Year : 2018 Including : Annual financial report REGISTRATION DOCUMENT

Welcome message from author
This document is posted to help you gain knowledge. Please leave a comment to let me know what you think about it! Share it to your friends and learn new things together.
Transcript
Ye a r : 2 0 1 8
I n c l u d i n g : A n n u a l f i n a n c i a l r e p o r t
REGISTRAT ION
DOCUMENT
Contents
INTRODUCTION 2
About us 2
A word from the Chairman 3
2018 Group performance 4
2018 key events 6
A multi-local leader 8
A producer of 100% renewable energy 10
Storage 12
Corporate social responsability 14
Our shareholders 16
Governance 18
01 PRESENTATION 21
Presentation of the Group1.1 22
Strategy of the Group1.2 24
Description of the renewable energy market1.3 27
Neoen's business1.4 56
Operating Model1.5 68
Property, plant and equipment1.6 79
Material contracts1.7 80
Intellectual property1.8 80
02 BUSINESS ACTIVITES AND PROSPECTS 83
Results for the financial year ended December 31, 20182.1 84
Cash and cash equivalents and equity2.2 98
Information about trends and objectives2.3 106
Other information2.4 108
03 RISKS FACTORS 119
Risks and uncertainties3.1 120
Insurance and risk management3.2 137
04 FINANCIAL STATEMENTS
AND STATUTORY AUDITORS REPORTS 143
Neoen Group consolidated financial statements 4.1
at December 31, 2018 144
Statutory auditors’ certification report 4.2
on the consolidated financial statements of Neoen
Group as of December 31, 2018 190
Annual financial statements of Neoen S.A. for the year 4.3
ended December 31, 2018 194
Statutory auditors’ certification report on the annual 4.4
financial statements of Neoen S.A. as of December 31,
2018 216
05 SUSTAINABLE DEVELOPMENT AND SOCIAL
RESPONSIBILITY 221
Positive contribution to the United Nations sustainable 5.1
development goals 222
Consideration of CSR/HSE matters in the Group’s 5.2
project management 223
Measurement of the impacts5.3 226
Report by the third-party organisation5.4 227
Vigilance Plan5.5 229
06 REPORT ON CORPORATE GOVERNANCE 231
State of governance6.1 232
Corporate governance organisation6.2 238
Remuneration of executive officers6.3 247
Other information6.4 258
07 CAPITAL AND SHAREHOLDING STRUCTURE 265
Information on the Company7.1 266
Capital7.2 268
Shareholding structure7.3 272
Securities market and relations with shareholders7.4 276
08 GENERAL SHAREHOLDERS’ MEETING 279
Draft resolutions8.1 280
Board of Directors’ report on the draft resolutions8.2 288
Statutory auditors’ reports on securities trading8.3 294
Statutory auditors’ special report on regulated 8.4
agreements and commitments 300
09 ADDITIONAL INFORMATION 303
Persons responsible9.1 304
Statutory auditors9.2 304
Historical financial information included by reference9.3 305
Documents available to the public9.4 305
Details of the projects9.5 306
Cross-reference tables9.6 318
Glossary9.7 322
2018Including annual financial report
REGISTRATION DOCUMENT
1REGISTRATION DOCUMENT 2018
Free translation of the French Document de Référence incluant le rapport financier (Registration Document including the annual financial report) of Neoen
By accepting this document, you acknowledge, and agree to be bound by, the following statements. This
document is a translation of Neoen’s Document de Référence dated June 05, 2019, filed with the French
Autorité des marchés financiers (“AMF”) under number R.19-021 (the “ Document de Référence ” or
“Registration Document”). The Document de Référence, in its original French version, is publicly available
at www.amf-france.org. This translation (this “Translation”) is provided for your convenience only. This
Translation has not been prepared for use in connection with any offering of securities. It does not contain
all of the information that an offering document would contain. None of Neoen or any of its respective
officers, directors, employees or affiliates, or any person controlling any of them assumes any liability
which may be based on this Translation or any omissions therefrom or errors or misstatements therein,
and any such liability is hereby expressly disclaimed. This Translation does not constitute or form part of
any offer to sell or the solicitation of an offer to purchase securities, nor shall it or any part of it form the
basis of, or be relied on in connection with, any contract or commitment whatsoever. Persons into whose
possession this Translation may come are required by Neoen to inform themselves about and to observe
any restrictions as to the distribution of this Translation.
Copies of the French Document de Référence may be obtained free of charge at Neoen, 6 rue Ménars, 75002 Paris, France, as well as on the
websites of Neoen (www.neoen.com) and of the AMF (www.amf-France.org).
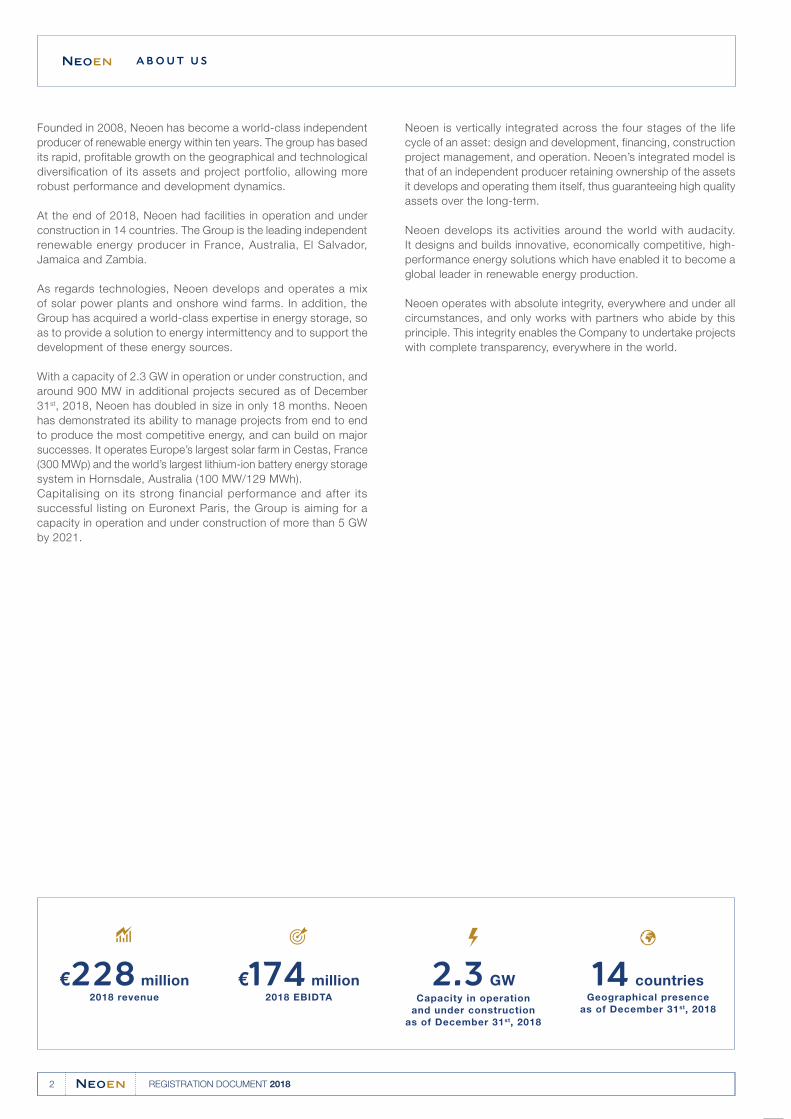
Founded in 2008, Neoen has become a world-class independent
producer of renewable energy within ten years. The group has based
its rapid, profitable growth on the geographical and technological
diversification of its assets and project portfolio, allowing more
robust performance and development dynamics.
At the end of 2018, Neoen had facilities in operation and under
construction in 14 countries. The Group is the leading independent
renewable energy producer in France, Australia, El Salvador,
Jamaica and Zambia.
As regards technologies, Neoen develops and operates a mix
of solar power plants and onshore wind farms. In addition, the
Group has acquired a world-class expertise in energy storage, so
as to provide a solution to energy intermittency and to support the
development of these energy sources.
With a capacity of 2.3 GW in operation or under construction, and
around 900 MW in additional projects secured as of December
31st, 2018, Neoen has doubled in size in only 18 months. Neoen
has demonstrated its ability to manage projects from end to end
to produce the most competitive energy, and can build on major
successes. It operates Europe’s largest solar farm in Cestas, France
(300 MWp) and the world’s largest lithium-ion battery energy storage
system in Hornsdale, Australia (100 MW/129 MWh).
Capitalising on its strong financial performance and after its
successful listing on Euronext Paris, the Group is aiming for a
capacity in operation and under construction of more than 5 GW
by 2021.
Neoen is vertically integrated across the four stages of the life
cycle of an asset: design and development, financing, construction
project management, and operation. Neoen’s integrated model is
that of an independent producer retaining ownership of the assets
it develops and operating them itself, thus guaranteeing high quality
assets over the long-term.
Neoen develops its activities around the world with audacity.
It designs and builds innovative, economically competitive, high-
performance energy solutions which have enabled it to become a
global leader in renewable energy production.
Neoen operates with absolute integrity, everywhere and under all
circumstances, and only works with partners who abide by this
principle. This integrity enables the Company to undertake projects
with complete transparency, everywhere in the world.
A BO UT US
€174 million€228 million2018 revenue 2018 EBIDTA
14 countriesGeographical presence
as of December 31st, 2018
2.3 GWCapacity in operation
and under construction
as of December 31st, 2018
2 REGISTRATION DOCUMENT 2018
About us
XAVIER BARBARO
Chairman and Chief executive officer
2018 has been an important year for the growth of Neoen, which
has become one of the leading players of renewable energies.
Neoen is now listed on Euronext Paris, and its excellent results
confirmed its dynamic growth. Neoen has also proven its ability to
renew its pipeline of projects in a portfolio spread over time, while
ensuring the continued progress of projects already under way.
With a capacity of around 3 GW in operation and under construction
as of May 2019, Neoen is the leading French independent producer
of renewable energy and one of the most dynamic worldwide.
Our positioning makes us stand out in several ways: first, because
we are a pure player of renewable energy, with a complete technology
mix (solar, wind, storage) and a world-class expertise enabling
us to carry out large-scale projects from end to end in each
of these segments. Our “develop to own” model is also distinctive:
we develop our own projects and retain our assets over the very
long-term to create value over time.
Day after day, our actions and our relationships with all our
stakeholders are driven by our values: audacity, integrity, commitment
and esprit de corps. These values are shared by our 197 employees
of more than 20 nationalities. They are the foundation of our
identity and provide the essential ethical guidelines for our day-
to-day behaviour.
This results for instance in a high level of discipline in the operational
and financial management of our business, which we intend to be
exemplary; in our governance, which is compliant with AFEP-MEDEF
recommendations; and in the choice of our projects. Neoen only
takes on projects at “grid parity”, the competitiveness of which
does not depend on subsidies which are always unpredictable
over time. We are also very careful to maintain the geographical
balance of our portfolio, the diversity of our technological mix, and
the financial stability of the partners and customers with which we
commit for the long-term.
This discipline is totally compatible with the entrepreneurial spirit
which has been leading us for ten years. It’s our flexibility and
our ability to adapt to new environments that have enabled us to
become a leading global player in renewable energies. This growth
continued in 2018 with the launch of projects in two new countries:
Finland and Colombia.
It is thanks to the above elements that Neoen has successfully
listed on the stock market in a particularly demanding market
environment. We raised €697 million, which was the largest listing
on Euronext Paris in 2018 by far.
Our long-standing shareholder, Impala, with which we share the
same long-term vision, renewed its trust in Neoen by increasing
its investment and confirming its role as our majority shareholder.
And we are very enthusiastic about continuing our development
in 2019, with the same demanding approach, and fully faithful to
our mission: to produce locally the most competitive renewable
electricity, sustainably and on a large scale.
M ESSAGE FROM THE CHAIRMAN AND CHIEF EXECUTIVE OFFICER
Neoen is the leading
French independent producer
of renewable energy and one of
the most dynamic worldwide.
3REGISTRATION DOCUMENT 2018
A word from the Chairman
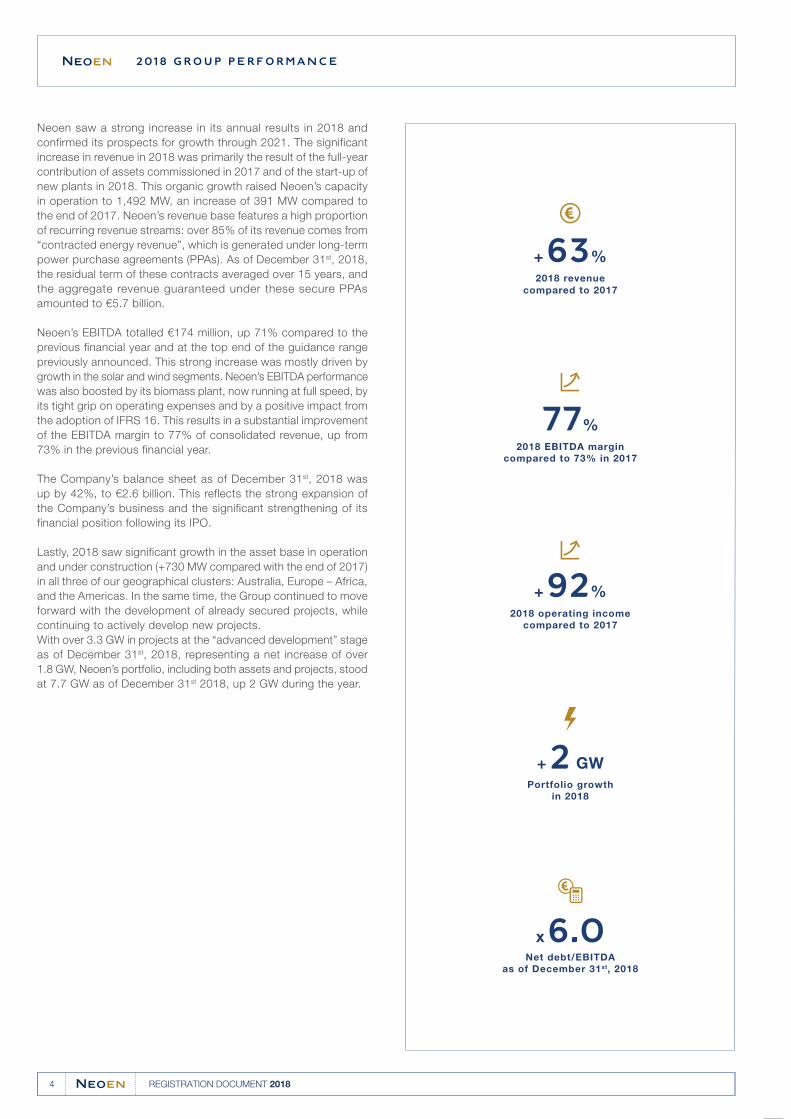
Neoen saw a strong increase in its annual results in 2018 and
confirmed its prospects for growth through 2021. The significant
increase in revenue in 2018 was primarily the result of the full-year
contribution of assets commissioned in 2017 and of the start-up of
new plants in 2018. This organic growth raised Neoen’s capacity
in operation to 1,492 MW, an increase of 391 MW compared to
the end of 2017. Neoen’s revenue base features a high proportion
of recurring revenue streams: over 85% of its revenue comes from
“contracted energy revenue”, which is generated under long-term
power purchase agreements (PPAs). As of December 31st, 2018,
the residual term of these contracts averaged over 15 years, and
the aggregate revenue guaranteed under these secure PPAs
amounted to €5.7 billion.
Neoen’s EBITDA totalled €174 million, up 71% compared to the
previous financial year and at the top end of the guidance range
previously announced. This strong increase was mostly driven by
growth in the solar and wind segments. Neoen’s EBITDA performance
was also boosted by its biomass plant, now running at full speed, by
its tight grip on operating expenses and by a positive impact from
the adoption of IFRS 16. This results in a substantial improvement
of the EBITDA margin to 77% of consolidated revenue, up from
73% in the previous financial year.
The Company’s balance sheet as of December 31st, 2018 was
up by 42%, to €2.6 billion. This reflects the strong expansion of
the Company’s business and the significant strengthening of its
financial position following its IPO.
Lastly, 2018 saw significant growth in the asset base in operation
and under construction (+730 MW compared with the end of 2017)
in all three of our geographical clusters: Australia, Europe – Africa,
and the Americas. In the same time, the Group continued to move
forward with the development of already secured projects, while
continuing to actively develop new projects.
With over 3.3 GW in projects at the “advanced development” stage
as of December 31st, 2018, representing a net increase of over
1.8 GW, Neoen’s portfolio, including both assets and projects, stood
at 7.7 GW as of December 31st 2018, up 2 GW during the year.
2018 GROUP PERFORMANCE
+ 63%
2018 revenue
compared to 2017
2018 EBITDA margin
compared to 73% in 2017
77%
2018 operating income
compared to 2017
+ 92%
+ 2 GW
Portfolio growth
in 2018
x 6.0Net debt/EBITDA
as of December 31st, 2018
4 REGISTRATION DOCUMENT 2018
2018 Group performance
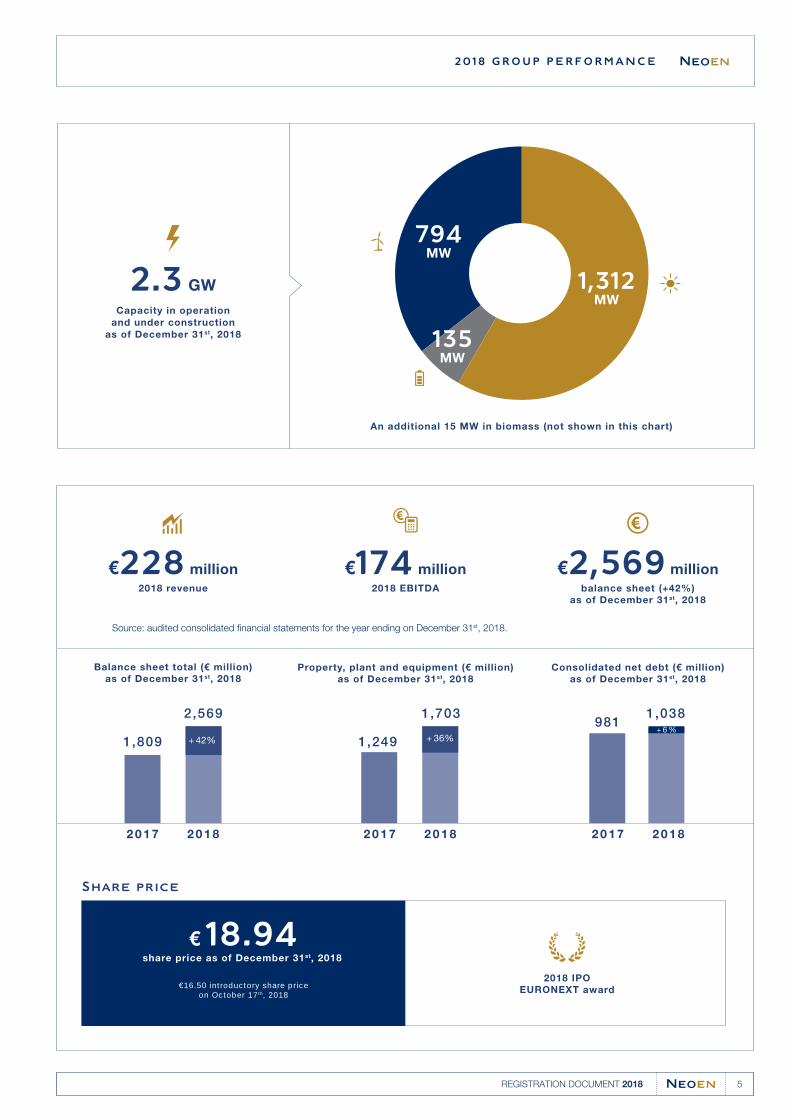
€228 million €174 million
2018 revenue
2,569 1,703 1,038
1,809 1,249
981
2 0 1 7 2 0 1 7 2 0 1 72 0 1 8 2 0 1 8 2 0 1 8
2018 EBITDA balance sheet (+42%)
as of December 31st, 2018
Capacity in operation
and under construction
as of December 31st, 2018
2.3 GW
2018 GROUP PERFORMANCE
€2,569 million
Balance sheet total (€ million)
as of December 31st, 2018Property, plant and equipment (€ million)
as of December 31st, 2018
Source: audited consolidated financial statements for the year ending on December 31st, 2018.
Consolidated net debt (€ million)
as of December 31st, 2018
+ 42%
2018 IPO
EURONEXT award
Share price
€16.50 introductory share price on October 17th, 2018
€ 18.94share price as of December 31st, 2018
+ 36%
1,312 MW
135 MW
794 MW
An additional 15 MW in biomass (not shown in this chart)
5REGISTRATION DOCUMENT 2018
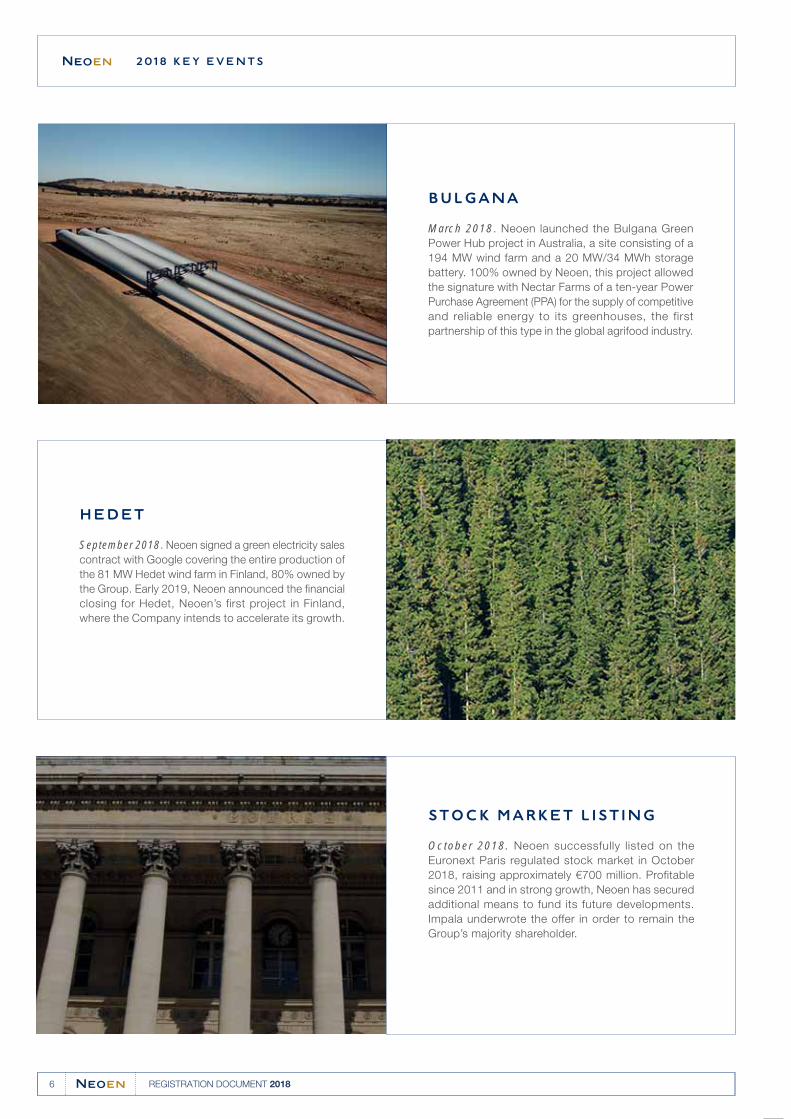
BULGANA
March 2018. Neoen launched the Bulgana Green
Power Hub project in Australia, a site consisting of a
194 MW wind farm and a 20 MW/34 MWh storage
battery. 100% owned by Neoen, this project allowed
the signature with Nectar Farms of a ten-year Power
Purchase Agreement (PPA) for the supply of competitive
and reliable energy to its greenhouses, the first
partnership of this type in the global agrifood industry.
HEDET
September 2018. Neoen signed a green electricity sales
contract with Google covering the entire production of
the 81 MW Hedet wind farm in Finland, 80% owned by
the Group. Early 2019, Neoen announced the financial
closing for Hedet, Neoen’s first project in Finland,
where the Company intends to accelerate its growth.
STOCK MARKET LISTING
October 2018. Neoen successfully listed on the
Euronext Paris regulated stock market in October
2018, raising approximately €700 million. Profitable
since 2011 and in strong growth, Neoen has secured
additional means to fund its future developments.
Impala underwrote the offer in order to remain the
Group’s majority shareholder.
2018 K EY EVENTS
6 REGISTRATION DOCUMENT 2018
2018 key events

HORNSDALE POWER RESERVE
December 2018. The performance of the Hornsdale
Power Reserve plant in Australia stands far above
expectations. Connected in 2017, the largest lithium-
ion battery in the world (100 MW/129 MWh) not only
contributed to the generation of nearly 40 million Australian
dollars in savings for network users; it also provided
support for the South Australia government’s pioneering
policy for renewable energy development, opening the
way for many new battery projects in the country.
CALL FOR TENDERS IN FRANCE
November 2018. Neoen came in top place for
the government’s bi-technological tender with 66
MW awarded, and confirmed its position as the
independent leader in solar energy in France. 100%
owned by Neoen, the five winning photovoltaic
projects demonstrate the Group’s capacity to develop
economically competitive projects, fully integrated
in local territories, innovative, and that have a high
degree of French industrial content.
COLEAMBALLY
November 2018. Neoen started to operate the largest
solar plant in Australia. With a capacity of 189 MWp,
100% owned by Neoen, Coleambally confirms the
Group’s status as the leading independent producer
of renewable energies in Australia.
2018 KEY EVENTS
7REGISTRATION DOCUMENT 2018
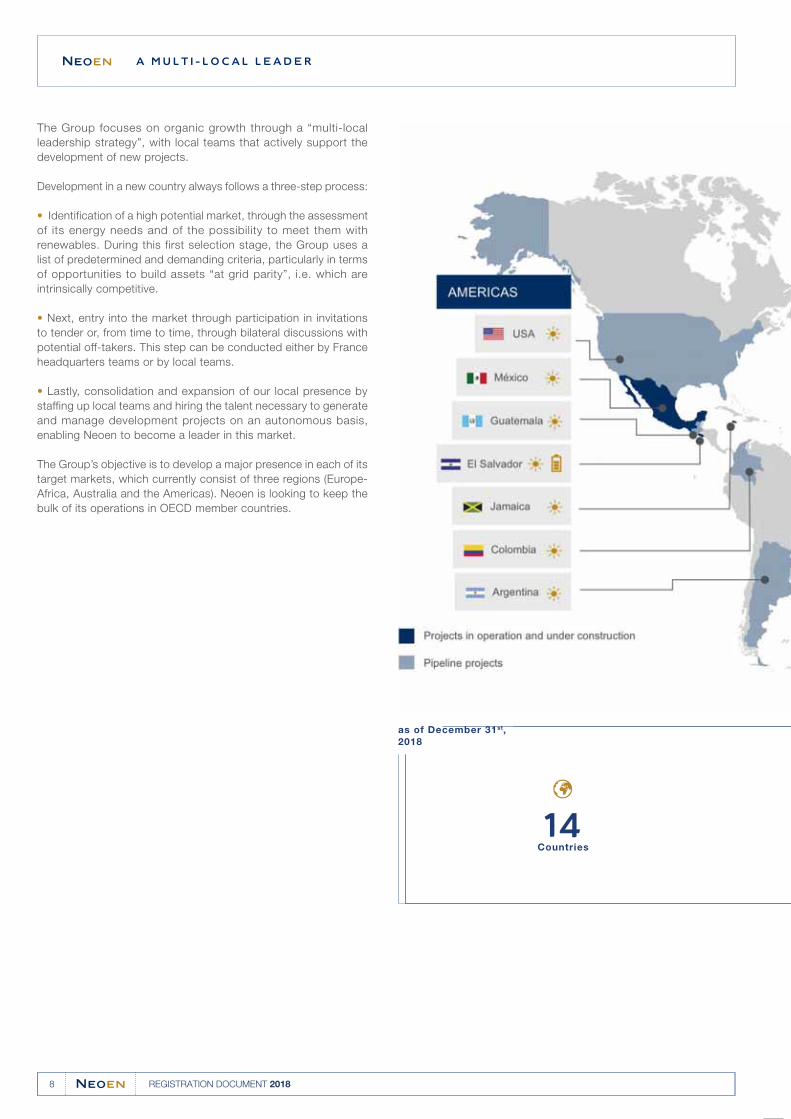
The Group focuses on organic growth through a “multi-local
leadership strategy”, with local teams that actively support the
development of new projects.
Development in a new country always follows a three-step process:
• Identification of a high potential market, through the assessment
of its energy needs and of the possibility to meet them with
renewables. During this first selection stage, the Group uses a
list of predetermined and demanding criteria, particularly in terms
of opportunities to build assets “at grid parity”, i.e. which are
intrinsically competitive.
• Next, entry into the market through participation in invitations
to tender or, from time to time, through bilateral discussions with
potential off-takers. This step can be conducted either by France
headquarters teams or by local teams.
• Lastly, consolidation and expansion of our local presence by
staffing up local teams and hiring the talent necessary to generate
and manage development projects on an autonomous basis,
enabling Neoen to become a leader in this market.
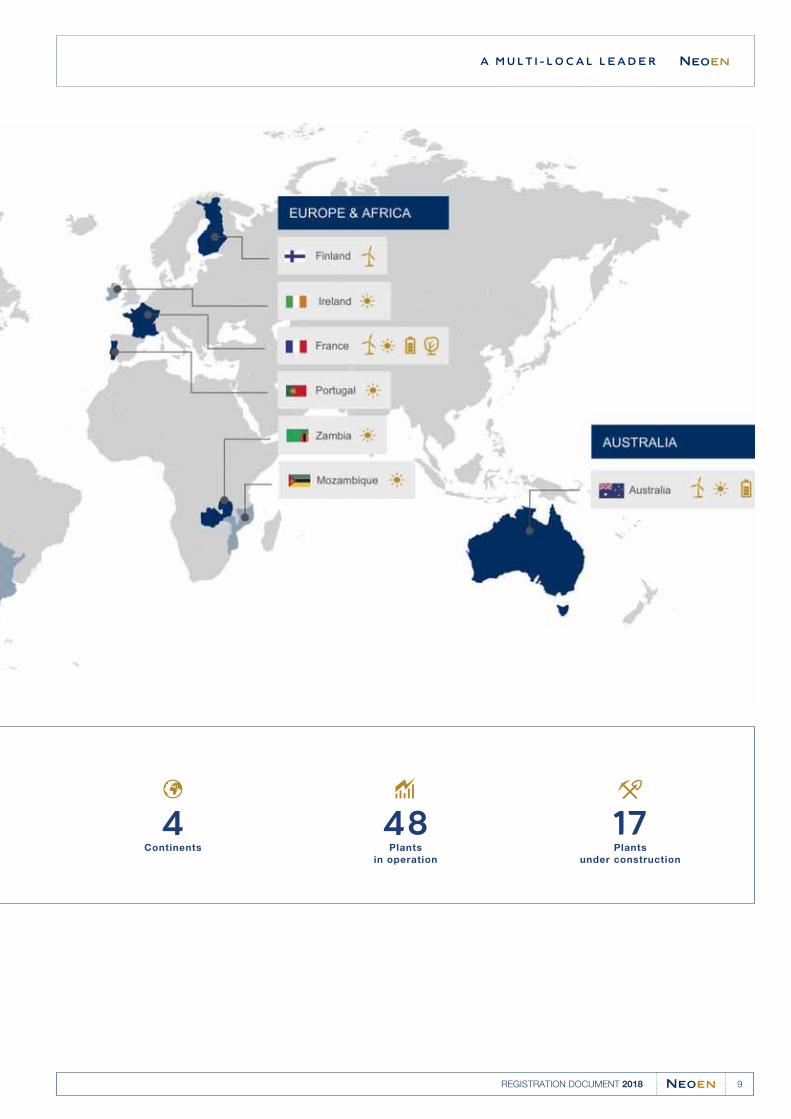
The Group’s objective is to develop a major presence in each of its
target markets, which currently consist of three regions (Europe-
Africa, Australia and the Americas). Neoen is looking to keep the
bulk of its operations in OECD member countries.
A MUL TI-L OCAL L EADER
14Countries
as of December 31st,
2018
8 REGISTRATION DOCUMENT 2018
A multi-local leader
A MULTI-LOCAL LEADER
4 48 17Continents Plants
in operation
Plants
under construction
9REGISTRATION DOCUMENT 2018

SOLAR
Solar energy is the most abundant renewable
energy on Earth and the quickest to deploy.
It is also the technology which has benefited
from the greatest focus and has witnessed the
most spectacular gains in productivity in recent
years, which make these facilities intrinsically
competitive in many countries. Solar energy was
the first technology deployed by Neoen. It is still
the Group’s main activity and the Company is
convinced of its strong development potential, in
an increasing number of territories.
A PU RE PL AY ER OF RENEW ABLE ENERGIES
As a leading player of renewable energies, Neoen focuses on pro-
ducing green electricity via renewable energies such as solar and
wind, which are mature, tried-and-tested technologies. In addition,
Neoen has acquired a very high level of expertise in storage, so
as to provide a solution to energy intermittency, thereby fostering
the development of these energy sources. Our operations are
vertically-integrated across the whole life cycle, developing our
own plants and operating them with a long-term perspective.
10 REGISTRATION DOCUMENT 2018
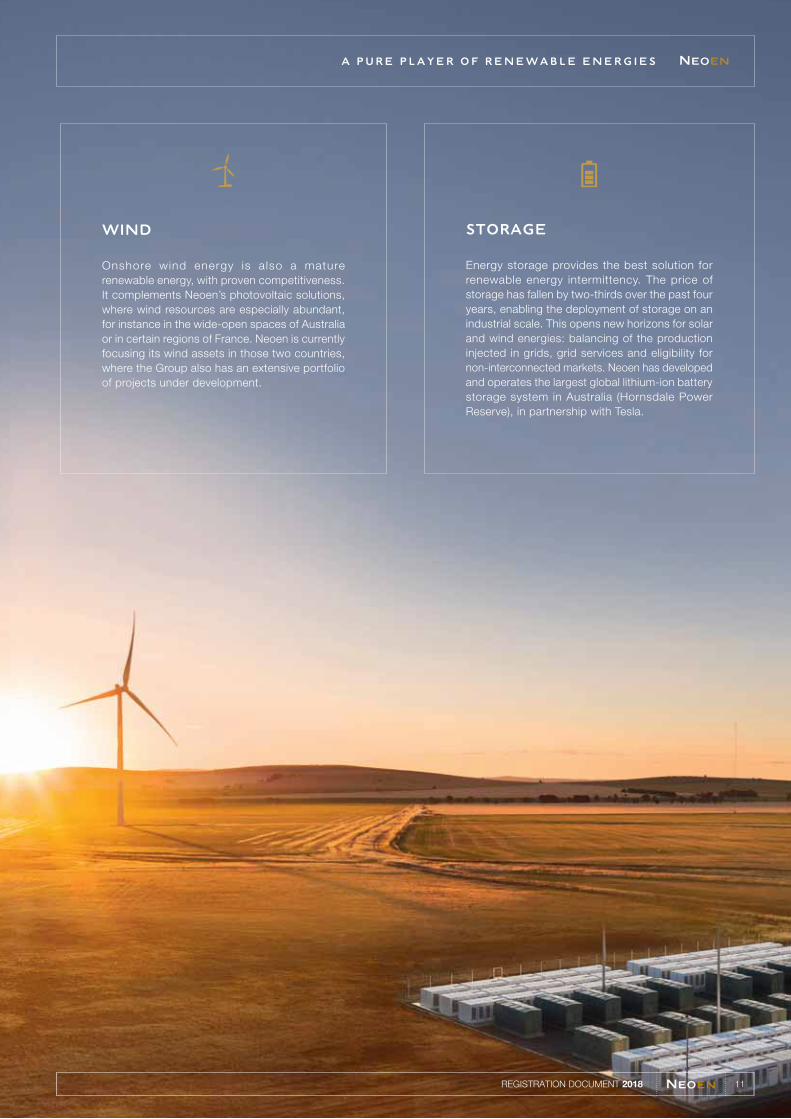
WIND
Onshore wind energy is also a mature
renewable energy, with proven competitiveness.
It complements Neoen’s photovoltaic solutions,
where wind resources are especially abundant,
for instance in the wide-open spaces of Australia
or in certain regions of France. Neoen is currently
focusing its wind assets in those two countries,
where the Group also has an extensive portfolio
of projects under development.
STORAGE
Energy storage provides the best solution for
renewable energy intermittency. The price of
storage has fallen by two-thirds over the past four
years, enabling the deployment of storage on an
industrial scale. This opens new horizons for solar
and wind energies: balancing of the production
injected in grids, grid services and eligibility for
non-interconnected markets. Neoen has developed
and operates the largest global lithium-ion battery
storage system in Australia (Hornsdale Power
Reserve), in partnership with Tesla.
A PURE PLAYER OF RENEWABLE ENERGIES
11REGISTRATION DOCUMENT 2018
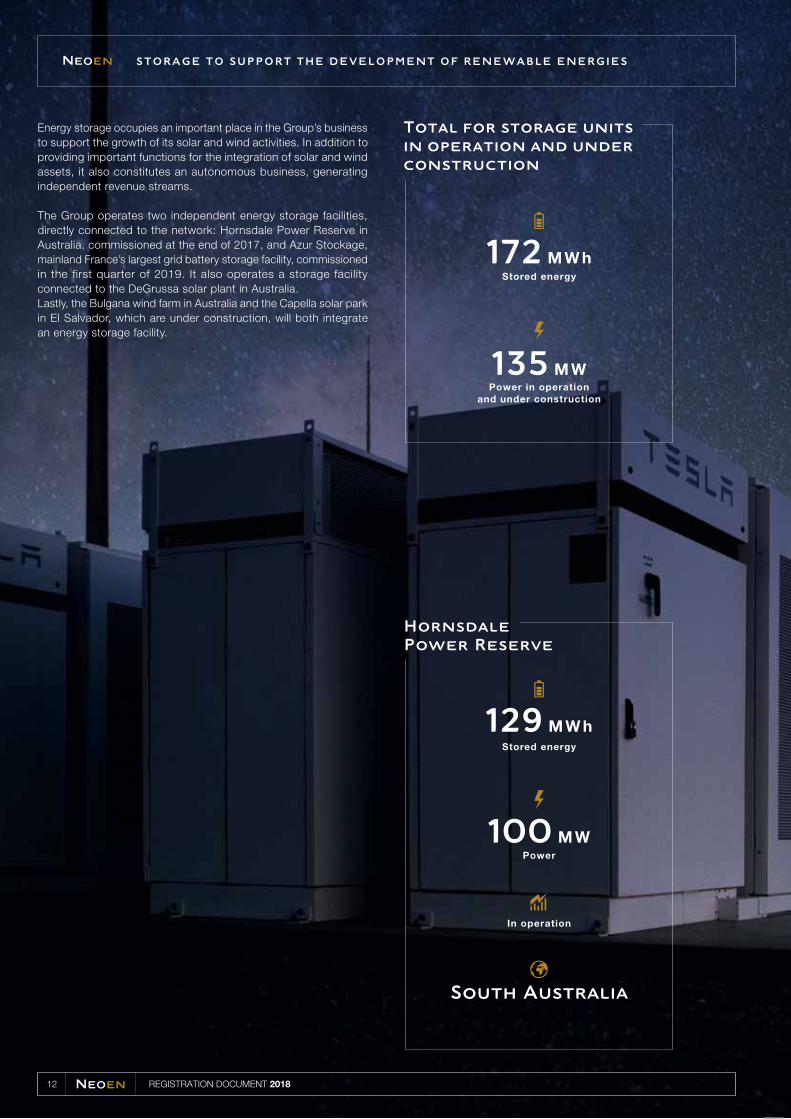
Energy storage occupies an important place in the Group’s business
to support the growth of its solar and wind activities. In addition to
providing important functions for the integration of solar and wind
assets, it also constitutes an autonomous business, generating
independent revenue streams.
The Group operates two independent energy storage facilities,
directly connected to the network: Hornsdale Power Reserve in
Australia, commissioned at the end of 2017, and Azur Stockage,
mainland France’s largest grid battery storage facility, commissioned
in the first quarter of 2019. It also operates a storage facility
connected to the DeGrussa solar plant in Australia.
Lastly, the Bulgana wind farm in Australia and the Capella solar park
in El Salvador, which are under construction, will both integrate
an energy storage facility.
STORAGE TO SUPPORT THE DEVELOPMENT OF RENEWABLE ENERGIES
Total for storage units
in operation and under
construction
Hornsdale
Power Reserve
135 M WPower in operation
and under construction
172 M W hStored energy
100 M WPower
129 M W hStored energy
In operation
South Australia
12 REGISTRATION DOCUMENT 2018
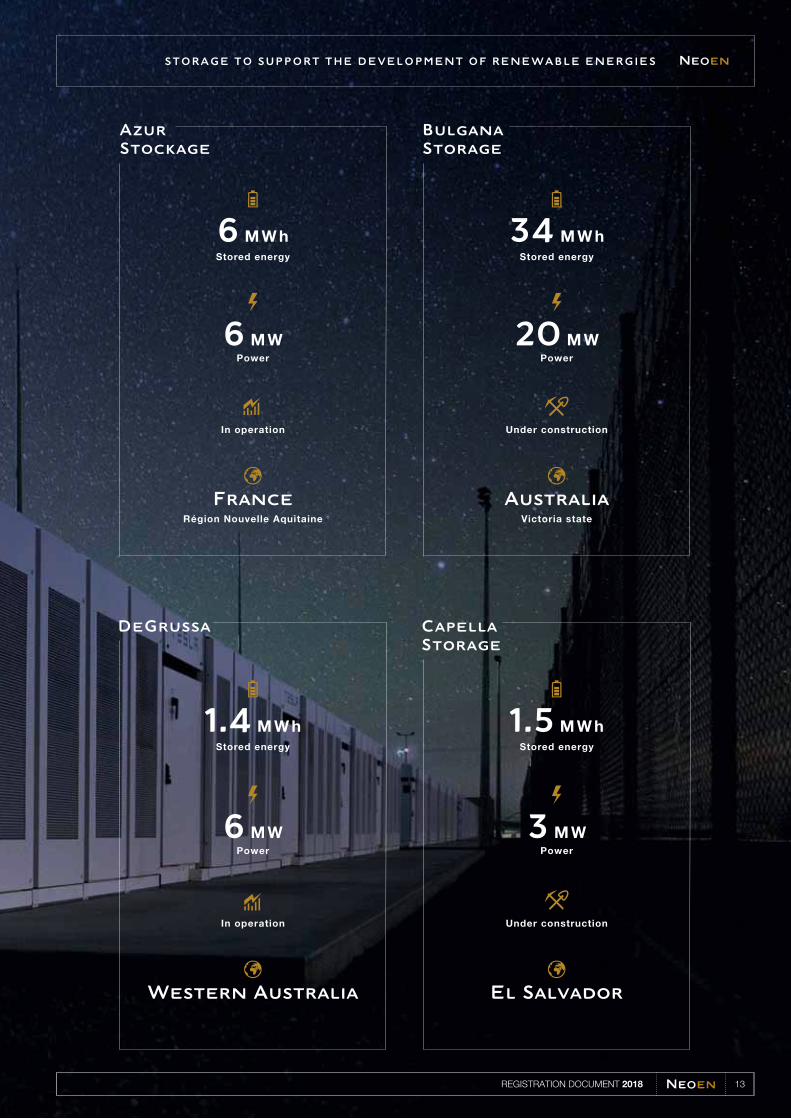
STORAGE TO SUPPORT THE DEVELOPMENT OF RENEWABLE ENERGIES
DeGrussa
Azur
Stockage
Capella
Storage
Bulgana
Storage
6 M WPower
1.4 M W hStored energy
In operation
Western Australia
3 M WPower
1.5 M W hStored energy
El Salvador
Under construction
20 M WPower
34 M W hStored energy
Victoria state
Australia
Under construction
6 M WPower
6 M W hStored energy
Région Nouvelle Aquitaine
France
In operation
13REGISTRATION DOCUMENT 2018
CO RPORATE SOC IAL RESP ONSABIL ITY
ENVIRONMENTAL COMMITMENTS
Neoen is particularly aware of environmental protection challen-
ges, and of the way its activities and those of its subcontractors
can relate to these. The Group’s demanding approach involves
systematic environmental impact studies for all of its projects,
and the implementation of specific measures which go beyond
regulations, when the Group deems it necessary. The Group uses
innovative technologies which are respectful of the environment,
so as to minimise its potential impact on the latter. The Group’s
commitment to the environment is also reflected in its policy
to protect biodiversity and the species present on its various sites.
SOCIAL COMMITMENTS
All Neoen employees and partners are committed to complying
with the highest standards in terms of business ethics and social
matters. Neoen pays particular attention to labour law, and hygiene
and safety conditions. The identification of potential risks associated
to its activities have led to the implementation of strict inspection
and monitoring processes which are reviewed on a quarterly
basis. In addition, the Company often makes special commitments
to the communities neighbouring its plants.
SOCIETAL AND CULTURAL
COMMITMENTS
Due to the nature of its activities, Neoen is essentially a local
player in all the places where it is present. It is aware of its special
role in terms of local development and promotes the use of local
companies. The Group also supports social economy projects
by promoting renewable energies and by facilitating access
to electricity. For this purpose, Neoen promotes college education
in the field of renewable energies by financing academic grants
and supporting the creation of a specialised technology institute.
In addition, Neoen provides support for local economic development
projects such as roads and infrastructure for the supply of water
and electricity. The Group is also involved with a number of non-
profit organizations to support access to cleaner and more reliable
electricity in countries in which the Group doesn’t have facilities.
Lastly, Neoen contributes to the preservation of local cultures and
communities in Australia thanks to its support of cultural funds
and the creation of cultural places of remembrance.
VIGEO A1
Very early on in its development, and in line with its convictions,
the Group has incorporated environmental components in methods
used to finance its projects. Neoen first issued €40 million in
green bonds in October 2015 and completed a second issue for
€245 million in December 2017. The Group voluntarily implemented
a corporate rating process with Vigeo Eiris in September 2018.
The award of an A1 rating confirmed the Group’s inclusion in the
1st quartile of companies rated by Vigeo Eiris and puts Neoen
among the 4% companies with the organisation’s best rating.
14 REGISTRATION DOCUMENT 2018
CORPORATE SOCIAL RESPONSABILITY
15REGISTRATION DOCUMENT 2018
O U R SHAREHOLDERS
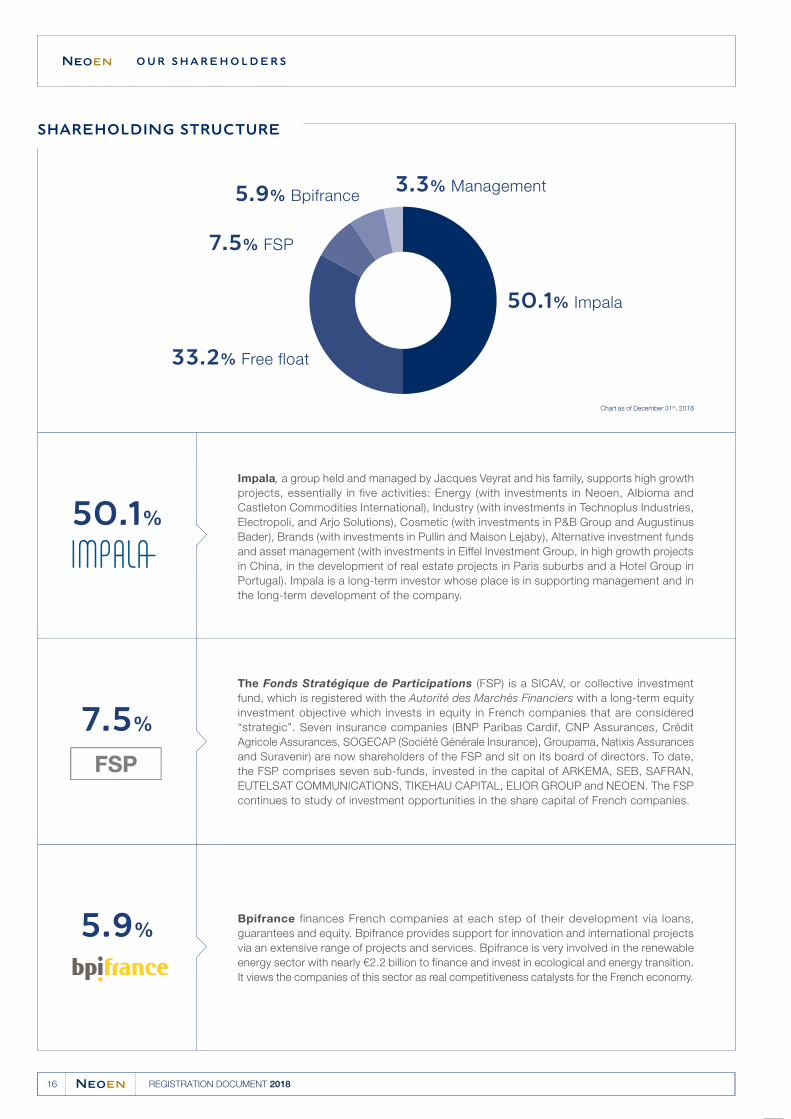
50.1%
50.1% Impala
3.3% Management
7.5% FSP
33.2% Free float
7.5%
5.9%
5.9% Bpifrance
SHAREHOLDING STRUCTURE
Impala, a group held and managed by Jacques Veyrat and his family, supports high growth
projects, essentially in five activities: Energy (with investments in Neoen, Albioma and
Castleton Commodities International), Industry (with investments in Technoplus Industries,
Electropoli, and Arjo Solutions), Cosmetic (with investments in P&B Group and Augustinus
Bader), Brands (with investments in Pullin and Maison Lejaby), Alternative investment funds
and asset management (with investments in Eiffel Investment Group, in high growth projects
in China, in the development of real estate projects in Paris suburbs and a Hotel Group in
Portugal). Impala is a long-term investor whose place is in supporting management and in
the long-term development of the company.
The Fonds Stratégique de Participations (FSP) is a SICAV, or collective investment
fund, which is registered with the Autorité des Marchés Financiers with a long-term equity
investment objective which invests in equity in French companies that are considered
“strategic”. Seven insurance companies (BNP Paribas Cardif, CNP Assurances, Crédit
Agricole Assurances, SOGECAP (Société Générale Insurance), Groupama, Natixis Assurances
and Suravenir) are now shareholders of the FSP and sit on its board of directors. To date,
the FSP comprises seven sub-funds, invested in the capital of ARKEMA, SEB, SAFRAN,
EUTELSAT COMMUNICATIONS, TIKEHAU CAPITAL, ELIOR GROUP and NEOEN. The FSP
continues to study of investment opportunities in the share capital of French companies.
Bpifrance finances French companies at each step of their development via loans,
guarantees and equity. Bpifrance provides support for innovation and international projects
via an extensive range of projects and services. Bpifrance is very involved in the renewable
energy sector with nearly €2.2 billion to finance and invest in ecological and energy transition.
It views the companies of this sector as real competitiveness catalysts for the French economy.
Chart as of December 31st, 2018
16 REGISTRATION DOCUMENT 2018
Our shareholders
OUR SHAREHOLDERS
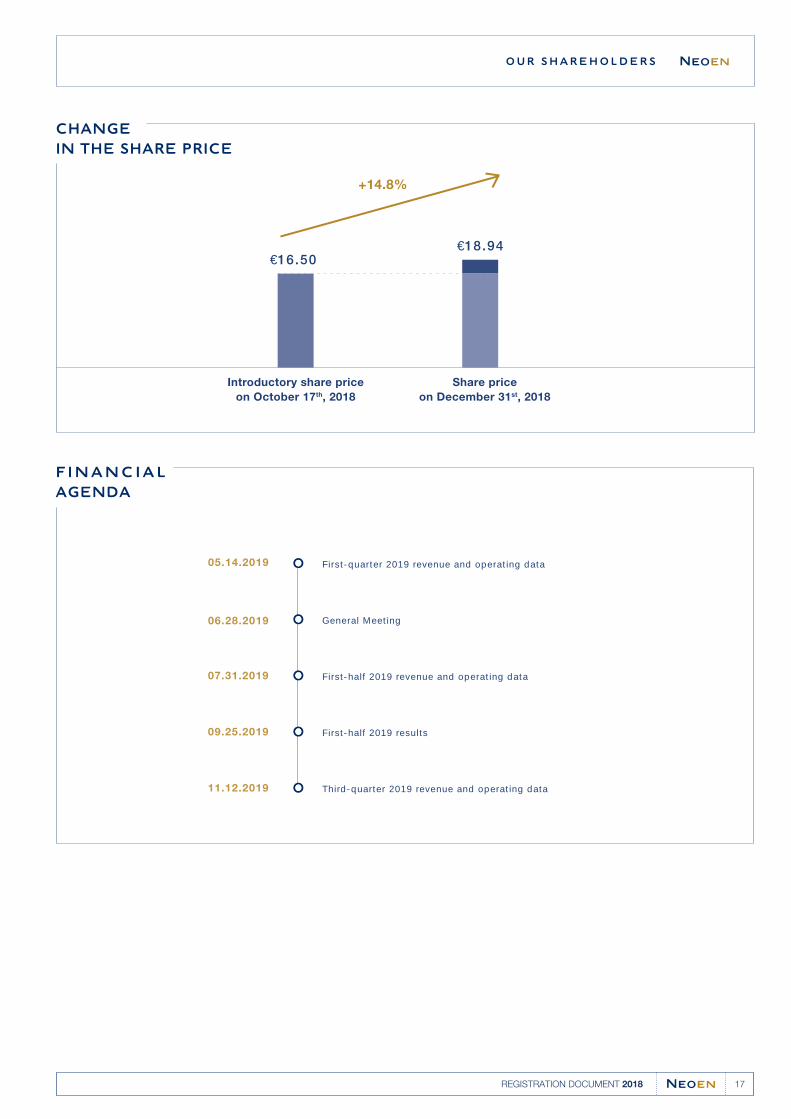
CHANGE
IN THE SHARE PRICE
+14.8%
€16.50€18.94
Share price
on December 31st, 2018
Introductory share price
on October 17th, 2018
FINANCIAL
AGENDA
05.14.2019 First-quarter 2019 revenue and operating data
06.28.2019 General Meeting
09.25.2019 First-half 2019 results
07.31.2019 First-half 2019 revenue and operating data
11.12.2019 Third-quarter 2019 revenue and operating data
17REGISTRATION DOCUMENT 2018
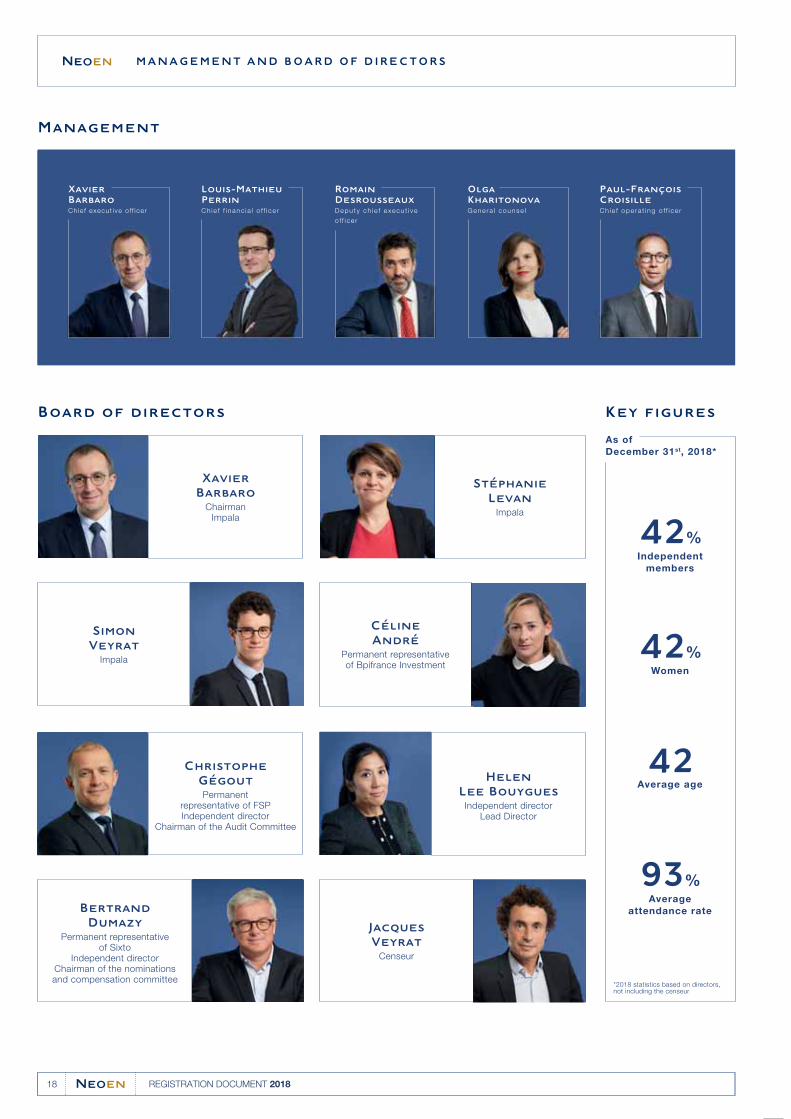
MA NAGEMENT AND B OARD OF DIRECTORS
42%Independent
members
42%Women
42Average age
93%Average
attendance rate
Board of directors Key figures
As of
December 31st, 2018*
Management
*2018 statistics based on directors, not including the censeur
Xavier
Barbaro
Chie f execut ive o ff icer
Louis-Mathieu
Perrin
Ch ie f f i nanc i a l o f f i ce r
Olga
Kharitonova
Gene ra l counse l
Romain
Desrousseaux
Depu ty ch i e f execu t i ve
o f f i ce r
Paul-François
Croisille
Ch ie f ope ra t i ng o f f i ce r
Simon
Veyrat
Impala
Xavier
Barbaro
ChairmanImpala
Céline
André
Permanent representative of Bpifrance Investment
Bertrand
Dumazy
Permanent representative of Sixto
Independent directorChairman of the nominations and compensation committee
Jacques
Veyrat
Censeur
Helen
Lee Bouygues
Independent directorLead Director
Christophe
Gégout
Permanent representative of FSPIndependent director
Chairman of the Audit Committee
Stéphanie
Levan
Impala
18 REGISTRATION DOCUMENT 2018
Governance
19REGISTRATION DOCUMENT 2018
20 REGISTRATION DOCUMENT 2018
01
21REGISTRATION DOCUMENT 2018
PRESENTATION
PRESENTATION OF THE GROUP1.1 22
History1.1.1 22
Presentation of the Group1.1.2 22
Competitive environment1.1.3 24
STRATEGY OF THE GROUP1.2 24
DESCRIPTION 1.3
OF THE RENEWABLE ENERGY
MARKET 27
A rapidly expanding global 1.3.1
renewable energy market
supported by sustainable market
dynamics 27
Market Structures1.3.2 32
National Renewable Energy 1.3.3
Markets 34
NEOEN'S BUSINESS1.4 56
Operating segments1.4.1 56
Geographic Footprint1.4.2 65
Customers1.4.3 66
Significant Contracts and Suppliers1.4.4 68
OPERATING MODEL1.5 68
Competitive developer and IPP with 1.5.1
a “develop-to-own” business model 68
A multi-local leadership approach1.5.2 69
Asset ownership1.5.3 70
Project planning and development1.5.4 70
Project financing1.5.5 73
Electricity sale contracts1.5.6 76
Capturing terminal value beyond 1.5.7
power purchase agreements 79
PROPERTY, PLANT 1.6
AND EQUIPMENT 79
The Group's generation assets1.6.1 79
Real estate assets owned 1.6.2
or occupied by the Group 79
MATERIAL CONTRACTS1.7 80
INTELLECTUAL PROPERTY1.8 80
Research and development1.8.1 80
Intellectual property1.8.2 81
01Presentation
Presentation of the Group
22 REGISTRATION DOCUMENT 2018
PRESENTATION OF THE GROUP1.1
HISTORY1.1.1
Founded in 2008 under the name Direct Énergie Renouvelable before
being re-named Neoen in 2011, from the moment of its creation, the
Company's ambition has been to become a key independent player
in the renewable generation sector. It quickly built up a significant
portfolio of projects in France and saw its commitments take the form
of the installation of an initial photovoltaic solar power plant in 2009,
followed by the construction of an initial wind farm in 2011. In 2012,
the Group won its first solar sector tender in the context of
procedures known as “CRE 1” launched by the French Energy
Regulator (Commission de Régulation de l’Énergie or “CRE”).
2014 was a landmark year for the Group. It saw the coming to fruition of
key projects such as the financial and industrial montage for the Cestas
solar power plant with operational capacity of 300 MW across 25 plants
over approximately 260 hectares (making it the most powerful photovoltaic
plant in Europe) and the operational launch of a large number of solar
power projects such as Ygos, Luxey and Geloux in France and Seixal,
Cabrela and Coruche in Portugal, as well as the operational launch of the
La Montagne wind power project in France. In June that same year, the
Group also won its first tender for a solar power project in Central America
with the Providencia Solar power plant (75.4 MWp) in El Salvador. The
Group continued its progress in 2015 and 2016, winning, in March 2017,
the first tranche of the “CRE 4” solar public tenders organised by the
Minister of Environment and Energy (86 MW of the 535 MW allocated).
The Group's internationalisation intensified as of 2013 with Mexico, then
Australia and El Salvador in 2014. Jamaica and Argentina followed in
2016, then Zambia and Finland in 2017. Finally, in 2018, the Group
implemented projects in the United States and Mozambique. As of the
date of this document, the Group has 16 offices located in 12 countries.
A wholly-owned subsidiary of the Direct Énergie group (which was
controlled by the Louis Dreyfus group in 2008), the Company then rapidly
opened its shareholding structure to other investors. As a sign of the start
of a new development phase for the Group, in August 2014, the Company
and its long-standing shareholders (Impala and FPCI Capenergie and FPCI
Capenergie II, represented by their management company Omnes Capital)
signed an investment protocol with FPCI ETI 2020, represented by its
management company Bpifrance Investissement, stipulating an
investment to be made by FPCI ETI 2020 in the Company's share capital
for a total of €25 million, of which one part via the acquisition of shares
from FPCI Capenergie and the remainder via the contribution of funds
intended for the investment by the Company in new generating capacity.
This equity acquisition was completed in October 2014.
Moreover, in order to associate its staff with the results of its
business, the Company has opened its share capital to Group
employees with several programmes since 2009.
Finally, from 2015 onwards, the Group diversified its sources of
financing by carrying out the issue of its first green bonds in
October 2015 in the amount of €40 million, with a maturity of 18 years
and non-recourse against the Company, and repayable exclusively
through future cash flows generated by a portfolio of 13 solar and wind
projects in France and Portugal with total operating capacity of
100 MW.
On October 17, 2018, Neoen completed its initial public offering on
Compartment A of the Paris Euronext regulated market. After exercise of
the greenshoe option, the size of the transaction was €697 million, making
this transaction the largest capital-raising in 2018 on Euronext Paris.
PRESENTATION OF THE GROUP1.1.2
Founded in 2008, Neoen is a leading and rapidly growing
independent producer of renewable energy throughout the world,
focusing on the production of solar and wind energy, as well as the
development of cutting-edge energy storage solutions. Neoen has
established recognised industrial expertise in developing and
operating large-scale projects and has built a diversified portfolio of
high-quality operating assets together with an extensive and balanced
project pipeline. At December 31, 2018, the Group had operations in
12 countries and owned and operated solar, wind power and storage
facilities, representing secured capacity (“secured portfolio”) of
3,156 MW. This secured portfolio is broken down into projects in
operation (1,492 MW), under construction (764 MW) and awarded
(899 MW), along with 15 MW of capacity from the Group's biomass
plant. Furthermore, the Group had an advanced pipeline portfolio
corresponding to projects at the tender-ready and advanced
development phases with capacity of 4,525 MW. To complement this
accumulated capacity (secured portfolio and advanced pipeline) of
7.7 GW, the Group holds over 4 GW of early stage projects. At
February 28, 2019, the Group had 2,646 MW of assets in operation
and under construction after giving effect to the entry into
construction of 390 MW of previously awarded projects on
December 31, 2018.
The Group has created a sound financial foundation over ten years of
operation based on a proven business model that provides the
potential for significant growth and expansion into new territories in
the future, as the renewable energy sector increasingly competes with
traditional energy sources.
As of December 31, 2018, the Group generated consolidated
revenue of €227.6 million, current EBITDA of €174.4 million and net
consolidated income of €13.5 million. For further information on the
revenue development, see Section 2.1.4.1 “Revenue” of this
document.
As part of the assessment and development of solar and wind
projects, the Group is focusing on mature, proven and financially
viable technologies, which have reached or are close to reaching grid
parity, while being technology agnostic (even if the Group is focused
on solar and wind power) and by maintaining complete freedom
vis-à-vis its industrial suppliers. The Group is mainly seeking
opportunities through participating in tendering procedures (public or
private), primarily in OECD member countries, and has achieved
notable success under these procedures. Its industrial expertise and
rigorous financial structuring enable it to target developments of
large-scale projects, ranging from several tens to several thousands
of MW. The Group invests in the long-term by developing projects (or,
in some cases, by acquiring them during the development phase) by
making their financing secure and by operating them itself. The
electricity produced is mainly sold under long-term off-take contracts
to state players, electricity suppliers and, in certain cases, robust
corporate off-takers. Depending on opportunities and to a lesser
degree, the Group also sells, the electricity it produces under
short-term contracts on the electricity market (spot market).
01Presentation
Presentation of the Group
23REGISTRATION DOCUMENT 2018
This approach enables the Group to hold a portfolio of high-quality
and diversified assets, most of which it is the sole owner. It benefits
from significant visibility of its revenue, thanks to the average
remaining term of the off-take contracts, which was over 15 years at
December 31, 2018. At the same date, the off-take contracts signed
by the Group for projects in operation, under construction and
awarded represented total revenue of €5.7 billion. The Group finances
its projects primarily through equity and by long-term non-recourse
project financings, for a total amount substantially lower than the
revenue generated by the off-take contracts.
The Group's portfolio of assets in operation, at December 31, 2018,
included 30 solar assets, 16 wind assets, 2 energy storage facilities
and a biomass asset (for a total operating capacity of 1,492 MW, of
which 100 MW is the independent energy storage capacity (as
opposed to behind the meter energy storage solutions connected to
solar or wind energy power plants whose operating capacity on this
same date amounted to 6 MW). In addition to these assets, the
Group has projects which have not yet gone into operation,
presented hereafter:
projects under construction: 10 solar projects, four wind projects●and three storage projects (29 MW/42 MWh) totalling 764 MW;
projects awarded: 27 solar projects and five wind projects for a●total of 899 MW;
tender-ready projects: 23 solar projects, 25 wind projects, one●biomass project and one energy storage asset totalling 1,204 MW;
advanced development projects: 64 solar projects, 21 wind●projects and four energy storage assets totalling 3,321 MW.
In addition to these various projects under development, the Group
has generated over 4 GW of early stage projects.
The Group operates on three main business segments:
Solar (segment revenue of €80.3 million and current segment EBITDA●of €77.5 million for the financial year ended December 31, 2018). In
the exercise of its activities relating to solar generation, the Group
develops and operates solar plants in a number of countries including
the Cestas solar plant in France, which is the most powerful solar
facility in Europe. At December 31, 2018, the Group's portfolio was
made up of 40 solar assets in operation or under construction in
Europe - Africa, Americas and Australia, with a cumulative capacity
of 1,312 MW, as well as 27 awarded projects with a cumulative
operating capacity of 819 MW. The Group is continuing to develop a
pipeline of 87 solar projects, with an additional potential production
of 3,116 MW, including 23 tender-ready projects (812 MW)
and 64 advanced development projects (2,304 MW).
of 1,040 MW, including 25 tender-ready projects (382 MW)
and 21 advanced development projects (658 MW).
Wind (segment revenue of €108.5 million and current segment●EBITDA of €91.8 million for the financial year ended December 31,
2018). In the exercise of its activities related to wind, the Group
develops and operates wind farms to date located in France, Australia
and Finland. At December 31, 2018, the Group's portfolio was made
up of 20 wind farms in operation or under construction, with a
cumulative capacity of 794 MW, as well as five awarded projects with
a cumulative capacity of 81 MW. The Group is continuing to develop a
pipeline of 46 solar projects, with an additional potential production
Storage (segment revenue of €17.9 million and current segment●EBITDA of €14.2 million for the financial year ended December 31,
2018). This business segment only includes independent storage
plants directly connected to the grid (as opposed to behind the
meter solutions whose action is connected, upstream of the grid, to
the energy generation activity of the solar power plants or wind
farms). At December 31, 2018, the Group's portfolio was made up
of five storage plants in operation or under construction, with a
cumulative capacity of 135 MW for 172.2 MWh of storage capacity.
The Group is continuing to develop a pipeline of 5 storage plants, with
an additional potential production of 364 MW, including one
tender-ready project (4 MW) and four advanced development projects
(360 MW).
Finally, the Group is the majority shareholder of an operational wood
biomass co-generation plant in France. This co-generation plant has
an installed capacity of 15 MW of electrical and 48.5 MW of thermal
power, the latter of which is sold to a private steam off-taker (1). It
generated revenue of €20.6 million and a current EBITDA of
€7.1 million for the financial year ended December 31, 2018. Neoen
does not consider this activity, which was purchased from Poweo
EnR in 2012, to be strategic and does not intend to further develop it.
The Group focuses on organic growth through a multi-local
“leadership” by which it obtains projects mainly through its own local
teams and aims at becoming the leader on its target markets. These
local teams set up partnerships and analyse market requirements in
selected and promising regions. The Group up to now has focused,
and intends to continue to focus, on OECD countries (for at least 80%
of its electricity capacity); operations in these countries account for
93% of its consolidated revenue in 2018 and 93% of its entire
operational portfolio. The teams acquire good knowledge of the
particular features of each market, take up the project structuring
processes proven on these markets and find new optimisation
methods to increase the Group's local competitiveness. This
approach enables the Group to obtain better terms when developing
projects, reduce the cost of capital and gain credibility as the Group
becomes established on the local market, particularly by delivering
projects on time and to budget. Furthermore, these economies of
scale, the improvement in the procurement conditions from suppliers
and the optimised execution of the Group's projects are expressed by
more competitive off-take prices, which reduces the risk of payment
default or an attempt to renegotiate prices by the counterparties to
the electricity purchase contracts. The main regions (“clusters”) in
which the Group operates are the following:
Europe – Africa: the Group has operations in France (where it is the●leading independent producer of solar energy and the leading
independent producer of exclusively renewable energy overall,
taking into account its awarded projects), in Portugal, Finland and
Zambia (where it is the leading independent producer of exclusively
renewable energy and in Mozambique and Ireland (projects under
development);
The Group also has a tendered biomass electricity project with a capacity of 5 MW.(1)
01Presentation
Strategy of the Group
24 REGISTRATION DOCUMENT 2018
Australia: the Group is the leading independent producer of●exclusively renewable energy in Australia;
Americas: the Group is established in El Salvador (where it is the●leading independent producer of exclusively renewable energy) and
it was awarded projects, through tenders, in Mexico, Argentina and
Jamaica. Furthermore, the Group has projects in development in
the US.
The Group intends to focus and increase its presence in the three
foregoing regions (“clusters”), while reinforcing its presence in a timely
and gradual way, on other markets or by penetrating new ones, while
retaining its multi-local leadership approach.
COMPETITIVE ENVIRONMENT1.1.3
The renewable energy market is still very open and fragmented,
composed in many countries of actors of all sizes.
Alterra Power by Innergex in 2018). Some of the global energy
leaders, especially in the oil & gas sector (Total, Shell, Statoil, Repsol)
are looking to anticipate the impact of the energy transition (for
example, Total's acquisition of Saft and Direct Energie, which is
competing with the Group in France through its subsidiary Quadran,
in 2018).
There are historical national electricity utilities that have driven
renewable solutions in their energy mix. Some of these traditional
players, which were already regional or global leaders in electricity
and have long since emerged from their domestic market, have
developed a know-how in renewable energies and have dedicated
subsidiaries abroad (EDP Renováveis, EDF Énergies Nouvelles, Enel,
Engie). In addition, there are international players specialising in
renewable energies, such as Neoen, Scatec, Voltalia and Boralex.
And there are also small players operating locally, although they are
decreasing. It should also be noted that these international or local
renewable energy actors ("IPP", independent power producers) are
sometimes bought out by large integrated energy groups (acquisition
of Solairedirect by Engie in 2016, Equis Energy by GIP in 2017,
The Group is an independent power producer of renewable energy
(IPP) exclusively and it is the first among its peers in Australia, El
Salvador, Jamaica, Zambia and in France, where it is the leading
independent producer of solar energy and the second largest
independent renewable energy producer as a whole, taking into
account its “awarded” projects.
The award of projects remains competitive. However, while the
authorities in charge of tenders are pushing actors to adopt more
competitive prices, they are also increasingly taking into account the
experience and the history of the operator, especially with regard to
the record of having carried out important projects on time and
without cost overrun. The ability to pre-qualify projects (obtaining
land, environmental studies, technical studies, obtaining building
permits), that is, to submit an offer with as little uncertainty as possible
regarding its technical and legal fulfilment is also key, which is a plus
for Neoen. Lastly, access to financing on acceptable terms and
financial soundness (tested in the form of bid bonds where
appropriate), testify to the ability to cope with the hazards of
construction and operation, and represent, with the elements above,
growing barriers to entry in the sector.
Combined with market fragmentation, these barriers should
contribute to a consolidation environment. Added to this is the
growing interest of investors in holding renewable asset portfolios and
the desire of the historic players in electricity, but also more broadly in
the energy sector, to rapidly make their energy mix evolve.
STRATEGY OF THE GROUP1.2
The strategy of the Group is comprised of the following key elements:
Consolidating its position as an independent renewable energy
leader with a “develop-to-own” strategy, through selective
geographic diversification and economies of scale
The Group intends to extend its proven “develop-to-own” strategy in
selected new regions and to continue to create value all through the
development of its projects, their industrial and financial structuring,
and up to their commissioning and beyond. The goal of the Group is
to continue to aim at large-scale projects under public tenders by
enlarging its plant portfolio, while achieving economies of scale and
reproducing the effective structuring of its projects in its chosen
markets. The Group expects that its increasing geographic
diversification will improve its economies of scale, the robust nature of
its cash flow via climate diversification, its capacity to develop in local
markets and the resilience of its activities by limiting its exposure to
local economic cycles and developments. To do this, it intends to
continue to follow its policy of targeting development projects in
markets with stable economic environments and contracts
denominated in strong currencies.
Broadening its presence in these main historical markets, to
become a local leader on the markets where it has set up a
solid pipeline of projects and to develop selectively in its three
key regions
After establishing itself as the leading independent electricity producer
in France and Australia, the Group intends to increase its presence on
these two key markets. At December 31, 2018, the Group had
project pipelines (“advanced pipeline” excluding “early stage” projects)
in France and Australia representing 1,070 MW and 1,668 MW
respectively, enabling it to retain its position as leader in these two
countries in the future. The Group expects that these countries will
continue to be the base point for its centralised functions as its
development teams relate to the new regions.
The Group also intends to deploy its strategy as a multi-local leader in
the markets where it has set up a substantial project pipeline,
particularly in Latin America. At December 31, 2018, the Group had a
project pipeline representing 1,613 MW in Latin America (Mexico,
Guatemala, Colombia and Argentina). The Group foresees strong
growth and multi-local leadership on its selected markets in the region.
01Presentation
Strategy of the Group
25REGISTRATION DOCUMENT 2018
By pursuing this expansion, the Group intends to deploy its strategy
by region (so-called “cluster” strategy), which consists in developing
markets in both in neighbouring regions and in nearby countries.
Markets on which it is already established and with considerable
success to date. The “cluster” strategy of the Group enables it to
benefit from the geographic proximity of its existing resources and to
make use of its own local or regional knowledge or that of its local
partners. As an example of the successful implementation of this
strategy, the Group initially developed a presence in El Salvador and
Mexico before continuing its expansion into other Latin American
countries. The Group plans to develop on average in one new country
per year while seeking to maintain at least 80% of its operating
capacity in OECD member states.
It also plans to continue to reinforce its organic growth via the selective
acquisition of projects in preliminary development phases, to which it
will be able to add value in line with its “develop-to-own” strategy.
Maintaining a regular growth trajectory while retaining
operational and financial discipline
The Group is well positioned to take advantage of the world's
transition to renewable energies. According to the report “New
Energy Outlook” 2018 by BNEF (Bloomberg New Energy Finance),
solar and wind operating capacity should rise from 16% of the
worldwide operating capacity in 2018 to 58% in 2050, with an annual
average growth rate of respectively 8.4% and 5.2% during said
period. Therefore, the growth in solar and wind capacity should
exceed growth in fossil fuels and nuclear energy by a considerable
margin. The strategic orientation of the Group as well as the balance
between its development of solar and wind production are therefore
strongly aligned with the dynamics of the world energy markets.
Furthermore, as the renewable energy market is attracting additional
investment, the Group feels that its financial and operational discipline
will allow it to stand out in an increasingly competitive and
consolidating field. This discipline was central to the Group's success
and it intends to maintain it as it grows.
The Group intends to maintain its current approach to financing
projects through debt, in particular its policy of subscribing mainly to
non-recourse debt, in the long term and in the same stable currencies
used for the income from its projects, to protect the stability of its
capital structure, and, in the future, to minimise the associated risks.
Furthermore, in the longer term, and thanks to its “develop-to-own”
strategy applied from the outset, the Group expects to be in a
position to finance more and more projects with the revenue from its
plants in operation (while covering the entire cost of the project's debt
by means of this revenue), thereby reducing the need for equity
contributions from its shareholders.
Reinforcing the renewable energy business models by
integrating storage and possibly adopting financially viable
new technologies
the Group completed the construction and commissioning of Azur
Storage which is, to date, the largest fixed storage facility directly
connected to the grid in mainland France. The Group has other
storage plants under development in France, Australia and El
Salvador and intends to continue to integrate “behind the meter”
storage facilities in its projects to ensure the stability of its solar and
wind projects and to enhance their competitiveness and profitability,
or directly connected to the grid. On this basis, the Group has started
to generate new sources of revenue, thanks in particular to the
provision of stabilisation services for the electricity grids in Australia
and, today, France. Feedback from the grid managers has been very
positive: after the plant's first year of operations, the quality of the
critical grid frequency stabilisation services provided by the Hornsdale
Power Reserve has been unanimously applauded, notably by the
Australian Energy Market Operator (AEMO).
The Group has pioneered the integration of storage solutions, in
particular thanks to its flagship Hornsdale Power Reserve project,
built in partnership with Tesla, which adjoins the Hornsdale Wind
Farm (but is nevertheless independent therefrom). In addition, the
Group currently has supplemental storage facilities integrated into its
DeGrussa solar power plant (in Australia), has begun work on the
construction of the Bulgana Green Power Hub which will include a
storage facility coupled with the Bulgana wind farm in Australia, and
the construction of Capella Storage, a storage facility coupled with
the Capella solar power plant in El Salvador. Finally, in February 2019,
The Group's approach to storage integration therefore lies in its
broader strategy involving the integration into project design and
structuring of elements that improve the projects' overall
attractiveness, increase acceptance of renewable energy and reduce
dependence on conventional energy sources for the supply and
transmission of electricity. As has been proven by the example of the
Hornsdale Power Reserve, the response time recorded by the
Group's storage facilities during peak power grid frequency periods is
much faster than that recorded by thermal power plants.
Consequently, the energy storage solutions are today much more
relevant than the use made of thermal power plants for frequency
regulation and so-called ancillary services. For these reasons, and in
the light of the results generated by the Hornsdale Power Reserve,
the Group has decided to consider the standalone cells business,
directly connected to the grid, as a business activity in its own right.
Lastly, in accordance with its technological agnosticism, the Group
keeps a close watch on the arrival of new technologies to perform
support functions for the production of renewable energy. For
example, in 2018, the Group obtained a subsidy in Australia to start
preliminary studies on the implementation and use of hydrogen
production and storage solutions.
Developing new promising sources of revenues by diversifying
the electricity off-takers
The Group continues to seek new sources of revenues through
off-takers other than the historic base that are the public entities and
electricity distributors. The Group has already signed private off-take
agreements for certain of its plants in operation, such as its Hedet
wind farm in Finland which signed an off-take agreement covering
100% of all electricity generated with Google, the Numurkah solar
power plant project in Australia from which the Melbourne tram
network is to purchase green certificates or again its DeGrussa
off-grid plant which supplies electricity to a copper mine under an
off-take contract. The Group expects that a substantial market for
corporate off-take contracts for renewable energy will develop in the
coming years, as the grid parity extends and that these parties
become increasingly sophisticated energy consumers. Resorting to
renewable energies enables these companies to reduce their costs
and the risk related to the prices for their electricity requirements. This
will also enable them to be recognised as “green” companies
committed to clean energy policies. The Group considers that the
credibility it acquired with existing corporate off-takers as well as the
good performance of large competitive projects puts it in a position to
take advantage of the growth in the market of corporate off-takers.
01Presentation
Strategy of the Group
26 REGISTRATION DOCUMENT 2018
In addition, while continuing to concentrate on securing stable
revenues through off-take contracts, the Group is strategically aiming
at additional market revenues by taking advantage of favourable
market prices. For example, the Group earned initial revenues from
sales in the spot market of the electricity produced by those wind
turbines or solar power plant sections already operational in farms
and plants under construction. In countries where the spot markets
are developed, the Group is planning to develop its projects and
tender bids to take advantage of market prices when they are
relatively predictable. This predictability is limited in time, that is,
before the start of a plant's off-take contract, insofar as the market
price is higher than the price of the off-take contract. The Group is
aiming to increase the profitability of its projects while afterwards
benefiting from the stability of electricity off-take contract prices at an
optimal level.
Remaining committed to corporate environmental and social
responsibility
The Group has emphasised maintaining the most demanding
standards on the health and safety of its employees and trading
partners, while preferring practices protecting the environment and
plans to continue doing so. The Group has already proven its
commitment towards Health, Safety and the Environment (“HSE”) by
establishing rigorous HSE polities, that it supervises in partnership
with specialised consultants. The Group intends to continue to
concentrate on rigorously managing these questions.
of stakeholders from the commercial standpoint, the Group takes into
account the social needs of the populations with whom it lives
side-by-side, recognising that its prospects are linked to the health
and prosperity of the regions in which it is investing. The Group's
activity is guided by the conviction that corporate social responsibility
(“CSR”) is crucial to its success. The Group expresses its
commitment to CSR by practical actions, including through:
Furthermore, the Group is dedicated to promoting local commitment
and socially and ecologically responsible practices, modelled on
major international guidelines, such as those published by the
International Finance Corporation. In addition to seeking the support
contributing to social investment funds for local development in●countries such as El Salvador and the creation of the Hornsdale
Wind Farm Community Fund in Australia;
investing in educational centres such as the Renewable Energy●Skills Centre of Excellence in the Canberra Institute of Technology
in Australia;
the contribution of 3% of the income generated by the Providencia●and Capella solar power plants in El Salvador to social
development projects;
support to organisations such as the Tendre La Main association●for the electrification of the schools being built by the association in
Madagascar;
putting in place sustainable financing frameworks, having already●financed green obligation projects, certified by Vigeo Eiris (“Vigeo”),
in October 2015 and December 2017. Furthermore, as part of the
due diligence carried out by Vigeo on the Group when the
Company' shares were listed on Euronext Paris, the Group was
rated A1 by Vigeo in June 2018.
For more information on the Group's HSE and CSR policies, see
Chapter 5 “Sustainable development and corporate responsibility” of
this document.
01Presentation
Description of the renewable energy market
27REGISTRATION DOCUMENT 2018
DESCRIPTION OF THE RENEWABLE ENERGY MARKET1.3
A RAPIDLY EXPANDING GLOBAL RENEWABLE ENERGY MARKET SUPPORTED 1.3.1
BY SUSTAINABLE MARKET DYNAMICS
OVERVIEW OF RENEWABLE ENERGIES IN THE WORLD1.3.1.1
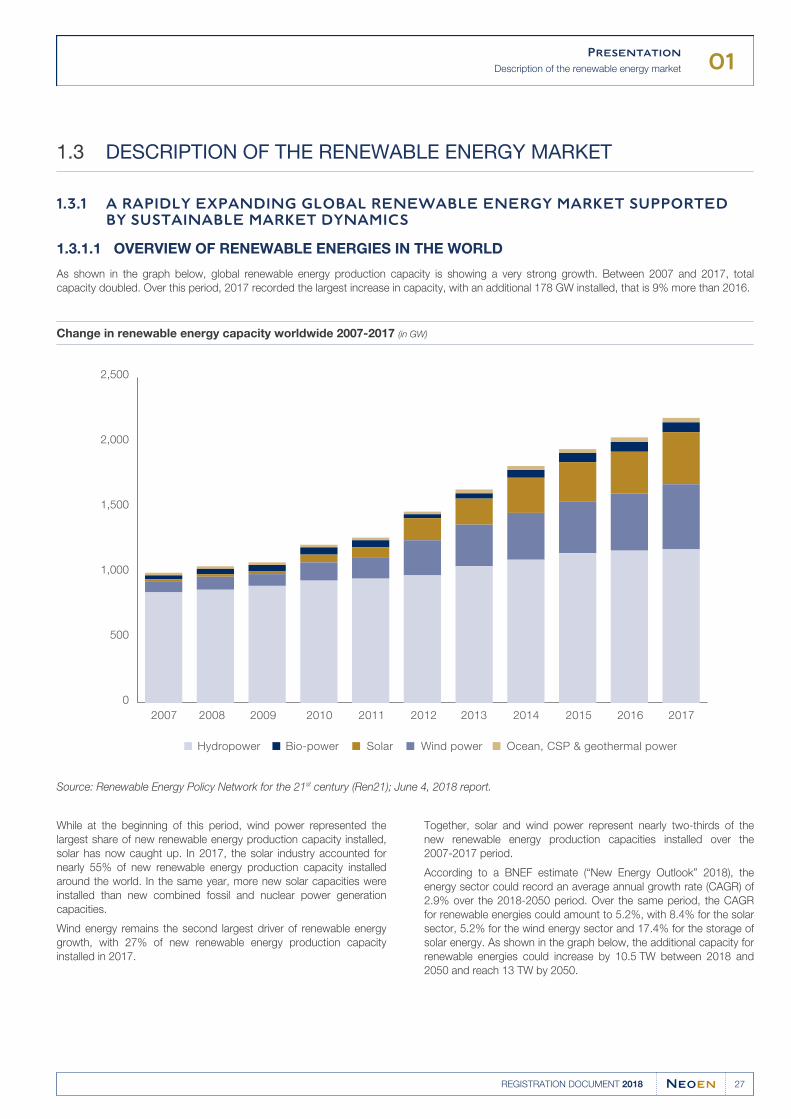
As shown in the graph below, global renewable energy production capacity is showing a very strong growth. Between 2007 and 2017, total
capacity doubled. Over this period, 2017 recorded the largest increase in capacity, with an additional 178 GW installed, that is 9% more than 2016.
Change in renewable energy capacity worldwide 2007-2017 (in GW)
0
500
1,000
1,500
2,000
2,500
Hydropower Ocean, CSP & geothermal power Wind powerSolarBio-power
2007 2008 2009 2010 2011 2012 2013 2014 2015 2016 2017
Source: Renewable Energy Policy Network for the 21st century (Ren21); June 4, 2018 report.
While at the beginning of this period, wind power represented the
largest share of new renewable energy production capacity installed,
solar has now caught up. In 2017, the solar industry accounted for
nearly 55% of new renewable energy production capacity installed
around the world. In the same year, more new solar capacities were
installed than new combined fossil and nuclear power generation
capacities.
Wind energy remains the second largest driver of renewable energy
growth, with 27% of new renewable energy production capacity
installed in 2017.
Together, solar and wind power represent nearly two-thirds of the
new renewable energy production capacities installed over the
2007-2017 period.
According to a BNEF estimate (“New Energy Outlook” 2018), the
energy sector could record an average annual growth rate (CAGR) of
2.9% over the 2018-2050 period. Over the same period, the CAGR
for renewable energies could amount to 5.2%, with 8.4% for the solar
sector, 5.2% for the wind energy sector and 17.4% for the storage of
solar energy. As shown in the graph below, the additional capacity for
renewable energies could increase by 10.5 TW between 2018 and
2050 and reach 13 TW by 2050.
01Presentation
Description of the renewable energy market
28 REGISTRATION DOCUMENT 2018
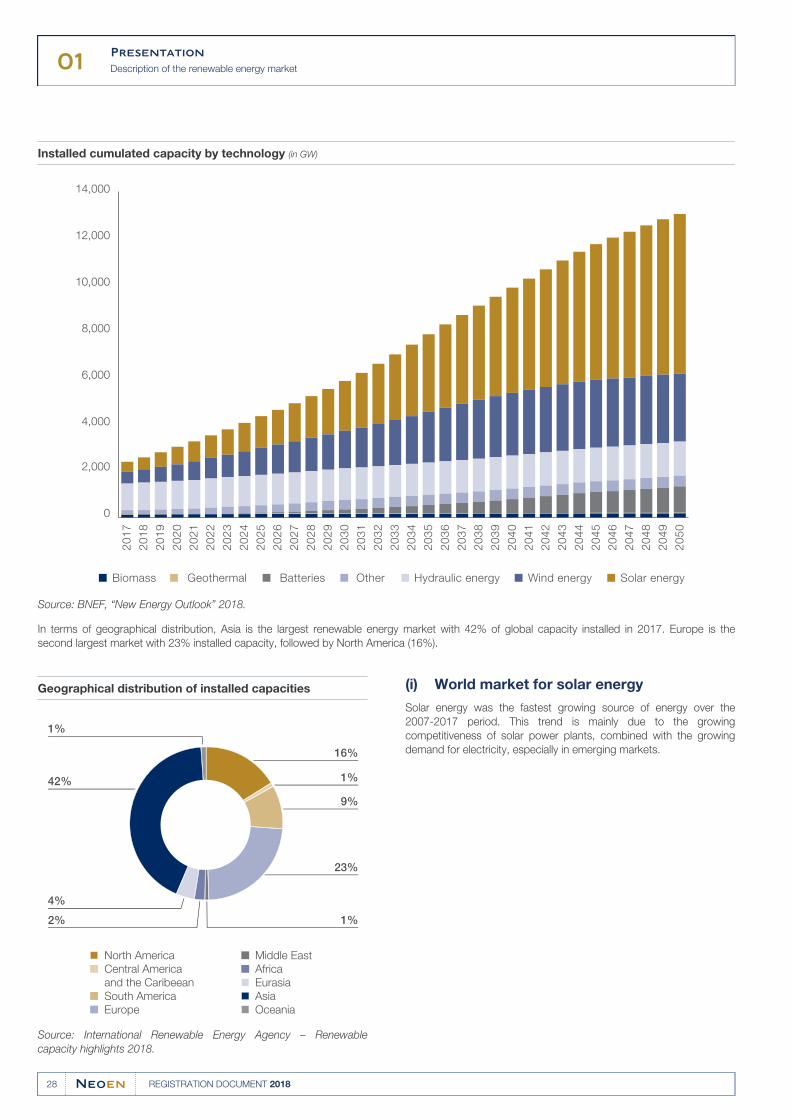
Installed cumulated capacity by technology (in GW)
0
2,000
4,000
6,000
8,000
10,000
12,000
14,000
Biomass Hydraulic energyOtherBatteriesGeothermal Solar energyWind energy
20
17
20
18
20
19
20
20
20
21
20
22
20
23
20
24
20
25
20
26
20
27
20
28
20
29
20
30
20
31
20
32
20
33
20
34
20
35
20
36
20
37
20
38
20
39
20
40
20
41
20
42
20
43
20
44
20
45
20
46
20
47
20
48
20
49
20
50
Source: BNEF, “New Energy Outlook” 2018.
In terms of geographical distribution, Asia is the largest renewable energy market with 42% of global capacity installed in 2017. Europe is the
second largest market with 23% installed capacity, followed by North America (16%).
Geographical distribution of installed capacities
42%
1%
4%
2%
16%
1%
9%
23%
1%
North America
Central America
and the Caribeean
South America
Europe
Middle East
Africa
Eurasia
Asia
Oceania
Source: International Renewable Energy Agency – Renewable
capacity highlights 2018.
World market for solar energy(i)
Solar energy was the fastest growing source of energy over the
2007-2017 period. This trend is mainly due to the growing
competitiveness of solar power plants, combined with the growing
demand for electricity, especially in emerging markets.
01Presentation
Description of the renewable energy market
29REGISTRATION DOCUMENT 2018
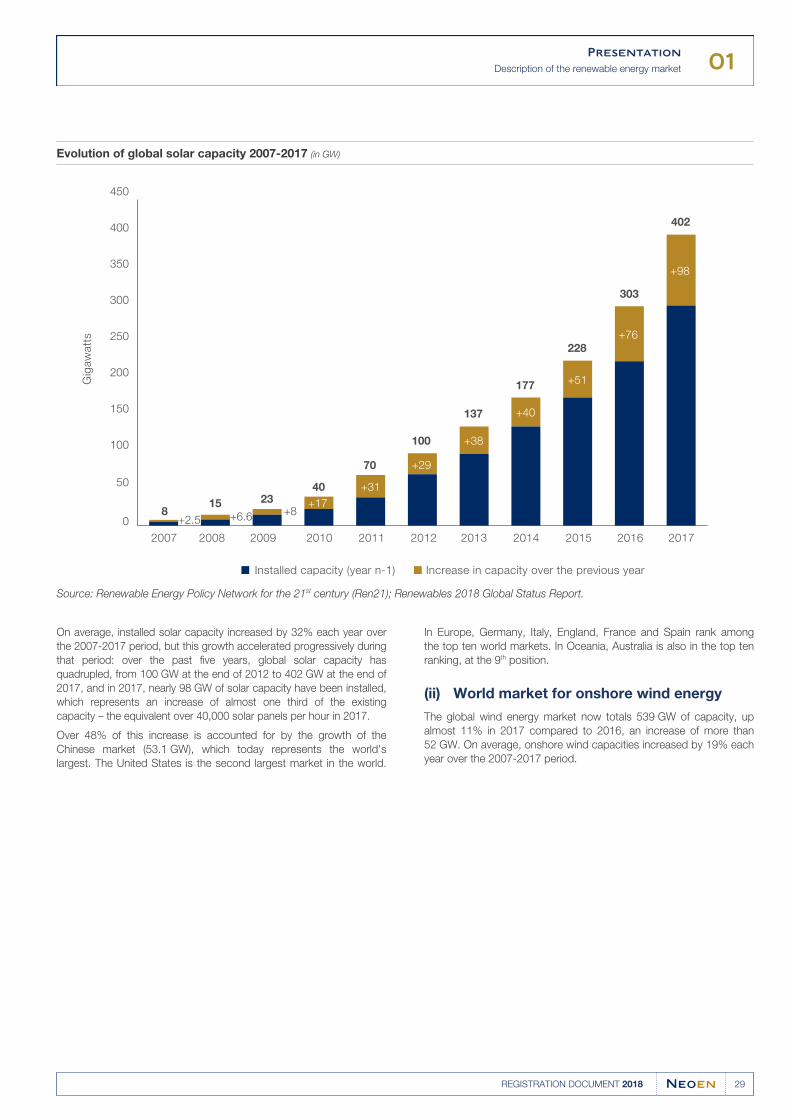
Evolution of global solar capacity 2007-2017 (in GW)
0
50
100
150
200
250
300
350
400
450
Installed capacity (year n-1) Increase in capacity over the previous year
+2.5 +6.6 +8 +17
+31
+29
+38
+40
+51
+76
+98
8 15 23
40
70
100
137
177
228
303
402
2007 2008 2009 2010 2011 2012 2013 2014 2015 2016 2017
Gig
aw
att
s
Source: Renewable Energy Policy Network for the 21st century (Ren21); Renewables 2018 Global Status Report.
On average, installed solar capacity increased by 32% each year over
the 2007-2017 period, but this growth accelerated progressively during
that period: over the past five years, global solar capacity has
quadrupled, from 100 GW at the end of 2012 to 402 GW at the end of
2017, and in 2017, nearly 98 GW of solar capacity have been installed,
which represents an increase of almost one third of the existing
capacity – the equivalent over 40,000 solar panels per hour in 2017.
In Europe, Germany, Italy, England, France and Spain rank among
the top ten world markets. In Oceania, Australia is also in the top ten
ranking, at the 9th position.
Over 48% of this increase is accounted for by the growth of the
Chinese market (53.1 GW), which today represents the world's
largest. The United States is the second largest market in the world.
World market for onshore wind energy(ii)
The global wind energy market now totals 539 GW of capacity, up
almost 11% in 2017 compared to 2016, an increase of more than
52 GW. On average, onshore wind capacities increased by 19% each
year over the 2007-2017 period.
01Presentation
Description of the renewable energy market
30 REGISTRATION DOCUMENT 2018
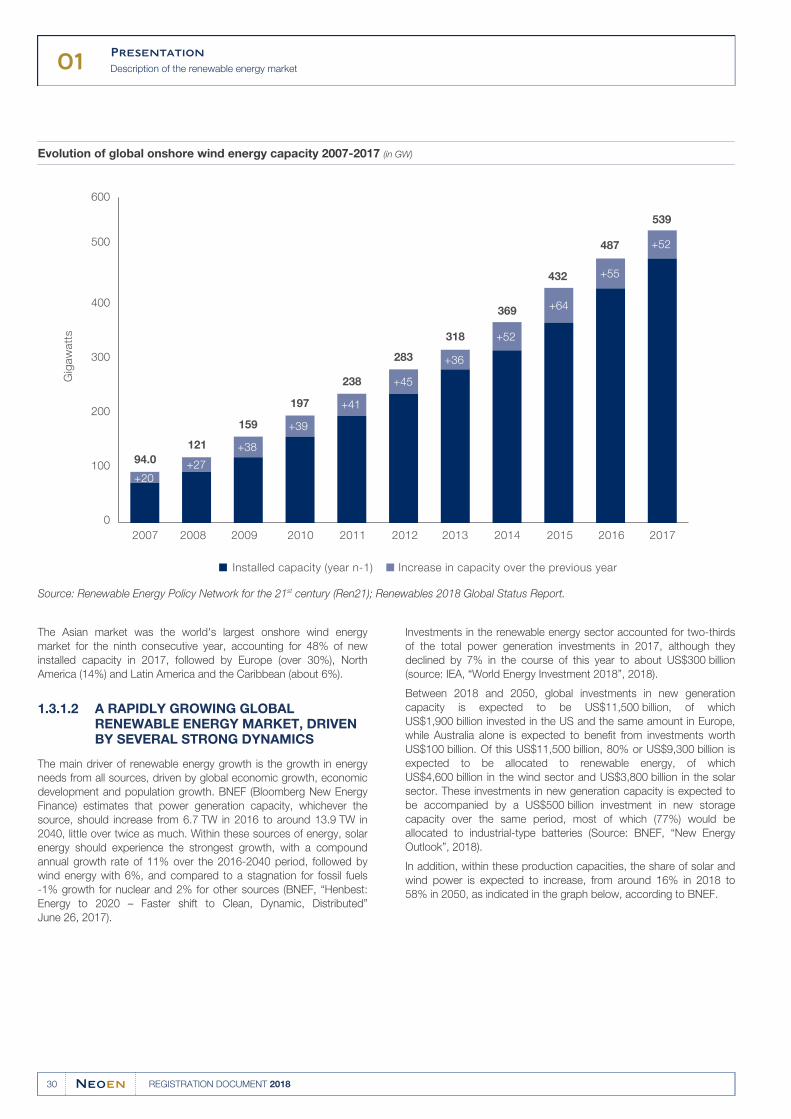
Evolution of global onshore wind energy capacity 2007-2017 (in GW)
0
100
200
300
400
500
600
Gig
aw
att
s
+20+27
+38
+39
+41
+45
+36
+52
+64
+55
+52
94.0
121
159
197
238
283
318
369
432
487
539
2007 2008 2009 2010 2011 2012 2013 2014 2015 2016 2017
Installed capacity (year n-1) Increase in capacity over the previous year
Source: Renewable Energy Policy Network for the 21st century (Ren21); Renewables 2018 Global Status Report.
The Asian market was the world's largest onshore wind energy
market for the ninth consecutive year, accounting for 48% of new
installed capacity in 2017, followed by Europe (over 30%), North
America (14%) and Latin America and the Caribbean (about 6%).
A RAPIDLY GROWING GLOBAL 1.3.1.2RENEWABLE ENERGY MARKET, DRIVEN BY SEVERAL STRONG DYNAMICS
The main driver of renewable energy growth is the growth in energy
needs from all sources, driven by global economic growth, economic
development and population growth. BNEF (Bloomberg New Energy
Finance) estimates that power generation capacity, whichever the
source, should increase from 6.7 TW in 2016 to around 13.9 TW in
2040, little over twice as much. Within these sources of energy, solar
energy should experience the strongest growth, with a compound
annual growth rate of 11% over the 2016-2040 period, followed by
wind energy with 6%, and compared to a stagnation for fossil fuels
-1% growth for nuclear and 2% for other sources (BNEF, “Henbest:
Energy to 2020 – Faster shift to Clean, Dynamic, Distributed”
June 26, 2017).
Investments in the renewable energy sector accounted for two-thirds
of the total power generation investments in 2017, although they
declined by 7% in the course of this year to about US$300 billion
(source: IEA, “World Energy Investment 2018”, 2018).
Between 2018 and 2050, global investments in new generation
capacity is expected to be US$11,500 billion, of which
US$1,900 billion invested in the US and the same amount in Europe,
while Australia alone is expected to benefit from investments worth
US$100 billion. Of this US$11,500 billion, 80% or US$9,300 billion is
expected to be allocated to renewable energy, of which
US$4,600 billion in the wind sector and US$3,800 billion in the solar
sector. These investments in new generation capacity is expected to
be accompanied by a US$500 billion investment in new storage
capacity over the same period, most of which (77%) would be
allocated to industrial-type batteries (Source: BNEF, “New Energy
Outlook”, 2018).
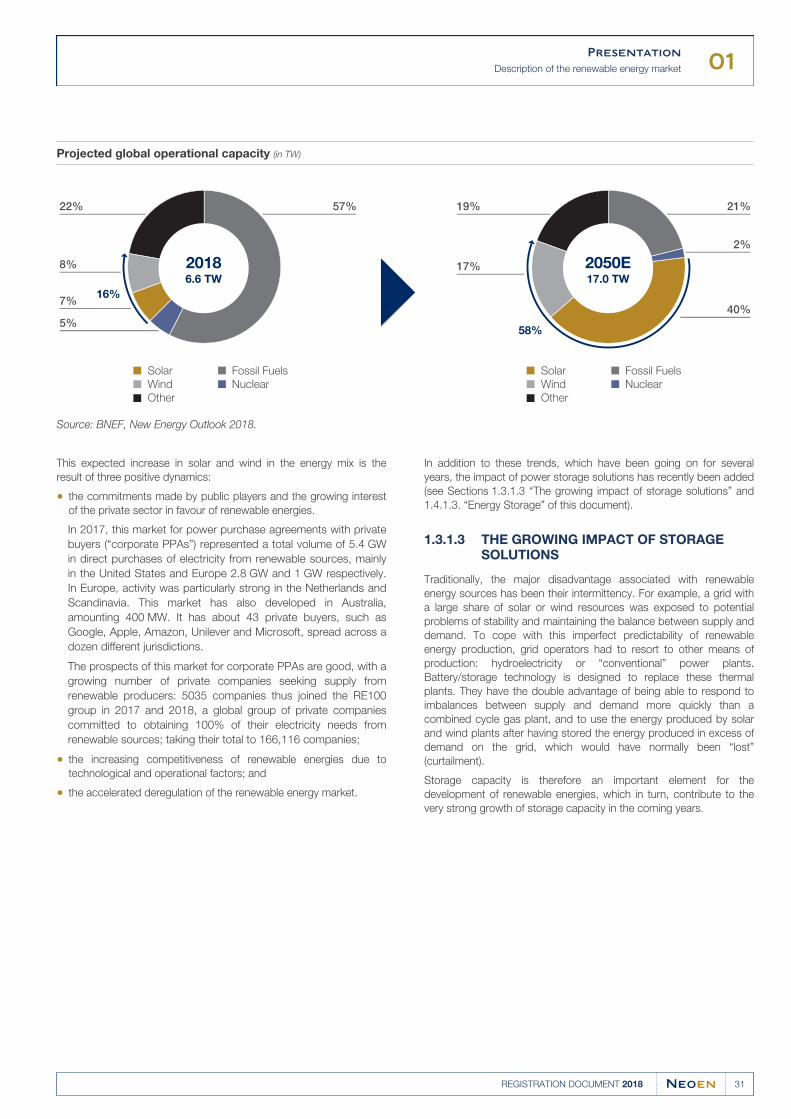
In addition, within these production capacities, the share of solar and
wind power is expected to increase, from around 16% in 2018 to
58% in 2050, as indicated in the graph below, according to BNEF.
01Presentation
Description of the renewable energy market
31REGISTRATION DOCUMENT 2018
Projected global operational capacity (in TW)
22% 57%
8%
16%
58%
7%
5%
19%
17%
21%
2%
40%
Solar
Wind
Other
Fossil Fuels
Nuclear
20186.6 TW
2050E17.0 TW
Solar
Wind
Other
Fossil Fuels
Nuclear
Source: BNEF, New Energy Outlook 2018.
This expected increase in solar and wind in the energy mix is the
result of three positive dynamics:
the commitments made by public players and the growing interest●of the private sector in favour of renewable energies.
In 2017, this market for power purchase agreements with private
buyers (“corporate PPAs”) represented a total volume of 5.4 GW
in direct purchases of electricity from renewable sources, mainly
in the United States and Europe 2.8 GW and 1 GW respectively.
In Europe, activity was particularly strong in the Netherlands and
Scandinavia. This market has also developed in Australia,
amounting 400 MW. It has about 43 private buyers, such as
Google, Apple, Amazon, Unilever and Microsoft, spread across a
dozen different jurisdictions.
The prospects of this market for corporate PPAs are good, with a
growing number of private companies seeking supply from
renewable producers: 5035 companies thus joined the RE100
group in 2017 and 2018, a global group of private companies
committed to obtaining 100% of their electricity needs from
renewable sources; taking their total to 166,116 companies;
the increasing competitiveness of renewable energies due to●technological and operational factors; and
the accelerated deregulation of the renewable energy market.●
In addition to these trends, which have been going on for several
years, the impact of power storage solutions has recently been added
(see Sections 1.3.1.3 “The growing impact of storage solutions” and
1.4.1.3. “Energy Storage” of this document).
THE GROWING IMPACT OF STORAGE 1.3.1.3SOLUTIONS
Traditionally, the major disadvantage associated with renewable
energy sources has been their intermittency. For example, a grid with
a large share of solar or wind resources was exposed to potential
problems of stability and maintaining the balance between supply and
demand. To cope with this imperfect predictability of renewable
energy production, grid operators had to resort to other means of
production: hydroelectricity or “conventional” power plants.
Battery/storage technology is designed to replace these thermal
plants. They have the double advantage of being able to respond to
imbalances between supply and demand more quickly than a
combined cycle gas plant, and to use the energy produced by solar
and wind plants after having stored the energy produced in excess of
demand on the grid, which would have normally been “lost”
(curtailment).
Storage capacity is therefore an important element for the
development of renewable energies, which in turn, contribute to the
very strong growth of storage capacity in the coming years.
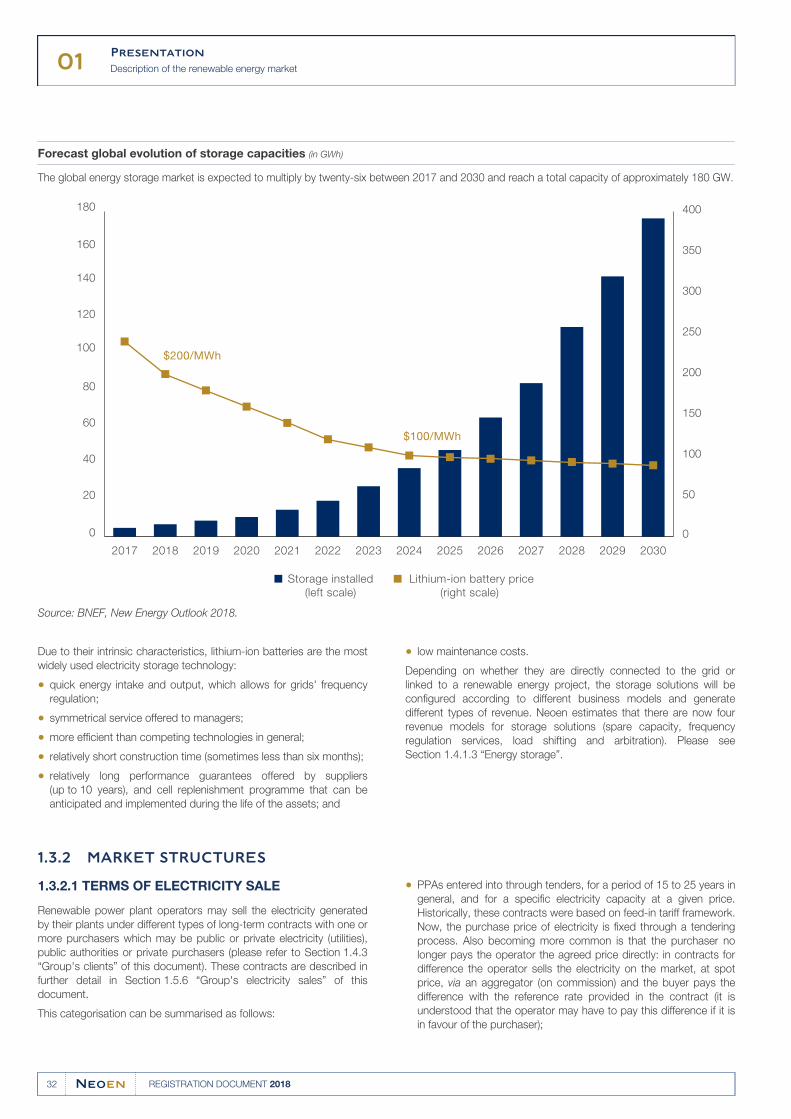
01Presentation
Description of the renewable energy market
32 REGISTRATION DOCUMENT 2018
Forecast global evolution of storage capacities (in GWh)
The global energy storage market is expected to multiply by twenty-six between 2017 and 2030 and reach a total capacity of approximately 180 GW.
0
20
40
60
80
100
120
140
160
180
0
50
100
150
200
250
300
350
400
2017 2018 2019 2020 2021 2022 2023 2024 2025 2026 2027 2028 2029 2030
$200/MWh
$100/MWh
Storage installed Lithium-ion battery price
(right scale)(left scale)
Source: BNEF, New Energy Outlook 2018.
Due to their intrinsic characteristics, lithium-ion batteries are the most
widely used electricity storage technology:
quick energy intake and output, which allows for grids' frequency●regulation;
symmetrical service offered to managers;●
more efficient than competing technologies in general;●
relatively short construction time (sometimes less than six months);●
relatively long performance guarantees offered by suppliers●(up to 10 years), and cell replenishment programme that can be
anticipated and implemented during the life of the assets; and
low maintenance costs.●
Depending on whether they are directly connected to the grid or
linked to a renewable energy project, the storage solutions will be
configured according to different business models and generate
different types of revenue. Neoen estimates that there are now four
revenue models for storage solutions (spare capacity, frequency
regulation services, load shifting and arbitration). Please see
Section 1.4.1.3 “Energy storage”.
MARKET STRUCTURES1.3.2
1.3.2.1 TERMS OF ELECTRICITY SALE
Renewable power plant operators may sell the electricity generated
by their plants under different types of long-term contracts with one or
more purchasers which may be public or private electricity (utilities),
public authorities or private purchasers (please refer to Section 1.4.3
“Group's clients” of this document). These contracts are described in
further detail in Section 1.5.6 “Group's electricity sales” of this
document.
This categorisation can be summarised as follows:
PPAs entered into through tenders, for a period of 15 to 25 years in●general, and for a specific electricity capacity at a given price.
Historically, these contracts were based on feed-in tariff framework.
Now, the purchase price of electricity is fixed through a tendering
process. Also becoming more common is that the purchaser no
longer pays the operator the agreed price directly: in contracts for
difference the operator sells the electricity on the market, at spot
price, via an aggregator (on commission) and the buyer pays the
difference with the reference rate provided in the contract (it is
understood that the operator may have to pay this difference if it is
in favour of the purchaser);
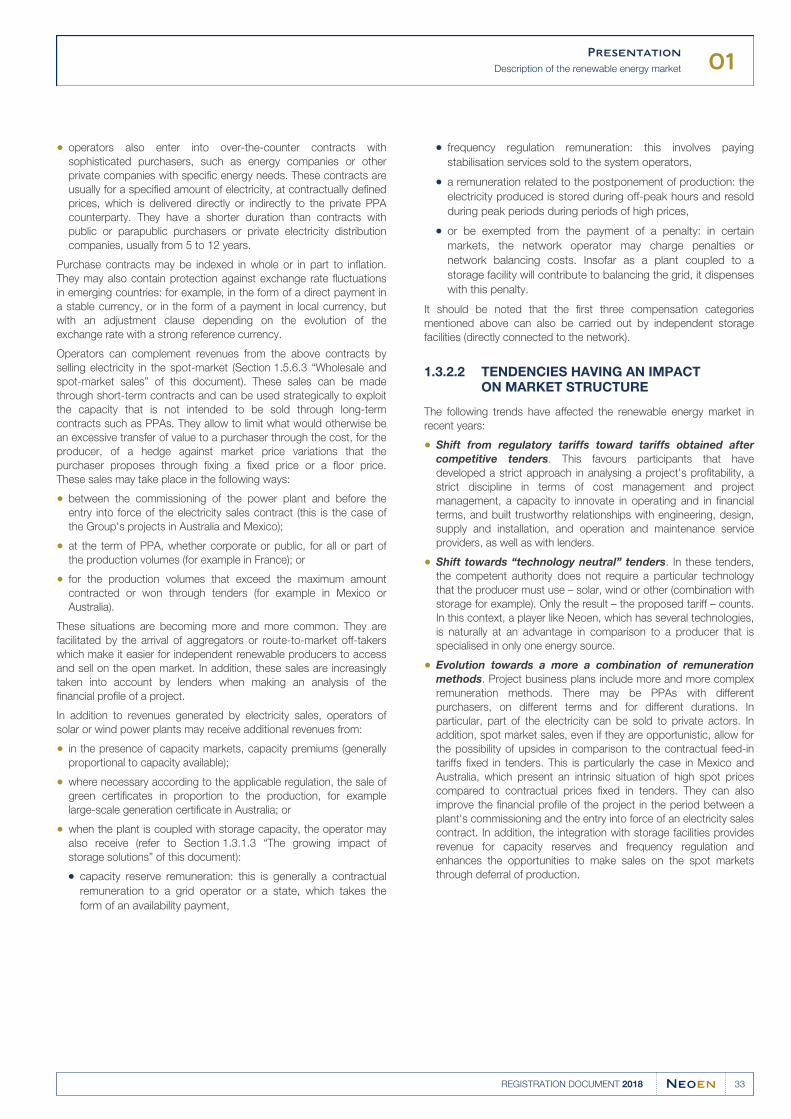
01Presentation
Description of the renewable energy market
33REGISTRATION DOCUMENT 2018
operators also enter into over-the-counter contracts with●sophisticated purchasers, such as energy companies or other
private companies with specific energy needs. These contracts are
usually for a specified amount of electricity, at contractually defined
prices, which is delivered directly or indirectly to the private PPA
counterparty. They have a shorter duration than contracts with
public or parapublic purchasers or private electricity distribution
companies, usually from 5 to 12 years.
Purchase contracts may be indexed in whole or in part to inflation.
They may also contain protection against exchange rate fluctuations
in emerging countries: for example, in the form of a direct payment in
a stable currency, or in the form of a payment in local currency, but
with an adjustment clause depending on the evolution of the
exchange rate with a strong reference currency.
Operators can complement revenues from the above contracts by
selling electricity in the spot-market (Section 1.5.6.3 “Wholesale and
spot-market sales” of this document). These sales can be made
through short-term contracts and can be used strategically to exploit
the capacity that is not intended to be sold through long-term
contracts such as PPAs. They allow to limit what would otherwise be
an excessive transfer of value to a purchaser through the cost, for the
producer, of a hedge against market price variations that the
purchaser proposes through fixing a fixed price or a floor price.
These sales may take place in the following ways:
between the commissioning of the power plant and before the●entry into force of the electricity sales contract (this is the case of
the Group's projects in Australia and Mexico);
at the term of PPA, whether corporate or public, for all or part of●the production volumes (for example in France); or
for the production volumes that exceed the maximum amount●contracted or won through tenders (for example in Mexico or
Australia).
These situations are becoming more and more common. They are
facilitated by the arrival of aggregators or route-to-market off-takers
which make it easier for independent renewable producers to access
and sell on the open market. In addition, these sales are increasingly
taken into account by lenders when making an analysis of the
financial profile of a project.
In addition to revenues generated by electricity sales, operators of
solar or wind power plants may receive additional revenues from:
in the presence of capacity markets, capacity premiums (generally●proportional to capacity available);
where necessary according to the applicable regulation, the sale of●green certificates in proportion to the production, for example
large-scale generation certificate in Australia; or
when the plant is coupled with storage capacity, the operator may●also receive (refer to Section 1.3.1.3 “The growing impact of
storage solutions” of this document):
capacity reserve remuneration: this is generally a contractual●remuneration to a grid operator or a state, which takes the
form of an availability payment,
frequency regulation remuneration: this involves paying●stabilisation services sold to the system operators,
a remuneration related to the postponement of production: the●electricity produced is stored during off-peak hours and resold
during peak periods during periods of high prices,
or be exempted from the payment of a penalty: in certain●markets, the network operator may charge penalties or
network balancing costs. Insofar as a plant coupled to a
storage facility will contribute to balancing the grid, it dispenses
with this penalty.
It should be noted that the first three compensation categories
mentioned above can also be carried out by independent storage
facilities (directly connected to the network).
TENDENCIES HAVING AN IMPACT 1.3.2.2ON MARKET STRUCTURE
The following trends have affected the renewable energy market in
recent years:
Shift from regulatory tariffs toward tariffs obtained after●competitive tenders. This favours participants that have
developed a strict approach in analysing a project's profitability, a
strict discipline in terms of cost management and project
management, a capacity to innovate in operating and in financial
terms, and built trustworthy relationships with engineering, design,
supply and installation, and operation and maintenance service
providers, as well as with lenders.
Shift towards “technology neutral” tenders. In these tenders,●the competent authority does not require a particular technology
that the producer must use – solar, wind or other (combination with
storage for example). Only the result – the proposed tariff – counts.
In this context, a player like Neoen, which has several technologies,
is naturally at an advantage in comparison to a producer that is
specialised in only one energy source.
Evolution towards a more a combination of remuneration●methods. Project business plans include more and more complex
remuneration methods. There may be PPAs with different
purchasers, on different terms and for different durations. In
particular, part of the electricity can be sold to private actors. In
addition, spot market sales, even if they are opportunistic, allow for
the possibility of upsides in comparison to the contractual feed-in
tariffs fixed in tenders. This is particularly the case in Mexico and
Australia, which present an intrinsic situation of high spot prices
compared to contractual prices fixed in tenders. They can also
improve the financial profile of the project in the period between a
plant's commissioning and the entry into force of an electricity sales
contract. In addition, the integration with storage facilities provides
revenue for capacity reserves and frequency regulation and
enhances the opportunities to make sales on the spot markets
through deferral of production.
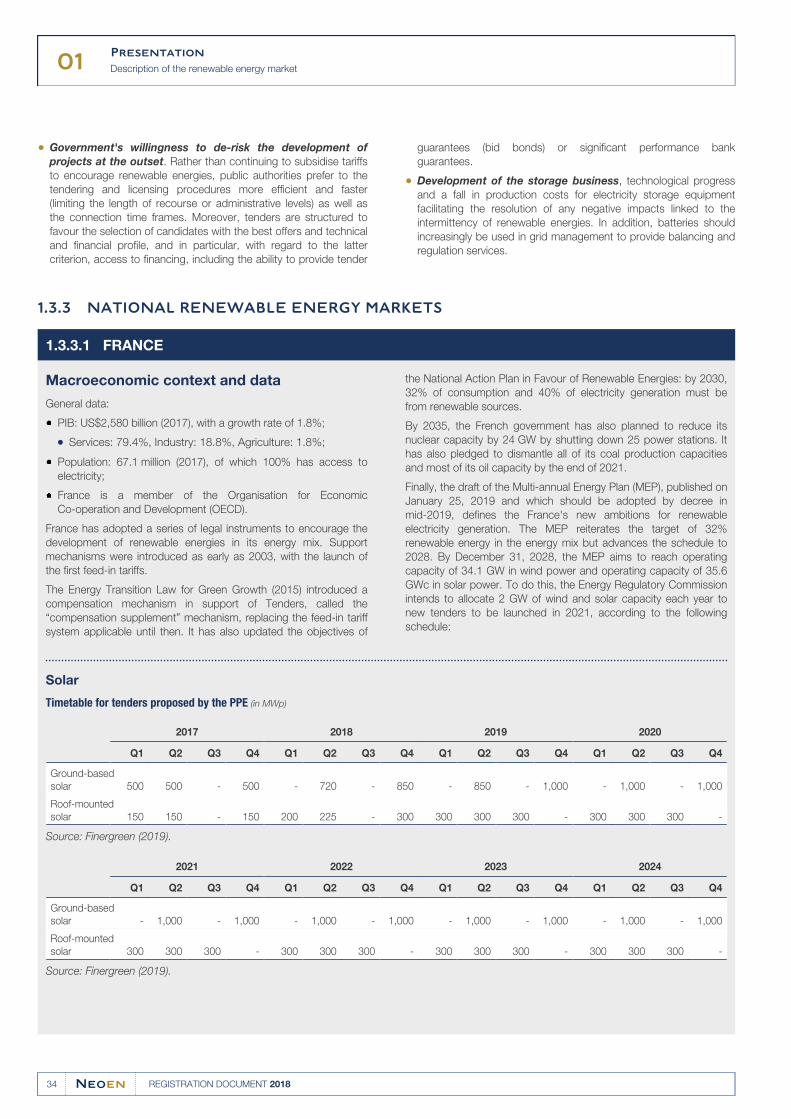
01Presentation
Description of the renewable energy market
34 REGISTRATION DOCUMENT 2018
Government's willingness to de-risk the development of● guarantees (bid bonds) or significant performance bank
projects at the outset. Rather than continuing to subsidise tariffs guarantees.
to encourage renewable energies, public authorities prefer to the
tendering and licensing procedures more efficient and faster
(limiting the length of recourse or administrative levels) as well as
the connection time frames. Moreover, tenders are structured to
favour the selection of candidates with the best offers and technical
and financial profile, and in particular, with regard to the latter
criterion, access to financing, including the ability to provide tender
Development of the storage business, technological progress●and a fall in production costs for electricity storage equipment
facilitating the resolution of any negative impacts linked to the
intermittency of renewable energies. In addition, batteries should
increasingly be used in grid management to provide balancing and
regulation services.
NATIONAL RENEWABLE ENERGY MARKETS1.3.3
FRANCE1.3.3.1
Macroeconomic context and data
General data:
PIB: US$2,580 billion (2017), with a growth rate of 1.8%;●
Services: 79.4%, Industry: 18.8%, Agriculture: 1.8%;●
Population: 67.1 million (2017), of which 100% has access to●electricity;
France is a member of the Organisation for Economic
Co-operation and Development (OECD).
France has adopted a series of legal instruments to encourage the
development of renewable energies in its energy mix. Support
mechanisms were introduced as early as 2003, with the launch of
the first feed-in tariffs.
the National Action Plan in Favour of Renewable Energies: by 2030,
32% of consumption and 40% of electricity generation must be
from renewable sources.
The Energy Transition Law for Green Growth (2015) introduced a
compensation mechanism in support of Tenders, called the
“compensation supplement” mechanism, replacing the feed-in tariff
system applicable until then. It has also updated the objectives of
By 2035, the French government has also planned to reduce its
nuclear capacity by 24 GW by shutting down 25 power stations. It
has also pledged to dismantle all of its coal production capacities
and most of its oil capacity by the end of 2021.
Finally, the draft of the Multi-annual Energy Plan (MEP), published on
January 25, 2019 and which should be adopted by decree in
mid-2019, defines the France's new ambitions for renewable
electricity generation. The MEP reiterates the target of 32%
renewable energy in the energy mix but advances the schedule to
2028. By December 31, 2028, the MEP aims to reach operating
capacity of 34.1 GW in wind power and operating capacity of 35.6
GWc in solar power. To do this, the Energy Regulatory Commission
intends to allocate 2 GW of wind and solar capacity each year to
new tenders to be launched in 2021, according to the following
schedule:
Solar
Timetable for tenders proposed by the PPE (in MWp)
2017 2018 2019 2020
Q1 Q2 Q3 Q4 Q1 Q2 Q3 Q4 Q1 Q2 Q3 Q4 Q1 Q2 Q3 Q4
Ground-based
solar 500 500 - 500 - 720 - 850 - 850 - 1,000 - 1,000 - 1,000
Roof-mounted
solar 150 150 - 150 200 225 - 300 300 300 300 - 300 300 300 -
Source: Finergreen (2019).
2021 2022 2023 2024
Q1 Q2 Q3 Q4 Q1 Q2 Q3 Q4 Q1 Q2 Q3 Q4 Q1 Q2 Q3 Q4
Ground-based
solar - 1,000 - 1,000 - 1,000 - 1,000 - 1,000 - 1,000 - 1,000 - 1,000
Roof-mounted
solar 300 300 300 - 300 300 300 - 300 300 300 - 300 300 300 -
Source: Finergreen (2019).
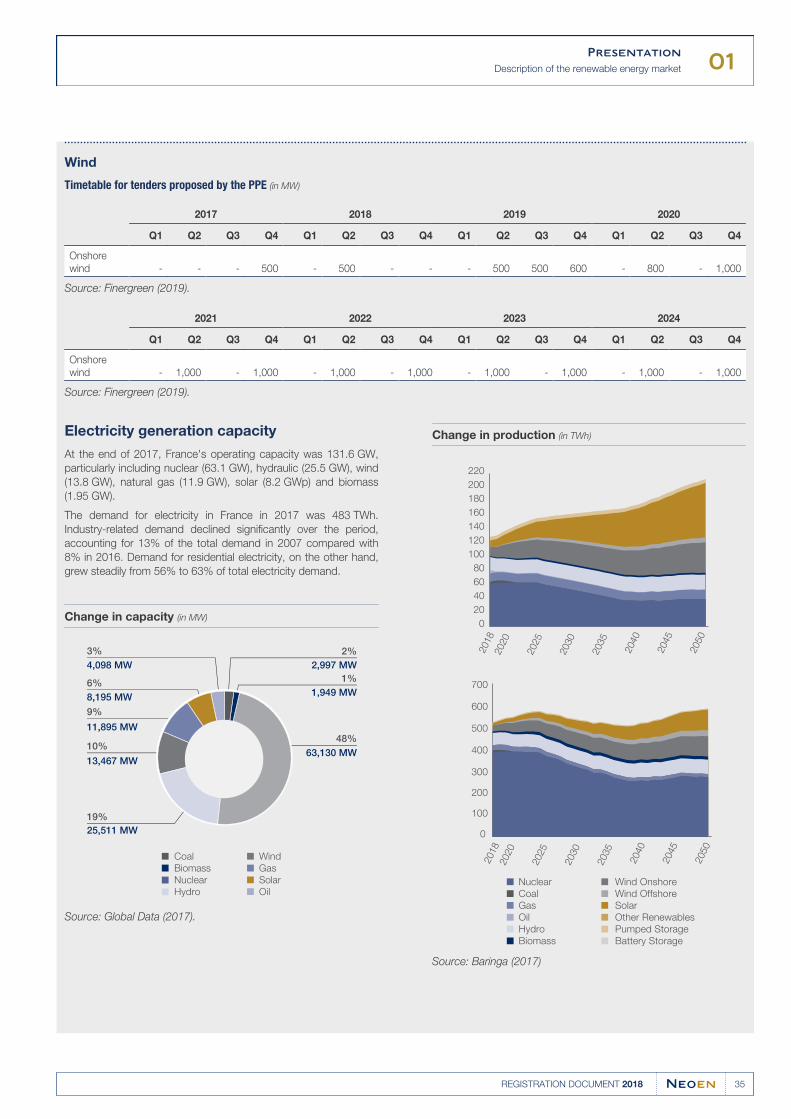
01Presentation
Description of the renewable energy market
35REGISTRATION DOCUMENT 2018
Wind
Timetable for tenders proposed by the PPE (in MW)
2017 2018 2019 2020
Q1 Q2 Q3 Q4 Q1 Q2 Q3 Q4 Q1 Q2 Q3 Q4 Q1 Q2 Q3 Q4
Onshore
wind - - - 500 - 500 - - - 500 500 600 - 800 - 1,000
Source: Finergreen (2019).
2021 2022 2023 2024
Q1 Q2 Q3 Q4 Q1 Q2 Q3 Q4 Q1 Q2 Q3 Q4 Q1 Q2 Q3 Q4
Onshore
wind - 1,000 - 1,000 - 1,000 - 1,000 - 1,000 - 1,000 - 1,000 - 1,000
Source: Finergreen (2019).
Electricity generation capacity
At the end of 2017, France's operating capacity was 131.6 GW,
particularly including nuclear (63.1 GW), hydraulic (25.5 GW), wind
(13.8 GW), natural gas (11.9 GW), solar (8.2 GWp) and biomass
(1.95 GW).
The demand for electricity in France in 2017 was 483 TWh.
Industry-related demand declined significantly over the period,
accounting for 13% of the total demand in 2007 compared with
8% in 2016. Demand for residential electricity, on the other hand,
grew steadily from 56% to 63% of total electricity demand.
Change in capacity (in MW)
Coal
Biomass
Nuclear
Hydro
Wind
Gas
Solar
Oil
9%
10%
3%
6%
19%
2%
1%
48%
4,098 MW
8,195 MW
11,895 MW
13,467 MW
25,511 MW
2,997 MW
1,949 MW
63,130 MW
Source: Global Data (2017).
Change in production (in TWh)
0
20
40
60
80
100
120
140
160
180
200
2202018
2020
2025
2030
2035
2040
2045
2050
0
100
200
300
400
500
600
700
Nuclear
Coal
Gas
Oil
Hydro
Biomass
Wind Onshore
Wind Offshore
Solar
Other Renewables
Pumped Storage
Battery Storage
2018
2020
2025
2030
2035
2040
2045
2050
Source: Baringa (2017)
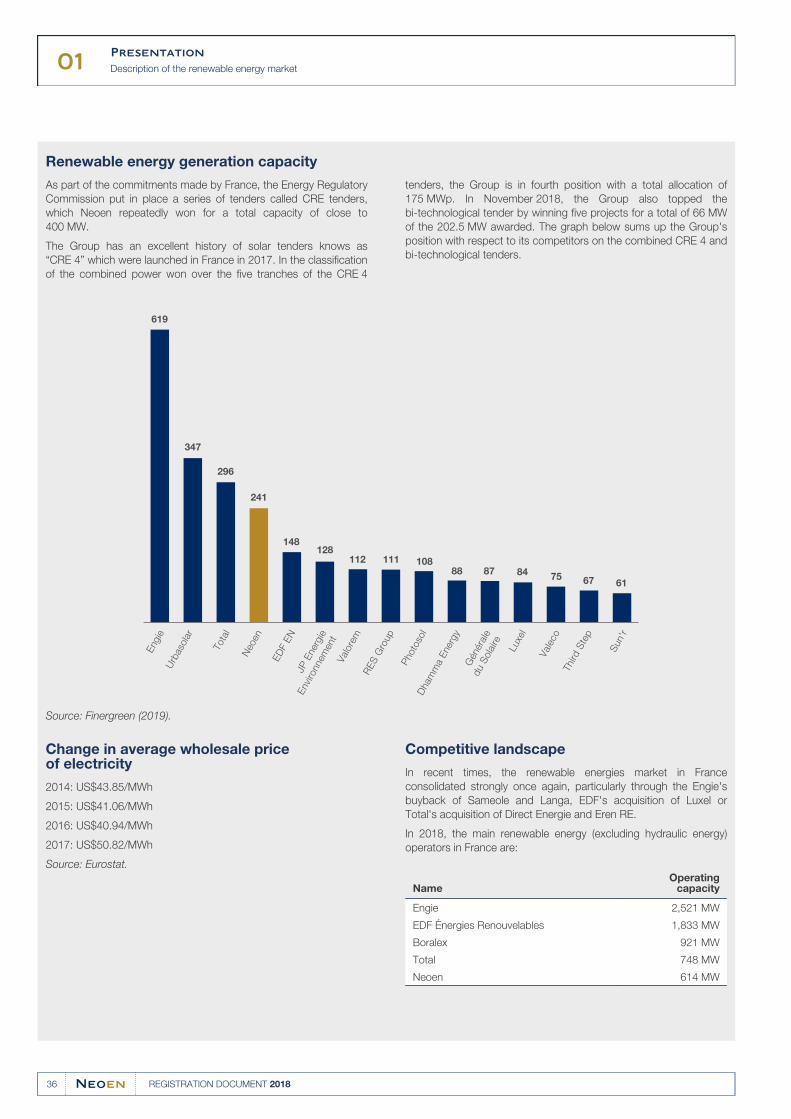
01Presentation
Description of the renewable energy market
36 REGISTRATION DOCUMENT 2018
Renewable energy generation capacity
As part of the commitments made by France, the Energy Regulatory
Commission put in place a series of tenders called CRE tenders,
which Neoen repeatedly won for a total capacity of close to
400 MW.
tenders, the Group is in fourth position with a total allocation of
175 MWp. In November 2018, the Group also topped the
bi-technological tender by winning five projects for a total of 66 MW
of the 202.5 MW awarded. The graph below sums up the Group's
position with respect to its competitors on the combined CRE 4 andThe Group has an excellent history of solar tenders knows asbi-technological tenders.“CRE 4” which were launched in France in 2017. In the classification
of the combined power won over the five tranches of the CRE 4
619
347
296
241
148128
112 111 10888 87
Engie
Urb
asola
r
Tota
l
Neo
en
ED
F E
NJP
Ener
gie
Envi
ronnem
ent
Val
ore
mR
ES
Gro
up
Photo
sol
Dham
ma
Ener
gy
Gén
éral
e
du S
ola
ire
Luxe
l
Val
eco
Third
Ste
p
Sun'r
84 75 67 61
Source: Finergreen (2019).
Change in average wholesale price of electricity
2014: US$43.85/MWh
2015: US$41.06/MWh
2016: US$40.94/MWh
2017: US$50.82/MWh
Source: Eurostat.
Competitive landscape
In recent times, the renewable energies market in France
consolidated strongly once again, particularly through the Engie's
buyback of Sameole and Langa, EDF's acquisition of Luxel or
Total's acquisition of Direct Energie and Eren RE.
In 2018, the main renewable energy (excluding hydraulic energy)
operators in France are:
NameOperating
capacity
Engie 2,521 MW
EDF Énergies Renouvelables 1,833 MW
Boralex 921 MW
Total 748 MW
Neoen 614 MW
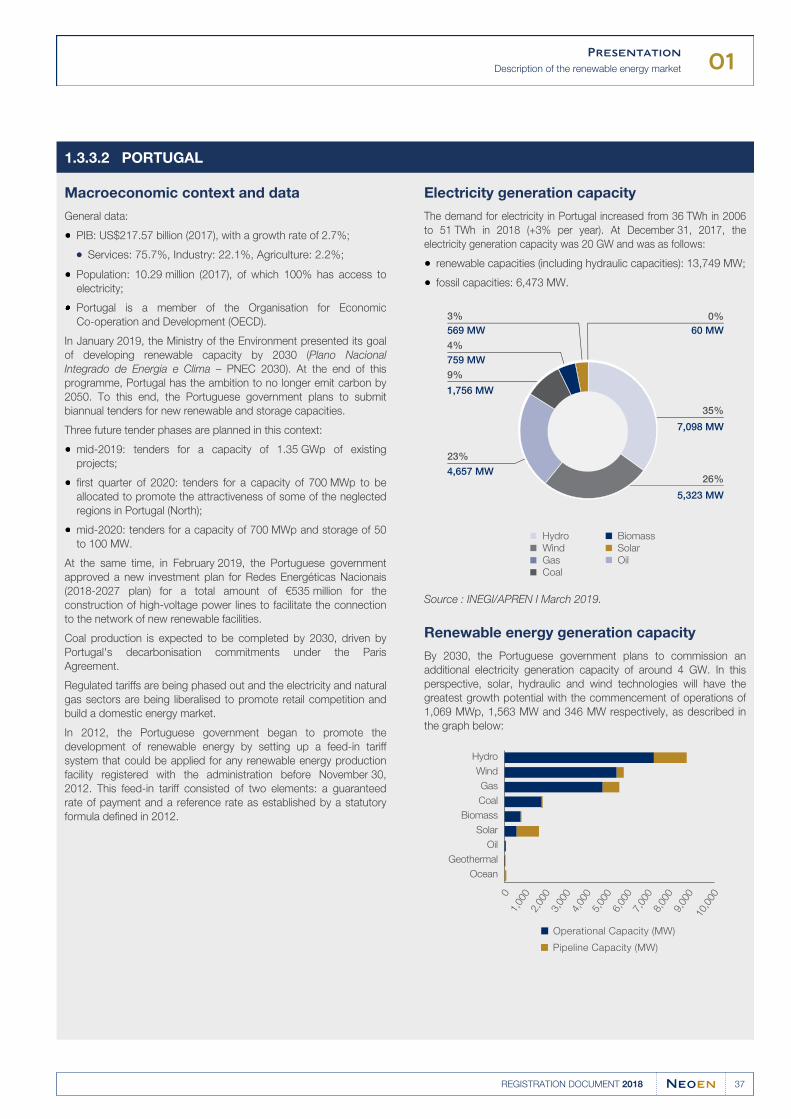
01Presentation
Description of the renewable energy market
37REGISTRATION DOCUMENT 2018
PORTUGAL1.3.3.2
Macroeconomic context and data
General data:
PIB: US$217.57 billion (2017), with a growth rate of 2.7%;●
Services: 75.7%, Industry: 22.1%, Agriculture: 2.2%;●
Population: 10.29 million (2017), of which 100% has access to●electricity;
Portugal is a member of the Organisation for Economic
Co-operation and Development (OECD).
In January 2019, the Ministry of the Environment presented its goal
of developing renewable capacity by 2030 (Plano Nacional
Integrado de Energia e Clima – PNEC 2030). At the end of this
programme, Portugal has the ambition to no longer emit carbon by
2050. To this end, the Portuguese government plans to submit
biannual tenders for new renewable and storage capacities.
Three future tender phases are planned in this context:
mid-2019: tenders for a capacity of 1.35 GWp of existing●projects;
first quarter of 2020: tenders for a capacity of 700 MWp to be●allocated to promote the attractiveness of some of the neglected
regions in Portugal (North);
mid-2020: tenders for a capacity of 700 MWp and storage of 50●to 100 MW.
At the same time, in February 2019, the Portuguese government
approved a new investment plan for Redes Energéticas Nacionais
(2018-2027 plan) for a total amount of €535 million for the
construction of high-voltage power lines to facilitate the connection
to the network of new renewable facilities.
Coal production is expected to be completed by 2030, driven by
Portugal's decarbonisation commitments under the Paris
Agreement.
Regulated tariffs are being phased out and the electricity and natural
gas sectors are being liberalised to promote retail competition and
build a domestic energy market.
In 2012, the Portuguese government began to promote the
development of renewable energy by setting up a feed-in tariff
system that could be applied for any renewable energy production
facility registered with the administration before November 30,
2012. This feed-in tariff consisted of two elements: a guaranteed
rate of payment and a reference rate as established by a statutory
formula defined in 2012.
Electricity generation capacity
The demand for electricity in Portugal increased from 36 TWh in 2006
to 51 TWh in 2018 (+3% per year). At December 31, 2017, the
electricity generation capacity was 20 GW and was as follows:
renewable capacities (including hydraulic capacities): 13,749 MW;●
fossil capacities: 6,473 MW.●
9%
3%569 MW
759 MW
1,756 MW
4,657 MW
7,098 MW
60 MW
4%
23%
0%
35%
5,323 MW
26%
Hydro
Wind
Gas
Coal
Biomass
Solar
Oil
Source : INEGI/APREN I March 2019.
Renewable energy generation capacity
By 2030, the Portuguese government plans to commission an
additional electricity generation capacity of around 4 GW. In this
perspective, solar, hydraulic and wind technologies will have the
greatest growth potential with the commencement of operations of
1,069 MWp, 1,563 MW and 346 MW respectively, as described in
the graph below:
Hydro
Wind
Gas
Coal
Biomass
Solar
Oil
Geothermal
Ocean
01,
000
4,00
05,
000
2,00
0
6,00
0
8,00
0
10,0
00
9,00
0
7,00
0
3,00
0
Operational Capacity (MW)
Pipeline Capacity (MW)
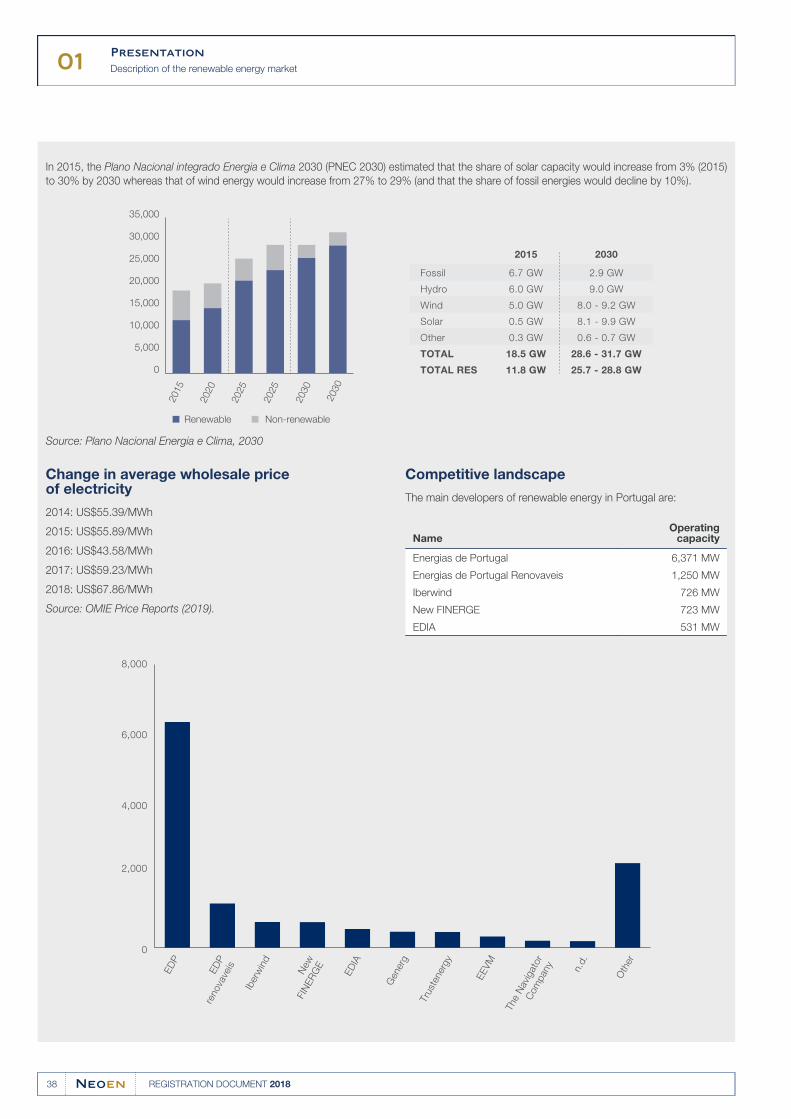
01Presentation
Description of the renewable energy market
38 REGISTRATION DOCUMENT 2018
In 2015, the Plano Nacional integrado Energia e Clima 2030 (PNEC 2030) estimated that the share of solar capacity would increase from 3% (2015)
to 30% by 2030 whereas that of wind energy would increase from 27% to 29% (and that the share of fossil energies would decline by 10%).
0
5,000
10,000
15,000
20,000
25,000
30,000
35,000
2015
2020
2025
2025
2030
2030
Renewable Non-renewable
Fossil
Hydro
Wind
Solar
Other
TOTAL
TOTAL RES
2015
6.7 GW
6.0 GW
5.0 GW
0.5 GW
0.3 GW
18.5 GW
11.8 GW
2030
2.9 GW
9.0 GW
8.0 - 9.2 GW
8.1 - 9.9 GW
0.6 - 0.7 GW
28.6 - 31.7 GW
25.7 - 28.8 GW
Source: Plano Nacional Energia e Clima, 2030
Change in average wholesale price of electricity
2014: US$55.39/MWh
2015: US$55.89/MWh
2016: US$43.58/MWh
2017: US$59.23/MWh
2018: US$67.86/MWh
Source: OMIE Price Reports (2019).
Competitive landscape
The main developers of renewable energy in Portugal are:
NameOperating
capacity
Energias de Portugal 6,371 MW
Energias de Portugal Renovaveis 1,250 MW
Iberwind 726 MW
New FINERGE 723 MW
EDIA 531 MW
0
2,000
4,000
6,000
8,000
ED
P
ED
P
renova
veis
Iber
win
d
New
FIN
ER
GE
ED
IA
Gen
erg
Tru
sten
ergy
EEVM
The
Nav
igat
or
Com
pan
y
n.d
.
Oth
er
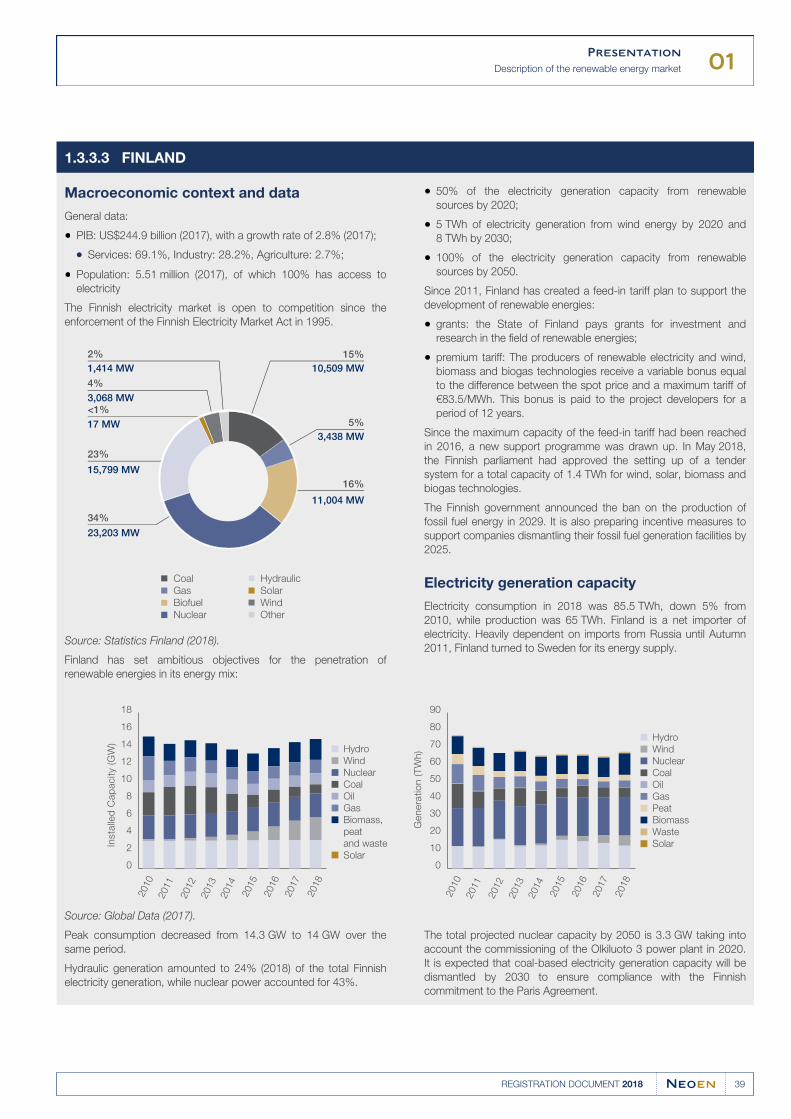
01Presentation
Description of the renewable energy market
39REGISTRATION DOCUMENT 2018
FINLAND1.3.3.3
Macroeconomic context and data
General data:
PIB: US$244.9 billion (2017), with a growth rate of 2.8% (2017);●
Services: 69.1%, Industry: 28.2%, Agriculture: 2.7%;●
Population: 5.51 million (2017), of which 100% has access to●electricity
The Finnish electricity market is open to competition since the
enforcement of the Finnish Electricity Market Act in 1995.
23%
2%1,414 MW
3,068 MW
15,799 MW
23,203 MW
11,004 MW
10,509 MW
4%
17 MW<1%
34%
15%
3,438 MW5%
16%
Coal
Gas
Biofuel
Nuclear
Hydraulic
Solar
Wind
Other
Source: Statistics Finland (2018).
Finland has set ambitious objectives for the penetration of
renewable energies in its energy mix:
50% of the electricity generation capacity from renewable●sources by 2020;
5 TWh of electricity generation from wind energy by 2020 and●8 TWh by 2030;
100% of the electricity generation capacity from renewable●sources by 2050.
Since 2011, Finland has created a feed-in tariff plan to support the
development of renewable energies:
grants: the State of Finland pays grants for investment and●research in the field of renewable energies;
premium tariff: The producers of renewable electricity and wind,●biomass and biogas technologies receive a variable bonus equal
to the difference between the spot price and a maximum tariff of
€83.5/MWh. This bonus is paid to the project developers for a
period of 12 years.
Since the maximum capacity of the feed-in tariff had been reached
in 2016, a new support programme was drawn up. In May 2018,
the Finnish parliament had approved the setting up of a tender
system for a total capacity of 1.4 TWh for wind, solar, biomass and
biogas technologies.
The Finnish government announced the ban on the production of
fossil fuel energy in 2029. It is also preparing incentive measures to
support companies dismantling their fossil fuel generation facilities by
2025.
Electricity generation capacity
Electricity consumption in 2018 was 85.5 TWh, down 5% from
2010, while production was 65 TWh. Finland is a net importer of
electricity. Heavily dependent on imports from Russia until Autumn
2011, Finland turned to Sweden for its energy supply.
Hydro
Wind
Nuclear
Coal
Oil
Gas
Biomass,
peat
and waste
Solar
Hydro
Wind
Nuclear
Coal
Oil
Gas
Peat
Biomass
Waste
Solar
0
2
4
6
8
10
12
14
16
18
0
10
20
30
40
50
60
70
80
90
2010
2011
2012
2013
2014
2015
2016
2017
2018
2010
2011
2012
2013
2014
2015
2016
2017
2018
Gen
era
tio
n (
TW
h)
Insta
lled
Cap
acity (
GW
)
Source: Global Data (2017).
Peak consumption decreased from 14.3 GW to 14 GW over the
same period.
Hydraulic generation amounted to 24% (2018) of the total Finnish
electricity generation, while nuclear power accounted for 43%.
The total projected nuclear capacity by 2050 is 3.3 GW taking into
account the commissioning of the Olkiluoto 3 power plant in 2020.
It is expected that coal-based electricity generation capacity will be
dismantled by 2030 to ensure compliance with the Finnish
commitment to the Paris Agreement.
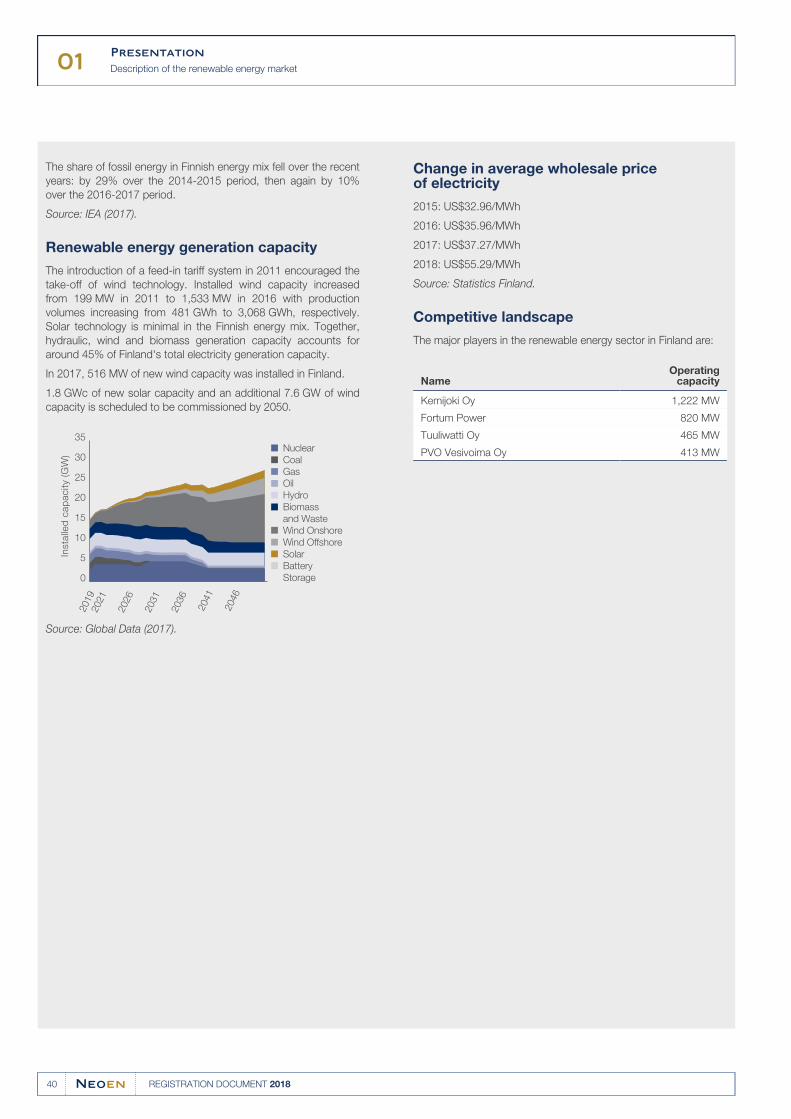
01Presentation
Description of the renewable energy market
40 REGISTRATION DOCUMENT 2018
The share of fossil energy in Finnish energy mix fell over the recent
years: by 29% over the 2014-2015 period, then again by 10%
over the 2016-2017 period.
Source: IEA (2017).
Renewable energy generation capacity
The introduction of a feed-in tariff system in 2011 encouraged the
take-off of wind technology. Installed wind capacity increased
from 199 MW in 2011 to 1,533 MW in 2016 with production
volumes increasing from 481 GWh to 3,068 GWh, respectively.
Solar technology is minimal in the Finnish energy mix. Together,
hydraulic, wind and biomass generation capacity accounts for
around 45% of Finland's total electricity generation capacity.
In 2017, 516 MW of new wind capacity was installed in Finland.
1.8 GWc of new solar capacity and an additional 7.6 GW of wind
capacity is scheduled to be commissioned by 2050.
Nuclear
Coal
Gas
Oil
Hydro
Biomass
and Waste
Wind Onshore
Wind Offshore
Solar
Battery
Storage0
5
10
15
20
25
30
35
2019
2021
2026
2031
2036
2041
2046
Insta
lled
cap
acity (
GW
)
Source: Global Data (2017).
Change in average wholesale price of electricity
2015: US$32.96/MWh
2016: US$35.96/MWh
2017: US$37.27/MWh
2018: US$55.29/MWh
Source: Statistics Finland.
Competitive landscape
The major players in the renewable energy sector in Finland are:
NameOperating
capacity
Kemijoki Oy 1,222 MW
Fortum Power 820 MW
Tuuliwatti Oy 465 MW
PVO Vesivoima Oy 413 MW
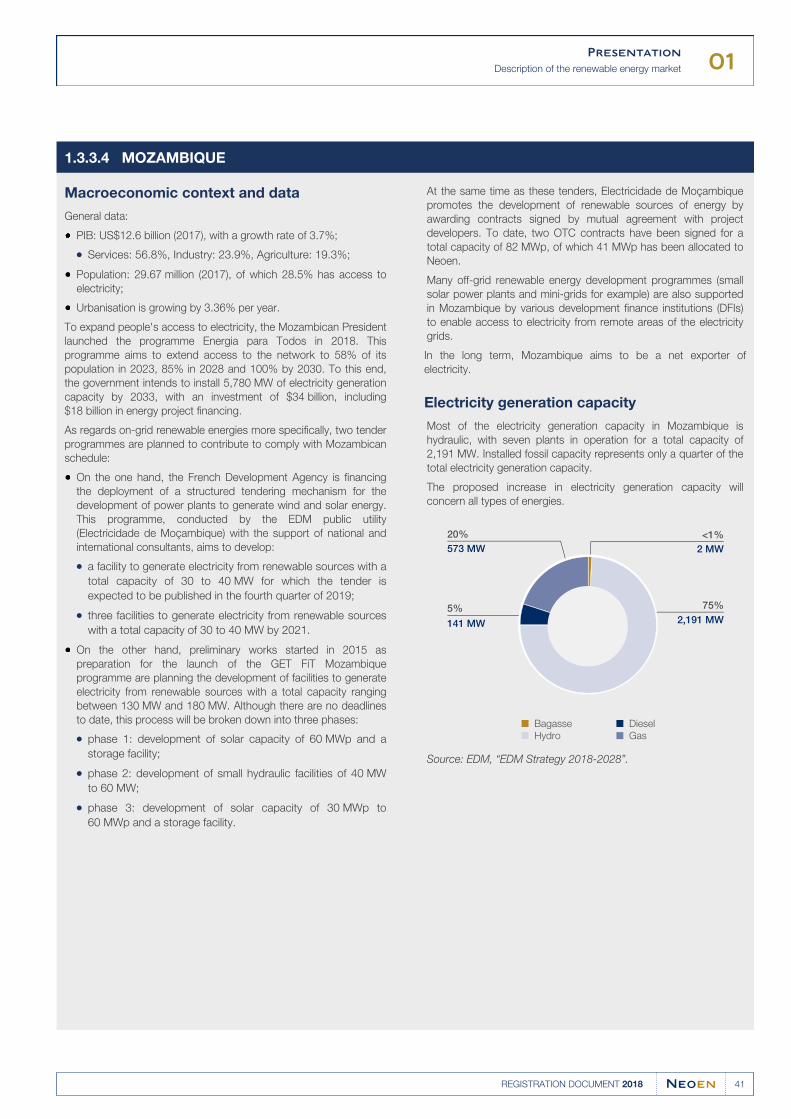
01Presentation
Description of the renewable energy market
41REGISTRATION DOCUMENT 2018
MOZAMBIQUE1.3.3.4
Macroeconomic context and data
General data:
PIB: US$12.6 billion (2017), with a growth rate of 3.7%;
Services: 56.8%, Industry: 23.9%, Agriculture: 19.3%;●
Population: 29.67 million (2017), of which 28.5% has access to●electricity;
Urbanisation is growing by 3.36% per year.●
To expand people's access to electricity, the Mozambican President
launched the programme Energia para Todos in 2018. This
programme aims to extend access to the network to 58% of its
population in 2023, 85% in 2028 and 100% by 2030. To this end,
the government intends to install 5,780 MW of electricity generation
capacity by 2033, with an investment of $34 billion, including
$18 billion in energy project financing.
As regards on-grid renewable energies more specifically, two tender
programmes are planned to contribute to comply with Mozambican
schedule:
On the one hand, the French Development Agency is financing●the deployment of a structured tendering mechanism for the
development of power plants to generate wind and solar energy.
This programme, conducted by the EDM public utility
(Electricidade de Moçambique) with the support of national and
international consultants, aims to develop:
a facility to generate electricity from renewable sources with a●total capacity of 30 to 40 MW for which the tender is
expected to be published in the fourth quarter of 2019;
three facilities to generate electricity from renewable sources●with a total capacity of 30 to 40 MW by 2021.
On the other hand, preliminary works started in 2015 as●preparation for the launch of the GET FiT Mozambique
programme are planning the development of facilities to generate
electricity from renewable sources with a total capacity ranging
between 130 MW and 180 MW. Although there are no deadlines
to date, this process will be broken down into three phases:
phase 1: development of solar capacity of 60 MWp and a●storage facility;
phase 2: development of small hydraulic facilities of 40 MW●to 60 MW;
phase 3: development of solar capacity of 30 MWp to●60 MWp and a storage facility.
At the same time as these tenders, Electricidade de Moçambique
promotes the development of renewable sources of energy by
awarding contracts signed by mutual agreement with project
developers. To date, two OTC contracts have been signed for a
total capacity of 82 MWp, of which 41 MWp has been allocated to
Neoen.
Many off-grid renewable energy development programmes (small
solar power plants and mini-grids for example) are also supported
in Mozambique by various development finance institutions (DFIs)
to enable access to electricity from remote areas of the electricity
grids.
In the long term, Mozambique aims to be a net exporter of
electricity.
Electricity generation capacity
Most of the electricity generation capacity in Mozambique is
hydraulic, with seven plants in operation for a total capacity of
2,191 MW. Installed fossil capacity represents only a quarter of the
total electricity generation capacity.
The proposed increase in electricity generation capacity will
concern all types of energies.
5%
20% <1%
75%
Bagasse
Hydro
Diesel
Gas
573 MW
141 MW
2 MW
2,191 MW
Source: EDM, “EDM Strategy 2018-2028”.
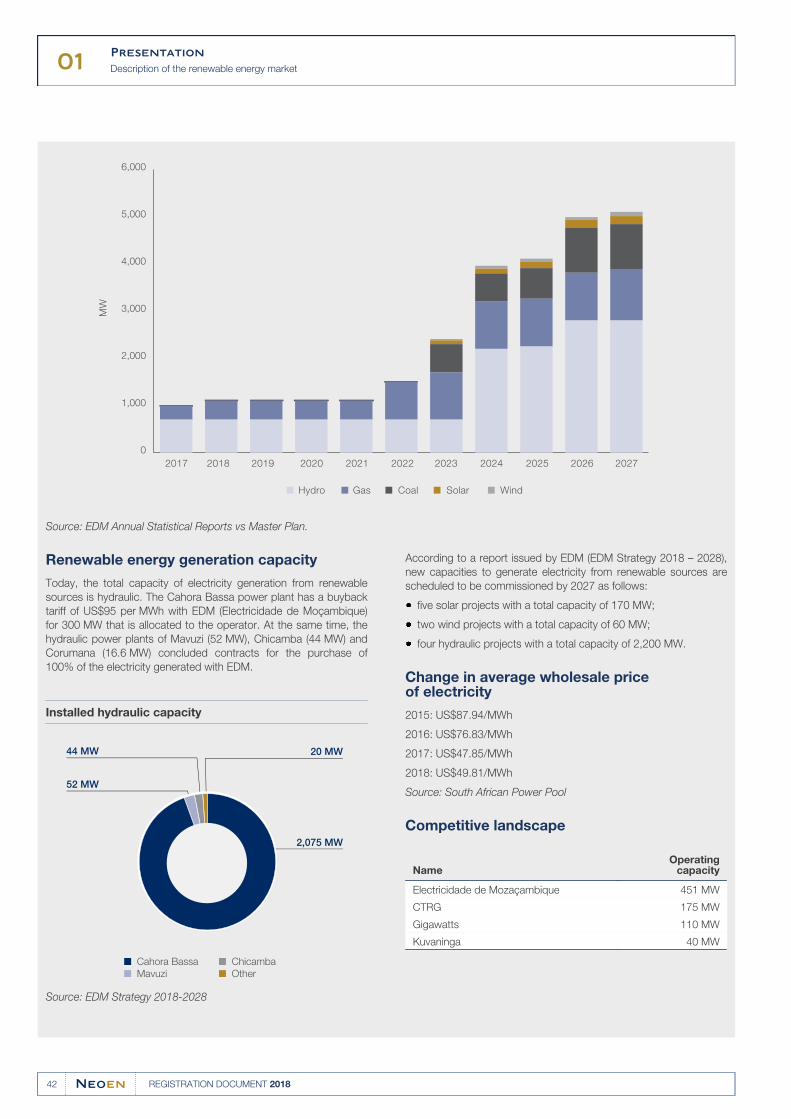
01Presentation
Description of the renewable energy market
42 REGISTRATION DOCUMENT 2018
0
1,000
2,000
3,000
4,000
5,000
6,000
Hydro WindSolarCoalGas
2017 2018 2019 2020 2021 2022 2023 2024 2025 2026 2027
MW
Source: EDM Annual Statistical Reports vs Master Plan.
Renewable energy generation capacity
Today, the total capacity of electricity generation from renewable
sources is hydraulic. The Cahora Bassa power plant has a buyback
tariff of US$95 per MWh with EDM (Electricidade de Moçambique)
for 300 MW that is allocated to the operator. At the same time, the
hydraulic power plants of Mavuzi (52 MW), Chicamba (44 MW) and
Corumana (16.6 MW) concluded contracts for the purchase of
100% of the electricity generated with EDM.
Installed hydraulic capacity
52 MW
Cahora Bassa
Mavuzi
Chicamba
Other
44 MW 20 MW
2,075 MW
Source: EDM Strategy 2018-2028
According to a report issued by EDM (EDM Strategy 2018 – 2028),
new capacities to generate electricity from renewable sources are
scheduled to be commissioned by 2027 as follows:
five solar projects with a total capacity of 170 MW;●
two wind projects with a total capacity of 60 MW;
four hydraulic projects with a total capacity of 2,200 MW.
Change in average wholesale price of electricity
2015: US$87.94/MWh
2016: US$76.83/MWh
2017: US$47.85/MWh
2018: US$49.81/MWh
Source: South African Power Pool
Competitive landscape
NameOperating
capacity
Electricidade de Mozaçambique 451 MW
CTRG 175 MW
Gigawatts 110 MW
Kuvaninga 40 MW
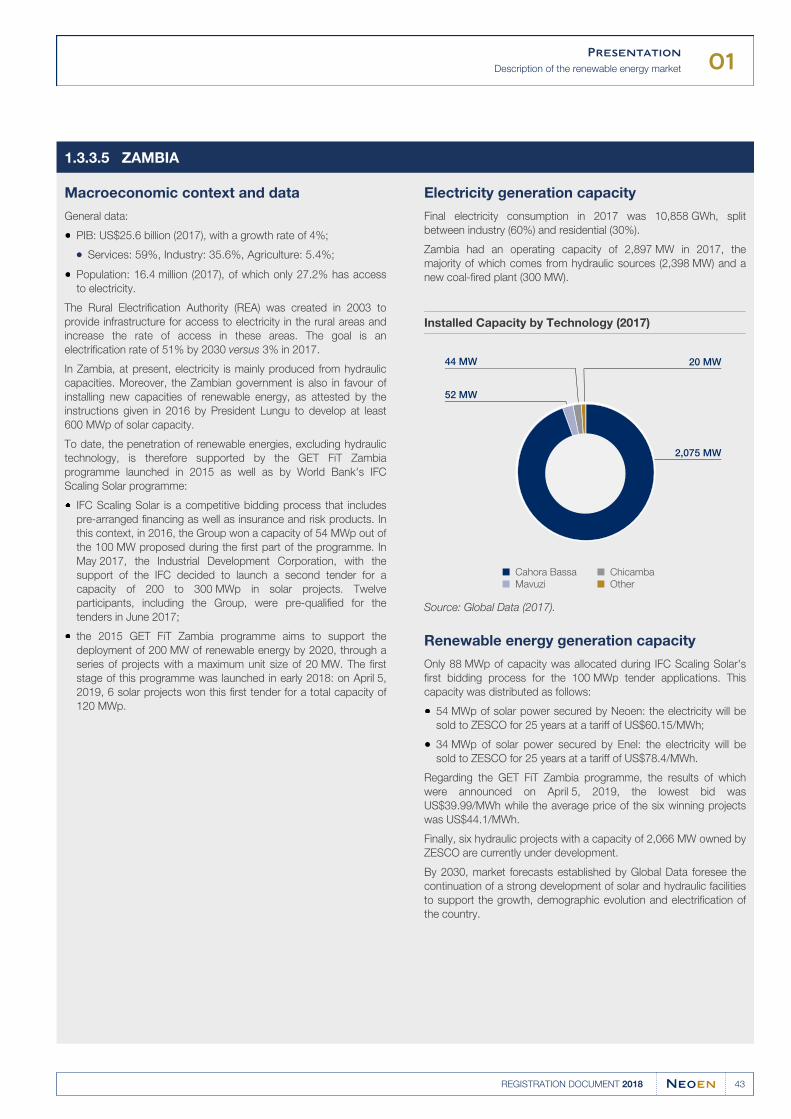
01Presentation
Description of the renewable energy market
43REGISTRATION DOCUMENT 2018
ZAMBIA1.3.3.5
Macroeconomic context and data
General data:
PIB: US$25.6 billion (2017), with a growth rate of 4%;●
Services: 59%, Industry: 35.6%, Agriculture: 5.4%;●
Population: 16.4 million (2017), of which only 27.2% has access●to electricity.
The Rural Electrification Authority (REA) was created in 2003 to
provide infrastructure for access to electricity in the rural areas and
increase the rate of access in these areas. The goal is an
electrification rate of 51% by 2030 versus 3% in 2017.
In Zambia, at present, electricity is mainly produced from hydraulic
capacities. Moreover, the Zambian government is also in favour of
installing new capacities of renewable energy, as attested by the
instructions given in 2016 by President Lungu to develop at least
600 MWp of solar capacity.
To date, the penetration of renewable energies, excluding hydraulic
technology, is therefore supported by the GET FiT Zambia
programme launched in 2015 as well as by World Bank's IFC
Scaling Solar programme:
IFC Scaling Solar is a competitive bidding process that includes
pre-arranged financing as well as insurance and risk products. In
this context, in 2016, the Group won a capacity of 54 MWp out of
the 100 MW proposed during the first part of the programme. In
May 2017, the Industrial Development Corporation, with the
support of the IFC decided to launch a second tender for a
capacity of 200 to 300 MWp in solar projects. Twelve
participants, including the Group, were pre-qualified for the
tenders in June 2017;
the 2015 GET FiT Zambia programme aims to support the●deployment of 200 MW of renewable energy by 2020, through a
series of projects with a maximum unit size of 20 MW. The first
stage of this programme was launched in early 2018: on April 5,
2019, 6 solar projects won this first tender for a total capacity of
120 MWp.
Electricity generation capacity
Final electricity consumption in 2017 was 10,858 GWh, split
between industry (60%) and residential (30%).
Zambia had an operating capacity of 2,897 MW in 2017, the
majority of which comes from hydraulic sources (2,398 MW) and a
new coal-fired plant (300 MW).
Installed Capacity by Technology (2017)
52 MW
Cahora Bassa
Mavuzi
Chicamba
Other
44 MW 20 MW
2,075 MW
Source: Global Data (2017).
Renewable energy generation capacity
Only 88 MWp of capacity was allocated during IFC Scaling Solar's
first bidding process for the 100 MWp tender applications. This
capacity was distributed as follows:
54 MWp of solar power secured by Neoen: the electricity will be●sold to ZESCO for 25 years at a tariff of US$60.15/MWh;
34 MWp of solar power secured by Enel: the electricity will be●sold to ZESCO for 25 years at a tariff of US$78.4/MWh.
Regarding the GET FiT Zambia programme, the results of which
were announced on April 5, 2019, the lowest bid was
US$39.99/MWh while the average price of the six winning projects
was US$44.1/MWh.
Finally, six hydraulic projects with a capacity of 2,066 MW owned by
ZESCO are currently under development.
By 2030, market forecasts established by Global Data foresee the
continuation of a strong development of solar and hydraulic facilities
to support the growth, demographic evolution and electrification of
the country.
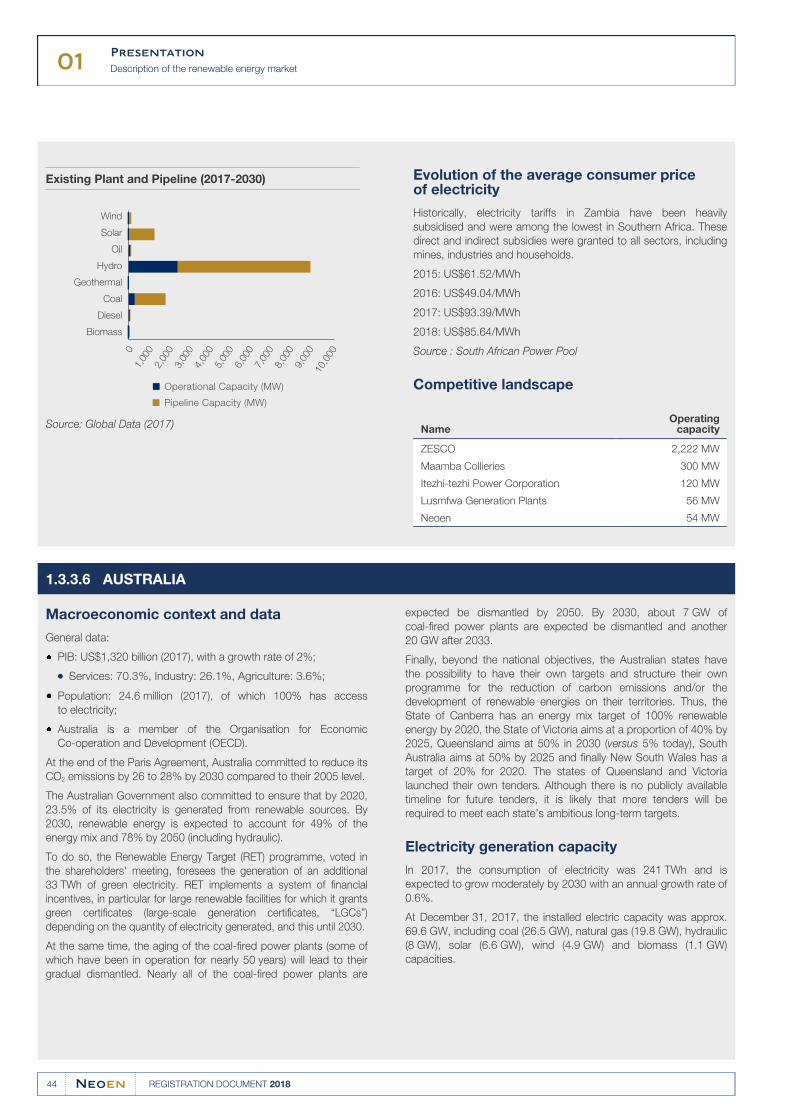
01Presentation
Description of the renewable energy market
44 REGISTRATION DOCUMENT 2018
Existing Plant and Pipeline (2017-2030)
Wind
Solar
Oil
Hydro
Geothermal
Coal
Diesel
Biomass
0
2,00
0
1,00
0
3,00
04,
000
5,00
06,
000
7,00
08,
000
9,00
010
,000
Operational Capacity (MW)
Pipeline Capacity (MW)
Source: Global Data (2017)
Evolution of the average consumer price of electricity
Historically, electricity tariffs in Zambia have been heavily
subsidised and were among the lowest in Southern Africa. These
direct and indirect subsidies were granted to all sectors, including
mines, industries and households.
2015: US$61.52/MWh
2016: US$49.04/MWh
2017: US$93.39/MWh
2018: US$85.64/MWh
Source : South African Power Pool
Competitive landscape
NameOperating
capacity
ZESCO 2,222 MW
Maamba Collieries 300 MW
Itezhi-tezhi Power Corporation 120 MW
Lusmfwa Generation Plants 56 MW
Neoen 54 MW
AUSTRALIA1.3.3.6
Macroeconomic context and data
General data:
PIB: US$1,320 billion (2017), with a growth rate of 2%;
Services: 70.3%, Industry: 26.1%, Agriculture: 3.6%;●
Population: 24.6 million (2017), of which 100% has access●to electricity;
Australia is a member of the Organisation for Economic
Co-operation and Development (OECD).
At the end of the Paris Agreement, Australia committed to reduce its
CO2 emissions by 26 to 28% by 2030 compared to their 2005 level.
The Australian Government also committed to ensure that by 2020,
23.5% of its electricity is generated from renewable sources. By
2030, renewable energy is expected to account for 49% of the
energy mix and 78% by 2050 (including hydraulic).
To do so, the Renewable Energy Target (RET) programme, voted in
the shareholders' meeting, foresees the generation of an additional
33 TWh of green electricity. RET implements a system of financial
incentives, in particular for large renewable facilities for which it grants
green certificates (large-scale generation certificates, “LGCs”)
depending on the quantity of electricity generated, and this until 2030.
expected be dismantled by 2050. By 2030, about 7 GW of
coal-fired power plants are expected be dismantled and another
20 GW after 2033.
At the same time, the aging of the coal-fired power plants (some of
which have been in operation for nearly 50 years) will lead to their
gradual dismantled. Nearly all of the coal-fired power plants are
Finally, beyond the national objectives, the Australian states have
the possibility to have their own targets and structure their own
programme for the reduction of carbon emissions and/or the
development of renewable energies on their territories. Thus, the
State of Canberra has an energy mix target of 100% renewable
energy by 2020, the State of Victoria aims at a proportion of 40% by
2025, Queensland aims at 50% in 2030 (versus 5% today), South
Australia aims at 50% by 2025 and finally New South Wales has a
target of 20% for 2020. The states of Queensland and Victoria
launched their own tenders. Although there is no publicly available
timeline for future tenders, it is likely that more tenders will be
required to meet each state’s ambitious long-term targets.
Electricity generation capacity
In 2017, the consumption of electricity was 241 TWh and is
expected to grow moderately by 2030 with an annual growth rate of
0.6%.
At December 31, 2017, the installed electric capacity was approx.
69.6 GW, including coal (26.5 GW), natural gas (19.8 GW), hydraulic
(8 GW), solar (6.6 GW), wind (4.9 GW) and biomass (1.1 GW)
capacities.
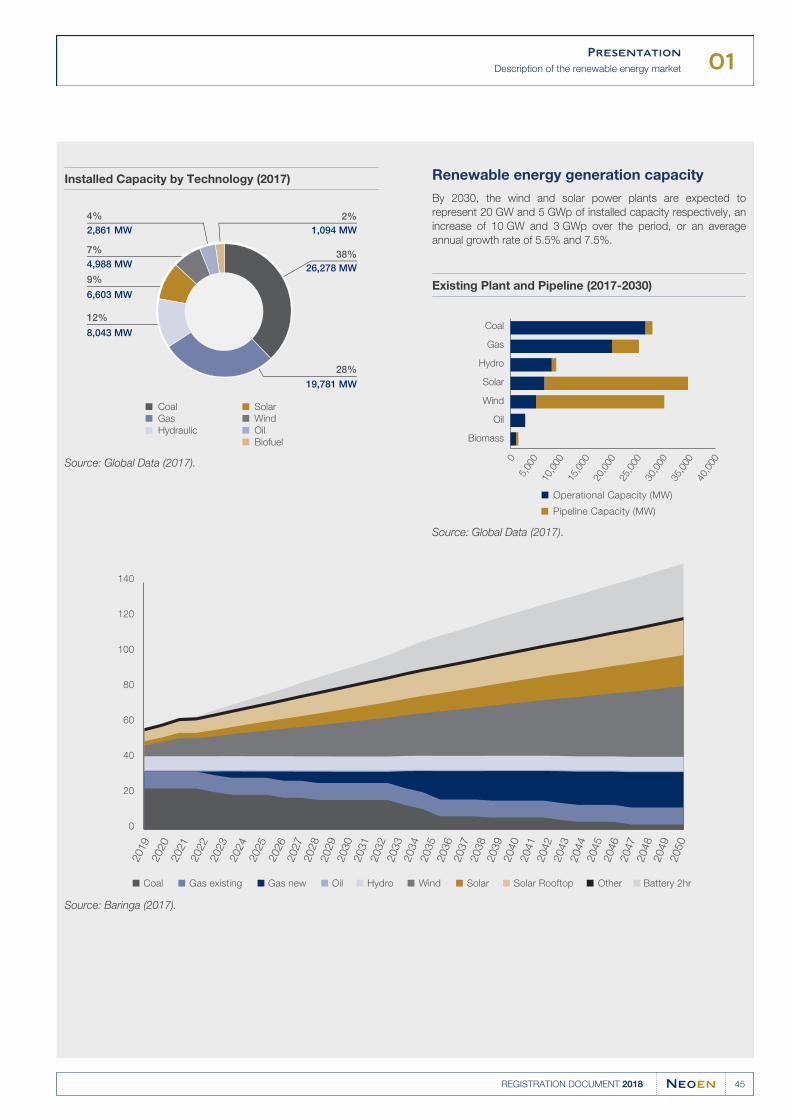
01Presentation
Description of the renewable energy market
45REGISTRATION DOCUMENT 2018
Installed Capacity by Technology (2017)
9%
2%1,094 MW2,861 MW
6,603 MW
12%
8,043 MW
19,781 MW
4%
4,988 MW7%
28%
26,278 MW38%
Coal
Gas
Hydraulic
Solar
Wind
Oil
Biofuel
Source: Global Data (2017).
Renewable energy generation capacity
By 2030, the wind and solar power plants are expected to
represent 20 GW and 5 GWp of installed capacity respectively, an
increase of 10 GW and 3 GWp over the period, or an average
annual growth rate of 5.5% and 7.5%.
Existing Plant and Pipeline (2017-2030)
Coal
Gas
Hydro
Solar
Wind
Oil
Biomass
0
10,0
00
5,00
0
15,0
0020
,000
25,0
0030
,000
35,0
0040
,000
Operational Capacity (MW)
Pipeline Capacity (MW)
Source: Global Data (2017).
Coal
2019
2020
2021
2022
2023
2024
2025
2026
0
20
40
60
80
100
120
140
Gas existing Gas new Oil Hydro Wind Solar Solar Rooftop Other Battery 2hr
2027
2028
2029
2030
2031
2032
2033
2034
2035
2036
2037
2038
2039
2040
2041
2042
2043
2044
2045
2046
2047
2048
2049
2050
Source: Baringa (2017).
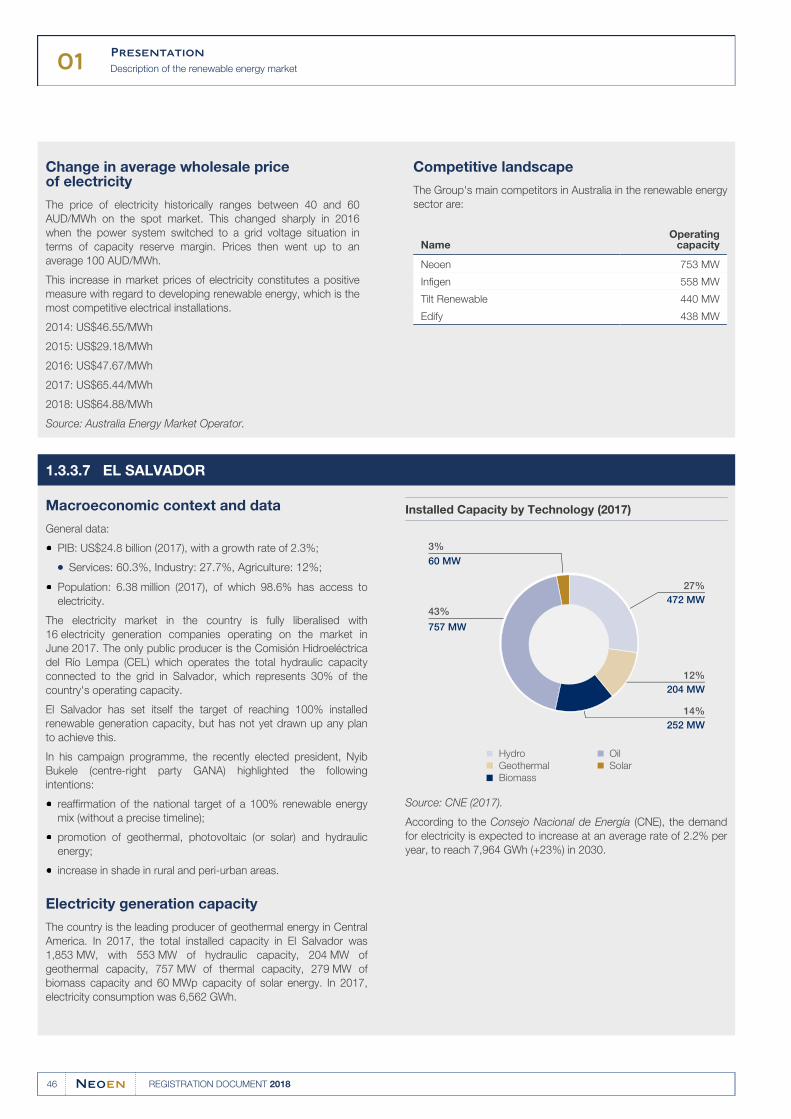
01Presentation
Description of the renewable energy market
46 REGISTRATION DOCUMENT 2018
Change in average wholesale price of electricity
The price of electricity historically ranges between 40 and 60
AUD/MWh on the spot market. This changed sharply in 2016
when the power system switched to a grid voltage situation in
terms of capacity reserve margin. Prices then went up to an
average 100 AUD/MWh.
This increase in market prices of electricity constitutes a positive
measure with regard to developing renewable energy, which is the
most competitive electrical installations.
2014: US$46.55/MWh
2015: US$29.18/MWh
2016: US$47.67/MWh
2017: US$65.44/MWh
2018: US$64.88/MWh
Source: Australia Energy Market Operator.
Competitive landscape
The Group's main competitors in Australia in the renewable energy
sector are:
NameOperating
capacity
Neoen 753 MW
Infigen 558 MW
Tilt Renewable 440 MW
Edify 438 MW
EL SALVADOR1.3.3.7
Macroeconomic context and data
General data:
PIB: US$24.8 billion (2017), with a growth rate of 2.3%;●
Services: 60.3%, Industry: 27.7%, Agriculture: 12%;●
Population: 6.38 million (2017), of which 98.6% has access to●electricity.
The electricity market in the country is fully liberalised with
16 electricity generation companies operating on the market in
June 2017. The only public producer is the Comisión Hidroeléctrica
del Río Lempa (CEL) which operates the total hydraulic capacity
connected to the grid in Salvador, which represents 30% of the
country's operating capacity.
El Salvador has set itself the target of reaching 100% installed
renewable generation capacity, but has not yet drawn up any plan
to achieve this.
In his campaign programme, the recently elected president, Nyib
Bukele (centre-right party GANA) highlighted the following
intentions:
reaffirmation of the national target of a 100% renewable energy●mix (without a precise timeline);
promotion of geothermal, photovoltaic (or solar) and hydraulic●energy;
increase in shade in rural and peri-urban areas.●
Electricity generation capacity
The country is the leading producer of geothermal energy in Central
America. In 2017, the total installed capacity in El Salvador was
1,853 MW, with 553 MW of hydraulic capacity, 204 MW of
geothermal capacity, 757 MW of thermal capacity, 279 MW of
biomass capacity and 60 MWp capacity of solar energy. In 2017,
electricity consumption was 6,562 GWh.
Installed Capacity by Technology (2017)
Hydro
Geothermal
Biomass
Oil
Solar
252 MW14%
43%
60 MW
757 MW
3%
472 MW27%
204 MW12%
Source: CNE (2017).
According to the Consejo Nacional de Energía (CNE), the demand
for electricity is expected to increase at an average rate of 2.2% per
year, to reach 7,964 GWh (+23%) in 2030.
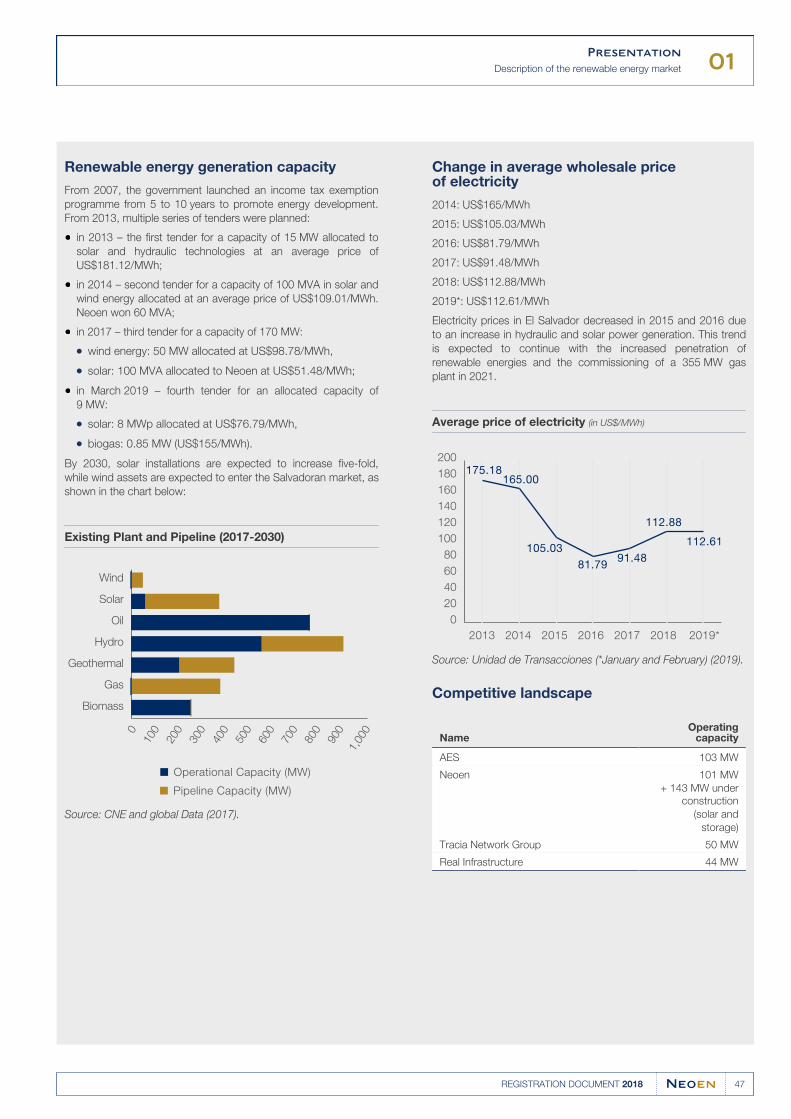
01Presentation
Description of the renewable energy market
47REGISTRATION DOCUMENT 2018
Renewable energy generation capacity
From 2007, the government launched an income tax exemption
programme from 5 to 10 years to promote energy development.
From 2013, multiple series of tenders were planned:
in 2013 – the first tender for a capacity of 15 MW allocated to●solar and hydraulic technologies at an average price of
US$181.12/MWh;
in 2014 – second tender for a capacity of 100 MVA in solar and●wind energy allocated at an average price of US$109.01/MWh.
Neoen won 60 MVA;
in 2017 – third tender for a capacity of 170 MW:●
wind energy: 50 MW allocated at US$98.78/MWh,●
solar: 100 MVA allocated to Neoen at US$51.48/MWh;●
in March 2019 – fourth tender for an allocated capacity of●9 MW:
solar: 8 MWp allocated at US$76.79/MWh,●
biogas: 0.85 MW (US$155/MWh).●
By 2030, solar installations are expected to increase five-fold,
while wind assets are expected to enter the Salvadoran market, as
shown in the chart below:
Existing Plant and Pipeline (2017-2030)
Wind
Solar
Oil
Hydro
Geothermal
Gas
Biomass
0
200
100
300
400
500
600
700
800
900
1,00
0
Operational Capacity (MW)
Pipeline Capacity (MW)
Source: CNE and global Data (2017).
Change in average wholesale price of electricity
2014: US$165/MWh
2015: US$105.03/MWh
2016: US$81.79/MWh
2017: US$91.48/MWh
2018: US$112.88/MWh
2019*: US$112.61/MWh
Electricity prices in El Salvador decreased in 2015 and 2016 due
to an increase in hydraulic and solar power generation. This trend
is expected to continue with the increased penetration of
renewable energies and the commissioning of a 355 MW gas
plant in 2021.
Average price of electricity (in US$/MWh)
0
20
40
60
80
100
120
140
160
180
200
2013 2014 2015 2016 2017 2018 2019*
165.00
105.03 81.79 91.48
112.88
112.61
175.18
Source: Unidad de Transacciones (*January and February) (2019).
Competitive landscape
NameOperating
capacity
AES 103 MW
Neoen 101 MW
+ 143 MW under
construction
(solar and
storage)
Tracia Network Group 50 MW
Real Infrastructure 44 MW
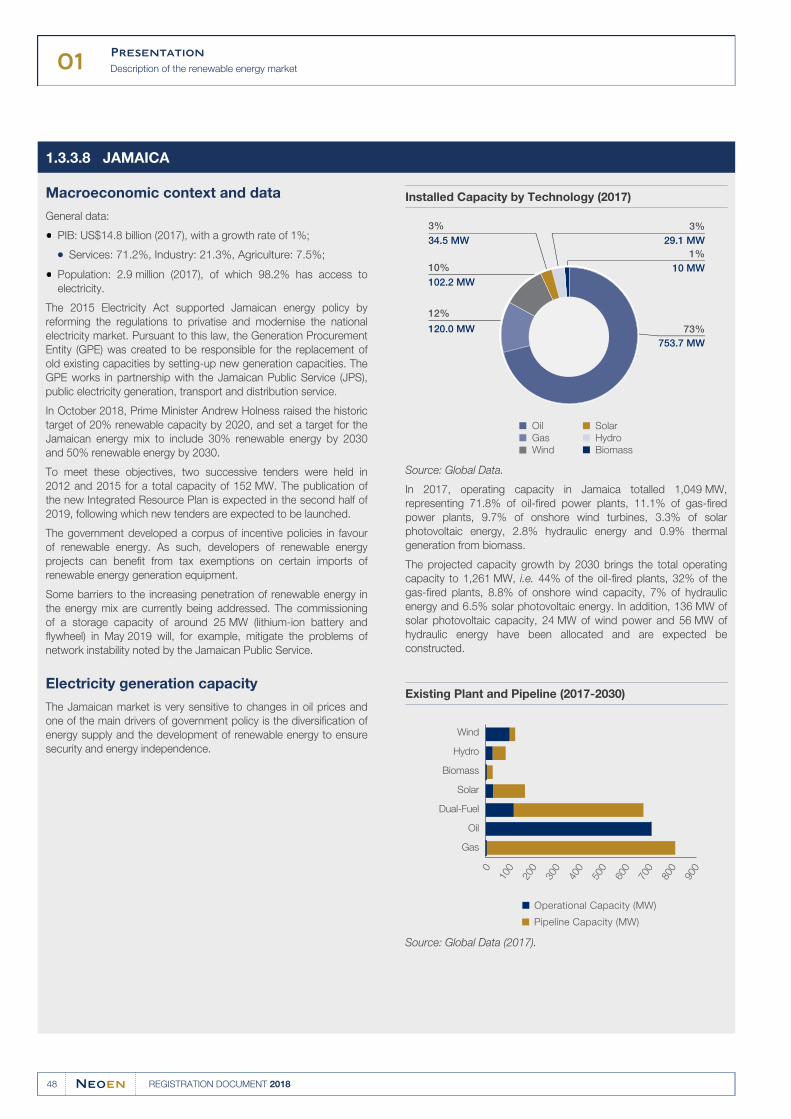
01Presentation
Description of the renewable energy market
48 REGISTRATION DOCUMENT 2018
JAMAICA1.3.3.8
Macroeconomic context and data
General data:
PIB: US$14.8 billion (2017), with a growth rate of 1%;●
Services: 71.2%, Industry: 21.3%, Agriculture: 7.5%;●
Population: 2.9 million (2017), of which 98.2% has access to●electricity.
The 2015 Electricity Act supported Jamaican energy policy by
reforming the regulations to privatise and modernise the national
electricity market. Pursuant to this law, the Generation Procurement
Entity (GPE) was created to be responsible for the replacement of
old existing capacities by setting-up new generation capacities. The
GPE works in partnership with the Jamaican Public Service (JPS),
public electricity generation, transport and distribution service.
In October 2018, Prime Minister Andrew Holness raised the historic
target of 20% renewable capacity by 2020, and set a target for the
Jamaican energy mix to include 30% renewable energy by 2030
and 50% renewable energy by 2030.
To meet these objectives, two successive tenders were held in
2012 and 2015 for a total capacity of 152 MW. The publication of
the new Integrated Resource Plan is expected in the second half of
2019, following which new tenders are expected to be launched.
The government developed a corpus of incentive policies in favour
of renewable energy. As such, developers of renewable energy
projects can benefit from tax exemptions on certain imports of
renewable energy generation equipment.
Some barriers to the increasing penetration of renewable energy in
the energy mix are currently being addressed. The commissioning
of a storage capacity of around 25 MW (lithium-ion battery and
flywheel) in May 2019 will, for example, mitigate the problems of
network instability noted by the Jamaican Public Service.
Electricity generation capacity
The Jamaican market is very sensitive to changes in oil prices and
one of the main drivers of government policy is the diversification of
energy supply and the development of renewable energy to ensure
security and energy independence.
Installed Capacity by Technology (2017)
12%
3%29.1 MW34.5 MW
120.0 MW
3%
102.2 MW10%
753.7 MW73%
Oil
Gas
Wind
Solar
Hydro
Biomass
1%10 MW
Source: Global Data.
In 2017, operating capacity in Jamaica totalled 1,049 MW,
representing 71.8% of oil-fired power plants, 11.1% of gas-fired
power plants, 9.7% of onshore wind turbines, 3.3% of solar
photovoltaic energy, 2.8% hydraulic energy and 0.9% thermal
generation from biomass.
The projected capacity growth by 2030 brings the total operating
capacity to 1,261 MW, i.e. 44% of the oil-fired plants, 32% of the
gas-fired plants, 8.8% of onshore wind capacity, 7% of hydraulic
energy and 6.5% solar photovoltaic energy. In addition, 136 MW of
solar photovoltaic capacity, 24 MW of wind power and 56 MW of
hydraulic energy have been allocated and are expected be
constructed.
Existing Plant and Pipeline (2017-2030)
Wind
Hydro
Biomass
Solar
Dual-Fuel
Oil
Gas
0
200
100
300
400
500
600
700
900
800
Operational Capacity (MW)
Pipeline Capacity (MW)
Source: Global Data (2017).
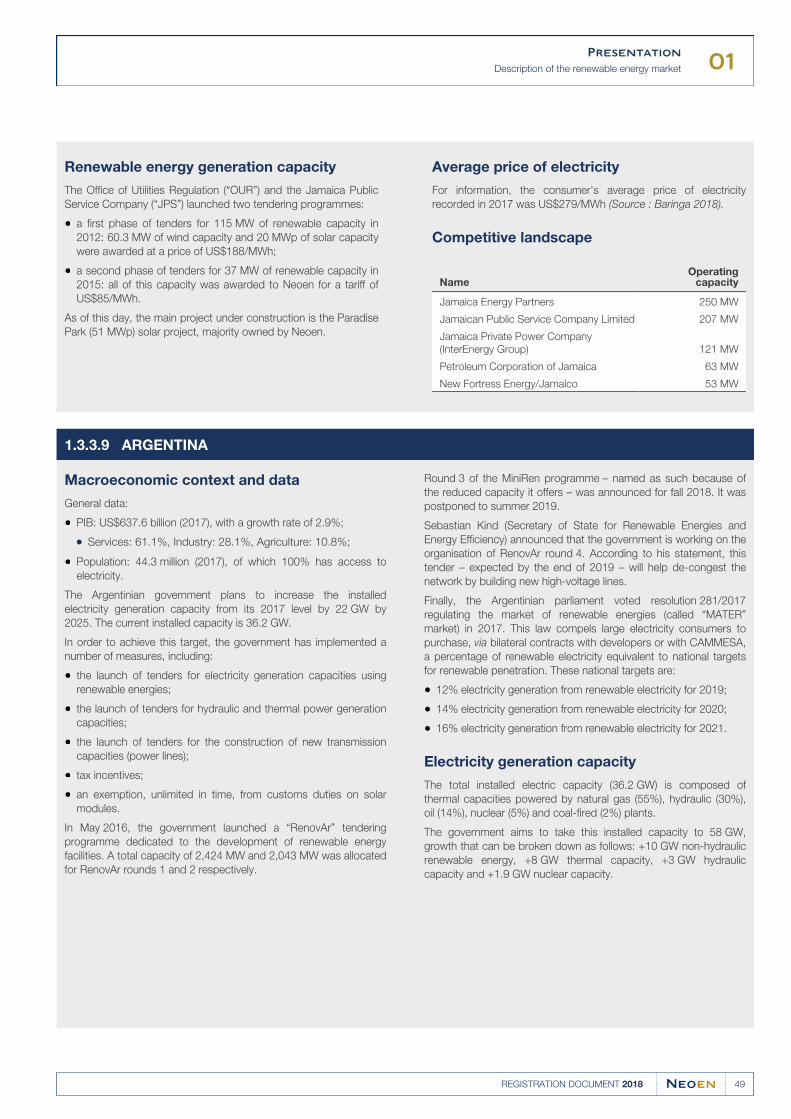
01Presentation
Description of the renewable energy market
49REGISTRATION DOCUMENT 2018
Renewable energy generation capacity
The Office of Utilities Regulation (“OUR”) and the Jamaica Public
Service Company (“JPS”) launched two tendering programmes:
a first phase of tenders for 115 MW of renewable capacity in●2012: 60.3 MW of wind capacity and 20 MWp of solar capacity
were awarded at a price of US$188/MWh;
a second phase of tenders for 37 MW of renewable capacity in●2015: all of this capacity was awarded to Neoen for a tariff of
US$85/MWh.
As of this day, the main project under construction is the Paradise
Park (51 MWp) solar project, majority owned by Neoen.
Average price of electricity
For information, the consumer's average price of electricity
recorded in 2017 was US$279/MWh (Source : Baringa 2018).
Competitive landscape
NameOperating
capacity
Jamaica Energy Partners 250 MW
Jamaican Public Service Company Limited 207 MW
Jamaica Private Power Company
(InterEnergy Group) 121 MW
Petroleum Corporation of Jamaica 63 MW
New Fortress Energy/Jamalco 53 MW
ARGENTINA1.3.3.9
Macroeconomic context and data
General data:
PIB: US$637.6 billion (2017), with a growth rate of 2.9%;●
Services: 61.1%, Industry: 28.1%, Agriculture: 10.8%;●
Population: 44.3 million (2017), of which 100% has access to●electricity.
The Argentinian government plans to increase the installed
electricity generation capacity from its 2017 level by 22 GW by
2025. The current installed capacity is 36.2 GW.
In order to achieve this target, the government has implemented a
number of measures, including:
the launch of tenders for electricity generation capacities using●renewable energies;
the launch of tenders for hydraulic and thermal power generation●capacities;
the launch of tenders for the construction of new transmission●capacities (power lines);
tax incentives;●
an exemption, unlimited in time, from customs duties on solar●modules.
In May 2016, the government launched a “RenovAr” tendering
programme dedicated to the development of renewable energy
facilities. A total capacity of 2,424 MW and 2,043 MW was allocated
for RenovAr rounds 1 and 2 respectively.
Round 3 of the MiniRen programme – named as such because of
the reduced capacity it offers – was announced for fall 2018. It was
postponed to summer 2019.
Sebastian Kind (Secretary of State for Renewable Energies and
Energy Efficiency) announced that the government is working on the
organisation of RenovAr round 4. According to his statement, this
tender – expected by the end of 2019 – will help de-congest the
network by building new high-voltage lines.
Finally, the Argentinian parliament voted resolution 281/2017
regulating the market of renewable energies (called “MATER”
market) in 2017. This law compels large electricity consumers to
purchase, via bilateral contracts with developers or with CAMMESA,
a percentage of renewable electricity equivalent to national targets
for renewable penetration. These national targets are:
12% electricity generation from renewable electricity for 2019;●
14% electricity generation from renewable electricity for 2020;●
16% electricity generation from renewable electricity for 2021.●
Electricity generation capacity
The total installed electric capacity (36.2 GW) is composed of
thermal capacities powered by natural gas (55%), hydraulic (30%),
oil (14%), nuclear (5%) and coal-fired (2%) plants.
The government aims to take this installed capacity to 58 GW,
growth that can be broken down as follows: +10 GW non-hydraulic
renewable energy, +8 GW thermal capacity, +3 GW hydraulic
capacity and +1.9 GW nuclear capacity.
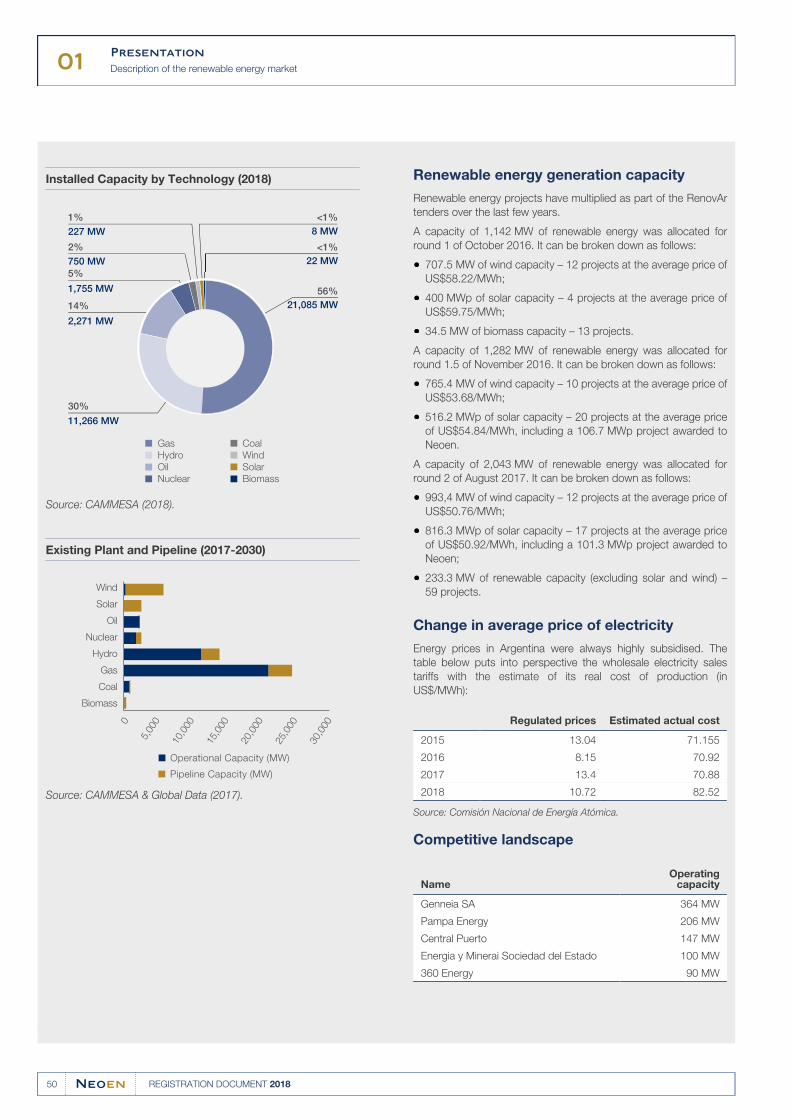
01Presentation
Description of the renewable energy market
50 REGISTRATION DOCUMENT 2018
Installed Capacity by Technology (2018)
5%
<1%8 MW227 MW
1,755 MW
14%
2,271 MW
11,266 MW
1%
750 MW2%
30%
21,085 MW56%
Gas
Hydro
Oil
Nuclear
Coal
Wind
Solar
Biomass
22 MW<1%
Source: CAMMESA (2018).
Existing Plant and Pipeline (2017-2030)
Wind
Solar
Oil
Nuclear
Hydro
Gas
Coal
Biomass
0
10,0
00
5,00
0
15,0
00
20,0
00
25,0
00
30,0
00
Operational Capacity (MW)
Pipeline Capacity (MW)
Source: CAMMESA & Global Data (2017).
Renewable energy generation capacity
Renewable energy projects have multiplied as part of the RenovAr
tenders over the last few years.
A capacity of 1,142 MW of renewable energy was allocated for
round 1 of October 2016. It can be broken down as follows:
707.5 MW of wind capacity – 12 projects at the average price of●US$58.22/MWh;
400 MWp of solar capacity – 4 projects at the average price of●US$59.75/MWh;
34.5 MW of biomass capacity – 13 projects.●
A capacity of 1,282 MW of renewable energy was allocated for
round 1.5 of November 2016. It can be broken down as follows:
765.4 MW of wind capacity – 10 projects at the average price of●US$53.68/MWh;
516.2 MWp of solar capacity – 20 projects at the average price●of US$54.84/MWh, including a 106.7 MWp project awarded to
Neoen.
A capacity of 2,043 MW of renewable energy was allocated for
round 2 of August 2017. It can be broken down as follows:
993,4 MW of wind capacity – 12 projects at the average price of●US$50.76/MWh;
816.3 MWp of solar capacity – 17 projects at the average price●of US$50.92/MWh, including a 101.3 MWp project awarded to
Neoen;
233.3 MW of renewable capacity (excluding solar and wind) –●59 projects.
Change in average price of electricity
Energy prices in Argentina were always highly subsidised. The
table below puts into perspective the wholesale electricity sales
tariffs with the estimate of its real cost of production (in
US$/MWh):
Regulated prices Estimated actual cost
2015 13.04 71.155
2016 8.15 70.92
2017 13.4 70.88
2018 10.72 82.52
Source: Comisión Nacional de Energía Atómica.
Competitive landscape
NameOperating
capacity
Genneia SA 364 MW
Pampa Energy 206 MW
Central Puerto 147 MW
Energia y Minerai Sociedad del Estado 100 MW
360 Energy 90 MW
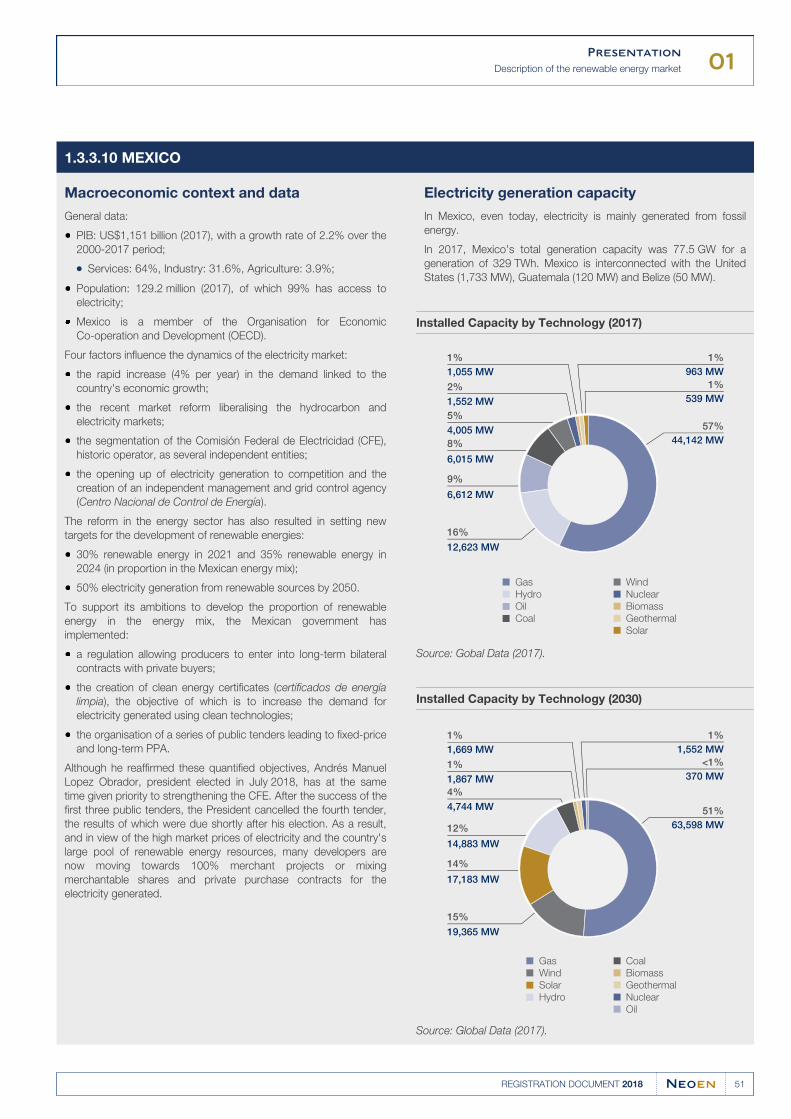
01Presentation
Description of the renewable energy market
51REGISTRATION DOCUMENT 2018
MEXICO1.3.3.10
Macroeconomic context and data
General data:
PIB: US$1,151 billion (2017), with a growth rate of 2.2% over the●2000-2017 period;
Services: 64%, Industry: 31.6%, Agriculture: 3.9%;●
Population: 129.2 million (2017), of which 99% has access to●electricity;
Mexico is a member of the Organisation for Economic
Co-operation and Development (OECD).
Four factors influence the dynamics of the electricity market:
the rapid increase (4% per year) in the demand linked to the●country's economic growth;
the recent market reform liberalising the hydrocarbon and●electricity markets;
the segmentation of the Comisión Federal de Electricidad (CFE),●historic operator, as several independent entities;
the opening up of electricity generation to competition and the●creation of an independent management and grid control agency
(Centro Nacional de Control de Energía).
The reform in the energy sector has also resulted in setting new
targets for the development of renewable energies:
30% renewable energy in 2021 and 35% renewable energy in●2024 (in proportion in the Mexican energy mix);
50% electricity generation from renewable sources by 2050.●
To support its ambitions to develop the proportion of renewable
energy in the energy mix, the Mexican government has
implemented:
a regulation allowing producers to enter into long-term bilateral●contracts with private buyers;
the creation of clean energy certificates (certificados de energía●limpia), the objective of which is to increase the demand for
electricity generated using clean technologies;
the organisation of a series of public tenders leading to fixed-price●and long-term PPA.
Although he reaffirmed these quantified objectives, Andrés Manuel
Lopez Obrador, president elected in July 2018, has at the same
time given priority to strengthening the CFE. After the success of the
first three public tenders, the President cancelled the fourth tender,
the results of which were due shortly after his election. As a result,
and in view of the high market prices of electricity and the country's
large pool of renewable energy resources, many developers are
now moving towards 100% merchant projects or mixing
merchantable shares and private purchase contracts for the
electricity generated.
Electricity generation capacity
In Mexico, even today, electricity is mainly generated from fossil
energy.
In 2017, Mexico's total generation capacity was 77.5 GW for a
generation of 329 TWh. Mexico is interconnected with the United
States (1,733 MW), Guatemala (120 MW) and Belize (50 MW).
Installed Capacity by Technology (2017)
8%
1%1,055 MW
1,552 MW
6,015 MW
9%
6,612 MW
12,623 MW
2%
4,005 MW5%
16%
44,142 MW57%
963 MW1%
539 MW1%
Gas
Hydro
Oil
Coal
Wind
Nuclear
Biomass
Geothermal
Solar
Source: Gobal Data (2017).
Installed Capacity by Technology (2030)
12%
1%1,669 MW
1,867 MW
14,883 MW
14%
17,183 MW
19,365 MW
1%
4,744 MW4%
15%
63,598 MW51%
1,552 MW1%
370 MW<1%
Gas
Wind
Solar
Hydro
Coal
Biomass
Geothermal
Nuclear
Oil
Source: Global Data (2017).
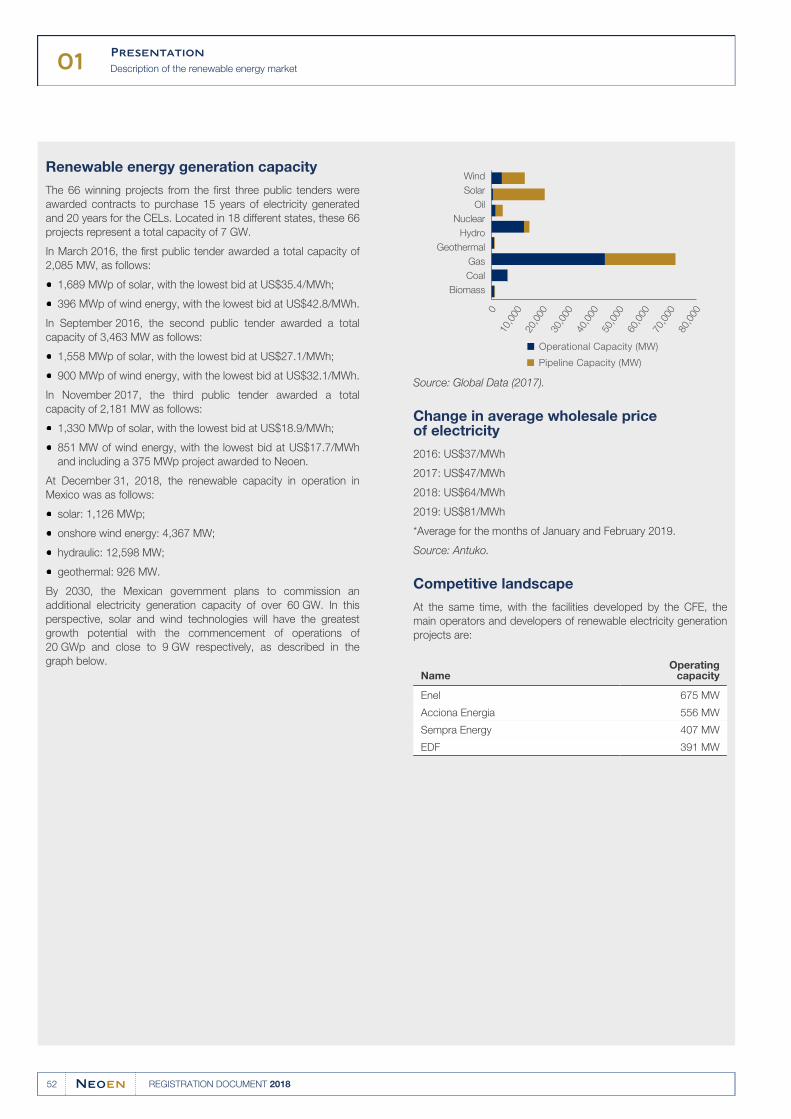
01Presentation
Description of the renewable energy market
52 REGISTRATION DOCUMENT 2018
Renewable energy generation capacity
The 66 winning projects from the first three public tenders were
awarded contracts to purchase 15 years of electricity generated
and 20 years for the CELs. Located in 18 different states, these 66
projects represent a total capacity of 7 GW.
In March 2016, the first public tender awarded a total capacity of
2,085 MW, as follows:
1,689 MWp of solar, with the lowest bid at US$35.4/MWh;●
396 MWp of wind energy, with the lowest bid at US$42.8/MWh.●
In September 2016, the second public tender awarded a total
capacity of 3,463 MW as follows:
1,558 MWp of solar, with the lowest bid at US$27.1/MWh;●
900 MWp of wind energy, with the lowest bid at US$32.1/MWh.●
In November 2017, the third public tender awarded a total
capacity of 2,181 MW as follows:
1,330 MWp of solar, with the lowest bid at US$18.9/MWh;●
851 MW of wind energy, with the lowest bid at US$17.7/MWh●and including a 375 MWp project awarded to Neoen.
At December 31, 2018, the renewable capacity in operation in
Mexico was as follows:
solar: 1,126 MWp;●
onshore wind energy: 4,367 MW;●
hydraulic: 12,598 MW;●
geothermal: 926 MW.●
By 2030, the Mexican government plans to commission an
additional electricity generation capacity of over 60 GW. In this
perspective, solar and wind technologies will have the greatest
growth potential with the commencement of operations of
20 GWp and close to 9 GW respectively, as described in the
graph below.
Wind
Solar
Oil
Nuclear
Hydro
Geothermal
Gas
Coal
Biomass
010
,000
40,0
0050
,000
20,0
00
60,0
0070
,000
80,0
00
30,0
00
Operational Capacity (MW)
Pipeline Capacity (MW)
Source: Global Data (2017).
Change in average wholesale price of electricity
2016: US$37/MWh
2017: US$47/MWh
2018: US$64/MWh
2019: US$81/MWh
*Average for the months of January and February 2019.
Source: Antuko.
Competitive landscape
At the same time, with the facilities developed by the CFE, the
main operators and developers of renewable electricity generation
projects are:
NameOperating
capacity
Enel 675 MW
Acciona Energia 556 MW
Sempra Energy 407 MW
EDF 391 MW
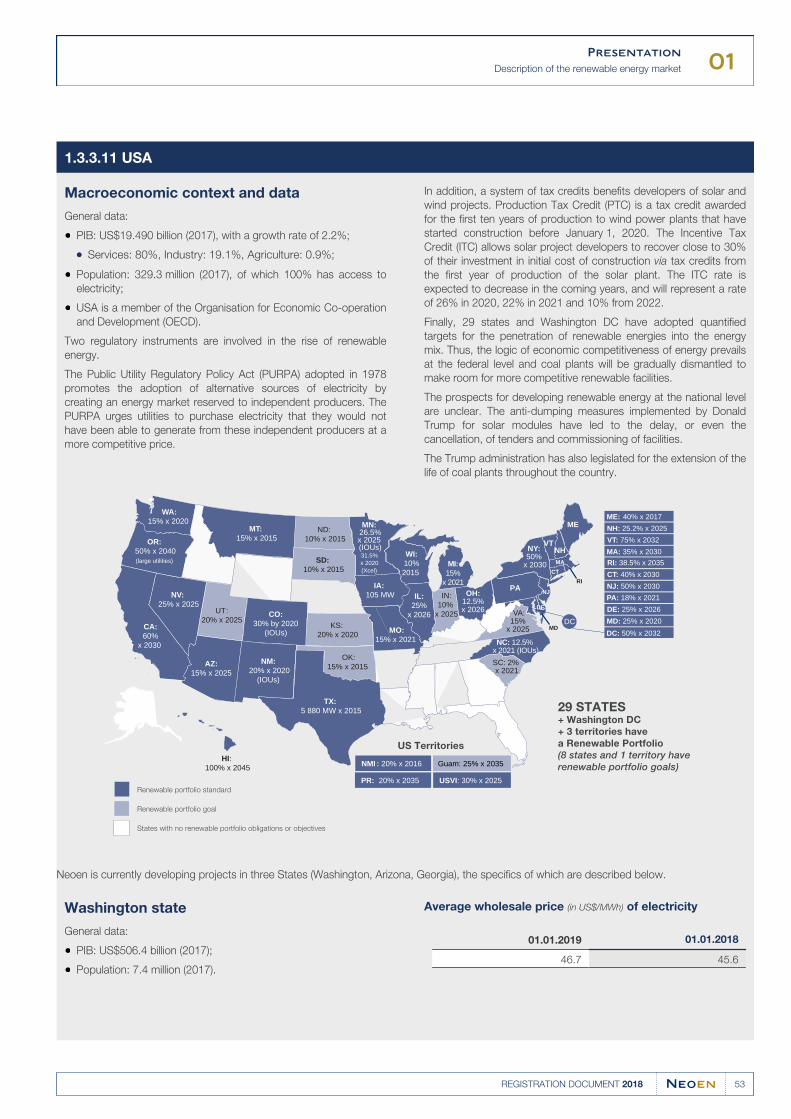
01Presentation
Description of the renewable energy market
53REGISTRATION DOCUMENT 2018
USA1.3.3.11
Macroeconomic context and data
General data:
PIB: US$19.490 billion (2017), with a growth rate of 2.2%;●
Services: 80%, Industry: 19.1%, Agriculture: 0.9%;●
Population: 329.3 million (2017), of which 100% has access to●electricity;
USA is a member of the Organisation for Economic Co-operation●and Development (OECD).
Two regulatory instruments are involved in the rise of renewable
energy.
The Public Utility Regulatory Policy Act (PURPA) adopted in 1978
promotes the adoption of alternative sources of electricity by
creating an energy market reserved to independent producers. The
PURPA urges utilities to purchase electricity that they would not
have been able to generate from these independent producers at a
more competitive price.
In addition, a system of tax credits benefits developers of solar and
wind projects. Production Tax Credit (PTC) is a tax credit awarded
for the first ten years of production to wind power plants that have
started construction before January 1, 2020. The Incentive Tax
Credit (ITC) allows solar project developers to recover close to 30%
of their investment in initial cost of construction via tax credits from
the first year of production of the solar plant. The ITC rate is
expected to decrease in the coming years, and will represent a rate
of 26% in 2020, 22% in 2021 and 10% from 2022.
Finally, 29 states and Washington DC have adopted quantified
targets for the penetration of renewable energies into the energy
mix. Thus, the logic of economic competitiveness of energy prevails
at the federal level and coal plants will be gradually dismantled to
make room for more competitive renewable facilities.
The prospects for developing renewable energy at the national level
are unclear. The anti-dumping measures implemented by Donald
Trump for solar modules have led to the delay, or even the
cancellation, of tenders and commissioning of facilities.
The Trump administration has also legislated for the extension of the
life of coal plants throughout the country.
WA: 15% x 2020
OR: 50% x 2040(large utilities)
CA: 60%
x 2030
MT: 15% x 2015
NV: 25% x 2025
UT : 20% x 2025
AZ: 15% x 2025
ND: 10% x 2015
NM: 20% x 2020
(IOUs)
HI: 100% x 2045
CO: 30% by 2020
(IOUs)
OK:15% x 2015
WI:10%2015
MO:15% x 2021
SD: 10% x 2015
IA: 105 MW IN:
10% x 2025
IL: 25%
x 2026
OH: 12.5% x 2026
NC: 12.5% x 2021 (IOUs)
VA:
15% x 2025
DCKS: 20% x 2020
ME: 40% x 2017
TX: 5 880 MW x 2015
SC: 2% x 2021
ME
PA
VTNHMA
CT
RI
NJ
DE
MD
NY: 50%
x 2030MI: 15%
x 2021
Renewable portfolio standard
Renewable portfolio goal
States with no renewable portfolio obligations or objectives
US Territories
29 STATES + Washington DC
+ 3 territories have
a Renewable Portfolio
(8 states and 1 territory have renewable portfolio goals)NMI : 20% x 2016
PR: 20% x 2035
Guam: 25% x 2035
USVI: 30% x 2025
NH: 25.2% x 2025
VT: 75% x 2032
MA: 35% x 2030
RI: 38.5% x 2035
CT: 40% x 2030
PA: 18% x 2021
NJ: 50% x 2030
DE: 25% x 2026
MD: 25% x 2020
DC: 50% x 2032
MN: 26.5%x 2025 (IOUs)31.5% x 2020 (Xcel)
Neoen is currently developing projects in three States (Washington, Arizona, Georgia), the specifics of which are described below.
Washington state
General data:
PIB: US$506.4 billion (2017);●
Population: 7.4 million (2017).●
Average wholesale price (in US$/MWh) of electricity
01.01.2019 01.01.2018
46.7 45.6
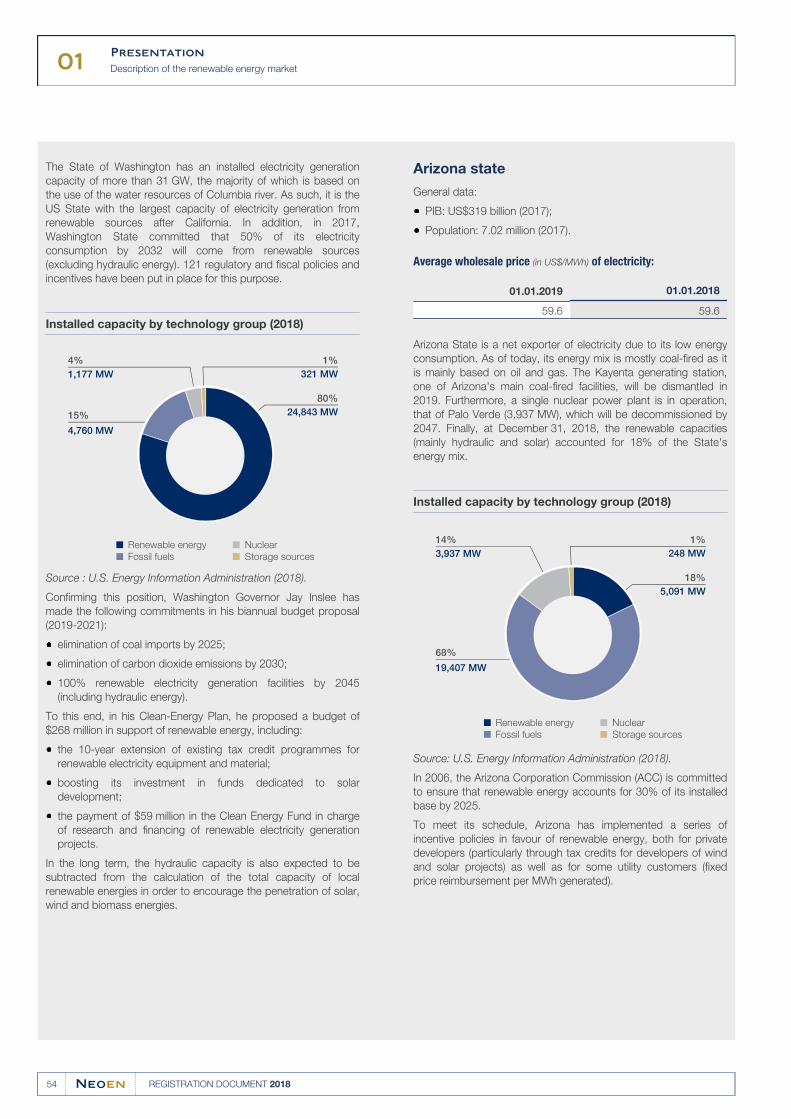
01Presentation
Description of the renewable energy market
54 REGISTRATION DOCUMENT 2018
The State of Washington has an installed electricity generation
capacity of more than 31 GW, the majority of which is based on
the use of the water resources of Columbia river. As such, it is the
US State with the largest capacity of electricity generation from
renewable sources after California. In addition, in 2017,
Washington State committed that 50% of its electricity
consumption by 2032 will come from renewable sources
(excluding hydraulic energy). 121 regulatory and fiscal policies and
incentives have been put in place for this purpose.
Installed capacity by technology group (2018)
15%
4%1,177 MW
4,760 MW
24,843 MW80%
321 MW1%
Nuclear
Storage sources
Renewable energy
Fossil fuels
Source : U.S. Energy Information Administration (2018).
Confirming this position, Washington Governor Jay Inslee has
made the following commitments in his biannual budget proposal
(2019-2021):
elimination of coal imports by 2025;
elimination of carbon dioxide emissions by 2030;●
100% renewable electricity generation facilities by 2045●(including hydraulic energy).
To this end, in his Clean-Energy Plan, he proposed a budget of
$268 million in support of renewable energy, including:
the 10-year extension of existing tax credit programmes for●renewable electricity equipment and material;
boosting its investment in funds dedicated to solar●development;
the payment of $59 million in the Clean Energy Fund in charge●of research and financing of renewable electricity generation
projects.
In the long term, the hydraulic capacity is also expected to be
subtracted from the calculation of the total capacity of local
renewable energies in order to encourage the penetration of solar,
wind and biomass energies.
Arizona state
General data:
PIB: US$319 billion (2017);●
Population: 7.02 million (2017).●
Average wholesale price (in US$/MWh) of electricity:
01.01.2019 01.01.2018
59.6 59.6
Arizona State is a net exporter of electricity due to its low energy
consumption. As of today, its energy mix is mostly coal-fired as it
is mainly based on oil and gas. The Kayenta generating station,
one of Arizona's main coal-fired facilities, will be dismantled in
2019. Furthermore, a single nuclear power plant is in operation,
that of Palo Verde (3,937 MW), which will be decommissioned by
2047. Finally, at December 31, 2018, the renewable capacities
(mainly hydraulic and solar) accounted for 18% of the State's
energy mix.
Installed capacity by technology group (2018)
68%
14%3,937 MW
19,407 MW
5,091 MW18%
248 MW1%
Nuclear
Storage sources
Renewable energy
Fossil fuels
Source: U.S. Energy Information Administration (2018).
In 2006, the Arizona Corporation Commission (ACC) is committed
to ensure that renewable energy accounts for 30% of its installed
base by 2025.
To meet its schedule, Arizona has implemented a series of
incentive policies in favour of renewable energy, both for private
developers (particularly through tax credits for developers of wind
and solar projects) as well as for some utility customers (fixed
price reimbursement per MWh generated).
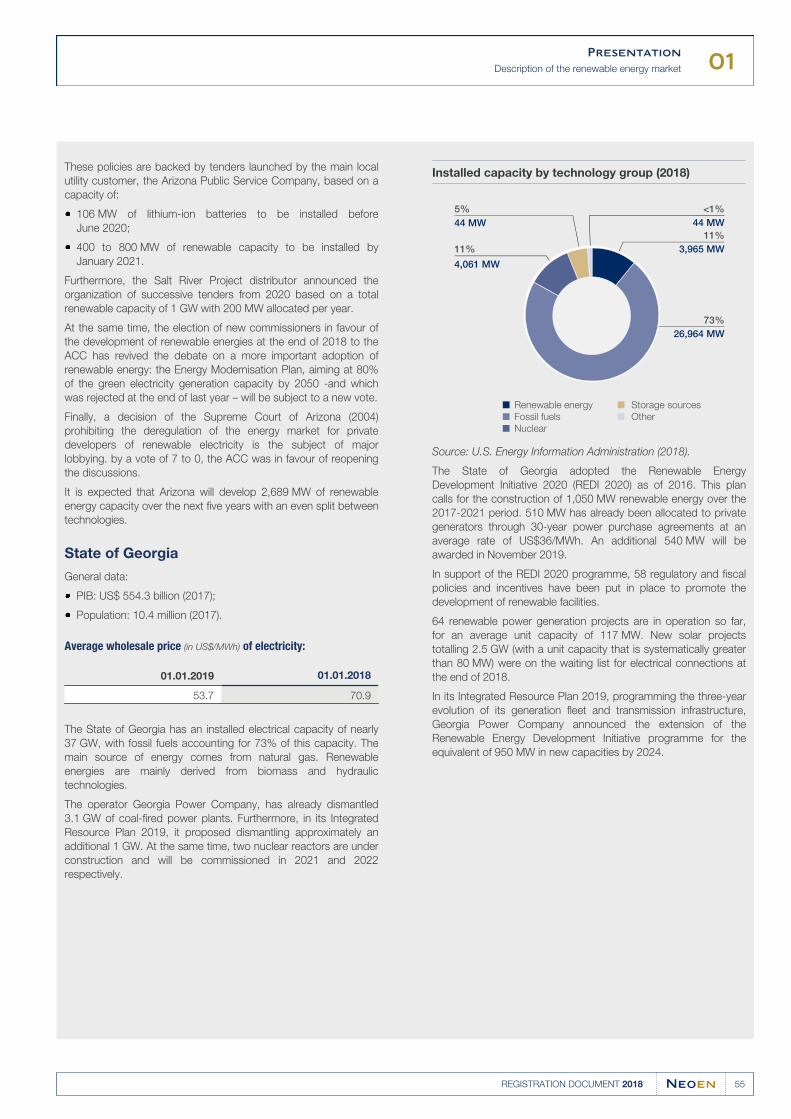
01Presentation
Description of the renewable energy market
55REGISTRATION DOCUMENT 2018
These policies are backed by tenders launched by the main local
utility customer, the Arizona Public Service Company, based on a
capacity of:
106 MW of lithium-ion batteries to be installed before●June 2020;
400 to 800 MW of renewable capacity to be installed by●January 2021.
Furthermore, the Salt River Project distributor announced the
organization of successive tenders from 2020 based on a total
renewable capacity of 1 GW with 200 MW allocated per year.
At the same time, the election of new commissioners in favour of
the development of renewable energies at the end of 2018 to the
ACC has revived the debate on a more important adoption of
renewable energy: the Energy Modernisation Plan, aiming at 80%
of the green electricity generation capacity by 2050 -and which
was rejected at the end of last year – will be subject to a new vote.
Finally, a decision of the Supreme Court of Arizona (2004)
prohibiting the deregulation of the energy market for private
developers of renewable electricity is the subject of major
lobbying. by a vote of 7 to 0, the ACC was in favour of reopening
the discussions.
It is expected that Arizona will develop 2,689 MW of renewable
energy capacity over the next five years with an even split between
technologies.
State of Georgia
General data:
PIB: US$ 554.3 billion (2017);
Population: 10.4 million (2017).●
Average wholesale price (in US$/MWh) of electricity:
01.01.2019 01.01.2018
53.7 70.9
The State of Georgia has an installed electrical capacity of nearly
37 GW, with fossil fuels accounting for 73% of this capacity. The
main source of energy comes from natural gas. Renewable
energies are mainly derived from biomass and hydraulic
technologies.
The operator Georgia Power Company, has already dismantled
3.1 GW of coal-fired power plants. Furthermore, in its Integrated
Resource Plan 2019, it proposed dismantling approximately an
additional 1 GW. At the same time, two nuclear reactors are under
construction and will be commissioned in 2021 and 2022
respectively.
Installed capacity by technology group (2018)
11%
5%44 MW
4,061 MW
3,965 MW11%
26,964 MW73%
44 MW<1%
Storage sources
Other
Renewable energy
Fossil fuels
Nuclear
Source: U.S. Energy Information Administration (2018).
The State of Georgia adopted the Renewable Energy
Development Initiative 2020 (REDI 2020) as of 2016. This plan
calls for the construction of 1,050 MW renewable energy over the
2017-2021 period. 510 MW has already been allocated to private
generators through 30-year power purchase agreements at an
average rate of US$36/MWh. An additional 540 MW will be
awarded in November 2019.
In support of the REDI 2020 programme, 58 regulatory and fiscal
policies and incentives have been put in place to promote the
development of renewable facilities.
64 renewable power generation projects are in operation so far,
for an average unit capacity of 117 MW. New solar projects
totalling 2.5 GW (with a unit capacity that is systematically greater
than 80 MW) were on the waiting list for electrical connections at
the end of 2018.
In its Integrated Resource Plan 2019, programming the three-year
evolution of its generation fleet and transmission infrastructure,
Georgia Power Company announced the extension of the
Renewable Energy Development Initiative programme for the
equivalent of 950 MW in new capacities by 2024.
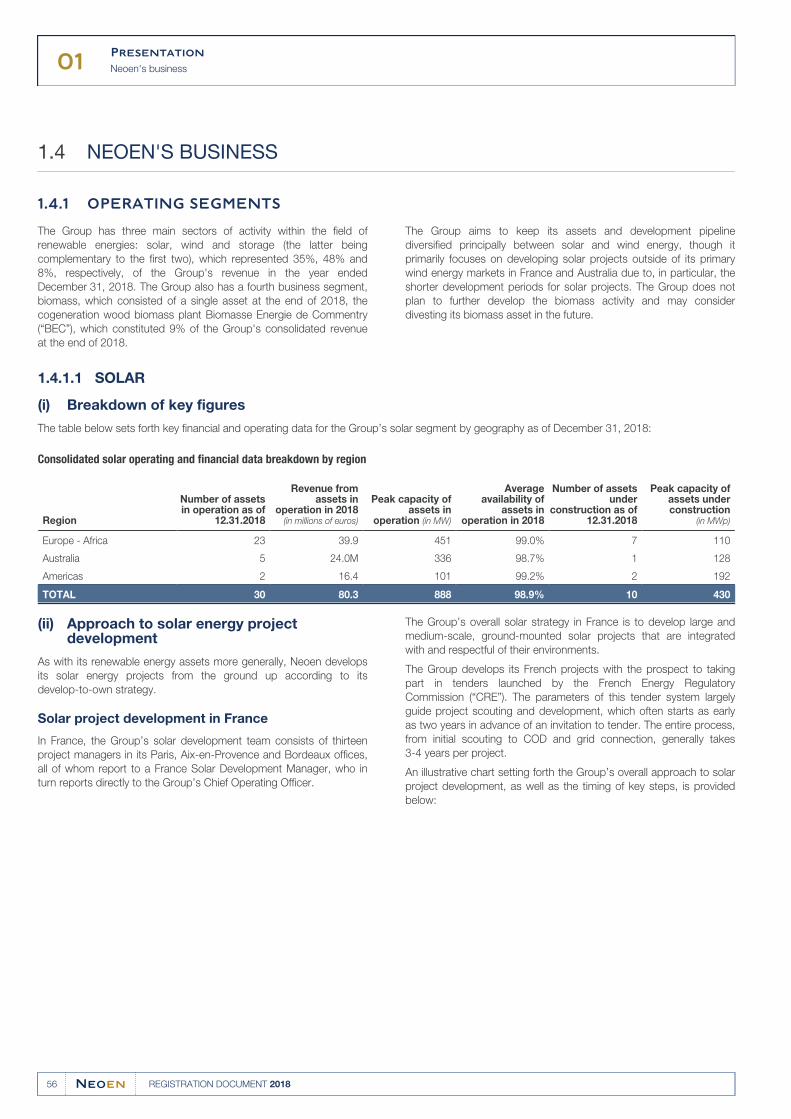
01Presentation
Neoen's business
56 REGISTRATION DOCUMENT 2018
NEOEN'S BUSINESS1.4
OPERATING SEGMENTS1.4.1
The Group has three main sectors of activity within the field of
renewable energies: solar, wind and storage (the latter being
complementary to the first two), which represented 35%, 48% and
8%, respectively, of the Group's revenue in the year ended
December 31, 2018. The Group also has a fourth business segment,
biomass, which consisted of a single asset at the end of 2018, the
cogeneration wood biomass plant Biomasse Energie de Commentry
(“BEC”), which constituted 9% of the Group's consolidated revenue
at the end of 2018.
The Group aims to keep its assets and development pipeline
diversified principally between solar and wind energy, though it
primarily focuses on developing solar projects outside of its primary
wind energy markets in France and Australia due to, in particular, the
shorter development periods for solar projects. The Group does not
plan to further develop the biomass activity and may consider
divesting its biomass asset in the future.
SOLAR1.4.1.1
Breakdown of key figures(i)
The table below sets forth key financial and operating data for the Group’s solar segment by geography as of December 31, 2018:
Consolidated solar operating and financial data breakdown by region
Region
Number of assetsin operation as of
12.31.2018
Revenue fromassets in
operation in 2018(in millions of euros)
Peak capacity ofassets in
operation (in MW)
Averageavailability of
assets inoperation in 2018
Number of assetsunder
construction as of12.31.2018
Peak capacity ofassets underconstruction
(in MWp)
Europe - Africa 23 39.9 451 99.0% 7 110
Australia 5 24.0M 336 98.7% 1 128
Americas 2 16.4 101 99.2% 2 192
TOTAL 30 80.3 888 98.9% 10 430
Approach to solar energy project (ii)development
As with its renewable energy assets more generally, Neoen develops
its solar energy projects from the ground up according to its
develop-to-own strategy.
Solar project development in France
In France, the Group’s solar development team consists of thirteen
project managers in its Paris, Aix-en-Provence and Bordeaux offices,
all of whom report to a France Solar Development Manager, who in
turn reports directly to the Group’s Chief Operating Officer.
The Group’s overall solar strategy in France is to develop large and
medium-scale, ground-mounted solar projects that are integrated
with and respectful of their environments.
The Group develops its French projects with the prospect to taking
part in tenders launched by the French Energy Regulatory
Commission (“CRE”). The parameters of this tender system largely
guide project scouting and development, which often starts as early
as two years in advance of an invitation to tender. The entire process,
from initial scouting to COD and grid connection, generally takes
3-4 years per project.
An illustrative chart setting forth the Group’s overall approach to solar
project development, as well as the timing of key steps, is provided
below:
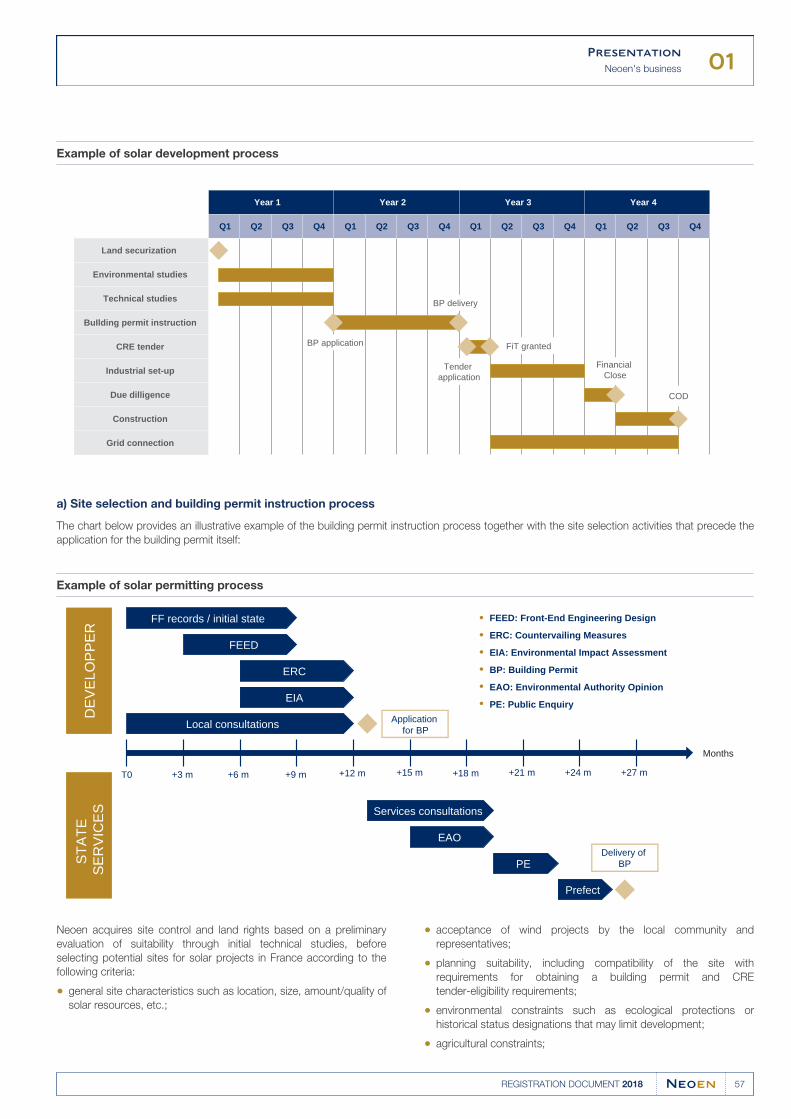
01Presentation
Neoen's business
57REGISTRATION DOCUMENT 2018
Example of solar development process
Year 1 Year 2 Year 3 Year 4
Q1 Q2 Q3 Q4 Q1 Q2 Q3 Q4 Q1 Q2 Q3 Q4 Q1 Q2 Q3 Q4
Land securization
Environmental studies
Technical studies
BuIlding permit instruction
CRE tender
Industrial set-up
Due dilligence
Construction
Grid connection
BP application
BP delivery
Tender application
Financial Close
FiT granted
COD
a) Site selection and building permit instruction process
The chart below provides an illustrative example of the building permit instruction process together with the site selection activities that precede the
application for the building permit itself:
Example of solar permitting process
DE
VE
LOP
PE
R
FF records / initial state
FEED
ERC
EIA
Local consultations
ST
AT
E
SE
RV
ICE
S Services consultations
EAO
PE
Months
Prefect
T0 +3 m +6 m +9 m +12 m +15 m +18 m +21 m +24 m +27 m
Application for BP
Delivery of BP
FEED: Front-End Engineering Design
ERC: Countervailing Measures
EIA: Environmental Impact Assessment
BP: Building Permit
EAO: Environmental Authority Opinion
PE: Public Enquiry
•
•
•
•
•
•
Neoen acquires site control and land rights based on a preliminary
evaluation of suitability through initial technical studies, before
selecting potential sites for solar projects in France according to the
following criteria:
general site characteristics such as location, size, amount/quality of●solar resources, etc.;
acceptance of wind projects by the local community and●representatives;
planning suitability, including compatibility of the site with●requirements for obtaining a building permit and CRE
tender-eligibility requirements;
environmental constraints such as ecological protections or●historical status designations that may limit development;
agricultural constraints;●
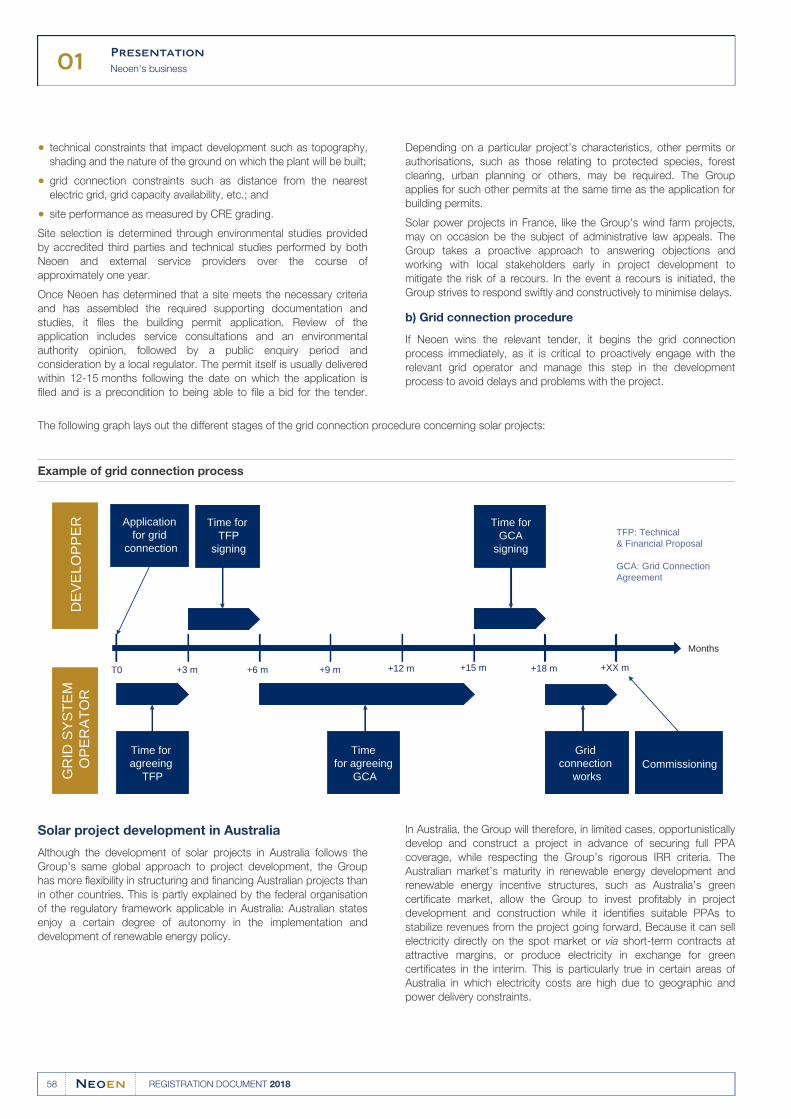
01Presentation
Neoen's business
58 REGISTRATION DOCUMENT 2018
technical constraints that impact development such as topography,●shading and the nature of the ground on which the plant will be built;
grid connection constraints such as distance from the nearest●electric grid, grid capacity availability, etc.; and
site performance as measured by CRE grading.●
Site selection is determined through environmental studies provided
by accredited third parties and technical studies performed by both
Neoen and external service providers over the course of
approximately one year.
Depending on a particular project’s characteristics, other permits or
authorisations, such as those relating to protected species, forest
clearing, urban planning or others, may be required. The Group
applies for such other permits at the same time as the application for
building permits.
Once Neoen has determined that a site meets the necessary criteria
and has assembled the required supporting documentation and
studies, it files the building permit application. Review of the
application includes service consultations and an environmental
authority opinion, followed by a public enquiry period and
consideration by a local regulator. The permit itself is usually delivered
within 12-15 months following the date on which the application is
filed and is a precondition to being able to file a bid for the tender.
Solar power projects in France, like the Group's wind farm projects,
may on occasion be the subject of administrative law appeals. The
Group takes a proactive approach to answering objections and
working with local stakeholders early in project development to
mitigate the risk of a recours. In the event a recours is initiated, the
Group strives to respond swiftly and constructively to minimise delays.
b) Grid connection procedure
If Neoen wins the relevant tender, it begins the grid connection
process immediately, as it is critical to proactively engage with the
relevant grid operator and manage this step in the development
process to avoid delays and problems with the project.
The following graph lays out the different stages of the grid connection procedure concerning solar projects:
Example of grid connection process
DE
VE
LOP
PE
RG
RID
SY
ST
EM
O
PE
RA
TO
R
Months
T0 +3 m +6 m +9 m +12 m +15 m +18 m +XX m
Application for grid
connection
Time for TFP
signing
Commissioning
TFP: Technical & Financial Proposal
GCA: Grid Connection Agreement
Time for agreeing
TFP
Time for GCA signing
Time for agreeing
GCA
Grid connection
works
Solar project development in Australia
Although the development of solar projects in Australia follows the
Group's same global approach to project development, the Group
has more flexibility in structuring and financing Australian projects than
in other countries. This is partly explained by the federal organisation
of the regulatory framework applicable in Australia: Australian states
enjoy a certain degree of autonomy in the implementation and
development of renewable energy policy.
In Australia, the Group will therefore, in limited cases, opportunistically
develop and construct a project in advance of securing full PPA
coverage, while respecting the Group’s rigorous IRR criteria. The
Australian market’s maturity in renewable energy development and
renewable energy incentive structures, such as Australia’s green
certificate market, allow the Group to invest profitably in project
development and construction while it identifies suitable PPAs to
stabilize revenues from the project going forward, Because it can sell
electricity directly on the spot market or via short-term contracts at
attractive margins, or produce electricity in exchange for green
certificates in the interim. This is particularly true in certain areas of
Australia in which electricity costs are high due to geographic and
power delivery constraints.
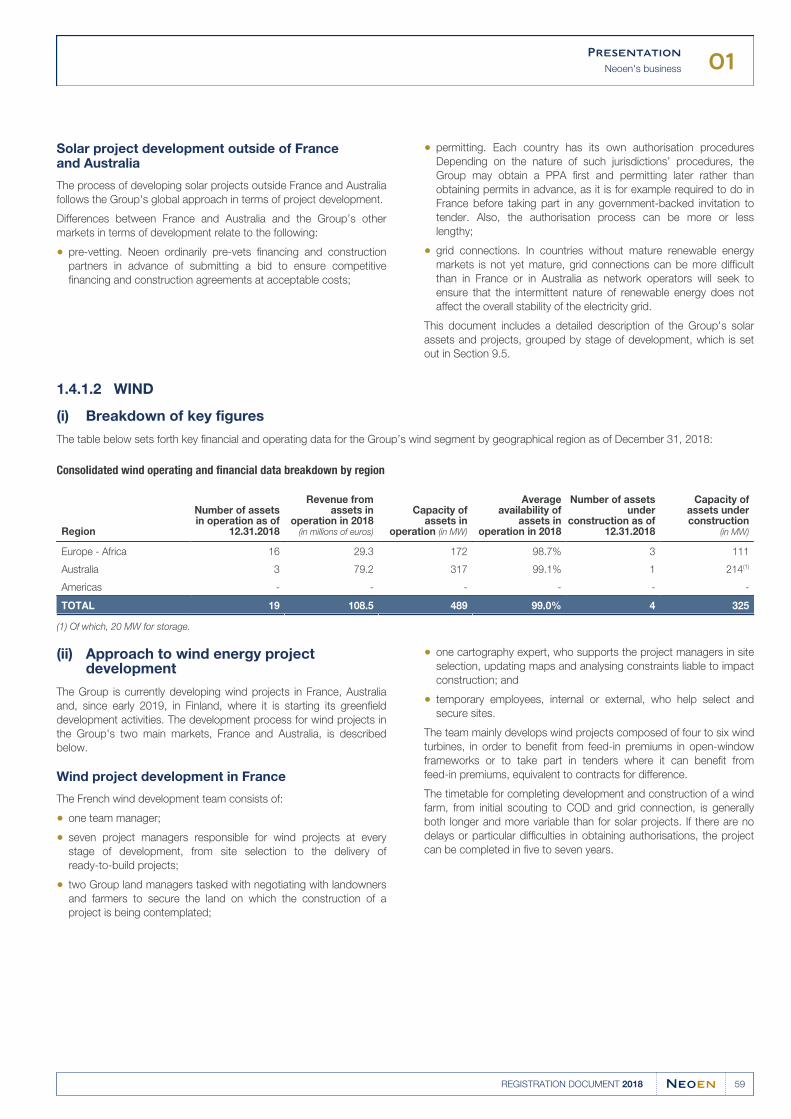
01Presentation
Neoen's business
59REGISTRATION DOCUMENT 2018
Solar project development outside of France and Australia
The process of developing solar projects outside France and Australia
follows the Group's global approach in terms of project development.
Differences between France and Australia and the Group’s other
markets in terms of development relate to the following:
pre-vetting. Neoen ordinarily pre-vets financing and construction●partners in advance of submitting a bid to ensure competitive
financing and construction agreements at acceptable costs;
permitting. Each country has its own authorisation procedures●Depending on the nature of such jurisdictions’ procedures, the
Group may obtain a PPA first and permitting later rather than
obtaining permits in advance, as it is for example required to do in
France before taking part in any government-backed invitation to
tender. Also, the authorisation process can be more or less
lengthy;
grid connections. In countries without mature renewable energy●markets is not yet mature, grid connections can be more difficult
than in France or in Australia as network operators will seek to
ensure that the intermittent nature of renewable energy does not
affect the overall stability of the electricity grid.
This document includes a detailed description of the Group's solar
assets and projects, grouped by stage of development, which is set
out in Section 9.5.
WIND1.4.1.2
Breakdown of key figures(i)
The table below sets forth key financial and operating data for the Group’s wind segment by geographical region as of December 31, 2018:
Consolidated wind operating and financial data breakdown by region
Region
Number of assetsin operation as of
12.31.2018
Revenue fromassets in
operation in 2018(in millions of euros)
Capacity ofassets in
operation (in MW)
Averageavailability of
assets inoperation in 2018
Number of assetsunder
construction as of12.31.2018
Capacity ofassets underconstruction
(in MW)
Europe - Africa 16 29.3 172 98.7% 3 111
Australia 3 79.2 317 99.1% 1 214(1)
Americas - - - - - -
TOTAL 19 108.5 489 99.0% 4 325
Of which, 20 MW for storage.(1)
Approach to wind energy project (ii)development
The Group is currently developing wind projects in France, Australia
and, since early 2019, in Finland, where it is starting its greenfield
development activities. The development process for wind projects in
the Group's two main markets, France and Australia, is described
below.
Wind project development in France
The French wind development team consists of:
one team manager;●
seven project managers responsible for wind projects at every●stage of development, from site selection to the delivery of
ready-to-build projects;
two Group land managers tasked with negotiating with landowners●and farmers to secure the land on which the construction of a
project is being contemplated;
one cartography expert, who supports the project managers in site●selection, updating maps and analysing constraints liable to impact
construction; and
temporary employees, internal or external, who help select and●secure sites.
The team mainly develops wind projects composed of four to six wind
turbines, in order to benefit from feed-in premiums in open-window
frameworks or to take part in tenders where it can benefit from
feed-in premiums, equivalent to contracts for difference.
The timetable for completing development and construction of a wind
farm, from initial scouting to COD and grid connection, is generally
both longer and more variable than for solar projects. If there are no
delays or particular difficulties in obtaining authorisations, the project
can be completed in five to seven years.
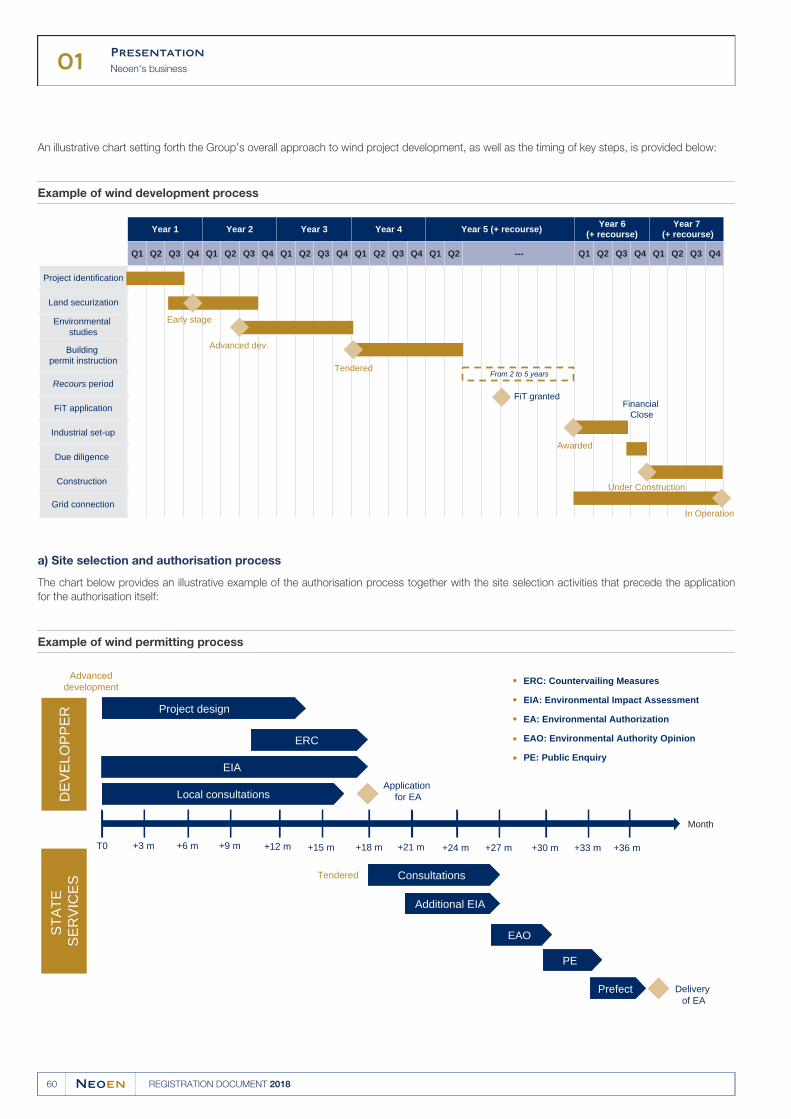
01Presentation
Neoen's business
60 REGISTRATION DOCUMENT 2018
An illustrative chart setting forth the Group’s overall approach to wind project development, as well as the timing of key steps, is provided below:
Example of wind development process
Year 1 Year 2 Year 3 Year 4 Year 5 (+ recourse) Year 6 (+ recourse)
Year 7 (+ recourse)
Q1 Q2 Q3 Q4 Q1 Q2 Q3 Q4 Q1 Q2 Q3 Q4 Q1 Q2 Q3 Q4 Q1 Q2 --- Q1 Q2 Q3 Q4 Q1 Q2 Q3 Q4
Project identification
Land securization
Environmental studies
Building permit instruction
Recours period
FiT application
Industrial set-up
Due diligence
Construction
Grid connection
Financial Close
From 2 to 5 years
FiT granted
In Operation
Early stage
Advanced dev.
Tendered
Awarded
Under Construction
a) Site selection and authorisation process
The chart below provides an illustrative example of the authorisation process together with the site selection activities that precede the application
for the authorisation itself:
Example of wind permitting process
Project design
ERC
EIA
Local consultations
Consultations
EAO
• ERC: Countervailing Measures
EIA: Environmental Impact Assessment
EA: Environmental Authorization
EAO: Environmental Authority Opinion
PE: Public Enquiry
•
•
•
•
PE
Month
Prefect
T0 +3 m +6 m +9 m +12 m +15 m +18 m +21 m +24 m +27 m
Application for EA
Delivery of EA
+30 m +33 m +36 m
Tendered
Advanceddevelopment
Additional EIA
DE
VE
LOP
PE
RS
TA
TE
S
ER
VIC
ES
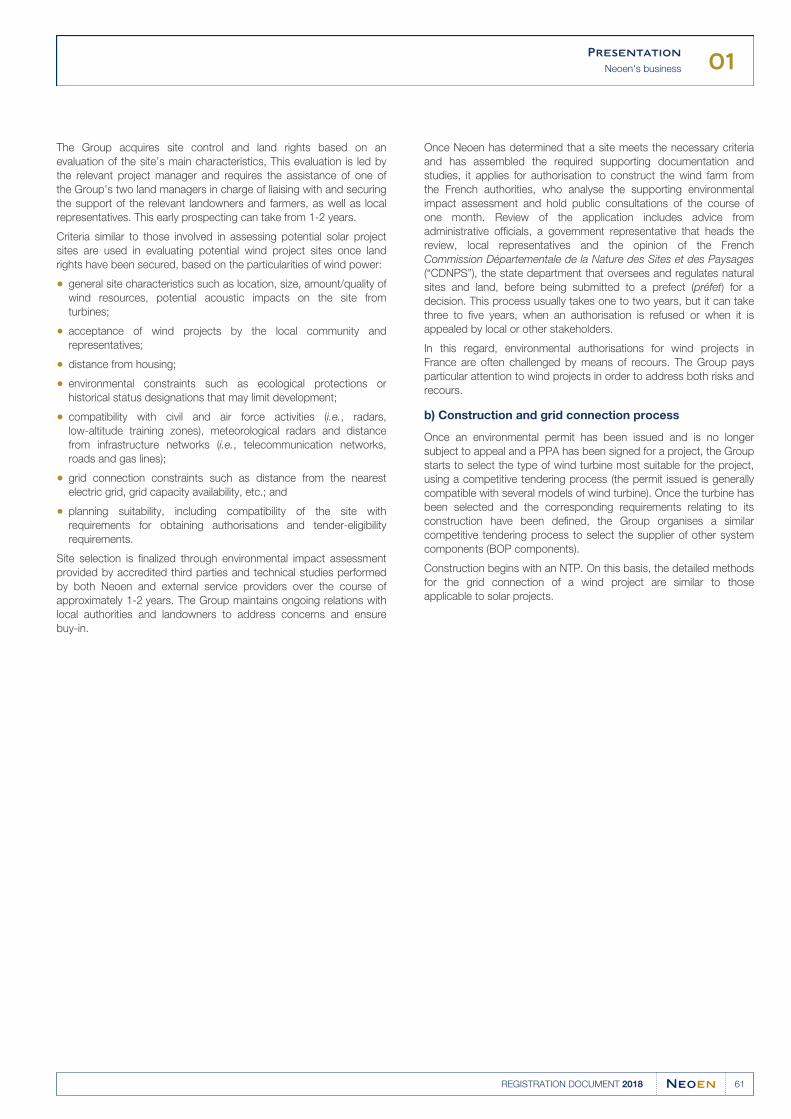
01Presentation
Neoen's business
61REGISTRATION DOCUMENT 2018
The Group acquires site control and land rights based on an
evaluation of the site’s main characteristics, This evaluation is led by
the relevant project manager and requires the assistance of one of
the Group's two land managers in charge of liaising with and securing
the support of the relevant landowners and farmers, as well as local
representatives. This early prospecting can take from 1-2 years.
Criteria similar to those involved in assessing potential solar project
sites are used in evaluating potential wind project sites once land
rights have been secured, based on the particularities of wind power:
general site characteristics such as location, size, amount/quality of●wind resources, potential acoustic impacts on the site from
turbines;
acceptance of wind projects by the local community and●representatives;
distance from housing;●
environmental constraints such as ecological protections or●historical status designations that may limit development;
compatibility with civil and air force activities (i.e., radars,●low-altitude training zones), meteorological radars and distance
from infrastructure networks (i.e., telecommunication networks,
roads and gas lines);
grid connection constraints such as distance from the nearest●electric grid, grid capacity availability, etc.; and
planning suitability, including compatibility of the site with●requirements for obtaining authorisations and tender-eligibility
requirements.
Site selection is finalized through environmental impact assessment
provided by accredited third parties and technical studies performed
by both Neoen and external service providers over the course of
approximately 1-2 years. The Group maintains ongoing relations with
local authorities and landowners to address concerns and ensure
buy-in.
Once Neoen has determined that a site meets the necessary criteria
and has assembled the required supporting documentation and
studies, it applies for authorisation to construct the wind farm from
the French authorities, who analyse the supporting environmental
impact assessment and hold public consultations of the course of
one month. Review of the application includes advice from
administrative officials, a government representative that heads the
review, local representatives and the opinion of the French
Commission Départementale de la Nature des Sites et des Paysages
(“CDNPS”), the state department that oversees and regulates natural
sites and land, before being submitted to a prefect (préfet) for a
decision. This process usually takes one to two years, but it can take
three to five years, when an authorisation is refused or when it is
appealed by local or other stakeholders.
In this regard, environmental authorisations for wind projects in
France are often challenged by means of recours. The Group pays
particular attention to wind projects in order to address both risks and
recours.
b) Construction and grid connection process
Once an environmental permit has been issued and is no longer
subject to appeal and a PPA has been signed for a project, the Group
starts to select the type of wind turbine most suitable for the project,
using a competitive tendering process (the permit issued is generally
compatible with several models of wind turbine). Once the turbine has
been selected and the corresponding requirements relating to its
construction have been defined, the Group organises a similar
competitive tendering process to select the supplier of other system
components (BOP components).
Construction begins with an NTP. On this basis, the detailed methods
for the grid connection of a wind project are similar to those
applicable to solar projects.
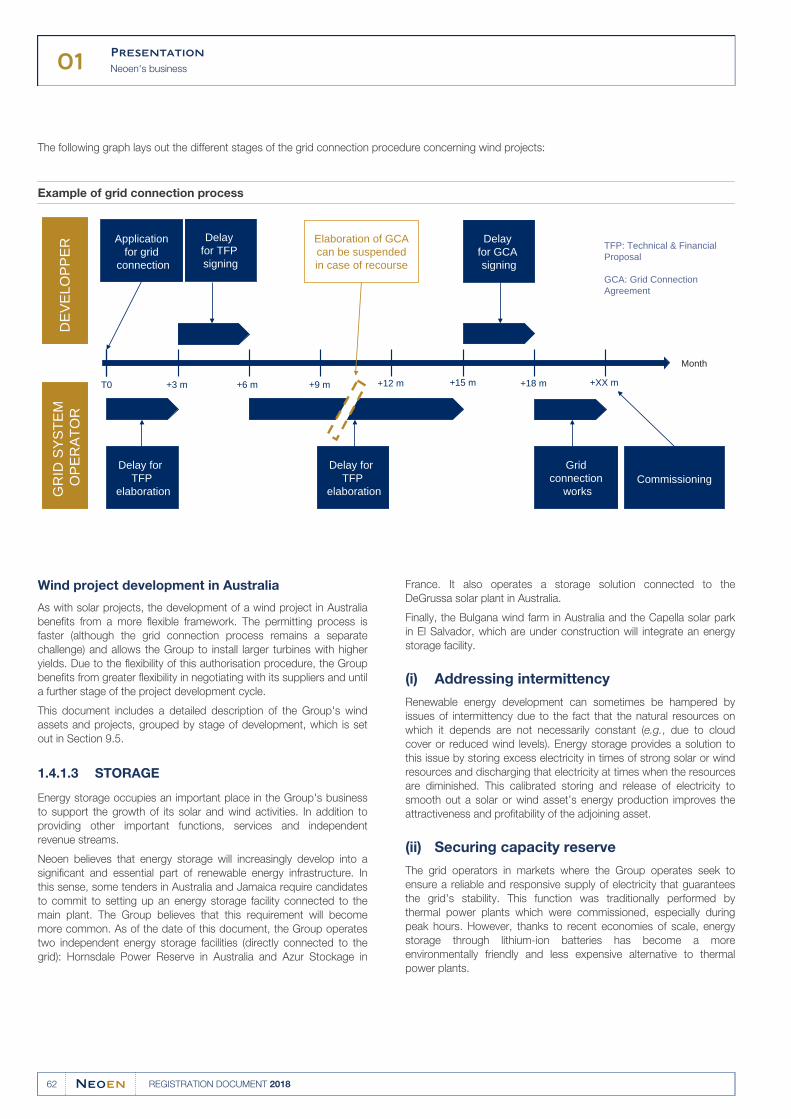
01Presentation
Neoen's business
62 REGISTRATION DOCUMENT 2018
The following graph lays out the different stages of the grid connection procedure concerning wind projects:
Example of grid connection process
GR
ID S
YS
TE
M
OP
ER
AT
OR
Month
T0 +3 m +6 m +9 m +12 m +15 m +18 m +XX m
Delay for TFP
elaboration
Elaboration of GCAcan be suspendedin case of recourse
Delay for TFP
elaboration
Grid connection
worksCommissioning
DE
VE
LOP
PE
R TFP: Technical & Financial Proposal
GCA: Grid Connection Agreement
Application for grid
connection
Delay for TFP signing
Delay for GCA signing
Wind project development in Australia
As with solar projects, the development of a wind project in Australia
benefits from a more flexible framework. The permitting process is
faster (although the grid connection process remains a separate
challenge) and allows the Group to install larger turbines with higher
yields. Due to the flexibility of this authorisation procedure, the Group
benefits from greater flexibility in negotiating with its suppliers and until
a further stage of the project development cycle.
This document includes a detailed description of the Group's wind
assets and projects, grouped by stage of development, which is set
out in Section 9.5.
STORAGE1.4.1.3
Energy storage occupies an important place in the Group's business
to support the growth of its solar and wind activities. In addition to
providing other important functions, services and independent
revenue streams.
France. It also operates a storage solution connected to the
DeGrussa solar plant in Australia.
Neoen believes that energy storage will increasingly develop into a
significant and essential part of renewable energy infrastructure. In
this sense, some tenders in Australia and Jamaica require candidates
to commit to setting up an energy storage facility connected to the
main plant. The Group believes that this requirement will become
more common. As of the date of this document, the Group operates
two independent energy storage facilities (directly connected to the
grid): Hornsdale Power Reserve in Australia and Azur Stockage in
Finally, the Bulgana wind farm in Australia and the Capella solar park
in El Salvador, which are under construction will integrate an energy
storage facility.
Addressing intermittency(i)
Renewable energy development can sometimes be hampered by
issues of intermittency due to the fact that the natural resources on
which it depends are not necessarily constant (e.g., due to cloud
cover or reduced wind levels). Energy storage provides a solution to
this issue by storing excess electricity in times of strong solar or wind
resources and discharging that electricity at times when the resources
are diminished. This calibrated storing and release of electricity to
smooth out a solar or wind asset’s energy production improves the
attractiveness and profitability of the adjoining asset.
Securing capacity reserve(ii)
The grid operators in markets where the Group operates seek to
ensure a reliable and responsive supply of electricity that guarantees
the grid's stability. This function was traditionally performed by
thermal power plants which were commissioned, especially during
peak hours. However, thanks to recent economies of scale, energy
storage through lithium-ion batteries has become a more
environmentally friendly and less expensive alternative to thermal
power plants.
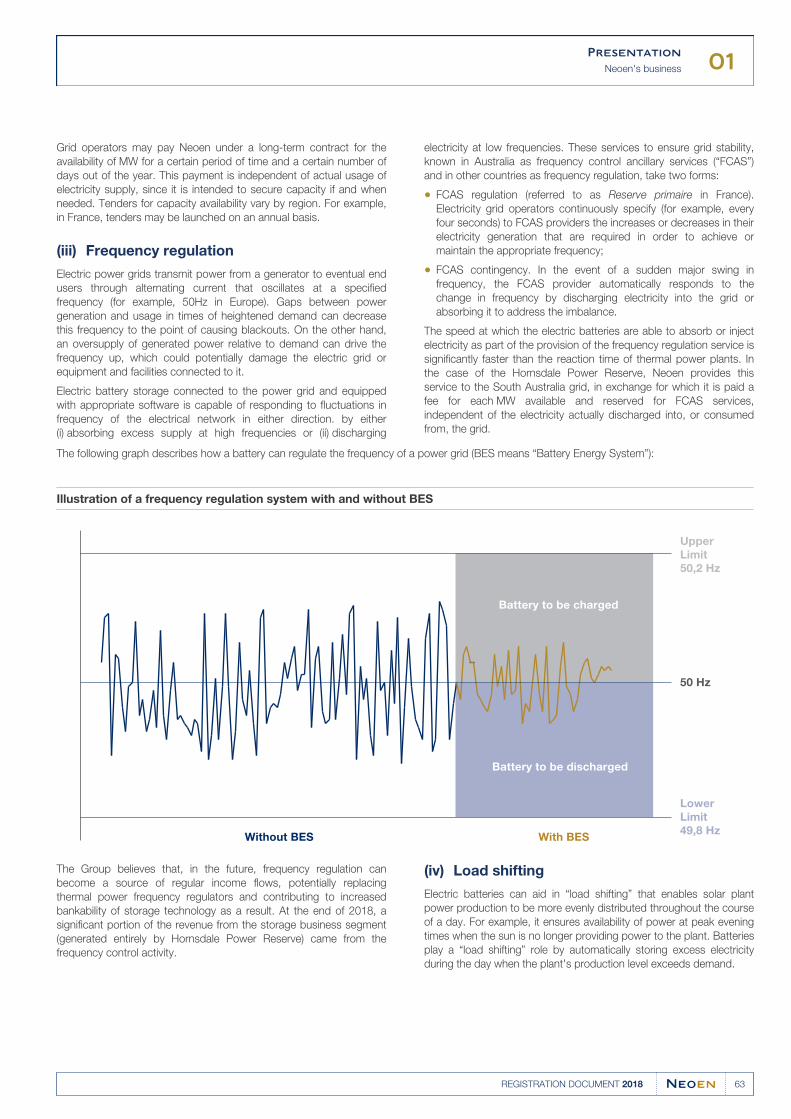
01Presentation
Neoen's business
63REGISTRATION DOCUMENT 2018
Grid operators may pay Neoen under a long-term contract for the
availability of MW for a certain period of time and a certain number of
days out of the year. This payment is independent of actual usage of
electricity supply, since it is intended to secure capacity if and when
needed. Tenders for capacity availability vary by region. For example,
in France, tenders may be launched on an annual basis.
Frequency regulation(iii)
Electric power grids transmit power from a generator to eventual end
users through alternating current that oscillates at a specified
frequency (for example, 50Hz in Europe). Gaps between power
generation and usage in times of heightened demand can decrease
this frequency to the point of causing blackouts. On the other hand,
an oversupply of generated power relative to demand can drive the
frequency up, which could potentially damage the electric grid or
equipment and facilities connected to it.
electricity at low frequencies. These services to ensure grid stability,
known in Australia as frequency control ancillary services (“FCAS”)
and in other countries as frequency regulation, take two forms:
Electric battery storage connected to the power grid and equipped
with appropriate software is capable of responding to fluctuations in
frequency of the electrical network in either direction. by either
(i) absorbing excess supply at high frequencies or (ii) discharging
FCAS regulation (referred to as Reserve primaire in France).●Electricity grid operators continuously specify (for example, every
four seconds) to FCAS providers the increases or decreases in their
electricity generation that are required in order to achieve or
maintain the appropriate frequency;
FCAS contingency. In the event of a sudden major swing in●frequency, the FCAS provider automatically responds to the
change in frequency by discharging electricity into the grid or
absorbing it to address the imbalance.
The speed at which the electric batteries are able to absorb or inject
electricity as part of the provision of the frequency regulation service is
significantly faster than the reaction time of thermal power plants. In
the case of the Hornsdale Power Reserve, Neoen provides this
service to the South Australia grid, in exchange for which it is paid a
fee for each MW available and reserved for FCAS services,
independent of the electricity actually discharged into, or consumed
from, the grid.
The following graph describes how a battery can regulate the frequency of a power grid (BES means “Battery Energy System”):
Illustration of a frequency regulation system with and without BES
Without BES With BES
Upper
Limit
50,2 Hz
50 Hz
Lower
Limit
49,8 Hz
Battery to be charged
Battery to be discharged
The Group believes that, in the future, frequency regulation can
become a source of regular income flows, potentially replacing
thermal power frequency regulators and contributing to increased
bankability of storage technology as a result. At the end of 2018, a
significant portion of the revenue from the storage business segment
(generated entirely by Hornsdale Power Reserve) came from the
frequency control activity.
Load shifting(iv)
Electric batteries can aid in “load shifting” that enables solar plant
power production to be more evenly distributed throughout the course
of a day. For example, it ensures availability of power at peak evening
times when the sun is no longer providing power to the plant. Batteries
play a “load shifting” role by automatically storing excess electricity
during the day when the plant's production level exceeds demand.
01Presentation
Neoen's business
64 REGISTRATION DOCUMENT 2018
The battery then discharges this excess electricity at peak per MWh corresponding to the increased demand. The Group
consumption hours (for example, in the evening as the sun’s intensity believes that load-shifting possesses significant potential for growth in
reaches its lowest point). Because load-shifting is timed to meet energy storage going forward due to the significant stability and
energy needs at peak usage times, the discharged electricity is continuity needs that it addresses.
transferred by Neoen to the grid in exchange for a higher price
The chart below illustrates the manner in which an electric battery can provide a load-shifting function:
Load shifting scheme
Hours
- 60
- 40
- 20
0
20
40
60
80
100
4 6 8 10 12 14 16 18 20 22
100MW of solar generation 50MW of battery generation Net yield of the plant
Sale of stored energy on the markets (v)(arbitrage)
When a battery’s capacity is not being used to provide back-up
services, frequency regulation or load-shifting, it can be sold on
energy trading markets. The Hornsdale Power Reserve, for example,
is able to respond to moments of volatility in energy prices,
discharging a portion of its electricity reserves to be sold on the spot
market at times of high prices.
Approach to energy storage project (vi)development
experts without however entering into master agreements, thereby
maintaining industrial and operational independence and the flexibility
that the Group favours for its solar and wind project development.
The Group and its development partners procure the batteries that
power the facilities themselves from a select group of battery
producers, such as Samsung SDI and LG Chem.
Though Neoen has developed its energy storage solutions more
recently than its initial core competencies of solar and wind power,
the Group is devoting significant resources to the further development
of energy storage. Neoen has developed a core of expertise
consisting of a central team of technical specialists and developers
that support energy storage project managers. This team has forged
relationships with suppliers (in particular, Tesla and Nidec) and
The Group continues to refine its business model with respect to
energy storage solutions. Currently its primary objective is to deploy
energy storage as a complementary component to facilitate the
development and entry of its solar plants and wind farms into various
markets.
Nevertheless, as the storage market evolves, Neoen expects that its
successful business model for the development and operation of
solar and wind assets can be deployed for energy storage tenders, In
this way, the Group has already developed a portfolio of storage
solutions.
This document includes a detailed description of the Group's
independent storage assets and projects, grouped by stage of
development, which is set out in Section 9.5 “Project details”.
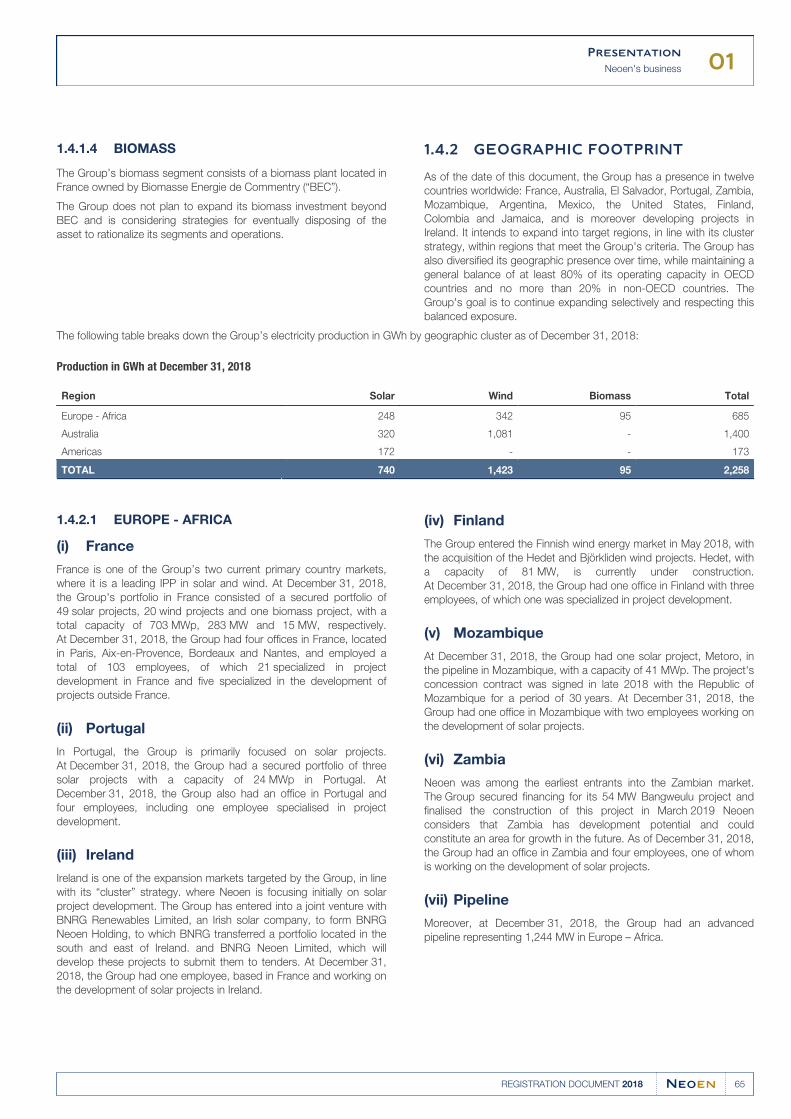
01Presentation
Neoen's business
65REGISTRATION DOCUMENT 2018
BIOMASS1.4.1.4
The Group’s biomass segment consists of a biomass plant located in
France owned by Biomasse Energie de Commentry (“BEC”).
The Group does not plan to expand its biomass investment beyond
BEC and is considering strategies for eventually disposing of the
asset to rationalize its segments and operations.
GEOGRAPHIC FOOTPRINT1.4.2
As of the date of this document, the Group has a presence in twelve
countries worldwide: France, Australia, El Salvador, Portugal, Zambia,
Mozambique, Argentina, Mexico, the United States, Finland,
Colombia and Jamaica, and is moreover developing projects in
Ireland. It intends to expand into target regions, in line with its cluster
strategy, within regions that meet the Group's criteria. The Group has
also diversified its geographic presence over time, while maintaining a
general balance of at least 80% of its operating capacity in OECD
countries and no more than 20% in non-OECD countries. The
Group's goal is to continue expanding selectively and respecting this
balanced exposure.
The following table breaks down the Group’s electricity production in GWh by geographic cluster as of December 31, 2018:
Production in GWh at December 31, 2018
Region Solar Wind Biomass Total
Europe - Africa 248 342 95 685
Australia 320 1,081 - 1,400
Americas 172 - - 173
TOTAL 740 1,423 95 2,258
EUROPE - AFRICA1.4.2.1
France(i)
France is one of the Group’s two current primary country markets,
where it is a leading IPP in solar and wind. At December 31, 2018,
the Group's portfolio in France consisted of a secured portfolio of
49 solar projects, 20 wind projects and one biomass project, with a
total capacity of 703 MWp, 283 MW and 15 MW, respectively.
At December 31, 2018, the Group had four offices in France, located
in Paris, Aix-en-Provence, Bordeaux and Nantes, and employed a
total of 103 employees, of which 21 specialized in project
development in France and five specialized in the development of
projects outside France.
Portugal(ii)
In Portugal, the Group is primarily focused on solar projects.
At December 31, 2018, the Group had a secured portfolio of three
solar projects with a capacity of 24 MWp in Portugal. At
December 31, 2018, the Group also had an office in Portugal and
four employees, including one employee specialised in project
development.
Ireland(iii)
Ireland is one of the expansion markets targeted by the Group, in line
with its “cluster” strategy. where Neoen is focusing initially on solar
project development. The Group has entered into a joint venture with
BNRG Renewables Limited, an Irish solar company, to form BNRG
Neoen Holding, to which BNRG transferred a portfolio located in the
south and east of Ireland. and BNRG Neoen Limited, which will
develop these projects to submit them to tenders. At December 31,
2018, the Group had one employee, based in France and working on
the development of solar projects in Ireland.
Finland(iv)
The Group entered the Finnish wind energy market in May 2018, with
the acquisition of the Hedet and Björkliden wind projects. Hedet, with
a capacity of 81 MW, is currently under construction.
At December 31, 2018, the Group had one office in Finland with three
employees, of which one was specialized in project development.
Mozambique(v)
At December 31, 2018, the Group had one solar project, Metoro, in
the pipeline in Mozambique, with a capacity of 41 MWp. The project's
concession contract was signed in late 2018 with the Republic of
Mozambique for a period of 30 years. At December 31, 2018, the
Group had one office in Mozambique with two employees working on
the development of solar projects.
Zambia(vi)
Neoen was among the earliest entrants into the Zambian market.
The Group secured financing for its 54 MW Bangweulu project and
finalised the construction of this project in March 2019 Neoen
considers that Zambia has development potential and could
constitute an area for growth in the future. As of December 31, 2018,
the Group had an office in Zambia and four employees, one of whom
is working on the development of solar projects.
Pipeline(vii)
Moreover, at December 31, 2018, the Group had an advanced
pipeline representing 1,244 MW in Europe – Africa.
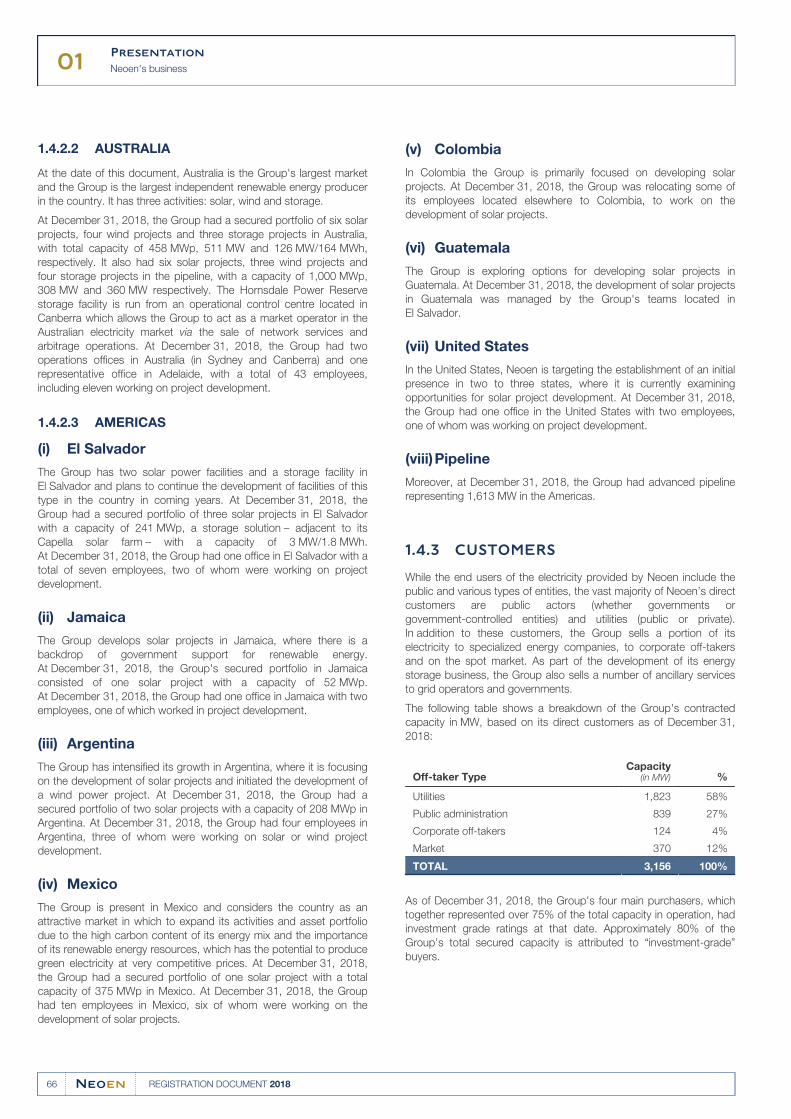
01Presentation
Neoen's business
66 REGISTRATION DOCUMENT 2018
AUSTRALIA1.4.2.2
At the date of this document, Australia is the Group's largest market
and the Group is the largest independent renewable energy producer
in the country. It has three activities: solar, wind and storage.
At December 31, 2018, the Group had a secured portfolio of six solar
projects, four wind projects and three storage projects in Australia,
with total capacity of 458 MWp, 511 MW and 126 MW/164 MWh,
respectively. It also had six solar projects, three wind projects and
four storage projects in the pipeline, with a capacity of 1,000 MWp,
308 MW and 360 MW respectively. The Hornsdale Power Reserve
storage facility is run from an operational control centre located in
Canberra which allows the Group to act as a market operator in the
Australian electricity market via the sale of network services and
arbitrage operations. At December 31, 2018, the Group had two
operations offices in Australia (in Sydney and Canberra) and one
representative office in Adelaide, with a total of 43 employees,
including eleven working on project development.
AMERICAS1.4.2.3
El Salvador(i)
The Group has two solar power facilities and a storage facility in
El Salvador and plans to continue the development of facilities of this
type in the country in coming years. At December 31, 2018, the
Group had a secured portfolio of three solar projects in El Salvador
with a capacity of 241 MWp, a storage solution – adjacent to its
Capella solar farm – with a capacity of 3 MW/1.8 MWh.
At December 31, 2018, the Group had one office in El Salvador with a
total of seven employees, two of whom were working on project
development.
Jamaica(ii)
The Group develops solar projects in Jamaica, where there is a
backdrop of government support for renewable energy.
At December 31, 2018, the Group's secured portfolio in Jamaica
consisted of one solar project with a capacity of 52 MWp.
At December 31, 2018, the Group had one office in Jamaica with two
employees, one of which worked in project development.
Argentina(iii)
The Group has intensified its growth in Argentina, where it is focusing
on the development of solar projects and initiated the development of
a wind power project. At December 31, 2018, the Group had a
secured portfolio of two solar projects with a capacity of 208 MWp in
Argentina. At December 31, 2018, the Group had four employees in
Argentina, three of whom were working on solar or wind project
development.
Mexico(iv)
The Group is present in Mexico and considers the country as an
attractive market in which to expand its activities and asset portfolio
due to the high carbon content of its energy mix and the importance
of its renewable energy resources, which has the potential to produce
green electricity at very competitive prices. At December 31, 2018,
the Group had a secured portfolio of one solar project with a total
capacity of 375 MWp in Mexico. At December 31, 2018, the Group
had ten employees in Mexico, six of whom were working on the
development of solar projects.
Colombia(v)
In Colombia the Group is primarily focused on developing solar
projects. At December 31, 2018, the Group was relocating some of
its employees located elsewhere to Colombia, to work on the
development of solar projects.
Guatemala(vi)
The Group is exploring options for developing solar projects in
Guatemala. At December 31, 2018, the development of solar projects
in Guatemala was managed by the Group's teams located in
El Salvador.
United States(vii)
In the United States, Neoen is targeting the establishment of an initial
presence in two to three states, where it is currently examining
opportunities for solar project development. At December 31, 2018,
the Group had one office in the United States with two employees,
one of whom was working on project development.
Pipeline(viii)
Moreover, at December 31, 2018, the Group had advanced pipeline
representing 1,613 MW in the Americas.
CUSTOMERS1.4.3
While the end users of the electricity provided by Neoen include the
public and various types of entities, the vast majority of Neoen’s direct
customers are public actors (whether governments or
government-controlled entities) and utilities (public or private).
In addition to these customers, the Group sells a portion of its
electricity to specialized energy companies, to corporate off-takers
and on the spot market. As part of the development of its energy
storage business, the Group also sells a number of ancillary services
to grid operators and governments.
The following table shows a breakdown of the Group's contracted
capacity in MW, based on its direct customers as of December 31,
2018:
Off-taker TypeCapacity
(in MW) %
Utilities 1,823 58%
Public administration 839 27%
Corporate off-takers 124 4%
Market 370 12%
TOTAL 3,156 100%
As of December 31, 2018, the Group's four main purchasers, which
together represented over 75% of the total capacity in operation, had
investment grade ratings at that date. Approximately 80% of the
Group’s total secured capacity is attributed to “investment-grade”
buyers.
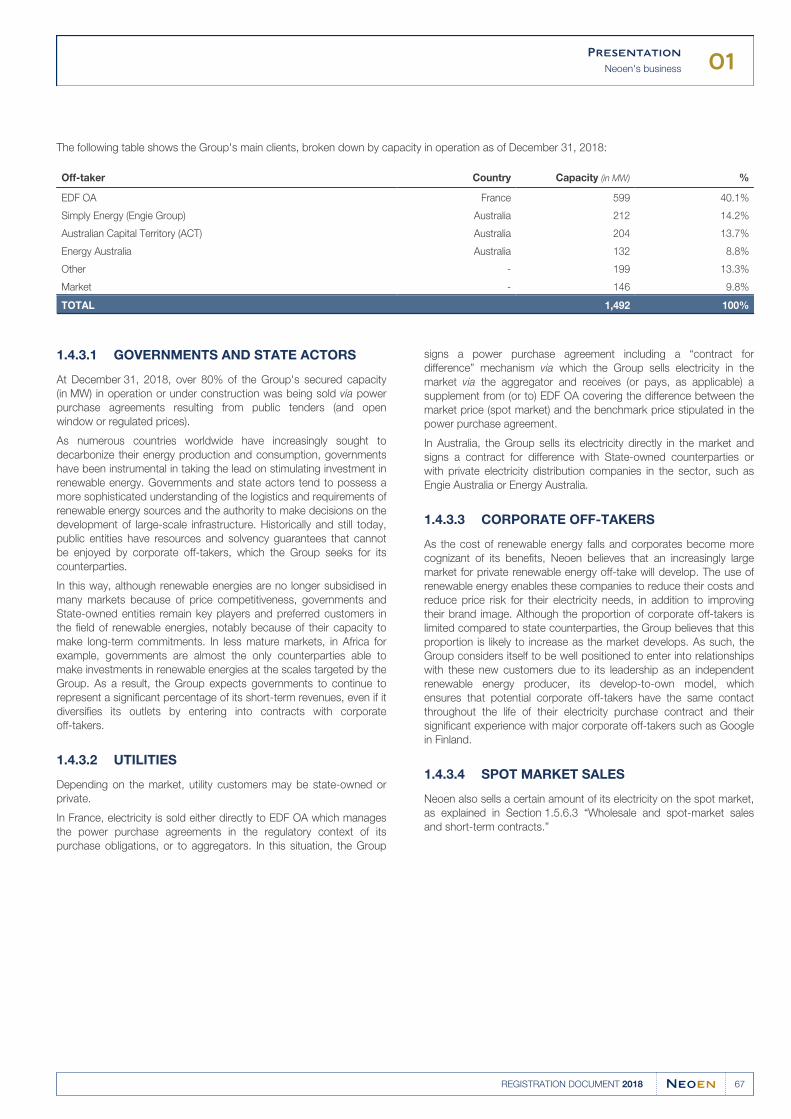
01Presentation
Neoen's business
67REGISTRATION DOCUMENT 2018
The following table shows the Group's main clients, broken down by capacity in operation as of December 31, 2018:
Off-taker Country Capacity (in MW) %
EDF OA France 599 40.1%
Simply Energy (Engie Group) Australia 212 14.2%
Australian Capital Territory (ACT) Australia 204 13.7%
Energy Australia Australia 132 8.8%
Other - 199 13.3%
Market - 146 9.8%
TOTAL 1,492 100%
GOVERNMENTS AND STATE ACTORS1.4.3.1
At December 31, 2018, over 80% of the Group's secured capacity
(in MW) in operation or under construction was being sold via power
purchase agreements resulting from public tenders (and open
window or regulated prices).
As numerous countries worldwide have increasingly sought to
decarbonize their energy production and consumption, governments
have been instrumental in taking the lead on stimulating investment in
renewable energy. Governments and state actors tend to possess a
more sophisticated understanding of the logistics and requirements of
renewable energy sources and the authority to make decisions on the
development of large-scale infrastructure. Historically and still today,
public entities have resources and solvency guarantees that cannot
be enjoyed by corporate off-takers, which the Group seeks for its
counterparties.
In this way, although renewable energies are no longer subsidised in
many markets because of price competitiveness, governments and
State-owned entities remain key players and preferred customers in
the field of renewable energies, notably because of their capacity to
make long-term commitments. In less mature markets, in Africa for
example, governments are almost the only counterparties able to
make investments in renewable energies at the scales targeted by the
Group. As a result, the Group expects governments to continue to
represent a significant percentage of its short-term revenues, even if it
diversifies its outlets by entering into contracts with corporate
off-takers.
UTILITIES1.4.3.2
Depending on the market, utility customers may be state-owned or
private.
signs a power purchase agreement including a “contract for
difference” mechanism via which the Group sells electricity in the
market via the aggregator and receives (or pays, as applicable) a
supplement from (or to) EDF OA covering the difference between the
market price (spot market) and the benchmark price stipulated in the
power purchase agreement.
In France, electricity is sold either directly to EDF OA which manages
the power purchase agreements in the regulatory context of its
purchase obligations, or to aggregators. In this situation, the Group
In Australia, the Group sells its electricity directly in the market and
signs a contract for difference with State-owned counterparties or
with private electricity distribution companies in the sector, such as
Engie Australia or Energy Australia.
CORPORATE OFF-TAKERS1.4.3.3
As the cost of renewable energy falls and corporates become more
cognizant of its benefits, Neoen believes that an increasingly large
market for private renewable energy off-take will develop. The use of
renewable energy enables these companies to reduce their costs and
reduce price risk for their electricity needs, in addition to improving
their brand image. Although the proportion of corporate off-takers is
limited compared to state counterparties, the Group believes that this
proportion is likely to increase as the market develops. As such, the
Group considers itself to be well positioned to enter into relationships
with these new customers due to its leadership as an independent
renewable energy producer, its develop-to-own model, which
ensures that potential corporate off-takers have the same contact
throughout the life of their electricity purchase contract and their
significant experience with major corporate off-takers such as Google
in Finland.
SPOT MARKET SALES1.4.3.4
Neoen also sells a certain amount of its electricity on the spot market,
as explained in Section 1.5.6.3 “Wholesale and spot-market sales
and short-term contracts.”
01Presentation
Operating Model
68 REGISTRATION DOCUMENT 2018
SIGNIFICANT CONTRACTS AND SUPPLIERS1.4.4
The most important contracts signed by the Group consist of the
contracts for difference and power purchase agreements described in
Section 1.5.6.1 “Power purchase agreements” of this document, the
design, procurement and installation agreements (EPC agreements)
and the operations and maintenance agreements (O&M agreements)
and project financing agreements signed with multiple lenders
described in Section 1.5.5 “Project financing”.
addition, as discussed in Section 1.5.5.5 “Operating assets”, while it
is not uncommon for the Group to engage in repeat business with
certain EPCs, it nevertheless remains flexible from an industrial point
of view and is able to select its O&M contractors and service
providers on a project-by-project basis rather than signing master
agreements. It therefore has limited dependence on any particular
partner for EPC or O&M services. The Group has however indirectly
signed significant contracts via its co-contractors on a case-by-caseThe Group has numerous such contracts and is not dependent onbasis depending on the project.any particular one. As indicated in Section 1.5.5 “Project financing”,
the Group finances its facilities via non-recourse financing only. In
OPERATING MODEL1.5
COMPETITIVE DEVELOPER AND IPP WITH A “DEVELOP-TO-OWN” BUSINESS 1.5.1
MODEL
Neoen’s business strategy targets primarily utility-scale solar and wind
project development opportunities (generally between 5-30 MW in
France and between 40-400 MW internationally) in competitive bids
and open-window frameworks in its target markets. The Group is
looking for opportunities to leverage its experience in project
development, industrial expertise, technical know-how and
operational flexibility to win competitive tenders for long-term
electricity sales contracts by elaborating structured competitive offers
to generate an attractive return on investment.
Neoen adheres to its “develop-to-own” strategy to ensure that every
stage of a project’s lifecycle, from design to operation, is implemented
according to the Group’s demanding standards and long-term
objectives. The Group's approach to its business, combining the
activities of developer and independent power producer, provides the
Group with an incentive and the capacity to make smart investments
in projects with high added value, in terms of development, that
generate significant returns at completion, especially through
adopting risk management strategies, building long-term trustworthy
relationships with stakeholders, reducing project costs and optimising
financing terms for these projects.
Neoen strategically investigates project development opportunities
using teams on the ground in a given market to scout sites, secure
land rights, obtain technical studies, detailed environmental studies
and building permits in order to design high-quality projects and
structure its bids. For additional details on initial project development,
see Section 1.5.4.1 “Identifying opportunities.” These initial
investments enable Neoen to better determine and mitigate project
risk from the very earliest stages and continue to reduce it as project
planning advances, protecting its subsequent increased investment.
In more mature markets or markets where the Group is already
established, when a tender is announced for which a given project or
multiple projects would be suitable, Neoen is able to quickly respond
with a bid by leveraging its early project development and obtaining
management validation, budgeting and financial modeling. In less
mature or new markets for the Group, Neoen may work with local
developers to acquire a knowledge base that helps it identify
promising local project sites and swiftly respond to later tenders. If
Neoen wins a tender, it works efficiently to produce a high-quality
asset through an integrated process of competitive procurement and
financing, partnering with respected industrial contractors and
suppliers for construction and seeking lending arrangements on
favourable terms that facilitate rapid project execution.
The Group is able to secure favourable long-term non-recourse
project financing for the construction of its assets thanks in particular
to the relatively stable long-term revenue streams provided by its
PPAs, and it actively monitors third-party on-site operation and
management (“O&M”) to ensure a high level of asset availability.
Neoen SAS functions as the Group’s development entity, and
charges (directly or indirectly) to the SPVs holding ready-to-build
projects a development fee in one or more installments. These fees
are booked as revenue at the Neoen SAS level and as capital
expenditures by the SPVs; they are eliminated in consolidation. This
development fee revenue contributes to funding further development.
01Presentation
Operating Model
69REGISTRATION DOCUMENT 2018
Once the Group’s production assets are operational, the Group sells
the electricity generated primarily pursuant to long-term contracts or,
sometimes in the spot electricity market in order to generate
additional revenue. For a more detailed description of the Group’s
electricity sale contracts, please see Section 1.5.6 “Electricity sale
contracts”. The Group aims to reinvest all or a portion of the revenue
from its electricity sales into additional “ready-to-build” projects, which
along with shareholder equity contributions form the basis of
continued equity investment in an expanding asset portfolio. These
revenues are deployed for its ready-to-build projects to support the
Group’s portfolio expansion instead of being used to finance
development activities and employee costs.
Neoen believes that its “develop-to-own” strategy results in profitable,
high-quality and durable assets with optimised financing
arrangements. The strategy also strengthens Neoen’s reputation as a
reliable IPP that is truly invested in the markets in which it operates,
with a strong track record in terms of both delivering projects on-time
and on-budget, as well as social and environmental responsibility.
Through its “develop-to-own” strategy, the Group has built a portfolio
of assets that is relatively young, with a weighted average asset age
(weighted by MW and calculated beginning on the assets’ respective
CODs) of two years and 3 months as of December 31, 2018, and, in
parallel, an average residual term for the power purchase agreements
(weighted by MW in operation) in excess of 15 years as from the
same date.
Neoen reinforces its “develop-to-own” strategy by either owning the
property on which its assets are located (for approximately a third of
its assets in operation by capacity) or entering into long-term leases
with durations of up to 99 years and typically 30-60 years (in each
case, assuming the exercise of all contractual lease extension options);
this enables it to upgrade its assets as they age in order to facilitate
their continued productivity, sign new energy contracts for them and
otherwise capture long-term value following the expiration of initial
PPAs. For further detail on Neoen’s approach to property ownership
and leases, see Section 1.5.7.1 “Land ownership and leases.”
A MULTI-LOCAL LEADERSHIP 1.5.2
APPROACH
Neoen takes an approach to geographic expansion that
complements its “develop-to-own” model.
The Group's objective is to develop a local presence in each of its
target markets, which are currently spread over three zones,
Europe-Africa, Australia and the Americas, while upholding its
international policy of keeping 80% of its operating capacity in OECD
member countries. The Group assesses the prospects of a new
market according to whether it is characterized by significant,
addressable energy needs and by reference to criteria that include the
following:
a geographical location with sufficient solar and wind resources to●produce green electricity at grid parity or below;
sufficiently stable political and economic environments and●favourable legal frameworks, including the ability to own all or a
majority of the assets it develops and operates;
the possibility of long-term off-take contracts with reliable●counterparties;
the availability of long-term non-recourse debt financing with local●or international lenders;
the availability of grid connections at acceptable costs;●
the ability to eliminate or minimise exchange rate exposure by●aligning project debt, capital expenditures and revenues in the
same stable currencies (as of the date hereof, in US dollars, euros
and Australian dollars);
the opportunity to become a leader in the local market;●
and opportunities to make economies of scale in the target market.●
Once the Group has identified a market that satisfies these criteria, it
enters the market mainly through participation in invitations to tender
(though from time to time it may also enter markets through bilateral
discussions with potential off-takers) that are managed from France
or by local teams. In the latter case, the local teams identify the
market’s specific needs and, in coordination with the Group’s
management in France, carry out the initial assessment and
development work in order to create a portfolio of projects in the
“advanced development” phase, ready for development in view of
tender opportunities as they arise. In each case, following its entry
into a new market, the Group then consolidates a local presence with
teams on site led by experienced project managers, some of whom
have already worked on other Group contracts. In certain cases,
these teams also work with local professional counterparts to gain a
better grasp of local norms and social structures, as well as legal and
administrative frameworks, quickly accumulating market knowledge
and enabling the teams to quickly respond to tender opportunities.
Local teams in the target market handle various aspects of project
management themselves, such as acquiring land rights and engaging
in local outreach, while benefiting from centralized technical support in
Paris for technical, procurement, industrial and financial know-how
and best practices that are shared across the Group. At the same
time, the local teams rely on external service providers, including
reliable local expertise, for aspects of project study and development
such as soil studies, environmental data and assessments, permits
and review of applicable tax consequences. By establishing these
teams on the ground and building local networks, Neoen is able to
learn about promising sites through early scouting; understand and
navigate constraints such as connection obstacles and site access;
appropriately assess relevant legal and logistical frameworks,
including taxes and fees; and form productive local relationships with
industrial partners and regulatory authorities. These advantages
contribute, in turn, to the high-quality conception of projects that form
an essential part of the Group’s “develop-to-own” strategy.
01Presentation
Operating Model
70 REGISTRATION DOCUMENT 2018
Once Neoen establishes a presence in a given local market, it focuses
on deepening and extending that presence through repeating
successful structuring processes for new projects to become a local
leader. The Group expands its team on the ground and gradually
transfers further autonomy to it. From an operational standpoint, the
Group’s solidified presence and local expansion results in economies
of scale, as a result of which it can negotiate better supplier terms.
More generally, by developing its own projects within the framework
of a multi-local leadership strategy, the Group is able to significantly
optimize project development and leverage the scale of its projects,
which in turn enables it to improve the competitiveness of its bids
while maintaining project profitability. At December 31, 2018,
approximately 80% of the Group's secure capacity was subject to
electricity sales contracts at prices below €90/MWh (at the exchange
rate in effect on December 31, 2018) and approximately 50% of the
Group's secure capacity were subject to contracts for the sale of
electricity at prices below €50/MWh (excluding, in each case, the
Dubbo Solar Hub project (which sells its electricity through spot sales
and green certificates only) and the storage activity (Hornsdale Power
Reserve).
Finally, by taking advantage of its scale and geographic diversification
and by bundling certain projects, Neoen is able to mitigate business
risks thanks to a robust portfolio, thereby reducing its cost of capital.
ASSET OWNERSHIP1.5.3
Consistent with its “develop-to-own” strategy, Neoen generally seeks
to be the sole owner of its assets, where practicable, with a view to
exercising the greatest possible degree of control over such assets.
At December 31, 2018, the Group held 86% of its assets in operation
and under construction (by MW), after taking the Group's share in
joint investments into consideration. In general, the Group targets sole
ownership of its assets to ensure that it can effectively maintain its
demanding quality standards and keep close control over asset
management. This framework enables Neoen to optimize its assets
operationally and industrially with shared systems and services and
uniform procedures, in addition to streamlining decision-making.
Moreover, sole ownership allows the Group to focus on a stable
long-term strategy for profitability based on developing high-quality
assets, instead of making decisions based on shorter-term
considerations.
limitations on asset ownership. For example, although Neoen
supervises the O&M provider for the Cestas plant on behalf of the
plant’s investors and owns the land on which it is located, French
regulations at the time of the project’s submission to the
open-window framework required structuring it such that the winner
would not be the site’s sole owner. This constraint is due to the fact
that the regulations at the time limited the size of sites via a
requirement stipulating that all inverters held by a single producer
must be a certain regulatory distance from each other.
In some cases, Neoen has chosen to share (minority) ownership of
projects with partners to facilitate its entry into a new market, or
where a local tender imposes a requirement for minority state entity
ownership. In instances where a business partner does not intend (or
has limited ability) to make or maintain an investment in a given
project, the Group agrees with the partner to structure ownership
such that Neoen has the option to purchase all or a portion of its
stake at financial closing for the project. In certain cases, Neoen
cannot be the sole owner of a given asset as a result of regulatory
PROJECT PLANNING 1.5.4
AND DEVELOPMENT
IDENTIFYING OPPORTUNITIES1.5.4.1
Neoen begins the overall development process with an initial
prospecting team that it assembles in a target market. Depending on
the targeted market, this team may be composed solely of Neoen
employees or it may include local third parties who can leverage their
knowledge on the ground to uncover opportunities and navigate local
complexities (such as permitting structures and stakeholder
management). This team prospects for sites. Once it identifies a site
with significant potential, the prospecting team obtains initial
preliminary studies from reputable third parties and performs initial
groundwork in view of obtaining permits and licenses.
As the team makes progress and receives feedback from its studies
and initial inquiries, it reports back to management. Management can
then evaluate whether a given opportunity possesses an appropriate
risk and reward profile to warrant further investment in early
development.
The ability to obtain detailed early information on project sites from its
own teams or local partners from the earliest stages provides Neoen
with the advantage of reducing ramp-up issues and helping to
overcome execution and project quality challenges that might
otherwise occur, particularly when the time between tender
announcements and bid deadlines is limited. Moreover, the Group is
able to conduct this preliminary work at a relatively low initial cost with
lean and efficient teams, thereby minimising its financial exposure to
the risk of the project being abandoned.
The initial cost is related to, among other elements, human resources,
travel and expenses, early technical studies, environmental impact
assessments and acquisition of permits and site control rights as the
project progresses through early development. These development
costs are borne by the Group and are capitalized in respect of
completed projects They may be depreciated or written off if a project
is postponed or abandoned.
Once the opportunity to secure a PPA arises, the Group shifts from
laying the foundations for its projects into more resource-intensive
project-execution mode, including through budgeting and finance
modeling.
01Presentation
Operating Model
71REGISTRATION DOCUMENT 2018
BIDDING FOR PROJECTS1.5.4.2
The tender opportunities that Neoen targets are structured in
frameworks that vary by both type of energy and country or state.
The particular features of each solar and wind tender are described
more fully in Sections 1.4.1.1 (ii) “Approach to solar energy project
development” and 14.1.1.2 (ii) “Approach to wind energy project
development” respectively. Neoen generally targets tenders that will
result in PPAs with robust counterparties because such PPAs provide
a long-term and relatively secure source of revenue, while transferring
price risk in exchange for limited counterparty risk. In addition, these
elements make it easier to obtain financing on favourable terms,
which enables the Group to improve its offers' competitiveness.
Tenders may be launched by both public entities and private
off-takers. Public entities include governments, who either organise or
back a given tender, and government-controlled entities such as state
or regional power companies. PPAs with such counterparties tend to
be longer in term, ranging from 15 to 20 years (and in some cases up
to 25 years). They are generally granted on the basis of price
considerations with little or no leverage in negotiations. For private
off-takers and distributors (utilities), these PPAs may be shorter in
term, ranging from 10 to 15 years, while providing greater leverage
when negotiating terms and conditions.
While the Group currently participates in bids for private PPAs more
rarely than in tenders launched by public entities, it considers private
PPAs to be a promising opportunity going forward. For further details
with respect to the types of PPAs to which the Group is a party, see
Section 1.5.6.1 “Power purchase agreements” of this document.
Neoen takes a disciplined approach to bidding for projects grounded
in its commitment to financial discipline. In order to assess potential
bids, Neoen conducts a modeling analysis based on generally
conservative assumptions that are backed by independent studies
when possible, validated by internal Neoen experts and presented to
an internal pricing committee for approval prior to bid submission.
These assumptions include the following, among others:
the project's yield is calculated over a period of 25 years (which●corresponds to the period over which the Group's solar and wind
power assets are depreciated in accordance with its applicable
accounting policies, although the recognised lifespan of the assets
is in general longer) and includes the yields anticipated from the
PPA, over its entire term, and, for any additional period, yields from
sales on the electricity spot markets subject to market risk; this
term is 10 years for energy storage and may also be shorter in
certain cases (off grid solar power plants, dependant on the
lifespan of the relevant mine);
market price and inflation assumptions based on independent●experts’ forecasts;
the production estimates are set at P50 (which means there is a●50% probability that the project will produce at least the predicted
capacity in a given year) based on energy efficiency assessments
made by independent experts, which are often the same used by
potential lenders;
the operating assumptions (including operating expenses), which●are largely aligned with the lender's assumptions; and
long-term financing with no refinancing risk and a cost of debt●based on initial letters of intent proposed by prospective lenders
(though final financing terms are set in negotiations following a
successful tender and the Group generally seeks to obtain better
terms than those that are initially proposed).
Beginning with these assumptions, the Group calculates a bid internal
rate of return (“Bid IRR”) for the proposed project to determine
whether it will earn a sufficient margin beyond the cost of project debt
to justify a bid given the relevant risks (in particular country risk). This
calculation is based on a reference market Bid IRR determined by a
specific Neoen pricing committee, composed of the Group’s
executive committee, a regional Finance Director, a regional
development director and a project manager. The Bid IRR takes into
account, among other things:
local costs, including taxes, local fees, network constraints and●related fees, in each case relying on available studies and due
diligence;
building costs using local experts and suppliers, taking into account●Neoen’s requirements for strong equipment quality and industrial
standards;
financing costs based on preliminary discussions with pre-vetted●prospective lenders; and
in most cases, a third-party financial advisor establishes an●estimate based on an appropriate financial model in order to
ensure that the project is profitable. which in certain cases is the
same model used for purposes of later financing due diligence by
lenders.
The Bid IRR the Group requires to invest in a project is set by
adjusting its reference market Bid IRR, in the first instance, to account
for inflation and to add a risk premium depending on the country in
which the project is located, resulting in a country-adjusted Bid IRR.
The country-adjusted Bid IRR is then further adjusted to account for
the nature of the PPA counterparty according to whether it is
sovereign or state, a private entity (with adjustments based on its
credit rating) or a market counterparty (with an additional risk
premium added). In the event that the off-take arrangement involves
multiple counterparties, the Bid IRR’s risk calibration and adjustments
are weighted according to the revenues expected from the relevant
counterparties. If the project reaches an acceptable Bid IRR
threshold, the Group launches its bid for the tender following regular
reporting and hypothesis validation and formalised price validation.
The Group does not model in its Bid IRR any potential variations in
IRR that may occur between the time of its offer and the financial
closing. Moreover, in line with its conservative approach, the Group
does not model in its Bid IRR certain IRR improvements that may
come about after the financial closing. Between the bid and financial
closing, the Group’s project IRR may vary due to:
fluctuations in interest rates or exchange rates;●
changes in the terms of EPC contracts and O&M between the time●of the initial proposals and the final contracts, and the possible
differences between the financing terms agreed and lenders' initial
letters of intent.
01Presentation
Operating Model
72 REGISTRATION DOCUMENT 2018
Following financial closing for its projects, the Group believes that the
following potential IRR upsides are available:
cost optimisation;●
project debt refinancing on more favourable market conditions;●
extended project lifetimes going beyond the Group's in-house●estimates for a useful lifespan of 30 years for solar or wind assets
(even if the Group depreciates and assesses the profitability of such
assets over 25 years);
the replacement of its projects;●
the integration of storage solutions to improve the operational●performance of the Group's projects;
and, finally, additional benefits resulting from the Group's strategy●of maintaining long-term projects on land owned by it or for which it
has obtained long-term leases for as long as possible.
DEVELOPING PROJECTS1.5.4.3
The specific features of project development depend significantly on
the type of energy to be produced by the project and the
country/region in which the project is to be developed. Additional
details relating to solar and wind power and energy storage projects
are provided respectively in Sections 1.4.1.1. (ii) “Approach to solar
energy project development”, 1.4.1.2 (ii) “Approach to wind energy
project development” and 1.4.1.3 (vi) “Approach to energy storage
project development”.
In general, Neoen fully structures its projects (building on and
completing its early development work) as soon as it has been
awarded a tender. This structuring involves several aspects, including
but not limited to the following:
obtaining permits and authorisations at the local and state level●(though in certain jurisdictions, such as France under the currently
applicable regime, the relevant building permit or construction
authorisation must be obtained before a bid is made);
sourcing engineering, procurement and construction (“EPC”) and●O&M with high-quality EPC and O&M contractors and negotiating
full-fledged contracts;
sourcing non-recourse project finance debt and organising security●packages; and
hedging interest rate exposure and any foreign exchange rate●exposure (e.g., between the currencies in which the Group pays its
construction expenses and the currency of the Group’s project
finance debt) that may exist for the period beginning when the
Group enters into its project financing and ending at financial
closing.
by working with repeat partners and replicating structuring in the
same countries, Neoen is able to facilitate accelerated project
structuring. In addition, for countries with mature spot pricing markets
or in the context of PPAs, where the Group may structure its bids in
order to benefit from more attractive spot pricing before a given
PPA’s term commences, reduces (“time to market”) for a project
enables increased early generation revenues for this project. The
Group is therefore able to create significant value from its accelerated
structuring processes.
The time required for such structuring (in particular between initial
contact with the relevant lender and financial closing) depends on the
market in which the project is being built. In a mature market such as
Australia, less time is required than in less mature markets such as
certain African and Latin American countries, notably when financing
has been guaranteed or arranged by development banks. The Group
is always seeking to reduce a project's (“time to market”) as much as
possible and, in this respect, believes that its advance work on
development aspects is helpful at a later date. Furthermore,
Outside of France, these efforts are undertaken by numerous
elements of both Neoen’s team and carefully selected third parties; A
project development manager within the Group oversees the
structuring of the project and coordinates the various teams including
the procurement team and the legal, technical and financing
specialists. to structure development in collaboration with external
lawyers, engineers, tax specialists, financial advisers and others. The
specifics of project management are handled by the relevant Neoen
development team under the project manager, who reports regularly
to senior management. In France, because of the smaller size and
larger number of projects, their structuring is handled by dedicated
Neoen teams according to a set process and defined set of
responsibilities.
From an operational standpoint, project development teams hand off
projects to construction teams, who in turn hand off projects to
operations teams. On the administrative side, the relevant financing
team hands over debt management to a financial controlling team at
the appropriate time.
PROJECT CLASSIFICATION1.5.4.4
Neoen tracks project development according to a defined set of
categories, as projects move through their lifecycle from initial
planning to COD. The Group defines each of these categories across
geographies and for both solar plants and wind farms as follows:
“Early stage”. A project (i) located on land with respect to which the●owner has confirmed his or her intention to agree a contract with
the Group for the applicable land rights, (ii) in proximity to an
electric grid to which the project may be connected and (iii) for
which technical studies have been initiated but not yet finalized.
“Advanced development”. At this stage the following elements are●expected to be completed:
1. Real-Estate: signature of a contract validating the use of the●land;
2. Access to the electricity grid: preliminary grid connection;●
3. Technical: completed pre-design engineering.●
“Tender-ready”. A project that has either:●
1. a building permit has been obtained and all the conditions●precedent to the signing of an electricity sales contract have
been fulfilled in a country which:
a) has a renewable energy development program through●recurrent tenders, or
b) has a liquid market for electricity sales contracts with●private companies.
01Presentation
Operating Model
73REGISTRATION DOCUMENT 2018
As of the date of this document, the countries meeting one of these●two conditions are France, Australia, Mexico and Argentina; or
2. feed-in tariffs are available and a building permit application●has been submitted;
Based on such criteria, once a project reaches the tender-ready●stage, it will not be reclassified to a less advanced stage as long as:
3. the market dynamics of renewable energies in the country in●question remain unchanged; and
4. the requirements for obtaining an electricity sales contract●remain the same;
Projects in “advanced development” phase and projects in
“tender-ready” phase constitute the “advanced pipeline”.
Projects in “advanced development” that win a tender through
a competitive auction process are classified as “awarded”
projects without being first classified as tender-ready.
“Awarded”. The primary authorisation request for the project (the●relevant building permit for a solar project and the relevant
environmental permit for a wind project) has resulted in a positive
outcome and is no longer subject to an appeal, and there is a
guaranteed off-take once the project is built, or the project has won
through a competitive auction process. At this stage, certain
additional licenses may be required as long as the Group judges
them to be secondary to the applicable primary authorisation.
Depending on what could be achieved during the initial
development phase, land procurement and additional studies may
also be underway. Discussion and contracting with an EPC, as well
as project financing negotiations, are usually completed during this
stage.
“Under construction”. The notice to proceed (“NTP”) has been●given to the relevant EPC contractor. The asset will remain in this
category until the provisional acceptance has been signed, even if
the plant has begun producing and selling energy.
“In operation”. The provisional acceptance has been signed.●Responsibility for the asset has been handed over by the
construction team to the operations team.
Projects in “awarded” phase, projects under construction and
projects in operation form the “secured portfolio”.
The Group has had considerable success in converting
“tender-ready” projects into “awarded” projects either by winning
tenders or successfully obtaining feed-in tariffs or feed-in premiums in
open-window frameworks. During the 2015 to December 31, 2018
period, the Group's projects with a total capacity of 2.5 GW won
tenders or obtained open-window feed-in tariffs or additional
compensation.
reaching a “bankable” agreement on the PPA with a private
counterparty. Construction work on these projects had not started.
Moreover, since the creation of the Group, only two projects in the
“awarded” phase have ever failed to reach the “under construction”
phase and had to be abandoned. The first one, in Egypt (50 MW), for
reasons relating to unexpected changes to the terms of the project's
PPA, and the second, in Jordan (34 MW), due to the impossibility of
Finally, the possibility of moving directly from the “tender-ready” stage
to the “under construction” stage for projects whose electricity is to
be sold on the spot market must be emphasised.
PROJECT FINANCING1.5.5
PROCESS1.5.5.1
Once a project in development is sufficiently well-advanced, the
Group begins a market-surveying process with lenders in view of
obtaining competitive financing as well as configuring bids for
anticipated tenders. After obtaining a PPA, the Group proceeds to put
in place the project financing in a detailed and structured process
involving extensive lenders’ due diligence and contract negotiation.
For these negotiations, the Group relies on its centralized financing
and legal team in Paris for all contracting done outside of Australia,
where the Group has a separate financing team.
STRUCTURE AND SCOPE1.5.5.2
The Group structures its project financing by forming a special
purpose vehicle for each of the projects it develops. In certain cases,
the overall project will be owned by more than one SPV. The financing
arrangements relate either to individual projects or to groups of
projects. In particular, in France, where projects are small in size, the
Group bundles multiple projects together in order to obtain financing
on more favourable terms than would otherwise be available had the
financing been negotiated on a project-by-project basis, thanks to the
increase in power production volumes (and, therefore, in income) and
to the reduction in risk achieved by cross-guarantees between project
companies and the diversification of resources. For example, the
Group syndicated 21 projects in France in October 2016 to obtain
approximately €240 million of financing for a duration longer than that
of the electricity sales contracts in those projects and at lower interest
rates (1.70% and 1.80% per year for the wind and solar projects,
respectively, benefiting from feed-in tariffs). In February 2019, the
Group entered into a new senior debt financing programme for wind
and solar projects in France, which reached close to one
hundred million euros.
In all cases, the financing subscribed by the Group on behalf of each
SPV and each intermediate holding (in the case of project syndication)
is without recourse to the assets of the Company or the assets of the
Group's other entities.
When financing conditions are favourable, the Group may
opportunistically refinance assets to improve project IRR and
financing terms. For example, the Group refinanced €249 million in
project debt for its solar power plant in Cestas, which approximately
doubled the facility's IRR on equity just two years after it was
commissioned.
01Presentation
Operating Model
74 REGISTRATION DOCUMENT 2018
LEVERAGE/GEARING1.5.5.3
Each project is financed at the SPV (or holding entity, in the case of
bundled projects) level via senior debt (with exceptional cases of
tranched mezzanine financing), together with a portion of equity
financing provided by the Group’s parent company (and minority
investors in certain cases).
The type of counterparty lender in these arrangements depends on
the relevant market:
in developed markets, the Group has established strong●relationships with a pool of “relationship” banks such as KfW Ipex,
Société Générale, Groupe BPCE and BPI France, while maintaining
the flexibility to choose between lenders based on the
attractiveness of their financing proposals;
in developing markets, the Group works with development banks in●addition to partner banks. These lenders include, for example,
Proparco, Inter-American Development Bank, the International
Finance Corporation (part of the World Bank) and the Overseas
Private Investment Corporation.
Loan conditions, and in particular the level of indebtedness of a
particular project, depend on various factors, such as the expected
cash flows, the project location or the financial counterparty and
market risks.
Based on these and other factors, the lenders will determine the
minimum debt service coverage ratio, i.e., the maximum amount of
the project’s projected cash flows that they are prepared to finance.
In certain cases, principally in less mature markets involving
development bank lenders, the lenders will also require a maximum
gearing ratio so as to ensure a minimum percentage of equity in the
relevant project.
PROCUREMENT AND CONSTRUCTION1.5.5.4
Outside of France, construction itself generally begins after financial
closing has been completed. In France, construction may begin prior
to financial closing (where a series of projects is anticipated to be
bundled into packages for financing purposes) but only after the
relevant permits are secured and a tender has been awarded. Project
construction is handled by a dedicated construction manager who
takes over from the project's development manager.
At December 31, 2018, the Group had 17 project managers, eight of
whom were working on European projects and based in France, and
the other nine on non-European projects located outside of France.
The project manager’s responsibilities include all construction and
technical aspects of the project from the moment that the NTP
(“notice to proceed”) is delivered to the EPC contractor, until the
hand-off of the asset to the asset manager, as well as the
management of relationships with project stakeholders.
In the context of these assignments and as required, the construction
manager is supported by the Group's legal, finance and development
teams.
The construction of solar plants and wind farms is implemented under
Neoen’s supervision as follows:
contractual commitments. The EPC contractor is selected on a
project-by-project basis, generally through a bidding process or a
similar arrangement, with the Group targeting partnerships with
specialised, financially sound contractors to ensure credible
guarantees. Neoen negotiates with the contractor with respect to
the purchase price and the contractor’s mark-up for modules and
inverters, which are integrated into a full-scope contract together
with other commercial terms relating to the technology to be used
in the project. In general, the Group verifies the choice of all other
components and defines the specifications. Moreover, the Group
focuses on the bankability of the relevant technology and working
with EPC contractors who can provide bankable guarantees in line
with project finance lenders’ expectations.
Solar Plants. Construction of solar plants is carried out by the●relevant EPC contractor, such as Eiffage or Bouygues, pursuant to
Depending on the nature of the project, a single supplier of solar
panels or multiple suppliers may be used (as is the case with
Cestas). The EPC contractor generally assumes delay and
performance risks with corresponding liquidated damages
clauses.
In France, where a typical solar project will have an average
capacity of approximately 10-12 MW, the construction period
between the NTP and the COD is generally 6-8 months. In other
countries, the construction period is generally between 8 and 12
months and may be even longer in some markets (for example, in
Argentina, this period is estimated to be around 15 months);
Wind Farms. The Group selects a turbine supplier through a●bidding process in line with its project-by-project procurement
approach, with whom it signs a turbine supply agreement (“TSA”)
for the supply, transportation, installation and commissioning of
wind turbines. Apart from turbines, the wind farm is built by a civil
engineering and construction company according to the terms of a
construction contract and a contract for the provisions of other
system components or BOP contract, the scope of which includes,
among other things, roadworks for the site, building and managing
of construction sites, the construction of foundations and works for
connection to the ground network (building delivery stations,
digging trenches and handling cabling) to connect the turbine to
the ground. The turbine manufacturer and BOP contractor each
assume similar contractual risks to those allocated in solar
contracts relating to delays and performance.
In France, the construction period is generally 9-10 months,
divided equally between (i) the civil works and (ii) the wiring,
assembly and commissioning of the wind turbine. In other
countries, where wind farms are significantly larger, with
capacities of 100 MW or more, the construction period is
generally between 12 and 18 months.
For each of the assets that the Group constructs, it sets aside a
contingency budget to cover unexpected costs incurred in the course
of construction. The amount of this contingency budget is typically
between 2-5% of the project’s total capital expenditures.
The grid connection process is initiated from the moment that Neoen
is awarded a tender (and may begin earlier, in certain cases, where a
project is sufficiently mature to justify it) and continues through the
construction process until the asset’s COD.
01Presentation
Operating Model
75REGISTRATION DOCUMENT 2018
The relevant project manager is responsible for grid connections for
solar and wind projects in France. Internationally, grid connection is
usually the responsibility of the EPC contractor, with close supervision
by the relevant construction manager. As part of the development
process, the Group typically enters into a grid connection agreement
with the local grid operator and makes arrangements for the
construction of a transmission line. Depending on the jurisdiction and
applicable regulations, the Group may also need to secure easements
and land rights for the transmission line from the solar plant or wind
farm to the grid connection point. The proactive management of the
grid connection process is essential if projects are to be built on time
at an acceptable cost.
In implementing construction, Neoen relies on third parties on a
project-by-project basis relating to industrial choices for EPC matters,
modules, inverters turbines and BOP and BOS management, among
others. These partnerships are established through a competitive
procurement process with a focus on top-tier counterparties.
The Group generally does not sign multi-project master agreements
despite the fact that certain contractors' focus on quality leads to
certain commercial partnerships being renewed, mainly with major
construction groups such as Eiffage, Bouygues Energies & Services
and TSK.
Neoen’s centralised contracting team in Paris (with additional
personnel expected to join in Australia) negotiates the agreements
with EPC and BOP contractors. The contract team develops
contracts adapted to the project and geography that are designed to
provide Neoen with a high level of protection while being as
consistent as practicable across projects and markets.
OPERATING ASSETS1.5.5.5
In line with this “develop-to-own” strategy, the Group pays strong
attention to the long-term performance and state of its assets. Neoen
outsources the maintenance of each asset under protective,
long-term, full-scope O&M contracts, and negotiates contractual
guarantees from the O&M provider with respect to availability and
compensatory payments in the event availability falls below specified
minimums, as well as other performance guarantees. As a general
rule the Group's O&M contracts have a minimum duration of 10 years
and include options for expansion under pre-approved conditions that
can be activated by the Group. The O&M suppliers are generally the
same as those involved in building (solar) assets and supplying (wind
farm) equipment.
Asset management and operation following project completion are
facilitated by:
the Group's internal expertise, which includes an operations control●centre in Paris and a local control room in Canberra, and Group
asset managers who oversee a defined portfolio;
continuous monitoring, supervision and analysis, which is provided●in part by the Group’s own asset managers with internal IT tools,
and in part by external service providers who oversee the assets
twenty-four hours a day, seven days a week; and
O&M services from external providers (who act as the day-to-day●managers on-site) on the basis of full-scope agreements with
performance guarantees, implementation of continuous
improvement and best practices according to the ISO 55000
approach and rolling and periodic reviews with peer performance
comparisons.
The asset manager is located close to, and has a deep understanding
of, the asset and its site. He is tasked with supervising technical
matters and drafting a detailed management plan concerning the
asset.
The specific implementation of key management responsibilities is
described in more detail below:
Production management. Production management consists of a●reporting section on the one hand, and a planning and control
section, on the other. The reporting section includes daily, monthly,
quarterly and yearly reports that track asset performance. The
frequency of the reporting depends on the asset's performance
measurement but includes such metrics such as load factor,
consolidated revenue, production output, shortfalls (if any), losses
in quantity or quality, key performance indicators (“KPIs”) such as
availability and performance ratios and significant event analysis
and feedback, among others;
Planning and control. A management plan is put into place that●maps every step (whether technical, administrative, commercial or
otherwise) needed to effectively and efficiently operate the relevant
asset. Control with respect to suppliers is structured around
monthly O&M contractor reviews.
In addition, Neoen conducts annual evaluations of its O&M
contractors in which it provides feedback on asset and
operational performance, together with an assessment of the
relevant O&M contractor against other contractors according to a
defined set of objective standards;
Maintenance management. Neoen organises and deploys●preventive and corrective maintenance for all of its assets.
Preventive maintenance is defined, in terms of substance and●frequency, in the relevant O&M contract, and the Group’s
asset managers closely supervise the implementation of
maintenance measures by the O&M contractor to ensure their
effectiveness and consistency. Maintenance actions are
planned quarterly or, if there is more limited need for such
maintenance, annually. All such actions are systematically
recorded through closely tracked monthly maintenance reports
tailored to the type of asset (solar, wind or energy storage).
Corrective maintenance obligations are also contractually●defined, with the O&M contractor responsible for plant
supervision (including rapid response to any alarms), corrective
action online or on-site and reporting on incidents in a manner
that permits their duration and any related losses to be tracked
for the purposes of availability calculations. For wind turbines,
the Group also implements tracking of mean time to repair
(“MTTR”) and mean time between failures (“MTBF”) to monitor
performance. In addition to its other responsibilities, the O&M
contractor manages each asset’s dedicated spare parts stock,
with used equipment replaced by the O&M contractor at its
own expense;
01Presentation
Operating Model
76 REGISTRATION DOCUMENT 2018
Performance management. Neoen tailors its performance●management metrics and approach to the type of asset,
depending on whether it is a wind or solar asset.
Solar asset performance is assessed according to three KPIs:●solar resource (the availability and capacity of solar energy to
which the plant has access), performance (the percentage of
the targeted electricity output that is actually produced), and
availability. Solar plant performance analysis involves a review
of plant incidents and lessons learned; production
comparisons between inverters (which convert variable direct
current output of a solar panel into a utility-frequency
alternating current that can be fed into the relevant electric grid)
and alarms; and “soiling” analysis, which examines limitations
on panel performance due to dirt.
analysis focuses on a breakdown of technical losses from
certain defects, failures or other problems; a capacity curve
analysis; a comparison of turbine effectiveness; and incident
analysis and lessons;
The performance of wind farms is assessed primarily on the●basis of availability, whether in terms of time or energy, in
accordance with the applicable O&M contract. Wind farm
Cost management. Neoen has entered into primarily long-term●contracts with respect to maintenance, rent and insurance for its
assets, which account for approximately 85% of technical
operational expenses for its solar assets and approximately 87% of
technical operational expenses for its wind assets. The long-term
nature of these contracts permits Neoen to negotiate competitive
terms and limit costs. At the same time, Neoen targets additional
cost savings through contract renegotiation where feasible, in
particular for solar assets, for which O&M costs have declined
significantly in recent years;
HSE management. The HSE management system at Neoen is●tracked via monthly reporting. For more details on HSE, please see
Chapter 5. “Sustainable development and social responsibility”.
ELECTRICITY SALE CONTRACTS1.5.6
Neoen sells the electricity produced by its assets either (i) under PPAs short-term contracts or (iii) bilateral spot sale agreements with respect
with primarily public off-takers and utilities, with a limited number of to green certificates. The principal features of these arrangements are
private-party PPAs, (ii) on the spot market at market prices or under summarized below.
POWER PURCHASE AGREEMENTS1.5.6.1
Power purchase agreements under the contract for difference scheme via public tender and open-window frameworks
The bulk of the Group’s electricity sales are made pursuant to PPAs an increasing number of the public tenders currently being targeted
agreed after public tenders, offering a feed-in tariff for periods of by the Group involve the signature of contracts for difference as
between 15 years (French wind power) and 20 or even 25 years. described below. The Group’s first project under a CFD-based PPA
However, as renewable energy has become increasingly competitive, entered into operation at the end of the first half of 2018.
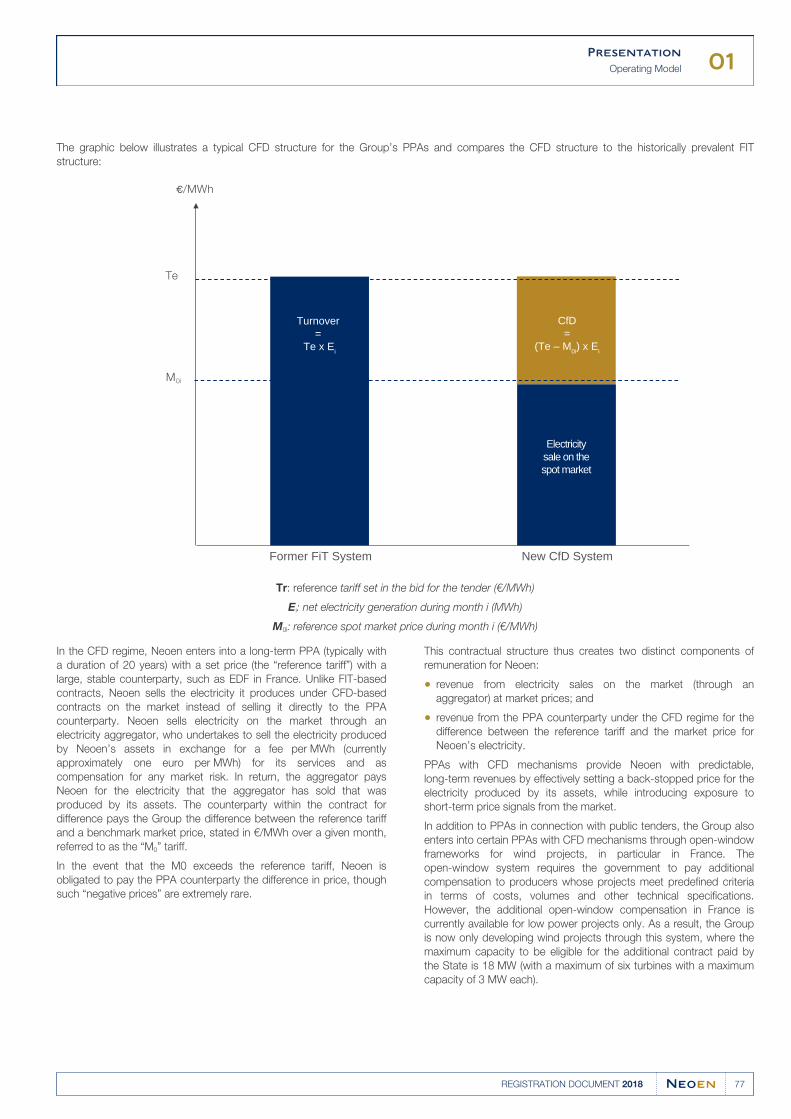
01Presentation
Operating Model
77REGISTRATION DOCUMENT 2018
The graphic below illustrates a typical CFD structure for the Group’s PPAs and compares the CFD structure to the historically prevalent FIT
structure:
New CfD System
Turnover =
Te x Ei
CfD =
(Te – M0i) x Ei
Electricitysale on thespot market
/MWh
Te
M0i
Former FiT System
Tr: reference tariff set in the bid for the tender (€/MWh)
Ei: net electricity generation during month i (MWh)
M0i: reference spot market price during month i (€/MWh)
In the CFD regime, Neoen enters into a long-term PPA (typically with
a duration of 20 years) with a set price (the “reference tariff”) with a
large, stable counterparty, such as EDF in France. Unlike FIT-based
contracts, Neoen sells the electricity it produces under CFD-based
contracts on the market instead of selling it directly to the PPA
counterparty. Neoen sells electricity on the market through an
electricity aggregator, who undertakes to sell the electricity produced
by Neoen’s assets in exchange for a fee per MWh (currently
approximately one euro per MWh) for its services and as
compensation for any market risk. In return, the aggregator pays
Neoen for the electricity that the aggregator has sold that was
produced by its assets. The counterparty within the contract for
difference pays the Group the difference between the reference tariff
and a benchmark market price, stated in €/MWh over a given month,
referred to as the “M0” tariff.
In the event that the M0 exceeds the reference tariff, Neoen is
obligated to pay the PPA counterparty the difference in price, though
such “negative prices” are extremely rare.
This contractual structure thus creates two distinct components of
remuneration for Neoen:
revenue from electricity sales on the market (through an●aggregator) at market prices; and
revenue from the PPA counterparty under the CFD regime for the●difference between the reference tariff and the market price for
Neoen’s electricity.
PPAs with CFD mechanisms provide Neoen with predictable,
long-term revenues by effectively setting a back-stopped price for the
electricity produced by its assets, while introducing exposure to
short-term price signals from the market.
In addition to PPAs in connection with public tenders, the Group also
enters into certain PPAs with CFD mechanisms through open-window
frameworks for wind projects, in particular in France. The
open-window system requires the government to pay additional
compensation to producers whose projects meet predefined criteria
in terms of costs, volumes and other technical specifications.
However, the additional open-window compensation in France is
currently available for low power projects only. As a result, the Group
is now only developing wind projects through this system, where the
maximum capacity to be eligible for the additional contract paid by
the State is 18 MW (with a maximum of six turbines with a maximum
capacity of 3 MW each).
01Presentation
Operating Model
78 REGISTRATION DOCUMENT 2018
Privately negotiated power purchase agreements
Neoen also enters into private PPAs with certain sophisticated
off-takers, such as specialized energy companies or private off-takers
with specific energy needs. These contracts are usually for a specified
amount of electricity, at contractually defined prices, which is
delivered directly or indirectly to the private PPA counterparty. The
quantities of electricity to be delivered pursuant to such PPAs are
generally less than for the large public tender projects that the Group
usually targets. Such PPAs currently represent a relatively small
percentage of the Group’s portfolio in operation or construction.
However, the Group aims to increase private electricity sales
contracts in the coming years in order to up its revenues, reduce its
dependence on electricity sales contracts signed with public
counterparties and obtain greater flexibility in establishing price
structures and conditions than in public tenders.
FEED-IN TARIFFS1.5.6.2
Certain PPAs that the Group entered into in connection with past
tenders or via the open-window framework submissions were based
on the mandatory FIT mechanism (as of the date hereof, for the
Group, exclusively in France). In FIT contracts, Neoen delivers
electricity directly to an off-taker and is paid a reference price, set in
advance under the tender or open-window framework, as applicable,
for all of the electricity produced by Neoen’s asset for the FIT
contract, regardless of market price. FIT contracts were used as a
means to encourage investment in renewable energy when it was
relatively expensive to produce solar and wind power.
WHOLESALE AND SPOT-MARKET SALES 1.5.6.3AND SHORT-TERM CONTRACTS
Neoen supplements its PPA revenue, which forms the bulk of its
overall revenue, with sales of energy into (i) spot markets, in particular
in markets where electricity from its renewable assets is below grid
parity and can be sold at a significant profit or (ii) under short-term
electricity purchase contracts that may be entered into in advance of
the start date of long-term PPAs, and which generally provide for
fixed prices that exceed those for long-term PPAs. Neoen sells
electricity via spot market sales and short-term contracts for the
following reasons:
Pre-COD revenues. Neoen generates revenues from certain of its●assets’ initial electricity production before the entirety of a given
asset is fully operational. This is in particular the case for the
Group's wind farms, where the wind turbines are progressively
connected to the grid and where one or more wind turbines can
start to generate electricity before the commercial operation date
(COD) for the wind farm as a whole. During this period, the Group
may sell on the spot market the electricity produced by the portion
of the asset that is already in service pending the connection to the
grid of the rest of the facility. though such revenues tend to be
limited in amount given the relatively short construction timeframes
for the Group’s assets;
Early generation revenues. For timing and strategic reasons, the●Group may launch the construction phase of a project prior to
signing one or several PPAs covering the entire production capacity
of a project. Therefore, the Group sometimes begins the
construction of the project and agrees sales on the spot market
while identifying potential PPAs for use by the plant in the long
term, which guarantees the profitability of the plant while ensuring
that it remains ready to seize all opportunities to sign PPAs as they
arise. In other instances, in particular in countries with developed
spot-price markets, the Group aims to time its project development
and bidding to take advantage of relatively predictable spot-market
pricing for a set period before the asset’s PPA term begins where
the market price exceeds the PPA price. Alternatively, the Group
may enter into pre-PPA short-term contracts to obtain revenues at
favourable fixed prices. This enables the Group to boost the
profitability of the project while targeting a locked-in PPA price at
an optimal point later on;
Supplementing PPA revenues. Because certain PPAs are●entered into for a set amount of electricity, Neoen will typically build
a solar plant or wind farm with an additional buffer capacity and use
targeted market sales to supplement contracted revenues;
Deploying excess battery capacity. To a limited extent, Neoen●strategically sells electricity stored in its energy storage assets on
the market when demand is higher at given times of the day (such
as noon time or evenings, for example) after having purchased the
stored electricity at times of lower demand (e.g., at night). In
addition, certain events may increase the price of energy and
provide an arbitrage window for sales at elevated prices. While
infrequent, these sales provide a way to productively deploy
available battery capacity.
01Presentation
Property, plant and equipment
79REGISTRATION DOCUMENT 2018
CAPTURING TERMINAL VALUE BEYOND POWER PURCHASE AGREEMENTS1.5.7
LAND OWNERSHIP AND LEASES1.5.7.1
Neoen is the owner of the land on which its assets are located or
installed for a minority of projects (27% by MW for projects in
operation as of December 31, 2018). Where it is not the owner of the
land, Neoen generally has long-term leases that often include
extension options (for total terms (including the applicable extension)
as long as 99 years, though typically for 30-60 years), which exceed
the duration of the initial PPA for the assets located on that land.
Almost all of those extension options can be called at the Group's
discretion. Assuming the exercise of all such options, the Group’s
average lease term (weighted by MW) amounts to approximately
55 years. As of the date hereof, ownership and long-term leases
enable the Group to generate long-term value from its assets by
giving it the flexibility to upgrade its assets over time, to sign new
PPAs for such assets following the expiration of their initial PPAs. For
more information on real estate and leases, please see Section 1.6.2
“Assets held or occupied by the Group”.
REPOWERING PROJECTS1.5.7.2
Over the life of a given asset, equipment productivity will eventually
deteriorate. For example, solar panels degrade over time with use,
and their efficiency in converting sunlight into electricity erodes as a
result. Beyond its active maintenance management, Neoen plans to
upgrade and replace such equipment as renewable energy
technology continues to improve. It refers to this process as
“repowering” its assets, enabling them to maintain or exceed previous
productivity levels. Repowering assets allows them to be redeployed
for profitable electricity sales at market rates or subsequent PPAs
following the expiration of existing contracts, without the significant
expense and time required to build a new project from the ground up.
PROPERTY, PLANT AND EQUIPMENT1.6
At December 31, 2018, the net value of property, plant and
equipment held by the Group amounted to €1,703 million compared
with €1,249 million at December 31, 2017. For a description of
property, plant and equipment, see Note 15 to the Consolidated
Financial Statements in Section 4.1 “Financial statements for the
financial year ended December 31, 2018” of this document.
fixed assets such as land acquired by the Group for the construction
of its facilities, structuring costs at the time of implementation,
borrowings used to finance the assets until the projects are
commissioned, or the right to use the land following the application of
IFRS 16 (see Note 3.a to the Consolidated Financial Statements in
Section 4.1 “Financial statements for the financial year ended
December 31, 2018” of this document).The Group's property, plant and equipment consists mainly of
production assets held by the Group and, to a lesser extent, other
THE GROUP'S GENERATION ASSETS1.6.1
As of December 31, 2017 and December 31, 2018, solar, wind, and equipment, respectively. For information on the solar, wind,
biomass projects and energy storage assets under construction or in biomass farms and storage assets held by the Group, the reader may
operation represented 99% and 93% of the Group’s property, plant refer to Section 9.5 “Project details” of this document.
REAL ESTATE ASSETS OWNED OR OCCUPIED BY THE GROUP1.6.2
The real estate assets owned by the Group essentially consist of land
acquired by the Group for the construction of its projects. As of the
date of this Registration Document, the Group owns the following
sites:
through the intermediary of Providencia Solar SA de CV, several●properties, valued at approximately €3.6 million as of December 31,
2018, on which the Providencia Solar park is located:
four plots of land located in El Pedregal, in the El Rosario●municipality of the department of La Paz, El Salvador, with a
surface area of 87 ha, 1 ha, 79 ha and 20 ha, respectively,
a plot of land located in Santiago Nonualco, in the El Rosario●municipality of the department of La Paz, El Salvador, with a
surface area of 3 ha;
through the intermediary of SCI Constantinus, a plot of land located●in Cestas in France, with a surface area of 260 ha, valued at
€2.3 million as of December 31, 2018, on which the solar plants of
Cestas are located;
01Presentation
Material contracts
80 REGISTRATION DOCUMENT 2018
through the intermediary of Numurkah Solar Farm Pty Ltd., a plot of●land valued at €3 million as of December 31, 2018, on which the
solar plant of Numurkah is located;
through the intermediary of Capella Solar and Jiboa Solar, plots of●land with a surface area of 331 hectares valued at a total of
€5.8 million as of December 31, 2018, on which the solar park of
Capella is located;
through the intermediary of Hornsdale Asset Co, a plot of land●located in Hornsdale in Australia, with a surface area of 11.5 ha, on
which are located cables and buildings used for maintenance
services (O&M services) for the Hornsdale wind farms;
Through the intermediary of SPV ENR AGS SA several properties
located at El Llano in Mexico with a total surface area of approx.
59 hectares, valued at a total of approx. €1.2 million as of
December 31, 2018.
When it does not own the land on which its projects are developed,
built and then operated, the Group secures the availability of the sites
by entering into leases and lifelong or equivalent leases with the
landowners, thus conferring long-term real property rights to project
SPVs.
In addition, in conducting its business activities, the Company leases
administrative buildings and offices, including:
the Company’s registered office, located at 6 rue Ménars, 75002●Paris, which is leased by the Company to Exane under a sublease
agreement entered into on May 23, 2018, effective from June 15,
2018 for a term of three years, i.e., until June 14, 2021; and
a regional office located at 860 rue René Descartes, 13100●Aix-en-Provence, which is leased by the Company under a
commercial lease entered into on January 22, 2016 effective from
January 1, 2016 and for a term of nine years, i.e., until
December 31, 2025.
In 2018, the Company leased offices from its main shareholder,
Impala SAS, as well as from Eiffel Investment Group SAS, an affiliate
of Impala SAS. These contracts both ended on August 29, 2018.
The rent payments related to the above contracts amounted to
€331,791 for the year ended December 31, 2017 and €873,312 for
the year ended December 31, 2018.
Lastly, certain of the Group’s subsidiaries occupy premises located
outside of France, namely in Australia (Sydney, Canberra and soon
Melbourne), Portugal, Mozambique, Zambia, Jamaica, El Salvador,
Mexico and the United States. The rent payments for these contracts
amounted to approximately €332,000 for the year ended
December 31, 2017 (based on applicable exchange rates as of
May 31, 2018) and €533,000 for the year ended December 31, 2018.
MATERIAL CONTRACTS1.7
As of the date of this Registration Document, no contract (aside from exception of the contracts described in Section 1.4 “Neoen's
the contracts entered into in the ordinary course of business) business”, in Section 2.2 “Liquidity and capital resources” and in
containing provisions imposing a significant obligation on any of the Section 8.4 “Statutory auditors' special report on regulated
Group's companies or commitments for the Group as a whole, has agreements and commitments” of this Registration Document.
been entered into by the Company or any other Group entity, with the
INTELLECTUAL PROPERTY1.8
RESEARCH AND DEVELOPMENT1.8.1
The Group’s business consists of developing and overseeing the
operation of renewable energy plants that generate electricity, the
construction of which is financed in part by debt that is non-recourse
other than to the relevant project SPV’s assets, securities and
shareholders’ current account, or project-specific assets of
intermediate holding companies (in certain exceptional cases, the
Group cross-collateralizes a bundle of projects to obtain better
financing terms), and in part by equity contributions. This financing
structure depends on the near-exclusive use of reputable suppliers
and tested technologies. See Section 2.2 “Cash and Cash
equivalents and Equity” of this document for an outline of the Group's
financing policy.
The Group’s research and development (“R&D”) activities are based
on partnerships with companies operating in the fields of innovative
solar energy, energy storage and production forecasting. These
partnerships involve:
selecting products and counterparties that are well-positioned in●their markets, based on innovative technologies that the Group
believes can improve the competitiveness of its solar, wind,
biomass and energy storage plants;
working to develop the technology and the research units and/or●the manufacturing processes of proposed suppliers.
01Presentation
Intellectual property
81REGISTRATION DOCUMENT 2018
For each partnership, the Group enters into an agreement relating to
joint efforts on one or more projects, but does not impose
commitments upon the Group beyond the agreement’s defined
scope. For example, the Group reached an agreement with Tesla with
respect to the storage solutions the Group sought to implement at the
Hornsdale Power Reserve.
As a result, the Group does not finance specific R&D research, except
for development costs for its various solar, wind, biomass or energy
storage projects.
Further, even though it is not specifically a R&D activity, the Group
created its own competence centre, with 3 people whose work
includes identifying and monitoring new technologies to reduce the
cost of the energy produced for new projects, improve the yield of
existing projects, or the competitiveness of energy storage.
Lastly, the Group takes technological innovation into account in its
project development, particularly when it is a criterion in tenders.
For example, in connection with the Hornsdale facility in Australia,
the Group financed the construction of a hydrogen plant on behalf of
the city of Canberra to develop hydrogen-powered vehicles.
INTELLECTUAL PROPERTY1.8.2
INTELLECTUAL PROPERTY RIGHTS1.8.2.1
The Group’s intellectual property rights primarily comprise rights to
distinctive marks, such as trademarks, including the “Neoen” name
and semi-figurative marks, and domain names, in particular those
including the name “Neoen,” such as www.neoen.com,
www.neoen.eu and www.neoen.fr.
The Group’s intellectual property rights are registered or in the
process of being registered in the principal markets in which the
Group does business in order to appropriately protect them.
The “Neoen” trade name is registered in the European Union,
Switzerland, the United States and Australia.
LICENSES1.8.2.2
The Group’s companies hold the licenses required for the use of information systems in the ordinary course of their business. Other than such
licenses, no material intellectual property rights have been granted to the Group’s companies.

82 REGISTRATION DOCUMENT 2018
02
83REGISTRATION DOCUMENT 2018
BUSINESS ACTIVITES AND PROSPECTS
RESULTS FOR THE FINANCIAL 2.1
YEAR ENDED DECEMBER 31,
2018 84
Key events2.1.1 84
Key performance indicators2.1.2 85
Segment Results2.1.3 90
Analysis of the income statement2.1.4 92
CASH AND CASH EQUIVALENTS 2.2
AND EQUITY 98
Group indebtedness2.2.1 99
Position and cash flows2.2.2 102
Group investments2.2.3 104
INFORMATION ABOUT TRENDS 2.3
AND OBJECTIVES 106
Trends and objectives2.3.1 106
1st quarter 2019 consolidated 2.3.2
revenue 107
OTHER INFORMATION2.4 108
Events after the reporting period2.4.1 108
Other information about the parent 2.4.2
company Neoen S.A. 109
Employees2.4.3 115
02Business Activites and Prospects
Results for the financial year ended December 31, 2018
84 REGISTRATION DOCUMENT 2018
RESULTS FOR THE FINANCIAL YEAR ENDED DECEMBER 31, 20182.1
KEY EVENTS2.1.1
INITIAL PUBLIC OFFERING2.1.1.1
On October 16, 2018, Neoen successfully completed its initial public
offering (IPO) on Compartment A of the Paris Euronext regulated
market. The offering price was set at €16.50 per share, valuing the
Group at just over €1.4 billion. In particular, this operation, enabled it
to raise €450 million through the issue of new shares (from a total of
€697 million raised, greenshoe option included). This entire amount
will be allocated to the Group's ongoing development. As a reminder,
the Group aims to have operation and under construction capacity of
at least 5 GW by 2021.
It should be noted that Impala, the Group's long-standing majority
shareholder, injected almost €170 million into this operation so as to
maintain control of the Group.
On December 3, 2018, Neoen entered into a liquidity contract with
Kepler Chevreux. This contract complies with the ethics charter
recognised by the French Financial Markets Authority (Autorité des
Marchés Financiers – AMF).
DEVELOPMENT2.1.1.2
Neoen continued its international expansion, concentrating initially on
the countries in which the Group already operates, and on countries
within the same clusters in Europe - Africa, Australia and the
Americas, identifying opportunities and establishing project feasibility.
The Group's portfolio has thus grown in volume, with 2,008 MW of
new projects over the period (net of abandoned projects and
excluding “early stage” projects), of which 19 MW are attributable to
an adjustment of the capacity of projects in development.
In the Americas, the Group continued its development over the
year: projects amounting to 556 MW, all technologies combined,
were added to the portfolio. This enabled Neoen to consolidate the
Americas as its third main growth hub, after Australia and Europe -
Africa.
Australia is the largest region in terms of megawatts secured. This
growth is indicative of the success of Neoen's international
development. A number of projects totalling 1,100 MW, comprising
350 MW of storage and 750 MWp of solar power were added to the
Group's portfolio this year.
In Europe - Africa, 384 MW of projects were added to the portfolio
in France, 113 MW in Finland and 16 MW in Ireland. With five solar
projects secured for a total capacity of 66 MW, Neoen also won
France's first bi-technological tender, the results of which were
announced in November: these projects thus progressed from
“tendered” status, to “awarded” status.
In Mozambique, at the end of 2018, Neoen signed a 30-year
concession agreement on its solar plant in Metoro. Metoro, at
41 MWp, is currently the largest solar plant under development in
Mozambique.
These benefits were offset by abandoned projects representing
160 MW.
CONSTRUCTION2.1.1.3
In Australia, the 194 MW Bulgana wind project entered its
construction phase in March. In addition to this 194 MW of wind
capacity is a 20 MW/34 MWh of lithium-ion battery storage facility
using batteries provided by Tesla.
This will be used to stabilise the electricity supply of a greenhouse
farm to be built by Australian company Nectar Farms. The remainder
of the electricity and the green certificates will be sold to the State
Government of Victoria under a 15-year power purchase agreement
(PPA). Construction began on solar project Numurkah, with a
128 MWp capacity, in August.
Construction also began in France on solar projects won as part of
the CRE 3 call for tenders (Lugos, Miremont, Bram, Saint-Avit), as
well as some of the projects won as part of the CRE 4 call for tenders
(Azur Est, Azur Sud, Cap Découverte 4 bis, Corbas, Saint-Eloy).
These projects should generate a total of 78 MWp.
Wind power projects Auxois Sud II and Les Hauts Chemins,
representing 16 MW and 14 MW respectively, entered their
construction phases in February and August 2018.
Following the success of the Hornsdale Power Reserve storage
project in Australia, Neoen has continued its pioneering work in this
field, developing opportunities in regions in which the Group currently
operates and notably in France, where Neoen began construction on
the largest stationary power storage unit in November (Azur Stockage
6 MW/6 MWh).
In Finland, construction began on the Hedet wind project with a
capacity of 81 MW at the end of 2018.
Over the next 10 years, Google will buy 100% of the green energy
produced by this wind farm, which is 80% owned by Neoen and
19,9% by Prokon Finland.
In Jamaica, solar project Paradise Park entered into construction in
June 2018, for 51 MWp capacity.
In El Salvador, construction began in December 2018 on the
140 MWp capacity Capella Solar project. This plant will be connected
to a 3 MW/1.5 MWh battery system.
FINANCING2.1.1.4
In May 2018, Neoen, majority shareholder in the project, completed
the financial closing of its Jamaican solar farm with Proparco and
FMO. This project represents a total investment of US$64 million.
In June 2018, Neoen launched a crowdfunding campaign to help
finance the projects it won as part of the CRE 4 call for tenders. The
Commission de Régulation de l’Énergie (“CRE”) allows producers
using crowdfunding to finance renewable energy projects to benefit
from a subsidised feed-in tariff. The Cap Découverte 4 bis solar plant
was the first Neoen project to have used crowdfunding.
In October 2018, Neoen launched a crowdfunding campaign for the
two phases of the Corbas plant (Corbas 1 and 3), a series of solar
shade structures in the communes of Corbas and Saint-Priest, near
Lyon, and the Azur Est ground solar plant, in Nouvelle-Aquitaine.
02Business Activites and Prospects
Results for the financial year ended December 31, 2018
85REGISTRATION DOCUMENT 2018
In November 2018, Neoen concluded the US$133 million financing for
Capella Solar, the 140 MWp solar park in El Salvador, with FMO, BID
Invest and Proparco. Wholly-owned by Neoen, Capella Solar is due to
become operational in early 2020. This investment amount includes the
cost of a 3 MW/1.5 MWh LG Chem lithium-ion battery installed by Nidec.
OPERATIONS2.1.1.5
In Australia, the three New South Wales projects chosen as part of
the ARENA call for tenders (Australian Renewable Energy Agency),
Parkes, Griffith and Dubbo, entered into operation during the first and
second quarters of 2018. These three projects represent a total of
131 MWp.
The Coleambally solar farm commenced operations in the fourth
quarter of 2018. With installed capacity of 189 MWp, Coleambally is
wholly owned by Neoen and is now the largest solar farm in operation
on Australian soil.
In December 2018, Neoen celebrated the first operational anniversary
of its Hornsdale Power Reserve storage unit, whose performance is
exceeding expectations. Notably, the study carried out by
independent expert Aurecon shows that Hornsdale Power Reserve
(HPR) has contributed to the generation of almost AUD40 million in
savings, substituting more costly and less responsive alternatives and
providing frequency support to steady the grid.
In France, the Champs d´Amour (9 MW), Pays Chaumontais (14 MW)
and Chassepain (20 MW) wind farms, and the Lugos solar plant
(12 MWp) became operational in January, April and June.
Solar plants Lagarde d’Apt (7 MWp), Cap Découverte 4 bis (5 MWp)
and Bram (5 MWp) entered into operation during the second half of
the year.
As of December 31, 2018, Neoen had increased its operational
asset base – controlled and non-controlled by 391 MW to
1,492 MW.
A non-controlled asset is a project in which the Group has a minority
and non-controlling interest but for which it oversees operations: the
only plants concerned are some of those in the Cestas solar park, for
regulatory reasons, and one plant in Portugal (Seixal), of which it
owns 50%.
ACQUISITIONS/M&A2.1.1.6
During the first half of the year, the Group acquired the project
company Hedet Vindpark. This transaction, recorded under intangible
assets, has enabled Neoen to acquire projects in development. These
are subject to straight-line depreciation at the same rate as the plants
to which they are linked.
During the second half of 2018, the Group sold the Melissa and
Manosque Ombrière solar plants.
In 2018, the Group increased its stakes in Field Fare Argentina and
Altiplano Solar (Argentina), and Jiboa Solar and Capella Solar
(El Salvador) to 100%.
KEY PERFORMANCE INDICATORS2.1.2
The Group's consolidated financial statements have been prepared in
accordance with IFRS as adopted by the European Union.
information has been applied. The impact of the restatement of the
debt renegotiation for the 2017 financial year is presented in Note 3.a
of the notes to the consolidated financial statements.The Group has applied IFRS 9 retrospectively since January 1, 2018
with cumulative adjustments recognised in opening equity without
restatement of comparative information. As regards the modifications
of liabilities for which the standard does not provide for any specific
transitional arrangement, the modification of the comparative
The consolidated financial statements for the financial year ended
December 31, 2018 have been audited by the Company's statutory
auditors and are presented in their entirety in Section 4.1 of this
document.
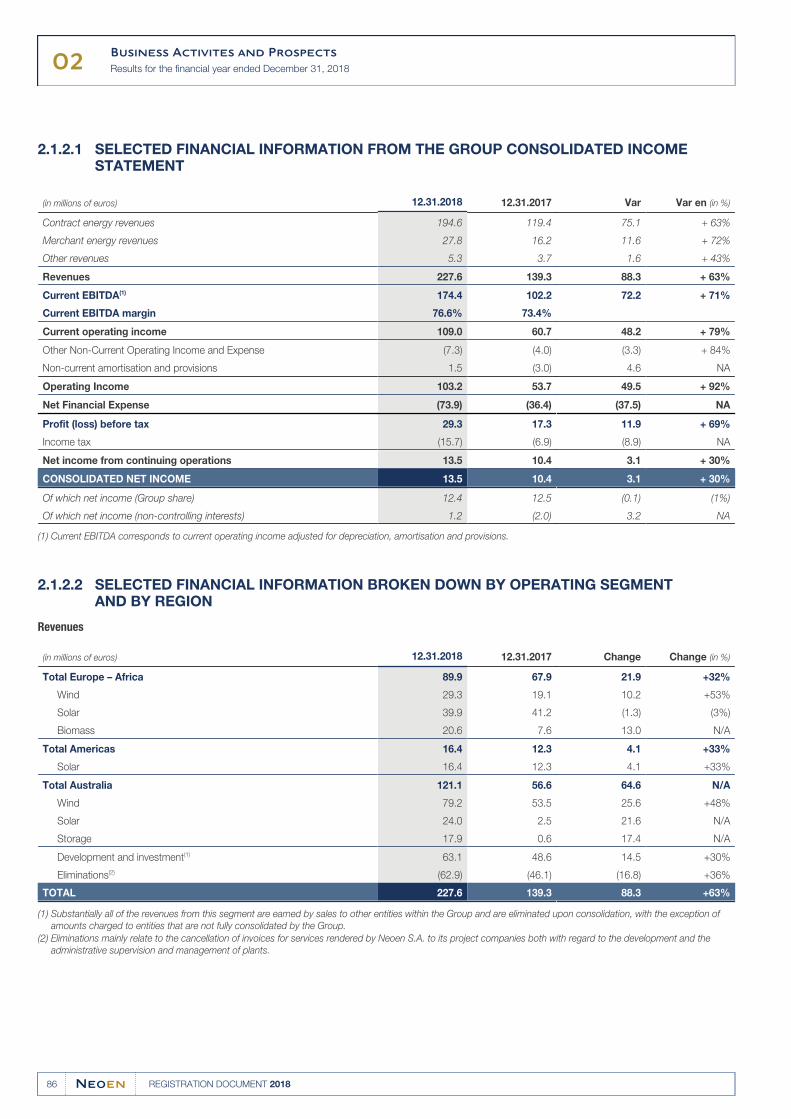
02Business Activites and Prospects
Results for the financial year ended December 31, 2018
86 REGISTRATION DOCUMENT 2018
SELECTED FINANCIAL INFORMATION FROM THE GROUP CONSOLIDATED INCOME 2.1.2.1STATEMENT
(in millions of euros) 12.31.2018 12.31.2017 Var Var en (in %)
Contract energy revenues 194.6 119.4 75.1 + 63%
Merchant energy revenues 27.8 16.2 11.6 + 72%
Other revenues 5.3 3.7 1.6 + 43%
Revenues 227.6 139.3 88.3 + 63%
Current EBITDA(1) 174.4 102.2 72.2 + 71%
Current EBITDA margin 76.6% 73.4%
Current operating income 109.0 60.7 48.2 + 79%
Other Non-Current Operating Income and Expense (7.3) (4.0) (3.3) + 84%
Non-current amortisation and provisions 1.5 (3.0) 4.6 NA
Operating Income 103.2 53.7 49.5 + 92%
Net Financial Expense (73.9) (36.4) (37.5) NA
Profit (loss) before tax 29.3 17.3 11.9 + 69%
Income tax (15.7) (6.9) (8.9) NA
Net income from continuing operations 13.5 10.4 3.1 + 30%
CONSOLIDATED NET INCOME 13.5 10.4 3.1 + 30%
Of which net income (Group share) 12.4 12.5 (0.1) (1%)
Of which net income (non-controlling interests) 1.2 (2.0) 3.2 NA
Current EBITDA corresponds to current operating income adjusted for depreciation, amortisation and provisions.(1)
SELECTED FINANCIAL INFORMATION BROKEN DOWN BY OPERATING SEGMENT 2.1.2.2AND BY REGION
Revenues
(in millions of euros) 12.31.2018 12.31.2017 Change Change (in %)
Total Europe – Africa 89.9 67.9 21.9 +32%
Wind 29.3 19.1 10.2 +53%
Solar 39.9 41.2 (1.3) (3%)
Biomass 20.6 7.6 13.0 N/A
Total Americas 16.4 12.3 4.1 +33%
Solar 16.4 12.3 4.1 +33%
Total Australia 121.1 56.6 64.6 N/A
Wind 79.2 53.5 25.6 +48%
Solar 24.0 2.5 21.6 N/A
Storage 17.9 0.6 17.4 N/A
Development and investment(1) 63.1 48.6 14.5 +30%
Eliminations(2) (62.9) (46.1) (16.8) +36%
TOTAL 227.6 139.3 88.3 +63%
Substantially all of the revenues from this segment are earned by sales to other entities within the Group and are eliminated upon consolidation, with the exception of (1)
amounts charged to entities that are not fully consolidated by the Group.
Eliminations mainly relate to the cancellation of invoices for services rendered by Neoen S.A. to its project companies both with regard to the development and the (2)
administrative supervision and management of plants.
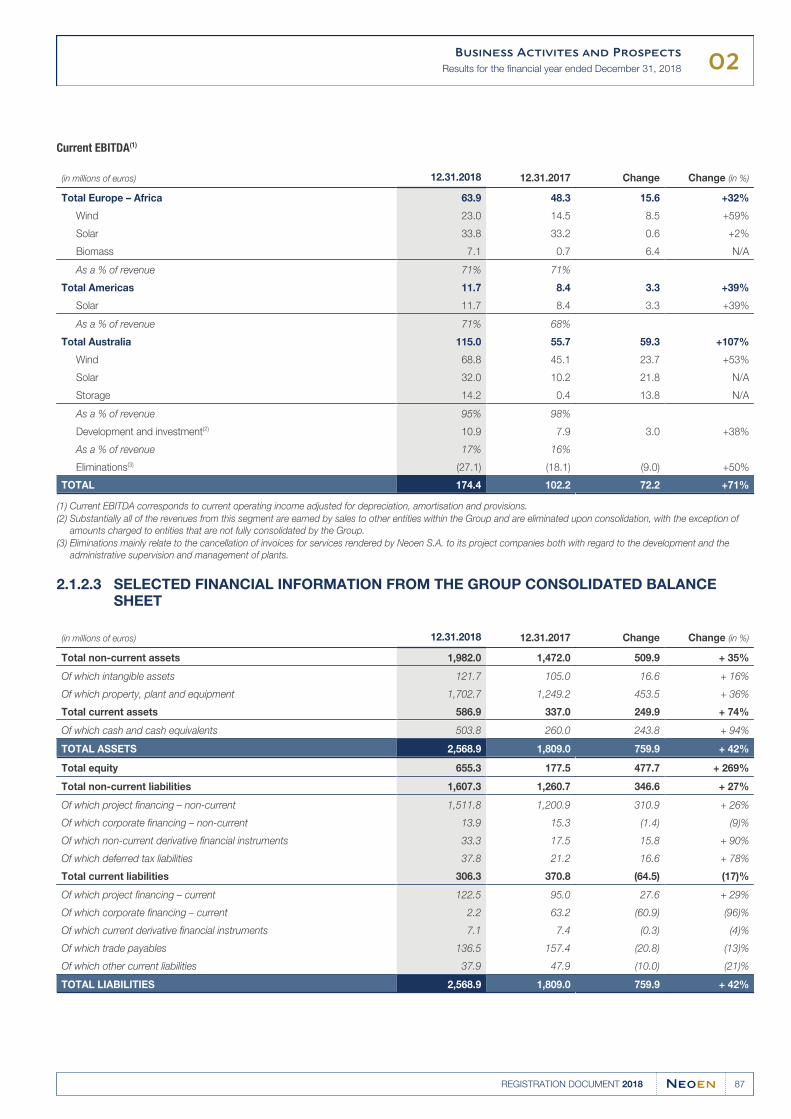
02Business Activites and Prospects
Results for the financial year ended December 31, 2018
87REGISTRATION DOCUMENT 2018
Current EBITDA(1)
(in millions of euros) 12.31.2018 12.31.2017 Change Change (in %)
Total Europe – Africa 63.9 48.3 15.6 +32%
Wind 23.0 14.5 8.5 +59%
Solar 33.8 33.2 0.6 +2%
Biomass 7.1 0.7 6.4 N/A
As a % of revenue 71% 71%
Total Americas 11.7 8.4 3.3 +39%
Solar 11.7 8.4 3.3 +39%
As a % of revenue 71% 68%
Total Australia 115.0 55.7 59.3 +107%
Wind 68.8 45.1 23.7 +53%
Solar 32.0 10.2 21.8 N/A
Storage 14.2 0.4 13.8 N/A
As a % of revenue 95% 98%
Development and investment(2) 10.9 7.9 3.0 +38%
As a % of revenue 17% 16%
Eliminations(3) (27.1) (18.1) (9.0) +50%
TOTAL 174.4 102.2 72.2 +71%
Current EBITDA corresponds to current operating income adjusted for depreciation, amortisation and provisions.(1)
Substantially all of the revenues from this segment are earned by sales to other entities within the Group and are eliminated upon consolidation, with the exception of (2)
amounts charged to entities that are not fully consolidated by the Group.
Eliminations mainly relate to the cancellation of invoices for services rendered by Neoen S.A. to its project companies both with regard to the development and the (3)
administrative supervision and management of plants.
SELECTED FINANCIAL INFORMATION FROM THE GROUP CONSOLIDATED BALANCE 2.1.2.3SHEET
(in millions of euros) 12.31.2018 12.31.2017 Change Change (in %)
Total non-current assets 1,982.0 1,472.0 509.9 + 35%
Of which intangible assets 121.7 105.0 16.6 + 16%
Of which property, plant and equipment 1,702.7 1,249.2 453.5 + 36%
Total current assets 586.9 337.0 249.9 + 74%
Of which cash and cash equivalents 503.8 260.0 243.8 + 94%
TOTAL ASSETS 2,568.9 1,809.0 759.9 + 42%
Total equity 655.3 177.5 477.7 + 269%
Total non-current liabilities 1,607.3 1,260.7 346.6 + 27%
Of which project financing – non-current 1,511.8 1,200.9 310.9 + 26%
Of which corporate financing – non-current 13.9 15.3 (1.4) (9)%
Of which non-current derivative financial instruments 33.3 17.5 15.8 + 90%
Of which deferred tax liabilities 37.8 21.2 16.6 + 78%
Total current liabilities 306.3 370.8 (64.5) (17)%
Of which project financing – current 122.5 95.0 27.6 + 29%
Of which corporate financing – current 2.2 63.2 (60.9) (96)%
Of which current derivative financial instruments 7.1 7.4 (0.3) (4)%
Of which trade payables 136.5 157.4 (20.8) (13)%
Of which other current liabilities 37.9 47.9 (10.0) (21)%
TOTAL LIABILITIES 2,568.9 1,809.0 759.9 + 42%
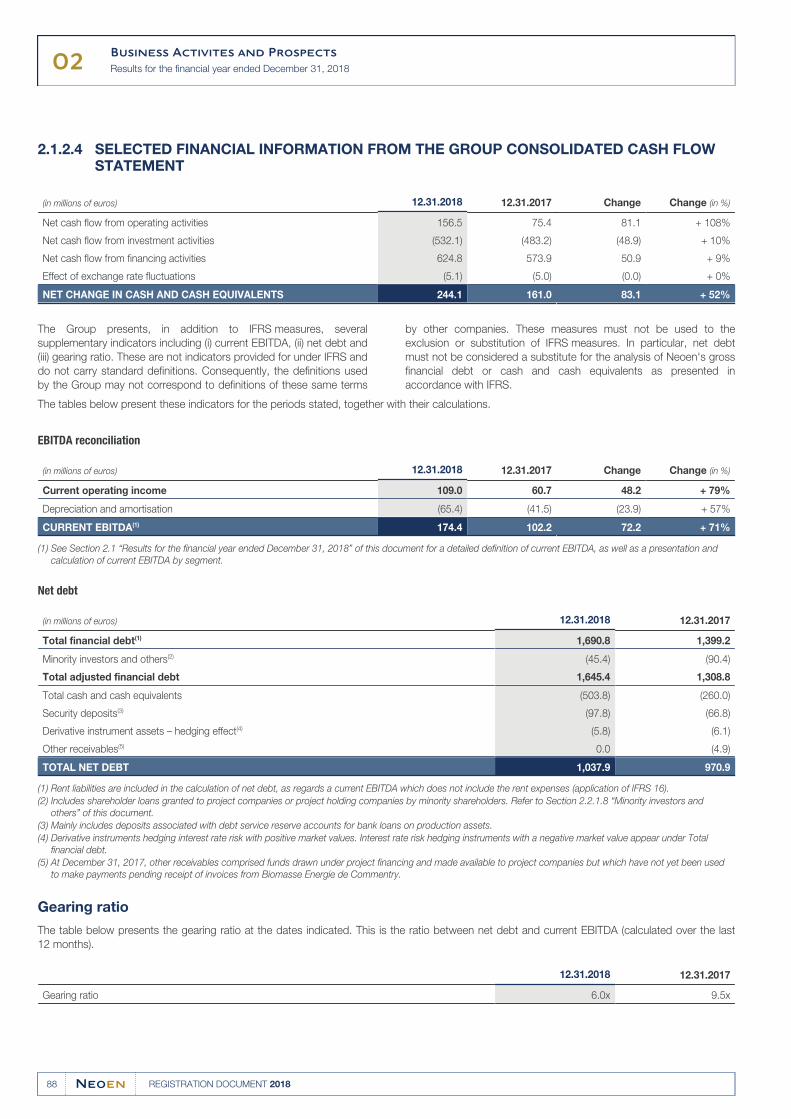
02Business Activites and Prospects
Results for the financial year ended December 31, 2018
88 REGISTRATION DOCUMENT 2018
SELECTED FINANCIAL INFORMATION FROM THE GROUP CONSOLIDATED CASH FLOW 2.1.2.4STATEMENT
(in millions of euros) 12.31.2018 12.31.2017 Change Change (in %)
Net cash flow from operating activities 156.5 75.4 81.1 + 108%
Net cash flow from investment activities (532.1) (483.2) (48.9) + 10%
Net cash flow from financing activities 624.8 573.9 50.9 + 9%
Effect of exchange rate fluctuations (5.1) (5.0) (0.0) + 0%
NET CHANGE IN CASH AND CASH EQUIVALENTS 244.1 161.0 83.1 + 52%
The Group presents, in addition to IFRS measures, several by other companies. These measures must not be used to the
supplementary indicators including (i) current EBITDA, (ii) net debt and exclusion or substitution of IFRS measures. In particular, net debt
(iii) gearing ratio. These are not indicators provided for under IFRS and must not be considered a substitute for the analysis of Neoen's gross
do not carry standard definitions. Consequently, the definitions used financial debt or cash and cash equivalents as presented in
by the Group may not correspond to definitions of these same terms accordance with IFRS.
The tables below present these indicators for the periods stated, together with their calculations.
EBITDA reconciliation
(in millions of euros) 12.31.2018 12.31.2017 Change Change (in %)
Current operating income 109.0 60.7 48.2 + 79%
Depreciation and amortisation (65.4) (41.5) (23.9) + 57%
CURRENT EBITDA(1) 174.4 102.2 72.2 + 71%
See Section 2.1 “Results for the financial year ended December 31, 2018” of this document for a detailed definition of current EBITDA, as well as a presentation and (1)
calculation of current EBITDA by segment.
Net debt
(in millions of euros) 12.31.2018 12.31.2017
Total financial debt(1) 1,690.8 1,399.2
Minority investors and others(2) (45.4) (90.4)
Total adjusted financial debt 1,645.4 1,308.8
Total cash and cash equivalents (503.8) (260.0)
Security deposits(3) (97.8) (66.8)
Derivative instrument assets – hedging effect(4) (5.8) (6.1)
Other receivables(5) 0.0 (4.9)
TOTAL NET DEBT 1,037.9 970.9
Rent liabilities are included in the calculation of net debt, as regards a current EBITDA which does not include the rent expenses (application of IFRS 16).(1)
Includes shareholder loans granted to project companies or project holding companies by minority shareholders. Refer to Section 2.2.1.8 “Minority investors and (2)
others” of this document.
Mainly includes deposits associated with debt service reserve accounts for bank loans on production assets.(3)
Derivative instruments hedging interest rate risk with positive market values. Interest rate risk hedging instruments with a negative market value appear under Total (4)
financial debt.
At December 31, 2017, other receivables comprised funds drawn under project financing and made available to project companies but which have not yet been used (5)
to make payments pending receipt of invoices from Biomasse Energie de Commentry.
Gearing ratio
The table below presents the gearing ratio at the dates indicated. This is the ratio between net debt and current EBITDA (calculated over the last
12 months).
12.31.2018 12.31.2017
Gearing ratio 6.0x 9.5x
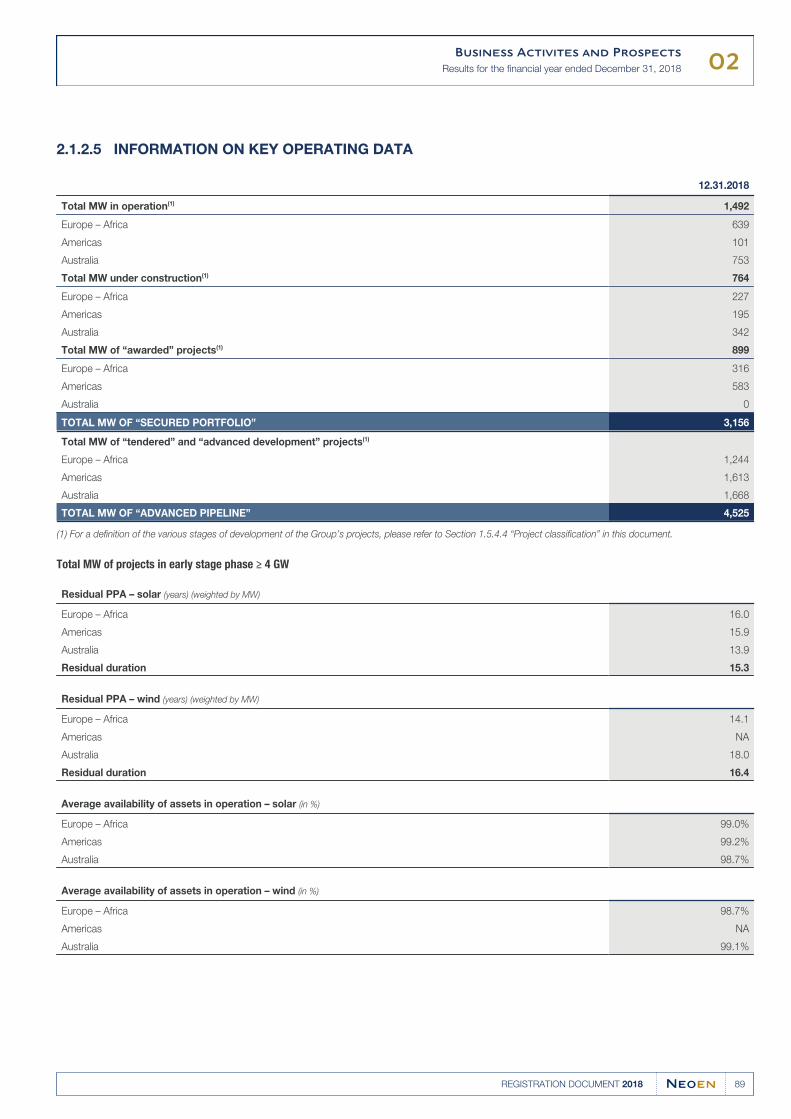
02Business Activites and Prospects
Results for the financial year ended December 31, 2018
89REGISTRATION DOCUMENT 2018
INFORMATION ON KEY OPERATING DATA2.1.2.5
12.31.2018
Total MW in operation(1) 1,492
Europe – Africa 639
Americas 101
Australia 753
Total MW under construction(1) 764
Europe – Africa 227
Americas 195
Australia 342
Total MW of “awarded” projects(1) 899
Europe – Africa 316
Americas 583
Australia 0
TOTAL MW OF “SECURED PORTFOLIO” 3,156
Total MW of “tendered” and “advanced development” projects(1)
Europe – Africa 1,244
Americas 1,613
Australia 1,668
TOTAL MW OF “ADVANCED PIPELINE” 4,525
For a definition of the various stages of development of the Group’s projects, please refer to Section 1.5.4.4 “Project classification” in this document.(1)
Total MW of projects in early stage phase ≥ 4 GW
Residual PPA – solar (years) (weighted by MW)
Europe – Africa 16.0
Americas 15.9
Australia 13.9
Residual duration 15.3
Residual PPA – wind (years) (weighted by MW)
Europe – Africa 14.1
Americas NA
Australia 18.0
Residual duration 16.4
Average availability of assets in operation – solar (in %)
Europe – Africa 99.0%
Americas 99.2%
Australia 98.7%
Average availability of assets in operation – wind (in %)
Europe – Africa 98.7%
Americas NA
Australia 99.1%
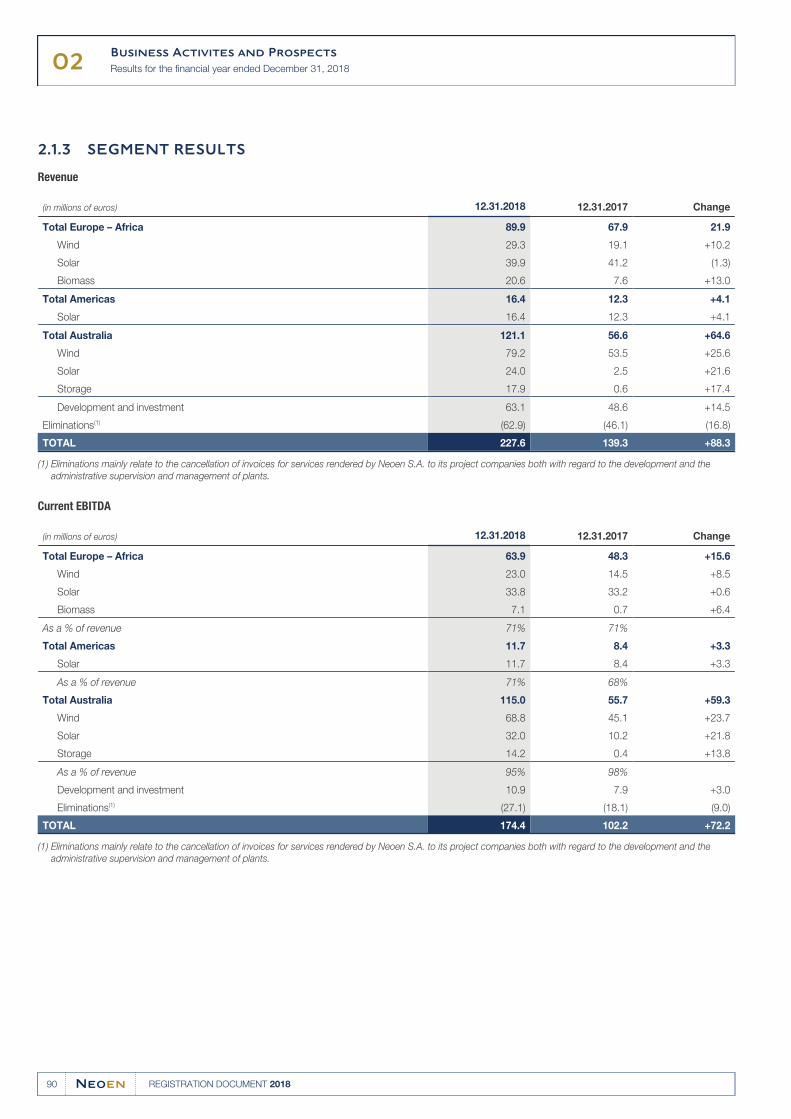
02Business Activites and Prospects
Results for the financial year ended December 31, 2018
90 REGISTRATION DOCUMENT 2018
SEGMENT RESULTS2.1.3
Revenue
(in millions of euros) 12.31.2018 12.31.2017 Change
Total Europe – Africa 89.9 67.9 21.9
Wind 29.3 19.1 +10.2
Solar 39.9 41.2 (1.3)
Biomass 20.6 7.6 +13.0
Total Americas 16.4 12.3 +4.1
Solar 16.4 12.3 +4.1
Total Australia 121.1 56.6 +64.6
Wind 79.2 53.5 +25.6
Solar 24.0 2.5 +21.6
Storage 17.9 0.6 +17.4
Development and investment 63.1 48.6 +14.5
Eliminations(1) (62.9) (46.1) (16.8)
TOTAL 227.6 139.3 +88.3
Eliminations mainly relate to the cancellation of invoices for services rendered by Neoen S.A. to its project companies both with regard to the development and the (1)
administrative supervision and management of plants.
Current EBITDA
(in millions of euros) 12.31.2018 12.31.2017 Change
Total Europe – Africa 63.9 48.3 +15.6
Wind 23.0 14.5 +8.5
Solar 33.8 33.2 +0.6
Biomass 7.1 0.7 +6.4
As a % of revenue 71% 71%
Total Americas 11.7 8.4 +3.3
Solar 11.7 8.4 +3.3
As a % of revenue 71% 68%
Total Australia 115.0 55.7 +59.3
Wind 68.8 45.1 +23.7
Solar 32.0 10.2 +21.8
Storage 14.2 0.4 +13.8
As a % of revenue 95% 98%
Development and investment 10.9 7.9 +3.0
Eliminations(1) (27.1) (18.1) (9.0)
TOTAL 174.4 102.2 +72.2
Eliminations mainly relate to the cancellation of invoices for services rendered by Neoen S.A. to its project companies both with regard to the development and the (1)
administrative supervision and management of plants.
02Business Activites and Prospects
Results for the financial year ended December 31, 2018
91REGISTRATION DOCUMENT 2018
EUROPE – AFRICA2.1.3.1
Revenues
Revenue for the Europe – Africa region totalled €89.9 million at
December 31, 2018, compared with €67.9 million at December 31,
2017, an increase of €21.9 million or 32%, owing to:
the €10.2 million increase in wind revenues, mainly attributable to●the rise in production resulting from newly-operational assets in
2018 (Champs d'Amour, Pays Chaumontais and Chassepain), as
well the effect of a full year of operations in 2018 at the Vallée aux
Grillons and l’Osière plants, which became operational in 2017;
the €13 million increase in biomass revenues, resulting from the●operation of the Commentry plant throughout 2018;
the €1.3 million decline in solar revenues, mainly due to lower●irradiation in 2018. This effect was offset in part by the newly
operational facilities (Lugos and Lagarde d’Apt) in 2018.
Current EBITDA
Current EBITDA for the Europe – Africa region stood at €63.9 million
at December 31, 2018, against €48.3 million at December 31, 2017,
an increase of €15.6 million owing to:
the €8.5 million increase in wind current EBITDA attributable to the●full-year operation of new farms;
the €6.4 million increase in biomass current EBITDA, generating●EBITDA of €7.1 million at December 31, 2018 and attributable to
the Commentry plant which had completed its first full-year of
operation.
At December 31, 2018, the current EBITDA margin generated by the
Europe – Africa region remained stable at 71% of revenues for this
region.
AMERICAS2.1.3.2
Revenues
Revenues for the Americas totalled €16.4 million at December 31,
2018, compared with €12.3 million at December 31, 2017, an
increase of €4.1 million, linked to the solar energy revenues from the
full-year operation of the Providencia park in El Salvador.
Current EBITDA
Current EBITDA for the Americas stood at €11.7 million at
December 31, 2018, against €8.4 million at December 31, 2017, an
increase of €3.3 million, attributable to the full-year operation of the
Providencia Solar park.
At December 31, 2018, the current EBITDA generated by the
Americas rose to 71% of revenues for this region, compared with
68% at December 31, 2017.
AUSTRALIA2.1.3.3
Revenues
In 2018, revenues in Australia increased by €64.6 million. This
performance is due to the growth in energy revenues (+€47.2 million)
resulting from:
the full-year operation of certain plants, including the Hornsdale 3●and Hornsdale 2 wind farms;
the commissioning of the Parkes, Griffith, Dubbo and Coleambally●solar plants;
the higher energy production of the DeGrussa solar park in 2018,●which had been affected by a power down in 2017;
the growth in the storage business (+€17.4 million) resulting from●the commissioning of the Hornsdale Power Reserve battery in
December 2017.
Current EBITDA
Australia's current EBITDA stood at €115 million at December 31,
2018, an increase of €59.3 million compared with December 31,
2017.
This was mainly due to:
the increased production at the Hornsdale 2 and 3 wind farms due●to their full-year operation;
the commissioning of the Parkes, Griffith, Dubbo and Coleambally●plants, as well as the €7.1 million of compensation received for the
loss of revenue associated with their delayed commissioning;
the entry into service of the Hornsdale Power Reserve storage unit●(including the impact of the drop in charges for the Group's
frequency control services due to lower market prices for frequency
control services owing in particular to its becoming operational).
At December 31, 2018, current EBITDA generated by Australia stood
at 95% of revenues generated by this region, compared with 98% at
December 31, 2017. These 2017 and 2018 margins were notably
affected (positively) by indemnities received and not recognised as
revenue, and by the share of market sales or short-term PPAs at
higher prices than long-term PPAs.
02Business Activites and Prospects
Results for the financial year ended December 31, 2018
92 REGISTRATION DOCUMENT 2018
DEVELOPMENT AND INVESTMENT2.1.3.4
Revenues
Revenue rose by €14.5 million between 2017 and 2018. This reflects
the sustained growth in development activity and construction
compared with the previous financial year.
Current EBITDA
Current EBITDA was up €3 million, which reflects a continuation of
business growth. At December 31, 2018, current EBITDA for the
Development and investment business represented 17% of revenue
generated by this business, compared with 16% at December 31,
2017.
ANALYSIS OF THE INCOME STATEMENT2.1.4
The presentation and notes on the consolidated income statement for
2018 and 2017 are broken down into two levels of analysis for
revenue and current EBITDA: the first covers the Group as a whole
and the second covers the different segments (Europe – Africa,
Americas and Australia, by activity: wind, solar, storage and biomass;
and Development and investment by central activities). Operating
Income and net income are subject to a general analysis.
In 2018, taking account of its strategic opportunities, the Group made
changes to its segment reporting and now presents certain storage
activities separately. These were previously included as part of the
“solar” and “wind” activities. The business segments used by the
Group are detailed in Notes 3.w and 5 of the Notes to the
consolidated financial statements for the 2018 financial year.
The Group’s results are affected by variations in foreign exchange
rates. For details of the Group’s exposure to exchange rate risk, see
Section 3.1.3.2 “Exchange rate risk” of this document.
REVENUES2.1.4.1
Structure of the Group's revenue(i)
At December 31, 2018, contract energy revenue represented 85% of
revenues, compared with 86% at December 31, 2017, stable over
the period. This enabled the Group to benefit from significant visibility
on its revenues, given the average remaining term of the off-take
contracts of approximately 15.6 years.
The Group also carries out merchant energy sales, where
opportunities arise. These represented 12% of revenues at
December 31, 2018, unchanged from 2017.
Furthermore, over the period, the Group strengthened its efforts in the
field of storage technology which, at December 31, 2018, had
become a separate business in terms of independent batteries, i.e.
those directly linked to networks, representing 8% of revenue.
Lastly, and to a lesser extent, the Group supplies project companies
with project development and other services, such as administrative
supervision and management.
The Group is present in three geographical regions (“clusters”):
Europe – Africa, Americas and Australia.
Energy generation revenues
Energy generation revenues are a function of the volume of electricity
generated and the average sale prices per MWh sold.
Key factors with an impact on power generation revenues
Demand for renewable energy. Worldwide demand for●renewable energy has grown rapidly over the last decade, driven by
government policies promoting clean energy and cost reductions
that have made it more competitive.
Off-take prices and contract structure. The Group recognises●revenue from the energy it generates on a per megawatt hour basis
based on the energy produced and sold by the Group’s generating
facilities. The average price per MWh changes in accordance with
contract and merchant sales completed, the technological mix and
the geographical mix (presented above). The average price
per MWh the Group realizes in a given period is affected by a
number of factors including:
electricity sold pursuant to Feed-in-Tariffs, long-term PPAs or●CfDs (Contract for difference) awarded following a tender
process, and short-term PPAs,
“Merchant revenues” for electricity sold at wholesale and●spot-market rates.
At December 31, 2018, the Group's merchant revenues (i.e.
revenue from the spot market) represented only a small
percentage of total power generation revenues. The Group’s
objective is for merchant revenues not to exceed 20% of its
total annual energy revenues. See Section 3.1.1 “Risks relating
to the Group’s business” of this document.
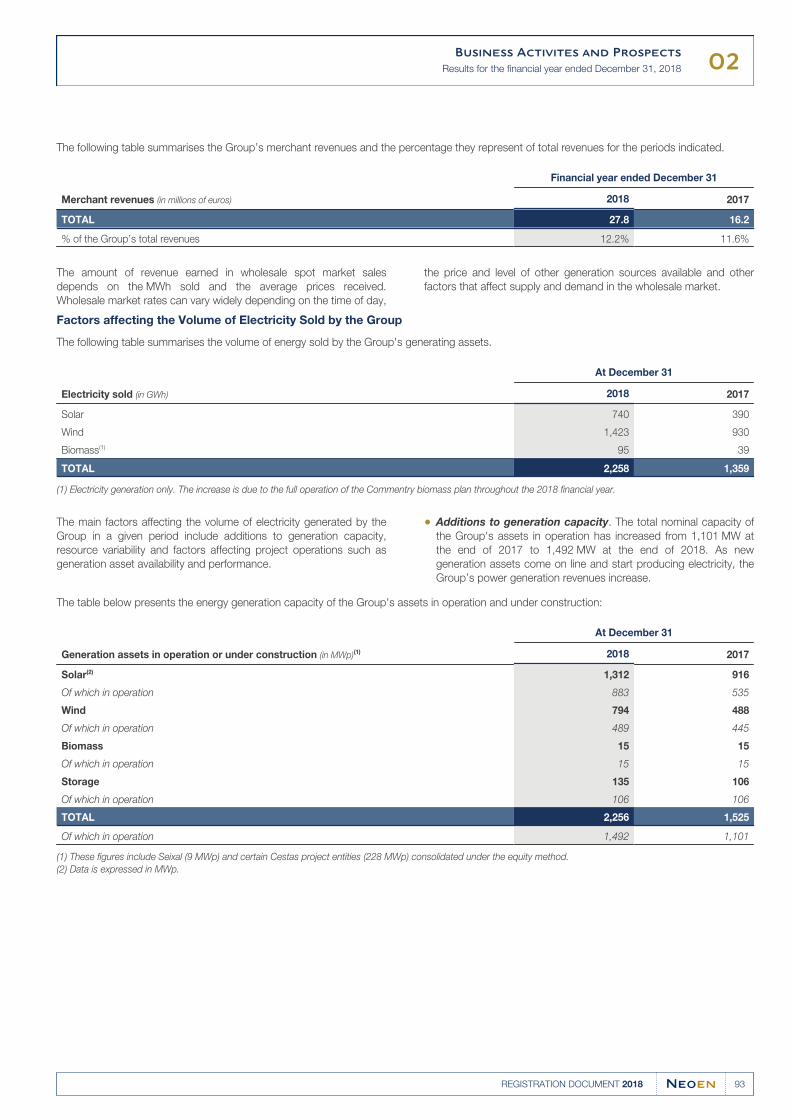
02Business Activites and Prospects
Results for the financial year ended December 31, 2018
93REGISTRATION DOCUMENT 2018
The following table summarises the Group’s merchant revenues and the percentage they represent of total revenues for the periods indicated.
Merchant revenues (in millions of euros)
Financial year ended December 31
2018 2017
TOTAL 27.8 16.2
% of the Group’s total revenues 12.2% 11.6%
The amount of revenue earned in wholesale spot market sales the price and level of other generation sources available and other
depends on the MWh sold and the average prices received. factors that affect supply and demand in the wholesale market.
Wholesale market rates can vary widely depending on the time of day,
Factors affecting the Volume of Electricity Sold by the Group
The following table summarises the volume of energy sold by the Group's generating assets.
Electricity sold (in GWh)
At December 31
2018 2017
Solar 740 390
Wind 1,423 930
Biomass(1) 95 39
TOTAL 2,258 1,359
Electricity generation only. The increase is due to the full operation of the Commentry biomass plan throughout the 2018 financial year.(1)
The main factors affecting the volume of electricity generated by the
Group in a given period include additions to generation capacity,
resource variability and factors affecting project operations such as
generation asset availability and performance.
Additions to generation capacity. The total nominal capacity of●the Group's assets in operation has increased from 1,101 MW at
the end of 2017 to 1,492 MW at the end of 2018. As new
generation assets come on line and start producing electricity, the
Group’s power generation revenues increase.
The table below presents the energy generation capacity of the Group's assets in operation and under construction:
Generation assets in operation or under construction (in MWp)(1)
At December 31
2018 2017
Solar(2) 1,312 916
Of which in operation 883 535
Wind 794 488
Of which in operation 489 445
Biomass 15 15
Of which in operation 15 15
Storage 135 106
Of which in operation 106 106
TOTAL 2,256 1,525
Of which in operation 1,492 1,101
These figures include Seixal (9 MWp) and certain Cestas project entities (228 MWp) consolidated under the equity method.(1)
Data is expressed in MWp.(2)
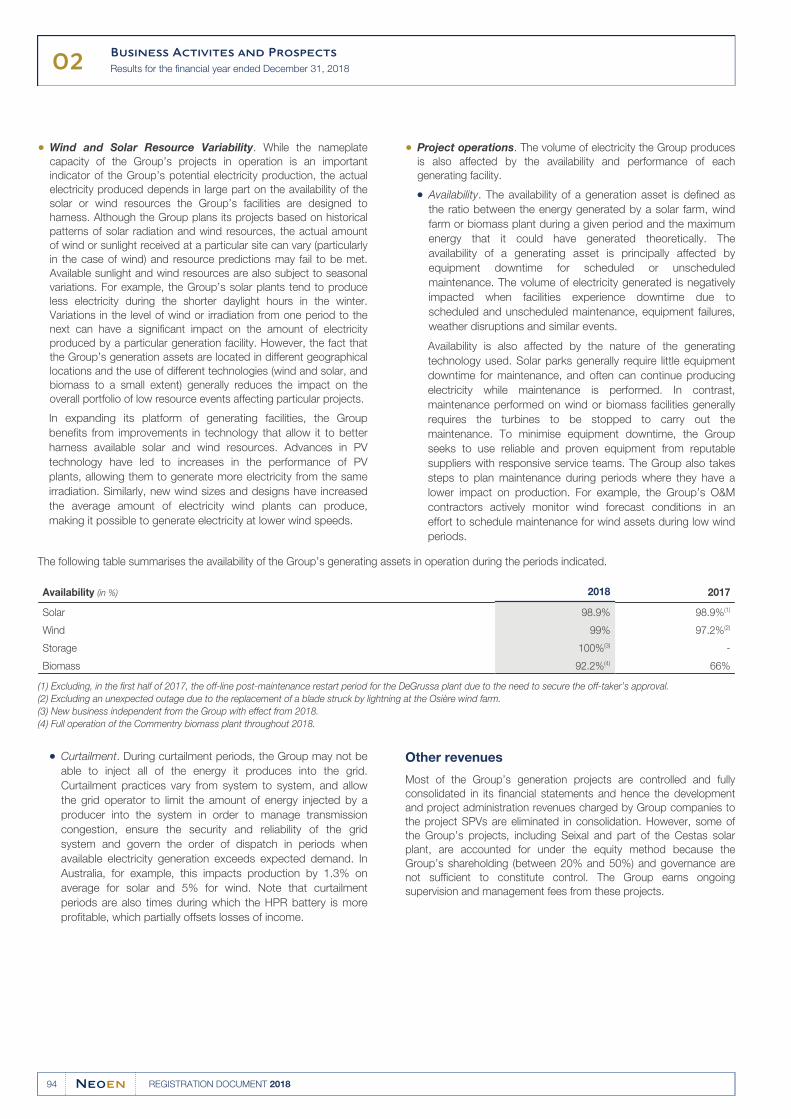
02Business Activites and Prospects
Results for the financial year ended December 31, 2018
94 REGISTRATION DOCUMENT 2018
Wind and Solar Resource Variability. While the nameplate●capacity of the Group’s projects in operation is an important
indicator of the Group’s potential electricity production, the actual
electricity produced depends in large part on the availability of the
solar or wind resources the Group’s facilities are designed to
harness. Although the Group plans its projects based on historical
patterns of solar radiation and wind resources, the actual amount
of wind or sunlight received at a particular site can vary (particularly
in the case of wind) and resource predictions may fail to be met.
Available sunlight and wind resources are also subject to seasonal
variations. For example, the Group’s solar plants tend to produce
less electricity during the shorter daylight hours in the winter.
Variations in the level of wind or irradiation from one period to the
next can have a significant impact on the amount of electricity
produced by a particular generation facility. However, the fact that
the Group’s generation assets are located in different geographical
locations and the use of different technologies (wind and solar, and
biomass to a small extent) generally reduces the impact on the
overall portfolio of low resource events affecting particular projects.
In expanding its platform of generating facilities, the Group
benefits from improvements in technology that allow it to better
harness available solar and wind resources. Advances in PV
technology have led to increases in the performance of PV
plants, allowing them to generate more electricity from the same
irradiation. Similarly, new wind sizes and designs have increased
the average amount of electricity wind plants can produce,
making it possible to generate electricity at lower wind speeds.
Project operations. The volume of electricity the Group produces●is also affected by the availability and performance of each
generating facility.
Availability. The availability of a generation asset is defined as●the ratio between the energy generated by a solar farm, wind
farm or biomass plant during a given period and the maximum
energy that it could have generated theoretically. The
availability of a generating asset is principally affected by
equipment downtime for scheduled or unscheduled
maintenance. The volume of electricity generated is negatively
impacted when facilities experience downtime due to
scheduled and unscheduled maintenance, equipment failures,
weather disruptions and similar events.
Availability is also affected by the nature of the generating
technology used. Solar parks generally require little equipment
downtime for maintenance, and often can continue producing
electricity while maintenance is performed. In contrast,
maintenance performed on wind or biomass facilities generally
requires the turbines to be stopped to carry out the
maintenance. To minimise equipment downtime, the Group
seeks to use reliable and proven equipment from reputable
suppliers with responsive service teams. The Group also takes
steps to plan maintenance during periods where they have a
lower impact on production. For example, the Group’s O&M
contractors actively monitor wind forecast conditions in an
effort to schedule maintenance for wind assets during low wind
periods.
The following table summarises the availability of the Group’s generating assets in operation during the periods indicated.
Availability (in %) 2018 2017
Solar 98.9% 98.9%(1)
Wind 99% 97.2%(2)
Storage 100%(3) -
Biomass 92.2%(4) 66%
Excluding, in the first half of 2017, the off-line post-maintenance restart period for the DeGrussa plant due to the need to secure the off-taker’s approval.(1)
Excluding an unexpected outage due to the replacement of a blade struck by lightning at the Osière wind farm.(2)
New business independent from the Group with effect from 2018.(3)
Full operation of the Commentry biomass plant throughout 2018.(4)
Curtailment. During curtailment periods, the Group may not be●able to inject all of the energy it produces into the grid.
Curtailment practices vary from system to system, and allow
the grid operator to limit the amount of energy injected by a
producer into the system in order to manage transmission
congestion, ensure the security and reliability of the grid
system and govern the order of dispatch in periods when
available electricity generation exceeds expected demand. In
Australia, for example, this impacts production by 1.3% on
average for solar and 5% for wind. Note that curtailment
periods are also times during which the HPR battery is more
profitable, which partially offsets losses of income.
Other revenues
Most of the Group’s generation projects are controlled and fully
consolidated in its financial statements and hence the development
and project administration revenues charged by Group companies to
the project SPVs are eliminated in consolidation. However, some of
the Group’s projects, including Seixal and part of the Cestas solar
plant, are accounted for under the equity method because the
Group’s shareholding (between 20% and 50%) and governance are
not sufficient to constitute control. The Group earns ongoing
supervision and management fees from these projects.
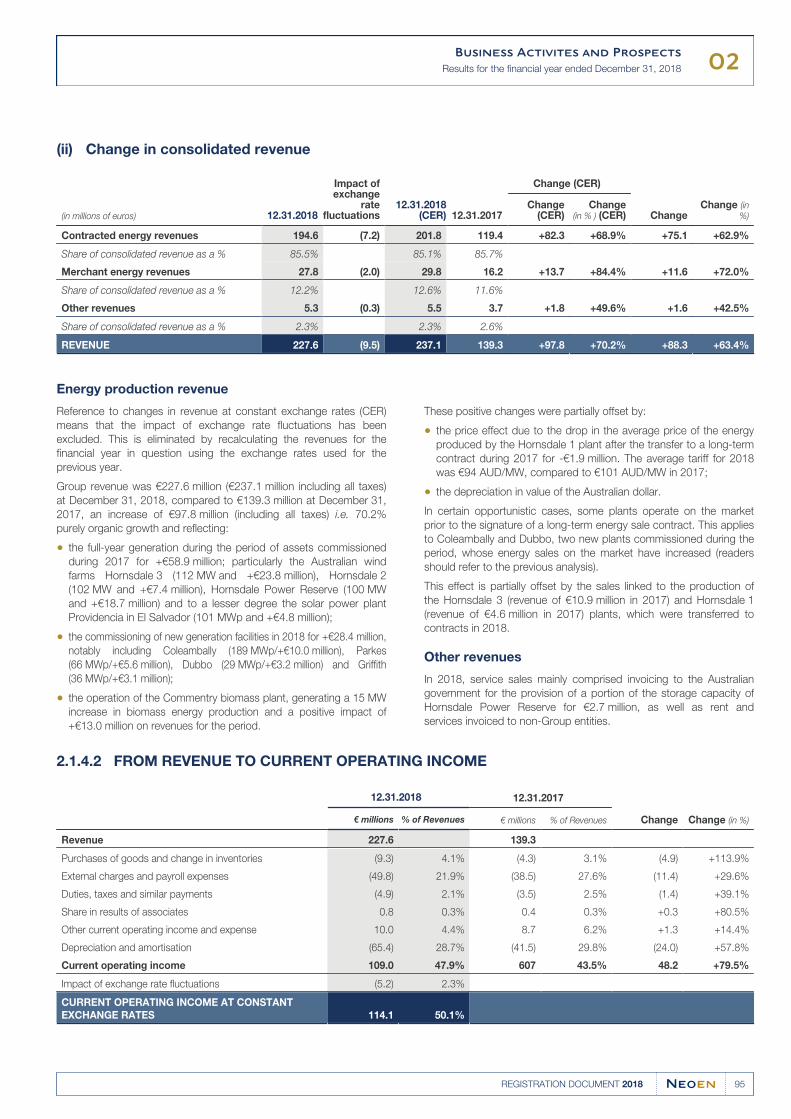
02Business Activites and Prospects
Results for the financial year ended December 31, 2018
95REGISTRATION DOCUMENT 2018
Change in consolidated revenue(ii)
(in millions of euros) 12.31.2018
Impact ofexchange
ratefluctuations
12.31.2018(CER) 12.31.2017
Change (CER)
ChangeChange (in
%)Change
(CER)Change
(in % ) (CER)
Contracted energy revenues 194.6 (7.2) 201.8 119.4 +82.3 +68.9% +75.1 +62.9%
Share of consolidated revenue as a % 85.5% 85.1% 85.7%
Merchant energy revenues 27.8 (2.0) 29.8 16.2 +13.7 +84.4% +11.6 +72.0%
Share of consolidated revenue as a % 12.2% 12.6% 11.6%
Other revenues 5.3 (0.3) 5.5 3.7 +1.8 +49.6% +1.6 +42.5%
Share of consolidated revenue as a % 2.3% 2.3% 2.6%
REVENUE 227.6 (9.5) 237.1 139.3 +97.8 +70.2% +88.3 +63.4%
Energy production revenue
Reference to changes in revenue at constant exchange rates (CER)
means that the impact of exchange rate fluctuations has been
excluded. This is eliminated by recalculating the revenues for the
financial year in question using the exchange rates used for the
previous year.
Group revenue was €227.6 million (€237.1 million including all taxes)
at December 31, 2018, compared to €139.3 million at December 31,
2017, an increase of €97.8 million (including all taxes) i.e. 70.2%
purely organic growth and reflecting:
the full-year generation during the period of assets commissioned●during 2017 for +€58.9 million; particularly the Australian wind
farms Hornsdale 3 (112 MW and +€23.8 million), Hornsdale 2
(102 MW and +€7.4 million), Hornsdale Power Reserve (100 MW
and +€18.7 million) and to a lesser degree the solar power plant
Providencia in El Salvador (101 MWp and +€4.8 million);
the commissioning of new generation facilities in 2018 for +€28.4 million,●notably including Coleambally (189 MWp/+€10.0 million), Parkes
(66 MWp/+€5.6 million), Dubbo (29 MWp/+€3.2 million) and Griffith
(36 MWp/+€3.1 million);
the operation of the Commentry biomass plant, generating a 15 MW●increase in biomass energy production and a positive impact of
+€13.0 million on revenues for the period.
These positive changes were partially offset by:
the price effect due to the drop in the average price of the energy●produced by the Hornsdale 1 plant after the transfer to a long-term
contract during 2017 for -€1.9 million. The average tariff for 2018
was €94 AUD/MW, compared to €101 AUD/MW in 2017;
the depreciation in value of the Australian dollar.●
In certain opportunistic cases, some plants operate on the market
prior to the signature of a long-term energy sale contract. This applies
to Coleambally and Dubbo, two new plants commissioned during the
period, whose energy sales on the market have increased (readers
should refer to the previous analysis).
This effect is partially offset by the sales linked to the production of
the Hornsdale 3 (revenue of €10.9 million in 2017) and Hornsdale 1
(revenue of €4.6 million in 2017) plants, which were transferred to
contracts in 2018.
Other revenues
In 2018, service sales mainly comprised invoicing to the Australian
government for the provision of a portion of the storage capacity of
Hornsdale Power Reserve for €2.7 million, as well as rent and
services invoiced to non-Group entities.
FROM REVENUE TO CURRENT OPERATING INCOME2.1.4.2
12.31.2018 12.31.2017
Change Change (in %)€ millions % of Revenues € millions % of Revenues
Revenue 227.6 139.3
Purchases of goods and change in inventories (9.3) 4.1% (4.3) 3.1% (4.9) +113.9%
External charges and payroll expenses (49.8) 21.9% (38.5) 27.6% (11.4) +29.6%
Duties, taxes and similar payments (4.9) 2.1% (3.5) 2.5% (1.4) +39.1%
Share in results of associates 0.8 0.3% 0.4 0.3% +0.3 +80.5%
Other current operating income and expense 10.0 4.4% 8.7 6.2% +1.3 +14.4%
Depreciation and amortisation (65.4) 28.7% (41.5) 29.8% (24.0) +57.8%
Current operating income 109.0 47.9% 607 43.5% 48.2 +79.5%
Impact of exchange rate fluctuations (5.2) 2.3%
CURRENT OPERATING INCOME AT CONSTANT
EXCHANGE RATES 114.1 50.1%
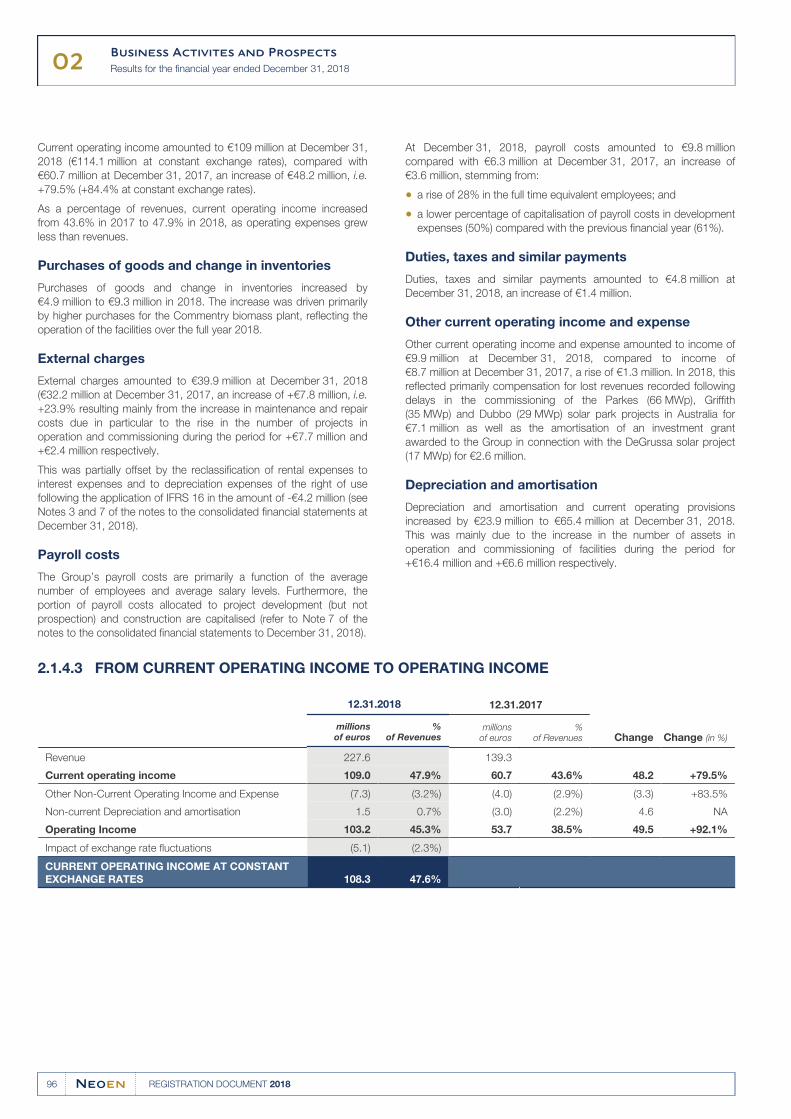
02Business Activites and Prospects
Results for the financial year ended December 31, 2018
96 REGISTRATION DOCUMENT 2018
Current operating income amounted to €109 million at December 31,
2018 (€114.1 million at constant exchange rates), compared with
€60.7 million at December 31, 2017, an increase of €48.2 million, i.e.
+79.5% (+84.4% at constant exchange rates).
As a percentage of revenues, current operating income increased
from 43.6% in 2017 to 47.9% in 2018, as operating expenses grew
less than revenues.
Purchases of goods and change in inventories
Purchases of goods and change in inventories increased by
€4.9 million to €9.3 million in 2018. The increase was driven primarily
by higher purchases for the Commentry biomass plant, reflecting the
operation of the facilities over the full year 2018.
External charges
External charges amounted to €39.9 million at December 31, 2018
(€32.2 million at December 31, 2017, an increase of +€7.8 million, i.e.
+23.9% resulting mainly from the increase in maintenance and repair
costs due in particular to the rise in the number of projects in
operation and commissioning during the period for +€7.7 million and
+€2.4 million respectively.
This was partially offset by the reclassification of rental expenses to
interest expenses and to depreciation expenses of the right of use
following the application of IFRS 16 in the amount of -€4.2 million (see
Notes 3 and 7 of the notes to the consolidated financial statements at
December 31, 2018).
Payroll costs
The Group’s payroll costs are primarily a function of the average
number of employees and average salary levels. Furthermore, the
portion of payroll costs allocated to project development (but not
prospection) and construction are capitalised (refer to Note 7 of the
notes to the consolidated financial statements to December 31, 2018).
At December 31, 2018, payroll costs amounted to €9.8 million
compared with €6.3 million at December 31, 2017, an increase of
€3.6 million, stemming from:
a rise of 28% in the full time equivalent employees; and●
a lower percentage of capitalisation of payroll costs in development●expenses (50%) compared with the previous financial year (61%).
Duties, taxes and similar payments
Duties, taxes and similar payments amounted to €4.8 million at
December 31, 2018, an increase of €1.4 million.
Other current operating income and expense
Other current operating income and expense amounted to income of
€9.9 million at December 31, 2018, compared to income of
€8.7 million at December 31, 2017, a rise of €1.3 million. In 2018, this
reflected primarily compensation for lost revenues recorded following
delays in the commissioning of the Parkes (66 MWp), Griffith
(35 MWp) and Dubbo (29 MWp) solar park projects in Australia for
€7.1 million as well as the amortisation of an investment grant
awarded to the Group in connection with the DeGrussa solar project
(17 MWp) for €2.6 million.
Depreciation and amortisation
Depreciation and amortisation and current operating provisions
increased by €23.9 million to €65.4 million at December 31, 2018.
This was mainly due to the increase in the number of assets in
operation and commissioning of facilities during the period for
+€16.4 million and +€6.6 million respectively.
FROM CURRENT OPERATING INCOME TO OPERATING INCOME2.1.4.3
12.31.2018 12.31.2017
Change Change (in %)
millionsof euros
%of Revenues
millionsof euros
%of Revenues
Revenue 227.6 139.3
Current operating income 109.0 47.9% 60.7 43.6% 48.2 +79.5%
Other Non-Current Operating Income and Expense (7.3) (3.2%) (4.0) (2.9%) (3.3) +83.5%
Non-current Depreciation and amortisation 1.5 0.7% (3.0) (2.2%) 4.6 NA
Operating Income 103.2 45.3% 53.7 38.5% 49.5 +92.1%
Impact of exchange rate fluctuations (5.1) (2.3%)
CURRENT OPERATING INCOME AT CONSTANT
EXCHANGE RATES 108.3 47.6%
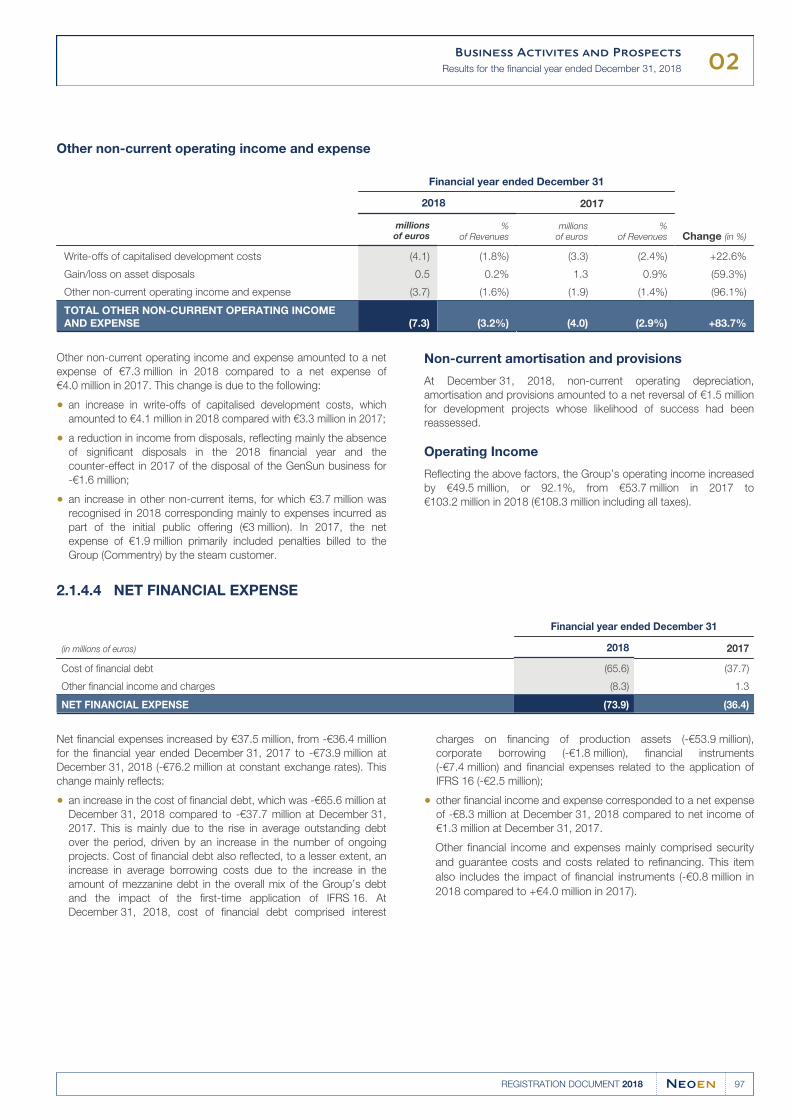
02Business Activites and Prospects
Results for the financial year ended December 31, 2018
97REGISTRATION DOCUMENT 2018
Other non-current operating income and expense
Financial year ended December 31
Change (in %)
2018 2017
millionsof euros
%of Revenues
millionsof euros
%of Revenues
Write-offs of capitalised development costs (4.1) (1.8%) (3.3) (2.4%) +22.6%
Gain/loss on asset disposals 0.5 0.2% 1.3 0.9% (59.3%)
Other non-current operating income and expense (3.7) (1.6%) (1.9) (1.4%) (96.1%)
TOTAL OTHER NON-CURRENT OPERATING INCOME
AND EXPENSE (7.3) (3.2%) (4.0) (2.9%) +83.7%
Other non-current operating income and expense amounted to a net
expense of €7.3 million in 2018 compared to a net expense of
€4.0 million in 2017. This change is due to the following:
an increase in write-offs of capitalised development costs, which●amounted to €4.1 million in 2018 compared with €3.3 million in 2017;
a reduction in income from disposals, reflecting mainly the absence●of significant disposals in the 2018 financial year and the
counter-effect in 2017 of the disposal of the GenSun business for
-€1.6 million;
an increase in other non-current items, for which €3.7 million was●recognised in 2018 corresponding mainly to expenses incurred as
part of the initial public offering (€3 million). In 2017, the net
expense of €1.9 million primarily included penalties billed to the
Group (Commentry) by the steam customer.
Non-current amortisation and provisions
At December 31, 2018, non-current operating depreciation,
amortisation and provisions amounted to a net reversal of €1.5 million
for development projects whose likelihood of success had been
reassessed.
Operating Income
Reflecting the above factors, the Group’s operating income increased
by €49.5 million, or 92.1%, from €53.7 million in 2017 to
€103.2 million in 2018 (€108.3 million including all taxes).
NET FINANCIAL EXPENSE2.1.4.4
(in millions of euros)
Financial year ended December 31
2018 2017
Cost of financial debt (65.6) (37.7)
Other financial income and charges (8.3) 1.3
NET FINANCIAL EXPENSE (73.9) (36.4)
Net financial expenses increased by €37.5 million, from -€36.4 million
for the financial year ended December 31, 2017 to -€73.9 million at
December 31, 2018 (-€76.2 million at constant exchange rates). This
change mainly reflects:
charges on financing of production assets (-€53.9 million),
corporate borrowing (-€1.8 million), financial instruments
(-€7.4 million) and financial expenses related to the application of
IFRS 16 (-€2.5 million);
an increase in the cost of financial debt, which was -€65.6 million at●December 31, 2018 compared to -€37.7 million at December 31,
2017. This is mainly due to the rise in average outstanding debt
over the period, driven by an increase in the number of ongoing
projects. Cost of financial debt also reflected, to a lesser extent, an
increase in average borrowing costs due to the increase in the
amount of mezzanine debt in the overall mix of the Group’s debt
and the impact of the first-time application of IFRS 16. At
December 31, 2018, cost of financial debt comprised interest
other financial income and expense corresponded to a net expense●of -€8.3 million at December 31, 2018 compared to net income of
€1.3 million at December 31, 2017.
Other financial income and expenses mainly comprised security
and guarantee costs and costs related to refinancing. This item
also includes the impact of financial instruments (-€0.8 million in
2018 compared to +€4.0 million in 2017).
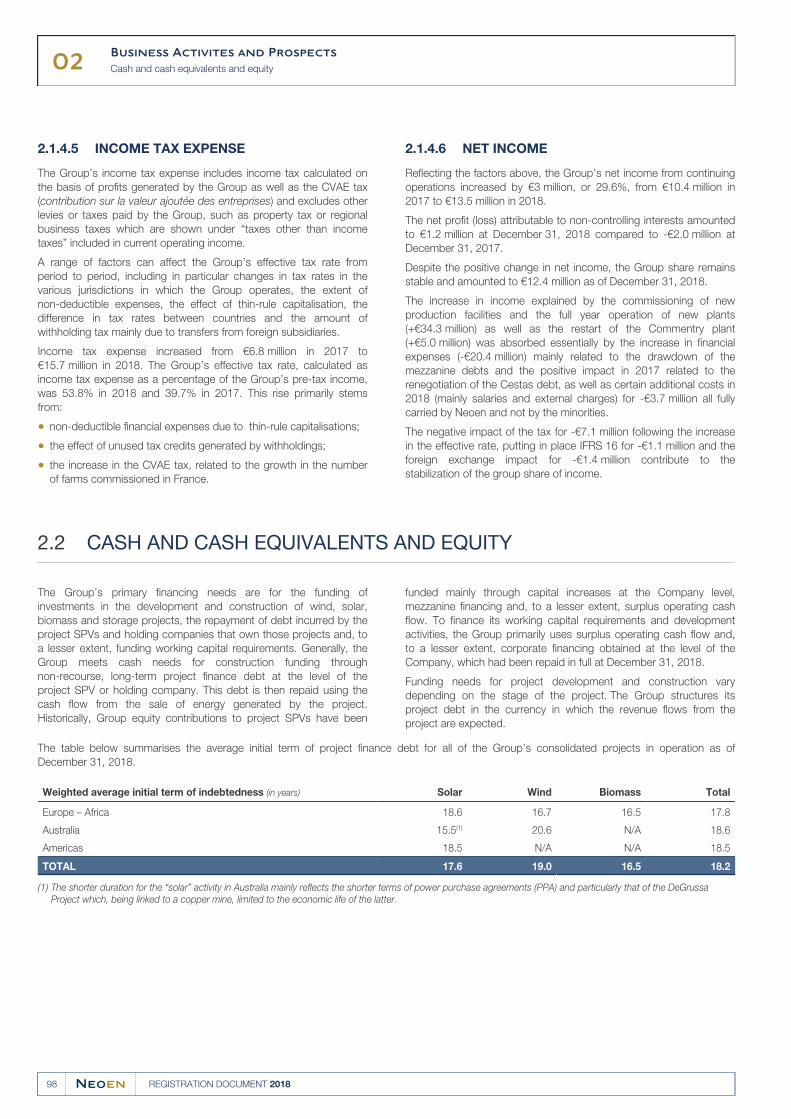
02Business Activites and Prospects
Cash and cash equivalents and equity
98 REGISTRATION DOCUMENT 2018
INCOME TAX EXPENSE2.1.4.5
The Group’s income tax expense includes income tax calculated on
the basis of profits generated by the Group as well as the CVAE tax
(contribution sur la valeur ajoutée des entreprises) and excludes other
levies or taxes paid by the Group, such as property tax or regional
business taxes which are shown under “taxes other than income
taxes” included in current operating income.
A range of factors can affect the Group’s effective tax rate from
period to period, including in particular changes in tax rates in the
various jurisdictions in which the Group operates, the extent of
non-deductible expenses, the effect of thin-rule capitalisation, the
difference in tax rates between countries and the amount of
withholding tax mainly due to transfers from foreign subsidiaries.
Income tax expense increased from €6.8 million in 2017 to
€15.7 million in 2018. The Group’s effective tax rate, calculated as
income tax expense as a percentage of the Group’s pre-tax income,
was 53.8% in 2018 and 39.7% in 2017. This rise primarily stems
from:
non-deductible financial expenses due to thin-rule capitalisations;●
the effect of unused tax credits generated by withholdings;●
the increase in the CVAE tax, related to the growth in the number●of farms commissioned in France.
NET INCOME2.1.4.6
Reflecting the factors above, the Group’s net income from continuing
operations increased by €3 million, or 29.6%, from €10.4 million in
2017 to €13.5 million in 2018.
The net profit (loss) attributable to non-controlling interests amounted
to €1.2 million at December 31, 2018 compared to -€2.0 million at
December 31, 2017.
Despite the positive change in net income, the Group share remains
stable and amounted to €12.4 million as of December 31, 2018.
The increase in income explained by the commissioning of new
production facilities and the full year operation of new plants
(+€34.3 million) as well as the restart of the Commentry plant
(+€5.0 million) was absorbed essentially by the increase in financial
expenses (-€20.4 million) mainly related to the drawdown of the
mezzanine debts and the positive impact in 2017 related to the
renegotiation of the Cestas debt, as well as certain additional costs in
2018 (mainly salaries and external charges) for -€3.7 million all fully
carried by Neoen and not by the minorities.
The negative impact of the tax for -€7.1 million following the increase
in the effective rate, putting in place IFRS 16 for -€1.1 million and the
foreign exchange impact for -€1.4 million contribute to the
stabilization of the group share of income.
CASH AND CASH EQUIVALENTS AND EQUITY2.2
The Group’s primary financing needs are for the funding of funded mainly through capital increases at the Company level,
investments in the development and construction of wind, solar, mezzanine financing and, to a lesser extent, surplus operating cash
biomass and storage projects, the repayment of debt incurred by the flow. To finance its working capital requirements and development
project SPVs and holding companies that own those projects and, to activities, the Group primarily uses surplus operating cash flow and,
a lesser extent, funding working capital requirements. Generally, the to a lesser extent, corporate financing obtained at the level of the
Group meets cash needs for construction funding through Company, which had been repaid in full at December 31, 2018.
non-recourse, long-term project finance debt at the level of the
project SPV or holding company. This debt is then repaid using the
cash flow from the sale of energy generated by the project.
Historically, Group equity contributions to project SPVs have been
Funding needs for project development and construction vary
depending on the stage of the project. The Group structures its
project debt in the currency in which the revenue flows from the
project are expected.
The table below summarises the average initial term of project finance debt for all of the Group’s consolidated projects in operation as of
December 31, 2018.
Weighted average initial term of indebtedness (in years) Solar Wind Biomass Total
Europe – Africa 18.6 16.7 16.5 17.8
Australia 15.5(1) 20.6 N/A 18.6
Americas 18.5 N/A N/A 18.5
TOTAL 17.6 19.0 16.5 18.2
The shorter duration for the “solar” activity in Australia mainly reflects the shorter terms of power purchase agreements (PPA) and particularly that of the DeGrussa (1)
Project which, being linked to a copper mine, limited to the economic life of the latter.
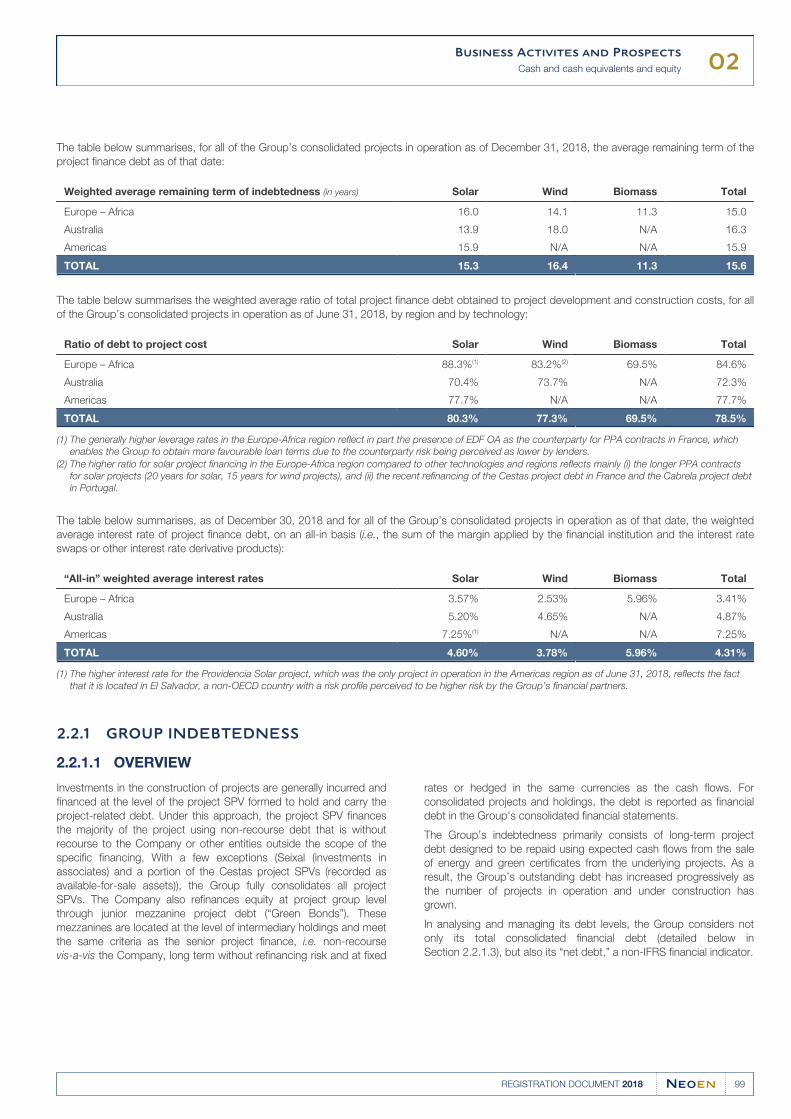
02Business Activites and Prospects
Cash and cash equivalents and equity
99REGISTRATION DOCUMENT 2018
The table below summarises, for all of the Group’s consolidated projects in operation as of December 31, 2018, the average remaining term of the
project finance debt as of that date:
Weighted average remaining term of indebtedness (in years) Solar Wind Biomass Total
Europe – Africa 16.0 14.1 11.3 15.0
Australia 13.9 18.0 N/A 16.3
Americas 15.9 N/A N/A 15.9
TOTAL 15.3 16.4 11.3 15.6
The table below summarises the weighted average ratio of total project finance debt obtained to project development and construction costs, for all
of the Group’s consolidated projects in operation as of June 31, 2018, by region and by technology:
Ratio of debt to project cost Solar Wind Biomass Total
Europe – Africa 88.3%(1) 83.2%(2) 69.5% 84.6%
Australia 70.4% 73.7% N/A 72.3%
Americas 77.7% N/A N/A 77.7%
TOTAL 80.3% 77.3% 69.5% 78.5%
The generally higher leverage rates in the Europe-Africa region reflect in part the presence of EDF OA as the counterparty for PPA contracts in France, which (1)
enables the Group to obtain more favourable loan terms due to the counterparty risk being perceived as lower by lenders.
The higher ratio for solar project financing in the Europe-Africa region compared to other technologies and regions reflects mainly (i) the longer PPA contracts (2)
for solar projects (20 years for solar, 15 years for wind projects), and (ii) the recent refinancing of the Cestas project debt in France and the Cabrela project debt
in Portugal.
The table below summarises, as of December 30, 2018 and for all of the Group’s consolidated projects in operation as of that date, the weighted
average interest rate of project finance debt, on an all-in basis (i.e., the sum of the margin applied by the financial institution and the interest rate
swaps or other interest rate derivative products):
“All-in” weighted average interest rates Solar Wind Biomass Total
Europe – Africa 3.57% 2.53% 5.96% 3.41%
Australia 5.20% 4.65% N/A 4.87%
Americas 7.25%(1) N/A N/A 7.25%
TOTAL 4.60% 3.78% 5.96% 4.31%
The higher interest rate for the Providencia Solar project, which was the only project in operation in the Americas region as of June 31, 2018, reflects the fact (1)
that it is located in El Salvador, a non-OECD country with a risk profile perceived to be higher risk by the Group’s financial partners.
GROUP INDEBTEDNESS2.2.1
OVERVIEW2.2.1.1
Investments in the construction of projects are generally incurred and rates or hedged in the same currencies as the cash flows. For
financed at the level of the project SPV formed to hold and carry the consolidated projects and holdings, the debt is reported as financial
project-related debt. Under this approach, the project SPV finances debt in the Group's consolidated financial statements.
the majority of the project using non-recourse debt that is without
recourse to the Company or other entities outside the scope of the
specific financing. With a few exceptions (Seixal (investments in
associates) and a portion of the Cestas project SPVs (recorded as
available-for-sale assets)), the Group fully consolidates all project
SPVs. The Company also refinances equity at project group level
through junior mezzanine project debt (“Green Bonds”). These
mezzanines are located at the level of intermediary holdings and meet
the same criteria as the senior project finance, i.e. non-recourse
vis-a-vis the Company, long term without refinancing risk and at fixed
The Group’s indebtedness primarily consists of long-term project
debt designed to be repaid using expected cash flows from the sale
of energy and green certificates from the underlying projects. As a
result, the Group’s outstanding debt has increased progressively as
the number of projects in operation and under construction has
grown.
In analysing and managing its debt levels, the Group considers not
only its total consolidated financial debt (detailed below in
Section 2.2.1.3), but also its “net debt,” a non-IFRS financial indicator.
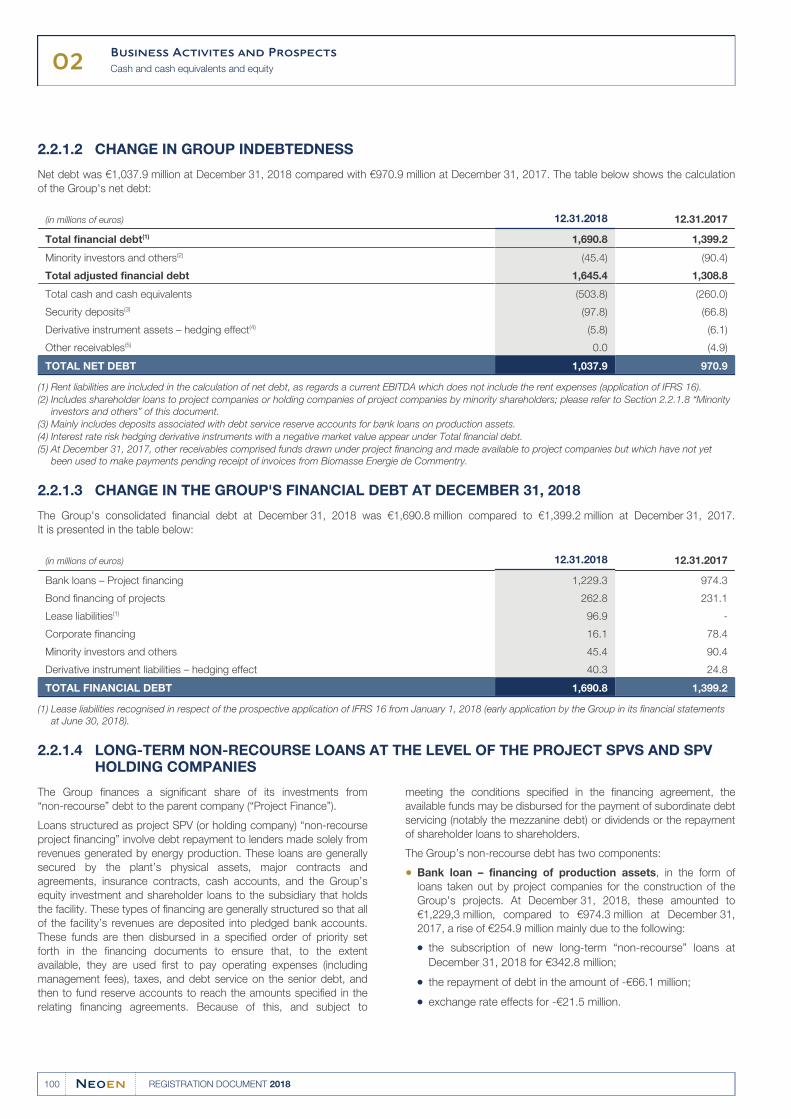
02Business Activites and Prospects
Cash and cash equivalents and equity
100 REGISTRATION DOCUMENT 2018
CHANGE IN GROUP INDEBTEDNESS2.2.1.2
Net debt was €1,037.9 million at December 31, 2018 compared with €970.9 million at December 31, 2017. The table below shows the calculation
of the Group's net debt:
(in millions of euros) 12.31.2018 12.31.2017
Total financial debt(1) 1,690.8 1,399.2
Minority investors and others(2) (45.4) (90.4)
Total adjusted financial debt 1,645.4 1,308.8
Total cash and cash equivalents (503.8) (260.0)
Security deposits(3) (97.8) (66.8)
Derivative instrument assets – hedging effect(4) (5.8) (6.1)
Other receivables(5) 0.0 (4.9)
TOTAL NET DEBT 1,037.9 970.9
Rent liabilities are included in the calculation of net debt, as regards a current EBITDA which does not include the rent expenses (application of IFRS 16).(1)
Includes shareholder loans to project companies or holding companies of project companies by minority shareholders; please refer to Section 2.2.1.8 “Minority (2)
investors and others” of this document.
Mainly includes deposits associated with debt service reserve accounts for bank loans on production assets.(3)
Interest rate risk hedging derivative instruments with a negative market value appear under Total financial debt.(4)
At December 31, 2017, other receivables comprised funds drawn under project financing and made available to project companies but which have not yet (5)
been used to make payments pending receipt of invoices from Biomasse Energie de Commentry.
CHANGE IN THE GROUP'S FINANCIAL DEBT AT DECEMBER 31, 20182.2.1.3
The Group's consolidated financial debt at December 31, 2018 was €1,690.8 million compared to €1,399.2 million at December 31, 2017.
It is presented in the table below:
(in millions of euros) 12.31.2018 12.31.2017
Bank loans – Project financing 1,229.3 974.3
Bond financing of projects 262.8 231.1
Lease liabilities(1) 96.9 -
Corporate financing 16.1 78.4
Minority investors and others 45.4 90.4
Derivative instrument liabilities – hedging effect 40.3 24.8
TOTAL FINANCIAL DEBT 1,690.8 1,399.2
Lease liabilities recognised in respect of the prospective application of IFRS 16 from January 1, 2018 (early application by the Group in its financial statements (1)
at June 30, 2018).
LONG-TERM NON-RECOURSE LOANS AT THE LEVEL OF THE PROJECT SPVS AND SPV 2.2.1.4HOLDING COMPANIES
The Group finances a significant share of its investments from
“non-recourse” debt to the parent company (“Project Finance”).
meeting the conditions specified in the financing agreement, the
available funds may be disbursed for the payment of subordinate debt
servicing (notably the mezzanine debt) or dividends or the repaymentLoans structured as project SPV (or holding company) “non-recourseof shareholder loans to shareholders.project financing” involve debt repayment to lenders made solely from
revenues generated by energy production. These loans are generally
secured by the plant’s physical assets, major contracts and
agreements, insurance contracts, cash accounts, and the Group’s
equity investment and shareholder loans to the subsidiary that holds
the facility. These types of financing are generally structured so that all
of the facility’s revenues are deposited into pledged bank accounts.
These funds are then disbursed in a specified order of priority set
forth in the financing documents to ensure that, to the extent
available, they are used first to pay operating expenses (including
management fees), taxes, and debt service on the senior debt, and
then to fund reserve accounts to reach the amounts specified in the
relating financing agreements. Because of this, and subject to
The Group’s non-recourse debt has two components:
Bank loan – financing of production assets, in the form of●loans taken out by project companies for the construction of the
Group's projects. At December 31, 2018, these amounted to
€1,229,3 million, compared to €974.3 million at December 31,
2017, a rise of €254.9 million mainly due to the following:
the subscription of new long-term “non-recourse” loans at●December 31, 2018 for €342.8 million;
the repayment of debt in the amount of -€66.1 million;●
exchange rate effects for -€21.5 million.●
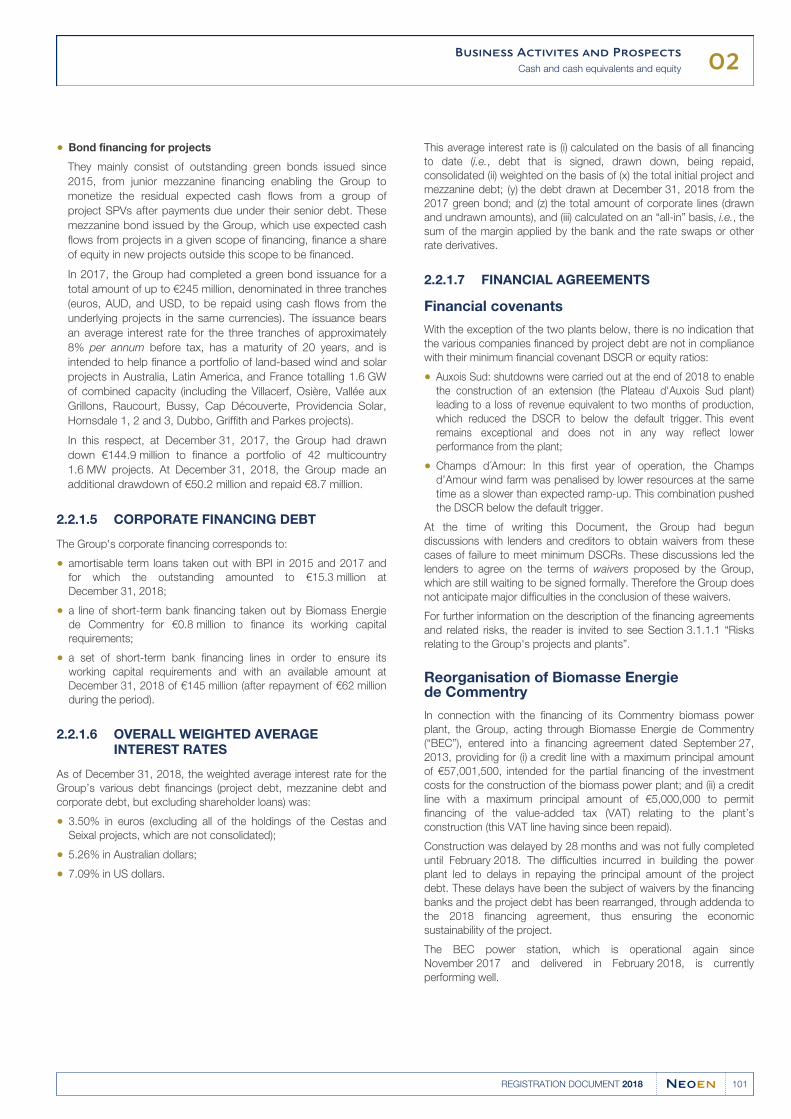
02Business Activites and Prospects
Cash and cash equivalents and equity
101REGISTRATION DOCUMENT 2018
Bond financing for projects●
They mainly consist of outstanding green bonds issued since
2015, from junior mezzanine financing enabling the Group to
monetize the residual expected cash flows from a group of
project SPVs after payments due under their senior debt. These
mezzanine bond issued by the Group, which use expected cash
flows from projects in a given scope of financing, finance a share
of equity in new projects outside this scope to be financed.
In 2017, the Group had completed a green bond issuance for a
total amount of up to €245 million, denominated in three tranches
(euros, AUD, and USD, to be repaid using cash flows from the
underlying projects in the same currencies). The issuance bears
an average interest rate for the three tranches of approximately
8% per annum before tax, has a maturity of 20 years, and is
intended to help finance a portfolio of land-based wind and solar
projects in Australia, Latin America, and France totalling 1.6 GW
of combined capacity (including the Villacerf, Osière, Vallée aux
Grillons, Raucourt, Bussy, Cap Découverte, Providencia Solar,
Hornsdale 1, 2 and 3, Dubbo, Griffith and Parkes projects).
In this respect, at December 31, 2017, the Group had drawn
down €144.9 million to finance a portfolio of 42 multicountry
1.6 MW projects. At December 31, 2018, the Group made an
additional drawdown of €50.2 million and repaid €8.7 million.
CORPORATE FINANCING DEBT2.2.1.5
The Group's corporate financing corresponds to:
amortisable term loans taken out with BPI in 2015 and 2017 and●for which the outstanding amounted to €15.3 million at
December 31, 2018;
a line of short-term bank financing taken out by Biomass Energie●de Commentry for €0.8 million to finance its working capital
requirements;
a set of short-term bank financing lines in order to ensure its●working capital requirements and with an available amount at
December 31, 2018 of €145 million (after repayment of €62 million
during the period).
OVERALL WEIGHTED AVERAGE 2.2.1.6INTEREST RATES
As of December 31, 2018, the weighted average interest rate for the
Group’s various debt financings (project debt, mezzanine debt and
corporate debt, but excluding shareholder loans) was:
3.50% in euros (excluding all of the holdings of the Cestas and●Seixal projects, which are not consolidated);
5.26% in Australian dollars;●
7.09% in US dollars.●
This average interest rate is (i) calculated on the basis of all financing
to date (i.e., debt that is signed, drawn down, being repaid,
consolidated (ii) weighted on the basis of (x) the total initial project and
mezzanine debt; (y) the debt drawn at December 31, 2018 from the
2017 green bond; and (z) the total amount of corporate lines (drawn
and undrawn amounts), and (iii) calculated on an “all-in” basis, i.e., the
sum of the margin applied by the bank and the rate swaps or other
rate derivatives.
FINANCIAL AGREEMENTS2.2.1.7
Financial covenants
With the exception of the two plants below, there is no indication that
the various companies financed by project debt are not in compliance
with their minimum financial covenant DSCR or equity ratios:
Auxois Sud: shutdowns were carried out at the end of 2018 to enable●the construction of an extension (the Plateau d'Auxois Sud plant)
leading to a loss of revenue equivalent to two months of production,
which reduced the DSCR to below the default trigger. This event
remains exceptional and does not in any way reflect lower
performance from the plant;
Champs d´Amour: In this first year of operation, the Champs●d’Amour wind farm was penalised by lower resources at the same
time as a slower than expected ramp-up. This combination pushed
the DSCR below the default trigger.
At the time of writing this Document, the Group had begun
discussions with lenders and creditors to obtain waivers from these
cases of failure to meet minimum DSCRs. These discussions led the
lenders to agree on the terms of waivers proposed by the Group,
which are still waiting to be signed formally. Therefore the Group does
not anticipate major difficulties in the conclusion of these waivers.
For further information on the description of the financing agreements
and related risks, the reader is invited to see Section 3.1.1.1 “Risks
relating to the Group's projects and plants”.
Reorganisation of Biomasse Energie de Commentry
In connection with the financing of its Commentry biomass power
plant, the Group, acting through Biomasse Energie de Commentry
(“BEC”), entered into a financing agreement dated September 27,
2013, providing for (i) a credit line with a maximum principal amount
of €57,001,500, intended for the partial financing of the investment
costs for the construction of the biomass power plant; and (ii) a credit
line with a maximum principal amount of €5,000,000 to permit
financing of the value-added tax (VAT) relating to the plant’s
construction (this VAT line having since been repaid).
Construction was delayed by 28 months and was not fully completed
until February 2018. The difficulties incurred in building the power
plant led to delays in repaying the principal amount of the project
debt. These delays have been the subject of waivers by the financing
banks and the project debt has been rearranged, through addenda to
the 2018 financing agreement, thus ensuring the economic
sustainability of the project.
The BEC power station, which is operational again since
November 2017 and delivered in February 2018, is currently
performing well.
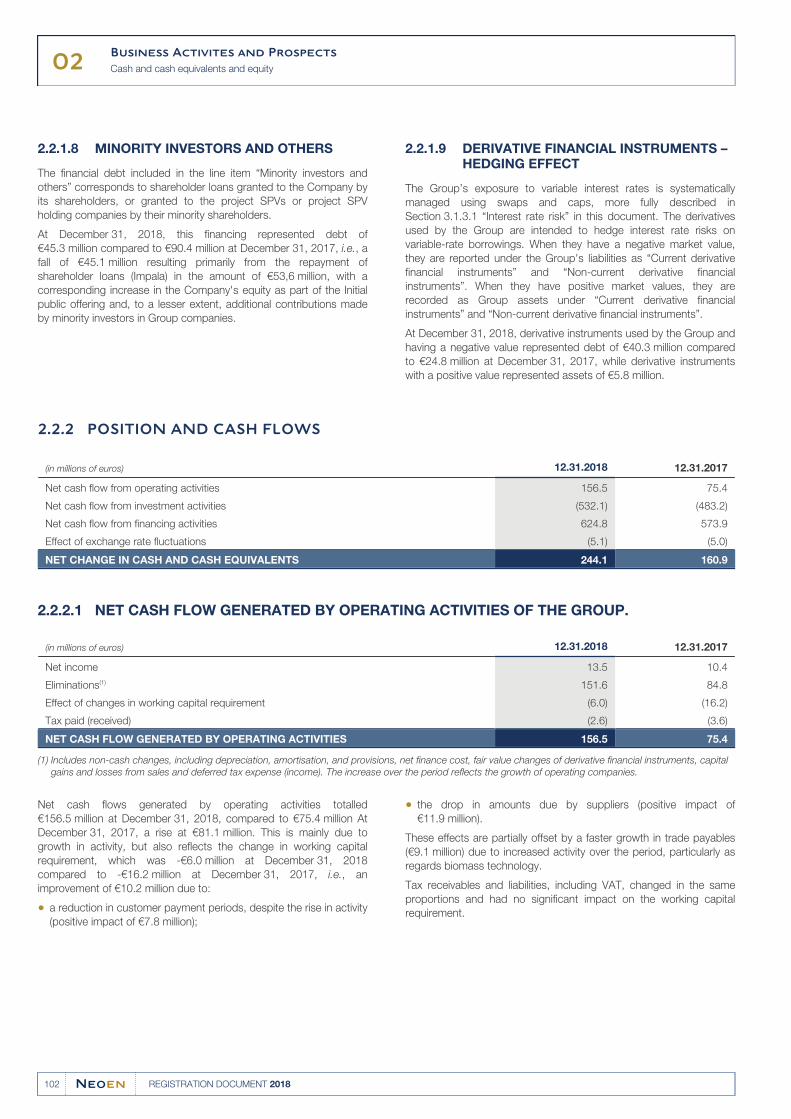
02Business Activites and Prospects
Cash and cash equivalents and equity
102 REGISTRATION DOCUMENT 2018
MINORITY INVESTORS AND OTHERS2.2.1.8
The financial debt included in the line item “Minority investors and
others” corresponds to shareholder loans granted to the Company by
its shareholders, or granted to the project SPVs or project SPV
holding companies by their minority shareholders.
At December 31, 2018, this financing represented debt of
€45.3 million compared to €90.4 million at December 31, 2017, i.e., a
fall of €45.1 million resulting primarily from the repayment of
shareholder loans (Impala) in the amount of €53,6 million, with a
corresponding increase in the Company's equity as part of the Initial
public offering and, to a lesser extent, additional contributions made
by minority investors in Group companies.
DERIVATIVE FINANCIAL INSTRUMENTS – 2.2.1.9HEDGING EFFECT
The Group’s exposure to variable interest rates is systematically
managed using swaps and caps, more fully described in
Section 3.1.3.1 “Interest rate risk” in this document. The derivatives
used by the Group are intended to hedge interest rate risks on
variable-rate borrowings. When they have a negative market value,
they are reported under the Group's liabilities as “Current derivative
financial instruments” and “Non-current derivative financial
instruments”. When they have positive market values, they are
recorded as Group assets under “Current derivative financial
instruments” and “Non-current derivative financial instruments”.
At December 31, 2018, derivative instruments used by the Group and
having a negative value represented debt of €40.3 million compared
to €24.8 million at December 31, 2017, while derivative instruments
with a positive value represented assets of €5.8 million.
POSITION AND CASH FLOWS2.2.2
(in millions of euros) 12.31.2018 12.31.2017
Net cash flow from operating activities 156.5 75.4
Net cash flow from investment activities (532.1) (483.2)
Net cash flow from financing activities 624.8 573.9
Effect of exchange rate fluctuations (5.1) (5.0)
NET CHANGE IN CASH AND CASH EQUIVALENTS 244.1 160.9
NET CASH FLOW GENERATED BY OPERATING ACTIVITIES OF THE GROUP.2.2.2.1
(in millions of euros) 12.31.2018 12.31.2017
Net income 13.5 10.4
Eliminations(1) 151.6 84.8
Effect of changes in working capital requirement (6.0) (16.2)
Tax paid (received) (2.6) (3.6)
NET CASH FLOW GENERATED BY OPERATING ACTIVITIES 156.5 75.4
Includes non-cash changes, including depreciation, amortisation, and provisions, net finance cost, fair value changes of derivative financial instruments, capital (1)
gains and losses from sales and deferred tax expense (income). The increase over the period reflects the growth of operating companies.
Net cash flows generated by operating activities totalled
€156.5 million at December 31, 2018, compared to €75.4 million At
December 31, 2017, a rise at €81.1 million. This is mainly due to
growth in activity, but also reflects the change in working capital
requirement, which was -€6.0 million at December 31, 2018
compared to -€16.2 million at December 31, 2017, i.e., an
improvement of €10.2 million due to:
a reduction in customer payment periods, despite the rise in activity●(positive impact of €7.8 million);
the drop in amounts due by suppliers (positive impact of●€11.9 million).
These effects are partially offset by a faster growth in trade payables
(€9.1 million) due to increased activity over the period, particularly as
regards biomass technology.
Tax receivables and liabilities, including VAT, changed in the same
proportions and had no significant impact on the working capital
requirement.
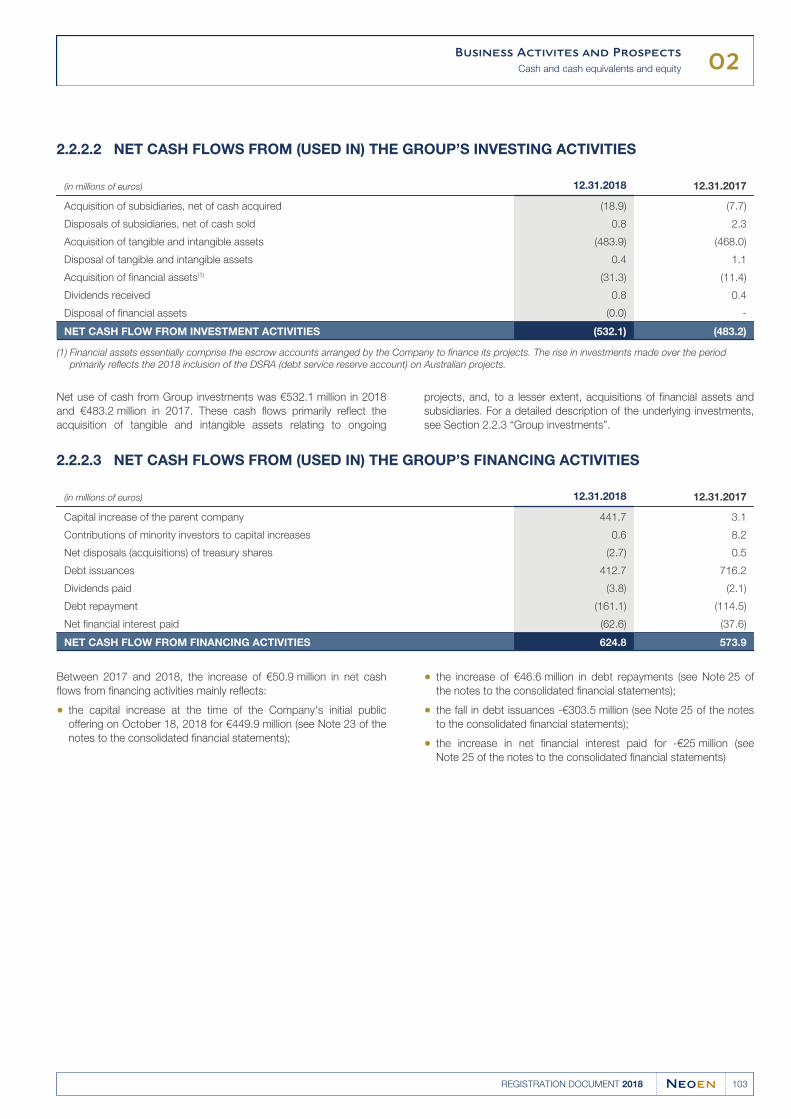
02Business Activites and Prospects
Cash and cash equivalents and equity
103REGISTRATION DOCUMENT 2018
NET CASH FLOWS FROM (USED IN) THE GROUP’S INVESTING ACTIVITIES2.2.2.2
(in millions of euros) 12.31.2018 12.31.2017
Acquisition of subsidiaries, net of cash acquired (18.9) (7.7)
Disposals of subsidiaries, net of cash sold 0.8 2.3
Acquisition of tangible and intangible assets (483.9) (468.0)
Disposal of tangible and intangible assets 0.4 1.1
Acquisition of financial assets(1) (31.3) (11.4)
Dividends received 0.8 0.4
Disposal of financial assets (0.0) -
NET CASH FLOW FROM INVESTMENT ACTIVITIES (532.1) (483.2)
Financial assets essentially comprise the escrow accounts arranged by the Company to finance its projects. The rise in investments made over the period (1)
primarily reflects the 2018 inclusion of the DSRA (debt service reserve account) on Australian projects.
Net use of cash from Group investments was €532.1 million in 2018 projects, and, to a lesser extent, acquisitions of financial assets and
and €483.2 million in 2017. These cash flows primarily reflect the subsidiaries. For a detailed description of the underlying investments,
acquisition of tangible and intangible assets relating to ongoing see Section 2.2.3 “Group investments”.
NET CASH FLOWS FROM (USED IN) THE GROUP’S FINANCING ACTIVITIES2.2.2.3
(in millions of euros) 12.31.2018 12.31.2017
Capital increase of the parent company 441.7 3.1
Contributions of minority investors to capital increases 0.6 8.2
Net disposals (acquisitions) of treasury shares (2.7) 0.5
Debt issuances 412.7 716.2
Dividends paid (3.8) (2.1)
Debt repayment (161.1) (114.5)
Net financial interest paid (62.6) (37.6)
NET CASH FLOW FROM FINANCING ACTIVITIES 624.8 573.9
Between 2017 and 2018, the increase of €50.9 million in net cash
flows from financing activities mainly reflects:
the capital increase at the time of the Company's initial public●offering on October 18, 2018 for €449.9 million (see Note 23 of the
notes to the consolidated financial statements);
the increase of €46.6 million in debt repayments (see Note 25 of●the notes to the consolidated financial statements);
the fall in debt issuances -€303.5 million (see Note 25 of the notes●to the consolidated financial statements);
the increase in net financial interest paid for -€25 million (see●Note 25 of the notes to the consolidated financial statements)
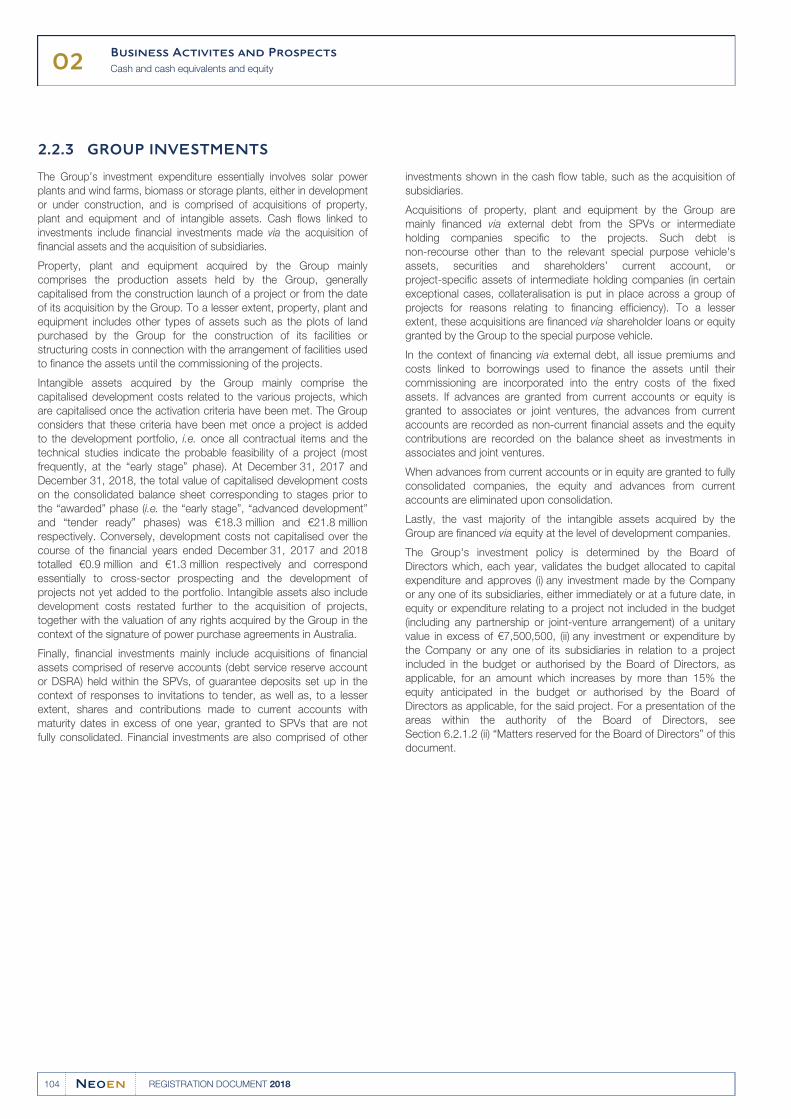
02Business Activites and Prospects
Cash and cash equivalents and equity
104 REGISTRATION DOCUMENT 2018
GROUP INVESTMENTS2.2.3
The Group’s investment expenditure essentially involves solar power
plants and wind farms, biomass or storage plants, either in development
or under construction, and is comprised of acquisitions of property,
plant and equipment and of intangible assets. Cash flows linked to
investments include financial investments made via the acquisition of
financial assets and the acquisition of subsidiaries.
Property, plant and equipment acquired by the Group mainly
comprises the production assets held by the Group, generally
capitalised from the construction launch of a project or from the date
of its acquisition by the Group. To a lesser extent, property, plant and
equipment includes other types of assets such as the plots of land
purchased by the Group for the construction of its facilities or
structuring costs in connection with the arrangement of facilities used
to finance the assets until the commissioning of the projects.
Intangible assets acquired by the Group mainly comprise the
capitalised development costs related to the various projects, which
are capitalised once the activation criteria have been met. The Group
considers that these criteria have been met once a project is added
to the development portfolio, i.e. once all contractual items and the
technical studies indicate the probable feasibility of a project (most
frequently, at the “early stage” phase). At December 31, 2017 and
December 31, 2018, the total value of capitalised development costs
on the consolidated balance sheet corresponding to stages prior to
the “awarded” phase (i.e. the “early stage”, “advanced development”
and “tender ready” phases) was €18.3 million and €21.8 million
respectively. Conversely, development costs not capitalised over the
course of the financial years ended December 31, 2017 and 2018
totalled €0.9 million and €1.3 million respectively and correspond
essentially to cross-sector prospecting and the development of
projects not yet added to the portfolio. Intangible assets also include
development costs restated further to the acquisition of projects,
together with the valuation of any rights acquired by the Group in the
context of the signature of power purchase agreements in Australia.
investments shown in the cash flow table, such as the acquisition of
subsidiaries.
Finally, financial investments mainly include acquisitions of financial
assets comprised of reserve accounts (debt service reserve account
or DSRA) held within the SPVs, of guarantee deposits set up in the
context of responses to invitations to tender, as well as, to a lesser
extent, shares and contributions made to current accounts with
maturity dates in excess of one year, granted to SPVs that are not
fully consolidated. Financial investments are also comprised of other
Acquisitions of property, plant and equipment by the Group are
mainly financed via external debt from the SPVs or intermediate
holding companies specific to the projects. Such debt is
non-recourse other than to the relevant special purpose vehicle's
assets, securities and shareholders’ current account, or
project-specific assets of intermediate holding companies (in certain
exceptional cases, collateralisation is put in place across a group of
projects for reasons relating to financing efficiency). To a lesser
extent, these acquisitions are financed via shareholder loans or equity
granted by the Group to the special purpose vehicle.
In the context of financing via external debt, all issue premiums and
costs linked to borrowings used to finance the assets until their
commissioning are incorporated into the entry costs of the fixed
assets. If advances are granted from current accounts or equity is
granted to associates or joint ventures, the advances from current
accounts are recorded as non-current financial assets and the equity
contributions are recorded on the balance sheet as investments in
associates and joint ventures.
When advances from current accounts or in equity are granted to fully
consolidated companies, the equity and advances from current
accounts are eliminated upon consolidation.
Lastly, the vast majority of the intangible assets acquired by the
Group are financed via equity at the level of development companies.
The Group's investment policy is determined by the Board of
Directors which, each year, validates the budget allocated to capital
expenditure and approves (i) any investment made by the Company
or any one of its subsidiaries, either immediately or at a future date, in
equity or expenditure relating to a project not included in the budget
(including any partnership or joint-venture arrangement) of a unitary
value in excess of €7,500,500, (ii) any investment or expenditure by
the Company or any one of its subsidiaries in relation to a project
included in the budget or authorised by the Board of Directors, as
applicable, for an amount which increases by more than 15% the
equity anticipated in the budget or authorised by the Board of
Directors as applicable, for the said project. For a presentation of the
areas within the authority of the Board of Directors, see
Section 6.2.1.2 (ii) “Matters reserved for the Board of Directors” of this
document.
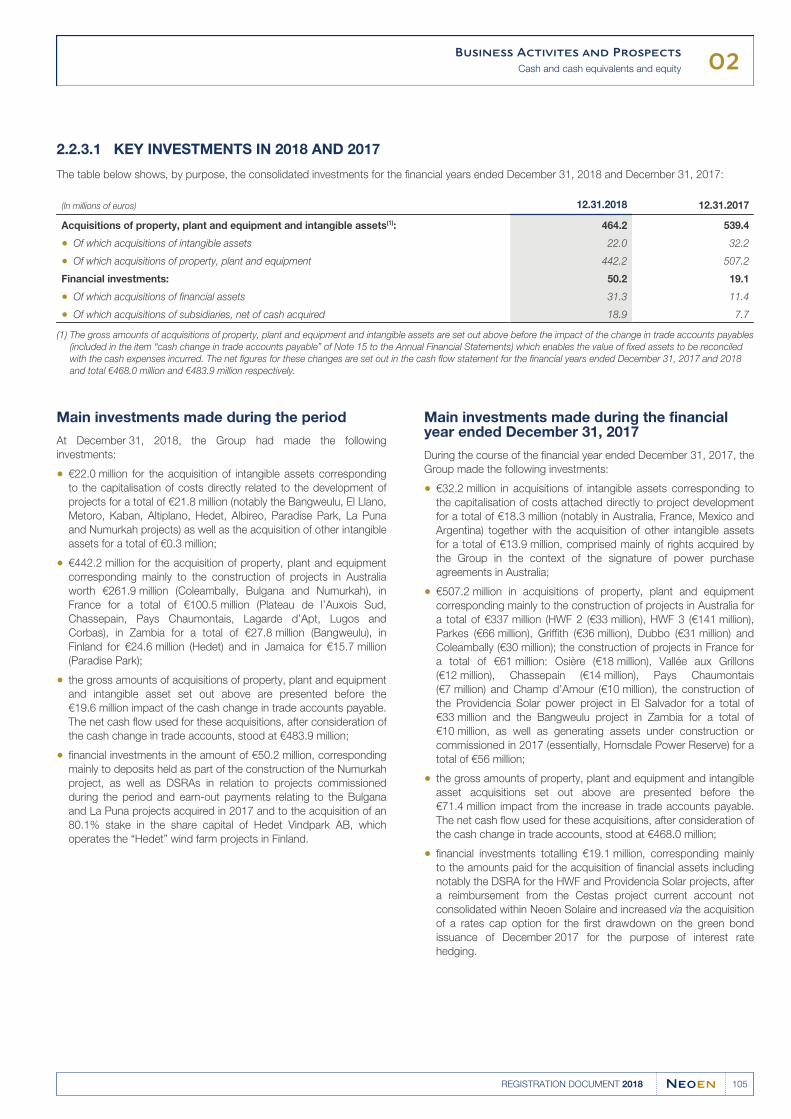
02Business Activites and Prospects
Cash and cash equivalents and equity
105REGISTRATION DOCUMENT 2018
KEY INVESTMENTS IN 2018 AND 20172.2.3.1
The table below shows, by purpose, the consolidated investments for the financial years ended December 31, 2018 and December 31, 2017:
(In millions of euros) 12.31.2018 12.31.2017
Acquisitions of property, plant and equipment and intangible assets(1): 464.2 539.4
Of which acquisitions of intangible assets● 22.0 32.2
Of which acquisitions of property, plant and equipment● 442.2 507.2
Financial investments: 50.2 19.1
Of which acquisitions of financial assets● 31.3 11.4
Of which acquisitions of subsidiaries, net of cash acquired● 18.9 7.7
The gross amounts of acquisitions of property, plant and equipment and intangible assets are set out above before the impact of the change in trade accounts payables (1)
(included in the item “cash change in trade accounts payable” of Note 15 to the Annual Financial Statements) which enables the value of fixed assets to be reconciled
with the cash expenses incurred. The net figures for these changes are set out in the cash flow statement for the financial years ended December 31, 2017 and 2018
and total €468.0 million and €483.9 million respectively.
Main investments made during the period
At December 31, 2018, the Group had made the following
investments:
€22.0 million for the acquisition of intangible assets corresponding●to the capitalisation of costs directly related to the development of
projects for a total of €21.8 million (notably the Bangweulu, El Llano,
Metoro, Kaban, Altiplano, Hedet, Albireo, Paradise Park, La Puna
and Numurkah projects) as well as the acquisition of other intangible
assets for a total of €0.3 million;
€442.2 million for the acquisition of property, plant and equipment●corresponding mainly to the construction of projects in Australia
worth €261.9 million (Coleambally, Bulgana and Numurkah), in
France for a total of €100.5 million (Plateau de l’Auxois Sud,
Chassepain, Pays Chaumontais, Lagarde d’Apt, Lugos and
Corbas), in Zambia for a total of €27.8 million (Bangweulu), in
Finland for €24.6 million (Hedet) and in Jamaica for €15.7 million
(Paradise Park);
the gross amounts of acquisitions of property, plant and equipment●and intangible asset set out above are presented before the
€19.6 million impact of the cash change in trade accounts payable.
The net cash flow used for these acquisitions, after consideration of
the cash change in trade accounts, stood at €483.9 million;
financial investments in the amount of €50.2 million, corresponding●mainly to deposits held as part of the construction of the Numurkah
project, as well as DSRAs in relation to projects commissioned
during the period and earn-out payments relating to the Bulgana
and La Puna projects acquired in 2017 and to the acquisition of an
80.1% stake in the share capital of Hedet Vindpark AB, which
operates the “Hedet” wind farm projects in Finland.
Main investments made during the financial year ended December 31, 2017
During the course of the financial year ended December 31, 2017, the
Group made the following investments:
€32.2 million in acquisitions of intangible assets corresponding to●the capitalisation of costs attached directly to project development
for a total of €18.3 million (notably in Australia, France, Mexico and
Argentina) together with the acquisition of other intangible assets
for a total of €13.9 million, comprised mainly of rights acquired by
the Group in the context of the signature of power purchase
agreements in Australia;
€507.2 million in acquisitions of property, plant and equipment●corresponding mainly to the construction of projects in Australia for
a total of €337 million (HWF 2 (€33 million), HWF 3 (€141 million),
Parkes (€66 million), Griffith (€36 million), Dubbo (€31 million) and
Coleambally (€30 million); the construction of projects in France for
a total of €61 million: Osière (€18 million), Vallée aux Grillons
(€12 million), Chassepain (€14 million), Pays Chaumontais
(€7 million) and Champ d’Amour (€10 million), the construction of
the Providencia Solar power project in El Salvador for a total of
€33 million and the Bangweulu project in Zambia for a total of
€10 million, as well as generating assets under construction or
commissioned in 2017 (essentially, Hornsdale Power Reserve) for a
total of €56 million;
the gross amounts of property, plant and equipment and intangible●asset acquisitions set out above are presented before the
€71.4 million impact from the increase in trade accounts payable.
The net cash flow used for these acquisitions, after consideration of
the cash change in trade accounts, stood at €468.0 million;
financial investments totalling €19.1 million, corresponding mainly●to the amounts paid for the acquisition of financial assets including
notably the DSRA for the HWF and Providencia Solar projects, after
a reimbursement from the Cestas project current account not
consolidated within Neoen Solaire and increased via the acquisition
of a rates cap option for the first drawdown on the green bond
issuance of December 2017 for the purpose of interest rate
hedging.
02Business Activites and Prospects
Information about trends and objectives
106 REGISTRATION DOCUMENT 2018
KEY INVESTMENTS CURRENTLY 2.2.3.2UNDERWAY
As of the date of this document, the Group's key investments
underway correspond to projects under construction or in
development for which investments and expenses have been
incurred.
KEY INVESTMENTS ENVISAGED2.2.3.3
Neoen pursues a “develop-to-own” strategy under which it develops
its projects with the intention to continue to own and operate the
assets post-construction. In this context, the investments which the
Group is considering making in the future will consist primarily of
(i) the continuous flow of new projects into this portfolio and
(ii) progressing the projects which form the Group's portfolio at more
advanced stages up until the commissioning of the facilities.
INFORMATION ABOUT TRENDS AND OBJECTIVES2.3
TRENDS AND OBJECTIVES2.3.1
The objectives and trends presented below result from the Group's
strategies and are based on data, assumptions and estimates which
are considered reasonable by the Group as of the date of this
document. Such data, assumptions and estimates are subject to
change or modification based on uncertainties in the economic,
financial, competitive and regulatory environment that impact the
Group or in response to other factors the Company is unaware of at
the time of writing. In particular, the occurrence of one or more of the
risks described in Section 3 “Risk factors” in this document could
have an impact on the Group’s business, results, financial condition
or prospects and adversely affect its ability to achieve the objectives
presented below. Moreover, the Group does not guarantee and can
give no assurance that the objectives described in this section will be
achieved.
The aims of the Group over the short and medium term are the
following:
Capacity growth. The Group’s objective is to achieve total●capacity in operation and under construction by the end of 2021 of
at least 5 GW, the entirety of which would be in operation by the
end of 2022, balanced between its three principal geographic
regions (Europe - Africa, Australia, Americas), with no major shift in
terms of the technology (i.e., solar and wind) mix reflected in its
secured portfolio of projects as of December 2018 (i.e. projects in
operation, under construction or awarded). Attaining this objective
requires transformation of its portfolio of secured projects and
projects under development which amounted at the end of 2018 to
7.7 GW (including operational projects and those under
construction). Further, the Group plans to continue developing the
storage activity, to facilitate the integration of solar plants and wind
farms (“behind the meter” batteries ) and independent batteries
directly connected to the grids to supply balancing and regulation
services. The activity of independent batteries directly connected to
the grid will now be reported as a completely separate business
line. Lastly, the Group is not contemplating continuing with its
investments in the biomass sector and may even be exiting it.
Group expects to continue to be able to achieve Bid IRRs in
the high single digits in OECD countries and in the low double
digits in non-OECD countries.
In structuring projects to achieve the above capacity increases,●and assuming that interest rates remain at current levels, the
The Group expects the increased capacity to drive revenue●growth, partially offset by continued erosion in average prices
per MWh, reflecting a continued decline in PPA prices
per MWh, in line with industry trends, assuming interest rates
remain at current levels. The Group expects the effect of
declining PPA prices to be partially offset by an increasing
portion of higher merchant revenues (with higher average
per MWh prices) in the Group’s revenue mix. Subject to
temporary exceptions for periods prior to entry into a PPA the
Group intends to maintain a strategy of limiting merchant
revenues to 20% of total revenues.
Current EBITDA growth. The Group’s objective is to generate●current EBITDA of €220 to €235 million in 2019 at constant
exchange rates compared to 2018, with an EBITDA margin
equivalent to that of 2018, and close to €400 million in 2021, evenly
balanced between the three regions of Europe - Africa, Australia
and the Americas. The vast majority of current EBITDA should be
contributed by the Group's solar and wind businesses.
These objectives are based in part on the Group maintaining
relative stability in its overall current EBITDA margin as compared
to the Group's current EBITDA margin in 2018 for solar and wind.
As decreases in average O&M costs for solar and wind, the
impact of higher energy yield solar projects located in countries
like Mexico and Argentina with greater solar resources and the
increasing proportion of higher-margin merchant revenues in the
Group’s revenue mix combine to help offset the expected erosion
in average prices per MWh, the Group anticipates that this will be
maintained. Regarding the independent battery business, despite
its growing market share, the Group anticipates that this activity
will remain limited in volume and be more volatile in terms of
earnings due to the very nature of this business.
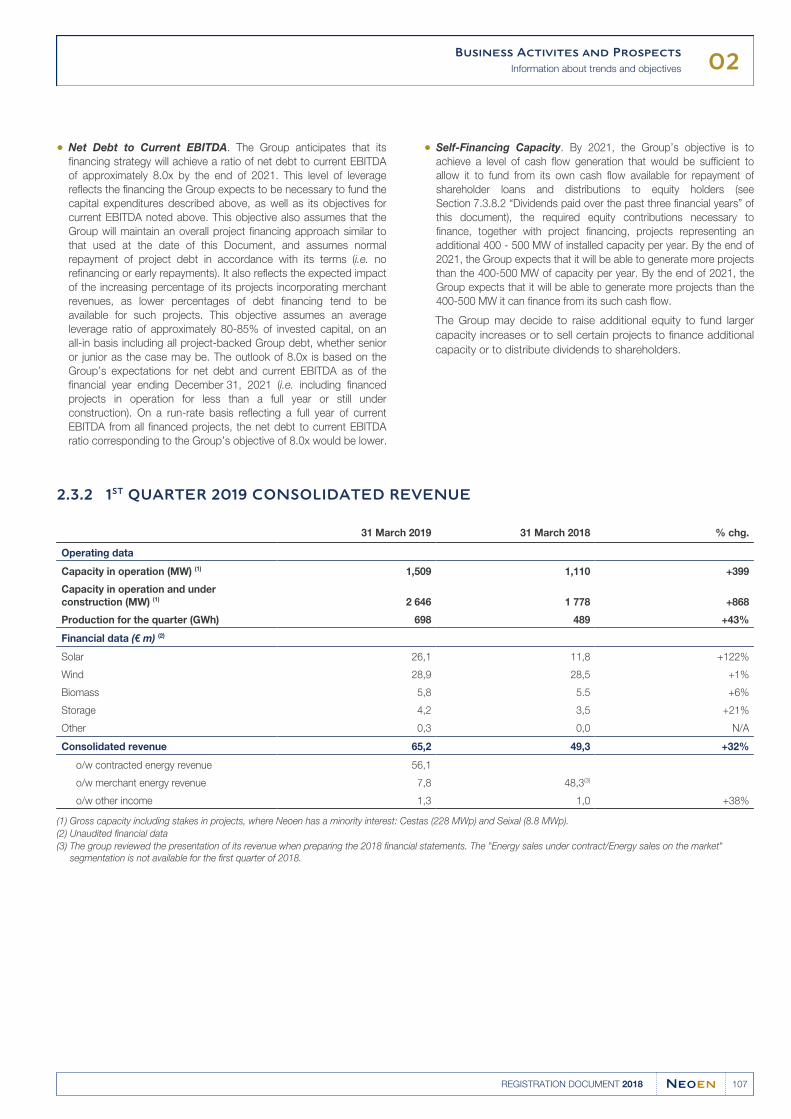
02Business Activites and Prospects
Information about trends and objectives
107REGISTRATION DOCUMENT 2018
Net Debt to Current EBITDA. The Group anticipates that its●financing strategy will achieve a ratio of net debt to current EBITDA
of approximately 8.0x by the end of 2021. This level of leverage
reflects the financing the Group expects to be necessary to fund the
capital expenditures described above, as well as its objectives for
current EBITDA noted above. This objective also assumes that the
Group will maintain an overall project financing approach similar to
that used at the date of this Document, and assumes normal
repayment of project debt in accordance with its terms (i.e. no
refinancing or early repayments). It also reflects the expected impact
of the increasing percentage of its projects incorporating merchant
revenues, as lower percentages of debt financing tend to be
available for such projects. This objective assumes an average
leverage ratio of approximately 80-85% of invested capital, on an
all-in basis including all project-backed Group debt, whether senior
or junior as the case may be. The outlook of 8.0x is based on the
Group’s expectations for net debt and current EBITDA as of the
financial year ending December 31, 2021 (i.e. including financed
projects in operation for less than a full year or still under
construction). On a run-rate basis reflecting a full year of current
EBITDA from all financed projects, the net debt to current EBITDA
ratio corresponding to the Group’s objective of 8.0x would be lower.
Self-Financing Capacity. By 2021, the Group’s objective is to●achieve a level of cash flow generation that would be sufficient to
allow it to fund from its own cash flow available for repayment of
shareholder loans and distributions to equity holders (see
Section 7.3.8.2 “Dividends paid over the past three financial years” of
this document), the required equity contributions necessary to
finance, together with project financing, projects representing an
additional 400 - 500 MW of installed capacity per year. By the end of
2021, the Group expects that it will be able to generate more projects
than the 400-500 MW of capacity per year. By the end of 2021, the
Group expects that it will be able to generate more projects than the
400-500 MW it can finance from its such cash flow.
The Group may decide to raise additional equity to fund larger
capacity increases or to sell certain projects to finance additional
capacity or to distribute dividends to shareholders.
1ST
QUARTER 2019 CONSOLIDATED REVENUE2.3.2
31 March 2019 31 March 2018 % chg.
Operating data
Capacity in operation (MW) (1) 1,509 1,110 +399
Capacity in operation and under
construction (MW) (1) 2 646 1 778 +868
Production for the quarter (GWh) 698 489 +43%
Financial data (€ m) (2)
Solar 26,1 11,8 +122%
Wind 28,9 28,5 +1%
Biomass 5,8 5.5 +6%
Storage 4,2 3,5 +21%
Other 0,3 0,0 N/A
Consolidated revenue 65,2 49,3 +32%
o/w contracted energy revenue 56,1
48,3(3)o/w merchant energy revenue 7,8
o/w other income 1,3 1,0 +38%
Gross capacity including stakes in projects, where Neoen has a minority interest: Cestas (228 MWp) and Seixal (8.8 MWp).(1)
Unaudited financial data(2)
The group reviewed the presentation of its revenue when preparing the 2018 financial statements. The "Energy sales under contract/Energy sales on the market" (3)
segmentation is not available for the first quarter of 2018.
02Business Activites and Prospects
Other information
108 REGISTRATION DOCUMENT 2018
OPERATIONAL SUMMARY
The strong dynamic growth of Neoen's business is mainly linked to
the contribution, over the quarter, of assets commissioned during the
2018 financial year and, to a lesser extent, to the start-up of new
power plants in the first quarter of 2019.
The fleets in operation produced nearly 700 GWh of green electricity
in the quarter (+43% compared to the 1st quarter of 2018) with an
average availability rate of close to 99% (compared to 98% in the first
quarter of 2018), illustrating the the Group's ability to optimise the use
of its production assets.
FINANCIAL SUMMARY
The growth in the Group's revenues for the quarter is primarily due to
the strong growth in solar energy sales (+ 122% compared to the first
quarter of 2018), which now represents 40% of the consolidated
revenue.
quarter of 2018 is in line with the Group's expectations: the positive
impact associated with the commissioning of new fleets, particularly
in 2018, was indeed offset by an anticipated decrease in the average
price captured. In addition, the Group's biomass plant confirmed its
ability to operate at full capacity, with revenues of €5.8 million.
The wind segment made Neoen's first revenue contribution for the
quarter. The relative stability of this contribution compared to the first
Lastly, the storage segment posted revenue of nearly €4.2 million, up
by over 20%, mainly due to favorable market conditions for the sale of
ancillary grid services (FCAS) and arbitrage.
CONFIRMATION OF GROWTH PROSPECTS
Considering the achievements of the first quarter of 2019, the Group
confirmed its outlook for 2019. It expects therefore to generate
EBITDA of between €220 million and €235 million in 2019 with an
EBITDA margin on a par with its 2018 level, assuming constant
exchange rates compared to 2018. Neoen is also reiterating its
objective of capacity of more than 5 GW in operation and under
construction by year-end 2021 (all of which is to be in operation by
year-end 2022) and EBITDA of approximately €400 million in 2021.
OTHER INFORMATION2.4
EVENTS AFTER THE REPORTING PERIOD2.4.1
In January 2019, Neoen announced the commissioning of the first
Corbas tranche. With total capacity of 16 MWp, Corbas is the largest
shade house project in France. Solar panels will protect new vehicles
on the site from bad weather. Local residents have been involved in
the financing. In the space of four weeks, they have contributed
€1.2 million to the project as crowdfunding, which makes it the largest
and fastest collection to finance a solar project in France according to
the terms proposed by the Commission de Régulation de l’Énergie
(CRE).
In February 2019, Neoen entered into a new senior debt financing
programme for a portfolio of solar and wind projects in France. This
programme is scaled to reach a hundred million euros or so. La Caisse
d’Épargne CEPAC, as loan arranger, coordinator and lending agent
structured the finance, Bpifrance and the BEI are its financial partners.
Further, in February 2019 and six months after the signature of an
electricity purchase contract with Google was announced, Neoen
secured financing for Hedet, a 81 MW wind project in Finland. KfW
Ipex and SEB contributed the senior debt for the project
(€66.5 million). Hedet will be Neoen's 1st project to be commissioned
in Finland, where the company intends to step up its growth.
In March 2019, Neoen was awarded the latest government tender
representing aggregate capacity of 45 MWp for ground-based solar
plants (known as CRE 4.5 - Commission de Régulation de l’Énergie).
These 45 MWp break down into 5 projects which are fully owned by
Neoen. These 5 projects are located in the départements of
Tarn-et-Garonne, Moselle, Meurthe-et-Moselle, l’Allier and Landes.
Three of them will rely on local crowdfunding. Two of them will be
involved in the rehabilitation of damaged sites. Finally, the
construction of three projects is expected to begin this year.
Also in March 2019, Neoen signed the financing of its El Llano
project in Mexico. Bancomex, Natixis and Société Générale will
contribute the senior debt for the project for which the total
investment excluding finance costs amounts to US$280 million. This
375 MWp solar power plant, fully developed by Neoen, is to date the
most powerful plant in its asset portfolio. In November 2017, this
project won the 3rd tender by the Mexican government for renewable
energies. With a PPA at under 19 dollars per MWh, it is one of the
world's most competitive solar projects.
At the end of March 2019, Neoen announced the launch of the
construction of the solar plant in Miremont, Haute-Garonne. Located
on a former gravel quarry, this 10 MWp project will play a role in the
rehabilitation of the site. It is expected to be commissioned in July this
year.
In late April 2019, Neoen finally announced that Mr. Louis-Mathieu
Perrin was to become the Group's new Chief Financial Officer on
May 2, 2019.
At the end of the Board meeting of 17 April 2019, Neoen
announced the appointment of Mr Romain Desrousseaux as Deputy
Chief Executive Officer.
Mr Romain Desrousseaux is an employee of the Company and his
duties under his employment contract are different from those conferred
upon him by his corporate appointment. Under his employment
contract, Mr Romain Desrousseaux is Deputy Chief Executive Officer in
charge of international project development, and as such, he is
particularly in charge of the international development of renewable
energy production facilities. His appointment as Deputy Chief Executive
Officer will enable him to supplement his current operational
responsibilities by giving him the power to represent the Company (and
its subsidiaries) towards third parties, subject to the authorisation of the
Chairman and Chief Executive Officer and or the Board of Directors for
certain operations in accordance with internal rules.
02Business Activites and Prospects
Other information
109REGISTRATION DOCUMENT 2018
In this context, it was decided not to compensate Mr Romain
Desrousseaux for his appointment and maintain his employment
contract, since he actively pursues the responsibilities of this position,
which are different from those of his corporate appointment. The
Board of Directors, at its meeting of 17 April 2019, approved the
principle of making the variable compensation with respect to Romain
Desrousseaux' employment contract, which was up until now purely
discretionary, subject to the achievement of certain quantitative and
qualitative criteria and authorised the Chief Executive Officer to
negotiate the amendment to his employment contract with Romain
Desrousseaux. This negotiation is currently ongoing. The signature of
the aforesaid amendment, intended only to cover the variable portion
of Romain Desrousseaux's compensation, will be subject to the prior
authorisation of the Board of Directors as a regulated agreement. The
fixed compensation with respect to the employment contract of
Romain Desrousseaux remained unchanged at the time of his
appointment as Deputy Chief Executive Officer.
fixed gross remuneration received on the date of termination of the
contractual relations.
Mr Romain Desrousseaux's employment contract includes a
non-competition clause, in accordance with the practices of the
company vis-à-vis a large majority of employees (including all
executive directors). Its duration is twelve (12) months, it being
specified that the Company has the option of waiving it during this
period, and the compensation paid in consideration of this
commitment would be equal to a maximum of a third of the annual,
Lastly, Mr Romain Desrousseaux is not entitled to receive severance
benefits, whether under his employment contract or as part of his
corporate appointment.
In late April 2019, Neoen announced that Mr Louis-Mathieu Perrin
was to become the Group's new Chief Financial Officer on May 2,
2019. Mr Louis-Mathieu Perrin is member of the Company's
Management Committee. After five years in audit and financial
consulting, Louis-Mathieu joined Pictet Asset Management in 2006,
where he carried out the responsibilities as Analyst and then as
Investment manager. In 2009, he joined EY, where he became
managing partner, and worked primarily with players in the energy
and utilities sectors. In 2014, he was appointed Chief Financial Officer
of the Direct Energie group, a position he held for almost four years,
before moving to Voodoo where he occupied similar positions. He
joined Neoen in 2019 as Chief Financial Officer. Mr Louis-Mathieu
Perrin graduated from Sciences Po Paris.
On 17 may 2019, the Group sold the 100% interest it held in the
share capital of Biomasse Energie de Montsinéry, a company
specialised in the development, construction and operation of
biomass plants.
OTHER INFORMATION ABOUT THE PARENT COMPANY NEOEN S.A.2.4.2
BUSINESS ACTIVITIES2.4.2.1
Neoen S.A., the parent company, specialises in the development,
financing and operation of electricity production facilities using
renewable energy.
It also holds intermediate holding companies for each of its operating
sectors (wind, solar, storage and biomass) and/or for certain
geographical areas Neoen Production 1 and Neoen Production 2
have been created to support projects under construction and in
operation and those for which financing has been put in place with
the objective of raising mezzanine debt.
Through these intermediate holding companies, Neoen S.A. generally
holds 100% of various project companies, with the exceptions set
forth below.
COMMENTS ON NEOEN S.A.'S BUSINESS2.4.2.2
Revenues
Revenue stood at €50.7 million at December 31, 2018, an increase of
€14.7 million compared with 2017. This is mainly due to the rise in
development facilities for new projects, particularly in Australia
(Bulgana, Coleambally and Numurkah), in France (Pays Chaumontais,
Pays de l’Auxois, Le Camp, Chassepain, Champs d’amour), and El
Salvador (Providencia).
Net income
Net income was €9.4 million, up €0.9 million i.e. an increase of 11%
compared to 2017.
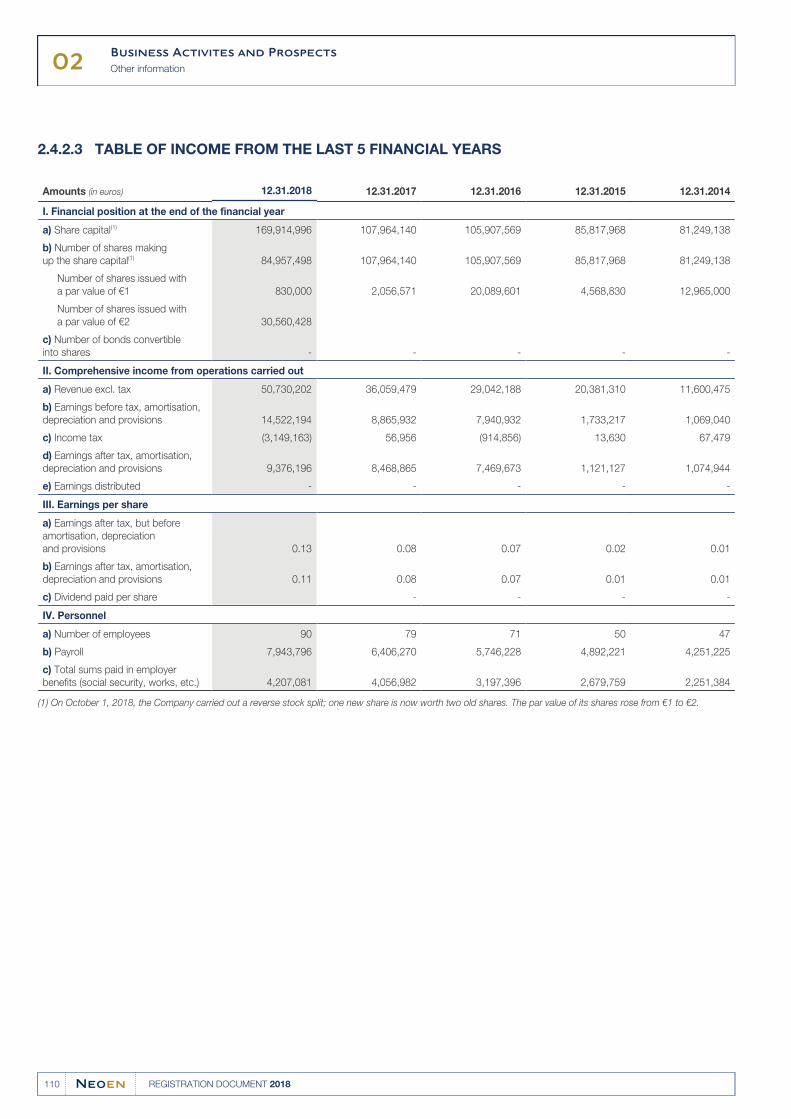
02Business Activites and Prospects
Other information
110 REGISTRATION DOCUMENT 2018
TABLE OF INCOME FROM THE LAST 5 FINANCIAL YEARS2.4.2.3
Amounts (in euros) 12.31.2018 12.31.2017 12.31.2016 12.31.2015 12.31.2014
I. Financial position at the end of the financial year
a) Share capital(1) 169,914,996 107,964,140 105,907,569 85,817,968 81,249,138
b) Number of shares making
up the share capital(1) 84,957,498 107,964,140 105,907,569 85,817,968 81,249,138
Number of shares issued with
a par value of €1 830,000 2,056,571 20,089,601 4,568,830 12,965,000
Number of shares issued with
a par value of €2 30,560,428
c) Number of bonds convertible
into shares - - - - -
II. Comprehensive income from operations carried out
a) Revenue excl. tax 50,730,202 36,059,479 29,042,188 20,381,310 11,600,475
b) Earnings before tax, amortisation,
depreciation and provisions 14,522,194 8,865,932 7,940,932 1,733,217 1,069,040
c) Income tax (3,149,163) 56,956 (914,856) 13,630 67,479
d) Earnings after tax, amortisation,
depreciation and provisions 9,376,196 8,468,865 7,469,673 1,121,127 1,074,944
e) Earnings distributed - - - - -
III. Earnings per share
a) Earnings after tax, but before
amortisation, depreciation
and provisions 0.13 0.08 0.07 0.02 0.01
b) Earnings after tax, amortisation,
depreciation and provisions 0.11 0.08 0.07 0.01 0.01
c) Dividend paid per share - - - -
IV. Personnel
a) Number of employees 90 79 71 50 47
b) Payroll 7,943,796 6,406,270 5,746,228 4,892,221 4,251,225
c) Total sums paid in employer
benefits (social security, works, etc.) 4,207,081 4,056,982 3,197,396 2,679,759 2,251,384
On October 1, 2018, the Company carried out a reverse stock split; one new share is now worth two old shares. The par value of its shares rose from €1 to €2.(1)
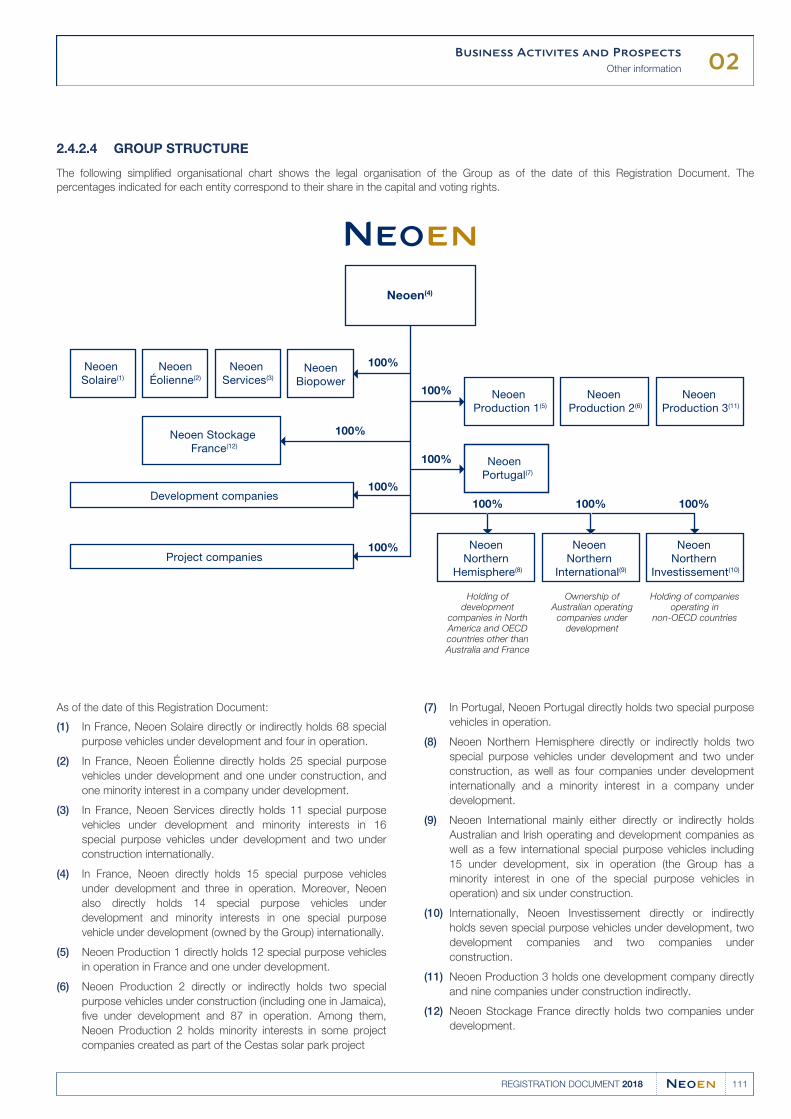
02Business Activites and Prospects
Other information
111REGISTRATION DOCUMENT 2018
GROUP STRUCTURE2.4.2.4
The following simplified organisational chart shows the legal organisation of the Group as of the date of this Registration Document. The
percentages indicated for each entity correspond to their share in the capital and voting rights.
Neoen(4)
Neoen Solaire(1)
NeoenÉolienne(2)
Neoen Stockage France(12)
Development companies
Project companies
Neoen Services(3)
NeoenBiopower
100%
100%
100%
100%
100% 100% 100%
Neoen Production 1(5)
Neoen Portugal(7)
Neoen Production 2(6)
Neoen Production 3(11)
Neoen Northern
Hemisphere(8)
Neoen Northern
Investissement(10)
Holding of development
companies in North America and OECD countries other than Australia and France
Ownership of Australian operating companies under
development
Holding of companies operating in
non-OECD countries
100%
100% Neoen Northern
International(9)
As of the date of this Registration Document:
In France, Neoen Solaire directly or indirectly holds 68 special(1)purpose vehicles under development and four in operation.
In France, Neoen Éolienne directly holds 25 special purpose(2)vehicles under development and one under construction, and
one minority interest in a company under development.
In France, Neoen Services directly holds 11 special purpose(3)vehicles under development and minority interests in 16
special purpose vehicles under development and two under
construction internationally.
In France, Neoen directly holds 15 special purpose vehicles(4)under development and three in operation. Moreover, Neoen
also directly holds 14 special purpose vehicles under
development and minority interests in one special purpose
vehicle under development (owned by the Group) internationally.
Neoen Production 1 directly holds 12 special purpose vehicles(5)in operation in France and one under development.
Neoen Production 2 directly or indirectly holds two special(6)purpose vehicles under construction (including one in Jamaica),
five under development and 87 in operation. Among them,
Neoen Production 2 holds minority interests in some project
companies created as part of the Cestas solar park project
In Portugal, Neoen Portugal directly holds two special purpose(7)vehicles in operation.
Neoen Northern Hemisphere directly or indirectly holds two(8)special purpose vehicles under development and two under
construction, as well as four companies under development
internationally and a minority interest in a company under
development.
Neoen International mainly either directly or indirectly holds(9)Australian and Irish operating and development companies as
well as a few international special purpose vehicles including
15 under development, six in operation (the Group has a
minority interest in one of the special purpose vehicles in
operation) and six under construction.
Internationally, Neoen Investissement directly or indirectly(10)holds seven special purpose vehicles under development, two
development companies and two companies under
construction.
Neoen Production 3 holds one development company directly(11)and nine companies under construction indirectly.
Neoen Stockage France directly holds two companies under(12)development.
02Business Activites and Prospects
Other information
112 REGISTRATION DOCUMENT 2018
Neoen S.A., parent company(i)
Neoen S.A., a limited company (société anonyme), was initially
incorporated and registered with the Paris Trade and Companies
Register on September 29, 2008, as a simplified limited company
(société anonyme) under number 508 320 017. Its shares were listed
on the regulated Euronext Paris market on October 17, 2018. It is
controlled by its main shareholder described in Section 7.3
“Shareholding structure” of this document.
It also holds intermediate holding companies for each of its operating
sectors (wind, solar, storage and biomass) and/or for certain
geographical areas
Neoen Production 1 and Neoen Production 2 have been created to
support projects under construction and in operation and those for
which financing has been put in place with the objective of raising
mezzanine debt.
Through these intermediate holding companies, Neoen S.A. generally
holds 100% of various project companies, with the exceptions set
forth below.
Significant subsidiaries(ii)
Intermediate holding companies
Neoen Solaire is a French limited company (société anonyme) with a
single shareholder, registered with the Paris Trade and Companies
Register under number 509 319 257, with share capital of €37,000,
headquartered at 4 rue Euler, 75008 Paris. Neoen Solaire mainly owns
companies that hold the Group’s solar projects under development in
France.
Neoen Éolienne is a French limited company (société anonyme) with a
single shareholder, registered with the Paris Trade and Companies
Register under number 509 212 585, with share capital of €37,000,
headquartered at 4 rue Euler, 75008 Paris. Neoen Éolienne owns
companies that hold the Group’s wind projects under development in
France.
Neoen Stockage France is a simplified limited company (société
anonyme) with a single shareholder, registered with the Paris Trade
and Companies Register under number 845 212 406, with a share
capital of €2,500, headquartered at 4 rue Euler, 75008 Paris. Neoen
Stockage France was registered in January 2019 and holds storage
projects in France.
Neoen Biopower is a French limited company (société anonyme)
with a single shareholder, registered with the Paris Trade and
Companies Register under number 511 780 215, with share capital of
€37,000, headquartered at 4 rue Euler, 75008 Paris. Neoen Biopower
holds 51% of Biomasse Energie de Commentry (BEC), the company
operating the BEC plant, with the remaining 49% being held by
Caisse des Dépôts et Consignations (“CDC”).
Neoen International is a French limited company (société anonyme)
with a single shareholder, registered with the Paris Trade and
Companies Register under number 789 991 635, with share capital of
€100,000, headquartered at 4 rue Euler, 75008 Paris. Neoen
International mainly owns companies that own the Group's
photovoltaic, wind and electricity storage projects located in Australia,
Ireland and Jamaica.
capital of €20,000, headquartered at 4 rue Euler, 75008 Paris. Neoen
Northern Hemisphere currently owns two companies that hold
projects under development in the United States and intermediate
parent companies of the Group’s solar, wind and storage project
companies located in member countries of the Organisation for
Economic Cooperation and Development (the “OECD”) other than
Australia and France (e.g., in the United States, Mexico and Finland).
Neoen Northern Hemisphere is a French limited company (société
anonyme) with a single shareholder, registered with the Paris Trade
and Companies Register under number 828 197 798, with share
Neoen Investissement is a French limited company (société
anonyme) with a single shareholder, registered with the Paris Trade
and Companies Register under number 820 556 074, with share
capital of €20,000, headquartered at 4 rue Euler, 75008 Paris. Neoen
Investissement owns the companies that hold the Group’s solar and
wind projects located in countries that are not members of the OECD
(e.g., Zambia and Argentina).
Neoen Services (formerly Poweo ENR) is a French limited company
(société anonyme) with a single shareholder, registered with the Paris
Trade and Companies Register under number 492 690 821, with share
capital of €51,210,000, headquartered at 4 rue Euler, 75008 Paris.
Neoen Services was acquired by the Group in September 2011 and
holds minority interests in certain project companies controlled by the
Group, as well as project companies developed by Poweo ENR and
acquired together with Poweo ENR in 2011.
Neoen Production 1 is a French limited company (société anonyme)
with a single shareholder, registered with the Paris Trade and
Companies Register under number 799 259 429, with share capital of
€10,000, headquartered at 4 rue Euler, 75008 Paris. Neoen
Production 1 completed the Group’s green bond issuance in
October 2015 and holds projects in operation that have been
financed by the proceeds of the green bond issuance.
Neoen Production 2 is a French limited company (société anonyme)
with a single shareholder, registered with the Paris Trade and
Companies Register under number 824 735 559, with share capital of
€2,500, headquartered at 4 rue Euler, 75008 Paris. Neoen Production
2 issued green bonds in December 2017 and mainly holds, directly or
indirectly, companies that own projects that are beyond the
development stage and that have been financed by such issuance.
Neoen Production 3 is a French limited company (société anonyme)
with a single shareholder, registered with the Paris Trade and
Companies Register under number 523 207 207 with share capital of
€2,500, headquartered at 4 rue Euler, 75008 Paris. Neoen Production
3 holds projects in France that are beyond the development stage
and have been financed by banks.
Project companies
These companies are special purpose vehicles (“SPVs”) They were
set up or, to a lesser extent, acquired by the Group for the purpose of
holding the Group’s solar, wind, biomass or storage assets and
generally carry the non-recourse debt incurred to finance such
projects.
The Group generally owns all of the share capital and voting rights of
these project companies, subject to certain exceptions, such as the
following:
for a portion of the project companies in the Cestas solar park,●composed of 25 plants with a capacity of 12 MW each (a total of
300 MW) held by 25 project companies, of which only six are wholly
owned by the Group, two others being 32% owned and seventeen
others being 20% owned, it being specified that the Group benefits
from options to acquire the interests not held in 2045;
02Business Activites and Prospects
Other information
113REGISTRATION DOCUMENT 2018
Biomasse Energie de Commentry (BEC), whose purpose is to●operate the BEC cogeneration plant located in France, and of
which Caisse des Dépôts et Consignations (“CDC”) holds 49% of
the share capital and voting rights;
for certain project companies located outside of France:●
Bangweulu Power Company Limited, whose purpose is the●operation of a solar power plant located in Zambia, and of
which Industrial Development Corporation (“IDC”) indirectly
holds 19.65% of the share capital and voting rights through its
subsidiary West Lunga Power Company. The remaining
80.35% of the company’s share capital and voting rights are
held by Zambian Sunlight One S.A.S., which is itself owned by
Neoen Investissement and First Solar Investment Holdco One
LLC, holding 68.70% and 31.30% of its share capital and
voting rights, respectively,
each of Hornsdale Wind Farm 1, 2 and 3, whose purpose is●the operation of the wind farm located in Hornsdale, Australia,
and of which the company John Laing holds 30%, 20% and
20% of the share capital and voting rights, respectively,
CSNSP 441, whose purpose is the operation of a solar power●plant located in Seixal, Portugal, and of which the company
EOS holds 50% of the share capital and voting rights,
Eight Rivers Energy Company Limited (“EREC”), whose purpose●is the operation of a solar power plant located in Jamaica, and
of which MPC and Mrs. Angella Rainford indirectly hold, through
various companies, including EREC Investment Limited, one
share less than 50% of the share capital and voting rights,
Blue Mahoe Energy Company Limited, whose purpose is the●developement, construction and operation of solar plants in
Jamaica, in which Ms. Angella Rainford indirectly holds 25% of
the share capital and voting rights,
Central Solar Metoro SA, whose purpose is to operate a solar●power plant located in Mozambique, and of which
Electricidade de Moçambique (“EDM”) holds 25% of the share
capital and voting rights,
Hedet Vindpark AB and Björkliden Vindpark AB, whose●purposes are to operate wind farms in Finland, in which Prokon
Finland indirectly holds 19.9% of the share capital and voting
rights, and
BNRGN Kerdiffstown Limited, BNRGN Milvale Limited,●BNRGN Hortland Limited, BNRGN Hilltown Limited, BNRGN
Ballyduff Limited, BNRGN Johnston North Limited, BNRGN
Dunmurry Limited, BNRGN Finnis Limited and BNRGN Mothel
Limited, whose purpose is the development, construction and
operation of solar power plants in Ireland, in which BNRG
indirectly holds 50% of the share capital and voting rights.
Recent acquisitions and sales (iii)of subsidiaries
Acquisitions
As part of its project development activities, the Group occasionally
acquires companies with solar or wind power projects, generally at an
early stage of development rather than after a project has already
been developed by third parties. In this respect, the following
acquisitions have been carried out since 2017:
in January 2017, the Group acquired Bulgana Holding Pty Ltd,●which held the Bulgana wind farm project, with a capacity of
194 MW on the date of acquisition, in the Australian state of
Victoria;
in August 2017, the Group acquired 95% of the shares of La Puna●Solar S.R.L (formerly Fieldfare Argentina II S.r.L), which held the “La
Puna” solar farm project, with a capacity of 100 MW on the date of
acquisition, in the Province of Salta, Argentina. In June 2018, the
Group acquired the remaining 5% of shares and now holds 100%
of the shares;
in May 2018, the Group acquired 80.1% of the shares of Hedet●Vindpark AB, which held both the Hedet wind farm project, with a
capacity of approximately 75 MW on the date of acquisition, and
the Björkliden wind farm project, with a capacity of approximately
29 MW on the date of acquisition, in Finland;
while it held 80% of the shares of Altiplano Solar S.A, which owns●the “Altiplano” solar farm project in the province of Salta, Argentina,
which had a capacity of 100 MW at the date of acquisition, the
Group acquired the remaining 20% of shares in July 2018 and now
holds 100% of the shares.
In addition, although the Group’s development was mainly achieved
through organic growth, the Group has also grown (to a lesser extent)
through acquisitions.
Sales and liquidations
In connection with its ongoing project management, the Group
rationalizes its project portfolio from time to time, though it is generally
committed to holding the projects it develops over the long term.
During the financial years 2017 and 2018, the Group sold certain
investments due to financial or strategic considerations:
on February 10, 2017, the Group sold the 60% interest it held in●the share capital of GenSun, a company that specialized in the
design, construction, operation and maintenance of solar power
plants of all capacities in France and internationally (and which itself
owned GenSun PVS and Genwind);
on August 13, 2018, the Group sold the 100% interest it held●directly in the share capital of CS Manosque Ombrière, a company
specialized in the development and operation of solar shelters;
on September 30, 2018, the Group sold the 100% interest it held●directly in the share capital of SASU PV Melissa, which owns and
operates a solar power plant in France;
on December 26, 2018, the Group sold the 50% interest it held directly●in the share capital of Peacock for Technical Consulting, a Jordanian
company whose purpose was the development of three solar projects
in Jordan (the Group decided to halt these projects).
Finally, Neoen Services Panama and Neoen Panama were voluntarily
wound up in June and December 2017, respectively. Neoen Egypt
Solar 1 was also wound up in December 2018.
Interests and Joint Ventures
For a presentation of the investments held by the Group, see Note 1
to the Annual Financial Statements.
For a presentation of joint-ventures set up by the Group, see Note 1
to the Annual Financial Statements.
In 2017 and 2018, no joint venture agreements were concluded by
the Group.
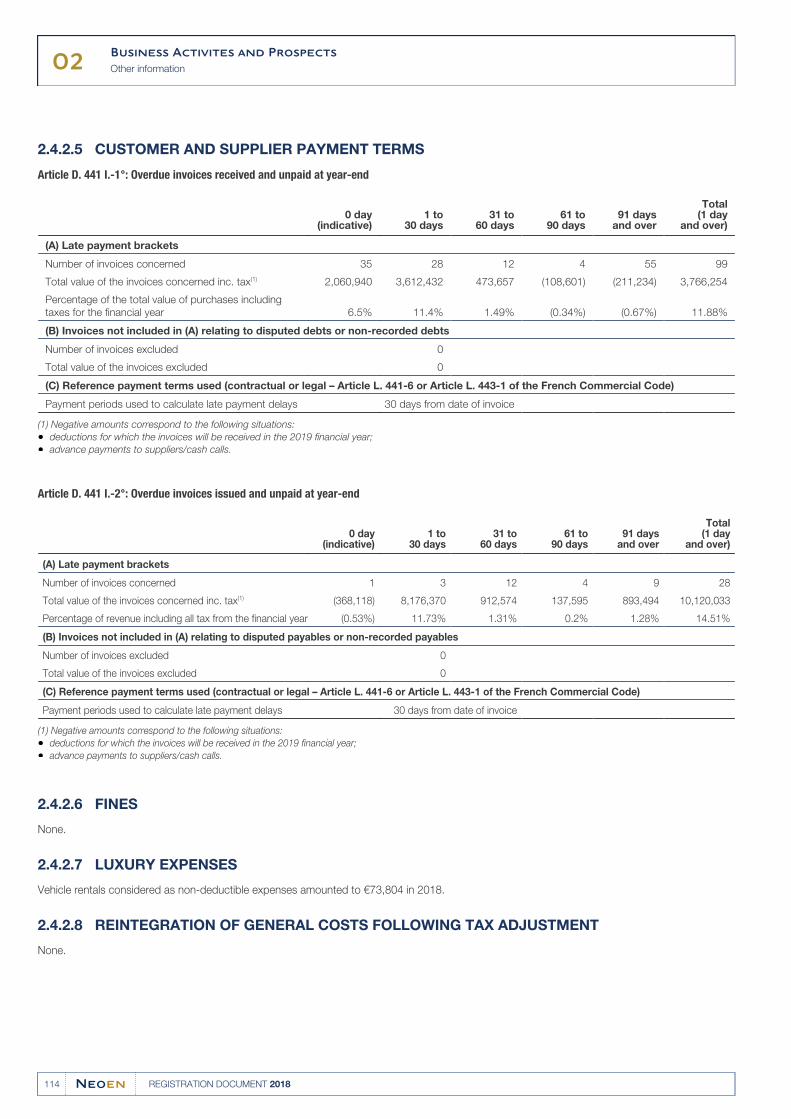
02Business Activites and Prospects
Other information
114 REGISTRATION DOCUMENT 2018
CUSTOMER AND SUPPLIER PAYMENT TERMS2.4.2.5
Article D. 441 I.-1°: Overdue invoices received and unpaid at year-end
0 day
(indicative)1 to
30 days31 to
60 days61 to
90 days91 days
and over
Total(1 day
and over)
(A) Late payment brackets
Number of invoices concerned 35 28 12 4 55 99
Total value of the invoices concerned inc. tax(1) 2,060,940 3,612,432 473,657 (108,601) (211,234) 3,766,254
Percentage of the total value of purchases including
taxes for the financial year 6.5% 11.4% 1.49% (0.34%) (0.67%) 11.88%
(B) Invoices not included in (A) relating to disputed debts or non-recorded debts
Number of invoices excluded 0
Total value of the invoices excluded 0
(C) Reference payment terms used (contractual or legal – Article L. 441-6 or Article L. 443-1 of the French Commercial Code)
Payment periods used to calculate late payment delays 30 days from date of invoice
Negative amounts correspond to the following situations:(1)
deductions for which the invoices will be received in the 2019 financial year;●advance payments to suppliers/cash calls.●
Article D. 441 I.-2°: Overdue invoices issued and unpaid at year-end
0 day
(indicative)1 to
30 days31 to
60 days61 to
90 days91 days
and over
Total(1 day
and over)
(A) Late payment brackets
Number of invoices concerned 1 3 12 4 9 28
Total value of the invoices concerned inc. tax(1) (368,118) 8,176,370 912,574 137,595 893,494 10,120,033
Percentage of revenue including all tax from the financial year (0.53%) 11.73% 1.31% 0.2% 1.28% 14.51%
(B) Invoices not included in (A) relating to disputed payables or non-recorded payables
Number of invoices excluded 0
Total value of the invoices excluded 0
(C) Reference payment terms used (contractual or legal – Article L. 441-6 or Article L. 443-1 of the French Commercial Code)
Payment periods used to calculate late payment delays 30 days from date of invoice
Negative amounts correspond to the following situations:(1)
deductions for which the invoices will be received in the 2019 financial year;●advance payments to suppliers/cash calls.●
FINES2.4.2.6
None.
LUXURY EXPENSES2.4.2.7
Vehicle rentals considered as non-deductible expenses amounted to €73,804 in 2018.
REINTEGRATION OF GENERAL COSTS FOLLOWING TAX ADJUSTMENT2.4.2.8
None.
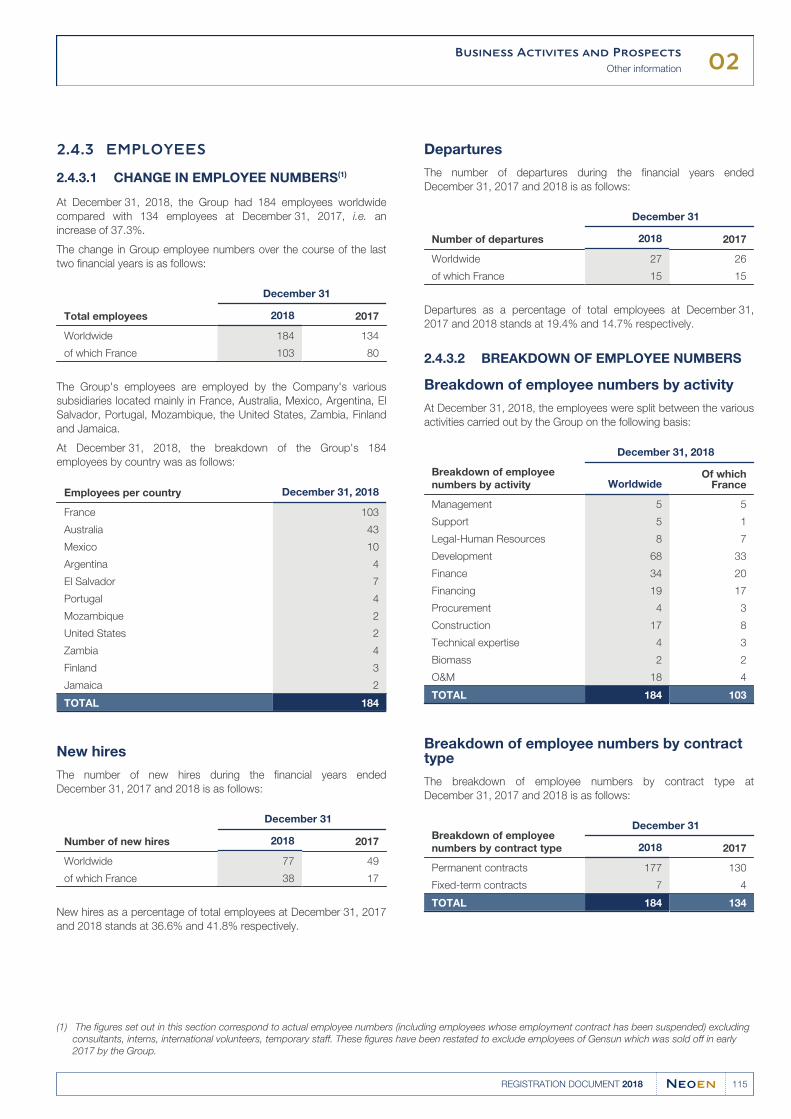
02Business Activites and Prospects
Other information
115REGISTRATION DOCUMENT 2018
EMPLOYEES2.4.3
CHANGE IN EMPLOYEE NUMBERS(1)2.4.3.1
At December 31, 2018, the Group had 184 employees worldwide
compared with 134 employees at December 31, 2017, i.e. an
increase of 37.3%.
The change in Group employee numbers over the course of the last
two financial years is as follows:
Total employees
December 31
2018 2017
Worldwide 184 134
of which France 103 80
The Group's employees are employed by the Company's various
subsidiaries located mainly in France, Australia, Mexico, Argentina, El
Salvador, Portugal, Mozambique, the United States, Zambia, Finland
and Jamaica.
At December 31, 2018, the breakdown of the Group's 184
employees by country was as follows:
Employees per country December 31, 2018
France 103
Australia 43
Mexico 10
Argentina 4
El Salvador 7
Portugal 4
Mozambique 2
United States 2
Zambia 4
Finland 3
Jamaica 2
TOTAL 184
New hires
The number of new hires during the financial years ended
December 31, 2017 and 2018 is as follows:
Number of new hires
December 31
2018 2017
Worldwide 77 49
of which France 38 17
New hires as a percentage of total employees at December 31, 2017
and 2018 stands at 36.6% and 41.8% respectively.
Departures
The number of departures during the financial years ended
December 31, 2017 and 2018 is as follows:
Number of departures
December 31
2018 2017
Worldwide 27 26
of which France 15 15
Departures as a percentage of total employees at December 31,
2017 and 2018 stands at 19.4% and 14.7% respectively.
BREAKDOWN OF EMPLOYEE NUMBERS2.4.3.2
Breakdown of employee numbers by activity
At December 31, 2018, the employees were split between the various
activities carried out by the Group on the following basis:
Breakdown of employee
numbers by activity
December 31, 2018
WorldwideOf which
France
Management 5 5
Support 5 1
Legal-Human Resources 8 7
Development 68 33
Finance 34 20
Financing 19 17
Procurement 4 3
Construction 17 8
Technical expertise 4 3
Biomass 2 2
O&M 18 4
TOTAL 184 103
Breakdown of employee numbers by contract type
The breakdown of employee numbers by contract type at
December 31, 2017 and 2018 is as follows:
Breakdown of employee
numbers by contract type
December 31
2018 2017
Permanent contracts 177 130
Fixed-term contracts 7 4
TOTAL 184 134
The figures set out in this section correspond to actual employee numbers (including employees whose employment contract has been suspended) excluding (1)
consultants, interns, international volunteers, temporary staff. These figures have been restated to exclude employees of Gensun which was sold off in early
2017 by the Group.
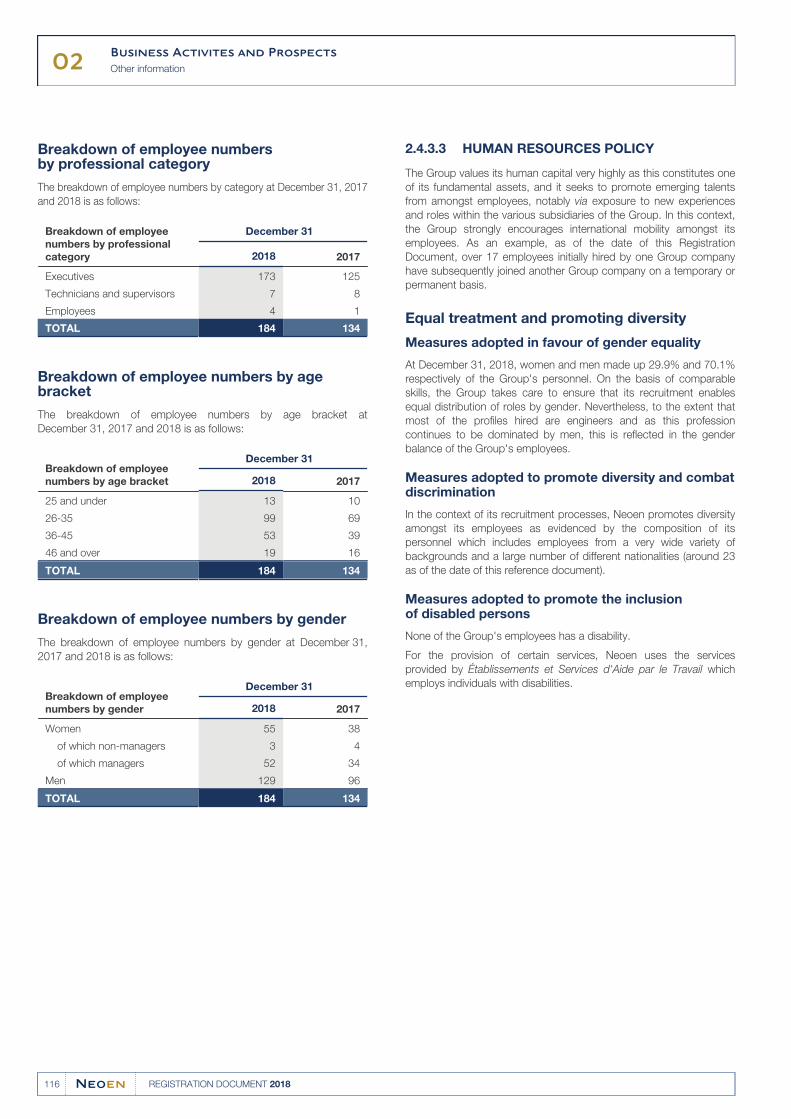
02Business Activites and Prospects
Other information
116 REGISTRATION DOCUMENT 2018
Breakdown of employee numbers by professional category
The breakdown of employee numbers by category at December 31, 2017
and 2018 is as follows:
Breakdown of employee
numbers by professional
category
December 31
2018 2017
Executives 173 125
Technicians and supervisors 7 8
Employees 4 1
TOTAL 184 134
Breakdown of employee numbers by age bracket
The breakdown of employee numbers by age bracket at
December 31, 2017 and 2018 is as follows:
Breakdown of employee
numbers by age bracket
December 31
2018 2017
25 and under 13 10
26-35 99 69
36-45 53 39
46 and over 19 16
TOTAL 184 134
Breakdown of employee numbers by gender
The breakdown of employee numbers by gender at December 31,
2017 and 2018 is as follows:
Breakdown of employee
numbers by gender
December 31
2018 2017
Women 55 38
of which non-managers 3 4
of which managers 52 34
Men 129 96
TOTAL 184 134
HUMAN RESOURCES POLICY2.4.3.3
The Group values its human capital very highly as this constitutes one
of its fundamental assets, and it seeks to promote emerging talents
from amongst employees, notably via exposure to new experiences
and roles within the various subsidiaries of the Group. In this context,
the Group strongly encourages international mobility amongst its
employees. As an example, as of the date of this Registration
Document, over 17 employees initially hired by one Group company
have subsequently joined another Group company on a temporary or
permanent basis.
Equal treatment and promoting diversity
Measures adopted in favour of gender equality
At December 31, 2018, women and men made up 29.9% and 70.1%
respectively of the Group's personnel. On the basis of comparable
skills, the Group takes care to ensure that its recruitment enables
equal distribution of roles by gender. Nevertheless, to the extent that
most of the profiles hired are engineers and as this profession
continues to be dominated by men, this is reflected in the gender
balance of the Group's employees.
Measures adopted to promote diversity and combat discrimination
In the context of its recruitment processes, Neoen promotes diversity
amongst its employees as evidenced by the composition of its
personnel which includes employees from a very wide variety of
backgrounds and a large number of different nationalities (around 23
as of the date of this reference document).
Measures adopted to promote the inclusion of disabled persons
None of the Group's employees has a disability.
For the provision of certain services, Neoen uses the services
provided by Établissements et Services d'Aide par le Travail which
employs individuals with disabilities.
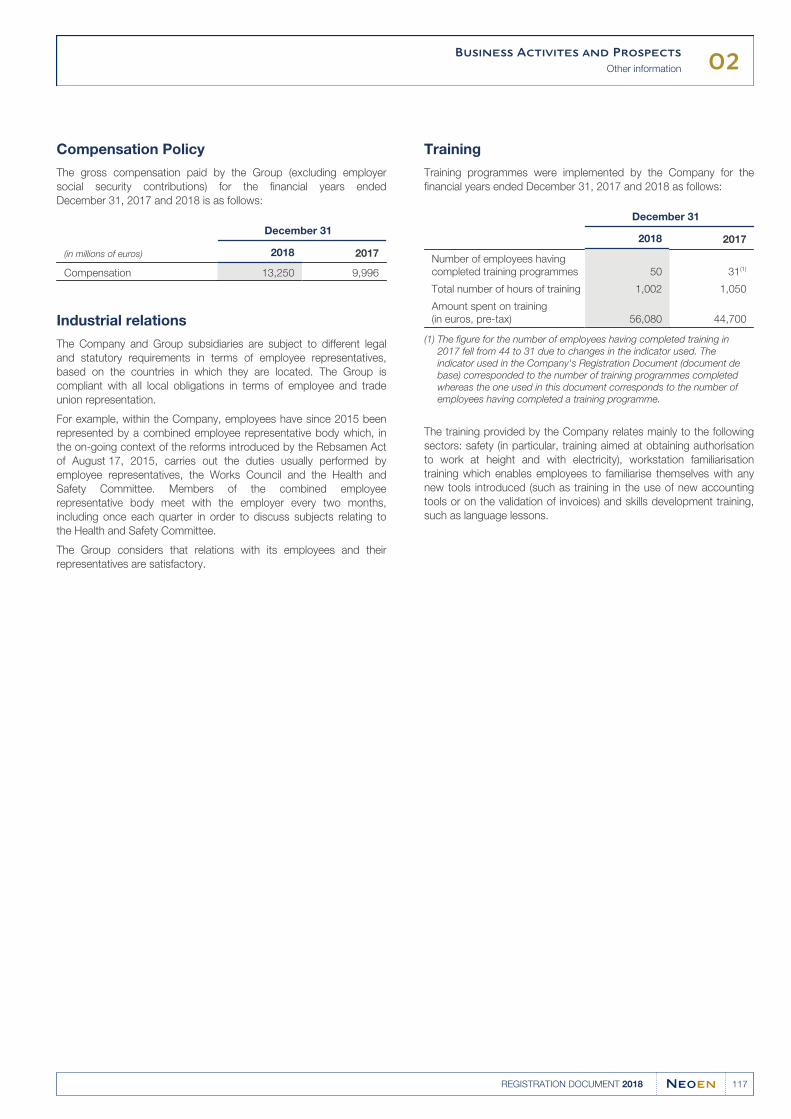
02Business Activites and Prospects
Other information
117REGISTRATION DOCUMENT 2018
Compensation Policy
The gross compensation paid by the Group (excluding employer
social security contributions) for the financial years ended
December 31, 2017 and 2018 is as follows:
(in millions of euros)
December 31
2018 2017
Compensation 13,250 9,996
Industrial relations
The Company and Group subsidiaries are subject to different legal
and statutory requirements in terms of employee representatives,
based on the countries in which they are located. The Group is
compliant with all local obligations in terms of employee and trade
union representation.
For example, within the Company, employees have since 2015 been
represented by a combined employee representative body which, in
the on-going context of the reforms introduced by the Rebsamen Act
of August 17, 2015, carries out the duties usually performed by
employee representatives, the Works Council and the Health and
Safety Committee. Members of the combined employee
representative body meet with the employer every two months,
including once each quarter in order to discuss subjects relating to
the Health and Safety Committee.
The Group considers that relations with its employees and their
representatives are satisfactory.
Training
Training programmes were implemented by the Company for the
financial years ended December 31, 2017 and 2018 as follows:
December 31
2018 2017
Number of employees having
completed training programmes 50 31(1)
Total number of hours of training 1,002 1,050
Amount spent on training
(in euros, pre-tax) 56,080 44,700
The figure for the number of employees having completed training in (1)
2017 fell from 44 to 31 due to changes in the indicator used. The
indicator used in the Company's Registration Document (document de
base) corresponded to the number of training programmes completed
whereas the one used in this document corresponds to the number of
employees having completed a training programme.
The training provided by the Company relates mainly to the following
sectors: safety (in particular, training aimed at obtaining authorisation
to work at height and with electricity), workstation familiarisation
training which enables employees to familiarise themselves with any
new tools introduced (such as training in the use of new accounting
tools or on the validation of invoices) and skills development training,
such as language lessons.

118 REGISTRATION DOCUMENT 2018
03
119REGISTRATION DOCUMENT 2018
RISKS FACTORS
RISKS AND UNCERTAINTIES3.1 120
Risks relating to the Group's 3.1.1
business 120
Risks relating to the renewable 3.1.2
energy sector 129
Market risk3.1.3 135
INSURANCE AND RISK 3.2
MANAGEMENT 137
Insurance3.2.1 137
Risk Management3.2.2 139
03Risks factors
Risks and uncertainties
120 REGISTRATION DOCUMENT 2018
RISKS AND UNCERTAINTIES3.1
RISKS RELATING TO THE GROUP'S BUSINESS3.1.1
RISKS RELATING TO THE GROUP'S PROJECTS AND PLANTS3.1.1.1
Risks relating to the development, construction and maintenance of the Group's plants3.1.1.1.1
The Group's project development activities are subject
to uncertainties
At December 31, 2018, the Group's pipeline of projects under
development was made up of 139 projects at various stages of
development (tender ready and advanced development projects,
excluding early stage projects). Projects under development are often
complex and large-scale and are subject to significant uncertainties,
which may prevent the Group from being able to complete them
according to plan, or at all.
The Group devotes considerable time to developing the projects it
has in its pipeline, especially in prospecting and identifying sites,
obtaining land licenses, financing for third-party environmental
studies, undertaking technical assessments and the involvement of
local stakeholders. The Group allocates financial resources to these
activities, which increase as projects progress through their
development stages.
The obstacles faced by the Group during the development phases
may create delays or additional costs which could make the projects
less competitive than initially planned. As a result, the Group may be
unable to secure the power purchase agreements it targets for such
projects, obtain financing on terms that will allow sufficient profitability,
or generate the projected returns on investments. In certain cases,
this could result in the project being postponed or abandoned and
could result in the loss or impairment of the development expenses
incurred, which could have a negative impact on the Group's growth
rate, outlook and results.
The Group may be unable to complete its projects under
construction
Projects still incur risk after a PPA and financing have been obtained,
during the construction phase, and especially with regard to
engineering, equipment and the proper performance by the EPC
Contractor of its obligations. At December 31, 2018, the Group's
projects under construction accounted for 764 MW.
The Group's inability to complete the construction of a facility or to
meet deadlines is likely to result in, for example, breaches of contract,
early termination of electricity sales contracts, facility depreciation, a
reduction of the period of eligibility for negotiated tariffs due to
non-compliance with certain stages, or delays and/or costs overruns,
which may not be fully covered or adequately provided for by
guarantees, indemnification clauses or EPC insurance. A project's
eligibility to certain regulated tariffs may be jeopardised or lost if the
facilities are not commissioned within agreed deadlines, and lengthy
and costly litigation may ensue between the Group and the parties
involved in the development, construction and financing of the
mproject.
When the Group commits to incur capital expenditure for the
construction of a project, it expects to potentially recover such costs.
However, the Group can give no assurance that a project will be
finalised and enter into the commercial operation phase. In the event
the Group's efforts do not enable the completion of the project, it may
be obliged to discontinue the project under construction and book
impairment for the costs in connection with said project. Inefficient
construction or operation management is likely to give rise to
unforeseen delays or cost overruns in the completion of these
projects, which may have a significant adverse effect on the Group's
activity, its financial position or its results.
Relying on third party contractors exposes the Group to risks
The Group engages various contractors for the construction of its
projects, for operating and maintenance services (O&M) as well as for
certain aspects in project development such as technical and
environmental studies. If the Group's contractors (or their
sub-contractors) do not fulfil their obligations, provide services that
are not up to the standard of the Group's quality, encounter financial
difficulties or do not comply with the laws and regulations in force, the
Group's reputation may be undermined, in addition to running the risk
of penalties or significant public liability. The ability of the Group to
obtain compensation from its sub-contractors may be limited by their
financial solvency or contractual limitations to their liability and the
guarantees granted by these sub-contractors or their affiliates may
not entirely cover the losses suffered by the Group.
More generally, serious repercussions may result from the failure of an
EPC contractor to fulfil its obligations, and particularly construction
deadlines, or financial problems of this contractor, can have major
repercussions. In particular, commissioning delays can have a
substantial impact on the Group's income for the current year and,
beyond a certains date, PPAs may be cancelled owing to their strict
deadlines for commissioning plants. Furthermore, insofar as most of
the EPC contractors selected to provide O&M services, once
construction of the plant has been completed, a failure of the EPC
can have a long-term impact on the plant owing to the contractors'
understanding of the technical aspects and the characteristics of the
equipment and the plant. If an EPC contractor must withdraw from an
EPC contract or a project, the necessity of finding another contractor
to provide the O&M services could lead to delays, additional costs
and logistical difficulties.
Moreover, EPC contractors may fail to fulfil their guarantee
commitments, owing to financial or other difficulties, with regard to
the performance levels of the equipment provided for in the EPC or
O&M contracts. In this case, the Group might be unable to complete
the construction of the project, as initially planned, if the operational
performance of its facilities fall below the contractually guaranteed
level, leading to contractual failures or compel the Group to set up a
reserve account (maintenance reserve account), which consists in a
cash reserve (of a potentially significant amount) put aside to cover
project-related expenses.
03Risks factors
Risks and uncertainties
121REGISTRATION DOCUMENT 2018
Even if the Group is not dependent on a single supplier for key
products and services, in certain cases, and depending on the region,
there may only be a number of potential suppliers, so that the
withdrawal of an important player could affect the availability, pricing
or guarantees relating to the products and services concerned.
The growth of the renewable energy industry, the intense competition
and the Group's strict contractual requirements limit the availability of
a sufficient number of EPC contractors to ensure effective
submissions to calls for tenders at prices and terms complying with
the Group's expectations.
Any failure by the EPC key contractors in fulfilling their obligations, or
the Group's inability to effectively manage the risks using
co-contractors could have a negative effect on the Group' activity, its
financial position and its income.
Should a significant case of liability not entirely covered by
insurance policies occur, it could have a negative effect on the
Group's financial position, cash flows and income
Electricity production entails hazardous activities, including the
operation of large rotating equipment and systems delivering
electricity to the transport and distribution grids. Apart from natural
hazards, unforeseeables risks (including fires, explosions and
defective equipment) are inherent to the activity of the Group, which
could result from internal procedures being inadequate, technical
defects, human errors or external events. These dangers may cause
serious even fatal injuries, serious damage, destruction of property,
plant and equipment, as well as interruption of the operation. The
occurrence of one of these events may cause an investigation to be
opened against the Group, as well as the necessity to adopt
corrective measures, and could result in significant damages including
for bodily injury and environmental damage, fines and/or penalties and
a loss of income due to the suspension of activities.
Furthermore, even if the Group obtains guarantees from its suppliers
and requires its counterparties to comply with certain performance
levels, indemnities for failure to meet these performance guarantees
are unlikely to be sufficient to compensate for the loss of revenue for
the Group, the increase in expenses and financing costs or damages
paid in the event that the Company suffers from a malfunction in its
equipment or non-performance by its counterparties or suppliers.
Damage or losses not covered by the contractor's guarantees may
be covered by taking out insurance, but this is not systematic as it
may be outside the scope of the cover provided by applicable
insurance policies or be considered as such by the insurers. For
example, with regard to the Commentry biomass plant, the Group
had disagreements with the project's insurers about the cover for
damage caused to equipment as well as for the operating time lost
during the plant construction and operation. Discussions are under
way with a view to an amicable settlement under satisfactory
conditions for the Group and the Areva-LLT consortium on the one
hand, and the insurer (RSA) on the other, failing which the Group
reserves the right to exercise all legal remedies, including litigation,
available in due course.
to the damages that the Group could suffer within the scope of its
activities.
There is no guarantee that the Group's insurance cover will be
enough to cover the anticipated or potential losses arising from
insurable events, or again that the insurance cover will be applicable
In addition, in certain cases, the compensation received from the
insurance company concerned could be reduced. The occurrence of
event giving rise to claims being made to the insurers can in turn lead
to additional preventive measures being adopted, such as increased
security and/or insurance premiums, which would have a negative
effect on the plants' profitability. Furthermore, the Group cannot
guarantee that the insurance policies will be renewed on the same
terms as existing policies or that it will be in a position to take out
insurance on normal and acceptable terms to provide appropriate
cover for its activity and plants.
Lastly, the Group could be indirectly affected by the risks arising from
the occurrence of major losses in the renewable energy sector.
Hence, following a series of losses which occurred particularly in the
field of dams as well as several losses arising from natural disasters in
Latin America, some Lloyds syndicates and insurers announced at
the last congress of the Association for Management of Corporate
Risks and Insurance (Association pour le Management des Risques et
des Assurances de l’Entreprise) their withdrawal from the renewable
energy market as well as a possible increase in insurance premiums
for construction in 2019 or 2020.
Each of the aforementioned risks could have a significant negative
effect on the Group's activity, its financial position or its income.
Repairs and renovation of the electricity production plants
carry significant risks which could lead to unexpected
interruptions, reduced production and unanticipated capital
expenditures
The operation of the Group's plants includes risks of breakdowns and
failures if equipment and procedures or again risks of performance
lower than the expected production or efficiency levels. A certain
number of factors can be responsible for these performance failures
and problems, such as human error, lack of maintenance and general
wear over time. Unexpected interruptions of the production units,
including extended programmed interruptions due to mechanical
failures or other problems in connection with the Group's production
plants, can also occur and constitute a risk inherent in its activity.
Unexpected interruptions of the Group's electricity production units
generally involve an increase in operating and maintenance costs,
which may not be recoverable under off-take contracts and thereby
reduce the Group's revenue arising from a reduction in the quantity of
electricity sold or compel the Group to incur substantial expenses as
a result of the increased operating cost of the plant, or could even
constitute a default under an off-take contract leading to its
termination. Furthermore, essential equipment and components may
not always be immediately available when needed, which could lead
to non-negligible downtime and a delay in resuming the plant's
operation, involving a loss of income which would probably not be
entirely compensated by the penal clauses included in the O&M
contracts. Certain bespoke equipment and parts require substantial
lead time for procurement and manufacturing and delivery costs: if
these items do not function as planned or are damaged, replacing
them may require significant expenses for the Group and lead to a
long interruption for the plant concerned.
03Risks factors
Risks and uncertainties
122 REGISTRATION DOCUMENT 2018
Capital expenditures higher than those provided for may be
necessary following changes in the laws and regulations on the
environment, health and safety (including changes in their
interpretation and application), necessary repairs to the plants or
unexpected events (such as natural or human disasters or terrorist
attacks).
Any unexpected failure, particularly breakdowns, forced interruptions
or unexpected capital expenditures, could lead to reduced profitability
for the projects and/or compromise the ability of the SPVs to repay
their debts or to retain the benefit of an off-take contract, to fulfil other
obligations and to pay dividends and could have a significant negative
effect on the Group's cash flow and financial position.
Risks relating to financing the Group's plants3.1.1.1.2
The Group depends on financing arrangements obtained from
various sources for the development and construction of its
renewable energy facilities, particularly from external debt
financing
The development and construction by the Group of solar plants and
wind farms and, in some cases, energy storage facilities, are expensive
activities that require significant financing, mainly through the use of
equity and external debt. This third-party debt financing generally
covers 75% to 85% of the project costs for projects in OECD
countries, between 65% and 75% of project costs for projects in
non-OECD countries, and as low as 60% or even 40% of project costs
for projects with strong merchant revenue components.
At December 31, 2018, the Group's outstanding bank debts amounted
to €1,229 million in project financing, along with €262 million in project
bond financing (essentially mezzanines), for energy generation facilities.
Under certain conditions or in certain markets, particularly in the event
of unfavourable general conditions in the credit market, the Group
may encounter difficulties in obtaining financing in a timely manner
and under conditions that allow a satisfactory profitability of the
projects, sufficient loans, or even to obtain financing at all. This risk is
increased in periods of rising market rates, unless the Group is able to
pass on the increase in the financing cost on to its power purchase
agreements rates. Nevertheless, the Group's leeway could be
hampered by various factors, including, for example, competition from
actors that benefit from less expensive sources of funding (for
example, groups that sell an interest in their projects).
The interval between the response to a tender and the signing of the
power purchase agreement, on the one hand, and the obtaining of
financing (which may be over a year), on the other hand, may also put
pressure on margins in a rising rate environment. Funding may also
be subject to binding conditions that increase operating costs and
reduce project value.
In addition, the Group's ability to obtain project financing may vary
from country to country, and no assurance can be given as to
whether banks that have provided financing for the Group's projects
in the past will continue to do so for new projects or markets as the
Group expands into new markets.
development bank. Reduced competition among lenders is likely to
result in increased financing costs. These lenders may also be able to
impose less favourable financing terms.
Moreover, the Group's ability to negotiate financing for renewable
energy projects on competitive terms is further limited by regulatory
constraints or market conditions in the less mature markets where the
Group is developing its project pipeline. This may require the Group to
establish partnerships with particular potential lenders or with a
In some cases, particularly in non-OECD countries, the Group may be
unable to close its financing after obtaining initial financing
commitments, for example, if the required permits and administrative
authorisations are not delivered or if extreme weather events occur or
political problems arise. In some countries, the Group is often
required to provide financial guarantees or deposits upfront to
participate in the tendering process. Insofar as the banks providing
such guarantees demand counter-guarantees, the Group may have
to draw on its lines of credit to meet these demands without any
assurance that the Group's bid will be successful.
If the Group is unable to negotiate financing or if the financing terms
are unfavourable, the Group may be unable to build some of is
forthcoming projects or will only be able to do so under less profitable
terms. Difficulties in obtaining favourable financing or the inability to
manage liquidity and other risks related to financial guarantees and
deposits provided in tenders or more generally in the event of
unforeseen investment expenses during the period prior to the
recognition of revenue from a particular project may have a material
adverse effect on the Group's business, financial position and results.
The Group has high leverage and significant project debt,
which may affect its operational flexibility and, in a crisis
scenario, have a significant adverse impact on its financial
position
To finance its projects, the Group uses significant leverage to limit its
equity exposure. In this sense, as of December 31, 2018, the Group's
leverage ratio that is the ratio between its net debt and its current
EBITDA (calculated over the last 12 months) was 6.0x. The Group's
medium-term objectives, including its net debt/EBITDA target,
assume a financial leverage ratio of approximately 80-85% of the
invested capital, taking into account all funding, whether senior,
subordinated or corporate. The Group's projects therefore imply a
significant reliance on debt by the special purpose vehicles, which
entails the risks detailed below. Moreover, the Group may be unable
to maintain the necessary leverage to attain its growth targets for
various reasons (including a possible rise in market rates or a higher
equity contribution required by lenders, notably due to a larger
proportion of sales at market prices of the electricity produced by a
project), which would entail greater exposure by its shareholders to
meet the Group's equity requirements.
03Risks factors
Risks and uncertainties
123REGISTRATION DOCUMENT 2018
At December 31, 2018, the Group's consolidated financial debt
amounted to €1,690.7 million, of which €1,492 million in project
financing debts contracted by special purpose vehicles or
intermediate holding companies, and €16.1 million in corporate
financing contracted by the Company that are not intended for
financing projects. The remaining €182.5 million corresponds
(following application of IFRS 16) to rental liabilities (€96.9 million),
shareholder loans granted to project companies or project company
holding companies by minority shareholders (€45.3 million) and
hedging instruments (€40.3 million). For a description of the Group's
indebtedness, please refer to Section 2.2.1. "Group's Indebtedness"
of this document. The indebtedness of each of the Group's project
companies raised in the amount of the project is without recourse to
the Company and the other entities located outside the specific
financing scope, although there are isolated exceptions such as a
guarantee granted by the Company during the period prior to the
commissioning of the Altiplano 200 project in Argentina, scheduled for
the first quarter of 2020.
This means that the debt is repayable only from the income generated
by the SPV concerned or its direct holding company (if several
projects have been syndicated) and that the repayment of these loans
(and interest thereon) is generally secured by the SPV's equity,
physical assets, contracts, insurance policies and cash flows, or
those of its holding if applicable.
If an SPV, or its holding company, were to default on its financing
agreements (for example, because of an unforeseen event or a
deterioration of its financial position) or fail to meet certain minimum
debt service coverage ratios, such failure could make the project debt
immediately payable. In the absence of a waiver or a restructuring
agreement, the lenders may be entitled to seize the assets or
securities pledged as collateral (in particular the Group's interest in
the subsidiary that owns the project).
Moreover, the failure of an SPV or a holding company to repay its
indebtedness could affect its ability to pay dividends to the Group,
pay fees or interest, reimburse intragroup loans and carry out any
other liquidity distribution, as the defaulting entity is generally
prohibited from distributing cash. This would probably result in a loss
of confidence by the Group's clients, lenders or counterparties, which
would adversely affect the Group's access to other sources of
financing for its projects.
Finally, in the event of insolvency, liquidation or reorganisation of one
of the special purpose vehicles, the creditors (including suppliers,
adjudicated creditors and tax authorities) would be entitled to the full
payment of their claim from the project's revenues, before the Group
is allowed to receive any distribution from that project. Where there is
indebtedness for a given project, lenders may request the forfeiture of
the term of the debt and seize any collateral; the Group could then
lose its interest in the special purpose vehicles in question.
The Group's project financing documents includes a certain
number of covenants the non-compliance of which could lead
to default on the project debt
Due to its project financing strategy, the Group has to manage
multiple financing contracts signed by many special purpose vehicles
in different countries and jurisdictions. Although the Group
endeavours to negotiate its financing on a uniform basis for all its
projects, the terms of certain financing agreements may vary or
provide for specific provisions or commitments that may prove difficult
to meet or to manage.
Each financing agreement contains financial and non-financial
covenants that are binding on the project SPV. In particular, financing
agreements generally contain a minimum debt service coverage ratio
or minimum DSCR defined in the financing contract (generally 1.05x
to 1.10x depending on the contract). The typical financing agreement
also imposes restrictions on distributions of monies to shareholders
and repayments of shareholder loans, including compliance with a
“lock-up” DSCR, which is generally set at a higher level than the
minimum DSCR (usually from 1.10x to 1.15x depending on the
agreement, or even higher for projects located in countries that are
not OECD members or that have a high merchant component), and
the maintenance of a "debt service reserve account". Certain
financing agreements impose minimum ratios of equity to
indebtedness. Lastly, some agreements also include cross-default
clauses in regard to the SPV or its direct holding company and, in
some cases, in relation with the financial position of the Company.
Failure to meet these covenants by the Group could lead to an event
of default on a project's financing and have adverse consequences,
such as the blocking of the project distributions, an increase in costs
or even the acceleration of the project debt, and thus have a
significant negative impact on the Group's ability to obtain financing in
the future or have an effect on the cost of its future financing. In
addition, if the Company experienced financial difficulties, this could
trigger the cross-default clauses included in some financing contracts
and thus lead to simultaneous defaults on several project SPVs.
At December 31, 2018, the minimum DSCRs and/or the minimum
equity/debt ratios were adhered to by the Group's companies, with
the exception of two cases of non-adherence to minimum DSCRs
stated below:
concerning the Auxois Sud wind farm, shutdowns were carried out●at the end of 2018 to enable the construction of an extension (the
Plateau d'Auxois Sud plant) leading to a loss of revenue equivalent
to two months of production, which reduced the DSCR to below
the default trigger. This event remains exceptional and does not in
any way reflect lower performance of the plant;
concerning the Champs d’Amour wind farm, in its first year of●operation it suffered from less wind combined with a production
ramp-up slower than expected over the first months of operation.
This combination pushed the DSCR below the default trigger.
As of the date of this document, the Group has entered into
discussions with the lending creditors in order to obtain waivers for
these cases of non-compliance with minimum DSCRs. These
discussions led to an agreement with the lenders on the terms of
waivers proposed by the Group, which are still waiting to be signed
formally. Therefore the Group does not anticipate major difficulties in
obtaining these waivers.
03Risks factors
Risks and uncertainties
124 REGISTRATION DOCUMENT 2018
Risks relating to the sale of electricity generated by the Group's plants 3.1.1.1.3
The profitability and, in many cases, the financing of the
Group's renewable energy projects are dependent on securing
power purchase agreements beforehand. The Group may be
unable to obtain these power purchase agreements on terms
that allow sufficient profitability from the projects
The value and viability of the Group's renewable energy projects
depend on its ability to sell the electricity produced under contracts
concluded with solvent counterparties and at appropriate prices,
especially within the context of public tenders. As of December 31,
2018, over 80% of the Group's secured capacity (in MW) are
allocated to power purchase agreements resulting from public
tenders (or feed in tariff) or were won after a public procedure.
These public tenders are usually governed by a specific regulatory
framework and/or government initiatives. Tenders are mainly won
according to the price in the offer.
Consequently, if competitors are willing to accept lower margins than
the Group or have less stringent project profitability analyses, margins
may be on pressure, it may be harder for the Group to win tenders or
win them at prices that ensure the project is sufficiently profitable.
In some cases, tenders may be announced before the Group or its
local business partners have sufficient time to develop projects to
present in its bid.
Also, some tenders include local commitments or criteria other than
the price of the offer that the Group may not be able to meet.
If the Group is unable to secure power purchase agreements for a
given project under a public tender or under sufficiently favourable
terms, it will likely be unable to finance that project or will only be able
to do so on unfavourable financing terms. In such circumstances, the
Group may retain such a project in its pipeline and attempt to obtain
power purchase agreements afterwards, through future tenders, but
cannot guarantee that such a tender would take place or that it will be
successful in winning it. Such a situation may lead the Group to incur
additional interim costs to maintain projects that may never be built. If
these projects are not carried out, all the associated prior
development costs that are capitalised in the balance sheet will be
written down and a corresponding expense will be recognised in the
Group's income statement, which may adversely affect the Group's
growth prospects, as well as its financial results.
Lastly, the Group cannot guarantee that it will be able to renew or
negotiate new power purchase agreements after the termination of
the initial agreements or that it will be able to negotiate sales prices
under future contracts or on the wholesale markets on terms
equivalent to those obtained initially. For more information, please
refer to “The Group is exposed to wholesale market price risks”
below. The Group’s inability to negotiate such long-term contracts
may increase volatility in the Group's earnings and cash flow, or result
in substantial future losses (or facility impairment), which could have a
significant adverse effect on the Group's business, financial position
and results.
The Group is exposed to wholesale electricity market price risk
The Group is exposed to price risks on the wholesale electricity
market (spot market), including the prices of green certificates or any
other instrument specific to a given market (for example, large-scale
generation certificates or LGCs in Australia) on which it sells part of
the electricity generated by its facilities.
The Group currently generates revenues from electricity sales on the
market in the following situations:
in some cases, where wholesale spot prices are expected to be●higher than the long-term PPA price, the Group aims to structure
the start date of the project’s long-term PPA to allow the Group to
benefit from a period of spot market sales prior to the long-term
PPA taking effect;
in other cases, the PPA only covers part of the estimated electricity●produced, which allows the Group to sell the excess electricity on
the spot market;
finally, for timing and strategic reasons, the Group may●exceptionally decide to construct a project prior to securing an
expected PPA and to sell at spot rates all energy generated before
the PPA is secured or enters into force.
In each of these cases, as in all circumstances where the Group sells
the electricity it produces on the wholesale electricity market, the
Group is and/or will be exposed to the risk that prices decrease on
the electricity market. In 2018, merchant revenues amounted to
€27.8 million, that is 12.2% of the Group's total revenue. The Group's
current policy (which may change in the future) is to maintain a market
exposure below a 20% threshold of its annual revenue.
Wholesale electricity prices are generally highly volatile,
market-specific and dependent on many factors. These include the
level of demand, time, availability and the cost of producing the
available capacity to meet demand, as well as the structure of
wholesale markets (especially the rules that define the order in which
generation capacity is allocated), and the factors affecting the amount
of electricity that can be carried by the available infrastructure at any
given times.
Electricity prices on the wholesale market partly depend on the
relative cost, the efficiency and the investments required for the
development and operation of conventional energy sources (such as
oil, coal, natural gas or nuclear energy) as well as renewables, such
as those operated by the Group. As a consequence, a decrease in
the costs of other sources of electricity, such as fossil fuels or nuclear
energy, may lead to a decrease in the wholesale market price.
Similarly, new electricity generation capacity could also lead to a
decrease in the wholesale market price, or even cause prices to be
negative at given times.
More significant regulatory changes in the electricity market (such as
changes in the integration of transport allocation or changes relating
to electricity exchange and transport pricing) could also have an
impact on electricity prices. Given the intermittency of solar and wind
resources (and in the absence of energy storage facilities near the
sites), it is difficult for the Group to capitalise on the periods of
strongest demand in the wholesale markets when these periods
happen when sunshine and wind are not sufficient to cope with
demand. Incidentally, prices fall and may at times even become
negative in markets with a high solar generation capacity during
periods where electricity supply increases due to prolonged sunshine.
03Risks factors
Risks and uncertainties
125REGISTRATION DOCUMENT 2018
There have previously been periods of high volatility in the wholesale
electricity market, and there could be more such periods in the future.
Electricity prices have fallen significantly in some markets in recent
years and periods of initially high prices can quickly be followed by
periods of declining prices. More generally, in the absence of a
contract for difference or equivalent arrangement, a project's revenue
is less predictable when it sells all or part of its electricity on the
wholesale market than if it sold it within the framework of a PPA
covering the entire production of the installation. The greater volatility
of income from a project exposed to market prices reduces the
percentage of the financing of a project by debt.
The Group generates revenues from the sale of renewable energy
certificates or green certificates (large-scale generation certificates or
LGCs) it obtains through the generation of electricity by wind and
solar projects in Australia. It then sells its LGCs either as part of a
bundled package with the electricity sold under the PPA or in sales on
the market via brokers or directly to distributors, or pursuant to LGC
sales contracts. In these latter cases, the Group is exposed to the risk
of decrease or volatility of LGC prices on the markets. In 2018,
revenues from the sale of LGCs amounted to €48.2 million, i.e. 21.1%
of the Group's total revenue.
A slump in the market price of electricity or LGCs could have a
negative impact on the financial appeal of new projects and the
profitability of the Group's facilities to the extent that part of their
electricity production, and some of the underlying LGCs, are sold on
the market. The impact on the Group's operating results and financial
position may be significant, depending on the extent of the market
exposure (i.e., spot sales or LGC sales) of its portfolio.
Some of the Group's power purchase agreements expose it to
inflation risk
Some of the Group's power purchase agreements do not provide for
the possibility of increasing prices based on inflation or provide for a
partial increase only. Even if the currencies in which the Group's
power purchase agreements are denominated (euros, US dollars and
Australian dollars) have experienced limited inflation in recent years,
they may be exposed to increased inflation in the future.
The Group's operating costs may increase if a given country where it
operates experiences a rise of inflation, and the Group may not be
able to generate sufficient revenues from the relevant power purchase
agreements without a price adjustment mechanism to offset inflation,
which could hinder its financial performance and, in extreme cases, its
ability to comply with financial covenants under project financing
arrangements.
The early termination of a PPA or a counterparty's default
could also adversely affect the Group's business
The Group sells most of the electricity generated by its assets under
long-term power sale agreements (up to 25 years) with state
counterparties (states or state-owned companies), utilities, and a
limited number of corporate off-takers.
Power purchase agreements entered into by the Group may be
terminated by the counterparties in limited circumstances, including
events that render any payment made under such contracts illegal,
cases of force majeure (including acts of state) and certain tax events.
This termination option for counterparties is generally subject the
payment of termination penalties. The loss of significant power
purchase agreements that may result from an early termination,
particularly if they concern a large plant, may have a significant
adverse effect on the Group's business, financial position and results.
The Group aims to reduce counterparty risk on electricity sales
contracts, in part by entering into contracts with states, public
electricity utilities or other clients with high credit quality, and by
obtaining performance guarantees by the purchasers. However,
whenever a current or future counterparty does not have, or loses, an
investment-grade credit rating and/or the Group cannot obtain
guarantees from the state; the Group is or will be exposed to
increased counterparty risk.
Even when the Group obtains such state guarantees, the guarantor
may not have an investment-grade credit rating, or may lose it. As of
December 31, 2018, the Group's main [four] clients, which accounted
for around 75% of its capacity in operation (in MW), all have
investment-grade credit ratings.
Similarly, the Group may be unable to fully limit its exposure to
regional economic crises, as well as the ensuing credit risk, despite its
diversity of locations. These risks may increase when there is volatility
in the global or regional economy.
Also, as long as the Group's purchasers are state entities or
state-owned entities, it is exposed to an increased risk of
expropriation or regulatory or political risks, including the privatisation
of counterparties, which may affect the proper performance of the
relevant contracts.
For an analysis on the Group's exposure to counterparty risk, please
refer to Section 3.1.3.3 of this document.
The financial performance of the Group's plants depends on its
counterparties' credit quality and regular performance of their
obligations under electricity sales contracts. A counterparty's default
in this regard may have a significant adverse effect on the Group's
business, financial position and results.
03Risks factors
Risks and uncertainties
126 REGISTRATION DOCUMENT 2018
RISKS RELATING TO THE ORGANISATION AND STRATEGY OF THE GROUP3.1.1.2
The internationalisation of the Group's activities and its
expansion in developing markets expose it to legal, political,
operational and other risks which could have a negative effect
on its operations and profitability
The Group currently operates solar plants, wind farms, electricity
storage facilities and a biomass plant, mainly in France and Australia,
its main markets in which it generated over 90% of its revenue in
2018, and to a lesser degree, solar plants on selected markets in
Europe, Latin America and Africa. It plans to extend its operations to
a large degree outside France and Australia, particularly in Latin
America (market in which the Group generated 7% of its revenue in
2018 but which constitutes 28% of the MWs in its portfolio of secured
projects at December 31, 2018).
The existing international activities of the Group and its expansion
strategy expose it to a certain number of risks connected to its
penetration in new markets and the management of its international
operations, particularly risks such as political (decline in public policies
to promote the development of renewable energies), competitive
(decrease in the costs of producing other sources of energy
compared with solar and wind energy on local markets or giving
preference to local competitors, through greater requirements of local
content), legal (increased exposure to disagreements or disputes or
increased legal and tax restrictions), relational (difficulties in
maintaining relations with local technical, financial and legal partners)
or operational (increased amount of work for the management of the
Group or failure to adjust the Group's policies and commercial
practices to local markets). The inability to effectively manage risks
linked to international expansion could have a substantial negative
effect on the Group's activity, financial position and income.
Furthermore, the current and expected operations of the Group in
emerging markets, particularly in Latin American and Africa, expose it
to specific risks inherent in investments and operations in developing
markets, and particularly:
emerging markets in which the Group operates or contemplates●operating are at various stages of development and could suffer
considerable changes in their economic performance, as well as
political unrest, social movements, war, terrorist acts or any other
violence. The level of security of certain markets may be reduced
and, from time to time, the Group has experienced theft or security
failures on these markets, which may also increase the risk of
failure or shortcomings of the infrastructure;
grid managers and other key counterparties in certain markets,●particularly concerning developing markets, may have limited or no
experience of the technical requirements for the development and
construction of renewable energy plants and their connection to the
electricity grid. This may lead to substantial delays in the
development and the non compliance of some of the development,
construction and commissioning stages;
the activities of the Group on developing markets may present risks●of losses in the event of expropriation, nationalisation, confiscation
of assets and property, restrictions on foreign investment and
recovery of invested capital;
imposition of foreign exchange controls or no acceptable foreign●currency in one or more emerging markets in which the Group
operates or intends to operate may lead to restrictions on
converting the local currency into a foreign currency and the
transfer of funds abroad, which could limit upstream payments of
the Company's dividends;
certain emerging markets have implemented measures to●encourage foreign investment, particularly tax benefits, the
elimination of which could have a negative impact on the Group's
income or on the availability or the cost of project financing in these
countries;
certain emerging markets could impose limits, new or additional, on●direct foreign investment, in which case the Group would have to
cope with additional costs or would have limited access to project
financing on attractive terms;
the inadequacy of the legal system and laws may create some●uncertainty for investments and the Group's activity in some
countries, due to the changes in requirements which could turn out
to be costly or unexpected, judicial systems' limited budgets,
unfavourable judicial interpretations and/or inappropriate or
uncertain regulatory systems. This could expose the Group to even
more risks with regard to the performance of contracts and could
increase the financing cost or reduce the financing available for the
Group's projects. These considerations led to, and could in the
future lead to the Group entirely abandoning certain projects or
markets without being able to recover all its investment; and
the Group operates or plans to operate in certain countries in which●corruption may be more widespread than in others. Even though
the Group has adopted a Neoen charter designed to respond to
these risks, the Group's controls and procedures could fail to
prevent anti-corruption laws and regulations being violated.
Any failure to comply with the applicable anti-corruption laws and
regulations could result in substantial fines, civil or penal penalties,
and an undermining of its reputation which could have a negative
effect on the cost and availability of financing for projects.
The Group's inability to adequately cope with the risks in connection
with operations and investment on developing markets could have a
significant negative effect on its activity, reputation, financial position
and income.
The Group may be unable to realise the envisaged benefits
from its acquisitions
The Group has mainly seen organic growth in the past, but has also
acquired interests in projects partially developed by third parties,
notably the Cestas solar plant in France, the Hornsdale wind farm in
Australia and more recently the Hedet wind farm in Finland. The
Group selectively acquires interests and some projects when it
believes that it can bring substantial added value in the development
of a facility. However, there is no guarantee that the envisaged
advantages will materialise.
03Risks factors
Risks and uncertainties
127REGISTRATION DOCUMENT 2018
The Group may discover, during development of a project and after
having acquired it, difficulties or problems linked to the project, which
have a negative impact on its profitability and make it difficult or
impossible to develop it at cost and with the initially envisaged
financial returns. These problems may force the Group to restructure
its investment or abandon the entire acquired project, which could
have a major negative impact on its financial situation and its results.
Further, the Group has already acquired and could in future acquire
energy companies in markets where it already operates or in its target
markets.
Interesting opportunities may present themselves due to an ad hoc
situation in a region, conditions in the renewable energy sector or
circumstances specific to a seller. In these situations, the Group may
have to act quickly so as not to miss an opportunity. The activities
linked to these acquisitions may take up some of the attention of the
Group's management and could increase the Group's leverage.
Future acquisitions could be significant and/or complex, and the
Group may be unable to complete them as envisaged or be unable to
complete them at all. There is no guarantee that the Group will be
able to negotiate the required agreements, overcome local or
international opposition and obtain the necessary licences, permits
and finance. Such risks, as well as political developments, could
hinder or prevent the completion of such acquisitions. Even if the
Group is able to complete these acquisitions, their success and the
performance under the related agreements will be subject to
additional risks, including risks linked to operation in developing
countries and risks linked to legal and regulatory changes. The
expected synergies may not materialise, and the Group may have
difficulty in consolidating the companies acquired. The Group may
also be exposed to major unforeseen liabilities and problems affecting
the target companies that it may have failed to identify during
its due diligence. The costs associated with these liabilities
or problems may not all be covered by compensation clauses
that the Group negotiates as part of its purchase agreements.
One of the abovementioned problems may have a major negative
impact on the Group's financial situation and results.
The success of the Group depends on its ability to retain key
executives and employees and to attract and retain new
qualified employees
The success of the Group and its ability to pursue its growth
objectives depend on qualified executives and employees, particularly
certain of the Group's executives and employees with specific
expertise in project development, financing, engineering, construction,
operation and maintenance. In view of their expertise in industry in
general, their knowledge of the Group's operating processes and
their relations with the Group's local partners, the loss of the services
of one or more of these persons could have a significant negative
effect on the growth, project development, financial position and
income of the Group.
additional qualified personnel with specific technical or market
segment expertise, including in the many international sites where it is
established.
As the Group extends its activities, its portfolio and establishment in
various regions, its operational success and its ability to pursue its
business plan largely depend on its ability to attract and retain
For example, the Group's engineering and personnel are crucial to
the development of new projects and the operation operation of
existing assets. The success of these projects depends on the
recruitment and retention of personnel, worldwide, with sufficient
expertise to enable the Group to complete accurately and timely its
analysis and report production requirements. There is substantial
competition in the renewable energy industry to attract qualified
personnel with the necessary expertise, and the Group cannot
guarantee that it will be in a position to recruit a sufficient number to
support its business plan and its growth. The inability to recruit and
retain qualified personnel could have a negative effect on the Group's
activities.
Furthermore, sometimes executives and other employees with
technical or market segment expertise leave the Group. If the Group
does not manage to rapidly appoint qualified and effective successors
or is unable to effectively manage the temporary expertise
discrepancies or other disruptions brought about by such departures,
this could have a significant negative effect on its activities and growth
strategy.
The Group's activities depend on its IT infrastructure, and
delays or breakdowns, or any potential cyber-attack on its IT
networks and system could have a negative effect on its
income
The Group's activity is based on the effective and uninterrupted
operation of its IT infrastructure, which includes complex and
sophisticated IT systems, telecommunications system, audit,
accounting and reporting, data processing, data acquisition and
monitoring systems. The Group may suffer computer breakdowns
and disruptions of these systems and networks, which are used in all
its activities, including in its highly automated plants and for the
distribution and supply of electricity. These may be caused by system
updating problems, natural disasters, cyber-attacks, accidents,
power cuts, telecommunications failures, terrorist attacks or war,
computer viruses, physical or electronic intrusions or similar events or
disruptions.
Disruptions to the Group's IT systems could seriously disrupt
administrative and sales operations, including causing a loss of
sensitive data and compromise operating capacity. This could also
lead to a loss of service for customers and incur substantial
expenditures to correct the security breaches and damage to the
system. Furthermore, in addition to having a negative effect on the
Group's activity, a failure of the operations' monitoring system
(focused on availability, the activity and efficiency of the plant,
accounting and reporting, operational monitoring, health and safety
and compliance with the laws and regulations on the environment)
could lead to a loss of revenue, non-compliance with contractual,
regulatory or tax obligations, requirements regarding permits and give
rise to fines and penalties.
03Risks factors
Risks and uncertainties
128 REGISTRATION DOCUMENT 2018
ACCOUNTING AND FINANCIAL RISKS RELATING TO THE ACTIVITY OF THE GROUP3.1.1.3
Impairment of the carrying value of the plant, property and
equipment and intangible assets of the Group would have a
negative effect on its income and consolidated balance sheet
The property, plant and equipment acquired by the Group is mainly
comprised of the generating assets held by the Group, generally
recorded as such as from the construction launch of a project or from
the date of its acquisition by the Group.
To a lesser extent, property, plant and equipment includes other
types of assets such as the plots of land purchased by the Group for
the construction of its facilities or structuring costs in connection with
the arrangement of facilities used to finance the assets up until the
commissioning of relevant projects. Intangible assets acquired by the
Group mainly comprise the capitalised development costs related to
the various projects, which are capitalised once the activation criteria
have been met. The property, plant and equipment and intangible
assets stood at €1,703 million and €122 million, respectively,
at December 31, 2018.
These assets are initially recorded at their cost and their fair value and
the property, plant and equipment and intangible assets relating to
projects in operation are amortised or depreciated over their useful
life. When impairment indicators are available, an impairment test is
carried out on the property, plant and equipment and intangible
assets.
When the recoverability of the assets is assessed, the Group makes
estimates and assumptions on the sales, climate resources, interest
rates, raw materials prices and discount rates in accordance
with the Group's budgets, business plans, economic forecasts,
forecasted cash flows of the Group as well as market data.
There are uncertainties inherent to these factors and the
management's judgement when applying them. As a general rule, the
fair value of the property, plant and equipment and intangible assets
is determined by discounting the future cash flows generated by each
group of assets.
The Group could be required to assess the recoverability of its
property, plant and equipment and intangible assets in a certain
number of situations, particularly when there is a diminished
probability of the project's development succeeding, a disruption of
the activities, an unexpected significant reduction in the operating
income, the sale of a major component of its activities or when an
unfavourable measure or decision is taken by regulatory authority.
Impairment expenses relating to the property, plant and equipment
and intangible assets significantly affect the Group's net expenses
during the periods in which they are recorded. If the current economic
conditions worldwide deteriorate, or if environmental policies with
regard to renewable energy become unfavourable, this could increase
the risk that the Group depreciates its property, plant and equipment
and intangible assets.
The Group might not be in a position to fully or effectively
hedge against exposure to exchange rate risk
The Group generally hedges against a potential exchange rate risk
insofar as certain of its project development costs and, in certain
cases, the project construction costs are paid in a currency other
than the one used to finance the project or the one in which the
Group receives its income from operations. For an analysis of the
Group's exposure to exchange rate risk and hedging, refer to
Section 3.1.3.2 of this document. Nevertheless, the risk management
procedures set up by the Group with regard to such hedging might
not always be effective or protect it as planned against exchange rate
fluctuations. In particular, when foreign exchange exposure is not yet
certain, the Group could decide not to hedge the risk. Consequently,
the exchange rate fluctuation may have a negative effect on the
financial results of the Group insofar as the Group did not hedge
certain positions or did not hedge them sufficiently. Furthermore,
certain types of economic hedge activities might not be eligible for
hedging accounting in accordance with IFRS, which would increase
volatility in the Group's net income.
The Group is not entirely hedged and might not be effectively
covered against the interest rate fluctuations provided for in
the project financing contracts to which it is party
In the majority of its project financing contracts, the Group has
hedged most of its exposure to the risk of a variable interest rate.
For an analysis of the Group's exposure to the interest rate risk, refer
to Section 3.1.3.1 of this document.
Nevertheless, with the aim, among others, of ensuring the greatest
flexibility in the case of early repayment or cancellation of the debt,
part of its exposure to the rate risk cannot be hedged. In certain
cases, the lender concerned is not in a position to provide an interest
rate risk at financial close, thereby exposing the project to variable
interest-rate fluctuations until the full draw-down on the debt
concerned.
In such cases, the resulting increases in interest rates and financial
expenses may affect the project company's ability to pay dividends,
to repay loans to shareholders or even to service its debt, or again to
increase the investment amounts required during construction, which
could lead to insufficient funds to complete commissioning the plant.
03Risks factors
Risks and uncertainties
129REGISTRATION DOCUMENT 2018
RISKS RELATING TO THE RENEWABLE ENERGY SECTOR3.1.2
RISKS RELATING TO REGULATION AND PUBLIC POLICY3.1.2.1
Any reduction in or challenge to regulated prices and tariffs for
the purchase of renewable electricity by national or local
authorities or any other public entity could have a material
adverse effect on the Group
The value and viability of the wind and solar power, storage and
biomass facilities developed and operated by the Group depend on
its capacity to sell the electricity thereby generated at suitable price
levels, either pursuant to power purchase agreements or on the
wholesale market.
In the past, those of the Group's projects located in France enjoyed an
open-window purchase obligation which required EDF or local
distribution companies to purchase the electricity generated by the
Group at the feed-in tariffs set by ministerial order. Since the introduction
of France's Energy Transition Law for environmentally-friendly growth
dated August 17, 2015, a majority of the Group's facilities located in
France now benefit from the “feed-in premium” mechanism based on the
option to sell the electricity generated by certain facilities directly on the
wholesale market (in particular to suppliers and traders) while also
receiving a premium paid by EDF. The feed-in premium agreement
works on the basis of a “contract for difference” by which EDF has an
obligation to pay the producer the difference between the price that it
would have paid under a feed-in tariff mechanism and the price at which
the producer is selling the electricity on the market. These contracts for
difference are either signed further to invitations to tender or, to a lesser
extent, in the context of an open-window framework.
These feed-in tariffs or feed-in premium mechanisms, on an
open-window basis or further to competitive tenders, are also found
in other countries in which the Group has a presence. For example,
in Zambia, the “Scaling Solar” programme in which the Group has
taken part in the past is aimed at coordinating the development and
installation of solar power plants with a target capacity of 600 MW.
In Argentina, the Group is a participant in the “RenovAr” programme
which includes provision for invitations to tender further to which the
successful bidders are awarded power purchase agreements offering
them a U.S. dollar-based indexed fixed price for a term of 20 years
with Compañía Administradora del Mercado Mayorista Eléctrico
(“CAMMESA”).
For each of these countries, any adverse changes in the premiums or
the prices offered on an open-window basis or further to invitations to
tender could have a material impact on the profitability of the Group's
projects and the revenue generated, particularly if the said feed-in
premiums or feed-in prices are not sufficiently high to cover the
project costs (notably the cost of repaying agreed debt) and
guarantee appropriate returns. Moreover, if the Group is not able to
reduce its costs, notably via other system components (BOS and/or
BOP components), quickly enough to offset the reduction in the
feed-in premiums or regulated prices in France or other countries, the
projects based on such remuneration conditions may not be viable.
Any adverse change in the regulations or public policy in
support for renewable energy could have a material effect on
the Group's activities
The Group's activities are, to a certain extent, dependent on the
incentive-based public policies adopted in those countries in which
the Group operates aimed at promoting the production and sale of
energy from renewable sources. Depending on the country, these
measures may take the form of commitments and planning for the
production of renewable energy (such as the multi-year energy
programme in France or the “Renewable Energy Target” programme
in Australia), direct or indirect subsidies paid to operators, obligations
to purchase at feed-in tariffs or the payment of bonuses through the
open-window market or in the context of invitations to tender, pricing
rules for electricity generated using renewable sources, quotas for the
supply of renewable energy imposed on private professional
consumers, the issuance of green certificates which can be traded in
the marketplace (notably, the large-scale generation certificates in
Australia), preferential rights to access electricity transport and
distribution networks and tax incentives. These policies and
mechanisms generally reinforce the commercial and financial viability
of renewable energy facilities and often make it easier for the Group to
obtain financing.
The Group's ability to benefit from these policies and their favourable
nature depend on the political and strategic options selected with
regard to the environmental challenges in a given country or region,
which may be impacted by a wide range of factors including
macro-economic conditions in the country or region in question,
changes within governments and lobbying efforts made by the
various stakeholders, including the renewables sector, other electricity
producers and consumers, environmental groups, farming businesses
and others.
Moreover, the organisation of public invitations to tender which
constitute the main opportunities for the Group to sell the electricity
generated depends to a great extent on the willingness of States or
regions to promote the production of renewable energy within their
territory, or even on planning tools such as the multi-year energy
programme in France. States or regions, due to political changes or
new governments could reduce the number of tender procedures or
throw into question ongoing or announced procedures. For example,
in Mexico, after the federal elections of 2018, the Centro Nacional de
Control de Energía or “CENACE” announced the postponement then
abandonment of tender procedures initially planned for the end of
2018, for which the Group was a preselected candidate.
These exceptional decisions delay the Group's ability to conclude
PPAs and find openings for the projects it develops in the country.
As far as the specific case of Mexico is concerned, the costs incurred
on the project Puebla represented €950 thousand at December 31
2018. Considering the opportunities offered by the Mexican energy
market, the Group has decided to continue developing this project
outside the framework of the initial call for tenders. To date, its
prospects for completion remain real, and justify maintaining
development costs in the Group's financial statements.
More generally, any challenge to, or adverse change in these
incentive-based public policies and any uncertainties in relation to
their interpretation or implementation or any reduction in the number
of invitation to tender procedures carried out or in the volumes
allocated thereby could have a material adverse effect on the Group's
business, results or financial position.
03Risks factors
Risks and uncertainties
130 REGISTRATION DOCUMENT 2018
More generally, the Group is doing business within a restrictive
regulatory environment. These regulations relate to matters of urban
planning, environmental protection (planning regulations, noise
regulations, biodiversity), protection of local populations (such as
Aboriginal populations in Australia), hygiene, safety and health at
work, maintenance and control of operational facilities, dismantling of
facilities at end of life and recycling of their components. If the Group
does not make its facilities compliant, or ensure their compliance with
the relevant provisions, it may have its authorisations withdrawn
(licences, permits, etc.) or be fined by the regulatory authorities or grid
managers which could have a major negative impact on its business,
results and financial situation.
If the Group is unable to secure the permits, licences and
authorisations necessary for the conduct of its business or the
construction of its facilities, this could have a material adverse
effect on business and on the value of its portfolio of assets
In the context of its activities, the Group is subject to significant
constraints relating to the issuance of the permits, licences and
authorisations required by the regulations in force and issued by local
or national authorities. Depending on the country, these permits,
licences and authorisations may take the form of planning permission
(such as building permits), environmental surveys and mandatory
impact surveys, generating and operating authorisations, network
connection authorisations and any other specific authorisations
related to the presence of protected areas close to the facilities
(archaeological sites, historic buildings, military or nuclear facilities,
forests, etc.).
Depending on the country, national governments and local authorities
may have greater or lesser discretionary powers with regard to the
granting of these permits, licences and authorisations and may
exercise these discretionary powers in an arbitrary or unpredictable
manner. Moreover, the number of competent authorities may make
the process for obtaining these authorisations and permits lengthy,
complex and costly.
Therefore, the Group cannot guarantee that it will be able to obtain
the permits, licences and authorisations necessary for the
construction of a given facility or for any activity that it intends to carry
out in a specific country at a reasonable cost or in accordance with
the anticipated timetable. Finally, for projects at the development
stage, the Group may have committed resources without obtaining
the permits and authorisations necessary and may therefore have to
withdraw from or abandon a project, which could have a material
adverse effect on its business, development or financial position.
More generally, if the Group is unable to secure these permits and
authorisations, this could have a material adverse effect on its
business and on its operating results.
Any opposition to the construction of facilities from local
communities or any challenge to permits, licences and
authorisations once granted to the Group may extend the
development timeline or force the Group to abandon certain
projects
The wind power projects and, to a lesser extent, solar projects
developed and operated by the Group may be the target of strong
opposition from local communities and associations, specialised in
particular in the fight against wind farms, particularly in France.
to an appeal filed by neighbours and associations who generally cite
damage to the landscape, noise pollution, damage to biodiversity or,
more generally, harm to the local environment before the courts.
In particular, the permits, authorisations and licences necessary for
the construction of a facility may, once granted, become the subject
Appeals of this kind are very frequent for those of the Group's wind
farm projects located in France and may arise for projects worldwide.
When the permits and authorisations obtained by the Group are
challenged or cancelled, the periods needed to develop the projects
are longer, and in some extreme cases, may force the Group to
abandon these projects under development.
At December 31, 2018, less than 10% of the Group's 87 solar power
projects and 27% of the Group's 45 wind power projects in the
“awarded”, “tender-ready” and “advanced development” phases in
France had become the subject of an appeal (projects in the “early
stage” phase are not generally far enough advanced to be challenged
by an appeal). Between January 1, 2018 and December 31, 2018,
the Group was forced to abandon one solar power project and one
wind farm project as a result of appeals.
More generally, no guarantees can be given by the Group that a wind
farm or, to a lesser extent, a solar power plant currently under
development will be given a positive reception or be accepted by its
neighbouring communities. Even if there are various regulations aimed
at restricting the exact locations of wind farms or solar power plants,
opposition from the local community may make it more difficult to
obtain a building permit and this could lead to more restrictive new
regulations being adopted. A lesser degree of acceptance by local
communities regarding the location of power plants, an increase in
the number of appeals or an adverse change to their outcome could
lead the Group to abandon certain projects and, therefore, have an
adverse effect on the Group's prospects and financial performance.
The Group could have exposure to tax risk
As an international group doing business in a large number of
countries, the Group has structured its commercial and financial
activities in accordance with the various regulatory obligations to
which it is subject and with its commercial and financial objectives.
The structure of the Group will moreover have to change as and when
the Group's activities develop, notably on an international level. To the
extent that the tax laws and regulations of the various countries in
which the Group entities are located or doing business do not make it
possible to establish any clear or definitive guidelines, the tax regime
applied to its activities, transactions or intra-group reorganisations
(past or future) involving Group companies is or could on occasion be
based on an interpretation of French or foreign tax laws and
regulations.
The Group cannot guarantee that these interpretations will not be
challenged by the relevant tax authorities. More generally, any
violation of the tax laws and regulations in force in those countries in
which the Group or Group entities are located or doing business may
lead to tax audits or to the payment of interest for late performance,
fines and penalties. In addition, tax laws and regulations may change
or be amended with regard to the interpretation and application made
by the relevant courts or authorities, potentially with retroactive effect,
in particular in the context of joint initiatives adopted on an
international or EU level (OECD, G20, European Union). Each of the
foregoing points is liable to take the form of an increase in the
Group's tax burden and have a material adverse effect on its financial
position or results.
03Risks factors
Risks and uncertainties
131REGISTRATION DOCUMENT 2018
The Group was the subject of tax audits in 2018 which could reoccur
in the future. The outcome of the tax audits could alter the Group's
forecasts and the amount recorded as a provision, if required, in the
consolidated financial statements, which could have a material
adverse effect on the Group's deferred tax assets, cash flow,
business, financial position or results of the Group.
The Group currently benefits (directly or via its special purpose
vehicles) from beneficial tax regimes or tax incentives in certain of the
countries in which it is active, designed to facilitate the development
and promote the use of renewable energy sources or the investments
related thereto. The benefit and scale of the tax incentive regimes are
not guaranteed and changes to these policies could have a material
adverse effect on the Group's business, results and financial and tax
situation.
Conversely, the Group is subject to specific taxes applicable to
companies in the energy sector in general and to local taxes
applicable to the construction of energy production facilities or the
use of electricity networks. The scale of these taxes could change in
response to shifts in political and social sensitivity to environmental
matters and in view of the maturity and growing profitability of the
renewable energy industry as a whole. Any increase in the specific
taxes and local levies could have a material adverse effect on the
Group's activities, its results, financial and tax position, in particular if
such an increase were to apply specifically to renewable energies
without targeting other energy sources, which could lead to a
potential reduction in the competitiveness of renewable energy.
The Group could see a reduction in its capacity to make
interest tax deductible
Articles 212 bis and 223 B bis of the French General Tax Code, in the
version in force prior to the 2019 budget act, limit the percentage of
the net financial expenses which can be deducted from company tax,
subject to certain terms and conditions and other than for exceptions
at 75% for financial years beginning after January 1, 2014 and before
January 1, 2019 (the “planing” rule).
In addition, according to the terms of the French rules on
under-capitalisation applicable to financial years beginning before
January 1, 2019, the deduction of any interest paid on loans granted by
a related party and, subject to certain exceptions, on loans granted by
third parties but guaranteed by a related-party, is subject to limitations,
in accordance with the rules set out in Article 212 of the French General
Tax Code in the version pre-dating the 2019 Finance Act.
The rules referred to above limiting the ability to deduct interest by
virtue of French tax legislation have been abandoned with effect from
financial years starting from January 1, 2019 in the context of the
partial transposition of the European directive establishing the rules for
the prevention of tax fraud, having a direct impact on the operation of
the internal market, adopted on July 12, 2016 (“ATAD”).
For financial years starting after January 1, 2019, the 2019 Finance
Act has introduced a new mechanism to limit the ability to deduct net
financial expenses at 30% of EBITDA for tax purposes (or €3 million if
greater), applied on the level of the tax group. This threshold is
reduced to 10% of EBITDA for tax purposes (or to €1 million if
greater) if the tax group is considered to be under-capitalised
pursuant to the new provisions. More favourable measures such as
protection clauses and the carry-forward of non-deductible financial
expenses may apply under certain conditions depending on the
situation of the Group.
The impact of these rules on the Group's capacity to carry out the
effective deduction of interest charges for tax purposes could have a
material adverse effect on its results and financial position.
The Group's future results, French and foreign tax rules and
tax audits and disputes could limit the Group's capacity to
record deferred tax assets and thereby have an effect on the
Group's financial position
The Group may record deferred tax assets on its balance sheet as the
difference between the recording of tax in accordance with IFRS and
the actual tax paid by Group entities. This difference includes inter alia
the deferred impact of any reduction in tax on losses carried forward.
At December 31, 2018, deferred tax assets net of tax liabilities carried
forward stood at €1.3 million, it being stipulated that this figure
includes the deferred tax assets corresponding to Group tax deficits
and tax credits for €45.3 million (please see Note 27 to the Annual
Financial Statements).
The actual realisation of these assets in future years will depend on a
set of factors including (i) the ability to generate a profit for tax
purposes and the degree of adequacy between the level of realisation
of these profits and the level of losses, (ii) the general limit applicable
to French tax deficits, according to which the percentage of any
deficit which can be carried forward for tax purposes which can be
used to off-set the portion of the taxable earnings in excess of
€1 million for each relevant subsequent financial year is capped at
50%, (iii) the limits imposed on the use of the tax deficits imposed by
foreign laws and regulations, (iv) the consequences of any current or
future tax audits or litigation and (v) any potential changes to the
applicable laws and regulations.
The impact of these risks could increase the tax burden imposed on
the Group and thereby have an adverse effect on the Group's
effective tax rate, financial position and results.
The Group has exposure to risk linked to various legal or
administrative proceedings or proceedings launched by tax or
regulatory authorities
The Group is currently involved in legal proceedings and litigation and
could, in the future, be involved in litigation of all kinds or in any other
judicial, governmental, administrative or tax proceedings, in the
normal course of its business. These proceedings may lead to an
adverse decision, to the payment of considerable damages, to
regulatory penalties or even criminal law penalties, and cause damage
to the reputation of the Group and thereby have a material adverse
effect on its business, financial position or results. Even if proceedings
of this kind are finally resolved in favour of the Group, they may take
up a significant volume of its resources and of its employees' time or
lead to negative publicity, to the detriment of the Group's reputation
and business.
For example, on 28 September 2016, a power failure occurred
throughout the entire state of South Australia for a period of 26 hours.
The Australian Energy Market Operator ("AEMO") issued a report on
the causes that identified tornadoes that had damaged the area’s
electricity transmission network infrastructure, resulting in
accumulated malfunctions of electricity transmission systems that, in
turn, triggered the system protection mechanisms of several wind
farms connected to the network, including Hornsdale Wind Farm 1
Pty Ltd ("HWF 1"). These system protection measures led to a
reduction or even stoppage of such wind farms’ output and hence an
increase in imported power flowing into the network, specifically from
the neighbouring state of Victoria, through an interconnector that
overloaded and was tripped offline, leading to complete system
shutdown.
03Risks factors
Risks and uncertainties
132 REGISTRATION DOCUMENT 2018
The Australian Energy Regulator (“AER”) requested information and
documents regarding the black-out from HWF 1 (and, to the
Company’s knowledge, from other renewable energy producers
connected to the network). HWF 1 responded to these questions and
provided the requested documents.
that it has a strong basis to contest any civil proceedings that may be
issued against HWF 1. However, no assurances can be given with
respect to the outcome of any such proceedings (or any appeal from
such proceedings), and the Group recognises that a declaration that
HWF 1 was in breach of the NER would increase the risk of a class
action lawsuit against HWF 1 by claimants seeking compensation forOn May 2, 2019, AER issued a letter to HWF 1 (and other renewabledamages allegedly incurred caused by the black-out. Defendingenergy providers) containing an invitation to provide furtheragainst any legal action would be costly and any related losses couldinformation or submissions in relation to alleged breaches of thebe significant.National Electricity Rules (“NER”) connected with the black-out. HWF
1 provided a written submission to AER dated May 10, 2019, and
thereafter AER and HWF 1 met on May 17, 2019, to further discuss
the issue. It is possible that the AER will issue civil proceedings
against HWF 1 for alleged breaches of the NER and seek (amongst
other things) an order that HWF 1 pay a civil penalty (up to a
maximum amount of AUD100,000 per breach). The Group believes
To the best of the Company's knowledge, there are no other legal or
administrative proceedings or proceedings from tax and regulatory
authorities that could have or may have recently had a significant
impact on the financial position or profitability of the Company and/or
the Group.
RISKS LINKED TO CLIMATE AND NATURAL DISASTERS3.1.2.2
Generating electricity from renewable energy sources is highly
dependent on meteorological conditions, notably sun and
wind, and the intermittent nature of renewable energies may
cause fluctuations and be a problem from a competitive
perspective
The Group is investing in and plans to continue investing in electricity
generating projects dependent on wind and sun. At December 31,
2018, those of the Group's solar facilities and wind farms in operation
represented 883 MW and 489 MW respectively, i.e. approximately
59% and 33% of its total operating capacity.
Generating levels for the Group's solar and wind projects depend
closely on the degree of irradiation for solar power facilities and the
kinetic energy of the wind to which wind turbines are exposed, both
of which are resources outside of the Group's control and which may
vary significantly depending on the period. Predicting general
meteorological conditions, such as seasonable variations in
resources, is highly complex, particularly given that exceptional poor
weather conditions may lead to one-off fluctuations in generating
levels and in the levels of income generated by the projects.
While, at the time of writing this Reference document, the Group's
activities are primarily concentrated in France (41% of the MW in
operation as of December 31, 2018) and in Australia (50% of the MW
in operation as of December 31, 2018), the geographical and
technological diversification strategy being applied to the portfolio of
Group projects should in the future restrict the scale of this risk on a
consolidated level. If adverse weather conditions were to continue
over the long term, this could have a negative impact on the level of
profitability of the projects in question.
Insufficient levels of irradiation or wind are liable to trigger a reduction
in the amount of electricity generated. Inversely, excessive heat may
lead to a reduction in the amount of electricity generated by solar
power plants and wind in excess of a certain speed may cause
damage to wind farms and force the Group to shut down turbines.
record for the sites. The Group's internal rate of return (“IRR”) and the
financial covenants negotiated in the context of project financing are
generally based on the assumption that these forecasts will be
accurate at least for a defined percentage of the time.
The Group makes forecasts relating to the amount of electricity
generated using statistical surveys based on the past meteorological
The estimates regarding the level of irradiation and wind resources
per site created on the basis of the Group's own experience and
studies carried out by independent engineers may however not reflect
the actual level of solar and wind resources available on a given site
for a given period. Although the Group draws up forecasts for
variations compared with the meteorological track record as well as
the potential impacts on its business, it cannot guarantee that these
forecasts will be sufficient to anticipate the most significant adverse
impacts on its business and predict future weather conditions.
Any reduction in the amount of electricity generated for the reasons
set out above would be liable to trigger a fall in revenue and in the
profitability of the Group and could have a material adverse effect on
its business, financial position or operating income and, in extreme
cases, on its capacity to comply with the financial covenants pursuant
to the project financing agreements.
Risks linked to climate change and to extreme weather events
could have an adverse impact on Neoen's business
The risks linked to climate change or extreme weather events could
have a material impact on the Group's facilities and activities.
To the extent that climate change triggers fluctuations in temperature,
wind resources and meteorological conditions, generates an increase
in average cloud cover or again increases the intensity or frequency of
extreme weather events, it is possible that it could have an adverse
effect on the Group's facilities and business. Moreover, extreme
weather events are liable to cause damage to the Group's facilities or
increase the number of stoppage periods, an increase in operating
and maintenance costs (O&M costs) or again interfere with the
development and construction of large-scale projects. For example, in
certain markets in which the Group has a presence, the Group has
already had to deal with extreme weather events such as hurricanes
in Jamaica and earthquakes in El Salvador.
03Risks factors
Risks and uncertainties
133REGISTRATION DOCUMENT 2018
RISKS LINKED TO COMPETITION IN THE RENEWABLE ENERGY SECTOR 3.1.2.3AND THE COMPETITIVENESS OF THE SECTOR COMPARED WITH OTHER SOURCES OF ENERGY PRODUCTION
Competition in the renewable energy market is increasing
constantly and may have an adverse effect on the Group
There is a great deal of competition in the solar, wind and biomass
energy sector which is undergoing constant change, and the Group is
faced with significant competition in each of the markets in which it
operates. This competition is the result of multiple factors including
notably an increase in the number of stakeholders in the renewable
energy sector in recent years, the fall in the cost of solar panels and
wind turbines, of other system components (BOS or BOP
components), and also in construction and maintenance costs, the
cost of capital and other costs, a fall in electricity prices both in the
spot market and via feed-in tariffs or through competitive tendering,
and, again, further to rapid changes in technology having an impact
on the sector.
All these factors may reduce the average sale price in power
purchase agreements or accentuate the Group's difficulties in bidding
successfully in invitations to tender at prices which guarantee the
desired or necessary returns, notably in order to guarantee the
financing of the projects in question. This intensive and increasing
level of competition has, along with the reduction in supply costs,
contributed to pushing down the prices on offer in the context of
invitations to tender, thereby leading to ever lower prices being seen
in the context of recent procedures.
Moreover, in each of the markets in which it operates, the Group is
facing competition both from local entities and global stakeholders,
many of which have a great deal of experience (both nationally and
internationally) in the development and running of power plants and
financial resources which are at least equivalent to or better than
those of the Group.
In addition, in recent years, the renewable energy sector has been
marked by a trend toward consolidation, notably via the arrival of
international energy groups in this market. As an example, EDF, the
main electricity supplier in France which is controlled by the French
State, has recently announced an ambitious programme for the
development of solar energy in France as well as a plan to develop
electricity storage in France and internationally which will be
implemented via dedicated subsidiaries. Other leading energy
operators such as Engie and Total have also strengthened their
positions in the renewable energy market via recent acquisitions of
independent wind and solar developers and producers. Finally, other
competitors have attempted to increase their market share via merger
transactions and company consolidations which have led to the
creation of larger stakeholders, having significant financial resources,
in many cases exceeding those of the Group.
The renewable energy market is a young market compared
with the conventional energy market and is changing rapidly,
and it may not develop as rapidly or in the manner anticipated
by the Group and could suffer from competition with other
sources of electricity generation
capacity and the attractiveness of renewable energies compared with
other sources of energy, in particular:
The renewable energy market is a market which is relatively young
compared with the market for electricity generated using fossil fuels or
nuclear energy. This market may change more rapidly or in a different
manner from that as currently anticipated by the Group or by sector
analysts. Several factors may impact growth in terms of generating
the competitiveness of the electricity generated by production●facilities using renewable energy sources compared with
conventional energy sources such as natural gas or nuclear fuel;
the performance, reliability and availability of the energy generated●by facilities producing electricity from renewable energy sources
compared with other conventional energy sources;
improvements in technology and changes in the cost of●components (solar panels, wind turbines, other system
components) as well as in development and construction costs
(EPC costs) and operating and maintenance (O&M costs) of the
facilities;
fluctuations in economic and market conditions having an impact●on prices and on demand for conventional energy, notably price
rises or falls concerning primary energy sources such as natural
gas, coal, oil and other fossil fuels, as well as developments relating
to cost structure, efficiency and investment in the equipment
necessary for other electricity generating technologies;
fluctuations impacting global demand for renewable energy both●from State entities (in the event of challenges to public incentive
schemes) and private stakeholders (notably in the event of a
reduction in the positive image enjoyed by private companies
powered exclusively or mainly by renewable energy); and
for those geographical markets in which network parity has not yet●been achieved, fluctuations in the availability, content and scale of
support programmes, including objectives set by public authorities,
subsidies, incentives and standards favourable to renewable energy
and including the possible adverse changes concerning the
programmes applicable to the other forms of production,
convention or other, of electricity.
Any one of the factors listed above could undergo changes not
currently anticipated by the Group. New market conditions could
emerge and be liable to impact the Group's strategy planning in an
unexpected manner. If the renewable energy market were to develop
more slowly or other than anticipated, investors' interest in investing in
this sector could erode and the Group could experience difficulties in
achieving its development objectives or commercial objectives.
The Group has exposure to risks linked to variations in the
price of solar panels and wind turbines, in other system
components, design, construction and manpower costs and
the raw materials necessary for the production of renewable
equipment
Although the Group entrusts the construction of its solar power plants
and wind farms to third-parties via turnkey EPC contracts, the specific
wind turbines and solar panels which it wants to see installed in its
solar power plants and wind farms are almost always stipulated and
the Group gives its opinion on the suppliers of other system
components (BOS or BOP components) such as inverters,
transformers, electric protection measures, cabling and monitoring
equipment, as well as structural elements such as the mounting
frames or wind turbine masts.
03Risks factors
Risks and uncertainties
134 REGISTRATION DOCUMENT 2018
The price of these wind turbines, solar panels and other system
components (BOS or BOP components) may increase or fluctuate
depending on a range of factors outside of the Group's control such
as adverse changes in the price of the raw materials required for the
production of renewable generating equipment (steel, lithium, cobalt,
etc.), the re-imposition of anti-dumping measures targeting Chinese
solar panel manufacturers (as was the case in the United States in
2018) or the adoption of any other inter-governmental commercial
measures targeting key materials used in the plants. These measures
could therefore increase the Group's supply costs, which could
damage the value of its projects or render certain projects non-viable,
each of these circumstances potentially having a material adverse
effect on the Group's business, results or financial position.
In order to remain competitive, the Group must respond to the
rapidly changing solar and wind power and electricity storage
markets, notably via the identification of new technologies and
their integration into projects currently under development
The solar and wind power and electricity storage sectors are marked
by rapid progress and an increase in the range of technologies,
products and services available. Technological progress made in
terms of solar, wind and electricity storage contributes to reducing
costs as well as improving techniques in order to offer better network
integration and improved returns, making older technologies less
competitive. Moreover, companies may perfect new electricity
generating or storage technologies which are more competitive from
the point of view of costs or more profitable than the solar, wind and
storage equipment used by the Group. If the Group does not manage
to identify and develop these new technologies or to adapt its existing
facilities to use these innovations, it could experience difficulties
in the context of participation in invitations to tender or in signing
attractive power purchase agreements for its new projects.
There could therefore be a material impact on the Group's business,
its financial position and the results of operations.
The Group may also experience difficulties with regard to negotiating
financing for projects using new but relatively unusual and as yet
untested technologies, which may place the Group at a disadvantage
compared with those of its competitors who have sufficient resources
in order to finance projects using these new technologies themselves,
in particular when these require a significant initial investment and/or
then give a material advantage in terms of costs.
If the Group's competitors manage to develop technologies enabling
them to submit lower bids or bids with more attractive conditions in
the context of invitations to tender, the Group may not be in a
position to align itself with these bids without causing an impact on its
profitability or could even be unable to submit a bid in the context of
the procedure. This situation could have a material adverse effect on
the Group's business, its future prospects, financial position and
operating results.
RISKS RELATED TO ACCESS 3.1.2.4TO AND THE PERFORMANCE OF ELECTRICITY GRIDS
Difficulties relating to the connection to distribution and
transmission networks, insufficient electricity transport
capacity and the possible cost of renovating the transport
network could have a material effect on the Group's capacity
to build its plants and sell the electricity generated thereby
In order to sell the electricity generated by the plants it operates, the
Group must have these plants connected to public distribution
networks or, to a lesser extent, electricity transportation networks.
So, the possibility of installing a production site at any given location
depends closely on the possibility of connecting the plant to the
distribution and/or transportation networks. As the sites available for
the construction of plants are sometimes located at a distance from
distribution and/or transportation networks, the Group cannot
guarantee that it will be able to obtain sufficient network connections,
within the contemplated cost and time parameters, for the
construction of its future plants, notably in non-mature or emerging
markets for which the network manager still lacks the experience
required in terms of connecting renewable energy generating facilities.
Moreover, insufficient network capacity caused by network
congestion, by over-production by connected facilities or by
excessive fluctuations in electricity market prices could cause material
damage to the Group's projects and lead to a reduction in project
size, delays in the implementation of projects, the cancellation of
projects, an increase in costs due to network improvements and the
potential confiscation of the guarantees put in place for the Group
with the network manager in the context of connection to a given
project.
Insufficient capacity of this kind could also lead the grid operator to
ask the Group to cap the supply to the network below its regular
production capacity (grid curtailment). At the moment, this
phenomenon is mainly an issue for the Group in Australia where the
network is accessible to all electricity generators (an open access
network), with no priority granted to renewables, and where the
Group is obliged to keep losses in terms of energy transported to a
minimum (marginal loss factors or “MLF”), notably in the event of
positive or negative fluctuations in network supply. In South Australia,
lack of network capacity has led the Australian Energy Market
Operator to limit the amount of wind-generated electricity injected into
the network based on the number of gas-powered power stations in
operation at the same time. The occurrence of curtailment requests of
this kind automatically leads to a loss of income generated by the
facilities impacted and a reduction in their profitability. Moreover, for
each of its projects in Australia, the Group has established financial
models taking grid curtailment and MLF forecasts into account on the
basis of the scenarios considered to be probable as of the date of the
financial closing. If these assumptions were to prove insufficient, this
would have a potentially material adverse effect on the internal rates
of return for the projects in question and, in extreme cases, could
impact the special purpose vehicles' ability to service their debt.
The introduction of energy storage measures by the Group has
provided a partial response to the risks generated by curtailment,
as is shown in Section 2.1.4.1 of this document.
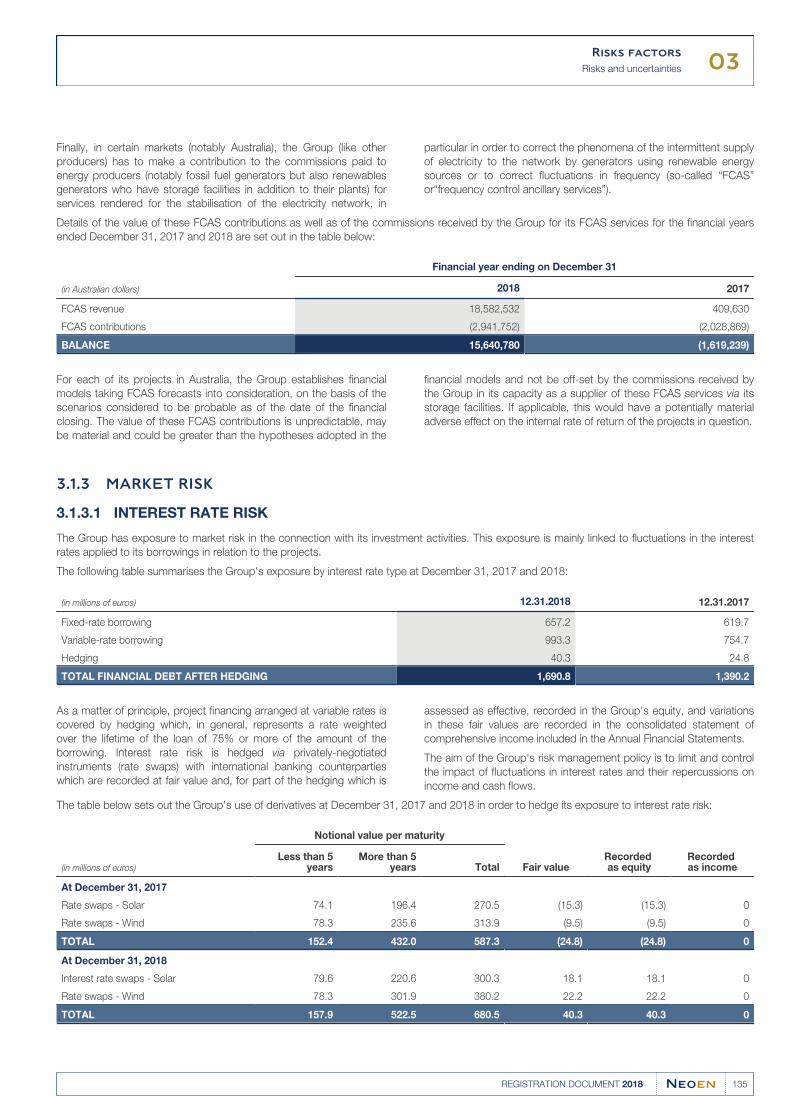
03Risks factors
Risks and uncertainties
135REGISTRATION DOCUMENT 2018
Finally, in certain markets (notably Australia), the Group (like other particular in order to correct the phenomena of the intermittent supply
producers) has to make a contribution to the commissions paid to of electricity to the network by generators using renewable energy
energy producers (notably fossil fuel generators but also renewables sources or to correct fluctuations in frequency (so-called “FCAS”
generators who have storage facilities in addition to their plants) for or“frequency control ancillary services”).
services rendered for the stabilisation of the electricity network, in
Details of the value of these FCAS contributions as well as of the commissions received by the Group for its FCAS services for the financial years
ended December 31, 2017 and 2018 are set out in the table below:
(in Australian dollars)
Financial year ending on December 31
2018 2017
FCAS revenue 18,582,532 409,630
FCAS contributions (2,941,752) (2,028,869)
BALANCE 15,640,780 (1,619,239)
For each of its projects in Australia, the Group establishes financial financial models and not be off-set by the commissions received by
models taking FCAS forecasts into consideration, on the basis of the the Group in its capacity as a supplier of these FCAS services via its
scenarios considered to be probable as of the date of the financial storage facilities. If applicable, this would have a potentially material
closing. The value of these FCAS contributions is unpredictable, may adverse effect on the internal rate of return of the projects in question.
be material and could be greater than the hypotheses adopted in the
MARKET RISK3.1.3
INTEREST RATE RISK3.1.3.1
The Group has exposure to market risk in the connection with its investment activities. This exposure is mainly linked to fluctuations in the interest
rates applied to its borrowings in relation to the projects.
The following table summarises the Group's exposure by interest rate type at December 31, 2017 and 2018:
(in millions of euros) 12.31.2018 12.31.2017
Fixed-rate borrowing 657.2 619.7
Variable-rate borrowing 993.3 754.7
Hedging 40.3 24.8
TOTAL FINANCIAL DEBT AFTER HEDGING 1,690.8 1,390.2
As a matter of principle, project financing arranged at variable rates is assessed as effective, recorded in the Group's equity, and variations
covered by hedging which, in general, represents a rate weighted in these fair values are recorded in the consolidated statement of
over the lifetime of the loan of 75% or more of the amount of the comprehensive income included in the Annual Financial Statements.
borrowing. Interest rate risk is hedged via privately-negotiated
instruments (rate swaps) with international banking counterparties
which are recorded at fair value and, for part of the hedging which is
The aim of the Group's risk management policy is to limit and control
the impact of fluctuations in interest rates and their repercussions on
income and cash flows.
The table below sets out the Group's use of derivatives at December 31, 2017 and 2018 in order to hedge its exposure to interest rate risk:
(in millions of euros)
Notional value per maturity
Fair valueRecorded as equity
Recorded as income
Less than 5years
More than 5years Total
At December 31, 2017
Rate swaps - Solar 74.1 196.4 270.5 (15.3) (15.3) 0
Rate swaps - Wind 78.3 235.6 313.9 (9.5) (9.5) 0
TOTAL 152.4 432.0 587.3 (24.8) (24.8) 0
At December 31, 2018
Interest rate swaps - Solar 79.6 220.6 300.3 18.1 18.1 0
Rate swaps - Wind 78.3 301.9 380.2 22.2 22.2 0
TOTAL 157.9 522.5 680.5 40.3 40.3 0
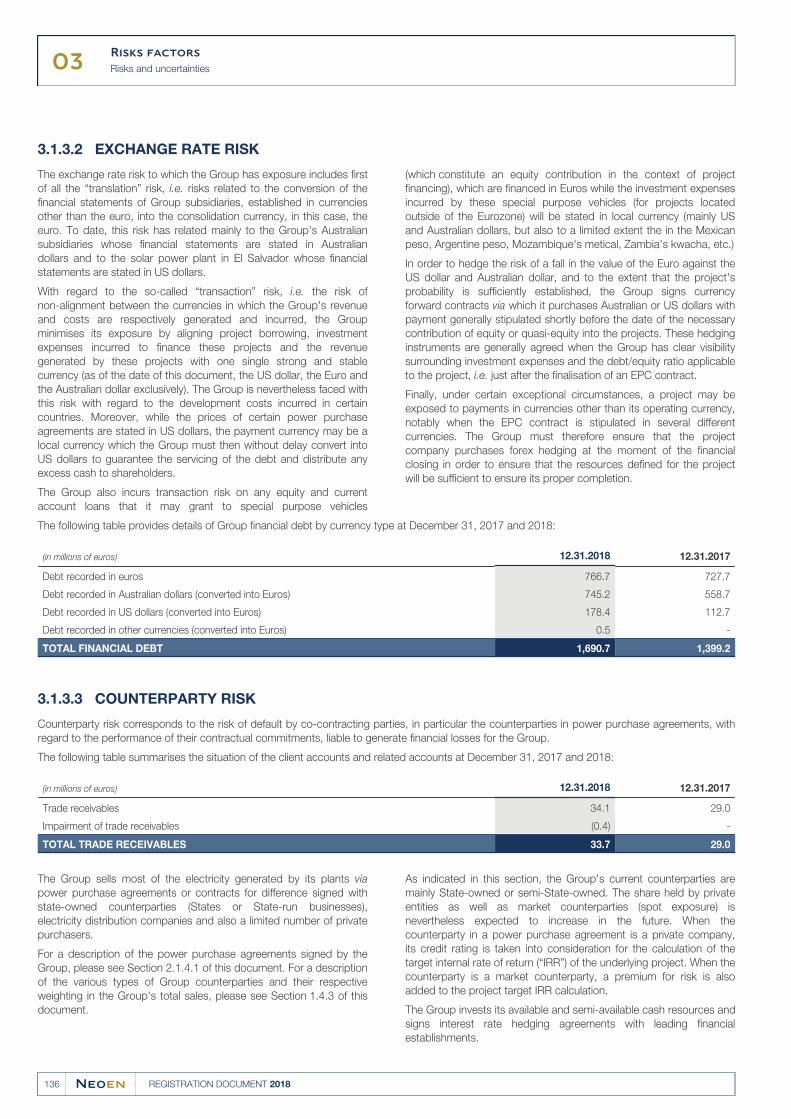
03Risks factors
Risks and uncertainties
136 REGISTRATION DOCUMENT 2018
EXCHANGE RATE RISK3.1.3.2
The exchange rate risk to which the Group has exposure includes first
of all the “translation” risk, i.e. risks related to the conversion of the
financial statements of Group subsidiaries, established in currencies
other than the euro, into the consolidation currency, in this case, the
euro. To date, this risk has related mainly to the Group's Australian
subsidiaries whose financial statements are stated in Australian
dollars and to the solar power plant in El Salvador whose financial
statements are stated in US dollars.
With regard to the so-called “transaction” risk, i.e. the risk of
non-alignment between the currencies in which the Group's revenue
and costs are respectively generated and incurred, the Group
minimises its exposure by aligning project borrowing, investment
expenses incurred to finance these projects and the revenue
generated by these projects with one single strong and stable
currency (as of the date of this document, the US dollar, the Euro and
the Australian dollar exclusively). The Group is nevertheless faced with
this risk with regard to the development costs incurred in certain
countries. Moreover, while the prices of certain power purchase
agreements are stated in US dollars, the payment currency may be a
local currency which the Group must then without delay convert into
US dollars to guarantee the servicing of the debt and distribute any
excess cash to shareholders.
(which constitute an equity contribution in the context of project
financing), which are financed in Euros while the investment expenses
incurred by these special purpose vehicles (for projects located
outside of the Eurozone) will be stated in local currency (mainly US
and Australian dollars, but also to a limited extent the in the Mexican
peso, Argentine peso, Mozambique's metical, Zambia's kwacha, etc.)
The Group also incurs transaction risk on any equity and current
account loans that it may grant to special purpose vehicles
In order to hedge the risk of a fall in the value of the Euro against the
US dollar and Australian dollar, and to the extent that the project's
probability is sufficiently established, the Group signs currency
forward contracts via which it purchases Australian or US dollars with
payment generally stipulated shortly before the date of the necessary
contribution of equity or quasi-equity into the projects. These hedging
instruments are generally agreed when the Group has clear visibility
surrounding investment expenses and the debt/equity ratio applicable
to the project, i.e. just after the finalisation of an EPC contract.
Finally, under certain exceptional circumstances, a project may be
exposed to payments in currencies other than its operating currency,
notably when the EPC contract is stipulated in several different
currencies. The Group must therefore ensure that the project
company purchases forex hedging at the moment of the financial
closing in order to ensure that the resources defined for the project
will be sufficient to ensure its proper completion.
The following table provides details of Group financial debt by currency type at December 31, 2017 and 2018:
(in millions of euros) 12.31.2018 12.31.2017
Debt recorded in euros 766.7 727.7
Debt recorded in Australian dollars (converted into Euros) 745.2 558.7
Debt recorded in US dollars (converted into Euros) 178.4 112.7
Debt recorded in other currencies (converted into Euros) 0.5 -
TOTAL FINANCIAL DEBT 1,690.7 1,399.2
COUNTERPARTY RISK3.1.3.3
Counterparty risk corresponds to the risk of default by co-contracting parties, in particular the counterparties in power purchase agreements, with
regard to the performance of their contractual commitments, liable to generate financial losses for the Group.
The following table summarises the situation of the client accounts and related accounts at December 31, 2017 and 2018:
(in millions of euros) 12.31.2018 12.31.2017
Trade receivables 34.1 29.0
Impairment of trade receivables (0.4) -
TOTAL TRADE RECEIVABLES 33.7 29.0
The Group sells most of the electricity generated by its plants via
power purchase agreements or contracts for difference signed with
state-owned counterparties (States or State-run businesses),
electricity distribution companies and also a limited number of private
purchasers.
For a description of the power purchase agreements signed by the
Group, please see Section 2.1.4.1 of this document. For a description
of the various types of Group counterparties and their respective
weighting in the Group's total sales, please see Section 1.4.3 of this
document.
As indicated in this section, the Group's current counterparties are
mainly State-owned or semi-State-owned. The share held by private
entities as well as market counterparties (spot exposure) is
nevertheless expected to increase in the future. When the
counterparty in a power purchase agreement is a private company,
its credit rating is taken into consideration for the calculation of the
target internal rate of return (“IRR”) of the underlying project. When the
counterparty is a market counterparty, a premium for risk is also
added to the project target IRR calculation.
The Group invests its available and semi-available cash resources and
signs interest rate hedging agreements with leading financial
establishments.
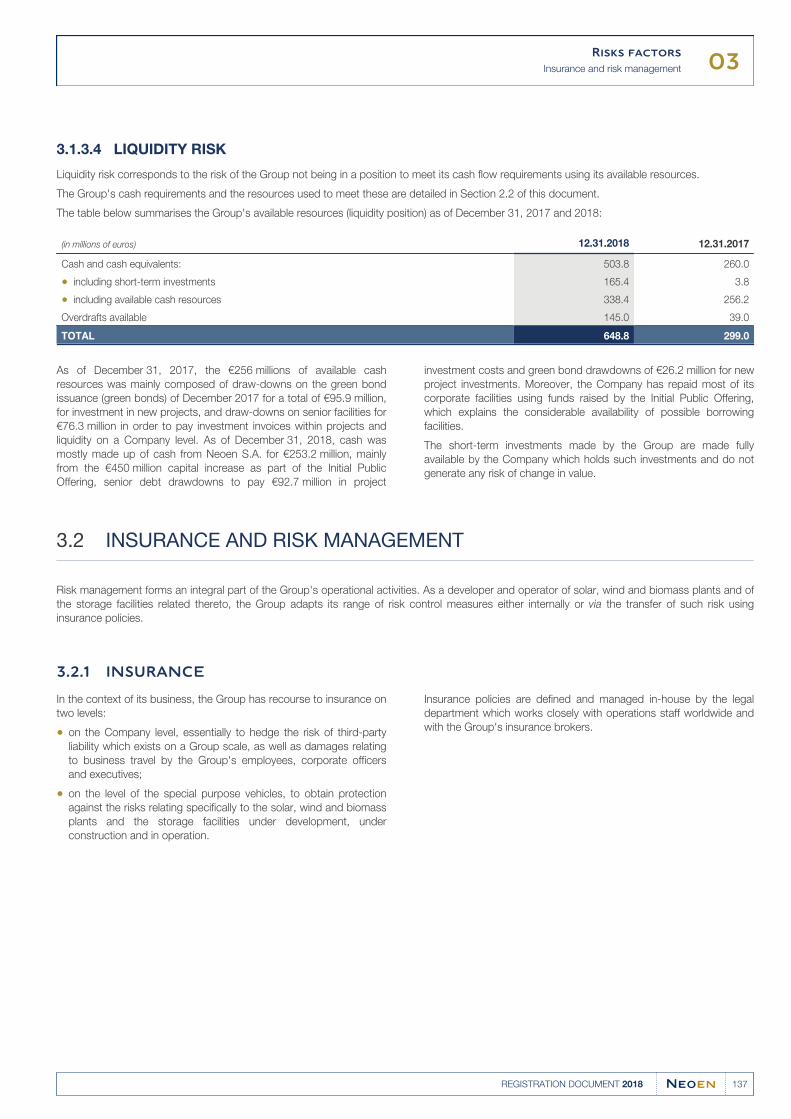
03Risks factors
Insurance and risk management
137REGISTRATION DOCUMENT 2018
LIQUIDITY RISK3.1.3.4
Liquidity risk corresponds to the risk of the Group not being in a position to meet its cash flow requirements using its available resources.
The Group's cash requirements and the resources used to meet these are detailed in Section 2.2 of this document.
The table below summarises the Group's available resources (liquidity position) as of December 31, 2017 and 2018:
(in millions of euros) 12.31.2018 12.31.2017
Cash and cash equivalents: 503.8 260.0
including short-term investments● 165.4 3.8
including available cash resources● 338.4 256.2
Overdrafts available 145.0 39.0
TOTAL 648.8 299.0
As of December 31, 2017, the €256 millions of available cash investment costs and green bond drawdowns of €26.2 million for new
resources was mainly composed of draw-downs on the green bond project investments. Moreover, the Company has repaid most of its
issuance (green bonds) of December 2017 for a total of €95.9 million, corporate facilities using funds raised by the Initial Public Offering,
for investment in new projects, and draw-downs on senior facilities for which explains the considerable availability of possible borrowing
€76.3 million in order to pay investment invoices within projects and facilities.
liquidity on a Company level. As of December 31, 2018, cash was
mostly made up of cash from Neoen S.A. for €253.2 million, mainly
from the €450 million capital increase as part of the Initial Public
Offering, senior debt drawdowns to pay €92.7 million in project
The short-term investments made by the Group are made fully
available by the Company which holds such investments and do not
generate any risk of change in value.
INSURANCE AND RISK MANAGEMENT3.2
Risk management forms an integral part of the Group's operational activities. As a developer and operator of solar, wind and biomass plants and of
the storage facilities related thereto, the Group adapts its range of risk control measures either internally or via the transfer of such risk using
insurance policies.
INSURANCE3.2.1
In the context of its business, the Group has recourse to insurance on
two levels:
on the Company level, essentially to hedge the risk of third-party●liability which exists on a Group scale, as well as damages relating
to business travel by the Group's employees, corporate officers
and executives;
on the level of the special purpose vehicles, to obtain protection●against the risks relating specifically to the solar, wind and biomass
plants and the storage facilities under development, under
construction and in operation.
Insurance policies are defined and managed in-house by the legal
department which works closely with operations staff worldwide and
with the Group's insurance brokers.
03Risks factors
Insurance and risk management
138 REGISTRATION DOCUMENT 2018
THE GROUP'S THIRD-PARTY LIABILITY 3.2.1.1AND “BUSINESS TRAVEL” INSURANCE
The insurance policies taken out by the Company to cover all Group
entities and its employees, corporate officers and executives are
essentially third-party liability policies as well as “business travel”
policies. As of the date of this document, the Group has taken out the
following main insurance policies, with the levels of cover (and caps
on compensation) that it considers appropriate and usual for
businesses active in the same market:
an international third-party liability insurance programme, provided●by XL Insurance Company SE, the purpose of which is to insure the
Group and those of its representatives and employees located in
France and in certain countries (notably Australia, Portugal,
Jamaica, El Salvador, Mexico, Mozambique, Argentina, Zambia,
Finland and the United States) against the financial consequences
of any liability potentially arising in relation to bodily, material and
non-material damages resulting from faults, errors of fact or law,
oversights, omissions, negligence or inaccuracies by them or their
agents and caused to third parties, including clients of the Group,
in the conduct of their professional activities. This insurance
programme also includes a “criminal defence” package covering
the payment of fees charged by any agents (solicitors, barristers,
bailiffs, appraisers) and the expenses necessary for the defence of
the Group in the event of lawsuits filed as a result of serious
incidents. The total value of these guarantees is capped per claim
and per year of insurance, with sub-limits imposed by type of
damage. This insurance is comprised of a master policy,
completed where applicable by local policies in Jamaica,
Mozambique and in the United States where the Group has
subsidiaries. This master policy is to apply in addition to or instead
of the local policies for coverage not provided thereby or when an
obligation exists to obtain local cover as a first resort;
a third-party liability insurance programme for executives and●corporate officers, provided by AIG (primary insurer) and Liberty,
intended mainly to provide cover for the directors, executives and
corporate officers of Group entities worldwide against the financial
consequences of any claims filed against them and on the basis of
any professional fault perpetrated in the performance of their
duties. The programme also covers defence costs incurred by
insured persons in proceedings in the civil, criminal and
administrative courts;
a “business travel” insurance programme (“employee assignments”●policy), provided by Chartis, aimed at covering all employees,
corporate officers, executives and directors or any person tasked
with an assignment by the Group, including expatriates and those
on secondment, against any damage caused in the context of their
business travel (by air or land, etc.). The total value of these
guarantees is capped per claim (each time with sub-limits imposed
by type of damage). This policy is completed by insurance provided
by Covéa Fleet which provides cover for the personal vehicles of
employees on assignment in the event of material and non-material
damage and without limitation in the event of bodily harm.
The insurance policies taken out by the Group contain caps,
exclusions and deductibles which could, in the event of a major claim
or a lawsuit being filed against the Group, have adverse
consequences. Moreover, the fact that, in certain cases, the Group
may be obliged to pay significant indemnities not covered by the
insurance policies in place or could incur material expenses not
covered or not sufficiently covered by its insurance policies cannot be
excluded.
INSURANCE SPECIFIC TO THE SPECIAL 3.2.1.2PURPOSE VEHICLES
In the performance of its activities relating to the development and
operation of wind, solar and biomass projects and of the storage
facilities related thereto, the Group is protected via insurance policies
against any damages and incidents that could occur and impact a
facility.
The Group's general insurance policy is based on the following
principles:
each Group project must be covered by:●
a “comprehensive construction risk” policy, providing both the●Group and the project company with cover relating to the
environmental and third-party liability risk that could apply
during the facility's construction phase,
when the facility has been commissioned, operating insurance●providing cover for third-party liability, damages and loss of
income caused by or to the facility (for example, fire, theft and
acts of vandalism, natural disasters, etc.);
if each project has its own insurance cover, separate from that●applicable to other projects, such cover must be in line with Group
policy on insurance cover. In the specific case of French solar
projects, standard terms and conditions have been set in the
master policies negotiated upstream by the Group with leading
insurance providers, notably via insurance brokers. Therefore, as of
the date of this Registration Document, master policies have been
taken out with Covéa and Royal and Sun Alliance (RSA) for the
Group's solar power projects located in France under construction
or in operation (respectively);
concerning the Group's international activities, the policies which●cover said projects are periodically taken out following invitations to
tender (of the “request for quotation” type) before recourse to the
services of a broker. In these situations, the Group relies in
particular on its local financial partners;
the insurance policies are generally audited by the lenders financing●the project who ask to be designated as joint insured parties in
order to be able, if applicable, to receive any potential pay-outs
made on the insurance in the event of a claim via subrogation in the
context of the loan agreements signed;
the Group ensures that its insurance policies cover all stakeholders,●including notably, in addition to the project company, the EPC
co-contractor, suppliers of wind turbines and other system
components (suppliers of BOS and BOP), sub-contractors and
employees;
taking out “Comprehensive Construction Insurance” or “All Risk●Construction Insurance” policies enables compensation to be paid
without any prior search to determine liability, so as to avoid lengthy
site stoppages;
finally, the insurance policies taken out by the special purpose●vehicles generally contain ceilings, deductibles and exclusions
calibrated on a project-by-project basis, the levels of which are set
on an adequate basis further to due diligence carried out by the
Group, in concert with the financing banks.
In addition to this general policy, certain mandatory local insurance
policies are put in place based on the country in question, such as,
for example, (i) local insurance taken out in the United States to cover
rental risk incurred by the US subsidiary for its use of land and
(ii) specific insurance which may be taken out in order to obtain cover
for specific risks such as the earthquake risk in El Salvador.
03Risks factors
Insurance and risk management
139REGISTRATION DOCUMENT 2018
In order to ensure that coherent insurance policies are put in place
and to guarantee a satisfactory level of cover, the Group has in
particular established guidelines to determine the method to be
adopted with regard to insurance during the construction phase of
the projects being developed.
As of the date of this Registration Document, the Group has put in
place a policy for the coverage of the key insurable risks with
guarantees that it considers compatible with the nature of its
activities. In the future, the Group is not contemplating any specific
difficulties in retaining adequate levels of insurance within the limit of
market conditions and availability.
Over recent years, the Group has not experienced any material
incidents having called into question its insurance policies.
RISK MANAGEMENT3.2.2
Risk management is reflected in the measures implemented by the
Group in order to survey, analyse and control the risks which it faces
in the context of its activities, in France and abroad. The Group places
special focus on risk management culture and has launched
structured measures aimed at implementing an active policy in terms
of risk management, providing assurance that its major and operating
risks are identified and under control. The set of measures used is
applicable to the Group wide, inclusive of all activities, duties and
territories.
Risk management is considered a priority by the Group, which has
put in place a coherent set of measures for risk management and
internal control. The Group's risk management and internal audit
measures are based on a set of resources, policies, procedures,
behaviours and actions aimed at ensuring that all necessary
measures are taken in order:
to verify the effectiveness of operations and the efficient use of●resources; and
to identify, analyse and control all risks liable to have a material●impact on the assets, income and operations of the Group and on
the achievement of its objectives, whether operational, commercial,
legal or financial, or related to compliance with laws and
regulations.
An organisation and tools to provide structure have been put in place
to support these measures on all levels of the Group's organisation.
RISK MAPPING3.2.2.1
The Group has perfected a risk mapping procedure to identify the
major risks relating to its business, as described in Section 3 “Risks
and uncertainties” of this document, with support from an external
consultant specialised in these subjects. The process used for this
risk mapping, which was put in place in 2016, has allowed the key
risks to which the Group is exposed to be identified and each risk to
be assessed in accordance with the methodology defined.
Further to the assessment of the degree of control of such risks,
action plans are defined for those risks considered to be insufficiently
controlled. The Executive Committee is responsible for progress
made in the creation of action plans.
Management of all of the Group's activities and sectors are closely
involved in the risk mapping process, thereby enabling the objectives
and challenges faced by all stakeholders to be taken into account.
The exercise consists of identifying those risks which are the most
significant for the Group, sorted into different families (development,
operating, financial, etc.). A description of these risks and their causes
is drawn up and, for each risk, the probability of occurrence, potential
impact on the Group and degree of current control are all assessed.
Risk mapping will be updated every three years, under the supervision
of the Chief Executive Officer; the next update is scheduled for the
second half of 2019. A presentation to the Audit Committee will be
made following each update.
Focus on Fraud Risk
Specific action has been taken to control the risk of fraud. In order to
plan for this major risk, awareness-raising training has been
specifically designed and rolled out to all employees within the
Group's Finance department.
Moreover, training relating to cybersecurity led by a specialist from the
French intelligence services has been organised for all employees of
the Company.
Specific alerts have been issued regarding the types of fraud to which
the Group has particular exposure, such as the “Chairman fraud”
(external fraud which consists of stealing the identity of the Chairman
and then requiring fund transfers).
Specific monitoring activities have also been defined in order to
manage this risk on an operational level and these have been
integrated into the various different processes concerned.
ORGANISATIONAL FRAMEWORK 3.2.2.2FOR RISK MANAGEMENT AND INTERNAL CONTROL
Roles and responsibilities in terms of risk management and the
internal control have been clearly defined within the Group.
Management responsibilities in this area form part of the Group's
particular culture and are anchored in the various management
bodies, notably the project management and business bodies (local
Development, Construction and Management Committees).
The Executive Committee is at the very heart of this process.
It is responsible for the design of the measure and examines and
oversees all subjects relating to risk management and the internal
control. It ensures the implementation within the Group of the internal
control process and action plans generated by the risk mapping
exercise.
To provide support to management in the deployment of major risk
management tools and internal control measures, a Group Internal
Control Manager has been appointed. This person is in charge of
coordinating the implementation, running and reporting functions of
the internal control department. He also coordinates the risk mapping
process.
In addition, business process owners have been designated within
the Executive Committee to manage the audit tools (resources,
policies, procedures, actions, etc.) necessary for the control of each
process.
Finally, the Control Committee plays a role in terms of risk
management and internal control, by requiring a report to be
produced at least once per year and challenging the range of
measures put in place by the Group. The report is compiled by the
Internal Control Manager, under the responsibility of the Group Chief
Financial Officer.
03Risks factors
Insurance and risk management
140 REGISTRATION DOCUMENT 2018
RANGE OF INTERNAL CONTROL MEASURES3.2.2.3
The range of Group internal control measures is intended to ensure
that all accounting and financial information produced is reliable and
to guarantee compliance with all laws and regulations in force
applicable to the Group and operational efficiency. They are mainly
based on a control environment, on control activities and on the
dynamic management of this topic.
Nevertheless, should any significant weaknesses in the Group's
internal control arise in the future, these could lead to material
inaccuracies in its consolidated financial statements, which could
oblige the Group to re-issue its financial statements or lead to a loss
of investor confidence in the reliability and exhaustiveness of its
financial statements and thereby have a negative impact on the
market price for the Company's shares.
The control environment is based in particular on the business culture
promoted. The Group has defined and deployed a code of ethics and
demonstrates a managerial culture which is sensitive to risk
management. The organisation of the Group and the clear definition
of roles and responsibilities, supported by the “Chart of Authorities” in
place also contribute to create a solid control environment.
Control activities have been defined for the ten major processes
identified by the Group, whether operational, support or
cross-departmental. For each one, control activities have been listed
and circulated via “control matrices”. This work has been carried out
under the responsibility of the business process owner. The control
activities have been defined on the basis of the operating risks
identified in each of the processes and with regard to the risks
identified via the risk mapping process. These have been detailed and
defined clearly in order to guarantee that they can be easily rolled out
by all Group subsidiaries. In addition to this organisation, a concrete
set of tools (checklist, model form documents, etc.) has been
designed and circulated within the Group for improved appropriation
and implementation of these control activities, in a harmonised
manner across all territories.
Finally, the implementation of the set of internal control measures is
assessed in the context of the annual internal audit self-assessment
campaigns, the first of which was launched in 2017 and a second
cross-departmental audit was completed in late 2018. Each relevant
manager draws up an assessment, for the area for which he is
responsible or for that of a colleague, of the effectiveness of the
control measures defined by the Group. This allows the level of
deployment of the internal control measures within the Group to be
assessed, and also enables action plans to be drawn up with the aim
of strengthening any activities not sufficiently controlled at the current
time. The results of these processes are then reported to the
Executive Committee and the Audit Committee.
The Group is moreover considering deploying external audit
campaigns in the second half of 2019 aimed firstly at verifying the
correct performance, in the various countries in which the Group has
a presence, of the control activities defined, and, secondly, at
verifying the proper functioning of the range of measures defined for
the management of all major risks, as well as of any other major risks
that may have been identified between two risk mapping exercises.
Finally, in 2018, the Group was the subject of a compliance control
carried out by an external consultant. This audit related mainly to the
prevention of corruption. On the completion of this audit, (x) an action
plan was drawn up and (y) training was provided to those Group
employees considered as being at the greatest risk of exposure to
corruption risks (this training being one of the measures set out in the
action plan).
Although the Group has established internal control policies and
procedures in order to identify any cases of fraud, these policies and
procedures may not identify and protect the Group against fraud or
other criminal acts perpetrated by its employees or agents or by
those of its affiliated companies.
Should employees or agents of the Group or of its affiliated
companies be involved in fraud or other criminal or unethical activities,
financial penalties could be imposed on the Group, the Group could
be the subject of investigations carried out by the criminal or
regulatory authorities or become the subject of disputes or litigation,
which could have a material adverse effect on its reputation, activities,
financial position or results.
03Risks factors
141REGISTRATION DOCUMENT 2018
142 REGISTRATION DOCUMENT 2018
04
143REGISTRATION DOCUMENT 2018
FINANCIAL STATEMENTS
AND STATUTORY AUDITORS REPORTS
NEOEN GROUP CONSOLIDATED 4.1
FINANCIAL STATEMENTS
AT DECEMBER 31, 2018 144
Consolidated income statement 144
Consolidated statement
of comprehensive income 144
Consolidated balance sheet 145
Consolidated statement of changes
in equity 146
Consolidated cash flow statement 147
NOTES TO THE CONSOLIDATED
FINANCIAL STATEMENTS 148
Notes to the income statement 161
Notes on the balance sheet 165
Additional notes to the financial
statements 178
STATUTORY AUDITORS’ 4.2
CERTIFICATION REPORT
ON THE CONSOLIDATED
FINANCIAL STATEMENTS
OF NEOEN GROUP
AS OF DECEMBER 31, 2018 190
ANNUAL FINANCIAL 4.3
STATEMENTS OF NEOEN S.A.
FOR THE YEAR ENDED
DECEMBER 31, 2018 194
Financial statements 194
Accounting policies and valuation
methods 197
Activity and key events 198
Details of accounts 203
Notes to the financial statements 206
Other information 206
STATUTORY AUDITORS’ 4.4
CERTIFICATION REPORT
ON THE ANNUAL FINANCIAL
STATEMENTS OF NEOEN S.A.
AS OF DECEMBER 31, 2018 216
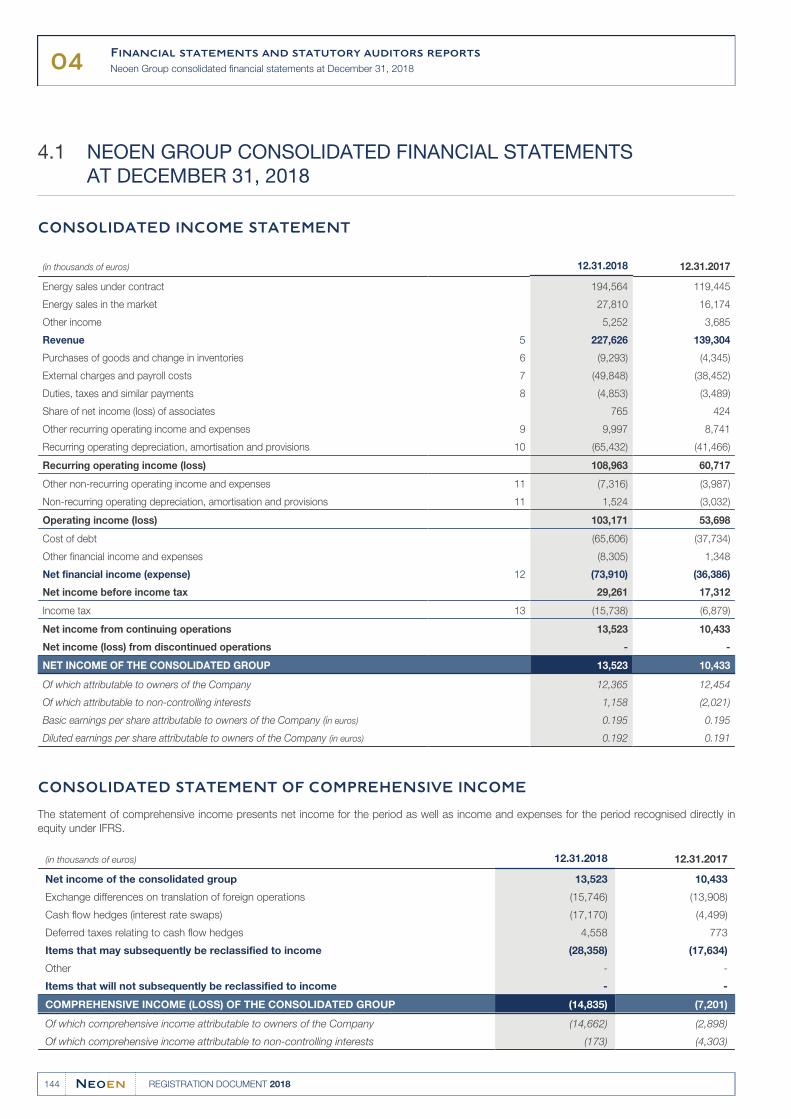
04Financial statements and statutory auditors reports
Neoen Group consolidated financial statements at December 31, 2018
144 REGISTRATION DOCUMENT 2018
NEOEN GROUP CONSOLIDATED FINANCIAL STATEMENTS 4.1
AT DECEMBER 31, 2018
CONSOLIDATED INCOME STATEMENT
(in thousands of euros) 12.31.2018 12.31.2017
Energy sales under contract 194,564 119,445
Energy sales in the market 27,810 16,174
Other income 5,252 3,685
Revenue 5 227,626 139,304
Purchases of goods and change in inventories 6 (9,293) (4,345)
External charges and payroll costs 7 (49,848) (38,452)
Duties, taxes and similar payments 8 (4,853) (3,489)
Share of net income (loss) of associates 765 424
Other recurring operating income and expenses 9 9,997 8,741
Recurring operating depreciation, amortisation and provisions 10 (65,432) (41,466)
Recurring operating income (loss) 108,963 60,717
Other non-recurring operating income and expenses 11 (7,316) (3,987)
Non-recurring operating depreciation, amortisation and provisions 11 1,524 (3,032)
Operating income (loss) 103,171 53,698
Cost of debt (65,606) (37,734)
Other financial income and expenses (8,305) 1,348
Net financial income (expense) 12 (73,910) (36,386)
Net income before income tax 29,261 17,312
Income tax 13 (15,738) (6,879)
Net income from continuing operations 13,523 10,433
Net income (loss) from discontinued operations - -
NET INCOME OF THE CONSOLIDATED GROUP 13,523 10,433
Of which attributable to owners of the Company 12,365 12,454
Of which attributable to non-controlling interests 1,158 (2,021)
Basic earnings per share attributable to owners of the Company (in euros) 0.195 0.195
Diluted earnings per share attributable to owners of the Company (in euros) 0.192 0.191
CONSOLIDATED STATEMENT OF COMPREHENSIVE INCOME
The statement of comprehensive income presents net income for the period as well as income and expenses for the period recognised directly in
equity under IFRS.
(in thousands of euros) 12.31.2018 12.31.2017
Net income of the consolidated group 13,523 10,433
Exchange differences on translation of foreign operations (15,746) (13,908)
Cash flow hedges (interest rate swaps) (17,170) (4,499)
Deferred taxes relating to cash flow hedges 4,558 773
Items that may subsequently be reclassified to income (28,358) (17,634)
Other - -
Items that will not subsequently be reclassified to income - -
COMPREHENSIVE INCOME (LOSS) OF THE CONSOLIDATED GROUP (14,835) (7,201)
Of which comprehensive income attributable to owners of the Company (14,662) (2,898)
Of which comprehensive income attributable to non-controlling interests (173) (4,303)
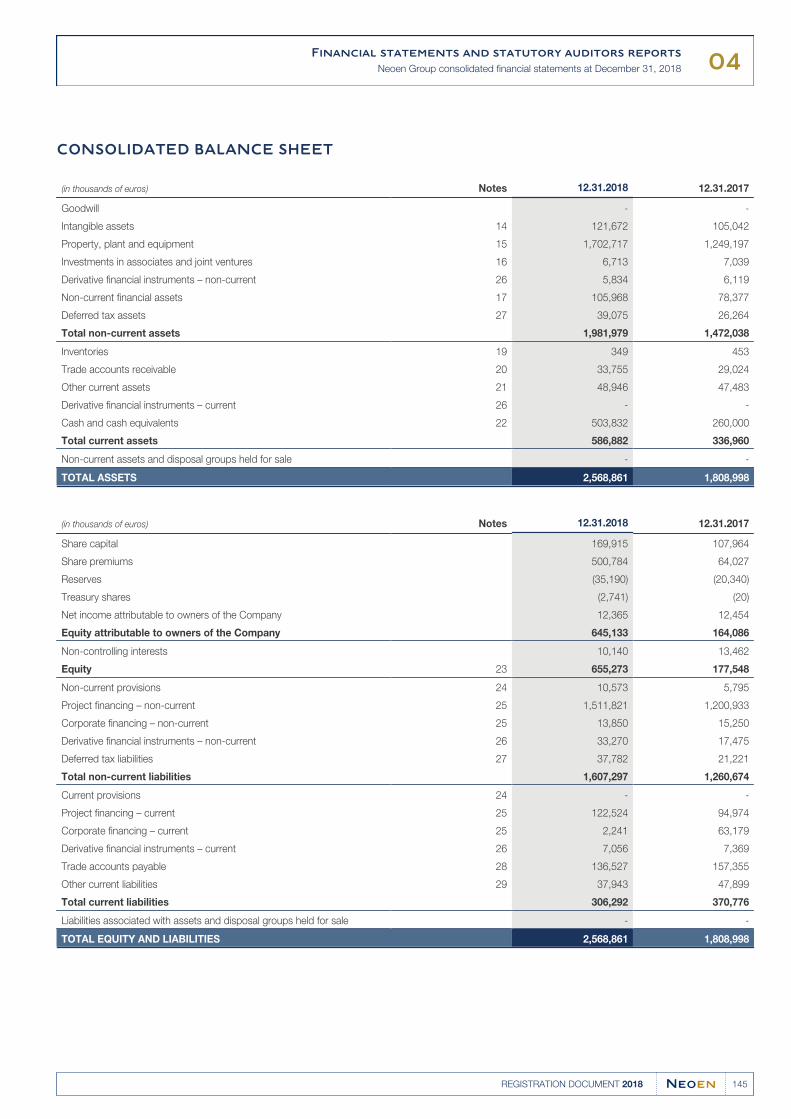
04Financial statements and statutory auditors reports
Neoen Group consolidated financial statements at December 31, 2018
145REGISTRATION DOCUMENT 2018
CONSOLIDATED BALANCE SHEET
(in thousands of euros) Notes 12.31.2018 12.31.2017
Goodwill - -
Intangible assets 14 121,672 105,042
Property, plant and equipment 15 1,702,717 1,249,197
Investments in associates and joint ventures 16 6,713 7,039
Derivative financial instruments – non-current 26 5,834 6,119
Non-current financial assets 17 105,968 78,377
Deferred tax assets 27 39,075 26,264
Total non-current assets 1,981,979 1,472,038
Inventories 19 349 453
Trade accounts receivable 20 33,755 29,024
Other current assets 21 48,946 47,483
Derivative financial instruments – current 26 - -
Cash and cash equivalents 22 503,832 260,000
Total current assets 586,882 336,960
Non-current assets and disposal groups held for sale - -
TOTAL ASSETS 2,568,861 1,808,998
(in thousands of euros) Notes 12.31.2018 12.31.2017
Share capital 169,915 107,964
Share premiums 500,784 64,027
Reserves (35,190) (20,340)
Treasury shares (2,741) (20)
Net income attributable to owners of the Company 12,365 12,454
Equity attributable to owners of the Company 645,133 164,086
Non-controlling interests 10,140 13,462
Equity 23 655,273 177,548
Non-current provisions 24 10,573 5,795
Project financing – non-current 25 1,511,821 1,200,933
Corporate financing – non-current 25 13,850 15,250
Derivative financial instruments – non-current 26 33,270 17,475
Deferred tax liabilities 27 37,782 21,221
Total non-current liabilities 1,607,297 1,260,674
Current provisions 24 - -
Project financing – current 25 122,524 94,974
Corporate financing – current 25 2,241 63,179
Derivative financial instruments – current 26 7,056 7,369
Trade accounts payable 28 136,527 157,355
Other current liabilities 29 37,943 47,899
Total current liabilities 306,292 370,776
Liabilities associated with assets and disposal groups held for sale - -
TOTAL EQUITY AND LIABILITIES 2,568,861 1,808,998
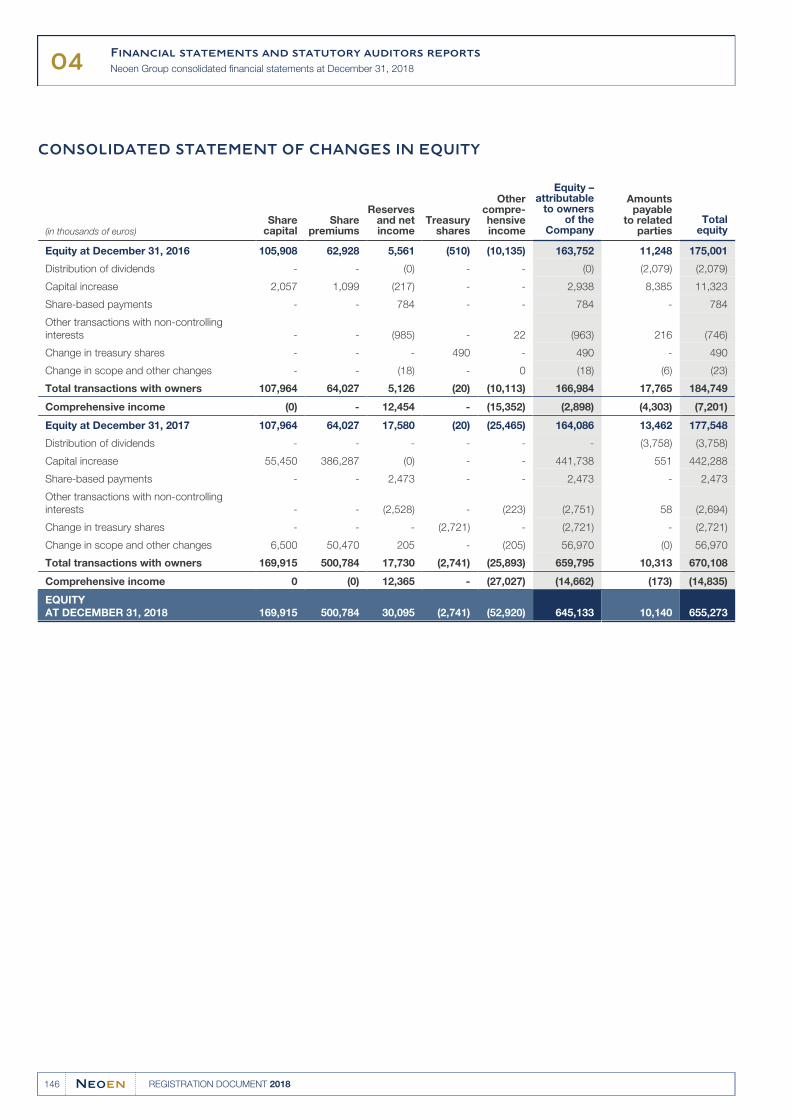
04Financial statements and statutory auditors reports
Neoen Group consolidated financial statements at December 31, 2018
146 REGISTRATION DOCUMENT 2018
CONSOLIDATED STATEMENT OF CHANGES IN EQUITY
(in thousands of euros)Share
capitalShare
premiums
Reservesand netincome
Treasuryshares
Othercompre-hensiveincome
Equity –attributable
to ownersof the
Company
Amountspayable
to relatedparties
Totalequity
Equity at December 31, 2016 105,908 62,928 5,561 (510) (10,135) 163,752 11,248 175,001
Distribution of dividends - - (0) - - (0) (2,079) (2,079)
Capital increase 2,057 1,099 (217) - - 2,938 8,385 11,323
Share-based payments - - 784 - - 784 - 784
Other transactions with non-controlling
interests - - (985) - 22 (963) 216 (746)
Change in treasury shares - - - 490 - 490 - 490
Change in scope and other changes - - (18) - 0 (18) (6) (23)
Total transactions with owners 107,964 64,027 5,126 (20) (10,113) 166,984 17,765 184,749
Comprehensive income (0) - 12,454 - (15,352) (2,898) (4,303) (7,201)
Equity at December 31, 2017 107,964 64,027 17,580 (20) (25,465) 164,086 13,462 177,548
Distribution of dividends - - - - - - (3,758) (3,758)
Capital increase 55,450 386,287 (0) - - 441,738 551 442,288
Share-based payments - - 2,473 - - 2,473 - 2,473
Other transactions with non-controlling
interests - - (2,528) - (223) (2,751) 58 (2,694)
Change in treasury shares - - - (2,721) - (2,721) - (2,721)
Change in scope and other changes 6,500 50,470 205 - (205) 56,970 (0) 56,970
Total transactions with owners 169,915 500,784 17,730 (2,741) (25,893) 659,795 10,313 670,108
Comprehensive income 0 (0) 12,365 - (27,027) (14,662) (173) (14,835)
EQUITY
AT DECEMBER 31, 2018 169,915 500,784 30,095 (2,741) (52,920) 645,133 10,140 655,273
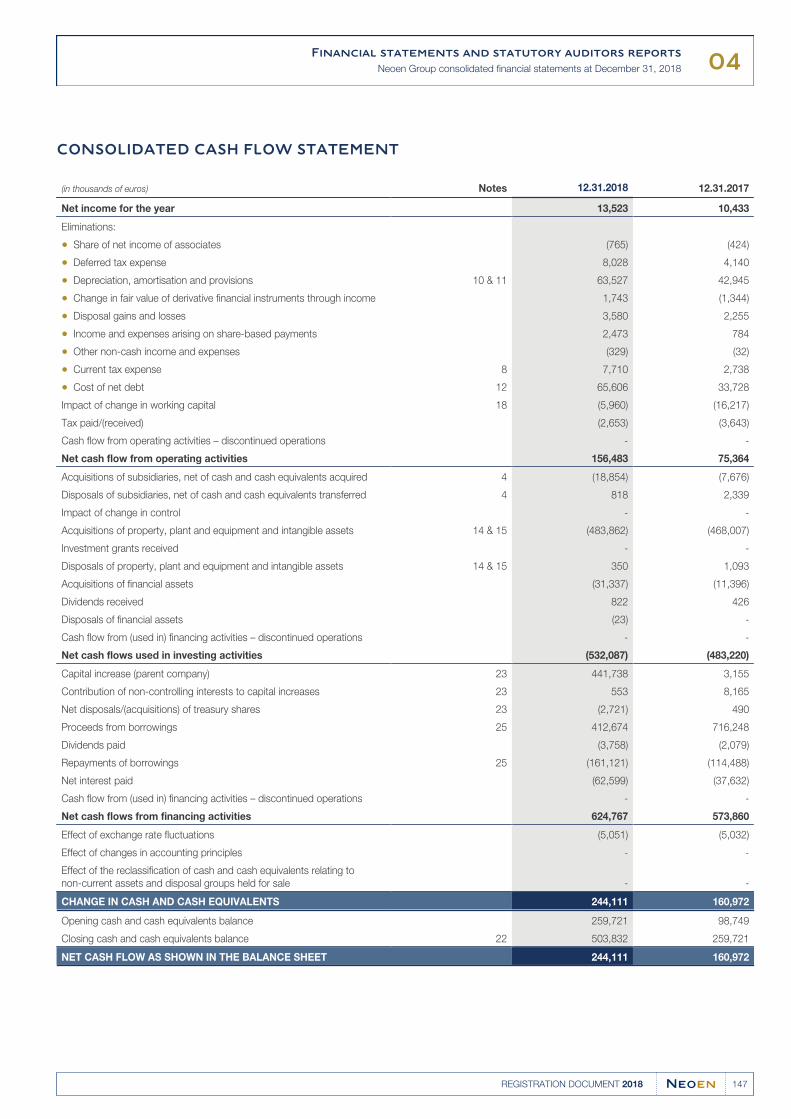
04Financial statements and statutory auditors reports
Neoen Group consolidated financial statements at December 31, 2018
147REGISTRATION DOCUMENT 2018
CONSOLIDATED CASH FLOW STATEMENT
(in thousands of euros) Notes 12.31.2018 12.31.2017
Net income for the year 13,523 10,433
Eliminations:
Share of net income of associates● (765) (424)
Deferred tax expense● 8,028 4,140
Depreciation, amortisation and provisions● 10 & 11 63,527 42,945
Change in fair value of derivative financial instruments through income● 1,743 (1,344)
Disposal gains and losses● 3,580 2,255
Income and expenses arising on share-based payments● 2,473 784
Other non-cash income and expenses● (329) (32)
Current tax expense● 8 7,710 2,738
Cost of net debt● 12 65,606 33,728
Impact of change in working capital 18 (5,960) (16,217)
Tax paid/(received) (2,653) (3,643)
Cash flow from operating activities – discontinued operations - -
Net cash flow from operating activities 156,483 75,364
Acquisitions of subsidiaries, net of cash and cash equivalents acquired 4 (18,854) (7,676)
Disposals of subsidiaries, net of cash and cash equivalents transferred 4 818 2,339
Impact of change in control - -
Acquisitions of property, plant and equipment and intangible assets 14 & 15 (483,862) (468,007)
Investment grants received - -
Disposals of property, plant and equipment and intangible assets 14 & 15 350 1,093
Acquisitions of financial assets (31,337) (11,396)
Dividends received 822 426
Disposals of financial assets (23) -
Cash flow from (used in) financing activities – discontinued operations - -
Net cash flows used in investing activities (532,087) (483,220)
Capital increase (parent company) 23 441,738 3,155
Contribution of non-controlling interests to capital increases 23 553 8,165
Net disposals/(acquisitions) of treasury shares 23 (2,721) 490
Proceeds from borrowings 25 412,674 716,248
Dividends paid (3,758) (2,079)
Repayments of borrowings 25 (161,121) (114,488)
Net interest paid (62,599) (37,632)
Cash flow from (used in) financing activities – discontinued operations - -
Net cash flows from financing activities 624,767 573,860
Effect of exchange rate fluctuations (5,051) (5,032)
Effect of changes in accounting principles - -
Effect of the reclassification of cash and cash equivalents relating to
non-current assets and disposal groups held for sale - -
CHANGE IN CASH AND CASH EQUIVALENTS 244,111 160,972
Opening cash and cash equivalents balance 259,721 98,749
Closing cash and cash equivalents balance 22 503,832 259,721
NET CASH FLOW AS SHOWN IN THE BALANCE SHEET 244,111 160,972
04Financial statements and statutory auditors reports
Notes to the consolidated financial statements
148 REGISTRATION DOCUMENT 2018
NOTES TO THE CONSOLIDATED FINANCIAL STATEMENTS
NOTE SUMMARY
General informationNote 1. 149
Key eventsNote 2. 149
Accounting policiesNote 3. 151
Changes in the scope Note 4.of consolidation 160
RevenueNote 5. 161
Purchases of goodsNote 6. 162
External charges and payroll costsNote 7. 162
Duties, taxes and similar Note 8.payments 162
Other recurring operating income Note 9.and expenses 162
Recurring operating depreciation, Note 10.amortisation and provisions 162
Other non-recurring income Note 11.and expenses 163
Net financial income (expense)Note 12. 163
Income taxNote 13. 164
Intangible assetsNote 14. 165
Property, plant and equipmentNote 15. 166
Investments in associates Note 16.and joint ventures 167
Non-current financial assetsNote 17. 168
Working capitalNote 18. 168
InventoriesNote 19. 169
Trade accounts receivableNote 20. 169
Other current assetsNote 21. 169
Cash and cash equivalentsNote 22. 170
EquityNote 23. 170
ProvisionsNote 24. 172
BorrowingsNote 25. 173
Derivative financial instrumentsNote 26. 175
Deferred taxNote 27. 175
Trade accounts payableNote 28. 176
Other current liabilitiesNote 29. 176
Total Financial assets and Note 30.liabilities measured at fair value 177
Segment reportingNote 31. 178
Risk managementNote 32. 180
Off-Balance sheet commitmentsNote 33. 181
Related partiesNote 34. 182
Executive remunerationNote 35. 182
Statutory auditors feesNote 36. 182
Subsequent eventsNote 37. 183
Consolidation scopeNote 38. 183
04Financial statements and statutory auditors reports
Notes to the consolidated financial statements
149REGISTRATION DOCUMENT 2018
GENERAL INFORMATIONNOTE 1.
The Neoen Group develops and operates power plants to generate
electricity and heat from renewable energies (wind, solar, biomass), as
well as energy storage facilities.
With nearly 2.3 GW of projects in operation and under construction
(including 237 MW under management) and 0.9 GW of projects
awarded at December 31, 2018 (secured portfolio of 3.2 GW), Neoen
is the leading independent producer of renewable energies in France.
The Group continues to grow, with an advanced pipeline of 4.5 GW
and more than 4 GW of early stage projects.
The Group operates in Europe-Africa, Australia and the Americas.
Previously a simplified limited company (société anonyme) (), the
Company was transformed into a public limited company at the
general meeting of September 12, 2018.
Following the move early in the second half of 2018, its head office is
located at 6 rue Menars – 75002 Paris.
The basis of preparation of these consolidated financial statements is
described in Note 3 “Accounting policies”.
The financial statements are presented in thousands of euros. They
were approved by the Board of Directors on April 17, 2019 and will be
submitted to the general meeting of June 28, 2019.
KEY EVENTSNOTE 2.
Initial public offering
On October 16, 2018, Neoen successfully completed its initial public
offering in compartment A of the regulated market of Euronext in
Paris. The offering price was set at €16.50 per share, valuing the
Group at just over €1.4 billion. This transaction, predominantly in the
primary market, allowed it to raise €450 million through the issue of
new shares (out of a total of €697 million, including a Greenshoe
option). The entire amount will be used to continue the Group’s
strong growth. As a reminder, the Group is aiming for capacity of at
least 5 GW in operation and under construction by 2021.
Impala, the Group’s majority and long-standing shareholder, injected
nearly €170 million into the transaction in order to maintain its control
of the Group.
On December 3, 2018, Neoen entrusted Kepler Cheuvreux with the
implementation of a liquidity contract that complies with the code of
ethics recognised by the Autorité des marchés financiers (AMF).
Development
Neoen continues to pursue international expansion, primarily by
concentrating on countries where it already operates and countries
belonging to the same clusters in Europe-Africa, Australia and the
Americas, by identifying opportunities and determining the feasibility
of projects.
The Group’s portfolio has changed in volume, with 2,008 MW of new
projects over the period (net of abandoned projects and excluding
early stage projects). Of this, 19 MW are attributable to a re-evaluation
of the generating capacity of projects under development.
In the Americas, development remained on a positive trend this
year: 556 MW of projects entered the portfolio across all
technologies, enabling Neoen to reinforce the Americas as the third
pillar of its development, after Australia and Europe - Africa.
Australia is the Group’s biggest region in terms of secured MW,
underlining Neoen’s successful international expansion. Projects
totalling 1,100 MW were added to the Group’s portfolio during the
period, of which 350 MW in storage and 750 MWp in solar.
tender, the results of which were announced in November. The status
of these projects has accordingly be changed from tender-ready to
awarded.
In Europe - Africa, projects totalling 384 MW entered the portfolio in
France, 113 MW in Finland and 66 MWp in Ireland. With the gain of
five solar projects representing total capacity of 66 MW, Neoen was
also the biggest winner of the French government bi-technological
In Mozambique, Neoen signed a 30-year concession agreement for
its Metoro solar farm at the end of 2018. The signature of this
contract confirms the finalisation of the project’s development. Metoro
(41 MWp) is currently the largest solar farm under development in
Mozambique.
These wins were diminished slightly by the discontinuation of 160 MW in
other projects.
Development costs are capitalized in intangible assets (Note 14).
Construction
Construction projects have a material impact on growth in the Group’s
property, plant and equipment, as disclosed in Note 15.
In Australia, work began on the Bulgana wind farm in March. In
addition to this 194 MW of wind capacity is a 20 MW/34 MWh
capacity of lithium-ion battery storage facility using batteries provided
by Tesla.
The facility will supply electricity to greenhouses to be built by the
Australian company Nectar Farms. The rest of the output and the green
certificates will be sold to the government of the state of Victoria as part
of a 15-year power purchase agreement (“PPA”).
Work began on the Numurkah solar farm, with capacity of 128 MWp,
in August.
In France, solar projects won at CRE tender 3 (Lugos, Miremont,
Bram, Saint-Avit) as well as some of the projects won at CRE tender
4 (Azur Est, Azur Sud, Cap Découverte 4bis, Corbas, Saint-Eloy) are
under construction. They represent total capacity of 78 MWp.
Work on the Auxois Sud II and Les Hauts Chemins wind projects
(16 MW and 14 MW respectively) began in February and August.
Following the success of the Hornsdale Power Reserve storage
project in Australia, Neoen continues to lead the way in this area by
developing opportunities in its various geographies, particularly in
France, where it has launched the construction of the largest
stationary power station, Azur Storage, with capacity of 6 MW
representing a storage capacity of 6 MWh.
04Financial statements and statutory auditors reports
Notes to the consolidated financial statements
150 REGISTRATION DOCUMENT 2018
In Finland, work started on the Hedet wind project (power capacity
of 81 MW) in late 2018.
Google has signed a 10-year agreement to buy 100% of the green
electricity generated by the farm, 80.1% owned by Neoen and 19.9%
by Prokon Finland.
In Jamaica, work began on the 51 MWp Paradise Park solar project
in June 2018.
In El Salvador, work began on the 140 MWp Capella solar project in
December 2018. This solar power will be compounded by a
3 MW/1.5 MWh battery.
Financing
In May 2018, Neoen closed financing for its majority owned Jamaican
solar farm, with Proparco and FMO. The project represents a total
investment of US$64 million.
In June 2018, Neoen signed a framework agreement to crowdfund
projects awarded at CRE tender 4. Under the incentive arrangements
put in place by the French Energy Regulatory Commission (CRE),
energy producers that crowdfund from the local area to cover the
costs of their renewable energy projects are entitled to higher tariffs.
The Cap Découverte 4 bis solar farm was Neoen’s first crowdfunded
project to open.
In October 2018, Neoen launched a crowdfunding campaign for the
two phases of the Corbas power plant (Corbas 1 and 3), a
photovoltaic shelter in the municipalities of Corbas and Saint-Priest,
near Lyon, and the Azur Est ground solar project in Nouvelle
Aquitaine.
In November 2018, Neoen closed US$133 million in funding for
Capella Solar, a 140 MWp solar farm in El Salvador, with FMO, BID
Invest and Proparco.
Wholly owned by Neoen, Capella Solar is expected to be
commissioned in early 2020. This investment amount includes the
cost of a 3 MW/1.5 MWh LG Chem lithium-ion battery to be installed
by Nidec.
Note 25 contains details of funding arranged during the period.
Operations
In Australia, in the state of New South Wales, Parkes, Griffith and
Dubbo, the three projects selected for the Australian Renewable
Energy Agency (ARENA), went into operation in the first and second
quarters of 2018. The three projects represent a total of 131 MWp.
The Coleambally solar plant was commissioned in the fourth quarter
of 2018. With installed capacity of 189 MWp, Coleambally is wholly
owned by Neoen. It is also the largest solar power plant ever to
operate in Australia.
In December 2018, Neoen celebrated the first anniversary of the
operation of its Hornsdale Power Reserve storage facility, revealing a
performance well above expectations by its asset. In particular, the
study by independent expert Aurecon showed that the Hornsdale
Power Reserve (HPR) has helped to generate nearly AU$40 million in
savings by replacing more expensive and less reactive alternatives to
regulate network frequency.
In France, the Champs d’Amour (9 MW), Pays Chaumontais
(14 MW) and Chassepain (20 MW) wind farms and the Lugos solar
farm (12 MWp) were commissioned in January, April and June (for the
last two) respectively.
The Lagarde d’Apt (7 MWp), Cap Découverte 4 bis (5 MWp) and Bram
(5 MWp) solar farms were commissioned during the second half of the
year.
Neoen increased its base of assets in operation by 391 MW, to
1,492 MW (controlled or non-controlled) at December 31, 2018.
A non-controlled asset is a project in which the Group holds a
non-controlling interest but whose operations it oversees. The only
plants in operation that are classified as non-controlled assets are
certain plants at the Cestas solar farm (for regulatory reasons) and a
plant in Portugal (Seixal) in which the Group holds a 50% stake.
Changes in energy revenue derived from facilities commissioned
during the period are described in Note 5.
M&A
In the first half of 2018, the Group acquired the Hedet Vindpark
project company. The transaction is recognized under intangible
assets and enables Neoen to purchase projects under development.
The intangible assets will be amortized on a straight-line basis over
the same period as the plants to which they relate (Note 14).
In the second half of 2018, the Group sold Melissa and Manosque
Ombrière.
In 2018, the Group increased its stakes in FieldFare Argentina and
Altiplano Solar (Argentina), and Jiboa Solar and Capella Solar (El
Salvador) to 100%.
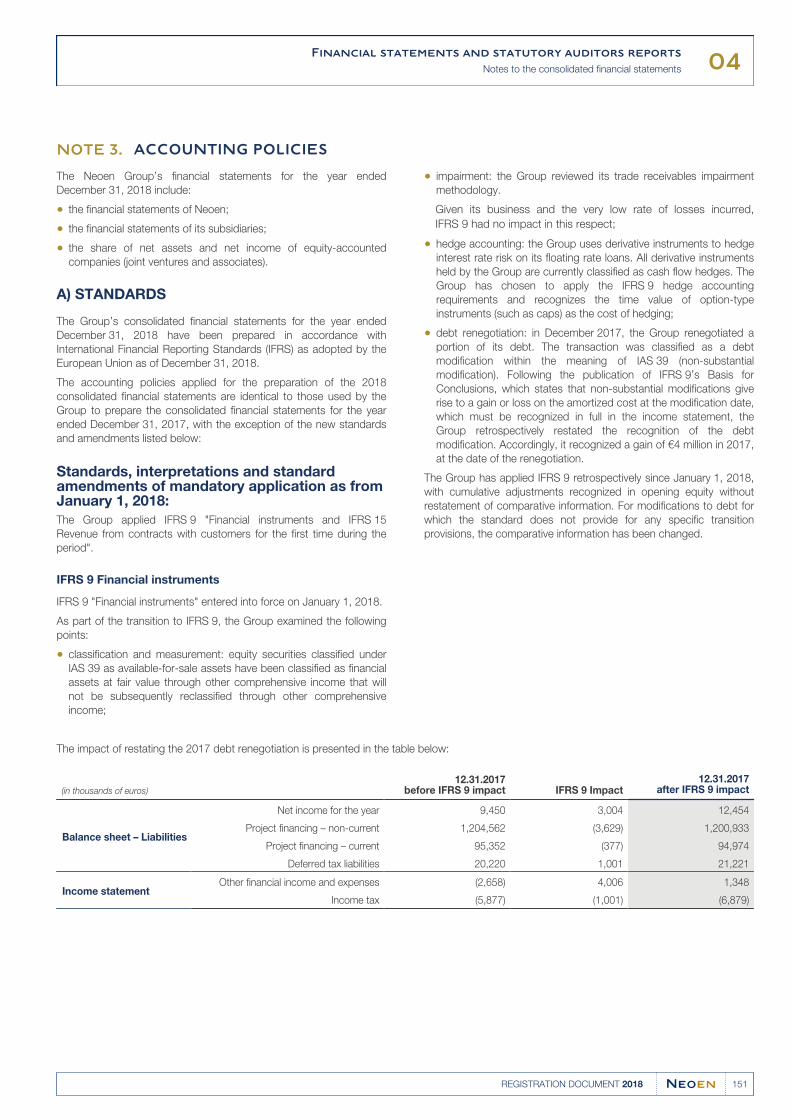
04Financial statements and statutory auditors reports
Notes to the consolidated financial statements
151REGISTRATION DOCUMENT 2018
ACCOUNTING POLICIESNOTE 3.
The Neoen Group’s financial statements for the year ended
December 31, 2018 include:
the financial statements of Neoen;●
the financial statements of its subsidiaries;●
the share of net assets and net income of equity-accounted●companies (joint ventures and associates).
A) STANDARDS
The Group’s consolidated financial statements for the year ended
December 31, 2018 have been prepared in accordance with
International Financial Reporting Standards (IFRS) as adopted by the
European Union as of December 31, 2018.
The accounting policies applied for the preparation of the 2018
consolidated financial statements are identical to those used by the
Group to prepare the consolidated financial statements for the year
ended December 31, 2017, with the exception of the new standards
and amendments listed below:
Standards, interpretations and standard amendments of mandatory application as from January 1, 2018:
The Group applied IFRS 9 "Financial instruments and IFRS 15
Revenue from contracts with customers for the first time during the
period".
IFRS 9 Financial instruments
IFRS 9 "Financial instruments" entered into force on January 1, 2018.
As part of the transition to IFRS 9, the Group examined the following
points:
classification and measurement: equity securities classified under●IAS 39 as available-for-sale assets have been classified as financial
assets at fair value through other comprehensive income that will
not be subsequently reclassified through other comprehensive
income;
impairment: the Group reviewed its trade receivables impairment●methodology.
Given its business and the very low rate of losses incurred,
IFRS 9 had no impact in this respect;
hedge accounting: the Group uses derivative instruments to hedge●interest rate risk on its floating rate loans. All derivative instruments
held by the Group are currently classified as cash flow hedges. The
Group has chosen to apply the IFRS 9 hedge accounting
requirements and recognizes the time value of option-type
instruments (such as caps) as the cost of hedging;
debt renegotiation: in December 2017, the Group renegotiated a●portion of its debt. The transaction was classified as a debt
modification within the meaning of IAS 39 (non-substantial
modification). Following the publication of IFRS 9’s Basis for
Conclusions, which states that non-substantial modifications give
rise to a gain or loss on the amortized cost at the modification date,
which must be recognized in full in the income statement, the
Group retrospectively restated the recognition of the debt
modification. Accordingly, it recognized a gain of €4 million in 2017,
at the date of the renegotiation.
The Group has applied IFRS 9 retrospectively since January 1, 2018,
with cumulative adjustments recognized in opening equity without
restatement of comparative information. For modifications to debt for
which the standard does not provide for any specific transition
provisions, the comparative information has been changed.
The impact of restating the 2017 debt renegotiation is presented in the table below:
(in thousands of euros)12.31.2017
before IFRS 9 impact IFRS 9 Impact12.31.2017
after IFRS 9 impact
Balance sheet – Liabilities
Net income for the year 9,450 3,004 12,454
Project financing – non-current 1,204,562 (3,629) 1,200,933
Project financing – current 95,352 (377) 94,974
Deferred tax liabilities 20,220 1,001 21,221
Income statementOther financial income and expenses (2,658) 4,006 1,348
Income tax (5,877) (1,001) (6,879)
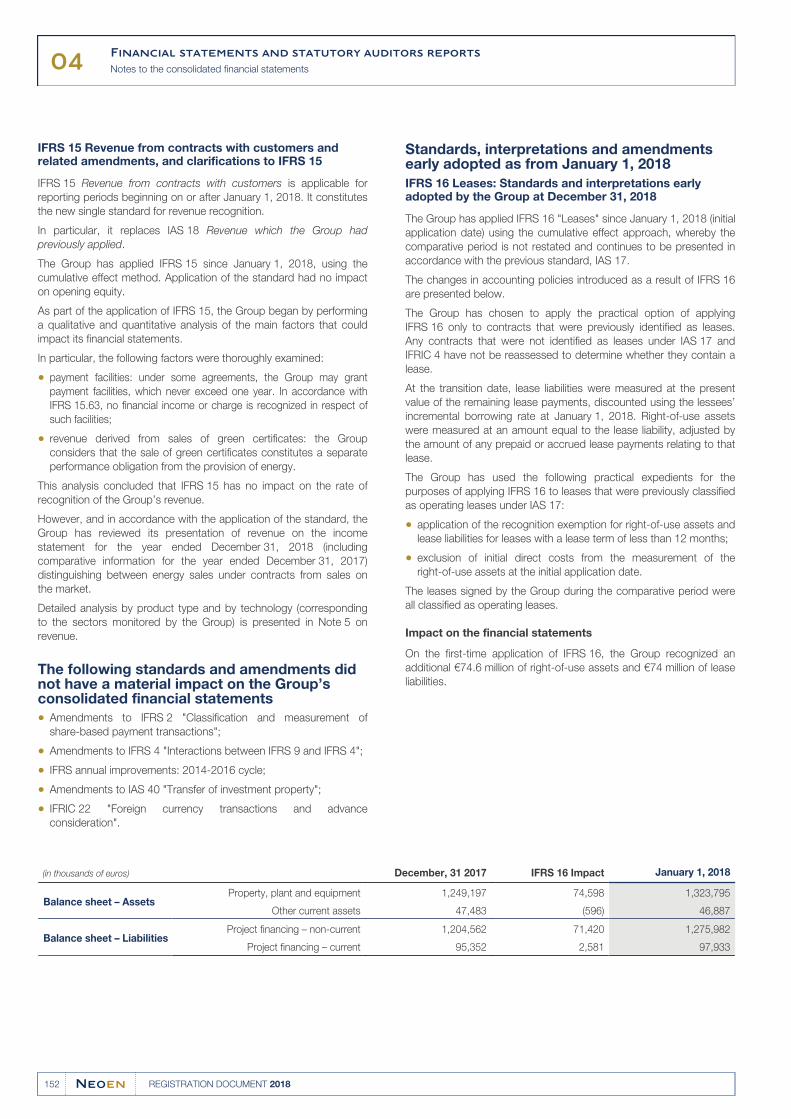
04Financial statements and statutory auditors reports
Notes to the consolidated financial statements
152 REGISTRATION DOCUMENT 2018
IFRS 15 Revenue from contracts with customers and related amendments, and clarifications to IFRS 15
IFRS 15 Revenue from contracts with customers is applicable for
reporting periods beginning on or after January 1, 2018. It constitutes
the new single standard for revenue recognition.
In particular, it replaces IAS 18 Revenue which the Group had
previously applied.
The Group has applied IFRS 15 since January 1, 2018, using the
cumulative effect method. Application of the standard had no impact
on opening equity.
As part of the application of IFRS 15, the Group began by performing
a qualitative and quantitative analysis of the main factors that could
impact its financial statements.
In particular, the following factors were thoroughly examined:
payment facilities: under some agreements, the Group may grant●payment facilities, which never exceed one year. In accordance with
IFRS 15.63, no financial income or charge is recognized in respect of
such facilities;
revenue derived from sales of green certificates: the Group●considers that the sale of green certificates constitutes a separate
performance obligation from the provision of energy.
This analysis concluded that IFRS 15 has no impact on the rate of
recognition of the Group’s revenue.
However, and in accordance with the application of the standard, the
Group has reviewed its presentation of revenue on the income
statement for the year ended December 31, 2018 (including
comparative information for the year ended December 31, 2017)
distinguishing between energy sales under contracts from sales on
the market.
Detailed analysis by product type and by technology (corresponding
to the sectors monitored by the Group) is presented in Note 5 on
revenue.
The following standards and amendments did not have a material impact on the Group’s consolidated financial statements
Amendments to IFRS 2 "Classification and measurement of●share-based payment transactions";
Amendments to IFRS 4 "Interactions between IFRS 9 and IFRS 4";●
IFRS annual improvements: 2014-2016 cycle;●
Amendments to IAS 40 "Transfer of investment property";●
IFRIC 22 "Foreign currency transactions and advance●consideration".
Standards, interpretations and amendments early adopted as from January 1, 2018
IFRS 16 Leases: Standards and interpretations early adopted by the Group at December 31, 2018
The Group has applied IFRS 16 "Leases" since January 1, 2018 (initial
application date) using the cumulative effect approach, whereby the
comparative period is not restated and continues to be presented in
accordance with the previous standard, IAS 17.
The changes in accounting policies introduced as a result of IFRS 16
are presented below.
The Group has chosen to apply the practical option of applying
IFRS 16 only to contracts that were previously identified as leases.
Any contracts that were not identified as leases under IAS 17 and
IFRIC 4 have not be reassessed to determine whether they contain a
lease.
At the transition date, lease liabilities were measured at the present
value of the remaining lease payments, discounted using the lessees’
incremental borrowing rate at January 1, 2018. Right-of-use assets
were measured at an amount equal to the lease liability, adjusted by
the amount of any prepaid or accrued lease payments relating to that
lease.
The Group has used the following practical expedients for the
purposes of applying IFRS 16 to leases that were previously classified
as operating leases under IAS 17:
application of the recognition exemption for right-of-use assets and●lease liabilities for leases with a lease term of less than 12 months;
exclusion of initial direct costs from the measurement of the●right-of-use assets at the initial application date.
The leases signed by the Group during the comparative period were
all classified as operating leases.
Impact on the financial statements
On the first-time application of IFRS 16, the Group recognized an
additional €74.6 million of right-of-use assets and €74 million of lease
liabilities.
(in thousands of euros) December, 31 2017 IFRS 16 Impact January 1, 2018
Balance sheet – AssetsProperty, plant and equipment 1,249,197 74,598 1,323,795
Other current assets 47,483 (596) 46,887
Balance sheet – LiabilitiesProject financing – non-current 1,204,562 71,420 1,275,982
Project financing – current 95,352 2,581 97,933
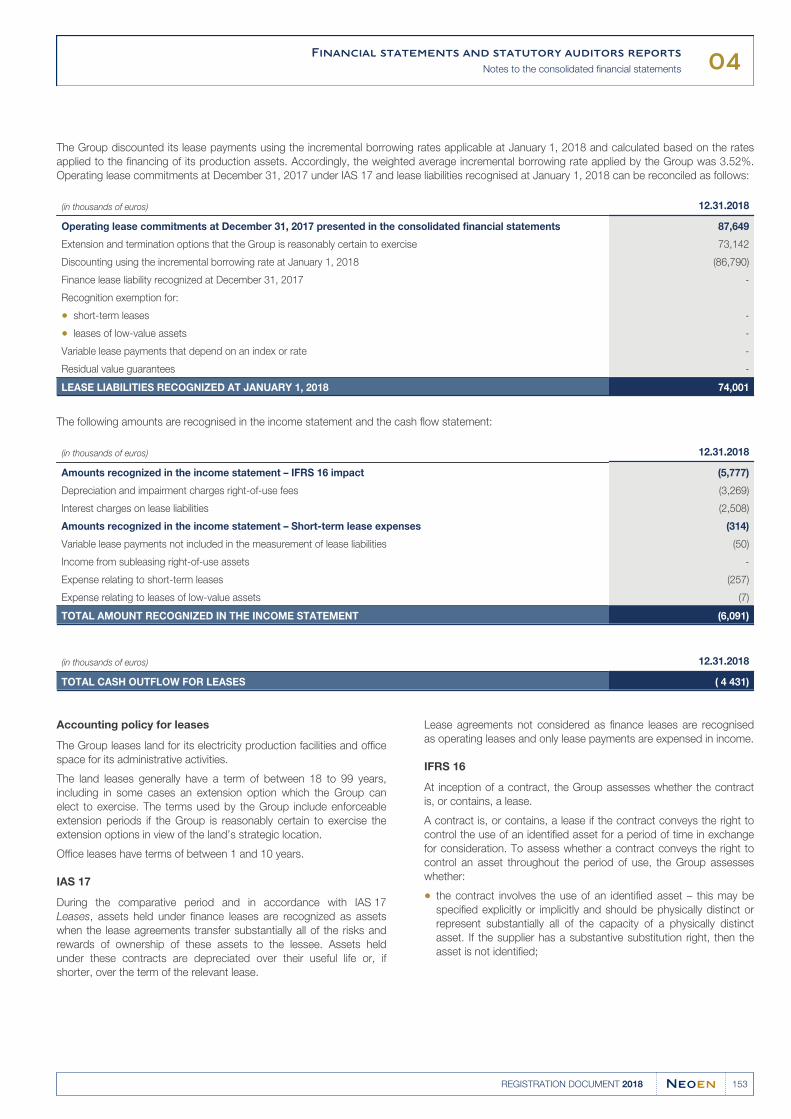
04Financial statements and statutory auditors reports
Notes to the consolidated financial statements
153REGISTRATION DOCUMENT 2018
The Group discounted its lease payments using the incremental borrowing rates applicable at January 1, 2018 and calculated based on the rates
applied to the financing of its production assets. Accordingly, the weighted average incremental borrowing rate applied by the Group was 3.52%.
Operating lease commitments at December 31, 2017 under IAS 17 and lease liabilities recognised at January 1, 2018 can be reconciled as follows:
(in thousands of euros) 12.31.2018
Operating lease commitments at December 31, 2017 presented in the consolidated financial statements 87,649
Extension and termination options that the Group is reasonably certain to exercise 73,142
Discounting using the incremental borrowing rate at January 1, 2018 (86,790)
Finance lease liability recognized at December 31, 2017 -
Recognition exemption for:
short-term leases● -
leases of low-value assets● -
Variable lease payments that depend on an index or rate -
Residual value guarantees -
LEASE LIABILITIES RECOGNIZED AT JANUARY 1, 2018 74,001
The following amounts are recognised in the income statement and the cash flow statement:
(in thousands of euros) 12.31.2018
Amounts recognized in the income statement – IFRS 16 impact (5,777)
Depreciation and impairment charges right-of-use fees (3,269)
Interest charges on lease liabilities (2,508)
Amounts recognized in the income statement – Short-term lease expenses (314)
Variable lease payments not included in the measurement of lease liabilities (50)
Income from subleasing right-of-use assets -
Expense relating to short-term leases (257)
Expense relating to leases of low-value assets (7)
TOTAL AMOUNT RECOGNIZED IN THE INCOME STATEMENT (6,091)
(in thousands of euros) 12.31.2018
TOTAL CASH OUTFLOW FOR LEASES ( 4 431)
Accounting policy for leases
The Group leases land for its electricity production facilities and office
space for its administrative activities.
The land leases generally have a term of between 18 to 99 years,
including in some cases an extension option which the Group can
elect to exercise. The terms used by the Group include enforceable
extension periods if the Group is reasonably certain to exercise the
extension options in view of the land’s strategic location.
Office leases have terms of between 1 and 10 years.
IAS 17
During the comparative period and in accordance with IAS 17
Leases, assets held under finance leases are recognized as assets
when the lease agreements transfer substantially all of the risks and
rewards of ownership of these assets to the lessee. Assets held
under these contracts are depreciated over their useful life or, if
shorter, over the term of the relevant lease.
Lease agreements not considered as finance leases are recognised
as operating leases and only lease payments are expensed in income.
IFRS 16
At inception of a contract, the Group assesses whether the contract
is, or contains, a lease.
A contract is, or contains, a lease if the contract conveys the right to
control the use of an identified asset for a period of time in exchange
for consideration. To assess whether a contract conveys the right to
control an asset throughout the period of use, the Group assesses
whether:
the contract involves the use of an identified asset – this may be●specified explicitly or implicitly and should be physically distinct or
represent substantially all of the capacity of a physically distinct
asset. If the supplier has a substantive substitution right, then the
asset is not identified;
04Financial statements and statutory auditors reports
Notes to the consolidated financial statements
154 REGISTRATION DOCUMENT 2018
the Group has the right to obtain substantially all of the economic●benefits from the use of the asset throughout the period of use;
the Group has the right to direct the use of the asset. The Group●has this right when it has the decision-making rights that are most
relevant to changing how and for what purpose the asset is used.
In rare cases where the decision about how and for what purpose
the asset is used is predetermined, the Group has the right to
direct the use of the asset if either:
the Group has the right to operate the asset, or●
the Group designed the asset in a way that predetermines how●and for what purpose it will be used.
These criteria apply to contracts signed or amended on or after
January 1st, 2018.
At inception or on reassessment of a contract containing a lease
component, the Group has elected not to separate the non-lease
components and to account for the lease as a single lease component.
The Group recognises a right-of-use asset and a lease liability at
contract inception:
The right-of-use asset is initially measured at cost, which comprises
the initial amount of the lease liability adjusted for any lease payments
made at or before the commencement date, plus any initial direct
costs incurred, less any lease incentives received.
The right-of-use asset is subsequently depreciated using the
straight-line method from the commencement date to the end of the
lease term. In addition, the carrying amount of the right-of-use asset
is adjusted for certain remeasurements of the lease liability and –
where appropriate – reduced to reflect impairment losses, in
accordance with IAS 36.
The lease liability is initially measured at the present value of the lease
payments that are not paid at the lease commencement date, discounted
using the lessee’s incremental borrowing rate, that is the rate the lessee
would have to pay to borrow funds over a similar term.
The following lease payments are included in the measurement of the
lease liability:
fixed payments, including in-substance fixed payments;●
variable lease payments that depend on an index or a rate, initially●measured using the index or rate as at the commencement date;
lease payments during an optional extension period if the Group is●reasonably certain to exercise the extension option.
The lease liability is remeasured when there is a change in future lease
payments resulting from a change in an index or a rate or if the Group
changes its assessment of whether it will exercise a purchase,
extension or termination option.
When the lease liability is remeasured, an adjustment is made to the
carrying amount of the right-of-use asset or is recorded in income if the
carrying amount of the right-of-use asset has been reduced to zero.
Short-term leases and leases of low-value assets
The Group has elected not to recognize right-of-use assets or lease
liabilities for short-term leases with a term of 12 months or less, or
leases of low-value assets. The Group recognizes the lease payments
associated with these leases as an expense.
Standards and interpretations not yet adopted by the European Union and not early adopted by the Group at December 31, 2018:
Amendment to IFRS 9 "Prepayment features with negative●compensation";
Amendments to IFRS 10 and IAS 28 "Sale or contribution of assets●between an investor and its associate or joint venture";
Amendments to IAS 28 "Long-term interests in associates and joint●ventures";
Amendments to IAS 19 "Plan amendment, curtailment or●settlement";
Amendment to IFRS 3 "Definition of a business";●
Amendments to IAS 1 and IAS 8 "Definition of significant";●
Amendments to references to the conceptual framework in IFRS;●
IFRS annual improvements: 2015-2017 cycle;●
IFRIC 23 "Uncertainty over income tax treatments".●
As these standards have not yet been adopted by the European
Union, the Group has not started analyzing the potential impacts of
their application for the Group.
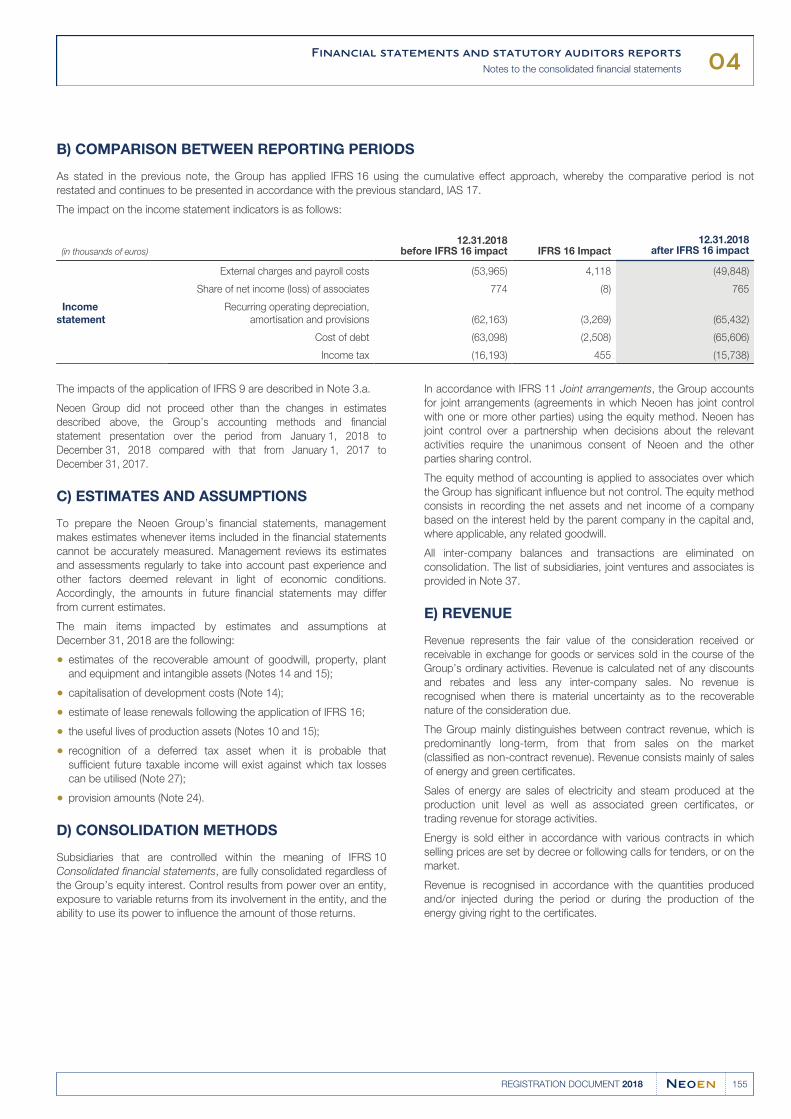
04Financial statements and statutory auditors reports
Notes to the consolidated financial statements
155REGISTRATION DOCUMENT 2018
B) COMPARISON BETWEEN REPORTING PERIODS
As stated in the previous note, the Group has applied IFRS 16 using the cumulative effect approach, whereby the comparative period is not
restated and continues to be presented in accordance with the previous standard, IAS 17.
The impact on the income statement indicators is as follows:
(in thousands of euros)12.31.2018
before IFRS 16 impact IFRS 16 Impact12.31.2018
after IFRS 16 impact
Income
statement
External charges and payroll costs (53,965) 4,118 (49,848)
Share of net income (loss) of associates 774 (8) 765
Recurring operating depreciation,
amortisation and provisions (62,163) (3,269) (65,432)
Cost of debt (63,098) (2,508) (65,606)
Income tax (16,193) 455 (15,738)
The impacts of the application of IFRS 9 are described in Note 3.a.
Neoen Group did not proceed other than the changes in estimates
described above, the Group’s accounting methods and financial
statement presentation over the period from January 1, 2018 to
December 31, 2018 compared with that from January 1, 2017 to
December 31, 2017.
C) ESTIMATES AND ASSUMPTIONS
To prepare the Neoen Group’s financial statements, management
makes estimates whenever items included in the financial statements
cannot be accurately measured. Management reviews its estimates
and assessments regularly to take into account past experience and
other factors deemed relevant in light of economic conditions.
Accordingly, the amounts in future financial statements may differ
from current estimates.
The main items impacted by estimates and assumptions at
December 31, 2018 are the following:
estimates of the recoverable amount of goodwill, property, plant●and equipment and intangible assets (Notes 14 and 15);
capitalisation of development costs (Note 14);●
estimate of lease renewals following the application of IFRS 16;●
the useful lives of production assets (Notes 10 and 15);●
recognition of a deferred tax asset when it is probable that●sufficient future taxable income will exist against which tax losses
can be utilised (Note 27);
provision amounts (Note 24).●
D) CONSOLIDATION METHODS
Subsidiaries that are controlled within the meaning of IFRS 10
Consolidated financial statements, are fully consolidated regardless of
the Group’s equity interest. Control results from power over an entity,
exposure to variable returns from its involvement in the entity, and the
ability to use its power to influence the amount of those returns.
In accordance with IFRS 11 Joint arrangements, the Group accounts
for joint arrangements (agreements in which Neoen has joint control
with one or more other parties) using the equity method. Neoen has
joint control over a partnership when decisions about the relevant
activities require the unanimous consent of Neoen and the other
parties sharing control.
The equity method of accounting is applied to associates over which
the Group has significant influence but not control. The equity method
consists in recording the net assets and net income of a company
based on the interest held by the parent company in the capital and,
where applicable, any related goodwill.
All inter-company balances and transactions are eliminated on
consolidation. The list of subsidiaries, joint ventures and associates is
provided in Note 37.
E) REVENUE
Revenue represents the fair value of the consideration received or
receivable in exchange for goods or services sold in the course of the
Group’s ordinary activities. Revenue is calculated net of any discounts
and rebates and less any inter-company sales. No revenue is
recognised when there is material uncertainty as to the recoverable
nature of the consideration due.
The Group mainly distinguishes between contract revenue, which is
predominantly long-term, from that from sales on the market
(classified as non-contract revenue). Revenue consists mainly of sales
of energy and green certificates.
Sales of energy are sales of electricity and steam produced at the
production unit level as well as associated green certificates, or
trading revenue for storage activities.
Energy is sold either in accordance with various contracts in which
selling prices are set by decree or following calls for tenders, or on the
market.
Revenue is recognised in accordance with the quantities produced
and/or injected during the period or during the production of the
energy giving right to the certificates.
04Financial statements and statutory auditors reports
Notes to the consolidated financial statements
156 REGISTRATION DOCUMENT 2018
F) OTHER NON-RECURRING OPERATING INCOME AND EXPENSES
This heading includes material amounts of non-recurring operating
income and expenses that, by definition or owing to their
extraordinary nature, may distort the interpretation of the Group’s
recurring operating performance. Such items may include:
disposal gains and losses or material and non-recurring impairment●of property, plant and equipment and intangible assets;
certain material expenses relating to restructuring operations or●unusual transactions;
other operating income and expenses such as a material provision●or penalty relating to a dispute.
G) BUSINESS COMBINATIONS
In accordance with IFRS 3 as amended, business combinations are
accounted for using the acquisition method. Under this method,
assets acquired as well as liabilities and contingent liabilities assumed
are measured at fair value. Goodwill represents the difference
between the purchase price paid for the business combination and
the amount of identifiable assets and liabilities acquired net of liabilities
and contingent liabilities assumed. It is provisionally determined on
acquisition and reviewed within a period of 12 months from the
acquisition date. Goodwill is not amortised and is subject to
impairment tests.
In accordance with IFRS 3 as amended:
acquisition costs are recognised in income in the period they are●incurred;
contingent earn-outs are estimated at fair value and included in the●share acquisition price.
For each business combination, the Group can measure
non-controlling interests either at fair value or at its share in the
acquiree’s net identifiable assets as measured at fair value at the
acquisition date. The Group decides on the method it will use to
account for non-controlling interests on a case-by-case basis.
H) INTANGIBLE ASSETS
The main intangible assets recognised by the Group relate to costs
incurred to develop renewable energy plants.
Direct and indirect, external or internal development costs are
capitalised as soon as the success of the corresponding projects
becomes probable.
Development costs are capitalised in accordance with IAS 38
"Intangible assets".
The main criteria for capitalisation are:
the technical feasibility of the project;●
the intention to complete the intangible asset and to either use or●sell it;
the ability to commission the intangible asset;●
the probability that the asset will generate future economic benefits;●
the availability of technical and financial resources to complete the●development of the project;
the ability to reliably estimate the expenditures attributable to the●asset during its development.
The Group considers that these criteria are met when a project enters
its portfolio, i.e. when contractual factors and technical studies
indicate that the feasibility of the project is probable.
When the conditions for the recognition of an asset generated
internally are not met, development costs are expensed in the period
in which they occurred.
Capitalisation of the costs associated with these projects ceases
when the plant is commissioned.
If a project is discontinued, the associated development costs are
expensed and presented in “Other non-recurring operating income
and expenses”.
If the Group considers that the probability of success has decreased,
the development costs are impaired and included in “Non-recurring
operating depreciation, amortisation and provisions”.
The Group identifies development costs relating to “Studies” and
those relating to “Operations”, based on the percentage of
completion of the project at the year-end. The “Operations” phase
includes the construction and operation of the plants.
After the project is commissioned, amortisation is calculated on a
straight-line basis over the useful life of the underlying asset.
Intangible assets are amortised on a straight-line basis over their
estimated useful lives.
The Group’s main intangible asset categories and their useful lives are
listed below:
software: 1 to 3 years;●
development costs: 25 years, in line with the estimated useful lives●of the power plants.
I) PROPERTY, PLANT AND EQUIPMENT
Property, plant and equipment is carried at acquisition cost in
accordance with IAS 16 "Property, plant and equipment". Property,
plant and equipment acquired in business combinations is recognised
at fair value.
Borrowing costs directly attributable to the acquisition or construction
of a qualifying asset are capitalised as part of the cost of that asset up
to commissioning.
Depreciation is calculated from the date the assets are commissioned
and is recognised over the assets’ estimated useful lives using the
straight-line method, as follows:
Power plants: 25 years(1);●
Fixtures and fittings: 3-10 years;●
Office equipment and furniture, IT equipment: 3-4 years.●
The Group considers that power plants have a useful life of 25 years but may adopt different useful lives in light of technical, regulatory or contractual (1)
constraints.
04Financial statements and statutory auditors reports
Notes to the consolidated financial statements
157REGISTRATION DOCUMENT 2018
Depreciation, useful lives and residual values are reviewed at the end
of each reporting period and adjusted where appropriate.
Production assets in progress relate to plants under construction. An
asset is identified from the date construction costs are incurred until
the date the plants are commissioned.
J) LEASES
IFRS 16 replaces IAS 17 and its related interpretations. This new
standard removes the distinction between operating leases and
finance leases for lessees. It provides for the principle of recognising
lease contracts on lessees’ balance sheets, with recognition of:
an asset representing the right to use the leased asset; and●
a liability representing its obligation to make lease payments.●
Exemptions are allowed for short-term contracts and contracts
covering low-value assets.
Operating lease expenses are replaced by amortisation and interest
expense.
K) IMPAIRMENT OF ASSETS
In accordance with IAS 36 Impairment of assets, the Group also
regularly reviews whether there is any evidence that intangible assets
and property, plant and equipment with finite useful lives are impaired.
If such evidence exists, the Group performs an impairment test to
assess whether the carrying amount of the asset exceeds its
recoverable amount, defined as the higher of fair value less costs to
sell and value in use.
Most fixed assets relate to production assets (plants under development
or construction or in operation). These assets have a finite useful life and
are subject to impairment tests whenever there is evidence that they may
be impaired.
In the course of the Group’s activities, only projects with adequate
initial profitability are built and operated. In so far as, in the absence of
any production incidents, the resources generated by the project can
be reliably estimated, the risk of failing to achieve the expected cash
flows is low.
The value in use of an asset is generally assessed by discounting the
future cash flows produced by the asset. Assets that do not generate
largely independent cash flows are grouped into cash-generating
units (CGUs). The Group considers each project to be a CGU.
Data used to perform impairment tests based on discounted cash
flows is taken from the business plans drawn up for the relevant
projects and covering the term of the power sales agreements. The
underlying assumptions are revised at the test date.
L) INVENTORIES
Inventories mainly comprise work-in-progress related to development
activities as well as wood for the biomass plant.
Inventories are stated at the lower of cost price and net realisable
value.
M) CASH AND CASH EQUIVALENTS
Cash and cash equivalents include cash and short-term investments
that are considered highly liquid, convertible to known amounts of
cash and subject to an insignificant risk of change in value in regard
to the criteria set out in IAS 7 "Statement of cash flows".
Overdrafts are excluded from cash and cash equivalents and are
shown within current borrowings.
N) FINANCIAL ASSETS
Financial assets consist of operating receivables, security deposits
related to financing agreements, term deposits, loans,
non-consolidated investments, short-term investments and cash
equivalents and derivative instruments with a positive market value.
Financial assets are classified and measured as follows:
operating receivables, deposits and term deposits are recorded at●amortised cost;
non-consolidated securities are recorded at fair value.●
O) FINANCIAL LIABILITIES
Financial liabilities include borrowings, operating liabilities and
derivative instruments with a negative market value.
Borrowings are initially recognised at their original fair value less
directly attributable transaction costs.
At each reporting date, borrowings are measured at amortised cost
using the effective interest rate method and are broken down into:
non-current borrowings, for the portion falling due in more than one●year;
current borrowings, for the portion due within one year.●
In accordance with IAS 23 "Borrowing costs", borrowing costs
directly attributable to the acquisition, construction or production of a
qualifying asset should be included in the cost of that asset.
P) DERIVATIVE FINANCIAL INSTRUMENTS
As part of its financing operations, the Group takes out floating rate
loans. In accordance with its financial risk hedging policy, the Group
systematically uses derivative financial instruments (mainly swaps).
Derivative financial instruments with a positive market value are
recognised as assets, and those with a negative market value are
recognised as liabilities.
When not treated for accounting purposes as cash flow hedging
instruments, changes in the fair value of these instruments are
recognised in income. The effective portion of changes in the fair
value of instruments classified as cash flow hedges for accounting
purposes is recognised in other comprehensive income to be
subsequently reclassified to income, while the ineffective portion is
taken to income. The new principles set out in IFRS 9 have not had a
material impact on the Group’s financial statements as such, since all
transactions that qualified as hedges under IAS 39 continue to qualify
as hedges under IFRS 9.
04Financial statements and statutory auditors reports
Notes to the consolidated financial statements
158 REGISTRATION DOCUMENT 2018
Q) EMPLOYEE BENEFITS
Employee benefits include defined contribution plans and defined
benefit plans.
Defined contribution plans are post-employment schemes under
which the Group pays fixed contributions to various social security
organisations.
Contributions are paid in exchange for services rendered by the
employees during the financial year and are expensed as incurred.
Defined benefit plans guarantee employees additional benefits such
as retirement indemnities. These guaranteed additional benefits
represent future obligations for the Group which is quantified. The
provision is calculated by estimating the amount of benefits that
employees have accumulated in exchange for services rendered
during the current and prior years.
Given the average age of Group employees, no liability has been
recognised for employee benefits since these are not material.
R) PROVISIONS
Provisions are recognised when:
the Group has a present obligation resulting from a past event;●
it is probable that an outflow of resources embodying economic●benefits will be required to settle the obligation;
the amount of the obligation can be reliably estimated.●
Provisions are measured in accordance with IAS 37 "Provisions,
contingent liabilities and contingent assets" on the basis of the most
probable estimate of the expense required to settle the obligation.
When the effect of the time value of money is significant, the amount
of the provision is discounted.
Where no reliable estimate can be made, the liability cannot be
recognised (contingent liability).
Provision for dismantling obligations
When the Group has a legal or contractual obligation to dismantle a
plant, it recognises a provision for its dismantling obligation against a
“dismantling asset”. The cost of this obligation is regularly estimated
based on independent valuations. In the event of a significant change
in the estimate leading to an increase in the provision, the net value of
the dismantling asset is also increased. If the change in estimate
leads to a decrease in the provision, the Group recognises an
impairment loss against the asset.
S) INCOME TAX AND OTHER TAX PAYABLES
Income tax
Income taxes include tax expense (income) payable and deferred tax
assets (liabilities), calculated in accordance with the tax laws in force
in the countries where profits are taxable. Current and deferred taxes
are generally recognised in income or equity to match the underlying
transaction.
The current tax expense (benefit) is the estimated amount of tax due
on taxable income for the period, determined using the tax rates
adopted at the reporting date. Deferred taxes result from temporary
differences between the carrying amount of assets and liabilities and
their tax basis. However, no deferred taxes are recognised for
temporary differences generated by:
goodwill not deductible for tax purposes;●
the initial recognition of an asset or liability in a transaction that is●not a business combination and which affects neither book income
nor taxable income (tax loss) at the transaction date;
investments in subsidiaries, joint ventures and associates, when the●Group controls the date on which the temporary differences will
reverse and it is likely that these differences will not reverse in the
foreseeable future.
Deferred tax assets and liabilities are measured at the expected tax
rate for the year in which the asset will be realised or the liability
settled and which were enacted at the reporting date. In the event of
a change in tax rates, deferred taxes are adjusted to the new
applicable rate and the adjustment is charged to the income
statement unless it relates to an underlying item recognised in equity,
in particular fair value gains and losses on hedging instruments.
Deferred taxes are reviewed at each reporting date, notably to reflect
changes in tax law and the probability that deductible temporary
differences will be recovered. A deferred tax asset is recognised only to
the extent that it is probable that the Group will have sufficient future
taxable income against which this asset can be utilised in the foreseeable
future, or will have deferred tax liabilities with matching maturities.
Other tax payables
In France, the 2010 finance law introduced the contribution
économique territoriale (CET) (Territorial Economic Contribution) in
spite of the taxe professionelle (Business Tax). The CET comprises
two new contributions: the cotisation foncière des entreprises (CFE),
or Corporate Real Estate Tax, and the cotisation sur la valeur ajoutée
des entreprises (CVAE), or Corporate Value Added Tax. For the years
presented, the Group recognised the CFE tax in operating income
under “Duties, taxes and similar payments” and considered that the
CVAE tax fell within the scope of IAS 12 Income taxes.
04Financial statements and statutory auditors reports
Notes to the consolidated financial statements
159REGISTRATION DOCUMENT 2018
T) NON-CURRENT ASSETS HELD FOR SALE AND DISCONTINUED OPERATIONS
IFRS 5 Non-current assets held for sale and discontinued operations,
requires the separate recognition and presentation of assets and
disposal groups held for sale, and discontinued operations sold or in
the process of being sold.
Non-current assets or disposal groups and any directly associated
liabilities are considered as held for sale if it is highly probable that the
carrying amount will be recovered mainly through a sale rather than
through continuing use. Assets held for sale are measured and
recognised at the lower of carrying amount and fair value less costs to
sell. Depreciation of these assets ceases once they are recognised as
assets (or disposal groups) held for sale. They are shown on a
separate line of the Group’s balance sheet, and prior periods are not
restated.
An operation is a component of the Group that has identifiable cash
flows and that represents a separate major line of business or
geographic area of operations.
In accordance with IFRS 5, the “Net income (loss) from discontinued
operations” line in the income statement includes net-of-tax income and
expenses arising on discontinued operations or assets held for sale.
U) SHARE-BASED PAYMENTS
In accordance with IFRS 2 Share-based payment the fair value of
options and free share grants is assessed using methods that are
appropriate in light of their characteristics, and is recognised in payroll
costs over the rights vesting period.
Share subscription options with no share price performance condition
are valued using the Black-Scholes model.
The fair value of share subscription options at the grant date is
recognised as an expense over the vesting period, depending on the
probability that these options will be exercised before they lapse, with
a corresponding increase in consolidated reserves.
The fair value of free share grant plans is assessed based on the last
share capital increase, taking into consideration the absence of
dividend payments during the vesting period and the lock-up period.
The expense is recognised over the vesting period with a
corresponding increase in consolidated reserves.
At each reporting date, the Group assesses the probability that rights
to options or free share grants will be lost before the end of the
vesting period. Where applicable, the impact of revised estimates is
recognised in income with a corresponding adjustment to
consolidated reserves.
V) TRANSLATION METHODS
Presentation currency of the consolidated financial statements
The Group’s consolidated financial statements are presented in
euros.
Functional currency
The functional currency of an entity is the currency of the economic
environment in which it primarily operates. In some entities, a
functional currency other than the local currency may be used
provided it reflects the currency of the entity’s main trading and
economic environment.
Translation of foreign currency transactions
Foreign currency transactions are translated into the functional
currency at the exchange rate prevailing at the transaction date. At
each reporting date:
monetary assets and liabilities denominated in foreign currencies●are recorded at the closing exchange rate. Any resulting exchange
differences are recognised in the income statement for the period;
non-monetary assets and liabilities denominated in foreign●currencies are translated at the historical exchange rate applicable
at the date of the transaction.
Translation of the financial statements of subsidiaries whose functional currency is not the euro
The balance sheet is translated into euros at the closing exchange
rate. Income and expense items and cash flows are translated using
average exchange rates. Any differences resulting from the translation
of the financial statements of foreign subsidiaries are recorded under
“Exchange differences on translation of foreign operations” in other
comprehensive income.
Goodwill and fair value adjustments arising on the acquisition of a
foreign operation are treated as assets and liabilities of the foreign
entity. They are therefore expressed in the functional currency of the
entity and translated at the closing rate.
Hyperinflation
Through its international operations, the Group may be exposed to
economies qualified as hyperinflationary within the meaning of IFRS
when the functional currency of the entity is the local currency of the
hyperinflationary economy.
In such cases, the Group applies IAS 29 and restates its
non-monetary assets and liabilities and its income statement to reflect
the effects of inflation by applying a general price index.
04Financial statements and statutory auditors reports
Notes to the consolidated financial statements
160 REGISTRATION DOCUMENT 2018
W) OPERATING SEGMENTS
In accordance with IFRS 8 "Operating segments", segment
information is presented based on the internal organisation and
reporting structure used by the Group’s management. Neoen uses
the following breakdown for its operating segments:
Wind: wind turbine production;●
Solar: photovoltaic production;●
Biomass: biomass production;●
Storage: this segment includes the activity related to independent●batteries, directly connected to the grid;
Development and investments: mainly development and●financing;
Eliminations: intercompany flows between the segments●eliminated in the consolidated financial statements and
development costs capitalised.
Geographic areas are defined based on their specific economic
environment and are subject to varying risks and returns. The Group’s
geographic areas are:
Europe - Africa: this region includes production operations in●Europe and Africa;
Americas: this region includes production operations in North●America, Central America, South America and the Caribbean;
Australia: this region includes production operations in Australia.●
Recurring EBITDA corresponds to current operating income adjusted
for current depreciation, amortisation and provisions.
X) EARNINGS PER SHARE
The Group applies IAS 33 "Earnings per share".
Basic earnings per share: net income for the period attributable to
the Group divided by the weighted average number of ordinary
shares outstanding less any treasury shares held.
Diluted earnings per share: net income for the period attributable
to the Group and the weighted average number of ordinary shares
outstanding after deducting treasury shares used to calculate basic
earnings per share are adjusted for the impact of any potentially
dilutive instruments.
CHANGES IN THE SCOPE OF CONSOLIDATIONNOTE 4.
A) CONSOLIDATED COMPANIES
At December 31, 2018, the Neoen Group comprised 280
consolidated companies, of which 276 were fully consolidated and 4
were equity-accounted.
B) NON-CONSOLIDATED COMPANIES
The Group has consolidated all its subsidiaries, including some that
could be considered non-material.
C) CHANGES IN SCOPE
Finland
On May 4, 2018 Neoen Northern Hemisphere acquired from Prokon
Wind Energy Finland 80.1% of the shares of Hedet Vindpark, the
company that holds the Hedet and Bjorkliden projects in Finland.
The acquired entity has been accounted for as an asset purchase
and included in intangible assets (Note 14) for €2.2 million.
France
The Group sold the Melissa and Manosque Ombrière solar farms,
previously wholly owned.
Business development
As part of its development, Neoen frequently creates new companies.
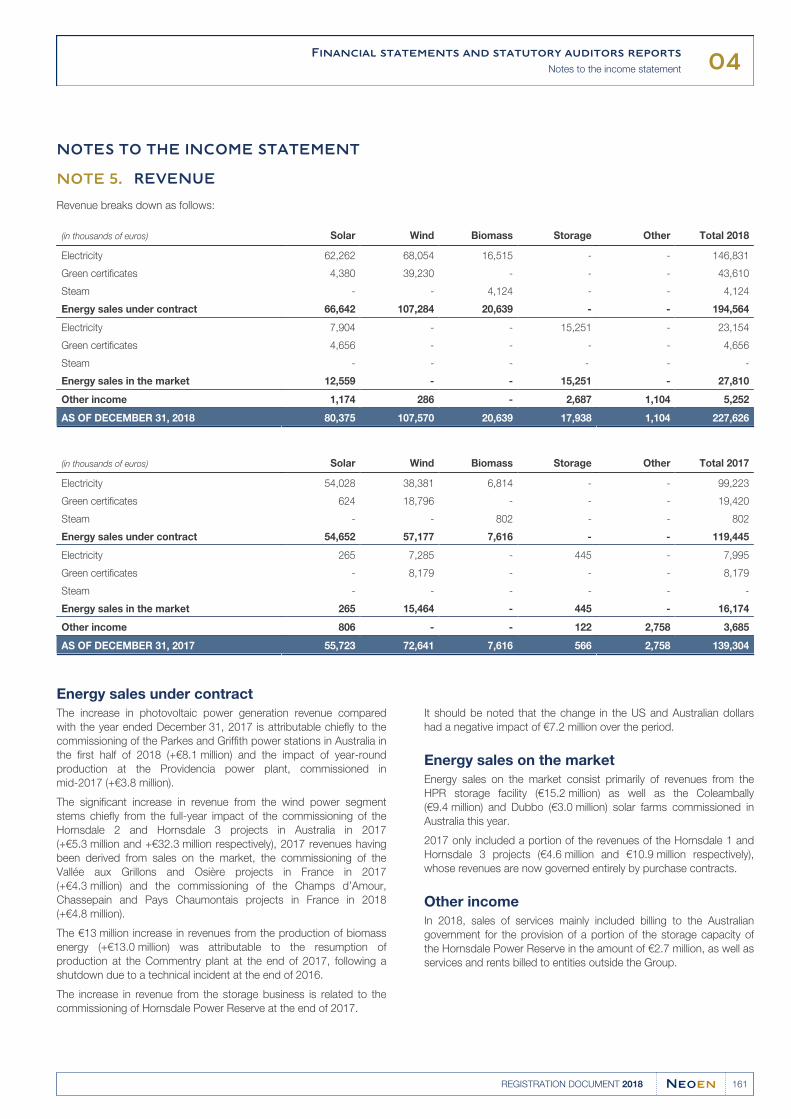
04Financial statements and statutory auditors reports
Notes to the income statement
161REGISTRATION DOCUMENT 2018
NOTES TO THE INCOME STATEMENT
REVENUENOTE 5.
Revenue breaks down as follows:
(in thousands of euros) Solar Wind Biomass Storage Other Total 2018
Electricity 62,262 68,054 16,515 - - 146,831
Green certificates 4,380 39,230 - - - 43,610
Steam - - 4,124 - - 4,124
Energy sales under contract 66,642 107,284 20,639 - - 194,564
Electricity 7,904 - - 15,251 - 23,154
Green certificates 4,656 - - - - 4,656
Steam - - - - - -
Energy sales in the market 12,559 - - 15,251 - 27,810
Other income 1,174 286 - 2,687 1,104 5,252
AS OF DECEMBER 31, 2018 80,375 107,570 20,639 17,938 1,104 227,626
(in thousands of euros) Solar Wind Biomass Storage Other Total 2017
Electricity 54,028 38,381 6,814 - - 99,223
Green certificates 624 18,796 - - - 19,420
Steam - - 802 - - 802
Energy sales under contract 54,652 57,177 7,616 - - 119,445
Electricity 265 7,285 - 445 - 7,995
Green certificates - 8,179 - - - 8,179
Steam - - - - - -
Energy sales in the market 265 15,464 - 445 - 16,174
Other income 806 - - 122 2,758 3,685
AS OF DECEMBER 31, 2017 55,723 72,641 7,616 566 2,758 139,304
Energy sales under contract
The increase in photovoltaic power generation revenue compared
with the year ended December 31, 2017 is attributable chiefly to the
commissioning of the Parkes and Griffith power stations in Australia in
the first half of 2018 (+€8.1 million) and the impact of year-round
production at the Providencia power plant, commissioned in
mid-2017 (+€3.8 million).
The significant increase in revenue from the wind power segment
stems chiefly from the full-year impact of the commissioning of the
Hornsdale 2 and Hornsdale 3 projects in Australia in 2017
(+€5.3 million and +€32.3 million respectively), 2017 revenues having
been derived from sales on the market, the commissioning of the
Vallée aux Grillons and Osière projects in France in 2017
(+€4.3 million) and the commissioning of the Champs d’Amour,
Chassepain and Pays Chaumontais projects in France in 2018
(+€4.8 million).
The €13 million increase in revenues from the production of biomass
energy (+€13.0 million) was attributable to the resumption of
production at the Commentry plant at the end of 2017, following a
shutdown due to a technical incident at the end of 2016.
The increase in revenue from the storage business is related to the
commissioning of Hornsdale Power Reserve at the end of 2017.
It should be noted that the change in the US and Australian dollars
had a negative impact of €7.2 million over the period.
Energy sales on the market
Energy sales on the market consist primarily of revenues from the
HPR storage facility (€15.2 million) as well as the Coleambally
(€9.4 million) and Dubbo (€3.0 million) solar farms commissioned in
Australia this year.
2017 only included a portion of the revenues of the Hornsdale 1 and
Hornsdale 3 projects (€4.6 million and €10.9 million respectively),
whose revenues are now governed entirely by purchase contracts.
Other income
In 2018, sales of services mainly included billing to the Australian
government for the provision of a portion of the storage capacity of
the Hornsdale Power Reserve in the amount of €2.7 million, as well as
services and rents billed to entities outside the Group.
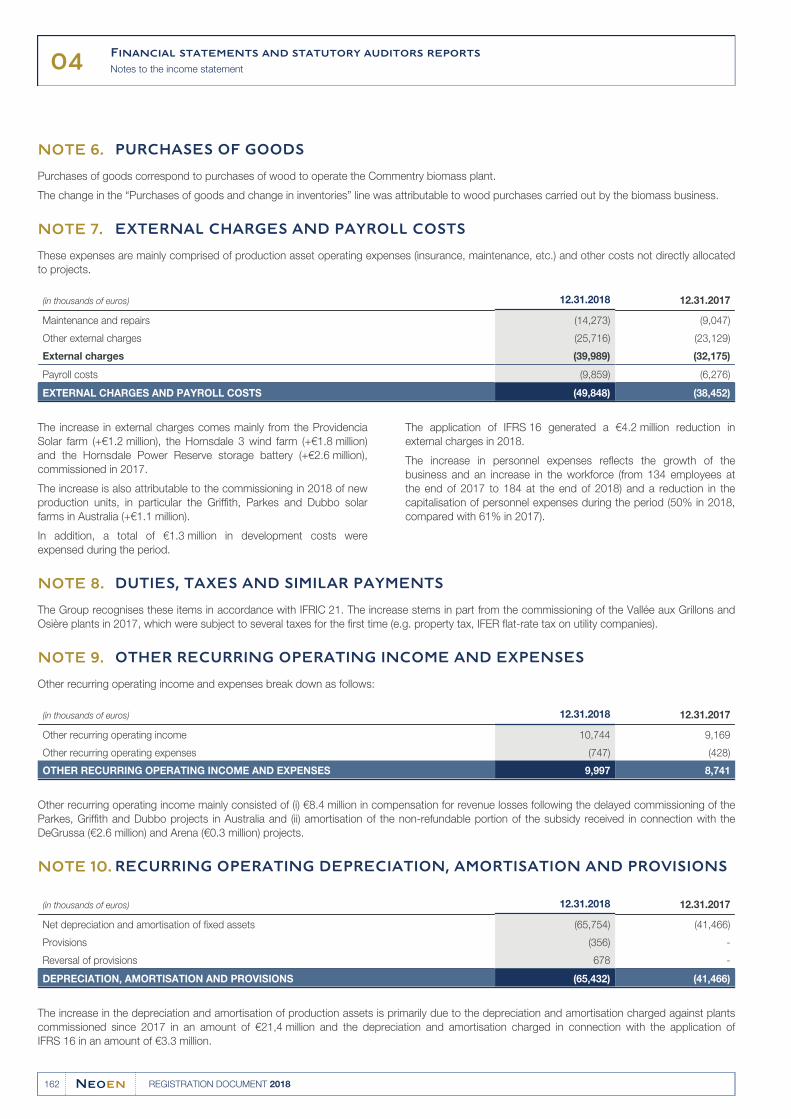
04Financial statements and statutory auditors reports
Notes to the income statement
162 REGISTRATION DOCUMENT 2018
PURCHASES OF GOODSNOTE 6.
Purchases of goods correspond to purchases of wood to operate the Commentry biomass plant.
The change in the “Purchases of goods and change in inventories” line was attributable to wood purchases carried out by the biomass business.
EXTERNAL CHARGES AND PAYROLL COSTSNOTE 7.
These expenses are mainly comprised of production asset operating expenses (insurance, maintenance, etc.) and other costs not directly allocated
to projects.
(in thousands of euros) 12.31.2018 12.31.2017
Maintenance and repairs (14,273) (9,047)
Other external charges (25,716) (23,129)
External charges (39,989) (32,175)
Payroll costs (9,859) (6,276)
EXTERNAL CHARGES AND PAYROLL COSTS (49,848) (38,452)
The increase in external charges comes mainly from the Providencia
Solar farm (+€1.2 million), the Hornsdale 3 wind farm (+€1.8 million)
and the Hornsdale Power Reserve storage battery (+€2.6 million),
commissioned in 2017.
The increase is also attributable to the commissioning in 2018 of new
production units, in particular the Griffith, Parkes and Dubbo solar
farms in Australia (+€1.1 million).
In addition, a total of €1.3 million in development costs were
expensed during the period.
The application of IFRS 16 generated a €4.2 million reduction in
external charges in 2018.
The increase in personnel expenses reflects the growth of the
business and an increase in the workforce (from 134 employees at
the end of 2017 to 184 at the end of 2018) and a reduction in the
capitalisation of personnel expenses during the period (50% in 2018,
compared with 61% in 2017).
DUTIES, TAXES AND SIMILAR PAYMENTSNOTE 8.
The Group recognises these items in accordance with IFRIC 21. The increase stems in part from the commissioning of the Vallée aux Grillons and
Osière plants in 2017, which were subject to several taxes for the first time (e.g. property tax, IFER flat-rate tax on utility companies).
OTHER RECURRING OPERATING INCOME AND EXPENSESNOTE 9.
Other recurring operating income and expenses break down as follows:
(in thousands of euros) 12.31.2018 12.31.2017
Other recurring operating income 10,744 9,169
Other recurring operating expenses (747) (428)
OTHER RECURRING OPERATING INCOME AND EXPENSES 9,997 8,741
Other recurring operating income mainly consisted of (i) €8.4 million in compensation for revenue losses following the delayed commissioning of the
Parkes, Griffith and Dubbo projects in Australia and (ii) amortisation of the non-refundable portion of the subsidy received in connection with the
DeGrussa (€2.6 million) and Arena (€0.3 million) projects.
RECURRING OPERATING DEPRECIATION, AMORTISATION AND PROVISIONSNOTE 10.
(in thousands of euros) 12.31.2018 12.31.2017
Net depreciation and amortisation of fixed assets (65,754) (41,466)
Provisions (356) -
Reversal of provisions 678 -
DEPRECIATION, AMORTISATION AND PROVISIONS (65,432) (41,466)
The increase in the depreciation and amortisation of production assets is primarily due to the depreciation and amortisation charged against plants
commissioned since 2017 in an amount of €21,4 million and the depreciation and amortisation charged in connection with the application of
IFRS 16 in an amount of €3.3 million.
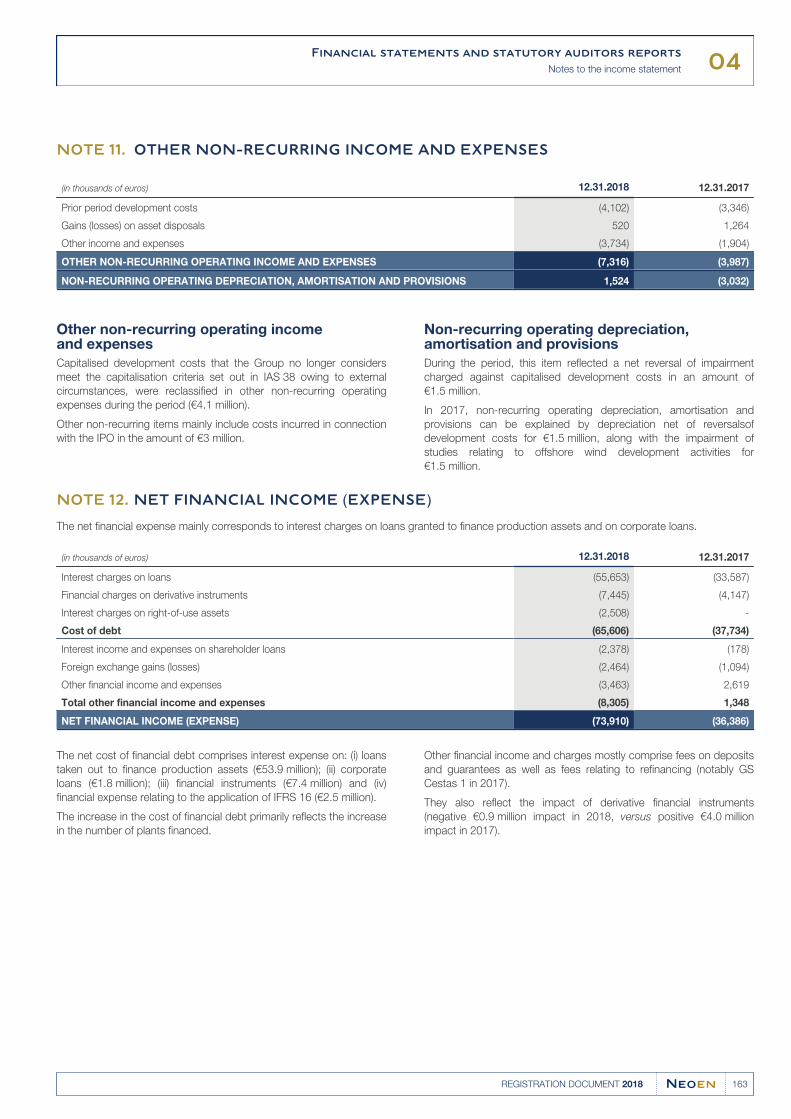
04Financial statements and statutory auditors reports
Notes to the income statement
163REGISTRATION DOCUMENT 2018
OTHER NON-RECURRING INCOME AND EXPENSESNOTE 11.
(in thousands of euros) 12.31.2018 12.31.2017
Prior period development costs (4,102) (3,346)
Gains (losses) on asset disposals 520 1,264
Other income and expenses (3,734) (1,904)
OTHER NON-RECURRING OPERATING INCOME AND EXPENSES (7,316) (3,987)
NON-RECURRING OPERATING DEPRECIATION, AMORTISATION AND PROVISIONS 1,524 (3,032)
Other non-recurring operating income and expenses
Capitalised development costs that the Group no longer considers
meet the capitalisation criteria set out in IAS 38 owing to external
circumstances, were reclassified in other non-recurring operating
expenses during the period (€4.1 million).
Other non-recurring items mainly include costs incurred in connection
with the IPO in the amount of €3 million.
Non-recurring operating depreciation, amortisation and provisions
During the period, this item reflected a net reversal of impairment
charged against capitalised development costs in an amount of
€1.5 million.
In 2017, non-recurring operating depreciation, amortisation and
provisions can be explained by depreciation net of reversalsof
development costs for €1.5 million, along with the impairment of
studies relating to offshore wind development activities for
€1.5 million.
NET FINANCIAL INCOME (EXPENSE)NOTE 12.
The net financial expense mainly corresponds to interest charges on loans granted to finance production assets and on corporate loans.
(in thousands of euros) 12.31.2018 12.31.2017
Interest charges on loans (55,653) (33,587)
Financial charges on derivative instruments (7,445) (4,147)
Interest charges on right-of-use assets (2,508) -
Cost of debt (65,606) (37,734)
Interest income and expenses on shareholder loans (2,378) (178)
Foreign exchange gains (losses) (2,464) (1,094)
Other financial income and expenses (3,463) 2,619
Total other financial income and expenses (8,305) 1,348
NET FINANCIAL INCOME (EXPENSE) (73,910) (36,386)
The net cost of financial debt comprises interest expense on: (i) loans
taken out to finance production assets (€53.9 million); (ii) corporate
loans (€1.8 million); (iii) financial instruments (€7.4 million) and (iv)
financial expense relating to the application of IFRS 16 (€2.5 million).
The increase in the cost of financial debt primarily reflects the increase
in the number of plants financed.
Other financial income and charges mostly comprise fees on deposits
and guarantees as well as fees relating to refinancing (notably GS
Cestas 1 in 2017).
They also reflect the impact of derivative financial instruments
(negative €0.9 million impact in 2018, versus positive €4.0 million
impact in 2017).
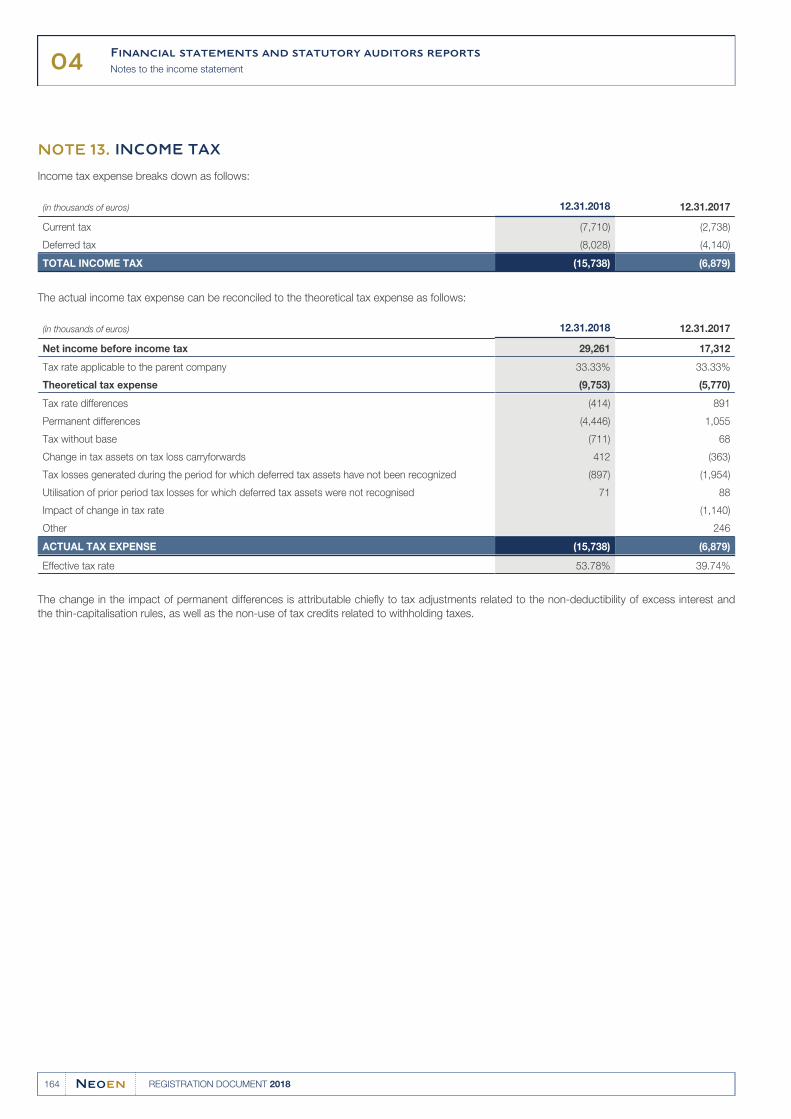
04Financial statements and statutory auditors reports
Notes to the income statement
164 REGISTRATION DOCUMENT 2018
INCOME TAXNOTE 13.
Income tax expense breaks down as follows:
(in thousands of euros) 12.31.2018 12.31.2017
Current tax (7,710) (2,738)
Deferred tax (8,028) (4,140)
TOTAL INCOME TAX (15,738) (6,879)
The actual income tax expense can be reconciled to the theoretical tax expense as follows:
(in thousands of euros) 12.31.2018 12.31.2017
Net income before income tax 29,261 17,312
Tax rate applicable to the parent company 33.33% 33.33%
Theoretical tax expense (9,753) (5,770)
Tax rate differences (414) 891
Permanent differences (4,446) 1,055
Tax without base (711) 68
Change in tax assets on tax loss carryforwards 412 (363)
Tax losses generated during the period for which deferred tax assets have not been recognized (897) (1,954)
Utilisation of prior period tax losses for which deferred tax assets were not recognised 71 88
Impact of change in tax rate (1,140)
Other 246
ACTUAL TAX EXPENSE (15,738) (6,879)
Effective tax rate 53.78% 39.74%
The change in the impact of permanent differences is attributable chiefly to tax adjustments related to the non-deductibility of excess interest and
the thin-capitalisation rules, as well as the non-use of tax credits related to withholding taxes.
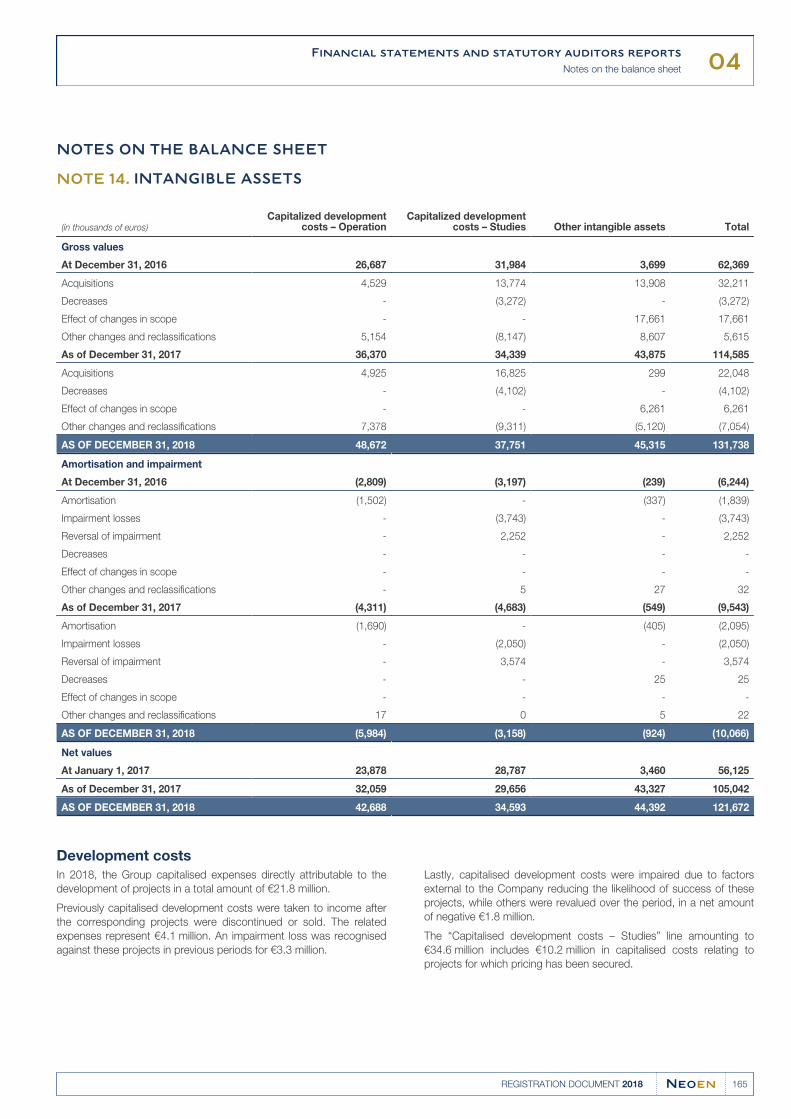
04Financial statements and statutory auditors reports
Notes on the balance sheet
165REGISTRATION DOCUMENT 2018
NOTES ON THE BALANCE SHEET
INTANGIBLE ASSETSNOTE 14.
(in thousands of euros)Capitalized development
costs – OperationCapitalized development
costs – Studies Other intangible assets Total
Gross values
At December 31, 2016 26,687 31,984 3,699 62,369
Acquisitions 4,529 13,774 13,908 32,211
Decreases - (3,272) - (3,272)
Effect of changes in scope - - 17,661 17,661
Other changes and reclassifications 5,154 (8,147) 8,607 5,615
As of December 31, 2017 36,370 34,339 43,875 114,585
Acquisitions 4,925 16,825 299 22,048
Decreases - (4,102) - (4,102)
Effect of changes in scope - - 6,261 6,261
Other changes and reclassifications 7,378 (9,311) (5,120) (7,054)
AS OF DECEMBER 31, 2018 48,672 37,751 45,315 131,738
Amortisation and impairment
At December 31, 2016 (2,809) (3,197) (239) (6,244)
Amortisation (1,502) - (337) (1,839)
Impairment losses - (3,743) - (3,743)
Reversal of impairment - 2,252 - 2,252
Decreases - - - -
Effect of changes in scope - - - -
Other changes and reclassifications - 5 27 32
As of December 31, 2017 (4,311) (4,683) (549) (9,543)
Amortisation (1,690) - (405) (2,095)
Impairment losses - (2,050) - (2,050)
Reversal of impairment - 3,574 - 3,574
Decreases - - 25 25
Effect of changes in scope - - - -
Other changes and reclassifications 17 0 5 22
AS OF DECEMBER 31, 2018 (5,984) (3,158) (924) (10,066)
Net values
At January 1, 2017 23,878 28,787 3,460 56,125
As of December 31, 2017 32,059 29,656 43,327 105,042
AS OF DECEMBER 31, 2018 42,688 34,593 44,392 121,672
Development costs
In 2018, the Group capitalised expenses directly attributable to the
development of projects in a total amount of €21.8 million.
Previously capitalised development costs were taken to income after
the corresponding projects were discontinued or sold. The related
expenses represent €4.1 million. An impairment loss was recognised
against these projects in previous periods for €3.3 million.
Lastly, capitalised development costs were impaired due to factors
external to the Company reducing the likelihood of success of these
projects, while others were revalued over the period, in a net amount
of negative €1.8 million.
The “Capitalised development costs – Studies” line amounting to
€34.6 million includes €10.2 million in capitalised costs relating to
projects for which pricing has been secured.
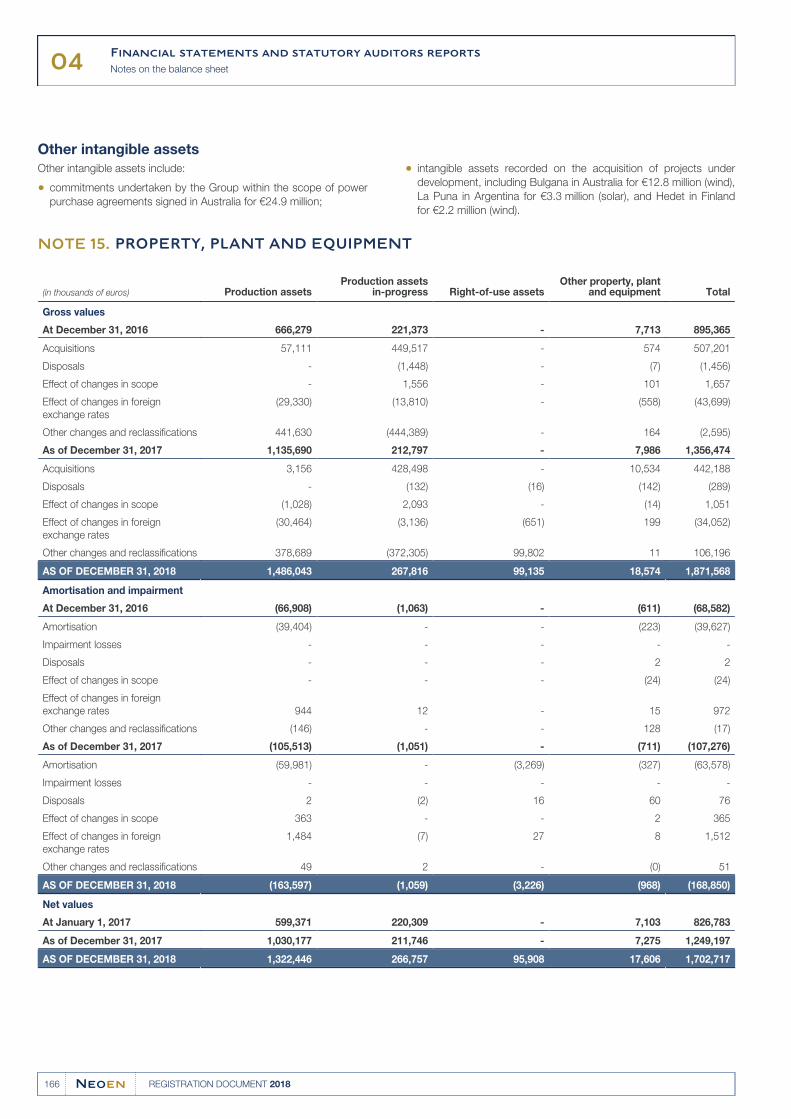
04Financial statements and statutory auditors reports
Notes on the balance sheet
166 REGISTRATION DOCUMENT 2018
Other intangible assets
Other intangible assets include:
commitments undertaken by the Group within the scope of power●purchase agreements signed in Australia for €24.9 million;
intangible assets recorded on the acquisition of projects under●development, including Bulgana in Australia for €12.8 million (wind),
La Puna in Argentina for €3.3 million (solar), and Hedet in Finland
for €2.2 million (wind).
PROPERTY, PLANT AND EQUIPMENTNOTE 15.
(in thousands of euros) Production assetsProduction assets
in-progress Right-of-use assetsOther property, plant
and equipment Total
Gross values
At December 31, 2016 666,279 221,373 - 7,713 895,365
Acquisitions 57,111 449,517 - 574 507,201
Disposals - (1,448) - (7) (1,456)
Effect of changes in scope - 1,556 - 101 1,657
Effect of changes in foreign
exchange rates
(29,330) (13,810) - (558) (43,699)
Other changes and reclassifications 441,630 (444,389) - 164 (2,595)
As of December 31, 2017 1,135,690 212,797 - 7,986 1,356,474
Acquisitions 3,156 428,498 - 10,534 442,188
Disposals - (132) (16) (142) (289)
Effect of changes in scope (1,028) 2,093 - (14) 1,051
Effect of changes in foreign
exchange rates
(30,464) (3,136) (651) 199 (34,052)
Other changes and reclassifications 378,689 (372,305) 99,802 11 106,196
AS OF DECEMBER 31, 2018 1,486,043 267,816 99,135 18,574 1,871,568
Amortisation and impairment
At December 31, 2016 (66,908) (1,063) - (611) (68,582)
Amortisation (39,404) - - (223) (39,627)
Impairment losses - - - - -
Disposals - - - 2 2
Effect of changes in scope - - - (24) (24)
Effect of changes in foreign
exchange rates 944 12 - 15 972
Other changes and reclassifications (146) - - 128 (17)
As of December 31, 2017 (105,513) (1,051) - (711) (107,276)
Amortisation (59,981) - (3,269) (327) (63,578)
Impairment losses - - - - -
Disposals 2 (2) 16 60 76
Effect of changes in scope 363 - - 2 365
Effect of changes in foreign
exchange rates
1,484 (7) 27 8 1,512
Other changes and reclassifications 49 2 - (0) 51
AS OF DECEMBER 31, 2018 (163,597) (1,059) (3,226) (968) (168,850)
Net values
At January 1, 2017 599,371 220,309 - 7,103 826,783
As of December 31, 2017 1,030,177 211,746 - 7,275 1,249,197
AS OF DECEMBER 31, 2018 1,322,446 266,757 95,908 17,606 1,702,717

04Financial statements and statutory auditors reports
Notes on the balance sheet
167REGISTRATION DOCUMENT 2018
Production assets in progress
Acquisitions in the period mainly concern plants under construction in
2018 and in particular:
in Australia: Coleambally (€121.1 million), Numurkah●(€49.1 million), Bulgana (€77.7 million);
in France: Chassepain (€14 million), Pays Chaumontais●(€10.4 million), Lagarde d’Apt (€11.2 million), Lugos (€8.3 million),
Plateau de l’Auxois Sud (€15.2 million);
as well as EREC (€15.7 million) in Jamaica, Hedet in Finland●(€24.6 million), and Bangweulu (€27.8 million) in Zambia.
The effect of changes in scope mainly corresponds to the fixed assets
of the Hedet project acquired over the period.
Property, plant and equipment relating to plants that came into
operation in 2018 were reclassified in production assets.
Production assets
No impairment test has resulted in the impairment of any of the
property, plant and equipment in the Group’s balance sheet.
Right-of-use assets
Other changes include €74.6 million in assets recognised on the
first-time application of IFRS 16 as of January 1, 2018, as well as the
effect of new leases or amendments that came into force during the
year in the amount of €24.6 million.
Other property, plant and equipment
These correspond primarily to land owned.
Interest capitalised in 2018 totalled €7.7 million, versus €9.5 million in
2017.
The table below presents cash flows relating to the acquisition of intangible assets and property, plant and equipment, net of change in payables
to suppliers of fixed assets:
(in thousands of euros) 12.31.2018 12.31.2017
Acquisitions of intangible assets 22,048 32,211
Acquisitions of property, plant and equipment 442,188 507,201
Cash change relating to fixed asset supplier debts 19,626 (71,405)
INVESTMENTS IN PROPERTY, PLANT AND EQUIPMENT AND INTANGIBLE ASSETS 483,862 468,007
INVESTMENTS IN ASSOCIATES AND JOINT VENTURESNOTE 16.
Changes in investments in associates and joint ventures are as follows:
(in thousands of euros) 12.31.2018 12.31.2017
Opening balance 7,039 6,443
Dividends paid (312) (426)
Capital increase - -
Change in consolidation method - -
Share of net income of associates 765 422
Change in fair value (779) 599
Other movements (0) 0
CLOSING BALANCE 6,713 7,039
This item corresponds primarily to the valuation of the Seixal plant (CSNSP 441 in Portugal) for €6.8 million, and BNRG Neoen Holding in Ireland
and Tureau to La Dame in France for negative €0.1 million.
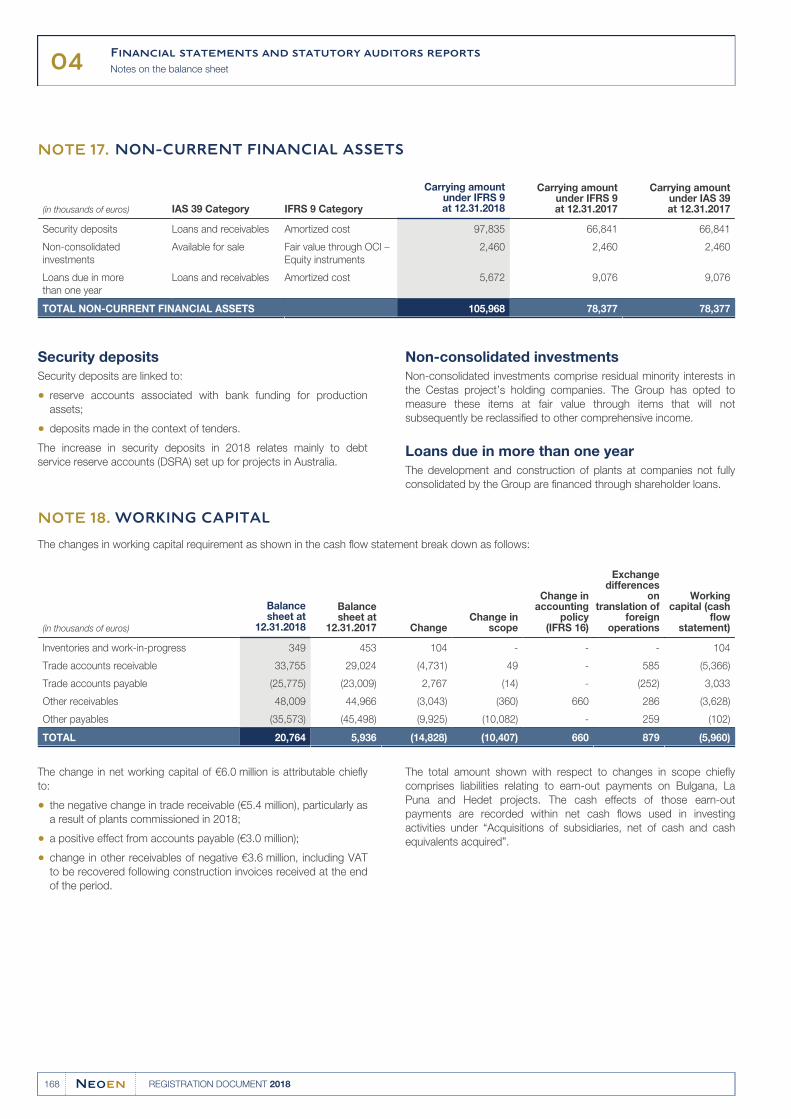
04Financial statements and statutory auditors reports
Notes on the balance sheet
168 REGISTRATION DOCUMENT 2018
NON-CURRENT FINANCIAL ASSETSNOTE 17.
(in thousands of euros) IAS 39 Category IFRS 9 Category
Carrying amountunder IFRS 9at 12.31.2018
Carrying amountunder IFRS 9at 12.31.2017
Carrying amountunder IAS 39at 12.31.2017
Security deposits Loans and receivables Amortized cost 97,835 66,841 66,841
Non-consolidated
investments
Available for sale Fair value through OCI –
Equity instruments
2,460 2,460 2,460
Loans due in more
than one year
Loans and receivables Amortized cost 5,672 9,076 9,076
TOTAL NON-CURRENT FINANCIAL ASSETS 105,968 78,377 78,377
Security deposits
Security deposits are linked to:
reserve accounts associated with bank funding for production●assets;
deposits made in the context of tenders.●
The increase in security deposits in 2018 relates mainly to debt
service reserve accounts (DSRA) set up for projects in Australia.
Non-consolidated investments
Non-consolidated investments comprise residual minority interests in
the Cestas project’s holding companies. The Group has opted to
measure these items at fair value through items that will not
subsequently be reclassified to other comprehensive income.
Loans due in more than one year
The development and construction of plants at companies not fully
consolidated by the Group are financed through shareholder loans.
WORKING CAPITALNOTE 18.
The changes in working capital requirement as shown in the cash flow statement break down as follows:
(in thousands of euros)
Balancesheet at
12.31.2018
Balancesheet at
12.31.2017 ChangeChange in
scope
Change inaccounting
policy(IFRS 16)
Exchangedifferences
ontranslation of
foreignoperations
Workingcapital (cash
flowstatement)
Inventories and work-in-progress 349 453 104 - - - 104
Trade accounts receivable 33,755 29,024 (4,731) 49 - 585 (5,366)
Trade accounts payable (25,775) (23,009) 2,767 (14) - (252) 3,033
Other receivables 48,009 44,966 (3,043) (360) 660 286 (3,628)
Other payables (35,573) (45,498) (9,925) (10,082) - 259 (102)
TOTAL 20,764 5,936 (14,828) (10,407) 660 879 (5,960)
The change in net working capital of €6.0 million is attributable chiefly
to:
the negative change in trade receivable (€5.4 million), particularly as●a result of plants commissioned in 2018;
a positive effect from accounts payable (€3.0 million);●
change in other receivables of negative €3.6 million, including VAT●to be recovered following construction invoices received at the end
of the period.
The total amount shown with respect to changes in scope chiefly
comprises liabilities relating to earn-out payments on Bulgana, La
Puna and Hedet projects. The cash effects of those earn-out
payments are recorded within net cash flows used in investing
activities under “Acquisitions of subsidiaries, net of cash and cash
equivalents acquired”.
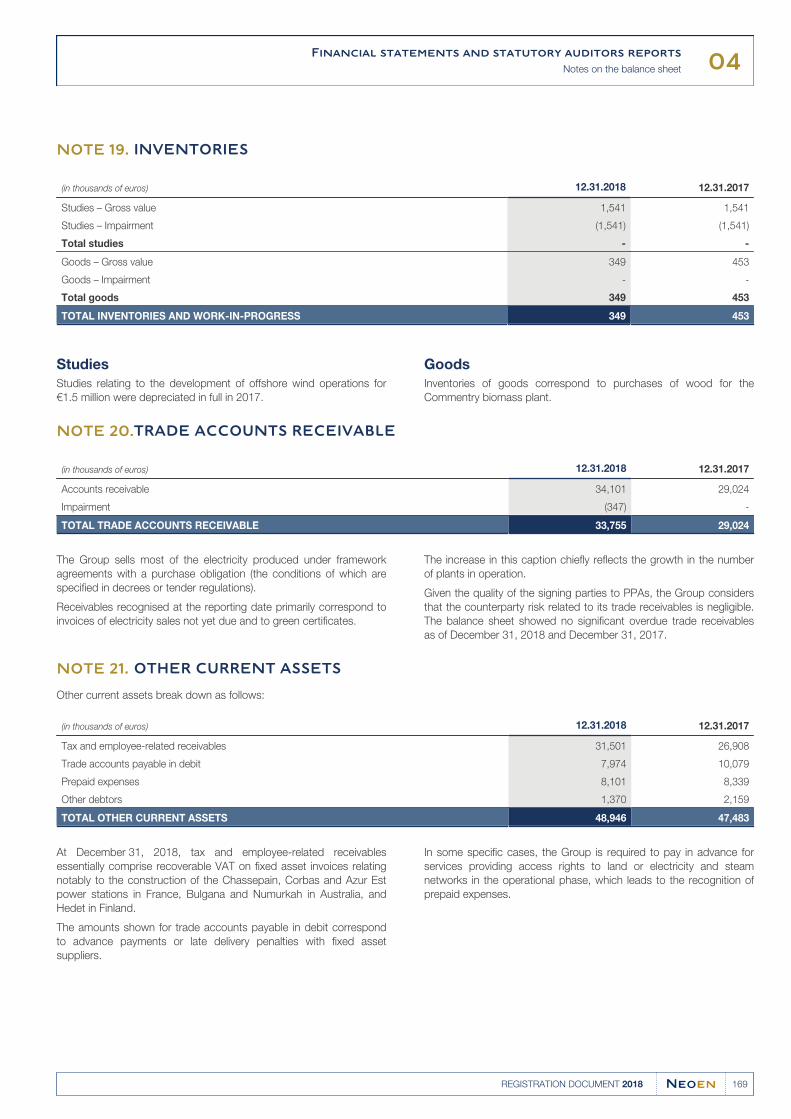
04Financial statements and statutory auditors reports
Notes on the balance sheet
169REGISTRATION DOCUMENT 2018
INVENTORIESNOTE 19.
(in thousands of euros) 12.31.2018 12.31.2017
Studies – Gross value 1,541 1,541
Studies – Impairment (1,541) (1,541)
Total studies - -
Goods – Gross value 349 453
Goods – Impairment - -
Total goods 349 453
TOTAL INVENTORIES AND WORK-IN-PROGRESS 349 453
Studies
Studies relating to the development of offshore wind operations for
€1.5 million were depreciated in full in 2017.
Goods
Inventories of goods correspond to purchases of wood for the
Commentry biomass plant.
TRADE ACCOUNTS RECEIVABLENOTE 20.
(in thousands of euros) 12.31.2018 12.31.2017
Accounts receivable 34,101 29,024
Impairment (347) -
TOTAL TRADE ACCOUNTS RECEIVABLE 33,755 29,024
The Group sells most of the electricity produced under framework
agreements with a purchase obligation (the conditions of which are
specified in decrees or tender regulations).
Receivables recognised at the reporting date primarily correspond to
invoices of electricity sales not yet due and to green certificates.
The increase in this caption chiefly reflects the growth in the number
of plants in operation.
Given the quality of the signing parties to PPAs, the Group considers
that the counterparty risk related to its trade receivables is negligible.
The balance sheet showed no significant overdue trade receivables
as of December 31, 2018 and December 31, 2017.
OTHER CURRENT ASSETSNOTE 21.
Other current assets break down as follows:
(in thousands of euros) 12.31.2018 12.31.2017
Tax and employee-related receivables 31,501 26,908
Trade accounts payable in debit 7,974 10,079
Prepaid expenses 8,101 8,339
Other debtors 1,370 2,159
TOTAL OTHER CURRENT ASSETS 48,946 47,483
At December 31, 2018, tax and employee-related receivables
essentially comprise recoverable VAT on fixed asset invoices relating
notably to the construction of the Chassepain, Corbas and Azur Est
power stations in France, Bulgana and Numurkah in Australia, and
Hedet in Finland.
The amounts shown for trade accounts payable in debit correspond
to advance payments or late delivery penalties with fixed asset
suppliers.
In some specific cases, the Group is required to pay in advance for
services providing access rights to land or electricity and steam
networks in the operational phase, which leads to the recognition of
prepaid expenses.
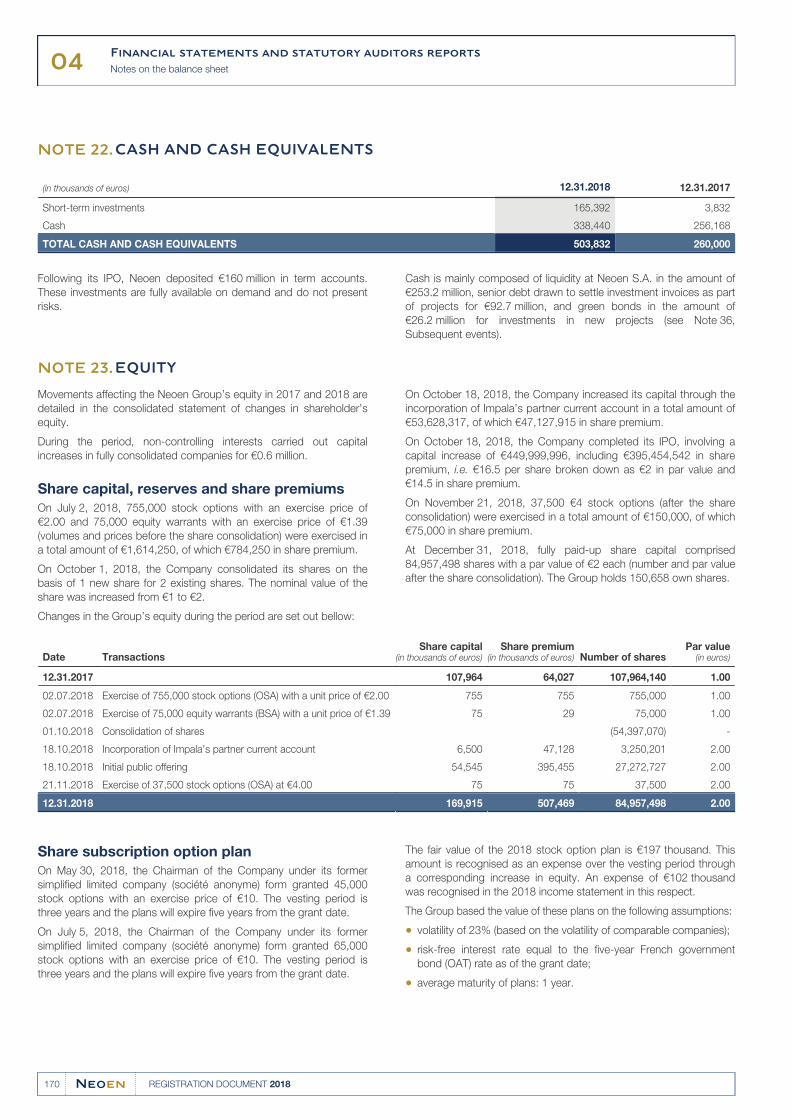
04Financial statements and statutory auditors reports
Notes on the balance sheet
170 REGISTRATION DOCUMENT 2018
CASH AND CASH EQUIVALENTSNOTE 22.
(in thousands of euros) 12.31.2018 12.31.2017
Short-term investments 165,392 3,832
Cash 338,440 256,168
TOTAL CASH AND CASH EQUIVALENTS 503,832 260,000
Following its IPO, Neoen deposited €160 million in term accounts.
These investments are fully available on demand and do not present
risks.
Cash is mainly composed of liquidity at Neoen S.A. in the amount of
€253.2 million, senior debt drawn to settle investment invoices as part
of projects for €92.7 million, and green bonds in the amount of
€26.2 million for investments in new projects (see Note 36,
Subsequent events).
EQUITYNOTE 23.
Movements affecting the Neoen Group’s equity in 2017 and 2018 are
detailed in the consolidated statement of changes in shareholder’s
equity.
During the period, non-controlling interests carried out capital
increases in fully consolidated companies for €0.6 million.
Share capital, reserves and share premiums
On July 2, 2018, 755,000 stock options with an exercise price of
€2.00 and 75,000 equity warrants with an exercise price of €1.39
(volumes and prices before the share consolidation) were exercised in
a total amount of €1,614,250, of which €784,250 in share premium.
On October 1, 2018, the Company consolidated its shares on the
basis of 1 new share for 2 existing shares. The nominal value of the
share was increased from €1 to €2.
On October 18, 2018, the Company increased its capital through the
incorporation of Impala’s partner current account in a total amount of
€53,628,317, of which €47,127,915 in share premium.
On October 18, 2018, the Company completed its IPO, involving a
capital increase of €449,999,996, including €395,454,542 in share
premium, i.e. €16.5 per share broken down as €2 in par value and
€14.5 in share premium.
On November 21, 2018, 37,500 €4 stock options (after the share
consolidation) were exercised in a total amount of €150,000, of which
€75,000 in share premium.
At December 31, 2018, fully paid-up share capital comprised
84,957,498 shares with a par value of €2 each (number and par value
after the share consolidation). The Group holds 150,658 own shares.
Changes in the Group’s equity during the period are set out bellow:
Date TransactionsShare capital
(in thousands of euros)Share premium
(in thousands of euros) Number of sharesPar value
(in euros)
12.31.2017 107,964 64,027 107,964,140 1.00
02.07.2018 Exercise of 755,000 stock options (OSA) with a unit price of €2.00 755 755 755,000 1.00
02.07.2018 Exercise of 75,000 equity warrants (BSA) with a unit price of €1.39 75 29 75,000 1.00
01.10.2018 Consolidation of shares (54,397,070) -
18.10.2018 Incorporation of Impala’s partner current account 6,500 47,128 3,250,201 2.00
18.10.2018 Initial public offering 54,545 395,455 27,272,727 2.00
21.11.2018 Exercise of 37,500 stock options (OSA) at €4.00 75 75 37,500 2.00
12.31.2018 169,915 507,469 84,957,498 2.00
Share subscription option plan
On May 30, 2018, the Chairman of the Company under its former
simplified limited company (société anonyme) form granted 45,000
stock options with an exercise price of €10. The vesting period is
three years and the plans will expire five years from the grant date.
On July 5, 2018, the Chairman of the Company under its former
simplified limited company (société anonyme) form granted 65,000
stock options with an exercise price of €10. The vesting period is
three years and the plans will expire five years from the grant date.
The fair value of the 2018 stock option plan is €197 thousand. This
amount is recognised as an expense over the vesting period through
a corresponding increase in equity. An expense of €102 thousand
was recognised in the 2018 income statement in this respect.
The Group based the value of these plans on the following assumptions:
volatility of 23% (based on the volatility of comparable companies);●
risk-free interest rate equal to the five-year French government●bond (OAT) rate as of the grant date;
average maturity of plans: 1 year.●
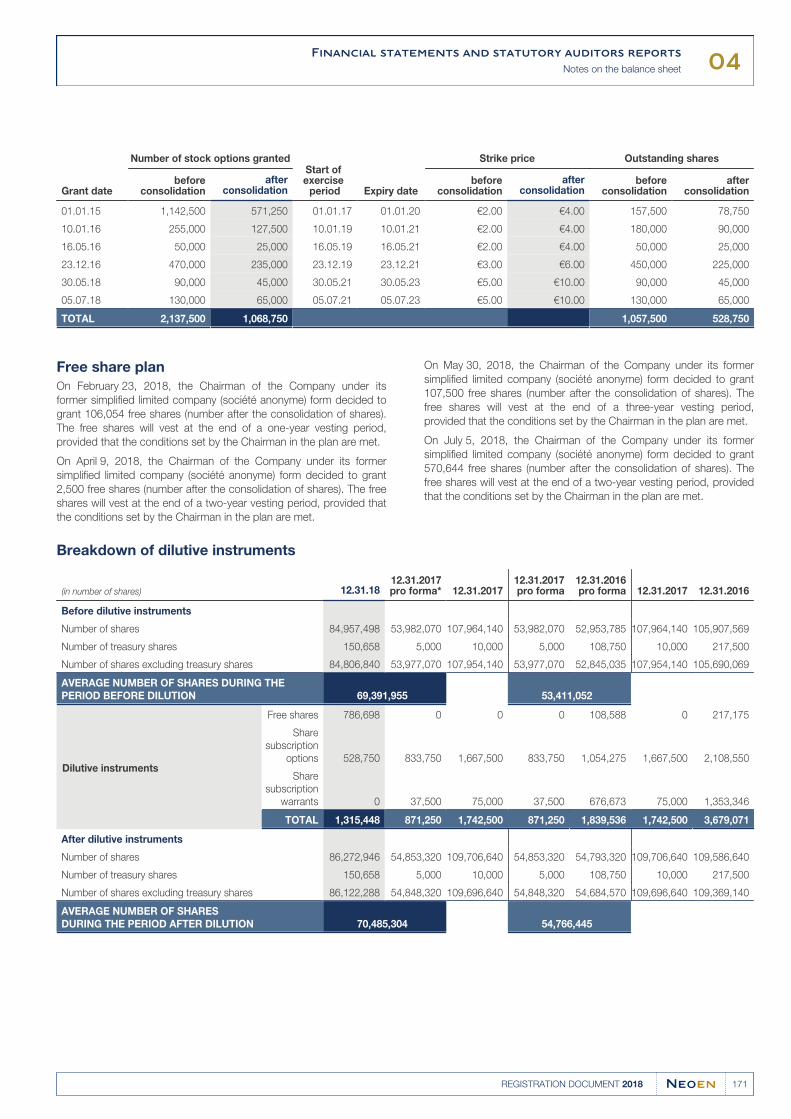
04Financial statements and statutory auditors reports
Notes on the balance sheet
171REGISTRATION DOCUMENT 2018
Grant date
Number of stock options grantedStart of exercise
period Expiry date
Strike price Outstanding shares
beforeconsolidation
afterconsolidation
beforeconsolidation
afterconsolidation
beforeconsolidation
afterconsolidation
01.01.15 1,142,500 571,250 01.01.17 01.01.20 €2.00 €4.00 157,500 78,750
10.01.16 255,000 127,500 10.01.19 10.01.21 €2.00 €4.00 180,000 90,000
16.05.16 50,000 25,000 16.05.19 16.05.21 €2.00 €4.00 50,000 25,000
23.12.16 470,000 235,000 23.12.19 23.12.21 €3.00 €6.00 450,000 225,000
30.05.18 90,000 45,000 30.05.21 30.05.23 €5.00 €10.00 90,000 45,000
05.07.18 130,000 65,000 05.07.21 05.07.23 €5.00 €10.00 130,000 65,000
TOTAL 2,137,500 1,068,750 1,057,500 528,750
Free share plan
On February 23, 2018, the Chairman of the Company under its
former simplified limited company (société anonyme) form decided to
grant 106,054 free shares (number after the consolidation of shares).
The free shares will vest at the end of a one-year vesting period,
provided that the conditions set by the Chairman in the plan are met.
On April 9, 2018, the Chairman of the Company under its former
simplified limited company (société anonyme) form decided to grant
2,500 free shares (number after the consolidation of shares). The free
shares will vest at the end of a two-year vesting period, provided that
the conditions set by the Chairman in the plan are met.
On May 30, 2018, the Chairman of the Company under its former
simplified limited company (société anonyme) form decided to grant
107,500 free shares (number after the consolidation of shares). The
free shares will vest at the end of a three-year vesting period,
provided that the conditions set by the Chairman in the plan are met.
On July 5, 2018, the Chairman of the Company under its former
simplified limited company (société anonyme) form decided to grant
570,644 free shares (number after the consolidation of shares). The
free shares will vest at the end of a two-year vesting period, provided
that the conditions set by the Chairman in the plan are met.
Breakdown of dilutive instruments
(in number of shares) 12.31.1812.31.2017pro forma* 12.31.2017
12.31.2017pro forma
12.31.2016pro forma 12.31.2017 12.31.2016
Before dilutive instruments
Number of shares 84,957,498 53,982,070 107,964,140 53,982,070 52,953,785 107,964,140 105,907,569
Number of treasury shares 150,658 5,000 10,000 5,000 108,750 10,000 217,500
Number of shares excluding treasury shares 84,806,840 53,977,070 107,954,140 53,977,070 52,845,035 107,954,140 105,690,069
AVERAGE NUMBER OF SHARES DURING THE
PERIOD BEFORE DILUTION 69,391,955 53,411,052
Dilutive instruments
Free shares 786,698 0 0 0 108,588 0 217,175
Share
subscription
options 528,750 833,750 1,667,500 833,750 1,054,275 1,667,500 2,108,550
Share
subscription
warrants 0 37,500 75,000 37,500 676,673 75,000 1,353,346
TOTAL 1,315,448 871,250 1,742,500 871,250 1,839,536 1,742,500 3,679,071
After dilutive instruments
Number of shares 86,272,946 54,853,320 109,706,640 54,853,320 54,793,320 109,706,640 109,586,640
Number of treasury shares 150,658 5,000 10,000 5,000 108,750 10,000 217,500
Number of shares excluding treasury shares 86,122,288 54,848,320 109,696,640 54,848,320 54,684,570 109,696,640 109,369,140
AVERAGE NUMBER OF SHARES
DURING THE PERIOD AFTER DILUTION 70,485,304 54,766,445
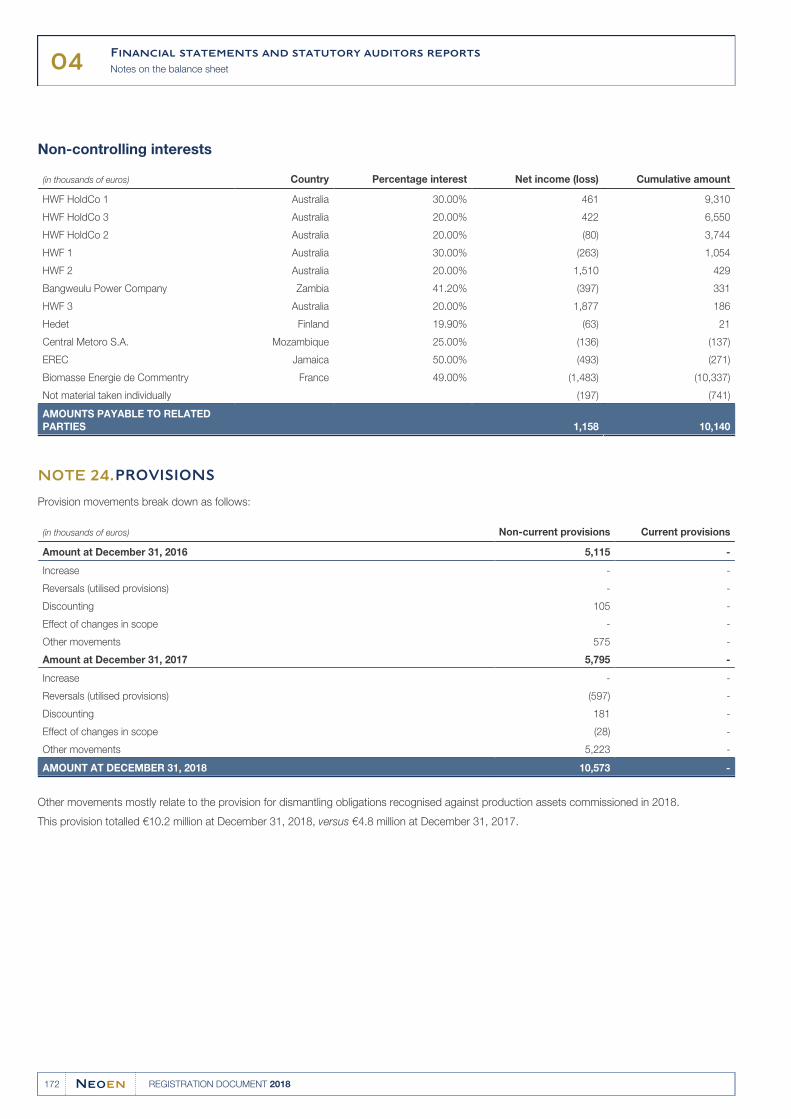
04Financial statements and statutory auditors reports
Notes on the balance sheet
172 REGISTRATION DOCUMENT 2018
Non-controlling interests
(in thousands of euros) Country Percentage interest Net income (loss) Cumulative amount
HWF HoldCo 1 Australia 30.00% 461 9,310
HWF HoldCo 3 Australia 20.00% 422 6,550
HWF HoldCo 2 Australia 20.00% (80) 3,744
HWF 1 Australia 30.00% (263) 1,054
HWF 2 Australia 20.00% 1,510 429
Bangweulu Power Company Zambia 41.20% (397) 331
HWF 3 Australia 20.00% 1,877 186
Hedet Finland 19.90% (63) 21
Central Metoro S.A. Mozambique 25.00% (136) (137)
EREC Jamaica 50.00% (493) (271)
Biomasse Energie de Commentry France 49.00% (1,483) (10,337)
Not material taken individually (197) (741)
AMOUNTS PAYABLE TO RELATED
PARTIES 1,158 10,140
PROVISIONSNOTE 24.
Provision movements break down as follows:
(in thousands of euros) Non-current provisions Current provisions
Amount at December 31, 2016 5,115 -
Increase - -
Reversals (utilised provisions) - -
Discounting 105 -
Effect of changes in scope - -
Other movements 575 -
Amount at December 31, 2017 5,795 -
Increase - -
Reversals (utilised provisions) (597) -
Discounting 181 -
Effect of changes in scope (28) -
Other movements 5,223 -
AMOUNT AT DECEMBER 31, 2018 10,573 -
Other movements mostly relate to the provision for dismantling obligations recognised against production assets commissioned in 2018.
This provision totalled €10.2 million at December 31, 2018, versus €4.8 million at December 31, 2017.
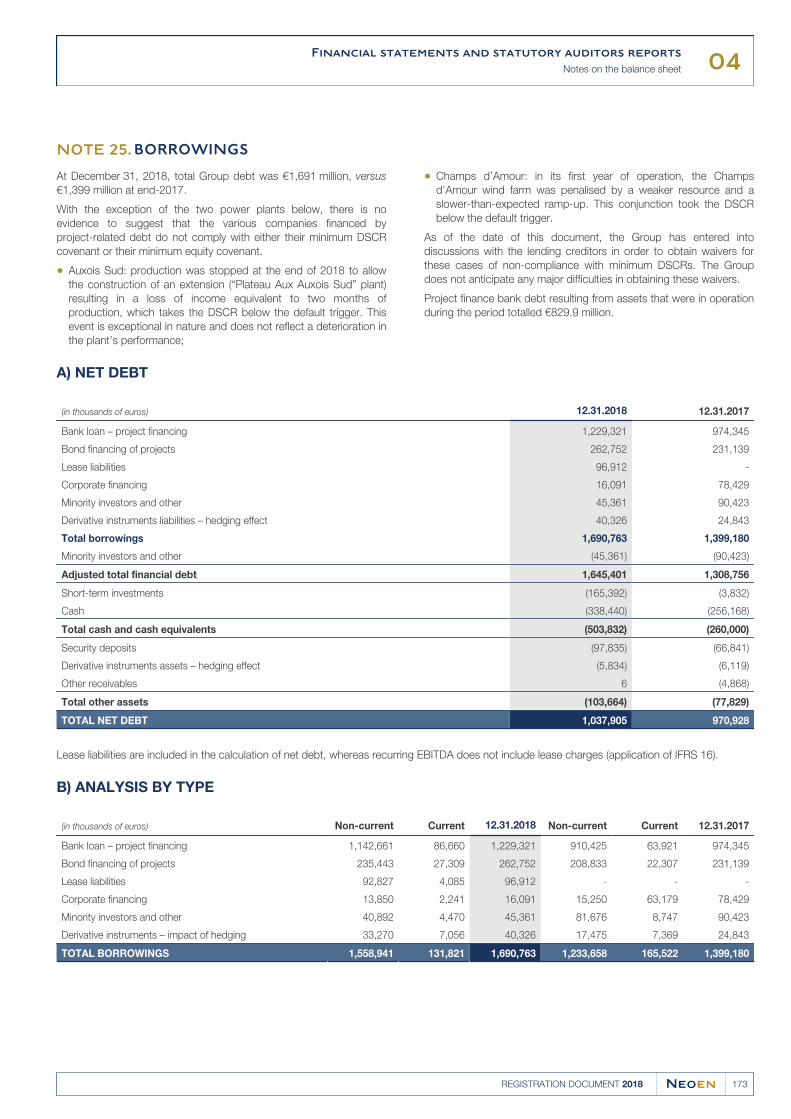
04Financial statements and statutory auditors reports
Notes on the balance sheet
173REGISTRATION DOCUMENT 2018
BORROWINGSNOTE 25.
At December 31, 2018, total Group debt was €1,691 million, versus
€1,399 million at end-2017.
With the exception of the two power plants below, there is no
evidence to suggest that the various companies financed by
project-related debt do not comply with either their minimum DSCR
covenant or their minimum equity covenant.
Auxois Sud: production was stopped at the end of 2018 to allow●the construction of an extension (“Plateau Aux Auxois Sud” plant)
resulting in a loss of income equivalent to two months of
production, which takes the DSCR below the default trigger. This
event is exceptional in nature and does not reflect a deterioration in
the plant’s performance;
Champs d’Amour: in its first year of operation, the Champs●d’Amour wind farm was penalised by a weaker resource and a
slower-than-expected ramp-up. This conjunction took the DSCR
below the default trigger.
As of the date of this document, the Group has entered into
discussions with the lending creditors in order to obtain waivers for
these cases of non-compliance with minimum DSCRs. The Group
does not anticipate any major difficulties in obtaining these waivers.
Project finance bank debt resulting from assets that were in operation
during the period totalled €829.9 million.
A) NET DEBT
(in thousands of euros) 12.31.2018 12.31.2017
Bank loan – project financing 1,229,321 974,345
Bond financing of projects 262,752 231,139
Lease liabilities 96,912 -
Corporate financing 16,091 78,429
Minority investors and other 45,361 90,423
Derivative instruments liabilities – hedging effect 40,326 24,843
Total borrowings 1,690,763 1,399,180
Minority investors and other (45,361) (90,423)
Adjusted total financial debt 1,645,401 1,308,756
Short-term investments (165,392) (3,832)
Cash (338,440) (256,168)
Total cash and cash equivalents (503,832) (260,000)
Security deposits (97,835) (66,841)
Derivative instruments assets – hedging effect (5,834) (6,119)
Other receivables 6 (4,868)
Total other assets (103,664) (77,829)
TOTAL NET DEBT 1,037,905 970,928
Lease liabilities are included in the calculation of net debt, whereas recurring EBITDA does not include lease charges (application of IFRS 16).
B) ANALYSIS BY TYPE
(in thousands of euros) Non-current Current 12.31.2018 Non-current Current 12.31.2017
Bank loan – project financing 1,142,661 86,660 1,229,321 910,425 63,921 974,345
Bond financing of projects 235,443 27,309 262,752 208,833 22,307 231,139
Lease liabilities 92,827 4,085 96,912 - - -
Corporate financing 13,850 2,241 16,091 15,250 63,179 78,429
Minority investors and other 40,892 4,470 45,361 81,676 8,747 90,423
Derivative instruments – impact of hedging 33,270 7,056 40,326 17,475 7,369 24,843
TOTAL BORROWINGS 1,558,941 131,821 1,690,763 1,233,658 165,522 1,399,180
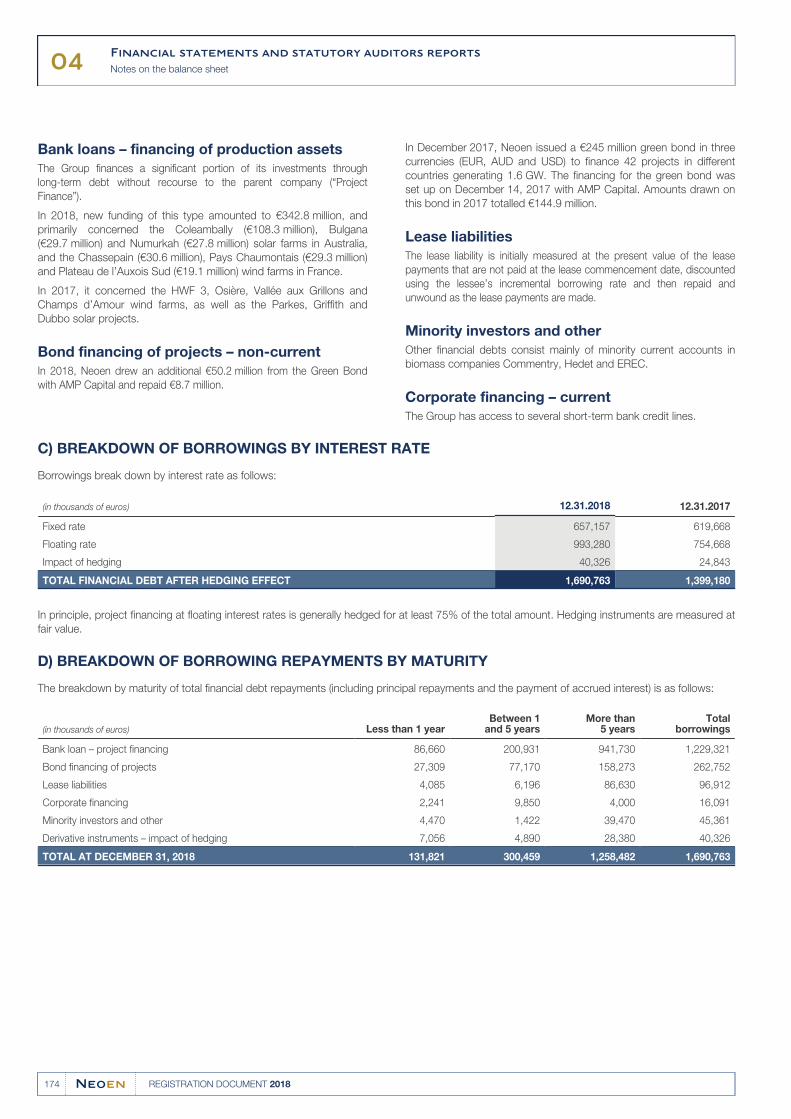
04Financial statements and statutory auditors reports
Notes on the balance sheet
174 REGISTRATION DOCUMENT 2018
Bank loans – financing of production assets
The Group finances a significant portion of its investments through
long-term debt without recourse to the parent company (“Project
Finance”).
In 2018, new funding of this type amounted to €342.8 million, and
primarily concerned the Coleambally (€108.3 million), Bulgana
(€29.7 million) and Numurkah (€27.8 million) solar farms in Australia,
and the Chassepain (€30.6 million), Pays Chaumontais (€29.3 million)
and Plateau de l’Auxois Sud (€19.1 million) wind farms in France.
In 2017, it concerned the HWF 3, Osière, Vallée aux Grillons and
Champs d’Amour wind farms, as well as the Parkes, Griffith and
Dubbo solar projects.
Bond financing of projects – non-current
In 2018, Neoen drew an additional €50.2 million from the Green Bond
with AMP Capital and repaid €8.7 million.
In December 2017, Neoen issued a €245 million green bond in three
currencies (EUR, AUD and USD) to finance 42 projects in different
countries generating 1.6 GW. The financing for the green bond was
set up on December 14, 2017 with AMP Capital. Amounts drawn on
this bond in 2017 totalled €144.9 million.
Lease liabilities
The lease liability is initially measured at the present value of the lease
payments that are not paid at the lease commencement date, discounted
using the lessee’s incremental borrowing rate and then repaid and
unwound as the lease payments are made.
Minority investors and other
Other financial debts consist mainly of minority current accounts in
biomass companies Commentry, Hedet and EREC.
Corporate financing – current
The Group has access to several short-term bank credit lines.
C) BREAKDOWN OF BORROWINGS BY INTEREST RATE
Borrowings break down by interest rate as follows:
(in thousands of euros) 12.31.2018 12.31.2017
Fixed rate 657,157 619,668
Floating rate 993,280 754,668
Impact of hedging 40,326 24,843
TOTAL FINANCIAL DEBT AFTER HEDGING EFFECT 1,690,763 1,399,180
In principle, project financing at floating interest rates is generally hedged for at least 75% of the total amount. Hedging instruments are measured at
fair value.
D) BREAKDOWN OF BORROWING REPAYMENTS BY MATURITY
The breakdown by maturity of total financial debt repayments (including principal repayments and the payment of accrued interest) is as follows:
(in thousands of euros) Less than 1 yearBetween 1
and 5 yearsMore than
5 yearsTotal
borrowings
Bank loan – project financing 86,660 200,931 941,730 1,229,321
Bond financing of projects 27,309 77,170 158,273 262,752
Lease liabilities 4,085 6,196 86,630 96,912
Corporate financing 2,241 9,850 4,000 16,091
Minority investors and other 4,470 1,422 39,470 45,361
Derivative instruments – impact of hedging 7,056 4,890 28,380 40,326
TOTAL AT DECEMBER 31, 2018 131,821 300,459 1,258,482 1,690,763
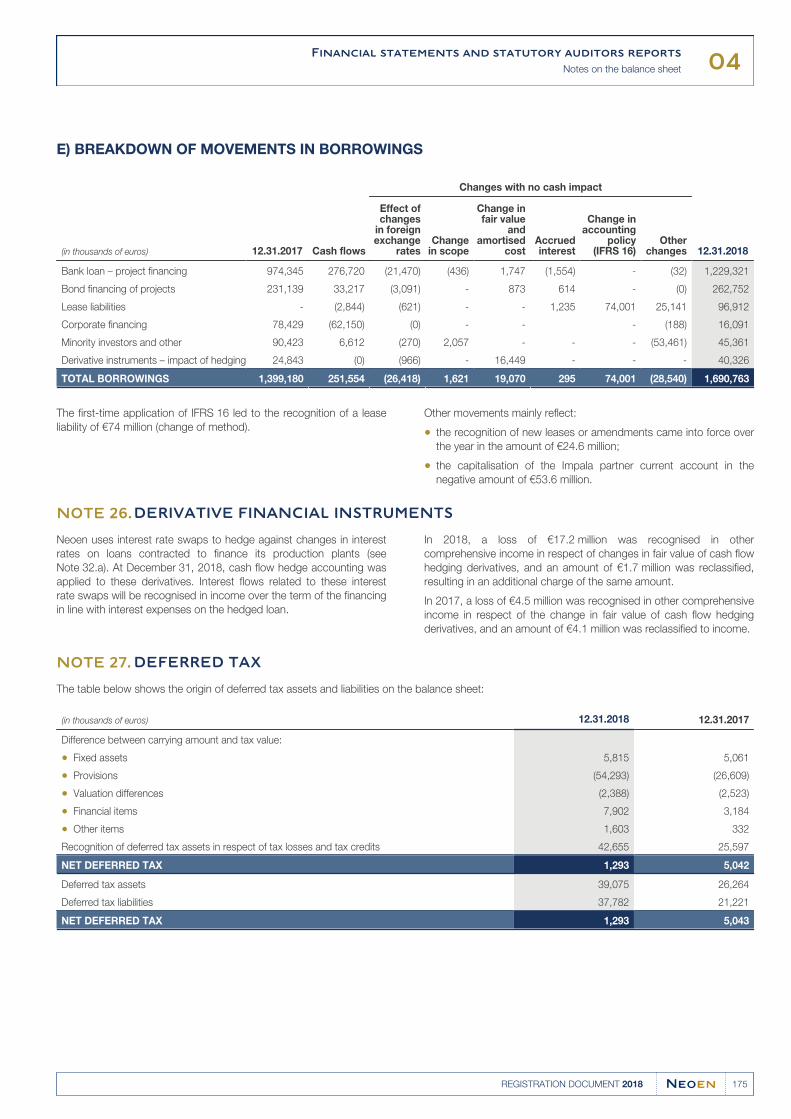
04Financial statements and statutory auditors reports
Notes on the balance sheet
175REGISTRATION DOCUMENT 2018
E) BREAKDOWN OF MOVEMENTS IN BORROWINGS
(in thousands of euros) 12.31.2017 Cash flows
Changes with no cash impact
12.31.2018
Effect ofchanges
in foreignexchange
ratesChange
in scope
Change infair value
andamortised
costAccruedinterest
Change inaccounting
policy(IFRS 16)
Otherchanges
Bank loan – project financing 974,345 276,720 (21,470) (436) 1,747 (1,554) - (32) 1,229,321
Bond financing of projects 231,139 33,217 (3,091) - 873 614 - (0) 262,752
Lease liabilities - (2,844) (621) - - 1,235 74,001 25,141 96,912
Corporate financing 78,429 (62,150) (0) - - - (188) 16,091
Minority investors and other 90,423 6,612 (270) 2,057 - - - (53,461) 45,361
Derivative instruments – impact of hedging 24,843 (0) (966) - 16,449 - - - 40,326
TOTAL BORROWINGS 1,399,180 251,554 (26,418) 1,621 19,070 295 74,001 (28,540) 1,690,763
The first-time application of IFRS 16 led to the recognition of a lease
liability of €74 million (change of method).
Other movements mainly reflect:
the recognition of new leases or amendments came into force over●the year in the amount of €24.6 million;
the capitalisation of the Impala partner current account in the●negative amount of €53.6 million.
DERIVATIVE FINANCIAL INSTRUMENTSNOTE 26.
Neoen uses interest rate swaps to hedge against changes in interest
rates on loans contracted to finance its production plants (see
Note 32.a). At December 31, 2018, cash flow hedge accounting was
applied to these derivatives. Interest flows related to these interest
rate swaps will be recognised in income over the term of the financing
in line with interest expenses on the hedged loan.
In 2018, a loss of €17.2 million was recognised in other
comprehensive income in respect of changes in fair value of cash flow
hedging derivatives, and an amount of €1.7 million was reclassified,
resulting in an additional charge of the same amount.
In 2017, a loss of €4.5 million was recognised in other comprehensive
income in respect of the change in fair value of cash flow hedging
derivatives, and an amount of €4.1 million was reclassified to income.
DEFERRED TAXNOTE 27.
The table below shows the origin of deferred tax assets and liabilities on the balance sheet:
(in thousands of euros) 12.31.2018 12.31.2017
Difference between carrying amount and tax value:
Fixed assets● 5,815 5,061
Provisions● (54,293) (26,609)
Valuation differences● (2,388) (2,523)
Financial items● 7,902 3,184
Other items● 1,603 332
Recognition of deferred tax assets in respect of tax losses and tax credits 42,655 25,597
NET DEFERRED TAX 1,293 5,042
Deferred tax assets 39,075 26,264
Deferred tax liabilities 37,782 21,221
NET DEFERRED TAX 1,293 5,043
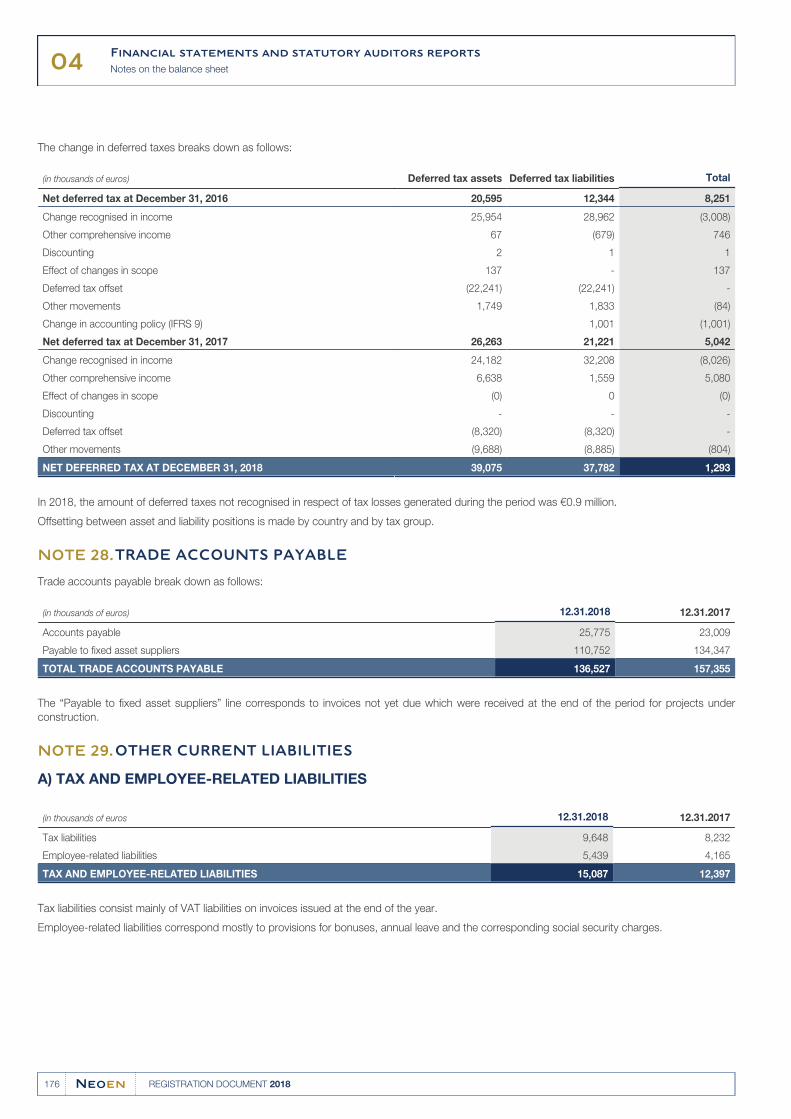
04Financial statements and statutory auditors reports
Notes on the balance sheet
176 REGISTRATION DOCUMENT 2018
The change in deferred taxes breaks down as follows:
(in thousands of euros) Deferred tax assets Deferred tax liabilities Total
Net deferred tax at December 31, 2016 20,595 12,344 8,251
Change recognised in income 25,954 28,962 (3,008)
Other comprehensive income 67 (679) 746
Discounting 2 1 1
Effect of changes in scope 137 - 137
Deferred tax offset (22,241) (22,241) -
Other movements 1,749 1,833 (84)
Change in accounting policy (IFRS 9) 1,001 (1,001)
Net deferred tax at December 31, 2017 26,263 21,221 5,042
Change recognised in income 24,182 32,208 (8,026)
Other comprehensive income 6,638 1,559 5,080
Effect of changes in scope (0) 0 (0)
Discounting - - -
Deferred tax offset (8,320) (8,320) -
Other movements (9,688) (8,885) (804)
NET DEFERRED TAX AT DECEMBER 31, 2018 39,075 37,782 1,293
In 2018, the amount of deferred taxes not recognised in respect of tax losses generated during the period was €0.9 million.
Offsetting between asset and liability positions is made by country and by tax group.
TRADE ACCOUNTS PAYABLENOTE 28.
Trade accounts payable break down as follows:
(in thousands of euros) 12.31.2018 12.31.2017
Accounts payable 25,775 23,009
Payable to fixed asset suppliers 110,752 134,347
TOTAL TRADE ACCOUNTS PAYABLE 136,527 157,355
The “Payable to fixed asset suppliers” line corresponds to invoices not yet due which were received at the end of the period for projects under
construction.
OTHER CURRENT LIABILITIESNOTE 29.
A) TAX AND EMPLOYEE-RELATED LIABILITIES
(in thousands of euros 12.31.2018 12.31.2017
Tax liabilities 9,648 8,232
Employee-related liabilities 5,439 4,165
TAX AND EMPLOYEE-RELATED LIABILITIES 15,087 12,397
Tax liabilities consist mainly of VAT liabilities on invoices issued at the end of the year.
Employee-related liabilities correspond mostly to provisions for bonuses, annual leave and the corresponding social security charges.
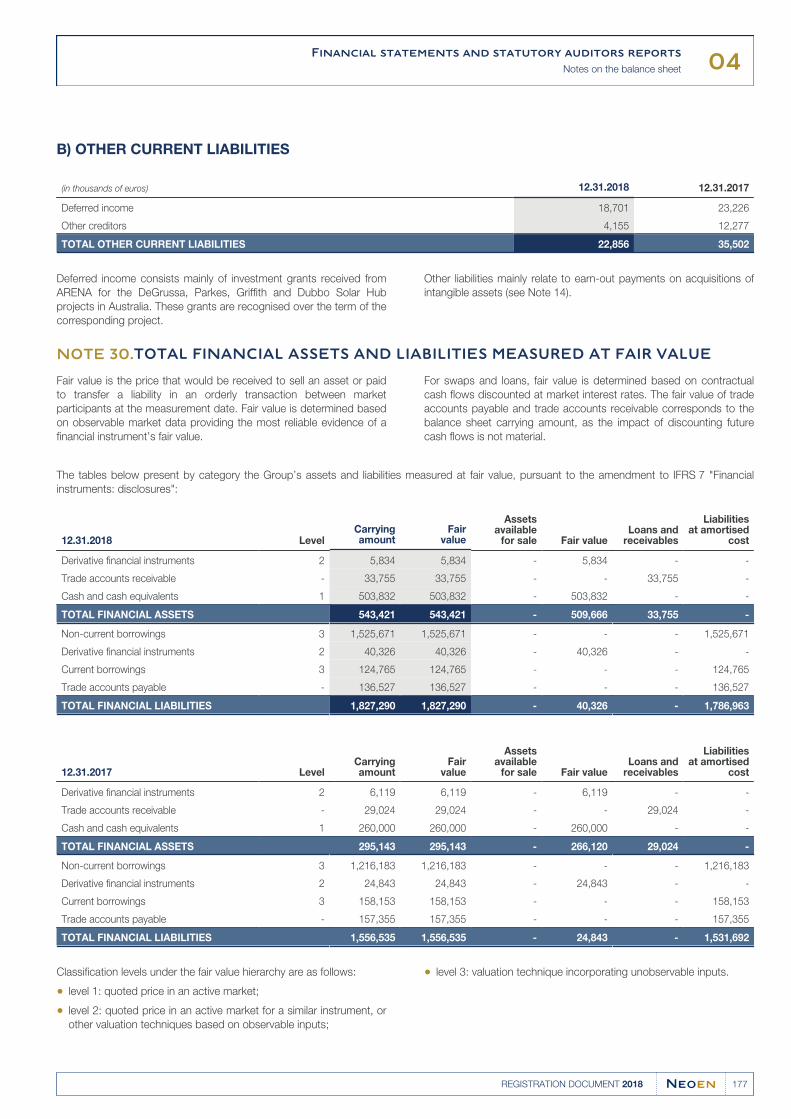
04Financial statements and statutory auditors reports
Notes on the balance sheet
177REGISTRATION DOCUMENT 2018
B) OTHER CURRENT LIABILITIES
(in thousands of euros) 12.31.2018 12.31.2017
Deferred income 18,701 23,226
Other creditors 4,155 12,277
TOTAL OTHER CURRENT LIABILITIES 22,856 35,502
Deferred income consists mainly of investment grants received from
ARENA for the DeGrussa, Parkes, Griffith and Dubbo Solar Hub
projects in Australia. These grants are recognised over the term of the
corresponding project.
Other liabilities mainly relate to earn-out payments on acquisitions of
intangible assets (see Note 14).
TOTAL FINANCIAL ASSETS AND LIABILITIES MEASURED AT FAIR VALUENOTE 30.
Fair value is the price that would be received to sell an asset or paid
to transfer a liability in an orderly transaction between market
participants at the measurement date. Fair value is determined based
on observable market data providing the most reliable evidence of a
financial instrument’s fair value.
For swaps and loans, fair value is determined based on contractual
cash flows discounted at market interest rates. The fair value of trade
accounts payable and trade accounts receivable corresponds to the
balance sheet carrying amount, as the impact of discounting future
cash flows is not material.
The tables below present by category the Group’s assets and liabilities measured at fair value, pursuant to the amendment to IFRS 7 "Financial
instruments: disclosures":
12.31.2018 LevelCarryingamount
Fairvalue
Assetsavailable
for sale Fair valueLoans and
receivables
Liabilitiesat amortised
cost
Derivative financial instruments 2 5,834 5,834 - 5,834 - -
Trade accounts receivable - 33,755 33,755 - - 33,755 -
Cash and cash equivalents 1 503,832 503,832 - 503,832 - -
TOTAL FINANCIAL ASSETS 543,421 543,421 - 509,666 33,755 -
Non-current borrowings 3 1,525,671 1,525,671 - - - 1,525,671
Derivative financial instruments 2 40,326 40,326 - 40,326 - -
Current borrowings 3 124,765 124,765 - - - 124,765
Trade accounts payable - 136,527 136,527 - - - 136,527
TOTAL FINANCIAL LIABILITIES 1,827,290 1,827,290 - 40,326 - 1,786,963
12.31.2017 LevelCarryingamount
Fairvalue
Assetsavailable
for sale Fair valueLoans and
receivables
Liabilitiesat amortised
cost
Derivative financial instruments 2 6,119 6,119 - 6,119 - -
Trade accounts receivable - 29,024 29,024 - - 29,024 -
Cash and cash equivalents 1 260,000 260,000 - 260,000 - -
TOTAL FINANCIAL ASSETS 295,143 295,143 - 266,120 29,024 -
Non-current borrowings 3 1,216,183 1,216,183 - - - 1,216,183
Derivative financial instruments 2 24,843 24,843 - 24,843 - -
Current borrowings 3 158,153 158,153 - - - 158,153
Trade accounts payable - 157,355 157,355 - - - 157,355
TOTAL FINANCIAL LIABILITIES 1,556,535 1,556,535 - 24,843 - 1,531,692
Classification levels under the fair value hierarchy are as follows:
level 1: quoted price in an active market;●
level 2: quoted price in an active market for a similar instrument, or●other valuation techniques based on observable inputs;
level 3: valuation technique incorporating unobservable inputs.●
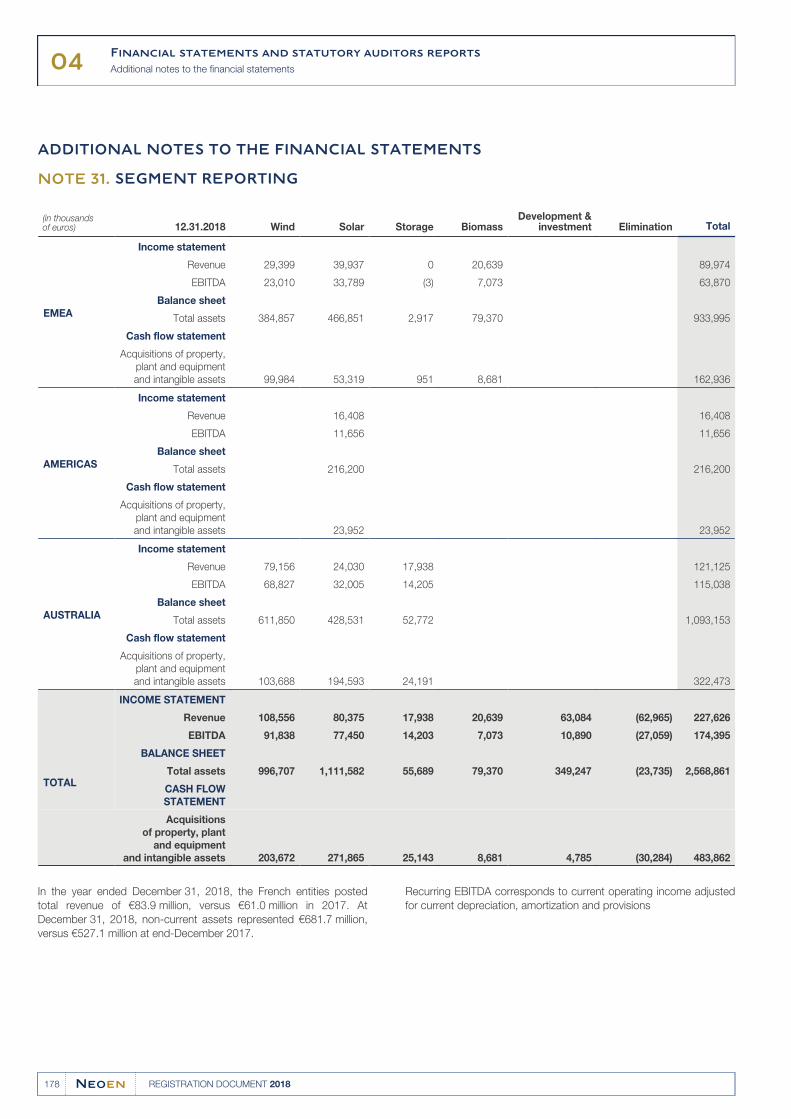
04Financial statements and statutory auditors reports
Additional notes to the financial statements
178 REGISTRATION DOCUMENT 2018
ADDITIONAL NOTES TO THE FINANCIAL STATEMENTS
SEGMENT REPORTINGNOTE 31.
(in thousands of euros) 12.31.2018 Wind Solar Storage Biomass
Development &investment Elimination Total
EMEA
Income statement
Revenue 29,399 39,937 0 20,639 89,974
EBITDA 23,010 33,789 (3) 7,073 63,870
Balance sheet
Total assets 384,857 466,851 2,917 79,370 933,995
Cash flow statement
Acquisitions of property,
plant and equipment
and intangible assets 99,984 53,319 951 8,681 162,936
AMERICAS
Income statement
Revenue 16,408 16,408
EBITDA 11,656 11,656
Balance sheet
Total assets 216,200 216,200
Cash flow statement
Acquisitions of property,
plant and equipment
and intangible assets 23,952 23,952
AUSTRALIA
Income statement
Revenue 79,156 24,030 17,938 121,125
EBITDA 68,827 32,005 14,205 115,038
Balance sheet
Total assets 611,850 428,531 52,772 1,093,153
Cash flow statement
Acquisitions of property,
plant and equipment
and intangible assets 103,688 194,593 24,191 322,473
TOTAL
INCOME STATEMENT
Revenue 108,556 80,375 17,938 20,639 63,084 (62,965) 227,626
EBITDA 91,838 77,450 14,203 7,073 10,890 (27,059) 174,395
BALANCE SHEET
Total assets 996,707 1,111,582 55,689 79,370 349,247 (23,735) 2,568,861
CASH FLOW
STATEMENT
Acquisitions
of property, plant
and equipment
and intangible assets 203,672 271,865 25,143 8,681 4,785 (30,284) 483,862
In the year ended December 31, 2018, the French entities posted
total revenue of €83.9 million, versus €61.0 million in 2017. At
December 31, 2018, non-current assets represented €681.7 million,
versus €527.1 million at end-December 2017.
Recurring EBITDA corresponds to current operating income adjusted
for current depreciation, amortization and provisions
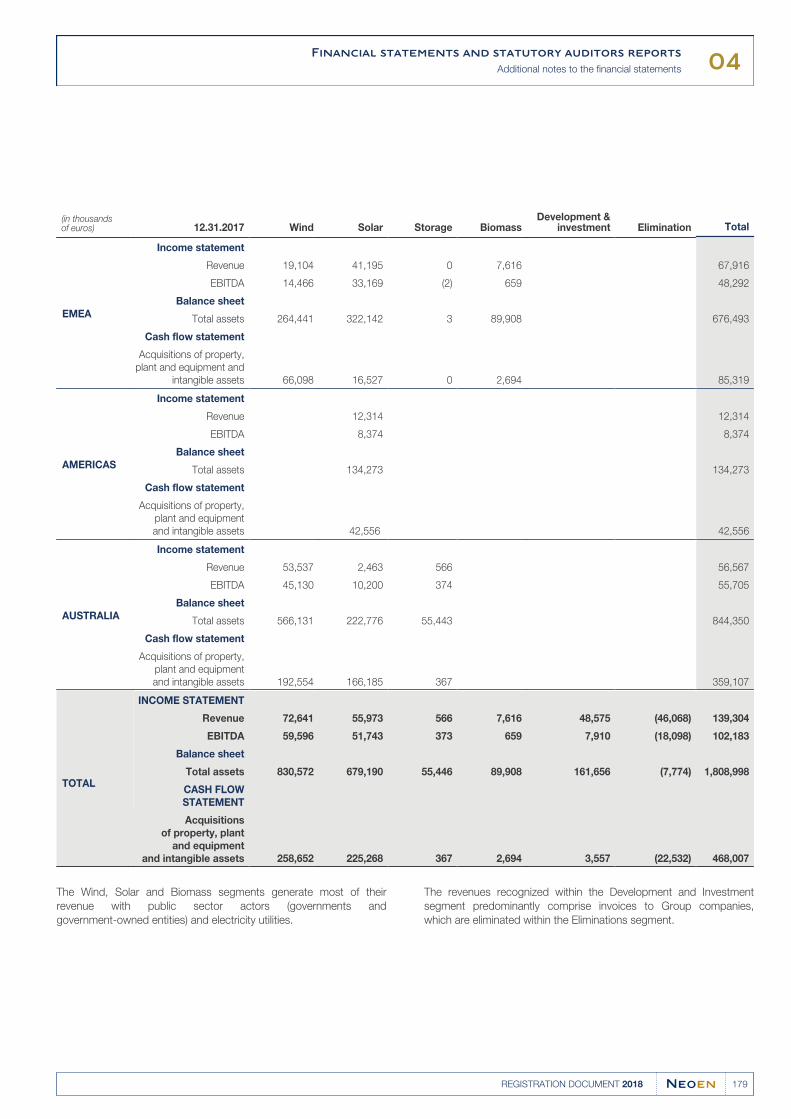
04Financial statements and statutory auditors reports
Additional notes to the financial statements
179REGISTRATION DOCUMENT 2018
(in thousands of euros) 12.31.2017 Wind Solar Storage Biomass
Development &investment Elimination Total
EMEA
Income statement
Revenue 19,104 41,195 0 7,616 67,916
EBITDA 14,466 33,169 (2) 659 48,292
Balance sheet
Total assets 264,441 322,142 3 89,908 676,493
Cash flow statement
Acquisitions of property,
plant and equipment and
intangible assets 66,098 16,527 0 2,694 85,319
AMERICAS
Income statement
Revenue 12,314 12,314
EBITDA 8,374 8,374
Balance sheet
Total assets 134,273 134,273
Cash flow statement
Acquisitions of property,
plant and equipment
and intangible assets 42,556 42,556
AUSTRALIA
Income statement
Revenue 53,537 2,463 566 56,567
EBITDA 45,130 10,200 374 55,705
Balance sheet
Total assets 566,131 222,776 55,443 844,350
Cash flow statement
Acquisitions of property,
plant and equipment
and intangible assets 192,554 166,185 367 359,107
TOTAL
INCOME STATEMENT
Revenue 72,641 55,973 566 7,616 48,575 (46,068) 139,304
EBITDA 59,596 51,743 373 659 7,910 (18,098) 102,183
Balance sheet
Total assets 830,572 679,190 55,446 89,908 161,656 (7,774) 1,808,998
CASH FLOW
STATEMENT
Acquisitions
of property, plant
and equipment
and intangible assets 258,652 225,268 367 2,694 3,557 (22,532) 468,007
The Wind, Solar and Biomass segments generate most of their
revenue with public sector actors (governments and
government-owned entities) and electricity utilities.
The revenues recognized within the Development and Investment
segment predominantly comprise invoices to Group companies,
which are eliminated within the Eliminations segment.
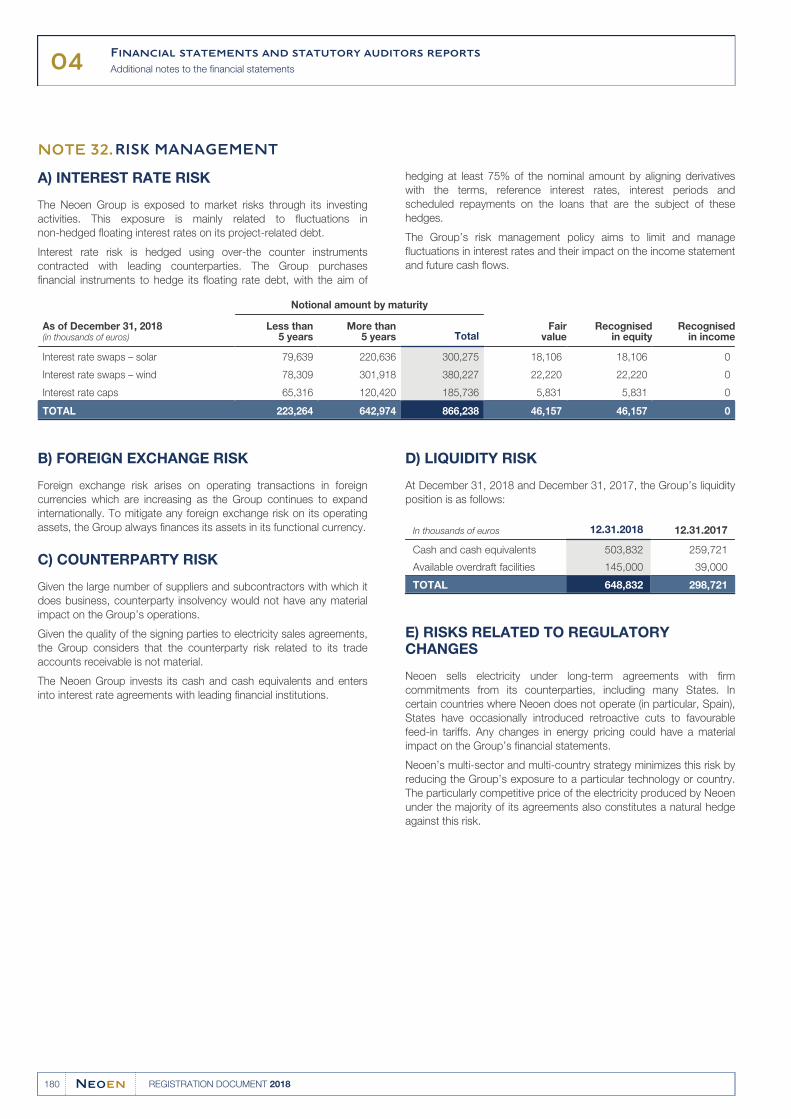
04Financial statements and statutory auditors reports
Additional notes to the financial statements
180 REGISTRATION DOCUMENT 2018
RISK MANAGEMENTNOTE 32.
A) INTEREST RATE RISK
The Neoen Group is exposed to market risks through its investing
activities. This exposure is mainly related to fluctuations in
non-hedged floating interest rates on its project-related debt.
hedging at least 75% of the nominal amount by aligning derivatives
with the terms, reference interest rates, interest periods and
scheduled repayments on the loans that are the subject of these
hedges.
Interest rate risk is hedged using over-the counter instruments
contracted with leading counterparties. The Group purchases
financial instruments to hedge its floating rate debt, with the aim of
The Group’s risk management policy aims to limit and manage
fluctuations in interest rates and their impact on the income statement
and future cash flows.
As of December 31, 2018(in thousands of euros)
Notional amount by maturity
Fairvalue
Recognisedin equity
Recognisedin income
Less than5 years
More than5 years Total
Interest rate swaps – solar 79,639 220,636 300,275 18,106 18,106 0
Interest rate swaps – wind 78,309 301,918 380,227 22,220 22,220 0
Interest rate caps 65,316 120,420 185,736 5,831 5,831 0
TOTAL 223,264 642,974 866,238 46,157 46,157 0
B) FOREIGN EXCHANGE RISK
Foreign exchange risk arises on operating transactions in foreign
currencies which are increasing as the Group continues to expand
internationally. To mitigate any foreign exchange risk on its operating
assets, the Group always finances its assets in its functional currency.
C) COUNTERPARTY RISK
Given the large number of suppliers and subcontractors with which it
does business, counterparty insolvency would not have any material
impact on the Group’s operations.
Given the quality of the signing parties to electricity sales agreements,
the Group considers that the counterparty risk related to its trade
accounts receivable is not material.
The Neoen Group invests its cash and cash equivalents and enters
into interest rate agreements with leading financial institutions.
D) LIQUIDITY RISK
At December 31, 2018 and December 31, 2017, the Group’s liquidity
position is as follows:
In thousands of euros 12.31.2018 12.31.2017
Cash and cash equivalents 503,832 259,721
Available overdraft facilities 145,000 39,000
TOTAL 648,832 298,721
E) RISKS RELATED TO REGULATORY CHANGES
Neoen sells electricity under long-term agreements with firm
commitments from its counterparties, including many States. In
certain countries where Neoen does not operate (in particular, Spain),
States have occasionally introduced retroactive cuts to favourable
feed-in tariffs. Any changes in energy pricing could have a material
impact on the Group’s financial statements.
Neoen’s multi-sector and multi-country strategy minimizes this risk by
reducing the Group’s exposure to a particular technology or country.
The particularly competitive price of the electricity produced by Neoen
under the majority of its agreements also constitutes a natural hedge
against this risk.
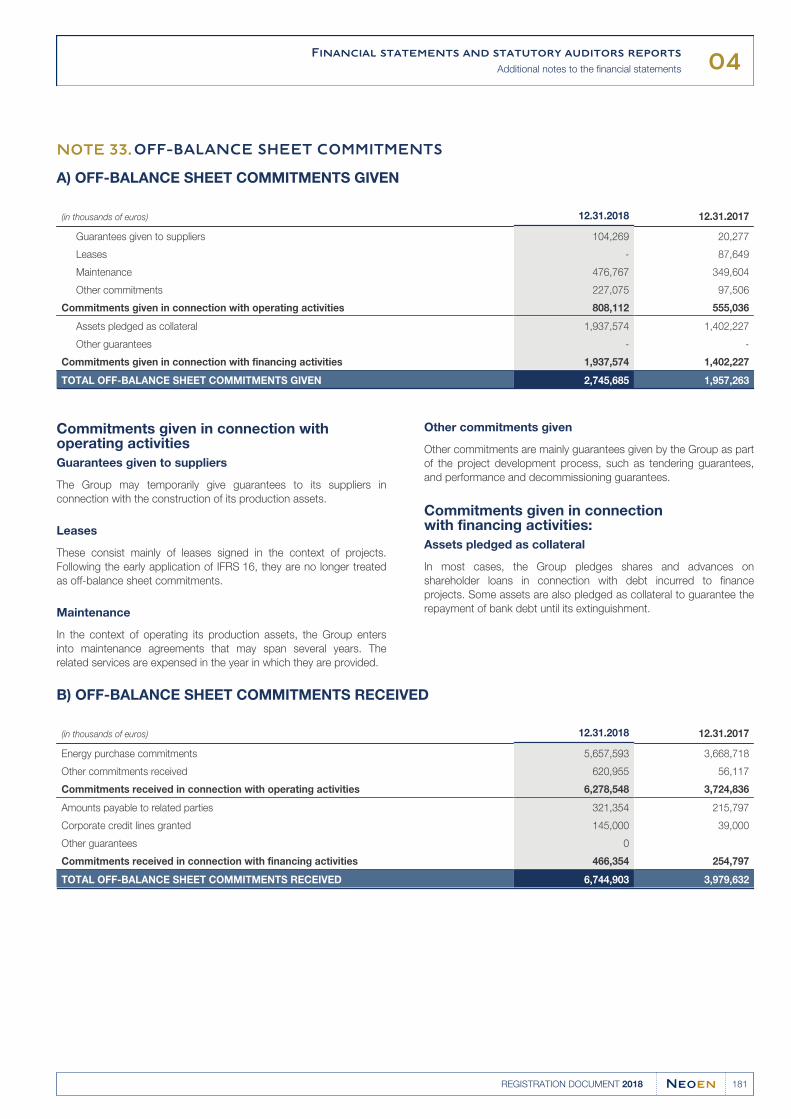
04Financial statements and statutory auditors reports
Additional notes to the financial statements
181REGISTRATION DOCUMENT 2018
OFF-BALANCE SHEET COMMITMENTSNOTE 33.
A) OFF-BALANCE SHEET COMMITMENTS GIVEN
(in thousands of euros) 12.31.2018 12.31.2017
Guarantees given to suppliers 104,269 20,277
Leases - 87,649
Maintenance 476,767 349,604
Other commitments 227,075 97,506
Commitments given in connection with operating activities 808,112 555,036
Assets pledged as collateral 1,937,574 1,402,227
Other guarantees - -
Commitments given in connection with financing activities 1,937,574 1,402,227
TOTAL OFF-BALANCE SHEET COMMITMENTS GIVEN 2,745,685 1,957,263
Commitments given in connection with operating activities
Guarantees given to suppliers
The Group may temporarily give guarantees to its suppliers in
connection with the construction of its production assets.
Leases
These consist mainly of leases signed in the context of projects.
Following the early application of IFRS 16, they are no longer treated
as off-balance sheet commitments.
Maintenance
In the context of operating its production assets, the Group enters
into maintenance agreements that may span several years. The
related services are expensed in the year in which they are provided.
Other commitments given
Other commitments are mainly guarantees given by the Group as part
of the project development process, such as tendering guarantees,
and performance and decommissioning guarantees.
Commitments given in connection with financing activities:
Assets pledged as collateral
In most cases, the Group pledges shares and advances on
shareholder loans in connection with debt incurred to finance
projects. Some assets are also pledged as collateral to guarantee the
repayment of bank debt until its extinguishment.
B) OFF-BALANCE SHEET COMMITMENTS RECEIVED
(in thousands of euros) 12.31.2018 12.31.2017
Energy purchase commitments 5,657,593 3,668,718
Other commitments received 620,955 56,117
Commitments received in connection with operating activities 6,278,548 3,724,836
Amounts payable to related parties 321,354 215,797
Corporate credit lines granted 145,000 39,000
Other guarantees 0
Commitments received in connection with financing activities 466,354 254,797
TOTAL OFF-BALANCE SHEET COMMITMENTS RECEIVED 6,744,903 3,979,632
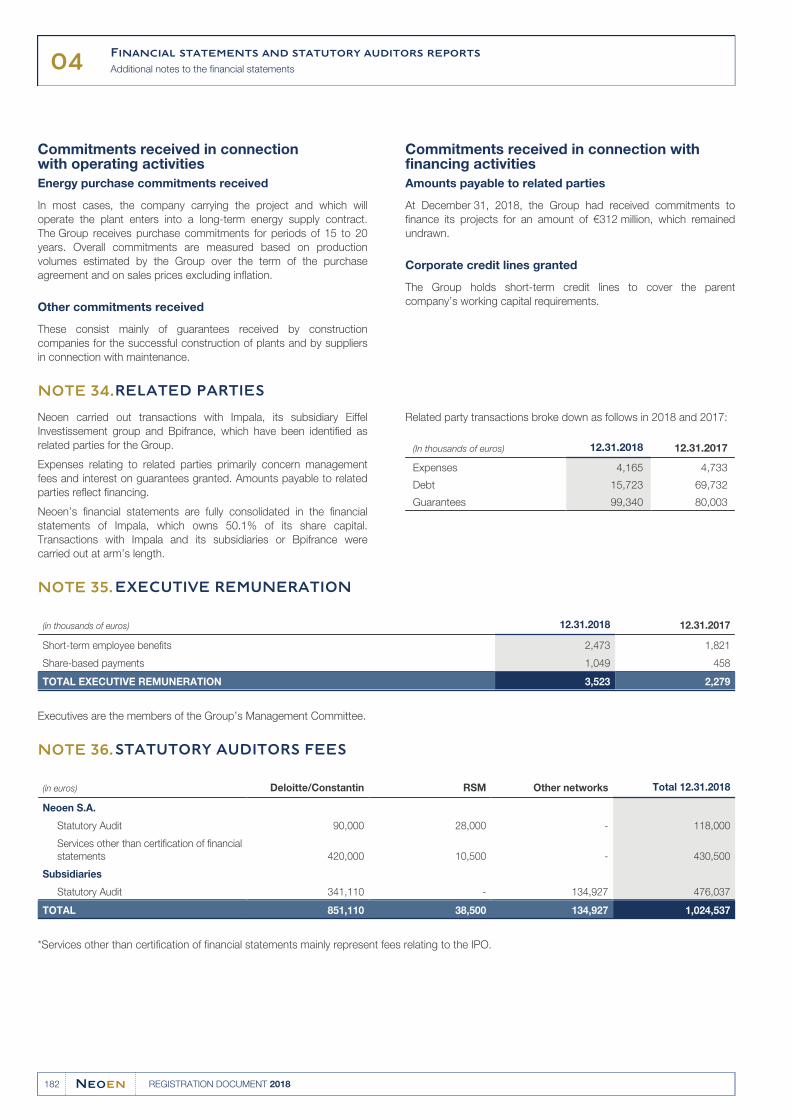
04Financial statements and statutory auditors reports
Additional notes to the financial statements
182 REGISTRATION DOCUMENT 2018
Commitments received in connection with operating activities
Energy purchase commitments received
In most cases, the company carrying the project and which will
operate the plant enters into a long-term energy supply contract.
The Group receives purchase commitments for periods of 15 to 20
years. Overall commitments are measured based on production
volumes estimated by the Group over the term of the purchase
agreement and on sales prices excluding inflation.
Other commitments received
These consist mainly of guarantees received by construction
companies for the successful construction of plants and by suppliers
in connection with maintenance.
Commitments received in connection with financing activities
Amounts payable to related parties
At December 31, 2018, the Group had received commitments to
finance its projects for an amount of €312 million, which remained
undrawn.
Corporate credit lines granted
The Group holds short-term credit lines to cover the parent
company’s working capital requirements.
RELATED PARTIESNOTE 34.
Neoen carried out transactions with Impala, its subsidiary Eiffel
Investissement group and Bpifrance, which have been identified as
related parties for the Group.
Expenses relating to related parties primarily concern management
fees and interest on guarantees granted. Amounts payable to related
parties reflect financing.
Neoen’s financial statements are fully consolidated in the financial
statements of Impala, which owns 50.1% of its share capital.
Transactions with Impala and its subsidiaries or Bpifrance were
carried out at arm’s length.
Related party transactions broke down as follows in 2018 and 2017:
(In thousands of euros) 12.31.2018 12.31.2017
Expenses 4,165 4,733
Debt 15,723 69,732
Guarantees 99,340 80,003
EXECUTIVE REMUNERATIONNOTE 35.
(in thousands of euros) 12.31.2018 12.31.2017
Short-term employee benefits 2,473 1,821
Share-based payments 1,049 458
TOTAL EXECUTIVE REMUNERATION 3,523 2,279
Executives are the members of the Group’s Management Committee.
STATUTORY AUDITORS FEESNOTE 36.
(in euros) Deloitte/Constantin RSM Other networks Total 12.31.2018
Neoen S.A.
Statutory Audit 90,000 28,000 - 118,000
Services other than certification of financial
statements 420,000 10,500 - 430,500
Subsidiaries
Statutory Audit 341,110 - 134,927 476,037
TOTAL 851,110 38,500 134,927 1,024,537
*Services other than certification of financial statements mainly represent fees relating to the IPO.
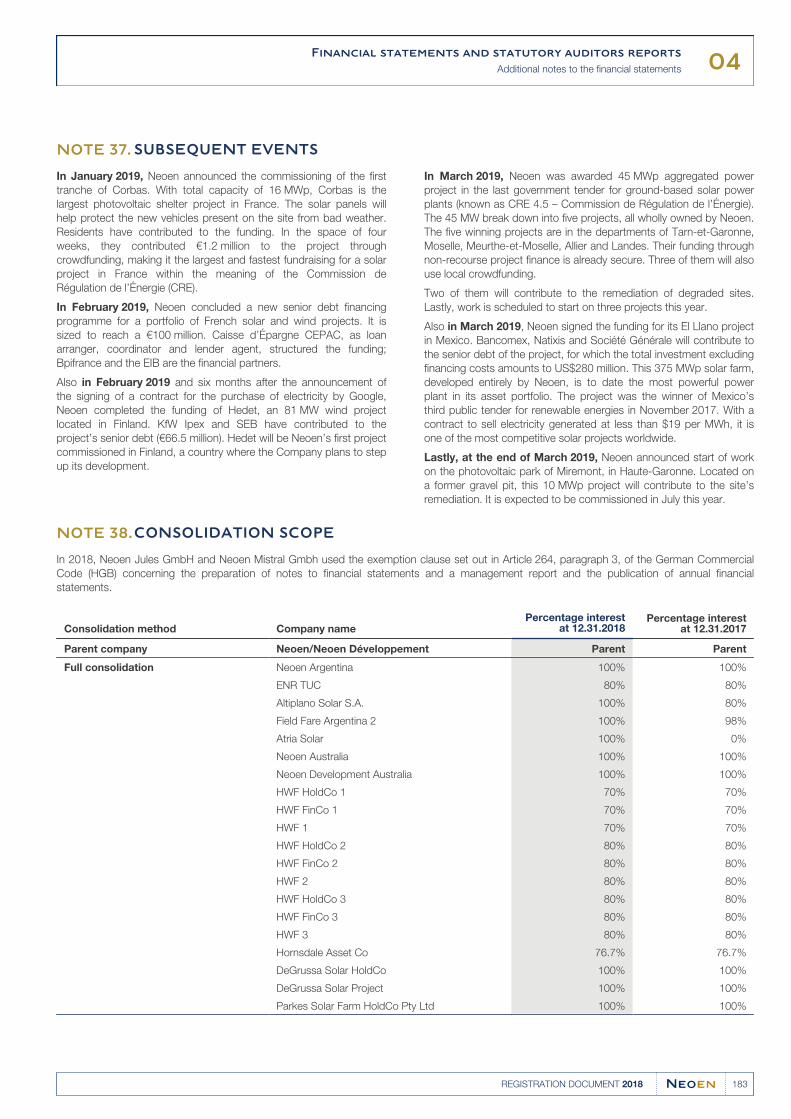
04Financial statements and statutory auditors reports
Additional notes to the financial statements
183REGISTRATION DOCUMENT 2018
SUBSEQUENT EVENTSNOTE 37.
In January 2019, Neoen announced the commissioning of the first
tranche of Corbas. With total capacity of 16 MWp, Corbas is the
largest photovoltaic shelter project in France. The solar panels will
help protect the new vehicles present on the site from bad weather.
Residents have contributed to the funding. In the space of four
weeks, they contributed €1.2 million to the project through
crowdfunding, making it the largest and fastest fundraising for a solar
project in France within the meaning of the Commission de
Régulation de l’Énergie (CRE).
In February 2019, Neoen concluded a new senior debt financing
programme for a portfolio of French solar and wind projects. It is
sized to reach a €100 million. Caisse d’Épargne CEPAC, as loan
arranger, coordinator and lender agent, structured the funding;
Bpifrance and the EIB are the financial partners.
Also in February 2019 and six months after the announcement of
the signing of a contract for the purchase of electricity by Google,
Neoen completed the funding of Hedet, an 81 MW wind project
located in Finland. KfW Ipex and SEB have contributed to the
project’s senior debt (€66.5 million). Hedet will be Neoen’s first project
commissioned in Finland, a country where the Company plans to step
up its development.
In March 2019, Neoen was awarded 45 MWp aggregated power
project in the last government tender for ground-based solar power
plants (known as CRE 4.5 – Commission de Régulation de l’Énergie).
The 45 MW break down into five projects, all wholly owned by Neoen.
The five winning projects are in the departments of Tarn-et-Garonne,
Moselle, Meurthe-et-Moselle, Allier and Landes. Their funding through
non-recourse project finance is already secure. Three of them will also
use local crowdfunding.
Two of them will contribute to the remediation of degraded sites.
Lastly, work is scheduled to start on three projects this year.
Also in March 2019, Neoen signed the funding for its El Llano project
in Mexico. Bancomex, Natixis and Société Générale will contribute to
the senior debt of the project, for which the total investment excluding
financing costs amounts to US$280 million. This 375 MWp solar farm,
developed entirely by Neoen, is to date the most powerful power
plant in its asset portfolio. The project was the winner of Mexico’s
third public tender for renewable energies in November 2017. With a
contract to sell electricity generated at less than $19 per MWh, it is
one of the most competitive solar projects worldwide.
Lastly, at the end of March 2019, Neoen announced start of work
on the photovoltaic park of Miremont, in Haute-Garonne. Located on
a former gravel pit, this 10 MWp project will contribute to the site’s
remediation. It is expected to be commissioned in July this year.
CONSOLIDATION SCOPENOTE 38.
In 2018, Neoen Jules GmbH and Neoen Mistral Gmbh used the exemption clause set out in Article 264, paragraph 3, of the German Commercial
Code (HGB) concerning the preparation of notes to financial statements and a management report and the publication of annual financial
statements.
Consolidation method Company namePercentage interest
at 12.31.2018Percentage interest
at 12.31.2017
Parent company Neoen/Neoen Développement Parent Parent
Full consolidation Neoen Argentina 100% 100%
ENR TUC 80% 80%
Altiplano Solar S.A. 100% 80%
Field Fare Argentina 2 100% 98%
Atria Solar 100% 0%
Neoen Australia 100% 100%
Neoen Development Australia 100% 100%
HWF HoldCo 1 70% 70%
HWF FinCo 1 70% 70%
HWF 1 70% 70%
HWF HoldCo 2 80% 80%
HWF FinCo 2 80% 80%
HWF 2 80% 80%
HWF HoldCo 3 80% 80%
HWF FinCo 3 80% 80%
HWF 3 80% 80%
Hornsdale Asset Co 76.7% 76.7%
DeGrussa Solar HoldCo 100% 100%
DeGrussa Solar Project 100% 100%
Parkes Solar Farm HoldCo Pty Ltd 100% 100%
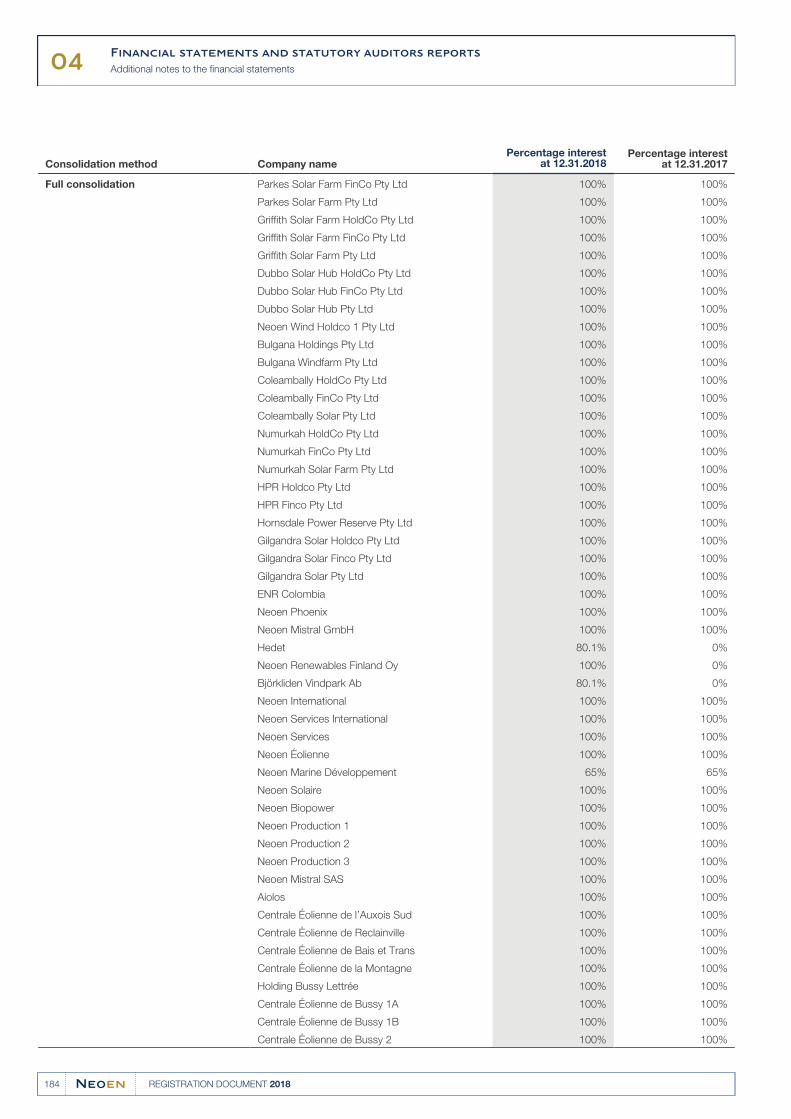
04Financial statements and statutory auditors reports
Additional notes to the financial statements
184 REGISTRATION DOCUMENT 2018
Consolidation method Company namePercentage interest
at 12.31.2018Percentage interest
at 12.31.2017
Full consolidation Parkes Solar Farm FinCo Pty Ltd 100% 100%
Parkes Solar Farm Pty Ltd 100% 100%
Griffith Solar Farm HoldCo Pty Ltd 100% 100%
Griffith Solar Farm FinCo Pty Ltd 100% 100%
Griffith Solar Farm Pty Ltd 100% 100%
Dubbo Solar Hub HoldCo Pty Ltd 100% 100%
Dubbo Solar Hub FinCo Pty Ltd 100% 100%
Dubbo Solar Hub Pty Ltd 100% 100%
Neoen Wind Holdco 1 Pty Ltd 100% 100%
Bulgana Holdings Pty Ltd 100% 100%
Bulgana Windfarm Pty Ltd 100% 100%
Coleambally HoldCo Pty Ltd 100% 100%
Coleambally FinCo Pty Ltd 100% 100%
Coleambally Solar Pty Ltd 100% 100%
Numurkah HoldCo Pty Ltd 100% 100%
Numurkah FinCo Pty Ltd 100% 100%
Numurkah Solar Farm Pty Ltd 100% 100%
HPR Holdco Pty Ltd 100% 100%
HPR Finco Pty Ltd 100% 100%
Hornsdale Power Reserve Pty Ltd 100% 100%
Gilgandra Solar Holdco Pty Ltd 100% 100%
Gilgandra Solar Finco Pty Ltd 100% 100%
Gilgandra Solar Pty Ltd 100% 100%
ENR Colombia 100% 100%
Neoen Phoenix 100% 100%
Neoen Mistral GmbH 100% 100%
Hedet 80.1% 0%
Neoen Renewables Finland Oy 100% 0%
Björkliden Vindpark Ab 80.1% 0%
Neoen International 100% 100%
Neoen Services International 100% 100%
Neoen Services 100% 100%
Neoen Éolienne 100% 100%
Neoen Marine Développement 65% 65%
Neoen Solaire 100% 100%
Neoen Biopower 100% 100%
Neoen Production 1 100% 100%
Neoen Production 2 100% 100%
Neoen Production 3 100% 100%
Neoen Mistral SAS 100% 100%
Aiolos 100% 100%
Centrale Éolienne de l’Auxois Sud 100% 100%
Centrale Éolienne de Reclainville 100% 100%
Centrale Éolienne de Bais et Trans 100% 100%
Centrale Éolienne de la Montagne 100% 100%
Holding Bussy Lettrée 100% 100%
Centrale Éolienne de Bussy 1A 100% 100%
Centrale Éolienne de Bussy 1B 100% 100%
Centrale Éolienne de Bussy 2 100% 100%
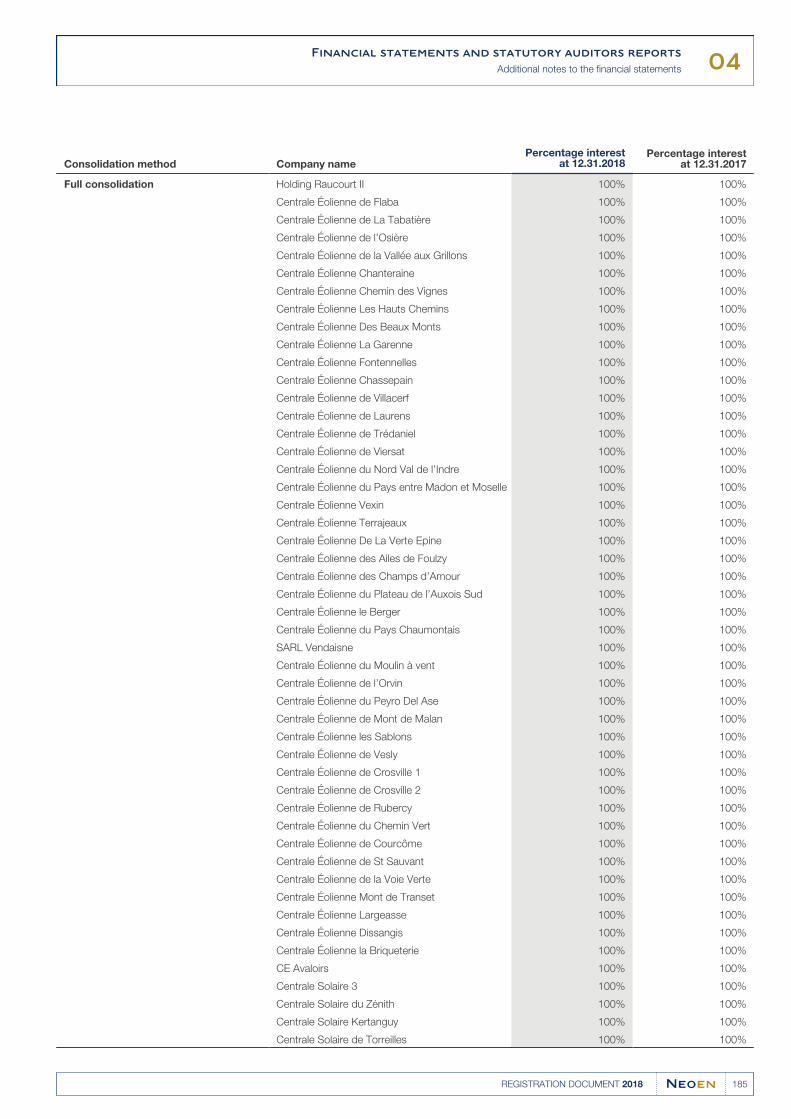
04Financial statements and statutory auditors reports
Additional notes to the financial statements
185REGISTRATION DOCUMENT 2018
Consolidation method Company namePercentage interest
at 12.31.2018Percentage interest
at 12.31.2017
Full consolidation Holding Raucourt II 100% 100%
Centrale Éolienne de Flaba 100% 100%
Centrale Éolienne de La Tabatière 100% 100%
Centrale Éolienne de l’Osière 100% 100%
Centrale Éolienne de la Vallée aux Grillons 100% 100%
Centrale Éolienne Chanteraine 100% 100%
Centrale Éolienne Chemin des Vignes 100% 100%
Centrale Éolienne Les Hauts Chemins 100% 100%
Centrale Éolienne Des Beaux Monts 100% 100%
Centrale Éolienne La Garenne 100% 100%
Centrale Éolienne Fontennelles 100% 100%
Centrale Éolienne Chassepain 100% 100%
Centrale Éolienne de Villacerf 100% 100%
Centrale Éolienne de Laurens 100% 100%
Centrale Éolienne de Trédaniel 100% 100%
Centrale Éolienne de Viersat 100% 100%
Centrale Éolienne du Nord Val de l’Indre 100% 100%
Centrale Éolienne du Pays entre Madon et Moselle 100% 100%
Centrale Éolienne Vexin 100% 100%
Centrale Éolienne Terrajeaux 100% 100%
Centrale Éolienne De La Verte Epine 100% 100%
Centrale Éolienne des Ailes de Foulzy 100% 100%
Centrale Éolienne des Champs d’Amour 100% 100%
Centrale Éolienne du Plateau de l’Auxois Sud 100% 100%
Centrale Éolienne le Berger 100% 100%
Centrale Éolienne du Pays Chaumontais 100% 100%
SARL Vendaisne 100% 100%
Centrale Éolienne du Moulin à vent 100% 100%
Centrale Éolienne de l’Orvin 100% 100%
Centrale Éolienne du Peyro Del Ase 100% 100%
Centrale Éolienne de Mont de Malan 100% 100%
Centrale Éolienne les Sablons 100% 100%
Centrale Éolienne de Vesly 100% 100%
Centrale Éolienne de Crosville 1 100% 100%
Centrale Éolienne de Crosville 2 100% 100%
Centrale Éolienne de Rubercy 100% 100%
Centrale Éolienne du Chemin Vert 100% 100%
Centrale Éolienne de Courcôme 100% 100%
Centrale Éolienne de St Sauvant 100% 100%
Centrale Éolienne de la Voie Verte 100% 100%
Centrale Éolienne Mont de Transet 100% 100%
Centrale Éolienne Largeasse 100% 100%
Centrale Éolienne Dissangis 100% 100%
Centrale Éolienne la Briqueterie 100% 100%
CE Avaloirs 100% 100%
Centrale Solaire 3 100% 100%
Centrale Solaire du Zénith 100% 100%
Centrale Solaire Kertanguy 100% 100%
Centrale Solaire de Torreilles 100% 100%
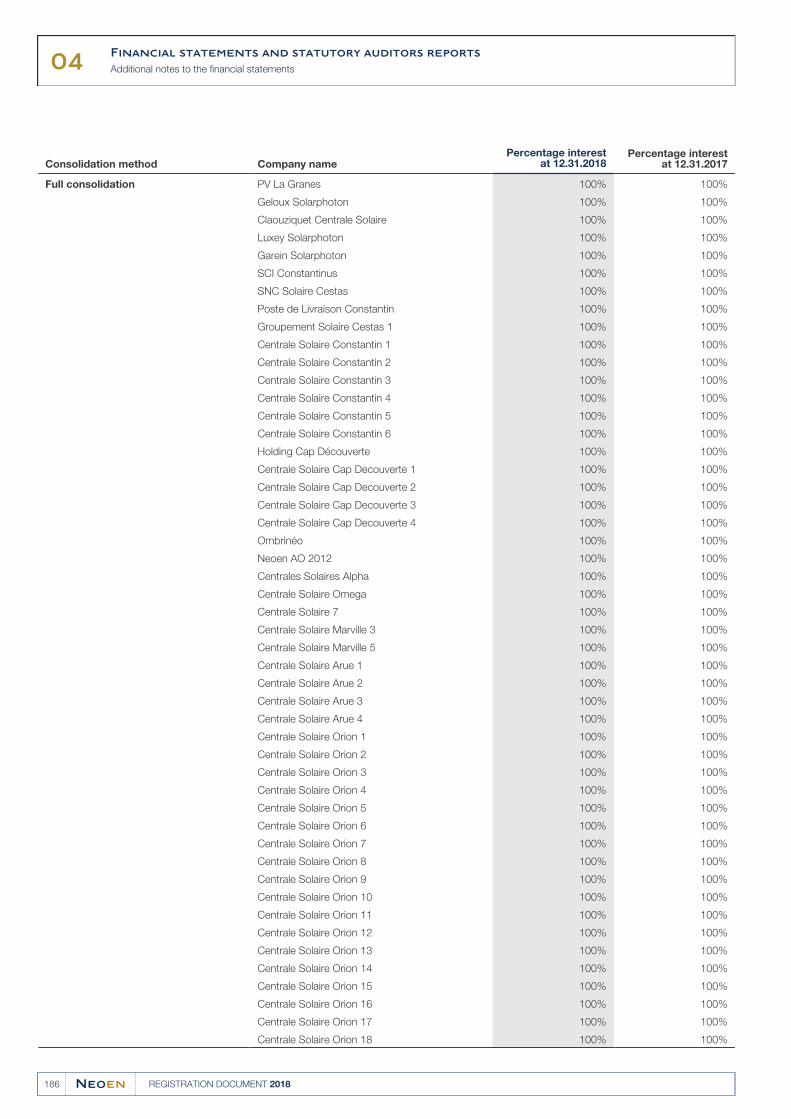
04Financial statements and statutory auditors reports
Additional notes to the financial statements
186 REGISTRATION DOCUMENT 2018
Consolidation method Company namePercentage interest
at 12.31.2018Percentage interest
at 12.31.2017
Full consolidation PV La Granes 100% 100%
Geloux Solarphoton 100% 100%
Claouziquet Centrale Solaire 100% 100%
Luxey Solarphoton 100% 100%
Garein Solarphoton 100% 100%
SCI Constantinus 100% 100%
SNC Solaire Cestas 100% 100%
Poste de Livraison Constantin 100% 100%
Groupement Solaire Cestas 1 100% 100%
Centrale Solaire Constantin 1 100% 100%
Centrale Solaire Constantin 2 100% 100%
Centrale Solaire Constantin 3 100% 100%
Centrale Solaire Constantin 4 100% 100%
Centrale Solaire Constantin 5 100% 100%
Centrale Solaire Constantin 6 100% 100%
Holding Cap Découverte 100% 100%
Centrale Solaire Cap Decouverte 1 100% 100%
Centrale Solaire Cap Decouverte 2 100% 100%
Centrale Solaire Cap Decouverte 3 100% 100%
Centrale Solaire Cap Decouverte 4 100% 100%
Ombrinéo 100% 100%
Neoen AO 2012 100% 100%
Centrales Solaires Alpha 100% 100%
Centrale Solaire Omega 100% 100%
Centrale Solaire 7 100% 100%
Centrale Solaire Marville 3 100% 100%
Centrale Solaire Marville 5 100% 100%
Centrale Solaire Arue 1 100% 100%
Centrale Solaire Arue 2 100% 100%
Centrale Solaire Arue 3 100% 100%
Centrale Solaire Arue 4 100% 100%
Centrale Solaire Orion 1 100% 100%
Centrale Solaire Orion 2 100% 100%
Centrale Solaire Orion 3 100% 100%
Centrale Solaire Orion 4 100% 100%
Centrale Solaire Orion 5 100% 100%
Centrale Solaire Orion 6 100% 100%
Centrale Solaire Orion 7 100% 100%
Centrale Solaire Orion 8 100% 100%
Centrale Solaire Orion 9 100% 100%
Centrale Solaire Orion 10 100% 100%
Centrale Solaire Orion 11 100% 100%
Centrale Solaire Orion 12 100% 100%
Centrale Solaire Orion 13 100% 100%
Centrale Solaire Orion 14 100% 100%
Centrale Solaire Orion 15 100% 100%
Centrale Solaire Orion 16 100% 100%
Centrale Solaire Orion 17 100% 100%
Centrale Solaire Orion 18 100% 100%
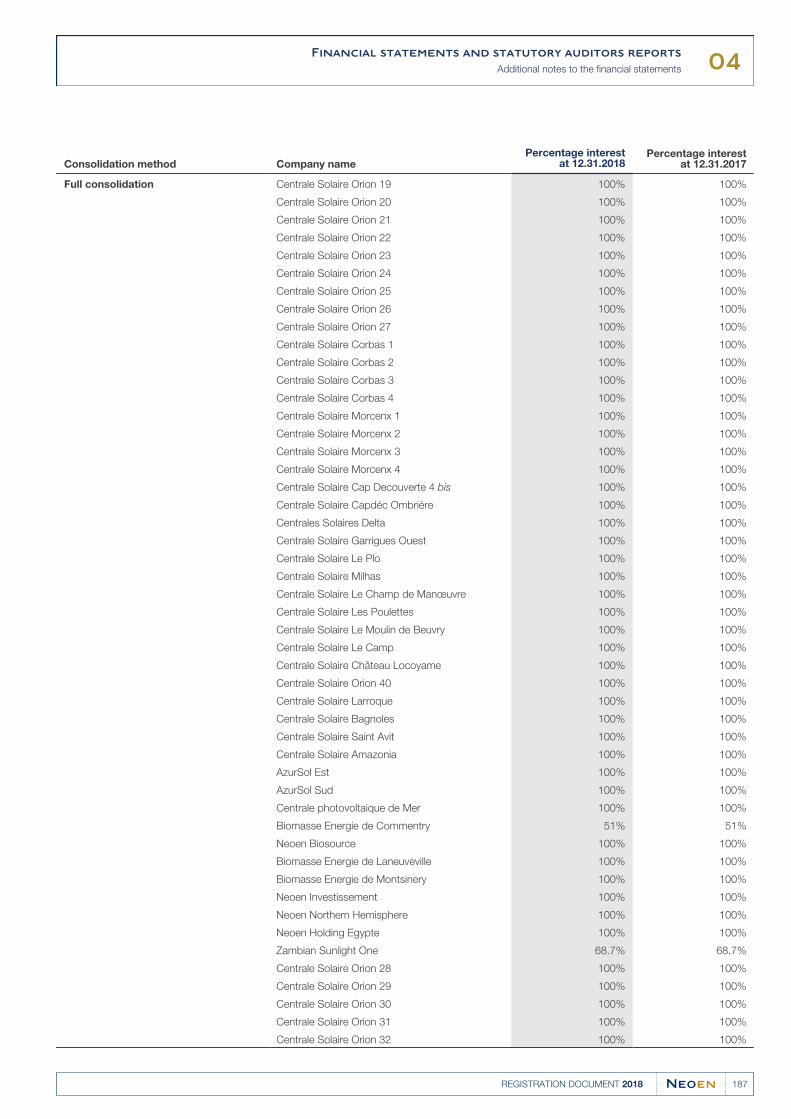
04Financial statements and statutory auditors reports
Additional notes to the financial statements
187REGISTRATION DOCUMENT 2018
Consolidation method Company namePercentage interest
at 12.31.2018Percentage interest
at 12.31.2017
Full consolidation Centrale Solaire Orion 19 100% 100%
Centrale Solaire Orion 20 100% 100%
Centrale Solaire Orion 21 100% 100%
Centrale Solaire Orion 22 100% 100%
Centrale Solaire Orion 23 100% 100%
Centrale Solaire Orion 24 100% 100%
Centrale Solaire Orion 25 100% 100%
Centrale Solaire Orion 26 100% 100%
Centrale Solaire Orion 27 100% 100%
Centrale Solaire Corbas 1 100% 100%
Centrale Solaire Corbas 2 100% 100%
Centrale Solaire Corbas 3 100% 100%
Centrale Solaire Corbas 4 100% 100%
Centrale Solaire Morcenx 1 100% 100%
Centrale Solaire Morcenx 2 100% 100%
Centrale Solaire Morcenx 3 100% 100%
Centrale Solaire Morcenx 4 100% 100%
Centrale Solaire Cap Decouverte 4 bis 100% 100%
Centrale Solaire Capdéc Ombrière 100% 100%
Centrales Solaires Delta 100% 100%
Centrale Solaire Garrigues Ouest 100% 100%
Centrale Solaire Le Plo 100% 100%
Centrale Solaire Milhas 100% 100%
Centrale Solaire Le Champ de Manœuvre 100% 100%
Centrale Solaire Les Poulettes 100% 100%
Centrale Solaire Le Moulin de Beuvry 100% 100%
Centrale Solaire Le Camp 100% 100%
Centrale Solaire Château Locoyame 100% 100%
Centrale Solaire Orion 40 100% 100%
Centrale Solaire Larroque 100% 100%
Centrale Solaire Bagnoles 100% 100%
Centrale Solaire Saint Avit 100% 100%
Centrale Solaire Amazonia 100% 100%
AzurSol Est 100% 100%
AzurSol Sud 100% 100%
Centrale photovoltaique de Mer 100% 100%
Biomasse Energie de Commentry 51% 51%
Neoen Biosource 100% 100%
Biomasse Energie de Laneuveville 100% 100%
Biomasse Energie de Montsinery 100% 100%
Neoen Investissement 100% 100%
Neoen Northern Hemisphere 100% 100%
Neoen Holding Egypte 100% 100%
Zambian Sunlight One 68.7% 68.7%
Centrale Solaire Orion 28 100% 100%
Centrale Solaire Orion 29 100% 100%
Centrale Solaire Orion 30 100% 100%
Centrale Solaire Orion 31 100% 100%
Centrale Solaire Orion 32 100% 100%
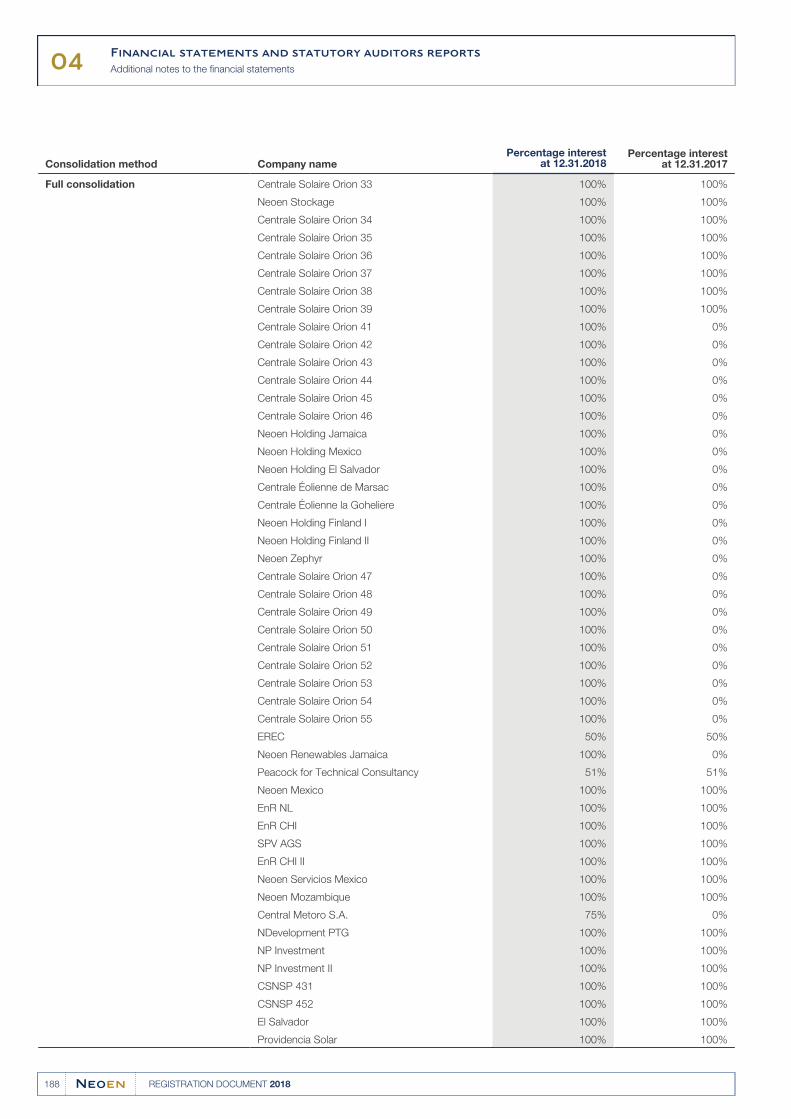
04Financial statements and statutory auditors reports
Additional notes to the financial statements
188 REGISTRATION DOCUMENT 2018
Consolidation method Company namePercentage interest
at 12.31.2018Percentage interest
at 12.31.2017
Full consolidation Centrale Solaire Orion 33 100% 100%
Neoen Stockage 100% 100%
Centrale Solaire Orion 34 100% 100%
Centrale Solaire Orion 35 100% 100%
Centrale Solaire Orion 36 100% 100%
Centrale Solaire Orion 37 100% 100%
Centrale Solaire Orion 38 100% 100%
Centrale Solaire Orion 39 100% 100%
Centrale Solaire Orion 41 100% 0%
Centrale Solaire Orion 42 100% 0%
Centrale Solaire Orion 43 100% 0%
Centrale Solaire Orion 44 100% 0%
Centrale Solaire Orion 45 100% 0%
Centrale Solaire Orion 46 100% 0%
Neoen Holding Jamaica 100% 0%
Neoen Holding Mexico 100% 0%
Neoen Holding El Salvador 100% 0%
Centrale Éolienne de Marsac 100% 0%
Centrale Éolienne la Goheliere 100% 0%
Neoen Holding Finland I 100% 0%
Neoen Holding Finland II 100% 0%
Neoen Zephyr 100% 0%
Centrale Solaire Orion 47 100% 0%
Centrale Solaire Orion 48 100% 0%
Centrale Solaire Orion 49 100% 0%
Centrale Solaire Orion 50 100% 0%
Centrale Solaire Orion 51 100% 0%
Centrale Solaire Orion 52 100% 0%
Centrale Solaire Orion 53 100% 0%
Centrale Solaire Orion 54 100% 0%
Centrale Solaire Orion 55 100% 0%
EREC 50% 50%
Neoen Renewables Jamaica 100% 0%
Peacock for Technical Consultancy 51% 51%
Neoen Mexico 100% 100%
EnR NL 100% 100%
EnR CHI 100% 100%
SPV AGS 100% 100%
EnR CHI II 100% 100%
Neoen Servicios Mexico 100% 100%
Neoen Mozambique 100% 100%
Central Metoro S.A. 75% 0%
NDevelopment PTG 100% 100%
NP Investment 100% 100%
NP Investment II 100% 100%
CSNSP 431 100% 100%
CSNSP 452 100% 100%
El Salvador 100% 100%
Providencia Solar 100% 100%
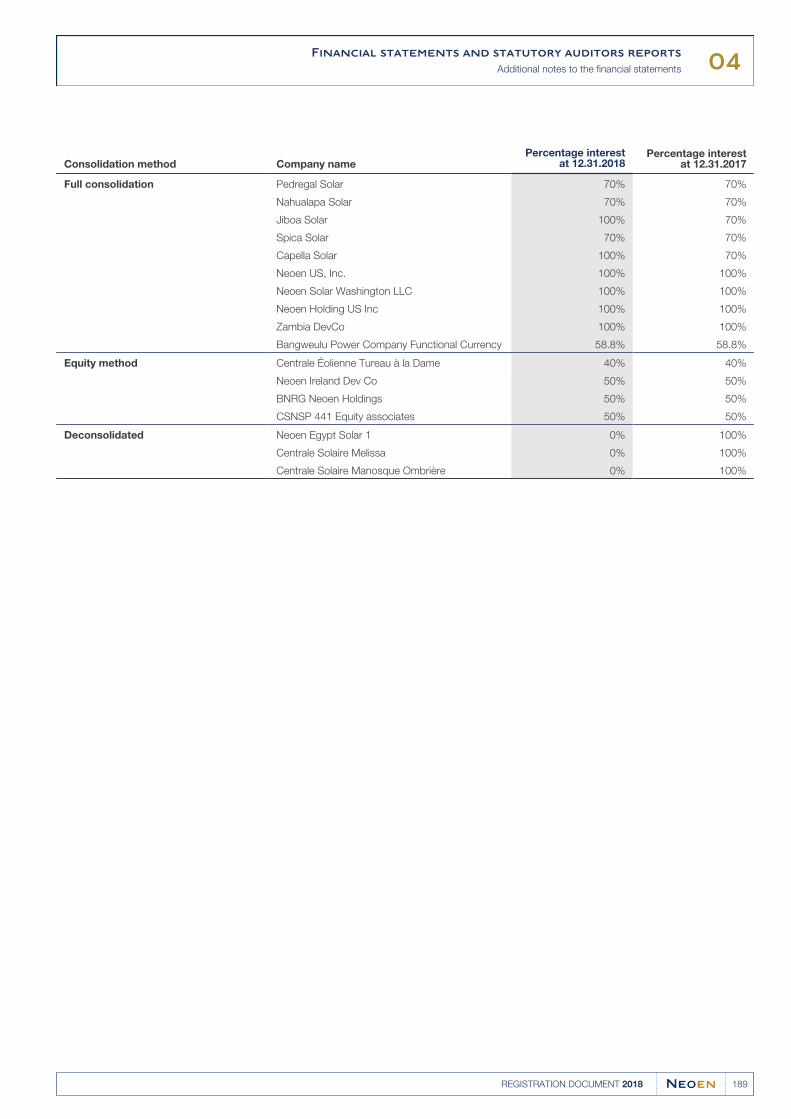
04Financial statements and statutory auditors reports
Additional notes to the financial statements
189REGISTRATION DOCUMENT 2018
Consolidation method Company namePercentage interest
at 12.31.2018Percentage interest
at 12.31.2017
Full consolidation Pedregal Solar 70% 70%
Nahualapa Solar 70% 70%
Jiboa Solar 100% 70%
Spica Solar 70% 70%
Capella Solar 100% 70%
Neoen US, Inc. 100% 100%
Neoen Solar Washington LLC 100% 100%
Neoen Holding US Inc 100% 100%
Zambia DevCo 100% 100%
Bangweulu Power Company Functional Currency 58.8% 58.8%
Equity method Centrale Éolienne Tureau à la Dame 40% 40%
Neoen Ireland Dev Co 50% 50%
BNRG Neoen Holdings 50% 50%
CSNSP 441 Equity associates 50% 50%
Deconsolidated Neoen Egypt Solar 1 0% 100%
Centrale Solaire Melissa 0% 100%
Centrale Solaire Manosque Ombrière 0% 100%
04Financial statements and statutory auditors reports
Statutory auditors’ certification report on the consolidated financial statements of Neoen Group as of December 31, 2018
190 REGISTRATION DOCUMENT 2018
STATUTORY AUDITORS’ CERTIFICATION REPORT 4.2
ON THE CONSOLIDATED FINANCIAL STATEMENTS OF NEOEN
GROUP AS OF DECEMBER 31, 2018
This is a translation into English of the statutory auditors’ report on the consolidated financial statements of the Company issued in French and it is
provided solely for the convenience of English speaking users.
This statutory auditors’ report includes information required by European regulation and French law, such as information about the appointment of
the statutory auditors or verification of the management report and other documents provided to shareholders.
This report should be read in conjunction and construed in accordance with French law and professional auditing standards applicable in France.
Year ended December 31, 2018
To the Neoen shareholders’ meeting,
OPINION
In compliance with the engagement entrusted to us by your shareholders’ meeting, we have audited the accompanying consolidated financial
statements of Neoen for the year ended December 31, 2018.
In our opinion, the consolidated financial statements give a true and fair view of the results of operations of the Group for the year then ended and of
its financial position and of its assets and liabilities as of December 31, 2018 in accordance with International Financial Reporting Standards as
adopted by the European Union.
The audit opinion expressed above is consistent with our report to the Audit Committee.
BASIS FOR OPINION
AUDIT FRAMEWORK
We conducted our audit in accordance with professional standards applicable in France. We believe that the audit evidence we have obtained is
sufficient and appropriate to provide a basis for our opinion.
Our responsibilities under those standards are further described in the “Statutory auditors’ responsibilities for the audit of the consolidated financial
statements” section of our report.
INDEPENDENCE
We conducted our audit in compliance with independence rules applicable to us, for the period from January 1, 2018 to the issue date of our report
and in particular we did not provide any prohibited non-audit services referred to in Article 5(1) of Regulation (EU) no. 537/2014 or in the French
code of ethics for statutory auditors (Code de déontologie).
OBSERVATION
Without qualifying the above opinion, we draw your attention to Note 3.a to the consolidated financial statements, which presents the impacts of the
first-time adoption of IFRS 15, IFRS 9 and IFRS 16 on the consolidated financial statements.
JUSTIFICATION OF ASSESSMENTS – KEY AUDIT MATTERS
In accordance with the requirements of Articles L. 823-9 and R. 823-7 of the French Commercial Code (Code de commerce) relating to the justification of
our assessments, we bring your attention to the key audit matters relating to risks of material misstatement that, in our professional judgment, were of
most significance in the audit of the consolidated financial statements of the current period, as well as our responses to those risks.
These assessments were made as part of our audit of the consolidated financial statements taken as a whole, and therefore contributed to the opinion
we formed which is expressed above. We do not express an opinion on any components of the consolidated financial statements taken individually.
04Financial statements and statutory auditors reports
Statutory auditors’ certification report on the consolidated financial statements of Neoen Group as of December 31, 2018
191REGISTRATION DOCUMENT 2018
A. INTERNALLY GENERATED INTANGIBLE ASSETS
(Notes 3.h and 14 to the consolidated financial statements)
As stated in Note “H) Intangible assets”, the development expenses for various renewable energy production facility projects, comprising external
and internal direct and indirect costs relating to the development, are capitalized as from when the success of the corresponding projects is
probable with regard to the six IAS 38 criteria.
Identified risk and main judgments
The Group considers that these criteria are satisfied once a project enters the portfolio, i.e. when the contractual factors and technical studies indicate
that the project’s feasibility is probable. Once a project is commissioned, amortization is calculated on a straight-line basis over the estimated useful life
of the underlying asset, i.e. 25 years. Furthermore, when the Group estimates that the probability of success is reduced, development expenses are
impaired. When a project is discontinued, the related development expenses are capitalized under “Other non-current operating income and expenses.”
As of December 31, 2018, the net value of development projects totaled €77.3 million, the Group having capitalized expenses directly attributable to
project development for €21.8 million in 2018.
We considered the recognition and measurement of internally generated development projects to be a key audit matter considering the level of
judgment required by Management to assess compliance with capitalization criteria for the corresponding costs and the sensitivity to the estimates
and assumptions used by Management in determining the recoverable amount.
Responses as part of our audit
Our procedures primarily consisted in:
assessing, with regard to prevailing accounting standards and the capitalization rules defined by the Group, the methods of reviewing●capitalization criteria, particularly by interviewing Management;
testing, on a sampling basis, the consistency of the amounts recorded in assets with the project monitoring file prepared by the Group with a●return to the underlying documented evidence;
analyzing the compliance of the methodology applied by the Company to determine the recoverable amount of development expenses with●prevailing standards;
analyzing, with regard to the useful life adopted for these projects under development, the development expense amortization process.●
Finally, we verified the appropriateness of the disclosures in notes H and 14 to the consolidated financial statements.
B. HEDGING FINANCIAL INSTRUMENTS
(Notes P and 26 to the consolidated financial statements)
Neoen finances the construction and operation of some of its facilities using floating-rate loans that expose the Company to interest rate risk. To hedge
this risk, Neoen sets up interest rate swap or cap hedges to peg the interest rate at the start of the project (or to peg the maximum interest rate).
As shown in Note “P) Derivative financial instruments,” derivative financial instruments with a positive market value are recorded in assets, while
those with a negative market value are recorded in liabilities. These instruments are initially measured at fair value on the derivative contract
signature date and then remeasured at their fair value at each closing date.
Identified risk and main judgments
Neoen classifies these hedges in its accounts as cash flow hedges so as to recognize the changes in fair value of the hedging instruments in OCI for
their effective portion. The new IFRS 9 principles had no material impact on the Group’s financial statements insofar as all the transactions that were
classified as hedges under IAS 39 continue to be classified as such under IFRS 9.
We consider the recognition of financial instruments to be a key audit matter due to the materiality of the potential changes in fair value of these instruments,
the level of judgment in documenting and analyzing the hedges and the accounting impacts arising from their classification as cash flow hedges.
Responses as part of our audit
Our procedures primarily consisted in:
analyzing the compliance of the methodologies applied by the Group with prevailing accounting standards;●
assessing the competency of the specialists hired by the Company (Finance Active) to measure the fair value of the financial instruments and●interviewing Management to obtain an understanding of its scope of involvement;
validating the breakdown of the Group financial instrument portfolio that we compared with the fair value determined by the Group’s external●specialists. We compared these bank confirmation statements and conducted valuation tests;
reviewing the cash flow hedging documentation, and the accounting treatment applied to financial instruments and their impacts on the income●statement and other comprehensive income according to the classification of these instruments.
Finally, we verified that notes P and 26 to the consolidated financial statements provide appropriate disclosure.
04Financial statements and statutory auditors reports
Statutory auditors’ certification report on the consolidated financial statements of Neoen Group as of December 31, 2018
192 REGISTRATION DOCUMENT 2018
SPECIFIC VERIFICATIONS
As required by French law, we have also verified in accordance with professional standards applicable in France the information concerning the
Group presented in the Board of Directors’ management report.
We have no matters to report as to its fair presentation and its consistency with the consolidated financial statements.
REPORT ON OTHER LEGAL AND REGULATORY REQUIREMENTS
APPOINTMENT OF THE STATUTORY AUDITORS
Constantin Associés were appointed as statutory auditors of Neoen by the shareholders’ meeting of September 13, 2008 and replaced by Deloitte
at the shareholders’ meeting of April 22, 2014. RSM Paris were also appointed as statutory auditors by the shareholders’ meeting of September 12,
2018.
As of December 31, 2018, Deloitte & Associés and RSM Paris were in the 11th year and first year of total uninterrupted engagement, respectively.
RESPONSIBILITIES OF MANAGEMENT AND THOSE CHARGED WITH GOVERNANCE
FOR THE CONSOLIDATED FINANCIAL STATEMENTS
Management is responsible for the preparation and fair presentation of the consolidated financial statements in accordance with International
Financial Reporting Standards as adopted by the European Union, and for such internal control as management determines is necessary to enable
the preparation of consolidated financial statements that are free from material misstatement, whether due to fraud or error.
In preparing the consolidated financial statements, management is responsible for assessing the Company’s ability to continue as a going concern,
disclosing, as applicable, matters related to going concern and using the going concern basis of accounting unless it is expected to liquidate the
Company or to cease its operations.
The Audit Committee is responsible for monitoring the financial reporting process and the effectiveness of internal control and risk management
systems and, where applicable, its internal audit, regarding the accounting and financial reporting procedures.
The consolidated financial statements have been approved by the Board of Directors.
STATUTORY AUDITORS’ RESPONSIBILITIES FOR THE AUDIT OF THE CONSOLIDATED
FINANCIAL STATEMENTS
OBJECTIVE AND AUDIT APPROACH
Our role is to issue a report on the consolidated financial statements. Our objective is to obtain reasonable assurance about whether the
consolidated financial statements as a whole are free from material misstatement. Reasonable assurance is a high level of assurance, but is not a
guarantee that an audit conducted in accordance with professional standards will always detect a material misstatement when it exists.
Misstatements can arise from fraud or error and are considered material if, individually or in the aggregate, they could reasonably be expected to
influence the economic decisions of users taken on the basis of these financial statements.
As specified by Article L. 823-10-1 of the French Commercial Code, the scope of our statutory audit does not include assurance on the future
viability of the Company or the quality with which Company’s management has conducted or will conduct the affairs of the entity.
As part of an audit in accordance with professional standards applicable in France, the statutory auditors exercise professional judgment throughout
the audit. They also:
identify and assess the risks of material misstatement of the consolidated financial statements, whether due to fraud or error, design and perform●audit procedures responsive to those risks, and obtain audit evidence that is sufficient and appropriate to provide a basis for our opinion. The risk
of not detecting a material misstatement resulting from fraud is higher than for one resulting from error, as fraud may involve collusion, forgery,
intentional omissions, misrepresentations, or the override of internal control;
obtain an understanding of internal control relevant to the audit in order to design audit procedures that are appropriate in the circumstances, but●not for the purpose of expressing an opinion on the effectiveness of the internal control;
evaluate the appropriateness of accounting policies used and the reasonableness of accounting estimates and related disclosures made by●management in the consolidated financial statements;
04Financial statements and statutory auditors reports
Statutory auditors’ certification report on the consolidated financial statements of Neoen Group as of December 31, 2018
193REGISTRATION DOCUMENT 2018
conclude on the appropriateness of management’s use of the going concern basis of accounting and, based on the audit evidence obtained,●whether a material uncertainty exists related to events or conditions that may cast significant doubt on the Company’s ability to continue as a
going concern. This assessment is based on the audit evidence obtained up to the date of their audit report. However, future events or conditions
may cause the Company to cease to continue as a going concern;
If the statutory auditors conclude that a material uncertainty exists, there is a requirement to draw attention in the audit report to the related
disclosures in the consolidated financial statements or, if such disclosures are not provided or inadequate, to modify the opinion expressed
therein;
evaluate the overall presentation of the consolidated financial statements and whether the consolidated financial statements represent the●underlying transactions and events in a manner that achieves fair presentation;
obtain sufficient appropriate audit evidence regarding the financial information of the entities included in the consolidation scope to express an●opinion on the consolidated financial statements. They are responsible for the direction, supervision and performance of the audit of the
consolidated financial statements as well as for the audit opinion.
REPORT TO THE AUDIT COMMITTEE
We submit a report to the Audit Committee which includes in particular a description of the scope of the audit and the audit program implemented, as
well as significant audit findings. We also bring to its attention any significant deficiencies in internal control regarding the accounting and financial
reporting procedures that we have identified.
Our report to the Audit Committee includes the risks of material misstatement that, in our professional judgment, were of most significance in the
audit of the consolidated financial statements of the current period and which are therefore the key audit matters that we are required to describe in
this report.
We also provide the Audit Committee with the declaration referred to in Article 6 of Regulation (EU) no. 537/2014, confirming our independence
pursuant to the rules applicable in France as defined in particular by Articles L. 822-10 to L. 822-14 of the French Commercial Code and in the
French code of ethics for statutory auditors. Where appropriate, we discuss with the Audit Committee the risks that may reasonably be thought to
bear on our independence, and where applicable, the related safeguards.
At Paris-la Défense and Paris, April 17, 2019
The statutory auditors
DELOITTE & ASSOCIÉS
François Xavier AMEYE
RSM Paris
Etienne de BRYAS
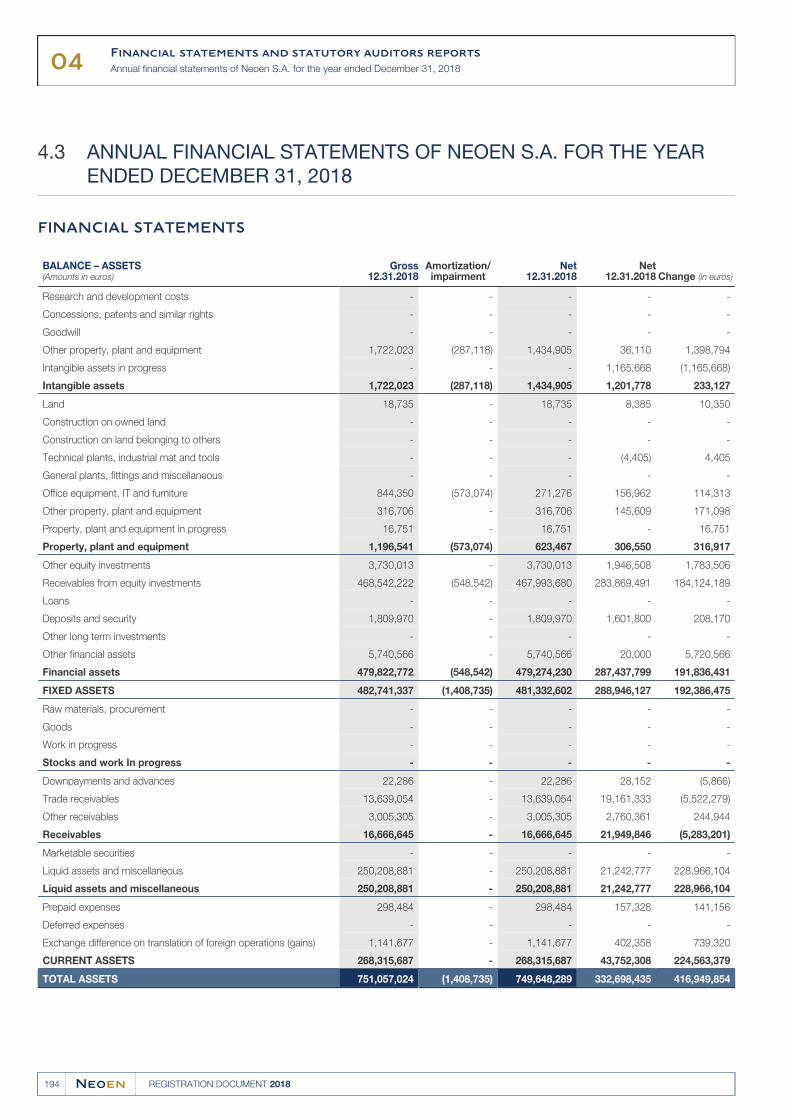
04Financial statements and statutory auditors reports
Annual financial statements of Neoen S.A. for the year ended December 31, 2018
194 REGISTRATION DOCUMENT 2018
ANNUAL FINANCIAL STATEMENTS OF NEOEN S.A. FOR THE YEAR 4.3
ENDED DECEMBER 31, 2018
FINANCIAL STATEMENTS
BALANCE – ASSETS(Amounts in euros)
Gross12.31.2018
Amortization/impairment
Net12.31.2018
Net12.31.2018 Change (in euros)
Research and development costs - - - - -
Concessions, patents and similar rights - - - - -
Goodwill - - - - -
Other property, plant and equipment 1,722,023 (287,118) 1,434,905 36,110 1,398,794
Intangible assets in progress - - - 1,165,668 (1,165,668)
Intangible assets 1,722,023 (287,118) 1,434,905 1,201,778 233,127
Land 18,735 - 18,735 8,385 10,350
Construction on owned land - - - - -
Construction on land belonging to others - - - - -
Technical plants, industrial mat and tools - - - (4,405) 4,405
General plants, fittings and miscellaneous - - - - -
Office equipment, IT and furniture 844,350 (573,074) 271,276 156,962 114,313
Other property, plant and equipment 316,706 - 316,706 145,609 171,098
Property, plant and equipment in progress 16,751 - 16,751 - 16,751
Property, plant and equipment 1,196,541 (573,074) 623,467 306,550 316,917
Other equity investments 3,730,013 - 3,730,013 1,946,508 1,783,506
Receivables from equity investments 468,542,222 (548,542) 467,993,680 283,869,491 184,124,189
Loans - - - - -
Deposits and security 1,809,970 - 1,809,970 1,601,800 208,170
Other long term investments - - - - -
Other financial assets 5,740,566 - 5,740,566 20,000 5,720,566
Financial assets 479,822,772 (548,542) 479,274,230 287,437,799 191,836,431
FIXED ASSETS 482,741,337 (1,408,735) 481,332,602 288,946,127 192,386,475
Raw materials, procurement - - - - -
Goods - - - - -
Work in progress - - - - -
Stocks and work In progress - - - - -
Downpayments and advances 22,286 - 22,286 28,152 (5,866)
Trade receivables 13,639,054 - 13,639,054 19,161,333 (5,522,279)
Other receivables 3,005,305 - 3,005,305 2,760,361 244,944
Receivables 16,666,645 - 16,666,645 21,949,846 (5,283,201)
Marketable securities - - - - -
Liquid assets and miscellaneous 250,208,881 - 250,208,881 21,242,777 228,966,104
Liquid assets and miscellaneous 250,208,881 - 250,208,881 21,242,777 228,966,104
Prepaid expenses 298,484 - 298,484 157,328 141,156
Deferred expenses - - - - -
Exchange difference on translation of foreign operations (gains) 1,141,677 - 1,141,677 402,358 739,320
CURRENT ASSETS 268,315,687 - 268,315,687 43,752,308 224,563,379
TOTAL ASSETS 751,057,024 (1,408,735) 749,648,289 332,698,435 416,949,854
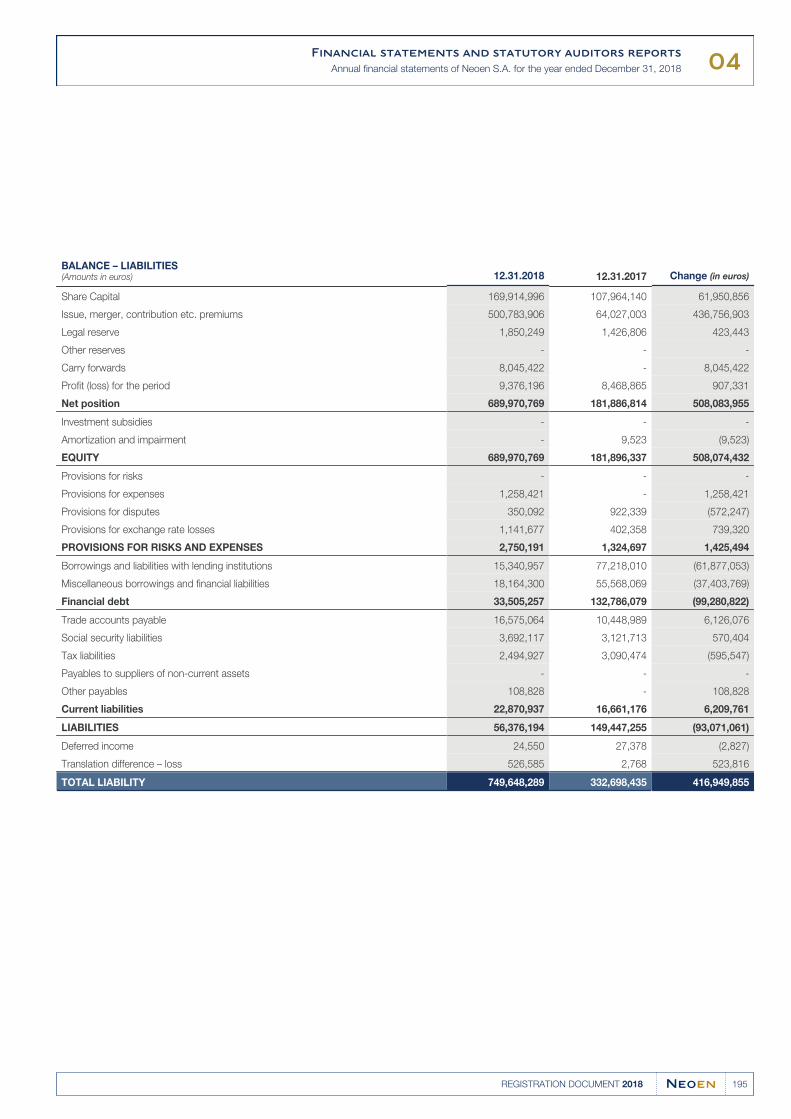
04Financial statements and statutory auditors reports
Annual financial statements of Neoen S.A. for the year ended December 31, 2018
195REGISTRATION DOCUMENT 2018
BALANCE – LIABILITIES(Amounts in euros) 12.31.2018 12.31.2017 Change (in euros)
Share Capital 169,914,996 107,964,140 61,950,856
Issue, merger, contribution etc. premiums 500,783,906 64,027,003 436,756,903
Legal reserve 1,850,249 1,426,806 423,443
Other reserves - - -
Carry forwards 8,045,422 - 8,045,422
Profit (loss) for the period 9,376,196 8,468,865 907,331
Net position 689,970,769 181,886,814 508,083,955
Investment subsidies - - -
Amortization and impairment - 9,523 (9,523)
EQUITY 689,970,769 181,896,337 508,074,432
Provisions for risks - - -
Provisions for expenses 1,258,421 - 1,258,421
Provisions for disputes 350,092 922,339 (572,247)
Provisions for exchange rate losses 1,141,677 402,358 739,320
PROVISIONS FOR RISKS AND EXPENSES 2,750,191 1,324,697 1,425,494
Borrowings and liabilities with lending institutions 15,340,957 77,218,010 (61,877,053)
Miscellaneous borrowings and financial liabilities 18,164,300 55,568,069 (37,403,769)
Financial debt 33,505,257 132,786,079 (99,280,822)
Trade accounts payable 16,575,064 10,448,989 6,126,076
Social security liabilities 3,692,117 3,121,713 570,404
Tax liabilities 2,494,927 3,090,474 (595,547)
Payables to suppliers of non-current assets - - -
Other payables 108,828 - 108,828
Current liabilities 22,870,937 16,661,176 6,209,761
LIABILITIES 56,376,194 149,447,255 (93,071,061)
Deferred income 24,550 27,378 (2,827)
Translation difference – loss 526,585 2,768 523,816
TOTAL LIABILITY 749,648,289 332,698,435 416,949,855
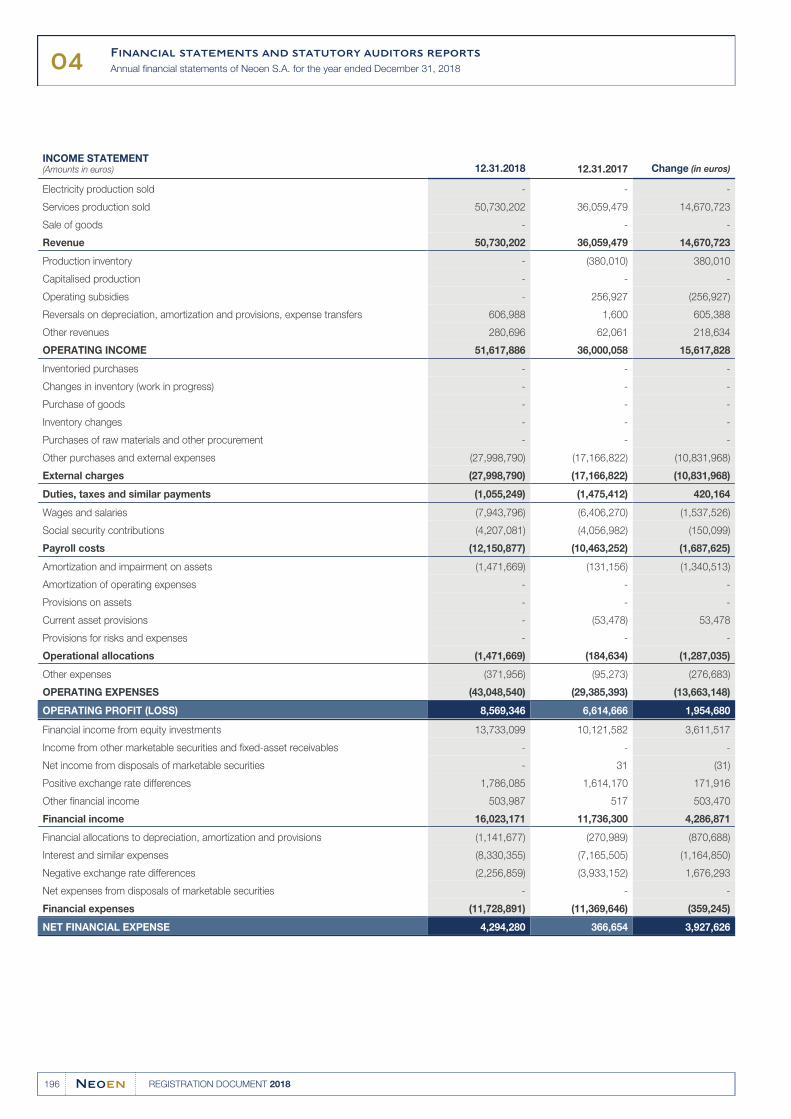
04Financial statements and statutory auditors reports
Annual financial statements of Neoen S.A. for the year ended December 31, 2018
196 REGISTRATION DOCUMENT 2018
INCOME STATEMENT(Amounts in euros) 12.31.2018 12.31.2017 Change (in euros)
Electricity production sold - - -
Services production sold 50,730,202 36,059,479 14,670,723
Sale of goods - - -
Revenue 50,730,202 36,059,479 14,670,723
Production inventory - (380,010) 380,010
Capitalised production - - -
Operating subsidies - 256,927 (256,927)
Reversals on depreciation, amortization and provisions, expense transfers 606,988 1,600 605,388
Other revenues 280,696 62,061 218,634
OPERATING INCOME 51,617,886 36,000,058 15,617,828
Inventoried purchases - - -
Changes in inventory (work in progress) - - -
Purchase of goods - - -
Inventory changes - - -
Purchases of raw materials and other procurement - - -
Other purchases and external expenses (27,998,790) (17,166,822) (10,831,968)
External charges (27,998,790) (17,166,822) (10,831,968)
Duties, taxes and similar payments (1,055,249) (1,475,412) 420,164
Wages and salaries (7,943,796) (6,406,270) (1,537,526)
Social security contributions (4,207,081) (4,056,982) (150,099)
Payroll costs (12,150,877) (10,463,252) (1,687,625)
Amortization and impairment on assets (1,471,669) (131,156) (1,340,513)
Amortization of operating expenses - - -
Provisions on assets - - -
Current asset provisions - (53,478) 53,478
Provisions for risks and expenses - - -
Operational allocations (1,471,669) (184,634) (1,287,035)
Other expenses (371,956) (95,273) (276,683)
OPERATING EXPENSES (43,048,540) (29,385,393) (13,663,148)
OPERATING PROFIT (LOSS) 8,569,346 6,614,666 1,954,680
Financial income from equity investments 13,733,099 10,121,582 3,611,517
Income from other marketable securities and fixed-asset receivables - - -
Net income from disposals of marketable securities - 31 (31)
Positive exchange rate differences 1,786,085 1,614,170 171,916
Other financial income 503,987 517 503,470
Financial income 16,023,171 11,736,300 4,286,871
Financial allocations to depreciation, amortization and provisions (1,141,677) (270,989) (870,688)
Interest and similar expenses (8,330,355) (7,165,505) (1,164,850)
Negative exchange rate differences (2,256,859) (3,933,152) 1,676,293
Net expenses from disposals of marketable securities - - -
Financial expenses (11,728,891) (11,369,646) (359,245)
NET FINANCIAL EXPENSE 4,294,280 366,654 3,927,626
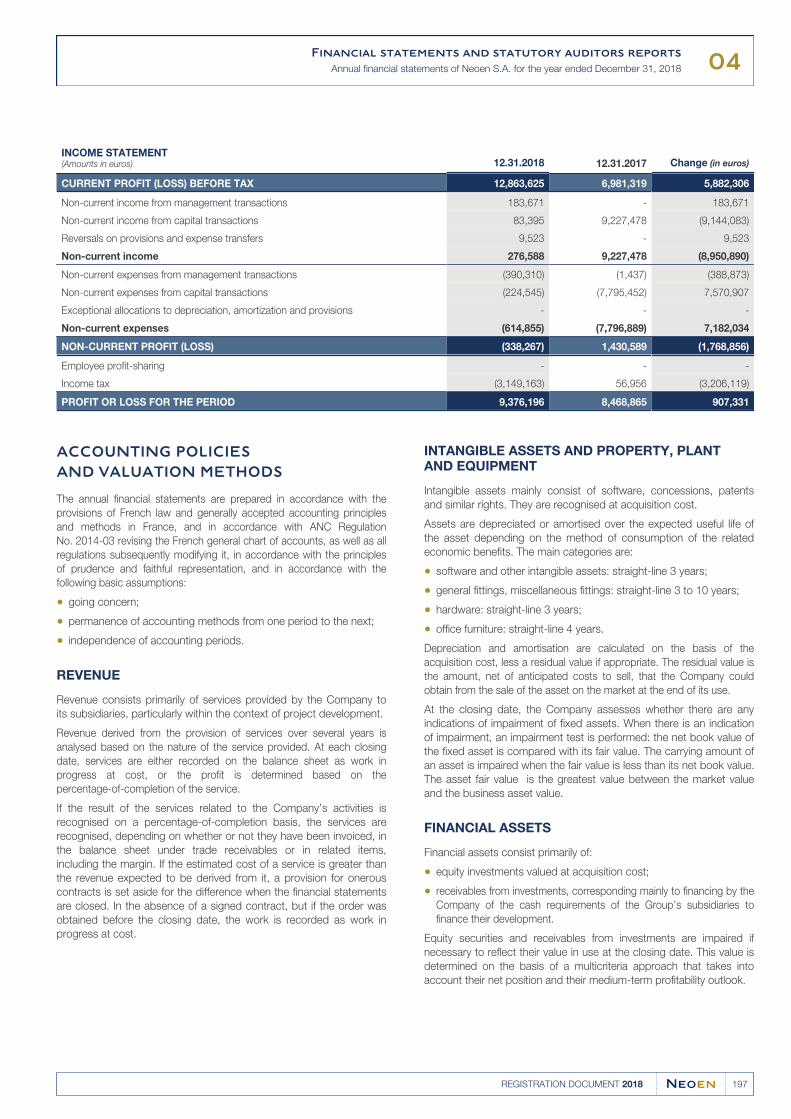
04Financial statements and statutory auditors reports
Annual financial statements of Neoen S.A. for the year ended December 31, 2018
197REGISTRATION DOCUMENT 2018
INCOME STATEMENT(Amounts in euros) 12.31.2018 12.31.2017 Change (in euros)
CURRENT PROFIT (LOSS) BEFORE TAX 12,863,625 6,981,319 5,882,306
Non-current income from management transactions 183,671 - 183,671
Non-current income from capital transactions 83,395 9,227,478 (9,144,083)
Reversals on provisions and expense transfers 9,523 - 9,523
Non-current income 276,588 9,227,478 (8,950,890)
Non-current expenses from management transactions (390,310) (1,437) (388,873)
Non-current expenses from capital transactions (224,545) (7,795,452) 7,570,907
Exceptional allocations to depreciation, amortization and provisions - - -
Non-current expenses (614,855) (7,796,889) 7,182,034
NON-CURRENT PROFIT (LOSS) (338,267) 1,430,589 (1,768,856)
Employee profit-sharing - - -
Income tax (3,149,163) 56,956 (3,206,119)
PROFIT OR LOSS FOR THE PERIOD 9,376,196 8,468,865 907,331
ACCOUNTING POLICIES
AND VALUATION METHODS
The annual financial statements are prepared in accordance with the
provisions of French law and generally accepted accounting principles
and methods in France, and in accordance with ANC Regulation
No. 2014-03 revising the French general chart of accounts, as well as all
regulations subsequently modifying it, in accordance with the principles
of prudence and faithful representation, and in accordance with the
following basic assumptions:
going concern;●
permanence of accounting methods from one period to the next;●
independence of accounting periods.●
REVENUE
Revenue consists primarily of services provided by the Company to
its subsidiaries, particularly within the context of project development.
Revenue derived from the provision of services over several years is
analysed based on the nature of the service provided. At each closing
date, services are either recorded on the balance sheet as work in
progress at cost, or the profit is determined based on the
percentage-of-completion of the service.
If the result of the services related to the Company’s activities is
recognised on a percentage-of-completion basis, the services are
recognised, depending on whether or not they have been invoiced, in
the balance sheet under trade receivables or in related items,
including the margin. If the estimated cost of a service is greater than
the revenue expected to be derived from it, a provision for onerous
contracts is set aside for the difference when the financial statements
are closed. In the absence of a signed contract, but if the order was
obtained before the closing date, the work is recorded as work in
progress at cost.
INTANGIBLE ASSETS AND PROPERTY, PLANT AND EQUIPMENT
Intangible assets mainly consist of software, concessions, patents
and similar rights. They are recognised at acquisition cost.
Assets are depreciated or amortised over the expected useful life of
the asset depending on the method of consumption of the related
economic benefits. The main categories are:
software and other intangible assets: straight-line 3 years;●
general fittings, miscellaneous fittings: straight-line 3 to 10 years;●
hardware: straight-line 3 years;●
office furniture: straight-line 4 years.●
Depreciation and amortisation are calculated on the basis of the
acquisition cost, less a residual value if appropriate. The residual value is
the amount, net of anticipated costs to sell, that the Company could
obtain from the sale of the asset on the market at the end of its use.
At the closing date, the Company assesses whether there are any
indications of impairment of fixed assets. When there is an indication
of impairment, an impairment test is performed: the net book value of
the fixed asset is compared with its fair value. The carrying amount of
an asset is impaired when the fair value is less than its net book value.
The asset fair value is the greatest value between the market value
and the business asset value.
FINANCIAL ASSETS
Financial assets consist primarily of:
equity investments valued at acquisition cost;●
receivables from investments, corresponding mainly to financing by the●Company of the cash requirements of the Group’s subsidiaries to
finance their development.
Equity securities and receivables from investments are impaired if
necessary to reflect their value in use at the closing date. This value is
determined on the basis of a multicriteria approach that takes into
account their net position and their medium-term profitability outlook.
04Financial statements and statutory auditors reports
Annual financial statements of Neoen S.A. for the year ended December 31, 2018
198 REGISTRATION DOCUMENT 2018
RECEIVABLES
Receivables are recorded at their nominal value when the service has
been provided. They are impaired where necessary to reflect any
collection difficulties. Receivables are impaired on a case-by-case
basis, notably on the basis of customers’ solvency.
INVESTMENT SECURITIES
Investment securities represent temporary cash positions invested in
SICAVs and/or money market funds. They are recorded at their
historical acquisition cost. When sold, gains or losses are calculated
using the FIFO method.
A provision is set aside if the net asset value is less than the book
value.
PROVISIONS FOR RISKS AND CHARGES
Provisions for risks and charges are made to cover probable outflows of
resources embodying economic benefits for third parties, without a
corresponding benefit for the Company. They are estimated on the basis
of the most probable assumptions at the closing date.
LIABILITIES
Liabilities are recorded at their nominal value.
ACTIVITY AND KEY EVENTS
The financial statements and the notes to the annual financial
statements of this document are presented in euros (€), unless
otherwise indicated.
GENERAL INFORMATION
Neoen (“the Company”) is a public limited company (société anonyme
– SA) registered and domiciled in France. Following the move early in
the second half of 2018, its head office is located at 6 rue Menars –
75002 Paris.
The company was registered on September 29, 2008.
ACTIVITY AND KEY EVENTS
The company’s purpose is to perform all operations relating to energy
in the broad sense, including, without limitation, the development,
construction and operation of renewable energies.
2018 was a particularly eventful year for the Company, both in France
and internationally, in all segments (onshore wind, solar, biomass,
storage) and activities (development, construction, financing and
operation).
Previously a simplified limited company (société anonyme) (société par
actions simplifiée), the Company was transformed into a public limited
company at the general meeting of September 12, 2018.
On October 16, 2018, Neoen successfully completed its initial public
offering in compartment A of the regulated market of Euronext in Paris.
The offering price was set at €16.50 per share, valuing the Group at just
over €1.4 billion. The transaction, predominantly in the primary market,
allowed it to raise €450 million through the issue of new shares (out of a
total of €697 million, including a Greenshoe option). This amount will
serve exclusively to continue the Company’s strong growth.
Capital transactions
On July 2, 2018, 755,000 stock options and 75,000 equity warrants were
exercised in a total amount of €1,614,250, including €784,250 in share
premium.
On October 1, 2018, the Company consolidated its shares on the basis
of 1 new share for 2 existing shares. The nominal value of the share was
increased from €1 to €2.
On October 18, 2018, the Company increased its capital through the
incorporation of Impala’s partner current account in a total amount of
€53,628,317, of which €47,127,915 in share premium.
On October 18, 2018, the Company completed its IPO, involving a
capital increase of €449,999,996, including €395,454,542 in share
premium, through the creation of 27,272,727 shares, i.e. €16.5 per
share broken down as €2 in par value and €14.5 in share premium.
On November 21, 2018, 37,500 €4 stock options (after the share
consolidation) were exercised in a total amount of €150,000, of which
€75,000 in share premium.
At December 31, 2018, fully paid-up share capital comprised
84,957,498 shares with a par value of €2 (number and par value after
the share consolidation).
At December 31, 2018, the Company directly or indirectly held
150,658 own shares, representing a book value of €2.7 million.
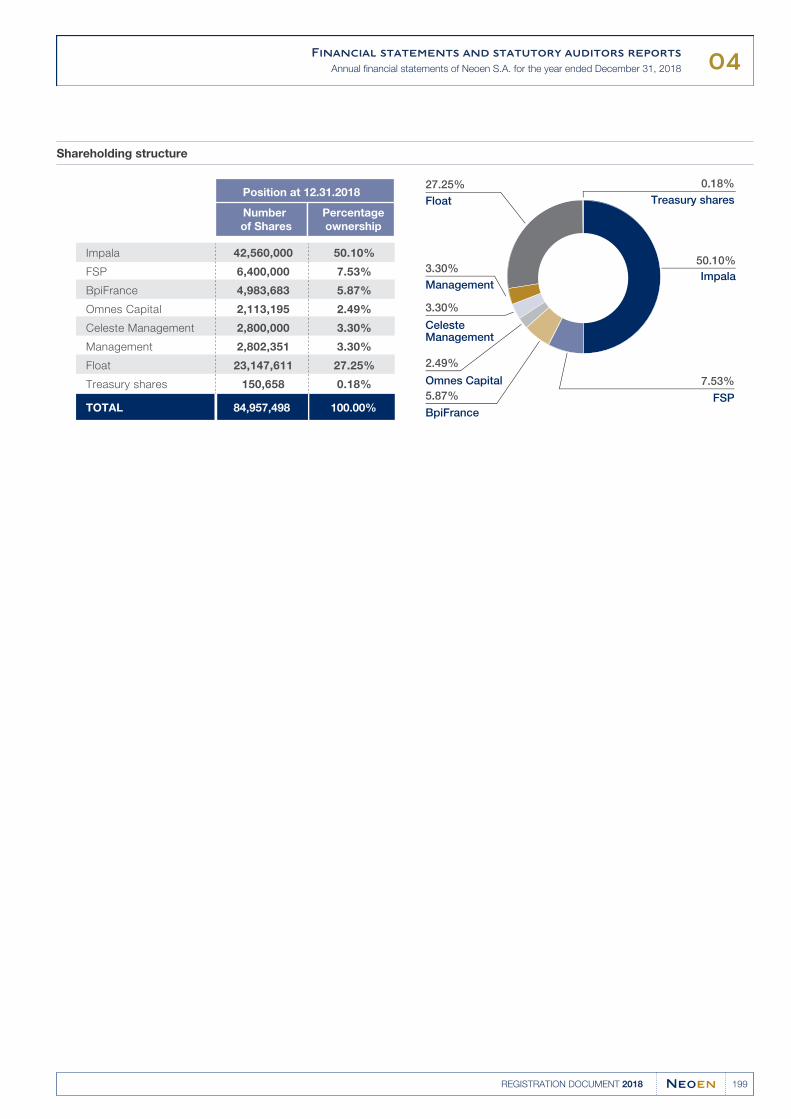
04Financial statements and statutory auditors reports
Annual financial statements of Neoen S.A. for the year ended December 31, 2018
199REGISTRATION DOCUMENT 2018
Shareholding structure
2.49%
Float
Omnes Capital
3.30%
Celeste Management
Management
BpiFrance
Impala
27.25%Treasury shares
0.18%
3.30%
5.87% FSP
7.53%
50.10%Impala
FSP
BpiFrance
Omnes Capital
Celeste Management
Management
Float
Treasury shares
42,560,000
6,400,000
4,983,683
2,113,195
2,800,000
2,802,351
23,147,611
150,658
50.10%
7.53%
5.87%
2.49%
3.30%
3.30%
27.25%
0.18%
84,957,498
Position at 12.31.2018
Number of Shares
Percentageownership
TOTAL 100.00%
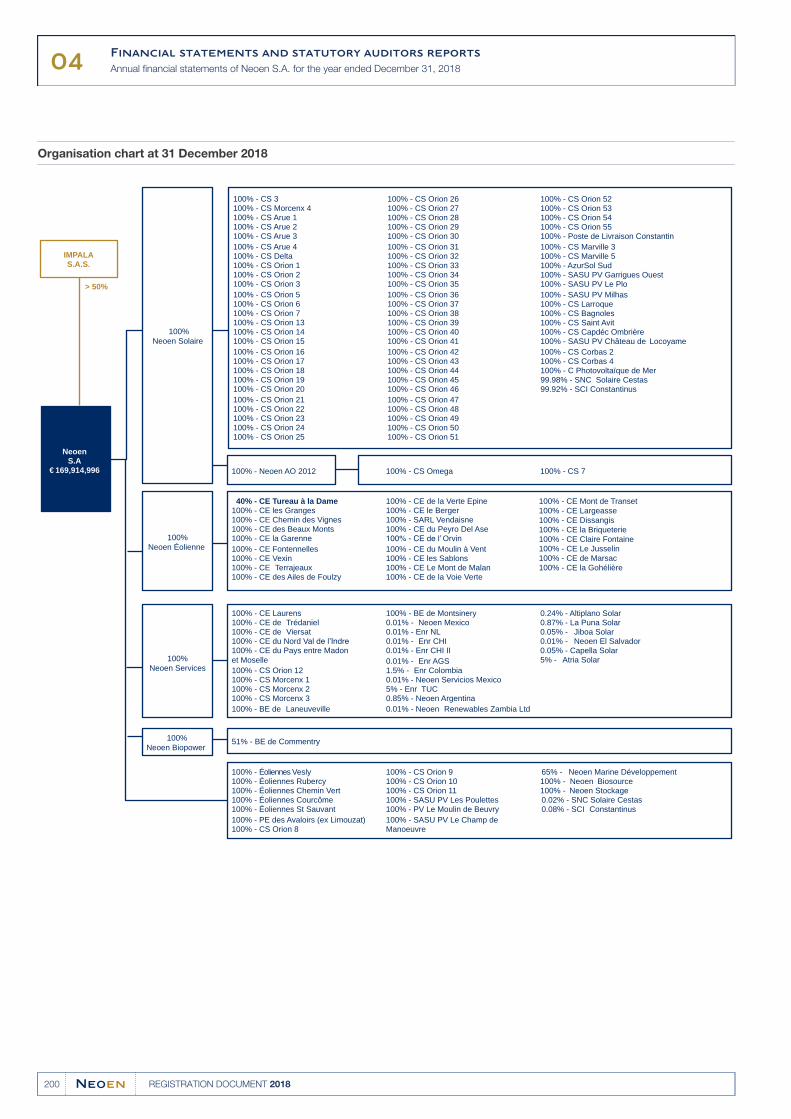
04Financial statements and statutory auditors reports
Annual financial statements of Neoen S.A. for the year ended December 31, 2018
200 REGISTRATION DOCUMENT 2018
Organisation chart at 31 December 2018
IMPALA S.A.S.
NeoenS.A
€169,914,996
> 50%
100% - CS 3 100% - CS Morcenx 4100% - CS Arue 1 100% - CS Arue 2 100% - CS Arue 3 100% - CS Arue 4100% - CS Delta 100% - CS Orion 1 100% - CS Orion 2 100% - CS Orion 3 100% - CS Orion 5100% - CS Orion 6 100% - CS Orion 7100% - CS Orion 13100% - CS Orion 14100% - CS Orion 15100% - CS Orion 16100% - CS Orion 17100% - CS Orion 18100% - CS Orion 19100% - CS Orion 20100% - CS Orion 21100% - CS Orion 22100% - CS Orion 23100% - CS Orion 24100% - CS Orion 25
100% - CS Orion 26100% - CS Orion 27100% - CS Orion 28100% - CS Orion 29100% - CS Orion 30100% - CS Orion 31100% - CS Orion 32100% - CS Orion 33100% - CS Orion 34100% - CS Orion 35100% - CS Orion 36100% - CS Orion 37100% - CS Orion 38100% - CS Orion 39100% - CS Orion 40100% - CS Orion 41100% - CS Orion 42100% - CS Orion 43100% - CS Orion 44100% - CS Orion 45100% - CS Orion 46100% - CS Orion 47100% - CS Orion 48100% - CS Orion 49100% - CS Orion 50100% - CS Orion 51
100% - CS Orion 52100% - CS Orion 53100% - CS Orion 54100% - CS Orion 55100% - Poste de Livraison Constantin 100% - CS Marville 3100% - CS Marville 5100% - AzurSol Sud100% - SASU PV Garrigues Ouest100% - SASU PV Le Plo100% - SASU PV Milhas100% - CS Larroque 100% - CS Bagnoles 100% - CS Saint Avit 100% - CS Capdéc Ombrière 100% - SASU PV Château de Locoyame100% - CS Corbas 2 100% - CS Corbas 4 100% - C Photovoltaïque de Mer99.98% - SNC Solaire Cestas 99.92% - SCI Constantinus
40% - CE Tureau à la Dame100% - CE les Granges100% - CE Chemin des Vignes100% - CE des Beaux Monts 100% - CE la Garenne100% - CE Fontennelles100% - CE Vexin100% - CE Terrajeaux100% - CE des Ailes de Foulzy
100% - CE de la Verte Epine100% - CE le Berger 100% - SARL Vendaisne 100% - CE du Peyro Del Ase
Orvin100% - CE du Moulin à Vent100% - CE les Sablons100% - CE Le Mont de Malan100% - CE de la Voie Verte
100% - CE Mont de Transet100% - CE Largeasse100% - CE Dissangis100% - CE la Briqueterie100% - CE Claire Fontaine100% - CE Le Jusselin 100% - CE de Marsac 100% - CE la Gohélière
51% - BE de Commentry
100%Neoen Solaire
100%Neoen Éolienne
100%Neoen Biopower
100% - Neoen AO 2012 100% - CS Omega 100% - CS 7
100% - CE Laurens100% - CE de Trédaniel100% - CE de Viersat100% - CE du Nord V100% - CE du Pays entre Madon et Moselle 100% - CS Orion 12 100% - CS Morcenx 1 100% - CS Morcenx 2 100% - CS Morcenx 3 100% - BE de Laneuveville
100% - BE de Montsinery0.01% - Neoen Mexico0.01% - Enr NL 0.01% - Enr CHI0.01% - Enr CHI II0.01% - Enr AGS1.5% - Enr Colombia 0.01% - Neoen Servicios Mexico5% - Enr TUC0.85% - Neoen Argentina0.01% - Neoen Renewables Zambia Ltd
0.24% - Altiplano Solar0.87% - La Puna Solar0.05% - Jiboa Solar0.01% - Neoen El Salvador0.05% - Capella Solar5% - Atria Solar100%
Neoen Services
100% - Éoliennes Vesly100% - Éoliennes Rubercy100% - Éoliennes Chemin Vert100% - Éoliennes Courcôme100% - Éoliennes St Sauvant100% - PE des Avaloirs (ex Limouzat)100% - CS Orion 8
100% - CS Orion 9100% - CS Orion 10100% - CS Orion 11100% - SASU PV Les Poulettes100% - PV Le Moulin de Beuvry100% - SASU PV Le Champ de Manoeuvre
65% - Neoen Marine Développement100% - Neoen Biosource100% - Neoen Stockage0.02% - SNC Solaire Cestas0.08% - SCI Constantinus
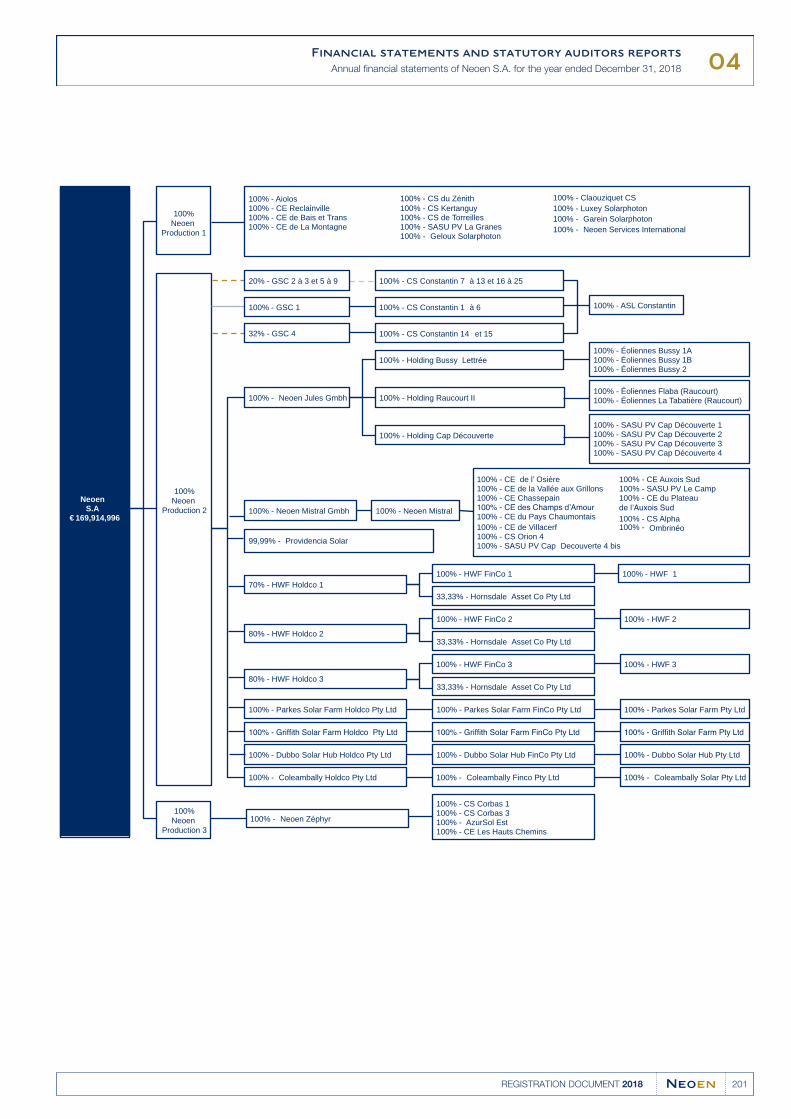
04Financial statements and statutory auditors reports
Annual financial statements of Neoen S.A. for the year ended December 31, 2018
201REGISTRATION DOCUMENT 2018
NeoenS.A
100% - Aiolos100% - CE Reclainville100% - CE de Bais et Trans100% - CE de La Montagne
100% - CS du Zénith100% - CS Kertanguy100% - CS de Torreilles100% - SASU PV La Granes100% - Geloux Solarphoton
100% - Claouziquet CS100% - Luxey Solarphoton100% - Garein Solarphoton100% - Neoen Services International
100%Neoen
Production 1
100%Neoen
Production 2
100% - GSC 1
32% - GSC 4
20% - GSC 2 à 3 et 5 à 9
100% - CS Constantin 1 à 6
100% - CS Constantin 14 et 15
100% - CS Constantin 7 à 13 et 16 à 25
100% - ASL Constantin
100% - Éoliennes Bussy 1A100% - Éoliennes Bussy 1B100% - Éoliennes Bussy 2
100% - Éoliennes Flaba (Raucourt)100% - Éoliennes La Tabatière (Raucourt)
100% - SASU PV Cap Découverte 1100% - SASU PV Cap Découverte 2100% - SASU PV Cap Découverte 3100% - SASU PV Cap Découverte 4
100% - Holding Bussy Lettrée
100% - Holding Raucourt II
100% - Holding Cap Découverte
100% - Neoen Jules Gmbh
100% - HWF 1
100% - HWF 2
100% - HWF 3
33,33% - Hornsdale Asset Co Pty Ltd
100% - HWF FinCo 3
33,33% - Hornsdale Asset Co Pty Ltd
33,33% - Hornsdale Asset Co Pty Ltd
100% - HWF FinCo 1
100% - HWF FinCo 2
70% - HWF Holdco 1
80% - HWF Holdco 2
80% - HWF Holdco 3
100% - Parkes Solar Farm Pty Ltd
100% - Dubbo Solar Hub Pty Ltd
100% - Parkes Solar Farm FinCo Pty Ltd
100% - Dubbo Solar Hub FinCo Pty Ltd
100% - Parkes Solar Farm Holdco Pty Ltd
100% - Dubbo Solar Hub Holdco Pty Ltd
100% - CE de l Osière 100% - CE de la Vallée aux Grillons100% - CE Chassepain
100% - CE du Pays Chaumontais 100% - CE de Villacerf 100% - CS Orion 4 100% - SASU PV Cap Decouverte 4 bis
100% - CE Auxois Sud100% - SASU PV Le Camp100% - CE du Plateau
100% - 100% - CS Alpha
Ombrinéo
100% - Neoen Mistral100% - Neoen Mistral Gmbh
99,99% - Providencia Solar
100% - Coleambally Holdco Pty Ltd 100% - Coleambally Finco Pty Ltd 100% - Coleambally Solar Pty Ltd
100%Neoen
Production 3100% - Neoen Zéphyr
100% - CS Corbas 1 100% - CS Corbas 3 100% - AzurSol Est 100% - CE Les Hauts Chemins
€169,914,996
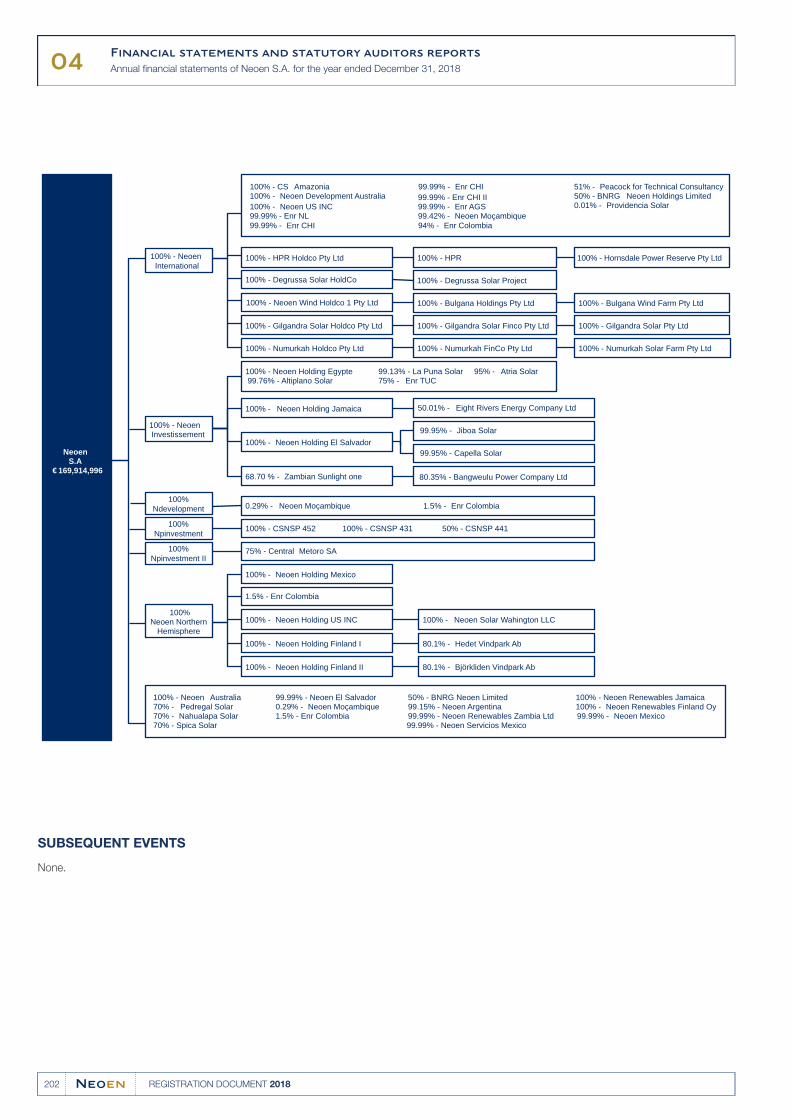
04Financial statements and statutory auditors reports
Annual financial statements of Neoen S.A. for the year ended December 31, 2018
202 REGISTRATION DOCUMENT 2018
100% - Gilgandra Solar Finco Pty Ltd100% - Gilgandra Solar Holdco Pty Ltd
100% - Neoen Australia70% - Pedregal Solar70% - Nahualapa Solar70% - Spica Solar
99.99% - Neoen El Salvador0.29% - Neoen Moçambique1.5% - Enr Colombia
50% - BNRG Neoen Limited99.15% - Neoen Argentina99.99% - Neoen Renewables Zambia Ltd 99.99% - Neoen Servicios Mexico
100% - Neoen Renewables Finland Oy99.99% - Neoen Mexico
100%Npinvestment
100% - CSNSP 452 100% - CSNSP 431 50% - CSNSP 441
NeoenS.A
100% - Neoen International
100% - CS Amazonia100% - Neoen Development Australia100% - Neoen US INC99.99% - Enr NL
99.99% - Enr CHI
99.99% - Enr CHI
99.99% - Enr CHI II99.99% - Enr AGS99.42% - Neoen Moçambique94% - Enr Colombia
51% - Peacock for Technical Consultancy50% - BNRG Neoen Holdings Limited0.01% - Providencia Solar
100% - Degrussa Solar HoldCo 100% - Degrussa Solar Project
100%Ndevelopment 0.29% - Neoen Moçambique 1.5% - Enr Colombia
100%Npinvestment II
1.5% - Enr Colombia
100% - Neoen Investissement
100% - Neoen Holding Egypte 99.76% - Altiplano Solar
99.13% - La Puna Solar75% - Enr TUC
95% - Atria Solar
80.35% - Bangweulu Power Company Ltd
100% - Bulgana Holdings Pty Ltd
100% - Numurkah Holdco Pty Ltd 100% - Numurkah FinCo Pty Ltd
100% - HPR Holdco Pty Ltd 100% - HPR
100%Neoen Northern
Hemisphere
100% - Neoen Holding US INC 100% - Neoen Solar Wahington LLC
68.70 % - Zambian Sunlight one
80.1% - Hedet Vindpark Ab
100% - Neoen Holding El Salvador
99.95% - Jiboa Solar
100% - Neoen Holding Jamaica 50.01% - Eight Rivers Energy Company Ltd
100% - Neoen Holding Mexico
75% - Central Metoro SA
99.95% - Capella Solar
100% - Neoen Holding Finland I
100% - Neoen Holding Finland II 80.1% - Björkliden Vindpark Ab
100% - Neoen Wind Holdco 1 Pty Ltd 100% - Bulgana Wind Farm Pty Ltd
100% - Gilgandra Solar Pty Ltd
100% - Numurkah Solar Farm Pty Ltd
100% - Hornsdale Power Reserve Pty Ltd
€169,914,996
100% - Neoen Renewables Jamaica
SUBSEQUENT EVENTS
None.
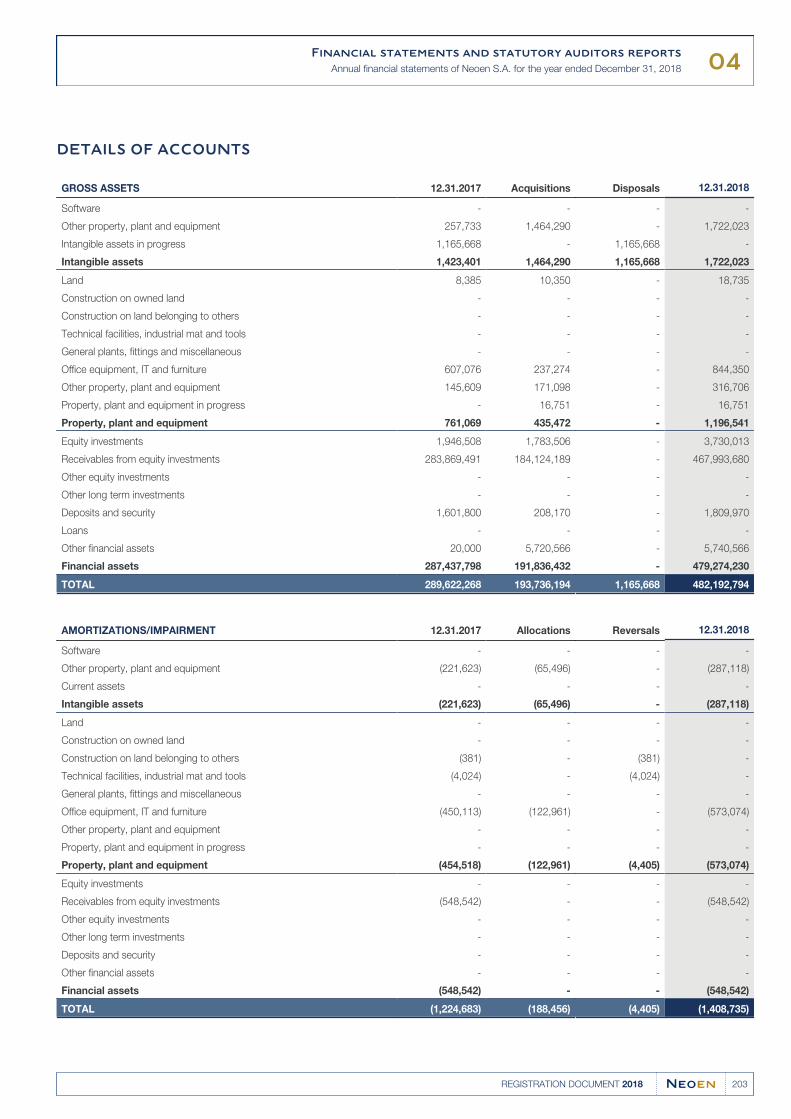
04Financial statements and statutory auditors reports
Annual financial statements of Neoen S.A. for the year ended December 31, 2018
203REGISTRATION DOCUMENT 2018
DETAILS OF ACCOUNTS
GROSS ASSETS 12.31.2017 Acquisitions Disposals 12.31.2018
Software - - - -
Other property, plant and equipment 257,733 1,464,290 - 1,722,023
Intangible assets in progress 1,165,668 - 1,165,668 -
Intangible assets 1,423,401 1,464,290 1,165,668 1,722,023
Land 8,385 10,350 - 18,735
Construction on owned land - - - -
Construction on land belonging to others - - - -
Technical facilities, industrial mat and tools - - - -
General plants, fittings and miscellaneous - - - -
Office equipment, IT and furniture 607,076 237,274 - 844,350
Other property, plant and equipment 145,609 171,098 - 316,706
Property, plant and equipment in progress - 16,751 - 16,751
Property, plant and equipment 761,069 435,472 - 1,196,541
Equity investments 1,946,508 1,783,506 - 3,730,013
Receivables from equity investments 283,869,491 184,124,189 - 467,993,680
Other equity investments - - - -
Other long term investments - - - -
Deposits and security 1,601,800 208,170 - 1,809,970
Loans - - - -
Other financial assets 20,000 5,720,566 - 5,740,566
Financial assets 287,437,798 191,836,432 - 479,274,230
TOTAL 289,622,268 193,736,194 1,165,668 482,192,794
AMORTIZATIONS/IMPAIRMENT 12.31.2017 Allocations Reversals 12.31.2018
Software - - - -
Other property, plant and equipment (221,623) (65,496) - (287,118)
Current assets - - - -
Intangible assets (221,623) (65,496) - (287,118)
Land - - - -
Construction on owned land - - - -
Construction on land belonging to others (381) - (381) -
Technical facilities, industrial mat and tools (4,024) - (4,024) -
General plants, fittings and miscellaneous - - - -
Office equipment, IT and furniture (450,113) (122,961) - (573,074)
Other property, plant and equipment - - - -
Property, plant and equipment in progress - - - -
Property, plant and equipment (454,518) (122,961) (4,405) (573,074)
Equity investments - - - -
Receivables from equity investments (548,542) - - (548,542)
Other equity investments - - - -
Other long term investments - - - -
Deposits and security - - - -
Other financial assets - - - -
Financial assets (548,542) - - (548,542)
TOTAL (1,224,683) (188,456) (4,405) (1,408,735)
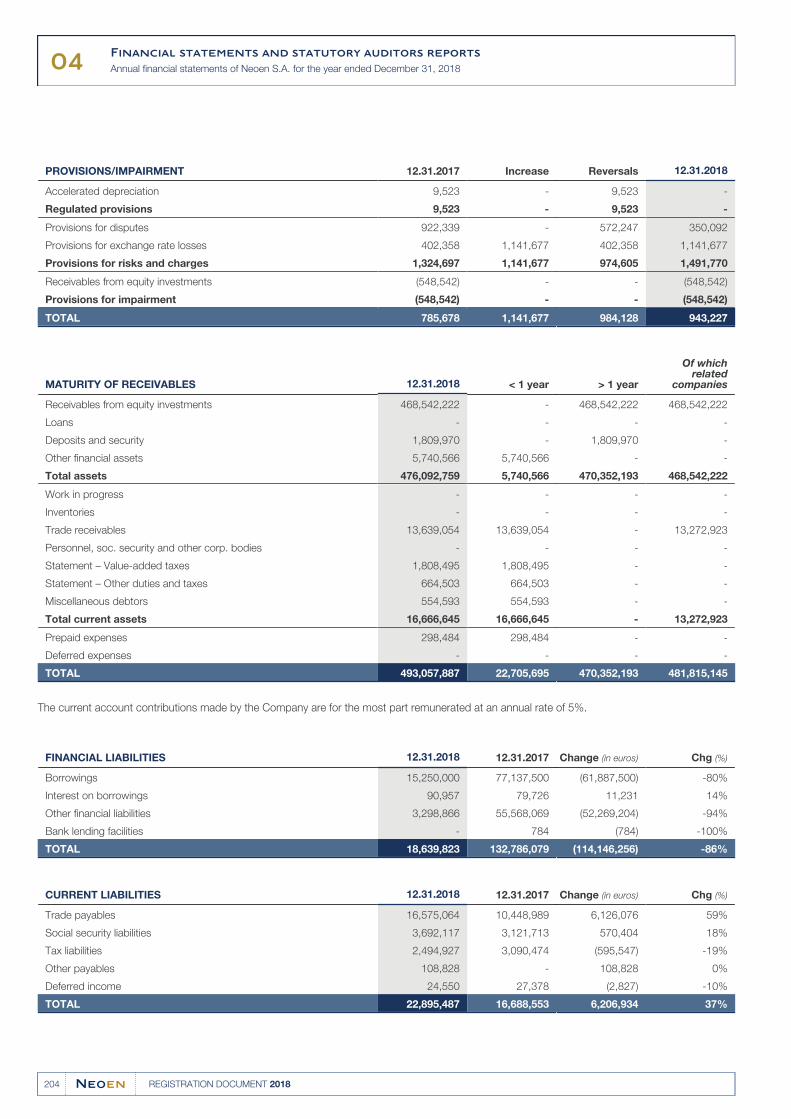
04Financial statements and statutory auditors reports
Annual financial statements of Neoen S.A. for the year ended December 31, 2018
204 REGISTRATION DOCUMENT 2018
PROVISIONS/IMPAIRMENT 12.31.2017 Increase Reversals 12.31.2018
Accelerated depreciation 9,523 - 9,523 -
Regulated provisions 9,523 - 9,523 -
Provisions for disputes 922,339 - 572,247 350,092
Provisions for exchange rate losses 402,358 1,141,677 402,358 1,141,677
Provisions for risks and charges 1,324,697 1,141,677 974,605 1,491,770
Receivables from equity investments (548,542) - - (548,542)
Provisions for impairment (548,542) - - (548,542)
TOTAL 785,678 1,141,677 984,128 943,227
MATURITY OF RECEIVABLES 12.31.2018 < 1 year > 1 year
Of whichrelated
companies
Receivables from equity investments 468,542,222 - 468,542,222 468,542,222
Loans - - - -
Deposits and security 1,809,970 - 1,809,970 -
Other financial assets 5,740,566 5,740,566 - -
Total assets 476,092,759 5,740,566 470,352,193 468,542,222
Work in progress - - - -
Inventories - - - -
Trade receivables 13,639,054 13,639,054 - 13,272,923
Personnel, soc. security and other corp. bodies - - - -
Statement – Value-added taxes 1,808,495 1,808,495 - -
Statement – Other duties and taxes 664,503 664,503 - -
Miscellaneous debtors 554,593 554,593 - -
Total current assets 16,666,645 16,666,645 - 13,272,923
Prepaid expenses 298,484 298,484 - -
Deferred expenses - - - -
TOTAL 493,057,887 22,705,695 470,352,193 481,815,145
The current account contributions made by the Company are for the most part remunerated at an annual rate of 5%.
FINANCIAL LIABILITIES 12.31.2018 12.31.2017 Change (in euros) Chg (%)
Borrowings 15,250,000 77,137,500 (61,887,500) -80%
Interest on borrowings 90,957 79,726 11,231 14%
Other financial liabilities 3,298,866 55,568,069 (52,269,204) -94%
Bank lending facilities - 784 (784) -100%
TOTAL 18,639,823 132,786,079 (114,146,256) -86%
CURRENT LIABILITIES 12.31.2018 12.31.2017 Change (in euros) Chg (%)
Trade payables 16,575,064 10,448,989 6,126,076 59%
Social security liabilities 3,692,117 3,121,713 570,404 18%
Tax liabilities 2,494,927 3,090,474 (595,547) -19%
Other payables 108,828 - 108,828 0%
Deferred income 24,550 27,378 (2,827) -10%
TOTAL 22,895,487 16,688,553 6,206,934 37%
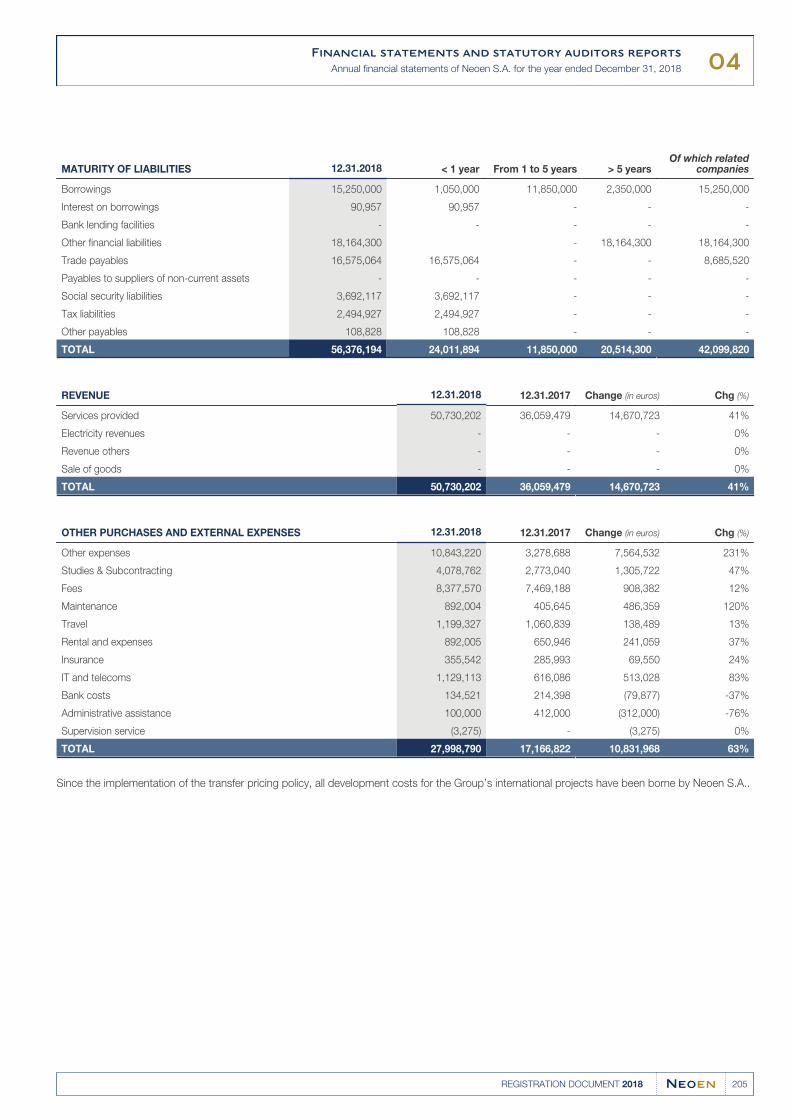
04Financial statements and statutory auditors reports
Annual financial statements of Neoen S.A. for the year ended December 31, 2018
205REGISTRATION DOCUMENT 2018
MATURITY OF LIABILITIES 12.31.2018 < 1 year From 1 to 5 years > 5 yearsOf which related
companies
Borrowings 15,250,000 1,050,000 11,850,000 2,350,000 15,250,000
Interest on borrowings 90,957 90,957 - - -
Bank lending facilities - - - - -
Other financial liabilities 18,164,300 - 18,164,300 18,164,300
Trade payables 16,575,064 16,575,064 - - 8,685,520
Payables to suppliers of non-current assets - - - - -
Social security liabilities 3,692,117 3,692,117 - - -
Tax liabilities 2,494,927 2,494,927 - - -
Other payables 108,828 108,828 - - -
TOTAL 56,376,194 24,011,894 11,850,000 20,514,300 42,099,820
REVENUE 12.31.2018 12.31.2017 Change (in euros) Chg (%)
Services provided 50,730,202 36,059,479 14,670,723 41%
Electricity revenues - - - 0%
Revenue others - - - 0%
Sale of goods - - - 0%
TOTAL 50,730,202 36,059,479 14,670,723 41%
OTHER PURCHASES AND EXTERNAL EXPENSES 12.31.2018 12.31.2017 Change (in euros) Chg (%)
Other expenses 10,843,220 3,278,688 7,564,532 231%
Studies & Subcontracting 4,078,762 2,773,040 1,305,722 47%
Fees 8,377,570 7,469,188 908,382 12%
Maintenance 892,004 405,645 486,359 120%
Travel 1,199,327 1,060,839 138,489 13%
Rental and expenses 892,005 650,946 241,059 37%
Insurance 355,542 285,993 69,550 24%
IT and telecoms 1,129,113 616,086 513,028 83%
Bank costs 134,521 214,398 (79,877) -37%
Administrative assistance 100,000 412,000 (312,000) -76%
Supervision service (3,275) - (3,275) 0%
TOTAL 27,998,790 17,166,822 10,831,968 63%
Since the implementation of the transfer pricing policy, all development costs for the Group’s international projects have been borne by Neoen S.A..
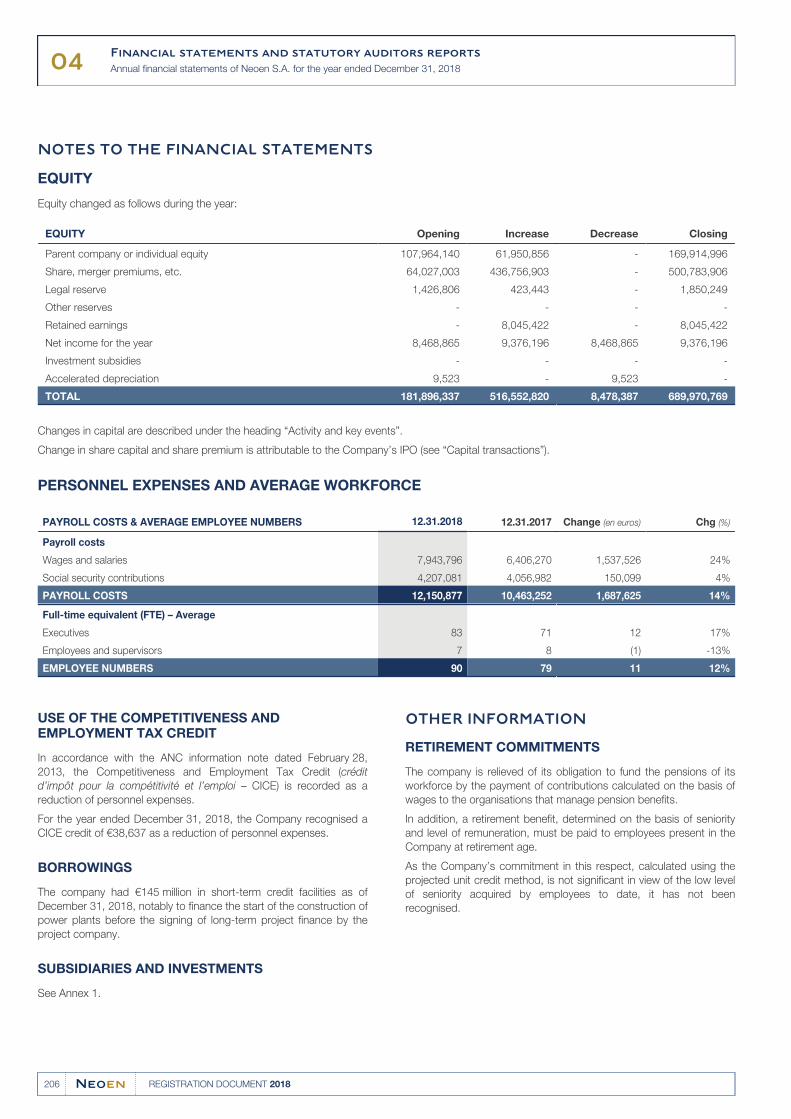
04Financial statements and statutory auditors reports
Annual financial statements of Neoen S.A. for the year ended December 31, 2018
206 REGISTRATION DOCUMENT 2018
NOTES TO THE FINANCIAL STATEMENTS
EQUITY
Equity changed as follows during the year:
EQUITY Opening Increase Decrease Closing
Parent company or individual equity 107,964,140 61,950,856 - 169,914,996
Share, merger premiums, etc. 64,027,003 436,756,903 - 500,783,906
Legal reserve 1,426,806 423,443 - 1,850,249
Other reserves - - - -
Retained earnings - 8,045,422 - 8,045,422
Net income for the year 8,468,865 9,376,196 8,468,865 9,376,196
Investment subsidies - - - -
Accelerated depreciation 9,523 - 9,523 -
TOTAL 181,896,337 516,552,820 8,478,387 689,970,769
Changes in capital are described under the heading “Activity and key events”.
Change in share capital and share premium is attributable to the Company’s IPO (see “Capital transactions”).
PERSONNEL EXPENSES AND AVERAGE WORKFORCE
PAYROLL COSTS & AVERAGE EMPLOYEE NUMBERS 12.31.2018 12.31.2017 Change (en euros) Chg (%)
Payroll costs
Wages and salaries 7,943,796 6,406,270 1,537,526 24%
Social security contributions 4,207,081 4,056,982 150,099 4%
PAYROLL COSTS 12,150,877 10,463,252 1,687,625 14%
Full-time equivalent (FTE) – Average
Executives 83 71 12 17%
Employees and supervisors 7 8 (1) -13%
EMPLOYEE NUMBERS 90 79 11 12%
USE OF THE COMPETITIVENESS AND EMPLOYMENT TAX CREDIT
In accordance with the ANC information note dated February 28,
2013, the Competitiveness and Employment Tax Credit (crédit
d’impôt pour la compétitivité et l’emploi – CICE) is recorded as a
reduction of personnel expenses.
For the year ended December 31, 2018, the Company recognised a
CICE credit of €38,637 as a reduction of personnel expenses.
BORROWINGS
The company had €145 million in short-term credit facilities as of
December 31, 2018, notably to finance the start of the construction of
power plants before the signing of long-term project finance by the
project company.
SUBSIDIARIES AND INVESTMENTS
See Annex 1.
OTHER INFORMATION
RETIREMENT COMMITMENTS
The company is relieved of its obligation to fund the pensions of its
workforce by the payment of contributions calculated on the basis of
wages to the organisations that manage pension benefits.
In addition, a retirement benefit, determined on the basis of seniority
and level of remuneration, must be paid to employees present in the
Company at retirement age.
As the Company’s commitment in this respect, calculated using the
projected unit credit method, is not significant in view of the low level
of seniority acquired by employees to date, it has not been
recognised.
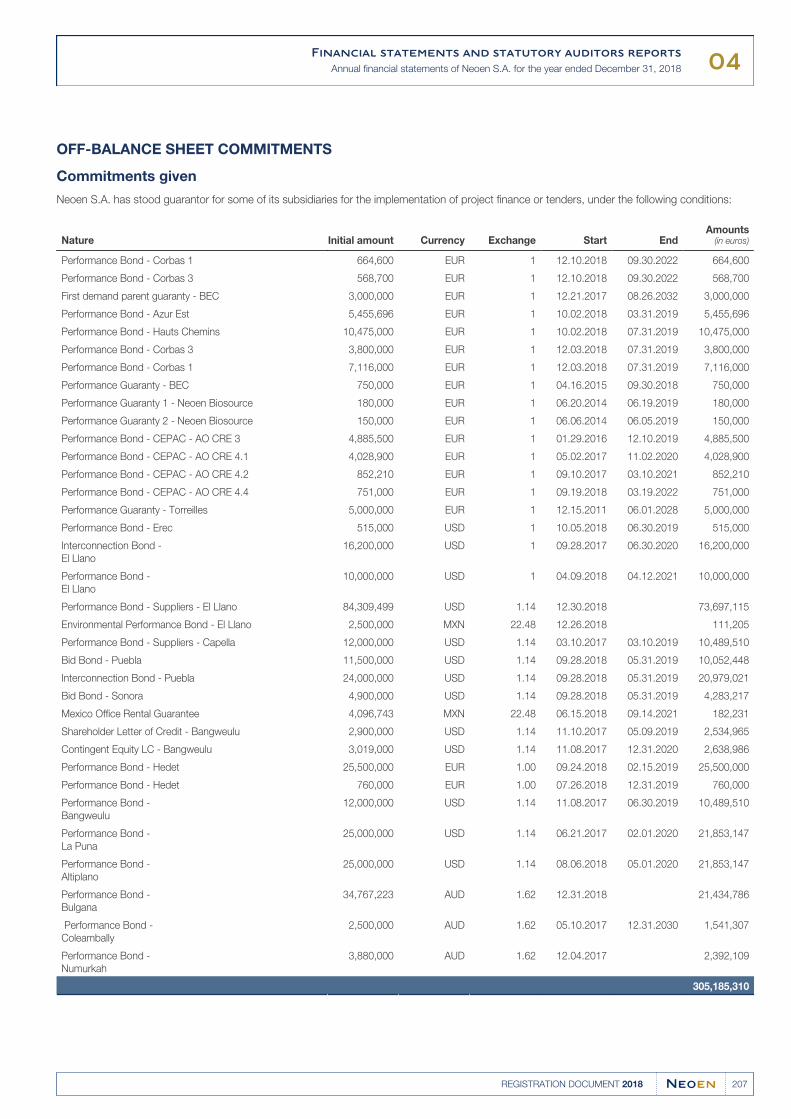
04Financial statements and statutory auditors reports
Annual financial statements of Neoen S.A. for the year ended December 31, 2018
207REGISTRATION DOCUMENT 2018
OFF-BALANCE SHEET COMMITMENTS
Commitments given
Neoen S.A. has stood guarantor for some of its subsidiaries for the implementation of project finance or tenders, under the following conditions:
Nature Initial amount Currency Exchange Start EndAmounts
(in euros)
Performance Bond - Corbas 1 664,600 EUR 1 12.10.2018 09.30.2022 664,600
Performance Bond - Corbas 3 568,700 EUR 1 12.10.2018 09.30.2022 568,700
First demand parent guaranty - BEC 3,000,000 EUR 1 12.21.2017 08.26.2032 3,000,000
Performance Bond - Azur Est 5,455,696 EUR 1 10.02.2018 03.31.2019 5,455,696
Performance Bond - Hauts Chemins 10,475,000 EUR 1 10.02.2018 07.31.2019 10,475,000
Performance Bond - Corbas 3 3,800,000 EUR 1 12.03.2018 07.31.2019 3,800,000
Performance Bond - Corbas 1 7,116,000 EUR 1 12.03.2018 07.31.2019 7,116,000
Performance Guaranty - BEC 750,000 EUR 1 04.16.2015 09.30.2018 750,000
Performance Guaranty 1 - Neoen Biosource 180,000 EUR 1 06.20.2014 06.19.2019 180,000
Performance Guaranty 2 - Neoen Biosource 150,000 EUR 1 06.06.2014 06.05.2019 150,000
Performance Bond - CEPAC - AO CRE 3 4,885,500 EUR 1 01.29.2016 12.10.2019 4,885,500
Performance Bond - CEPAC - AO CRE 4.1 4,028,900 EUR 1 05.02.2017 11.02.2020 4,028,900
Performance Bond - CEPAC - AO CRE 4.2 852,210 EUR 1 09.10.2017 03.10.2021 852,210
Performance Bond - CEPAC - AO CRE 4.4 751,000 EUR 1 09.19.2018 03.19.2022 751,000
Performance Guaranty - Torreilles 5,000,000 EUR 1 12.15.2011 06.01.2028 5,000,000
Performance Bond - Erec 515,000 USD 1 10.05.2018 06.30.2019 515,000
Interconnection Bond -
El Llano
16,200,000 USD 1 09.28.2017 06.30.2020 16,200,000
Performance Bond -
El Llano
10,000,000 USD 1 04.09.2018 04.12.2021 10,000,000
Performance Bond - Suppliers - El Llano 84,309,499 USD 1.14 12.30.2018 73,697,115
Environmental Performance Bond - El Llano 2,500,000 MXN 22.48 12.26.2018 111,205
Performance Bond - Suppliers - Capella 12,000,000 USD 1.14 03.10.2017 03.10.2019 10,489,510
Bid Bond - Puebla 11,500,000 USD 1.14 09.28.2018 05.31.2019 10,052,448
Interconnection Bond - Puebla 24,000,000 USD 1.14 09.28.2018 05.31.2019 20,979,021
Bid Bond - Sonora 4,900,000 USD 1.14 09.28.2018 05.31.2019 4,283,217
Mexico Office Rental Guarantee 4,096,743 MXN 22.48 06.15.2018 09.14.2021 182,231
Shareholder Letter of Credit - Bangweulu 2,900,000 USD 1.14 11.10.2017 05.09.2019 2,534,965
Contingent Equity LC - Bangweulu 3,019,000 USD 1.14 11.08.2017 12.31.2020 2,638,986
Performance Bond - Hedet 25,500,000 EUR 1.00 09.24.2018 02.15.2019 25,500,000
Performance Bond - Hedet 760,000 EUR 1.00 07.26.2018 12.31.2019 760,000
Performance Bond -
Bangweulu
12,000,000 USD 1.14 11.08.2017 06.30.2019 10,489,510
Performance Bond -
La Puna
25,000,000 USD 1.14 06.21.2017 02.01.2020 21,853,147
Performance Bond -
Altiplano
25,000,000 USD 1.14 08.06.2018 05.01.2020 21,853,147
Performance Bond -
Bulgana
34,767,223 AUD 1.62 12.31.2018 21,434,786
Performance Bond -
Coleambally
2,500,000 AUD 1.62 05.10.2017 12.31.2030 1,541,307
Performance Bond -
Numurkah
3,880,000 AUD 1.62 12.04.2017 2,392,109
305,185,310
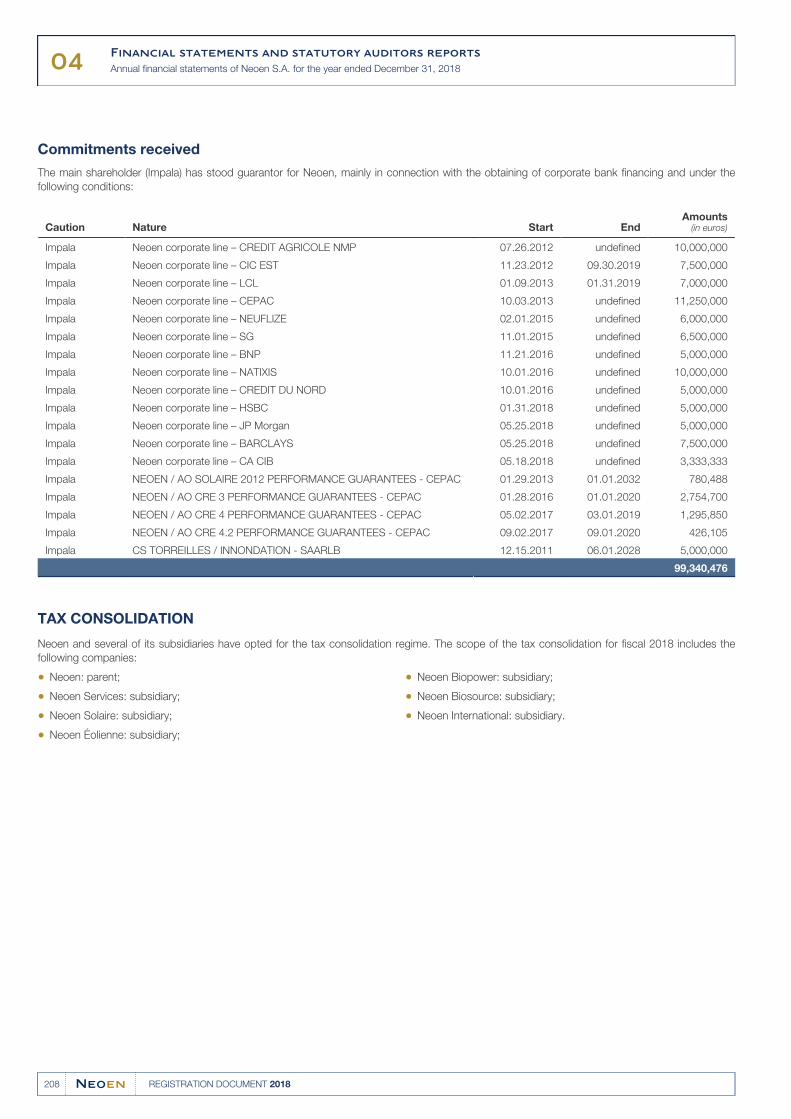
04Financial statements and statutory auditors reports
Annual financial statements of Neoen S.A. for the year ended December 31, 2018
208 REGISTRATION DOCUMENT 2018
Commitments received
The main shareholder (Impala) has stood guarantor for Neoen, mainly in connection with the obtaining of corporate bank financing and under the
following conditions:
Caution Nature Start EndAmounts
(in euros)
Impala Neoen corporate line – CREDIT AGRICOLE NMP 07.26.2012 undefined 10,000,000
Impala Neoen corporate line – CIC EST 11.23.2012 09.30.2019 7,500,000
Impala Neoen corporate line – LCL 01.09.2013 01.31.2019 7,000,000
Impala Neoen corporate line – CEPAC 10.03.2013 undefined 11,250,000
Impala Neoen corporate line – NEUFLIZE 02.01.2015 undefined 6,000,000
Impala Neoen corporate line – SG 11.01.2015 undefined 6,500,000
Impala Neoen corporate line – BNP 11.21.2016 undefined 5,000,000
Impala Neoen corporate line – NATIXIS 10.01.2016 undefined 10,000,000
Impala Neoen corporate line – CREDIT DU NORD 10.01.2016 undefined 5,000,000
Impala Neoen corporate line – HSBC 01.31.2018 undefined 5,000,000
Impala Neoen corporate line – JP Morgan 05.25.2018 undefined 5,000,000
Impala Neoen corporate line – BARCLAYS 05.25.2018 undefined 7,500,000
Impala Neoen corporate line – CA CIB 05.18.2018 undefined 3,333,333
Impala NEOEN / AO SOLAIRE 2012 PERFORMANCE GUARANTEES - CEPAC 01.29.2013 01.01.2032 780,488
Impala NEOEN / AO CRE 3 PERFORMANCE GUARANTEES - CEPAC 01.28.2016 01.01.2020 2,754,700
Impala NEOEN / AO CRE 4 PERFORMANCE GUARANTEES - CEPAC 05.02.2017 03.01.2019 1,295,850
Impala NEOEN / AO CRE 4.2 PERFORMANCE GUARANTEES - CEPAC 09.02.2017 09.01.2020 426,105
Impala CS TORREILLES / INNONDATION - SAARLB 12.15.2011 06.01.2028 5,000,000
99,340,476
TAX CONSOLIDATION
Neoen and several of its subsidiaries have opted for the tax consolidation regime. The scope of the tax consolidation for fiscal 2018 includes the
following companies:
Neoen: parent;●
Neoen Services: subsidiary;●
Neoen Solaire: subsidiary;●
Neoen Éolienne: subsidiary;●
Neoen Biopower: subsidiary;●
Neoen Biosource: subsidiary;●
Neoen International: subsidiary.●
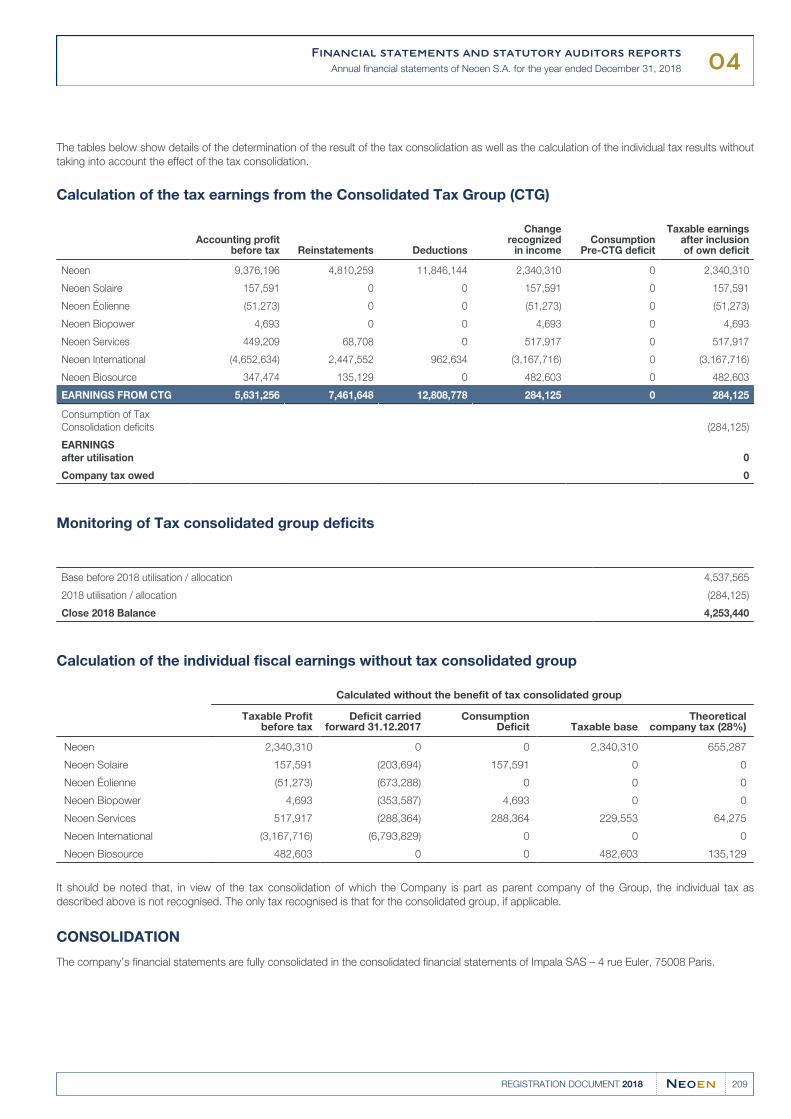
04Financial statements and statutory auditors reports
Annual financial statements of Neoen S.A. for the year ended December 31, 2018
209REGISTRATION DOCUMENT 2018
The tables below show details of the determination of the result of the tax consolidation as well as the calculation of the individual tax results without
taking into account the effect of the tax consolidation.
Calculation of the tax earnings from the Consolidated Tax Group (CTG)
Accounting profit
before tax Reinstatements Deductions
Changerecognized
in incomeConsumption
Pre-CTG deficit
Taxable earningsafter inclusionof own deficit
Neoen 9,376,196 4,810,259 11,846,144 2,340,310 0 2,340,310
Neoen Solaire 157,591 0 0 157,591 0 157,591
Neoen Éolienne (51,273) 0 0 (51,273) 0 (51,273)
Neoen Biopower 4,693 0 0 4,693 0 4,693
Neoen Services 449,209 68,708 0 517,917 0 517,917
Neoen International (4,652,634) 2,447,552 962,634 (3,167,716) 0 (3,167,716)
Neoen Biosource 347,474 135,129 0 482,603 0 482,603
EARNINGS FROM CTG 5,631,256 7,461,648 12,808,778 284,125 0 284,125
Consumption of Tax
Consolidation deficits (284,125)
EARNINGS
after utilisation 0
Company tax owed 0
Monitoring of Tax consolidated group deficits
Base before 2018 utilisation / allocation 4,537,565
2018 utilisation / allocation (284,125)
Close 2018 Balance 4,253,440
Calculation of the individual fiscal earnings without tax consolidated group
Calculated without the benefit of tax consolidated group
Taxable Profitbefore tax
Deficit carriedforward 31.12.2017
ConsumptionDeficit Taxable base
Theoreticalcompany tax (28%)
Neoen 2,340,310 0 0 2,340,310 655,287
Neoen Solaire 157,591 (203,694) 157,591 0 0
Neoen Éolienne (51,273) (673,288) 0 0 0
Neoen Biopower 4,693 (353,587) 4,693 0 0
Neoen Services 517,917 (288,364) 288,364 229,553 64,275
Neoen International (3,167,716) (6,793,829) 0 0 0
Neoen Biosource 482,603 0 0 482,603 135,129
It should be noted that, in view of the tax consolidation of which the Company is part as parent company of the Group, the individual tax as
described above is not recognised. The only tax recognised is that for the consolidated group, if applicable.
CONSOLIDATION
The company’s financial statements are fully consolidated in the consolidated financial statements of Impala SAS – 4 rue Euler, 75008 Paris.
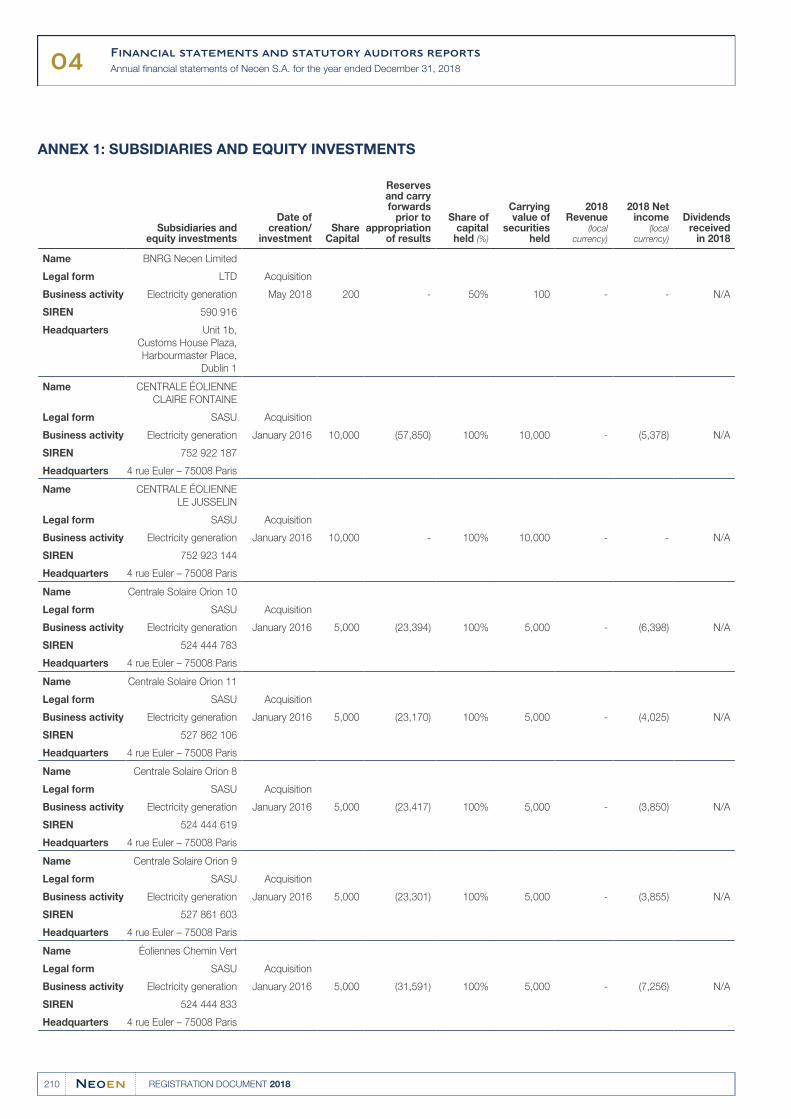
04Financial statements and statutory auditors reports
Annual financial statements of Neoen S.A. for the year ended December 31, 2018
210 REGISTRATION DOCUMENT 2018
ANNEX 1: SUBSIDIARIES AND EQUITY INVESTMENTS
Subsidiaries and
equity investments
Date ofcreation/
investmentShare
Capital
Reservesand carryforwards
prior toappropriation
of results
Share ofcapital
held (%)
Carryingvalue of
securitiesheld
2018Revenue
(localcurrency)
2018 Netincome
(localcurrency)
Dividendsreceived
in 2018
Name BNRG Neoen Limited
Legal form LTD Acquisition
Business activity Electricity generation May 2018 200 - 50% 100 - - N/A
SIREN 590 916
Headquarters Unit 1b,
Customs House Plaza,
Harbourmaster Place,
Dublin 1
Name CENTRALE ÉOLIENNE
CLAIRE FONTAINE
Legal form SASU Acquisition
Business activity Electricity generation January 2016 10,000 (57,850) 100% 10,000 - (5,378) N/A
SIREN 752 922 187
Headquarters 4 rue Euler – 75008 Paris
Name CENTRALE ÉOLIENNE
LE JUSSELIN
Legal form SASU Acquisition
Business activity Electricity generation January 2016 10,000 - 100% 10,000 - - N/A
SIREN 752 923 144
Headquarters 4 rue Euler – 75008 Paris
Name Centrale Solaire Orion 10
Legal form SASU Acquisition
Business activity Electricity generation January 2016 5,000 (23,394) 100% 5,000 - (6,398) N/A
SIREN 524 444 783
Headquarters 4 rue Euler – 75008 Paris
Name Centrale Solaire Orion 11
Legal form SASU Acquisition
Business activity Electricity generation January 2016 5,000 (23,170) 100% 5,000 - (4,025) N/A
SIREN 527 862 106
Headquarters 4 rue Euler – 75008 Paris
Name Centrale Solaire Orion 8
Legal form SASU Acquisition
Business activity Electricity generation January 2016 5,000 (23,417) 100% 5,000 - (3,850) N/A
SIREN 524 444 619
Headquarters 4 rue Euler – 75008 Paris
Name Centrale Solaire Orion 9
Legal form SASU Acquisition
Business activity Electricity generation January 2016 5,000 (23,301) 100% 5,000 - (3,855) N/A
SIREN 527 861 603
Headquarters 4 rue Euler – 75008 Paris
Name Éoliennes Chemin Vert
Legal form SASU Acquisition
Business activity Electricity generation January 2016 5,000 (31,591) 100% 5,000 - (7,256) N/A
SIREN 524 444 833
Headquarters 4 rue Euler – 75008 Paris
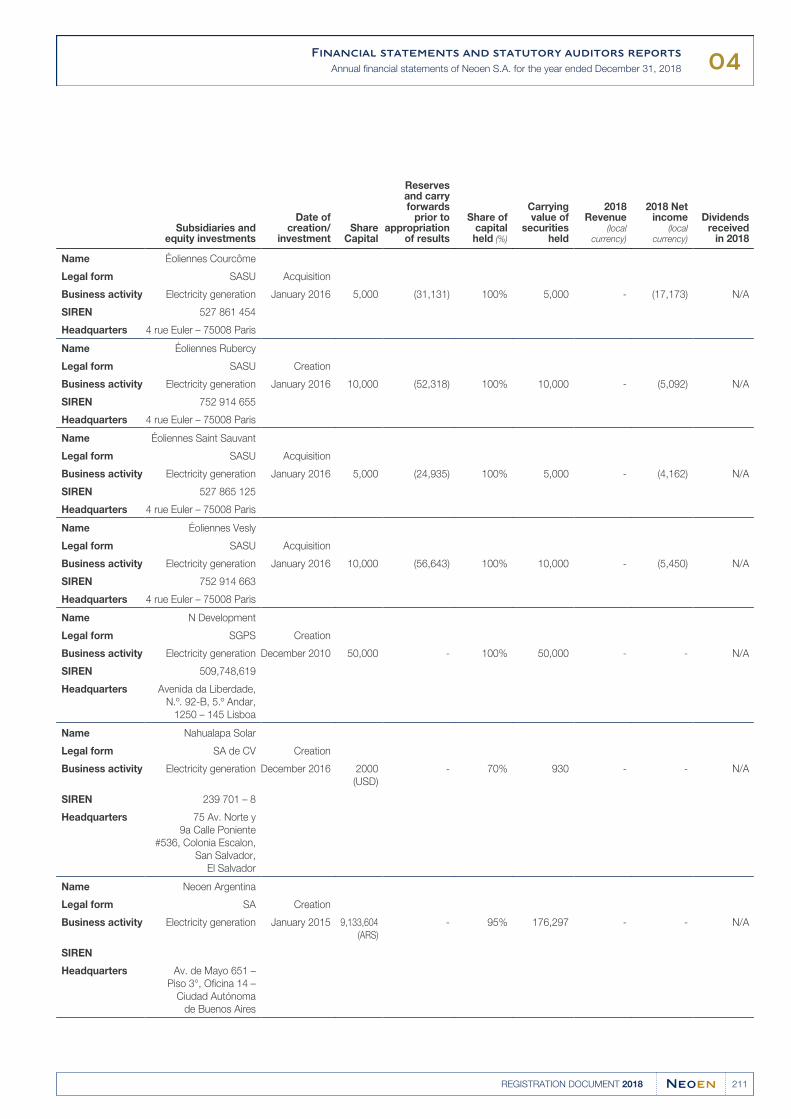
04Financial statements and statutory auditors reports
Annual financial statements of Neoen S.A. for the year ended December 31, 2018
211REGISTRATION DOCUMENT 2018
Subsidiaries andequity investments
Date ofcreation/
investmentShare
Capital
Reservesand carryforwards
prior toappropriation
of results
Share ofcapitalheld (%)
Carryingvalue of
securitiesheld
2018Revenue
(localcurrency)
2018 Netincome
(localcurrency)
Dividendsreceived
in 2018
Name Éoliennes Courcôme
Legal form SASU Acquisition
Business activity Electricity generation January 2016 5,000 (31,131) 100% 5,000 - (17,173) N/A
SIREN 527 861 454
Headquarters 4 rue Euler – 75008 Paris
Name Éoliennes Rubercy
Legal form SASU Creation
Business activity Electricity generation January 2016 10,000 (52,318) 100% 10,000 - (5,092) N/A
SIREN 752 914 655
Headquarters 4 rue Euler – 75008 Paris
Name Éoliennes Saint Sauvant
Legal form SASU Acquisition
Business activity Electricity generation January 2016 5,000 (24,935) 100% 5,000 - (4,162) N/A
SIREN 527 865 125
Headquarters 4 rue Euler – 75008 Paris
Name Éoliennes Vesly
Legal form SASU Acquisition
Business activity Electricity generation January 2016 10,000 (56,643) 100% 10,000 - (5,450) N/A
SIREN 752 914 663
Headquarters 4 rue Euler – 75008 Paris
Name N Development
Legal form SGPS Creation
Business activity Electricity generation December 2010 50,000 - 100% 50,000 - - N/A
SIREN 509,748,619
Headquarters Avenida da Liberdade,
N.º. 92-B, 5.º Andar,
1250 – 145 Lisboa
Name Nahualapa Solar
Legal form SA de CV Creation
Business activity Electricity generation December 2016 2000
(USD)
- 70% 930 - - N/A
SIREN 239 701 – 8
Headquarters 75 Av. Norte y
9a Calle Poniente
#536, Colonia Escalon,
San Salvador,
El Salvador
Name Neoen Argentina
Legal form SA Creation
Business activity Electricity generation January 2015 9,133,604
(ARS)
- 95% 176,297 - - N/A
SIREN
Headquarters Av. de Mayo 651 –
Piso 3°, Oficina 14 –
Ciudad Autónoma
de Buenos Aires
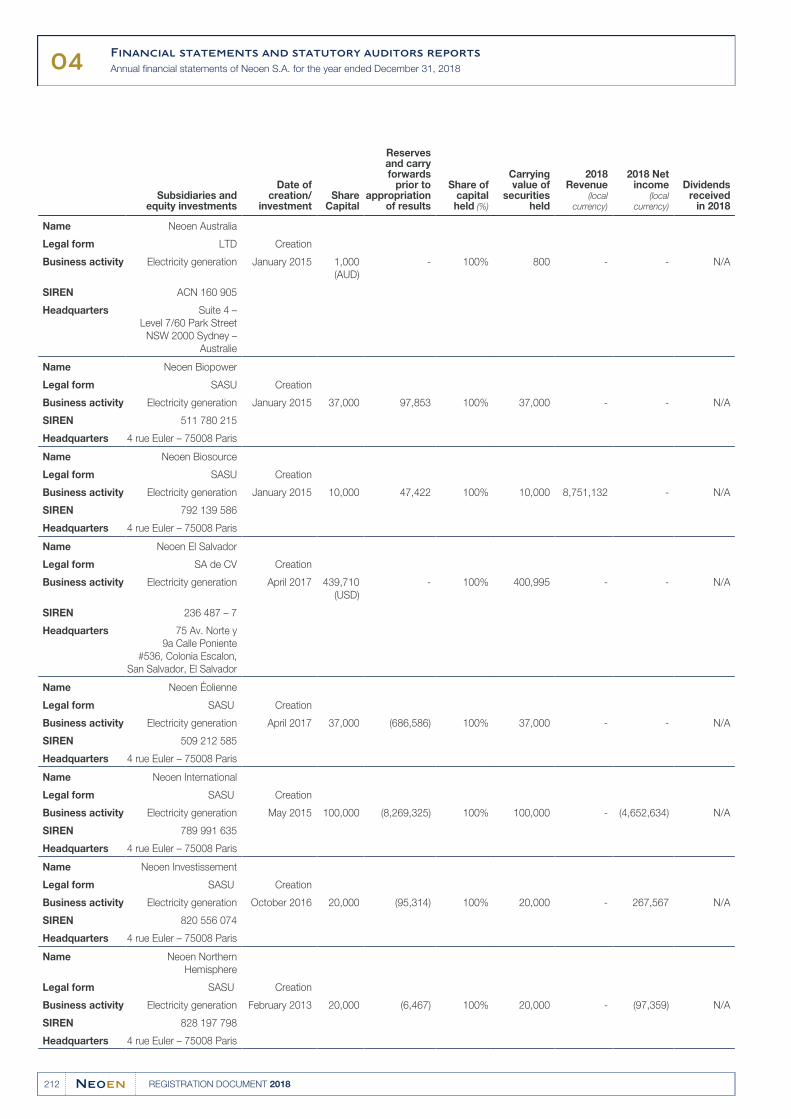
04Financial statements and statutory auditors reports
Annual financial statements of Neoen S.A. for the year ended December 31, 2018
212 REGISTRATION DOCUMENT 2018
Subsidiaries andequity investments
Date ofcreation/
investmentShare
Capital
Reservesand carryforwards
prior toappropriation
of results
Share ofcapitalheld (%)
Carryingvalue of
securitiesheld
2018Revenue
(localcurrency)
2018 Netincome
(localcurrency)
Dividendsreceived
in 2018
Name Neoen Australia
Legal form LTD Creation
Business activity Electricity generation January 2015 1,000
(AUD)
- 100% 800 - - N/A
SIREN ACN 160 905
Headquarters Suite 4 –
Level 7/60 Park Street
NSW 2000 Sydney –
Australie
Name Neoen Biopower
Legal form SASU Creation
Business activity Electricity generation January 2015 37,000 97,853 100% 37,000 - - N/A
SIREN 511 780 215
Headquarters 4 rue Euler – 75008 Paris
Name Neoen Biosource
Legal form SASU Creation
Business activity Electricity generation January 2015 10,000 47,422 100% 10,000 8,751,132 - N/A
SIREN 792 139 586
Headquarters 4 rue Euler – 75008 Paris
Name Neoen El Salvador
Legal form SA de CV Creation
Business activity Electricity generation April 2017 439,710
(USD)
- 100% 400,995 - - N/A
SIREN 236 487 – 7
Headquarters 75 Av. Norte y
9a Calle Poniente
#536, Colonia Escalon,
San Salvador, El Salvador
Name Neoen Éolienne
Legal form SASU Creation
Business activity Electricity generation April 2017 37,000 (686,586) 100% 37,000 - - N/A
SIREN 509 212 585
Headquarters 4 rue Euler – 75008 Paris
Name Neoen International
Legal form SASU Creation
Business activity Electricity generation May 2015 100,000 (8,269,325) 100% 100,000 - (4,652,634) N/A
SIREN 789 991 635
Headquarters 4 rue Euler – 75008 Paris
Name Neoen Investissement
Legal form SASU Creation
Business activity Electricity generation October 2016 20,000 (95,314) 100% 20,000 - 267,567 N/A
SIREN 820 556 074
Headquarters 4 rue Euler – 75008 Paris
Name Neoen Northern
Hemisphere
Legal form SASU Creation
Business activity Electricity generation February 2013 20,000 (6,467) 100% 20,000 - (97,359) N/A
SIREN 828 197 798
Headquarters 4 rue Euler – 75008 Paris
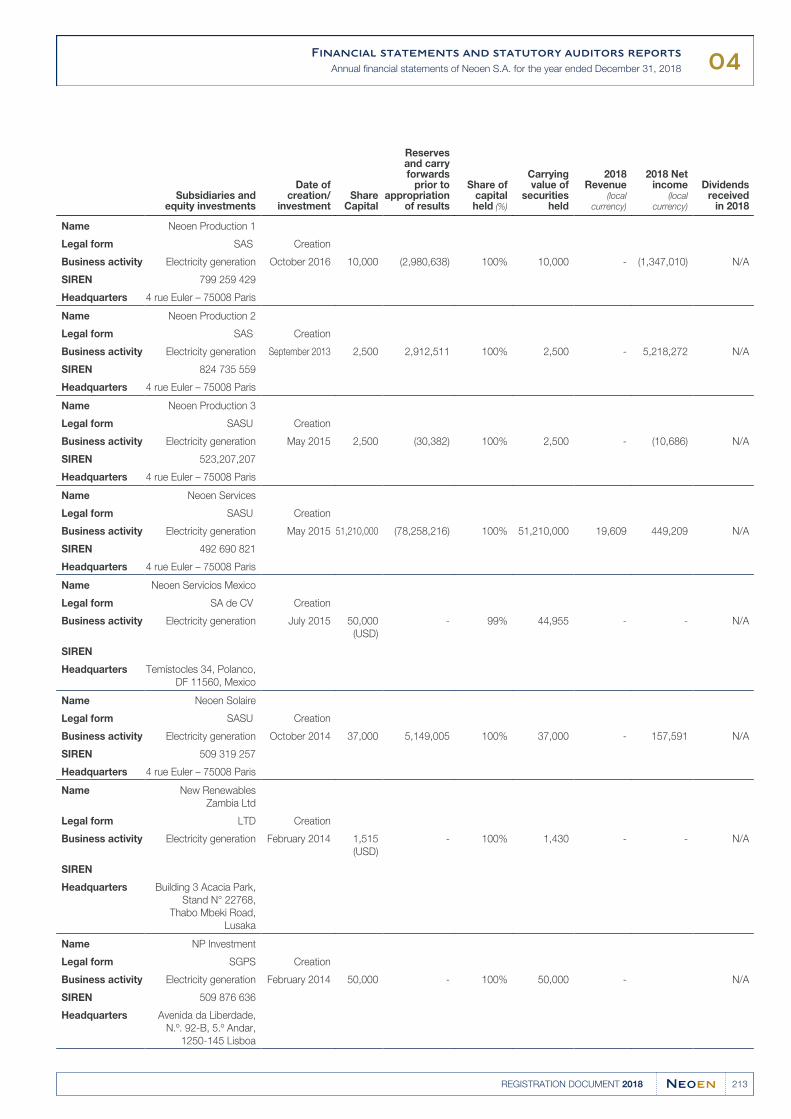
04Financial statements and statutory auditors reports
Annual financial statements of Neoen S.A. for the year ended December 31, 2018
213REGISTRATION DOCUMENT 2018
Subsidiaries andequity investments
Date ofcreation/
investmentShare
Capital
Reservesand carryforwards
prior toappropriation
of results
Share ofcapitalheld (%)
Carryingvalue of
securitiesheld
2018Revenue
(localcurrency)
2018 Netincome
(localcurrency)
Dividendsreceived
in 2018
Name Neoen Production 1
Legal form SAS Creation
Business activity Electricity generation October 2016 10,000 (2,980,638) 100% 10,000 - (1,347,010) N/A
SIREN 799 259 429
Headquarters 4 rue Euler – 75008 Paris
Name Neoen Production 2
Legal form SAS Creation
Business activity Electricity generation September 2013 2,500 2,912,511 100% 2,500 - 5,218,272 N/A
SIREN 824 735 559
Headquarters 4 rue Euler – 75008 Paris
Name Neoen Production 3
Legal form SASU Creation
Business activity Electricity generation May 2015 2,500 (30,382) 100% 2,500 - (10,686) N/A
SIREN 523,207,207
Headquarters 4 rue Euler – 75008 Paris
Name Neoen Services
Legal form SASU Creation
Business activity Electricity generation May 2015 51,210,000 (78,258,216) 100% 51,210,000 19,609 449,209 N/A
SIREN 492 690 821
Headquarters 4 rue Euler – 75008 Paris
Name Neoen Servicios Mexico
Legal form SA de CV Creation
Business activity Electricity generation July 2015 50,000
(USD)
- 99% 44,955 - - N/A
SIREN
Headquarters Temístocles 34, Polanco,
DF 11560, Mexico
Name Neoen Solaire
Legal form SASU Creation
Business activity Electricity generation October 2014 37,000 5,149,005 100% 37,000 - 157,591 N/A
SIREN 509 319 257
Headquarters 4 rue Euler – 75008 Paris
Name New Renewables
Zambia Ltd
Legal form LTD Creation
Business activity Electricity generation February 2014 1,515
(USD)
- 100% 1,430 - - N/A
SIREN
Headquarters Building 3 Acacia Park,
Stand N° 22768,
Thabo Mbeki Road,
Lusaka
Name NP Investment
Legal form SGPS Creation
Business activity Electricity generation February 2014 50,000 - 100% 50,000 - N/A
SIREN 509 876 636
Headquarters Avenida da Liberdade,
N.º. 92-B, 5.º Andar,
1250-145 Lisboa
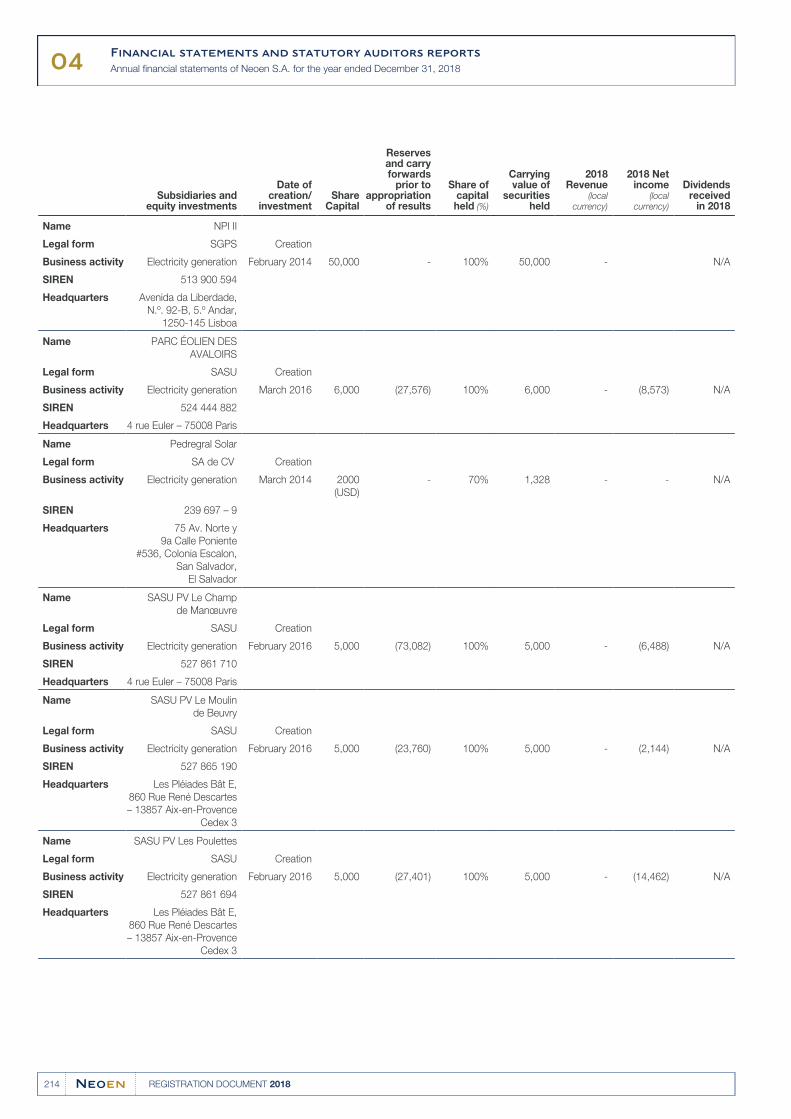
04Financial statements and statutory auditors reports
Annual financial statements of Neoen S.A. for the year ended December 31, 2018
214 REGISTRATION DOCUMENT 2018
Subsidiaries andequity investments
Date ofcreation/
investmentShare
Capital
Reservesand carryforwards
prior toappropriation
of results
Share ofcapitalheld (%)
Carryingvalue of
securitiesheld
2018Revenue
(localcurrency)
2018 Netincome
(localcurrency)
Dividendsreceived
in 2018
Name NPI II
Legal form SGPS Creation
Business activity Electricity generation February 2014 50,000 - 100% 50,000 - N/A
SIREN 513 900 594
Headquarters Avenida da Liberdade,
N.º. 92-B, 5.º Andar,
1250-145 Lisboa
Name PARC ÉOLIEN DES
AVALOIRS
Legal form SASU Creation
Business activity Electricity generation March 2016 6,000 (27,576) 100% 6,000 - (8,573) N/A
SIREN 524 444 882
Headquarters 4 rue Euler – 75008 Paris
Name Pedregral Solar
Legal form SA de CV Creation
Business activity Electricity generation March 2014 2000
(USD)
- 70% 1,328 - - N/A
SIREN 239 697 – 9
Headquarters 75 Av. Norte y
9a Calle Poniente
#536, Colonia Escalon,
San Salvador,
El Salvador
Name SASU PV Le Champ
de Manœuvre
Legal form SASU Creation
Business activity Electricity generation February 2016 5,000 (73,082) 100% 5,000 - (6,488) N/A
SIREN 527 861 710
Headquarters 4 rue Euler – 75008 Paris
Name SASU PV Le Moulin
de Beuvry
Legal form SASU Creation
Business activity Electricity generation February 2016 5,000 (23,760) 100% 5,000 - (2,144) N/A
SIREN 527 865 190
Headquarters Les Pléiades Bât E,
860 Rue René Descartes
– 13857 Aix-en-Provence
Cedex 3
Name SASU PV Les Poulettes
Legal form SASU Creation
Business activity Electricity generation February 2016 5,000 (27,401) 100% 5,000 - (14,462) N/A
SIREN 527 861 694
Headquarters Les Pléiades Bât E,
860 Rue René Descartes
– 13857 Aix-en-Provence
Cedex 3
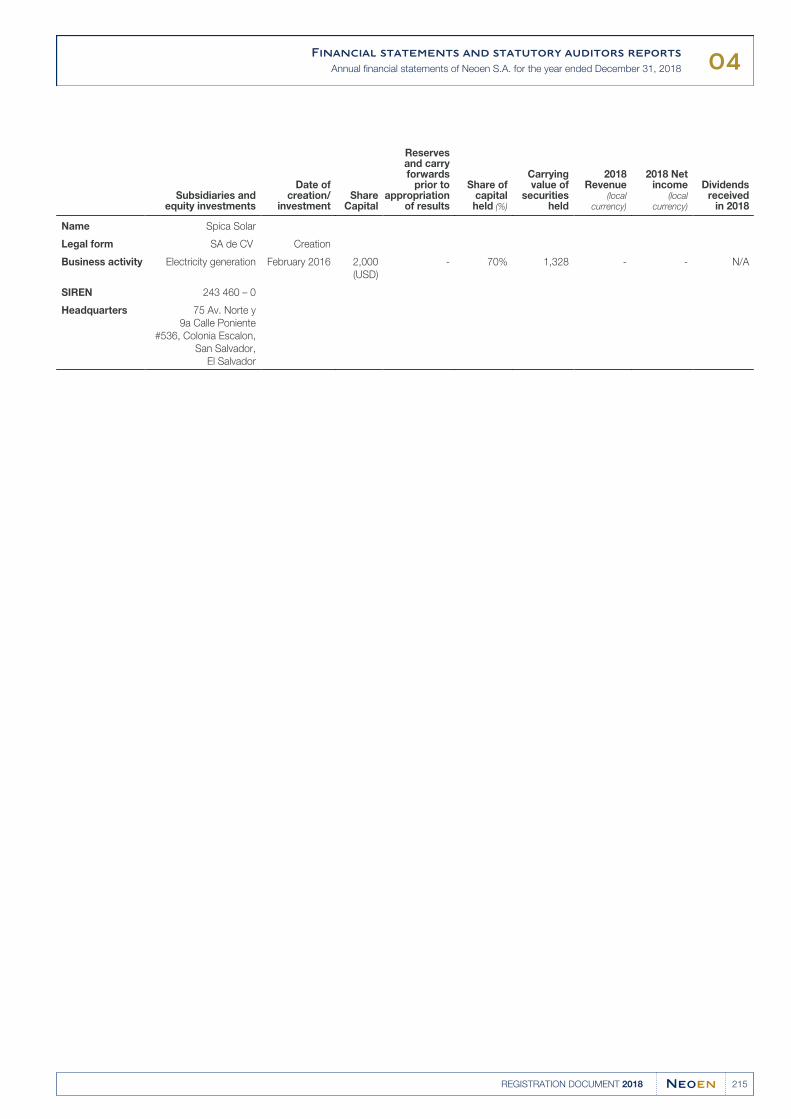
04Financial statements and statutory auditors reports
Annual financial statements of Neoen S.A. for the year ended December 31, 2018
215REGISTRATION DOCUMENT 2018
Subsidiaries andequity investments
Date ofcreation/
investmentShare
Capital
Reservesand carryforwards
prior toappropriation
of results
Share ofcapitalheld (%)
Carryingvalue of
securitiesheld
2018Revenue
(localcurrency)
2018 Netincome
(localcurrency)
Dividendsreceived
in 2018
Name Spica Solar
Legal form SA de CV Creation
Business activity Electricity generation February 2016 2,000
(USD)
- 70% 1,328 - - N/A
SIREN 243 460 – 0
Headquarters 75 Av. Norte y
9a Calle Poniente
#536, Colonia Escalon,
San Salvador,
El Salvador
04Financial statements and statutory auditors reports
Statutory auditors’ certification report on the annual financial statements of Neoen S.A. as of December 31, 2018
216 REGISTRATION DOCUMENT 2018
STATUTORY AUDITORS’ CERTIFICATION REPORT ON THE ANNUAL 4.4
FINANCIAL STATEMENTS OF NEOEN S.A. AS OF DECEMBER 31, 2018
This is a translation into English of the statutory auditors’ report on the financial statements of the Company issued in French and it is provided solely
for the convenience of English-speaking users.
This statutory auditors’ report includes information required by French law, such as information about the appointment of the statutory auditors
or verification of the management report and other documents provided to shareholders.
This report should be read in conjunction and construed in accordance with French law and professional auditing standards applicable in France.
Year ended December 31, 2018
To the Neoen shareholders’ meeting,
OPINION
In compliance with the engagement entrusted to us by your shareholders’ meeting, we have audited the accompanying financial statements of
Neoen for the year ended December 31, 2018.
In our opinion, the financial statements give a true and fair view of the assets and liabilities and of the financial position of the Company as of
December 31, 2018 and of the results of its operations for the year then ended in accordance with French accounting principles.
The audit opinion expressed above is consistent with our report to the Audit Committee.
BASIS FOR OPINION
AUDIT FRAMEWORK
We conducted our audit in accordance with professional standards applicable in France. We believe that the audit evidence we have obtained is
sufficient and appropriate to provide a basis for our opinion.
Our responsibilities under those standards are further described in the “statutory auditors’ Responsibilities for the Audit of the Financial Statements”
section of our report.
INDEPENDENCE
We conducted our audit in compliance with independence rules applicable to us, for the period from January 1, 2018 to the issue date of our report
and in particular we did not provide any prohibited non-audit services referred to in Article 5(1) of Regulation (EU) no. 537/2014 or in the French
code of ethics for statutory auditors (Code de déontologie).
JUSTIFICATION OF ASSESSMENTS – KEY AUDIT MATTERS
In accordance with the requirements of Articles L. 823-9 and R. 823-7 of the French Commercial Code (Code de commerce) relating to the justification
of our assessments, we are required to bring your attention to the key audit matters relating to risks of material misstatement that, in our professional
judgment, were of most significance in the audit of the financial statements of the current period, as well as our responses to those risks.
We have determined that there were no key audit matters to disclose in our report.
SPECIFIC VERIFICATIONS
We have also performed, in accordance with professional standards applicable in France, the specific verifications required by French law.
04Financial statements and statutory auditors reports
Statutory auditors’ certification report on the annual financial statements of Neoen S.A. as of December 31, 2018
217REGISTRATION DOCUMENT 2018
INFORMATION GIVEN IN THE MANAGEMENT REPORT AND IN THE OTHER
DOCUMENTS ADDRESSED TO SHAREHOLDERS WITH RESPECT TO THE FINANCIAL
POSITION AND THE FINANCIAL STATEMENTS.
We have no comments to make on the fair presentation and consistency with the financial statements of the information given in the Board of
Directors’ management report and in the documents addressed to shareholders with respect to the financial position and the financial statements.
We attest the fair presentation and the consistency with the financial statements of the information relating to payment terms, mentioned in
Article D. 441-4 of the French Commercial Code.
REPORT ON CORPORATE GOVERNANCE
We attest that the Board of Directors’ report on corporate governance contains the information required by Articles L. 225-37-3 and L. 225-37-4 of
the French Commercial Code.
Concerning the information presented in accordance with the requirements of Article L. 225-37-3 of the French Commercial Code relating to remuneration
and benefits received by corporate officers and any other commitments made in their favor, we have verified its consistency with the financial statements, or
with the underlying information used to prepare these financial statements and, where applicable, with the information obtained by your Company from
companies controlling your Company or controlled by it. Based on this work, we attest the accuracy and fair presentation of this information.
OTHER DISCLOSURES
Pursuant to the law, we have verified that the management report contains the appropriate disclosures as to acquisitions of investments and
controlling interests.
REPORT ON OTHER LEGAL AND REGULATORY REQUIREMENTS
APPOINTMENT OF THE STATUTORY AUDITORS
Constantin Associés were appointed as statutory auditors of Neoen by the shareholders’ meeting of September 13, 2008 and replaced by Deloitte at the
shareholders’ meeting of April 22, 2014. RSM Paris were appointed as statutory auditors by the shareholders’ meeting of September 12, 2018.
As of December 31, 2018, Deloitte & Associés and RSM Paris were in the 11th year and first year of total uninterrupted engagement, respectively.
RESPONSIBILITIES OF MANAGEMENT AND THOSE CHARGED WITH GOVERNANCE
FOR THE FINANCIAL STATEMENTS
Management is responsible for the preparation and fair presentation of the financial statements in accordance with French accounting principles,
and for such internal control as management determines is necessary to enable the preparation of financial statements that are free from material
misstatement, whether due to fraud or error.
In preparing the financial statements, management is responsible for assessing the Company’s ability to continue as a going concern, disclosing, as
applicable, matters related to going concern and using the going concern basis of accounting unless it is expected to liquidate the Company or to
cease its operations.
The Audit Committee is responsible for monitoring the financial reporting process and the effectiveness of internal control and risk management
systems and, where applicable, its internal audit, regarding the accounting and financial reporting procedures.
The financial statements have been approved by the Board of Directors.
04Financial statements and statutory auditors reports
Statutory auditors’ certification report on the annual financial statements of Neoen S.A. as of December 31, 2018
218 REGISTRATION DOCUMENT 2018
STATUTORY AUDITORS’ RESPONSIBILITIES FOR THE AUDIT OF THE FINANCIAL
STATEMENTS
OBJECTIVE AND AUDIT APPROACH
Our role is to issue a report on the financial statements. Our objective is to obtain reasonable assurance about whether the financial statements as a
whole are free from material misstatement. Reasonable assurance is a high level of assurance, but is not a guarantee that an audit conducted in
accordance with professional standards will always detect a material misstatement when it exists. Misstatements can arise from fraud or error and
are considered material if, individually or in the aggregate, they could reasonably be expected to influence the economic decisions of users taken on
the basis of these financial statements.
As specified by Article L. 823-10-1 of the French Commercial Code, the scope of our statutory audit does not include assurance on the future
viability of the Company or the quality with which Company’s management has conducted or will conduct the affairs of the entity.
As part of an audit in accordance with professional standards applicable in France, the statutory auditor exercises professional judgment throughout
the audit. He also:
identifies and assesses the risks of material misstatement of the financial statements, whether due to fraud or error, designs and performs audit●procedures responsive to those risks, and obtains audit evidence that is sufficient and appropriate to provide a basis for his opinion; The risk of
not detecting a material misstatement resulting from fraud is higher than for one resulting from error, as fraud may involve collusion, forgery,
intentional omissions, misrepresentations, or the override of internal control;
obtains an understanding of internal control relevant to the audit in order to design audit procedures that are appropriate in the circumstances,●but not for the purpose of expressing an opinion on the effectiveness of the internal control;
evaluates the appropriateness of accounting policies used and the reasonableness of accounting estimates and related disclosures made by●management in the financial statements;
concludes on the appropriateness of management’s use of the going concern basis of accounting and, based on the audit evidence obtained,●whether a material uncertainty exists related to events or conditions that may cast significant doubt on the Company’s ability to continue as a going
concern. This assessment is based on the audit evidence obtained up to the date of his audit report. However, future events or conditions may
cause the Company to cease to continue as a going concern. If the statutory auditor concludes that a material uncertainty exists, there is a
requirement to draw attention in the audit report to the related disclosures in the financial statements or, if such disclosures are not provided or
inadequate, to modify the opinion expressed therein;
evaluates the overall presentation of the financial statements and whether the financial statements represent the underlying transactions and●events in a manner that achieves fair presentation.
REPORT TO THE AUDIT COMMITTEE
We submit a report to the Audit Committee which includes in particular a description of the scope of the audit and the audit program implemented, as well
as significant audit findings. We also bring to its attention any significant deficiencies in internal control regarding the accounting and financial reporting
procedures that we have identified.
Our report to the Audit Committee includes the risks of material misstatement that, in our professional judgment, were of most significance in the
audit of the financial statements of the current period and which are therefore the key audit matters that we are required to describe in this report.
We also provide the Audit Committee with the declaration referred to in Article 6 of Regulation (EU) no. 537/2014, confirming our independence
pursuant to the rules applicable in France as defined in particular by Articles L. 822-10 to L. 822-14 of the French Commercial Code and in the
French code of ethics for statutory auditors. Where appropriate, we discuss with the Audit Committee the risks that may reasonably be thought to
bear on our independence, and where applicable, the related safeguards.
At Paris-la Défense and Paris, April 17, 2019
The statutory auditors
DELOITTE & ASSOCIÉS
François Xavier AMEYE
RSM Paris
Étienne de BRYAS
04Financial statements and statutory auditors reports
219REGISTRATION DOCUMENT 2018

220 REGISTRATION DOCUMENT 2018
05
221REGISTRATION DOCUMENT 2018
SUSTAINABLE DEVELOPMENT AND SOCIAL
RESPONSIBILITY
POSITIVE CONTRIBUTION 5.1
TO THE UNITED NATIONS
SUSTAINABLE DEVELOPMENT
GOALS 222
CONSIDERATION OF CSR/HSE5.2
MATTERS IN THE GROUP’S
PROJECT MANAGEMENT 223
Integrate and involve 5.2.1
all stakeholders in managing
the project 223
A proactive policy5.2.2
on the environment and protection
of biodiversity 225
MEASUREMENT OF THE IMPACTS5.3 226
Carbon emissions avoided5.3.1 226
Recognition by third-party 5.3.2
organisations 226
REPORT BY THE THIRD-PARTY 5.4
ORGANISATION 227
VIGILANCE PLAN5.5 229
05Sustainable development and social responsibility
Positive contribution to the United Nations sustainable development goals
222 REGISTRATION DOCUMENT 2018
Sustainable development and social responsibility
Neoen is an independent renewable energy producer which decided Neoen has a long-term vision and continuity approach for its plants.
to focus on mature and entirely carbon-free technologies in order to On this basis, the Group keeps a close watch on the challenges
provide energy to as many people as possible, in all the geographies relating to local acceptance of its projects. Moreover, the Group pays
in which it operates and at the best price. Conscious of the special particular attention to promoting social measures to the benefit of its
role it has to play in promoting sustainable development and its own employees and to abiding by the principles of good governance.
responsibility to “give an example”, Neoen develops, finances, builds In this case, the Group adopted the recommendations of the
and operates its facilities in accordance with the best performance AFEP-MEDEF Code. Please refer to Chapter 6 “Corporate
standards as defined by major international institutions. governance report” of this document for more information.
Neoen voluntarily initiated a ratings-based approach to its
environmental and societal responsibility by recognised bodies in
order to be in the forefront of best practices. Regarding its positioning
and the initiatives it has set up, Neoen makes a positive contribution
to sustainable development issues. On top of its general policy,
On the date of this Registration Document, the Company is not
required to prepare a Corporate Social Responsibility (CSR) report, as
provided for by Article L. 225-102-1 of the French Commercial Code,
insofar as it does not meet applicable regulatory criteria.
POSITIVE CONTRIBUTION TO THE UNITED NATIONS SUSTAINABLE 5.1
DEVELOPMENT GOALS
DIRECT IMPACTS
Regarding its positioning and the initiatives it has set up, Neoen
makes a positive contribution to the sustainable development goals
(SDG), that 193 members of the United Nations adopted in
September 2015, with the aim of ending poverty, protecting the
planet and guaranteeing prosperity for all. Neoen’s contribution is
more directly related to Goal 7 (clean energy and at an affordable
cost), in particular its targets 7.1 (“by 2030, ensure universal access
to affordable, reliable and modern energy services, at an affordable
cost”), 7.2 (by 2030, increase substantially the share of renewable
energy in the global energy mix), and also Goals 12 (responsible
consumption and production) and 13 (actions to combat climate
change) which are the priority goals immediately relating to its activity.
INDIRECT IMPACTS
Neoen also considers that due to its positioning, which is focused on
marketing, at or less than grid parity, the most competitive electricity
wherever the Group is established, it contributes to facilitating access
to electricity, which is an essential service, and hence participates in
ending poverty (Goal 1 – No poverty) and in reducing inequalities
within a said country (Goal 10 – Reduced inequalities) by fostering its
economic activity. Furthermore, Neoen only markets green energy.
In this way, the Group contributes to reducing the exposure of people
in vulnerable situations to climate-related extreme events (Goal 1.5)
and takes action against air pollution and contamination so as to
enable all to live in good health and promote well-being at any age
(Goal 3).
Neoen is an extremely local player. With more than 23 nationalities,
the Group is concerned with giving priority to local employment,
whether directly, in its own subsidiaries, or indirectly, by encouraging
its co-contracting parties to use, as far as possible, local labour and
local sub-contractors to enable the local economy to become more
dynamic. In this way, in Zambia, the construction of its Bangweulu
solar plant, at the peak of the works, needed to employ more than
800 workers on the site, the large majority of whom were local
people.
In Mexico, the construction of the El Llano plant should employ up to
820 people on site during its construction. This requirement meets
Goal 8 (Decent work and economic growth) of the SDGs.
Neoen is a responsible player. In line with its internal code, signed by
all employees and according to which it undertakes to carry out its
business in such a manner to avoid or limit, as far as possible,
damage to the environment other than the visual damage inherent in
the activity in question, Neoen has a specific vision regarding
environmental protection and the respect for biodiversity (Goal 15 –
Life on land).
CONTRIBUTION THROUGH THE GROUP’S VALUES AND SETTING UP OPERATIONAL PROCESSES ON AN AD HOC BASIS
The Group’s internal Code also formalises the Group’s social
commitments. This Code is based on the following principles:
health and safety: the Group ensures the safety of its employees●and seeks to prevent any health risk they might incur, especially
when travelling in countries with specific risks;
compliance with local laws and regulations: the Group respects,●and ensures that its employees comply with, the laws and
regulations of each country in which it operates. More specifically,
rules of conduct are established to fight passive and active
corruption risks; and
reporting obligation: to better enable the Group to monitor the●ethical behaviour of its employees, the charter provides for upward
reporting obligations to management, particularly with respect to
conflicts of interest or, more generally, in the event of a risk of
non-compliance with local regulations. In addition, employees have
the opportunity to retain the services of a third-party lawyer
regarding any difficulty they may encounter, both in terms of
interpretation of the principles of the charter and in the context of
its application.
05Sustainable development and social responsibility
Consideration of CSR/HSE matters in the Group’s project management
223REGISTRATION DOCUMENT 2018
The principles of this Code, and particularly the special emphasis the
Group places on combating corruption, fall under Goal 16
(Peace, justice and strong institutions) of the SDG. It should be noted
that at the date of this registration document, the Group is not aware
of past occurrences, nor the existence of any current conduct, that
violates the provisions of Neoen’s charter.
Neoen builds sustainable infrastructures. Scaled to produce electricity
at or under grid parity and non-polluting, in general they have the
advantage of excellent local acceptance. Neoen has a long-term vision:
in general, it is the majority shareholder of its infrastructure and,
therefore, its goal is to optimise the yield of its plants over their entire
life cycle. Consequently, this enables it to take appropriate decisions
regarding plant maintenance. In some cases, such as in Mozambique,
the facilities are operated in the form of concessions of limited duration
(30 years in Mozambique). Neoen’s responsible attitude with regard to
the construction of resilient infrastructures, which, in addition, uses
local labour trained for their construction and operation, falls within
Goal 9 of the SDG (Industries, innovation and infrastructure).
SOCIETAL AND CULTURAL COMMITMENT (PHILANTHROPY)
Lastly, and as a complement to its activities, Neoen regularly
contributed to philanthropic initiatives and in support of local
education and culture. For instance, in El Salvador, in 2017, Neoen
financed a giant fresco by the artist Fernando Llort on the walls of its
Providencia Solar plant. In Australia, the Group chose to display
aboriginal paintings on the wind turbine masts at its Hornsdale plant.
From a philanthropic standpoint, in France, the Group decided for the
first time in 2018 to support the Helen Keller International foundation
for its unique PlanVue project – the aim of which is to create
awareness of, detect and treat vision problems in schools.
Similarly, in 2019, the Group tasked in Madagascar Électriciens Sans
Frontières to install electricity in two schools built by the non-profit
organization Se Tendre la Main. Provided that this initiative, which
should be completed during 2019, is a success, the Group could
perpetuate its programme to install electricity in schools in partnership
with the two organisations. These two initiatives fall within Goal 4
(Give access to education) which is dear to Neoen.
CONSIDERATION OF CSR/HSE MATTERS IN THE GROUP’S PROJECT 5.2
MANAGEMENT
The perpetuation of its plants is part of Neoen’s philosophy. On this basis, the Group keeps a close watch on the challenges relating to local
acceptance of its projects.
INTEGRATE AND INVOLVE ALL STAKEHOLDERS IN MANAGING THE PROJECT5.2.1
Throughout its entire value chain, the Group ensures that both it, and
the persons for whom it is responsible, comply with the
environmental, social and loyalty principles it has set for itself or to
which it is bound.
IN THE DEVELOPMENT PHASE
Hence, each plant’s establishment is decided in collaboration with the
local authorities and residents close to the plants. Public meetings are
organized on a regular basis, make it possible to bring local residents
and communities into the projects. These meetings are an
opportunity for the Neoen teams to present the project’s integration
into the landscape, the conclusion of the social (in developing
countries) and environmental study of the project and the support
measures that will be undertaken accordingly, and more generally,
together with the local people so as to be in a position to propose
solutions that most people will find satisfactory. In this context,
specific support measures may be proposed (for example, in France,
financing a skating rink, setting up an educational pathway, etc.).
In Australia, a specific website for each project goes online from the
beginnings of the project’s development so that everyone can obtain
all the information available on the project and, if need be, contact the
team in charge of developing the project. An online book of
grievances is also available.
The Group may also take specific steps in favour of local populations,
particularly in Western Australia where the Group, prior to each project,
carries out a study to preserve the aboriginal population (Aboriginal
Heritage Survey Report) submitted to the Western Australia
Department of Planning, Lands and Heritage. In El Salvador,
the development of both the Goup’s projects was conducted right from
the start in close conjunction with the funds dedicated to the
development of social projects for the benefit of the local population.
IN THE CONSTRUCTION PHASE
The Group endeavours to retain suppliers that are responsible and
comply with the most stringent standards and afterwards check that
these rules were complied with through their integration in the EPC
(Engineering Procurement Construction) contracts or the contracts for
the supply of wind turbines signed by the Group. Accordingly, the
Group, through its procurement policy and in accordance with its
processes, selects suppliers of solar panels, wind turbines and other
system components (BOS and BOP components) whose products
come from ISO 9001 and ISO 14001 certified factories. The Group
systematically visits its main potential suppliers’ factories before
initiating a business relationship. Afterwards, it endeavours to repeat
these visits as often as possible, at least once a year.
05Sustainable development and social responsibility
Consideration of CSR/HSE matters in the Group’s project management
224 REGISTRATION DOCUMENT 2018
Regardless of the country in which its projects are located, the Group
only works with first-class EPC contractors which can only be chosen
after a rigorous pre-selection process.
In particular, and in developing countries, special attention is paid to
combating corruption: any co-contractor whose revenue exceeds the
threshold of US$75,000 must produce a Compliant Policy before
undertaking any work for the Group. In emerging markets, the Group
carries out social and environmental studies that are shared with EPC
contractors during their selection procedure. In emerging markets, the
EPC must then implement social action and environmental plans and
undertake, as far as possible, to call on local sub-contracts and local
labour. In some cases, as in Zambia or Jamaica, these actions plans
may be broken down into specific action plans for the benefit of the
communities (Community Engagement and Development Plan) and
on-site work covered by a specific contract (Site Labour Agreement).
At the contract stage, the Group sends the EPC contractor the
guidelines on health, safety and the environment (“HSE”) incorporated
into the plan, produced by its construction department (Health, Safety
and Environnement Management Plan or HSEMP). These HSE
guidelines are drawn up in line with the regulations in France and
Australia, where the Group considers that local regulations are
sufficiently stringent and, stricter than local regulations in the other
countries, particularly in the emerging countries. In this case, the
Group will particularly refer to the International Finance Corporation
(IFC) guidelines. The HSE guidelines are systematically appended to
EPC and O&M contracts and apply to all the Group’s contractors, as
well as their sub-contractors.
In addition to being responsible for monitoring the construction,
dedicated third parties are in charge of confirming that these social and
environmental measures are properly applied and, more generally, that
the fundamental rules recommended by the International Labour
Organisation (ILO) and the European Convention on Human Rights (for
developing countries) are complied with on the site. In France, for
example, this management is entrusted to entities (Apave, Socotec,
Bureau Veritas, etc.) that assume the role of coordinator for safety and
health protection (coordinateur en matière de sécurité et de protection
de la santé, “CSPS”) and establish a general coordination plan (plan
général de coordination, or “PCG”) that sets forth safety and health
guidelines to be followed at the Group’s sites. Outside of France, such
management is carried out by dedicated third-party organisations with
established track records, which prepare monthly monitoring reports.
At any time, the HSE third-party organisation can alert the project
manager or the parent company if it notices that a commitment is not
respected. In certain cases, like in Zambia, a dedicated Community
Liaison Officer may also be appointed when the project construction
starts and for the entire duration of the operation.
IN THE OPERATION PHASE
Once the facility begins operating, the monitoring of HSE compliance
is delegated to the service provider that ensures the maintenance of
the facility (the O&M provider), which is usually the EPC contractor or
the wind turbine supplier, in coordination with the relevant asset
manager. HSE reporting to the Group is carried out on a monthly
basis and focuses on workplace accidents and environmental impact,
the application of the measures recommended by the environmental
impact study as well as the implementation of the rules applicable to
the facility. All of the Group’s HSE management systems are
implemented using OHSAS 18001 and ISO 14001 guidelines.
At the same time, the Group closely supervises the performance of its
facilities as well as the satisfaction of the population living near the site
and the communities enjoying the economic benefits of the projects
through taxes and land leases. Lastly, in many cases, aware of the role
it can play in local development, the Group continues to actively back
social economic projects, particularly:
in Australia where the majority of projects support community funds●created for each project, on an ad hoc basis. For instance, in South
Australia, the Group founded the Hornsdale Wind Farm Community
Fund, which aims to fund local initiatives in the Jamestown area.
Administered jointly with a local elected offcial and community
representatives, the fund will be financed up to AUD 120,000 per year
for 20 years.
39 projects were supported in 2017 and 2018, including the●construction of a children’s garden and the installation of solar
panels at the Gladstone memorial site.
Furthermore, an Aboriginal community fund with A$50,000●provided by Hornsdale Asset Co for 25 years, intended for the
Ngadjuri and Nukunu Aboriginal Corporations was set up to
preserve aboriginal culture;
in El Salvador where 3% of the revenue generated by the Providencia●and Capella solar plants are given to social development projects in
co-ordination with the Social Investment Funds for Local Development
for Providencia (the Social Investment Fund for local Development
develops local projects such as roads, water and electricity supplies or
school renovation), in co-ordination with the FUSAL El Salvador
foundation for Capella;
in Zambia where 0.5% of income generated by the plant will be given●back into the Community Development Plan to benefit people living near
the project;
in Mozambique where it is planned to continue participating in projects●financing the local economy after the facility has been commissioned;
in Portugal, where the Group supports the University of Coruche of the●municipality where its solar plant is located, by financing three-year
scholarships intended to promote renewable energy academic curricula
and to train the industry’s future actors. The Group has also
implemented a five-year financing program with the Seixal municipal
energy agency, the objective of which is to promote more thoughtful
energy consumption, increase the use of renewable energies and
sustainably develop the municipality.
05Sustainable development and social responsibility
Consideration of CSR/HSE matters in the Group’s project management
225REGISTRATION DOCUMENT 2018
Since the summer of 2018, the Group has set up a HSE Committee which
is composed of members of Group’s management and personnel, and
which meets quarterly. The HSE rules recommended by the Group aim to
prevent accidents, injuries and pollution in the workplace, especially on the
Group’s sites, and also during the construction and operation phases of
the facilities. These objectives are set forth in the HSE specifications
developed by the Group, as follows:
avoid serious employee injuries;●
improve working conditions and reduce risks for each workstation;●
promote proactive information reporting related to near-accidents and●dangerous situations;
promote the Group’s HSE culture (site visits, 15-minute safety meetings,●audit, training, etc.); and
minimize as much as possible the use and prevent the risk of spills of●hazardous substances.
The task of the HSE Committee is to control the Group’s performance of
the HSE policy through monitoring, on a consolidated basis, of all the
indicators relating to these objectives. These indicators also directly
concern the Group’s teams and also all the employees of the
co-contractors working on the Group’s sites, especially during the
construction phase.
A PROACTIVE POLICY ON THE ENVIRONMENT AND PROTECTION 5.2.2
OF BIODIVERSITY
The Group pays particular attention to respecting the habitats of the
species on its project sites as well as to land protection. For each
project and regardless of the country, an assessment of the
environmental impacts, the impact study (botanical, avifauna,
landscape, acoustic and other studies) is carried out to establish the
support measures which will have to be put in place during
construction and also during operation of the facility.
The Group has also formally made several commitments in favor of
the environment and biodiversity among which are:
limited construction phases to limit disturbances during the●breeding season of surrounding species;
construction of drainage networks simultaneously with the●construction of the facility;
construction of corridors to facilitate mobility of native animal●species;
monitoring the evolution of animal species on the site;●
land-clearing to prevent the spread of fires and facilitate the●circulation of fire-fighting vehicles;
preservation of historical heritage that may be present on the facility●site;
limitation of noise pollution, especially for wind turbines.●
equivalent of the entire surface area occupied by the Cestas plant has
been reforested in the same locality through financing from the project’s
revenues. In Portugal, during the construction of the Seixal power plant,
more than a thousand native trees and shrubs were planted around the
facility to promote landscape integration. In Australia, the Hornsdale
plant was designed to ensure the preservation of the site’s gray lizard
population. In Jamaica, the Paradise Park project’s Biodiversity
Management Plan requires all activity to cease when the Jamaican
crocodile (protected species) is present, until NEPA (National
Environment and Planning Agency) can send a team to the site to
capture the animal and release it in another area.
For example, in France, the Cestas power plant incorporates
environmental protection measures such as the preservation of
wetlands, the protection of plants and animals species on-site
(in particular butterflies), and full landscape integration achieved by
planting hedgerows at the edge of the power plant. Furthermore, the
All the Group’s development, construction and operating teams are
trained to protect the environment and respect biodiversity.
Correct application of the support measures recommended by the
impact study will be closely monitored by a third party, during the
construction and for a large part of the facility’s life.
Lastly, in line with its Code of conduct, according to which it
undertakes to carry out its activity avoiding or limiting, as far as
possible, damage to the environment other than visual damage
inherent in the activity concerned, the Group complies with all the
obligations applicable thereto, particularly with regard to standards
and constitution of provisions and guarantees for dismantling its
facilities at the end of its operation. For the dismantling and recycling
of solar park components, the Group is a member of PV Cycle, a
waste-collection and recycling provider for solar panels at the end of
their useful lives that is active throughout Europe. More generally, the
Group seeks to keep its facilities’ sites clean and reusable for future
renewable energy production facilities.
05Sustainable development and social responsibility
Measurement of the impacts
226 REGISTRATION DOCUMENT 2018
MEASUREMENT OF THE IMPACTS5.3
The Group’s main consolidated indicator for the measurement of its action is the quantification of the tonnes of CO2 carbon avoided thanks to its
business. Furthermore, the scope of the actions initiated by the Group is widely recognised by third-party organisations.
CARBON EMISSIONS AVOIDED5.3.1
As a responsible participant in the renewable energy sector, the respectively, according to its own calculations deriving from the strict
Group is actively involved, due to the nature of its business, in the application of the dedicated methods proposed by the European
global challenges, such as the fight against greenhouse gas Investment Bank.
emissions and climate change. During the course of the year ended
December 31, 2017 and December 31, 2018, the Group reduced its
carbon footprint by 810,239 and 1,494,678 metric tons of CO2,
The Group appointed Deloitte to review compliance of its
understanding of the EIB methods and the formulas it applied.
RECOGNITION BY THIRD-PARTY ORGANISATIONS5.3.2
VIGEO CERTIFICATION5.3.2.1
In line with its positioning and its convictions, early on, the Group has financings have been validated in accordance with the applicable
been concerned to incorporate the environmental components into green bonds principles published by the International Capital Market
the methods for financing its projects. As a result, it completed its first Association (“ICMA”) in 2015 and in 2017, and certified by Vigeo Eiris
issuance of green bonds in an amount of €40 million in October 2015, (“Vigeo”), a recognized expert in sustainable development, which
intended to finance 13 solar and wind projects located in France and completed such certification following its environmental, social and
Portugal with aggregate operating capacity of 100 MW. This financing governance (“ESG”) due diligence with respect to the Group.
method was repeated in December 2017, when the Group
completed the issuance of another round of green bonds in a
maximum amount of €245 million to finance a portfolio of solar and
onshore wind projects in Australia, Latin America and France totalling
1.6 GW of aggregate operating capacity. These green bond
In September 2018, the Group initiated a corporate rating process
with Vigeo Eiris on a voluntary basis. The result of this was an A1
rating representing the Group’s inclusion in the 1st quartile of
companies rated by Vigeo Eiris and ranked Neoen among the first
4 percent of companies with the organisation’s best rating.
AWARD BY THE CLIMATE BONDS STANDARD BOARD5.3.2.2
In March 2019, Climate Bonds Standard Board spontaneously awarded the Group the Green Loan certification for its project’s financing put in
place in Mexico for its El Llano solar project.
05Sustainable development and social responsibility
Report by the third-party organisation
227REGISTRATION DOCUMENT 2018
REPORT BY THE THIRD-PARTY ORGANISATION5.4
NEOEN
Moderate assurance declaration on the “Sustainable development and corporate responsibility” section of the Neoen Registration Document.
(Financial year ended December 31, 2018)
At the Neoen general shareholders’ meeting,
In our capacity as the statutory auditors of your company, we are hereby presenting you with our declaration on the “Sustainable development and
corporate responsibility” section in relation to the financial year ended December 31, 2018, as presented in the Neoen Registration Document.
RESPONSIBILITY OF THE ENTITY
Neoen is responsible for the drafting of the “Sustainable development and corporate responsibility” section of its Registration Document.
INDEPENDENCE AND QUALITY CONTROL
Our independence is defined by the provisions of Article L. 822-11-3 of the French Commercial Code and the industry’s code of ethics. In addition,
we have put in place a quality control system which includes documented procedures and policies aimed at ensuring compliance with the rules of
ethics, professional best practice and all applicable legal and statutory regulations.
RESPONSIBILITY OF THE STATUTORY AUDITOR
We are responsible, on the basis of our work, for producing the moderate assurance declaration on the accuracy of the “Sustainable development
and corporate responsibility” section in relation to the financial year ended December 31, 2018, presented in Neoen’s Registration Document.
However, we have no obligation to give our opinion on:
compliance by the entity with all other applicable legal and statutory provisions, notably with regard to the plan for vigilance and the prevention●of corruption and tax evasion;
compliance by products and services with all applicable regulations.●
NATURE AND SCOPE OF THE WORK
We have completed the following tasks:
we have examined the “Sustainable development and corporate responsibility” section of Neoen’s Registration Document;●
we have selected certain qualitative data from this chapter;●
we have checked via sampling the accuracy of the data, via interviews and/or via the provision of supporting evidence.●
We consider that the work carried out by us, in exercising our professional judgment, allows us to reach a conclusion of moderate assurance;
a more certain degree of assurance would have required more extensive verification work.
MEANS AND RESOURCES
Our investigations involved the skills of two individuals and was carried out between 9 and 23 April 2019, covering a total working time of three days.
To assist us with the performance of our work, we called on individuals specialised in sustainable development and corporate responsibility.
We have held interviews with the person responsible for the preparation of the “Sustainable development and corporate responsibility” section
of Neoen’s Registration Document.
05Sustainable development and social responsibility
Report by the third-party organisation
228 REGISTRATION DOCUMENT 2018
CONCLUSION
On the basis of our work, we have not noted any significant anomalies liable to challenge the fact that the following topics are presented in an
accurate manner:
indirect impacts: number of indirect jobs in Mexico and Zambia, internal code of conduct;●
positive contribution to the United Nations’ sustainable development goals via the Group’s values and the introduction of ad hoc operational●processes: internal code of conduct;
commitments to cultural and social activities: Mural by Fernando Llort in El Salvador, aboriginal painting in Australia, “Plan Vue” project with Helen●Keller International;
integration of stakeholders:●
during the development phase: measures in favour of the local communities in Western Australia and in El Salvador,●
during the construction phase: procurement policy involving the purchase of products from plants holding IS0 9001 and 14001●certification, Compliant Policy for co-contractors with turnover in excess of $100 thousand, HSE guidelines attached as schedules to EPC
and O&M contracts, verification of health and safety instructions by third party organisations,
during the operation phase: monthly HSE reporting, association with ad hoc Australian community funds;●
policy on environmental matters and the preservation of biodiversity: environmental impact studies, creation of provisions and guarantees for the●decommissioning of facilities;
measurement of impacts: carbon emissions avoided and assessment by the firm Vigeo Eiris.●
Paris, April 25, 2019
RSM Paris
Martine Leconte
CSR Partner
05Sustainable development and social responsibility
Vigilance Plan
229REGISTRATION DOCUMENT 2018
VIGILANCE PLAN5.5
At the date of this Registration Document, in view of the number of employees, the Company is not required to prepare a duty of care plan as
provided for under Article L. 225-102-4 of the French Commercial Code.

230 REGISTRATION DOCUMENT 2018
06
231REGISTRATION DOCUMENT 2018
REPORT ON CORPORATE GOVERNANCE
STATE OF GOVERNANCE6.1 232
Composition of the Board 6.1.1
of Directors 232
Censeurs of the Board of Directors6.1.2 236
Proposal to the annual 6.1.3
shareholders’ meeting concerning
the evolution of the Board
of Directors 237
CORPORATE GOVERNANCE6.2
ORGANISATION 238
Principles governing 6.2.1
the composition of the Board
of Directors 238
Principles governing the functioning 6.2.2
of the governance 242
REMUNERATION OF EXECUTIVE 6.3
OFFICERS 247
Remuneration of executive officers6.3.1 247
Report on options and free shares6.3.2 251
Other information about 6.3.3
the executive officer 255
Sum of provisions made 6.3.4
by the Company or its subsidiaries
for pensions, retirement benefits
or other benefits 256
Principles and Criteria 6.3.5
for Determining, Allocating
and Granting Compensation
of the Chairman and Chief
Executive Officer in 2019 256
OTHER INFORMATION6.4 258
List of delegations in place granted 6.4.1
by the general shareholders’
meeting with regard to capital
increases (including uses) 258
Agreements entered into by officers 6.4.2
or shareholders with subsidiaries
or sub-subsidiaries of Neoen 260
Main related-party transactions6.4.3 260
Factors that may have an impact 6.4.4
in the event of a public offer 262
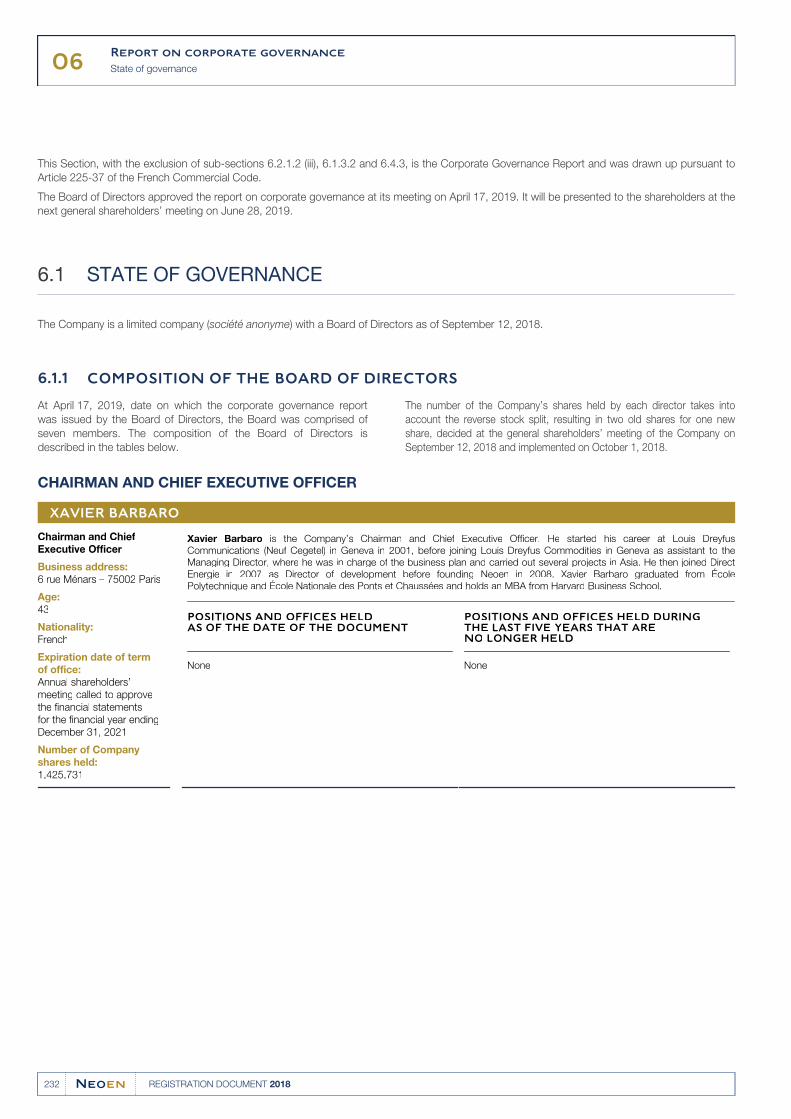
06Report on corporate governance
State of governance
232 REGISTRATION DOCUMENT 2018
Report on corporate governance
This Section, with the exclusion of sub-sections 6.2.1.2 (iii), 6.1.3.2 and 6.4.3, is the Corporate Governance Report and was drawn up pursuant to
Article 225-37 of the French Commercial Code.
The Board of Directors approved the report on corporate governance at its meeting on April 17, 2019. It will be presented to the shareholders at the
next general shareholders’ meeting on June 28, 2019.
STATE OF GOVERNANCE6.1
The Company is a limited company (société anonyme) with a Board of Directors as of September 12, 2018.
COMPOSITION OF THE BOARD OF DIRECTORS6.1.1
At April 17, 2019, date on which the corporate governance report
was issued by the Board of Directors, the Board was comprised of
seven members. The composition of the Board of Directors is
described in the tables below.
The number of the Company’s shares held by each director takes into
account the reverse stock split, resulting in two old shares for one new
share, decided at the general shareholders’ meeting of the Company on
September 12, 2018 and implemented on October 1, 2018.
CHAIRMAN AND CHIEF EXECUTIVE OFFICER
XAVIER BARBARO
Chairman and ChiefExecutive Officer
Business address:6 rue Ménars – 75002 Paris
Age:43
Nationality:French
Expiration date of term of office:Annual shareholders’meeting called to approvethe financial statementsfor the financial year endingDecember 31, 2021
Number of Company shares held:1,425,731
Xavier Barbaro is the Company’s Chairman and Chief Executive Officer. He started his career at Louis DreyfusCommunications (Neuf Cegetel) in Geneva in 2001, before joining Louis Dreyfus Commodities in Geneva as assistant to theManaging Director, where he was in charge of the business plan and carried out several projects in Asia. He then joined DirectEnergie in 2007 as Director of development before founding Neoen in 2008. Xavier Barbaro graduated from ÉcolePolytechnique and École Nationale des Ponts et Chaussées and holds an MBA from Harvard Business School.
POSITIONS AND OFFICES HELD
AS OF THE DATE OF THE DOCUMENT
POSITIONS AND OFFICES HELD DURING
THE LAST FIVE YEARS THAT ARE
NO LONGER HELD
None None
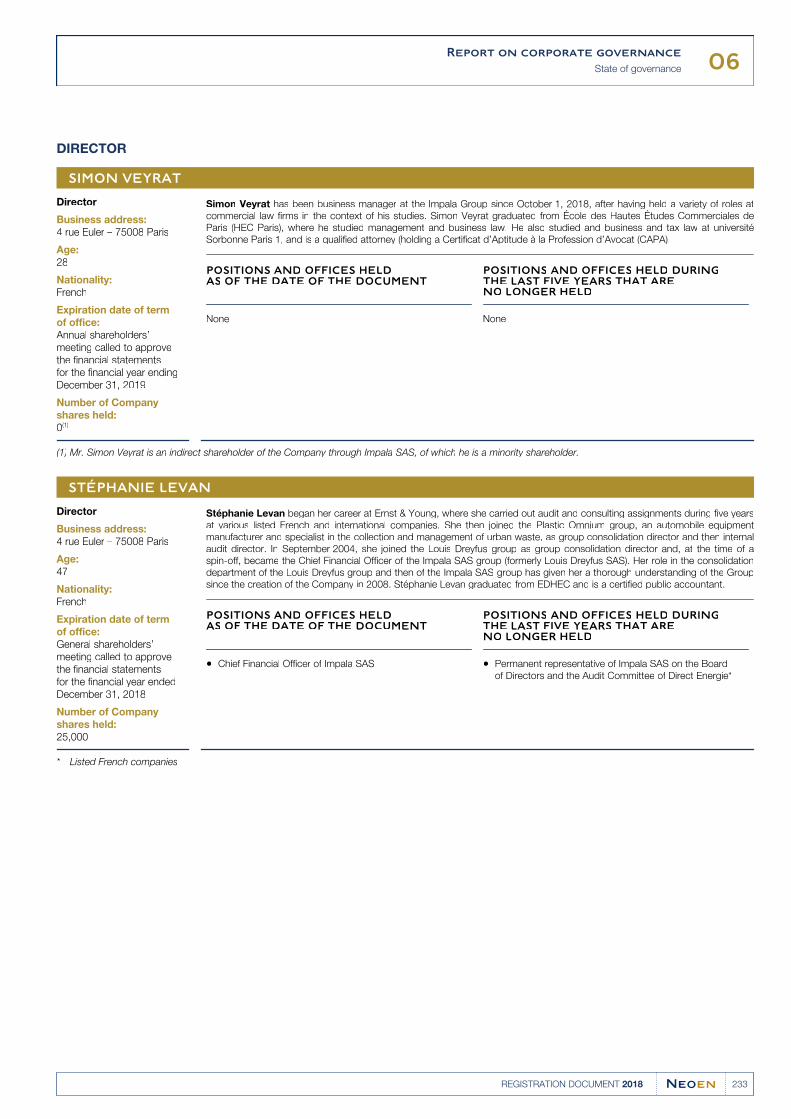
06Report on corporate governance
State of governance
233REGISTRATION DOCUMENT 2018
DIRECTOR
SIMON VEYRAT
Director
Business address:4 rue Euler – 75008 Paris
Age:28
Nationality:French
Expiration date of term of office:Annual shareholders’meeting called to approvethe financial statementsfor the financial year endingDecember 31, 2019
Number of Company shares held:0(1)
Simon Veyrat has been business manager at the Impala Group since October 1, 2018, after having held a variety of roles atcommercial law firms in the context of his studies. Simon Veyrat graduated from École des Hautes Études Commerciales deParis (HEC Paris), where he studied management and business law. He also studied and business and tax law at universitéSorbonne Paris 1, and is a qualified attorney (holding a Certificat d’Aptitude à la Profession d’Avocat (CAPA).
POSITIONS AND OFFICES HELD
AS OF THE DATE OF THE DOCUMENT
POSITIONS AND OFFICES HELD DURING
THE LAST FIVE YEARS THAT ARE
NO LONGER HELD
None None
Mr. Simon Veyrat is an indirect shareholder of the Company through Impala SAS, of which he is a minority shareholder.(1)
STÉPHANIE LEVAN
Director
Business address:4 rue Euler – 75008 Paris
Age:47
Nationality:French
Expiration date of term of office:General shareholders’meeting called to approvethe financial statementsfor the financial year endedDecember 31, 2018
Number of Company shares held:25,000
Stéphanie Levan began her career at Ernst & Young, where she carried out audit and consulting assignments during five yearsat various listed French and international companies. She then joined the Plastic Omnium group, an automobile equipmentmanufacturer and specialist in the collection and management of urban waste, as group consolidation director and then internalaudit director. In September 2004, she joined the Louis Dreyfus group as group consolidation director and, at the time of aspin-off, became the Chief Financial Officer of the Impala SAS group (formerly Louis Dreyfus SAS). Her role in the consolidationdepartment of the Louis Dreyfus group and then of the Impala SAS group has given her a thorough understanding of the Groupsince the creation of the Company in 2008. Stéphanie Levan graduated from EDHEC and is a certified public accountant.
POSITIONS AND OFFICES HELD
AS OF THE DATE OF THE DOCUMENT
POSITIONS AND OFFICES HELD DURING
THE LAST FIVE YEARS THAT ARE
NO LONGER HELD
Chief Financial Officer of Impala SAS● Permanent representative of Impala SAS on the Board●of Directors and the Audit Committee of Direct Energie*
Listed French companies*
06Report on corporate governance
State of governance
234 REGISTRATION DOCUMENT 2018
CÉLINE ANDRÉ
Director as permanentrepresentativeof BpifranceInvestissement
Business address:6/8 boulevard Haussmann –75009 Paris
Age:40
Nationality:French
Expiration date of term of office:Annual shareholders’meeting called to approvethe financial statements forthe financial year endingDecember 31, 2020
Number of Company shares held:0(1)
Céline André began her career as a lawyer in 2004 in the mergers and acquisitions practices of French law firms such as GideLoyrette Nouel and Veil Jourde. In 2012, she joined the legal department of the Fonds Stratégique d’Investissement (FSI) beforeserving as an in-house lawyer in the legal department of Bpifrance in 2013. She became Director of Investments for the mid-and large-cap team at Bpifrance Investissement in 2016, and then Director of Investments for the same team as of October 1,2017 (which has since become the Large Cap team of the Capital Development department). Céline André holds a master’s inprivate law from the university of Lille 2 and a CAPA (Certificate of Aptitude à la Profession d’Avocat – qualified attorney). She isalso a graduate of EDHEC – Grande École (2002) and holds a corporate director certificate from the Institut français desadministrateurs (IFA).
POSITIONS AND OFFICES HELD
AS OF THE DATE OF THE DOCUMENT
POSITIONS AND OFFICES HELD DURING
THE LAST FIVE YEARS THAT ARE
NO LONGER HELD
Permanent representative of Bpifrance Investissement●on the Board of Directors of La Maison Bleue
Permanent representative of Bpifrance Investissement●on the Board of Directors of Kelenn Participations
Director of Cosmeur●Censeur of the Board of Directors of Dupont Restauration●SAS
Permanent representative of Bpifrance Investissement●on the Supervisory Board of Vergnet*
Permanent representative of Bpifrance Participation●on the Board of Directors and the Audit Committee
of Viadeo*
Permanent representative of Bpifrance Investissement●on the Board of Directors of Gascogne SA*
Supervisory Board member of STH●
Bpifrance Investissement, of which Céline André is the permanent representative, is a shareholder of the Company through its fund FPCI ETI 2020(1)(see Section 7.3 “Shareholding” of this document).
Listed French companies*
INDEPENDENT DIRECTORS
HELEN LEE BOUYGUES
Independent director
Lead Director
Business address:184 avenue Victor Hugo –75116 Paris
Age:46
Nationality:American
Expiration date of term of office:Annual shareholders’meeting called to approvethe financial statementsfor the financial year endingDecember 31, 2020
Number of Company shares held:1,632
Helen Lee Bouygues began her career in 1995 with JP Morgan and an M&A associate in New York and Hong Kong. In 1997,she was appointed Development Director of Pathnet, a telecommunications services provider based in Washington, DC, andthen in 2000 joined Cogent Communications where she worked as Treasurer, Chief Operating Officer and Chief Financial Officeruntil 2004. Helen Lee Bouygues was subsequently appointed partner at Alvarez & Marsal in Paris, which she left in 2010 tocreate her own consulting firm. In 2014, she joined McKinsey & Company, where she became a partner in charge of theRecovery and Transformation Services department. Since February 2018, she has been President of LB Associés, a consultingfirm. Helen Lee Bouygues holds a Bachelor of Arts in political science, magna cum laude, from Princeton University and anMBA from Harvard Business School.
POSITIONS AND OFFICES HELD
AS OF THE DATE OF THE DOCUMENT
POSITIONS AND OFFICES HELD DURING
THE LAST FIVE YEARS THAT ARE
NO LONGER HELD
President of HLB Partners●Member of the Board of Directors and Audit Committee●of Vivarte
Member of the Board of Directors and Audit●and Remuneration Committee of Burelle SA*
Governor and member of the Finance Committee of the●American Hospital (Association)
Member of the Board of Directors of CGG*●
Founder and Managing Director of Lee Bouygues Partners●Partner of McKinsey RTS France●
Listed French companies*
06Report on corporate governance
State of governance
235REGISTRATION DOCUMENT 2018
BERTRAND DUMAZY
Independent directoras permanentrepresentative of Sixto
Business address:166-180 boulevard GabrielPéri – 92240 Malakoff
Age:47
Nationality:French
Expiration date of term of office:Annual shareholders’meeting called to approvethe financial statementsfor the financial year endingDecember 31, 2021
Number of Company shares held:0(1)
Bertrand Dumazy began his career in 1994 as a consultant with Bain & Company, first in Paris and later in Los Angeles. Hethen worked as an Investment Director of BC Partners in 1999 before founding Constructeo. In 2002, he joined the Neopostgroup. Initially head of Marketing and Strategy, he was appointed Chairman and Chief Executive Officer (CEO) of NeopostFrance in 2005 and then Chief Financial Officer for the Neopost group in 2008. In 2011, he became President and CEO ofDeutsch, a world leader in high performance connectors, a position he held until the Group was acquired by TE Connectivity. In2012, he joined Materis Group as Executive Vice-President and then CEO and eventually President and CEO of Cromology. InOctober 2015, he was appointed Chairman and CEO of Edenred group. He also became Chairman of the Supervisory Board ofUTA in November 2015. Bertrand Dumazy is a graduate of ESCP Europe with an MBA from Harvard Business School.
POSITIONS AND OFFICES HELD
AS OF THE DATE OF THE DOCUMENT
POSITIONS AND OFFICES HELD DURING
THE LAST FIVE YEARS THAT ARE
NO LONGER HELD
Chairman and Chief Executive Officer of Edenred SA*●Chairman of the Supervisory Board of Union Tank Eckstein●GmbH & Co. KG (Germany – company of the Edenred
group)
President of PWCE Participations SAS●(company of the Edenred group)
Member of the Board of Directors of Terreal SAS●
President of Cromology (formerly Materis Paints)●President of Cromology Services (formerly Materis●Peintures)
President of Materis SAS●President of Materis Corporate Services●Chairman of the Board of Directors of Cromology SL●(formerly Materis Paint Espana SL) – Permanent
representative of Cromology Services
Chairman of the Board of Directors of International Coating●Products (UK) Limited
Member of the Board of Directors of Vernis Claessens●Member of the Board of Directors of Cromology Italia SpA●(formerly – Materis Paints Italia SpÀ) (Italy)
Member of the Board of Directors of Innovcoat●Nanoteknolojik Boya Ve Yüsey Urunleri Sanayi Ticaret
Ve Arge A.S. (Turkey)
Censeur on the Board of Directors of d’AB Science●
As of the date of this Corporate Governance Report, the Sixto Company, of which Bertrand Dumazy is the permanent representative, has undertaken to(1)acquire 500 shares in the Company. For the requirements of this Registration Document, it is specified that on 17 May 2019, Mr Bertrand Dumazy acquired1,350 shares.
Listed French companies*
06Report on corporate governance
State of governance
236 REGISTRATION DOCUMENT 2018
CHRISTOPHE GÉGOUT
Independent directorin the capacity ofpermanent representativeof FSP
Business address:25 rue Leblanc –75015 Paris
Age:42
Nationality:French
Expiration date of term of office:Annual shareholders’meeting called to approvethe financial statementsfor the financial year endingDecember 31, 2019
Number of Company shares held:0(1)
Christophe Gégout began his career in 2001 at the French Treasury and by 2003 worked at the Budget Department, wherehe was a consultant for the government. In 2007, he become an advisor to the Minister of Finance. He joined the FrenchAlternative Energies and Atomic Energy Commission (CEA) in April 2009 as Chief Financial Officer, and became DeputyManaging Director in September 2015. He was also Chairman of CEA Investissement, a subsidiary of CEA, since January 2010.In 2018, he became the new President of the Alliance Nationale de Coordination de la Recherché pour l’Énergie (Ancre). He isnow Senior Investment Director at Meridiam, one of the world’s leaders in investment and asset management in publicinfrastructures at the service of the community Christophe Gégout graduated from École Polytechnique, Sciences-Po Paris andENSAE (École Nationale de la Statistique et de l’Administration Économique).
POSITIONS AND OFFICES HELD
AS OF THE DATE OF THE DOCUMENT
POSITIONS AND OFFICES HELD DURING
THE LAST FIVE YEARS THAT ARE
NO LONGER HELD
Member of the Board of Directors and Chairman●of the Audit Committee of Soitec*
Member of the Board of Directors of Séché environnement●Member of the Board of Directors of Allego BV●
Permanent representative of CEA,●member of the Supervisory Board of Areva*
Permanent representative of CEA Investissement,●censeur of the Board of Directors of Areva*
Director of Areva NC●Director of Areva Mines●Assistant Managing Director of the French Alternative●Energies and Atomic Energy Commission (CEA)
Chairman of the Board of Directors of CEA Investissement●Member of the Supervisory Board of Supernova Invest●Permanent representative of CEA, Director of FT1CI●Permanent representative of CEA Investissement,●censeur of the Supervisory Board of Kalray*
The Fonds Stratégique de Participations (Strategic Investment Fund) of which Mr. Christophe Gégout is the permanent representative is a shareholder of the(1)Company (see Section 7.3 “Shareholding” of this document).
Listed French companies*
CENSEURS OF THE BOARD OF DIRECTORS6.1.2
The Board of Directors may appoint censeurs.
Censeurs act as observers, and may be consulted, at meetings of the Board of Directors. The Board of Directors may grant specific duties to the
censeurs; they can join, and chair, committees created by the Board of Directors.
JACQUES VEYRAT
Business address:4 rue Euler – 75008 Paris
Age:56
Nationality:French
Expiration date of term of office:Annual shareholders’meeting called to approvethe financial statementsfor the financial year endingDecember 31, 2021
Number of Company shares held:0(1)
Jacques Veyrat began his career in 1989 at the Industrial Restructuring Interdepartmental Committee (treasury department),where he was rapporteur until 1991. From 1991 to 1993, he was deputy secretary general of the Paris Club, and subsequentlybecame a technical advisor to the Ministry of Transportation Equipment, Tourism and the Sea as of 1993. In 1995, he joined theLouis Dreyfus group as Managing Director of Louis Dreyfus Armateurs until 1998, before becoming Chairman and CEO of LouisDreyfus Communications (Neuf Cegetel) from 1998 to 2008 and Chairman and CEO of the Louis Dreyfus group until 2011.Since 2011, he has been President of Impala SAS. Jacques Veyrat graduated from the École Polytechnique and Collège desIngénieurs, and is an engineer of the Corps des Ponts et Chaussées.
POSITIONS AND OFFICES HELD
AS OF THE DATE OF THE DOCUMENT
POSITIONS AND OFFICES HELD DURING
THE LAST FIVE YEARS THAT ARE
NO LONGER HELD
President of Impala SAS●Chairman of the Board of Directors of Fnac-Darty*●Director of HSBC France●Director of Nexity*●Censeur on the Supervisory Board of Louis Dreyfus●Armateurs
Censeur on the Supervisory Board of Sucres et Denrées●Censeur on the Board of Directors of ID Logistics*●
Member of the Supervisory Board of Eurazeo*●Director of Direct Énergie*●Director of ID Logistics Group●Director of Imerys●
Jacques Veyrat controls Impala SAS that holds the majority of the Company’s share capital.(1)
Listed French companies*
06Report on corporate governance
State of governance
237REGISTRATION DOCUMENT 2018
PROPOSAL TO THE ANNUAL SHAREHOLDERS’ MEETING CONCERNING THE 6.1.3
EVOLUTION OF THE BOARD OF DIRECTORS
PROPOSED RENEWAL OF MS STÉPHANIE 6.1.3.1LEVAN’S APPOINTEMENT AS DIRECTOR
Ms Stéphanie Levan’s tenure expires immediately after the general
shareholder's meeting approving the financial statements for the
financial year ended December 31, 2018, i.e. at the next annual
general shareholders’ meeting.
Ms Stéphanie Levan was appointed Director of the Company on
September 12, 2018, date on which the Company became a limited
company (société anonyme), at the initiative of Impala and for a term
ending on said date in the event of completion of the Company’s IPO,
in order to ensure the gradual renewal of the Board of Directors in the
future, in accordance with the recommendations in the AFEP-MEDEF
Code which the Company has decided to apply.
It will be proposed to the annual shareholders’ meeting of the
Company to renew Ms Stéphanie Levan’s appointment as a director,
for a period of four (4) years which shall expire immediately after the
annual general meeting approving the financial statements for the year
ending December 31, 2022.
Ms Stéphanie Levan, who is the Chief Financial Officer of Impala, is
not currently and, as of her renewal, would not be considered an
independent director.
This renewal would allow for a balanced composition of the Board of
Directors, as well as high level of competence and stability in the
Company’s corporate bodies, recently changed into a limited
company.
As Stéphanie Levan is a member of the Company’s Audit Committee,
it is therefore appropriate to proceed with the renewal of her term of
office as Director, upon the favourable opinion of the Nomination and
Compensation Committee.
PROPOSAL FOR THE RATIFICATION 6.1.3.2OF THE COOPTATION OF FONDS STRATÉGIQUE DE PARTICIPATIONS
The cooptation of Fonds Stratégique de Participations, as a director
for the remainder of the term of office of its predecessor, Christophe
Gégout, who has decided to terminate his duties as a director in his
own right, i.e. until the end of the General Shareholders' Meeting
called to approved the financial statements for the year ending on 31
December 2019, was decided by the Board of Directors at its
meeting of 21 November 2018.
This cooptation took place pursuant to an agreement concluded on 2
October 2018 between the Company and the Fonds Stratégique de
Participations as part of the listing of the Company's shares on the
Euronext Paris regulated market. Under the terms of this agreement,
in exchange for the commitments given by Fonds Stratégique de
Participations, the Company agreed to do its best efforts to ensure
that Fonds Stratégique de Participations would be appointed as a
Company director before 31 December 2018. This information is
contained in the Company's IPO prospectus which was approved
under visa no. 10-467 on 3 October 2018.
The Board of Directors also reviewed the position of Fonds
Stratégique de Participations with regard to the recommendations of
the AFEP-MEDEF Code and, on the advice of the Nomination and
Compensation Committee, concluded that Fonds Stratégique de
Participations would be considered an independent director.
It is specified that Fonds Stratégique de Participations appointed
Christophe Gégout as its permanent representative on the
Company's Board of Directors.
06Report on corporate governance
Corporate governance organisation
238 REGISTRATION DOCUMENT 2018
CORPORATE GOVERNANCE ORGANISATION6.2
PRINCIPLES GOVERNING THE COMPOSITION OF THE BOARD OF DIRECTORS6.2.1
RULES APPLICABLE 6.2.1.1TO THE COMPOSITION OF THE BOARD OF DIRECTORS
The Company is governed by a Board of Directors comprising at least
three (3) members and eighteen (18) at the most, appointed by the
ordinary general shareholders’ meeting.
A legal entity may be appointed as director but it must, under the
conditions laid down by law, appoint a natural person who will act as its
permanent representative on the Board of Directors.
The Board of Directors has staggered terms for its members and
terms will be renewed each year on a rolling basis.
The ordinary general shareholders’ meeting set the duration of
directors’ terms at four (4) years, subject to legal provisions allowing
an extension of the term’s duration. The duties of each director will
terminate following the ordinary general shareholders’ meeting called
to approve the financial statements of the prior financial year and
which is held in the year during which such director’s term expires.
On an exceptional basis, the general shareholders’ meeting may, in the
interest of establishing a staggered renewal of the Board of Directors,
appoint one or more directors for durations other than four (4) years but not
exceeding four (4) years, or may reduce the duration of the terms of one or
more directors to a duration less than four (4) years. The duties of any
director who is either appointed in such a manner, or for whom the
duration of the term is modified to a duration not exceeding four (4) years,
will end following the ordinary general shareholders’ meeting called to
approve the financial statements of the prior financial year and which is
held in the year during which such director’s term expires.
INTERNAL REGULATIONS 6.2.1.2FOR THE BOARD OF DIRECTORS
On September 12, 2018, the Company’s Board of Directors adopted
internal regulations describing the composition, duties and rules
governing its functioning in addition to the applicable legislative,
regulatory and statutory provisions.
Participation in meetings of the Board (i)of Directors by video-conference or any other means of communication
In accordance with the provisions of Article L. 225-37 of the French
Commercial Code, and as stipulated in Article 14.3 of the bylaws,
meetings of the Board of Directors may be held by any methods of
video-conference or telecommunications enabling the directors to be
identified and guaranteeing their effective participation, i.e. which
transmits at least the voice of the participants and complies with
technical characteristics enabling the uninterrupted and simultaneous
transmission of the deliberations in order to enable them to participate
in meetings of the Board of Directors.
Any members of the Board of Directors taking part in Board meetings
via video-conference or other means of telecommunication under the
conditions set out above are considered as being present for the
calculation of the quorum and majority.
The methods of participation described above do not apply to the
approval of those decisions defined by Articles L. 232-1 and
L. 233-16 of the French Commercial Code relating respectively to the
establishment of the annual financial statements and the management
report and to the establishment of the Group’s consolidated financial
statements and management report.
The aforementioned exclusions relate solely to the inclusion of those
directors taking part remotely in the calculation of the quorum and
majority and not to the possibility of the relevant directors to take part
in the meeting and give their opinions, on a non-voting basis, on the
relevant decisions.
Participation via video-conference or telecommunications may also be
refused by the Chairman for technical reasons, to the extent that such
technical reasons would prevent the holding of the meeting of the
Board of Directors via video-conference or other means of
telecommunication in accordance with the applicable legal and
statutory conditions.
Reserved matters of the Board (ii)of Directors
According to the terms of Article 15 of the bylaws, the Board of
Directors sets the limits on the powers of the Chief Executive Officer,
if applicable, according to its internal regulations, defining the
decisions for which the prior approval of the Board of Directors is
required.
According to the terms of Article 4.2 of the internal regulations of the
Board of Directors, without prejudice as to those decisions expressly
reserved by law for general shareholders’ meetings and without
prejudice to the general powers of the Board of Directors to examine
any question concerning the conduct of Company business, the
following decisions relating to the Company and/or any one of its
subsidiaries, as applicable, and any measure leading in practice to the
same consequences as those resulting from one of the following
decisions which the Chief Executive Officer and/or the Deputy Chief
Executive Officers or the corporate officers may wish to make shall be
subject to prior approval of the Board of Directors, voting on the basis
of a simple majority of this members present or represented:
any issuance by the Company of shares or other securities(i)giving the right, at any time whatsoever, by conversion,
exchange, reimbursement, presentation or exercise of a
warrant or in any other manner, to equity securities
representing a share of the Company’s share capital or voting
rights;
any acquisition or disposal (in particular by means of sale,(ii)merger, spin-off, or partial asset contribution) by the Company
or one of its subsidiaries of an asset or equity investment of
more than €5,000,000 (with the exception of potential
transactions to be carried out by the Company or one of its
subsidiaries in the assets or equity securities of subsidiaries
that are wholly owned, directly or indirectly, by the Company);
approval or modification of the Company’s annual budget;(iii)
06Report on corporate governance
Corporate governance organisation
239REGISTRATION DOCUMENT 2018
any investment by the Company or by one of its subsidiaries,(iv)immediately or in the future, in equity or expenses relating to a
project not included in the budget (including any partnership or
joint venture agreement) for a unit amount greater than
€7,500,000;
any investment or expense by the Company or one of its(v)subsidiaries relating to a project included in the budget or
authorized by the Board of Directors or the Supervisory Board, as
the case may be, for an amount that results in an increase of
more than 15% of the equity provided for in the budget or
authorized by the Board of Directors or the Supervisory Board, as
the case may be, for such project;
closure of the Company’s annual financial statements and(vi)half-year financial statements, and the annual and half-year
consolidated financial statements;
any dividend distribution by the Company;(vii)
the adoption of a new business plan or any modification to the(viii)current business plan;
any change in the compensation policy for the Company’s senior(ix)executives and any hiring, removal, or compensation changes of
any kind for the Company’s five employees or officers receiving
the highest compensation of all employees and corporate officers;
any change in the Company’s corporate form or corporate(x)purpose, and any strategic change in the nature of its
activities;
without prejudice to the provisions of the French Commercial(xi)Code applicable to related party agreements, the entry into,
amendment, or termination of any agreement, other that those
referred to in paragraph (xii) below, between, on the one hand,
any entity controlled by the Company within the meaning of
Article L. 233-3 of the French Commercial Code (a “Group
Company”) and, on the other hand, (i) one of the Company’s
shareholders and/or one of its executives, company officers, or
directors; and/or (ii) any entity or company affiliated with one of
the persons or entities referred to in (i) and the shareholders,
executives, company officers or directors of those affiliates;
and/or (iii) any person with an indirect interest in the entry into
such agreement (the “Related Parties”), it being specified that
for the purposes hereof, an affiliate of a company means any
entity that controls, is controlled by, or is under common control
with such company, in each case within the meaning of
Article L. 233-3 of the French Commercial Code;
approval of a list including all of the following agreements, other(xii)than those referred to in paragraphs (xi) above and (xii)(a) below,
entered into since the meeting of the Board of Directors
approving the previous list, and their characterization as an
agreement within the scope of that list (it being specified that the
list must be prepared by the CEO, shall provide details on the
main provisions of each agreement referred to in paragraphs (c)
through (e) and included in the list, and shall be submitted at
each meeting of the Board of Directors):
agreements that are entered into only between Group(a)Companies and that benefit only such Group Companies,
loans granted by the Company in the form of an advance in(b)current account by the Company’s shareholders on arm’s
length terms equivalent to the terms that such loans would
include if entered into with persons or entities that are not
Related Parties,
to the extent that they represent a unit amount of(c)€15,000,000 or less and a total annual amount for all Group
Companies of €75,000,000 or less, the guarantees or
endorsements granted by the majority shareholder to one of
the Group Companies, on arm’s length terms equivalent to
the terms that would be included in such agreements if
entered into with persons or entities that are not Related
Parties, and in the ordinary course of business,
to the extent that they represent a unit amount of €1,000,000(d)or less and a total annual amount for all Group Companies of
€1,500,000 or less, the legal, accounting, or financial services
agreements or site lease agreements entered into between
the majority shareholder (or any person or entity that controls
or is controlled directly or indirectly by the majority
shareholder) and one of the Group Companies, in the ordinary
course of business and on arm’s length terms equivalent to
the terms that would be included in such agreements if
entered into with persons or entities that are not Related
Parties, and
to the extent that they represent a unit amount of(e)€1,000,000 or less and a total annual amount for all Group
Companies of €1,500,000 or less, any commercial
partnership, production, or distribution agreements entered
into between one of the Group Companies and one of the
Company’s shareholders, in the ordinary course of business
and on arm’s length terms equivalent to the terms that
would be included in such agreements if entered into with
persons or entities that are not Related Parties;
any transfer or sale of all or nearly all of the Company’s assets,(xiii)or any merger, spin-off, winding up, or liquidation of the
Company (except for any transactions with a Group Company
that are merely internal reorganization transactions without any
effect on the shareholders’ rights and obligations);
the entry into or amendment by the Company of any loan or(xiv)corporate financing agreement with a person other than a Group
Company or one of its shareholders, and any guarantee,
endorsement, or other similar payment commitment by the
Company having the effect of increasing the Company’s total
indebtedness by more than 10%, it being specified that all
projects that are part of the same decision or the same call for
tenders shall be combined for purposes of the thresholds
provided for in this paragraph (xiv);
the decision to (x) change the stock exchange on which the(xv)Company is listed, (y) conduct an initial public offering of the
Company on another regulated market in addition to Euronext
Paris, or to (z) conduct an initial public offering of a subsidiary
of the Company on a regulated market (marché réglementé or
marché régulé;
the decision to transfer the registered office outside of France(xvi)(or to move the main decision-making centers outside of
France); and
the implementation of any incentive plan or plan to grant(xvii)options, free shares, or securities giving access to the
Company’s share capital, either immediately or in the future, for
the benefit of the executives and/or employees of the Company
and Group Companies that result in the dilution of all of these
share capital incentive and involvement mechanisms beyond a
threshold of 13%.
06Report on corporate governance
Corporate governance organisation
240 REGISTRATION DOCUMENT 2018
Lead Director(iii)
The Board of Directors may decide to appoint a Lead Director, if it
deems it useful or necessary, under the conditions set out by this
Article.
Appointment of Lead Director
When the Company's senior management is assumed by the
Chairman of the Board of Directors, the Board of Directors may
appoint from among its qualified independent members, on the
recommendation of the Nomination and Compensation Committee, a
lead director ("Lead Director").
The Lead Director is appointed for a period which may not exceed
that of his/her term of office. He/she can be re-elected and may be
dismissed from his/her duties as Lead Director by the Board of
Directors at any time, it being specified that his/her duties will end
early if the duties of Chairman of the Board of Directors and Chief
Executive Officer are separated before the end of his/her term of
office.
Responsibilities and powers of the Lead Director
The responsibilities of the Lead Director are as follows:
Organisation of the Board of Directors' work
The Lead Director:
may be consulted by the Chairman of the Board of Directors with●respect to the draft of the meetings calendar submitted to the
Board for approval and on the draft agenda for each of the Board's
meetings.
he/she may propose the inclusion of items on the agenda of the●Board's meetings to the Chairman, at his own initiative or at the
request of one or more members of the Board of Directors;
he/she may ask the Chairman to call a Board meeting to discuss a●particular agenda;
he/she may gather the members of the Board of Directors outside●the presence of executive officers together in so-called "executive
sessions", at his/her own initiative or at the request of one or more
members of the Board of Directors, on a specific agenda, in
particular with a view to (i) assessing the performance of the senior
management and (ii) assessing the functioning of the Board. In this
case, he/she chairs the meetings;
he/she chairs the meetings of the Board in the absence of the●Chairman;
he/she ensures compliance with the internal regulations; and●
he/she leads the process of assessing the functioning of the Board●of Directors and reports on this assessment to the Board of
Directors.
Relationships with the directors
The Lead Director shall maintain a regular and open dialogue with
each member of the Board of Directors, particularly the independent
directors, and may become their spokesperson to the Chairman, if
necessary. The Lead Director ensures that the members of the Board
of Directors are able to perform their duties under the best possible
conditions and, in particular, receive a high level of information prior to
Board meetings.
Functioning of the governing bodies
The Lead Director:
may attend and participate in any Committee meeting, including●the ones in which he/she is not a member. If he/she is not a
member of the Nomination and Compensation Committee, he is
automatically associated with the work of this Committee; and
may be appointed as Chairman of one or more Board Committees.●
Management of conflict of interests
Notwithstanding the obligation of declaration of conflicts of interest
imposed on each member of the Board of Directors provided for in
the internal regulations of the Board of Directors, the Lead Director
draws the attention of the Board of Directors to any conflict of interest
(even potential), that he/she has identified.
Relationships with the shareholders
The Lead Director takes note of shareholder inquiries in matters
relating to governance and ensures that such inquiries are answered.
He/she assists the Chairman or Chief Executive Officer in answering
shareholder inquiries, remains available to meet some of them, and
shares the shareholders' concerns about governance with the Board.
Resources made available to the Lead Director and report on
his/her work
In order to carry out the duties referred to above, the Lead Director
has access to all documents and information that he/she deems
necessary for the performance of his/her duties.
The Lead Director reports on his/her work to the Board of Directors
annually during the assessment of the functioning of the Board of
Directors provided for in the internal regulations of the Board of
Directors. He/she attends general shareholders' meetings and may
be invited by the Chairman to report on his actions during these
meetings.
CORPORATE GOVERNANCE CODE6.2.1.3
Since the listing of its shares on the Euronext Paris regulated market,
the Company has been referring to the Code of Corporate
Governance for Listed Companies issued by the Association
Française des Entreprises Privées (AFEP) and the Mouvement des
Entreprises de France (MEDEF) (the “AFEP-MEDEF Code”).
The Company complies with the recommendations of the
AFEP-MEDEF Code.
The AFEP-MEDEF Code is available online at: www.medef.com. The
Company ensures that copies of this Code are available to members of
its corporate bodies at all times.
REVIEW OF THE INDEPENDENCE 6.2.1.4OF DIRECTORS
In accordance with Article 1 (ii) of the Internal Rules of the Nomination
and Compensation Committee, the Committee shall assess “each
year, prior to the publication of the Company’s annual report, the
position of each member of the Board of Directors with regard to the
independence criteria adopted by the Company”.
In accordance with the AFEP-MEDEF Code, to which the Company
adheres, and the internal regulations of the Board of Directors,
directors who do not have any relationship with the Company, its
group or its management, of any kind whatsoever that may
compromise their freedom of judgement are considered independent.
In particular, the criteria to be considered by the Nomination and
Compensation Committee and the Board of Directors in order to
consider a director as independent are as follows:
06Report on corporate governance
Corporate governance organisation
241REGISTRATION DOCUMENT 2018
may not be an employee or executive officer of the Company,(i)may not be an employee or Director of the parent company or
of a company or entity in the Group, and may not have been
so during the previous five years;
may not be an executive officer of a company in which the(ii)Company directly or indirectly serves as a director or in which
an employee appointed as such or a company officer of the
Company (currently or in the last five years) serves or has
served as a director;
may not be a significant customer, supplier, investment(iii)banker, or corporate finance banker of the Company or the
Group, or for which the Company or the Group represents a
significant share of its business.
may not have any close family relationship with an officer of(iv)the Company;
may not have been, during the previous five years, the(v)statutory auditor of the Company, or of a company or entity
holding at least 10% of the Company’s share capital, or of a
company of which the Company held at least 10% of the
share capital at the time such director or nominee ceased to
serve as statutory auditor;
may not have been a Director of the Company for longer than(vi)twelve (12) years.
According to the AFEP-MEDEF Code, with regard to the criterion
mentioned in point (iii) above, the assessment of whether or not the
relationship with the Company or its group is significant must be
discussed by the Board of Directors and the quantitative and
qualitative criteria that lead to this assessment contained in the
corporate governance report.
For directors holding more than 10% of the share capital or voting
rights of the Company, or representing a legal person holding such an
interest, the AFEP-MEDEF Code further recommends that the
qualification as an independent director take into account the
composition of the Company’s capital and the existence of a potential
conflict of interest.
In conformity with these criteria, the following persons were previously
considered independent, on the occasion of the Company’s IPO in
October 2018: Ms Helen Lee Bouygues, Mr. Bertrand Dumazy (as
permanent representative of the Company Sixto, director) and
Mr. Christophe Gégout (as permanent representative of the Strategic
Investment Fund (Fonds Stratégique de Participations), director).
With regard to the composition of the capital of the Company,
three directors (Ms Stéphanie Levan, Mr. Xavier Barbaro and●Mr. Simon Veyrat) should not be considered independent given
their nomination on the proposal of the reference shareholder
Impala SAS;
a director (Ms. Céline André as permanent representative of●Bpifrance Investissement) should not be considered independent,
Bpifrance Investissement’s stake now represents 5.9% of the
Company’s share capital, a sharp reduction compared to the
13.85% interest it held before the IPO, and that this stake is now
below 10% of its capital; however, given that Bpifrance
Investissement is the manager of the FPCI ETI 2020 which in the
previous five years held over 10% of the capital of the Company,
Ms Céline André (as permanent representative of Bpifrance
Investissement) is not considered an independent director, and
three directors (Mrs. Helen Lee Bouygues, Mr. Bertrand Dumazy as●permanent representative of Sixto, director) and Mr. Christophe
Gégout (as permanent representative of the Strategic Investment
Fund (FSP), director) may be considered as independent from the
Company, according to these criteria:
they meet all the independence criteria contained in the Board●of Directors’ internal regulations and the AFEP-MEDEF Code;
and
the independence assessment made by the Board when they●were appointed is still valid and they must therefore be
qualified as independent directors.
With regard to the FSP (director corporation) and its permanent
representative, Mr. Christophe Gégout, it is recalled that the FSP is an
investment vehicle to promote long-term investment in French
companies, whose investors are Cardif Life Insurance (BNP Paribas
Group), CNP Assurances, Predica (Crédit Agricole Group), Sogecap
(Société Générale Group), Groupama, BPCE Vie (Natixis Assurances
Group) and Suravenir (Crédit Mutuel Arkea Group), and neither the
FSP nor any of its investors do not have significant commercial
relationships with the Company.
The 7.5% interest that the FSP holds in the Company’s capital does
not affect its independence given the nature of this professional
investor and the absence of any other or previous relationship with
the Company.
In addition, Mr. Christophe Gégout, permanent representative of the
FSP, meets all the aforementioned independence criteria.
According to this analysis, on April 17, 2019, the Board of Directors
of the Company, having received the opinions of the Nomination and
Compensation Committee, concluded that three directors (Mrs. Helen
Lee Bouygues, Mr. Bertrand Dumazy and Mr. Christophe Gégout)
can be considered as independent with regard to the
above-mentioned criteria.
DIVERSITY POLICY APPLIED 6.2.1.5TO THE BOARD OF DIRECTORS AND THE EXECUTIVE COMMITTEE
The Board of Directors, both within the Company under its former
form of simplified limited company (société anonyme) as well as after
its transformation into a limited company (société anonyme) in the
financial year 2018, has implemented a diversity policy aimed at
obtaining a composition that achieves a good balance and a fair
distribution of experiences, qualifications, cultures, ages, nationalities
and seniority, in line with the needs of the Company. The search for
this diversity results in a balanced composition within the Board of
Directors, taking into account in particular the following elements: (i)
the desired balance in the Board of Directors in view of the
Company’s shareholders, (ii) the desired number of independent
members, (iii) the proportion of men and women required by the
regulations in force, and (iv) the integrity, competence, experience
and independence of each candidate.
It is reminded that, to date, the proportion of independent directors is
42%, which is above the ratio recommended by the AFEP-MEDEF
Code, and that the chairmen of the Audit Committee and the
Nomination and Compensation Committee are independent directors.
06Report on corporate governance
Corporate governance organisation
242 REGISTRATION DOCUMENT 2018
This policy includes a requirement for diversity in the composition of
the Board of Directors and its committees. In fact, three out of seven
members currently sitting in the Board are women, a mix rate (42%)
that is higher than the applicable legal requirements (40%). The
majority of the members sitting in the Audit Committee are women
and the majority of the members sitting in the Nomination and
Compensation Committee are men. The Board of Directors of the
Company, on April 17, 2019, deemed that these elements being very
satisfactory, it would be advisable to maintain a balanced
representation ratio of women and men at least equal to the legal
requirements, as well as a mixed composition of the Committees.
The balanced representation of women and men will be discussed
each year in the Board of Directors, and one session per year of the
Nomination and Compensation Committee will include an item on
diversity policy on its agenda.
On December 31, 2018, women represented 29.9% of the total
workforce and 30.4% of executives (excluding the Executive
Committee). Their representation on the Executive Committee to date
is 20%.
At Group level, Neoen continues to endeavour to achieve a
satisfactory gender distribution and a great diversity both in terms of
backgrounds and nationalities (more than 23 nationalities).
The diversity policy also takes into account the director’s varied and
complementary skills. Indeed, some have strategic skills, while others
have financial or more specific skills (legal, managerial experience,
engineering). The majority of directors have extensive professional
experience in various business segments and in senior positions,
most of whom are already or have already held directorships or
corporate offices in other French or foreign companies, some of
which are public companies. These diversified profiles complement
the Board members’ expertise and experience, which allows them to
quickly and thoroughly apprehend the Company’s development
challenges and to make informed and quality decisions. The diversity
of experiences and points of view as well as the directors’
independence allow for the necessary objectivity and independence in
the Board of Directors with regard to the senior management and
with regard to the shareholders or a group shareholders in particular.
The terms of office and their extension also contribute to the proper
functioning of the Company’s corporate bodies. These elements allow
the directors to have a quality of judgement and an ability to
anticipate, which allows them to act in the Company’s social interest
and to face the challenges facing the Group.
With respect to the above, on April 17, 2019, the Board of Directors
of the Company deemed that the diversity of skills within the Board of
Directors is satisfactory.
The Board of Directors is also international in nature with the
presence of Mrs. Helen Lee Bouygues, an American citizen with
international experience, and Mr. Bertrand Dumazy, who heads a
group that has a strong international presence.
To date, directors are between 28 and 47 years old, which averages
42 years of age.
PRINCIPLES GOVERNING 6.2.2
THE FUNCTIONING
OF THE GOVERNANCE
METHOD OF GOVERNANCE6.2.2.1
Combination of the functions of Chairman (i)of the Board of Directors and Chief Executive Officer
Xavier Barbaro was appointed Chairman and Chief Executive Officer
at the Board of Directors meeting of September 12, 2018, with
immediate effect.
Following the opinion of the Nomination and Compensation
Committee, the Board of Directors concluded that not separating the
functions of Chairman and Chief Executive Officer would ensure
continuity with the separation of the powers between the statutory
corporate bodies of the Company in its form as a simplified joint stock
company, so that the change in the corporate form would not have
any effect on the way in which the Company’s senior management is
exercised.
Mr. Xavier Barbaro held the position of Chief Executive Officer
(Président) of the Company and Chairman of the Supervisory Board
of the Company in its previous corporate form as a simplified joint
stock company until it was changed into a limited company (société
anonyme) on the same date, September 12, 2018.
Executive Committee(ii)
As of the date of this Corporate Governance Report, approved by the
Board of Directors at its meeting of 17 April 2019, the Executive
Committee was comprised of five members including Xavier Barbaro.
Romain Desrousseaux Deputy Chief Executive Officer
Paul-François Croisille Deputy Chief Executive Officer
Serge Stepanov Chief Financial Officer
Olga Kharitonova Secretary General
Mr. Xavier Barbaro’s resume is set out in paragraph 6.1.1 of this
document.
Romain Desrousseaux began his career in 1999 at LDCom, in charge
of the investment program in the high speed broadband internet network.
In 2008, he joined the Louis Dreyfus Commodities group as deputy Chief
Information Officer, then he took over operations management for the
African and Middle East region. He joined Neoen in 2013 as Deputy Chief
Executive Officer in charge of international project development. Romain
Desrousseaux is a graduate of France’s École Normale Supérieure.
The Board of Directors of the Company in its April 17, 2019 meeting, on
the proposal of the Chairman and Chief Executive Officer and after
receiving the opinion of the Nomination and Compensation Committee,
has decided to appoint Romain Desrousseaux, a member of the
Executive Committee as Deputy Chief Executive Officer (Directeur
général délégué). This appointment is justified by the importance of the
development of international projects as part of the implementation of
the Company’s strategy and the desirability that these development
activities be directly supervised by a corporate officer of the Company.
In accordance with the law, a Deputy Chief Executive Officer (Directeur
général délégué) has the legal power to represent the Company and
has the same powers with respect to third parties as the Chief
Executive Officer.
06Report on corporate governance
Corporate governance organisation
243REGISTRATION DOCUMENT 2018
Paul-François Croisille joined LDCom in 2000 where he developed
transmission systems and then operator communication services, after
ten years in innovation and marketing at France Télécom and with the
Spanish operator Uni2. In 2003, he launched Swisscom Hospitality
Services’ business in France before taking over global operations
management in 2006. Paul-François Croisille joined Neoen 2010. He
graduated from École Polytechnique with a degree in
telecommunications and holds an MBA from Harvard Business School.
Serge Stepanov has over eighteen years’ experience in operations
and finance. He began his career with Danone in Russia before
moving to France and Asia. He joined Louis Dreyfus Commodities in
2007 where he was in charge of business development and cash flow
management in North America. In 2010, he was appointed Chief
Executive Officer of Biosev in Brazil and led its IPO in 2013 before
joining Neoen in 2014. Serge Stepanov graduated from the École des
Mines in Paris and holds an MBA from Harvard Business School.
Olga Kharitonova began her career in Moscow in 2000 with the
European Business Club (an association representing the interests of
European businesses in Russia) before joining Bureau Francis
Lefebvre. Admitted to the Paris bar in 2006, she then joined the Paris
office of Cleary Gottlieb Steel & Hamilton LLP where she advised
clients on complex international transactions. Olga Kharitonova joined
Neoen in 2018. She graduated from the State University of Moscow
(Lomonossov), from the Paris IEP and holds a master’s degree in
business law from the Paris I-Sorbonne University.
Powers of the Chief Executive Officer (iii)(Article 16 of the bylaws and Article 4.2 of the internal regulations of the Board of Directors)
The Chief Executive Officer is vested with all powers to act in all
circumstances in the name of and on behalf of the Company. He
exercises these powers within the limit of the corporate purpose and
subject to those powers that the law and the bylaws expressly reserve
to the general shareholders’ meetings and the Board of Directors.
The Chief Executive Officer represents the Company in its relations
with third parties. The Company is committed even by the actions of
the Chief Executive Officer which do not fall within the corporate
purpose, unless it can prove that the third party knew that the action
exceeded this purpose or that he could not ignore it in the relevant
circumstances, it being clarified that the publication of the bylaws
alone shall not in itself be sufficient proof thereof.
With the Chief Executive Officer’s agreement, the Board of Directors
determines the extent and duration of the powers granted to the
executive Deputy Chief Executive Officers.
Towards third parties, the executive Deputy Chief Executive Officer(s)
have the same powers as the Chief Executive Officer.
Nevertheless, they must obtain the prior approval of the Board of
Directors for operations listed in Section 6.2.1.2 (ii) “Matters reserved
to the Board of Directors” in this Registration Document.
Succession plan(iv)
Under Article 1 (i) of the Internal Rules of the Nomination and
Compensation Committee, the Committee is required to prepare and
maintain a succession plan for the members of the Board of Directors
and the Executive Board, as well as for the Company’s senior
management, in order to be in a position to propose quickly to the
Board of Directors succession solutions, especially in case of
unforeseeable vacancy.
The Board of Directors, after receiving the opinion of the Nomination
and Compensation Committee, has examined this point and
considered the following:
the Company may appoint a Deputy Chief Executive Officer sitting●in the Board of Directors, if there is one, as part of the immediate
succession of the Chief Executive Officer in the event of an
unforeseeable vacancy. This internal solution has the advantage of
ensuring a certain form of continuity as well as the thorough
knowledge of the Company by the successor thus designated;
the appointment of a lead director by the Board of Directors●enables the Board to play the role of interim successor by
immediately assuming the duties of Chairman of the Board of
Directors in the event the position becomes vacant unexpectedly.
Given the role of the lead director, this would enable the Company
and its Board of Directors to benefit from a certain form of
continuity throughout the corporate bodies and the ultimate
successor would benefit from its knowledge of the Company; and
regarding the members of the Board of Directors, this subject is●currently being discussed, it being reminded, however, that three
out of the nine directors are legal persons and thus the question of
succession does not arise with regard to them, with the exception
of Sixto, and that, with respect to Impala, Jacques Veyrat resigned
from his position as a member of the Supervisory Board of the
Company under its former form of simplified limited company
(société anonyme) to give way to his son, Simon Veyrat, who also
performs duties in Impala.
RULES APPLICABLE TO THE OPERATION 6.2.2.2OF THE BOARD OF DIRECTORS
Duties (internal regulations - Article 4)(i)
The Board of Directors shall perform the responsibilities and exercise
the powers attributed to it by law, the Company’s bylaws, and the
internal regulations of the Board and its committees. It shall determine
and evaluate the Company’s strategic direction, objectives, and
performance, and supervise their implementation. Subject to the
powers attributed to the shareholders’ meetings and within the limit of
the corporate purpose, the Board may address any question
concerning the Company’s operations and shall settle the matters
within its purview through its deliberations.
The Board shall carry out the audits and verifications that it believes
appropriate and may request communication of documents that it
deems useful in order to carry out its responsibilities.
The Board of Directors shall also work to promote value creation over
the business’s long term, taking into account the employment,
societal, and environmental dimensions of its activities. Where
necessary, it shall propose any amendments to the corporate
purpose set forth in the bylaws that it shall deem appropriate. It shall
also be informed of developments on the markets, of the competitive
environment, and of the principal challenges facing the business,
including with regard to social and environmental responsibility.
The Board of Directors shall regularly examine, in light of the strategy
that it has defined, the Company’s opportunities and risks, including
financial, legal, operational, social, and environmental risks, as well as
the measures taken as a result. To that end, the Board of Directors
shall obtain all information from the Company’s executive officers that
it needs to perform its responsibilities.
06Report on corporate governance
Corporate governance organisation
244 REGISTRATION DOCUMENT 2018
The Board of Directors shall ensure that the executive officers
implement a non-discrimination and diversity policy, in particular with
respect to the balanced representation of women and men on
management bodies.
Directors’ competence and expertise (ii)(Article 3.4 of the internal regulations)
Members of the Board of Directors must have the following essential
attributes:
they must be attentive to the corporate interest;●
they must have good judgment, in particular with respect to●situations, strategies, and people, relying in particular on their
experience;
they must have the ability to anticipate risks and strategic●challenges;
they must have integrity and be present, active, and involved.●
Ethics (conflicts of interest, family links, (iii)service contracts)
Criminal record and bankruptcy
To Company’s knowledge, over the course of the last five years:
none of the aforementioned individuals has been found guilty of●fraud;
none of the aforementioned individuals has been associated with●any bankruptcy, compulsory administration order or liquidation;
no condemnation and/or official public sanction has been handed●down against any one of the aforementioned individuals by any
statutory or regulatory authorities (including any designated
professional bodies);
none of the aforementioned individuals has been prevented by any●court from acting as member of a management or supervisory
body of an issuer or from being involved in the management or
conduct of an issuer’s business.
Family links
As of the date of this document, to the Company’s knowledge, other
than the family relationship between Jacques Veyrat (censeur of the
Board of Directors and majority shareholder of the Company through
Impala SAS) and his son Simon Veyrat (member of the Board of
Directors), there are no family relationships among the members of
the Board of Directors mentioned or between members of the Board
of Directors and members of the Company’s Executive Committee.
Conflicts of Interest
According to the terms of Article 3 of the Board of Directors’ internal
regulations, each member of the Board of Directors must inform the
Board about any conflict of interest (even potential) and must not vote
in the corresponding deliberation.
As of the date of this document, to the Company’s knowledge, there
are no potential conflicts of interest between the duties of the
directors or executive officers with regard to Neoen and their private
interests or other duties.
To the Company’s knowledge, no arrangement or agreement has
been entered into with any of the main shareholders, a client, a
supplier or any third party in performance of which any member
whatsoever of the Board of Directors or an executive officer may have
been appointed to the Board of Directors or Executive Committee
respectively.
To the Company’s knowledge and as of the date of this document,
there are no potential conflicts of interest between the duties owed to
the Company by the members of the Board of Directors, set forth in
Section 6.1.1 “Composition of the Board of Directors” herein and of
the Company’s Executive Committee and their private interests.
As of the date of this document, to the Company’s knowledge, the
restrictions accepted by the members of the Board of Directors listed
in Section 6.1.1 “Composition of the Board of Directors” herein or
members of the Company’s Executive Committee concerning the
disposal of their interests in the Company’s share capital are as
follows:
pursuant to the guarantee agreement signed on October 2, 2018●between Neoen, the banks and certain shareholders of the
Company, the commitment to keep the securities for a period
expiring 365 days after the settlement date of the offer (which took
place on October 18, 2018) by certain directors;
the rules relating to preventing insider trading;●
the rules defined by the Company in accordance with the●AFEP-MEDEF Code imposing an obligation to hold shares, namely:
in accordance with the Board of Directors’ internal regulations●(Article 3.10), the obligation for each member of the Board of
Directors to own (directly or indirectly) 500 (five hundred)
shares throughout his term of office and in any event not later
than six months after his appointment,
the obligation for executive officers to keep in registered form,●until the end of their term, at least 5,000 (five thousand) shares,
the minimum number set by the Board of Directors,
the minimum number of shares issued as free shares or stock●subscription or purchase options to be retained by the
executive officers until the end of their term, as set by the
Board of Directors.
ASSESSMENT AND WORK 6.2.2.3OF THE BOARD AND THE COMMITTEES
In accordance with the provisions of recommendation 9 of the
AFEP-MEDEF Code, the Board of Directors must assess its ability to
meet the expectations of shareholders, who have given it the
mandate to manage the Company, by periodically reviewing its
composition, organisation and functioning. The assessment has three
objectives:
review the Board of Directors operating procedures;●
check that important issues are properly prepared and discussed; and●
assess the actual contribution of each director to the Board’s work.●
Article 7 of Board of Director’s internal rules stipulates that the Board
must devote an item of its agenda to the assessment of its operating
procedures once a year, taking account of the report of the
Nomination and Compensation Committee.
06Report on corporate governance
Corporate governance organisation
245REGISTRATION DOCUMENT 2018
The assessment is carried out as follows:
once a year, the Board discusses its operation;●
a formal assessment of the Board of Directors and the Committees●is made at least every three years, possibly managed by an
independent member of the Board of Directors and, if applicable,
assisted by an external consultant; and
the shareholders are informed each year in the corporate●governance report about the assessments carried out and their
follow-up, if any.
The Company’s corporate from was changed into a limited company
(société anonyme) on September 12, 2018 and its shares were listed
on the Euronext Paris regulated market on October 17, 2018.
Consequently, the period covered by the assessment of the Board of
Directors’ functioning for the 2018 financial year, in application of the
abovementioned AFEP-MEDEF Code recommendation applicable to
the Company since its IPO, concerns a period of less than three
months.
For this reason, no assessment questionnaires were formally sent to
the directors and the assessment for the period in question was
made on the basis of informal discussions and deliberations within the
Nomination and Compensation Committee and the Board of
Directors.
The current composition of the Board of Directors is the one set up
for the Company’s IPO, which includes the resignation of two
directors, Mr. Serge Savasta and Mr. Christophe Gégout, and the
appointment of the FSP, whose permanent representative is
Mr. Christophe Gégout.
The year 2018 was marked by a very intense activity by the
Company’s governance bodies, before and after the conversion into a
limited company (société anonyme), due to the Company’s IPO in
2018. Since the Company’s shares were listed on Euronext Paris on
October 17, 2018, the Board of Directors began meeting more
frequently. Thus, since that date, the following were held in 2018:
2 Board meetings;●
1 Nomination and Compensation Committee meeting; and●
1 meeting of the Audit Committee.●
The average duration of the Board meetings were 2.5 hours and the
directors’ attendance rate was very high, a participation rate of
approximately 93% on average. The attendance rate of each director
is 100%, and with the exception of Mr. Simon Veyrat who was unable
to attend a Board meeting. The Board’s work focused on the
approval of the 2019 budget, the Group’s strategy and governance
issues (director resignations, co-optation of a director, distribution of
directors’ fees for 2018, the share buyback program voted by the
shareholders general meeting of October 2, 2018, etc.). The
directors’ involvement in the Company’s IPO project was highlighted
by the Board of Directors, as the directors were called upon to attend
numerous workshops on the subject, in addition to the Board
meetings.
The average duration of Nomination and Compensation Committee
meetings was two hours. The participation rate of its members was
100%.
The average duration of Audit Committee meetings was 2 hours. The
participation rate of its members was 100%. The Audit Committee’s
work focused on closing options, the 2019 budget and internal
control.
The assessment of the Board’s functioning is very positive overall, the
Directors highlighting in particular:
the involvement of the Board, illustrated by the high number of●meetings and its involvement in the Company’s IPO and, more
generally, in the Company’s strategic decisions since its conversion
into a limited company (société anonyme) in 2018;
the directors considered the Board’s diversity to be fully●satisfactory, with a very satisfactory proportion of women (3/7, i.e.
42% of Board members) and independent directors (3/7, i.e. 42%
of Board members);
the majority of the Directors consider that the time required to●convene the Board, the conduct of Board meetings, the
consideration of their requests, and the work allocation between
the Council and the Committees are satisfactory;
the directors appreciated the quality of the debates and the●management’s interventions. They further noted that the important
issues are properly prepared and discussed, and that the actual
contribution of each director to the Board’s work is satisfactory in
view of its competence and involvement in the various
deliberations;
the majority of directors believe they receive the information they●need to fully exercise their mandate;
the directors consider the Board’s organisation and functioning to●be satisfactory.
The same observations apply to the Nomination and Compensation
Committee and the Audit Committee.
BOARD COMMITTEES6.2.2.4
At its meeting held on September 12, 2018, the Board of Directors
decided to set up two permanent committees: an Audit Committee
and a Nomination and Compensation Committee . The composition
of these two committees is compliant with the recommendations set
out in the AFEP-MEDEF Code.
Audit Committee(i)
(A) Composition
Yearset up Chairman Members Positions
Stéphanie
Levan
Director
Audit
Committee2018
Christophe
Gégout
Christophe
Gégout
Permanent
representative
of FSP,
independent
director
Helen Lee
Bouygues
Independent
director
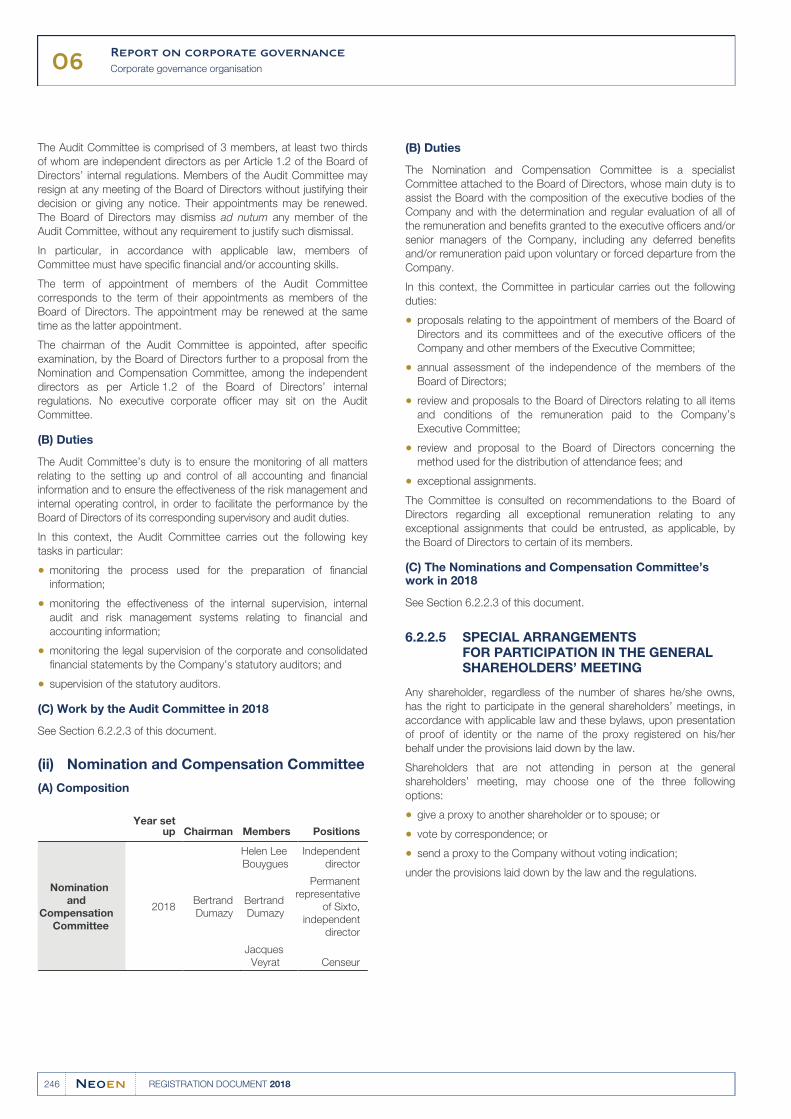
06Report on corporate governance
Corporate governance organisation
246 REGISTRATION DOCUMENT 2018
The Audit Committee is comprised of 3 members, at least two thirds
of whom are independent directors as per Article 1.2 of the Board of
Directors’ internal regulations. Members of the Audit Committee may
resign at any meeting of the Board of Directors without justifying their
decision or giving any notice. Their appointments may be renewed.
The Board of Directors may dismiss ad nutum any member of the
Audit Committee, without any requirement to justify such dismissal.
In particular, in accordance with applicable law, members of
Committee must have specific financial and/or accounting skills.
The term of appointment of members of the Audit Committee
corresponds to the term of their appointments as members of the
Board of Directors. The appointment may be renewed at the same
time as the latter appointment.
The chairman of the Audit Committee is appointed, after specific
examination, by the Board of Directors further to a proposal from the
Nomination and Compensation Committee, among the independent
directors as per Article 1.2 of the Board of Directors’ internal
regulations. No executive corporate officer may sit on the Audit
Committee.
(B) Duties
The Audit Committee’s duty is to ensure the monitoring of all matters
relating to the setting up and control of all accounting and financial
information and to ensure the effectiveness of the risk management and
internal operating control, in order to facilitate the performance by the
Board of Directors of its corresponding supervisory and audit duties.
In this context, the Audit Committee carries out the following key
tasks in particular:
monitoring the process used for the preparation of financial●information;
monitoring the effectiveness of the internal supervision, internal●audit and risk management systems relating to financial and
accounting information;
monitoring the legal supervision of the corporate and consolidated●financial statements by the Company’s statutory auditors; and
supervision of the statutory auditors.●
(C) Work by the Audit Committee in 2018
See Section 6.2.2.3 of this document.
Nomination and Compensation Committee(ii)
(A) Composition
Year setup Chairman Members Positions
Helen Lee
Bouygues
Independent
director
Nomination
and
Compensation
Committee
2018Bertrand
Dumazy
Bertrand
Dumazy
Permanent
representative
of Sixto,
independent
director
Jacques
Veyrat Censeur
(B) Duties
The Nomination and Compensation Committee is a specialist
Committee attached to the Board of Directors, whose main duty is to
assist the Board with the composition of the executive bodies of the
Company and with the determination and regular evaluation of all of
the remuneration and benefits granted to the executive officers and/or
senior managers of the Company, including any deferred benefits
and/or remuneration paid upon voluntary or forced departure from the
Company.
In this context, the Committee in particular carries out the following
duties:
proposals relating to the appointment of members of the Board of●Directors and its committees and of the executive officers of the
Company and other members of the Executive Committee;
annual assessment of the independence of the members of the●Board of Directors;
review and proposals to the Board of Directors relating to all items●and conditions of the remuneration paid to the Company’s
Executive Committee;
review and proposal to the Board of Directors concerning the●method used for the distribution of attendance fees; and
exceptional assignments.●
The Committee is consulted on recommendations to the Board of
Directors regarding all exceptional remuneration relating to any
exceptional assignments that could be entrusted, as applicable, by
the Board of Directors to certain of its members.
(C) The Nominations and Compensation Committee’swork in 2018
See Section 6.2.2.3 of this document.
SPECIAL ARRANGEMENTS 6.2.2.5FOR PARTICIPATION IN THE GENERAL SHAREHOLDERS’ MEETING
Any shareholder, regardless of the number of shares he/she owns,
has the right to participate in the general shareholders’ meetings, in
accordance with applicable law and these bylaws, upon presentation
of proof of identity or the name of the proxy registered on his/her
behalf under the provisions laid down by the law.
Shareholders that are not attending in person at the general
shareholders’ meeting, may choose one of the three following
options:
give a proxy to another shareholder or to spouse; or●
vote by correspondence; or●
send a proxy to the Company without voting indication;●
under the provisions laid down by the law and the regulations.
06Report on corporate governance
Remuneration of executive officers
247REGISTRATION DOCUMENT 2018
REMUNERATION OF EXECUTIVE OFFICERS6.3
The Company generally refers, and specifically with regard to
remuneration, to the AFEP-MEDEF Corporate Governance Code for
Listed Companies, as interpreted by the High Committee on
Corporate Governance (AFEP-MEDEF Code application guide; activity
report of the High Committee on Corporate Governance of
October 2018) and the AMF recommendations presented in the
AMF’s guide to preparing registration documents, as well as the
AMF’s report on corporate governance and executive remuneration at
listed companies, published on November 26, 2018.
Pursuant to Article L. 225-100-II of the French Commercial Code, the
general shareholders’ meeting of June 28, 2019 will be asked to
approve the elements that make up the total remuneration and
benefits of any kind paid or awarded to executive officers with respect
to the 2018 financial year. Furthermore, in accordance with
Article L. 225-37-2 of the French Commercial Code, the principles
and criteria for the determination, distribution and allocation of fixed,
variable and exceptional elements of the total remuneration and
benefits of any kind attributable to the executive officers, as described
below, are subject to the approval of the general shareholders’
meeting.
This Corporate Governance Report was examined by the
Nominations and Compensation Committee.
REMUNERATION OF EXECUTIVE 6.3.1
OFFICERS
PRINCIPLES AND RULES 6.3.1.1FOR THE DETERMINATION OF REMUNERATION GRANTED TO THE EXECUTIVE OFFICER FOR THE 2018 FINANCIAL YEAR
Xavier Barbaro was appointed director by a decision of the general
shareholders’ meeting of September 12, 2018, the date on which the
Company changed its corporate form into that of a limited company
(société anonyme) with a Board of Directors, and was appointed
Chairman and CEO of the Company for the duration of his
directorship by a decision of the Board of Directors of the same date.
Prior to the date of this change in corporate form, Xavier Barbaro was
Chairman of the simplified joint stock company (société par actions
simplifiée) since his appointment by the general shareholders’ meeting
on February 7, 2011, with effect from March 1, 2011.
With regard to his position as Chairman and CEO of the Company,
the fixed and variable remuneration of Xavier Barbaro is determined in
accordance with the principles set out hereunder. These principles
have been reviewed by the Nomination and Compensation
Committee and approved by the Board of Directors on 12
September 2018.
Remuneration
The remuneration of Xavier Barbaro comprises a fixed portion and a
variable portion, with the latter being determined in accordance with
performance criteria set by the Board of Directors, after consultation
with the Nomination and Compensation Committee. These criteria are
regularly reviewed by the Board.
The payment of the variable and exceptional elements of
remuneration is conditional upon the approval by an ordinary general
meeting of the elements of Xavier Barbaro’s remuneration.
Fixed remuneration
The gross annual fixed remuneration of Xavier Barbaro is set at
€200,000, with effect from September 1, 2018.
Annual variable remuneration
The gross variable remuneration of Xavier Barbaro represents an
amount equal to 100% of the annual fixed remuneration, subject to
the fulfilment of quantitative and qualitative criteria set by the Board of
Directors.
75% of these are quantitative criteria based on the achievement of
revenue targets (up to 15% and for a maximum gross remuneration of
€45,000), EBITDA targets (up to 30% and for a maximum gross
remuneration of €90,000) and the achievement of an annual new
“awarded” MW target (up to 30% and for a maximum gross
remuneration of €240,000). The remaining 25% relate to qualitative
criteria. These are based on (i) the leadership of the Company’s senior
management, his capacity to lead the Company and unite its
members with a focus on growth and international expansion,
together with his ability to represent the Company externally and (ii)
compliance with a CSR objective, namely the implementation of a
CSR strategy resulting in an improvement in the key performance
indicators taken into account by Vigeo-Eiris for its assessment. In the
event of the over-achievement of one or more criteria, the weighting
of the various criteria will be adjusted in accordance with the level of
performance achieved and the criteria in question.
In the event of the over-achievement of these targets, the maximum
share of variable remuneration is increased to 212.5% of the gross
annual fixed remuneration, i.e. €425,000.
Benefits in kind
Xavier Barbaro benefits from a company vehicle worth a maximum of
€6,000 per year.
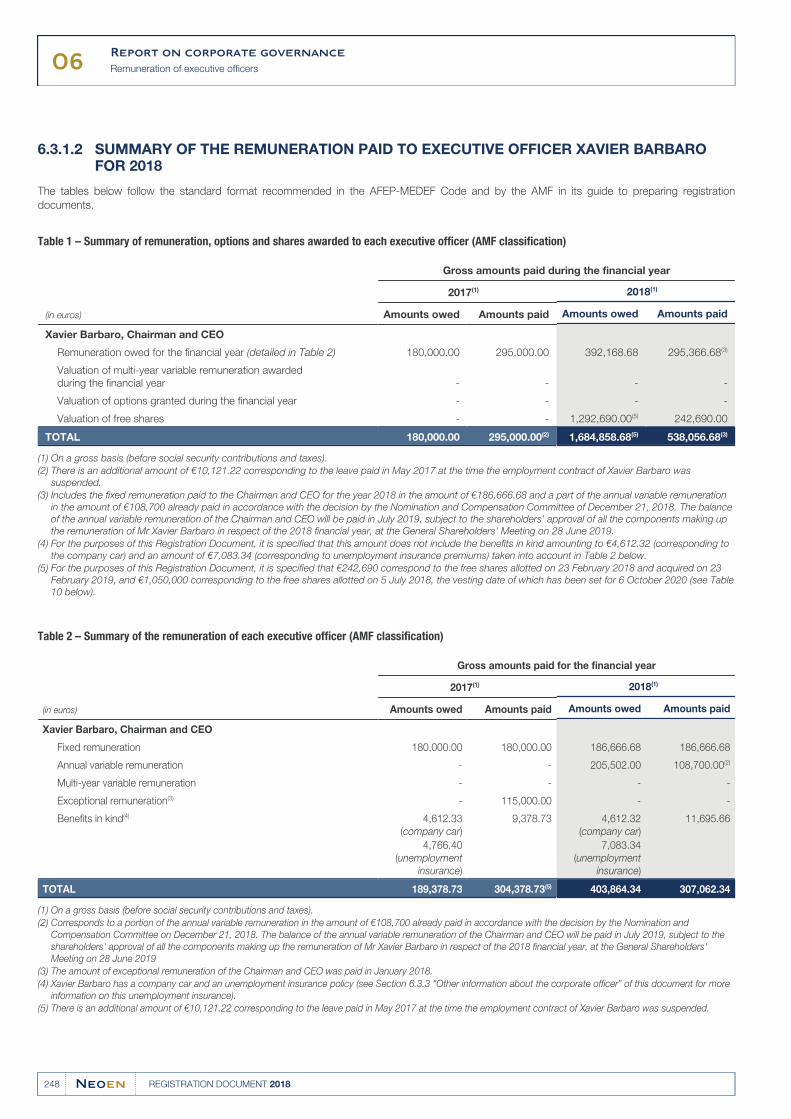
06Report on corporate governance
Remuneration of executive officers
248 REGISTRATION DOCUMENT 2018
SUMMARY OF THE REMUNERATION PAID TO EXECUTIVE OFFICER XAVIER BARBARO 6.3.1.2FOR 2018
The tables below follow the standard format recommended in the AFEP-MEDEF Code and by the AMF in its guide to preparing registration
documents.
Table 1 – Summary of remuneration, options and shares awarded to each executive officer (AMF classification)
(in euros)
Gross amounts paid during the financial year
2017(1) 2018(1)
Amounts owed Amounts paid Amounts owed Amounts paid
Xavier Barbaro, Chairman and CEO
Remuneration owed for the financial year (detailed in Table 2) 180,000.00 295,000.00 392,168.68 295,366.68(3)
Valuation of multi-year variable remuneration awarded
during the financial year - - - -
Valuation of options granted during the financial year - - - -
Valuation of free shares - - 1,292,690.00(5) 242,690.00
TOTAL 180,000.00 295,000.00(2) 1,684,858.68(5) 538,056.68(3)
On a gross basis (before social security contributions and taxes).(1)
There is an additional amount of €10,121.22 corresponding to the leave paid in May 2017 at the time the employment contract of Xavier Barbaro was (2)
suspended.
Includes the fixed remuneration paid to the Chairman and CEO for the year 2018 in the amount of €186,666.68 and a part of the annual variable remuneration (3)
in the amount of €108,700 already paid in accordance with the decision by the Nomination and Compensation Committee of December 21, 2018. The balance
of the annual variable remuneration of the Chairman and CEO will be paid in July 2019, subject to the shareholders' approval of all the components making up
the remuneration of Mr Xavier Barbaro in respect of the 2018 financial year, at the General Shareholders' Meeting on 28 June 2019.
For the purposes of this Registration Document, it is specified that this amount does not include the benefits in kind amounting to €4,612.32 (corresponding to (4)
the company car) and an amount of €7,083.34 (corresponding to unemployment insurance premiums) taken into account in Table 2 below.
For the purposes of this Registration Document, it is specified that €242,690 correspond to the free shares allotted on 23 February 2018 and acquired on 23 (5)
February 2019, and €1,050,000 corresponding to the free shares allotted on 5 July 2018, the vesting date of which has been set for 6 October 2020 (see Table
10 below).
Table 2 – Summary of the remuneration of each executive officer (AMF classification)
(in euros)
Gross amounts paid for the financial year
2017(1) 2018(1)
Amounts owed Amounts paid Amounts owed Amounts paid
Xavier Barbaro, Chairman and CEO
Fixed remuneration 180,000.00 180,000.00 186,666.68 186,666.68
Annual variable remuneration - - 205,502.00 108,700.00(2)
Multi-year variable remuneration - - - -
Exceptional remuneration(3) - 115,000.00 - -
Benefits in kind(4) 4,612.33
(company car)
4,766.40
(unemployment
insurance)
9,378.73 4,612.32
(company car)
7,083.34
(unemployment
insurance)
11,695.66
TOTAL 189,378.73 304,378.73(5) 403,864.34 307,062.34
On a gross basis (before social security contributions and taxes).(1)
Corresponds to a portion of the annual variable remuneration in the amount of €108,700 already paid in accordance with the decision by the Nomination and (2)
Compensation Committee on December 21, 2018. The balance of the annual variable remuneration of the Chairman and CEO will be paid in July 2019, subject to the
shareholders' approval of all the components making up the remuneration of Mr Xavier Barbaro in respect of the 2018 financial year, at the General Shareholders'
Meeting on 28 June 2019
The amount of exceptional remuneration of the Chairman and CEO was paid in January 2018.(3)
Xavier Barbaro has a company car and an unemployment insurance policy (see Section 6.3.3 “Other information about the corporate officer” of this document for more (4)
information on this unemployment insurance).
There is an additional amount of €10,121.22 corresponding to the leave paid in May 2017 at the time the employment contract of Xavier Barbaro was suspended.(5)
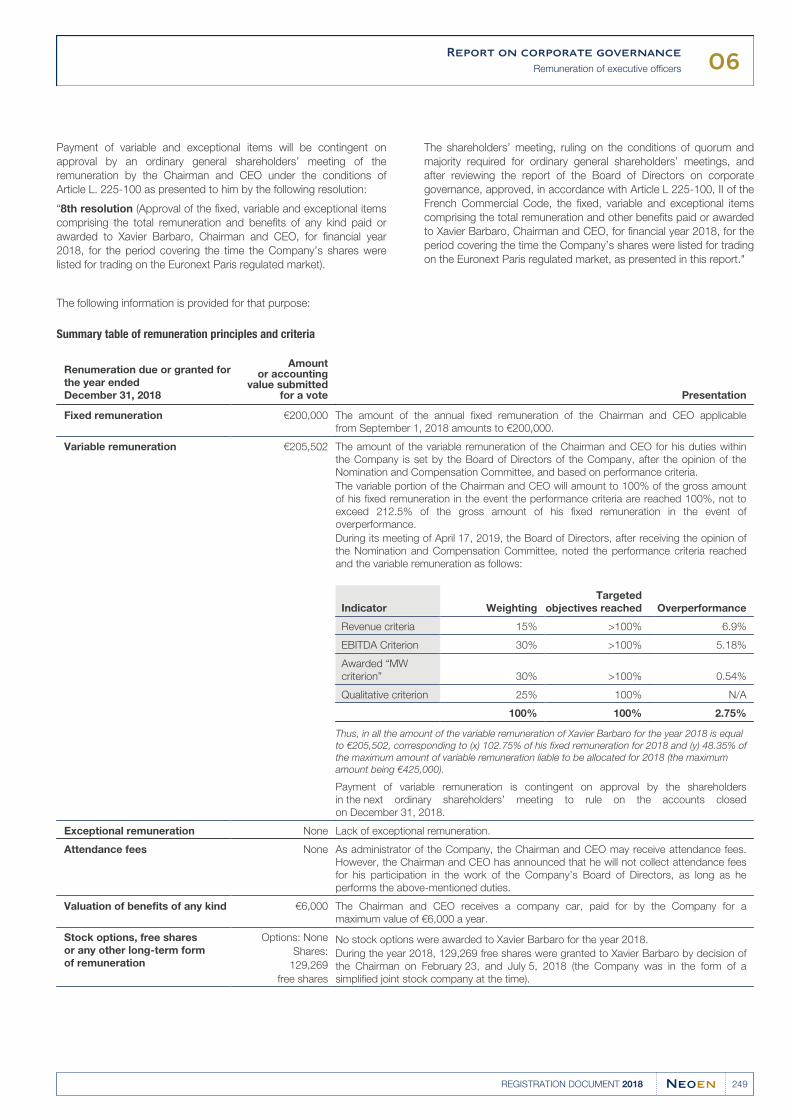
06Report on corporate governance
Remuneration of executive officers
249REGISTRATION DOCUMENT 2018
Payment of variable and exceptional items will be contingent on
approval by an ordinary general shareholders’ meeting of the
remuneration by the Chairman and CEO under the conditions of
Article L. 225-100 as presented to him by the following resolution:
“8th resolution (Approval of the fixed, variable and exceptional items
comprising the total remuneration and benefits of any kind paid or
awarded to Xavier Barbaro, Chairman and CEO, for financial year
2018, for the period covering the time the Company’s shares were
listed for trading on the Euronext Paris regulated market).
The shareholders’ meeting, ruling on the conditions of quorum and
majority required for ordinary general shareholders’ meetings, and
after reviewing the report of the Board of Directors on corporate
governance, approved, in accordance with Article L 225-100, II of the
French Commercial Code, the fixed, variable and exceptional items
comprising the total remuneration and other benefits paid or awarded
to Xavier Barbaro, Chairman and CEO, for financial year 2018, for the
period covering the time the Company’s shares were listed for trading
on the Euronext Paris regulated market, as presented in this report."
The following information is provided for that purpose:
Summary table of remuneration principles and criteria
Renumeration due or granted for
the year ended
December 31, 2018
Amountor accounting
value submittedfor a vote Presentation
Fixed remuneration €200,000 The amount of the annual fixed remuneration of the Chairman and CEO applicable
from September 1, 2018 amounts to €200,000.
Variable remuneration €205,502 The amount of the variable remuneration of the Chairman and CEO for his duties within
the Company is set by the Board of Directors of the Company, after the opinion of the
Nomination and Compensation Committee, and based on performance criteria.
The variable portion of the Chairman and CEO will amount to 100% of the gross amount
of his fixed remuneration in the event the performance criteria are reached 100%, not to
exceed 212.5% of the gross amount of his fixed remuneration in the event of
overperformance.
During its meeting of April 17, 2019, the Board of Directors, after receiving the opinion of
the Nomination and Compensation Committee, noted the performance criteria reached
and the variable remuneration as follows:
Indicator Weighting
Targeted
objectives reached Overperformance
Revenue criteria 15% >100% 6.9%
EBITDA Criterion 30% >100% 5.18%
Awarded “MW
criterion” 30% >100% 0.54%
Qualitative criterion 25% 100% N/A
100% 100% 2.75%
Thus, in all the amount of the variable remuneration of Xavier Barbaro for the year 2018 is equal
to €205,502, corresponding to (x) 102.75% of his fixed remuneration for 2018 and (y) 48.35% of
the maximum amount of variable remuneration liable to be allocated for 2018 (the maximum
amount being €425,000).
Payment of variable remuneration is contingent on approval by the shareholders
in the next ordinary shareholders’ meeting to rule on the accounts closed
on December 31, 2018.
Exceptional remuneration None Lack of exceptional remuneration.
Attendance fees None As administrator of the Company, the Chairman and CEO may receive attendance fees.
However, the Chairman and CEO has announced that he will not collect attendance fees
for his participation in the work of the Company’s Board of Directors, as long as he
performs the above-mentioned duties.
Valuation of benefits of any kind €6,000 The Chairman and CEO receives a company car, paid for by the Company for a
maximum value of €6,000 a year.
Stock options, free shares
or any other long-term form
of remuneration
Options: None
Shares:
129,269
free shares
No stock options were awarded to Xavier Barbaro for the year 2018.
During the year 2018, 129,269 free shares were granted to Xavier Barbaro by decision of
the Chairman on February 23, and July 5, 2018 (the Company was in the form of a
simplified joint stock company at the time).
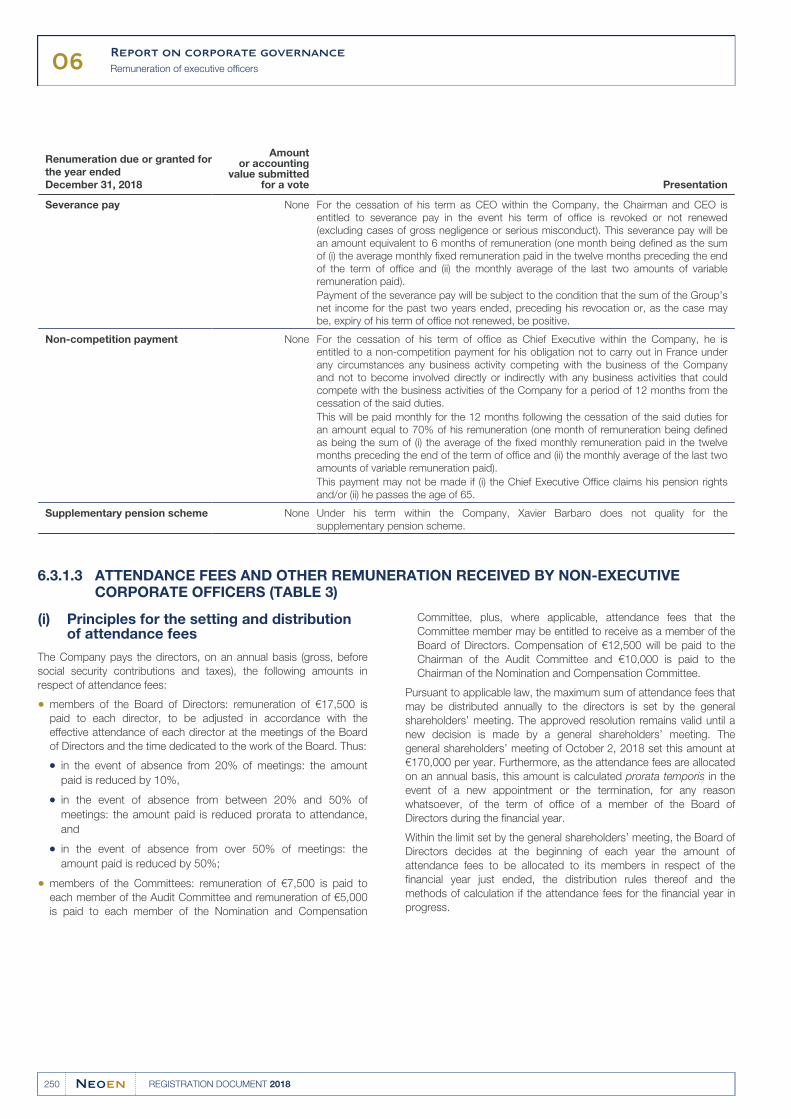
06Report on corporate governance
Remuneration of executive officers
250 REGISTRATION DOCUMENT 2018
Renumeration due or granted for
the year ended
December 31, 2018
Amountor accounting
value submittedfor a vote Presentation
Severance pay None For the cessation of his term as CEO within the Company, the Chairman and CEO is
entitled to severance pay in the event his term of office is revoked or not renewed
(excluding cases of gross negligence or serious misconduct). This severance pay will be
an amount equivalent to 6 months of remuneration (one month being defined as the sum
of (i) the average monthly fixed remuneration paid in the twelve months preceding the end
of the term of office and (ii) the monthly average of the last two amounts of variable
remuneration paid).
Payment of the severance pay will be subject to the condition that the sum of the Group’s
net income for the past two years ended, preceding his revocation or, as the case may
be, expiry of his term of office not renewed, be positive.
Non-competition payment None For the cessation of his term of office as Chief Executive within the Company, he is
entitled to a non-competition payment for his obligation not to carry out in France under
any circumstances any business activity competing with the business of the Company
and not to become involved directly or indirectly with any business activities that could
compete with the business activities of the Company for a period of 12 months from the
cessation of the said duties.
This will be paid monthly for the 12 months following the cessation of the said duties for
an amount equal to 70% of his remuneration (one month of remuneration being defined
as being the sum of (i) the average of the fixed monthly remuneration paid in the twelve
months preceding the end of the term of office and (ii) the monthly average of the last two
amounts of variable remuneration paid).
This payment may not be made if (i) the Chief Executive Office claims his pension rights
and/or (ii) he passes the age of 65.
Supplementary pension scheme None Under his term within the Company, Xavier Barbaro does not quality for the
supplementary pension scheme.
ATTENDANCE FEES AND OTHER REMUNERATION RECEIVED BY NON-EXECUTIVE 6.3.1.3CORPORATE OFFICERS (TABLE 3)
Principles for the setting and distribution (i)of attendance fees
The Company pays the directors, on an annual basis (gross, before
social security contributions and taxes), the following amounts in
respect of attendance fees:
members of the Board of Directors: remuneration of €17,500 is●paid to each director, to be adjusted in accordance with the
effective attendance of each director at the meetings of the Board
of Directors and the time dedicated to the work of the Board. Thus:
in the event of absence from 20% of meetings: the amount●paid is reduced by 10%,
in the event of absence from between 20% and 50% of●meetings: the amount paid is reduced prorata to attendance,
and
in the event of absence from over 50% of meetings: the●amount paid is reduced by 50%;
Committee, plus, where applicable, attendance fees that the
Committee member may be entitled to receive as a member of the
Board of Directors. Compensation of €12,500 will be paid to the
Chairman of the Audit Committee and €10,000 is paid to the
Chairman of the Nomination and Compensation Committee.
members of the Committees: remuneration of €7,500 is paid to●each member of the Audit Committee and remuneration of €5,000
is paid to each member of the Nomination and Compensation
Pursuant to applicable law, the maximum sum of attendance fees that
may be distributed annually to the directors is set by the general
shareholders’ meeting. The approved resolution remains valid until a
new decision is made by a general shareholders’ meeting. The
general shareholders’ meeting of October 2, 2018 set this amount at
€170,000 per year. Furthermore, as the attendance fees are allocated
on an annual basis, this amount is calculated prorata temporis in the
event of a new appointment or the termination, for any reason
whatsoever, of the term of office of a member of the Board of
Directors during the financial year.
Within the limit set by the general shareholders’ meeting, the Board of
Directors decides at the beginning of each year the amount of
attendance fees to be allocated to its members in respect of the
financial year just ended, the distribution rules thereof and the
methods of calculation if the attendance fees for the financial year in
progress.
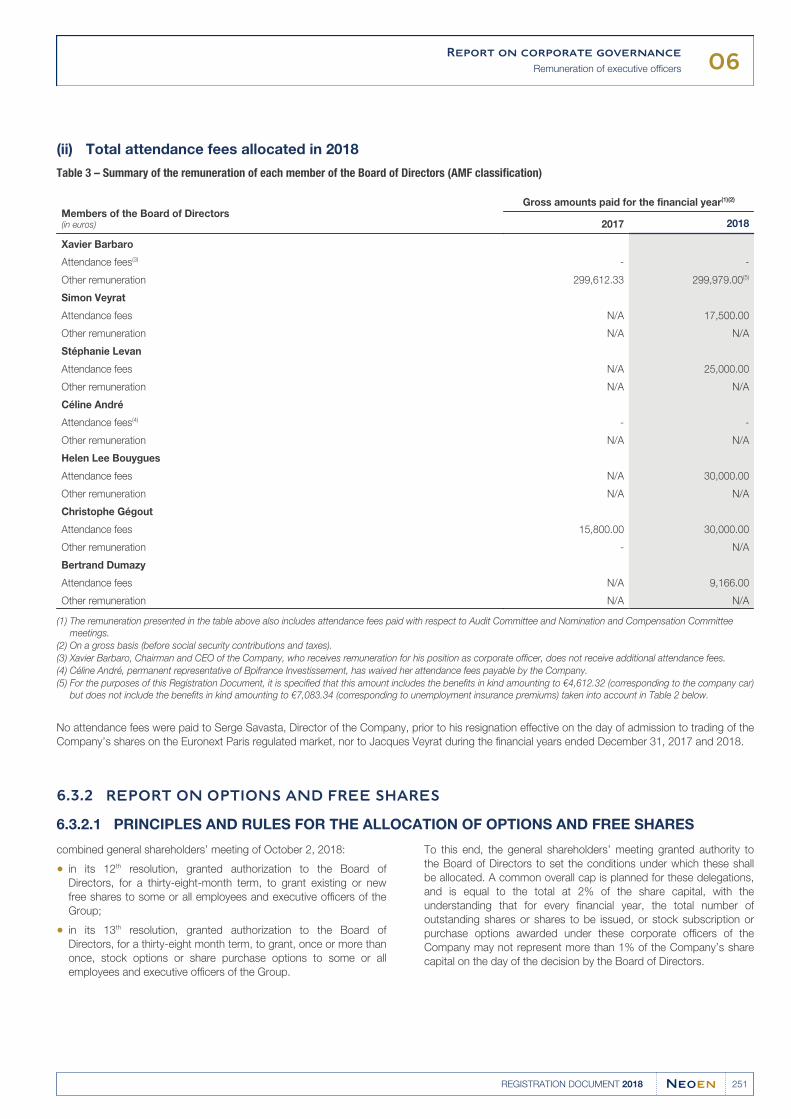
06Report on corporate governance
Remuneration of executive officers
251REGISTRATION DOCUMENT 2018
Total attendance fees allocated in 2018(ii)
Table 3 – Summary of the remuneration of each member of the Board of Directors (AMF classification)
Members of the Board of Directors(in euros)
Gross amounts paid for the financial year(1)(2)
2017 2018
Xavier Barbaro
Attendance fees(3) - -
Other remuneration 299,612.33 299,979.00(5)
Simon Veyrat
Attendance fees N/A 17,500.00
Other remuneration N/A N/A
Stéphanie Levan
Attendance fees N/A 25,000.00
Other remuneration N/A N/A
Céline André
Attendance fees(4) - -
Other remuneration N/A N/A
Helen Lee Bouygues
Attendance fees N/A 30,000.00
Other remuneration N/A N/A
Christophe Gégout
Attendance fees 15,800.00 30,000.00
Other remuneration - N/A
Bertrand Dumazy
Attendance fees N/A 9,166.00
Other remuneration N/A N/A
The remuneration presented in the table above also includes attendance fees paid with respect to Audit Committee and Nomination and Compensation Committee (1)
meetings.
On a gross basis (before social security contributions and taxes).(2)
Xavier Barbaro, Chairman and CEO of the Company, who receives remuneration for his position as corporate officer, does not receive additional attendance fees.(3)
Céline André, permanent representative of Bpifrance Investissement, has waived her attendance fees payable by the Company.(4)
For the purposes of this Registration Document, it is specified that this amount includes the benefits in kind amounting to €4,612.32 (corresponding to the company car) (5)
but does not include the benefits in kind amounting to €7,083.34 (corresponding to unemployment insurance premiums) taken into account in Table 2 below.
No attendance fees were paid to Serge Savasta, Director of the Company, prior to his resignation effective on the day of admission to trading of the
Company’s shares on the Euronext Paris regulated market, nor to Jacques Veyrat during the financial years ended December 31, 2017 and 2018.
REPORT ON OPTIONS AND FREE SHARES6.3.2
PRINCIPLES AND RULES FOR THE ALLOCATION OF OPTIONS AND FREE SHARES6.3.2.1
combined general shareholders’ meeting of October 2, 2018:
in its 12th resolution, granted authorization to the Board of●Directors, for a thirty-eight-month term, to grant existing or new
free shares to some or all employees and executive officers of the
Group;
in its 13th resolution, granted authorization to the Board of●Directors, for a thirty-eight month term, to grant, once or more than
once, stock options or share purchase options to some or all
employees and executive officers of the Group.
To this end, the general shareholders’ meeting granted authority to
the Board of Directors to set the conditions under which these shall
be allocated. A common overall cap is planned for these delegations,
and is equal to the total at 2% of the share capital, with the
understanding that for every financial year, the total number of
outstanding shares or shares to be issued, or stock subscription or
purchase options awarded under these corporate officers of the
Company may not represent more than 1% of the Company’s share
capital on the day of the decision by the Board of Directors.
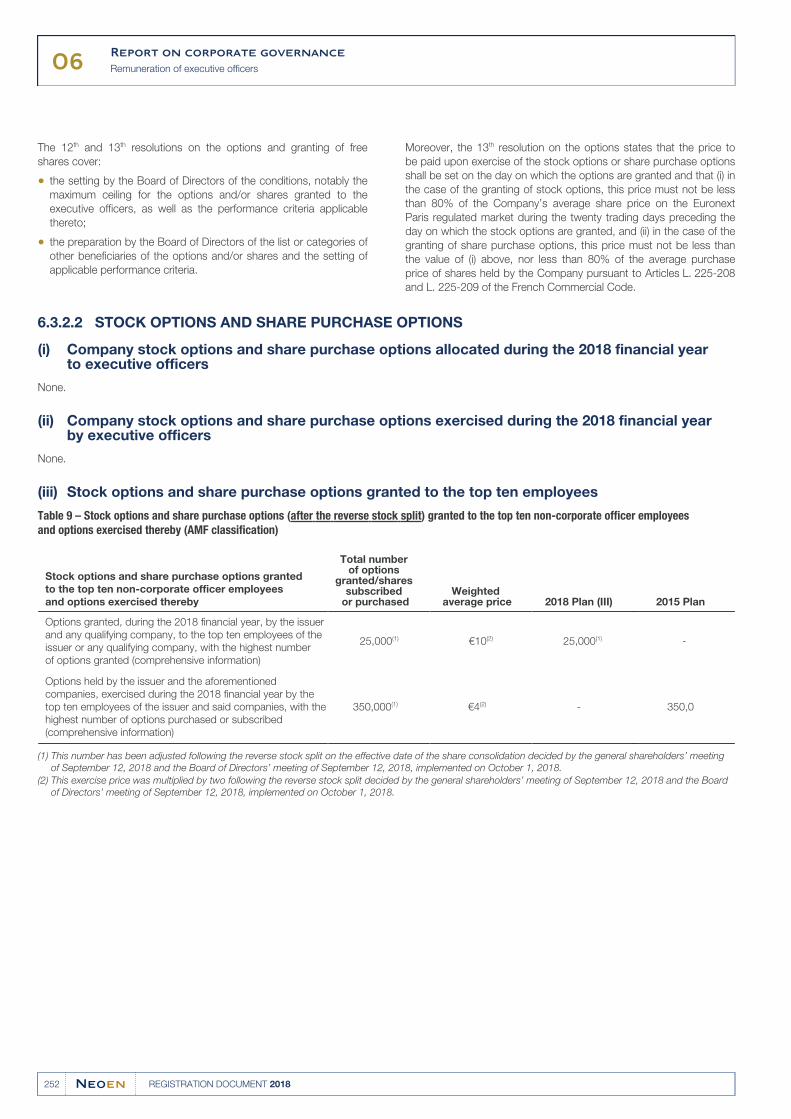
06Report on corporate governance
Remuneration of executive officers
252 REGISTRATION DOCUMENT 2018
The 12th and 13th resolutions on the options and granting of free
shares cover:
the setting by the Board of Directors of the conditions, notably the●maximum ceiling for the options and/or shares granted to the
executive officers, as well as the performance criteria applicable
thereto;
the preparation by the Board of Directors of the list or categories of●other beneficiaries of the options and/or shares and the setting of
applicable performance criteria.
Moreover, the 13th resolution on the options states that the price to
be paid upon exercise of the stock options or share purchase options
shall be set on the day on which the options are granted and that (i) in
the case of the granting of stock options, this price must not be less
than 80% of the Company’s average share price on the Euronext
Paris regulated market during the twenty trading days preceding the
day on which the stock options are granted, and (ii) in the case of the
granting of share purchase options, this price must not be less than
the value of (i) above, nor less than 80% of the average purchase
price of shares held by the Company pursuant to Articles L. 225-208
and L. 225-209 of the French Commercial Code.
STOCK OPTIONS AND SHARE PURCHASE OPTIONS6.3.2.2
Company stock options and share purchase options allocated during the 2018 financial year (i)to executive officers
None.
Company stock options and share purchase options exercised during the 2018 financial year (ii)by executive officers
None.
Stock options and share purchase options granted to the top ten employees(iii)
Table 9 – Stock options and share purchase options (after the reverse stock split) granted to the top ten non-corporate officer employees
and options exercised thereby (AMF classification)
Stock options and share purchase options granted
to the top ten non-corporate officer employees
and options exercised thereby
Total number of options
granted/shares subscribed
or purchasedWeighted
average price 2018 Plan (III) 2015 Plan
Options granted, during the 2018 financial year, by the issuer
and any qualifying company, to the top ten employees of the
issuer or any qualifying company, with the highest number
of options granted (comprehensive information)
25,000(1) €10(2) 25,000(1) -
Options held by the issuer and the aforementioned
companies, exercised during the 2018 financial year by the
top ten employees of the issuer and said companies, with the
highest number of options purchased or subscribed
(comprehensive information)
350,000(1) €4(2) - 350,0
This number has been adjusted following the reverse stock split on the effective date of the share consolidation decided by the general shareholders’ meeting (1)
of September 12, 2018 and the Board of Directors’ meeting of September 12, 2018, implemented on October 1, 2018.
This exercise price was multiplied by two following the reverse stock split decided by the general shareholders’ meeting of September 12, 2018 and the Board (2)
of Directors’ meeting of September 12, 2018, implemented on October 1, 2018.
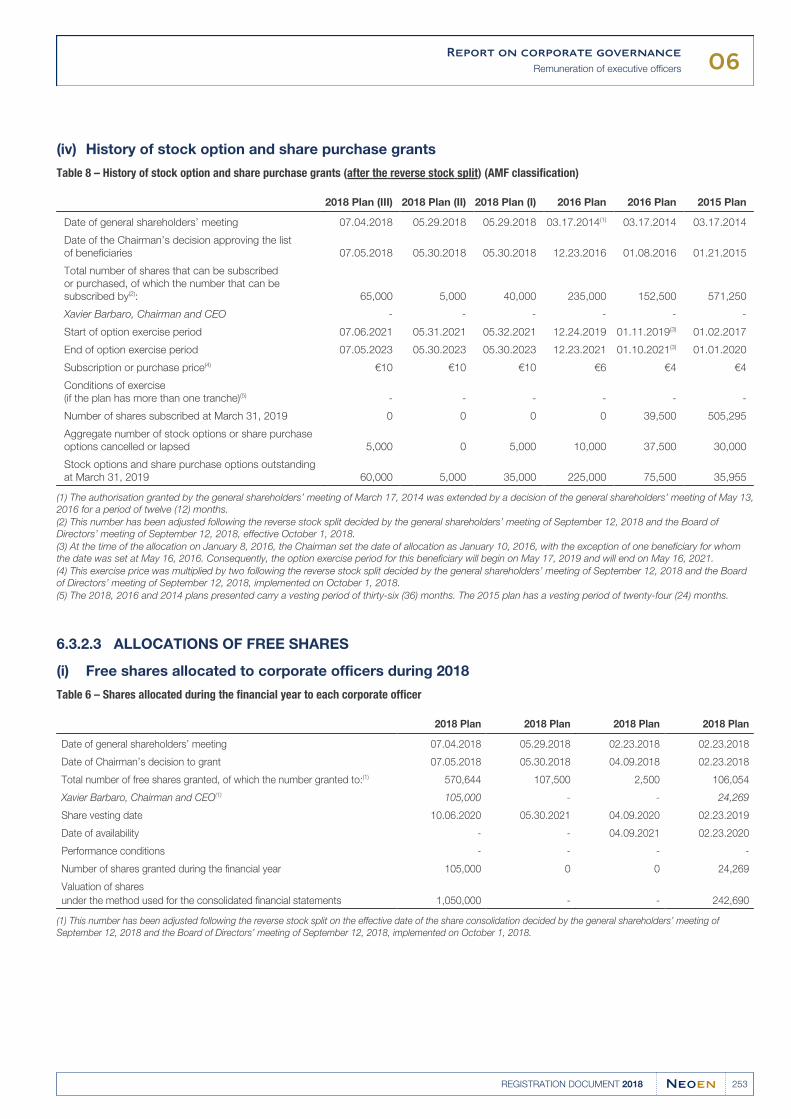
06Report on corporate governance
Remuneration of executive officers
253REGISTRATION DOCUMENT 2018
History of stock option and share purchase grants(iv)
Table 8 – History of stock option and share purchase grants (after the reverse stock split) (AMF classification)
2018 Plan (III) 2018 Plan (II) 2018 Plan (I) 2016 Plan 2016 Plan 2015 Plan
Date of general shareholders’ meeting 07.04.2018 05.29.2018 05.29.2018 03.17.2014(1) 03.17.2014 03.17.2014
Date of the Chairman’s decision approving the list
of beneficiaries 07.05.2018 05.30.2018 05.30.2018 12.23.2016 01.08.2016 01.21.2015
Total number of shares that can be subscribed
or purchased, of which the number that can be
subscribed by(2): 65,000 5,000 40,000 235,000 152,500 571,250
Xavier Barbaro, Chairman and CEO - - - - - -
Start of option exercise period 07.06.2021 05.31.2021 05.32.2021 12.24.2019 01.11.2019(3) 01.02.2017
End of option exercise period 07.05.2023 05.30.2023 05.30.2023 12.23.2021 01.10.2021(3) 01.01.2020
Subscription or purchase price(4) €10 €10 €10 €6 €4 €4
Conditions of exercise
(if the plan has more than one tranche)(5) - - - - - -
Number of shares subscribed at March 31, 2019 0 0 0 0 39,500 505,295
Aggregate number of stock options or share purchase
options cancelled or lapsed 5,000 0 5,000 10,000 37,500 30,000
Stock options and share purchase options outstanding
at March 31, 2019 60,000 5,000 35,000 225,000 75,500 35,955
(1) The authorisation granted by the general shareholders’ meeting of March 17, 2014 was extended by a decision of the general shareholders’ meeting of May 13,
2016 for a period of twelve (12) months.
(2) This number has been adjusted following the reverse stock split decided by the general shareholders’ meeting of September 12, 2018 and the Board of
Directors’ meeting of September 12, 2018, effective October 1, 2018.
(3) At the time of the allocation on January 8, 2016, the Chairman set the date of allocation as January 10, 2016, with the exception of one beneficiary for whom
the date was set at May 16, 2016. Consequently, the option exercise period for this beneficiary will begin on May 17, 2019 and will end on May 16, 2021.
(4) This exercise price was multiplied by two following the reverse stock split decided by the general shareholders’ meeting of September 12, 2018 and the Board
of Directors’ meeting of September 12, 2018, implemented on October 1, 2018.
(5) The 2018, 2016 and 2014 plans presented carry a vesting period of thirty-six (36) months. The 2015 plan has a vesting period of twenty-four (24) months.
ALLOCATIONS OF FREE SHARES6.3.2.3
Free shares allocated to corporate officers during 2018(i)
Table 6 – Shares allocated during the financial year to each corporate officer
2018 Plan 2018 Plan 2018 Plan 2018 Plan
Date of general shareholders’ meeting 07.04.2018 05.29.2018 02.23.2018 02.23.2018
Date of Chairman’s decision to grant 07.05.2018 05.30.2018 04.09.2018 02.23.2018
Total number of free shares granted, of which the number granted to:(1) 570,644 107,500 2,500 106,054
Xavier Barbaro, Chairman and CEO(1) 105,000 - - 24,269
Share vesting date 10.06.2020 05.30.2021 04.09.2020 02.23.2019
Date of availability - - 04.09.2021 02.23.2020
Performance conditions - - - -
Number of shares granted during the financial year 105,000 0 0 24,269
Valuation of shares
under the method used for the consolidated financial statements 1,050,000 - - 242,690
(1) This number has been adjusted following the reverse stock split on the effective date of the share consolidation decided by the general shareholders’ meeting of
September 12, 2018 and the Board of Directors’ meeting of September 12, 2018, implemented on October 1, 2018.
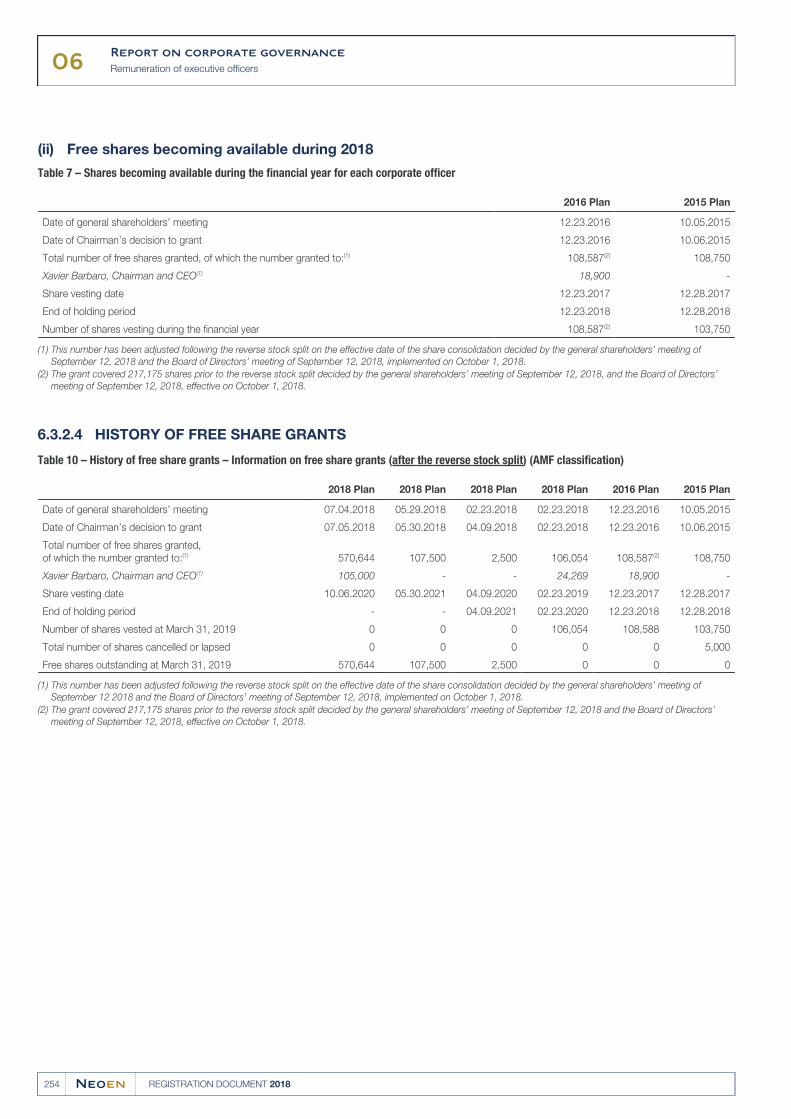
06Report on corporate governance
Remuneration of executive officers
254 REGISTRATION DOCUMENT 2018
Free shares becoming available during 2018(ii)
Table 7 – Shares becoming available during the financial year for each corporate officer
2016 Plan 2015 Plan
Date of general shareholders’ meeting 12.23.2016 10.05.2015
Date of Chairman’s decision to grant 12.23.2016 10.06.2015
Total number of free shares granted, of which the number granted to:(1) 108,587(2) 108,750
Xavier Barbaro, Chairman and CEO(1) 18,900 -
Share vesting date 12.23.2017 12.28.2017
End of holding period 12.23.2018 12.28.2018
Number of shares vesting during the financial year 108,587(2) 103,750
This number has been adjusted following the reverse stock split on the effective date of the share consolidation decided by the general shareholders’ meeting of (1)
September 12, 2018 and the Board of Directors’ meeting of September 12, 2018, implemented on October 1, 2018.
The grant covered 217,175 shares prior to the reverse stock split decided by the general shareholders’ meeting of September 12, 2018, and the Board of Directors’ (2)
meeting of September 12, 2018, effective on October 1, 2018.
HISTORY OF FREE SHARE GRANTS6.3.2.4
Table 10 – History of free share grants – Information on free share grants (after the reverse stock split) (AMF classification)
2018 Plan 2018 Plan 2018 Plan 2018 Plan 2016 Plan 2015 Plan
Date of general shareholders’ meeting 07.04.2018 05.29.2018 02.23.2018 02.23.2018 12.23.2016 10.05.2015
Date of Chairman’s decision to grant 07.05.2018 05.30.2018 04.09.2018 02.23.2018 12.23.2016 10.06.2015
Total number of free shares granted,
of which the number granted to:(1) 570,644 107,500 2,500 106,054 108,587(2) 108,750
Xavier Barbaro, Chairman and CEO(1) 105,000 - - 24,269 18,900 -
Share vesting date 10.06.2020 05.30.2021 04.09.2020 02.23.2019 12.23.2017 12.28.2017
End of holding period - - 04.09.2021 02.23.2020 12.23.2018 12.28.2018
Number of shares vested at March 31, 2019 0 0 0 106,054 108,588 103,750
Total number of shares cancelled or lapsed 0 0 0 0 0 5,000
Free shares outstanding at March 31, 2019 570,644 107,500 2,500 0 0 0
This number has been adjusted following the reverse stock split on the effective date of the share consolidation decided by the general shareholders’ meeting of (1)
September 12 2018 and the Board of Directors’ meeting of September 12, 2018, implemented on October 1, 2018.
The grant covered 217,175 shares prior to the reverse stock split decided by the general shareholders’ meeting of September 12, 2018 and the Board of Directors’ (2)
meeting of September 12, 2018, effective on October 1, 2018.
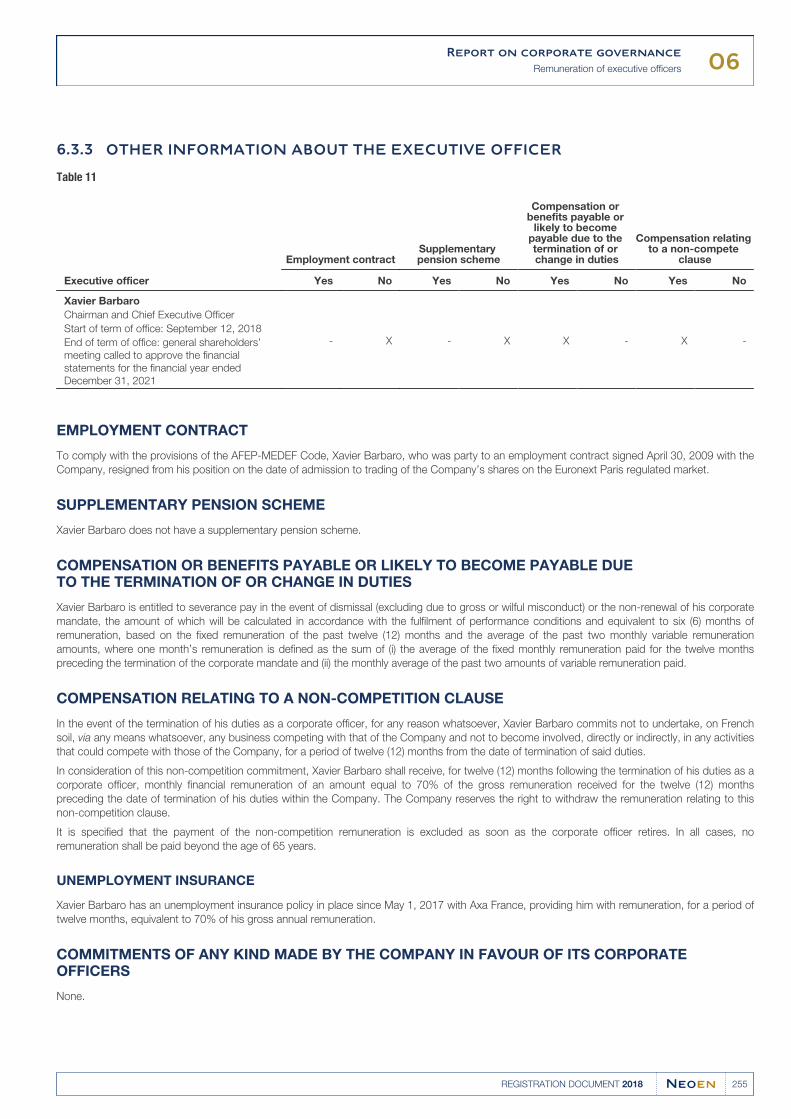
06Report on corporate governance
Remuneration of executive officers
255REGISTRATION DOCUMENT 2018
OTHER INFORMATION ABOUT THE EXECUTIVE OFFICER6.3.3
Table 11
Executive officer
Employment contractSupplementary pension scheme
Compensation or benefits payable or
likely to become payable due to the termination of or change in duties
Compensation relating to a non-compete
clause
Yes No Yes No Yes No Yes No
Xavier Barbaro
Chairman and Chief Executive Officer
Start of term of office: September 12, 2018
End of term of office: general shareholders’
meeting called to approve the financial
statements for the financial year ended
December 31, 2021
- X - X X - X -
EMPLOYMENT CONTRACT
To comply with the provisions of the AFEP-MEDEF Code, Xavier Barbaro, who was party to an employment contract signed April 30, 2009 with the
Company, resigned from his position on the date of admission to trading of the Company’s shares on the Euronext Paris regulated market.
SUPPLEMENTARY PENSION SCHEME
Xavier Barbaro does not have a supplementary pension scheme.
COMPENSATION OR BENEFITS PAYABLE OR LIKELY TO BECOME PAYABLE DUE TO THE TERMINATION OF OR CHANGE IN DUTIES
Xavier Barbaro is entitled to severance pay in the event of dismissal (excluding due to gross or wilful misconduct) or the non-renewal of his corporate
mandate, the amount of which will be calculated in accordance with the fulfilment of performance conditions and equivalent to six (6) months of
remuneration, based on the fixed remuneration of the past twelve (12) months and the average of the past two monthly variable remuneration
amounts, where one month’s remuneration is defined as the sum of (i) the average of the fixed monthly remuneration paid for the twelve months
preceding the termination of the corporate mandate and (ii) the monthly average of the past two amounts of variable remuneration paid.
COMPENSATION RELATING TO A NON-COMPETITION CLAUSE
In the event of the termination of his duties as a corporate officer, for any reason whatsoever, Xavier Barbaro commits not to undertake, on French
soil, via any means whatsoever, any business competing with that of the Company and not to become involved, directly or indirectly, in any activities
that could compete with those of the Company, for a period of twelve (12) months from the date of termination of said duties.
In consideration of this non-competition commitment, Xavier Barbaro shall receive, for twelve (12) months following the termination of his duties as a
corporate officer, monthly financial remuneration of an amount equal to 70% of the gross remuneration received for the twelve (12) months
preceding the date of termination of his duties within the Company. The Company reserves the right to withdraw the remuneration relating to this
non-competition clause.
It is specified that the payment of the non-competition remuneration is excluded as soon as the corporate officer retires. In all cases, no
remuneration shall be paid beyond the age of 65 years.
UNEMPLOYMENT INSURANCE
Xavier Barbaro has an unemployment insurance policy in place since May 1, 2017 with Axa France, providing him with remuneration, for a period of
twelve months, equivalent to 70% of his gross annual remuneration.
COMMITMENTS OF ANY KIND MADE BY THE COMPANY IN FAVOUR OF ITS CORPORATE OFFICERS
None.
06Report on corporate governance
Remuneration of executive officers
256 REGISTRATION DOCUMENT 2018
SUM OF PROVISIONS MADE BY THE COMPANY OR ITS SUBSIDIARIES 6.3.4
FOR PENSIONS, RETIREMENT BENEFITS OR OTHER BENEFITS
The Company has not made any provisions for pensions, retirement benefits or any other similar benefits for its corporate officers.
PRINCIPLES AND CRITERIA FOR DETERMINING, ALLOCATING AND GRANTING 6.3.5
COMPENSATION OF THE CHAIRMAN AND CHIEF EXECUTIVE OFFICER IN 2019
The Board of Directors, on April 17, 2019, resolved to approve the proposal of the Remuneration and Nomination Committee to renew the general
structure of Chairman and Chief Executive Officer remuneration applicable for the 2018 financial year, subject to a few minor amendments presented
below.
FIXED REMUNERATION
The gross fixed remuneration of the Chairman and Chief Executive
Officer will be maintained at €200,000 per year.
VARIABLE REMUNERATION
With regard to the gross variable remuneration, it is proposed that it be
based 75% on quantitative criteria and 25% on qualitative criteria,
subject to the achievement of target objectives set with regard to the
Company’s budget, as approved by the Board of Directors and, with
respect to the “awarded” MW criterion, on the basis of the target set
by the Board of Directors. The proposed quantitative criteria make it
possible to correlate the amount of the Chairman and Chief Executive
Officer’s annual variable remuneration to the performance achieved by
the Group. The qualitative criteria take into consideration (i) on the one
hand, the improvement of the Company’s compliance with the social
and environmental standards, the importance of which continues to
grow and constitutes a major point of concern for the Group, whose
activity is focused on the development of renewable energies, and (ii)
on the other hand, the leadership that the Chairman and Chief
Executive Officer has demonstrated in order to contribute to the
Group’s development.
The amount of the annual variable remuneration would be equal to
100% of the annual fixed remuneration in case the quantitative and
the qualitative criteria set by the Board of Directors were achieved,
with the understanding that, if these criteria are outperformed, the
maximum amount of the variable remuneration cannot exceed an
amount corresponding to 200% of the gross annual fixed
remuneration.
With regard to quantitative criteria:
The quantitative criteria would represent 75% of the gross annual
variable remuneration in the event that the target objectives were
achieved, and would be appreciated with regard to the revenue and
EBITDA criteria in view of the realisation of the budget set by the Board
of Directors.
For each criterion defined below (i) a triggering threshold in relation to
the fixed objective is stipulated, (ii) in case of outperformance of the
said criterion in relation to the objective set, the weighting of this
criterion will be increased in order to account for this outperformance;
and (iii) an outperformance cap with regard to the target set is
stipulated.
These criteria are as follows:
Revenue criteria:●
15% of the gross annual variable remuneration (this percentage is
applicable in the event that the target objectives are achieved), taking
into account the Company’s revenue, with a threshold at 90% of the
revenue forecasted in the budget adopted by the Board of Directors,
as well as the following conditions for outperformance:
if revenue is between 90% and 100% (inclusive) of the●forecasted revenue, the realised percentage will be taken into
consideration in a linear manner. Thus, for example, if 95% of
the target revenue is attained, this criterion will allow the
Chairman and Chief Executive Officer to receive 50% of the
target amount of annual gross variable remuneration for this
criterion (that is, 7.5% of the amount of his annual fixed gross
remuneration), i.e. €15,000,
if revenue exceeds 100% of the forecasted revenue, a●multiplying factor of two will apply to the percentage of the
outperformance (i.e., the percentage between 100% and the
revenue attained). For example, if 120% of the target revenue
is attained, this criterion will allow the Chairman and Chief
Executive Officer to be paid 15% of 140% (i.e., 100% of the
target amount plus the percentage of outperformance (20%)
multiplied by two) of its annual fixed gross remuneration, i.e.
€42,000. It is pointed out that the level of outperformance
taken into account for the purposes of this calculation may not
exceed 125% of the forecasted revenue, so that the maximum
amount that may be due in the event of outperformance under
this criterion cannot exceed 15% of 150% of his annual fixed
gross remuneration, i.e. €45,000;
EBITDA Criterion:●
30% of the gross annual variable remuneration (this percentage is
applicable in the event that the target objectives are attained),
taking into account the EBITDA attained, with a threshold at 90%
of the EBITDA amount forecasted in the budget approved by the
Board of Directors (with linear application to the target amount of
the percentage attained between 90% and 100%) and identical
conditions of outperformance mutatis mutandis to those provided
for the revenue criterion, with the understanding that the
maximum amount that may be due in the event of
outperformance under this criterion may not exceed 30% of
150% of its annual fixed gross remuneration, i.e. €90,000;
06Report on corporate governance
Remuneration of executive officers
257REGISTRATION DOCUMENT 2018
Awarded New MW criterion:●
30% of the annual gross variable remuneration (this percentage is
applicable in the event that the target objectives are reached),
taking into account the number of new MWs awarded (including
all new MWs acquired within the framework of any external
growth operations as well as the new MWs having gone directly
to the “under construction” phase without going through the
“awarded” phase, and the new MWs corresponding to the
incremental capacity within the context of repowering projects)
(the “New MW”), with a threshold at 50% of the number of MWs
in the “awarded” target phase provided for by the Board of
Directors (the “Annual Target Number of New MW Awarded”,
as described below) and the following outperformance
conditions:
if the number of New MWs is between 50% and 100%●(inclusive) of the Annual Target Number of New MW Awarded
for a given year, the percentage attained will be taken into
consideration in a linear manner. For example, if the number of
new MWs reaches 70% of the Annual Target Number of New
MWs Awarded, this criterion will allow the Chairman and Chief
Executive Officer to receive 40% of the target amount of the
gross variable remuneration for this criterion (i.e., 30% of his
annual fixed remuneration), i.e. €24,000,
if the number of New MWs exceeds 100% of the Annual●Target Number of New MWs Awarded for a given year, a
multiplying factor of two applies to the percentage of
outperformance attained (i.e., the percentage between 100%
and the level attained). For example, if the number of New
MWs reaches 200% of the Annual Target Number of New
MWs Awarded, this criterion will allow the Chairman and Chief
Executive Officer to be paid 30% of 300% (i.e., 100% added to
the percentage of outperformance (i.e., 100%) multiplied by
two) of its annual fixed gross remuneration, i.e. €180,000. It is
pointed out that the level of outperformance taken into account
for the purposes of this calculation may not exceed 250% of
the Annual Target Number of New MWs Awarded for a given
financial year, so that the maximum amount that may be due in
the event of outperformance this criterion cannot exceed 30%
of 400% (i.e., 100% plus the percentage of maximum
outperformance (150%) multiplied by two) of his annual fixed
gross remuneration, i.e. €240,000.
the year compared with the number of bids taken into account
in the 2019 budget.
The Annual Target Number of New MWs Awarded is set by the
Board of Directors. In that owing to the postponement and
then the cancellation of the Mexican bid, the Group was unable
to win 402 MW under the Peubla project, despite the fact that
this project was taken into account in the 2018 budget, the
Nomination and Compensation Committee recommends to the
Board of Directors to set the Annual Target Number of New
MW Awarded for the purpose of variable remuneration for
financial years 2019 and 2020 to 901 MW per year. The Board
of Directors will have the option of adjusting the New MW
target Awarded to take into account the number of bids in
which the Company will have been able to participate during
With regard to qualitative criteria:
The qualitative performance criteria selected would represent 25% of
the Chairman and Chief Executive Officer’s annual gross variable
remuneration (this percentage is applicable in the event that the target
objectives are attained) and take into account:
the leadership of the Company’s Senior Management, its ability to●lead the Company and unite it around a growth and
internationalisation project and its ability to represent the Company
vis-à-vis the outside world; and
in order to comply with the requirements of the AFEP-MEDEF●Code, compliance with a CSR objective, namely a CSR strategy to
apply the highest standards in terms of governance and social and
environmental practices.
BENEFITS IN KIND AND OTHER ELEMENTS OF REMUNERATION
It is reminded that the Chairman and Chief Executive Officer has a
company car with a maximum value of €6,000 per year.
Mr. Xavier Barbaro will continue to benefit from the other conditions of
his tenure as Chairman and Chief Executive Officer set upon the
appointment of President and Chief Executive Officer, as decided by
the Board of Directors at its meeting of September 12, 2018 (defined
contribution supplementary pension as of its implementation for the
Company’s senior executives), severance package (average six
months of fixed and variable remuneration) and 12-month
non-competition indemnity (in exchange for a monthly financial
remuneration equal to 70% of the average monthly remuneration).
Pursuant to Article L. 225-37-2 of the French Commercial Code, the
following will be submitted for approval by the general shareholders’
meeting ruling on the 2018 accounts: the principles and the criteria
for determining and distributing the fixed, variable and exceptional
items comprising the total remuneration and benefits of any kind that
can be granted to the Chairman and CEO for exercising his term for
financial year 2019, comprising the remuneration policy concerning
him:
“9th resolution (Approval of the principles and the criteria for
determining and distributing the fixed, variable and exceptional items
comprising the total remuneration and benefits of any kind that can
be granted to the Chairman and CEO for exercising his term for
financial year 2019).
The general shareholders’ meeting, ruling on the conditions of
quorum and majority required for ordinary shareholders’ meetings,
having reviewed the report by the Board of Directors on corporate
governance, in accordance with Article L. 225-37-2 of the French
Commercial Code, approves the principles and the criteria for
determining and distributing the fixed, variable and exceptional items
comprising the total remuneration and benefits of any kind that can
be granted to the Chairman and CEO for exercising his term for the
year 2019 as presented in this report."
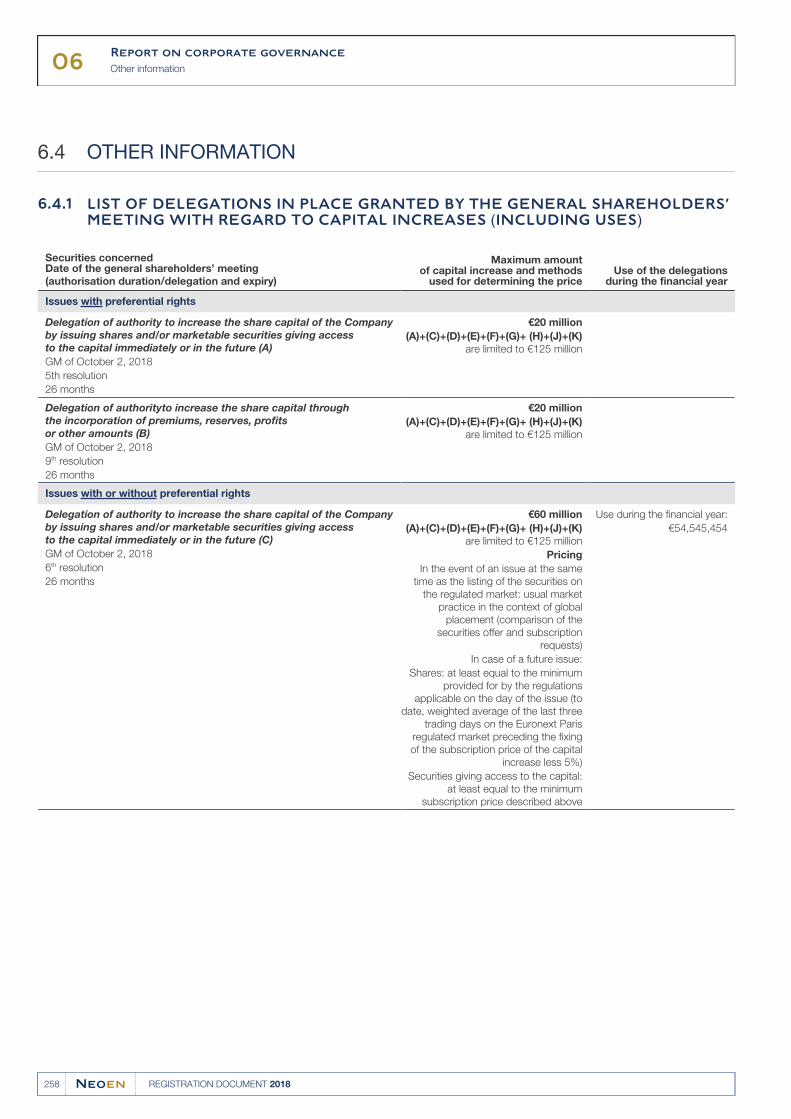
06Report on corporate governance
Other information
258 REGISTRATION DOCUMENT 2018
OTHER INFORMATION6.4
LIST OF DELEGATIONS IN PLACE GRANTED BY THE GENERAL SHAREHOLDERS’ 6.4.1
MEETING WITH REGARD TO CAPITAL INCREASES (INCLUDING USES)
Securities concernedDate of the general shareholders’ meeting
(authorisation duration/delegation and expiry)
Maximum amountof capital increase and methods
used for determining the priceUse of the delegations
during the financial year
Issues with preferential rights
Delegation of authority to increase the share capital of the Company
by issuing shares and/or marketable securities giving access
to the capital immediately or in the future (A)
GM of October 2, 2018
5th resolution
26 months
€20 million
(A)+(C)+(D)+(E)+(F)+(G)+ (H)+(J)+(K)
are limited to €125 million
Delegation of authorityto increase the share capital through
the incorporation of premiums, reserves, profits
or other amounts (B)
GM of October 2, 2018
9th resolution
26 months
€20 million
(A)+(C)+(D)+(E)+(F)+(G)+ (H)+(J)+(K)
are limited to €125 million
Issues with or without preferential rights
Delegation of authority to increase the share capital of the Company
by issuing shares and/or marketable securities giving access
to the capital immediately or in the future (C)
GM of October 2, 2018
6th resolution
26 months
€60 million
(A)+(C)+(D)+(E)+(F)+(G)+ (H)+(J)+(K)
are limited to €125 million
Pricing
In the event of an issue at the same
time as the listing of the securities on
the regulated market: usual market
practice in the context of global
placement (comparison of the
securities offer and subscription
requests)
In case of a future issue:
Shares: at least equal to the minimum
provided for by the regulations
applicable on the day of the issue (to
date, weighted average of the last three
trading days on the Euronext Paris
regulated market preceding the fixing
of the subscription price of the capital
increase less 5%)
Securities giving access to the capital:
at least equal to the minimum
subscription price described above
Use during the financial year:
€54,545,454
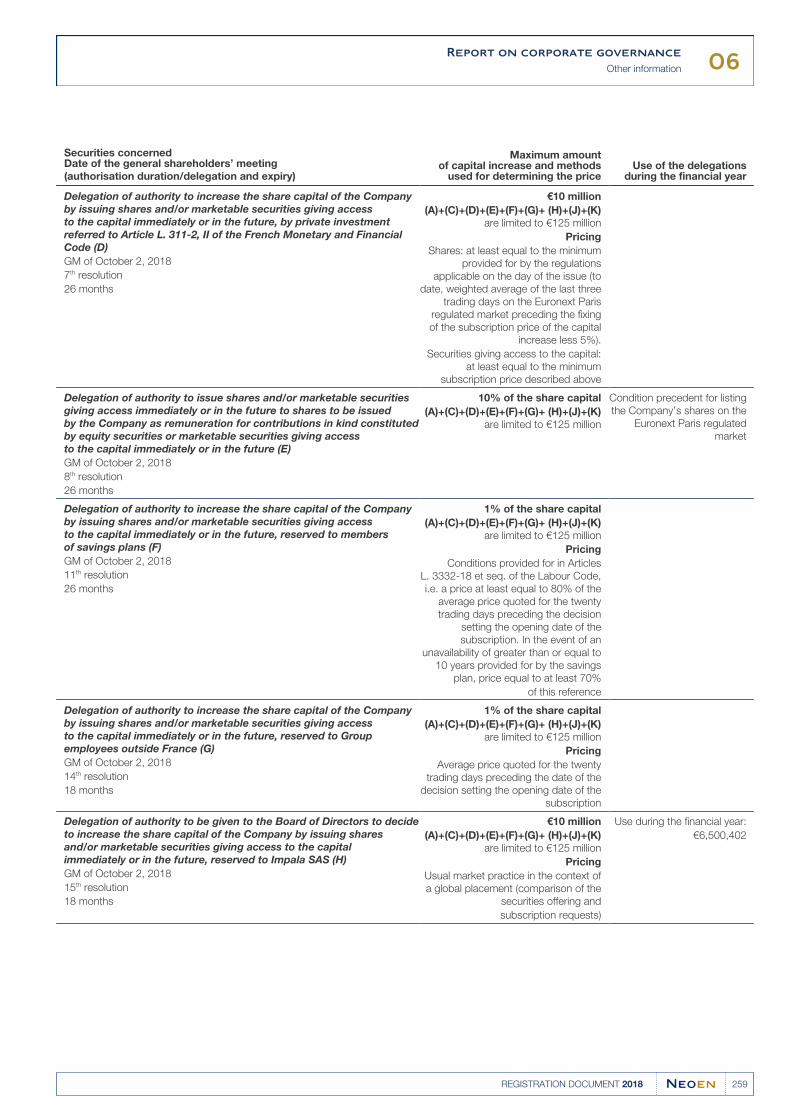
06Report on corporate governance
Other information
259REGISTRATION DOCUMENT 2018
Securities concernedDate of the general shareholders’ meeting
(authorisation duration/delegation and expiry)
Maximum amountof capital increase and methods
used for determining the priceUse of the delegations
during the financial year
Delegation of authority to increase the share capital of the Company
by issuing shares and/or marketable securities giving access
to the capital immediately or in the future, by private investment
referred to Article L. 311-2, II of the French Monetary and Financial
Code (D)
GM of October 2, 2018
7th resolution
26 months
€10 million
(A)+(C)+(D)+(E)+(F)+(G)+ (H)+(J)+(K)
are limited to €125 million
Pricing
Shares: at least equal to the minimum
provided for by the regulations
applicable on the day of the issue (to
date, weighted average of the last three
trading days on the Euronext Paris
regulated market preceding the fixing
of the subscription price of the capital
increase less 5%).
Securities giving access to the capital:
at least equal to the minimum
subscription price described above
Delegation of authority to issue shares and/or marketable securities
giving access immediately or in the future to shares to be issued
by the Company as remuneration for contributions in kind constituted
by equity securities or marketable securities giving access
to the capital immediately or in the future (E)
GM of October 2, 2018
8th resolution
26 months
10% of the share capital
(A)+(C)+(D)+(E)+(F)+(G)+ (H)+(J)+(K)
are limited to €125 million
Condition precedent for listing
the Company’s shares on the
Euronext Paris regulated
market
Delegation of authority to increase the share capital of the Company
by issuing shares and/or marketable securities giving access
to the capital immediately or in the future, reserved to members
of savings plans (F)
GM of October 2, 2018
11th resolution
26 months
1% of the share capital
(A)+(C)+(D)+(E)+(F)+(G)+ (H)+(J)+(K)
are limited to €125 million
Pricing
Conditions provided for in Articles
L. 3332-18 et seq. of the Labour Code,
i.e. a price at least equal to 80% of the
average price quoted for the twenty
trading days preceding the decision
setting the opening date of the
subscription. In the event of an
unavailability of greater than or equal to
10 years provided for by the savings
plan, price equal to at least 70%
of this reference
Delegation of authority to increase the share capital of the Company
by issuing shares and/or marketable securities giving access
to the capital immediately or in the future, reserved to Group
employees outside France (G)
GM of October 2, 2018
14th resolution
18 months
1% of the share capital
(A)+(C)+(D)+(E)+(F)+(G)+ (H)+(J)+(K)
are limited to €125 million
Pricing
Average price quoted for the twenty
trading days preceding the date of the
decision setting the opening date of the
subscription
Delegation of authority to be given to the Board of Directors to decide
to increase the share capital of the Company by issuing shares
and/or marketable securities giving access to the capital
immediately or in the future, reserved to Impala SAS (H)
GM of October 2, 2018
15th resolution
18 months
€10 million
(A)+(C)+(D)+(E)+(F)+(G)+ (H)+(J)+(K)
are limited to €125 million
Pricing
Usual market practice in the context of
a global placement (comparison of the
securities offering and
subscription requests)
Use during the financial year:
€6,500,402
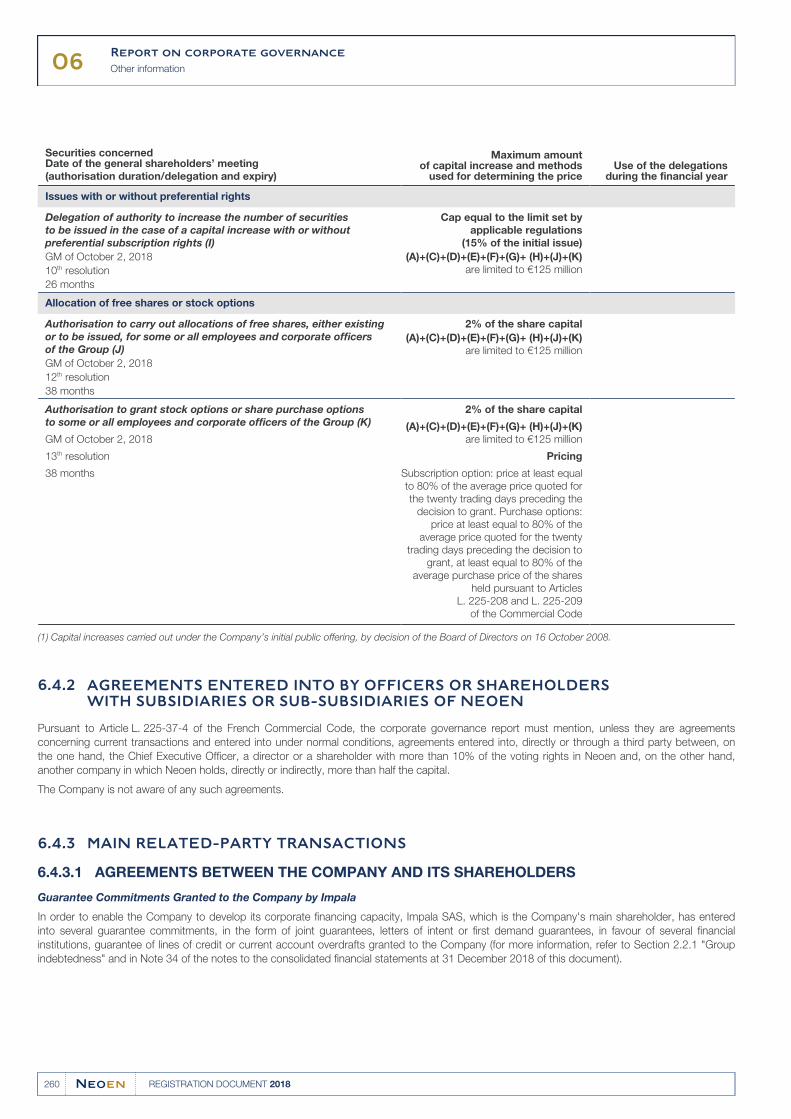
06Report on corporate governance
Other information
260 REGISTRATION DOCUMENT 2018
Securities concernedDate of the general shareholders’ meeting
(authorisation duration/delegation and expiry)
Maximum amountof capital increase and methods
used for determining the priceUse of the delegations
during the financial year
Issues with or without preferential rights
Delegation of authority to increase the number of securities
to be issued in the case of a capital increase with or without
preferential subscription rights (I)
GM of October 2, 2018
10th resolution
26 months
Cap equal to the limit set by
applicable regulations
(15% of the initial issue)
(A)+(C)+(D)+(E)+(F)+(G)+ (H)+(J)+(K)
are limited to €125 million
Allocation of free shares or stock options
Authorisation to carry out allocations of free shares, either existing
or to be issued, for some or all employees and corporate officers
of the Group (J)
GM of October 2, 2018
12th resolution
38 months
2% of the share capital
(A)+(C)+(D)+(E)+(F)+(G)+ (H)+(J)+(K)
are limited to €125 million
Authorisation to grant stock options or share purchase options
to some or all employees and corporate officers of the Group (K)
GM of October 2, 2018
13th resolution
38 months
2% of the share capital
(A)+(C)+(D)+(E)+(F)+(G)+ (H)+(J)+(K)
are limited to €125 million
Pricing
Subscription option: price at least equal
to 80% of the average price quoted for
the twenty trading days preceding the
decision to grant. Purchase options:
price at least equal to 80% of the
average price quoted for the twenty
trading days preceding the decision to
grant, at least equal to 80% of the
average purchase price of the shares
held pursuant to Articles
L. 225-208 and L. 225-209
of the Commercial Code
Capital increases carried out under the Company’s initial public offering, by decision of the Board of Directors on 16 October 2008.(1)
AGREEMENTS ENTERED INTO BY OFFICERS OR SHAREHOLDERS 6.4.2
WITH SUBSIDIARIES OR SUB-SUBSIDIARIES OF NEOEN
Pursuant to Article L. 225-37-4 of the French Commercial Code, the corporate governance report must mention, unless they are agreements
concerning current transactions and entered into under normal conditions, agreements entered into, directly or through a third party between, on
the one hand, the Chief Executive Officer, a director or a shareholder with more than 10% of the voting rights in Neoen and, on the other hand,
another company in which Neoen holds, directly or indirectly, more than half the capital.
The Company is not aware of any such agreements.
MAIN RELATED-PARTY TRANSACTIONS6.4.3
AGREEMENTS BETWEEN THE COMPANY AND ITS SHAREHOLDERS6.4.3.1
Guarantee Commitments Granted to the Company by Impala
In order to enable the Company to develop its corporate financing capacity, Impala SAS, which is the Company's main shareholder, has entered
into several guarantee commitments, in the form of joint guarantees, letters of intent or first demand guarantees, in favour of several financial
institutions, guarantee of lines of credit or current account overdrafts granted to the Company (for more information, refer to Section 2.2.1 "Group
indebtedness" and in Note 34 of the notes to the consolidated financial statements at 31 December 2018 of this document).
06Report on corporate governance
Other information
261REGISTRATION DOCUMENT 2018
Technical and Administrative Assistance Agreement between
the Company and Impala
On 10 May 2012, the Company and its main shareholder, Impala
SAS, entered into a technical and administrative assistance
agreement, pursuant to which Impala SAS undertook to provide the
following services to the Company:
advising on the Group's financing and guarantee strategy and●assisting with the negotiation of any financing and guarantee line
with financial partners;
representing the Company's interests before central and/or local●governments and regulatory authorities.
In consideration for these services, the agreement provides for the
payment to Impala SAS of a fixed monthly fee of €25,000 before tax,
which can be revised every year by agreement between the parties. In
the financial year ended 31 December 2018, Impala SAS charged the
Company €100,000 before tax in these royalties.
Strategic Management Agreement between the Company and
Impala
Impala SAS undertook to provide the following services of the
Group's holding company:
On 2 January 2017, the Company and its main shareholder, Impala
SAS, entered into a strategic management agreement by which
definition of the Group's general policy and organisational●principles;
definition of the Group's economic, commercial and financial●strategy;
definition of the Group's development policy and the resources to●be adopted (external growth, diversification, creation of new
establishments, growth and equity opportunities, investments, etc.);
definition of the Group's communication policy (marketing,●advertising, etc).
Since the date of the agreement, these benefits have not been
remunerated by the Company.
Real Estate Sublease Contracts
In the course of its business, the Company leased administrative
buildings and offices from its main shareholder, Impala SAS, as well
as from Eiffel Investment Group SAS, an affiliate of Impala SAS. These
contracts both ended on 29 August 2018.
AGREEMENTS BETWEEN THE COMPANY AND ITS SUBSIDIARIES6.4.3.2
Tax Consolidation Groups
The Company and some of its French direct subsidiaries, i.e. over
95% owned, constitute a tax consolidation group set up pursuant to
the provisions of Articles 223 A et seq. of the French Tax Code. Given
that the Company is the Group's parent company, it is solely liable for
the tax payable by all the companies belonging to the integrated
group. These subsidiaries pay the Company the tax for which they
would be liable in the absence of tax consolidation, calculated
according to the rules of law as they would apply in the absence of
tax consolidation.
Nine other French tax consolidation groups have also been set up in
France between each of the nine development companies related to
the Cestas project as parent company of the group and special
purpose vehicles owned by the development company in question by
more than 95%. The creation of these groups resulted in the signing
of tax consolidation agreements under which the integrated
subsidiaries pay the parent company the tax they would be liable for
in the absence of tax consolidation, calculated on the rules of law as
they would apply in the absence of tax consolidation.
In addition, the Group has also set up certain tax consolidation
groups abroad, particularly in Australia, where the parent company is
solely liable for the tax payable by all the companies of the group. The
creation of these groups led to the conclusion of tax consolidation
agreements between the parent company and each of the group's
companies in order to regulate the subsidiaries' contribution to the
overall tax based on a distribution key set in accordance with local
regulations and on the principle of "equitable distribution".
Agreements between the Company and the Special Purpose
Vehicles
As part of its activities, the Company aims to conclude, directly or
through its intermediary holding companies, all the contracts
necessary for the development, financing and operation of
photovoltaic, wind, biomass and storage facilities they operate. These
contracts generally provide for the following services:
project development and assistance during the construction phase,●including assistance in obtaining planning and environmental
permits, feasibility studies, diagnoses and impact studies; relations
with project stakeholders (neighbourhood, local authorities, etc.),
selection and relations with the EPC contractor or technical tests
related to the provisional and/or final acceptance of the installation;
administrative and financial management;●
facility operation and maintenance monitoring, including the●management and monitoring of relations with the O&M service
provider, the processing of information concerning the grid
connection of the facility or the performance of works and studies
to improve the performance of the facility.
These agreements are considered by the Group as ordinary
agreements entered into on normal terms.
Moreover, as part of project financing, the Company (or one of its
intermediate holding or development companies) generally grants
shareholder loans to special purpose vehicles. These agreements
generally provide for an interest of between 5% and 10% (with the
exception of certain Australian projects for which the rates are
generally between 10% and 15%), in line with the interest rates for
debt with equivalent levels of subordination. Shareholder loans are
subordinated to senior financing and are repayable on demand at the
Group's request, subject however to the financial covenants provided
for in the financing agreements, for projects located in France or at
maturity for projects located abroad. In the latter case, the related
agreements contain the usual cases of early repayment. They are
usually considered by the Group as ordinary agreements entered into
under normal conditions, but each is analysed in accordance with the
provisions of Article L. 225-38 of the French Commercial Code
relating to related-party agreements.
06Report on corporate governance
Other information
262 REGISTRATION DOCUMENT 2018
FACTORS THAT MAY HAVE AN IMPACT IN THE EVENT OF A PUBLIC OFFER6.4.4
In accordance with Article 225-37-5 of the French Commercial Code, the Company must set out and, if appropriate, explain the factors that may
have an impact in the event of a public tender or exchange offer. These factors include the agreements entered into by the Company that are
modified or terminated in the event of a change of control of the Company Hence, the financing contracts contain change of control clauses.
To the Company’s knowledge, there are no other factors that may have an impact in the event of a public purchase or exchange offer.
06Report on corporate governance
263REGISTRATION DOCUMENT 2018
264 REGISTRATION DOCUMENT 2018
07
265REGISTRATION DOCUMENT 2018
CAPITAL AND SHAREHOLDING STRUCTURE
INFORMATION ON THE COMPANY7.1 266
Corporate name7.1.1 266
Headquarters7.1.2 266
Legal form7.1.3 266
Legislation7.1.4 266
Term7.1.5 266
Corporate purpose7.1.6 266
Trade and Companies Register7.1.7 266
Location where documents 7.1.8
and information on the Company
may be consulted 266
Financial year7.1.9 266
Statutory distribution of the profits7.1.10 266
General shareholders’ meetings7.1.11 267
Shareholders’ voting rights7.1.12 267
Declaration of intent7.1.13 267
CAPITAL7.2 268
Share Capital7.2.1 268
Potential share capital7.2.2 268
Securities not representing share 7.2.3
capital 268
Conditions laid down by the Board 7.2.4
of Directors relating to the exercise
of the subscription and purchase
options granted to the officers 268
Conditions laid down by the Board 7.2.5
of Directors relating to the disposal
of the free shares allocated
to the officers 268
Summary statement 7.2.6
of the transactions
carried out during the financial year
by the executives or similar persons
on the Company’s securities
or on related financial instruments 268
Treasury shares and purchase 7.2.7
by the Company of its own shares 269
Other securities giving access 7.2.8
to the share capital 269
Terms governing any acquisition7.2.9
rights and/or obligations attached
to subscribed but not paid-up
capital 269
Share capital of any Group 7.2.10
company subject to an option
or option agreement 269
Programme for Neoen to buy back 7.2.11
its own shares 269
Agreement providing 7.2.12
for employees’ shareholding
in the Company’s capital 270
Shares not representing capital7.2.13 270
Change in the share capital7.2.14 271
Disposal of shares7.2.15 272
Pledges7.2.16 272
SHAREHOLDING STRUCTURE7.3 272
Allotment of capital and voting 7.3.1
rights 272
Commitments made 7.3.2
by the shareholders to retain
the securities in connection
with the initial public offering 273
Obligation to retain the Company’s 7.3.3
shares 273
Exceeding legal and/or statutory 7.3.4
thresholds 273
Changes in shareholding 7.3.5
over three years 274
Control structure7.3.6 275
Agreements that may lead 7.3.7
to a change of control 275
Dividends7.3.8 275
SECURITIES MARKET 7.4
AND RELATIONS
WITH SHAREHOLDERS 276
Securities market (stock market 7.4.1
information) 276
Relationships with shareholders7.4.2 277
07Capital and shareholding structure
Information on the Company
266 REGISTRATION DOCUMENT 2018
INFORMATION ON THE COMPANY7.1
CORPORATE NAME7.1.1
The Company’s corporate name is “Neoen”.
HEADQUARTERS7.1.2
The company’s registered office is located at 6 rue Ménars – 75002 Paris.
LEGAL FORM7.1.3
Until September 12, 2018, the Company was a simplified joint stock
company (société par actions simplifiée) with a statutory Supervisory
Board. As of the date hereof, the Company is a French law limited
company (société anonyme) governed by all of the laws and
regulations in force in France (and, in particular, by the provisions of
Book II of the French Commercial Code) as well as by its bylaws.
LEGISLATION7.1.4
A limited company (société anonyme) incorporated under French law.
TERM7.1.5
The Company was registered on September 29, 2008. The Company
has been incorporated for a period of 99 years as from the date of its
registration with the Trade and Companies Register, i.e. up until
September 28, 2107, except in the event of extension or early
dissolution.
CORPORATE PURPOSE7.1.6
(See Article 2 of the bylaws)
The Company’s corporate purpose includes the following activities,
both in France and abroad:
all activities relating to energy and the environment, and in●particular to the electricity, natural gas, and water sectors, In
particular, the production of electricity or other sources of energy,
and the sale, distribution, marketing, and storage of all energy
products and raw materials;
all arbitrage, development and marketing services relating to●derivative products and aggregate hedging products, and
management of the balancing of such products; all management
and advisory services relating to the energy or commodities sector;
the acquisition, disposal, use, and licensing of any intellectual or●industrial property rights related directly or indirectly to the
corporate purpose;
the corporate purpose or intended to promote its expansion or
development, including, but not limited to, the acquisition, holding,
obtaining or use, in any form whatsoever, of licenses, patents,
trademarks, and technical information.
and, more generally, all industrial, commercial, financial, movable●property or real estate transactions directly or indirectly related to
The Company may act, both in France and abroad, on its own behalf
or on behalf of third parties, and either alone or in partnerships,
associations, economic interest groups or companies with any other
companies or persons, and may carry out, directly or indirectly, in any
form whatsoever, transactions that fall within its corporate purpose.
It may also acquire, in any form, any interests and investments in any
companies or enterprises, whether French or foreign, whatever their
purpose.
TRADE AND COMPANIES 7.1.7
REGISTER
The Company is registered with the Paris Trade and Companies
Register under number 508 320 017.
LOCATION WHERE DOCUMENTS 7.1.8
AND INFORMATION
ON THE COMPANY MAY BE
CONSULTED
Information concerning the Company and particularly the bylaws,
balance sheets, income statements, reports by the Board of Directors
to the general shareholders’ meetings and the report by the statutory
auditors may be consulted on request at the Company’s
headquarters.
FINANCIAL YEAR7.1.9
The financial year begins on January 1 and ends on December 31,
of each year.
STATUTORY DISTRIBUTION 7.1.10
OF THE PROFITS
(See Article 24 of the bylaws)
Distributable profits shall consist of the year’s profit minus any prior
losses and the amount set aside as provided for above, plus profits
carried forward.
If the year’s financial statements, as approved by the general
shareholders meeting, show a distributable profit, the general
shareholders’ meeting shall decide whether to record it in one or
more reserve accounts of which it shall determine the allocation or
use, to carry it forward in retained earnings, or to distribute it in the
form of a dividend.
07Capital and shareholding structure
Information on the Company
267REGISTRATION DOCUMENT 2018
GENERAL SHAREHOLDERS’ MEETINGS7.1.11
(See Article 21 of the bylaws)
General shareholders’ meetings shall be called and held as provided
for by law.
Meetings shall take place either at the registered office or at any other
location specified in the final notice of meeting (avis de convocation).
All shareholders, whatever the number of shares they possess, have
the right to participate in shareholder meetings as provided for by law
and by these bylaws, upon proving their identity and registration of
their shares in their name or in the name of the intermediary registered
on their behalf as provided for by law.
Shareholders who do not personally attend the meeting may choose
one of the three following possibilities:
they may give a proxy to another shareholder or to their spouse; or●
they may vote by correspondence; or●
they may send a proxy to the Company without indicating a●representative;
as provided for by laws and regulations.
In accordance with applicable laws and regulations, the Board of
Directors may make arrangements for shareholders to participate in
and vote at general meetings by video conference or by other means
of telecommunication that make it possible to identify them.
If the Board of Directors decides to use this option for a given
meeting, the Board’s decision shall be stated in the preliminary (avis
de réunion) and.or final (avis de convocation) notice of meeting.
shareholders who participate in meetings by video conference or any
other means of telecommunication referred to above, as chosen by
the Board of Directors, shall be deemed present for purposes of
calculating the quorum and majority.
Meetings are chaired by the Chairman of the Board of Directors, or, in
the Chairman’s absence, by a director specifically delegated for the
purpose by the Board. Otherwise, the meeting shall appoint its own
chairman.
The role of scrutineer (scrutateur) shall be filled by the two
shareholders with the greatest number of voting rights who are
present and agree to perform the function. The bureau shall appoint a
secretary, who need not be a shareholder.
An attendance sheet must be maintained as provided for by law.
On the first notice of meeting, the ordinary general shareholders’
meeting may deliberate validly only if shareholders present,
represented, or voting by correspondence or by electronic means hold
at least one-fifth of shares with voting rights. On the second notice of
meeting, no quorum is required.
Decisions of the ordinary shareholders’ meeting are made by a
majority vote of shareholders present or represented.
The extraordinary general shareholders’ meeting may deliberate
validly only if shareholders present, represented, or having voted by
correspondence or by electronic means hold at least, on the first
notice of meeting, one-fourth, and on the second notice of meeting,
one-fifth of the shares with voting rights. In the absence of the latter
quorum, the second meeting may be postponed by a maximum of
two months following the date for which it was called, with the same
requirement of a quorum of one-fifth.
Decisions of the extraordinary shareholders’ meeting are made by a
two-thirds majority of shareholders present or represented.
Copies or extracts of the meeting minutes may be validly certified by
the Chairman of the Board of Directors, by a director serving as CEO,
or by the meeting’s secretary.
Ordinary and extraordinary general shareholders’ meetings shall
exercise their respective powers pursuant to the conditions provided
for by law.
SHAREHOLDERS’ VOTING RIGHTS7.1.12
(See Article 11 of the bylaws)
Each ordinary share gives its holder the right to one vote at general
shareholders’ meetings.
Moreover, as an exception to Article L. 225-123 of the Commercial
Code, Article 11 of the Company’s Articles of association stipulates
that the Company’s shares do not grant double voting rights in favour
of the Company’s shareholders.
DECLARATION OF INTENT7.1.13
None.
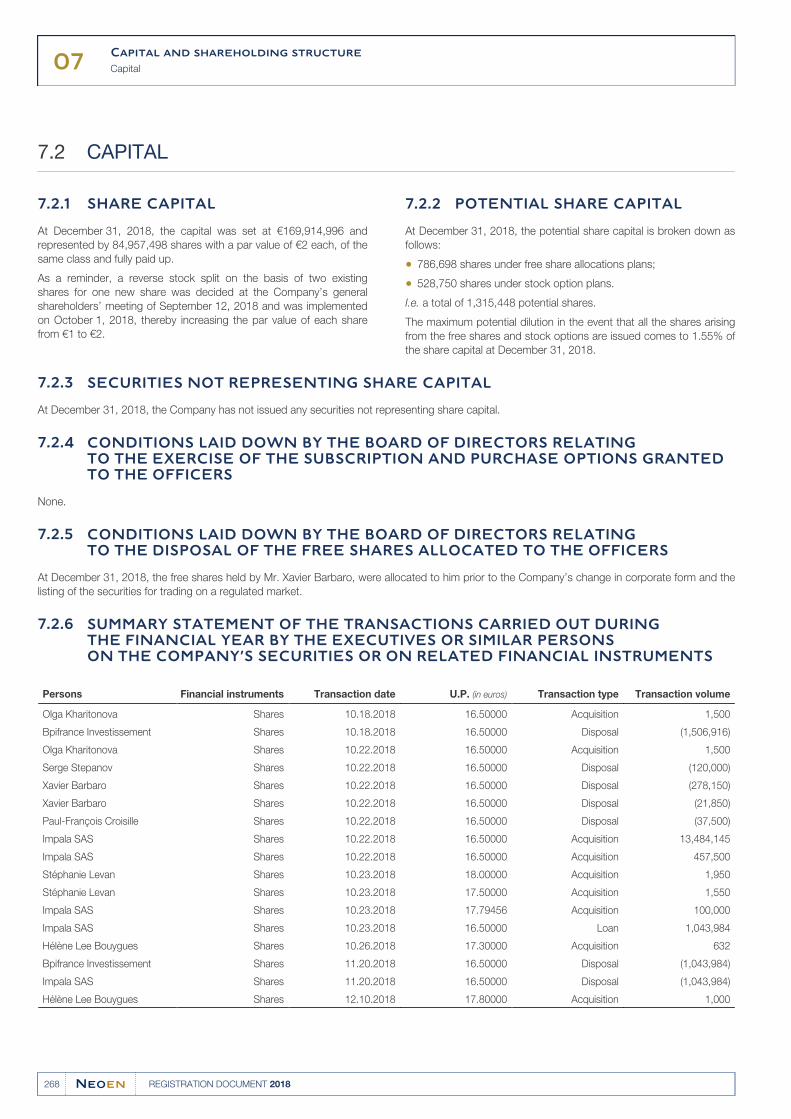
07Capital and shareholding structure
Capital
268 REGISTRATION DOCUMENT 2018
CAPITAL7.2
SHARE CAPITAL7.2.1
At December 31, 2018, the capital was set at €169,914,996 and
represented by 84,957,498 shares with a par value of €2 each, of the
same class and fully paid up.
As a reminder, a reverse stock split on the basis of two existing
shares for one new share was decided at the Company’s general
shareholders’ meeting of September 12, 2018 and was implemented
on October 1, 2018, thereby increasing the par value of each share
from €1 to €2.
POTENTIAL SHARE CAPITAL7.2.2
At December 31, 2018, the potential share capital is broken down as
follows:
786,698 shares under free share allocations plans;●
528,750 shares under stock option plans.●
I.e. a total of 1,315,448 potential shares.
The maximum potential dilution in the event that all the shares arising
from the free shares and stock options are issued comes to 1.55% of
the share capital at December 31, 2018.
SECURITIES NOT REPRESENTING SHARE CAPITAL7.2.3
At December 31, 2018, the Company has not issued any securities not representing share capital.
CONDITIONS LAID DOWN BY THE BOARD OF DIRECTORS RELATING 7.2.4
TO THE EXERCISE OF THE SUBSCRIPTION AND PURCHASE OPTIONS GRANTED
TO THE OFFICERS
None.
CONDITIONS LAID DOWN BY THE BOARD OF DIRECTORS RELATING 7.2.5
TO THE DISPOSAL OF THE FREE SHARES ALLOCATED TO THE OFFICERS
At December 31, 2018, the free shares held by Mr. Xavier Barbaro, were allocated to him prior to the Company’s change in corporate form and the
listing of the securities for trading on a regulated market.
SUMMARY STATEMENT OF THE TRANSACTIONS CARRIED OUT DURING 7.2.6
THE FINANCIAL YEAR BY THE EXECUTIVES OR SIMILAR PERSONS
ON THE COMPANY’S SECURITIES OR ON RELATED FINANCIAL INSTRUMENTS
Persons Financial instruments Transaction date U.P. (in euros) Transaction type Transaction volume
Olga Kharitonova Shares 10.18.2018 16.50000 Acquisition 1,500
Bpifrance Investissement Shares 10.18.2018 16.50000 Disposal (1,506,916)
Olga Kharitonova Shares 10.22.2018 16.50000 Acquisition 1,500
Serge Stepanov Shares 10.22.2018 16.50000 Disposal (120,000)
Xavier Barbaro Shares 10.22.2018 16.50000 Disposal (278,150)
Xavier Barbaro Shares 10.22.2018 16.50000 Disposal (21,850)
Paul-François Croisille Shares 10.22.2018 16.50000 Disposal (37,500)
Impala SAS Shares 10.22.2018 16.50000 Acquisition 13,484,145
Impala SAS Shares 10.22.2018 16.50000 Acquisition 457,500
Stéphanie Levan Shares 10.23.2018 18.00000 Acquisition 1,950
Stéphanie Levan Shares 10.23.2018 17.50000 Acquisition 1,550
Impala SAS Shares 10.23.2018 17.79456 Acquisition 100,000
Impala SAS Shares 10.23.2018 16.50000 Loan 1,043,984
Hélène Lee Bouygues Shares 10.26.2018 17.30000 Acquisition 632
Bpifrance Investissement Shares 11.20.2018 16.50000 Disposal (1,043,984)
Impala SAS Shares 11.20.2018 16.50000 Disposal (1,043,984)
Hélène Lee Bouygues Shares 12.10.2018 17.80000 Acquisition 1,000
07Capital and shareholding structure
Capital
269REGISTRATION DOCUMENT 2018
TREASURY SHARES AND PURCHASE BY THE COMPANY OF ITS OWN SHARES7.2.7
At December 31, 2018, none of its subsidiaries or a third party acting on its own account held any of the Company shares. At December 31, 2018,
the Company held 150,658 of is shares, representing 0.17% (on the basis of the share capital at December 31, 2018), of which 3,592 shares held
under the liquidity contract. These shares have no voting rights.
OTHER SECURITIES GIVING ACCESS TO THE SHARE CAPITAL7.2.8
STOCK OPTIONS7.2.8.1
At December 31, 2018, the general shareholders’ meeting of the
Company of October 2, 2018, in its 13th resolution authorised the
Board of Directors, with the right to sub-delegate, to grant stock
options or share purchase options to some or all employees and
executive officers of the Group.
ALLOCATIONS OF FREE SHARES7.2.8.2
At December 31, 2018, [the general shareholders’ meeting of the
Company of October 2, 2018, in its 12th resolution authorised the
Board of Directors to carry out allocations of free shares, either
existing or to be issued, for some or all employees and corporate
officers of the Group.
TERMS GOVERNING ANY ACQUISITION RIGHTS AND/OR OBLIGATIONS 7.2.9
ATTACHED TO SUBSCRIBED BUT NOT PAID-UP CAPITAL
None.
SHARE CAPITAL OF ANY GROUP COMPANY SUBJECT TO AN OPTION OR OPTION 7.2.10
AGREEMENT
None.
PROGRAMME FOR NEOEN TO BUY BACK ITS OWN SHARES7.2.11
AUTHORISATION GIVEN BY THE GENERAL SHAREHOLDERS’ MEETING OF OCTOBER 2, 2018
The general shareholders’ meeting of October 2, 2018 authorized the
Board of Directors to carry out stock market transactions on the
Company’s own shares. This authorization was given for 18 months,
until April 1, 2020.
The maximum buy-back unit price was set by the fourth resolution,
adopted by the combined general shareholders’ meeting of the
Company on October 2, 2018, at 200% of the price of the shares
offered to the public when the Company’s shares were listed for
trading on the Euronext Paris regulated market, i.e. a unit price of €33
per share for a maximum amount of €50 million.
The objectives of this programme are the following:
allocation of free shares under the provisions of●Articles L. 225-197-1 et seq. of the French Commercial Code
and/or the reduction of capital by cancellation of all or part of the
shares thus purchased;
stabilising the secondary market or the liquidity of the shares of the●Company by an investment service provider operating under a
liquidity contract complying with the charter of ethics recognised by
the Financial Market Authority (Autorité des Marchés Financiers –
AMF).
ASSESSMENT OF THE SHARE BUY-BACK PROGRAMME
(in number of treasury shares) Stock market stabilisationShare buy-back
programme Total
Positions at December 31, 2017 0 5,000(1) 5,000
Procurement 25,509 142,066 167,575
Sales (21,917) - (21,917)
POSITIONS AT DECEMBER 31, 2018 3,592 147,066 150,658
Number of shares after the implementation of the regrouping of shares on October 1, 2018.(1)
07Capital and shareholding structure
Capital
270 REGISTRATION DOCUMENT 2018
Over the whole year 2018, 167,575 shares were purchased at the average price of €18.67 per share and 21,917 shares were sold at the average
price of €18.79 per share. At December 31, 2018, Neoen directly or indirectly held 150,658 treasury shares, representing a value of €207 million on
the basis of the book value.
AGREEMENT PROVIDING FOR EMPLOYEES’ SHAREHOLDING 7.2.12
IN THE COMPANY’S CAPITAL
PROFIT-SHARING AGREEMENT
The introduction of a profit-sharing agreement is mandatory in
companies with 50 or more employees recording profits for tax
purposes in excess of the remuneration on 5% of the equity capital in
application of Article L. 3322-2 of the French Labor Code.
In 2018, the Company signed a profit-sharing agreement with the
combined employee representative body, which was filed with the
DIRECCTE.
COMPANY SAVINGS SCHEMES AND ASSIMILATED SCHEMES
The creation of a savings scheme is mandatory in companies having
put in place a profit-sharing arrangement in application of
Articles L. 3323-2 and L. 3323-3 of the French Labour Code. A
company or group savings scheme is a collective savings system
offering employees of member companies the option to build up a
portfolio of securities with the help of their employer.
In 2014, the Company put in place a company savings scheme (PEE)
and a collective retirement savings scheme (PERCO).
Any amounts generated under the profit-sharing scheme as well as
contributions made by employees on a voluntary basis, potentially
topped by an additional payment made by the employer (top-up),
may be paid to the PEE and the PERCO.
This arrangement for payment of a top-up by the employer in addition
to voluntary payments made by employees up to the maximum limits
defined by law has been in place in the Company to date and is
revised on an annual basis.
All amounts invested in the PEE are then locked up for five years while
amounts invested in the PERCO remain locked up until the retirement of
the beneficiary other than in those cases of early release defined by law.
In accordance with Article L. 3332-25 of the French Labour Code, the
saver has the option to liquidate all assets held in the scheme in order
to exercise the share purchase options allocated under the conditions
set out in Articles L. 225-177 or L. 225-179 of the French
Commercial Code. Shares subscribed for or purchased in this
manner by the saver are then paid into the savings scheme and are
vested only after a period of five years starting from this payment.
At December 31, 2018, the employees did not have any share in the
profits of the Company under the agreements described above.
SHARES NOT REPRESENTING CAPITAL7.2.13
There are no shares not representing capital.
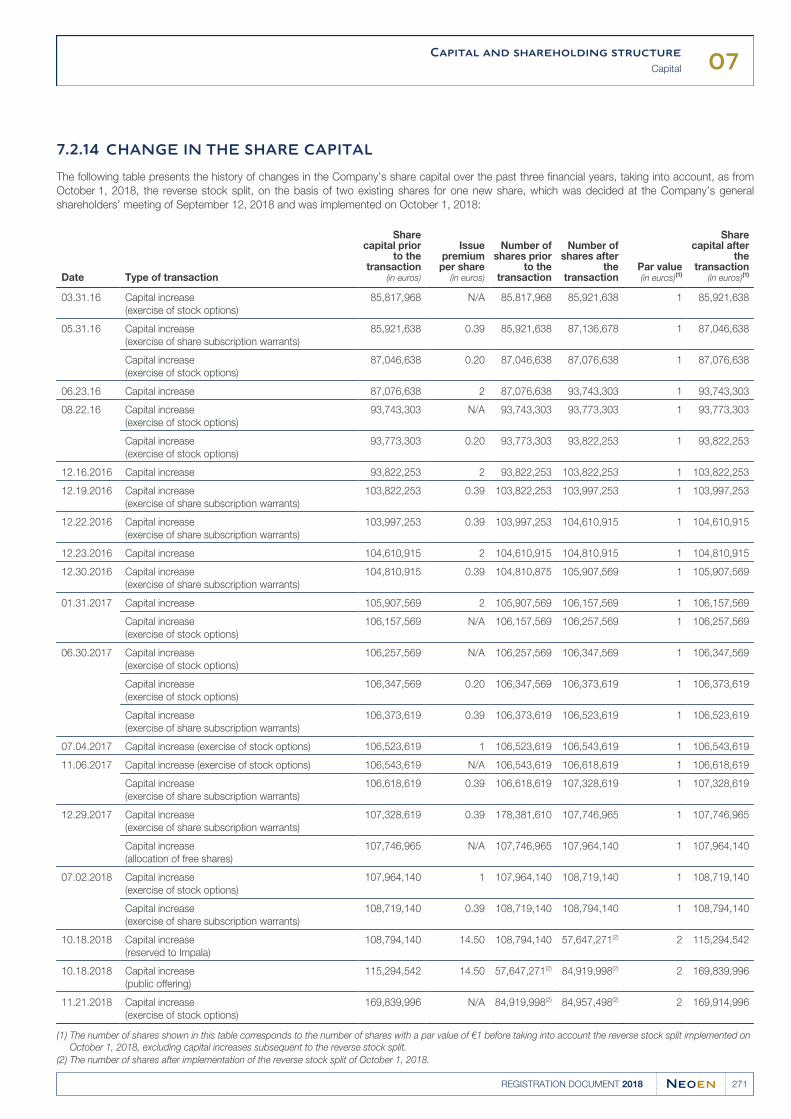
07Capital and shareholding structure
Capital
271REGISTRATION DOCUMENT 2018
CHANGE IN THE SHARE CAPITAL7.2.14
The following table presents the history of changes in the Company’s share capital over the past three financial years, taking into account, as from
October 1, 2018, the reverse stock split, on the basis of two existing shares for one new share, which was decided at the Company’s general
shareholders’ meeting of September 12, 2018 and was implemented on October 1, 2018:
Date Type of transaction
Sharecapital prior
to thetransaction
(in euros)
Issuepremium
per share(in euros)
Number ofshares prior
to thetransaction
Number ofshares after
thetransaction
Par value(in euros)(1)
Sharecapital after
thetransaction
(in euros)(1)
03.31.16 Capital increase
(exercise of stock options)
85,817,968 N/A 85,817,968 85,921,638 1 85,921,638
05.31.16 Capital increase
(exercise of share subscription warrants)
85,921,638 0.39 85,921,638 87,136,678 1 87,046,638
Capital increase
(exercise of stock options)
87,046,638 0.20 87,046,638 87,076,638 1 87,076,638
06.23.16 Capital increase 87,076,638 2 87,076,638 93,743,303 1 93,743,303
08.22.16 Capital increase
(exercise of stock options)
93,743,303 N/A 93,743,303 93,773,303 1 93,773,303
Capital increase
(exercise of stock options)
93,773,303 0.20 93,773,303 93,822,253 1 93,822,253
12.16.2016 Capital increase 93,822,253 2 93,822,253 103,822,253 1 103,822,253
12.19.2016 Capital increase
(exercise of share subscription warrants)
103,822,253 0.39 103,822,253 103,997,253 1 103,997,253
12.22.2016 Capital increase
(exercise of share subscription warrants)
103,997,253 0.39 103,997,253 104,610,915 1 104,610,915
12.23.2016 Capital increase 104,610,915 2 104,610,915 104,810,915 1 104,810,915
12.30.2016 Capital increase
(exercise of share subscription warrants)
104,810,915 0.39 104,810,875 105,907,569 1 105,907,569
01.31.2017 Capital increase 105,907,569 2 105,907,569 106,157,569 1 106,157,569
Capital increase
(exercise of stock options)
106,157,569 N/A 106,157,569 106,257,569 1 106,257,569
06.30.2017 Capital increase
(exercise of stock options)
106,257,569 N/A 106,257,569 106,347,569 1 106,347,569
Capital increase
(exercise of stock options)
106,347,569 0.20 106,347,569 106,373,619 1 106,373,619
Capital increase
(exercise of share subscription warrants)
106,373,619 0.39 106,373,619 106,523,619 1 106,523,619
07.04.2017 Capital increase (exercise of stock options) 106,523,619 1 106,523,619 106,543,619 1 106,543,619
11.06.2017 Capital increase (exercise of stock options) 106,543,619 N/A 106,543,619 106,618,619 1 106,618,619
Capital increase
(exercise of share subscription warrants)
106,618,619 0.39 106,618,619 107,328,619 1 107,328,619
12.29.2017 Capital increase
(exercise of share subscription warrants)
107,328,619 0.39 178,381,610 107,746,965 1 107,746,965
Capital increase
(allocation of free shares)
107,746,965 N/A 107,746,965 107,964,140 1 107,964,140
07.02.2018 Capital increase
(exercise of stock options)
107,964,140 1 107,964,140 108,719,140 1 108,719,140
Capital increase
(exercise of share subscription warrants)
108,719,140 0.39 108,719,140 108,794,140 1 108,794,140
10.18.2018 Capital increase
(reserved to Impala)
108,794,140 14.50 108,794,140 57,647,271(2) 2 115,294,542
10.18.2018 Capital increase
(public offering)
115,294,542 14.50 57,647,271(2) 84,919,998(2) 2 169,839,996
11.21.2018 Capital increase
(exercise of stock options)
169,839,996 N/A 84,919,998(2) 84,957,498(2) 2 169,914,996
The number of shares shown in this table corresponds to the number of shares with a par value of €1 before taking into account the reverse stock split implemented on (1)
October 1, 2018, excluding capital increases subsequent to the reverse stock split.
The number of shares after implementation of the reverse stock split of October 1, 2018.(2)
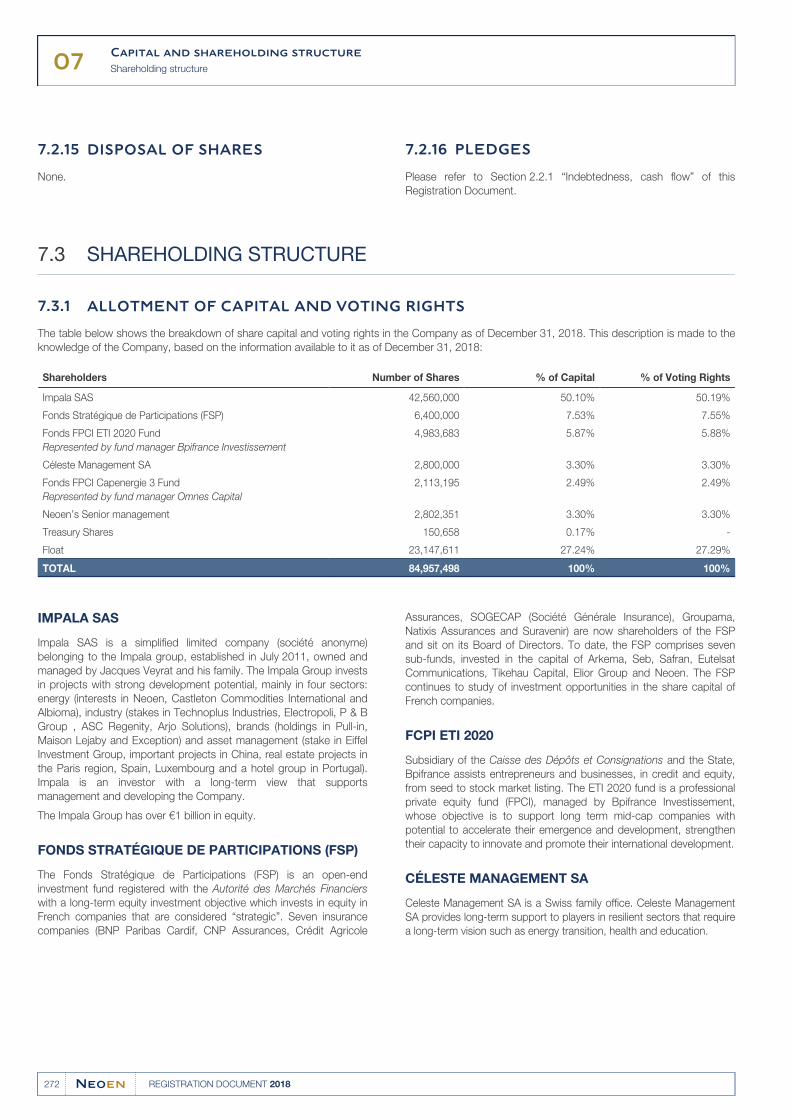
07Capital and shareholding structure
Shareholding structure
272 REGISTRATION DOCUMENT 2018
DISPOSAL OF SHARES7.2.15
None.
PLEDGES7.2.16
Please refer to Section 2.2.1 “Indebtedness, cash flow” of this
Registration Document.
SHAREHOLDING STRUCTURE7.3
ALLOTMENT OF CAPITAL AND VOTING RIGHTS7.3.1
The table below shows the breakdown of share capital and voting rights in the Company as of December 31, 2018. This description is made to the
knowledge of the Company, based on the information available to it as of December 31, 2018:
Shareholders Number of Shares % of Capital % of Voting Rights
Impala SAS 42,560,000 50.10% 50.19%
Fonds Stratégique de Participations (FSP) 6,400,000 7.53% 7.55%
Fonds FPCI ETI 2020 Fund
Represented by fund manager Bpifrance Investissement
4,983,683 5.87% 5.88%
Céleste Management SA 2,800,000 3.30% 3.30%
Fonds FPCI Capenergie 3 Fund
Represented by fund manager Omnes Capital
2,113,195 2.49% 2.49%
Neoen’s Senior management 2,802,351 3.30% 3.30%
Treasury Shares 150,658 0.17% -
Float 23,147,611 27.24% 27.29%
TOTAL 84,957,498 100% 100%
IMPALA SAS
Impala SAS is a simplified limited company (société anonyme)
belonging to the Impala group, established in July 2011, owned and
managed by Jacques Veyrat and his family. The Impala Group invests
in projects with strong development potential, mainly in four sectors:
energy (interests in Neoen, Castleton Commodities International and
Albioma), industry (stakes in Technoplus Industries, Electropoli, P & B
Group , ASC Regenity, Arjo Solutions), brands (holdings in Pull-in,
Maison Lejaby and Exception) and asset management (stake in Eiffel
Investment Group, important projects in China, real estate projects in
the Paris region, Spain, Luxembourg and a hotel group in Portugal).
Impala is an investor with a long-term view that supports
management and developing the Company.
The Impala Group has over €1 billion in equity.
FONDS STRATÉGIQUE DE PARTICIPATIONS (FSP)
Assurances, SOGECAP (Société Générale Insurance), Groupama,
Natixis Assurances and Suravenir) are now shareholders of the FSP
and sit on its Board of Directors. To date, the FSP comprises seven
sub-funds, invested in the capital of Arkema, Seb, Safran, Eutelsat
Communications, Tikehau Capital, Elior Group and Neoen. The FSP
continues to study of investment opportunities in the share capital of
French companies.
The Fonds Stratégique de Participations (FSP) is an open-end
investment fund registered with the Autorité des Marchés Financiers
with a long-term equity investment objective which invests in equity in
French companies that are considered “strategic”. Seven insurance
companies (BNP Paribas Cardif, CNP Assurances, Crédit Agricole
FCPI ETI 2020
Subsidiary of the Caisse des Dépôts et Consignations and the State,
Bpifrance assists entrepreneurs and businesses, in credit and equity,
from seed to stock market listing. The ETI 2020 fund is a professional
private equity fund (FPCI), managed by Bpifrance Investissement,
whose objective is to support long term mid-cap companies with
potential to accelerate their emergence and development, strengthen
their capacity to innovate and promote their international development.
CÉLESTE MANAGEMENT SA
Celeste Management SA is a Swiss family office. Celeste Management
SA provides long-term support to players in resilient sectors that require
a long-term vision such as energy transition, health and education.
07Capital and shareholding structure
Shareholding structure
273REGISTRATION DOCUMENT 2018
FPCI CAPENERGIE 3
Capenergie 3 is a professional private equity fund (FPCI) that
specialises in the field of renewable energies. Its management
company, Omnes Capital, is a major player in private equity and
infrastructure investment, particularly in the field of renewable energies
with €3.6 billion under management in this sector and 1.5 GW in
operation. Formerly a subsidiary of Crédit Agricole SA until
March 2012, Omnes Capital is now owned by its employees.
To the best of the Company’s knowledge, no other shareholder
owns, directly or indirectly, alone or in concert, more than 5% of the
Company’s share capital and/or voting rights.
None of the companies controlled by the Company hold treasury
shares of the Company.
COMMITMENTS MADE BY THE SHAREHOLDERS TO RETAIN THE SECURITIES 7.3.2
IN CONNECTION WITH THE INITIAL PUBLIC OFFERING
In application of the guarantee contract signed on October 2, 2018
between Neoen, the guarantor banks in the initial public offering, and some
of its shareholders, a commitment was made to retain the securities:
for a period expiring 180 days after the settlement date of the offer●(which took place on October 18, 2018) by:
FPCI Capenergie II (represented by Omnes Capital),●
FPCI Fonds ETI 2020 (represented by Bpifrance Investissement),●
Impala,●
FPCI Capenergie 3 (represented by Omnes Capital),●
Le Fonds Stratégique de Participation (FSP),●
Celeste Management S.A.;●
for a period expiring 365 days after the settlement date of the offer●(which took place on October 18, 2018) by certain executives.
OBLIGATION TO RETAIN THE COMPANY’S SHARES7.3.3
Pursuant to the internal regulations of the Board of Directors (Article 3.10),
each member of the Board of Directors must own (directly or indirectly) at
least 500 (five hundred) shares throughout his/her term of office and, in any
case, at the latest within six months after his/her appointment.
Furthermore, in accordance with the AFEP-MEDEF Corporate Governance
Code to which the Company refers, an obligation to retain shares,
registered and up to the end of their terms of office, was laid down at
5,000 (five thousand) shares by the Board of Directors for the executive
officers.
EXCEEDING LEGAL AND/OR STATUTORY THRESHOLDS7.3.4
(See Article 10 of the bylaws)
In addition to the thresholds provided for by applicable laws and
regulations, any natural person or legal entity, acting alone or in
concert, who comes to hold or ceases to hold, directly or indirectly, a
fraction equal to or greater than one percent (1%) of the Company’s
share capital or voting rights or any multiple of such percentage,
including beyond the reporting thresholds provided for by laws and
regulations and up to 50% of the share capital or voting rights, must
inform the Company of the total number of shares and voting rights
that it possesses as well as of securities giving access to the share
capital and voting rights that are potentially attached thereto, by
registered letter with return receipt requested sent to the Company’s
senior management at the registered office no later than the close of
the fourth trading day following the day on which the threshold is
crossed.
The thresholds referred to above shall be determined also taking into
account indirectly held shares or voting rights and shares or voting
rights having the same rights as the shares or voting rights held, as
defined in Articles L. 233-7 et seq. of the French Commercial Code.
In the event of non-compliance with the above provisions, the
sanctions provided for by law for the failure to comply with the
obligation to report the crossing of legal thresholds shall apply to the
thresholds set forth in the bylaws only upon the request (recorded in
the minutes of the general shareholders’ meeting) of one or more
shareholders holding at least five percent (5%) of the Company’s
share capital or voting rights.
The Company reserves the right to inform the public and the
shareholders either of the information that shall have been provided to
it or of the non-compliance by any person with the obligation set forth
above.
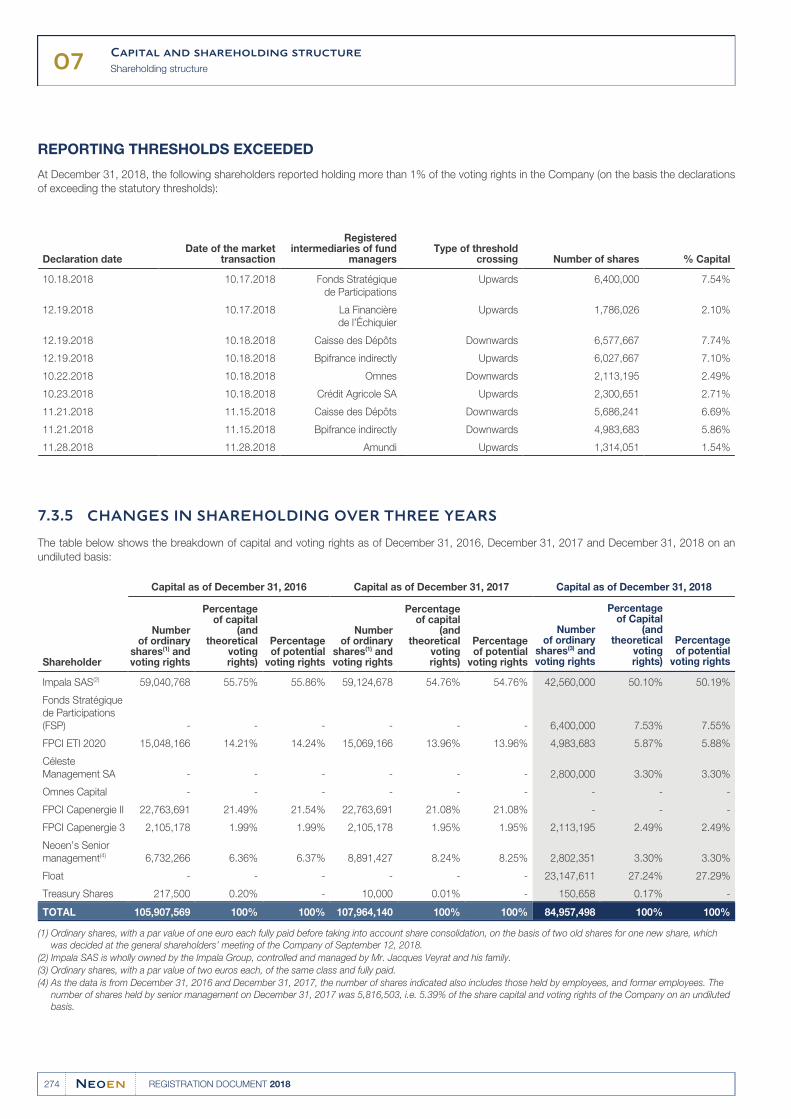
07Capital and shareholding structure
Shareholding structure
274 REGISTRATION DOCUMENT 2018
REPORTING THRESHOLDS EXCEEDED
At December 31, 2018, the following shareholders reported holding more than 1% of the voting rights in the Company (on the basis the declarations
of exceeding the statutory thresholds):
Declaration dateDate of the market
transaction
Registeredintermediaries of fund
managersType of threshold
crossing Number of shares % Capital
10.18.2018 10.17.2018 Fonds Stratégique
de Participations
Upwards 6,400,000 7.54%
12.19.2018 10.17.2018 La Financière
de l’Échiquier
Upwards 1,786,026 2.10%
12.19.2018 10.18.2018 Caisse des Dépôts Downwards 6,577,667 7.74%
12.19.2018 10.18.2018 Bpifrance indirectly Upwards 6,027,667 7.10%
10.22.2018 10.18.2018 Omnes Downwards 2,113,195 2.49%
10.23.2018 10.18.2018 Crédit Agricole SA Upwards 2,300,651 2.71%
11.21.2018 11.15.2018 Caisse des Dépôts Downwards 5,686,241 6.69%
11.21.2018 11.15.2018 Bpifrance indirectly Downwards 4,983,683 5.86%
11.28.2018 11.28.2018 Amundi Upwards 1,314,051 1.54%
CHANGES IN SHAREHOLDING OVER THREE YEARS7.3.5
The table below shows the breakdown of capital and voting rights as of December 31, 2016, December 31, 2017 and December 31, 2018 on an
undiluted basis:
Shareholder
Capital as of December 31, 2016 Capital as of December 31, 2017 Capital as of December 31, 2018
Numberof ordinary
shares(1) andvoting rights
Percentageof capital
(andtheoretical
votingrights)
Percentageof potential
voting rights
Numberof ordinary
shares(1) andvoting rights
Percentageof capital
(andtheoretical
votingrights)
Percentageof potential
voting rights
Numberof ordinary
shares(3) andvoting rights
Percentageof Capital
(andtheoretical
votingrights)
Percentageof potential
voting rights
Impala SAS(2) 59,040,768 55.75% 55.86% 59,124,678 54.76% 54.76% 42,560,000 50.10% 50.19%
Fonds Stratégique
de Participations
(FSP) - - - - - - 6,400,000 7.53% 7.55%
FPCI ETI 2020 15,048,166 14.21% 14.24% 15,069,166 13.96% 13.96% 4,983,683 5.87% 5.88%
Céleste
Management SA - - - - - - 2,800,000 3.30% 3.30%
Omnes Capital - - - - - - - - -
FPCI Capenergie II 22,763,691 21.49% 21.54% 22,763,691 21.08% 21.08% - - -
FPCI Capenergie 3 2,105,178 1.99% 1.99% 2,105,178 1.95% 1.95% 2,113,195 2.49% 2.49%
Neoen’s Senior
management(4) 6,732,266 6.36% 6.37% 8,891,427 8.24% 8.25% 2,802,351 3.30% 3.30%
Float - - - - - - 23,147,611 27.24% 27.29%
Treasury Shares 217,500 0.20% - 10,000 0.01% - 150,658 0.17% -
TOTAL 105,907,569 100% 100% 107,964,140 100% 100% 84,957,498 100% 100%
Ordinary shares, with a par value of one euro each fully paid before taking into account share consolidation, on the basis of two old shares for one new share, which (1)
was decided at the general shareholders’ meeting of the Company of September 12, 2018.
Impala SAS is wholly owned by the Impala Group, controlled and managed by Mr. Jacques Veyrat and his family.(2)
Ordinary shares, with a par value of two euros each, of the same class and fully paid.(3)
As the data is from December 31, 2016 and December 31, 2017, the number of shares indicated also includes those held by employees, and former employees. The (4)
number of shares held by senior management on December 31, 2017 was 5,816,503, i.e. 5.39% of the share capital and voting rights of the Company on an undiluted
basis.
07Capital and shareholding structure
Shareholding structure
275REGISTRATION DOCUMENT 2018
CONTROL STRUCTURE7.3.6
At December 31, 2018, the Company is indirectly controlled by
Mr. Jacques Veyrat and his family, who hold the majority of the capital
and voting rights through Impala SAS.
As a result, Impala SAS is the reference shareholder of the Company.
In this context, the Company has taken all necessary measures to
ensure that control is not improperly exercised:
out of the seven members of the Board of Directors, three directors●(more than one third) are independent members, in accordance
with the recommendations of the AFEP-MEDEF Code applicable to
controlled companies;
three directors (less than half) are representatives of Impala; and●
one director is a representative of Bpifrance Investissement.●
AGREEMENTS THAT MAY LEAD TO A CHANGE OF CONTROL7.3.7
To the best of the Company’s knowledge, at the date of this Registration Document, there are no agreements whose implementation could, at a
later date, result in a change of control.
DIVIDENDS7.3.8
DIVIDEND DISTRIBUTION POLICY7.3.8.1
In accordance with the law and the bylaws of the Company, the
general shareholders’ meeting may decide, on the recommendation
of the Board of Directors, the distribution of dividends.
The Company’s dividend distribution policy takes into account, in
particular, the Company’s results, its financial position, the
implementation of its objectives and its liquidity requirements.
expects to be able to pay a dividend for the first time in respect of the
2021 financial year, which would be payable in 2022. The size of any
such dividend would depend on market opportunities and the
Group’s assessment of the best way to achieve total returns for
shareholders based on then-prevailing market conditions. Future
dividends depend, in particular, on the business’ general terms and
conditions and any factors deemed relevant by the Board ofGiven its medium-term objectives mentioned in Section 2.3 Directors.“Information on trends and objectives” of this document, the Group
DIVIDENDS DISTRIBUTED OVER THE PAST THREE YEARS7.3.8.2
The Group did not distribute dividends for the years ended December 31, 2015, 2016 and 2017.
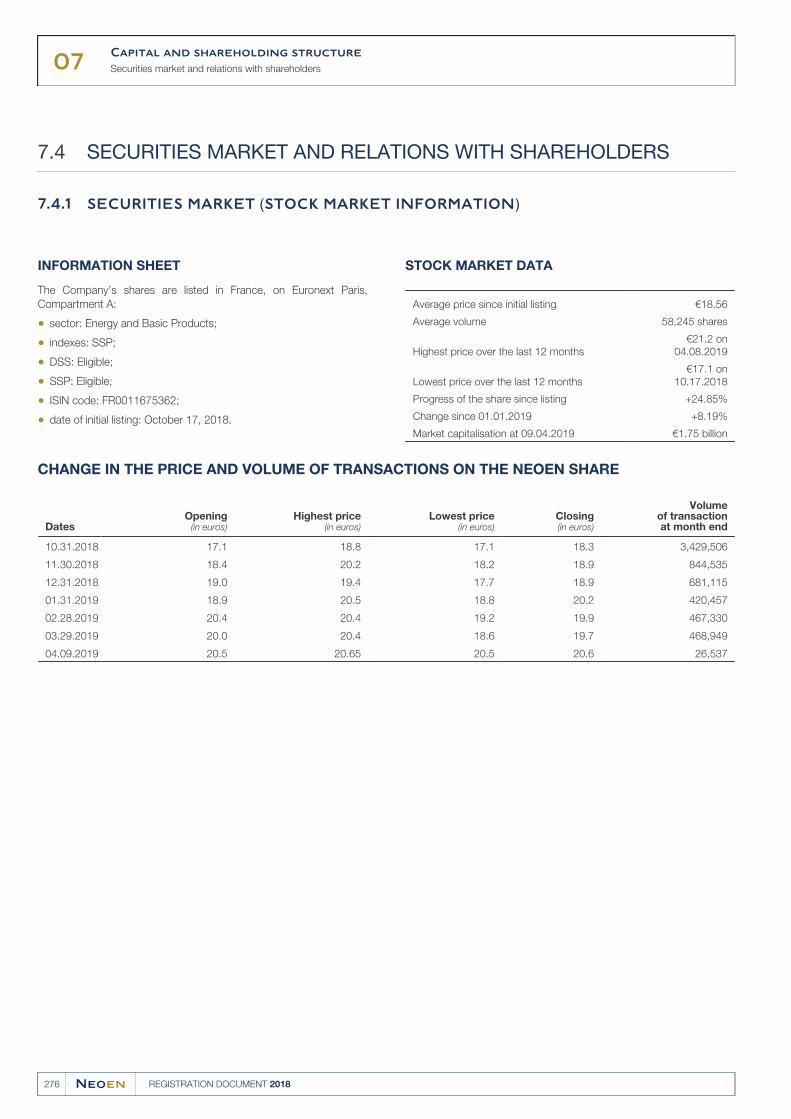
07Capital and shareholding structure
Securities market and relations with shareholders
276 REGISTRATION DOCUMENT 2018
SECURITIES MARKET AND RELATIONS WITH SHAREHOLDERS7.4
SECURITIES MARKET (STOCK MARKET INFORMATION)7.4.1
INFORMATION SHEET
The Company’s shares are listed in France, on Euronext Paris,
Compartment A:
sector: Energy and Basic Products;●
indexes: SSP;●
DSS: Eligible;●
SSP: Eligible;●
ISIN code: FR0011675362;●
date of initial listing: October 17, 2018.●
STOCK MARKET DATA
Average price since initial listing €18.56
Average volume 58,245 shares
Highest price over the last 12 months
€21.2 on
04.08.2019
Lowest price over the last 12 months
€17.1 on
10.17.2018
Progress of the share since listing +24.85%
Change since 01.01.2019 +8.19%
Market capitalisation at 09.04.2019 €1.75 billion
CHANGE IN THE PRICE AND VOLUME OF TRANSACTIONS ON THE NEOEN SHARE
DatesOpening
(in euros)Highest price
(in euros)Lowest price
(in euros)Closing(in euros)
Volumeof transactionat month end
10.31.2018 17.1 18.8 17.1 18.3 3,429,506
11.30.2018 18.4 20.2 18.2 18.9 844,535
12.31.2018 19.0 19.4 17.7 18.9 681,115
01.31.2019 18.9 20.5 18.8 20.2 420,457
02.28.2019 20.4 20.4 19.2 19.9 467,330
03.29.2019 20.0 20.4 18.6 19.7 468,949
04.09.2019 20.5 20.65 20.5 20.6 26,537
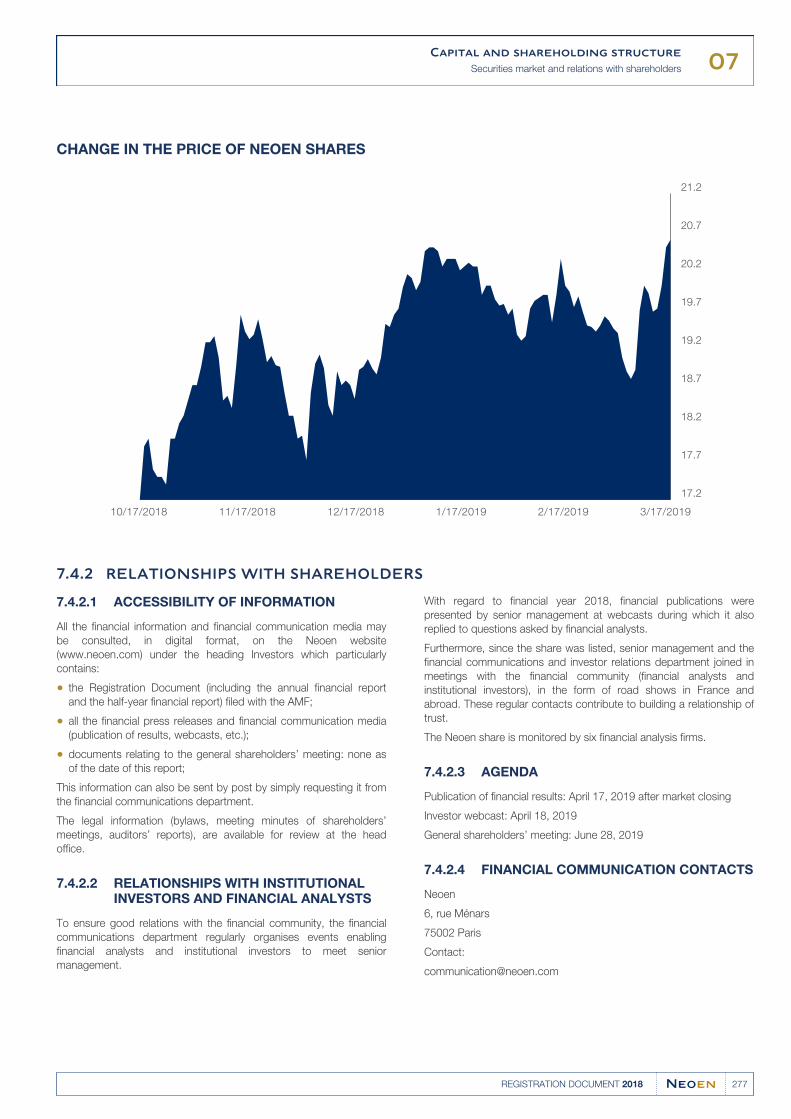
07Capital and shareholding structure
Securities market and relations with shareholders
277REGISTRATION DOCUMENT 2018
CHANGE IN THE PRICE OF NEOEN SHARES
17.2
17.7
18.2
18.7
19.2
19.7
20.2
20.7
21.2
10/17/2018 11/17/2018 12/17/2018 1/17/2019 2/17/2019 3/17/2019
RELATIONSHIPS WITH SHAREHOLDERS7.4.2
ACCESSIBILITY OF INFORMATION7.4.2.1
All the financial information and financial communication media may
be consulted, in digital format, on the Neoen website
(www.neoen.com) under the heading Investors which particularly
contains:
the Registration Document (including the annual financial report●and the half-year financial report) filed with the AMF;
all the financial press releases and financial communication media●(publication of results, webcasts, etc.);
documents relating to the general shareholders’ meeting: none as●of the date of this report;
This information can also be sent by post by simply requesting it from
the financial communications department.
The legal information (bylaws, meeting minutes of shareholders’
meetings, auditors’ reports), are available for review at the head
office.
RELATIONSHIPS WITH INSTITUTIONAL 7.4.2.2INVESTORS AND FINANCIAL ANALYSTS
To ensure good relations with the financial community, the financial
communications department regularly organises events enabling
financial analysts and institutional investors to meet senior
management.
With regard to financial year 2018, financial publications were
presented by senior management at webcasts during which it also
replied to questions asked by financial analysts.
Furthermore, since the share was listed, senior management and the
financial communications and investor relations department joined in
meetings with the financial community (financial analysts and
institutional investors), in the form of road shows in France and
abroad. These regular contacts contribute to building a relationship of
trust.
The Neoen share is monitored by six financial analysis firms.
AGENDA7.4.2.3
Publication of financial results: April 17, 2019 after market closing
Investor webcast: April 18, 2019
General shareholders’ meeting: June 28, 2019
FINANCIAL COMMUNICATION CONTACTS7.4.2.4
Neoen
6, rue Ménars
75002 Paris
Contact:
278 REGISTRATION DOCUMENT 2018
08
279REGISTRATION DOCUMENT 2018
GENERAL SHAREHOLDERS’ MEETING
DRAFT RESOLUTIONS8.1 280
Resolutions within the remit 8.1.1
of the Ordinary general
shareholders’ meeting 280
Resolution within the remit 8.1.2
of the extraordinary general
shareholders’ meeting 282
Resolution within the remit 8.1.3
of the ordinary general
shareholders’ meeting 287
BOARD OF DIRECTORS’ REPORT 8.2
ON THE DRAFT RESOLUTIONS 288
Resolutions within the remit 8.2.1
of the ordinary general
shareholders’ meeting 288
Resolutions within the remit 8.2.2
of extraordinary general
shareholders’ meetings 290
STATUTORY AUDITORS’ 8.3
REPORTS ON SECURITIES
TRADING 294
Statutory auditors’ report 8.3.1
on the planned amendments
to delegation limits for issues
of shares and marketable securities
with cancellation of preferential
subscription rights (11th resolution) 294
Statutory auditors’ report 8.3.2
on the planned amendments
to delegation limits for issues
of shares and marketable securities
with retention of preferential
subscription rights (12th resolution 296
Statutory auditors’ report 8.3.3
on the issue of shares
and/or marketable securities
with cancellation of preferential
subscription rights, reserved
for members of company savings
plans (13th resolution) 297
Statutory auditors’ report 8.3.4
on the issue of shares
and/or marketable securities
with cancellation of preferential
subscription rights (14th resolution) 298
Statutory auditors’ report 8.3.5
on the share capital decrease
(15th resolution ) 299
STATUTORY AUDITORS’ SPECIAL 8.4
REPORT ON REGULATED
AGREEMENTS
AND COMMITMENTS 300
08General shareholders’ meeting
Draft resolutions
280 REGISTRATION DOCUMENT 2018
DRAFT RESOLUTIONS8.1
RESOLUTIONS WITHIN THE REMIT OF THE ORDINARY GENERAL 8.1.1
SHAREHOLDERS’ MEETING
First resolution (Approval of the 2018 financial statements)
The general shareholders’ meeting, after reviewing the Board of
Directors’ and Auditors’ reports approves the 2018 financial statements,
as presented, comprising the balance sheet, the income statement and
the notes, which show a profit of €9,376,196, as well as the
transactions reflected in these financial statements and summarised in
these reports.
Second resolution (Approval of the 2018 consolidated financial statements)
The general shareholders’ meeting, after reviewing the Board of
Directors’ and Auditors’ reports approves the 2018 consolidated
financial statements, as presented, comprising the balance sheet, the
income statement and the notes, as well as the transactions reflected
in these financial statements and summarised in these reports.
Third resolution (Allocation of net income)
The general shareholders’ meeting, ruling under the quorum and
majority conditions required for ordinary shareholders’ meetings, and
after having established that the corporate financial statements for the
year ended December 31, 2018, and approved by this meeting, show
a profit of €9,376,196:
in accordance with applicable legal requirements, decides to●allocate €468,810 of this profit to the legal reserve;
notes that the balance of the remaining 2018 profit amounts to●€8,907,386;
decides to allocate the distributable profit of €8,907,386 to “Other
reserves”, which will stand at €8,907,386, post allocation.
In accordance with legal requirements, the general shareholders’
meeting notes that no dividends have been distributed for the three
financial years prior to 2018.
Fourth resolution (Setting the overall remuneration package for Board members)
The general shareholders’ meeting, ruling under the quorum and majority
conditions required for ordinary general shareholders’ meetings, after
reviewing the Board of Directors’ report, decides to set the overall
remuneration package for members of the Board of Directors at
€207,500 per year for current and subsequent periods, unless the
annual amount is amended by a new general shareholders’ meeting.
The Board of Directors may allocate this amount freely between its
members.
Fifth resolution (Ratification of the cooptation of Fonds Stratégique de Participations as a director)
The general shareholders’ meeting, ruling under the quorum and
majority conditions required for ordinary general shareholders’
meetings, and after reviewing the Board of Directors’ report, ratifies
the cooptation, decides on by the Board of Directors’ on
November 21, 2018, of Fonds Stratégique de Participations as a
director, to replace Christophe Gégout, who has resigned, for the
remainder of the latter’s term of office, i.e. until after the general
shareholders’ meeting to approve the financial statements for the
financial year ending on December 31, 2019.
Sixth resolution (Renewal of Stéphanie Levan's directorship)
The general shareholders’ meeting, ruling under the quorum and
majority conditions required for ordinary general shareholders’
meetings, and after reviewing the Board of Directors’ report, renews
Stéphanie Levan’s directorship, which is due to end after this
shareholders’ meeting, for a four-year period ending after the general
shareholders’ meeting to approve the financial statements for the
financial year ending on December 31, 2022.
Seventh resolution (Approval of agreements and commitments subject to the provisions of Articles L. 225-38 et seq. of the French Commercial Code)
The general shareholders’ meeting, ruling under the quorum and
majority conditions required for ordinary shareholders’ meetings, and
after reviewing the Auditor’ report on agreements and commitments
subject to the provisions of Articles L. 225-38 and L. 225-40 to
L. 225-42 of the French Commercial Code, approves all the
provisions of this report, as well as the new agreements it refers to,
approved by the Board of Directors during the financial year ended 31
December 2018.
Eighth resolution (Approval of the fixed, variable and exceptional items comprising the total remuneration and benefits of any kind paid or awarded to Xavier Barbaro, Chairman and CEO, for the financial year 2018, for the period starting from the listing of the Company’s shares for trading on the Euronext Paris regulated market)
The general shareholders’ meeting, ruling under the conditions of
quorum and majority required for ordinary general shareholders’
meetings, and after reviewing the report of the Board of Directors on
corporate governance, approves, in accordance with
Article L. 225-100, II of the French Commercial Code, the fixed,
variable and exceptional items comprising the total remuneration and
other benefits paid or awarded to Xavier Barbaro, Chairman and
CEO, for financial year 2018, for the period starting from the listing of
the Company’s shares for trading on the Euronext Paris regulated
market, as presented in this report.
08General shareholders’ meeting
Draft resolutions
281REGISTRATION DOCUMENT 2018
Ninth resolution (Approval of the principles and the criteria for determining and distributing the fixed, variable and exceptional items comprising the total remuneration and benefits of any kind that can be granted to the Chairman and CEO for exercising his term for the financial year 2019)
The general shareholders’ meeting, ruling under the conditions of
quorum and majority required for ordinary shareholders’ meetings,
having reviewed the report by the Board of Directors on corporate
governance, in accordance with Article L. 225-37-2 of the French
Commercial Code, approves the principles and the criteria for
determining and distributing the fixed, variable and exceptional items
comprising the total remuneration and benefits of any kind that can
be granted to the Chairman and CEO for exercising his term for the
financial year 2019 as presented in this report.
Tenth resolution (Authorisation to be given to the Board of Directors to trade on the Company's shares)
The general shareholders’ meeting, ruling under the quorum and
majority conditions required for ordinary general shareholders’
meetings, after reviewing the Board of Directors’ report, authorises
the Board of Directors, with the right to subdelegate in accordance
with applicable law, pursuant to the provisions of Articles L. 225-209
et seq. of the French Commercial Code, to purchase Company
shares, or to have them purchased by third parties, with a view to:
implementing any Company share purchase option plan under the●provisions of Articles L. 225-177 et seq. of the French Commercial
Code or any similar plan; or
allocating or selling shares to employees to enable them to share in●the fruits of the Company’s expansion or the introduction of any
company or group savings scheme (or similar plan) under the
conditions provided for by law, in particular, Articles L. 3332-1 et
seq. of the French Labour Code; or
allocating free shares under the provisions of Articles L. 225-197-1●et seq. of the French Commercial Code; or
generally speaking, honouring stock option plans or other share●allocation to Company employees or corporate officers or those of
an associated company; or
delivering shares when rights attached to transferable securities●giving access to the share capital by redemption, conversion,
exchange or the presentation of warrants, or by any other means,
are exercised; or
cancelling all, or some, of the securities bought back in this way,●subject to the adoption of the 15th resolution of this general
shareholders’ meeting or any other resolution of the same kind; or
delivering shares (in exchange, as payment or otherwise) in●connection with acquisitions, mergers, spin-offs or contributions; or
stabilising the secondary market or the liquidity of Company shares●by an investment service provider under a liquidity contract
complying with market practices approved by the French Financial
Markets Authority (Autorité des Marchés Financiers – AMF),
amended where applicable.
This programme is also intended to enable any market practice that
may be approved by the French Financial Markets Authority to be
implemented and, more generally speaking, any other transaction that
complies with current regulations. Under such circumstances, the
Company will inform its shareholders by means of a press release.
The Company will be able to purchase a number of shares such that,
on the date of each buyback, the total number of shares purchased by
the Company since the start of the buyback programme (including
those that are the subject of said buyback) is no more than 10% of the
shares comprising the Company’s share capital on that date
(taking into consideration transactions affecting the share capital after
the date of this general shareholders’ meeting). It is specified that (i) the
number of shares acquired with a view to retention and subsequent
delivery as part of a merger, spin-off or contribution, may not be more
than 5% of its share capital and (ii) where shares are bought back to
boost liquidity under the conditions defined by the French Financial
Markets Authority’s general regulation, the number of shares taken into
consideration when calculating the 10% cap provided for above,
corresponds to the number of shares purchased, less the number of
shares resold during the authorisation period.
Shares may be acquired, sold or transferred at any time, except during
a public offer, within the limits set by current legislation and regulations,
and by any means, particularly on regulated markets, multilateral
trading facilities, via systematic internalisers or over-the-counter
transactions, including via block trades, public purchase or exchange
offers, or the use of options or other futures traded on regulated
markets, multilateral trading systems, via systemic internalisers or
over-the-counter or by the delivery of shares following the issue of
transferable securities giving access to the Company’s share capital by
conversion, exchange, redemption or the exercise of warrants, either
directly or indirectly via an investment services provider, or by any other
means (with no limit on the percentage of the buyback programme that
can be carried out using any one of these methods).
The maximum share purchase price under this resolution will be €35
per share (or the equivalent of this amount, on the same date, in any
other currency). This maximum price only applies to acquisitions
decides after the date of this shareholders’ meeting and not to future
transactions concluded under an authorisation granted by a previous
general shareholders’ meeting and providing for share acquisitions
after the date of this shareholders’ meeting.
The general shareholders’ meeting authorises the Board of Directors,
in the event of a change in the share’s par value, an increase in the
share capital through the incorporation of reserves, free share grants,
stock splits or reverse stock splits, a distribution of reserves or any
other assets, the redemption of capital, or any other transaction
affecting the share capital or equity, to adjust the aforementioned
maximum purchase price to take into account the impact of these
operations on the share value.
The maximum funds designated for use by the buyback programme
is set at €50 million.
The general shareholders’ meeting gives the Board of Directors full
authority, with the right to subdelegate in accordance with applicable
law, to decide on and implement this authorisation and, if necessary,
to specify the terms and conditions thereof, to carry out the buyback
programme and, in particular, to place any trading orders, conclude
any agreements, allocate or reallocate the shares acquired to the
objectives set, in accordance with applicable legal and regulatory
requirements, to set the terms under which the rights of holders of
transferable securities giving access to the share capital or other
rights giving access to the share capital, will be protected,
if necessary, in accordance with legal and regulatory provisions and,
where applicable, with contractual provisions providing for other
adjustments, to make any declarations to the French Financial
08General shareholders’ meeting
Draft resolutions
282 REGISTRATION DOCUMENT 2018
Markets Authority and any other competent authority and to complete
any other formalities and, generally speaking, to do all that is
necessary.
This authorisation is given for a period of eighteen months from the
date of this general shareholders’ meeting.
RESOLUTION WITHIN THE REMIT OF THE EXTRAORDINARY GENERAL 8.1.2
SHAREHOLDERS’ MEETING
Eleventh resolution (Increase in the nominal ceiling on capital increases that may be carried out and setting of a nominal ceiling on debt securities that may be issued, under the 6th and 7th resolutions of the combined general shareholders’ meeting of October 2, 2018, authorising the Board of Directors to issue shares and/or transferable securities giving immediate or future access, respectively, to the share capital, without preferential subscription rights by public offering and without preferential subscription rights by the private placement referred to in Article L. 411-2 II of the French Monetary and Financial Code, valid until December 1, 2020)
The general shareholders’ meeting, ruling under the quorum and
majority conditions required for extraordinary general shareholders’
meetings, after reviewing the Board of Directors’ report and the
Auditors’ special report, and in accordance with the provisions of
Articles L. 225-129 et seq. and L. 228-91 et seq. of the French
Commercial Code:
after having reminded that the combined general shareholders’1.meeting of October 2, 2018:
under its 6th resolution, authorised the Board of Directors to●increase the Company’s capital by issuing shares and/or
transferable securities giving immediate, or future, access to
the share capital, without preferential subscription rights, by
public offering, by up to a nominal amount of €60 million, valid
until December 1, 2020, and
under its 7th resolution, authorised the Board of Directors to●increase the Company’s capital by issuing shares and/or
transferable securities giving immediate, or future, access to
the share capital, without preferential subscription rights, by
the private placement referred to in Article L. 411-2 II of the
French Monetary and Financial Code, by up to a nominal
amount of €10 million. It is specified that this amount is
included in the ceiling provided for in the 6th resolution, valid
until December 1, 2020; and
(including an issue premium of €14.50 per share), i.e. a
nominal capital increase of €54,545,454.00, plus an overall
premium of €395,454,541.50;
after having reminded that the Board of Directors, meeting on2.October 16, 2018, in making use of the aforementioned 6th
resolution, within the context of the Company’s IPO, decides
to increase the share capital by €449,999,995.50 without
preferential subscription rights, by public offering, by issuing
27,272,727 new ordinary shares with a par value of
two (2) euro each, at an issue price of €16.50 per share
decides that the maximum nominal amount of the capital3.increases that may be completed under the 6th resolution of the
combined general shareholders’ meeting of October 2, 2018,
may not exceed a new nominal ceiling set at €80 million. It is
specified that, given the nominal amount of the capital increase
without preferential subscription rights by public offering carried
out on October 16, 2018 of €54,545,454.00, included in the
ceiling provided for in said 6th resolution, the total nominal
amount of the capital increases that may be completed following
said modification may not exceed €25,454,546. It is specified,
however, that (i) the aforementioned nominal amounts do not
take into account adjustments that may be made in accordance
with applicable legal and regulatory provisions, and where
applicable, contractual provisions providing for other
adjustments, to protect the rights of holders of transferable
securities or other rights giving access to share capital and that
(ii) the nominal amount of capital increases that may be
implemented under said 6th resolution will be included in the
€125 million overall ceiling, provided for by paragraph 2 of the 5th
resolution of the combined general shareholders’ meeting of
October 2, 2018. It is also specified that, where necessary,
capital increases completed under the 5th, 7th, 8th, 10th, 11th, 12th,
13th, 14th and 15th resolutions of the combined shareholders’
meeting of October 2, 2018, as well as under the 11th, 13th and
14th resolutions of this general shareholders’ meeting, will also
be included in the aforementioned €125 million overall ceiling;
decides that the maximum nominal amount of capital4.increases that may be carried out under the 7th resolution of
the combined shareholders’ meeting of October 2, 2018, may
not exceed a new nominal ceiling set at €25 million. It is
specified that (i) this maximum nominal amount does not take
into account any adjustments that may be made in
accordance with applicable legal and regulatory provisions,
and where applicable, contractual provisions providing for
other adjustments, to protect the rights of holders of
transferable securities or other rights giving access to share
capital and that (ii) this maximum nominal amount will be
included in the ceiling provided for in the 6th resolution of the
combined shareholders’ meeting of October 2, 2018, as
increased by this resolution, and in the overall ceiling provided
for by paragraph 2 of the 5th resolution of the combined
shareholders’ meeting of October 2, 2018, as reiterated under
this resolution;
08General shareholders’ meeting
Draft resolutions
283REGISTRATION DOCUMENT 2018
decides that the Board of Directors may not, without prior5.authorisation by the General Shareholders' Meeting, make use
of the 6th and 7th resolutions of the Combined General
Shareholders' Meeting of 2 October 2018, as amended by this
delegation, from the date of filing of a public offering for the
securities of the Company by a third party until the end of the
offering period;
decides to set limits on the amounts of debt securities issued in6.the event of issues of transferable securities in the form of debt
securities giving immediate, or future, access to the Company’s
share capital, under the 6th or 7th resolutions of the combined
shareholders’ meeting of October 2, 2018, as follows:
the nominal amount of debt securities that may be issued●immediately, or in the future, under each of the 6th and 7th
resolutions of the combined general shareholders’ meeting of
October 2, 2018, is set at €200 million, or the equivalent value
in any other currency or monetary unit established in reference
to a basket of currencies on the issue date,
where appropriate, this amount may be increased by any●above-par redemption premium,
this amount is not dependent on the amount of debt securities●that may be issued as a result of the use of other resolutions
brought before this meeting, as well as those of the combined
general shareholders’ meeting of October 2, 2018, and debt
securities whose issue may be decided upon, or authorised, by
the Board of Directors in accordance with Articles L. 228-36-A,
L. 228-40, L. 228-92 paragraph 3, L. 228-93 paragraph 6 and
L. 228-94 paragraph 3 of the French Commercial Code;
decides that the other provisions of the 6th and 7th resolutions7.remain unchanged and are still valid for the remaining term of
said resolutions, i.e. until December 1, 2020.
Twelfth resolution (Nominal ceiling on debt securities that may be issued under the 5th and 8th resolutions of the combined general shareholders’ meeting of October 2, 2018, authorising the Board of Directors to issue shares and/or transferable securities giving immediate or future access, respectively, to the share capital, with preferential subscription rights or in return for contributions in kind, constituted by equity securities or transferable securities giving access to the share capital, valid until December 1, 2020)
The general shareholders’ meeting, ruling under the quorum and
majority conditions required for Extraordinary general shareholders’
meetings, after reviewing the Board of Directors’ report [and the
Auditors’ special report], and in accordance with the provisions of
Articles L. 225-129 et seq. and L. 228-91 et seq. of the French
Commercial Code:
after having reminded that the combined general shareholders’1.meeting of October 2, 2018:
under its 5th resolution, delegated to the Board of Directors the●authority to decide on share capital increases of the Company
by issuing shares and/or transferable securities giving
immediate, or future, access to the share capital, with
preferential subscription rights,
under its 8th resolution, authorised the Board of Directors to●issue shares and/or transferable securities giving immediate, or
future, access to shares to be issued by the Company in return
for contributions in kind constituted by equity securities or
transferable securities giving access to share capital; and
after having also reminded that the combined general2.shareholders’ meeting of October 2, 2018 had not, under the
aforementioned resolutions, set the maximum nominal amount
of debt securities that may be issued immediately, or in the
future, under these resolutions;
decides to set limits on the amounts of debt securities issued3.in the event of issues of transferable securities in the form of
debt securities giving immediate, or future, access to the
Company’s share capital, under the 5th or 8th resolutions of the
combined shareholders’ meeting of October 2, 2018, as
follows:
the nominal amount of debt securities that may be issued●immediately, or in the future, under each of the 5th and 8th
resolutions of the combined general shareholders’ meeting of
October 2, 2018, was set at €200 million, or the equivalent
value in any other currency or monetary unit established in
reference to a basket of currencies on the issue date,
where appropriate, this amount will include any above-par●redemption premium,
this amount is not dependent on the amount of debt securities●that may be issued as a result of the use of other resolutions
brought before this meeting, as well as those of the combined
general shareholders’ meeting of October 2, 2018, and debt
securities whose issue may be decided upon, or authorised, by
the Board of Directors in accordance with Articles L. 228-36-A,
L. 228-40, L. 228-92 paragraph 3, L. 228-93 paragraph 6 and
L. 228-94 paragraph 3 of the French Commercial Code;
decides that the other provisions of the 5th and 8th resolutions4.of the combined general shareholders’ meeting of October 2,
2018 remain unchanged and continue to be valid for the
remaining term of said resolutions, i.e. until December 1, 2020.
Thirteenth resolution (Authorisation to be given to the Board of Directors to increase the Company’s capital by issuing shares and/or transferable securities giving immediate, or future, access to the share capital, without preferential subscription rights, reserved for members of savings schemes)
The general shareholders’ meeting, ruling under the quorum and
majority conditions required for extraordinary general shareholders’
meetings, after reviewing the Board of Directors’ report and the
Auditors’ special report, and in accordance with, on the one hand,
the provisions of Articles L. 225-129-2, L. 225-129-6, L. 225-138-1
and L. 228-91 et seq. of the French Commercial Code and, on the
other, of Articles L. 3332-18 to L. 3332-24 of the French Labour
Code:
08General shareholders’ meeting
Draft resolutions
284 REGISTRATION DOCUMENT 2018
authorises the Board of Directors, with the right to1.subdelegate in accordance with applicable law, to decide on
the share capital increase without preferential subscription
rights, on one or more occasions, in France or abroad, in the
proportions and at the times that it sees fit, either in euro, or in
any other currency or monetary unit established in reference to
a basket of currencies, with or without a premium, for a fee or
free of charge, by issuing (i) Company shares (other than
preference shares) and/or (ii) transferable securities governed
by Articles L. 228-92 paragraph 1 or L. 228-94 paragraph 2 of
the French Commercial Code, giving immediate or future
access, at any time or on a set date, by subscription,
conversion, exchange, redemption, the presentation of
warrants or by any other means, to the Company’s share
capital (including equity securities granting entitlement to debt
securities), reserved for members of one or more employee
savings schemes (or any other members’ plan under which
Articles L. 3332-1 et seq. of the French Labour Code, or any
other similar law or regulation, that would allow for a reserved
capital increase under the same conditions) set up in a French
or foreign company, or group of companies, falling within the
scope of the Company’s consolidated or combined financial
statements in accordance with Article L. 3344-1 of the French
Labour Code, it being specified that this resolution may be
used to implement leverage formulae;
decides to set the limits for the capital increases authorised,2.should this delegation of power be used by the Board of
Directors:
the maximum nominal amount of immediate, or future, capital●increases that may be carried out under this authorisation is set
at 1% of the share capital on the date of the Board of Directors’
decision. It is specified that this amount will be included in the
overall ceiling provided for by paragraph 2 of the 5th resolution of
the combined shareholders’ meeting of October 2, 2018, as
reiterated under the 11th resolution of this general shareholders’
meeting, or, where applicable, in any overall ceiling provided for
by resolutions of the same type that may supersede this
resolution during the period of validity of this delegation of
power,
where applicable, these ceilings will also include the nominal●amount of shares to be issued to protect, in accordance with legal
and regulatory provisions and, where applicable, contractual
provisions providing for other adjustments, the rights of holders of
transferable securities, or other rights, giving access to the share
capital;
provisions applicable on the issue date, will automatically replace
the aforementioned 20% and 30% discounts, respectively, on the
Reference Price. For the purposes of this paragraph, the
Reference Price means the average of the opening prices of the
Company’s shares on the Paris Euronext regulation market in the
twenty trading sessions prior to the date of the decision being
taken by the Board of Directors or its delegate, setting the
opening date of the subscription period for members of a
company or group savings scheme (or similar scheme);
decides that the issue price of new shares or transferable3.securities giving access to the share capital will be determined
under the conditions provided for in Articles L. 3332-18 et seq. of
the French Labour Code and will be at least 80% of the Reference
Price (as this expression is defined below) or 70% of the
Reference Price where the lockup period under
Articles L. 3332-25 and L. 3332-26 of the French Labour Code, is
ten years or more, given that, in the event of legislative changes,
the maximum discounts provided for by legal or regulatory
The general shareholders’ meeting expressly authorises the
Board of Directors, should it see fit, to reduce or cancel the
aforementioned discount on the Reference Price, within legal
and regulatory limits, in particular, to take into account locally
applicable legal, accounting, tax and social security systems;
authorises the Board of Directors to grant, free of charge, to4.the aforementioned beneficiaries, in addition to shares or
transferable securities giving access to the share capital,
shares or transferable securities giving access to future or
existing share capital to replace all, or part, of the discount on
the Reference Price and/or the employer’s top-up
contribution, given that the benefit arising from this grant may
not exceed the legal or regulatory limits applicable under
Articles L. 3332-10 et seq. of the French Labour Code;
for the benefit of the aforementioned beneficiaries, decides to5.remove shareholders’ preferential right to subscribe for the
securities referred to by this resolution, said shareholders also
waiving any right, in the event of free shares or transferable
securities giving access to the share capital being awarded to
the beneficiaries shown above, to said shares or securities
giving access to share capital, including the portion of the
reserves, profits or premiums incorporated in the share capital,
as a result of the allocation of said securities, free of charge,
on the basis of this resolution;
authorises the Board of Directors, under the terms of this6.authorisation, to sell shares to members of a company or
group savings scheme (or similar scheme) as provided for by
Article L. 3332-24 of the French Labour Code, given that the
nominal amount of shares sold at a discount to members of
one, or more, of the employee savings schemes referred to in
this resolution, will be included in the ceilings referred to in
paragraph 2 above;
decides that the Board of Directors, with the right to7.subdelegate in accordance with applicable law, will have full
authority to implement this delegation of power, in particular,
for the purposes of:
issuing shares and/or transferable securities giving immediate,●or future, access to the Company’s share capital,
drawing up, in accordance with applicable law, a list of●companies that have issued shares or transferable securities
giving access to share capital that may be subscribed for by
the above beneficiaries who, where applicable, may receive
free shares or transferable securities giving access to share
capital,
08General shareholders’ meeting
Draft resolutions
285REGISTRATION DOCUMENT 2018
deciding that beneficiaries, members of a company or group●savings scheme (or similar scheme) may subscribe direct or via
an employees’ mutual fund or other structures or entities
permitted by applicable legal or regulatory provisions,
determining the requirements, particularly in terms of length of●service, that must be met by beneficiaries of capital increases,
where applicable, setting terms for the exercise of rights (where●applicable, rights of conversion, exchange or redemption,
including by the delivery of Company assets such as existing
treasury shares or transferable securities) attached to shares or
transferable securities giving access to share capital and, in
particular, setting the date, which may be retrospective, from
which the new shares will rank for dividend, as well as any
other terms and conditions applicable to capital increases,
setting the terms under which the Company will have, where●applicable, the right to purchase or trade on the stock market,
at any time or during set periods, transferable securities giving
access to the share capital whether or not with a view to
cancelling said securities, given the applicable legal provisions,
providing for the option to suspend any exercise of rights●attached to shares or securities giving access to the share
capital in accordance with legal and regulatory provisions,
setting the amounts of issues to be made under this●authorisation and determining, in particular, issue prices, dates,
time limits, terms and conditions of subscription, settlement,
delivery and vesting (which may be retrospective), rules on
reducing amounts in the event of oversubscription, as well as
other terms and conditions of issue, in accordance with current
legal or regulatory constraints,
determining and making any adjustments intended to recognise●the impact of transactions on the Company’s share capital or
equity, in particular, in the event of changes to the par value of
shares, capital increases through the incorporation of reserves,
profits or premiums, free share grants, stock splits or reverse
stock splits, the distribution of dividends, reserves or premiums
or any other assets, redemption of capital, or any other
transactions affecting the capital or equity (including in the event
of a public offer and/or change of control), and setting any other
terms ensuring, where applicable, that the rights of holders of
transferable securities or other rights giving access to share
capital are protected (including via cash adjustments),
in the event of the award of free shares or transferable securities●giving access to the share capital, setting the type and number of
shares or transferable securities giving access to the share capital
to be issued, as well as related terms and characteristics, the
number to be awarded to each beneficiary, and setting the dates,
time limits and terms and conditions for the award of these shares
or transferable securities giving access to the share capital, in
accordance with current legal and regulatory constraints and, in
particular, choosing whether to fully, or partially, replace the award
of these shares or transferable securities with the discounts on the
Reference Price provided for above, or to deduct the equivalent
value of these shares or transferable securities from the total
employer’s top-up contribution, or to combine these two options,
in the event of new shares being issued, deducting the sums●needed to pay up these shares from the reserves, profits or
issue premiums,
recording capital increases and amending the Articles of●association accordingly,
at its sole discretion, charging the costs of capital increases to●related premiums and deducting the sums needed for the legal
reserve from this amount,
generally speaking, entering into any agreement, in particular,●to carry out the proposed issues successfully, to take any
measures and carry out any formalities required for the issue,
listing and financial administration of the securities issued
under this delegation, as well as for the exercise of the rights
attached thereto;
sets the period of validity of the delegation of power referred to8.in this resolution at twenty-six months from the date of this
shareholders’ meeting;
recognises the fact that, as of today, this delegation will cause the9.unused portion of any delegation of power relating to the
Company’s capital increase by means of the issue of shares
and/or transferable securities giving immediate, or future, access
to the share capital, without preferential subscription rights,
reserved for savings scheme members, to lapse.
Fourteenth resolution (Authorisation of the Board of Directors to increase the Company’s share capital by issuing shares and/or transferable securities giving immediate, or future, access to the capital, without preferential subscription rights, reserved for group employees outside France)
The general shareholders’ meeting, ruling under the quorum and
majority conditions required for extraordinary general shareholders’
meetings, after reviewing the Board of Directors’ report and the
Auditors’ special report, and in accordance with the provisions of
Articles L. 225-129-2, L. 225-138 and L. 228-91 et seq. of the
French Commercial Code:
recognises that in some countries, legal or tax issues may make1.it difficult to set up employee share ownership schemes directly,
or via employee mutual funds (the employees, pre-retirees and
corporate officers, referred to in Articles L. 3332-1 and
L. 3332-2 of the French Labour Code, of Neoen Group
companies with registered offices in one of these countries and
employees, pre-retirees or retirees of Neoen Group companies
residing in these same countries are hereinafter referred to as
“Overseas Employees”, the “Neoen Group” comprising the
Company and French and foreign companies falling within the
scope of the Company’s consolidated financial statements in
accordance with Articles L. 3344-1 et seq. of the French
Labour Code), and that the introduction of alternatives to the
schemes offered to French residents who are members of one
of the employee savings schemes set up by one of the Neoen
Group companies, may prove to be desirable;
08General shareholders’ meeting
Draft resolutions
286 REGISTRATION DOCUMENT 2018
authorises the Board of Directors, with the option to2.subdelegate in accordance with applicable law, to increase
the share capital, without preferential subscription rights, on
one or more occasions, in France or abroad, in the
proportions and at the times that it sees fit, (except during a
period of public offering for the securities of the Company filed
by a third party) either in euro, or in any other currency or
monetary unit established in reference to a basket of
currencies, with or without a premium, for a fee or free of
charge, by issuing (i) Company shares (other than preference
shares), and/or (ii) transferable securities governed by
Articles L. 228-92 paragraph 1, L. 228-93 paragraphs 1 and 3
or L. 228-94 paragraph 2 of the French Commercial Code
giving immediate, or future, access, at any time, or on a set
date, by subscription, conversion, exchange, redemption, the
presentation of warrants or any other means, to the
Company’s share capital (including capital securities giving
entitlement to debt securities), reserved for the following
category of beneficiaries: (i) Overseas Employees, (ii) employee
investment funds or other entities, whether legal or natural
persons, that invest in Company securities, whose unit-holders
or shareholders comprise Overseas Employees, and/or (iii) any
banks or entities controlled by any such establishment within
the meaning of Article L. 233-3 of the French Commercial
Code, to set up a structured offer for Overseas Employees at
the Company’s request;
decides to set the limits for the capital increases authorised,3.should this delegation of power be used by the Board of
Directors:
the maximum nominal amount of immediate, or future, capital●increases that may be carried out under this authorisation is set
at 1% of the share capital on the date of the Board of Directors’
decision. Please not that this amount will be included in the
overall ceiling referred to in paragraph 2 of the 5th resolution of
the combined shareholders’ meeting of October 2, 2018, as
reiterated under the 11th resolution of this general shareholders’
meeting, or, where applicable, in any overall ceiling that may be
provided for by resolutions of the same type that may supersede
this resolution during the period of validity of this delegation of
power,
where applicable, these ceilings will also include the nominal●amount of shares to be issued to protect, in accordance with
legal and regulatory provisions and, where applicable,
contractual provisions providing for other adjustments, the
rights of holders of transferable securities, or other rights, giving
access to the share capital;
decides to cancel, for the benefit of the aforementioned4.beneficiaries, shareholders’ preferential subscription rights to
the securities referred to in this resolution;
subscriptions for the corresponding capital increase carried
out under this resolution, or (ii) for operations carried out as
part of an overall employee share ownership scheme set up in
France or abroad, the date of the decision setting the opening
date for subscriptions for the corresponding capital increase
carried out under the 13th resolution, less a maximum discount
of 30%;
decides that the issue price of new shares or transferable5.securities giving access to share capital to be issued under
this authorisation will be set by the Board of Directors on the
basis of the Company’s share price on the Paris Euronext
regulated market. This price will be the average of the opening
prices of the Company’s shares in the twenty trading sessions
prior to (i) the date of the decision setting the opening date for
decides that the Board of Directors, with the right to6.subdelegate within the law, will have full authority to implement
this delegation of authority, in particular, for the purposes of:
issuing shares and/or transferable securities giving immediate,●or future, access to the Company’s share capital,
drawing up a list of one or more beneficiaries of the●cancellation of preferential subscription rights from the
category defined above, as well as the number of shares or
transferable securities giving access to share capital to be
subscribed for by each of said beneficiaries,
where applicable, setting terms for the exercise of rights (where●applicable, rights of conversion, exchange or redemption,
including by the delivery of Company assets such as existing
treasury shares or transferable securities) attached to shares or
transferable securities giving access to share capital and, in
particular, setting the date, which may be retrospective, from
which the new shares will rank for dividend, as well as any
other terms and conditions applicable to capital increases,
setting the terms under which the Company will have, where●applicable, the right to purchase or trade on the stock market,
at any time or during set periods, transferable securities giving
access to the share capital whether or not with a view to
cancelling said securities, given the applicable legal provisions,
providing for the option to suspend any exercise of rights attached●to shares or securities giving access to the share capital in
accordance with legal and regulatory provisions,
setting the amounts of issues to be made under this●authorisation and determining, in particular, issue prices, dates,
time limits, terms and conditions of subscription, settlement,
delivery and vesting (which may be retrospective), rules on
reducing amounts in the event of oversubscription, as well as
other terms and conditions of issue, in accordance with current
legal or regulatory constraints,
determining and making any adjustments intended to●recognise the impact of transactions on the Company’s share
capital or equity, in particular, in the event of changes to the
par value of shares, capital increases through the incorporation
of reserves, profits or premiums, free share grants, stock splits
or reverse stock splits, the distribution of dividends, reserves or
premiums or any other assets, redemption of capital, or any
other transactions affecting the capital or equity (including in
the event of a public offer and/or change of control), and
setting any other terms ensuring, where applicable, that the
rights of holders of transferable securities or other rights giving
access to share capital are protected (including via cash
adjustments),
recording capital increases and amending the Articles of●association accordingly,
08General shareholders’ meeting
Draft resolutions
287REGISTRATION DOCUMENT 2018
where applicable, charging the costs of capital increases to●related premiums and deducting the sums needed for the legal
reserve from this amount,
generally speaking, entering into any agreement, in particular,●to carry out the proposed issues successfully, to take any
measures and decisions and carry out any formalities required
for the issue, listing and financial administration of the
securities issued under this delegation, as well as for the
exercise of the rights attached thereto or consecutive to the
capital increases carried out;
sets the period of validity of the delegation of authority referred7.to in this resolution at eighteen months from the date of this
shareholders’ meeting.
Fifteenth resolution (Authorisation to be given to the Board of Directors to reduce the share capital by cancelling treasury shares)
The general shareholders’ meeting, ruling under the quorum and
majority conditions required for extraordinary general shareholders’
meetings, after reviewing the Board of Directors’ report and the
Auditors’ special report, authorises the Board of Directors to reduce
the share capital, on one or more occasions, in the proportions and at
the times that it sees fits, by cancelling any quantity of treasury
shares, to the extent permitted by law, in accordance with the
provisions of Articles L. 225-209 et seq. and L. 225-213 of the
French Commercial Code.
On each cancellation date, the maximum number of shares cancelled
by the Company during the twenty-four month period prior to said
cancellation, including the shares cancelled on said date, may not
exceed 10% of the shares comprising the Company’s share capital
on that date, or, by way of indication, based on the share capital of
€169,914,996 euros at 30 April 2019, a maximum of 8,495,750
shares; given that this cap is applied to a capital amount that will,
where applicable, be adjusted in recognition of transactions affecting
the share capital after this general shareholders’ meeting.
The general shareholders’ meeting gives the Board of Directors full
authorisation, with the right to subdelegate in accordance with
applicable law, to implement the cancellation(s) and reduction(s) of
share capital permitted under this authorisation, to deduct the
difference between the buyback value and the par value of the
cancelled shares from available premiums and reserves, at its
discretion, to allocate the portion of the legal reserve freed up as a
result of the capital reduction and to amend the Articles of association
accordingly and to carry out any formalities.
This authorisation is granted for a period of twenty-six months from
today and will cause the unused portion of any prior authorisation
granted for the same purpose, i.e. any authorisation relating to capital
reductions via the cancellation of treasury shares, to lapse from this
general shareholders’ meeting.
RESOLUTION WITHIN THE REMIT OF THE ORDINARY GENERAL 8.1.3
SHAREHOLDERS’ MEETING
Sixteenth resolution (Powers to carry out formalities)
The general shareholders’ meeting, ruling under the conditions of quorum and majority required for extraordinary shareholders’ meetings, authorises
bearers of originals, copies or extracts of the minutes of its deliberations to make any filings or carry out any formalities required by law.
08General shareholders’ meeting
Board of Directors’ report on the draft resolutions
288 REGISTRATION DOCUMENT 2018
BOARD OF DIRECTORS’ REPORT ON THE DRAFT RESOLUTIONS8.2
OVERVIEW OF THE COMPANY’S BUSINESS AFFAIRS
An overview of the financial position, business activity and results of
the Company and its Group over the past year, as well as the various
disclosures required by current legal and regulatory provisions,
appear in the Board of Directors’ 2018 management report which is
in included in the annual financial report which can be accessed on
the Company website (www.neoen.com), which you are invited to
consult.
Since the beginning of 2019, the Company has continued to pursue
its activities within the normal course of its business.
Post-closing events are described in Note 37 Post-closing events)
to the consolidated financial statements at December 31, 2018.
The documents required by law and by the bylaws were sent out
and/or made available to you within the deadlines set.
It is specified that the Board of Directors approves all the
resolutions brought before the general shareholders’ meeting.
RESOLUTIONS WITHIN THE REMIT OF THE ORDINARY GENERAL 8.2.1
SHAREHOLDERS’ MEETING
The 1st to 10th and the 16th resolutions fall within the remit of ordinary general shareholders’ meetings.
Approval of the 2018 corporate and consolidated financial statements and appropriation of net income (1st, 2nd and 3rd resolutions)
The draft 1st and 2nd resolutions concern the approval of the 2018
corporate and consolidated financial statements, approved by the
Board of Directors on April 17, 2019, in accordance with the
provisions of Article L. 232-1 of the French Commercial Code.
You are asked, under the 3rd resolution, to allocate the 2018 net
income, amounting to €9,376,196 as follows:
in accordance with applicable legal requirements, to allocate●€468.810 of this profit to the legal reserve;
to note that the balance of the remaining 2018 profit is €8,907,386;●
to allocate the distributable profit of €8,907,386 to “Other reserves”,
which will stand at €8,907,386 post allocation.
Setting the overall remuneration package for Board members (4th resolution)
You are asked, under the 4th resolution, to set the overall
remuneration package for members of the Board of Directors at
€207,500 per year for current and subsequent periods and until any
new decision is taken. The Board of Directors will then share this
amount freely between its members.
importance of the Board’s work and in line with market practice, and
(ii) arrange for additional remuneration to be paid to the lead Board
member.
It is specified that the overall remuneration package for Board
members set by the general shareholders’ meeting of October 2,
2018, is €170,000. The Board of Directors is asking you to increase
this amount so as to be able (i) to increase the maximum individual
amount of remuneration payable, by the Board of Directors, to each
Board member on the basis of their corporate office, given the
Ratification of the cooptation of Fonds Stratégique de Participations as a director (5th resolution)
You are asked to ratify the cooptation of Fonds Stratégique de
Participations, as a director for the remainder of the term of office of its
predecessor, Christophe Gégout, who has decided to terminate his
duties as a director in his own right, i.e. until the end of the general
shareholders’ meeting called to approves the financial statements for
the year ending on December 31, 2019. The Board of Directors
decides on this cooptation at its meeting on November 21, 2018.
This cooptation was the result of an agreement entered into on
October 2, 2018, by the Company and Fonds Stratégique de
Participations, within the context of the admission of the Company’s
shares to trading on the Paris Euronext regulated market. Under the
terms of this agreement, in exchange for the commitments given by
Fonds Stratégique de Participations, the Company agreed to do its
best efforts to ensure that Fonds Stratégique de Participations would
be appointed as a Company director before December 31, 2018.
This information is contained in the Company’s IPO prospectus which
was approved under visa no. 10-467 on October 3, 2018.
The Board of Directors also reviewed the position of Fonds
Stratégique de Participations with regard to the recommendations of
the AFEP-MEDEF Governance Code and, on the advice of the
Nomination and Compensation Committee, concluded that Fonds
Stratégique de Participations would be considered an independent
director.
08General shareholders’ meeting
Board of Directors’ report on the draft resolutions
289REGISTRATION DOCUMENT 2018
Fonds Stratégique de Participations is an investment vehicle intended
to boost long-term investment in French companies. CARDIF
Assurance Vie (BNP Paribas Group), CNP Assurances, PREDICA
(Crédit Agricole Group), SOGECAP (Société Générale Group),
Groupama, BPCE Vie (Natixis Assurances Group) and SURAVENIR
(Crédit Mutuel ARKEA Group) are investors.
It is specified that Fonds Stratégique de Participations appointed
Christophe Gégout as its permanent representative on the
Company’s Board of Directors.
Renewal of Stéphanie Levan as a director (6th resolution)
You are asked, under the 6th resolution, to renew Stéphanie Levan’s
directorship for a 4-year period ending after the ordinary general
shareholders’ meeting to approve the financial statements for the year
ending on December 31, 2022.
In particular, the Board of Directors noted that this renewal would
help to balance the composition of the Board of Directors, and to
ensure that the corporate bodies set up by the Company, which was
recently converted into a public limited company (société anonyme),
are highly skilled and very stable.
Approval of the agreements and commitments referred to in Article L. 225-38 et seq. of the French Commercial Code (7th resolution)
Under the 7th resolution, you are asked to approve the statutory
auditors’ special report on the agreements and commitments referred
to in Articles L. 225-38 and L. 225-40 to L. 225-42 of the French
Commercial Code in all its provisions.
Approval of the fixed, variable and exceptional items comprising the total remuneration and benefits of any kind paid or awarded to Xavier Barbaro, Chairman and CEO,for financial year 2018, for the period covering the time the Company’s shares were listed for trading on the Euronext Paris regulated market (8th resolution)
You are asked, under the 8th resolution, in accordance with
Article L. 225-100, II of the French Commercial Code, based on the
Board of Directors’ report on corporate governance, to approve the
fixed, variable and exceptional items comprising the total
remuneration and other benefits paid or awarded to Xavier Barbaro,
Chairman and CEO, for financial year 2018, for the period covering
the time the Company’s shares were listed for trading on the
Euronext Paris regulated market, as presented in this report.
It is specified that the general shareholders’ meeting of October 2,
2018, had approved, in its 3rd resolution, in accordance with the
requirements of Article L. 225-37-2 of the French Commercial Code,
principles and criteria for determining and distributing the fixed,
variable and exceptional items comprising the total remuneration and
benefits of any kind that can be awarded to the Chairman and Chief
Executive Officer on the basis of his corporate office for the period
covering the time the Company’s shares were listed for trading on the
Euronext Paris regulated market and subject to the admission of the
Company’s shares to trading on the Paris Euronex regulated market.
Approval of the principles and the criteria for determining and distributing the fixed, variable and exceptional items comprising the total remuneration and benefits of any kind that can be granted to the Chairman and CEO for exercising his term for 2019 (9th resolution)
You are asked, under the 9th resolution, in accordance with
Article L. 225-37-2 of the French Commercial Code, based on the
Board of Directors’ report on corporate governance, to approve the
principles and criteria for determining and distributing the fixed,
variable and exceptional items comprising the total remuneration and
other benefits that can be granted to the Chairman and CEO, on the
basis of his corporate office, for 2019.
Authorisation to be given to the Board of Directors to trade in Company shares (10th resolution)
You are asked, under the 10th resolution, to authorise the Board of
Directors to purchase Company shares, or to have them purchased
by third parties, with a view to:
implementing any Company share purchase option plan under the●provisions of Articles L. 225-177 et seq. of the French Commercial
Code or any similar plan; or
allocating or selling shares to employees to enable them to share in●the fruits of the Company’s expansion or the implementation of any
company or group savings scheme (or similar plan) under the
conditions provided for by law, in particular, Articles L. 3332-1 et
seq. of the French Labour Code; or
allocating free shares under the provisions of Articles L. 225-197-1●et seq. of the French Commercial Code; or
generally speaking, honouring stock option plans or other share●grants to Company employees or corporate officers or those of an
associate; or
delivering shares when rights attached to transferable securities●giving access to the share capital by redemption, conversion,
exchange or the presentation of warrants, or by any other means,
are exercised; or
cancelling some, or all, of the securities bought back in this way,●subject to the adoption of the [15]th resolution described below or
any other resolution of the same kind; or
delivering shares (in exchange, as payment or other) in connection●with acquisitions, mergers, spin-offs or contributions; or
stabilising the secondary market or the liquidity of Company shares●by an investment service provider under a liquidity contract
complying with market practices approved by the French Financial
Markets Authority (Autorité des Marchés Financiers – AMF),
amended where applicable.
This programme may also be intended to enable any market practice
that may be approved by the French Financial Markets Authority to be
implemented and, more generally speaking, any other transaction that
complies with current regulations. Under such circumstances, the
Company would inform its shareholders by means of a press release.
08General shareholders’ meeting
Board of Directors’ report on the draft resolutions
290 REGISTRATION DOCUMENT 2018
The Company would be able to purchase a number of shares such
that, on the date of each buyback, the total number of shares
purchased by the Company since the start of the buyback programme
(including those that are the subject of said buyback) is no more than
10% of the shares comprising the Company’s share capital on that
date (taking into consideration transactions affecting the share capital
after the date of the general shareholders’ meeting), given that (i) the
number of shares acquired with a view to retention and subsequent
delivery as part of a merger, spin-off or contribution, could not be more
than 5% of its share capital and (ii) where shares may be bought back
to boost liquidity under the conditions defined by the French Financial
Markets Authority’s general regulation, the number of shares taken into
consideration when calculating the 10% cap provided for above, would
correspond to the number of shares purchased, less the number of
shares resold during the authorisation period.
Shares could be acquired, sold or transferred at any time, except
during a public offer, within the limits set by current legislation and
regulations, and by any means, particularly on regulated markets,
multilateral trading facilities, via systematic internalisers or
over-the-counter transactions, including via block trades, public
purchase or exchange offers, or the use of options or other futures
traded on regulated markets, multilateral trading systems, via
systemic internalisers or over-the-counter or by the delivery of shares
following the issue of transferable securities giving access to the
Company’s share capital by conversion, exchange, redemption or the
exercise of warrants, either directly or indirectly via an investment
services provider, or by any other means (with no limit on the
percentage of the buyback programme that can be carried out using
any one of these methods).
The maximum purchase price would be €35 per share (or the
equivalent value in any other currency). This maximum price would
only apply to acquisitions decided as of the date of the shareholders’
meeting and not to any forward transactions contracted under an
authorisation granted by a previous general shareholders’ meeting
and providing for share acquisitions after the meeting date.
The general shareholders’ meeting would authorise the Board of
Directors, in the event of a change in the share’s par value, an
increase in the share capital through the incorporation of reserves,
free share grants, stock splits or reverse stock splits, a distribution of
reserves or any other assets, the redemption of capital, or any other
transaction affecting the share capital or equity, to adjust the
aforementioned maximum purchase price to take into account the
impact of these operations on the share value.
The maximum funds designated for use by the aforementioned
buyback programme would be set at €50 million.
The Board of Directors would have full authority, with the right to
subdelegate within the law, to implement this authorisation.
This authorisation would be granted for a period of eighteen months
from the date of this general shareholders’ meeting.
POWERS TO CARRY OUT FORMALITIES (16TH RESOLUTION)
You are asked, under the 16th resolution, to fully authorise bearers of
originals, copies or extracts of the minutes of its deliberations to file
any papers or carry out any formalities required by law.
RESOLUTIONS WITHIN THE REMIT 8.2.2
OF EXTRAORDINARY GENERAL
SHAREHOLDERS’ MEETINGS
The 11th to 15th resolutions fall within the remit of Extraordinary
general shareholders’ meetings.
Increase in the nominal ceiling on capital increases that may be carried out and setting of a nominal ceiling on debt securities that may be issued, under the 6th and 7th resolutions of the combined general shareholders’ meeting of October 2, 2018, authorising the Board of Directors to issue shares and/or transferable securities giving immediate or future access, respectively, to the share capital, without preferential subscription rights by public offering and without preferential rights by the private placement referred to in Article L. 411-2 II of the French Monetary and Financial Code, valid until December 1, 2020 (11th resolution)
You are asked, under the 11th resolution, to increase the nominal
ceiling on capital increases that may be carried out under the 6th and
7th resolutions of the combined general shareholders’ meeting of
October 2, 2018.
In fact, you are reminded that the combined general shareholders’
meeting of October 2, 2018,
under its 6th resolution, authorised the Board of Directors to●increase the Company’s capital by issuing shares and/or
transferable securities giving immediate, or future, access to the
share capital, without preferential subscription rights, by public
offering, by up to a nominal amount of €60 million, valid until
December 1, 2020; and
under its 7th resolution, authorised the Board of Directors to●increase the Company’s capital by issuing shares and/or
transferable securities giving immediate, or future, access to the
share capital, without preferential subscription rights by the private
placement referred to in Article L. 411-2 II of the French Monetary
and Financial Code, by up to a nominal amount of €10 million. It is
specified that this amount is included in the ceiling provided for in
the 6th resolution, valid until December 1, 2020.
You are reminded that the Board of Directors, meeting on
October 16, 2018, in making use of the aforementioned 6th resolution,
within the context of the Company’s IPO, decides to increase the
share capital by €449,999,995.50 without preferential subscription
rights, by public offering, by issuing 27,272,727 new ordinary shares
with a par value of two (2) euro each, for an issue price of €16.50 per
share (including an issue premium of €14.50 per share), i.e. a nominal
capital increase of €54,545,454.00, plus an overall premium of
€395,454,541.50. The available balance, in relation to the ceiling
referred to in the aforementioned 6th resolution is, therefore,
€5,454,546.
08General shareholders’ meeting
Board of Directors’ report on the draft resolutions
291REGISTRATION DOCUMENT 2018
Consequently, you are asked to increase the nominal amount of the
capital increases that may be carried out under the 6th resolution of the
combined general shareholders’ meeting of October 2, 2018, and to
specify that said amount may not exceed a new ceiling set at
€80 million. It is specified that, given the nominal amount of the capital
increase without preferential subscription rights by public offering
carried out on October 16, 2018 for €54,545,454.00, which is included
in the ceiling referred to in said 6th resolution, the total nominal amount
of the capital increases that may be carried out from the date of this
increase may not exceed €25,454,546. It is specified, however, that (i)
the aforementioned nominal amounts may not take into consideration
adjustments that may be made in accordance with applicable legal and
regulatory provisions, and where applicable, contractual provisions
providing for other adjustments, to protect the rights of holders of
transferable securities or other rights giving access to the share capital
and that (ii) the nominal amount of the capital increases carried out,
where applicable, under said 6th resolution would be included in the
overall ceiling of €125 million, provided for in paragraph 2 of the 5th
resolution of the combined general shareholders’ meeting of October 2,
2018. Please also note that, where appropriate, the aforementioned
overall ceiling of €125 million would also include the capital increases
carried out under the 5th, 7th, 8th, 10th, 11th, 12th, 13th, 14th and 15th
resolutions of the combined general shareholders’ meeting of
October 2, 2018, as well as under the 11th, 13th and 14th resolutions of
the general shareholders’ meeting.
You are also asked to decide that the maximum nominal amount of
capital increases that may be carried out under the 7th resolution of
the combined shareholders’ meeting of October 2, 2018, could not
exceed a new nominal ceiling set at €25 million. It is specified that (i)
this maximum nominal amount does not take into account any
adjustments that may be made in accordance with applicable legal
and regulatory provisions, and where applicable, contractual
provisions providing for other adjustments, to protect the rights of
holders of transferable securities or other rights giving access to share
capital and that (ii) this maximum nominal amount would be included
in the ceiling provided for in the 6th resolution of the combined
shareholders’ meeting of October 2, 2018, as increased by this
resolution, and in the overall ceiling provided for by paragraph 2 of the
5th resolution of the combined shareholders’ meeting of October 2,
2018, as reiterated under this resolution.
You are asked to resolve that the Board of Directors is not to make
use of the 6th and 7th resolutions of the Combined General
Shareholders' Meeting of 2 October 2018 without prior authorisation
by the General Shareholders' Meeting, as amended by this
delegation, from the date of filing of a public offering for the securities
of the Company by a third party until the end of the offering period.
In addition, you are also advised that the combined general
shareholders’ meeting of October 2, 2018 did not set the maximum
nominal amount of debt securities to be issued immediately, or in the
future, under these resolutions.
Consequently, you are asked to set a ceiling on the nominal amount
of debt securities that may be issued immediately, or in the future,
under each of the 6th and 7th resolutions of the combined general
shareholders’ meeting of October 2, 2018, This ceiling would amount
to €200 million or the equivalent value in any other currency or
monetary unit established in reference to a basket of currencies on
the issue date.
This amount would include any above-par redemption premium.
as those of the combined general shareholders’ meeting of
October 2, 2018, and debt securities whose issue may be decided
upon, or authorised, by the Board of Directors in accordance with
Articles L. 228-36-A, L. 228-40, L. 228-92 paragraph 3, L. 228-93
paragraph 6 and L. 228-94 paragraph 3 of the French Commercial
Code.
This amount would not be dependent on the amount of debt
securities that may be issued as a result of the use of other
resolutions brought before the general shareholders’ meeting, as well
The other provisions of the 6th and 7th resolutions of the combined
general shareholders’ meeting of October 2, 2018 would remain
unchanged for the remaining term of said resolutions, i.e. until
December 1, 2020.
Nominal ceiling on debt securities that may be issued under the 5th and 8th resolutions of the combined general shareholders’ meeting of October 2, 2018, authorising the Board of Directors to issue shares and/or transferable securities giving immediate or future access, respectively, to the share capital, with preferential subscription rights or in return for contributions in kind, constituted by equity securities or transferable securities giving access to the share capital, valid until December 1, 2020 (12th resolution)
You are asked, under the 12th resolution, to set the maximum nominal
amount of debt securities that may be issued immediately, or in the
future, under the 5th and 8th resolutions of the combined general
shareholders’ meeting of October 2, 2018.
In fact, you are reminded that the combined general shareholders’
meeting of October 2, 2018:
under its 5th resolution, authorised the Board of Directors to●increase the Company’s capital by issuing shares and/or
transferable securities giving immediate, or future, access to the
share capital, with preferential subscription rights; and
under its 8th resolution, authorised the Board of Directors to issue●shares and/or transferable securities giving immediate, or future,
access to shares to be issued by the Company in return for
contributions in kind constituted by equity securities or transferable
securities giving access to share capital.
The combined general shareholders’ meeting of October 2, 2018 did
not set the maximum nominal amount of debt securities to be issued
immediately, or in the future, under these resolutions.
Consequently, you are asked to set a ceiling on the nominal amount
of debt securities that may be issued immediately, or in the future,
under each of the 5th and 8th resolutions of the combined general
shareholders’ meeting of October 2, 2018, This ceiling would amount
to €200 million or the equivalent value in any other currency or
monetary unit established in reference to a basket of currencies on
the issue date.
This amount would include any above-par redemption premium.
This amount would not be dependent on the amount of debt
securities that may be issued as a result of the use of other
resolutions brought before the general shareholders’ meeting, as well
as those of the combined general shareholders’ meeting of
October 2, 2018, and debt securities whose issue may be decided
upon, or authorised, by the Board of Directors in accordance with
Articles L. 228-36-A, L. 228-40, L. 228-92 paragraph 3, L. 228-93
paragraph 6 and L. 228-94 paragraph 3 of the French Commercial
Code.
08General shareholders’ meeting
Board of Directors’ report on the draft resolutions
292 REGISTRATION DOCUMENT 2018
The other provisions of the 5th and 8th resolutions of the combined
general shareholders’ meeting of October 2, 2018 would remain
unchanged and would be valid for the remaining term of said
resolutions, i.e. until December 1, 2020.
Authorisation to be given to the Board of Directors to increase the Company’s capital by issuing shares and/or transferable securities giving immediate, or future, access to the share capital, without preferential subscription rights, reserved for members of savings schemes (13th resolution)
You are asked, under the 13th resolution, to authorise the Board of
Directors to increase the share capital, without preferential subscription
rights, by issuing (i) Company shares (apart from preference shares)
and/or (ii) transferable securities governed by Articles L. 228-92
paragraph 1 or L. 228-94 paragraph 2 of the French Commercial Code,
giving immediate or future access to the Company’s share capital,
reserved for members of company, or group, savings schemes.
This resolution would enable the Company to include some
employees and corporate officers in its success by developing an
employee share ownership scheme.
The maximum nominal amount of the immediate, or future, capital
increases that may be carried out under this authorisation would be
set at 1% of the share capital on the date when the decision is taken
by the Board of Directors. It is specified that this amount would be
included in the overall ceiling provided for in paragraph 2 of the 5th
resolution of the combined general shareholders’ meeting of
October 2, 2018, as reiterated under this resolution, or, where
applicable, in any overall ceiling that may be provided for by a
resolution of the same kind that may supersede said resolution during
the period of validity of the 13th resolution.
Where applicable, these ceilings would also include the nominal
amount of shares to be issued to protect, in accordance with legal
and regulatory provisions and, where applicable, contractual
provisions providing for other adjustments, the rights of holders of
transferable securities, or other rights, giving access to the share
capital.
The subscription price would be set under the conditions provided for
by Articles L. 3332-18 et seq. of the French Labour Code and would
be at least 80% of the Reference Price (as this expression is defined
below) or 70% of the Reference Price where the lockup period
provided for by the plan, under Articles L. 3332-25 and L. 3332-26 of
the French Labour Code, is ten years or more, given that, in the event
of legislative changes, the maximum discounts provided for by legal or
regulatory provisions applicable on the issue date, would automatically
replace the aforementioned 20% and 30% discounts, respectively, on
the Reference Price. For the purposes of this paragraph, the Reference
Price would mean the average of the opening prices of the Company’s
shares on the Paris Euronext regulated market in the twenty trading
sessions prior to the date of the decision taken by the Board of
Directors or its delegate, setting the opening date of the subscription
period for members of a company or group savings scheme (or similar
scheme).
The Board of Directors could, however, reduce or cancel the
aforementioned discount in view of locally applicable legal,
accounting, tax and social security systems.
The period of validity of this authorisation would be set at twenty-six
months from the date of the general shareholders’ meeting.
Authorisation of the Board of Directors to increase the Company’s share capital by issuing shares and/or transferable securities giving immediate, or future, access to the share capital, without preferential subscription rights, reserved for group employees abroad (14th resolution)
You are asked, under the 14th resolution, to authorise the Board of
Directors to increase the share capital, without preferential
subscription rights, by issuing Company shares as well as other
equity securities giving access to the Company’s share capital
(except during a period of public offering for the securities of the
Company filed by a third party). The capital increase would be
reserved (i) for the employees, pre-retirees or retirees and corporate
officers referred to in Articles L. 3332-1 and L. 3332-2 of the French
Labour Code, of Neoen Group companies with their registered office
in one of these countries and employees, pre-retirees or retirees of
Neoen Group companies residing in these same companies (the
“Overseas Employees”), (ii) employee investment funds or other
entities, whether legal or natural persons, that invest in Company
securities, whose unit-holders or shareholders comprise Overseas
Employees, and/or (iii) any banks or entities controlled by any such
establishment within the meaning of Article L. 233-3 of the French
Commercial Code, to set up a structured offer for Overseas
Employees at the Company’s request.
This resolution would enable the Company to include some overseas
employees and corporate officers in its success by developing an
employee share ownership scheme.
The maximum nominal amount of immediate, or future, capital
increases that may be carried out under this authorisation would be
set at 1% of the share capital on the date of the Board of Directors’
decision. It is specified that this amount would be included in the
overall ceiling referred to in paragraph 2 of the 5th resolution of the
combined shareholders’ meeting of October 2, 2018, as reiterated
under the 11th resolution above, or, where applicable, in any overall
ceiling that may be provided for by resolutions of the same type that
may supersede this resolution during the period of validity of this
authorisation.
Where applicable, these ceilings would also include the nominal
amount of shares to be issued to protect, in accordance with legal
and regulatory provisions and, where applicable, contractual
provisions providing for other adjustments, the rights of holders of
transferable securities, or other rights, giving access to the share
capital.
The issue price of new shares or transferable securities giving access
to share capital to be issued under this authorisation would be set by
the Board of Directors on the basis of the Company’s share price on
the Paris Euronext regulated market. This price would be the average
of the opening prices of the Company’s shares in the twenty trading
sessions prior to (i) the date of the decision setting the opening date
for subscriptions for the corresponding capital increase carried out
under this resolution, or (ii) for operations carried out as part of an
overall employee share ownership scheme set up in France or
abroad, the date of the decision setting the opening date for
subscriptions for the corresponding capital increase carried out under
the 13th resolution, less a maximum discount of 30%.
The period of validity of this authorisation would be set at eighteen
months from the date of the general shareholders’ meeting.
08General shareholders’ meeting
Board of Directors’ report on the draft resolutions
293REGISTRATION DOCUMENT 2018
Authorisation to be given to the Board of Directors to reduce the share capital by cancelling treasury shares (15th resolution)
You are asked, with regard to the 10th resolution above, authorising
the Board of Directors to buy Company shares, in particular, for the
purposes of cancelling all, or some, of the shares purchases, to
authorise the Board of Directors to reduce the share capital, on one
or more occasions, by cancelling any quantity of treasury shares that
it sees fit, within the legal limits.
The maximum number of shares cancelled by the Company during
the twenty-four month period prior to said cancellation, including said
cancelled shares, may not exceed 10% of the shares comprising the
Company’s share capital on that date.
This authorisation would be granted for a period of twenty-six months
from the date of this general shareholders’ meeting.
08General shareholders’ meeting
Statutory auditors’ reports on securities trading
294 REGISTRATION DOCUMENT 2018
STATUTORY AUDITORS’ REPORTS ON SECURITIES TRADING8.3
STATUTORY AUDITORS’ REPORT ON THE PLANNED AMENDMENTS 8.3.1
TO DELEGATION LIMITS FOR ISSUES OF SHARES AND MARKETABLE SECURITIES
WITH CANCELLATION OF PREFERENTIAL SUBSCRIPTION RIGHTS
(11TH RESOLUTION)
Combined Shareholders’ Meeting of June 28, 2019
This is a translation into English of the statutory auditors’ report issued in French and it is provided solely for the convenience of English-speaking
users.
This report should be read in conjunction and construed in accordance with French law and professional auditing standards applicable in France.
To the NEOEN Shareholders’ Meeting,
As statutory auditors of your Company and pursuant to the engagement set forth in Articles L. 228-92 and L. 225-135 et seq. of the French
Commercial Code (Code de commerce), we hereby present our report on the planned amendments to Board of Directors’ delegation limits for
various issues of shares and/or marketable securities, transactions on which you are asked to vote.
On October 2, 2018, the Shareholders’ Meeting authorized the following delegations:
under its 6th resolution, the delegation of authority to the Board of Directors to decide an increase in the Company’s share capital via the issue of●shares and/or marketable securities granting access to capital immediately or in the future, with cancellation of preferential subscription rights, as
part of a public offering, for up to a maximum par value amount of €60 million, valid until December 1, 2020; and
under its 7th resolution, the delegation of authority to the Board of Directors to decide an increase in the Company’s share capital via the issue of●shares and/or marketable securities granting access to capital immediately or in the future, with cancellation of preferential subscription rights, as
part of a private placement referred to in Article L. 411-2 II of the French Monetary and Financial Code (Code monétaire et financier), for up to a
maximum par value amount of €10 million, it being specified that such amount shall be deducted from the limit set forth in the 6th resolution, valid
until December 1, 2020.
We presented a report on the aforementioned transactions to this Shareholders’ Meeting. It is now proposed that the Shareholders’ Meeting amend
the Board of Directors’ delegations regarding the maximum par value amount of share capital increases that may be carried out:
the maximum par value amount of share capital increases that may be carried out pursuant to the 6th resolution of the Combined Shareholders’●Meeting of October 2, 2018, may not exceed a new par value limit of €80 million. It is specified that considering the par value amount of the share
capital increase with cancellation of preferential subscription rights as part of a public offering carried out on October 16, 2018 of
€54,545,454.00, deducted from the limit for the 6th resolution, the maximum par value amount of share capital increases that may be carried out
as a result of this amendment may not exceed €25,454,546,
the maximum par value amount of share capital increases that may be carried out, pursuant to the 7th resolution of the Combined Shareholders’●Meeting of October 2, 2018, may not exceed a new par value limit of €25 million.
limits on the amount of authorized debt securities in the event of issues of marketable securities consisting of debt securities granting access to●capital, immediately or in the future, pursuant to the 6th and 7th resolutions of the Combined Shareholders’ Meeting of October 2, 2018 are as
follows:
the nominal amount of debt securities that may be issued, immediately or in the future, pursuant to the 6th and 7th resolutions of the●Combined Shareholders’ Meeting of October 2, 2018, is set at €200 million or its equivalent in any other currency or monetary unit
established by reference to several currencies on the issue date;
any redemption premium above par shall be added to this amount, where applicable;●
this amount is separate from the amount of debt securities whose issue may result from the use of other resolutions submitted to this●Shareholders’ Meeting, as well as those of the Combined Shareholders’ Meeting of October 2, 2018, and debt securities whose issue
would be decided or authorized by the Board of Directors in accordance with Articles L. 228-36-A, L. 228-40, L. 228-92 section 3,
L.228-93 section 6 and L. 228-94 section 3 of the French Commercial Code.
08General shareholders’ meeting
Statutory auditors’ reports on securities trading
295REGISTRATION DOCUMENT 2018
It is the responsibility of the Board of Directors to prepare a report in accordance with Articles R. 225-113 et seq. of the French Commercial Code.
Our role is to express an opinion on the planned amendments to the Board of Directors’ delegation limits for various issues of shares and/or
marketable securities.
We performed the procedures that we considered necessary with regard to the professional guidelines of the French National Institute of Statutory
Auditors (Compagnie Nationale des Commissaires aux Comptes) applicable to this engagement. These procedures consisted in verifying the
content of the Board of Directors’ report on the planned amendments to the Board of Directors’ delegation limits for various issues of shares and/or
marketable securities.
We have no comments to make on the planned amendments to the Board of Directors’ delegations for various issues of shares and/or marketable
securities.
Paris-La Défense and Paris, May 15, 2019
The Statutory Auditors
DELOITTE & ASSOCIÉS
François Xavier AMEYE
RSM Paris
Étienne de BRYAS
08General shareholders’ meeting
Statutory auditors’ reports on securities trading
296 REGISTRATION DOCUMENT 2018
STATUTORY AUDITORS’ REPORT ON THE PLANNED AMENDMENTS 8.3.2
TO DELEGATION LIMITS FOR ISSUES OF SHARES AND MARKETABLE SECURITIES
WITH RETENTION OF PREFERENTIAL SUBSCRIPTION RIGHTS (12TH RESOLUTION
Combined Shareholders’ Meeting of June 28, 2019
This is a translation into English of the statutory auditors’ report issued in French and it is provided solely for the convenience of English-speaking
users.
This report should be read in conjunction and construed in accordance with French law and professional auditing standards applicable in France.
To the NEOEN Shareholders’ Meeting,
As statutory auditors of your Company and pursuant to the engagement set forth in Articles L. 228-92 et seq. of the French Commercial Code
(Code de commerce), we hereby present our report on the planned amendments to Board of Directors’ delegation limits for various issues of shares
and/or marketable securities, transactions on which you are asked to vote.
On October 2, 2018, the Shareholders’ Meeting authorized the following delegations:
under its 5th resolution, the delegation of authority to the Board of Directors to decide an increase in the Company’s share capital via the issue of●shares and/or marketable securities granting access to capital immediately or in the future, with retention of preferential subscription rights,
under its 8th resolution, the authorization of the Board of Directors to issue shares and/or marketable securities granting access immediately or in●the future to shares to be issued by the Company in exchange for contributions in kind comprising shares or marketable securities granting
access to share capital.
We presented a report on the aforementioned transactions to this Shareholders’ Meeting. It is now proposed that the Shareholders’ Meeting amend
the Board of Directors’ delegations regarding the maximum par value amount of share capital increases that may be carried out:
the nominal amount of debt securities that may be issued, immediately or in the future, pursuant to the 5th and 8th resolutions of the Combined●Shareholders’ Meeting of October 2, 2018, is set at €200 million or its equivalent in any other currency or monetary unit established by reference
to several currencies on the issue date;
any redemption premium above par shall be added to this amount, where applicable;●
this amount is separate from the amount of debt securities whose issue may result from the use of other resolutions submitted to this●Shareholders’ Meeting, as well as those of the Combined Shareholders’ Meeting of October 2, 2018, and debt securities whose issue would be
decided or authorized by the Board of Directors in accordance with Articles L. 228-36-A, L. 228-40, L. 228-92 section 3, L.228-93 section 6 and
L. 228-94 section 3 of the French Commercial Code.
It is the responsibility of the Board of Directors to prepare a report in accordance with Articles R. 225-113 et seq. of the French Commercial Code.
Our role is to express an opinion on the planned amendments to the Board of Directors’ delegation limits for various issues of shares and/or
marketable securities.
We performed the procedures that we considered necessary with regard to the professional guidelines of the French National Institute of Statutory
Auditors (Compagnie Nationale des Commissaires aux Comptes) applicable to this engagement. These procedures consisted in verifying the
content of the Board of Directors’ report on the planned amendments to the Board of Directors’ delegation limits for various issues of shares and/or
marketable securities.
We have no comments to make on the planned amendments to the Board of Directors’ delegations for various issues of shares and/or marketable
securities.
Paris-La Défense and Paris, May 15, 2019
The Statutory Auditors
DELOITTE & ASSOCIÉS
François Xavier AMEYE
RSM Paris
Étienne de BRYAS
08General shareholders’ meeting
Statutory auditors’ reports on securities trading
297REGISTRATION DOCUMENT 2018
STATUTORY AUDITORS’ REPORT ON THE ISSUE OF SHARES 8.3.3
AND/OR MARKETABLE SECURITIES WITH CANCELLATION OF PREFERENTIAL
SUBSCRIPTION RIGHTS, RESERVED FOR MEMBERS OF COMPANY SAVINGS
PLANS (13TH RESOLUTION)
Combined Shareholders’ Meeting of June 28, 2019
This is a translation into English of the statutory auditors’ report issued in French and it is provided solely for the convenience of English-speaking
users.
This report should be read in conjunction and construed in accordance with French law and professional auditing standards applicable in France.
To the NEOEN Shareholders’ Meeting,
As statutory auditors of your Company and pursuant to the engagement set forth in Articles L. 228-92 and L. 225-135 et seq. of the French
Commercial Code (Code de commerce), we hereby present our report on the proposed delegation of authority to the Board of Directors to decide
the issue of (i) Company shares (excluding preferred shares) and/or (ii) marketable securities governed by Article L. 228-92 section 1 or Article L.
228-94 section 2 of the French Commercial Code granting access, immediately or in the future, to the Company’s share capital (including shares
conferring entitlement to the allocation of debt securities), with cancellation of preferential subscription rights, reserved for members of one or more
company saving plans (or any other plan for whose members a share capital increase may be reserved on equivalent terms pursuant to Articles L.
3332-1 et seq. of the French Labor Code (Code du travail) or any similar law or regulation) set up within a French or non-French company or group
of companies included in the consolidation or combination scope of the Company’s financial statements in accordance with Article L. 3344-1 of the
French Labor Code, a transaction on which you are asked to vote.
The total par value amount of the issue likely to be carried out, immediately or in the future under this delegation, is set at 1% of the share capital as
of the date of the Board of Directors’ decision. It is specified that this amount shall be deducted from the overall limit set forth in paragraph 2 of the
5th resolution of the Combined Shareholders’ Meeting of October 2, 2018, as reiterated in the 11th resolution of this Shareholders’ Meeting, or where
applicable, the overall limit that may be set forth in a resolution of the same type that may supersede this resolution during the validity of this
delegation.
Shareholders are asked to approve this issue pursuant to Article L. 225-129-6 section 2 of the French Commercial Code and Articles L. 3332-18 et
seq. of the French Labor Code.
Based on its report, the Board of Directors asks that you delegate to it, for a period of 26 months, the authority to decide an issue and cancel your
preferential subscription rights to the ordinary shares or marketable securities to be issued. When appropriate, it will set the final terms and
conditions of this transaction.
It is the responsibility of the Board of Directors to prepare a report in accordance with Articles R. 225-113 et seq. of the French Commercial Code.
Our role is to express an opinion on the fair presentation of the quantified information extracted from the accounts, on the proposed cancellation of
preferential subscription rights and on certain other information concerning the issue, contained in this report.
We performed the procedures that we considered necessary with regard to the professional guidelines of the French National Institute of Statutory
Auditors (Compagnie Nationale des Commissaires aux Comptes) applicable to this engagement. These procedures consisted in verifying the
content of the Board of Directors’ report on this transaction and the process for determining the issue price of the future securities.
Subject to a subsequent review of the terms and conditions of the proposed issue, we have no comments to make on the process for determining
the issue price of the future securities presented in the Board of Directors’ report.
As the final terms and conditions of the issue have not been determined, we do not express an opinion thereon and, as such, on the proposed
cancellation of preferential subscription rights.
In accordance with Article R. 225-116 of the French Commercial Code, we will issue a supplementary report, if necessary, should this delegation be
used by your Board of Directors.
Paris-La Défense and Paris, May 15, 2019
The Statutory Auditors
DELOITTE & ASSOCIÉS
François Xavier AMEYE
RSM Paris
Étienne de BRYAS
08General shareholders’ meeting
Statutory auditors’ reports on securities trading
298 REGISTRATION DOCUMENT 2018
STATUTORY AUDITORS’ REPORT ON THE ISSUE OF SHARES 8.3.4
AND/OR MARKETABLE SECURITIES WITH CANCELLATION OF PREFERENTIAL
SUBSCRIPTION RIGHTS (14TH RESOLUTION)
Combined Shareholders’ Meeting of June 28, 2019
This is a translation into English of the statutory auditors’ report issued in French and it is provided solely for the convenience of English-speaking
users.
This report should be read in conjunction and construed in accordance with French law and professional auditing standards applicable in France.
To the NEOEN Shareholders’ Meeting,
As statutory auditors of your Company and pursuant to the engagement set forth in Articles L. 228-92 and L. 225-135 et seq. of the French
Commercial Code (Code de commerce), we hereby present our report on the proposed delegation of authority to the Board of Directors to decide
the issue of (i) Company shares (excluding preferred shares) and/or (ii) marketable securities governed by Article L. 228-92 section 1, Article
L.228-93 sections 1 and 3 or Article L. 228-94 section 2 of the French Commercial Code granting access, immediately or in the future, to the
Company’s share capital (including shares conferring entitlement to the allocation of debt securities), with cancellation of preferential subscription
rights, on one or more occasions, reserved for the following category of beneficiaries: (i) Non-French Employees, (ii) investment funds or other
entities, either corporate bodies or natural persons, with employee shareholdings in the Company and whose shareholders will comprise
Non-French Employees, and/or (iii) any banking institution or entity controlled by such an institution within the meaning of Article L. 233-3 of the
French Commercial Code acting at the Company’s request to set up a structured offering to Non-French Employees, a transaction on which you
are asked to vote.
The total par value amount of share capital increases likely to be carried out, immediately or in the future, under this delegation, is set at 1% of the
share capital as of the date of the Board of Directors’ decision, it being specified that this amount shall be deducted from the overall limit set forth in
paragraph 2 of the 5th resolution of the Combined Shareholders’ Meeting of October 2, 2018, as reiterated in the 11th resolution of this
Shareholders’ Meeting, or where applicable, the overall limit that may be set forth in a resolution of the same type that may supersede this resolution
during the validity of this delegation.
Based on its report, the Board of Directors asks that you delegate to it, for a period of 18 months, the authority to decide an issue and cancel your
preferential subscription rights to the ordinary shares or marketable securities to be issued. When appropriate, it will set the final terms and
conditions of this transaction.
It is the responsibility of the Board of Directors to prepare a report in accordance with Articles R. 225-113 et seq. of the French Commercial Code.
Our role is to express an opinion on the fair presentation of the quantified information extracted from the accounts, on the proposed cancellation of
preferential subscription rights and on certain other information concerning the issue, contained in this report.
We performed the procedures that we considered necessary with regard to the professional guidelines of the French National Institute of Statutory
Auditors (Compagnie Nationale des Commissaires aux Comptes) applicable to this engagement. These procedures consisted in verifying the
content of the Board of Directors’ report on this transaction and the process for determining the issue price of the future securities.
Subject to a subsequent review of the terms and conditions of the proposed issue, we have no comments to make on the process for determining
the issue price of the future securities presented in the Board of Directors’ report.
As the final terms and conditions of the issue have not been determined, we do not express an opinion thereon and, as such, on the proposed
cancellation of preferential subscription rights.
In accordance with Article R. 225-116 of the French Commercial Code, we will issue a supplementary report, if necessary, should this delegation be
used by your Board of Directors.
Paris-La Défense and Paris, May 15, 2019
The Statutory Auditors
DELOITTE & ASSOCIÉS
François Xavier AMEYE
RSM Paris
Étienne de BRYAS
08General shareholders’ meeting
Statutory auditors’ reports on securities trading
299REGISTRATION DOCUMENT 2018
STATUTORY AUDITORS’ REPORT ON THE SHARE CAPITAL DECREASE 8.3.5
(15TH RESOLUTION )
Combined Shareholders’ Meeting of June 28, 2019
This is a translation into English of the statutory auditors’ report issued in French and it is provided solely for the convenience of English-speaking
users.
This report should be read in conjunction and construed in accordance with French law and professional auditing standards applicable in France.
To the NEOEN Shareholders’ Meeting,
As statutory auditors of your Company and pursuant to the engagement set forth in Article L. 225-209 of the French Commercial Code (Code de
commerce) concerning share capital decreases by cancellation of shares purchased, we hereby present our report on our assessment of the
reasons for and terms and conditions of the proposed share capital decrease.
Shareholders are requested to confer all necessary powers on the Board of Directors, during a period of 26 months commencing the date of this
Shareholders’ Meeting, to cancel, up to a maximum of 10% of its share capital during the 24-month period prior to the cancellation, shares
purchased by the Company pursuant to the authorization to purchase its own shares, as part of the provisions of the aforementioned article.
We performed the procedures that we considered necessary with regard to the professional guidelines of the French National Institute of Statutory
Auditors (Compagnie Nationale des Commissaires aux Comptes) applicable to this engagement. These procedures consisted in verifying the
fairness of the reasons for and the terms and conditions of the proposed share capital decrease, which does not undermine shareholder equality.
We have no comments on the reasons for and the terms and conditions of the proposed share capital decrease.
Paris-La Défense and Paris, May 15, 2019
The Statutory Auditors
DELOITTE & ASSOCIÉS
François Xavier AMEYE
RSM Paris
Étienne de BRYAS
08General shareholders’ meeting
Statutory auditors’ special report on regulated agreements and commitments
300 REGISTRATION DOCUMENT 2018
STATUTORY AUDITORS’ SPECIAL REPORT ON REGULATED 8.4
AGREEMENTS AND COMMITMENTS
We performed the work that we deemed necessary in accordance with professional guidance issued by the French institute of statutory auditors
(Compagnie Nationale des commissaires aux comptes) for this type of engagement:
payment of the severance pay will be subject to the condition that the sum of the Group’s net income for the past two years ended, preceding his●revocation or, as the case may be, expiry of his term of office not renewed, be positive;
the Company reserves the right to withdraw the remuneration relating to this non-competition clause;●
it is specified that the payment of the non-competition remuneration is excluded as soon as the corporate officer retires. In all cases, no●remuneration shall be paid beyond the age of 65 years.
This is a free translation into English of the statutory auditors’ special report on regulated agreements and commitments issued in the French
language and is provided solely for the convenience of English speaking readers. This report on regulated agreements and commitments should be
read in conjunction with, and construed in accordance with, French law and professional auditing standards applicable in France. It should be
understood that the agreements and commitments reported on are only those provided by the French Commercial Code and that the report does
not apply to those related party transactions described in IAS 24 or other equivalent accounting standards.
Shareholders’ Meeting held to approve the financial statements for the year ended December 31, 2018
To the NEOEN shareholders’ meeting,
In our capacity as statutory auditors of your Company, we hereby report to you on regulated agreements and commitments.
The terms of our engagement require us to communicate to you, based on information provided to us, the principal terms and conditions of those
agreements and commitments brought to our attention or which we may have discovered during the course of our audit, as well as the reasons justifying
that such commitments and agreements are in the Company’s interest, without expressing an opinion on their usefulness and appropriateness or
identifying such other agreements, if any. It is your responsibility, pursuant to Article R. 225-31 of the French Commercial Code (Code de commerce), to
assess the interest involved in respect of the conclusion of these agreements and commitments for the purpose of approving them.
Our role is also to provide you with the information stipulated in Article R. 225-31 of the French Commercial Code relating to the implementation
during the past year of agreements and commitments previously approved by the annual general meeting, if any.
We performed the procedures that we considered necessary with regard to the professional guidelines of the French National Institute of statutory
auditors (Compagnie Nationale des commissaires aux comptes) applicable to this engagement. These procedures consisted in agreeing the
information provided to us with the relevant source documents.
AGREEMENTS AND COMMITMENTS SUBMITTED FOR APPROVAL
TO THE SHAREHOLDERS’ MEETING
AGREEMENTS AND COMMITMENTS AUTHORIZED AND CONCLUDED DURING THE YEAR
Pursuant to Article R. 225-40 of the French Commercial Code, we have been informed that the following agreements and commitments were
previously authorized by your Board of Directors.
Underwriting Agreement.
Persons concerned
Impala SAS, FPCI Capenergie II, represented by its management company Omnes Capital, and FPCI Fonds ETI 2020, represented by its
management company Bpifrance Investissement (the “transferring shareholders”).
Nature and purpose
Underwriting Agreement between Neoen S.A. (the “Company”) and the transferring shareholders, on the one hand, and JP Morgan Securities plc●and Natixis as Overall Coordinators, Barclays PLC and Société Générale as Related Bookrunners, and Carnegie AS as Related Lead Arranger
(the “Underwriting Institutions”), on the other hand, signed on October 16, 2018.
Terms and conditions
The signing of this underwriting agreement was previously authorized by the Board of Directors on October 16, 2018.●
Under this agreement, the Underwriting Institutions, not acting severally between them, each pledged, for a maximum number of shares offered●as part of the Company’s IPO, to have purchased and paid, subscribed and freed up, or where necessary, purchase and pay, subscribe and free
up themselves, the shares offered at the offer price on the settlement-delivery date.
The commitments undertaken by the Underwriting Institutions were subject to standard conditions precedent.●
08General shareholders’ meeting
Statutory auditors’ special report on regulated agreements and commitments
301REGISTRATION DOCUMENT 2018
The underwriting agreement provides that the contracting financial institutions be compensated with the fees stipulated therein.●
The total number of Neoen shares offered as part of its IPO following the exercise of the greenshoe option totaled 42,249,457, i.e. 27,272,727●new shares and 14,976,730 existing shares, bringing the size of the offering to around €697 million.
Reasons justifying that the agreement is in the Company’s interest
The underwriting agreement falls within the context of the Company’s IPO and is an inseparable component in accordance with market practices.●Considering the benefits for the Company expected from the IPO, the Board considers that the underwriting agreement complied with the
Company’s corporate interest.
AGREEMENTS AND COMMITMENTS PREVIOUSLY APPROVED BY THE SHAREHOLDERS’
MEETING
AGREEMENTS AND COMMITMENTS APPROVED DURING THE YEAR
We have been informed that the following agreements and commitments, previously approved by the shareholders’ meeting of October 2, 2018
based on the statutory auditors’ special report of September 17, 2018, had continuing effect during the year.
Commitments regarding a severance payment and non-compete remuneration for the Chairman and CEO, subject to the admission of the
Company’s shares for trading on the Euronext Paris regulated market.
Person concerned
Mr. Xavier Barbaro, Chairman and CEO.
Terms and conditions of the commitment
In the event of the termination (except for gross or willful misconduct) or non-renewal of his term of office, the CEO will receive a severance pay (V●“Severance”) equivalent to six (6) months’ salary (the “Salary”), one month’s salary being defined as the sum of (i) the average fixed monthly salaries
paid over the twelve months preceding the end of the term of office and (ii) the monthly average of the last two variable salary amounts paid.
The payment of the severance will be subject to the condition precedent that the Group’s total net income for the last two years, preceding his●termination or, depending on the case, the expiry of his non-renewed term of office, is positive.
In the event that he ceases his duties under his term of office, the CEO undertakes not to conduct, on French territory, under whatever capacity,●an activity that competes with that of the Company, and not to take interest directly or indirectly in any activities that could compete with the
Company’s activities during a period of twelve (12) months as from the termination of said duties.
In consideration for this non-compete undertaking, the CEO will receive during the twelve (12) months following the cessation of his term of office●a monthly financial sum equal to 70% of the salary received during the twelve (12) months preceding the date of termination of his duties within
the Company. The Company reserves the right to waive the benefits of this non-compete clause.
It should be noted that the payment of this non-compete remuneration will be removed once the CEO retires. In any case, no remuneration can●be paid over the age of 65.
Paris-la Défense and Paris, April 17, 2019
The statutory auditors
DELOITTE & ASSOCIÉS
François Xavier AMEYE
RSM Paris
Étienne de BRYAS
302 REGISTRATION DOCUMENT 2018
09
303REGISTRATION DOCUMENT 2018
ADDITIONAL INFORMATION
PERSONS RESPONSIBLE9.1 304
Name and job title of the person 9.1.1
responsible for the Registration
Document 304
Declaration by the person 9.1.2
responsible for the Registration
Document 304
Name and job title of the person 9.1.3
responsible for the Financial
information 304
STATUTORY AUDITORS9.2 304
Principal statutory auditors9.2.1 304
9.2.2 Alternate statutory auditor 304
HISTORICAL FINANCIAL 9.3
INFORMATION INCLUDED
BY REFERENCE 305
DOCUMENTS AVAILABLE 9.4
TO THE PUBLIC 305
DETAILS OF THE PROJECTS9.5 306
Solar9.5.1 306
Wind9.5.2 314
Storage9.5.3 316
CROSS-REFERENCE TABLES9.6 318
Cross-reference table WITH EC 9.6.1
REGULATION NO. 809/2004 318
Cross-reference table for the annual 9.6.2
financial report 320
Cross-reference table 9.6.3
for the management report 320
GLOSSARY9.7 322
09Additional information
Persons responsible
304 REGISTRATION DOCUMENT 2018
PERSONS RESPONSIBLE9.1
NAME AND JOB TITLE OF THE PERSON RESPONSIBLE FOR THE REGISTRATION 9.1.1
DOCUMENT
Xavier Barbaro, Chairman and Chief Executive Officer of Neoen.
DECLARATION BY THE PERSON RESPONSIBLE FOR THE REGISTRATION 9.1.2
DOCUMENT
“I hereby declare, having taken all reasonable measures for this purpose, that the information contained in this Registration Document is, to the best
of my knowledge, true and accurate, and does not contain any omission likely to affect its scope or significance.
I have obtained a completion letter from the statutory auditors in which they state that they have audited the information relating to the financial
position and the financial statements included in this Registration Document, and that they have read this Registration Document in its entirety”.
5 June 2019
Xavier Barbaro
Chairman and Chief Executive Officer of Neoen
NAME AND JOB TITLE OF THE PERSON RESPONSIBLE FOR THE FINANCIAL 9.1.3
INFORMATION
Xavier Barbaro
Chairman and Chief Executive Officer of Neoen
6 rue Ménars – 75002 Paris
Tel. +33 1 70 91 61 50
STATUTORY AUDITORS9.2
PRINCIPAL STATUTORY AUDITORS9.2.1
DELOITTE & ASSOCIÉS
Represented by Mr. François-Xavier Ameye
Tour Majunga, 6 Place de la Pyramide,
92908 Paris-la-Défense Cedex
Deloitte & Associés was appointed by decision of the general
shareholders’ meeting of April 15, 2014 for a term of six financial years,
i.e. until the end of the general shareholders’ meeting called to approve
financial statements for the financial year ending December 31, 2019.
Deloitte & Associés is a member of the Paris Regional Institute of
statutory auditors (Compagnie Régionale des Commissaires aux
Comptes de Paris).
In accordance with applicable law, the Company’s general
shareholders’ meeting of September 12, 2018 resolved to appoint a
second principal statutory auditor for a term of six financial years, i.e.
until the end of the general shareholders’ meeting called to approve
the financial statements for the financial year ending December 31,
2023:
RSM PARIS
Represented by Mr. Étienne de Bryas,
26 rue Cambacérès,
75008 Paris
RSM Paris is a member of the Paris Regional Institute of statutory auditors
(Compagnie Régionale des Commissaires aux Comptes de Paris).
9.2.2 ALTERNATE STATUTORY AUDITOR
BEAS
Represented by Mr. Jean-Paul Seguret
Tour Majunga, 6 Place de la Pyramide
92908 Paris-la-Défense Cedex
BEAS was appointed as statutory auditor by decision of the general
shareholders’ meeting of April 2014 for a term of six financial years, i.e.
until the end of the general shareholders’ meeting called to approve the
financial statements for the financial year ending December 31, 2019.
BEAS is a member of the Compagnie Régionale des Commissaires
aux Comptes de Versailles (Versailles Regional Association of
statutory auditors).
09Additional information
Historical financial information included by reference
305REGISTRATION DOCUMENT 2018
HISTORICAL FINANCIAL INFORMATION INCLUDED BY REFERENCE9.3
In accordance with Article 28 of EC Regulation no. 809/2004 of accordance with IFRS, and the statutory auditor’s report presented in
April 29, 2004, this 2018 Registration Document includes by Appendix II and Appendix III respectively to the Registration
reference the consolidated financial statements for the financial years Document, as filed by the Autorité des Marchés Financiers on
ended December 31, 2016 and December 31, 2017 established in September 18, 2018 under number I. 18-065.
DOCUMENTS AVAILABLE TO THE PUBLIC9.4
Copies of this Registration Document are available free of charge at
Company’s registered office (6 rue Ménars – 75002 Paris). This
Registration Document may also be consulted on the Company’s
website (www.neoen.com) and on the website of French Financial
Markets Authority (Autorité des Marchés Financiers – AMF)
(www.amf-france.org).
During the validity period of this Registration Document, the following
documents (or a copy of these documents) may be consulted at the
Company’s registered office:
the Company’s bylaws;●
Company, part of which is included or referred to in this
Registration Document; and
all the minutes of general shareholders’ meetings, reports, letters●and other documents, historical financial information, valuations
and statements prepared by experts at the request of the
hictorical financial information contained in this Registration●Document.
All of these legal and financial documents relating to the Company
which must be made available to shareholders in accordance with the
regulations in force may be consulted at the Company’s registered
office.
Since the Company’s shares were listed on the regulated market of
Euronext Paris, regulated information within the meaning of the
provisions of the AMF General Regulation is also available on the
Company’s website.
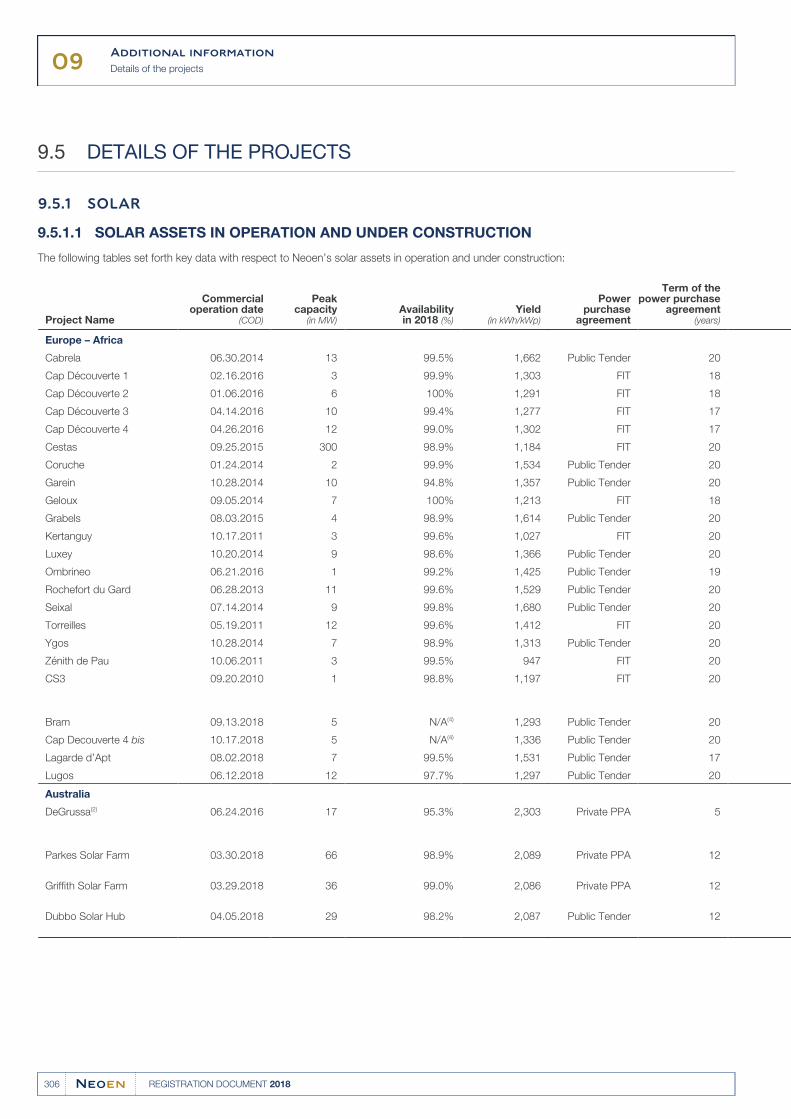
09Additional information
Details of the projects
306 REGISTRATION DOCUMENT 2018
DETAILS OF THE PROJECTS9.5
SOLAR9.5.1
SOLAR ASSETS IN OPERATION AND UNDER CONSTRUCTION9.5.1.1
The following tables set forth key data with respect to Neoen’s solar assets in operation and under construction:
Project Name
Commercialoperation date
(COD)
Peakcapacity
(in MW)Availabilityin 2018 (%)
Yield(in kWh/kWp)
Powerpurchase
agreement
Term of thepower purchase
agreement(years)
Europe – Africa
Cabrela 06.30.2014 13 99.5% 1,662 Public Tender 20
Cap Découverte 1 02.16.2016 3 99.9% 1,303 FIT 18
Cap Découverte 2 01.06.2016 6 100% 1,291 FIT 18
Cap Découverte 3 04.14.2016 10 99.4% 1,277 FIT 17
Cap Découverte 4 04.26.2016 12 99.0% 1,302 FIT 17
Cestas 09.25.2015 300 98.9% 1,184 FIT 20
Coruche 01.24.2014 2 99.9% 1,534 Public Tender 20
Garein 10.28.2014 10 94.8% 1,357 Public Tender 20
Geloux 09.05.2014 7 100% 1,213 FIT 18
Grabels 08.03.2015 4 98.9% 1,614 Public Tender 20
Kertanguy 10.17.2011 3 99.6% 1,027 FIT 20
Luxey 10.20.2014 9 98.6% 1,366 Public Tender 20
Ombrineo 06.21.2016 1 99.2% 1,425 Public Tender 19
Rochefort du Gard 06.28.2013 11 99.6% 1,529 Public Tender 20
Seixal 07.14.2014 9 99.8% 1,680 Public Tender 20
Torreilles 05.19.2011 12 99.6% 1,412 FIT 20
Ygos 10.28.2014 7 98.9% 1,313 Public Tender 20
Zénith de Pau 10.06.2011 3 99.5% 947 FIT 20
CS3 09.20.2010 1 98.8% 1,197 FIT 20
Bram 09.13.2018 5 N/A(4) 1,293 Public Tender 20
Cap Decouverte 4 bis 10.17.2018 5 N/A(4) 1,336 Public Tender 20
Lagarde d’Apt 08.02.2018 7 99.5% 1,531 Public Tender 17
Lugos 06.12.2018 12 97.7% 1,297 Public Tender 20
Australia
DeGrussa(2) 06.24.2016 17 95.3% 2,303 Private PPA 5
Parkes Solar Farm 03.30.2018 66 98.9% 2,089 Private PPA 12
Griffith Solar Farm 03.29.2018 36 99.0% 2,086 Private PPA 12
Dubbo Solar Hub 04.05.2018 29 98.2% 2,087 Public Tender 12
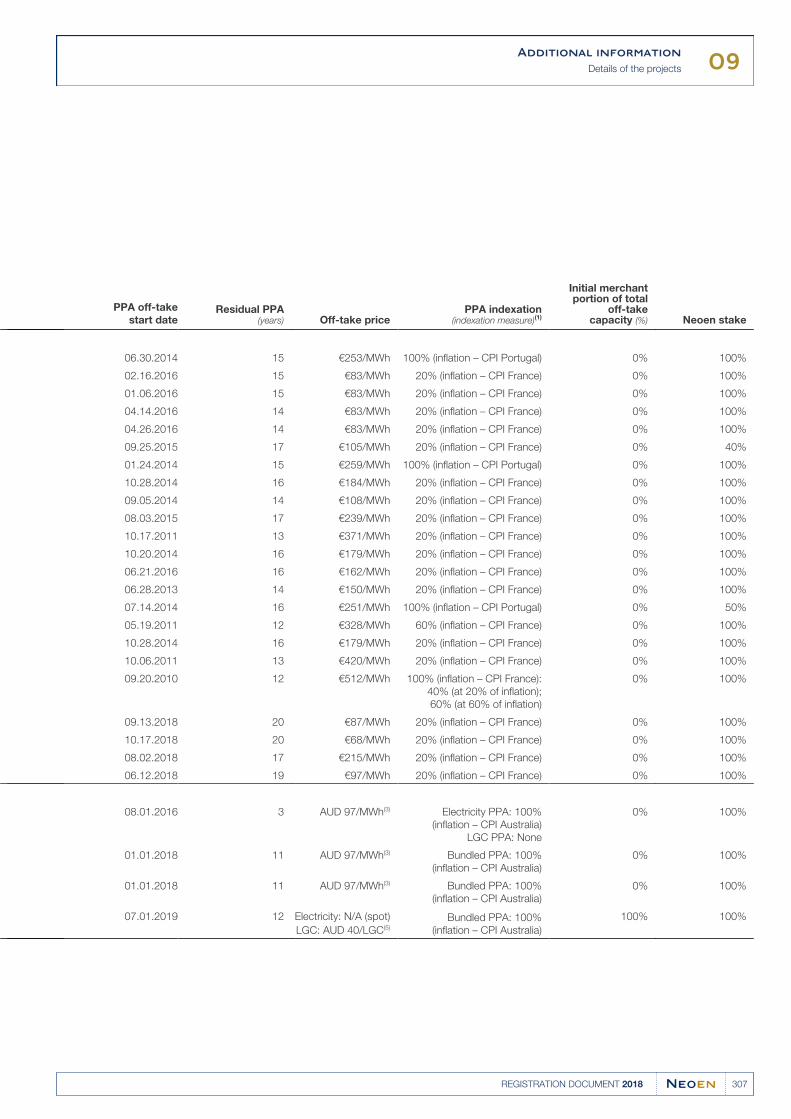
09Additional information
Details of the projects
307REGISTRATION DOCUMENT 2018
PPA off-take
start dateResidual PPA
(years) Off-take pricePPA indexation
(indexation measure)(1)
Initial merchantportion of total
off-takecapacity (%) Neoen stake
06.30.2014 15 €253/MWh 100% (inflation – CPI Portugal) 0% 100%
02.16.2016 15 €83/MWh 20% (inflation – CPI France) 0% 100%
01.06.2016 15 €83/MWh 20% (inflation – CPI France) 0% 100%
04.14.2016 14 €83/MWh 20% (inflation – CPI France) 0% 100%
04.26.2016 14 €83/MWh 20% (inflation – CPI France) 0% 100%
09.25.2015 17 €105/MWh 20% (inflation – CPI France) 0% 40%
01.24.2014 15 €259/MWh 100% (inflation – CPI Portugal) 0% 100%
10.28.2014 16 €184/MWh 20% (inflation – CPI France) 0% 100%
09.05.2014 14 €108/MWh 20% (inflation – CPI France) 0% 100%
08.03.2015 17 €239/MWh 20% (inflation – CPI France) 0% 100%
10.17.2011 13 €371/MWh 20% (inflation – CPI France) 0% 100%
10.20.2014 16 €179/MWh 20% (inflation – CPI France) 0% 100%
06.21.2016 16 €162/MWh 20% (inflation – CPI France) 0% 100%
06.28.2013 14 €150/MWh 20% (inflation – CPI France) 0% 100%
07.14.2014 16 €251/MWh 100% (inflation – CPI Portugal) 0% 50%
05.19.2011 12 €328/MWh 60% (inflation – CPI France) 0% 100%
10.28.2014 16 €179/MWh 20% (inflation – CPI France) 0% 100%
10.06.2011 13 €420/MWh 20% (inflation – CPI France) 0% 100%
09.20.2010 12 €512/MWh 100% (inflation – CPI France):
40% (at 20% of inflation);
60% (at 60% of inflation)
0% 100%
09.13.2018 20 €87/MWh 20% (inflation – CPI France) 0% 100%
10.17.2018 20 €68/MWh 20% (inflation – CPI France) 0% 100%
08.02.2018 17 €215/MWh 20% (inflation – CPI France) 0% 100%
06.12.2018 19 €97/MWh 20% (inflation – CPI France) 0% 100%
08.01.2016 3 AUD 97/MWh(3) Electricity PPA: 100%
(inflation – CPI Australia)
LGC PPA: None
0% 100%
01.01.2018 11 AUD 97/MWh(3) Bundled PPA: 100%
(inflation – CPI Australia)
0% 100%
01.01.2018 11 AUD 97/MWh(3) Bundled PPA: 100%
(inflation – CPI Australia)
0% 100%
07.01.2019 12 Electricity: N/A (spot)
LGC: AUD 40/LGC(5)
Bundled PPA: 100%
(inflation – CPI Australia)
100% 100%
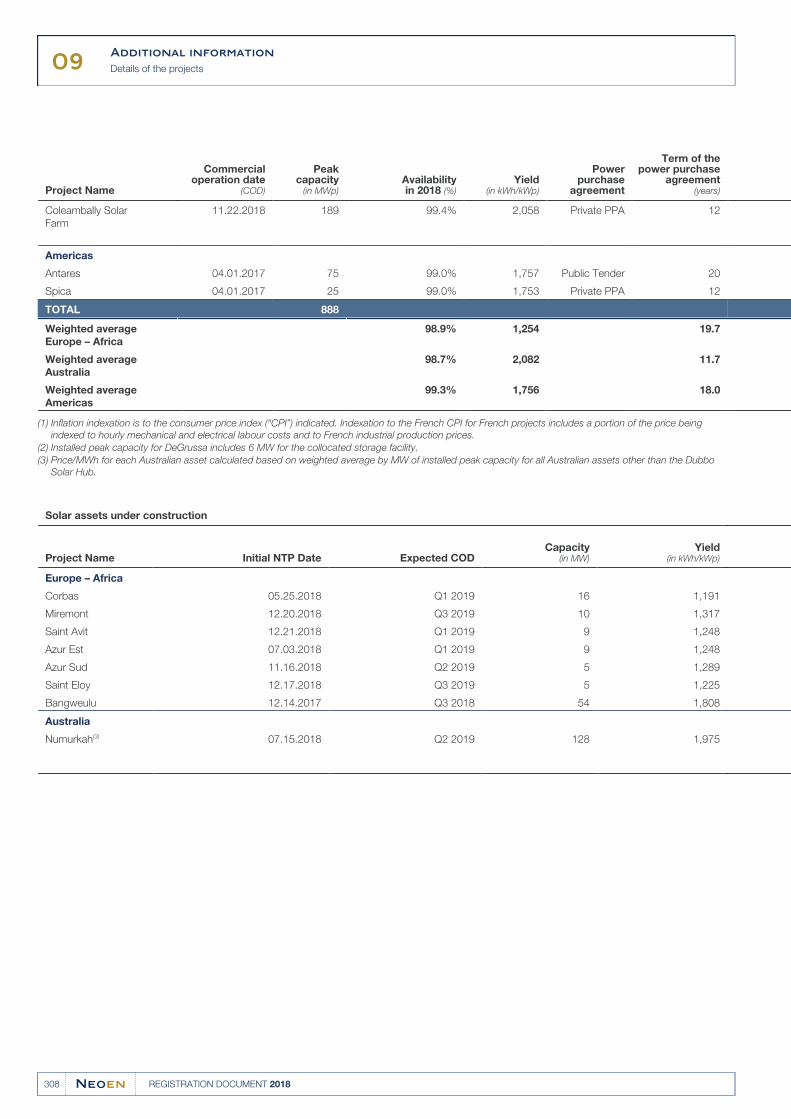
09Additional information
Details of the projects
308 REGISTRATION DOCUMENT 2018
Project Name
Commercialoperation date
(COD)
Peakcapacity
(in MWp)Availabilityin 2018 (%)
Yield(in kWh/kWp)
Powerpurchase
agreement
Term of thepower purchase
agreement(years)
Coleambally Solar
Farm
11.22.2018 189 99.4% 2,058 Private PPA 12
Americas
Antares 04.01.2017 75 99.0% 1,757 Public Tender 20
Spica 04.01.2017 25 99.0% 1,753 Private PPA 12
TOTAL 888
Weighted average
Europe – Africa
98.9% 1,254 19.7
Weighted average
Australia
98.7% 2,082 11.7
Weighted average
Americas
99.3% 1,756 18.0
Inflation indexation is to the consumer price index (“CPI”) indicated. Indexation to the French CPI for French projects includes a portion of the price being (1)
indexed to hourly mechanical and electrical labour costs and to French industrial production prices.
Installed peak capacity for DeGrussa includes 6 MW for the collocated storage facility.(2)
Price/MWh for each Australian asset calculated based on weighted average by MW of installed peak capacity for all Australian assets other than the Dubbo (3)
Solar Hub.
Solar assets under construction
Project Name Initial NTP Date Expected CODCapacity
(in MW)Yield
(in kWh/kWp)
Europe – Africa
Corbas 05.25.2018 Q1 2019 16 1,191
Miremont 12.20.2018 Q3 2019 10 1,317
Saint Avit 12.21.2018 Q1 2019 9 1,248
Azur Est 07.03.2018 Q1 2019 9 1,248
Azur Sud 11.16.2018 Q2 2019 5 1,289
Saint Eloy 12.17.2018 Q3 2019 5 1,225
Bangweulu 12.14.2017 Q3 2018 54 1,808
Australia
Numurkah(3) 07.15.2018 Q2 2019 128 1,975
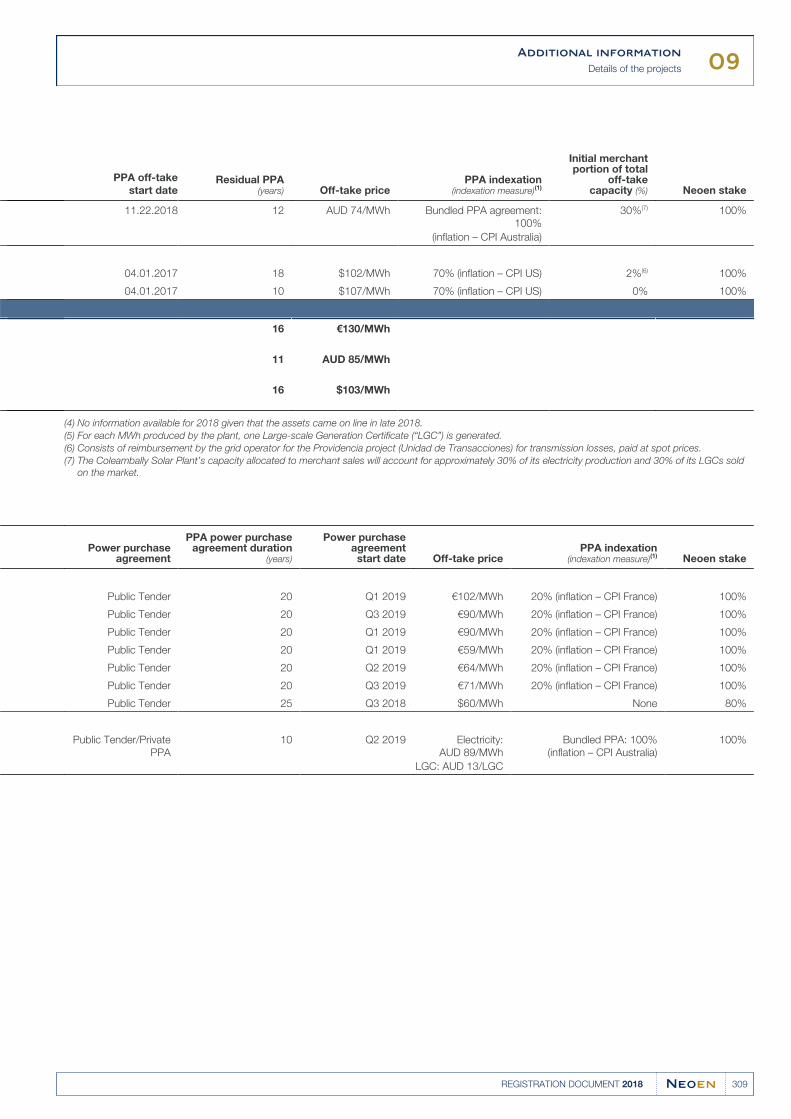
09Additional information
Details of the projects
309REGISTRATION DOCUMENT 2018
PPA off-take
start dateResidual PPA
(years) Off-take pricePPA indexation
(indexation measure)(1)
Initial merchantportion of total
off-takecapacity (%) Neoen stake
11.22.2018 12 AUD 74/MWh Bundled PPA agreement:
100%
(inflation – CPI Australia)
30%(7) 100%
04.01.2017 18 $102/MWh 70% (inflation – CPI US) 2%(6) 100%
04.01.2017 10 $107/MWh 70% (inflation – CPI US) 0% 100%
16 €130/MWh
11 AUD 85/MWh
16 $103/MWh
No information available for 2018 given that the assets came on line in late 2018.(4)
For each MWh produced by the plant, one Large-scale Generation Certificate (“LGC”) is generated.(5)
Consists of reimbursement by the grid operator for the Providencia project (Unidad de Transacciones) for transmission losses, paid at spot prices.(6)
The Coleambally Solar Plant’s capacity allocated to merchant sales will account for approximately 30% of its electricity production and 30% of its LGCs sold (7)
on the market.
Power purchase
agreement
PPA power purchaseagreement duration
(years)
Power purchaseagreementstart date Off-take price
PPA indexation(indexation measure)(1) Neoen stake
Public Tender 20 Q1 2019 €102/MWh 20% (inflation – CPI France) 100%
Public Tender 20 Q3 2019 €90/MWh 20% (inflation – CPI France) 100%
Public Tender 20 Q1 2019 €90/MWh 20% (inflation – CPI France) 100%
Public Tender 20 Q1 2019 €59/MWh 20% (inflation – CPI France) 100%
Public Tender 20 Q2 2019 €64/MWh 20% (inflation – CPI France) 100%
Public Tender 20 Q3 2019 €71/MWh 20% (inflation – CPI France) 100%
Public Tender 25 Q3 2018 $60/MWh None 80%
Public Tender/Private
PPA
10 Q2 2019 Electricity:
AUD 89/MWh
LGC: AUD 13/LGC
Bundled PPA: 100%
(inflation – CPI Australia)
100%
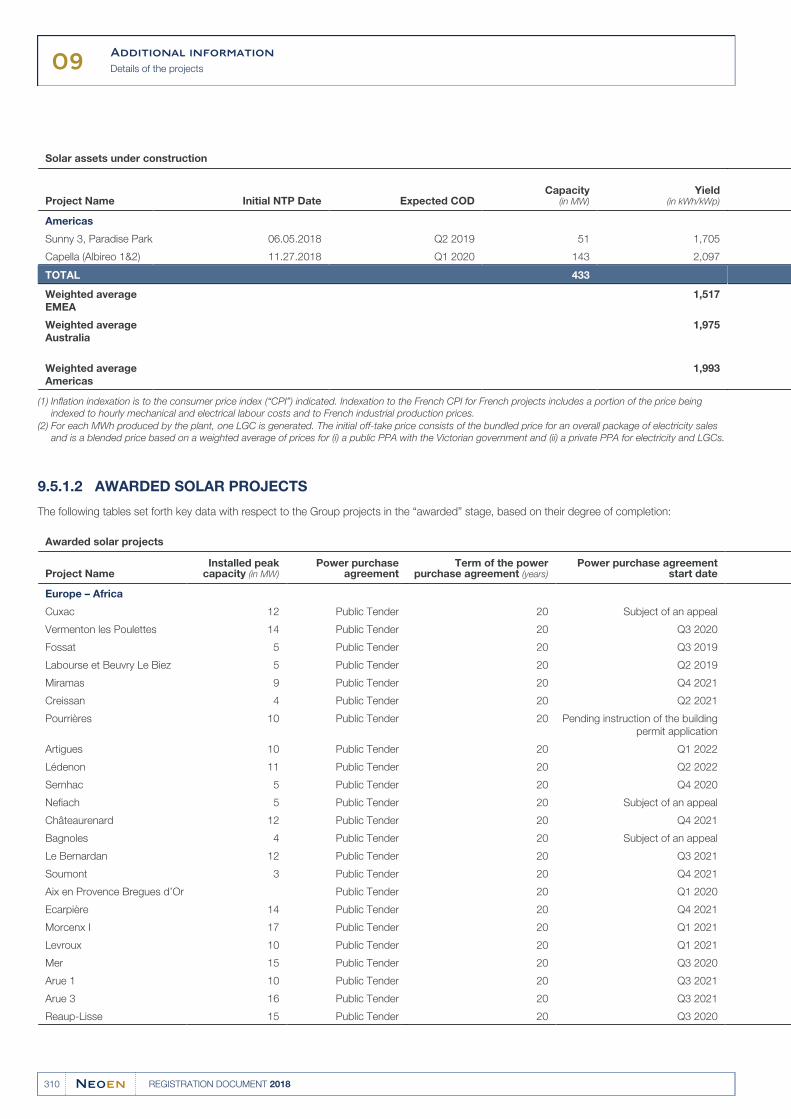
09Additional information
Details of the projects
310 REGISTRATION DOCUMENT 2018
Solar assets under construction
Project Name Initial NTP Date Expected CODCapacity
(in MW)Yield
(in kWh/kWp)
Americas
Sunny 3, Paradise Park 06.05.2018 Q2 2019 51 1,705
Capella (Albireo 1&2) 11.27.2018 Q1 2020 143 2,097
TOTAL 433
Weighted average
EMEA
1,517
Weighted average
Australia
1,975
Weighted average
Americas
1,993
Inflation indexation is to the consumer price index (“CPI”) indicated. Indexation to the French CPI for French projects includes a portion of the price being (1)
indexed to hourly mechanical and electrical labour costs and to French industrial production prices.
For each MWh produced by the plant, one LGC is generated. The initial off-take price consists of the bundled price for an overall package of electricity sales (2)
and is a blended price based on a weighted average of prices for (i) a public PPA with the Victorian government and (ii) a private PPA for electricity and LGCs.
AWARDED SOLAR PROJECTS9.5.1.2
The following tables set forth key data with respect to the Group projects in the “awarded” stage, based on their degree of completion:
Awarded solar projects
Project NameInstalled peak
capacity (in MW)Power purchase
agreementTerm of the power
purchase agreement (years)Power purchase agreement
start date
Europe – Africa
Cuxac 12 Public Tender 20 Subject of an appeal
Vermenton les Poulettes 14 Public Tender 20 Q3 2020
Fossat 5 Public Tender 20 Q3 2019
Labourse et Beuvry Le Biez 5 Public Tender 20 Q2 2019
Miramas 9 Public Tender 20 Q4 2021
Creissan 4 Public Tender 20 Q2 2021
Pourrières 10 Public Tender 20 Pending instruction of the building
permit application
Artigues 10 Public Tender 20 Q1 2022
Lédenon 11 Public Tender 20 Q2 2022
Sernhac 5 Public Tender 20 Q4 2020
Nefiach 5 Public Tender 20 Subject of an appeal
Châteaurenard 12 Public Tender 20 Q4 2021
Bagnoles 4 Public Tender 20 Subject of an appeal
Le Bernardan 12 Public Tender 20 Q3 2021
Soumont 3 Public Tender 20 Q4 2021
Aix en Provence Bregues d’Or Public Tender 20 Q1 2020
Ecarpière 14 Public Tender 20 Q4 2021
Morcenx I 17 Public Tender 20 Q1 2021
Levroux 10 Public Tender 20 Q1 2021
Mer 15 Public Tender 20 Q3 2020
Arue 1 10 Public Tender 20 Q3 2021
Arue 3 16 Public Tender 20 Q3 2021
Reaup-Lisse 15 Public Tender 20 Q3 2020
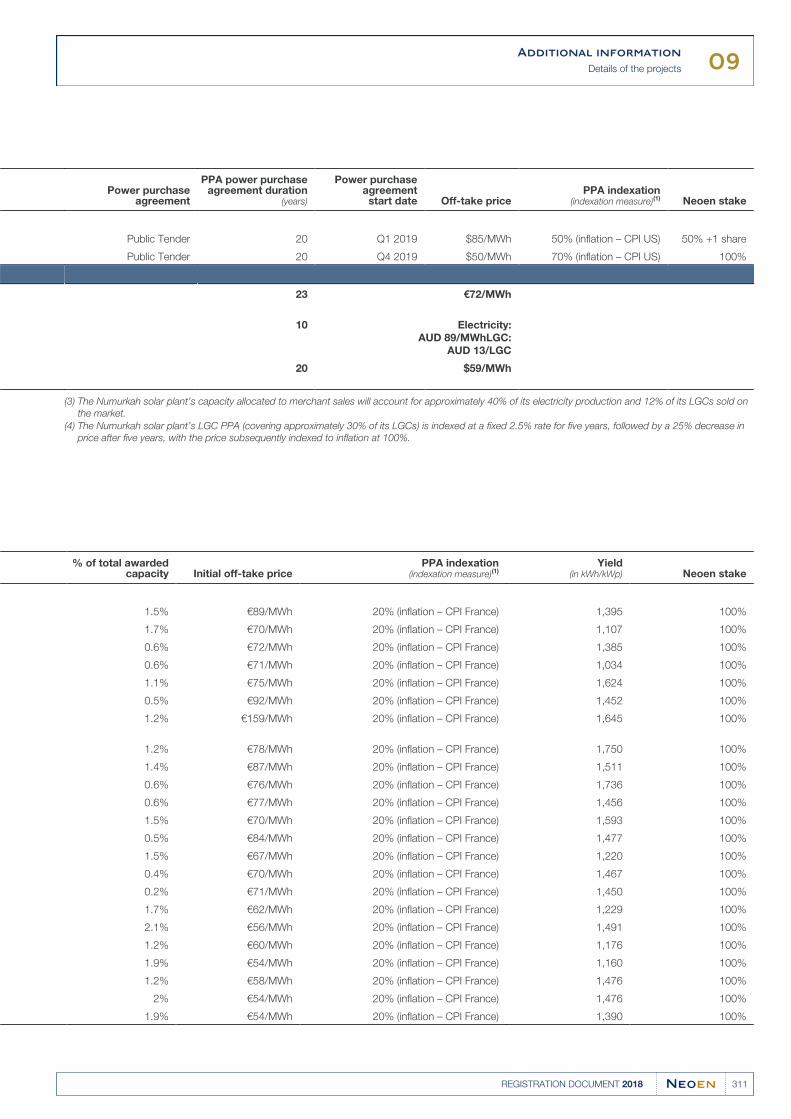
09Additional information
Details of the projects
311REGISTRATION DOCUMENT 2018
Power purchase
agreement
PPA power purchaseagreement duration
(years)
Power purchaseagreementstart date Off-take price
PPA indexation(indexation measure)(1) Neoen stake
Public Tender 20 Q1 2019 $85/MWh 50% (inflation – CPI US) 50% +1 share
Public Tender 20 Q4 2019 $50/MWh 70% (inflation – CPI US) 100%
23 €72/MWh
10 Electricity:
AUD 89/MWhLGC:
AUD 13/LGC
20 $59/MWh
The Numurkah solar plant’s capacity allocated to merchant sales will account for approximately 40% of its electricity production and 12% of its LGCs sold on (3)
the market.
The Numurkah solar plant’s LGC PPA (covering approximately 30% of its LGCs) is indexed at a fixed 2.5% rate for five years, followed by a 25% decrease in (4)
price after five years, with the price subsequently indexed to inflation at 100%.
% of total awarded
capacity Initial off-take pricePPA indexation
(indexation measure)(1)Yield
(in kWh/kWp) Neoen stake
1.5% €89/MWh 20% (inflation – CPI France) 1,395 100%
1.7% €70/MWh 20% (inflation – CPI France) 1,107 100%
0.6% €72/MWh 20% (inflation – CPI France) 1,385 100%
0.6% €71/MWh 20% (inflation – CPI France) 1,034 100%
1.1% €75/MWh 20% (inflation – CPI France) 1,624 100%
0.5% €92/MWh 20% (inflation – CPI France) 1,452 100%
1.2% €159/MWh 20% (inflation – CPI France) 1,645 100%
1.2% €78/MWh 20% (inflation – CPI France) 1,750 100%
1.4% €87/MWh 20% (inflation – CPI France) 1,511 100%
0.6% €76/MWh 20% (inflation – CPI France) 1,736 100%
0.6% €77/MWh 20% (inflation – CPI France) 1,456 100%
1.5% €70/MWh 20% (inflation – CPI France) 1,593 100%
0.5% €84/MWh 20% (inflation – CPI France) 1,477 100%
1.5% €67/MWh 20% (inflation – CPI France) 1,220 100%
0.4% €70/MWh 20% (inflation – CPI France) 1,467 100%
0.2% €71/MWh 20% (inflation – CPI France) 1,450 100%
1.7% €62/MWh 20% (inflation – CPI France) 1,229 100%
2.1% €56/MWh 20% (inflation – CPI France) 1,491 100%
1.2% €60/MWh 20% (inflation – CPI France) 1,176 100%
1.9% €54/MWh 20% (inflation – CPI France) 1,160 100%
1.2% €58/MWh 20% (inflation – CPI France) 1,476 100%
2% €54/MWh 20% (inflation – CPI France) 1,476 100%
1.9% €54/MWh 20% (inflation – CPI France) 1,390 100%
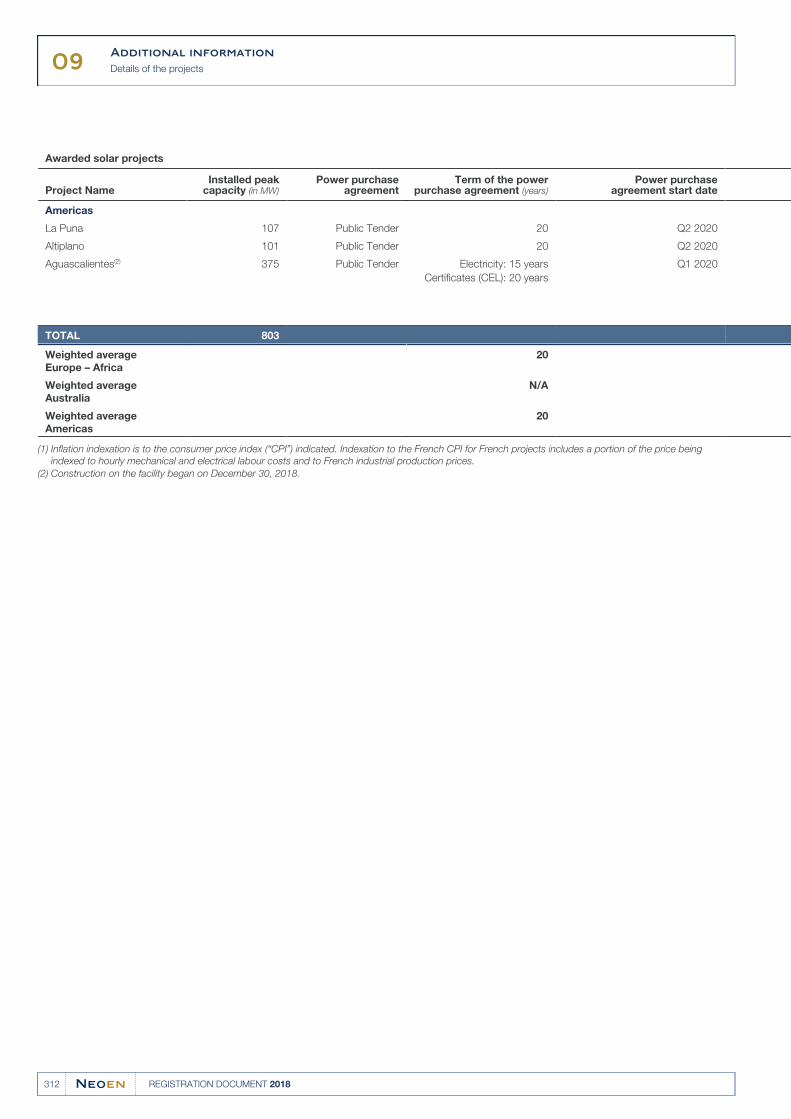
09Additional information
Details of the projects
312 REGISTRATION DOCUMENT 2018
Awarded solar projects
Project NameInstalled peak
capacity (in MW)Power purchase
agreementTerm of the power
purchase agreement (years)Power purchase
agreement start date
Americas
La Puna 107 Public Tender 20 Q2 2020
Altiplano 101 Public Tender 20 Q2 2020
Aguascalientes(2) 375 Public Tender Electricity: 15 years
Certificates (CEL): 20 years
Q1 2020
TOTAL 803
Weighted average
Europe – Africa
20
Weighted average
Australia
N/A
Weighted average
Americas
20
Inflation indexation is to the consumer price index (“CPI”) indicated. Indexation to the French CPI for French projects includes a portion of the price being (1)
indexed to hourly mechanical and electrical labour costs and to French industrial production prices.
Construction on the facility began on December 30, 2018.(2)
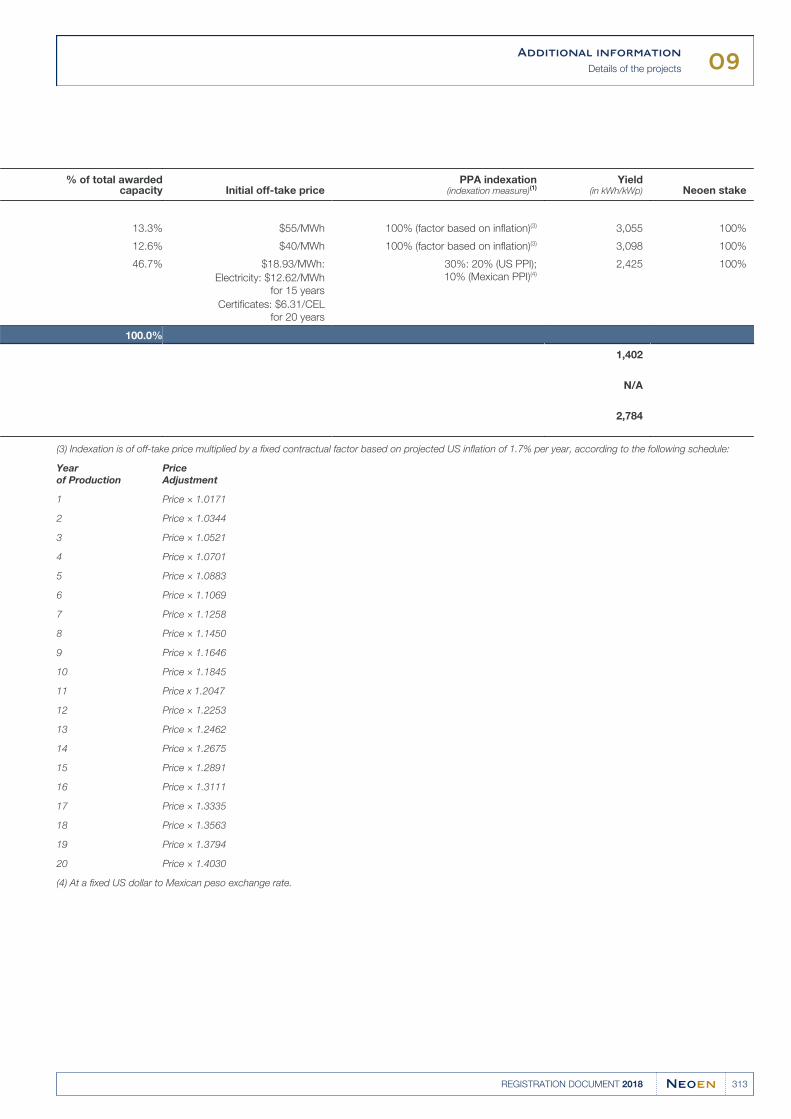
09Additional information
Details of the projects
313REGISTRATION DOCUMENT 2018
% of total awardedcapacity Initial off-take price
PPA indexation(indexation measure)(1)
Yield(in kWh/kWp) Neoen stake
13.3% $55/MWh 100% (factor based on inflation)(3) 3,055 100%
12.6% $40/MWh 100% (factor based on inflation)(3) 3,098 100%
46.7% $18.93/MWh:
Electricity: $12.62/MWh
for 15 years
Certificates: $6.31/CEL
for 20 years
30%: 20% (US PPI);
10% (Mexican PPI)(4)
2,425 100%
100.0%
1,402
N/A
2,784
Indexation is of off-take price multiplied by a fixed contractual factor based on projected US inflation of 1.7% per year, according to the following schedule: (3)
Year
of Production
Price
Adjustment
1 Price × 1.0171
2 Price × 1.0344
3 Price × 1.0521
4 Price × 1.0701
5 Price × 1.0883
6 Price × 1.1069
7 Price × 1.1258
8 Price × 1.1450
9 Price × 1.1646
10 Price × 1.1845
11 Price x 1.2047
12 Price × 1.2253
13 Price × 1.2462
14 Price × 1.2675
15 Price × 1.2891
16 Price × 1.3111
17 Price × 1.3335
18 Price × 1.3563
19 Price × 1.3794
20 Price × 1.4030
At a fixed US dollar to Mexican peso exchange rate.(4)
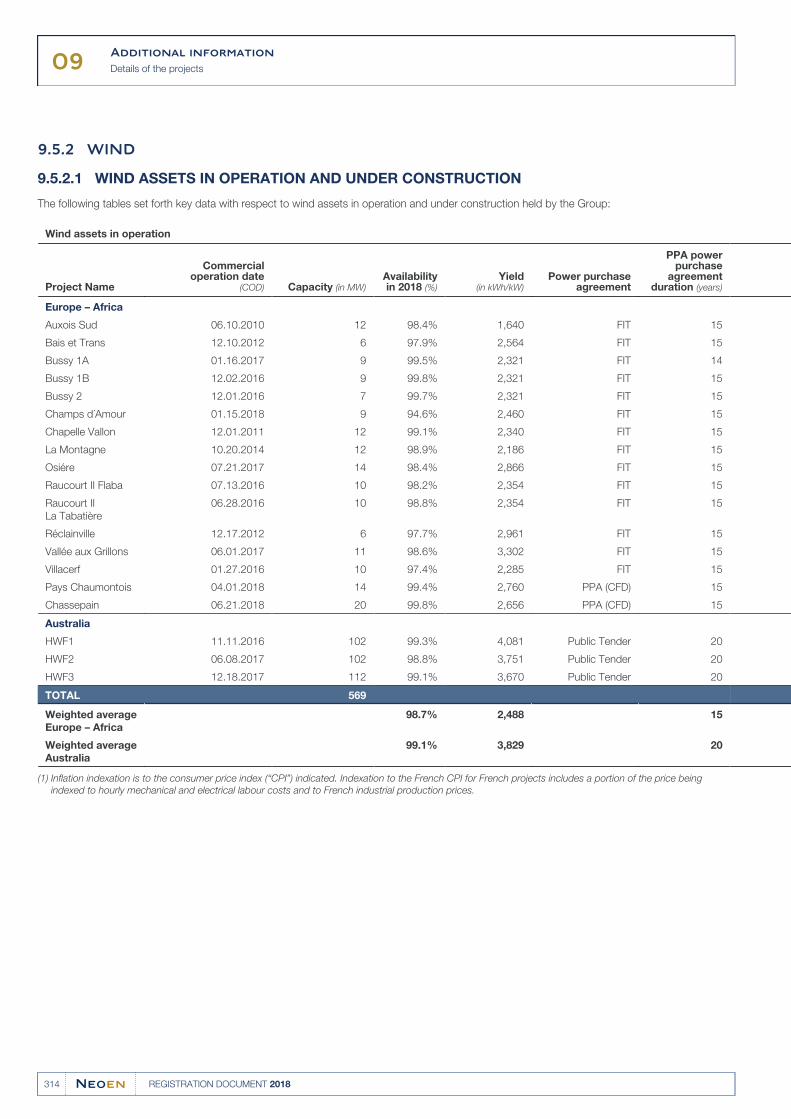
09Additional information
Details of the projects
314 REGISTRATION DOCUMENT 2018
WIND9.5.2
WIND ASSETS IN OPERATION AND UNDER CONSTRUCTION9.5.2.1
The following tables set forth key data with respect to wind assets in operation and under construction held by the Group:
Wind assets in operation
Project Name
Commercialoperation date
(COD) Capacity (in MW)Availabilityin 2018 (%)
Yield(in kWh/kW)
Power purchaseagreement
PPA powerpurchase
agreementduration (years)
Europe – Africa
Auxois Sud 06.10.2010 12 98.4% 1,640 FIT 15
Bais et Trans 12.10.2012 6 97.9% 2,564 FIT 15
Bussy 1A 01.16.2017 9 99.5% 2,321 FIT 14
Bussy 1B 12.02.2016 9 99.8% 2,321 FIT 15
Bussy 2 12.01.2016 7 99.7% 2,321 FIT 15
Champs d´Amour 01.15.2018 9 94.6% 2,460 FIT 15
Chapelle Vallon 12.01.2011 12 99.1% 2,340 FIT 15
La Montagne 10.20.2014 12 98.9% 2,186 FIT 15
Osiére 07.21.2017 14 98.4% 2,866 FIT 15
Raucourt II Flaba 07.13.2016 10 98.2% 2,354 FIT 15
Raucourt II
La Tabatière
06.28.2016 10 98.8% 2,354 FIT 15
Réclainville 12.17.2012 6 97.7% 2,961 FIT 15
Vallée aux Grillons 06.01.2017 11 98.6% 3,302 FIT 15
Villacerf 01.27.2016 10 97.4% 2,285 FIT 15
Pays Chaumontois 04.01.2018 14 99.4% 2,760 PPA (CFD) 15
Chassepain 06.21.2018 20 99.8% 2,656 PPA (CFD) 15
Australia
HWF1 11.11.2016 102 99.3% 4,081 Public Tender 20
HWF2 06.08.2017 102 98.8% 3,751 Public Tender 20
HWF3 12.18.2017 112 99.1% 3,670 Public Tender 20
TOTAL 569
Weighted average
Europe – Africa
98.7% 2,488 15
Weighted average
Australia
99.1% 3,829 20
Inflation indexation is to the consumer price index (“CPI”) indicated. Indexation to the French CPI for French projects includes a portion of the price being (1)
indexed to hourly mechanical and electrical labour costs and to French industrial production prices.
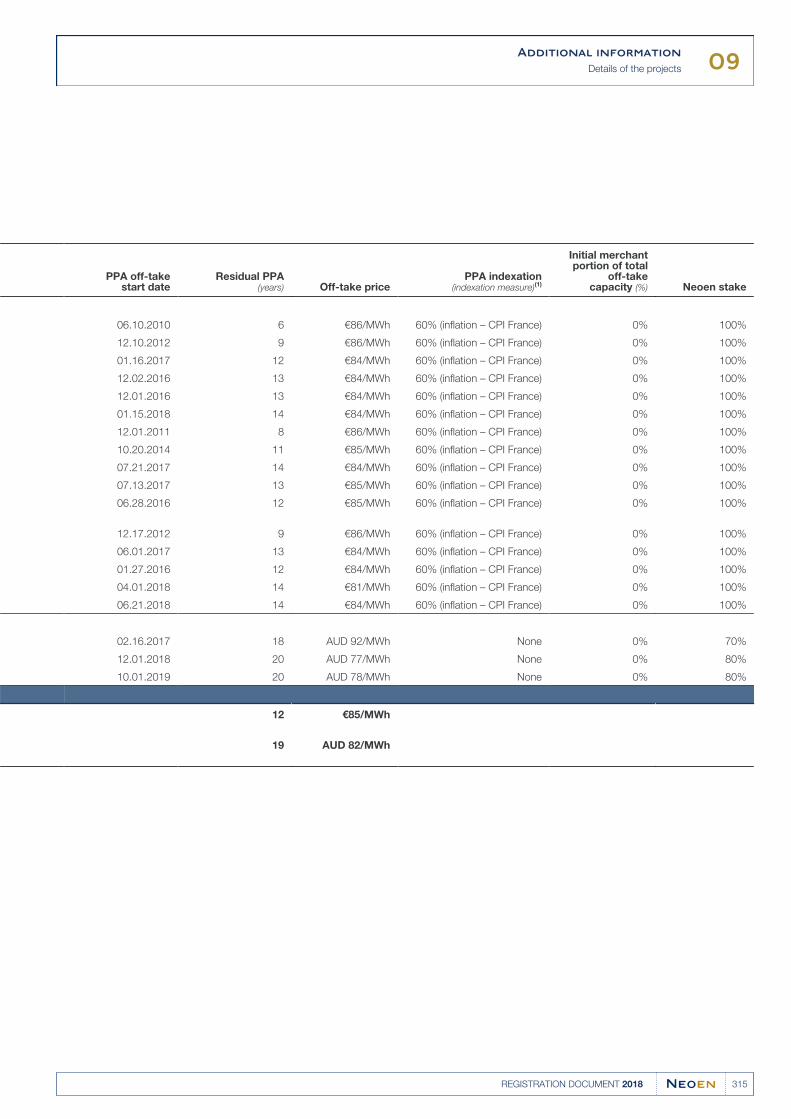
09Additional information
Details of the projects
315REGISTRATION DOCUMENT 2018
PPA off-take
start dateResidual PPA
(years) Off-take pricePPA indexation
(indexation measure)(1)
Initial merchantportion of total
off-takecapacity (%) Neoen stake
06.10.2010 6 €86/MWh 60% (inflation – CPI France) 0% 100%
12.10.2012 9 €86/MWh 60% (inflation – CPI France) 0% 100%
01.16.2017 12 €84/MWh 60% (inflation – CPI France) 0% 100%
12.02.2016 13 €84/MWh 60% (inflation – CPI France) 0% 100%
12.01.2016 13 €84/MWh 60% (inflation – CPI France) 0% 100%
01.15.2018 14 €84/MWh 60% (inflation – CPI France) 0% 100%
12.01.2011 8 €86/MWh 60% (inflation – CPI France) 0% 100%
10.20.2014 11 €85/MWh 60% (inflation – CPI France) 0% 100%
07.21.2017 14 €84/MWh 60% (inflation – CPI France) 0% 100%
07.13.2017 13 €85/MWh 60% (inflation – CPI France) 0% 100%
06.28.2016 12 €85/MWh 60% (inflation – CPI France) 0% 100%
12.17.2012 9 €86/MWh 60% (inflation – CPI France) 0% 100%
06.01.2017 13 €84/MWh 60% (inflation – CPI France) 0% 100%
01.27.2016 12 €84/MWh 60% (inflation – CPI France) 0% 100%
04.01.2018 14 €81/MWh 60% (inflation – CPI France) 0% 100%
06.21.2018 14 €84/MWh 60% (inflation – CPI France) 0% 100%
02.16.2017 18 AUD 92/MWh None 0% 70%
12.01.2018 20 AUD 77/MWh None 0% 80%
10.01.2019 20 AUD 78/MWh None 0% 80%
12 €85/MWh
19 AUD 82/MWh
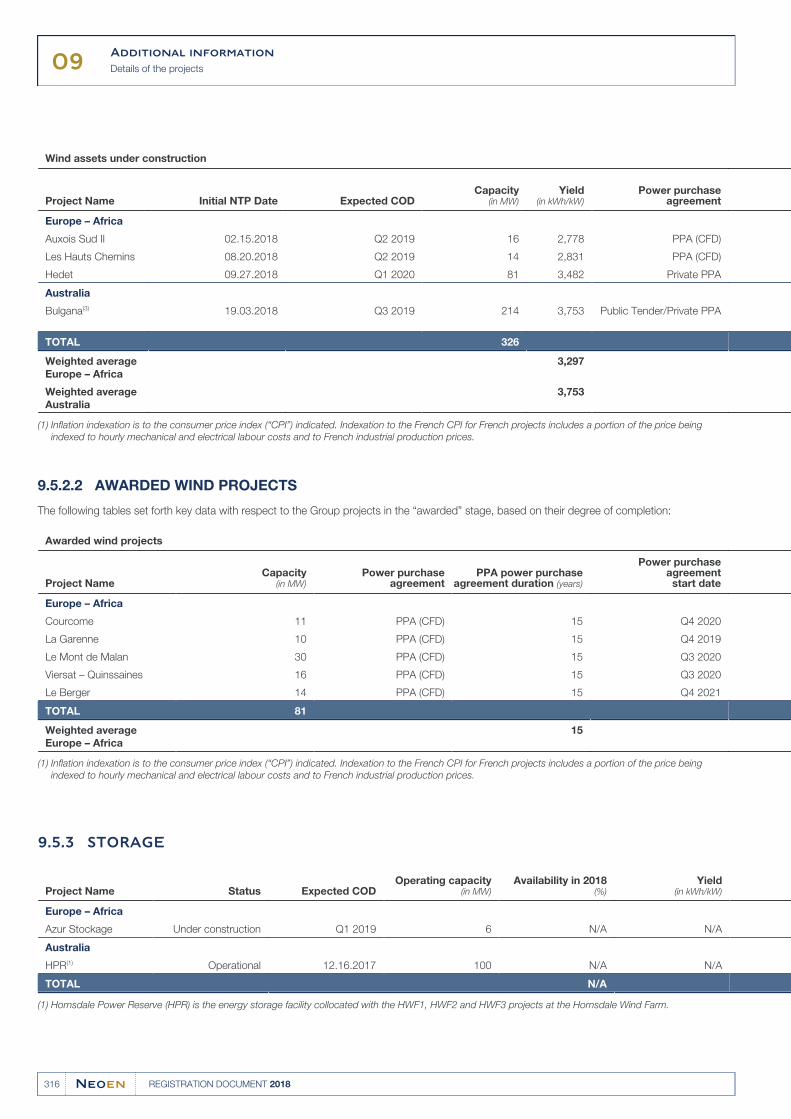
09Additional information
Details of the projects
316 REGISTRATION DOCUMENT 2018
Wind assets under construction
Project Name Initial NTP Date Expected CODCapacity
(in MW)Yield
(in kWh/kW)Power purchase
agreement
Europe – Africa
Auxois Sud II 02.15.2018 Q2 2019 16 2,778 PPA (CFD)
Les Hauts Chemins 08.20.2018 Q2 2019 14 2,831 PPA (CFD)
Hedet 09.27.2018 Q1 2020 81 3,482 Private PPA
Australia
Bulgana(3) 19.03.2018 Q3 2019 214 3,753 Public Tender/Private PPA
TOTAL 326
Weighted average
Europe – Africa
3,297
Weighted average
Australia
3,753
Inflation indexation is to the consumer price index (“CPI”) indicated. Indexation to the French CPI for French projects includes a portion of the price being (1)
indexed to hourly mechanical and electrical labour costs and to French industrial production prices.
AWARDED WIND PROJECTS9.5.2.2
The following tables set forth key data with respect to the Group projects in the “awarded” stage, based on their degree of completion:
Awarded wind projects
Project NameCapacity
(in MW)Power purchase
agreementPPA power purchase
agreement duration (years)
Power purchaseagreementstart date
Europe – Africa
Courcome 11 PPA (CFD) 15 Q4 2020
La Garenne 10 PPA (CFD) 15 Q4 2019
Le Mont de Malan 30 PPA (CFD) 15 Q3 2020
Viersat – Quinssaines 16 PPA (CFD) 15 Q3 2020
Le Berger 14 PPA (CFD) 15 Q4 2021
TOTAL 81
Weighted average
Europe – Africa
15
Inflation indexation is to the consumer price index (“CPI”) indicated. Indexation to the French CPI for French projects includes a portion of the price being (1)
indexed to hourly mechanical and electrical labour costs and to French industrial production prices.
STORAGE9.5.3
Project Name Status Expected CODOperating capacity
(in MW)Availability in 2018
(%)Yield
(in kWh/kW)
Europe – Africa
Azur Stockage Under construction Q1 2019 6 N/A N/A
Australia
HPR(1) Operational 12.16.2017 100 N/A N/A
TOTAL N/A
Hornsdale Power Reserve (HPR) is the energy storage facility collocated with the HWF1, HWF2 and HWF3 projects at the Hornsdale Wind Farm.(1)
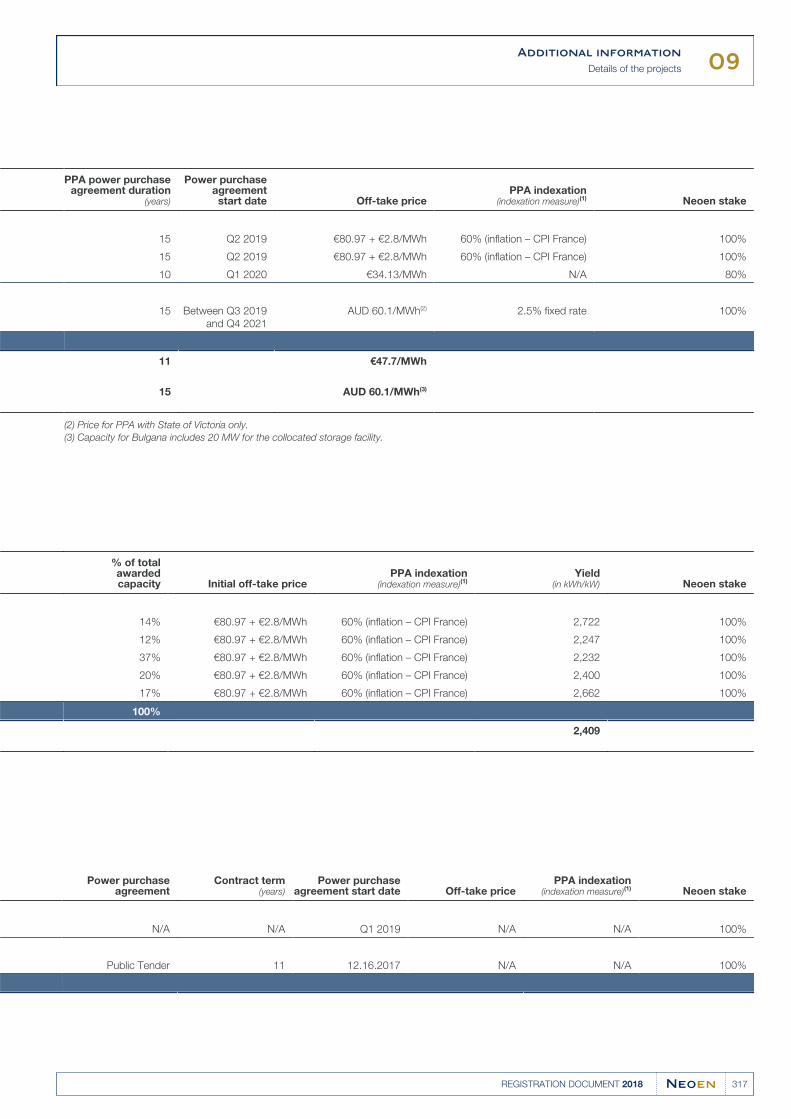
09Additional information
Details of the projects
317REGISTRATION DOCUMENT 2018
PPA power purchaseagreement duration
(years)
Power purchaseagreementstart date Off-take price
PPA indexation(indexation measure)(1) Neoen stake
15 Q2 2019 €80.97 + €2.8/MWh 60% (inflation – CPI France) 100%
15 Q2 2019 €80.97 + €2.8/MWh 60% (inflation – CPI France) 100%
10 Q1 2020 €34.13/MWh N/A 80%
15 Between Q3 2019
and Q4 2021
AUD 60.1/MWh(2) 2.5% fixed rate 100%
11 €47.7/MWh
15 AUD 60.1/MWh(3)
Price for PPA with State of Victoria only.(2)
Capacity for Bulgana includes 20 MW for the collocated storage facility.(3)
% of totalawardedcapacity Initial off-take price
PPA indexation(indexation measure)(1)
Yield (in kWh/kW) Neoen stake
14% €80.97 + €2.8/MWh 60% (inflation – CPI France) 2,722 100%
12% €80.97 + €2.8/MWh 60% (inflation – CPI France) 2,247 100%
37% €80.97 + €2.8/MWh 60% (inflation – CPI France) 2,232 100%
20% €80.97 + €2.8/MWh 60% (inflation – CPI France) 2,400 100%
17% €80.97 + €2.8/MWh 60% (inflation – CPI France) 2,662 100%
100%
2,409
Power purchase
agreementContract term
(years)Power purchase
agreement start date Off-take pricePPA indexation
(indexation measure)(1) Neoen stake
N/A N/A Q1 2019 N/A N/A 100%
Public Tender 11 12.16.2017 N/A N/A 100%
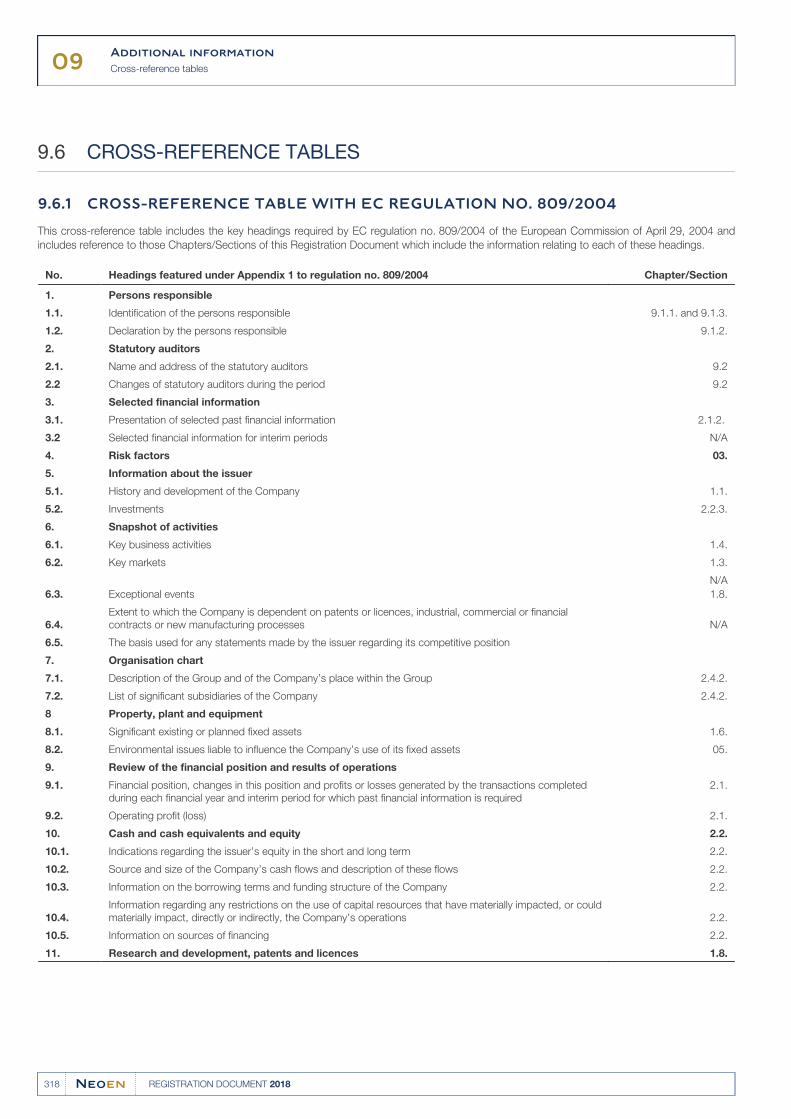
09Additional information
Cross-reference tables
318 REGISTRATION DOCUMENT 2018
CROSS-REFERENCE TABLES9.6
CROSS-REFERENCE TABLE WITH EC REGULATION NO. 809/20049.6.1
This cross-reference table includes the key headings required by EC regulation no. 809/2004 of the European Commission of April 29, 2004 and
includes reference to those Chapters/Sections of this Registration Document which include the information relating to each of these headings.
No. Headings featured under Appendix 1 to regulation no. 809/2004 Chapter/Section
1. Persons responsible
1.1. Identification of the persons responsible 9.1.1. and 9.1.3.
1.2. Declaration by the persons responsible 9.1.2.
2. Statutory auditors
2.1. Name and address of the statutory auditors 9.2
2.2 Changes of statutory auditors during the period 9.2
3. Selected financial information
3.1. Presentation of selected past financial information 2.1.2.
3.2 Selected financial information for interim periods N/A
4. Risk factors 03.
5. Information about the issuer
5.1. History and development of the Company 1.1.
5.2. Investments 2.2.3.
6. Snapshot of activities
6.1. Key business activities 1.4.
6.2. Key markets 1.3.
6.3. Exceptional events
N/A
1.8.
6.4.
Extent to which the Company is dependent on patents or licences, industrial, commercial or financial
contracts or new manufacturing processes N/A
6.5. The basis used for any statements made by the issuer regarding its competitive position
7. Organisation chart
7.1. Description of the Group and of the Company’s place within the Group 2.4.2.
7.2. List of significant subsidiaries of the Company 2.4.2.
8 Property, plant and equipment
8.1. Significant existing or planned fixed assets 1.6.
8.2. Environmental issues liable to influence the Company’s use of its fixed assets 05.
9. Review of the financial position and results of operations
9.1. Financial position, changes in this position and profits or losses generated by the transactions completed
during each financial year and interim period for which past financial information is required
2.1.
9.2. Operating profit (loss) 2.1.
10. Cash and cash equivalents and equity 2.2.
10.1. Indications regarding the issuer’s equity in the short and long term 2.2.
10.2. Source and size of the Company’s cash flows and description of these flows 2.2.
10.3. Information on the borrowing terms and funding structure of the Company 2.2.
10.4.
Information regarding any restrictions on the use of capital resources that have materially impacted, or could
materially impact, directly or indirectly, the Company’s operations 2.2.
10.5. Information on sources of financing 2.2.
11. Research and development, patents and licences 1.8.
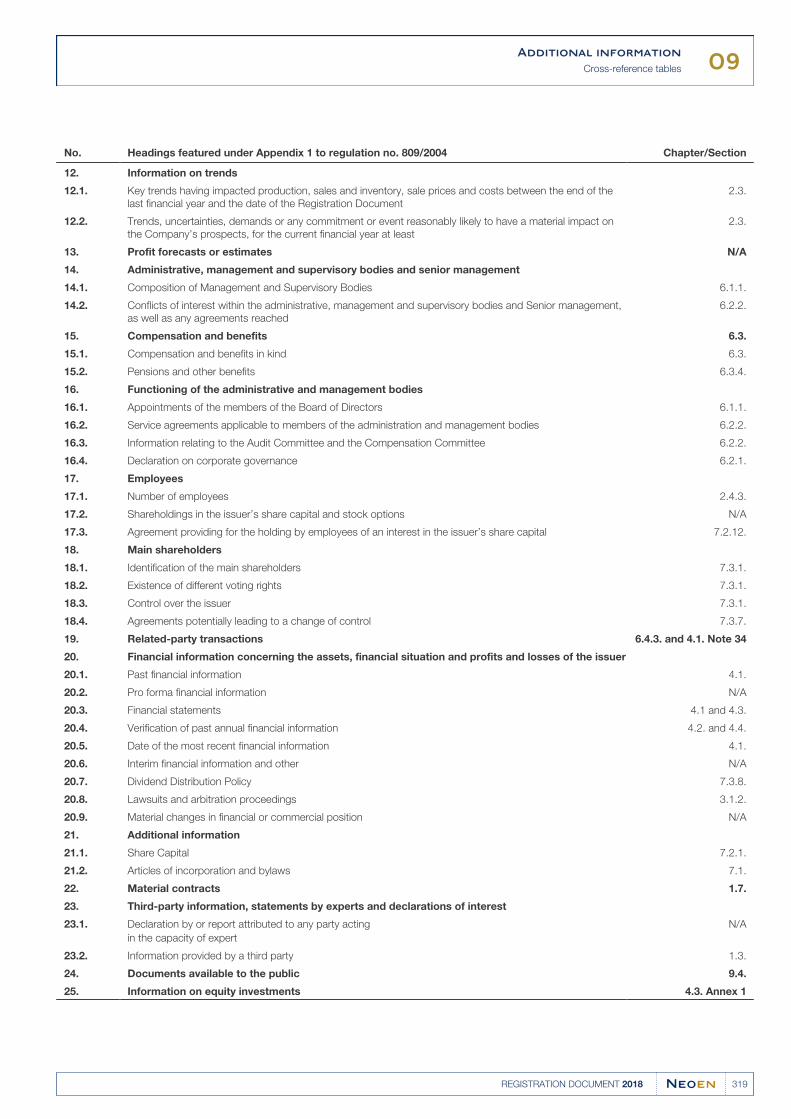
09Additional information
Cross-reference tables
319REGISTRATION DOCUMENT 2018
No. Headings featured under Appendix 1 to regulation no. 809/2004 Chapter/Section
12. Information on trends
12.1. Key trends having impacted production, sales and inventory, sale prices and costs between the end of the
last financial year and the date of the Registration Document
2.3.
12.2. Trends, uncertainties, demands or any commitment or event reasonably likely to have a material impact on
the Company’s prospects, for the current financial year at least
2.3.
13. Profit forecasts or estimates N/A
14. Administrative, management and supervisory bodies and senior management
14.1. Composition of Management and Supervisory Bodies 6.1.1.
14.2. Conflicts of interest within the administrative, management and supervisory bodies and Senior management,
as well as any agreements reached
6.2.2.
15. Compensation and benefits 6.3.
15.1. Compensation and benefits in kind 6.3.
15.2. Pensions and other benefits 6.3.4.
16. Functioning of the administrative and management bodies
16.1. Appointments of the members of the Board of Directors 6.1.1.
16.2. Service agreements applicable to members of the administration and management bodies 6.2.2.
16.3. Information relating to the Audit Committee and the Compensation Committee 6.2.2.
16.4. Declaration on corporate governance 6.2.1.
17. Employees
17.1. Number of employees 2.4.3.
17.2. Shareholdings in the issuer’s share capital and stock options N/A
17.3. Agreement providing for the holding by employees of an interest in the issuer’s share capital 7.2.12.
18. Main shareholders
18.1. Identification of the main shareholders 7.3.1.
18.2. Existence of different voting rights 7.3.1.
18.3. Control over the issuer 7.3.1.
18.4. Agreements potentially leading to a change of control 7.3.7.
19. Related-party transactions 6.4.3. and 4.1. Note 34
20. Financial information concerning the assets, financial situation and profits and losses of the issuer
20.1. Past financial information 4.1.
20.2. Pro forma financial information N/A
20.3. Financial statements 4.1 and 4.3.
20.4. Verification of past annual financial information 4.2. and 4.4.
20.5. Date of the most recent financial information 4.1.
20.6. Interim financial information and other N/A
20.7. Dividend Distribution Policy 7.3.8.
20.8. Lawsuits and arbitration proceedings 3.1.2.
20.9. Material changes in financial or commercial position N/A
21. Additional information
21.1. Share Capital 7.2.1.
21.2. Articles of incorporation and bylaws 7.1.
22. Material contracts 1.7.
23. Third-party information, statements by experts and declarations of interest
23.1. Declaration by or report attributed to any party acting
in the capacity of expert
N/A
23.2. Information provided by a third party 1.3.
24. Documents available to the public 9.4.
25. Information on equity investments 4.3. Annex 1
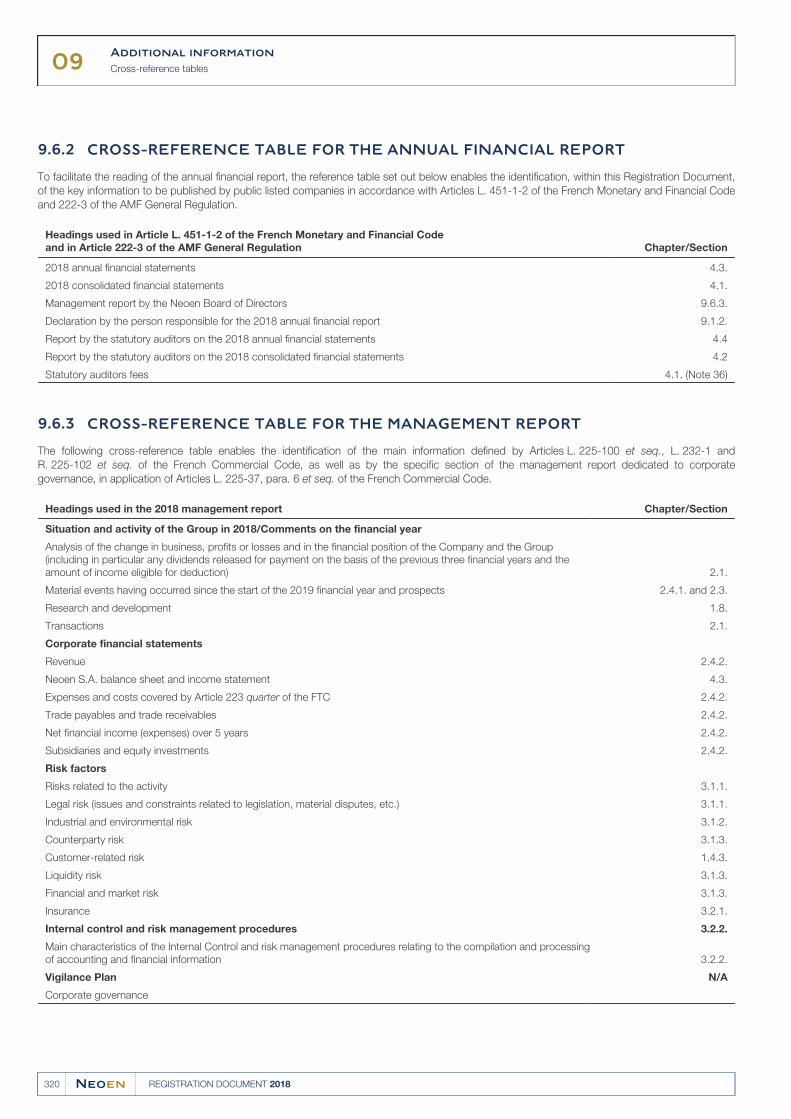
09Additional information
Cross-reference tables
320 REGISTRATION DOCUMENT 2018
CROSS-REFERENCE TABLE FOR THE ANNUAL FINANCIAL REPORT9.6.2
To facilitate the reading of the annual financial report, the reference table set out below enables the identification, within this Registration Document,
of the key information to be published by public listed companies in accordance with Articles L. 451-1-2 of the French Monetary and Financial Code
and 222-3 of the AMF General Regulation.
Headings used in Article L. 451-1-2 of the French Monetary and Financial Code
and in Article 222-3 of the AMF General Regulation Chapter/Section
2018 annual financial statements 4.3.
2018 consolidated financial statements 4.1.
Management report by the Neoen Board of Directors 9.6.3.
Declaration by the person responsible for the 2018 annual financial report 9.1.2.
Report by the statutory auditors on the 2018 annual financial statements 4.4
Report by the statutory auditors on the 2018 consolidated financial statements 4.2
Statutory auditors fees 4.1. (Note 36)
CROSS-REFERENCE TABLE FOR THE MANAGEMENT REPORT9.6.3
The following cross-reference table enables the identification of the main information defined by Articles L. 225-100 et seq., L. 232-1 and
R. 225-102 et seq. of the French Commercial Code, as well as by the specific section of the management report dedicated to corporate
governance, in application of Articles L. 225-37, para. 6 et seq. of the French Commercial Code.
Headings used in the 2018 management report Chapter/Section
Situation and activity of the Group in 2018/Comments on the financial year
Analysis of the change in business, profits or losses and in the financial position of the Company and the Group
(including in particular any dividends released for payment on the basis of the previous three financial years and the
amount of income eligible for deduction) 2.1.
Material events having occurred since the start of the 2019 financial year and prospects 2.4.1. and 2.3.
Research and development 1.8.
Transactions 2.1.
Corporate financial statements
Revenue 2.4.2.
Neoen S.A. balance sheet and income statement 4.3.
Expenses and costs covered by Article 223 quarter of the FTC 2.4.2.
Trade payables and trade receivables 2.4.2.
Net financial income (expenses) over 5 years 2.4.2.
Subsidiaries and equity investments 2.4.2.
Risk factors
Risks related to the activity 3.1.1.
Legal risk (issues and constraints related to legislation, material disputes, etc.) 3.1.1.
Industrial and environmental risk 3.1.2.
Counterparty risk 3.1.3.
Customer-related risk 1.4.3.
Liquidity risk 3.1.3.
Financial and market risk 3.1.3.
Insurance 3.2.1.
Internal control and risk management procedures 3.2.2.
Main characteristics of the Internal Control and risk management procedures relating to the compilation and processing
of accounting and financial information 3.2.2.
Vigilance Plan N/A
Corporate governance
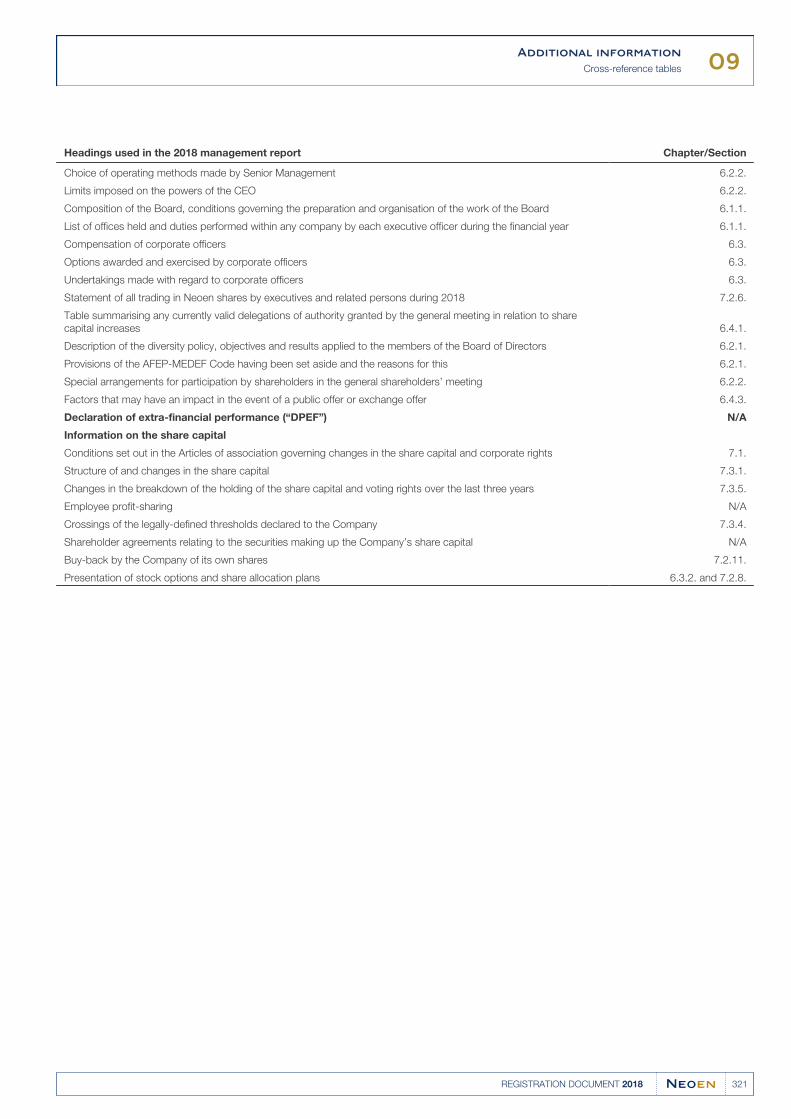
09Additional information
Cross-reference tables
321REGISTRATION DOCUMENT 2018
Headings used in the 2018 management report Chapter/Section
Choice of operating methods made by Senior Management 6.2.2.
Limits imposed on the powers of the CEO 6.2.2.
Composition of the Board, conditions governing the preparation and organisation of the work of the Board 6.1.1.
List of offices held and duties performed within any company by each executive officer during the financial year 6.1.1.
Compensation of corporate officers 6.3.
Options awarded and exercised by corporate officers 6.3.
Undertakings made with regard to corporate officers 6.3.
Statement of all trading in Neoen shares by executives and related persons during 2018 7.2.6.
Table summarising any currently valid delegations of authority granted by the general meeting in relation to share
capital increases 6.4.1.
Description of the diversity policy, objectives and results applied to the members of the Board of Directors 6.2.1.
Provisions of the AFEP-MEDEF Code having been set aside and the reasons for this 6.2.1.
Special arrangements for participation by shareholders in the general shareholders’ meeting 6.2.2.
Factors that may have an impact in the event of a public offer or exchange offer 6.4.3.
Declaration of extra-financial performance (“DPEF”) N/A
Information on the share capital
Conditions set out in the Articles of association governing changes in the share capital and corporate rights 7.1.
Structure of and changes in the share capital 7.3.1.
Changes in the breakdown of the holding of the share capital and voting rights over the last three years 7.3.5.
Employee profit-sharing N/A
Crossings of the legally-defined thresholds declared to the Company 7.3.4.
Shareholder agreements relating to the securities making up the Company’s share capital N/A
Buy-back by the Company of its own shares 7.2.11.
Presentation of stock options and share allocation plans 6.3.2. and 7.2.8.
09Additional information
Glossary
322 REGISTRATION DOCUMENT 2018
GLOSSARY9.7
Aggregator Intermediary that purchases electricity from an electricity producer to sell it
on the electricity market. The Group contracts with an aggregator when it
wishes to sell the electricity produced by its assets on certain wholesale
electricity market (spot market).
Average availability Ratio between the energy actually produced by a photovoltaic, wind or
biomass asset during a given period and the energy that could
theoretically be produced by the asset during the same period.
Biomass Process for producing electricity using the heat generated by the
combustion of organic materials of plant or animal origin (biomass by
combustion) or bio-gas from the fermentation of these materials (though
the letter is not one of the Group’s activities).
Commercial operation date (COD) Date at which a solar, wind or biomass asset is connected to the grid and
starts selling the electricity it produces.
Contract for difference or “CFD” A contract structure pursuant to which a buyer of electricity (usually a state
or state-backed entity) undertakes to pay the electricity producer the
difference between a reference tariff and the actual price at which the
producer sells the electricity on the market (“M0i” price) via an aggregator.
EPC (“Engineering, Procurement and Construction”) Contract Design, supply and installation contracts for photovoltaic, wind or biomass
plants. These contracts generally include the supply of photovoltaic panels
or wind turbines and other system components (BOS or BOP
components).
Feed-in-tariff or “FIT” A legal and regulatory structure under which the purchase price of
electricity produced by a generating unit is mandated for a given buyer
under long-term contracts.
Green bonds Debt securities whose proceeds are used to finance projects eligible for
sustainability ratings under given social or environmental criteria, in
particular by reference to the relevant guidelines established by the
International Capital Markets Association (“Green Bonds Principles”).
Grid The combined energy infrastructures used to transport electrical energy
from electrical production units to consumers.
Grid curtailment Grid Where an electricity producer is forced to reduce its energy production to
a level below its regular production capacity, for reasons beyond its
control, usually at the request of the grid operator.
Grid parity Where the levelised cost of electricity (“LCOE”) of a renewable energy
source is less than or equal to the purchase price of electricity on the grid.
Installed power Level of peak power watts or watts, as applicable, for a given solar, wind
or biomass asset or storage.
Interconnection agreement Agreement setting forth the mutual obligations and the technical, legal and
financial conditions that the electricity producer and the grid operator must
respectively fulfill for the connection of an electricity production installation
to a given electrical grid.
Internal rate of return (“IRR”) of a project Ratio between a project’s future cash flows and its foreseeable costs
(including the related cost of debt).
Inverter Device for converting a direct current (“DC”) produced by a photovoltaic,
wind or biomass asset into an alternating current (“AC”) compatible with
electricity transmission and distribution networks.
Irradiation The level of exposure of a point on the Earth’s surface to the sun’s
radiation, which determines the level of electricity that a solar power plant
can produce.
Kilowatt (“kW”) Standard unit measuring electrical power, equivalent to 1,000 watts.
Kilowatt-hour (“kWh”) Standard unit measuring the electrical power generated or consumed
(power expressed in kW multiplied by a period expressed in hours).
09Additional information
Glossary
323REGISTRATION DOCUMENT 2018
Levelised Cost of Energy or “LCOE” An indicator for comparing the competitiveness of different energy
sources, calculated by comparing the total cost of electricity production
(including development, financing, construction, operation and
maintenance costs) for a given plant with the actual electricity production
of that installation (expressed in kWh) over its entire lifetime.
Megawatt (“MW”) Standard unit measuring electrical power, equivalent to 1,000 kW or one
million watts.
Megawatt-hour (“MWh”) Standard unit measuring the electrical generated or consumed (power
expressed in MW multiplied by a period expressed in hours).
Monocrystalline silicon Basic material composing photovoltaic cells, produced by melting
polycrystalline silicon refined at very high temperatures, then solidifying it
into a single large cylindrical crystal.
O&M (“Operation and Maintenance”) contract Operation and Maintenance contract for a photovoltaic, wind or biomass
asset. Generally, the O&M service provider is the EPC contractor for the
construction of the asset.
Other components of the system (“balance of system” or “BOS”
components for solar parks and “balance of plant” or “BOP” components
for wind parks)
All equipment and components necessary for the construction of a solar
power plant other than photovoltaic panels, or of a wind park other than
wind turbines, including inverters, transformers, electrical protection
devices, wiring and control equipment, and also structural elements such
as mounting frames or wind turbine masts.
Peak power Maximum power produced by a photovoltaic panel under standard test
conditions.
Performance ratio (“PR”) Ratio expressed as a percentage between actual electricity production
and theoretical production over a reference period.
Photovoltaic (or solar) panel The main component of a solar park, consisting of a set of photovoltaic
cells electrically connected to each other, encapsulated in a plastic or
glass envelope and supported by supporting materials, usually an
aluminium structure.
Polycrystalline silicon Basic material composing photovoltaic cells, produced by re-melting
refined silicon pieces and then solidifying them by in a cuboid crucible and
cutting them into rectangular ingots consisting of multiple small crystals of
different sizes and shapes. Each ingot is then cut into very thin wafers.
This technology is more widespread but a slightly less efficient than
monocrystalline silicon.
Power Purchase Agreement or “PPA” Contract by which an electricity producer sells, for a fixed price, all or part
of its electricity production to a purchaser of electricity.
Provisional acceptance date The date on which the Group’s EPC provider reaches a contractually
defined level of completion of the construction of a solar, wind or biomass
asset and obtains the necessary certifications and performance to meet
the “provisional acceptance” criteria under EPC contracts and other
agreements relating to that asset.
PV Abbreviation of “photovoltaic”.
Solar Process for producing an electric current by exposing semiconductor
materials to light.
Special purpose vehicle (“SPV”) Company specifically created or, to a lesser extent, acquired by the Group
for the sole purpose of holding a solar, wind, biomass or storage asset of
the Group while carrying the debt (without recourse to the Company or
any other Group entities outside of the debt financing perimeter) relating to
the energy-producing asset.
Standard test conditions Standardised test conditions for measuring the nominal capacity produced
by photovoltaic cells or panels corresponding to (i) an irradiation level of
1,000 W/m2, (ii) an air mass level of 1.5 units, and (iii) a cell or panel
temperature of 25°C.
Supervisory Control and Data Acquisition (“SCADA”) Information system used to evaluate, optimize and control energy
production, performance, safety and, more generally, the proper operation
of a solar, wind or biomass asset in real time.
Transformer Conversion device for changing the voltage and intensity of an electric
current into an electric current of different voltage and intensity.
09Additional information
Glossary
324 REGISTRATION DOCUMENT 2018
Turbine Generator producing electricity from kinetic wind energy. The main
component of a wind asset.
Turbine Supply Agreement (or “TSA”) Contract pursuant to which a supplier provides, transports, installs and
commissions turbines.
Watt (“W”) Standard unit measuring (for the Group) the electrical power of a solar
asset, established under standard test conditions or of a wind, biomass or
storage asset.
Wind Process to transform the kinetic energy of the wind into mechanical
energy and then into electrical energy through the use of wind turbines.
Wind kinetic energy Energy generated by moving air, depending on its mass and speed.

This document is printed in France by an Imprim'Vert certified printer on PEFC certified paper produced from sustainably managed forest.
N E O E N
6 r u e M é n a r s
7 5 0 0 2 P a r i s - F r a n c e
w w w. n e o e n . c o m
REGISTRAT ION
DOCUMENT
Related Documents