Sustainable Urban Transport Index Framework (SUTI) for Phnom Penh Data Collection and Assessment Regional Workshop on Sustainable, Inclusive and Resilient Urban Passenger Transport: Preparing for Post - Pandemic Mobility in Asia Virtual, 28 - 29 October 2021 28-29 October 2021 Chea Monykoran Deputy Director, Land Transport Department, MPWT National Conultant on Sustainable Urban Transport System, UNESCAP

Welcome message from author
This document is posted to help you gain knowledge. Please leave a comment to let me know what you think about it! Share it to your friends and learn new things together.
Transcript

Sustainable Urban Transport Index Framework (SUTI)
for Phnom Penh
Data Collection and Assessment
Regional Workshop on Sustainable, Inclusive and Resilient Urban Passenger Transport:
Preparing for Post-Pandemic Mobility in Asia
Virtual, 28-29 October 2021
28-29 October 2021
Chea Monykoran
Deputy Director, Land Transport Department, MPWT
National Conultant on Sustainable Urban Transport System, UNESCAP
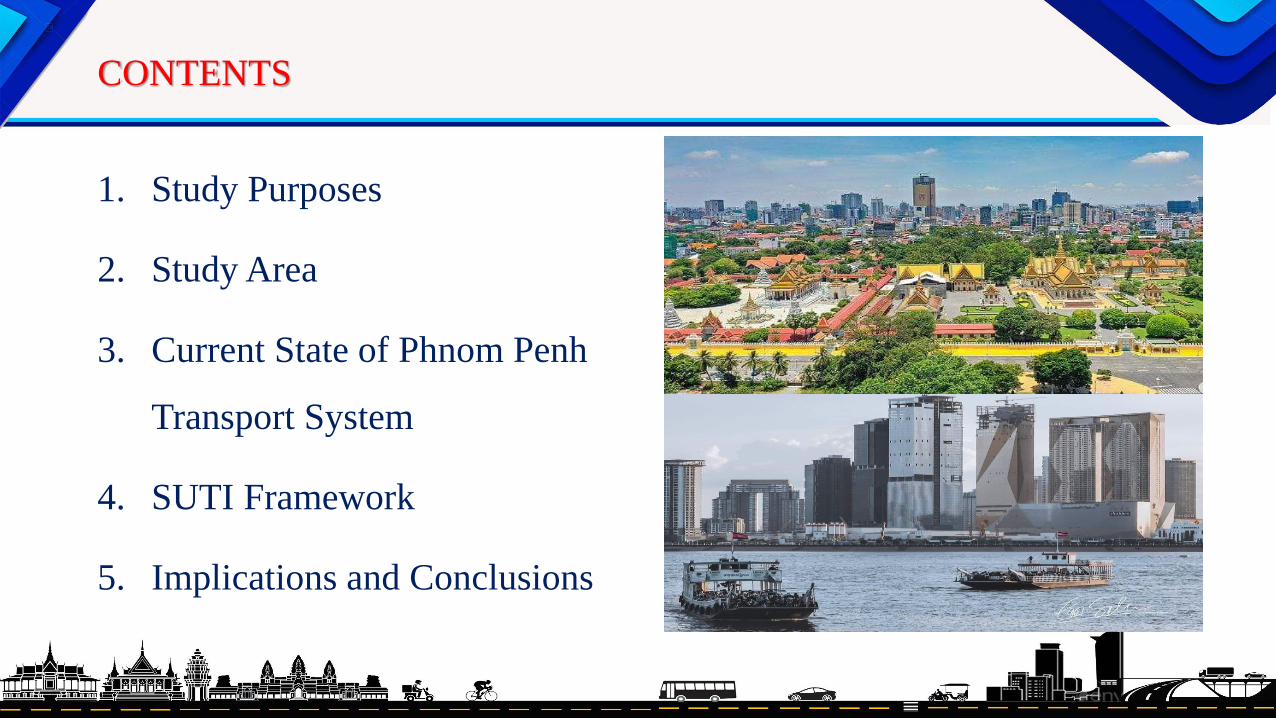
CONTENTS
1. Study Purposes
2. Study Area
3. Current State of Phnom Penh
Transport System
4. SUTI Framework
5. Implications and Conclusions

• To ascertain the conditions of urban transport system in Phnom Penh before and in the
period of COVID-19 pandemic
• To assess the impacts of COVID-19 on the overall performance of sustainable urban
transport services for Phnom Penh, using SUTI framework
• To initiate evidence-based policy measures in response to the impacts of COVID-19, and
• To improve overall sustainability, resilience, and inclusiveness of urban passenger
transport systems and services in Phnom Penh
1. Study Purposes

2. Study Area (Phnom Penh Capital City)
General Description✓ Land area: 679 km2✓ Population: 2,189,460 (app. 14%)✓ Location: on the banks of 3 rivers✓ Municipality: 14 admin. Called Khan (districts)✓ Density: 3,224✓ Population growth rate: 3.16%✓ Estimated population in 2035: 2,868,000 (JICA-
PPUTMP)
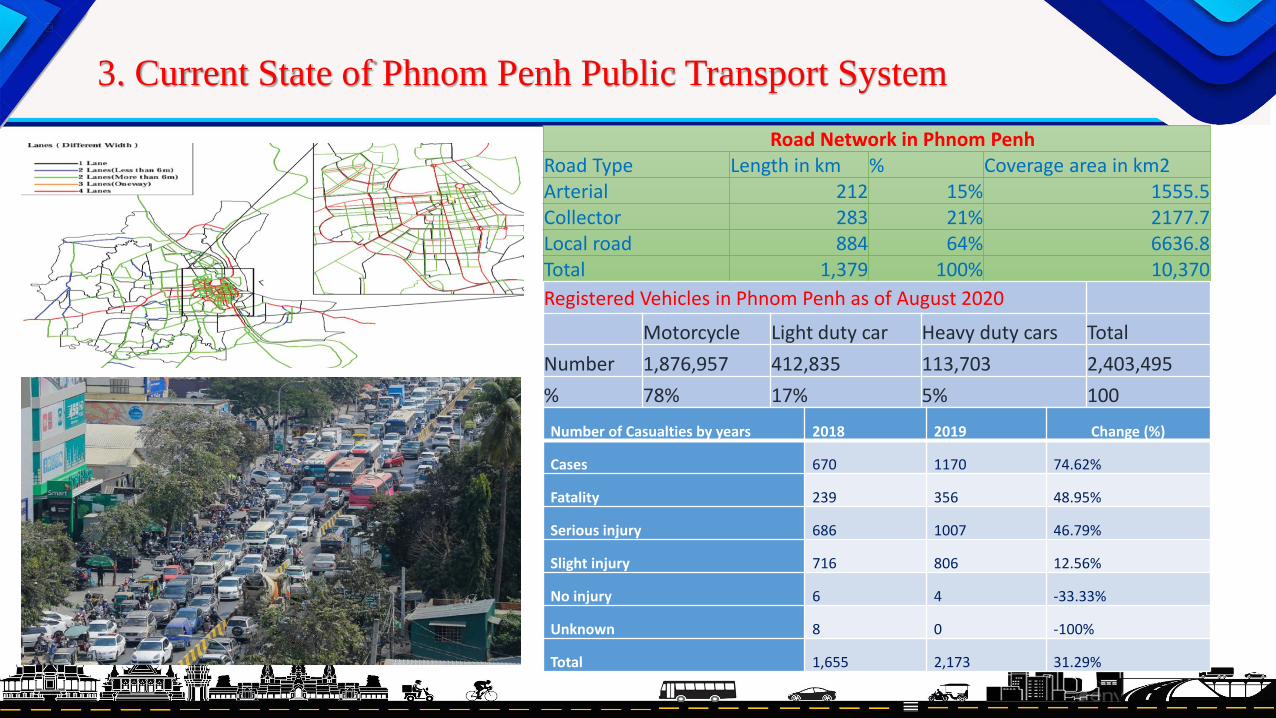
3. Current State of Phnom Penh Public Transport System
r Rr
Road Network in Phnom PenhRoad Type Length in km % Coverage area in km2Arterial 212 15% 1555.5Collector 283 21% 2177.7Local road 884 64% 6636.8Total 1,379 100% 10,370
Registered Vehicles in Phnom Penh as of August 2020
Motorcycle Light duty car Heavy duty cars Total
Number 1,876,957 412,835 113,703 2,403,495
% 78% 17% 5% 100
Number of Casualties by years 2018 2019 Change (%)
Cases 670 1170 74.62%
Fatality 239 356 48.95%
Serious injury 686 1007 46.79%
Slight injury 716 806 12.56%
No injury 6 4 -33.33%
Unknown 8 0 -100%
Total 1,655 2,173 31.29%
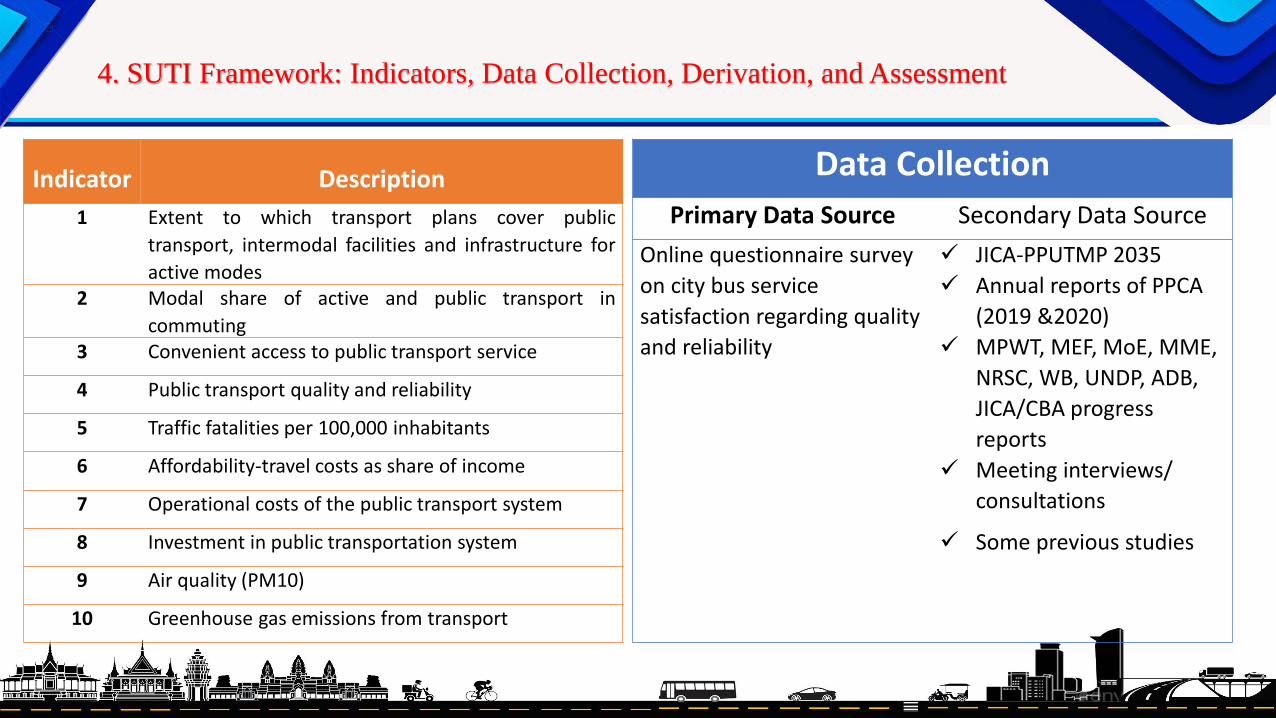
4. SUTI Framework: Indicators, Data Collection, Derivation, and Assessment
Indicator Description
1 Extent to which transport plans cover public
transport, intermodal facilities and infrastructure for
active modes2 Modal share of active and public transport in
commuting3 Convenient access to public transport service
4 Public transport quality and reliability
5 Traffic fatalities per 100,000 inhabitants
6 Affordability-travel costs as share of income
7 Operational costs of the public transport system
8 Investment in public transportation system
9 Air quality (PM10)
10 Greenhouse gas emissions from transport
Data Collection
Primary Data Source Secondary Data Source
Online questionnaire survey
on city bus service
satisfaction regarding quality
and reliability
✓ JICA-PPUTMP 2035
✓ Annual reports of PPCA
(2019 &2020)
✓ MPWT, MEF, MoE, MME,
NRSC, WB, UNDP, ADB,
JICA/CBA progress
reports
✓ Meeting interviews/
consultations
✓ Some previous studies

Indicator 1Extent to which transport plans cover public transport, intermodal facilities
and infrastructure for active modes
Aspects Explanation Score
1. Walking
networks
• 3 master plans have been set out with clear goals and
targets, but no clear budget allocation and funding
sources
• Some sections of sidewalks have been improved along
the trunk roads as well as the ones near the 100
signalized intersections upgrading project between
2017-2018
2
1. Cycling networks • Clear goals and target, but no obvious budget allocation
and financing sources
• Some attention has been paid toward cycling networks
2
1. Intermodal
transfer facilities
• Clear goals and target, but no obvious budget allocation
and financing sources
• Some attention has been paid
2
1. Public transport • 3 master plans with clear goals and targets, no clear
budget allocating and funding sources
• accomplished 13 bus routes in 2020 beyond the target
• completed the construction and introduction of one
priority bus line with 4-km distance
• completed the improvement project of existing railway
line and water transport
3
Total9
Final derived value for Indicator 1
Aspect Value Year Comments
Indicator 1 7 2020A value of 7 is reflects that attention of
urban public transport system planning
and implementation is strongly paid,
particularly budget allocation in order to
achieve sustainable urban transport
system in Phnom Penh.
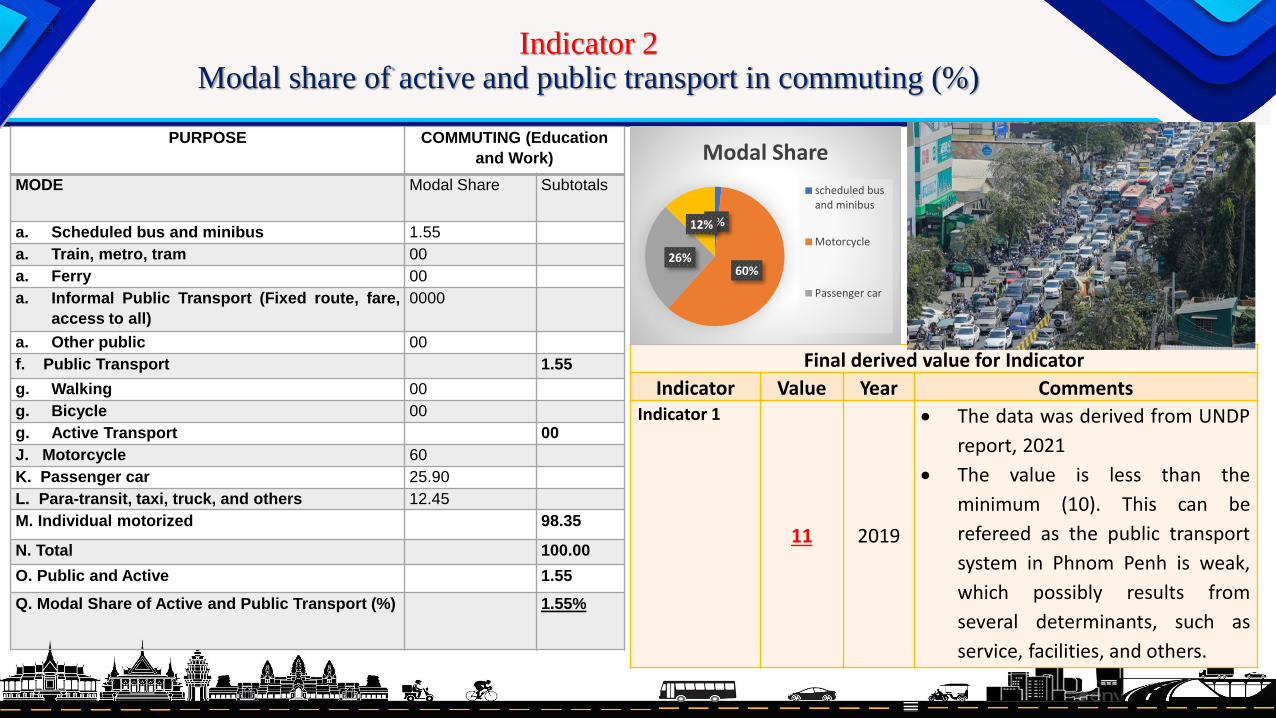
Indicator 2Modal share of active and public transport in commuting (%)
Final derived value for Indicator
Indicator Value Year CommentsIndicator 1
11 2019
• The data was derived from UNDP
report, 2021
• The value is less than the
minimum (10). This can be
refereed as the public transport
system in Phnom Penh is weak,
which possibly results from
several determinants, such as
service, facilities, and others.
PURPOSE COMMUTING (Education
and Work)
MODE Modal Share Subtotals
a. Scheduled bus and minibus 1.55
a. Train, metro, tram 00
a. Ferry 00
a. Informal Public Transport (Fixed route, fare,
access to all)
0000
a. Other public 00
f. Public Transport 1.55
g. Walking 00
g. Bicycle 00
g. Active Transport 00
J. Motorcycle 60
K. Passenger car 25.90
L. Para-transit, taxi, truck, and others 12.45
M. Individual motorized 98.35
N. Total 100.00
O. Public and Active 1.55
Q. Modal Share of Active and Public Transport (%) 1.55%
2%
60%26%
12%
Modal Share
scheduled busand minibus
Motorcycle
Passenger car

INDICATOR3Convenient Access to Public Transport
Number of Bus stop/
shelters
Coverage area within
500 m radius (km2)
Population density
(inhabitants/km2)
Inhabitants in
PP
625 491 3,075 1,509,825
Total population 2,129,371
% within 500 m buffers71%
Indicator 3 Value Year Comments
Convenient
access to public
transport
services
71% 2020
The data is based on the CBA report. The derived
value reflects the satisfactory accesses to public bus
stops in terms of figure, but does not reflect the
quality, convenience, safety, and others as many bus
stops along the streets are using roadsides which
might sometimes cause accidents. Moreover, thereis a lower density of bus stops in peripheral areas.

INDICATOR 4Public Transport Quality and Reliability
Dimension
Dissatisfied Neither Satisfied
RESP AVS scoreSATISF
(%)Very Partly Nor Partly Very
1 2 3 4 5 6 7
Frequency of the
service74 84 80 62 102 68 10 480 3.58 37.5
Punctuality (delay) 101 74 89 67 84 50 15 480 3.35 31.04
Comfort and
cleanliness of
vehicles
23 35 62 71 89 126 74 480 4.75 60.2
Safety of vehicles 15 27 59 101 80 129 69 480 4.8 57.91
Convenience of
stops/stations32 51 77 69 150 98 3 480 4.16 52.29
Availability of
information21 40 35 52 181 145 6 480 4.64 69.16
Personnel courtesy 100 65 72 33 89 97 24 480 3.26 43.75
Fare level 46 74 38 87 124 90 21 480 4.1 48.95
Responses 412 450 512 542 899 803 222 3,840 4.08 50.1

INDICATOR 5Traffic Fatalities per 100,000 Inhabitants
Number of Casualties by years 2018 2019 Change (%)
Cases 670 1170 74.62%
Fatality 239 356 48.95%
Serious injury 686 1007 46.79%
Slight injury 716 806 12.56%
No injury 6 4 -33.33%
Unknown 8 0 -100%
Total 1,655 2,173 31.29%
Fatalities 356
Inhabitants 2,129,371
Fatalities/100,000 inhabitants ≈ 17
Indictor 5 Value Year Comments
Traffic
fatalities per
100,000 in
habitants
9
2019 The data was based on the
report of NRSC in 2018 and
2019. The derived score is
beyond the maximum value.
So, it is required to modify so
as the assessment is made
possible. The value reflects
the city and stakeholders to
make more efforts to
improve such severe
situation.

INDICATOR 6Affordability – Travel Costs as Part of Income
Description Amount (USD)Monthly cost on public transport 22.2Minimum wage, 2019 182Affordability – travel costs as part of income
(%)12.20
Indicator Value Year Comments
Affordability travel cost as
part of income12.20 2019
• The derivation was based
on CBA and Ministry of
Labour and Vocational
Training.
• The result shows that bus
users (lower or middle
class) allocate 12.2% of
their income for the fare of
using Phnom Penh city bus.

INDICATOR 7Operational Costs of the Public Transport System
Service Market shares
(%)
Revenues Transport Operating
Expenses
Fare box ratio
CBA 100% USD 1,024,788 USD 7,726,097.56 13.26%
Indicator Value Year CommentsOperational costs of the public
transport system (%) 22 2018
The data was derived from the report of PiBO project of
JICA/CBA in 2018. The fare box ratio is comparatively low.
More attention and measures are required to ensure
sustainability of city bus operations.

INDICATOR 8Investment in Public Transportation Systems
Investments in 2019 (in
million USD)
2020 (in
million USD)
Average (in
million USD)
Public transport
facilities
112 112 112
Public works and
Transport
nationwide
513 568 540.5
Share (%) 21.83% 19.71% 20.72%
Indicator Value Year Comments
Investment in
public transport
systems
20.72% 2020
Based on the JICA-PPUTMP
2035 and the Ministry of
Economy and Finance. Through
the value, financial resources
should be increased and made
sure it available in accordance
to a set schedule.
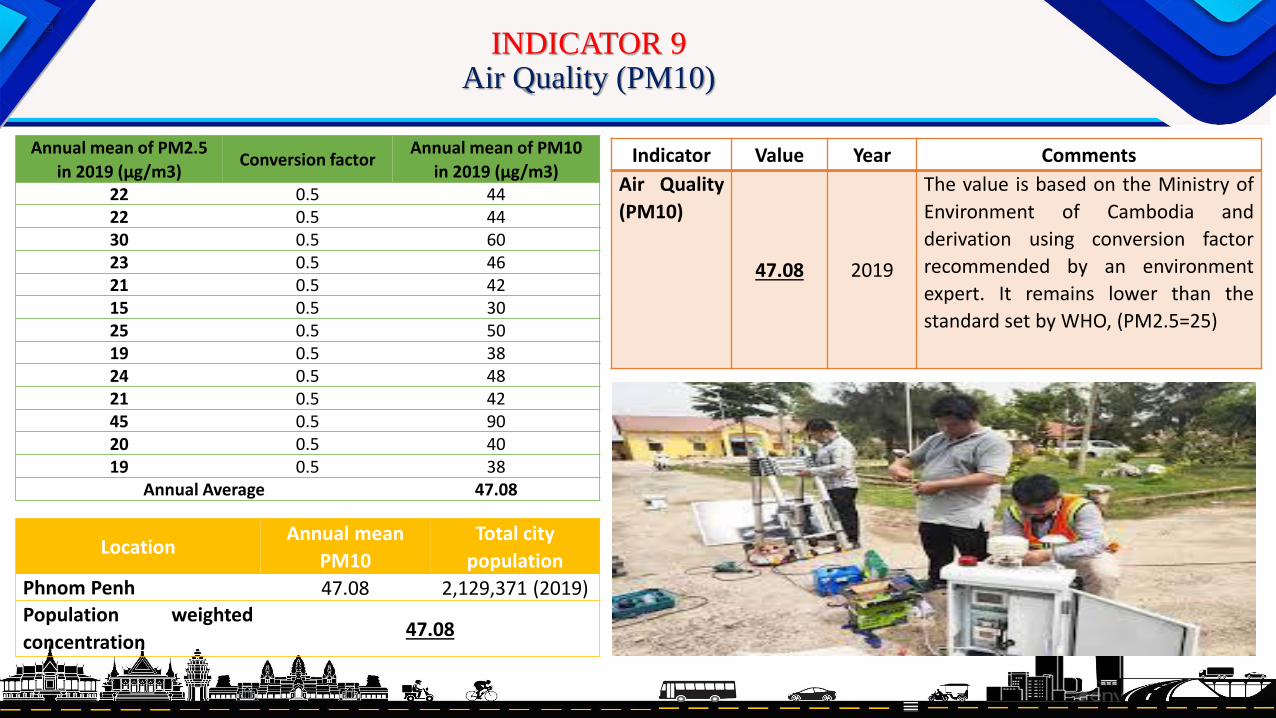
INDICATOR 9Air Quality (PM10)
Annual mean of PM2.5
in 2019 (µg/m3)Conversion factor
Annual mean of PM10
in 2019 (µg/m3)22 0.5 4422 0.5 4430 0.5 6023 0.5 4621 0.5 4215 0.5 3025 0.5 5019 0.5 3824 0.5 4821 0.5 4245 0.5 9020 0.5 4019 0.5 38
Annual Average 47.08
LocationAnnual mean
PM10
Total city
population
Phnom Penh 47.08 2,129,371 (2019)Population weighted
concentration47.08
Indicator Value Year Comments
Air Quality
(PM10)
47.08 2019
The value is based on the Ministry of
Environment of Cambodia and
derivation using conversion factor
recommended by an environment
expert. It remains lower than the
standard set by WHO, (PM2.5=25)

INDICATOR 10Greenhouse Gas Emissions from Transport
Indicator Value Year Comments
CO2 emissions for
transport (CO2
emission/capita)1.18 2019
Based on the data from the ministries of
Mines and Energy and Public Works and
Transport (2019)
Motor vehicles in Phnom
Penh in 2019
Total amount of CO2
emissions from transport
in Phnom Penh in 2019
Total Population
in 2019
CO2 emissions per
capita in 2019 (tons
of CO2/year)
Motorcycle 1,876,957
2,313,042 tons of CO2
/year1,952,000 1.18Light-duty
vehicle412,835
Heavy-duty
vehicle113,703
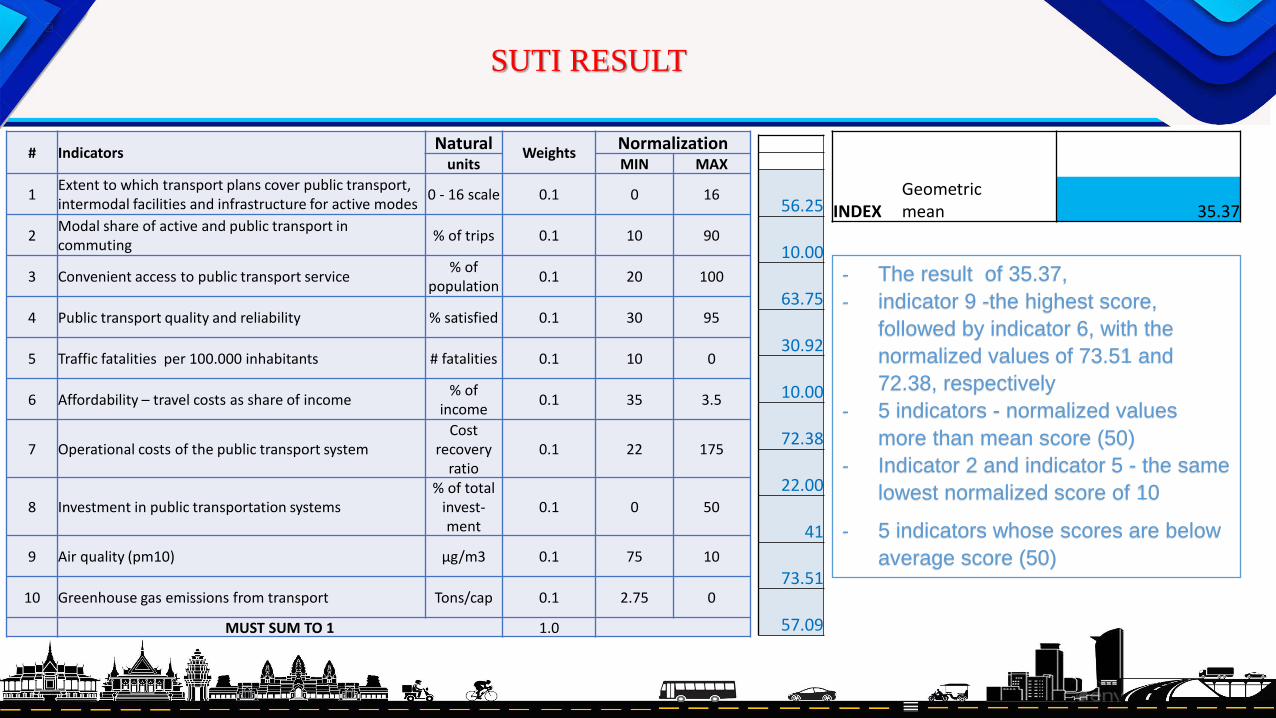
SUTI RESULT
# IndicatorsNatural
WeightsNormalization
units MIN MAX
1Extent to which transport plans cover public transport, intermodal facilities and infrastructure for active modes
0 - 16 scale 0.1 0 16
2Modal share of active and public transport in commuting
% of trips 0.1 10 90
3 Convenient access to public transport service% of
population0.1 20 100
4 Public transport quality and reliability % satisfied 0.1 30 95
5 Traffic fatalities per 100.000 inhabitants # fatalities 0.1 10 0
6 Affordability – travel costs as share of income% of
income0.1 35 3.5
7 Operational costs of the public transport systemCost
recovery ratio
0.1 22 175
8 Investment in public transportation systems% of total
invest-ment
0.1 0 50
9 Air quality (pm10) μg/m3 0.1 75 10
10 Greenhouse gas emissions from transport Tons/cap 0.1 2.75 0
MUST SUM TO 1 1.0
56.25
10.00
63.75
30.92
10.00
72.38
22.00
41
73.51
57.09
INDEXGeometric mean 35.37
- The result of 35.37,
- indicator 9 -the highest score,
followed by indicator 6, with the
normalized values of 73.51 and
72.38, respectively
- 5 indicators - normalized values
more than mean score (50)
- Indicator 2 and indicator 5 - the same
lowest normalized score of 10
- 5 indicators whose scores are below
average score (50)

SPIDER DIAGRAM
56.25
10.00 63.75
30.9210.00
72.38
22.00
41
73.51
57.09
0.0010.0020.0030.0040.0050.0060.0070.0080.00
Extent to whichtransport plans cover
public transport,intermodal facilities
and infrastructure for…
Modal share of activeand public transport in
commuting
Convenient access topublic transport service
Public transport qualityand reliability
Traffic fatalities per100.000 inhabitants
Affordability – travel costs as part of income
Operational costs ofthe public transport
system
Investment in publictransportation systems
Air quality (pm2.5)
Greenhouse gasemissions from
transport
Discussions, Implications and Suggestions✓ The spider diagram demonstrates the performance of public transport
systems in Phnom Penh
✓ The air quality in PP is deemed as fair ( 73.51) – WHO (PM2.5 =25 or
PM5 =50)
✓ Indicator 6 (72.38) – affordable – in parallel to CBA/JICA-PiBO report and
fare discount policy
✓ Indicator 3 – in compliance with the CBA report
✓ Indicator 9 – lack of data and information- from the figure of fuel sales of
MME
✓ Indicator 1- clear goals and targets within 3 master plans and some
achievements in reality in terms of public transport facility improvement in
the last few years
✓ Indicator 2 and 5 – the lowest score – supported by total trip number per
day and number of bus users in Phnom Penh. Indicator 5 – statistics from
NRSC
✓ Indicator 7 – CBA/JICA report and discount policy on fare
✓ Indicator 4 – congestion, illegal parking, and no priority bus lanes,…
✓ Indicator 8 – no specific figures for public transport facility investment
(only the planned/estimated one from JICA-PPUTMP 2035); and Budget
Laws of the MEF

PERSPECTIVES AND CONCLUSION
✓The SUTI demonstrates a well-established framework of 10 effective and
efficient indicators to develop a sustainable public transport system for a
city/town. The result illustrates that to have a sustainable transport system, all
indicators must share the same directions and good coordination
✓The framework elaborates the weaknesses and strengths of public transport
systems
✓The result will possibly contribute the government, transport authorities, private
sector and concerned stakeholders to take decisions and actions to develop a
more sustainable public transport system

IMPACTS OF COVID-19 PANDEMIC ON PHNOM PENH CITY BUS
General Situation of COVID-19 Disease in Cambodia
✓ First case was detected in Sihanoukville, the imported one on January 17th, 2020
✓ First death identified on March 11th, 2021✓ It has threatened seriously economic activities in
various areas, while tourism and manufacturing for exports and construction are seen as the hardest hit
Public Health Response Measures✓ Inter-ministerial committee to fight COVID-19✓ Social distancing measure is the most effective
front-line
Number
Tests 2,058,880
Cases 113,475
Deaths 2,406
Dose
Dose
Receiver in
million
Dose Receiver (%)
compared to total
population (about 16
million)1st dose 12.05 75.3%
2nd dose 10.3 64.4%
3rd
dose/booster830,814 5.2%

IMPACTS OF COVID-19 PANDEMIC ON PHNOM PENH CITY BUS
City Bus Before COVID-19 ERUPTION✓ Bus routes: 13 covering the majority of Phnom Penh✓ Bus fleet: 235✓ Ridership increased from 1,566,342 in 2015 to
8,265,107 in 2019 ( about 30,000 per day)
COVID-19 Impacts on CBA✓ Since the beginning of year 2020, the city bus
operation and JICA/CBA PiBO project sinifcantlyimpacted
✓ On March 26th, 2020, CBA announced the temporary suspension of bus services as part of the measures to prevent the spread of the virus and in compliance with the government regulations and measures.
Responsive Measures✓ CBA and JICA are jointly developing an operation and recovery plan
which includes mitigation, preparedness, response and recovery to ensure the safety of passengers during the prolonged disease and in the post-pandemic period
✓ Those measures include regular cleaning, and disinfection of vehicles and equipments, social distancing on buses and trainings in hygiene and prevention measures, as well as providing preventive equipment

Thank you!
Related Documents