Regional variation in obstetrical intervention for hospital birth in the Republic of Ireland, 2005–2009 Lutomski et al. Lutomski et al. BMC Pregnancy and Childbirth 2012, 12:123 http://www.biomedcentral.com/1471-2393/12/123

Welcome message from author
This document is posted to help you gain knowledge. Please leave a comment to let me know what you think about it! Share it to your friends and learn new things together.
Transcript
Regional variation in obstetrical intervention forhospital birth in the Republic of Ireland, 2005–2009Lutomski et al.
Lutomski et al. BMC Pregnancy and Childbirth 2012, 12:123http://www.biomedcentral.com/1471-2393/12/123
Lutomski et al. BMC Pregnancy and Childbirth 2012, 12:123http://www.biomedcentral.com/1471-2393/12/123
RESEARCH ARTICLE Open Access
Regional variation in obstetrical intervention forhospital birth in the Republic of Ireland, 2005–2009Jennifer E Lutomski1*, John J Morrison2 and Mona T Lydon-Rochelle1,3
Abstract
Background: Obstetrical interventions during childbirth vary widely across European and North American countries.Regional differences in intrapartum care may reflect an inpatient-based, clinician-oriented, interventional practicestyle.
Methods: Using nationally representative hospital discharge data, a retrospective cohort study was conducted toexplore regional variation in obstetric intervention across four major regions (Dublin Mid Leinster; Dublin Northeast;South; West) within the Republic of Ireland. Specific focus was given to rates of induction of labour, caesareandelivery, epidural anaesthesia, blood transfusion, hysterectomy and episiotomy. Logistic regression analyses wereperformed to assess the association between geographical region and interventions while adjusting for patientcase-mix.
Results: 323,588 deliveries were examined. The incidence of interventions varied significantly across regions; thegreatest disparities were observed for rates of induction of labour and caesarean delivery. Women in the South hadnearly two-fold odds of having prostaglandins (adjusted OR: 1.75, 95% CI 1.68-1.82), whereas women in the Westhad 1.85 odds (95% CI 1.77-1.93) of artificial rupture of membrane. Women delivering in the Dublin Northeast,South and West regions had more than two-fold increased odds of elective caesarean delivery relative to womendelivering in the Dublin Mid Leinster region. The Dublin Northeast region had the highest odds of emergencycaesarean delivery (adjusted OR: 1.36; 95% CI: 1.31-1.40).
Conclusions: Substantial regional variation in intrapartum care was observed within this small, relativelyhomogeneous population. The association of intervention use with region illustrates the need to encourage uptakeof scientific based practice guidelines to better inform clinical judgment.
Keywords: Caesarean section, Clinical practice variations, Epidural anaesthesia, ICD-10, Hospital discharge data
BackgroundThe adoption and adherence to strong evidence-basedclinical guidelines have been shown to improve mater-nal and perinatal outcomes [1,2]. Yet, wide variation inobstetrical intervention practice during childbirth haspersisted across European and North American coun-tries [3-6]. Such regional differences in obstetric prac-tice are not necessarily explained by differences insocioeconomic status, women’s preferences, or severityof co-morbidities. Rather, differences may reflect a
* Correspondence: [email protected] Perinatal Epidemiology Centre, Department of Obstetrics andGynaecology, Cork University Maternity Hospital 5th floor, Wilton, Cork,IrelandFull list of author information is available at the end of the article
© 2012 Lutomski et al.; licensee BioMed CentrCommons Attribution License (http://creativecreproduction in any medium, provided the or
more inpatient-based, clinician-oriented, interventionalpractice style.The identification of regional differences in intrapar-
tum intervention has obvious implications for policy im-plementation. However, to date, such research has notbeen undertaken in the Republic of Ireland, a countrywith a historical reputation for both good obstetric train-ing and perinatal outcomes. For instance, despite itsstringent abortion legislation, Republic of Ireland hasrelatively low rates of perinatal mortality [7]. Further, in2006, Republic of Ireland reported the lowest pretermdelivery rate in the European Union and Norway [8].In this context, we used administrative hospital dis-
charge data to explore rates of frequently performedintrapartum interventions across four major regions in
al Ltd. This is an Open Access article distributed under the terms of the Creativeommons.org/licenses/by/2.0), which permits unrestricted use, distribution, andiginal work is properly cited.
Lutomski et al. BMC Pregnancy and Childbirth 2012, 12:123 Page 2 of 9http://www.biomedcentral.com/1471-2393/12/123
Ireland over a five-year period. We hypothesised therewould be minimal variation between regions given thecountry’s small jurisdiction (approximately four millionresidents), its limited number of maternity units (20 intotal), and that fact that obstetric trainees typically rotatewithin this small network. We further examined tem-poral trends to assess if regional patterns in intrapartumintervention were persistent over time.
MethodsData source and study cohortChildbirth hospitalisation is the most frequently listedadmission for any hospitalisation among all acute carepublic specialty hospitals in the Republic of Ireland [9].Under the Health Service Executive (HSE) Maternaland Infant Scheme, all pregnant women ordinarilyresident in the country receive universal coverage forpregnancy-related care and services from public Irishmaternity hospitals [10].Data for this retrospective population-based cohort
study were obtained from the Hospital In-Patient En-quiry (HIPE) database. Maintained by the Economic andResearch Institute, HIPE is the only national level sourceof acute public hospital discharge records and has beenextensively used for analysis of non-obstetric health ser-vices trends [11-16]. Each year, HIPE collects data onapproximately 73,000 childbirth discharges from 19 ofthe 20 Irish maternity units [9], and represents approxi-mately 97% of all recorded births in the country [7].Using the HIPE database, we identified all women whohad a singleton live birth in hospital between January 1,2005 and December 31, 2009 (N=323,588).Hospital-level data are not publically available in the
HIPE dataset; the smallest geographical unit available foranalysis is the HSE administrative hospital region. Theseregions, which acted as our primary predictor variable,are classified into four major areas (Dublin Mid Leinster;Dublin Northeast; South; West) and reflect both individ-ual hospital and catchment areas. Based on governmentfigures (data not published), the annual number of livebirths (rounded to the nearest 100) for each HSE regionwere approximately distributed as follows: (1) DublinMid Leinster has four hospitals with 22,000 live births(range 2,600-8,800); (2) Dublin Northeast has three hos-pitals with 14,000 live births (range 1,600-8,400); (3) theSouth has six hospitals with 17,700 live births (range1,200-7,900); and (4) the West has six hospitals with16,200 live births (range 1,300-5,200) (Figure 1). Thereare four large (≥8,000 deliveries per annum), tertiary re-ferral hospitals in the Republic of Ireland, one is locatedin Dublin Northeast, two in Dublin Mid Leinster andone in the South.The following measures for maternal characteristics
and health service indicators were obtained from the
HIPE database: maternal age; marital status; possessionof a medical card (government assistance generallyassigned to low-income individuals); length of stay; in-tensive care unit (ICU) admission; and type of discharge,which indicates if a patient was released to her home orother semi-permanent accommodation (i.e. convalescenthome, foster care, or prison), absconded, or was trans-ferred to an acute hospital, psychiatric ward, rehabilita-tion centre or hospice.Incident cases of childbirth-related co-morbidities and
interventions were identified using the HIPE dataset,which records up to 20 diagnoses and procedures codedaccording to the International Statistical Classificationof Diseases and Related Health Problems, Tenth Revision,Australian Modification (ICD-10-AM). Maternal co-morbidities included only those reported during the hos-pitalisation for delivery. Co-morbidities were identifiedusing a modified classification scheme as described byLutomski et al [17]. The following ICD-10-AM codeswere used for co-morbidity classifications: hypertensivedisorders (I10-I12; I13.9; I15; O10; O11; O13-O16); ges-tational diabetes (O24.4); established diabetes (E10-14;O24.0,1,2,3); antepartum haemorrhage (O20.8,9; O45;O46); and placental disorders (O43.1,2,8,9; O44.1).Since previous caesarean delivery may affect the deci-
sion for obstetrical intervention, we identified womenwith a uterine scar using the following two diagnosticcodes: Maternal care due to uterine scar from previoussurgery (caesarean section) (O34.2) and Vaginal deliveryfollowing previous caesarean section (O75.7). Parity wasnot available in the HIPE dataset.Obstetrical procedures were identified by ICD-10-AM
codes as well. In order to differentiate induction oflabour from labour augmentation, we classified induc-tion of labour using only induction-specific ICD-10-AMcodes, including: Medical induction of labour, oxytocin(90465–00); Medical induction of labour, prostaglandin(90465–01); Other medical induction of labour (90465–02); Surgical induction of labour by artificial ruptureof membranes (90465–03); Other surgical induction oflabour (90465–04), or Medical and surgical inductionof labour (90465–05). Mode of delivery was categorisedas follows: elective caesarean (16520–00; 16520–02),emergency caesarean (16520–01; 16520–03), vacuumextraction (90469-00/01), or forceps extraction (e.g. breech,mid-cavity, high, low, rotation of fetal head and failedforceps) (90468-00/01/02/03/04/05; 90470-02/04). Mea-sures of vacuum and forceps extraction were includedwhether these attempts had failed or succeeded.Other interventions included epidural/spinal anaesthe-
sia (92506-sub-divisions; 92507-sub-divisions; 92508-sub-divisions; 92516–00), episiotomy (90472–00), bloodtransfusion (13706-01/02/03; 92060–00; 92062–00) andhysterectomy (35653-00/01/02/03/04).
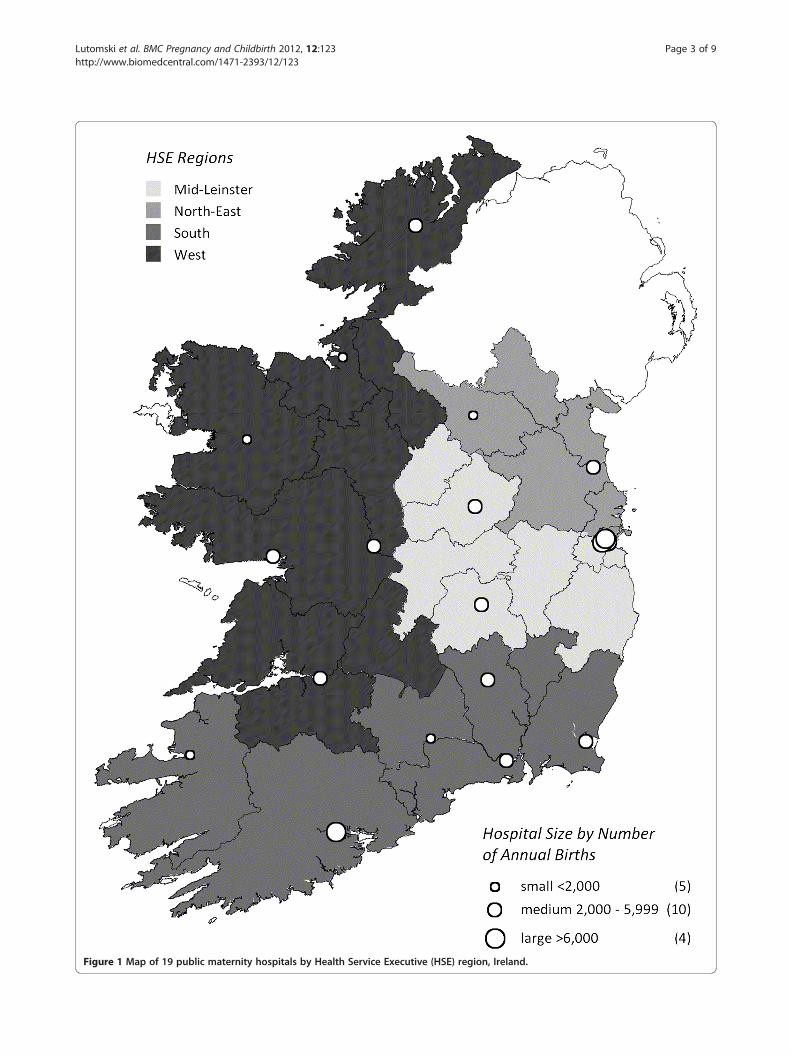
Figure 1 Map of 19 public maternity hospitals by Health Service Executive (HSE) region, Ireland.
Lutomski et al. BMC Pregnancy and Childbirth 2012, 12:123 Page 3 of 9http://www.biomedcentral.com/1471-2393/12/123
Lutomski et al. BMC Pregnancy and Childbirth 2012, 12:123 Page 4 of 9http://www.biomedcentral.com/1471-2393/12/123
Statistical analysisSince certain interventions may eliminate the possibilityof others during the delivery continuum (i.e. electivecaesarean delivery precludes induction of labour), weidentified three distinct groups to allow for the mostrobust comparisons of interventions between regions.Group 1 comprised of all women (n=323,588), Group 2comprised of women with emergency caesarean or vagi-nal deliveries (operative and non-operative) (n=286,495)and Group 3 comprised of only women with vaginal de-liveries (operative and non-operative) (n=243,291). The-oretically all women are at risk for elective caesareandelivery, blood transfusion or hysterectomy, and there-fore subsequent analyses for these interventions wereconducted within Group 1. Since emergency caesareandelivery, operative vaginal delivery, induction of labourand epidural anaesthesia are only relevant for womenwho undertook a trial of labour, analyses for these inter-ventions were conducted within Group 2. Lastly, episiot-omy is only relevant for women with vaginal deliveries,and thus this intervention was analysed within Group 3.Characteristics of the study population were described
across HSE administrative regions using means, mediansor proportions. Using the appropriate base population asdescribed above, five-year intervention rates werederived. We further calculated annual incidence ratesbetween 2005 and 2009 and evaluated regional temporaltrends using the Cochrane-Armitage test. Temporal ana-lysis was limited to induction, mode of delivery, epiduralanaesthesia and episiotomy as these rates were the moststable across years and regions. Logistic regression ana-lyses were conducted to examine the association between
Table 1 Patient characteristics by Health Service Executive hohospitalisations (N=323,588), Republic of Ireland, 2005-2009
Characteristic Dublin Mid Leinster (n=102,509)
Age, years [mean (SD)] 30.6 (5.7)
Married 65,079 (63.5)
Medical card possessiona 12,497 (12.2)
Length of stay, days [median (IQR)] 3 (2–4)
ICU admission 99 (0.1)
Hospital transferb 75 (0.1)
Previous caesarean delivery 6,608 (10.1)
Morbidities
Hypertensive disorders 5,228 (5.1)
Gestational diabetes 1,773 (1.7)
Established diabetes 374 (0.4)
Antepartum haemorrhage 1,234 (1.2)
Placental disorders 385 (0.4)
Note: Values are N (%) unless otherwise indicated.Abbreviation: SD, standard deviation; IQR, inter-quartile range; ICU, intensive care ua Possession of a medical card provides low-income individuals with select free heab Includes transfers to acute hospital, psychiatric ward, rehabilitation centre or hosp
HSE region and obstetric interventions with adjustmentfor relevant risk factors using the largest HSE region(Dublin Mid Leinster) as the referent region. Multivariateanalysis was not performed for hysterectomy due to smallnumbers. All statistical analyses were conducted usingSAS version 9.2 (SAS Institute, Inc., Carey, NC, USA).
Details of ethical approvalThis study was exempt from University College CorkClinical Research Ethics Committee review as it usedpublicly available, anonymised data (Ref. No. ECM4(g)05/08/08).
ResultsOver the five-year study period, there were 323,588 de-liveries; 102,509 occurred in Dublin Mid Leinster, 65,667in Dublin Northeast, 79,789 in the South and 75,623 inthe West. Differences in patient characteristics wereobserved across the four regions (Table 1). The percen-tages of married women and of women who receivedgovernment medical assistance were highest in the West(67.3% and 34.9% respectively). Dublin Mid Leinsterreported the lowest percentage of maternal ICU admis-sions (0.1%). Antepartum haemorrhage was relativelysimilar across regions, except for the West, which wasmodestly lower (0.8%). Placental disorders were highestin Dublin Northeast (1.1%) and lowest in Dublin MidLeinster (0.4%).Use of prostaglandin for induction of labour was most
common in the South (8.9%), with the other regions ran-ging from 4.7% to 5.9% (Table 2). The percentage ofwomen receiving oxytocin was highest in Dublin Mid
spital region for singleton, live birth delivery
Dublin Northeast (n=65,667) South (n=79,789) West (n=75,623)
30.0 (5.7) 30.4 (5.6) 30.7 (5.7)
38,898 (59.2) 48,886 (61.3) 50,903 (67.3)
10,828 (16.5) 8,847 (11.1) 26,414 (34.9)
3 (2–4) 3 (2–5) 3 (2–5)
437 (0.7) 128 (0.2) 177 (0.2)
66 (0.1) 144 (0.2) 144 (0.2)
10,956 (10.7) 8,804 (11.0) 7,502 (9.9)
3,677 (5.6) 3,957 (5.0) 4,271 (5.7)
1,515 (2.3) 861 (1.1) 951 (1.3)
178 (0.3) 279 (0.4) 211 (0.3)
870 (1.3) 1,092 (1.4) 606 (0.8)
736 (1.1) 455 (0.6) 342 (0.5)
nit.lth care services.ice.
Lutomski et al. BMC Pregnancy and Childbirth 2012, 12:123 Page 5 of 9http://www.biomedcentral.com/1471-2393/12/123
Leinster (6.8%), whereas the remaining regions used oxy-tocin at a rate of 1.8%. Artificial rupture of membranes(AROM) rates ranged from 3.6% to 8.9%.Incidence rates of caesarean and operative vaginal deliv-
eries varied across regions. While the West reported thehighest elective caesarean delivery rate (13.4%), this regionalso reported the lowest emergency caesarean delivery rate(13.7%). Dublin Mid Leinster had the lowest vacuum-assisted delivery rate (13.2%) and the highest forceps-assisted delivery rate (5.8%). Exclusive of elective repeat cae-sarean deliveries, the rate of non-operative vaginal deliverieswas higher in Dublin Mid Leinster and the West (68.3%and 69.8% respectively) and lower in Dublin Northeast andthe South (63.9% and 65.0% respectively).Blood transfusion was lowest in the South (0.6%) and
highest in Dublin Northeast (1.4%). The rate of episiot-omy among vaginal deliveries ranged from 18.5% inDublin Northeast to 27.4% in Dublin Mid Leinster.Several temporal trends in obstetric intervention
across HSE regions were observed between 2005 and2009. While rates of induction of labour were fairly
Table 2 Incidence of interventions by Health ServiceExecutive hospital region for singleton, live birth deliveryhospitalisations, Republic of Ireland, 2005-2009
Dublin MidLeinster
DublinNortheast
South West
Induction of labour
Prostaglandin 5.2 4.7 8.9 5.9
Oxytocin 6.8 1.8 1.8 1.8
Artificial rupture of membrane 5.1 3.6 4.4 8.9
Othera 12.2 13.5 12.3 15.4
Total induction 27.6 23.3 26.9 31.3
Pain relief
Epidural anaesthesia 56.3 52.5 56.6 48.4
Mode of delivery
Elective caesareanb 8.1 12.3 13.3 13.4
Emergency caesarean 14.7 16.4 15.7 13.7
Vacuumc 13.2 18.1 16.2 14.8
Forcepsc 5.8 4.2 4.8 2.7
Non-operative vaginal 68.3 63.9 65.0 69.8
Select procedures
Blood transfusionb 1.2 1.4 1.0 0.6
Hysterectomyb 0.02 0.03 0.01 0.02
Episiotomyd 27.4 18.5 22.4 21.8
Note: Values are rates per 100 deliveries. Rates are based on emergency andvaginal (operative and non-operative) deliveries only (n=286,495) unlessotherwise specified.a Includes medical and surgical methods (i.e. Bougie, cervical dilation andFoley’s catheter) not elsewhere specified.b Rate is based on all deliveries (n=323,588).c Rate includes failed attempts.d Rate is based on vaginal (operative and non-operative) deliveries only(n=243,291).
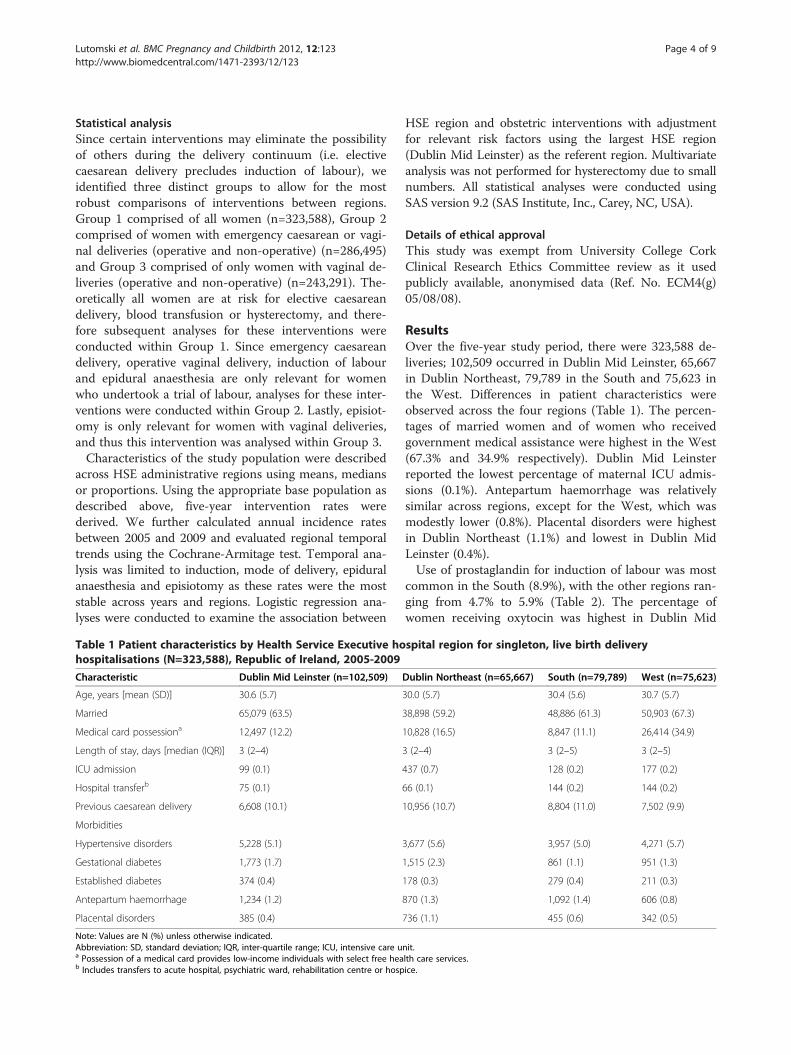
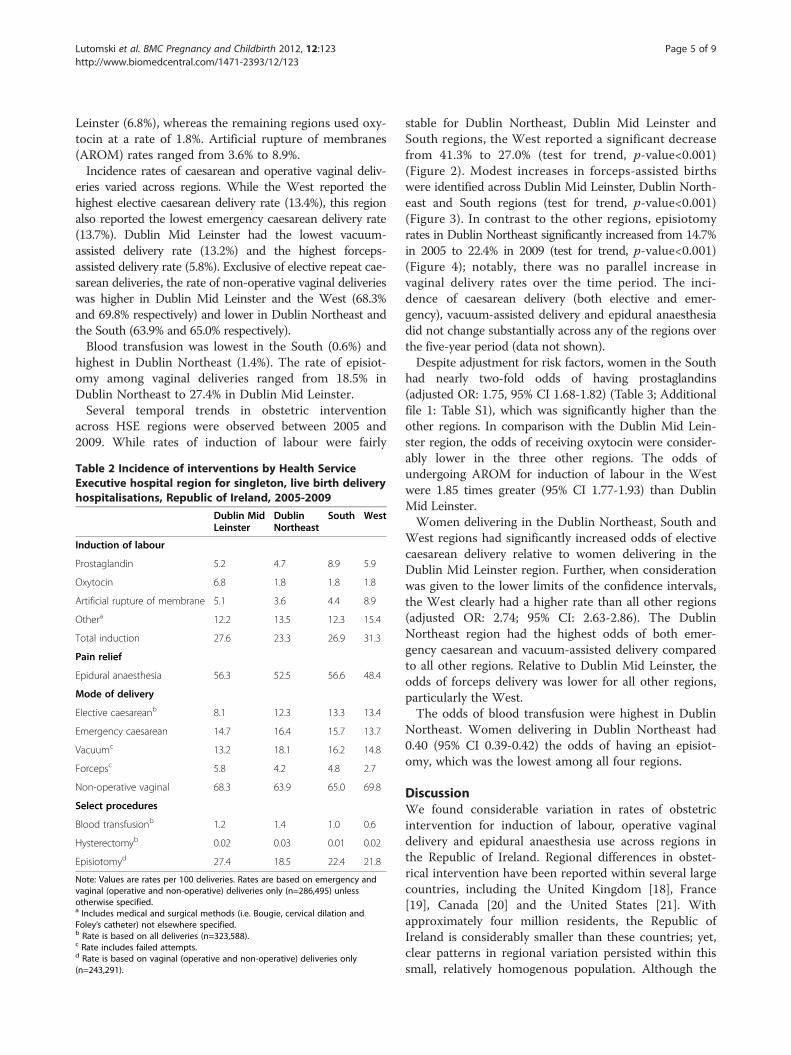
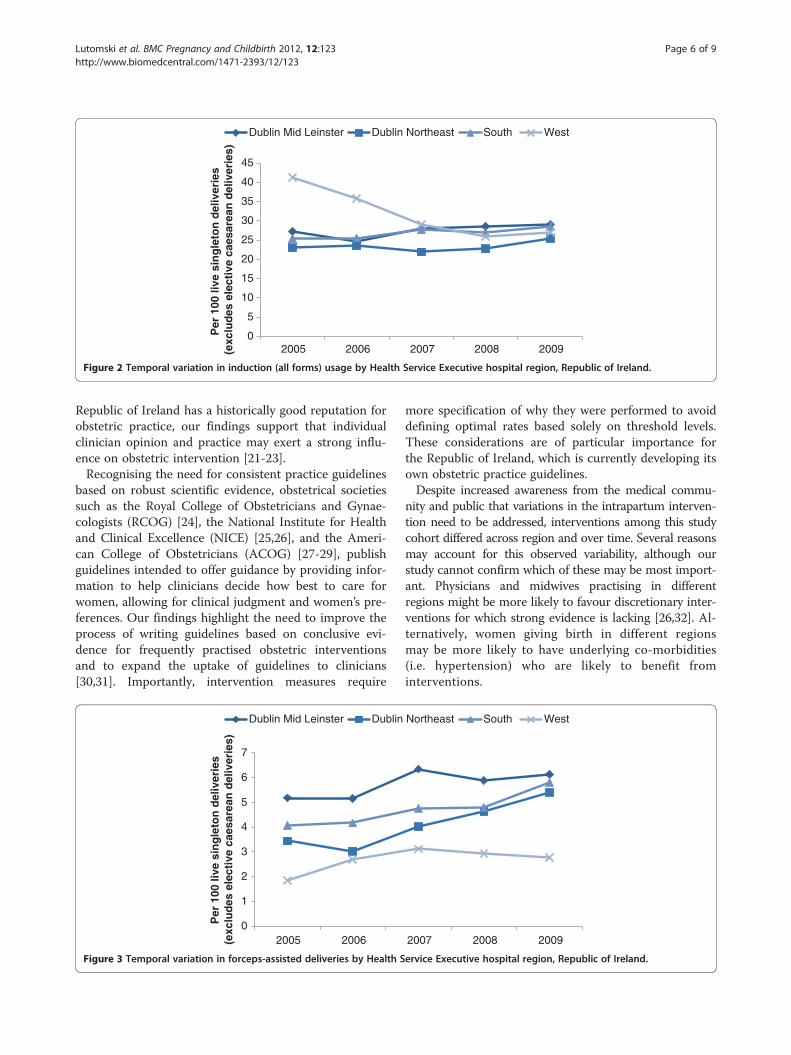
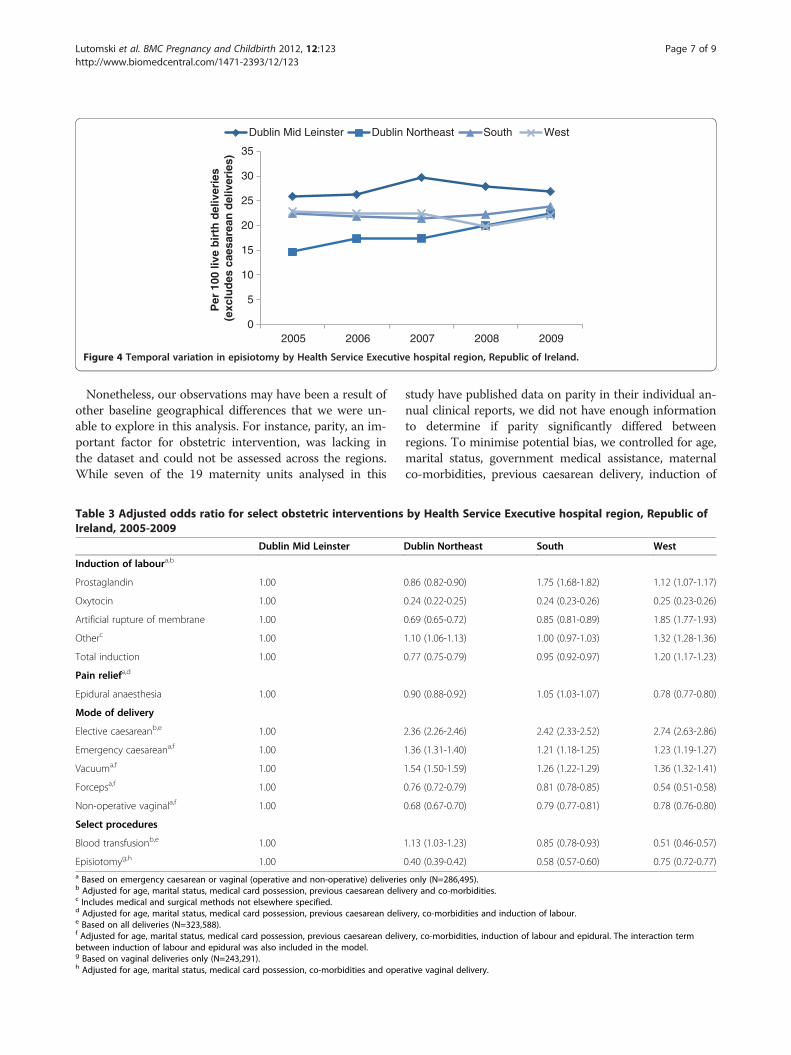
stable for Dublin Northeast, Dublin Mid Leinster andSouth regions, the West reported a significant decreasefrom 41.3% to 27.0% (test for trend, p-value<0.001)(Figure 2). Modest increases in forceps-assisted birthswere identified across Dublin Mid Leinster, Dublin North-east and South regions (test for trend, p-value<0.001)(Figure 3). In contrast to the other regions, episiotomyrates in Dublin Northeast significantly increased from 14.7%in 2005 to 22.4% in 2009 (test for trend, p-value<0.001)(Figure 4); notably, there was no parallel increase invaginal delivery rates over the time period. The inci-dence of caesarean delivery (both elective and emer-gency), vacuum-assisted delivery and epidural anaesthesiadid not change substantially across any of the regions overthe five-year period (data not shown).Despite adjustment for risk factors, women in the South
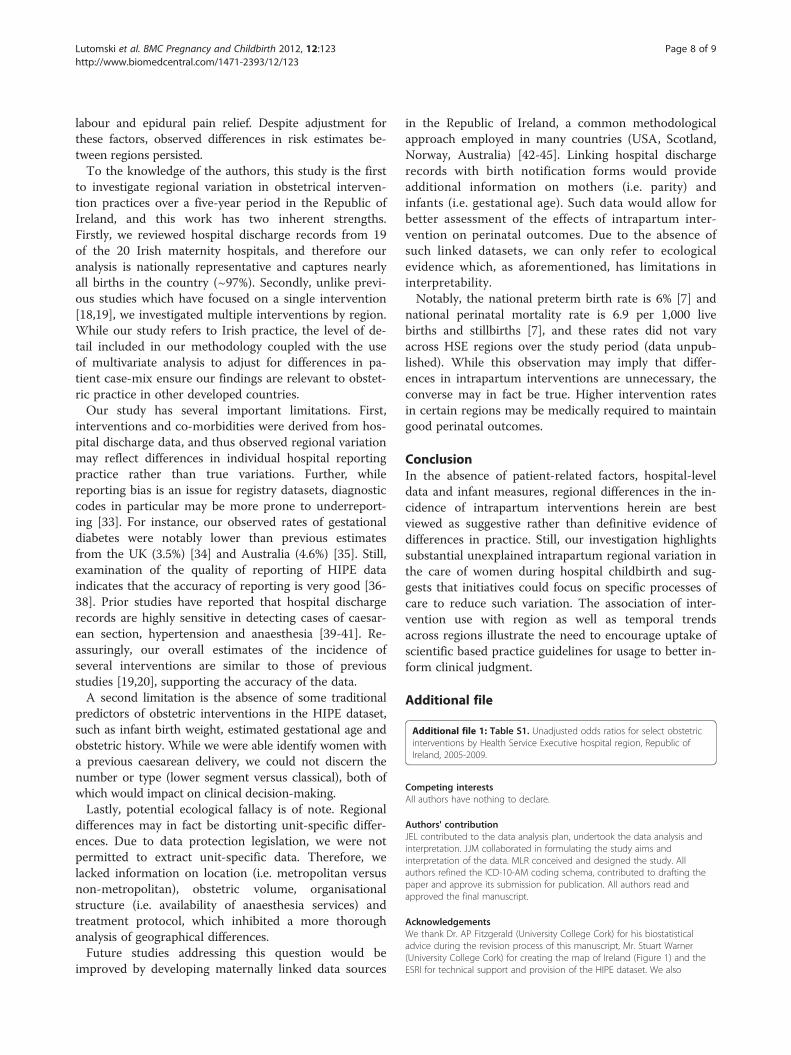
had nearly two-fold odds of having prostaglandins(adjusted OR: 1.75, 95% CI 1.68-1.82) (Table 3; Additionalfile 1: Table S1), which was significantly higher than theother regions. In comparison with the Dublin Mid Lein-ster region, the odds of receiving oxytocin were consider-ably lower in the three other regions. The odds ofundergoing AROM for induction of labour in the Westwere 1.85 times greater (95% CI 1.77-1.93) than DublinMid Leinster.Women delivering in the Dublin Northeast, South and
West regions had significantly increased odds of electivecaesarean delivery relative to women delivering in theDublin Mid Leinster region. Further, when considerationwas given to the lower limits of the confidence intervals,the West clearly had a higher rate than all other regions(adjusted OR: 2.74; 95% CI: 2.63-2.86). The DublinNortheast region had the highest odds of both emer-gency caesarean and vacuum-assisted delivery comparedto all other regions. Relative to Dublin Mid Leinster, theodds of forceps delivery was lower for all other regions,particularly the West.The odds of blood transfusion were highest in Dublin
Northeast. Women delivering in Dublin Northeast had0.40 (95% CI 0.39-0.42) the odds of having an episiot-omy, which was the lowest among all four regions.
DiscussionWe found considerable variation in rates of obstetricintervention for induction of labour, operative vaginaldelivery and epidural anaesthesia use across regions inthe Republic of Ireland. Regional differences in obstet-rical intervention have been reported within several largecountries, including the United Kingdom [18], France[19], Canada [20] and the United States [21]. Withapproximately four million residents, the Republic ofIreland is considerably smaller than these countries; yet,clear patterns in regional variation persisted within thissmall, relatively homogenous population. Although the
0
5
10
15
20
25
30
35
40
45
2005 2006 2007 2008 2009
Per
100
live
sin
gle
ton
del
iver
ies
(exc
lud
es e
lect
ive
caes
area
n d
eliv
erie
s)
Dublin Mid Leinster Dublin Northeast South West
Figure 2 Temporal variation in induction (all forms) usage by Health Service Executive hospital region, Republic of Ireland.
Lutomski et al. BMC Pregnancy and Childbirth 2012, 12:123 Page 6 of 9http://www.biomedcentral.com/1471-2393/12/123
Republic of Ireland has a historically good reputation forobstetric practice, our findings support that individualclinician opinion and practice may exert a strong influ-ence on obstetric intervention [21-23].Recognising the need for consistent practice guidelines
based on robust scientific evidence, obstetrical societiessuch as the Royal College of Obstetricians and Gynae-cologists (RCOG) [24], the National Institute for Healthand Clinical Excellence (NICE) [25,26], and the Ameri-can College of Obstetricians (ACOG) [27-29], publishguidelines intended to offer guidance by providing infor-mation to help clinicians decide how best to care forwomen, allowing for clinical judgment and women’s pre-ferences. Our findings highlight the need to improve theprocess of writing guidelines based on conclusive evi-dence for frequently practised obstetric interventionsand to expand the uptake of guidelines to clinicians[30,31]. Importantly, intervention measures require
0
1
2
3
4
5
6
7
2005 2006
Per
100
live
sin
gle
ton
del
iver
ies
(exc
lud
es e
lect
ive
caes
area
n d
eliv
erie
s)
Dublin Mid Leinster Dublin
Figure 3 Temporal variation in forceps-assisted deliveries by Health S
more specification of why they were performed to avoiddefining optimal rates based solely on threshold levels.These considerations are of particular importance forthe Republic of Ireland, which is currently developing itsown obstetric practice guidelines.Despite increased awareness from the medical commu-
nity and public that variations in the intrapartum interven-tion need to be addressed, interventions among this studycohort differed across region and over time. Several reasonsmay account for this observed variability, although ourstudy cannot confirm which of these may be most import-ant. Physicians and midwives practising in differentregions might be more likely to favour discretionary inter-ventions for which strong evidence is lacking [26,32]. Al-ternatively, women giving birth in different regionsmay be more likely to have underlying co-morbidities(i.e. hypertension) who are likely to benefit frominterventions.
2007 2008 2009
Northeast South West
ervice Executive hospital region, Republic of Ireland.
0
5
10
15
20
25
30
35
2005 2006 2007 2008 2009
Per
100
live
bir
th d
eliv
erie
s (e
xclu
des
cae
sare
an d
eliv
erie
s)
Dublin Mid Leinster Dublin Northeast South West
Figure 4 Temporal variation in episiotomy by Health Service Executive hospital region, Republic of Ireland.
Lutomski et al. BMC Pregnancy and Childbirth 2012, 12:123 Page 7 of 9http://www.biomedcentral.com/1471-2393/12/123
Nonetheless, our observations may have been a result ofother baseline geographical differences that we were un-able to explore in this analysis. For instance, parity, an im-portant factor for obstetric intervention, was lacking inthe dataset and could not be assessed across the regions.While seven of the 19 maternity units analysed in this
Table 3 Adjusted odds ratio for select obstetric interventionsIreland, 2005-2009
Dublin Mid Leinster
Induction of laboura,b
Prostaglandin 1.00
Oxytocin 1.00
Artificial rupture of membrane 1.00
Otherc 1.00
Total induction 1.00
Pain reliefa,d
Epidural anaesthesia 1.00
Mode of delivery
Elective caesareanb,e 1.00
Emergency caesareana,f 1.00
Vacuuma,f 1.00
Forcepsa,f 1.00
Non-operative vaginala,f 1.00
Select procedures
Blood transfusionb,e 1.00
Episiotomyg,h 1.00a Based on emergency caesarean or vaginal (operative and non-operative) deliverieb Adjusted for age, marital status, medical card possession, previous caesarean delivc Includes medical and surgical methods not elsewhere specified.d Adjusted for age, marital status, medical card possession, previous caesarean delive Based on all deliveries (N=323,588).f Adjusted for age, marital status, medical card possession, previous caesarean delivbetween induction of labour and epidural was also included in the model.g Based on vaginal deliveries only (N=243,291).h Adjusted for age, marital status, medical card possession, co-morbidities and oper
study have published data on parity in their individual an-nual clinical reports, we did not have enough informationto determine if parity significantly differed betweenregions. To minimise potential bias, we controlled for age,marital status, government medical assistance, maternalco-morbidities, previous caesarean delivery, induction of
by Health Service Executive hospital region, Republic of
Dublin Northeast South West
0.86 (0.82-0.90) 1.75 (1.68-1.82) 1.12 (1.07-1.17)
0.24 (0.22-0.25) 0.24 (0.23-0.26) 0.25 (0.23-0.26)
0.69 (0.65-0.72) 0.85 (0.81-0.89) 1.85 (1.77-1.93)
1.10 (1.06-1.13) 1.00 (0.97-1.03) 1.32 (1.28-1.36)
0.77 (0.75-0.79) 0.95 (0.92-0.97) 1.20 (1.17-1.23)
0.90 (0.88-0.92) 1.05 (1.03-1.07) 0.78 (0.77-0.80)
2.36 (2.26-2.46) 2.42 (2.33-2.52) 2.74 (2.63-2.86)
1.36 (1.31-1.40) 1.21 (1.18-1.25) 1.23 (1.19-1.27)
1.54 (1.50-1.59) 1.26 (1.22-1.29) 1.36 (1.32-1.41)
0.76 (0.72-0.79) 0.81 (0.78-0.85) 0.54 (0.51-0.58)
0.68 (0.67-0.70) 0.79 (0.77-0.81) 0.78 (0.76-0.80)
1.13 (1.03-1.23) 0.85 (0.78-0.93) 0.51 (0.46-0.57)
0.40 (0.39-0.42) 0.58 (0.57-0.60) 0.75 (0.72-0.77)
s only (N=286,495).ery and co-morbidities.
ery, co-morbidities and induction of labour.
ery, co-morbidities, induction of labour and epidural. The interaction term
ative vaginal delivery.
Lutomski et al. BMC Pregnancy and Childbirth 2012, 12:123 Page 8 of 9http://www.biomedcentral.com/1471-2393/12/123
labour and epidural pain relief. Despite adjustment forthese factors, observed differences in risk estimates be-tween regions persisted.To the knowledge of the authors, this study is the first
to investigate regional variation in obstetrical interven-tion practices over a five-year period in the Republic ofIreland, and this work has two inherent strengths.Firstly, we reviewed hospital discharge records from 19of the 20 Irish maternity hospitals, and therefore ouranalysis is nationally representative and captures nearlyall births in the country (~97%). Secondly, unlike previ-ous studies which have focused on a single intervention[18,19], we investigated multiple interventions by region.While our study refers to Irish practice, the level of de-tail included in our methodology coupled with the useof multivariate analysis to adjust for differences in pa-tient case-mix ensure our findings are relevant to obstet-ric practice in other developed countries.Our study has several important limitations. First,
interventions and co-morbidities were derived from hos-pital discharge data, and thus observed regional variationmay reflect differences in individual hospital reportingpractice rather than true variations. Further, whilereporting bias is an issue for registry datasets, diagnosticcodes in particular may be more prone to underreport-ing [33]. For instance, our observed rates of gestationaldiabetes were notably lower than previous estimatesfrom the UK (3.5%) [34] and Australia (4.6%) [35]. Still,examination of the quality of reporting of HIPE dataindicates that the accuracy of reporting is very good [36-38]. Prior studies have reported that hospital dischargerecords are highly sensitive in detecting cases of caesar-ean section, hypertension and anaesthesia [39-41]. Re-assuringly, our overall estimates of the incidence ofseveral interventions are similar to those of previousstudies [19,20], supporting the accuracy of the data.A second limitation is the absence of some traditional
predictors of obstetric interventions in the HIPE dataset,such as infant birth weight, estimated gestational age andobstetric history. While we were able identify women witha previous caesarean delivery, we could not discern thenumber or type (lower segment versus classical), both ofwhich would impact on clinical decision-making.Lastly, potential ecological fallacy is of note. Regional
differences may in fact be distorting unit-specific differ-ences. Due to data protection legislation, we were notpermitted to extract unit-specific data. Therefore, welacked information on location (i.e. metropolitan versusnon-metropolitan), obstetric volume, organisationalstructure (i.e. availability of anaesthesia services) andtreatment protocol, which inhibited a more thoroughanalysis of geographical differences.Future studies addressing this question would be
improved by developing maternally linked data sources
in the Republic of Ireland, a common methodologicalapproach employed in many countries (USA, Scotland,Norway, Australia) [42-45]. Linking hospital dischargerecords with birth notification forms would provideadditional information on mothers (i.e. parity) andinfants (i.e. gestational age). Such data would allow forbetter assessment of the effects of intrapartum inter-vention on perinatal outcomes. Due to the absence ofsuch linked datasets, we can only refer to ecologicalevidence which, as aforementioned, has limitations ininterpretability.Notably, the national preterm birth rate is 6% [7] and
national perinatal mortality rate is 6.9 per 1,000 livebirths and stillbirths [7], and these rates did not varyacross HSE regions over the study period (data unpub-lished). While this observation may imply that differ-ences in intrapartum interventions are unnecessary, theconverse may in fact be true. Higher intervention ratesin certain regions may be medically required to maintaingood perinatal outcomes.
ConclusionIn the absence of patient-related factors, hospital-leveldata and infant measures, regional differences in the in-cidence of intrapartum interventions herein are bestviewed as suggestive rather than definitive evidence ofdifferences in practice. Still, our investigation highlightssubstantial unexplained intrapartum regional variation inthe care of women during hospital childbirth and sug-gests that initiatives could focus on specific processes ofcare to reduce such variation. The association of inter-vention use with region as well as temporal trendsacross regions illustrate the need to encourage uptake ofscientific based practice guidelines for usage to better in-form clinical judgment.
Additional file
Additional file 1: Table S1. Unadjusted odds ratios for select obstetricinterventions by Health Service Executive hospital region, Republic ofIreland, 2005-2009.
Competing interestsAll authors have nothing to declare.
Authors' contributionJEL contributed to the data analysis plan, undertook the data analysis andinterpretation. JJM collaborated in formulating the study aims andinterpretation of the data. MLR conceived and designed the study. Allauthors refined the ICD-10-AM coding schema, contributed to drafting thepaper and approve its submission for publication. All authors read andapproved the final manuscript.
AcknowledgementsWe thank Dr. AP Fitzgerald (University College Cork) for his biostatisticaladvice during the revision process of this manuscript, Mr. Stuart Warner(University College Cork) for creating the map of Ireland (Figure 1) and theESRI for technical support and provision of the HIPE dataset. We also

Lutomski et al. BMC Pregnancy and Childbirth 2012, 12:123 Page 9 of 9http://www.biomedcentral.com/1471-2393/12/123
acknowledge all data entry personnel for the accurate and timely entry ofHIPE data.
FundingThis research was supported by the National Perinatal Epidemiology Centreof Ireland.
Author details1National Perinatal Epidemiology Centre, Department of Obstetrics andGynaecology, Cork University Maternity Hospital 5th floor, Wilton, Cork,Ireland. 2Department of Obstetrics and Gynaecology, Clinical ScienceInstitute, National University of Ireland, Galway, Ireland. 3Department ofEpidemiology and Public Health, University College Cork, Cork, Ireland.
Received: 3 May 2011 Accepted: 25 October 2012Published: 5 November 2012
References1. Althabe F, Buekens P, Bergel E, et al: A behavioral intervention to improve
obstetrical care. N Engl J Med 2008, 358:1929–1940.2. von Dadelszen P, Sawchuck D, McMaster R, et al: The active
implementation of pregnancy hypertension guidelines in BritishColumbia. Obstet Gynecol 2010, 116:659–666.
3. Raleigh VS, Cooper J, Bremner SA, Scobie S: Patient safety indicators forEngland from hospital administrative data: case–control analysis andcomparison with US data. BMJ 2008, 337:a1702.
4. Deneux-Tharaux C, Macfarlane A, Winter C, Zhang WH, Alexander S,Bouvier-Colle MH: Policies for manual removal of placenta at vaginaldelivery: variations in timing within Europe. BJOG 2009, 116:119–124.
5. Knight M, Callaghan WM, Berg C, et al: Trends in postpartum hemorrhagein high resource countries: a review and recommendations from theInternational Postpartum Hemorrhage Collaborative Group. BMCPregnancy Childbirth 2009, 9:55.
6. Zeitlin J, Mohangoo A, Cuttini M, et al: The European Perinatal Health Report:comparing the health and care of pregnant women and newborn babies inEurope. J Epidemiol Community Health 2009, 63:681–682.
7. Perinatal Statistics Report 2009. The Economic and Social Research Institute;2010. Accessed May 1, 2012, at http://www.esri.ie/health_information/nprs/nprs_reports/.
8. Zimbeck M, Mohangoo A, Zeitlin J: The European perinatal health report:delivering comparable data for examining differences in maternal andinfant health. Eur J Obstet Gynecol Reprod Biol 2009, 146:149–151.
9. The Economic and Social Research Institute: Activity in Acute Public Hospitalsin Ireland 2008 Annual Report. Dublin: ERSI; 2010.
10. Maternity Care Services. Health Services Executive; 2010. Accessed September19, 2010, at http://www.hse.ie/eng/services/Find_a_Service/maternity/.
11. Butler JS, Fitzpatrick P, Ni Mhaolain AM, Synnott K, O’Byrne JM: Themanagement and functional outcome of isolated burst fractures of thefifth lumbar vertebra. Spine (Phila Pa 1976) 2007, 32:443–447.
12. El-Gohary Y, Alagtal M, Gillick J: Long-term complications followingoperative intervention for intestinal malrotation: a 10-year review.Pediatr Surg Int 2010, 26:203–206.
13. Kearney D, Cahill RA, O’Brien E, Kirwan WO, Redmond HP: Influence ofdelays on perforation risk in adults with acute appendicitis.Dis Colon Rectum 2008, 51:1823–1827.
14. Malik SA, Murphy M, Connolly P, O’Byrne J: Evaluation of morbidity,mortality and outcome following cervical spine injuries in elderlypatients. Eur Spine J 2008, 17:585–591.
15. Neary P, Hurson C, Briain DO, et al: Abdominal aortic aneurysm repair andcolonic infarction: a risk factor appraisal. Colorectal Dis 2007, 9:166–172.
16. Shaddique S, Cahill RA, Watson RG, O’Connor J: Trends in the incidenceand significance of presentations to the emergency department due toacute pancreatitis. Eur J Emerg Med 2006, 13:209–213.
17. Lutomski JE, Morrison JJ, Greene RA, Lydone-Rochelle MT: Maternal morbidityduring delivery hospitalization in Ireland. Obstet Gynecol 2010, 117:596–602.
18. Bragg F, Cromwell DA, Edozien LC, et al: Variation in rates of caesareansection among English NHS trusts after accounting for maternal andclinical risk: cross sectional study. BMJ 2010, 341:c5065.
19. Benhamou D, Bouaziz H, Chassard D, et al: Anaesthetic practices forscheduled caesarean delivery: a 2005 French national survey.Eur J Anaesthesiol 2009, 26:694–700.
20. Chalmers B, Kaczorowski J, Levitt C, et al: Use of routine interventions invaginal labor and birth: findings from the Maternity Experiences Survey.Birth 2009, 36:13–25.
21. Menacker F, Hamilton BE: Recent trends in cesarean delivery in theUnited States. NCHS Data Brief 2010, 35:1–8.
22. Deneux-Tharaux C, Dupont C, Colin C, et al: Multifaceted intervention todecrease the rate of severe postpartum haemorrhage: the PITHAGORE6cluster-randomised controlled trial. BJOG 2010, 117:1278–1287.
23. Funk C, Anderson BL, Schulkin J, Weinstein L: Survey of obstetric andgynecologic hospitalists and laborists. Am J Obstet Gynecol 2010, 203:177. e1-4.
24. Royal College of Obstetricians and Gynaecologists: Green-top Guideline No. 26:Operative vaginal delivery. London: RCOG; 2011.
25. National Collaborating Centre for Women’s and Children’s Health:Induction of labour. London: National Institute for Health and ClinicalExcellence; 2008.
26. Sheehan SR, Wedisinghe L, Macleod M, Murphy DJ: Implementation ofguidelines on oxytocin use at caesarean section: a survey of practice inGreat Britain and Ireland. Eur J Obstet Gynecol Reprod Biol 2010, 148:121–124.
27. ACOG Committee on Practice Bulletins - Obstetrics: ACOG Practice BulletinNo. 107: Induction of labor. Obstet Gynecol 2009, 114:386–397.
28. ACOG Committee on Practice Bulletins - Obstetrics: ACOG Practice BulletinNo. 115: Vaginal birth after previous cesarean delivery. Obstet Gynecol2010, 116:450–463.
29. ACOG Committee on Practice Bulletins - Obstetrics: ACOG Practice BulletinNo. 71: Episiotomy. Obstet Gynecol 2006, 107:957–962.
30. Tricoci P, Allen JM, Kramer JM, Califf RM, Smith SC Jr: Scientific evidenceunderlying the ACC/AHA clinical practice guidelines. JAMA 2009, 301:831–841.
31. Krahn M, Naglie G: The next step in guideline development:incorporating patient preferences. JAMA 2008, 300:436–438.
32. Valbo A, Gjessing L, Herzog C, Goderstad JM, Laine K, Valset AM: Analsphincter tears at spontaneous delivery: a comparison of five hospitalsin Norway. Acta Obstet Gynecol Scand 2008, 87:1176–1180.
33. Chantry AA, Deneux-Tharaux C, Cans C, et al: Hospital discharge data canbe used for monitoring procedures and intensive care related to severematernal morbidity. J Clin Epidemiol 2011, 69:1014–1022.
34. National Collaborating Centre for Women’s and Children’s Health: Diabetes inpregnancy: Management of diabetes and its complications from preconception to thepostnatal period. London: National Institute for Health and Clinical Excellence; 2008.
35. Templeton M, Pieris-Caldwell I: Gestational diabetes mellitus in Australia,2005–2006. Canberra: AIHW; 2008. Cat. no. CVD 44.
36. Bramley M, Reid B: Evaluation standards for clinical coder training. HIM J2007, 36:20–30.
37. Bramley M, Reid BA: Clinical coder training initiatives in Ireland. HIM J2005, 34:40–46.
38. Bramley M, Reid BA: Morbidity data quality initiatives in Ireland. HIM J2005, 34:47–53.
39. Roberts CL, Ford JB, Lain S, Algert CS, Sparks CJ: The accuracy of reportingof general anaesthesia for childbirth: a validation study. Anaesth IntensiveCare 2008, 36:418–424.
40. Roberts CL, Bell JC, Ford JB, Morris JM: Monitoring the quality of maternitycare: how well are labour and delivery events reported in populationhealth data? Paediatr Perinat Epidemiol 2009, 23:144–152.
41. Roberts CL, Bell JC, Ford JB, Hadfield RM, Algert CS, Morris JM: The accuracyof reporting of the hypertensive disorders of pregnancy in populationhealth data. Hypertens Pregnancy 2008, 27:285–297.
42. Mealing NM, Roberts CL, Ford JB, Simpson JM, Morris JM: Trends ininduction of labour, 1998–2007: a population-based study. Aust N Z JObstet Gynaecol 2009, 49:599–605.
43. Pasupathy D, Wood AM, Pell JP, Fleming M, Smith GC: Time of birth andrisk of neonatal death at term: retrospective cohort study. BMJ 2010,341:c3498.
44. Vikse BE, Irgens LM, Leivestad T, Skjaerven R, Iversen BM: Preeclampsia andthe risk of end-stage renal disease. N Engl J Med 2008, 359:800–809.
45. Zhang X, Joseph KS, Kramer MS: Decreased term and posttermbirthweight in the United States: impact of labor induction. Am J ObstetGynecol 2010, 203:124. e1-7.
doi:10.1186/1471-2393-12-123Cite this article as: Lutomski et al.: Regional variation in obstetricalintervention for hospital birth in the Republic of Ireland, 2005–2009.BMC Pregnancy and Childbirth 2012 12:123.
Related Documents