DOCUMENTS TECHNIQUES Regional trade and border markets between Niger, Benin and Nigeria: A methodological note Olivier WALTHER Michel TENIKUE Mathias KUEPIE Document Technique n°2012-03 October 2012

Welcome message from author
This document is posted to help you gain knowledge. Please leave a comment to let me know what you think about it! Share it to your friends and learn new things together.
Transcript

DOCUMENTS TECHNIQUES
Regional trade and border markets between Niger, Benin and Nigeria: A methodological note
Olivier WALTHERMichel TENIKUEMathias KUEPIE
Document Technique n°2012-03October 2012


Regional trade and border markets between Niger,
Benin and Nigeria: A methodological note1
Olivier Walther1,2
, Michel Tenikue2, Mathias Kuepié
2
1 Department of Geography,
2 Afrilux Research Unit
Centre for Population, Poverty and Public Policy Studies (CEPS/INSTEAD)
3 avenue de la Fonte, L-4364 Esch/Belval, Luxembourg
E-mail: [email protected] (corresponding author)
15 October 2012
Abstract
The objective of this methodological paper is to identify a number
of products or sectors whose trade is relevant for border regions in
West Africa. Focussing on Niger, Benin and Nigeria, we start with
contextualising the importance of border markets by quantifying the
changes in the relative values and volumes of imports and exports
passing through border posts. In a second step, we determine which
are the products most commonly found among the imports and
exports of the border posts. The study shows that seven products are
recognised as being heavily imported, subject to significant trade
from large traders, and considered as re-export products: building
materials, cereals and flour, textile, used clothing, used vehicles,
cigarettes and oil.
Keywords: regional trade; border markets; imports; exports; Niger;
Benin; Nigeria; West Africa
JEL classification codes: F14; F15; F23; O24
1 This research is supported by core funding from the Ministry of Higher Education and Research of
Luxembourg (CROSSTRADE FNR Project C10/LM/783313).

2
1. Introduction
The objective of this methodological paper is to identify a number of products or sectors
whose trade is relevant for border regions in West Africa. Focussing on Niger, Benin and
Nigeria, we start with contextualising the importance of border markets by quantifying the
changes in the relative values and volumes of imports and exports passing through the
border posts of Gaya and Birni N’Konni in Niger.
In a second step, we determine which are the products most commonly found among the
imports and exports of Gaya and Birni N’Konni. Our work makes use of various sources:
official data from the Niger Customs Administration, existing field surveys, and lists of
goods that are subject to an import ban in Nigeria. Combining these sources, the study
shows that building materials, cereals and flour, textile, used clothing and vehicles,
cigarettes and oil are recognised as being heavily imported, subject to significant trade from
large traders, and considered as re-export products in the two border regions under scrutiny.
The list of these products will provide the foundation for conducting field surveys on small
and large traders in the framework of the Informal Trade and Cross-Border Integration in
West Africa (CROSSTRADE) project described in Appendix 1.
2. Data selection and case study
Our analysis uses data from the years 2003 to 2010 on both the values and volumes of
declared goods, provided by the Nigerien Customs Administration (DGD) and the National
Institute for Statistics (INS) in Niger. The decision to use Nigerien data is motivated by the
fact that Niger serves as a transit country for a number of re-exports to Nigeria. This re-
export trade is of particular importance for the two border markets of Gaya and Birni
N’Konni in Niger, as well as for the twins markets of Malanville (Benin) and Kamba and
Illela (Nigeria) (see Map 1). These flows are also of particular importance to Nigerien
domestic consumption. According to recent studies, the Cotonou corridor, where Gaya is
located, accounts for almost all oil imports and about 44% of imported goods from Niger
(Gouvernement du Niger 2008).

3
It should be noted that Nigerien customs data do not always records flows at the specific
border posts through which goods enter or leave the country. This is the case in particular
for uranium exports and oil imports, which are recorded at the Arlit and Dosso and/or
Niamey customs desks respectively. These two products are the two main sources of
Niger’s income and expenditure and their inclusion significantly alters the relative shares of
border posts in this study. In order to give an accurate impression of the importance of
border posts relative to the national economy, it was therefore deemed necessary to
reallocate these flows to the border posts where they physically enter or leave Niger. In
practice, this means that we have allocated exports of uranium and imports of oil to the
Gaya border post, through which all enriched uranium from Niger passes before going to
Cotonou, and through which all legally-imported Nigerien oil transits. This reallocation
was done using the combined imports of oil, gasoline, diesel and fuel published by the INS
to provide volumes, and chapter 27 of the INS fuels and mineral oils nomenclature to
provide the values.
Map 1. The Gaya, Malanville, Kamba, Birni N’Konni and Illela border markets
Source: authors.

4
3. The importance of border posts within the Nigerien national economy
The border posts of Gaya and Birni N’Konni play very different, albeit complementary,
roles within the international trade of Niger. The following analysis shows that Gaya is
increasing the main gateway for the country’s imports, while Birni N’Konni is declining as
a gateway for official agricultural and mining exports and livestock at a regional scale.
In 2010, imports through the border post of Gaya accounted for 13.3% of national imports
by value and 14.7% by volume, as shown by Figure 1. Since 2003, fluctuations in these
imports have remained relatively small, representing a maximum of 23.3% of the total
national value and 19.5% by volume. Exports through Gaya represented 73.3% of total
Nigerien exports in terms of value in 2010, but only 2.4% by volume, which is due to the
fact that, other than onions and livestock, most outflows from Gaya are accounted for by
uranium, a product with an average export price of FCFA 55,000 per kilo in 2009.
Figure 1. Proportion of national imports and exports passing through Gaya, in %, 2003-10
Sources: Niger Customs Administration and Niger National Institute for Statistics (INS).
Authors’ calculation. Note: our figures include uranium exports and oil imports.
In 2010, Birni N’Konni accounted for a negligible proportion of national imports by value

5
(0.6%) and by volume (2.0%), as shown by Figure 2. Similarly, the value of exports from
this border crossing was extremely low (1.5%), and remained so over the whole of the
period under consideration. The volumes are, however, relatively high (10.5% in 2010),
although they have been subject to a downwards trend since 2003. According to surveys
conducted in 2012 with freight agents, this trend does not reflect the reality of cross-border
trade activities, which have increasingly increased since the beginning of the 2000s. The
observed diminution of exports is, according to these agents, explained by the fact that
exports have been under-recorded by Customs Authorities from 2004 to 2010.
Figure 2. Proportion of national imports and exports passing through Birni N’Konni, in %,
2003-10
Sources: Niger Customs Administration. Authors’ calculation.
4. Selection of products
There are three possible ways of selecting the list of product or economic sectors on which
to base cross-border trade surveys: building on data from Customs Authorities, using
existing field surveys, or working on goods that are subject to an import ban in Nigeria.

6
4.1. Main Nigerien imports and exports
The first option is to use official data from the Niger Customs Administration to identify
which products are most heavily traded through Gaya and Birni N’Konni. We focus first on
import data, as these flows are significantly greater in terms of value and volume for a
landlocked country such as Niger than exports. We select the most relevant imports for the
two border crossings considered in this study. We then describe exports flows for both
places, with a particular emphasis on Birni N’Konni, due to the weakness of official exports
flowing through Gaya over recent decades.
According to Table 1, the most imported products, in terms of value, in Gaya in 2010 were
those relating to the construction industry (sectors 25 and 72), cereals and flour (10, 11, 19
and 23), textiles, second-hand clothes and shoes (62, 63, and 64), food-processing products
(4, 17), chemical products (28 and 34), vehicles (87) and tobacco (24).
Table 1. Most imported products in Gaya, 2010 (value over FCFA 100 million)
Sector Label Value in FCFA
25
Salt; sulphur; earths and stone; plastering materials, lime and
cement 12 573 074 273
10 Cereals 2 841 547 278
11
Products of the milling industry; malt; starches; inulin; wheat
gluten 449 082 454
72 Iron and steel 360 592 232
63 Footwear, gaiters and the like; parts of such articles 355 662 818
19 Prep. of cereals, flour, starch or milk; pastrycooks’ products 233 145 988
17 Sugars and sugar confectionery 232 649 754
34
Soap, organic surface-active agents, washing preparations,
lubricating preparations, artificial waxes 208 072 846
28
Inorganic chemicals; organic or inorganic compounds of
precious/rare-earth/radioactive metals, or isotopes 178 025 533
87
Vehicles other than railway or tramway rolling stock, and parts
and accessories thereof 162 898 270
4
Dairy produce; birds’ eggs; natural honey; edible products of
animal origin, not elsewhere specified or included 143 990 176
62
Articles of apparel and clothing accessories, not knitted or
crocheted 142 469 547
24 Tobacco and manufactured tobacco substitutes 128 281 842
64 Footwear, gaiters and the like; parts of such articles 127 589 137
23
Residues and waste from the food industries; prepared animal
fodder 122 165 925
Source: Niger Customs Administration. Note: oil is not included. Simplified definition of
goods according to the Combined Nomenclature of the European Union.

7
As shown in Table 2, these products are also the most imported in terms of volume, albeit
sometimes in a different order for a few highly valuable but lightweight goods, such as
tobacco. Oil imports are not considered here as there are no data for regional flows for this
product, which represents by far the greatest import, with an estimated value of CFA 93
billion in 2010 for Niger, based on 2008 INS data.
Table 2. Most imported products in Gaya, 2010 (volume over 1000 t)
Sector Label Volume in tons
25
Salt; sulphur; earths and stone; plastering materials, lime and
cement 123 482
10 Cereals 17 986
24 Tobacco and manufactured tobacco substitutes 6 723
11
Products of the milling industry; malt; starches; inulin; wheat
gluten 2 088
23
Residues and waste from the food industries; prepared animal
fodder 1 969
34
Soap, organic surface-active agents, washing preparations,
lubricating preparations, artificial waxes 1 941
72 Iron and steel 1 558
17 Sugars and sugar confectionery 1 510
28
Inorganic chemicals; organic or inorganic compounds of
precious/rare-earth/radioactive metals, or isotopes 1 383
64 Footwear, gaiters and the like; parts of such articles 1 331
19
Preparations of cereals, flour, starch or milk; pastrycooks’
products 1 298
Source: Niger Customs Administration. Note: oil is not included. Simplified definition of
goods according to the Combined Nomenclature of the European Union.
In Birni N’Konni, the most imported products in terms of value and volume in 2010 were
those relating to the construction industry (sector 25), cereals and flour (10, 11, and 19),
food-processing products (21), and vehicles (87), as shown in Table 3 and 4. The most
noticeable difference with the border post of Gaya is the presence of mineral fuels and
mineral oils (27), animal and vegetable fats (15), and fruits (8). One should note, however,
that oil is very heavily traded in Gaya as well, albeit in an informal and illegal manner,
between Nigeria and Niger, and that fruit is produced in the region and exported regionally
(Walther 2008).

8
Table 3. Most imported products in Birni N’Konni, 2010 (value over FCFA 100 million)
Sector Label Value in FCFA
25
Salt; sulphur; earths and stone; plastering materials, lime and
cement 1 637 108 649
21 Miscellaneous edible preparations 814 479 898
27
Mineral fuels, mineral oils and products of their distillation;
bituminous substances; mineral waxes 502 839 284
11
Products of the milling industry; malt; starches; inulin; wheat
gluten 424 082 184
10 Cereals 412 279 896
19 Prep. of cereals, flour, starch or milk; pastrycooks’ products 337 302 746
8 Edible fruit and nuts; peel of citrus fruit or melons 259 730 501
87
Vehicles other than railway or tramway rolling stock, and parts
and accessories thereof 196 647 254
15
Animal or vegetable fats and oils and their cleavage products;
prepared edible fats; animal or vegetable waxes 127 472 970
Source: Niger Customs Administration. Simplified definition of goods according to the
Combined Nomenclature of the European Union.
Table 4. Most imported products in Birni N’Konni, 2010 (volume over 1000 t)
Sector Label Volume in tons
25
Salt; sulphur; earths and stone; plastering materials, lime and
cement 18 093
10 Cereals 2 979
19 Prep. of cereals, flour, starch or milk; pastrycooks’ products 2 084
11
Products of the milling industry; malt; starches; inulin; wheat
gluten 1 651
27
Mineral fuels, mineral oils and products of their distillation;
bituminous substances; mineral waxes 1 612
23
Residues and waste from the food industries; prepared animal
fodder 1 414
94
Furniture; bedding, mattresses and cushions; lamps, illuminated
signs and the like; prefabricated buildings 1 078
Source: Niger Customs Administration. Simplified definition of goods according to the
Combined Nomenclature of the European Union.
Over recent years, the Gaya border post has experienced sustained growth in the value and
volume of imports, going from CFA 5.5 billion in 2003 to CFA 18.8 billion in 2010, and
from 38,900 to 166,700 tonnes (Figure 3). In contrast, Birni N’Konni has experienced
uneven growth and has strongly been affected by a downturn in 2007 (Figure 4). The value
of goods increased from CFA 3.3 to 5.4 billion, and from 26,600 to 33,000 tonnes, between
2003 and 2010. This represents about a third of the value, or a fifth of the volume, of the
imports passing through Gaya.

9
Figure 3. Total imports, Gaya, 2003-2010
Source: Niger Customs Administration.
Figure 4. Total imports, Birni N’Konni, 2003-2010
Source: Niger Customs Administration.

10
Between 2003 and 2010, goods crossing the border at Gaya were subject to contradictory
trends. The following section describes the changes in the most relevant products in terms
of value and volume, starting with cement and then moving on to rice, wheat and maize
imports.
Cement imports have experienced continuous and rapid growth since 2003 in Gaya. Such
growth mirrors the urbanisation of West African societies and is consequently not affected
by seasonal or climatic variations (Figure 5). Cement is currently the biggest import, worth
FCFA 12 billion in 2010.
Figure 5. Cement imports by value and volume, Gaya, 2003-2010
Source: Niger Customs Administration. The following codes have been used: 2523100000,
2523210000, 2523290022, 2523290029, 2523300000, and 2523900000.
In both markets, cereals and flour imports are of particular significance, especially rice and
maize (sector 10, Figure 6), and wheat (sector 11, Figure 7), which is unsurprising given
Niger’s chronic food deficit. The huge potential for the development of rice in the region,
and the considerable imports from international market, have attracted the attention of
many policy makers. With 10 million tonnes produced and 16 million tonnes consumed in
2009, rice is certainly the cereal with the greatest potential for irrigated production in West

11
Africa. For such countries as Niger, rice has become the “principal food staple” (African
Economic Outlook 2011). Figure 6 shows that recent changes in rice imports have been
marked by upward and downward trends, with the peaks corresponding to the food crises of
2004/2005 and 2009/2010.
It should also be noted that maize is of growing importance within the region. With 16
million tonnes produced in 2009, maize is now recognised as the “first cereal of the region”
(Soulé 2011: 29) and has greatly benefited from the recent growth in the regional
agricultural market in West Africa. Maize is also the cereal that circulates the most within
the region, notably through cross-border networks, while West African rice flows are
generally local. In both cases, Nigeria is by far the largest producer, accounting for 50%
and 40% of the regional production of rice and maize respectively. As shown in Figure 7,
the changes in wheat and maize imports is extremely difficult to interpret and only partially
correspond to food crises. Wheat was heavily imported in 2005, probably due to
insufficient rainfall, but maize imports peaked in 2008, a year with normal rainfall levels.
The year 2004 appears to be highly atypical.
Figure 6. Rice imports, Gaya, 2003-2010
Source: Niger Customs Administration. The following codes have been used: 1006109000,
1006200000, 1006301000, 1006309000, and 1006400000.

12
Niger imports most of its corn from Benin and Nigeria (Coste and Soulé 2003). Production
areas are located in the Atakora (Natitingou) and Borgou (Nikki, Kalala, Perer, Ndali) in
Benin. In Nigeria, rice is grown mainly around the cities of Sokoto, Argungu, Jega,
Gumjiji, and Yelwa.
Figure 7. Wheat and maize imports by value, Gaya, 2003-2010
Source: Niger Customs Administration. The following codes have been used: Wheat
(1101000000, 1102200000, 1103110000, and 1001100000), Maize (1005900000,
1102200000, and 1511109090). Wheat data for 2008 are unavailable; here, estimates are
based on 2006/2007, another year with normal levels of rainfall. Maize data for 2010 are
unavailable.
With regard to exports, the literature shows that Niger’s exports have generally been stable
over the past 10 years (Gouvernement du Niger 2008). This stability is not, however,
reflected in the flows measured at the regional border points, which have recorded strong
annual variations since 2003. In Gaya, for example, 2004 was marked by a major fall, due
to the boycotting of the port of Cotonou in Benin by Nigerien carriers, which had the effect
of redirecting flows to Lomé in Togo and Tema in Ghana (see Walther 2008: 174). Apart
from these downturns, the general trend is of a decline in the exports passing through the
two border posts. In Gaya, as shown in Figure 8, exports fell to just one tenth of their initial
volume between 2003 and 2009, from 984 tonnes to just 91 tonnes, while the value of such
exports decreased from FCFA 534.6 to just 38.7 million. The fall was particularly marked
after 2005.

13
Figure 8. Total exports, Gaya, 2003-2010
Source: Niger Customs Administration. Note: uranium is not included.
At Birni N’Konni, exports declined, to FCFA 33.0 million and 5.4 million tonnes in 2010
(Figure 9). Birni N’Konni exports are almost 10 times greater than those crossing the
border at Gaya. This situation contrasts with that of imports, discussed above, as the
changes experienced by and the relative importance of the two border posts is completely
reversed depending on whether one considers incoming or outcoming flows.
Figure 9. Total exports, Birni N’Konni, 2003-2010
Source: Niger Customs Administration.
14
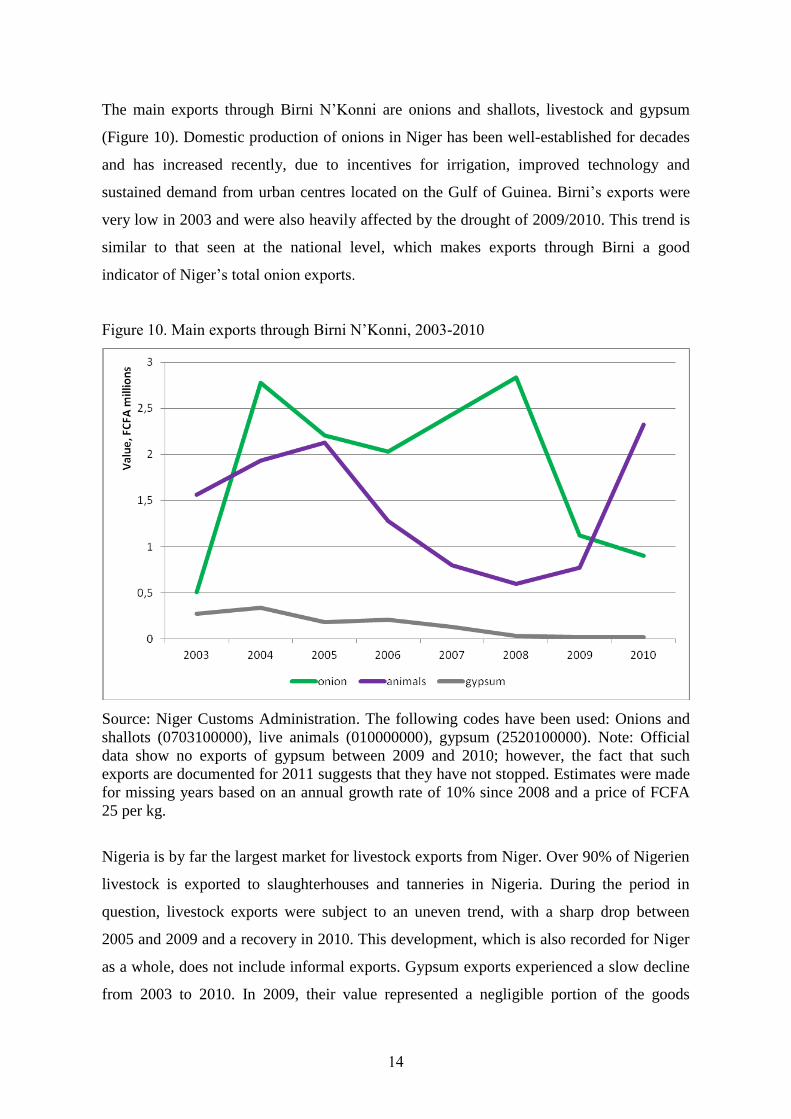
The main exports through Birni N’Konni are onions and shallots, livestock and gypsum
(Figure 10). Domestic production of onions in Niger has been well-established for decades
and has increased recently, due to incentives for irrigation, improved technology and
sustained demand from urban centres located on the Gulf of Guinea. Birni’s exports were
very low in 2003 and were also heavily affected by the drought of 2009/2010. This trend is
similar to that seen at the national level, which makes exports through Birni a good
indicator of Niger’s total onion exports.
Figure 10. Main exports through Birni N’Konni, 2003-2010
Source: Niger Customs Administration. The following codes have been used: Onions and
shallots (0703100000), live animals (010000000), gypsum (2520100000). Note: Official
data show no exports of gypsum between 2009 and 2010; however, the fact that such
exports are documented for 2011 suggests that they have not stopped. Estimates were made
for missing years based on an annual growth rate of 10% since 2008 and a price of FCFA
25 per kg.
Nigeria is by far the largest market for livestock exports from Niger. Over 90% of Nigerien
livestock is exported to slaughterhouses and tanneries in Nigeria. During the period in
question, livestock exports were subject to an uneven trend, with a sharp drop between
2005 and 2009 and a recovery in 2010. This development, which is also recorded for Niger
as a whole, does not include informal exports. Gypsum exports experienced a slow decline
from 2003 to 2010. In 2009, their value represented a negligible portion of the goods

15
flowing through Birni N’Konni (CFA 18.7 million). This product is artisanally mined in the
Iullemeden basin and sold to the cement factory of Malbaza in Niger, or exported to
Nigeria.
4.2. Sectors of activity of local traders
The second means of identifying key products is to examine the main sectors of activity for
large traders working in border markets. According to field surveys conducted in 2009 in
the three markets of Gaya, Malanville and Kamba (Walther 2012), building materials,
cereals, and manufacturing products are primarily consumed within Niger, whereas used
clothes, second-hand cars, fuel, cigarettes are re-exported to other African countries (Table
5). Large differences between markets indicate that traders are specialising in certain
products according to their location.
Table 5. Main sectors of activity for large traders, 2009
Wholes
ale
Second-
hand cars
and parts
Transpo
rt
Used
clothes
Fuel Building
materials
Other Total
Gaya 19 2 12 10 1 3 3 50
Malanvil
le
10 4 2 0 0 1 6 23
Kamba 1 9 0 0 5 0 4 19
Total 30 15 14 10 6 4 13 92
Source: Walther 2012. Note: the category ‘Wholesale’ includes cereals and the category
‘Other’ includes cigarettes and textiles.
These results, obtained at the scale of the three border markets, confirm the macro-analysis
performed earlier on the basis of data from Nigerien Customs Authorities, which showed
that the most relevant products for border regions are a combination of nationally-
consumed and re-exported goods. The next section elaborates in greater detail on the latter
types of goods.
4.3. Banned goods in Nigeria
A third possible means of selecting relevant products is to look at goods that are subject to
an import ban in Nigeria. Given that Nigeria is the principal market of the region and the
engine of most of the re-export trade, goods can be selected according to their likelihood of
being traded because their import is illegal or subject to high tax rates.

16
Table 6 shows goods whose import is prohibited in Nigeria in 2011, according to the
Nigerian Customs authorities. Not all such goods are traded regionally, because their re-
export is not profitable on a regional scale or because some products are cheaper in Nigeria
than in Niger. Goods that are likely to be re-exported to Nigeria, indicated in bold, include
vegetable oil (4), spaghetti and noodles (6), cement (9), second-hand tyres (15), textiles
(18), used fridges (21), used vehicles (22) and furniture (23). In addition, second-hand
clothes are classified as goods whose importation “is absolutely prohibited” in another list
provided by the Customs Authorities. Studies devoted to re-export trade between Nigeria
and its neighbours show that rice, cigarettes and oil can be included in this category, in
addition to second-hand tyres, second-hand vehicles, textiles and second-hand clothes
(Amselle and Grégoire 1988, Soulé 2001: 39, Gouvernement du Niger 2008: 12-13).
Table 6. Simplified list of goods whose import is prohibited in Nigeria in 2011
1 Live or Dead Birds including Frozen Poultry
2 Pork, Beef
3 Birds Eggs
4 Refined Vegetable Oils and Fats
5 Cocoa Butter, Powder and Cakes
6 Spaghetti/Noodles
7 Fruit Juice in Retail Packs
8 Waters, Beer and Stout
9 Bagged Cement
10 Medicaments falling under Headings 3003 and 3004
11 Waste Pharmaceuticals
12 Soaps and Detergents in retail packs
13 Mosquito Repellent Coils
14 Sanitary Wares of Plastics and Domestic Articles and Wares of Plastics
15 Rethreaded and used Pneumatic tyres
16 Corrugated Paper and Paper Boards
17 Telephone Re-charge Cards and Vouchers
18 Textile Fabrics of all types and articles
19 All types of Foot Wears and Bags
20 Hollow Glass Bottles
21 Used Compressors, Used Air Conditioners and Used Fridges/Freezers
22 Used Motor Vehicles above fifteen (15) years
23 Furniture
24 Ball Point Pens
Source: Nigeria Customs Administration. A complete list containing exceptions and details
is available here: http://www.customs.gov.ng/ProhibitionList/import.php.

17
The future of the re-export trade in West Africa appears uncertain. Some authors argue that
re-exporting is no longer the dominant way of doing business in the region and that the
growing importance of farm production should be taken into account (Soulé 2000: 39).
Long-distance re-exporting of manufactured goods and agricultural products is obviously
no longer as important as it was 1970s and 1980s (see Grégoire 1991). These authors also
note that the re-export trade has declined over recent decades, as is the case for second-
hand clothes, which face fierce competition from Chinese exports (Brédeloup and Lombard
2008), and second-hand vehicles, which experienced a sharp drop in demand in the 2000s
(Beuving 2006).
The re-export trade is also under stress because Nigeria recently lowered its tariffs, which
has made re-exported goods less competitive on the Nigerian market than was previously
the case. As Soulé (2000: 39) noted a decade ago, “Only goods subjects to import bans
(second-hand clothes, second-hand tyres) or severe taxes (wax fabrics, liqueurs) are still
worth trading”. It is certainly true that Nigeria’s liberalisation of trade policy has led to a
process of harmonisation of tariffs among West African countries, which, in turn, has
reduced re-export opportunities.
Examination of the main re-export flows crossing the Gaya border post, shown in Figure
11, confirms the global trend described above. Second-hand clothes, cigarettes and textiles
have experienced relative decline over recent years. Second-hand clothes are still the main
re-exported goods, giving rise to the development of large storage facilities in border
regions, in particular in Gaya, which seems to have increasingly specialised in this trade
(Walther 2008, 2009). This trade was worth FCFA 332 billion in 2010, more than twice the
value of cigarette re-export flows (the latter being worth FCFA 128 billion in the same
period). Textiles have experienced a long and sustained decline since the early 2000s and
were worth only FCFA 42 billion in 2010.

18
Figure 11. Main re-export flows imported through Gaya, 2003-2010
Source: Niger Customs Administration. The following codes have been used: second-hand
clothes (6309000000), cigarettes (2402200000), and textiles (52000000, 54000000,
55000000, and 57000000). Cigarette data for 2003 have not been used.
5. Synthesis
It follows from the preceding analysis that a number of products can be regarded as being
significant to the regional activity of both the border posts of Gaya and Birni N’Konni,
located between Niger, Benin and Nigeria. Our data show that although the amount and
direction of flows transiting through Gaya and Birni N’Konni are very different, the same
products are strongly represented at both border posts. This allows a single selection to be
used for both markets, and two social networks of economic actors working on the same set
of products to be compared.
Table 7 shows that seven products, indicated in bold italic, are recognised as being heavily
imported, subject to significant trade from large traders on the markets of Gaya, Malanville
and Kamba, and considered as re-export products: building materials (including cement),
cereals and flour (including rice), textile, used clothing, used vehicles, cigarettes and oil.

19
Table 7. Most traded products, according to various sources
1. Main imports 2. Local survey 3. Re-export flows
construction industry building materials bagged cement
cereals and flour cereals rice
textiles textiles cotton and synthetic textiles
second-hand clothes and shoes used clothes second-hand clothes
food-processing products spaghetti and noodles
chemical products
vehicles second-hand cars/parts second-hand vehicles/tyres
tobacco cigarettes cigarettes
mineral fuels and mineral oils fuel oil
fruits
animal and vegetable fats
(Birni)
refined vegetable oils/fats
manufacturing products
used compressors/fridges
furniture
Sources: Niger Customs Administration and INS 2011 (1), Walther 2012 (2), Nigerian
Customs Administration, Soulé 2000 and Gouvernement du Niger 2008 (3).
Surveys conducted in the border markets of Gaya, Malanville, Kamba, Birni N’Konni and
Illela should focus on goods whose trade (1) has a certain impact on regional development
and (2) does not involve illegal or criminal networks that would make them too difficult to
investigate. For these reasons we suggest ignoring three products previously identified as
relevant in our analysis of social networks: used vehicles, cigarettes and oil. Used vehicles
pay a local fare and are of importance for border municipalities but only the hired drivers
transit through border posts. This business does not really involve local border actors and
can be more usefully studied in the main urban centres of the Gulf of Guinea, where
vehicles are unloaded for importation before being sent to the final consumer (see Beuving
2006). Cigarettes networks also mainly concern trans-Saharan traders, and, in addition,
involve a great number of criminal activities, rendering their observation particularly
difficult (Grégoire 1992, 1998, 2000, Scheele 2011). Oil networks are certainly interesting
to examine but are, again, dominated by illegal practices and petty trade along the border.

20
References
Amselle J.-L, Grégoire E. 1998. Echanges régionaux, commerce frontalier et sécurité
alimentaire en Afrique de l’Ouest. Politiques nationales et réseaux marchands
transnationaux. Les cas du Mali et du Niger – Nord Nigeria. Paris, Club du Sahel, OCDE.
Beuving JJ. 2006. Nigerien second-hand car traders in Cotonou: A sociocultural analysis of
economic decision-making. African Affairs 105(420): 353–373.
Brédeloup S, Lombard J. 2008. Mort de la fripe en Afrique ou fin d’un cycle? Revue Tiers
Monde 194: 391-412.
Coste J, Soulé B. 2003. L’Ec(h)o des frontières. Bulletin régional de suivi des échanges
frontaliers. Cotonou, LARES 25-26.
Gouvernement du Niger 2008. Niger. La modernisation du commerce pendant un boom minier.
Etude diagnostique sur l’intégration commerciale. Programme du Cadre intégré. Report for
the Government of Niger. Niamey.
Grégoire E. 1991. Les chemins de la contrebande: étude des réseaux commerciaux en pays
hausa. Cahiers d’Etudes Africaines 124(4): 509–532.
Grégoire E. 1992. The Alhazai of Maradi: Traditional Hausa Merchants in a Changing
Sahelian City. Boulder: Lynne Rienner.
Grégoire E. 1998. Sahara nigérien: terre d’échanges. Autrepart 6: 91-104.
Grégoire E. 2000. Les communautés marchandes d’Agadès (Niger). Accumulation et exclusion,
1945-1998, in Chaléard JL, Pourtier R (eds) Politique et dynamiques territoriales dans les
pays du Sud. Paris, Sorbonne: 231-246.
Scheele J. 2011. Circulations marchandes au Sahara: entre licite et illicite. Hérodote 142: 143-
162.
Soulé BG. 2000. Prospects for trade between Nigeria and its neighbours. Paris: Sahel and West
Africa Club–OECD.
Walther O. 2012. Traders, agricultural entrepreneurs and the development of cross-border
regions in West Africa. Entrepreneurship and Regional Development 25(3-4): 123-141.
Walther O. 2009. A mobile idea of space. Traders, patrons and the cross-border economy in
Sahelian Africa. Journal of Borderlands Studies 24: 34-46.
Walther O. 2008. Affaires de patrons. Villes et commerce transfrontalier au Sahel. Bern: Peter
Lang.

21
Appendix 1. The Informal Trade and Cross-Border Integration in West Africa
(CROSSTRADE) project
The main objective of the CROSSTRADE project (2011-13) funded by the National
Research Fund of Luxembourg (FNR) is to study the contribution that informal economic
networks make to cross-border integration in West Africa. We examine both the market-
driven dimension of spatial integration, i.e. the level of social and economic interaction
between agents, and the institutional aspect of spatial integration, i.e. the willingness of the
actors to cooperate across borders.
The project primarily uses Social Network Analysis, a relational approach which stresses
that social behaviours cannot be explained simply by the attributes of individual actors, but
rather by also considering the relationships between them. This approach is complemented
by an econometric one in order to analyse whether the individual’s social network
influences the likelihood of their being a successful entrepreneur, and by a set of
biographical information.
The project develops innovative ideas for understanding cross-border economic activities
by giving a special importance to the economic actors who run cross-border informal
economic networks, to the places where trade is being concentrated and to the institutions
which are developed in the process of constructing regional economies. The project could
also have a significant impact on development practice and policy, as the potential of
border urban markets has recently drawn the attention of international institutions.
The project is coordinated by Dr Olivier Walther, in collaboration with Dr Christophe
Sohn, Dr Mathias Kuepié and Dr Michel Tenikue, CEPS/INSTEAD, Luxembourg. Other
partners and members of the follow-up committee include: Prof. Denis Retaillé
(University of Bordeaux III-CNRS), Dr Lawali Dambo, Dr Waziri Maman Mato, Dr Henri
Motcho, Dr Amadou Boureima, Moustapha Koné (University of Niamey), Dr Dimitris
Christopoulos (MODUL University Vienna), Prof. Paul Nugent (University of Edinburg),
Dr Marie Trémolières, Philipp Heinrigs (Sahel and West Africa Club, OECD).
More information is available at: http://www.ceps.lu/?type=module&id=39&tmp=1761

22
Appendix 2. Food and agricultural situation in Niger, 1966-2011
1966/67 drought
1973/1974 severe food crisis
1984/1985 severe food crisis
1990/1991 severe food crisis
1993/1994 drought
1996/1997 severe food crisis
2000/2001 drought
2001/2002 normal
2002/2003 normal
2003/2004 normal
2004/2005 severe food crisis
2005/2006 normal
2006/2007 normal
2007/2008 normal
2008/2009 good
2009/2010 severe food crisis
2010/2011 normal
Sources: Gouvernement du Niger/Dispositif National de Prévention et de Gestion des crises
alimentaires (DNPGCA) 2007 and authors.


3, avenue de la FonteL-4364 Esch-sur-AlzetteTél.: +352 58.58.55-801www.ceps.lu
Related Documents