National Council of Applied Economic Research Regional Tourism Satellite Account Chhattisgarh, 2009-10 National Council of Applied Economic Research A C N R E 60 Study Commissioned by Ministry of Tourism, Government of India Phase III 20161103 (3) 2016 Report November

Welcome message from author
This document is posted to help you gain knowledge. Please leave a comment to let me know what you think about it! Share it to your friends and learn new things together.
Transcript

National Council of Applied Economic Research
Regional Tourism Satellite Account Chhattisgarh, 2009-10
National Council of Applied Economic Research
ACN RE
60
Study Commissioned by Ministry of Tourism, Government of India
Phase III
20161103 (3) 2016Report November


Regional Tourism Satellite Account Chhattisgarh, 2009-10
National Council of Applied Economic Research11 Indraprastha Estate, New Delhi 110 002
NCAER | QUALITY . RELEVANCE . IMPACT
November, 2016
Project Sponsored byMinistry of Tourism, Government of India

© National Council of Applied Economic Research, 2016
All rights reserved. The material in this publication is copyrighted. NCAER encourages the dissemination of its work and will normally grant permission to reproduce portions of the work promptly. For permission to photocopy or reprint any part of this work, please send a request with complete information to the publisher below.
Published by Anil Kumar Sharma Secretary and Head of the Operations and Senior Fellow, NCAER The National Council of Applied Economic Research Parisila Bhawan, 11, Indraprastha Estate, New Delhi–110 002 Tel:+91 11 2337-9861 to 3 Fax:+91 11 2337 0164 [email protected] www.ncaer.org
Publication Coordinator Jagbir Singh Punia

http://www.ncaer.org/publication details.php?pID=271)
http://www.ncaer.org/publication detaiis.php?pID=272)
ACN RE
60
PREFACE
NATIONAL COUNCIL OF APPLIED ECONOMIC RESEARCH
Parisila Bhawan 11 Indraprastha Estate New Delhi 110 002Tel: +91 11 2337 0466, 2337 9861 Fax: +91 11 2337 [email protected]. www.ncaer.org

Dr. Shekhar ShahDirector-General

|III| National Council of Applied Economic Research
ACKNOWLEDGEMENT
We would like to thank the officials of The Ministry of Tourism (MoT) for their
valuable inputs during the project review meetings and presentations. In particular,
we are immensely grateful to Dr. R.K. Bhatnagar (ADG, Market Research, and MoT),
Smt. Mini Prasanna Kumar (Joint Director, Market Research, MoT), Smt. Neha
Srivastava (Deputy Director, Market Research, MoT) and Shailesh Kumar (Deputy
Director, Market Research, MoT). We are also grateful to Shri Vinod Zutshi (Secretary,
MoT) and Shri Sanjeev Ranjan (Additional Secretary, MoT) for their valuable insights
and comments. The study also benefited immensely from the important inputs from
the officials of various State Tourism Departments.
STUDY TEAM
POONAM MUNJAL (PROJECT LEADER)
K. A. SIDDIQUI, AMIT SHARMA, MONISHA GROVER, SHASHI SINGH (CORE RESEARCH TEAM)
RAMESH KOLLI (HONORARY RESEARCH ADVISOR)

|IV| National Council of Applied Economic Research

|V| National Council of Applied Economic Research
ABBREVIATIONS AND ACRONYMS
Units used in the Report
1 crore = 10 million 1 lakh = 100 thousand
Abbreviations CES Consumer Expenditure Survey
CFC Consumption of Fixed Capital
CSO Central Statistical Office
DTS Domestic Tourism Survey
Eurostat Statistical Office of the European Union
EUS Employment and Unemployment Survey
FISIM Financial Intermediation Services Indirectly Measured
GCE/GFCE Government Final Consumption Expenditure
GDP Gross Domestic Product
GO Gross output
GSDP Gross State Domestic Product
GVA Gross Value Added
GVATI Gross Value Added of Tourism Industries
HCE Household consumer expenditure
IC Intermediate consumption
IC - PP Intermediate consumption at purchasers’ price
IPS International Passenger Survey
IRTS International Recommendations on Tourism Statistics
ISI Indian Statistical Institute
ISIC International Standard Industrial Classification (United Nations)
ISWGNA Inter-secretariat Working Group on National Accounts
MPCE Monthly per capita consumer expenditure
MRP Mixed reference period
NAS National Accounts Statistics (of India)
NCAER National Council of Applied Economic Research
NIT Net Indirect tax
NPISH Non Profit Institutions Serving Households
NRI Non-Resident Indian
NSO National Statistical Office
NSSO National Sample Survey Office
|VI| National Council of Applied Economic Research
Abbreviations OECD Organisation for Economic Cooperation and Development
OS Operating Surplus
OS/MI Operating Surplus/Mixed Income
PFCE Private Final Consumption Expenditure
PIO People of Indian Origin
PP Purchasers price
RMF Recommended Methodological Framework
SUT Supply and Use Tables
TDGDP Tourism Direct Gross Domestic Product
TDGVA Tourism Direct Gross Value Added
TSA:RMF Tourism Satellite Account: Recommended Methodological Framework
TTM Trade and transport margins
UN United Nations
UNWTO United Nations World Tourism Organisation
VAT Value Added Tax
WTO World Tourism Organisation

|VII| National Council of Applied Economic Research
TABLE OF CONTENTS Preface………….…..........................................................................................................................................I Acknowledgement ..................................................................................................................................III Study Team…………………………………….……………………………………………..…………….….................III Abbreviations and Acronyms................................................................................................................V List of Tables ............................................................................................................................................IX List of Figures............................................................................................................................................XI
1. Introduction.............................................................................................................................. ............1
About Tourism ................................................................................................................................................................ 1 Some definitions of Tourism ....................................................................................................................................... 1 UNWTO Definition.......................................................................................................................................................... 2 Tourism - World ............................................................................................................................................................. 2 Economic Value of Tourism ........................................................................................................................................ 4 Tourism - India ............................................................................................................................................................... 7 Tourism Satellite Account ......................................................................................................................................... 11 Uses and Applications of TSA ................................................................................................................................... 12 Regional Tourism Satellite Account ....................................................................................................................... 12 Contribution of tourism to economy ...................................................................................................................... 14 Tourism in Chhattisgarh ........................................................................................................................................... 18 State Tourism Policy ................................................................................................................................................... 19 Structure of The Report ............................................................................................................................................. 21
2. Profile of The State ................................................................................................................................................ 23
Geographic Profile ....................................................................................................................................................... 23 Demographic and Social Profile .............................................................................................................................. 24 Economic Profile........................................................................................................................................................... 24 Nature and Wild Life Tourism ................................................................................................................................. 28 Society .............................................................................................................................................................................. 28 Fair and Festivals ......................................................................................................................................................... 29 History ............................................................................................................................................................................. 30 Tourism ........................................................................................................................................................................... 30 Health and Medical...................................................................................................................................................... 32
3. Data Sources and Their Key Findings............................................................................................................. 33
Data Sources .................................................................................................................................................................. 33 Domestic Tourism Survey (DTS) ............................................................................................................................. 33 Use of DTS in Preparation of State TSA ................................................................................................................. 35 DTS– Key Findings for Chhattisgarh ...................................................................................................................... 35 Trips by Purpose .......................................................................................................................................................... 36 International Passenger Survey (IPS) ................................................................................................................... 37 66.03 lakh ForeignTtourists Visited India in 2010-11..................................................................................... 38 Use of IPS Data in Preparation of State TSA ........................................................................................................ 39 IPS – Key Findings for Chhattisgarh ...................................................................................................................... 39 Employment and Unemployment Survey ............................................................................................................. 42 Use of EUS Data in Preparation of State TSA....................................................................................................... 42 Household Consumer Expenditure Survey ........................................................................................................... 44 Use of CES Data in Preparation of State TSA ....................................................................................................... 46 State GDP Accounts ...................................................................................................................................................... 48

|VIII| National Council of Applied Economic Research
4. Methodology Adopted for State TSA Tables ................................................................................................. 51 Tourism Satellite Account ......................................................................................................................................... 51 Expenditure or Demand side Data ......................................................................................................................... 51 Production or Supply side data ............................................................................................................................... 52 Compilation of State TSAs ......................................................................................................................................... 53 Inbound Tourism Expenditure ................................................................................................................................ 55 Inbound Tourism Expenditure by International Tourists .............................................................................. 55 Key Findings – Inbound Tourism Expenditure ................................................................................................... 58 Domestic Tourism Expenditure ............................................................................................................................... 64 Outbound Tourism Expenditure ............................................................................................................................. 70 Key Findings – Outbound Tourism Expenditure ................................................................................................ 71 Total Internal Tourism Consumption ................................................................................................................... 74 Production Account of Tourism Industries.......................................................................................................... 76 Tourism Industry Ratios and TDGVA .................................................................................................................... 77 State Tourism Industry Ratio ................................................................................................................................... 81 Non-Monetary Indicators .......................................................................................................................................... 85
5. TSA Tables and Accounts .................................................................................................................................... 87
6. Summary of Findings ......................................................................................................................................... 123
Number of Trips......................................................................................................................................................... 123 Internal Tourism Expenditure .............................................................................................................................. 123 Employment in Tourism Industries .................................................................................................................... 124 Gross Value Added .................................................................................................................................................... 125 Direct and Indirect Shares in GSDP & Employment ....................................................................................... 125
Glossary............................................................................................................................................................................ 129
Appendix .......................................................................................................................................................................... 151

|IX| National Council of Applied Economic Research
LIST OF TABLES
Table 1.1: International Tourist Arrivals (Actual and Projections), by sub-regions ................................. 3 Table 1.2: Contribution of Tourism to State GDP – Phase I states ............................................................... 17 Table 1.3: Contribution of Tourism to State GDP – Phase II states.............................................................. 17 Table 1.4: Number of approved hotels and rooms in Chhattisgarh, 2012 ................................................. 19 Table 1.5: Expenditure incurred and revenue collected on centrally protected ticked monuments
in Chhattisgarh ............................................................................................................................... 19 Table 3.1: Estimated number of workers by status – Chhattisgarh (Numbers in ‘000) .......................... 44 Table 3.2: Break-up of monthly per capita consumer expenditure over broad categories of goods –
Chhattisgarh and India .................................................................................................................. 47 Table 3.3: State GDP accounts for Chhattisgarh, 2009-10 (Rs. lakh) .......................................................... 50 Table 4.1: Availability of data for compiling State TSAs according to different approaches ................. 53 Table 4.2: Products recommended in TSA: RMF 2008 Vs. Products included in TSA, 2009-10 ............ 54 Table 4.3: Average per-tourist per-day Inbound Tourism Expenditure by type of tourists .................. 55 Table 4.4: Consumption Expenditure Adjustment Factors ........................................................................... 57 Table 4.5: State-wise per-cent distribution of inbound trips (from other states), by purposes of
travel ................................................................................................................................................. 59 Table 4.6: State wise per-trip expenditure (Rs.) of inbound trips (from other states) by purpose of
travel ................................................................................................................................................. 61 Table 4.7: State wise per-tourist per-day expenditure (Rs.) of inbound trips (from other states) by
purpose of travel ............................................................................................................................ 62 Table 4.8: State-wise per-cent distribution of trips (within the state) by purposes of travel ............... 65 Table 4.9: State wise per-trip expenditure (Rs.) of domestic trips (within state) by purpose of
travel ................................................................................................................................................. 67 Table 4.10: State wise per-tourist per-day expenditure (Rs.) of domestic trips (within state) by
purposes of travel .......................................................................................................................... 68 Table 4.11: State-wise per-cent distribution of number of outbound trips (to other countries) by
purpose of travel ............................................................................................................................ 72 Table 4.12: State wise per tourist expenditure (Rs.) on outbound trips (to other countries) by
purpose of travel ............................................................................................................................ 73 Table 4.13: State-specific Tourism Industry Ratios ....................................................................................... 83 Table 4.14: Identification of Formal/Informal workers (EUS) .................................................................... 85 TSA Table 1A: Inbound Tourism Expenditure by products and by type of foreign tourists
(expenditure at market price) ..................................................................................................... 89 TSA Table 1B: Inbound Tourism Expenditure (incurred by tourists from other states) by products
and purposes of travel (expenditure at market price) ........................................................... 90 TSA Table 1C: Total Inbound Tourism Expenditure by products and by type of tourists
(expenditure at market price) ..................................................................................................... 91 Table 2: Domestic Tourism Consumption (visitors from within the state of reference) by products
and by purpose of travel ............................................................................................................... 92 Table 3: Outbound Tourism Consumption by products and by purpose of travel (expenditure at
market price) .................................................................................................................................. 93 TSA Table 4: Total Internal Tourism Consumption, 2009-10 ...................................................................... 94 TSA Table 5: Production account of tourism industries and other industries, Chhattisgarh 2009-10 95 TSA Table 6: Tourism direct output and value added at basic prices – Chhattisgarh, 2009-10 .......... 107 TSA Table 7A: Number of workers in tourism industries by formal/informal and by gender –
Chhattisgarh, RURAL – 2009-10 ................................................................................................ 108

|X| National Council of Applied Economic Research
TSA Table 7B: Number of workers in tourism industries by formal/informal and by gender – Chhattisgarh, URBAN – 2009-10 ................................................................................................ 109
TSA Table 7C: Number of workers in tourism industries by formal/informal and by gender – Chhattisgarh, TOTAL – 2009-10 ................................................................................................ 110
TSA Table 7D: Number of jobs in tourism industries by formal/informal and by gender – Chhattisgarh, RURAL – 2009-10 ................................................................................................ 111
TSA Table 7E: Number of jobs in tourism industries by formal/informal and by gender – Chhattisgarh, URBAN – 2009-10 ................................................................................................ 112
TSA Table 7F: Number of jobs in tourism industries by formal/informal and by gender – Chhattisgarh, TOTAL – 2009-10 ................................................................................................ 113
TSA Table 10.1: Domestic and foreign tourism visits to states/ UTs during 2010-2014...................... 114 TSA Table 10.2: Average number of overnight trips per 100 households in different state /Uts ....... 115 TSA Table 10.3: Percentage of households and persons undertaking overnight trips: states/UTs,
last 365 days .................................................................................................................................. 116 TSA Table 10.4: Share of States in the total households reporting overnight visitor(s) and total
number of overnight visitor(s), separately for each State/UTs .......................................... 117 TSA Table 10.5: Per 1000 distribution of overnight visitor-trips by purpose of travels or each
State/ UTs ...................................................................................................................................... 118 TSA Table 10.6: Average no. of places visited per overnight trip by main destination for each
State/UTs of destination ............................................................................................................. 119 TSA Table 10.7A: Per 1000 Distribution Of Households Who Are Aware Of 'Incredible India'
Campaign And Other Tourism Promotional Campaigns By Source Of Information About The Campaign – Chhattisgarh ........................................................................................ 120
TSA Table 10.7B: Per 1000 Distribution Of Households Who Are Aware Of 'Incredible India' Campaign And Other Tourism Promotional Campaigns By Source Of Information About The Campaign – All India ................................................................................................ 120
TSA Table 10.8A: Per 1000 Distribution Of Households Who Are Aware Of 'Incredible India' Campaign And Other Tourism Promotional Campaigns By Impact Of The Campaign – Chhattisgarh .................................................................................................................................. 121
TSA Table 10.8B: Per 1000 Distribution Of Households Who Are Aware Of 'Incredible India' Campaign And Other Tourism Promotional Campaigns By Impact Of The Campaign – All India .......................................................................................................................................... 121
Table 6.1: Total Estimated Number of Trips/Tourists to Chhattisgarh and India ................................ 123 Table 6.2: Gross Internal Tourism Expenditure of Chhattisgarh and India (Rs. lakh) .......................... 124 Table 6.3: Total employment in tourism industries in Chhattisgarh and India ..................................... 124 Table 6.4: Gross Value Added of tourism industries in Chhattisgarh and India ..................................... 125 Table 6.5: Contribution of Tourism in the Economy – Chhattisgarh and India ...................................... 126 Table 6.6: State-wise contribution of Tourism to the Economy ................................................................ 127

|XI| National Council of Applied Economic Research
LIST OF FIGURES
Figure 1.1: International Tourist Arrivals, by sub-regions (1990-2014) ....................................3 Figure 1.2: International Tourist Arrivals (Index 2010=100), By Sub-Regions .........................4 Figure 1.3: International Tourist Receipts (US$ billion), by sub-regions ....................................5 Figure 1.4: Share of sub-regions in International Tourist Arrivals and International
Tourism Receipts, 2014 ....................................................................................................6 Figure 1.5: Foreign Tourist Arrivals and International Tourism Receipts for India .................8 Figure 1.6: Foreign and Domestic Tourist Visits in Chhattisgarh (‘000) .................................. 18 Figure 2.1: Growth in Gross State Domestic Product (constant prices) .................................... 25 Figure 2.2: Structural Changes in GDP over the last decade ........................................................ 26 Figure 2.3: Sectoral Growth in Gross State Domestic Product (constant prices) .................... 27 Figure 3.1: Distribution of visitor trips undertaken by purpose – Chhattisgarh as state of
destination ........................................................................................................................ 36 Figure 3.2: Per cent distribution of trips to Chhattisgarh by states of origin .......................... 37 Figure 3.3: Distribution of number of Outbound Tourists by purpose Chhattisgarh and
India ................................................................................................................................... 40 Figure 3.4: Percentage Distribution of mission for which Business Trip is Undertaken –
Chhattisgarh ..................................................................................................................... 41 Figure 3.5: Percentage distribution of reasons for preferring foreign destination when
Leisure Trip is undertaken – Chhattisgarh................................................................. 41 Figure 3.6: MPCE at MRP on food, non-food and total – Chhattisgarh and India ..................... 46 Figure 4.1: Average per-trip expenditure (Rs.) incurred in inbound trips (from other
states) by purpose of travel ........................................................................................... 60 Figure 4.2: Percentage distribution of Inbound Tourism Expenditure (incurred by
visitors from other states) by products for different purposes of travel- Chhattisgarh ..................................................................................................................... 63
Figure 4.3: Average per-trip expenditure incurred in domestic trips (within state) by purpose of travel.............................................................................................................. 66
Figure 4.4: Percentage distribution of Domestic Tourism Expenditure (incurred by visitors from within the state) by products for different purposes of travel – Chhattisgarh ..................................................................................................................... 69

|XII| National Council of Applied Economic Research

Region al Tourism Satellite Account– Chhattishgarh,2009-10
|1| National Council of Applied Economic Research
1. INTRODUCTION
ABO UT TO URISM 1.1. Tourism is a social, cultural and economic phenomenon related to the movement of people to places outside their usual place of residence, pleasure being the usual motivation1. From this definition and the fact that tourism is a temporary activity, it can be interpreted that tourism is a demand based concept.
1.2. The decision of the tourist to make a visit generates additional demand for goods and services, which are provided from the supply side either through increased domestic production or through imports. Therefore, tourism, though a demand-based concept, can also be viewed from the supply side.
SOME DEFIN ITI ONSOF TO URIS M
1.3. These two aspects of tourism give rise to a number of alternate definitions of tourism, though they all can be understood similarly in the context of tourism. Some of the definitions available in the public domain are:
Tourism arises from a movement of people to, and their stay in, various destinations.
Tourism is travel for recreational, leisure or business purposes.
The temporary movement of people to destinations outside their normal places of work and residence, the activities undertaken during their stay in those destinations, and the facilities created to cater to their needs2.
The sum of the phenomena and relationships arising from the interaction of tourists, business suppliers, host governments and host communities in the process of attracting and hosting these tourists and other visitors3.
Tourism is a collection of activities, services and industries that delivers a travel experience, including
1United Nations World Tourism Organisation (UNWTO): International Recommendations for Tourism Statistics (IRTS), 2008 (para 1.1) 2Mathieson, Alister, Wall, Geoffrey (1982) :Tourism: Economic, physical, and social impacts, Longman (London and New York) 3McIntosh, Robert W., Goeldner, Charles R. (1986): Tourism: Principles, practices, philosophies; Wiley (New York)
Region al Tourism Satellite Account– Chhattishgarh, 2009-10
|2| National Council of Applied Economic Research
transportation, accommodations, eating and drinking establishments, retail shops, entertainment businesses, activity facilities and other hospitality services provided for individuals or groups travelling away from home.
Tourism can be understood as the set of productive activities that cater mainly to visitors.
UNWTODEFINI TION
1.4. The UN World Tourism Organization (UNWTO) provides the following definition of tourism which is now the accepted official definition of Tourism.
“Tourism refers to the activity of visitors. A visitor is a traveller taking a trip to a main destination outside his/her usual environment for less than a year, for any main purpose (business, leisure or other personal purpose) other than to be employed by a resident entity in the country or place visited4.”
1.5. Tourism has recently become a phenomenon which is continuously increasing and establishing itself as an important economic sector. Tourist arrivals are exponentially growing across the globe creating high demand for tourism-connected consumer items/ services and infrastructure.
TO URIS M - WO RLD 1.6. According to the UNWTO-Tourism Highlights (2015), despite occasional shocks, worldwide international tourist arrivals have shown virtually uninterrupted growth from 25 million in 1950 to 278 million in 1980 to 528 million in 1995, breached 1 billion mark (at 1,035 million) for the first time in history in 2012 and reached 1,133 million in 2014. This is supplemented with an estimate of 5 to 6 billion domestic tourism, making tourism a phenomenal economic activity. According to UNWTO-World Tourism Barometer (Volume 12, December 2014), 978 million international overnight tourist visits were made between January and October 2014. This number is 45 million more than that in the same period of 2013.
1.7. Amongst the sub-regions, Europe has been receiving the highest number of international tourists since beginning and the number stood at 581.8 million in 2014. This is followed by Asia and the Pacific with 263.3 million international tourist arrivals. Asia and the Pacific superseded Americas in terms of receiving
4UNWTO: IRTS 2008, para 2.9

Region al Tourism Satellite Account– Chhattishgarh, 2009-10
|3| National Council of Applied Economic Research
international tourist arrivals in 2005 (Figure 1.1)
Figure 1.1: International Tourist Arrivals, by sub-regions (1990-2014)
Source: UNWTO – Tourism Market Trends, 2006 edition and various editions of UNWTO – Tourism Highlights
1.8. Going forward, the international tourist arrivals are expected to reach 1.81 billion by 2030, with the expected growth of 3.3 per cent a year. The following table gives actual and projected international tourist arrivals by sub-regions. Expected international tourist arrivals in Asia and the Pacific are 355 and 535 million in 2020 and 2030 respectively.
TABLE 1.1: INTERNATIONAL TOURIST ARRIVALS (ACTUAL AND PROJECTIONS), BY SUB-REGIONS (In Millions)
Area Actual Projections 1980 1995 2010 2020 2030
World 277 528 940 1360 1809 Africa 7.2 18.9 50.3 85 134 Americas 62.3 109 149.7 199 248 Asia and the Pacific 22.8 82 204 355 535 Europe 177.3 304.1 475.3 620 744 Middle East 7.1 13.7 60.9 101 149
Source: UNWTO – Tourism Highlights, 2014 Edition
0
200
400
600
800
1000
1200
1990
1995
2000
2005
2006
2007
2008
2009
2010
2011
2012
2013
2014
Inte
rnat
iona
l Tou
sits
Arr
ival
(M
illio
n)
World Africa Americas Asia andthe Pacific
Europe MiddleEast

Region al Tourism Satellite Account– Chhattishgarh,2009-10
|4| National Council of Applied Economic Research
Figure 1.2: International Tourist Arrivals (Index 2010=100), By Sub-Regions
Source: NCAER computation using data from UNWTO – Tourism Highlights, 2014 Edition
1.9. In Figure 1.2, the UNWTO’s projected numbers for the regions are presented by indexing the 2010 numbers for all the regions to 100. This exhibit gives a clearer picture of expected growth in international tourists received by the regions in 2020 and 2030 over 2010. It is evident that Africa and Asia are expected to gain the highest percentage increase in international tourist arrivals by 2020 and 2030. The expected increase in Asia is 74 per cent by 2020 over 2010, followed by Africa (69 per cent), Middle East (66 per cent), Americas (33 per cent) and Europe (30 per cent). Asia is emerging as an attraction for a high number of international tourists every year. Between 2010 and 2030, the highest growth is expected in Africa (166 per cent), followed by Asia and the Pacific (162 per cent) and Middle East (145 per cent). Europe is expected to witness the lowest growth of 57 per cent by 2030 over 2010 level.
ECON OMI C VAL UEOF TO URIS M
1.10. Tourism is one of the largest and fastest growing economic sectors in the world, thanks to the increase in tourism destinations in tandem with an increase in awareness among people. Unlike a rather conservative tourism activity in the past, particularly in developing countries like India, now
192
100
266
166
262
157
245
0
50
100
150
200
250
300
1980
1995
2010
2020
2030
World
Africa
Americas
Asia and the Pacific
Europe
Middle East

Region al Tourism Satellite Account– Chhattishgarh, 2009-10
|5| National Council of Applied Economic Research
people are willing to travel more and even cross boundaries to visit far-away and sometimes remote destinations.
1.11. For many countries, Tourism is an important social and economic phenomenon, being a key driver in socio-economic progress through the creation of jobs and enterprises, infrastructure development and the export revenues earned. As an internationally traded service, inbound tourism is one of the world’s major trade categories. According to the latest data from UNWTO, international tourism receipts amounted to an estimated US$ 1,245 billion worldwide in 2014, up by 4 per cent over previous year. This is despite the economic volatility across the globe.
1.12. Figure 1.3 shows worldwide international tourism receipts and that for different sub-regions. The total international tourism receipts received by world stood at 1,245 billion US$ in 2014. The sub-regional international tourism receipts also show strong upwards trend during last many decades. From a mere 270.2 billion USD in 1990, the international tourism receipts for the worlds increased to 1,245 billion USD in 2014.
Figure 1.3: International Tourist Receipts (US$ billion), by sub-regions
Source: UNWTO – Tourism Market Trends, 2006 edition and various editions of UNWTO – Tourism Highlights
0.0
200.0
400.0
600.0
800.0
1000.0
1200.0
1400.0
1990
1995
2000
2005
2006
2007
2008
2009
2010
2011
2012
2013
2014
World Africa Americas Asia andthe Pacific
Europe MiddleEast

Region al Tourism Satellite Account– Chhattishgarh, 2009-10
|6| National Council of Applied Economic Research
1.13. Worldwide international tourism receipts in 2014 grew by 4 per cent over previous year. The per cent growth has been the highest for Middle East at 9 per cent, followed by Asia and the Pacific (4.5 per cent), Americas (3.7 per cent) and Europe (3.5 per cent).
1.14. Shares of different sub-regions in total international tourist arrivals and international tourism receipts, while looked at together and compared, can give idea about another crucial dimension of economic importance of tourism sector across the sub-regions. As shown in figure 1.4, it can be easily interpreted that Asia and Americas are the only two sub-regions which exhibit shares in world’s international tourism receipts more than their share in world’s international tourist arrivals. Asia’s share in international tourism receipt is 30.3 per cent, 7 percentage points higher than its share in international tourist arrivals which is 23.2 per cent. Similarly, America’s share in international tourism receipt and international tourist arrivals are 22 per cent and 16 per cent respectively.
Figure 1.4: Share of sub-regions in International Tourist Arrivals and International Tourism Receipts, 2014
Source: NCAER computations using data from UNWTO – Tourism Highlights, 2015
4.9
16.0
23.2 51.3
4.5
Shares in International Tourist Arrivals
Africa
Americas
Asia andthe Pacific
Europe
MiddleEast
2.9
22.0
30.3 40.9
4.0
Shares in International Tourism Receipts

Region al Tourism Satellite Account– Chhattishgarh, 2009-10
|7| National Council of Applied Economic Research
TO URIS M -INDIA
1.15. In India, tourism is seeing a remarkable growth in the recent months with Narendra Modi led new government’s pro-tourism agenda which identifies tourism as a key sector among others in its ambitious “Make in India” campaign. One of the major recent initiatives taken by the government to give a boost to the tourism sector is the launch of visa-on-arrival at nine major airports in the country. While earlier visa-on-arrival was offered to tourists from only 12 countries but now the facility has been extended for tourists from more than 77 countries and the government’s goal is to hit 150 countries by next year. Another initiative is the release of fresh category of visa called medical visa or M-visa, in order to encourage the medical tourism in India.
1.16. Tourism contributes 6.8 per cent to the country’s GDP and 10.2 per cent to its employment (including both direct and indirect effects). It is the third largest foreign exchange earner for the country, after gems and jewellery and readymade garments. India’s foreign exchange earnings from tourism stood at US$ 18.1 billion in 2013, growing by 2.2 per cent over previous year. India is the 16th most visited country in the world and has a share of 1.56 per cent in the world’s total tourism receipts.
1.17. According to the latest data compiled by the Ministry of Tourism, number of foreign tourist arrivals in India was 22.6 million in 2014, posting an annual growth of 13.1 per cent over last year. Domestic tourism, which accounts for a bulk of tourism in India, grew by 13 per cent with total domestic tourists visiting all states and UTs of India numbered at 129 crore in 2014.
The following figure represents the growing tourism phenomenon in India, as indicated by the international tourists and tourism receipts.

Region al Tourism Satellite Account– Chhattishgarh, 2009-10
|8| National Council of Applied Economic Research
Figure 1.5: Foreign Tourist Arrivals and International Tourism Receipts for India
Source: Various editions of India Tourism Statistics, MoT and UNWTO – Tourism Highlights
1.18. It is evident from the above illustration that both foreign tourist arrivals and international tourism receipt in case of India are rising sharply. While Asia and the Pacific is the fastest emerging tourism destination for international tourists (as observed from UNWTO data on international tourist arrivals), India is the largest tourism destination in South Asia. From these facts, it can be surely ascertained that the prospects for growth of Indian tourism sector is very promising in future.
MEAS UREMEN TOF TO URISM
1.19. Owing to the rapidly increasing tourism activities across the globe and the significantly high foreign exchange earnings from such tourism activities, it has become a task of primary preference for nations to measure tourism statistics (both monetary and non-monetary).
1.20. Tourism primarily relates to the movement of people to places outside their usual place of residence, pleasure being the usual motivation. It induces economic activity either directly or indirectly, sometimes in places beyond those visited. These could be in terms of economic output or in terms of employment generation, besides other social and infrastructural dimensions. Therefore, for a holistic approach to tourism development, it is necessary that reliable
0
50
100
150
200
25020
01
2002
2003
2004
2005
2006
2007
2008
2009
2010
2011
2012
2013
2014
Foreign Tourist Arrivals (lakh) International Tourism Receipt (US$ billion)

Region al Tourism Satellite Account– Chhattishgarh, 2009-10
|9| National Council of Applied Economic Research
statistics on tourism sector and analysis based on tourism statistics are available to the policymakers for decision making.
1.21. The UNWTO lays down standard international guidelines for the collection, compilation and dissemination of statistics on tourism by the member countries. The latest publication, International Recommendations for Tourism Statistics 2008 (IRTS, 2008) provides a common reference framework for countries to use in the compilation of tourism statistics. The IRTS, 2008 presents a system of definitions, concepts, classifications and indicators that are internally consistent and that facilitate the link to the conceptual frameworks of the Tourism Satellite Account, national accounts, balance of payments and labour statistics, among others and further provides general guidance with respect to data sources and data compilation methods. This ensures international comparability of tourism statistics and enhances coherence of tourism statistics with other official statistics and further development of tourism satellite accounts.
1.22. However, tourism is not defined separately in either the standard international industry or product classifications5 or in the accounting framework of national accounts, which focuses on accounting of economic activities undertaken in the country according to standard international classifications. This is because tourism, unlike other sectors of the SNA, is not defined as an industry by the characteristic of the product it makes as an output. It is identified rather by the characteristic of the purchaser demanding the products, that is, a visitor.
1.23. This means the tourism industry is defined according to the status of the consumer, not according to the status of producer. Therefore, this special characteristic of tourism sector cannot be made explicit while compiling the national accounts according to System of National Accounts (SNA)6, though tourism is an economic activity and its contribution is already included in the national accounts implicitly.
5These are respectively the International Standard Industrial Classification of All Economic Activities, Revision 3 (ISIC rev 3) and the Central Classification of Products, Revision 1 (CPC rev 1). Both are published and maintained by the United Nations Statistics Division, New York. The website http://unstats.un.org/unsd contains a detailed registry of these and other United Nations Classifications. 6A System of National Accounts 1993 and 2008. Both are prepared and published under the auspices of the Inter-secretariat Working Group on National Accounts (ISWGNA), which is an interagency body set up by the United Nations Statistical Commission (UNSC) on national accounts and consists of European Commission (EU), International Monetary Fund (IMF), Organization for Economic Co-operation and Development (OECD), United Nations (UN) and World Bank.

Region al Tourism Satellite Account– Chhattishgarh, 2009-10
|10| National Council of Applied Economic Research
1.24. In the context of national accounts, tourism remains difficult to define and measure. Therefore, there is little room for organising data into a structure that permits examination and analysis by function. In such cases, where SNA core accounts do not provide the required information, the SNA suggests the development of satellite accounts within the framework, concepts and definitions of SNA. These satellite accounts draw from the core accounts in concept, framework and data but are recast to highlight the particular aspect of the economy that is inadequately described.
1.25. Tourism has several dimensions and all of these are important in the context of compiling statistics on tourism. These dimensions are as follows:
(i) motivation for traveling – purpose of trip;
(ii) facilities, that include hotels and restaurants, support services and infrastructure facilities;
(iii) transportation and finances, such as air, road and water transportation, availability of finances to incur travel expenditures;
(iv) Hospitality – interaction of tourists with local population.
SATELLITEAC CO UN TS
1.26. The SNA provides flexibility for elaborations, extensions and alternative concepts, while still remaining within the conceptual framework of SNA. Satellite accounts compilations are one such extension. The idea behind compilation of such accounts is to allow certain types of analysis that focus on a certain field or aspects of economic and social life. Such detailed analysis is usually not available in the central framework. Therefore, the satellite accounts are distinct from the central system.
1.27. The satellite accounts maintain a loose relationship with the SNA, with boundaries expanded and reclassified and focus on the purpose or function of transactions. Thus, transactions are first analysed in the system of national accounts according to their characteristics, then certain types of transactions (such as tourism, or health care, or environment, etc.) are analysed from the expenditure side. In satellite accounts, therefore, the unit of analysis to which classification is applied is not an establishment (as in national accounts) but, instead, is transactions, or groups of transactions.

Region al Tourism Satellite Account– Chhattishgarh, 2009-10
|11| National Council of Applied Economic Research
TO URIS MSATELLITEAC CO UN T
1.28. The Tourism Satellite Account (TSA) is an accounting procedure designed to measure goods and services associated with tourism, according to internationally agreed standards, concepts, classifications and definitions. It helps in assessing the size and contribution of tourism to the economy. Essentially, the TSA uses the macro-economic framework of the System of National Accounts, 19937 (1993 SNA) for integrating tourism statistics and for showing the linkages between demand and supply for goods and services in respect of Tourism.
1.29. In TSA, the national accounts framework and methodology is applied to tourism so that the industries supplying tourism output are identified in the production account, while at the same time showing the visitors’ expenditures identified by functions, which is the determining characteristic of tourism, on the expenditure account. The national account framework further allows confrontation of these two dimensions through the supply and use tables for arriving at a consistent set of economic data.
1.30. The TSA provides a framework for policy analysis of issues related to tourism economics as well as for model building, tourism growth analysis and productivity measurement. The systems of tourism statistics and tourism satellite accounts are tools by which the role of tourism in the economy can be better understood and more accurately measured8. The TSA focuses on the economic dimension of tourism trips9, mostly through expenditure by visitors or by others for their benefit.
1.31. It provides the mechanism for transforming demand based concept of tourism into a methodology for identifying who produces what for the visitor. It identifies the typical tourism industries, i.e. those industries that produce commodities which represent a significant part of tourism demand and whose existence is very strongly dependent on tourism demand or would be seriously affected were tourism to cease. For this set of industries, the TSA measures the value added, employment, capital formation, etc., flowing from that demand and identifies who the visitors are.
1.32. The TSA framework provided by UNWTO is the most
7 United Nations, World Bank, International Monetary Fund, Commission of the European Communities and Organisation for Economic Cooperation and Development,1993. System of National Accounts 1993. New York, Washington, D.C., Brussels and Paris 8Eurostat: European Implementation Manual on TSA 9IRTS 2008, para. 2.29

Region al Tourism Satellite Account– Chhattishgarh, 2009-10
|12| National Council of Applied Economic Research
comprehensive way to measure the economic importance of tourism in national economies. According to TSA: RMF 2008, TSA comprises a set of tables and is mainly descriptive in nature. It provides accounts and tables and macroeconomic aggregates, principal among them being the gross value added of tourism industry (GVATI), tourism direct gross value added (TDGVA) and tourism direct gross domestic product (TDGDP). The TSA also has a scope to link economic data with the investment in tourism, employment in the tourism industry and other non-monetary (quantitative) information related to tourism and tourists concerning tourism statistics.
USES ANDAPPLI CATIONSOF TSA
1.33. The important uses and applications of TSA are to:
Analyse tourism from an economic point of view.
Provide a set of accounts that are internationally compatible, working within national accounting principles.
Offer policy makers insights into tourism and its socio-economic functions and impacts (in current prices as well as in volume terms).
Calculate tourism value added for a given list of industries in a coherent system.
Provide information on the employment profiles of the tourism industries.
Indicate the production functions of tourism industries and illustrate the interlink ages between the tourism industries and the rest of the economy.
Offer a reference framework within which impact models and other analytical economic models of tourism can be calculated.
Provide an indication of the size of tourism capital investment, and the means to analyse its link with tourism supply.
Provide information on the industry’s capital stock and capital base.
REGIO N ALTO URIS MSATELLITEAC CO UN T
1.34. Regional TSAs or TSAs at sub-national level are increasingly becoming popular. According to TSA:RMF 2008, there are various reasons for encouraging discussion on how the Tourism Satellite Account can be adapted to sub-national levels. Some of these reasons are:
There is a worldwide trend towards a certain degree of

Region al Tourism Satellite Account– Chhattishgarh, 2009-10
|13| National Council of Applied Economic Research
decentralization of political power and decentralized management of national resources in federal states, regions, municipalities, etc. In order to allocate and monitor these resources effectively, more and better integrated regional and local information are required.
The tourism activities are multifaceted in nature and can potentially benefit rural areas that are seeking to diversify.
The unequal geographical distribution and characteristics of tourism activity within the national territory, from the standpoint of both demand and supply, lead to additional requirements for tourism statistics at the various territorial levels.
There is a growing interest of tourism-related businesses in learning about the interrelation of their activity with others and its main determinants and seasonal cycles.
There is a great necessity of improving the allocation of resources in national and local economies, which can only be achieved by upgrading quantitative references and measuring economic impacts.
1.35. There are no standard international guidelines to prepare regional or sub-national TSAs. However, TSAs at regional level or state level do provide useful indicators for regional tourism enterprises and organisations in identifying possible business opportunities and for state government tourism departments to formulate relevant tourism policies.
1.36. Essentially, preparation of a state TSA requires the following.
Statistics on expenditures made by visitors on different products within the state.
Statistics on supplies from the domestic production and imports (which include from other states) to meet these purchases of tourists.
Confrontation of the two sets of statistics in the national accounting framework through the supply and use tables so that supplies from domestic production and imports match with the expenditures made by tourists.
Estimate the value added out of the domestic production that is involved in supplying the products to tourists’ purchases.
1.37. This procedure of compiling a state TSA places enormous demand on data and construction of SUTs at state level. In India,

Region al Tourism Satellite Account– Chhattishgarh, 2009-10
|14| National Council of Applied Economic Research
SUTs are compiled neither at the national level nor at the state level.
1.38. The second method, normally followed by a few countries which compile regional TSAs, is applying the tourism industry ratios from national TSA on the output of the respective industries in the state. Following this approach, NCAER combined regional TSAs for the states of Kerala and Madhya Pradesh for the year 2009-10 in 2013 along with the TSA for India for the same year.
1.39. The state-level TSA for Chhattisgarh, presented in this Report followed the guidelines provided in the TSA RMF: 2008 to the extent they are applicable at regional level and the reportincludes the first seven tables and Table 10 on non-monetary indicators. In comparison to the all-India TSA tables, the state TSA tables do not include the supply table, as no information on imports to the state from other states or from abroad is available. The data sources mainly include (i) Domestic Passenger Survey, 2008-09 conducted by the National Sample Survey Office of the NSO, India, (ii) International Passenger Survey, 2009-10 conducted by the Indian Statistical Institute, India, (iii) State Accounts by State Department of Economics and Statistics, (iv) Employment and Unemployment Survey, 2009-10 conducted by NSSO, (v) Consumer Expenditure Survey, 2009-10, conducted by NSSO.
CON TRI BUTIONOF TO URISM TO E CON OMY
1.40. Tourism is witnessing itself being established as an important sector in the economies. The main reason on account of which this importance of tourism sector is realized is the increasing visitors consumption induced by increased number of visitor trips and significant increase in international tourism receipts per arrival.
WO RLD 1.41. According to UNWTO-Tourism Highlights, tourism’s total contribution to worldwide gross domestic product (GDP) is estimated at 9 per cent for 2014.
INDIA 1.42. With respect to the contribution of tourism to the GDP of India, the second Tourism Satellite Account of 2009-10 estimates it at 3.68 per cent as the direct share and 6.77 per cent, taking indirect impact also into account. This brings tourism to one of the top sectors of Indian economy in terms of contribution to economy.

Region al Tourism Satellite Account– Chhattishgarh, 2009-10
|15| National Council of Applied Economic Research
1.43. An exercise to update these numbers on annual basis till the release of third Tourism Satellite Account10 reveals that the share of tourism in GDP moderated slightly to 3.67 per cent in 2010-11 due to the overall slowdown in general economy and held the same share in 2011-12. However, the share increased to 3.74 per cent in 2012-13. Accordingly the total (direct and indirect) share fell from 6.77 per cent in 2009-10 to 6.76 per cent in 2010-11 and 2011-12 but upped at 6.88 per cent in 2012-13.
1.44. Tourism sector contributes significantly to the creation of jobs as well. It is estimated to have created 23.4 million jobs in 2009-10, which translated to a share of 4.4 per cent in the total employment. This sector also contributed 54.5 million jobs indirectly, which increased its share to 10.2 per cent. Within the non-agriculture employment, tourism had a share of 9.7 per cent in employment and if indirect share is included, the share goes up to 22.6 per cent. This implies that almost every 4th to 5th person employed in non-agricultural activities is directly or indirectly engaged in tourism activities.
1.45. The share of Tourism industries’ employment in total employment grew from 4.4 per cent in 2009-10 (according to Second TSA) to 4.6 per cent in 2010-11, to 4.9 per cent in 2011-12 and further up to 5.3 per cent in 2012-1311. Its direct and indirect share escalated to 10.7 per cent in 2010-11, 11.1 per cent in 2011-12 and 11.9 per cent in 2012-13.
BACK G RO UNDOF PRESEN TSTUDY
1.46. For India, the first TSA was prepared for the year 2002-03, followed by second for 2009-10. So far, state TSAs have been prepared for the first time in the country by NCAER during 2013-14. Taking this forward, the Ministry of Tourism had commissioned a 3-year integrated study to the National Council of Applied Economic Research (NCAER), which comprises the preparation of TSAs for all the States/UTs of India, 10 in each year; and two research papers in each year.
1.47. The present study is covered under Phase-III (2015-16) of a three-year integrated study commissioned by Ministry of Tourism to National Council of Applied Economic Research, New Delhi.
10 This exercise is based on the data obtained from the latest National Accounts Statistics, 2013 11 The employment numbers for 2011-12 were obtained from the latest NSSO survey on Employment and Unemployment of India, 68th Round. The employment for 2010-11 was obtained by interpolating the numbers of 2009-10 and 2010-11.

Region al Tourism Satellite Account– Chhattishgarh, 2009-10
|16| National Council of Applied Economic Research
Construction of Regional TSAs for 10 states of India is primary objective during each phase of the three-year study.
1.48. In the first and second phase of the 3-year integrated study, during 2013-14 and 2014-15 respectively, NCAER has prepared State TSAs for the following 20 states:
Phase I (i) Andhra Pradesh
(ii) Bihar (iii) Gujarat (iv) Jammu & Kashmir (v) Punjab
(vi) Rajasthan (vii) Sikkim
(viii) Tripura (ix) Tamil Nadu (x) West Bengal
Phase II (i) Arunachal Pradesh
(ii) Assam (iii) Goa (iv) Himachal Pradesh (v) Jharkhand
(vi) Karnataka (vii) Maharashtra
(viii) Odisha (ix) Puducherry (x) Uttar Pradesh
1.49. The final reports of 20 State-TSAs and the four research reports were submitted to the Ministry of Tourism. Presentation based on these draft reports was made to the Secretary of Tourism, other senior officers from the MoT and to state representative of State Department of Tourism, of 20 selected states, with representatives from NCAER.
1.50. Reports on TSAs of 20 states, were well taken and the meeting focused on the importance in compilation of regional TSA. Key findings of State TSAs are given in Table 1.21 and 1.22:

Region al Tourism Satellite Account– Chhattishgarh, 2009-10
|17| National Council of Applied Economic Research
TABLE 1.2: CONTRIBUTION OF TOURISM TO STATE GDP – PHASE I STATES
States Gross Value added (GVA) at basic prices(Rs. Lakh)
Tourism Direct Gross Value Added (TDGVA) (Rs. Lakh)
Share of TDGVA in GVA (%)
Andhra Pradesh 4,81,66,626 18,56,387 3.85 Bihar 1,65,24,762 5,15,201 3.12 Gujarat 1,65,10,594 5,84,043 3.54 Jammu & Kashmir 49,12,896 1,93,346 3.94 Punjab 2,03,58,388 5,68,773 2.79 Rajasthan 2,69,89,445 10,03,602 3.72 Sikkim 6,28,848 17,782 2.83 Tripura 15,61,572 47,548 3.04 Tamil Nadu 4,88,08,673 18,95,119 3.88 West Bengal 4,08,56,666 13,65,832 3.34 India 61,86,95,000 2,34,91,181 3.8
Source: NCAER Computation
TABLE 1.3: CONTRIBUTION OF TOURISM TO STATE GDP – PHASE II STATES
States Gross Value added (GVA) at basic prices(Rs. Lakh)
Tourism Direct Gross Value Added (TDGVA)
(Rs Lakh)
Share of TDGVA in GVA
(%)Arunachal Pradesh 7,57,671 14,750 1.95 Assam 97,30,973 2,65,871 2.73 Goa 1,65,10,594 2,18,577 7.39 Himachal Pradesh 48,95,572 1,92,797 3.94 Jharkhand 1,02,23,781 2,82,299 2.76 Karnataka 3,43,48,035 10,97,409 3.19 Maharashtra 8,70,31,584 17,782 3.28 Odisha 1,65,20,188 47,548 3.52 Puducherry 12,52,157 18,95,119 1.95 Uttar Pradesh 5,31,78,944 13,65,832 3.42 India 61,86,95,000 2,34,91,181 3.8
Source: NCAER Computations
OBJE CTIVES &SCO PE
As mentioned above, the regional TSAs for all the States/UTs of India are proposed to be prepared for 2009-10.
13 states that have been identified for which State TSAs will be prepared during third phase (2015-16) are as follows:
(i) Andaman & Nicobar Island (ii) Chandigarh
(iii) Chhattisgarh (iv) Dadra & Nagar Haveli (v) Daman & Diu
(vi) Delhi (vii) Haryana
(viii) Lakshadweep (ix) Manipur (x) Meghalaya
(xi) Mizoram (xii) Nagaland
(xiii) Uttarakhand

Region al Tourism Satellite Account– Chhattishgarh, 2009-10
|18| National Council of Applied Economic Research
1.51. The topic of the two research reports for 2015-16 will be communicated to NCAER by MoT after mutual discussion and the decision will be based on the importance of the topic and feasibility of these reports with the given set of data.
State-wise (Source of origin as well as destination wise) comparison of the average number of trips, duration and spending pattern.
A comparative study on how the household with different socio- economic background are spending on tourism.
TO URIS M INCH H ATTIS G ARH
1.51. The major tourist attractions offered by Chhattisgarh to its tourists is a heavily forested state in central India also known for its temples and waterfalls. It is home to famous Lakshmana (Laxman) temple, decorated with carvings from Indian mythology.
1.52. Domestic tourist visits stood at 2.45 crore in 2014, posing an annual growth of 7.4 per cent while the numbers in case of foreign tourist visits were recorded at 7,777 and 100 per cent for the same period.
1.53. visits stood at 9.8 crore in 2013, posing an annual growth of 4 per cent while the numbers in case of foreign tourist visits were recorded at 7.9 lakh and 7 per cent for the same period.
Figure 1.6: Foreign and Domestic Tourist Visits in Chhattisgarh (‘000)
Source: Various India Tourism Statistics reports, Ministry of Tourist
0
5000
10000
15000
20000
25000
30000
2001
2002
2003
2004
2005
2006
2007
2008
2009
2010
2011
2012
2013
2014
0
1
2
3
4
5
6
7
8
9
Dom
esti
c T
ouri
sts
Arr
ival
Fore
ign
Tou
rist
s A
rriv
al
Foreign Tourists Visits Domestic Tourists Visits

Region al Tourism Satellite Account– Chhattishgarh, 2009-10
|19| National Council of Applied Economic Research
1.54. According to the latest data compiled by the Ministry of Statistics and Programme Implementation (as on 31st Dec, 2012), Chhattisgarh have a total of 47 approved hotels with 3730 rooms. The number of hotels and rooms by type of hotels are presented in the table below:
TABLE 1.4: NUMBER OF APPROVED HOTELS AND ROOMS IN CHHATTISGARH, 2012
Types of Hotels Hotels Rooms One Star 4 103 Two Star 2 67 Three Star 25 1462 Four Star 3 188 Five Star 3 348 Five Star Delux 7 1370 Others 3 192 Total 47 3730
Source: http://www.andamanandnicobarislandstat.com, CSO
1.55. There are 36 recognised tour operators or travel agents in the state, of which 16 are travel agents, 7 cater to inbound tourism, 5 are domestic tour operators and the remaining 8 are tourist transport operators.
1.56. The state government spends about Rs. 3 crore every year on the maintenance of centrally protected ticked monuments in the state (see Table below). But the state earns more than it spends through the revenue collected from entry fee in these monuments.
TABLE 1.5: EXPENDITURE INCURRED AND REVENUE COLLECTED ON CENTRALLY PROTECTED TICKED MONUMENTS IN CHHATTISGARH
Centrally Protected Ticketed Monuments in Chhattisgarh
State 2009-10 2010-11 2011-12
Expenditure incurred 351.4 294.6 334.7 Revenue earned from entry fee 384.4 409.6 442.1
Source: http://www.andamanandnicobarislandstat.com, CSO
STATETO URIS MPOLI CY
1.57. The Chhattisgarh government constituted the Chhattisgarh Tourism Vision Group (KTVG) in 2003. According to the report prepared by this group, the tourist traffic in the state is expected to more than double by 2024. In order to cater to this huge growth, an investment of Rs. 54000 crore is estimated in the sector over the period of 2015-2020, of which about half is expected to be mobilised by the private sector.

Region al Tourism Satellite Account– Chhattishgarh, 2009-10
|20| National Council of Applied Economic Research
1.58. Against this backdrop, the Chhattisgarh Tourism Policy 2015-20 focuses on facilitating private investment in the tourism sector and strives towards making tourism a safe and sustainable sector in the state.
1.59. The mission statements of Chhattisgarh Tourism Policy 2015-20 are as follows:
Promote tourism products and services to encourage repeat visits, increased length of stay and tourist spending.
Preserve social and cultural fabric of the state, while stimulating economic growth and raising quality of service to world standards.
Protect environment and ecology and encourage safe and sustainable tourism in the state.
1.60. To achieve these, the government has identified many strategic intervention areas which include positioning Chhattisgarh as the preferred tourist destination at state, national and international level; improvement in infrastructure and tourism products and services; streamlining processes for obtaining approvals; prioritising human resource development; promote ICT initiatives; provide concessions and subsidies to tourism products and services; and create institutional structures for effective implementation of Tourism Policy.
1.61. With regard to improving Tourism products and services, special emphasis will be laid on mega projects like golf courses, cruise tourism; entertainment products like cable cars, tourism trains; heritage zones; and various types of tourism like marine tourism, eco-tourism, rural tourism, wellness tourism, adventure tourism, weekend tourism, healthcare tourism, religious tourism etc.

Region al Tourism Satellite Account– Chhattishgarh, 2009-10
|21| National Council of Applied Economic Research
STRUCTURE OFTHE RE PO RT
1.62. The present section on Introduction dealt with the importance of tourism, problems in the measurement of economic aspects of tourism, the concept of satellite accounting in the framework of national accounts, tourism satellite accounts, its role and applications and regional tourism satellite accounts.
1.63. Chapter 2 presents a snapshot of the state of reference, which here is Chhattisgarh. This chapter serves as a window to the state’s geographical, demographic and economic profile, all of which, albeit partially, contribute to the extent of tourism activities in the state.
1.64. Chapter 3 talks briefly about the various data sources that were used in the preparation of the state TSA.
1.65. Chapter 4 provides the framework of the recommended TSA tables and tourism aggregates that have been included in this Report. The text for this section is mainly drawn from IRTS, 2008 and TSA: RMF 2008.
1.66. Chapter 5 presents the TSA tables for the year 2009-10.This Section also includes the tourism aggregates that have been derived from the TSA tables.
1.67. Chapter 6 presents the key findings of TSA, 2009-10.
1.68. The Glossary includes the conceptual issues and operational definitions of tourism, its types, forms, dimensions and related issues.
1.69. Estimation Procedure section provides insights on procedure followed to estimate number of trips, by different categories such as main destination, purpose of trips, mode of travel etc., undertaken during last 365 days from DTS micro-data. This information is provided only for last 30 days in the data.
_____________________

Region al Tourism Satellite Account– Chhattishgarh, 2009-10
|22| National Council of Applied Economic Research

Region al Tourism Satellite Account– Chhattishgarh, 2009-10
|23| National Council of Applied Economic Research
2. PROFILE OF THE STATE
GEOG RAPHI CPROFILE
2.1. Chhattisgarh has Madhya Pradesh in northwest, Maharashtra in southwest, Telangana in south, Odisha in east, Jharkhand in northeast and Uttar Pradesh in north. In 2000, it was made from16 chhattisgarhi speaking southeastern districts of Madhya Pradesh. Chhattisgarh has 18 districts and capital is Raipur. Chhattisgarh has an area of 1,35,160 sq km in 2011. Density of population is 189 people per sq km in 2011 much below India population density of 382. Chhattisgarh is divided into 4 administrative divisions, namely, Baster, Raipur, Bilaspur and Surguja. Chhattisgarh in its eastern parts is influenced by Oriya culture. Chhattisgarh is connected with epic Ramayana. Dandakaranya region in Chhattisgarh is identified with exile of Lord Rama and his wife Sita, with younger brother Laxmana. Shivrinarayan near Bilaspur is named after Shabari in Ramayana. State bird is Pahari Myna, state tree is Sal or Sarai, state animal is Van Bhainsa (Wild Buffalo). State language is Chhattisgarhi. Bengali, Telgu, Hindi, Kosali, Odia and Bhojpuri are languages spoken.
2.2. Malhar is an ancient town of Chhattisgarh. It is a tourist attraction as it was centre of Buddhism in 300 CE to 650 CE. Buddhist shrines belonging to Vajrayana sect were discovered in the region. An image of a Vajrayana deity is preserved at Malhar museum. Malhar lies on an ancient route of Koshambi and Puri, it is therefore linked with cultural and political developments. Two temples and a mud fort were discovered in Malhar. Pataleshvara temple is 10th or 11th century old, famous for its carving under the protection of Archaeological Survey of India. Bhima Kichaka temple is dedicated to Shiva was found in ruins. Sirpur another important centre of Buddhism during 6-10th century in Chhattisgarh, has various Buddhist excavations discovered.

Region al Tourism Satellite Account– Chhattishgarh, 2009-10
|24| National Council of Applied Economic Research
DEM OG RAPHI CAND SOCI ALPROFILE
2.3. Population of Chhattisgarh is approx. 2.6 crs, constituting 2.1 per cent of the total population in 2011. Hindu’s are 94.7 per cent of the total people in Chhattisgarh. Muslims comprise of 2.0 per cent and Christian constitutes 1.9 per cent of total population in Chhattisgarh, according to 2001, Census. In 1991-01 the population of Chhattisgarh grew at rate of 18.3 lower than India growth rate of 21.5 per cent. During 2001-11, Chhattisgarh growth rate of 22.6 per cent is higher than India growth rate of 17.7 per cent. As per census 2011, in Chhattisgarh males constitute 50.2 per cent of the total population. Total literacy in Chhattisgarh is 70.3 per cent. Chhattisgarh has 30.6 per cent of ST population, SC constitutes 12.8 per cent of the total population.
2.4. Sex ratio in Chhattisgarh is 991, higher than the national average of 943. The rural women are independent, organised and outspoken. There exist custom in Chhattisgarh of “chudi pahanana” to allow women to terminate of marriage. Witchcraft is practiced in tribal population, where women are believed to be witches (tonhi). In 2005, Chhattisgarh Tonhi Atyachar (Niwaran) Act was passed. Male literacy in Chhattisgarh is 80.3 per cent and female literacy is 60.2 per cent. Rural literacy in Chhattisgarh is 66.0 per cent and urban literacy is 84.0 per cent of the total population. HDI index is lowest in Chhattisgarh at 0.358. Per capita income in Chhattisgarh is below national average at Rs. 58,522 in 2013-14.
ECON OMI CPROFILE
2.5. In 2013-14, growth rate of Chhattisgarh and India is 5.0 per cent & 4.7 per cent respectively. In 2001-11, Chhattisgarh has grown at an average growth rate of 12.4 per cent, and corresponding rate of growth of India is 10.0 per cent. Despite very low standards of living it has witnessed high growth rates. Chhattisgarh has 16 per cent of coal deposits of India. The 12 coal sites in Chhattigarh produces 44483 mn tonnes of coal. Bhilai in Chhattisgarh accounts for 75 per cent of total export, remaining exports are from Urla, Bhanduri and Sirgitti. Indian Institute of Management, All India Institute of Medical Sciences and National Institute of Technology are premier institutes of Chhattisgarh. Chhollywood is film industry of Chhattisgarh.

Region al Tourism Satellite Account– Chhattishgarh, 2009-10
|25| National Council of Applied Economic Research
Figure 2.1: Growth in Gross State Domestic Product (constant prices)
Source: NCAER Computation
AGRICUL TURE 2.6 Agriculture in 2013-14 constitutes a share of 19.1 per cent in GSDP. The rate of growth of agriculture in 2013-14 is 1.4 per cent. Chhatisgarh is known as “rice bowl” as it is main crop, with 3.9 mn ha of land under cultivation. Modern practices e.g. use of Chloroxylon for pest management in organic rice cultivation is followed. The medicinal rice variety grown in Chhattisgarh is an immune booster. Maize, kodo-kutki, small millet, pulses and oilseeds are among other crops. Chhattisgarh mostly has single cropping with lesser dependence on irrigation.
2.7. Horticulture includes Mango, Banana, Guava, Litchi, Cashew-nut, Cheku, Sitafal, Cucurbits, Beans, Cabbage, Cauliflower, Solaneious crops etc. Horticulture in Chhattisgarh has 0.7 mn ha of land under cultivation. Tea production is encouraged in districts of Jashpur and Surguja in Chhattisgarh. Tea processing unit in Sogara Ashram is named as Aghor Tea Processing Plant. Spices like Chili, Ginger, Garlic, Turmeric, Coriander & Methi are grown in state. Marry-gold, Tuberose, Gladiolus, Roses, Gaillardia, Chrysanthemum, Orchids etc. constitute floriculture of Chhattisgarh.
8.5 7.5
9.5 9.6 9.3
6.7
8.6 8.9
6.7
4.5 4.7
16.5
5.5
3.2
18.6
8.6 8.4
3.4
10.6
5.7
8.8
5.0
0
2
4
6
8
10
12
14
16
18
2020
03-0
4
2004
-05
2005
-06
2006
-07
2007
-08
2008
-09
2009
-10
2010
-11
2011
-12
2012
-13
2013
-14
All India State

Region al Tourism Satellite Account– Chhattishgarh, 2009-10
|26| National Council of Applied Economic Research
Figure 2.2: Structural Changes in GDP over the last decade
Source: NCAER Computation
INDUS TRYSECTOR
2.8. Industry sector constitute 42.4 per cent of the total GSDP in 2013-14. Services sector constitute 38.5 per cent of GSDP in 2013-14. Industry grew at a rate of growth of 5.2 per cent in 2013-14. Services grew at 7.0 per cent in same period. Chhattisgarh has dominant agriculture and industry sector than services sector. Korba is power capital of Chhattisgarh. National Thermal Power Corporation Ltd (NTPC) has 2,600 MW plant in Korba. NTPC‘s Sipat plant in Bilaspur is 2,980 MW plant. Chhattisgarh State Electricity Board (CSEB) has generation capacity of 1780 MW and hydel capacity of 130 MW. Korba west and east thermal power station is owned by CSEB.
2.9. Chhattisgarh produces 15 per cent of total steel production in India. Bhilai Steel Plant is the main plant owned by SAIL. There are steel plants in Raipur, Bilaspur, Korba and Raigarh as well. Bharat Aluminium Company Ltd. is located in Korba. There are industries e.g. handicrafts, handlooms, blended yarn, food and agri. products etc. promoted by Chhattisgarh State Industrial
g g
0%
20%
40%
60%
80%
100%
2002
-03
2003
-04
2004
-05
2005
-06
2006
-07
2007
-08
2008
-09
2009
-10
2010
-11
2011
-12
2012
-13
2013
-14
Agriculture and Allied Industry Services

Region al Tourism Satellite Account– Chhattishgarh, 2009-10
|27| National Council of Applied Economic Research
Development Corporation Ltd. Indian Oil–CREDA Biofuels Ltd. in Chhattisgarh produces 30,000 MT of biodiesel every year. National Mineral Development Corporation, Jindal Steel and Power Plant etc. are important companies in Chhattisgarh. Chhattisgarh produces, cement, engineering products, iron ore, tin, bauxite, dolomite, limestone, quartz, marbles, diamonds etc.
Figure 2.3: Sectoral Growth in Gross State Domestic Product (constant prices)
Source: NCAER Computation
CLIM ATE 2.10. Chhattisgarh has tropical climate. In summers during Mar-May average temperatures ranges from 30oC to 45oC. In winters from Nov-Jan the weather is mostly pleasant, with temperatures ranging from 0oC to 25oC. Monsoon season is from Jun-Oct, with average annual rainfall of 140 cms.
-30
-20
-10
0
10
20
30
40
50
2000
-01
2001
-02
2002
-03
2003
-04
2004
-05
2005
-06
2006
-07
2007
-08
2008
-09
2009
-10
2010
-11
2011
-12
2012
-13
2013
-14
Agriculture and Allied Industry Services State

Region al Tourism Satellite Account– Chhattishgarh, 2009-10
|28| National Council of Applied Economic Research
NATURE ANDWILD LIFETO URIS M
2.9. Chhattisgarh has 44 per cent of its total area covered by deciduous forest. The forest type is tropical moist deciduous forest and tropical dry deciduous forest. Indravati National Park (INP) est. in 1982 is a 1258 sq km park in Bijapur. The park is named after Indravati, a nearby river. It is home to rare wild asian buffalos and hill mynas. The park in 1981 was proclaimed national park. In 1983, it became a tiger reserve of India. The park has an altitude of 177-599 m above sea level. It has hilly terrain, covered with Sal, Teak, Lendia, Tendu, Salai, Semal, Mahua, Haldu, Jamun, Bamboo, Grasses etc. Wildlife consists of Gaur, Leopard, Nilgai, Chausingha, Sloth Bear, Striped Hyenas, Black Buck, Sambar, Wild Boar, Chital, Indian Muntjac, Indian Spotted Chevrotain, Cobra, Russel’s Viper, Indian Rock Python etc.
2.10. Kanger Valley National Park (KVNP) est. in 1982 is 200 sq km park, in Baster district. It is situated along Kanger valley and perennial river Kanger. The park has Sal, Teak, Bamboo, Climbers, Wild Sugarcane, Ferns, Epiphytes etc., including virgin forests. Wildlife e.g. Tiger, Leopard, Mouse Deer, Wild Cat, Chital, Sambar, Jackal, Sloth Bear, Wild Boars etc. are found in park. The soil type is loamy, sandy & lateritic, however due to seasonal nallahs it support wildlife. Park has birds e.g. Hill Myna, Spotted Owlet, Red Jungle Fowls, Racket-tailed Drongos, Steppe Eagles, Red Spur Fall, Tree Pie, Heron etc. Tribal populations exist in park in forest village of Kotamsar. Cliff in Tirathgarh waterfall area is habitat for bats, eagles, pigeons, reptiles etc. The park has catchment area of Godavari river. Kotumsar cave is popular limestone cave, 35 m below ground level. The cave discovered in 1900, is 137 m long, near bank of Kanger river. The Kailash cave, discovered in 1993, is 250 m long, situated 40 m above ground level, hasformation of Shivlinga.
SO CIE TY 2.11. Baster district in Chhattisgarh has ST and SC population of 65.6 per cent and 2.3 per cent respectively. Tribes in Chhattisgarh differ among themselves in many aspects. However, most of the tribes are highly religious and worship gods and goddesses. Women tribes dress themselves with ornaments made of cowries, shells, bones, copper and bronze. Black magic is offered as a cure to many diseases by some tribes. The dominant tribes are Agariya, Birhor, Baiga, Kharia, Pardhan and Gond. Gond or Kotoriya tribes are oldest and maximum in numbers. Gond is literal telegu term meaning “Kond” signifying hill. The Gond tribes are agrarian.

Region al Tourism Satellite Account– Chhattishgarh, 2009-10
|29| National Council of Applied Economic Research
Allied activities e.g. forestry, fishing, hunting, cottage industries are subsistence activities of these tribes. Gonds follow traditional Hindu customs, and get married within the family. Gonds tribes are sub-divided into Asur, Korba, Abhuj Maria, Nagarchi, Gaiki and Badi Maria. Abuj Maria living in Narayanpur believes in primitive customs and is not driven by material pleasures. Abuj Maria is more bestial than human, but fear mankind. Headdresses form another distinction among tribes. Bison Horn Maria tribe has horns of a wild bison.
2.12. In Chhattisgarh the percentage of rural population is 76.8 per cent. There is 92.4 per cent of ST population staying in rural areas in Chhattisgarh. Rural SC population constitutes 76.7 per cent. Work force participation rate is 55.6 per cent. The social development in the state is gloomy. Poverty is prevalent in the state. The social problems are underlined in writing of Khub Chand Baghel in plays “Jarnail Sigh” and “Unch Neech”. Habib Tanvir play Charandas Chor, is part of Chhattisgarh theatre. E-Governance in Chhattisgarh is promoted through CHIPS (Chhattisgarh Infotech and Biotech Promotion Society) and CHOICE (Chhattisgarh On-line Information for Citizens Empowerment). Pakhal bhat, korsa, angakar roti, and rice flour chapatti is traditional tribal food of Chhattisgarh. Fara/muthiya, cheela, chousera roti etc. is prepared too. Sweets of Chhattisgarh are rakhia badi and bafauri. Mahuwa is local drink of Chhattisgarh made from fruit of local tree.
FAI R ANDFESTI V ALS
2.13. Main festivals of Chhattisgarh are Baster Dussehra, Goncha, Hareli, Dantewada fair, Champaran mela, Sirpur festival, Ma Bambleshwari fair and Rajim Lochan Mahotsav. Danteshwari temple at Dantewada is named after Goddess Danteshwari. It is a Goddess of tribes and Hindu’s in Baster region, has shrines of Shakti, the divine feminine. 'Bastar Dussehra' festival every year is celebrated by thousands of tribes and tourists gathered to pay homage to this goddess.
2.14. Diwali in Bhilai, Chhattisagrh is celebrated with great pride. Hareli festival is one of the most important harvest festival in Chhattisgarh celebrated in monsoon to seek blessings of God for good crop. Goncha festival is celebrated at time of Rath Yatra by tribes of Chhattisagrh. Raut Nacha is a traditional folk dance of cowherds. The dance form is related to Krishna with gopis,

Region al Tourism Satellite Account– Chhattishgarh, 2009-10
|30| National Council of Applied Economic Research
performed by Yaduvanshi. The festival is celebrated from Goverdhan puja to Ekadashi. Karma is tribal dance of Gonds, Baigas, and Oraons in Chhattisgarh. It is performed to welcome spring season, at the end of rainy season. Panthi, Karma, Pandwani and Soowa Nacha are some other dance forms of Chhattisgarh.
HISTO RY 2.15. The region of Chhattisgarh and west Odisha is considered Dakshina Kosala under Maurya Empire. Kausalya, mother of Lord Ram is native of this kingdom. However, during 6th to 12th century, the region came under Sarabhpurias, Panduavanshi, Somvanshi, Kalachuri and Nagvanshi. Kalachuris ruled Chhattisgarh from 980 to 1741 AD. Chedisgarh means “Empire of Chedis” or Kalchuri Dynasty. The Bastar region of Chhattisgarh was ruled by Chola dynasty in 11th century. Chhattisgarh was with Marathas from 1741 to 1845 AD. British rule was est. during 1845 to 1947 in Chhattisgarh region, wherein Raipur gained prominence over capital Ratanpur. In 1905, under British administration the Sambalpur district was transferred to Odisha and Surguja was transferred to Chhattisgarh from Bengal. Nagpur was made the capital of the region. The region became a part of the Central Provinces and Berar under British rule. During this time, some areas constituting Chhattisgarh state were princely states under British rule, but later on were merged into Madhya Pradesh. In 1956, the region was merged with Madhya Pradesh under the States Reorganisation Act, 1956.
TO URIS M 2.17. Chhattisgarh means “36 forts”. These forts have not been identified in the region. There are few palaces that are popular among tourist. Kanker palace located at a national highway is 140 km south of Raipur. In 1937, the palace was built as a colonial bungalow for British agent. The palace has adjoining tribal villages in Baster. Kanker and Baster area of south Chhattisgarh is covered with dense tropical forest. Qila Dongri and rock formations with prehistoric paintings are nearby visits. Palace Chhuikhadan on state highway of Kawardha to Rajnandgaon is 120 km northwest of Raipur. The Palace was built in 18th century and is well connected with other states. Chhattisgarh therefore is enclosed by hills on both north and south side of the state. The satpura range is in the east and Chota Nagpur Plateau in west, forming a belt that divides the Mahanadi river basin from Indo-Gangetic plain. The central part of Chhattisgarh is plain, i.e. fertile

Region al Tourism Satellite Account– Chhattishgarh, 2009-10
|31| National Council of Applied Economic Research
upper basin of Mahanadi river used for rice cultivation. The Mahanadi basin is separated from Narmada basin in west by Maikal Hills and Odisha in the east by hill ranges. The southern part of Chhattisgarh has Deccan plateau and Godavari river basin. The rivers of Chhattisgarh are Mahanadi, Hasdo (a tributary of Mahanadi), Rihand, Indravati, Jonk, Arpa and Shivnath.
2.18. Champaran, 56 km from Raipur is birth place of Saint Vallabhacharaya, reformer and founder of Vallabha sect. Chhattisgarh has religious sects as Satnami panth, Kabir panth, Ramnami samaj etc. The Shabari temple of Kharod, Nar Narayan temple of Sheorinarayan, Vishnu Mandir of Janjgir are important pilgrim places of Chhattisgarh. There are 20,126 villages in Chhattisgarh. Most of them have “Ghotul” huts made up of bamboos and earthen walls. Tribal art of kosa silk and lost wax art is famous in Chhattisgarh. Craft items made by tribes of Chhattisgarh from bamboo, jute, clay, wood etc are popular. Temple of Maa Bamleshwari at Dongargarh is a Holy shrine. Dongargarh is considered a tirth, as 2200 years ago, it was territory named Kamavati, ruled by Maharaja Kamsen, also called Kamakhya Nagri. The temple was constructed when the queen gave birth to Maharaja’s son.
2.19. Chhattisgarh road length is 45,988 km, having low road density in comparison to national average. Railway in Chhattisgarh is part of South Eastern Central Railway Zone of Indian Railways. Raipur, Bilaspur, Durg, Champa, Korba, Raigarh and Rajnandgaon are main railway stations. The railway in Chhattisgarh has highest freight loading in the country. Freight trains have regular service mostly of coal and iron ore on Mumbai-Howrah line. The north and south of Chhattisgarh is disrupted from passenger services. Swami Vivekananda Airport in Raipur is Chhattisgarh’s only domestic airport. Dantewada district in Baster division has repeated naxalite attacks. These assaults are also witnessed in Narayanpur and Sukhma districts of Chhattisgarh.

Region al Tourism Satellite Account– Chhattishgarh, 2009-10
|32| National Council of Applied Economic Research
HE ALTH ANDMEDICAL
2.20 Chhattisgarh has high Infant Mortality Rate (IMR) and need to be brought down. The IMR in Chhattisgarh is 47 and India’s IMR is 44 in 2011. The children in Chhattisgarh are suffering from underweight and malnutrition. Fertility rate in Chhattisgarh is high compared to all-India with low maternal health. Total Fertility Rate (TFR) in Chhattisgarh is 2.8 in 2010 in comparison to all-India at 2.5. Crude Birth Rate (CBR) in Chhattisgarh is 24.5 in 2011, also higher than national average at 21.8. Crude Death Rate (CDR) is higher at 7.9, than India’s CDR at 7.1.
2.21. The 12th plan under National Health Mission in Chhattisgarh is to reduce IMR and TFR. Haal Hruday Suraksha Yojana in 2008 started for hospitals in Chhattisgarh like Apollo S.R., Ram Krishna Care Hospital, Escort Heart Centre and Apollo. Chhattisgarh Rural Medical Course (CRMC) is recommended for medically unreached areas, where doctors and staff is unavailable. To reach people in these areas, 74 mobile medical units are made available. Special incentives for doctors working in backward areas include availability of health dept. colony, transport, insurance schemes, family support for education etc. for. Proposal to post 3 year medical diploma holder in rural PHCs and more nurses in PHCs and CHCs is planned.
_____________________________________
References Chhattisgarh-Wikipedia, https://en.wikipedia.org/wiki/Chhattisgarh Official Website Govt. of Chhattisgarh, https://cgstate.gov.in/en/about-chhattisgarh Maps of India, http://www.mapsofindia.com/chhattisgarh/people-culture-festivals/chhattisgarh-tribes.html Walk through India, http://www.walkthroughindia.com/attraction/chhattisgarh-the-beautiful-world-of-tribal-india/ Maa Bamleshwari, http://maabamleshwaridevi.com/ Danteshwari Temple - Wikipedia, https://en.wikipedia.org/wiki/Danteshwari_Temple Indravati National Park - Wikipedia, https://en.wikipedia.org/wiki/Indravati_National_Park Kanger Ghati National Park - Wikipedia, https://en.wikipedia.org/wiki/Kanger_Ghati_National_Park Outlook Traveller, http://www.outlooktraveller.com/trips/royal-colours-1004594 Indian History and Architecture, http://puratattva.in/2011/09/26/malhar-a-rhythm-of-antiquity-1121 Department of Agriculture, Chhattisgarh, http://agridept.cg.gov.in/index.htm Directorate, Horticulture & Farm Forestry, Department of Agriculture, Government of Chhattisgarh, http://cghorticulture.gov.in/index.htm Mineral Resource Department, Govt. of Chhattisgarh, http://chhattisgarhmines.gov.in/about-us.htm Maps of India, http://www.mapsofindia.com/energy/chhattisgarh-thermal-power-plants-map.html

Region al Tourism Satellite Account– Chhattishgarh, 2009-10
|33| National Council of Applied Economic Research
3. DATA SOURCES AND THEIR KEY FINDINGS
DATA SO UR CES 3.1. The important data sources used for the preparation of the second TSA for India were the following:
Domestic Tourism Survey of NSSO, 2008–09
International Passenger Survey of Indian Statistical Institute (ISI), Kolkata, 2010–11
Employment and Unemployment Survey of NSSO, 2009–10
Consumer Expenditure Survey of NSSO, 2009–10
State Accounts by State Department of Economics and Statistics, 2012.
DO MESTI CTO URIS MSURVEY (DTS)
3.2. National Sample Survey Office (NSSO) conducted its first comprehensive survey on domestic tourism, called Domestic Tourism Survey, during the period July 2008 to June 2009. This was an all-India household survey and was carried out as part of NSSO’s 65th Round of sample surveys.
3.3. A detailed schedule of enquiry was used to collect data from the sample households on various parameters like household characteristics such as comprising household size, principal industry, principal occupation, household type, religion, social group, consumption expenditure, number of overnight trips, and same-day trips undertaken, visits of NRIs to the households and their impact, renting out of some portion of the house to tourists during the last 365 days, and awareness, source of information, and impact of the “Incredible India” campaign by the Government of India or other tourism promotional campaigns.
3.4. Data were also collected for each household member on age, gender, marital status, educational level, usual principal activity status, industry and occupation of employed members, number of overnight as well as same-day trips completed during the last 30 days and the last 365 days.
3.5. For each trip, data on various trip characteristics were also collected. These included leading purpose of the trip, main

Region al Tourism Satellite Account– Chhattishgarh, 2009-10
|34| National Council of Applied Economic Research
destination, number of places visited, mode of travel, type of stay, number of nights spent outside usual place of residence, and so on. Finally, for the latest three overnight trips completed during the last 30 days, detailed data were collected on expenditure on different items under the heads of accommodation, food and drink, transport, shopping, recreation, religious, cultural, sporting, and health-related activities, and other expenditures along with information of reimbursement/direct payment by any institution for such trips.
3.6. The main objectives of the survey were to estimate the volume of domestic tourism in terms of number of visitors, number of households undertaking domestic tourism activity and number of trips that contributed to domestic tourism in India; to study the characteristics of visitors such as age, economic level, activity status, occupation and industry of work; to study the characteristics of trips such as purpose, main destination etc; and to estimate the expenditure incurred by the households in domestic tourism activity.
3.7. For the DTS 2008-09, a stratified multi-stage sampling design was adopted. In all, 1,53,308 households were surveyed from 8109 sample villages and 4719 urban blocks spread over all states and union territories of India. Of the total households, 97,074 (63 per cent) belonged to the rural areas and 56,234 to urban areas. Out of the total sample households, number of households reporting overnight visitors was 1,44,384.
3.8. In Andaman and Nicobar Islands, the sample number of households was 444, comprising 252 from rural areas and 192 from urban areas. Number of households reporting overnight visitors were 404. In other words, 91 per cent of the sample households reported overnight visitors.
3.9. For India, total number of households reporting overnight visitors was estimated at 20.61 crore and total number of overnight visitors was estimated at 78.35 crore. These numbers for Chhattisgarh were 66,500 and 2.22 lakh respectively. The rural-urban breakup suggests that of the total 2.22 lakh overnight visitors, as much as 71.6 per cent were from rural areas of the state. As compared to this, at national level, overnight visitors belonging to rural areas are 73.2 per cent of the total.

Region al Tourism Satellite Account– Chhattishgarh, 2009-10
|35| National Council of Applied Economic Research
3.10. Intensity of domestic tourism in each state is measured by the number of trips per 100 household during a year. Chhattisgarh secured 19th rank in terms of intensity of overnight domestic tourism, with an average of 340 trips per 100 households, as compared to the all-India average of 418 trips per 100 households. Hence, the tourism intensity in Chhattisgarh is 18.7 per cent lower than the national-level tourism intensity. Regarding the incidence of trips per 100 rural households, Chhattisgarh secured 15th rank with 418 trips per 100 households as against 440 for India. The rank for urban Chhattisgarh was 32 with an average of 181 trips per 100 households as compared to 365 for urban India.
USE OF DTS INPRE PARATI ON OF S TATE TSA
3.11. The DTS data that were used in the preparation of TSA for Chhattisgarh were the expenditure data by items of expenditure and by purpose of travel. These expenditures were collected for the tourists who travelled within the state providing information on Domestic Tourism Expenditure of the state. Also these data were used to arrive at the expenditures of those tourists who belonged to other states of India but whose main destination was Chhattisgarh. This formed one part of Inbound Tourism Expenditure, the other part being expenditure of foreign tourists that visit the state, which was obtained from the International Passenger Survey.
DTS– KEYFINDINGS FO R CH H ATTIS G ARH
3.12. In all, 4.6 crore visitor-trips originated from Chhattisgarh (here, Chhattisgarh is the state of origin), of which only 7.2 per cent of the trips were undertaken in the states other than Chhattisgarh.
3.13. Of the total 4.6 crore visitor-trips, 82.8 per cent originated from the rural parts of the state. As compared to this, at national level, 73.5 per cent of the total 211.7 crore visitor-trips originated from the rural sector.
3.14. On the other hand, with Chhattisgarh as the state of destination, a total of 3.2 crore visitor-trips were undertaken. Of these 4.1 per cent of the trips were undertaken from states other than Chhattisgarh. Hence, the majority of the tourism activity occurred within the state.
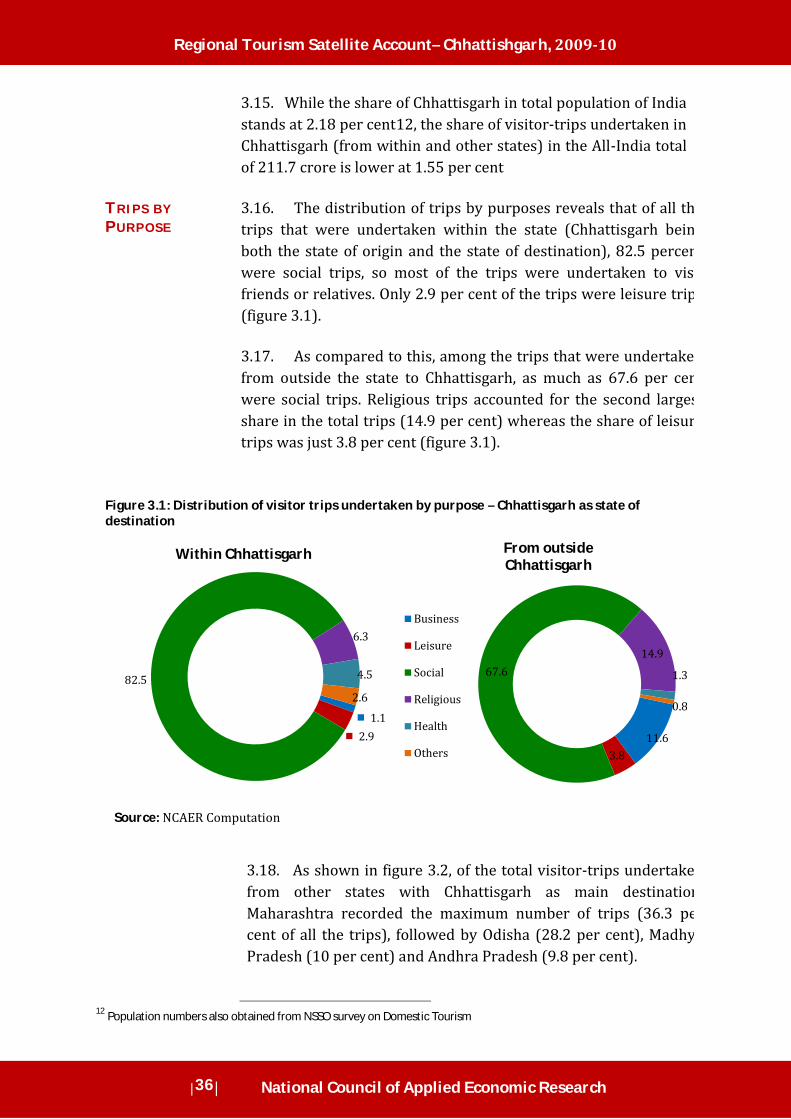
Region al Tourism Satellite Account– Chhattishgarh, 2009-10
|36| National Council of Applied Economic Research
3.15. While the share of Chhattisgarh in total population of India stands at 2.18 per cent12, the share of visitor-trips undertaken in Chhattisgarh (from within and other states) in the All-India total of 211.7 crore is lower at 1.55 per cent
TRI PS BYPURPOSE
3.16. The distribution of trips by purposes reveals that of all thtrips that were undertaken within the state (Chhattisgarh beinboth the state of origin and the state of destination), 82.5 percenwere social trips, so most of the trips were undertaken to visfriends or relatives. Only 2.9 per cent of the trips were leisure trip(figure 3.1).
3.17. As compared to this, among the trips that were undertakefrom outside the state to Chhattisgarh, as much as 67.6 per cenwere social trips. Religious trips accounted for the second largesshare in the total trips (14.9 per cent) whereas the share of leisurtrips was just 3.8 per cent (figure 3.1).
Figure 3.1: Distribution of visitor trips undertaken by purpose – Chhattisgarh as state of destination
Source: NCAER Computation
3.18. As shown in figure 3.2, of the total visitor-trips undertakefrom other states with Chhattisgarh as main destinationMaharashtra recorded the maximum number of trips (36.3 pecent of all the trips), followed by Odisha (28.2 per cent), MadhyPradesh (10 per cent) and Andhra Pradesh (9.8 per cent).
12 Population numbers also obtained from NSSO survey on Domestic Tourism
1.1 2.9
82.5
6.3
4.5
2.6
Within Chhattisgarh
Business
Leisure
Social
Religious
Health
Others11.6
3.8
67.6 14.9
1.3
0.8
From outside Chhattisgarh

Region al Tourism Satellite Account– Chhattishgarh, 2009-10
|37| National Council of Applied Economic Research
Figure 3.2: Per cent distribution of trips to Chhattisgarh by states of origin
Source: NCAER Computation
3.19. Further analysis reveals that trips originating from the largest contributing states i.e. Maharashtra, Odisha, Madhya Pradesh and Andhra Pradesh, to Chhattisgarh were largely undertaken for social purpose. Almost 66 per cent of the trip originating from Maharashtra was social trips while the shares of social trips in total trips originating from Odisha (79.2 per cent), Madhya Pradesh (78 per cent) and Andhra Pradesh (100 per cent) were also quite high.
3.20. Interestingly, amongst all the states, Rajasthan contributed most of the business trips undertaken in Chhattisgarh (78.2 per cent). Contribution of Odisha has been highest in total leisure trips made to Chhattisgarh (68.1 per cent), while Maharashtra contributed most of the religious trips (80.4 per cent).
INTE RN ATI ON ALPASSENGE RSURVEY (IPS)
3.21. MoT commissioned the Indian Statistical Institute (ISI), Kolkata to conduct the International Passenger Survey (IPS) for the year 2009-10. The survey targeted the following three categories of International tourists, namely.
(i) Foreign nationals visiting India, (ii) Non-Resident Indians visiting India, and (iii) Indian Residents travelling abroad.
0.4
0.5
0.7
0.9
0.9
3.3
9.0
9.8
10.0
28.2
36.3
0.0 5.0 10.0 15.0 20.0 25.0 30.0 35.0 40.0
Kerala
West Bengal
Delhi
Jharkhand
Others
Uttar Pradesh
Rajasthan
Andhra Pradesh
Madhya Pradesh
Odisha
Maharashtra

Region al Tourism Satellite Account– Chhattishgarh, 2009-10
|38| National Council of Applied Economic Research
3.22. The sampling methodology used was stratified sampling with the 15 port points, selected initially, being divided into two set of ports. Two of the ports – Goa and Raxaul – were also selected as points of survey but no survey was conducted at Goa airport (permission was not granted) and at Raxual (passenger size was very scanty as seen in the pilot/initial survey).
3.23. The Foreign Resident survey covered 13 ports, namely four international airports – Chennai, Delhi, Kolkata and Mumbai; 4 other airports - Ahmedabad, Bangalore, Cochin, Hyderabad and 5 land check-posts – Attari, Haridaspur, Ghojdanga, Munabao and Sonauli. Outbound Indian Residents survey was conducted for 11 ports out of which four are international airports – Chennai, Delhi, Kolkata and Mumbai, 4 other airports - Ahmedabad, Bangalore, Cochin, Hyderabad and three land check-posts – Haridaspur, Ghojdanga and Munabao.
66.03 LAK HFOR EI GN TOURI ST S VISIT ED IN DI A I N2010-11
3.24. Stratified random sampling was adopted for the selection of passengers for the survey. In case of IPS a total of 40,672 passengers were surveyed at 13 exit points across the country. The total number of foreign tourists departing from the exit points covered by this survey during the period 2009-10 is estimated at 66,03,897.
3.25. The principal objectives of the survey were:
To estimate the total number of tourist arrivals in India. The tourists were to be identified as foreign tourist (PIOs and others) and Non-Resident Indians.
To assess the detailed expenditure pattern of the foreign tourists visiting the country.
To assess the number of outbound tourists to various countries.
To evaluate the performance of existing tourist facilities in India.
To estimate the average duration of stay of foreign tourists in India including country-wise details.
To obtain demographic, economic and social profiles of foreign tourist visiting India and the motivational factors responsible for attracting them to India.

Region al Tourism Satellite Account– Chhattishgarh, 2009-10
|39| National Council of Applied Economic Research
USE OF IPSDATA I NPRE PARATIONOF STATE TSA
3.26. The data from IPS were used to obtain the expenditure incurred by the foreign tourists in India, by items of expenditure and by types of tourists, namely NRIs, PIOs and other foreign tourists. These data were used in the preparation of TSA at national level. Since the data failed to capture the expenditure incurred in different states of visit, these data could not be used in the preparation of state TSA. However, assuming that the foreign tourists’ expenditure pattern is the same across states, we have only used the national level structure and imposed the per-tourist expenditure on the total number of foreign tourists that visited the state during the period of reference. This number was obtained from the MoT publication, India Tourism Statistics.
3.27. On the other hand, the data on pre-trip expenditure incurred by outbound tourists (Indian tourists travelling abroad) could be obtained by states. The survey provides information on the respondent’s state of residence; hence we can obtain the data on number of tourists travelling abroad from each state and on their pre-trip expenditure which is assumed to have been largely incurred in the state of reference. These expenditures are obtained by the items of expenditure and by purpose of travel.
IPS – KEYFINDINGS FOR CH H ATTIS G ARH
3.28. According to the India Tourism Statistics, the foreign tourist visits in Chhattisgarh grew from just about 792 in 2001 to about 10 times in 2014. The state hosted a total of 7777 foreign tourists during 2014, posting an annual growth of 100 per cent as against the all-India growth of 13.1 per cent over the year 2013.
3.29. With regard to outbound tourists, the latest data (based on IPS survey) reveal that the number of people living in Chhattisgarh who travelled abroad during 2010-11 was 55,659. With this, the state accounted for 0.51 per cent of the total 1.08 crore outbound tourists in India.
3.30. According to figure 3.3, the percentage distribution of outbound tourists (after normalising for “No Response”) reveals that at all-India level, majority of the tourists travelled abroad for business purposes, that is, 32.3 per cent. This is closely followed by outbound tourists travelling for leisure (29.1 per cent). Tourists travelling for social purpose accounted for 21.7

Region al Tourism Satellite Account– Chhattishgarh, 2009-10
|40| National Council of Applied Economic Research
per cent and the remaining 16.8 per cent travelled for religious (1.4), education (7.9), medical (1.3) and other (6.2) purposes.
Figure 3.3: Distribution of number of Outbound Tourists by purpose Chhattisgarh and India
Source: NCAER Computation
3.31. As compared to this, of the total outbound tourists of Chhattisgarh, about 56.1 per cent travelled abroad for educational purpose. As much as 17.8 per cent travelled for leisure purpose, 13.8 per cent travelled for business purpose and only 1.9 per cent travelled with social purpose. No tourist travelled for religious and medical purpose.
3.32. The percentage distribution of outbound tourists (across the missions for which the trip was undertaken) whose state of residence is Chhattisgarh and who travelled for business purposes shows that major (62.6 per cent) business trips were made for participation in meetings and seminars while 29.7 per cent trips were undertaken with a mission of installing equipments, inspections, purchase or sales. Rest 7.7 travelled with a purpose of professional sports. (Figure 3.4).
3.33. While looking at the percentage distribution of leisure trips undertaken by residents of Chhattisgarh across the reasons of such trips, it is observed that more than half (50.9 per cent) of the leisure trips were undertaken because of cheaper air fare. Almost one third of leisure trips were undertaken as the tourists have relatives or friends living outside India who can host them while 8.6 per cent of such trips were conduced because of the fact that the outbound tourists find themselves attracted more
13.8
17.8
1.9
0.0
56.1
0.0
10.4
Chhattisgarh
Business
Holiday
Social
Religious
Education/ training
Medical
Others
32.3
29.1
21.7
1.4
7.9
1.3
6.2
India

Region al Tourism Satellite Account– Chhattishgarh, 2009-10
|41| National Council of Applied Economic Research
towards foreign destinations than towards similar Indian destinations (refer to figure 3.5).
Figure 3.4: Percentage Distribution of mission for which Business Trip is Undertaken – Chhattisgarh
Source: NCAER Computation
Figure 3.5: Percentage distribution of reasons for preferring foreign destination when Leisure Trip is undertaken – Chhattisgarh
Source: NCAER Computation
g
29.7
62.6
7.7 Installing equipment.inspection. purchase & sales
Meetings, seminars etc.
Trade fare/ exhibitions
Professional sports
Government/ UN missions
Others
p g
50.9
8.6
33.8
6.7
Cheaper package
Cheaper air fare
Increase in statustrip
Non-availability of the desired destination inIndia
Higher attraction towards the foreigndestination over similar Indian destination
Bettertourist infrastructure facilities at foreigndestination
Relatives, friends residing/hosting there
Others

Region al Tourism Satellite Account– Chhattishgarh, 2009-10
|42| National Council of Applied Economic Research
EMPL OYMEN TAND UNEMPL OYMEN TSURVEY
3.34. Employment and employment survey is part of the quinquennial programme of NSSO surveys. The data source on employment table for the State TSAs is the 66th round survey on employment and unemployment for the year 2009-10. By a decision of the National Statistical Commission, the quinquennial survey of employment-unemployment (and consumer expenditure) was repeated in the 68th round (2011-12) although it was only two years since the 66th round surveyhad taken place. However, the data source on employment table for the State TSAs is the 66th round survey on employment and unemployment for the year 2009-10.
3.35. The quinquennial EUSs of NSSO aim to measure the extent of ‘employment’ and ‘unemployment’ in quantitative terms disaggregated by household and population characteristics. The persons surveyed are classified into various economic activity categories on the basis of the activities pursued by them during certain specified reference periods.
3.36. Three reference periods are used in these surveys. These are (i) one year, (ii) one week and (iii) each day of the week. Based on these three periods, three different measures of employment are arrived at, of which the one with 365 days reference period, called workforce according to ‘usual status’ approach, is widely used.
USE OF EUSDATA I NPRE PARATIONOF STATE TSA
3.37. For the TSA tables, the employment data is based on usual activity status in both principal and subsidiary activities. The usual activity status (it is the activity situation in which a person is found during a reference period that relates to the person's participation in economic and non-economic activities) relates to the activity status of a person during the reference period of 365 days preceding the date of survey. The activity status on which a person spent relatively longer time (major time criterion) during the 365 days preceding the date of survey is considered the principal usual activity status of the person.
3.38. The sampling design adopted was essentially a stratified multi-stage one for both rural and urban areas. The number of households surveyed was 1,00,957 (59,129 in rural areas and 41,828 in urban areas) and number of persons surveyed was 4,59,784 (2,81,327 in rural areas and 1,78,457 in urban areas).

Region al Tourism Satellite Account– Chhattishgarh, 2009-10
|43| National Council of Applied Economic Research
3.39. The main objective of the employment-unemployment surveys conducted by NSSO at periodic interval is to get estimates of level parameters of various employment and unemployment characteristics at national and state level.
3.40. A schedule of enquiry was used in the 68th round, like other rounds of EU survey, to collect information on various facets of employment and unemployment in India in order to generate estimates on various employment and unemployment and labour force characteristics at the national and State levels. The information on the following aspects was collected through well designed schedule:
Household size, religion, social group, land possessed, land cultivated etc.;
Information on MNREGA for population living in rural areas;
Information on household monthly consumer expenditure for a set of consumer items;
Demographic particulars, like age, sex, educational level, status of current attendance and vocational training;
Usual principal activity status and subsidiary economic activity status of the all members of canvassed households;
Particulars of the enterprise for all the usual status workers (excluding those engaged in growing of crops and growing of crops combined with farming of animals) viz., location of work place, type of enterprises, number of workers in the enterprise etc. and some particulars on the conditions of employment for the employees, like type of job contract, eligibility for paid leave, availability of social security benefits, etc.
Extent of underutilization of the labour time and on the qualitative aspects of employment, like changes in activity status, occupation /industry, existence of trade unions/associations, nature of employment (permanent/temporary) etc.
Participation in specified activities by the household members who are classified as engaged in domestic duties in the usual principal activity status.
3.41. Table 3.1 given below presents the number of workers

Region al Tourism Satellite Account– Chhattishgarh, 2009-10
|44| National Council of Applied Economic Research
estimated using 66th round EU survey micro-data for Chhattisgarh.
TABLE 3.1: ESTIMATED NUMBER OF WORKERS BY STATUS – CHHATTISGARH (NUMBERS IN ‘000)
Worker Rural Urban All Male Female Total Male Female Total Male Female Total
Prin
cipa
l Own account worker 17.24 12.45 29.69 3.50 0.75 4.25 20.74 13.21 33.95 Employer 0.09 0.18 0.26 0.05 0.00 0.05 0.14 0.18 0.32 Regular Employee 3.29 0.35 3.64 3.88 0.91 4.79 7.17 1.26 8.43 Casual wage labor 25.23 18.74 43.97 2.16 0.94 3.10 27.39 19.68 47.07
Subs
idia
ry
Own account worker 6.64 6.14 12.78 0.11 0.05 0.16 6.76 6.19 12.94 Employer 0.02 0.00 0.02 0.04 0.00 0.04 0.06 0.00 0.06 Regular Employee 0.01 0.00 0.02 0.07 0.00 0.07 0.08 0.00 0.08 Casual wage labor 9.66 7.33 16.99 0.21 0.11 0.32 9.87 7.44 17.31
Prin
cipa
l +
Own account worker 23.89 18.59 42.48 3.61 0.80 4.41 27.49 19.40 46.89 Employer 0.11 0.18 0.28 0.09 0.00 0.10 0.20 0.18 0.38 Regular Employee 3.30 0.35 3.65 3.94 0.91 4.86 7.27 1.27 8.51 Casual wage labor 34.88 26.07 60.96 2.37 1.05 3.42 37.25 27.12 64.37
Source: NCAER Computation
HO USEH OLDCONS UME REXPE NDI TURESURVEY
3.42. NSSO has been conducting the ‘Household Consumer Expenditure surveys’ (CES) on quinquennial basis. The first round of the CES (October 1972 - September 1973) in the quinquennial series was the 27th round. The ninth survey in the series, had been embarked for the 68th round conducted during July 2011 – June 2012. By a decision of the National Statistical Commission, the quinquennial survey of consumer expenditure (and employment-unemployment) was repeated in the 68th round (2011-12) although it was only two years since the 66th round survey had taken place. The whole geographical area of the country is covered in EU surveys except for a few villages of Nagaland and Andaman and Nicobar Islands accessibility to which is difficult.
3.43. A stratified multi-stage design was adopted for the CES. The number of households surveyed in 66th round was 1,00,794 (59,097 in rural areas and 41,697 in urban areas). The prime aim of the CES was to generate estimates on monthly per capita consumer expenditure (MPCE) and its distribution across the different sections of the population like rural and urban and different socio- economic groups etc. both at country level as well as the State level.
3.44. These indicators are amongst the most important measures of the level of living of the respective domains of the population. The distribution of MPCE highlights the differences in level of living

Region al Tourism Satellite Account– Chhattishgarh, 2009-10
|45| National Council of Applied Economic Research
of the different segments of the population and is an effective tool to study the prevalence of poverty and inequality. These numbers enable the apex planning and decision-making process to allocate the nation’s resources among sectors, regions, and socio-economic groups, and assess the “inclusiveness” of economic growth.
3.45. Besides measuring the household consumption level and its pattern, the CES has another important use. To work out consumer price indices (CPIs) which measure the general rise in consumer prices, one needs to know not only the price rise for each commodity group but also the budget shares of different commodity groups (used as weights).
3.46. In the 66th round of CES, two types of schedules of enquiry, type 1 and type 2, were canvassed The only difference in the two types of the schedules was the reference period used for collection of consumption data. Data from type 1 schedule has been used in the estimations used in State TSAs.
3.47. Schedule Type 1 was canvassed following the traditional way of the previous quinquennial CES rounds. For less frequently consumed items, the information was collected for last 30 days and last 365 days consumption while for more frequently used items like food and fuel etc. the information was collected for the last 30 days consumption only.
3.48. On the other hand, the reference periods for schedule type 2 were last 365 days (only) for the infrequently purchased items, last 7 days for very frequently consumed items like some of the food items, pan, tobacco and intoxicants etc. and last 30 days for other food items, fuel etc.
3.49. A very detailed item classification was adopted to collect information on consumption of more than 300 items consumed by the households. The items on which the information was collected include 142 items of food, 15 items of energy (fuel, light and household appliances), 28 items of clothing, bedding and footwear, 19 items of educational and medical expenses, 51 items of durable goods, and 89 other items. Other demographic information on household members like age, sex, educational attainment etc. were also collected through the CES schedules.

Region al Tourism Satellite Account– Chhattishgarh, 2009-10
|46| National Council of Applied Economic Research
USE OF CESDATA I NPRE PARATIONOF STATE TSA
3.50. The main use of CES results in the preparation of TSAs is to estimate the product level ratios of tourist expenditures as percentage of overall household expenditures and these ratios are applied on the PFCE estimates coming from the national accounts statistics. This adjustment is important to ensure the overall consistency of survey results with the national accounts statistics. The data source on household expenditure table for the State TSAs is the 66th round of CES for the year 2009-10.
3.51. According to CES, MPCE (at MRP) on both food and non-food in both rural and urban Chhattisgarh is lower than that for All India MPCEs. Overall MPCE in rural Chhattisgarh (Rs. 686) is about 28 per cent lower than that for India (Rs. 953) and the same for urban Chhattisgarh (Rs. 1370) is about 26 per cent lower than that for urban India (Rs. 1856), as given in figure 3.6.
Figure 3.6: MPCE at MRP on food, non-food and total – Chhattisgarh and India
Source: NCAER Computation
353
333
686
563 80
8
1370
497
456
953
727
1129
1856
Food Non-food Total Food Non-food Total
Rural Urban
Chhattisgarh India

Region al Tourism Satellite Account– Chhattishgarh, 2009-10
|47| National Council of Applied Economic Research
3.52. Major constituents of expenditure are Cereals (rural: 121, urban: 163.9), Fuel & Light (rural: 67.9, urban: 110.1) and vegetables (rural: 60.3, urban: 93.5) in Chhattisgarh (table 3.2).
TABLE 3.2: BREAK-UP OF MONTHLY PER CAPITA CONSUMER EXPENDITURE OVER BROAD CATEGORIES OF GOODS – CHHATTISGARH AND INDIA
(RUPEES VALUE OF PER CAPITA CONSUMPTION IN 30 DAYS)
Sl. No. Item Category Chhattisgarh All India
Rural Urban Rural Urban 1 Cereal 121.0 163.9 145.1 161.9 2 Cereal Substitutes 0.0 0.0 0.7 0.8 3 Pulses and Pulse Products 32.9 61.8 35.7 49.8 4 Milk and Milk Products 13.2 56.8 80.2 138.7 5 Sugar 17.1 27.0 22.6 27.6 6 Salt 2.2 2.7 2.1 2.4 7 Edible Oil 30.8 45.9 34.1 46.1 8 Egg, Fish & Meat 16.8 23.3 32.3 48.0 9 Vegetables 60.3 93.5 57.2 76.7
10 Fruits (Fresh) 5.1 17.9 11.8 29.5 11 Fruits (Dry) 0.5 2.6 3.1 7.8 12 Spices 17.5 18.6 20.3 25.2 13 Beverages, Refreshments, etc. 36.0 48.6 52.0 113.0 14 Food: Total (1-13) 353.2 562.6 497.1 727.5 15 Pan, Tobacco & Intoxicants 18.4 24.3 20.6 21.9 16 Fuel and Light 67.9 110.1 87.8 142.8 17 Clothing and Bedding 54.5 95.4 57.6 98.6 18 Footwear 8.7 16.7 10.0 19.8 19 Education 13.2 97.2 40.3 162.2 20 Medical (Institutional) 5.4 25.4 17.8 34.0 21 Medical (Non-institutional) 25.1 36.8 39.3 64.7 22 Entertainment 5.8 20.4 8.2 31.5 23 Minor Durable-type Goods 3.0 3.1 2.5 4.3 24 Toilet Articles 27.9 51.0 23.2 44.0 25 Other Household Consumables 20.6 30.6 20.3 35.8 26 Consumer Services Excluding Conveyance 26.5 87.4 44.5 127.3 27 Conveyance 17.5 68.0 37.6 115.2 28 Rent 2.8 44.5 4.8 117.8 29 Taxes and Cesses 1.0 9.7 2.3 16.0 30 Durable Goods 34.5 87.1 39.3 92.6 31 Non-food: Total (15-30) 332.7 807.7 456.0 1128.5 32 Total Expenditure (14+31) 685.9 1370.3 953.0 1856.0
Source: Key Indicators of Household Consumer Expenditure in India (NSS KI 68/1.0), NSSO

Region al Tourism Satellite Account– Chhattishgarh, 2009–10
|48| National Council of Applied Economic Research
STATE GDPAC CO UN TS
3.53. At national level, the estimates of Gross Domestic Product are prepared and published annually by the Central Statistical Office (CSO). Similarly, at state-level, the State Domestic Product estimates are prepared annually by the State Directorate of Economics and Statistics (DES). The state DES is the nodal agency for the coordination of statistical activities in the state.
3.54. DES annually estimates the State Domestic Product (SDP) using the concepts and methodology approved by the System of National Accounts (SNA) of the international agencies and finalize after the reconciliation with CSO.
3.55. Like GDP, SDP is the monetary value of all the goods and services produced within the geographical boundaries of the state, without duplication, within a given period of time, generally a year. The goods cover all possible items like agricultural crops, livestock products, fisheries, forest products, manufacture of materials in the registered and unregistered sectors, construction of buildings, roads etc. Services cover medical and educational services, domestic services, hotels, restaurants, trade, transport and public services etc.
3.56. Conceptually, the estimates of State Income can be prepared by adopting two approaches, namely, income originating and income accruing. In the income originating approach, the measurement corresponds to income originating to the factors of production physically located within the geographical boundaries of the state and represents gross/net value of goods and services produced within the state. On the other hand, the income accruing approach relates to the income accruing to the normal residents of a state. Since this measures the income that become available to the residents of a state, it provides a better measure of welfare of the residents of the state.
3.57. However, for compiling the State Domestic Product (SDP) estimates by income accruing approach one needs data on flows of factor incomes to/from the boundaries of state i.e. on inter-state flows as well as flows to/from abroad. Due to lack of availability of these data, presently, the estimates of SDP are compiled by the respective DES in the states following the income originating approach. Thus the current concept of compiling the Gross/Net SDP is similar to that of compiling the GDP/NDP of the entire economy i.e., measuring the volume in monetary terms, the total value of

Region al Tourism Satellite Account– Chhattishgarh, 2009–10
|49| National Council of Applied Economic Research
goods and services produced within the geographical boundary of the state.
3.58. The general methodology for compiling the estimates of state income is to first compile the estimates at disaggregated level for each economic activity and then aggregating them for the whole region/state. The estimates for commodity producing sectors like agriculture, forestry, fishing, mining & quarrying, manufacturing, etc. are prepared using the production approach i.e. measuring the value of output and deducting there from the cost of material inputs used in the process of production.
3.59. In the services sectors (non-public segment) like trade, transport, hotels & restaurants etc., the estimates are prepared by income approach, specifically, by multiplying the value added per worker by the number of workers, for the benchmark estimates and extrapolating these benchmark estimates with suitable indicators for the annual estimates. The information on value added per worker is obtained from the relevant Enterprise Surveys conducted for the purpose.
3.60. The estimates of workforce are obtained using the results of large-scale sample surveys on employment & unemployment conducted by National Sample Survey Organisation (NSSO) and decennial population census carried out in the country by the Office of Registrar General of India (RGI) and Census Commissioner.
3.61. In the preparation of State TSA, the SDP accounts are used to arrive at the supply side information of the tourism industries, which here are 20 in number. While the SDP data are not available for all of these industries, the national level ratios are used to disaggregate the available data.

Region al Tourism Satellite Account– Chhattishgarh, 2009-10
|50| National Council of Applied Economic Research
TABLE 3.3: STATE GDP ACCOUNTS FOR CHHATTISGARH, 2009-10 (RS. LAKH)
Sl. No. At current prices (2009-10) GVO – FC IC – PP GVA – FC
Total agriculture and livestock 2021487.6 549971.7 1471515.9 1 Forestry and logging 429079.6 66936.4 362143.2 2 Fishing 125335.0 11280.2 114054.8 3 Mining 1171153.6 0.0 947033.6 4 Meat, fish, fruits, vegetables and oils 121074.9 0.0 7084.2 5 Dairy products 6929.9 0.0 961.0 6 Grain mill products 570086.7 0.0 44735.6 7 Other food products 17940.2 0.0 2282.4 8 Beverages 50469.8 0.0 5948.3 9 Tobacco products 23531.0 0.0 8619.6
10 Spinning, weaving and finishing of textiles 119217.1 0.0 3546.9 11 Wearing apparel 17660.6 0.0 2747.2 12 Leather & fur products 14777.5 0.0 3879.1 13 Wood and wood products 87489.5 0.0 12793.2 14 Furniture 24293.6 0.0 3883.7 15 Paper and printing etc 64442.8 0.0 10995.1 16 Rubber, petroleum products etc. 142811.8 0.0 10259.6 17 Chemical and chemical products 72388.3 0.0 8894.8 18 Non-metallic products 486728.4 0.0 226313.3 19 Basic metals 5462014.6 0.0 1292477.5 20 Recycling 0.0 0.0 2344.2 21 Metal products and machinery 370952.8 0.0 52877.1 22 Electrical machinery 18744.6 0.0 3354.9 23 Other manufacturing 174097.2 0.0 16194.3 24 Transport equipment 63474.8 0.0 7243.9
Total Manufacturing 0.0 0.0 1727435.7 25 Construction 0.0 0.0 0.0 26 Electricity, gas and water supply 0.0 0.0 0.0 27 Railway transport services 0.0 0.0 0.0 28 Land transport including via pipeline 0.0 0.0 43567.7 29 Water transport 0.0 0.0 0.0 30 Air transport 0.0 0.0 1998.0 31 Supporting and aux. tpt activities 0.0 0.0 2071.9 32 Storage and communication 0.0 0.0 0.0 33 Trade 0.0 0.0 469964.4 34 Hotels and restaurants 0.0 0.0 70643.6 35 Banking and insurance 0.0 0.0 0.0 36 Real estate and business services 0.0 0.0 0.0 37 Education and research 0.0 0.0 73005.6 38 Medical and health 0.0 0.0 46503.9 39 Other services 0.0 0.0 40714.2 40 Public administration 0.0 0.0 0.0
Total all industries 0.0 0.0 0.0
Source: CSO Note: Gross Value Added - Others relate to Irrigation component in the case of "Total Agriculture and Livestock", Unregistered value added in the case of manufacturing industries and Communication in the case of "Storage and

Region al Tourism Satellite Account– Chhattishgarh, 2009-10
|51| National Council of Applied Economic Research
4. METHODOLOGY ADOPTED FOR STATE TSA TABLES
TO URIS MSATELLITEAC CO UN T
4.1. The 10 tables that make up the Tourism Satellite Account are the key to estimate the economic contribution of tourism in the economy. At national level, these tables to be prepared in a standard format as recommended by WTO in the TSA:RMF 2008, enable international comparisons, among countries. However, each country has the flexibility to decide on the most adequate format for taking into account its tourism reality and scope of available data.
4.2. At regional level, no standard recommendations are made by WTO in either TSA: RMF 2008 or in IRTS-2008. However, IRTS-2008 does mention the importance of developing the TSAs at regional level as special features of tourism prevail across the regions of a country.
4.3. Essentially, preparation of a state TSA requires the following:
Statistics on expenditure made by visitors on different products and services within the state.
Statistics on supplies from the domestic production and imports (which include supplies/imports from other states) to meet these purchases of tourists.
Confrontation of the two sets of statistics in the national accounting framework through the supply and use tables so that supplies from domestic production and imports match with the expenditures made by tourists and tourism ratios are developed.
Estimate the value added out of the domestic production that is involved in supplying the products to tourists’ purchases.
EXPE NDI TURE O RDEM AND SIDEDATA
4.4. Expenditure by visitors on different products and services can be obtained only from Domestic Tourism Survey (DTS) as International Passenger Survey (IPS) did not capture any data at state level. However, unlike national TSA, in which Domestic Tourism Expenditure relates to only one type of tourism activity (that is, within country of reference), state TSAs require data (apart from those related to foreign countries) from DTS on

Region al Tourism Satellite Account– Chhattishgarh, 2009-10
|52| National Council of Applied Economic Research
three types of tourism activities:
i. Within state movement – this information feeds intoDomestic Tourism Expenditure.
ii. Movement from the state of reference to any other state –this is required for Outbound Tourism Expenditure
iii. Movement from other states to the state of reference – thisis required for Inbound Tourism Expenditure.
PROD UCTI ON O RSUPPL Y SIDEDATA
4.5. Data on supplies from domestic production are obtained from State Departments of Economic and Statistics. Using these data and national level ratios, the following tables are prepared for the supply account of each state TSA:
Supply table at basic prices Use table at purchaser’s prices Input-Output table for indirect effects
SUPP LY SI DEDA TA
4.6. As of now, in India, Supply and Use Tables are not at all compiled at state level. This is because no data on imports to the state from other states or from abroad are available. Hence the confrontation of the demand side data and the supply side data is not possible at state level. Therefore other approaches have to be followed to prepare the state TSA and to estimate the value added on account of the tourism activity.
4.7. Following are two possible approaches to compile regional/state TSAs:
The interregional approach or top-bottom approach, which is common to all the regions of the national territory and is based on and intimately linked to the System of National Accounts. It is an approach that relies on the existence of a National TSA and the availability in each region of uniform tourism information for each of the tables and aggregates to be regionalized;
The regional approach or bottom-top approach, which entails the development of a specific TSA for any given region, in which specific situations and differentials may also be identified for important sub-regional territories, provided there is sufficient information on them.
4.8. Of the two possible approaches for compiling State TSAs,

Region al Tourism Satellite Account– Chhattishgarh, 2009-10
|53| National Council of Applied Economic Research
namely, (i) regionalisation or top-down and (ii) regional or bottom-up, adoption of one or both approaches depends upon the availability of information that is required to compile the TSAs. It is, therefore, necessary to look at the availability of information for state TSAs in respect of both the approaches. This is presented in the following table:
TABLE 4.1: AVAILABILITY OF DATA FOR COMPILING STATE TSAS ACCORDING TO DIFFERENT APPROACHES
Approach Data requirement Data availability
Reg
iona
l (bo
ttom
-up)
Statistics on expenditures made by visitors on different products within the state
Data is available from the DTS, 2008-09 and IPS, 2010-11 (subject to some assumptions)
Statistics on supplies from the domestic production and imports (which include from other states) to meet these purchases of tourists
- Data on supplies from domestic production is available - Data on imports at state level is not available
Confrontation of the two sets of statistics in the national accounting framework through the supply and use tables so that supplies from domestic production and imports match with the expenditures made by tourists
- In the absence of data on imports, it is not possible to compile SUT at state level. - However, State SUT can be constructed for domestic supplies and total of capital formation and net exports as other final demand in the use table. - This SUT though not suitable for TSA, can be used for estimating indirect effects of tourism consumption, value added and employment.
Estimate value added out of the domestic production that is involved in supplying products for tourists’ purchases
- Not possible, as how much of domestic production is able to meet the tourists’ demand is not known in the absence of information on imports. - However, it is possible to compute GVATI and TDGVA using national tourism ratios of output of industries, as suggested in the TSA: RMF 2008.
Reg
iona
lisat
ion
(top
-dow
n)
National TSA and tourism ratios by products and industries Available
State level tourism consumption Available State level estimates of output and value added by tourism and other industries
Available
State level estimates of employment by tourism and other industries Available
Source: NCAER computation
COM PIL ATI ON OFSTATE TSAS
4.9. From the above table, it is evident that without the supply table that includes imports from other states and countries, it is not possible to compile regional TSAs in the same manner as in the case of national TSA and in particular the estimation of key aggregates of TDGVA and TDGDP. However, with the information that is available at State level in India, it is possible to compile TSA Tables 1 to 5 and 7 without much difficulty, though some assumptions would need to be made for this. Also, Tables 8 and 9 on Tourism Gross Fixed Capital Formation and Tourism Collective

Region al Tourism Satellite Account– Chhattishgarh, 2009-10
|54| National Council of Applied Economic Research
Consumption respectively cannot be included in the State TSAs due to the non-availability of these data at state level. Even at national level, the TSA: RMF 2008 placed these compilations under research agenda and did not recommend their compilations, although NCAER included experimental compilations of these two tables in the all India TSA, 2009-10. Each of these tables is described in the following sections of this chapter.
4.10. Before presenting the description of the TSA Tables, it is important to mention that TSA: RMF 2008 recommends certain set of activities and products to be included while compiling the TSA. While some of the activities have been specified distinctly, some are recommended to be country-specific. Accordingly, a comprehensive set of activities and products were identified in the compilation of national as well as state TSAs. Both the recommended and the adopted classifications separately for products and activities are shown in the table below.
TABLE 4.2: PRODUCTS RECOMMENDED IN TSA: RMF 2008 VS. PRODUCTS INCLUDED IN TSA, 2009-10
Products Recommended in the TSA: RMF 2008 Products Used for TSA of India 2009-10
Product Product 1 Accommodation services for visitors 20 Hotels 2 Food and beverage serving services 21 Restaurants 3 Railway passenger transport services 15 Railway passenger transport services
4 Road passenger transport services 16 Land passenger transport including via
pipeline 5 Water passenger transport services 17 Water passenger transport 6 Air passenger transport services 18 Air passenger transport 7 Transport equipment rental services 23 Renting of transport equipment
8 Travel agencies and other reservation services 19 Tourism related supporting and auxiliary
transport activities 9 Cultural services 24 Cultural and religious services 10 Sports and recreational services 25 Sporting and recreational services 11 Country-specific tourism characteristic goods 22 Medical and health
12 Country-specific tourism characteristic services
6 Processed food products 7 Beverages 8 Tobacco products 9 Readymade garments 10 Printing and publishing 11 Leather footwear 12 Travel related consumer goods 13 Soaps and cosmetics 14 Gems and jewellery
Source: NCAER computation

Region al Tourism Satellite Account– Chhattishgarh, 2009-10
|55| National Council of Applied Economic Research
INBO UNDTO URIS MEXPE NDI TURE
4.11. Inbound Tourism Expenditure forms Table 1 of the TSA. At regional or state level, inbound tourism expenditure comprises of expenditure incurred by visitors from other countries as well as by those from other states of the same country. These expenditures are incurred within the state of reference on tourism characteristic and tourism connected products and services. An inbound tourism trip refers to the travel of a visitor from the time of arriving in a country/state to the time of leaving that country/state.
IN BOUND TOURI SMEXP EN DITUR E B YINT ERN ATION ALTOU RIS TS
4.12. The data on Inbound tourism expenditure or the expenditure by international tourists in the state of reference are not available and therefore, were estimated using the pattern of expenditure observed at national level. For national level expenditures, data were derived from the International passenger Survey (IPS), 2010-11 conducted by the Indian Statistical Institute (ISI), Kolkata and are reported in “Second Tourism Satellite Account of India, 2009-10”.
4.13. The per-tourist pattern of expenditure by tourism characteristic products and tourism connected products observed at national level was applied on number of inbound tourists in state to arrive at the state-level estimates of expenditures. Hence the per-tourist expenditure by type of international tourists remains the same as observed for India.
TABLE 4.3: AVERAGE PER-TOURIST PER-DAY INBOUND TOURISM EXPENDITURE BY TYPE OF TOURISTS
Item NRIs Foreigner
PIO Foreigner
Others
Total International
Tourists
Inbound Tourism Expenditure (Rs. Crore) 14660 14748 70271 99679
Number of tourists 1148234 917277 4538387 6603897
Expenditure per tourist (Rs.) 127672 160784 154837 150939
Average number of days spent by a tourist in India 21 19 20 20
Expenditure per tourist per day (in Rs.) 6201 8518 7716 7550
Source: NCAER computations using IPS, 2010 data

Region al Tourism Satellite Account– Chhattishgarh, 2009-10
|56| National Council of Applied Economic Research
IN BOUND TOURI SMEXP EN DITU R E BYDO MESTI C TOU RIS TSBELO NGI NG TO STAT ES O THERTHAN CHHATTI SGARH
4.14. The state-level inbound tourism also includes tourism activities of visitors from other states of India to the state of reference. The data on their expenditures were obtained from the DTS, 2008-09. Data on item-wise expenditure incurred during all the overnight trips originating from any state (other than the state of reference, that is, Chhattisgarh and for which main destination was the state of reference (Chhattisgarh), were collected to arrive at this component of inbound tourism expenditure. These expenditures were estimated by the leading purpose of the trip. The procedure of estimation of these expenditure is given in Appendix.
4.15. It must be noted that while the statistics provided in Chapter 3 were with respect to visitor-trips, this chapter’s statistics, obtained from DTS, will pertain to trips as the expenditure data were collected for entire trip irrespective of the number of visitors/tourists travelling in that trip.
4.16. Since the reference period of the DTS differs with the reference period of TSA, price adjustments to the source data were carried out.
4.17. Also, it is observed that the primary household surveys tend to underestimate the value of consumption expenditure. This observation comes from the notable underestimation of value of consumption expenditure (both at aggregate level and for each item) that is derived from the NSSO’s large sample survey on “Consumption Expenditure” when compared with the Private Final Consumption Expenditure (PFCE) as reported in the CSO’s National Accounts of Statistics (NAS). The reason behind underestimation could be the inability to recall the expenses and in some cases reluctance to report the actual expenses.
4.18. Hence, adjustment to the source data has been made to benchmark the data with the private final consumption expenditure of national accounts.
4.19. The underestimation of DTS value of expenditure is corrected by applying the adjustment factor on value of expenditure of each item. The adjustment factor, for each item, is obtained by taking the ratio of PFCE expenditure and NSSO expenditure. These factors are assumed to be the same as those at national level (refer to “Second Tourism Satellite Account of India,

Region al Tourism Satellite Account– Chhattishgarh, 2009-10
|57| National Council of Applied Economic Research
2009-10). These adjustment factors for the tourism specific goods and services are given in the Table 4.4.
4.20. An adjustment factor of 1.64 in the case of “Hotels” would mean that the NAS value of expenditure incurred on “Hotels” services is 1.64 times what is reported in the NSSO survey. Hence, for each item, the value of expenditure obtained through the DTS is multiplied by the corresponding adjustment factor.
IN BOUND TOURI SMEXP EN DITUR E
4.21. The inbound tourism expenditure incurred by international tourists, that incurred by tourists of other states of India and the TSA Table 1, obtained from these two tables is presented in Chapter 5 on Tables and Accounts.
TABLE 4.4: CONSUMPTION EXPENDITURE ADJUSTMENT FACTORS
Industries Adjustment factors A 1. Tourism characteristic products 1 Accommodation services/Hotels 1.64 2 Food and beverage serving services/Restaurants 1.64 3 Railway passenger transport services 6.9 4 Road passenger transport services 8.86 5 Water passenger transport services 13.07 6 Air passenger transport services 6.81 7 Transport equipment rental services 8.63 8 Travel agencies and other reservation services/ Supporting
d l8.63
9 Cultural and religious services 0.5 10 Sports and other recreational services 0.5 11 Health and medical related services 1.81 A.2 Tourism connected products 12 Readymade garments 2.56 13 Processed food 1.49 14 Tobacco products 5.28 15 Beverages 3.04 16 Travel related consumer goods 1.74 17 Footwear 3.05 18 Soaps, cosmetics and glycerine 0.7 19 Gems and jewellery 1.45 20 Books, journals, magazines, stationery etc. 1.41
Source: NCAER computation

Region al Tourism Satellite Account– Chhattishgarh, 2009-10
|58| National Council of Applied Economic Research
KEY FINDIN GS– INBO UNDTO URIS MEXPE NDI TURE
4.22. As mentioned earlier, for regional TSA, inbound tourism refers to the tourist activities of all the visitors visiting the state of reference from across both the international border as well as the state border.
4.23. According to the India Tourism Statistics, Chhattisgarh received a total of 1,586 inbound tourists from other countries during 2009-10. Besides, the state played host to 8,58,919 inbound trips from the other states of India. In terms of visitor-trips, this number stood at 13,61,864.
4.24. The per-cent distribution of trips by purposes is almost the same as that of visitor-trips (as given in Chapter 3). Of the total trips undertaken in the state from the other states, 57.7 per cent were social trips, followed by 19.8 per cent trips undertaken with business purposes.
4.25. The following table presents a state-wise comparison of the per-cent distribution of trips undertaken in the state from the other states by purposes of travel (refer to Table 4.5).
4.26. The average per-trip expenditure of inbound tourists from other states was Rs. 35,513. However, among the various purposes of travel, business trip turns out to be the most expensive, with per-trip expenditure of Rs. 1,51,295 (Figure 4.1).
4.27. The state-wise average per-trip expenditure of inbound tourists from other states is given in the Table 4.6. The average per-tourist per-day expenditure is also reported in Table 4.7.
4.28. The per cent distribution of total expenditure by items of expenditure reveals that the tourism connected products account for 78.1 per cent of the total expenditure (Figure 4.2).
4.29. The share of expenditure incurred on passenger transport services is the maximum across most of the purposes of travel, highest being in trips undertaken for “other purposes”, at 95.3 per cent.
4.30. For business trips, the share of expenses on tourism connected products was the highest at 87.9 per cent, followed by expenses incurred on passenger transport services at 8 per cent (Figure 4.2).

Region al Tourism Satellite Account– Chhattishgarh, 2009-10
|59| National Council of Applied Economic Research
TABLE 4.5: STATE-WISE PER-CENT DISTRIBUTION OF INBOUND TRIPS (FROM OTHER STATES), BY PURPOSES OF TRAVEL
S. No. States
Bus
ines
s
Leis
ure
Soci
al
Rel
igio
us
Educ
atio
n
& tr
aini
ng
Hea
lth
&
Med
ical
Shop
ping
Oth
er
Tota
l
1 A & N Islands 4.3 5.4 67.4 2.7 3.8 9.5 1.8 5.1 100 2 Andhra Pradesh 3.8 6.6 35.3 47.9 1.1 3.6 0 1.7 100 3 Arunachal Pradesh 6.7 4 60.9 28.4 0 0 0 0 100 4 Assam 9.5 4.3 46.4 5 3.5 13.1 2.5 15 100 5 Bihar 2 5.2 74.3 8.5 1.4 6.5 0.1 2.1 100 6 Chandigarh 2.1 5.7 55.9 2.4 5.5 21.3 0.1 7.1 100 7 Chhattisgarh 19.8 4.5 57.7 15.7 0.8 1.3 0 0.2 100 8 Dadra & Nagar Haveli 0 0 100 0 0 0 0 0 100 9 Daman & Diu 0 45.1 21.2 33.7 0 0 0 0 100
10 Delhi 7.9 5.1 59.7 2.9 5.7 5.2 1.6 11.9 100 11 Goa 15.6 37.6 14.4 12.9 15.9 0 0 3.6 100 12 Gujarat 11.1 1.9 61.7 12.6 1.1 6.4 0.9 4.4 100 13 Haryana 5.2 2.1 76.7 5.8 0.3 6.7 0 3.1 100 14 Himachal Pradesh 2 9.9 35.7 49.1 2.5 0.6 0 0.2 100 15 Jammu & Kashmir 1 10.1 21.3 60.6 4 0.3 0 2.6 100 16 Jharkhand 3 1.7 45.9 39.6 1.3 5 0 3.5 100 17 Karnataka 8.9 4.8 49.8 20.4 3.8 2.6 0 9.7 100 18 Kerala 1.4 4.9 62.9 27.4 0.1 2.6 0 0.7 100 19 Lakshadweep 0 21.3 72 0 0 6.7 0 0 100 20 Madhya Pradesh 2 0.6 73.9 17.4 2.1 1.8 0 2.2 100 21 Maharashtra 11.8 7.7 42.9 25.3 1.4 7.9 0.3 2.8 100 22 Manipur 41.2 0 52.7 1.6 0 4.6 0 0 100 23 Meghalaya 11.7 23.2 47.1 3.7 2 0.2 1 11 100 24 Mizoram 2.1 53.7 31.7 1.4 3.1 8.1 0 0 100 25 Nagaland 43.9 1.7 12 3 0.2 36.2 0 2.9 100 26 Orissa 15.8 15.9 39.8 12.8 0.2 8.9 0.4 6.2 100 27 Puducherry 0 3.7 70.9 14.4 1 7.9 0 2.1 100 28 Punjab 3.9 3.4 72.7 8.3 1.2 4.4 0 6.2 100 29 Rajasthan 2.9 2.9 50.2 34.8 1.6 4.9 0.2 2.3 100 30 Sikkim 8.8 52.9 12.7 12.1 5.6 0 0 7.9 100 31 Tamil Nadu 6.2 6.1 46.1 26.9 1.6 7 0.1 6 100 32 Tripura 2.3 9.4 72 0 0 0 0 16.3 100 33 Uttar Pradesh 2.6 2.6 69.6 18.4 1.1 4.2 0.3 1.1 100 34 Uttarakhand 2.5 8.2 26.5 57.5 0.9 1.3 0 3 100 35 West Bengal 9.9 9.2 53.7 8.3 1.2 12.5 0.4 4.8 100
All India 5.5 5.2 54.8 22.8 1.9 5.2 0.3 4.2 100
Source: NCAER computation

Region al Tourism Satellite Account– Chhattishgarh, 2009-10
|60| National Council of Applied Economic Research
Figure 4.1: Average per-trip expenditure (Rs.) incurred in inbound trips (from other states) by purpose of travel
Source: NCAER computation
1,51,295
35,513
13,362 12,804 11,208 10,477 7,009
4,241
Business All purposes Otherpurposes
Holiday,leisure andrecreation
Health andmedical
Educationand training
Social Religious

Region al Tourism Satellite Account– Chhattishgarh, 2009-10
|61| National Council of Applied Economic Research
TABLE 4.6: STATE WISE PER-TRIP EXPENDITURE (RS.) OF INBOUND TRIPS (FROM OTHER STATES) BY PURPOSE OF TRAVEL
(Package + non-package)
S. No. States
Bus
ines
s
Leis
ure
Soci
al
Rel
igio
us
Educ
atio
n &
trai
ning
Hea
lth
&
med
ical
Shop
ping
Oth
ers
Tota
l
1 Andhra Pradesh 25,155 7,312 10,981 12,277 17,049 23,374 0.0 16,585 12,4942 Arunachal Pradesh 77,445 57,008 7,885 11,095 0.0 0.0 0.0 0.0 15,4343 Assam 22,893 22,673 10,132 10,639 13,085 22,776 21,652 9,632 13,9054 Bihar 8,919 11,203 7,544 26,669 47,181 9,504 1,019 6,607 10,0595 Chandigarh 9,190 7,768 6,583 111518 5,267 12,369 22,133 7,385 10,4456 Chhattisgarh 151295 12,804 7,009 4,241 10,477 11,208 0.0 13,36
235,51
37 Dadra & Nagar Haveli 0.0 0.0 1,598 0.0 0.0 0.0 0.0 0.0 1,598 8 Daman & Diu 0.0 10,047 4,107 1,808 0.0 0.0 0.0 0.0 6,013 9 Delhi 16,246 14,524 9,792 7,937 14,874 24,084 5,601 5,991 11,00
910 Goa 27,895 31,113 22,280 39,076 6,191 0.0 0.0 35,766 26,56411 Gujarat 11,643 12,427 10,369 12,433 14,656 13,401 22,337 12,116 11,23112 Haryana 7,790 14,058 8,898 2,844 1,592 17,192 0.0 9,398 9,142
13 Himachal Pradesh 6,872 44,124 7,446 5,508 1,053 5,115 0.0 14,722 9,961 14 Jammu & Kashmir 8,289 42,953 7,936 21,861 10,363 20,171 0.0 5,135 19,99
015 Jharkhand 3,992 12,294 5,180 6,870 2,985 4,220 0.0 6,549 5,901 16 Karnataka 8,179 17,470 10,961 11,480 21,101 13,866 62,703 23,410 12,79
517 Kerala 9,524 39,241 6,547 11,346 10,481 23,886 0.0 69,728 10,41018 Lakshadweep 30112 4142 0.0 0.0 10366 0.0 0.0 0.0 10,07919 Madhya Pradesh 6,516 22,825 5,912 7,450 6,774 9,388 0.0 4,497 6,347
20 Maharashtra 25,643 20,747 13,439 17,835 16,220 8,839 25,282 19,208 16,41921 Manipur 11,082 0.0 13,732 3,422 0.0 17,256 0.0 0.0 12,63722 Meghalaya 10,707 22,904 5,887 20,497 7,600 40,132 45,709 14,105 12,36323 Mizoram 15,613 92,092 13,411 4,533 20,021 41,077 0.0 0.0 58,01524 Nagaland 4,016 7,212 7,475 11,179 10,748 2,767 0.0 14,593 4,571
25 Orissa 3,462 27,256 7,818 24,437 32,331 12,695 1,997 3,484 12,52126 Puducherry 0.0 59,676 2,881 3,297 678 13,095 0.0 4,455 5,871
27 Punjab 13,675 23,679 5,536 6,867 15,109 13,415 0.0 6,112 7,080 28 Rajasthan 45,920 86,102 8,552 8,775 17,755 8,299 29,930 6,297 12,12
629 Sikkim 11,487 39,995 24,946 396797 5,489 0.0 0.0 11,768 74,52130 Tamil Nadu 9,642 31,433 8,066 12,990 8,288 23,416 13,298 8,698 12,03031 Tripura 34,927 19,580 7,069 0.0 0.0 0.0 0.0 8,565 9,132
32 Uttar Pradesh 11,473 26,750 8,022 6,501 8,551 6,046 6,943 5,589 8,218 33 Uttarakhand 6,562 29,137 9,194 9,705 18,717 6,849 0.0 20,241 11,45
234 West Bengal 14,373 14,447 24,618 15,712 24,332 9,770 12,766 8,543 19,239All India 19,229 26,461 8,781 11,497 14,230 14,142 12,419 11,177 11,394
Source: NCAER computation

Region al Tourism Satellite Account– Chhattishgarh, 2009-10
|62| National Council of Applied Economic Research
TABLE 4.7: STATE WISE PER-TOURIST PER-DAY EXPENDITURE (RS.) OF INBOUND TRIPS (FROM OTHER STATES) BY PURPOSE OF TRAVEL
S. No. State
Bus
ines
s
Leis
ure
Soci
al
Rel
igio
us
Educ
atio
n &
Tra
inin
g
Hea
lth
&
med
ical
Shop
ping
Oth
er
Purp
oses
All
Purp
oses
1 A&NI 0 0 0 0 0 0 0 0 0 2 Andhra Pradesh 2133 779 568 1708 4265 2044 2002 1047 3 Arunachal Pradesh 16402 3032 489 2346 0 0 0 0 1261 4 Assam 5518 1231 833 2087 1380 2918 6750 1413 1448 5 Bihar 2430 622 427 2275 18909 274 401 1079 574 6 Chandigarh 18801 3538 1283 13001 4579 5985 27245 9115 2772 7 Chhattisgarh 24966 1316 385 1303 1816 2997 1523 2782 8 Dadra & Nagar Haveli 0 0 218 0 0 0 0 0 218 9 Daman & Diu 0 875 916 238 0 0 0 0 692
10 Delhi 6070 1892 1584 1546 3501 2210 1978 2087 1951 11 Goa 3798 3535 2704 4614 1562 0 0 10089 3545 12 Gujarat 159 729 657 336 1183 1125 3656 1140 463 13 Haryana 1180 1324 941 461 108 1370 0 1109 980 14 HP 1304 3147 1060 1394 396 637 0 993 1637 15 J&K 2815 725 272 1062 517 1354 0 744 777 16 Jharkhand 613 556 368 620 1234 420 0 353 468 17 Karnataka 1580 1171 920 1421 2721 1879 3870 2181 1244 18 Kerala 1748 4761 1322 2196 1907 2382 0 6250 1943 19 Lakshadweep 0 2920 1116 0 0 13291 0 0 2049 20 Madhya Pradesh 2715 5287 618 1590 1306 812 0 858 756 21 Maharashtra 3575 1742 962 1983 2551 2127 8237 2965 1544 22 Manipur 3899 0 1943 545 0 2564 0 0 2385 23 Meghalaya 2156 1199 562 810 2141 3896 7596 4250 1085 24 Mizoram 7738 5957 2092 2014 9792 20388 0 0 5458 25 Nagaland 5282 1626 2621 4431 3624 1337 0 5890 2761 26 Odisha 492 1049 438 1855 450 2622 1389 703 840 27 Puducherry 0 1939 203 489 144 1091 0 427 439 28 Punjab 2918 1190 524 1037 1204 774 0 320 634 29 Rajasthan 10167 5621 653 1296 1061 1669 7989 580 1178 30 Sikkim 1528 1307 1180 5563 948 0 0 1144 2544 31 Tamil Nadu 2304 4982 789 2077 1375 1405 3967 1103 1371 32 Tripura 7880 1423 297 0 0 0 0 2354 477 33 UP 1408 998 592 1053 1186 944 1709 763 689 34 Uttarakhand 3778 2381 685 1027 3121 1172 0 1678 1087 35 West Bengal 3912 1080 1405 1772 6885 875 8042 1103 1420
Source: NCAER computation using 65th round NSSO data

Region al Tourism Satellite Account– Chhattishgarh, 2009-10
|63| National Council of Applied Economic Research
Figure 4.2: Percentage distribution of Inbound Tourism Expenditure (incurred by visitors from other states) by products for different purposes of travel- Chhattisgarh
Source: NCAER computation

Region al Tourism Satellite Account– Chhattishgarh, 2009-10
|64| National Council of Applied Economic Research
DO MESTI CTO URIS MEXPE NDI TURE
4.31. TSA Table 2 focuses on domestic tourism by products and by purpose of travel. This table presents the Domestic Tourism Consumption which refers to the tourism consumption of a resident visitor within the economy of reference. At state level, this table refers to tourists from within the state.
4.32. The domestic tourism expenditure was derived from the Domestic Tourism Survey (DTS), conducted by the National Sample Survey Organisation (NSSO) during 2008-09. The detailed information was collected on the expenditure incurred by tourists on a detailed set of items which were mapped with the tourism characteristic and tourism connected (together called tourism specific) products and services.
4.33. The procedure of estimation is given in Appendix.
4.34. As done for other states’ inbound tourism expenditure, domestic tourism expenditure data was also price-adjusted to benchmark them for the TSA reference year. Also, the underestimation of these data is corrected by applying the adjustment factors (Table 4.3) on value of expenditure for each item.
4.35. The TSA Table 2 is given in Chapter 5 on Tables and Accounts.
4.36. In all, 159.38 lakh domestic or intrastate trips were undertaken in 2008-09 in Chhattisgarh.
4.37. The per cent distribution of intrastate trips by purpose of travel was different from that of interstate trips. While maximum number of trips (57.7 per cent of the total, as given in Table 4.4) undertaken from other states to the state of reference were social trips, this proportion stood at 81 per cent in case of intrastate domestic trips, as shown in Table 4.8, which presents the state-wise distribution of intra-state trips by purposes of travel.
4.38. Among the total intrastate domestic trips, 5.8 per cent were religious trips and 4.3 per cent were medical trips. 4.3. The average per-trip expenditure incurred during domestic trips in Chhattisgarh was Rs. 2,444. The per-trip expenditure is the highest for shopping trips (Rs. 18,810) followed by medical trips (Rs 5,627) (see Figure 4.3). The average per-tourist per-day expenditure is also reported in Table 4.10.

Region al Tourism Satellite Account– Chhattishgarh, 2009-10
|65| National Council of Applied Economic Research
TABLE 4.8: STATE-WISE PER-CENT DISTRIBUTION OF TRIPS (WITHIN THE STATE) BY PURPOSES OF TRAVEL
S. No. States
Bus
ines
s
Leis
ure
Soci
al
Rel
igio
us
Educ
atio
n
& tr
aini
ng
Hea
lth
&
med
ical
Shop
ping
Oth
ers
Tota
l
1 A & N Islands 4.3 5.4 67.4 2.7 3.8 9.5 1.8 5.1 100 2 Andhra Pradesh 2.3 3.6 74.0 8.7 0.6 7.0 0.1 3.7 100 3 Arunachal Pradesh 10.6 1.4 35.1 4.8 5.5 12.3 13.8 14.9 100 4 Assam 8.6 2.4 65.1 6.3 1.9 10.3 1.1 4.2 100 5 Bihar 4.5 1.4 72.0 7.9 1.1 10.2 0.9 1.7 100 6 Chandigarh 0.0 0.0 100.0 0.0 0.0 0.0 0.0 0.0 100 7 Chhattisgarh 2.0 2.9 81.0 5.8 1.2 4.3 0.8 1.9 100 8 Dadra & Nagar Haveli 0.3 0.3 97.8 0.2 0.0 1.4 0.0 0.0 100 9 Daman & Diu 0.0 0.0 99.3 0.0 0.0 0.0 0.0 0.7 100
10 Delhi 0.0 1.2 92.9 0.2 0.0 4.7 0.0 1.0 100 11 Goa 0.0 1.5 76.5 19.4 0.1 2.3 0.2 0.0 100 12 Gujarat 1.3 1.7 76.0 15.1 1.4 3.9 0.1 0.7 100 13 Haryana 0.8 0.1 86.9 2.8 0.5 5.6 0.0 3.2 100 14 Himachal Pradesh 3.0 2.2 78.4 4.3 1.1 5.3 1.5 4.2 100 15 Jammu & Kashmir 2.3 1.7 83.9 3.7 2.0 3.0 0.7 2.8 100 16 Jharkhand 2.4 3.6 76.4 3.0 1.8 9.7 0.7 2.5 100 17 Karnataka 2.1 2.6 76.3 13.0 0.5 3.9 0.1 1.6 100 18 Kerala 1.9 2.2 69.8 7.9 1.1 9.9 0.0 7.2 100 19 Lakshadweep 9.9 6.0 49.8 4.3 1.5 0.7 0.0 27.7 100 20 Madhya Pradesh 2.3 1.4 81.6 7.2 0.6 5.0 0.3 1.7 100 21 Maharashtra 1.6 1.8 70.8 15.4 0.7 7.4 0.4 1.8 100 22 Manipur 13.4 2.5 45.5 7.0 2.7 11.4 10.9 6.2 100 23 Meghalaya 9.4 5.0 55.9 7.8 1.9 13.6 1.6 4.7 100 24 Mizoram 23.2 1.2 50.2 5.7 3.2 5.5 6.3 4.6 100 25 Nagaland 19.0 4.2 34.1 9.3 6.9 3.8 2.1 20.6 100 26 Orissa 3.1 4.2 74.1 4.8 0.8 8.1 1.2 3.7 100 27 Puducherry 0.0 10.9 66.7 5.4 6.9 9.3 0.0 0.8 100 28 Punjab 1.8 0.2 79.2 11.8 0.8 4.1 0.0 2.2 100 29 Rajasthan 1.3 1.0 82.4 6.2 1.2 4.8 0.2 2.9 100 30 Sikkim 6.7 0.7 51.7 10.9 3.6 10.4 0.8 15.3 100 31 Tamil Nadu 1.5 4.1 74.4 14.8 0.4 3.6 0.1 1.2 100 32 Tripura 0.2 5.4 82.3 1.1 0.4 7.5 0.1 2.5 100 33 Uttar Pradesh 1.8 1.5 82.5 5.0 1.1 4.9 0.3 2.8 100 34 Uttarakhand 4.3 0.5 76.0 4.6 1.1 3.5 3.7 6.3 100 35 West Bengal 2.4 5.8 76.0 3.6 0.6 8.8 0.1 2.8 100
All India 2.2 2.4 76.6 8.4 0.9 6.3 0.4 2.8 100
Source: NCAER computation

Region al Tourism Satellite Account– Chhattishgarh, 2009-10
|66| National Council of Applied Economic Research
Figure 4.3: Average per-trip expenditure incurred in domestic trips (within state) by purpose of travel
Source: NCAER computation
18,810
5,627
2,444 2,374 2,270 2,187 2,177 1,567 1,345
Shopping Health andmedical
Allpurposes
Holiday,leisure andrecreation
Religious Social Educationand
training
Otherpurposes
Business

Region al Tourism Satellite Account– Chhattishgarh, 2009-10
|67| National Council of Applied Economic Research
TABLE 4.9: STATE WISE PER-TRIP EXPENDITURE (RS.) OF DOMESTIC TRIPS (WITHIN STATE) BY PURPOSE OF TRAVEL
(Package + non-package)
S. No. States
Bus
ines
s
Leis
ure
Soci
al
Rel
igio
us
Educ
atio
n
& tr
aini
ng
Hea
lth
&
med
ical
Shop
ping
Oth
er
All
1 A & N Islands 7746 4309 3671 4929 3437 6732 29033 5413 4753 2 Andhra Pradesh 2807 2486 2089 6141 4224 9705 5342 4748 3121 3 Arunachal Pradesh 13523 10268 7451 4672 9984 8206 6089 7828 8112 4 Assam 4351 5508 2767 2742 4800 4451 4555 3483 3231 5 Bihar 3308 1596 1626 1532 1412 3222 4053 1258 1871 6 Chandigarh 0.0 0.0 2234 0.0 0.0 0.0 0.0 0.0 2234 7 Chhattisgarh 1345 2374 2187 2270 2177 5627 18810 1567 2444 8 Dadra & Nagar 666 3041 638 2999 0.0 1279 0.0 0.0 659 9 Daman & Diu 0.0 0.0 1814 0.0 0.0 0.0 0.0 7189 1852
10 Delhi 0.0 1305 1774 1991 0.0 56980 0.0 2160 4347 11 Goa 0.0 8244 3914 7099 1680 13242 519 0.0 4806 12 Gujarat 5181 5147 2962 3986 5044 24080 11351 6464 4058 13 Haryana 1446 2194 2075 4850 1238 9090 96270 13010 2921 14 Himachal Pradesh 1975 1894 3326 2625 3499 7772 5355 3270 3490 15 Jammu & Kashmir 4058 7858 1417 2538 6099 6259 8532 7292 2075 16 Jharkhand 1991 3546 1994 1931 3423 8384 5372 2175 2720 17 Karnataka 3039 15037 2650 5792 5040 10729 5824 4371 3742 18 Kerala 6116 20058 1859 4592 2226 12679 11530 8436 4104 19 Lakshadweep 8578 11701 5876 9694 4977 6461 0.0 2930 5830 20 Madhya Pradesh 2743 4136 1618 2481 3533 4210 3150 1931 1890 21 Maharashtra 5555 12333 3477 4842 4246 8179 4563 5555 4275 22 Manipur 8542 5440 3008 3224 6252 7151 7839 3593 4956 23 Meghalaya 4402 3094 2487 1378 2936 4440 6029 3971 3012 24 Mizoram 10418 4549 4499 2842 7543 14126 8392 5675 6701 25 Nagaland 7127 5460 4353 4893 7251 7103 6806 7137 5907 26 Orissa 2079 1897 1291 4016 8480 6026 2174 1711 1939 27 Puducherry 0.0 1132 1890 667 10178 3118 0.0 806 2421 28 Punjab 3410 19774 2118 3727 2074 12933 9673 8596 2948 29 Rajasthan 6102 5392 2562 3108 3646 14028 4623 7475 3378 30 Sikkim 3996 5812 3866 4547 2942 6628 13064 5237 4494 31 Tamil Nadu 3120 7126 2487 4530 5973 20414 46751 5902 3723 32 Tripura 3459 1265 887 930 1117 3297 11577 2352 1140 33 Uttar Pradesh 1728 1876 1837 2655 1872 5935 6439 3265 2134 34 Uttarakhand 3394 5683 3639 5085 4967 9015 6066 2443 3923 35 West Bengal 2936 3178 1337 1815 3226 6814 18152 3032 2059
All India 3492 5558 2184 4103 3525 8761 6664 4963 2976
Source: NCAER computation

Region al Tourism Satellite Account– Chhattishgarh, 2009-10
|68| National Council of Applied Economic Research
TABLE 4.10: STATE WISE PER-TOURIST PER-DAY EXPENDITURE (RS.) OF DOMESTIC TRIPS (WITHIN STATE) BY PURPOSES OF TRAVEL
(In Rs)
S. No. State
Bus
ines
s
Leis
ure
Soci
al
Rel
igio
us
Educ
atio
n &
trai
ning
Hea
lth
&
med
ical
Shop
ping
Oth
er
purp
oses
All
purp
oses
1 A&NI 1423 180 372 307 475 437 3072 448 427 2 Andhra Pradesh 487 296 295 962 1470 1074 2507 474 431 3 Arunachal Pradesh 2118 931 1704 1258 1233 1341 1278 1810 1582 3 Assam 935 1482 601 729 1744 1479 2343 1517 768 4 Bihar 1788 410 239 92 497 903 2716 103 268 5 Chandigarh 0.0 0.0 423 0.0 0.0 0.0 0.0 0.0 423 6 Chhattisgarh 652 383 368 457 702 1203 16543 296 430 7 Dadra & Nagar Haveli 465 1482 118 349 0.0 150 0.0 0.0 121 8 Daman & Diu 0.0 0.0 400 0.0 0.0 0.0 0.0 1639 409 9 Delhi 0.0 1353 842 1424 0.0 21335 0.0 642 2041
10 Goa 0.0 743 507 534 811 876 501 0.0 534 11 Gujarat 2636 344 371 969 1365 3241 3543 244 542 12 Haryana 311 456 358 1154 641 1381 22291 3345 512 13 HP 971 451 897 825 1296 1591 4082 940 956 14 J&K 1519 1066 454 674 2980 1052 1187 1507 620 15 Jharkhand 762 806 375 410 1165 1303 3561 290 513 16 Karnataka 1051 1102 398 930 1211 655 3478 490 527 17 Kerala 1460 3910 300 1443 427 1008 11400 993 614 18 Lakshadweep 769 1795 613 887 232 584 0.0 468 656 19 Madhya Pradesh 666 701 265 510 985 544 1691 648 316 20 Maharashtra 938 1154 450 640 1321 695 2576 1262 541 21 Manipur 5395 2886 1286 1255 1551 1322 4212 1711 1927 22 Meghalaya 2392 1043 603 580 1405 1526 2497 803 855 23 Mizoram 3167 2103 1254 962 1515 1050 3121 1627 1682 24 Nagaland 3005 1363 1569 1135 1905 2458 4723 2401 1982 25 Odisha 505 418 248 870 2251 915 1647 462 379 26 Puducherry 0.0 265 116 43 833 286 0.0 222 172 27 Punjab 261 951 360 1111 75 2385 4522 1213 500 28 Rajasthan 1326 560 450 666 724 2102 1759 1128 591 29 Sikkim 2542 1030 844 624 533 1222 7665 510 796 30 Tamil Nadu 520 1213 501 965 1120 1912 26850 939 716 31 Tripura 1052 207 161 306 536 756 10822 544 212 32 UP 521 323 328 587 415 765 2036 571 381 33 Uttarakhand 2561 1471 918 1511 555 2179 2997 1299 1065 34 West Bengal 1090 468 199 405 797 962 7414 432 313
All India 43288 33346 19187 25574 32770 60692 163034 30978 24802
Source: NCAER computations using 65th round NSSO data

Region al Tourism Satellite Account– Chhattishgarh, 2009-10
|69| National Council of Applied Economic Research
Figure 4.4: Percentage distribution of Domestic Tourism Expenditure (incurred by visitors from within the state) by products for different purposes of travel – Chhattisgarh
Source: NCAER computation
Source: NCAER computation
SSSSSoource: NNNNCNCCCNNCCCCCCNCCCCCNNCCNCCCNCNNCNCCCCCCN AEAEAEAEAEAEAEAAEAEAEAEAEAEAEAEAEAEAEAAAEAAEAAEAEAAAAEEER RRRRRRRRRRRRRRRRRRRRRRRRRRRRRRRRRR coooompmmmmmmppppmmppmppmmpppmmppmpmmmpmmppmpmpuuuuutuuuuuuuuuuuuu atttttttattttttttttioiioiioioiiioiooon nnnnnnnnnnnnnnnnnnnn

Region al Tourism Satellite Account– Chhattishgarh, 2009-10
|70| National Council of Applied Economic Research
4.40. The state-wise average per-trip expenditure of domestic tourists from within the state of reference is given in the Table 4.9.
4.41. The per cent distribution of total expenditure by items of expenditure reveals that the passenger transport services (comprising transport by railway, road, water, air and transport rental services) account for 56.4 per cent of the total expenditure.
4.42. When observed by purposes of travel (Figure 4.4), the share of passenger transport expenses is the highest in most of the trips, except in case of medical trips and shopping related trips, where its share is 28.7 per cent and 16.4 per cent respectively. The maximum share in case of medical and shopping trips is of expenditure incurred on health and medical related services (65.1 per cent) and expenses incurred on tourism connected products (82.9 per cent) respectively.
OUTBO UNDTO URIS MEXPE NDI TURE
4.43. TSA Table 3 focuses on outbound tourism. This table presents the tourism expenditure incurred by the resident visitor outside the country of reference on tourism characteristic and tourism connected products and services.
4.44. This expenditure could be either as part of an outbound tourism trip or as part of a domestic trip. Both domestic trip and an outbound trip correspond to the travel between leaving the place of residence and returning. However, a domestic trip has a main destination in the country of residence of the traveller, while an outbound trip has a main destination outside this country.
4.45. In the state TSA tables, the data presented refers to the residents visiting outside the country and the expenditures included here are pre-trip expenditures within the country.
4.46. While trips undertaken outside the territory of the state of reference, to other states within India, also fall under the definition of outbound tourism, but the pre-trip expenditure of such trips is beyond the scope of the Domestic Tourism Survey, 2008-09.
4.47. The DTS-2008-09 conducted by NSSO canvassed the domestic tourists only and no information was collected on outbound tourism. However, a separate survey was conducted by ISI, Kolkata and was a part of IPS. This survey captured the expenditure incurred by outbound tourists within India which includes the pre-trip

Region al Tourism Satellite Account– Chhattishgarh, 2009-10
|71| National Council of Applied Economic Research
expenditure, say, on shopping or expenditure incurred on travelling from place of residence to place of exit to another country and back.
4.48. This expenditure is supposed to be a part of TSA Table 2 but since there are no data available on the recommended TSA Table 3, the outbound tourism expenditure incurred in India (pre-outbound trip) is presented in this table. As mentioned, this information was collected through survey conducted by ISI.
4.49. The procedure followed to compile the estimates is same as for TSA Tables 1 and 2. Since the reference period of the IPS is 2010-11 whereas TSA is prepared for 2009-10, the expenditure data are deflated for 2009-10 using the PFCE deflator.
4.50. Adjustment for benchmarking survey data with the estimates of PFCE has also been carried out for pre-trip expenditures of residents.
4.51. The TSA Table 3 is presented in Chapter 5.
KEYFINDINGS –OUTBO UNDTO URIS MEXPE NDI TURE
4.52. In all, there were 55,659 outbound tourists from Chhattisgarh in 2010-11.
4.53. The per-cent distribution of trips by purposes of travel reveals that 56.1 per cent of people travelling abroad are for education and training purposes. This was followed by trips undertaken for leisure purposes, whose share in total stood at 17.8 per cent (Table 4.11) and 13.8 per cent of trips were made for business purposes.
4.54. As compared to this, only 29.1 per cent of the total outbound tourists at all-India level travelled for leisure.
4.55. On an average, Indians travelled abroad mostly for business, leisure and social purposes, with their shares in total outbound tourists being 32.3 per cent, 29.1 per cent and 21.8 per cent.
4.56. Table 4.12 presents the state wise per-trip expenditure for outbound trips originated from each state.

Region al Tourism Satellite Account– Chhattishgarh, 2009-10
|72| National Council of Applied Economic Research
TABLE 4.11: STATE-WISE PER-CENT DISTRIBUTION OF NUMBER OF OUTBOUND TRIPS (TO OTHER COUNTRIES) BY PURPOSE OF TRAVEL
S. No. States
Bus
ines
s
Leis
ure
Soci
al
Rel
igio
us
Educ
atio
n
& tr
aini
ng
Hea
lth
&
med
ical
Oth
er
All
1 A & N Islands 36.3 27.9 12.8 0 22.6 0.4 0 100 2 Andhra Pradesh 23.5 30.4 31.9 0.1 8.2 0.6 5.4 100 3 Arunachal 79.5 13.8 4.4 2.3 0 0 0 100 4 Assam 33.1 34 11.3 0 11.9 0 9.6 100 5 Bihar 33.4 36.2 3.9 10.7 10.5 0 5.4 100 6 Chandigarh 37.2 33 8.3 4 13 0 4.6 100 7 Chhattisgarh 13.8 17.8 1.9 0 56.1 0 10.4 100 8 Dadra & Nagar 89.1 10.9 0 0 0 0 0 100 9 Daman & Diu 35 23.6 27.4 0 5.8 8.2 0 100
10 Delhi 33.4 46.6 5.3 0.9 9.3 0.8 3.6 100 11 Goa 34.7 36.7 17.4 1.4 2.8 0.5 6.5 100 12 Gujarat 38.2 21.2 25.4 1.3 7.8 0.1 6 100 13 Haryana 32.8 41.5 7.8 0.9 11.3 2.4 3.4 100 14 Himachal 42.5 24.9 13.5 0 8.8 0 10.3 100 15 Jammu & 29.7 51.8 7 1.6 2.8 2.3 4.8 100 16 Jharkhand 33.3 15 18.1 0 8.3 0 25.3 100 17 Karnataka 47.8 27.1 11.2 0.7 6.6 1.7 4.9 100 18 Kerala 10.2 29.2 42.1 0.8 5.4 4.6 7.8 100 19 Lakshadweep 59.9 0 40.1 0 0 0 0 100 20 Madhya Pradesh 28.2 48.5 16.4 0.7 1.6 2 2.6 100 21 Maharashtra 46.6 26.5 12.9 1.9 9.6 0.7 1.9 100 22 Manipur 48.6 36.4 0 0 10.2 0 4.8 100 23 Meghalaya 21.6 0 0 0 0 0 78.4 100 24 Mizoram 24.9 1.9 29.9 0 18.6 0 24.7 100 25 Nagaland 47.6 0 22.4 30 0 0 0 100 26 Orissa 47.2 32 2.8 0 7.3 0 10.8 100 27 Puducherry 63.8 27.1 0 0 0 0 9 100 28 Punjab 32 26.3 22.9 0.3 15.4 0.6 2.5 100 29 Rajasthan 24.2 15.1 29.2 9.1 3.6 0.4 18.4 100 30 Sikkim 17.5 20.3 9.5 0 12.6 40.1 0 100 31 Tamil Nadu 48 16.6 12.7 0.4 10 1.3 11.1 100 32 Tripura 51.1 6.2 42.6 0 0 0 0 100 33 Uttar Pradesh 44.9 28.2 6 6.3 4.9 0.7 9.1 100 34 Uttarakhand 13.4 63.3 8.4 4.1 1.9 0 8.8 100 35 West Bengal 38.6 26 23.6 0.4 4.2 0 7.3 100 36 Others 8.1 33.4 58.5 0 0 0 0 100
All India 32.3 29.1 21.8 1.4 7.9 1.3 6.2 100
Source: NCAER computation

Region al Tourism Satellite Account– Chhattishgarh, 2009-10
|73| National Council of Applied Economic Research
TABLE 4.12: STATE WISE PER TOURIST EXPENDITURE (RS.) ON OUTBOUND TRIPS (TO OTHER COUNTRIES) BY PURPOSE OF TRAVEL
S. No. States
Bus
ines
s
Leis
ure
Soci
al
Rel
igio
us
Educ
atio
n &
trai
ning
Hea
lth
&
med
ical
Oth
er
All
1 A & N Islands 19,611 8,394 4,689 0 6,083 101 0 11,4332 Andhra Pradesh 11,360 9,099 6,851 5,825 10,561 24,577 3,313 8,809
3 Arunachal Pradesh 12,418 3,768 32,788 13,037 0 0 0 12,133 4 Assam 37,014 5,710 4,443 0 2,331 0 2,284 15,195 5 Bihar 4,726 12,395 77,629 3,967 8,154 0 1,990 10,445 6 Chandigarh 9,011 8,097 21,864 5,264 1,747 0 3,834 8,444 7 Chhattisgarh 9,705 4,420 183 0 5,874 0 1,550 5,585 8 Dadra & Nagar Haveli 12,141 10,287 0 0 0 0 0 11,939 9 Daman & Diu 4,831 57,244 9,982 0 9,770 34,530 0 21,361
10 Delhi 6,439 7,597 12,452 7,965 5,947 4,493 7,658 7,296 11 Goa 67,733 23,409 14,301 1,899 7,244 8,825 8,414 35,416 12 Gujarat 9,382 20,819 6,048 1,293 6,649 7,474 3,939 10,309 13 Haryana 3,539 9,383 6,137 5,068 7,754 12,325 4,747 6,904 14 Himachal Pradesh 5,681 6,945 9,400 0 14,307 0 2,766 6,954 15 Jammu & Kashmir 705 12,771 1,898 8,357 4,526 8,757 21,569 8,459 16 Jharkhand 6,738 55,256 5,141 0 2,058 0 3,769 12,572 17 Karnataka 10,100 17,912 13,827 17,025 19,894 29,971 24,498 14,383 18 Kerala 29,960 35,507 46,610 7,572 23,567 28,111 51,077 39,624 19 Lakshadweep 28,956 0 6,332 0 0 0 0 19,876 20 Madhya Pradesh 8,297 15,350 7,178 3,314 6,442 3,319 2,362 11,215 21 Maharashtra 16,124 34,510 7,374 5,806 8,068 20,669 3,518 18,691 22 Manipur 40,498 6,770 0 0 1,776 0 11,727 22,898 23 Meghalaya 16,121 0 0 0 0 0 248 3,680 24 Mizoram 2,333 3,476 14,735 0 13,133 0 784 7,695 25 Nagaland 2,612 0 9,110 18,842 0 0 0 8,934 26 Orissa 23,972 17,343 12,135 0 2,349 0 9,102 18,345 27 Puducherry 45,335 15,408 0 0 0 0 7,034 33,757 28 Punjab 6,913 12,475 12,326 7,994 9,529 4,305 8,828 10,059 29 Rajasthan 4,848 19,836 4,776 1,298 7,248 16,309 2,952 6,549 30 Sikkim 23,099 2,05,831 30,219 0 474 0 0 48,818 31 Tamil Nadu 17,683 14,312 18,074 36,983 14,042 18,106 7,033 15,714 32 Tripura 12,598 456 62,228 0 0 0 0 33,006 33 Uttar Pradesh 3,517 6,744 6,634 6,806 5,564 3,178 3,017 4,872 34 Uttarakhand 4,264 4,109 6,389 940 2,591 0 5,906 4,322 35 West Bengal 5,189 4,301 3,140 4,336 9,840 328 3,034 4,508
All India 12,558 12,566 17,473 18,529 5,571 10,647 22,970 13,651
Source: NCAER computation

Region al Tourism Satellite Account– Chhattishgarh, 2009-10
|74| National Council of Applied Economic Research
TO TALINTE RN ALTO URIS MCONS UM PTI ON
4.57. TSA Table 4 in chapter 5 presents the total internal tourism expenditure and the total internal tourism consumption. Besides the internal tourism expenditure, the internal tourism consumption includes the imputed consumption. Internal tourism expenditure presented in this table is made up of inbound tourism expenditure from TSA Table 1, domestic tourism expenditure from TSA Table 2 and outbound tourism expenditure done in the economy of reference which, in this report, is given in TSA Table 3. In addition, TSA Table 4 presents separately the components of imputed consumption of tourists.
4.58. TSA Table 4 presents the estimates of total internal tourism consumption. In addition to tourism expenditure, this includes the following components of imputed consumption:
Services associated with vacation accommodation on own account: This item includes all imputed accommodation services related to accommodation units on own account and to all other types of vacation home13 ownership, as well as expenditure related to their acquisition that is not capitalized as part of the investment, for instance charges for time share exchanges.
Tourism social transfers in kind (except refunds): This item includes the value of individual non-market services provided by Governments and non-profit institutions serving households (NPISH) that benefit visitors and exceed the values paid by the visitors themselves: costs of museums, performing arts, short-term education, health services provided short term in special establishments.
Other imputed consumption: This item includes all other imputed items not previously included, such as services benefiting visitors for which they do not pay (costs of vacation residences or camps provided by producers for the benefit of their employees, financial intermediation services indirectly measured (FISIM) on purchases related to tourism trips, etc.).
4.59. However, these components are not directly available from any data source; hence, after discussions with the technical committee members, these are derived using certain plausible assumptions.
Services associated with vacation accommodation on own
13A vacation home (sometimes also designated as a holiday home) is a secondary dwelling that is visited by the members of the household mostly for purposes of recreation, vacation or any other form of leisure.

Region al Tourism Satellite Account– Chhattishgarh, 2009-10
|75| National Council of Applied Economic Research
account: The imputed consumption on services associated with vacation homes on own account is assumed to be equal to 1 per cent of the urban owner occupied dwelling services14.
Tourism social transfers in kind (except refunds): This is derived from the component of “social transfer in kind” against “Recreation and Culture” in the Classification of Individual Consumption Expenditure of Households (COICOP). Household consumption on any item of consumption comprises of the individual consumption expenditure and social transfers in kind (paid by government). Since, the data on the share of these transfers that goes to the tourists and to non-tourists are not available, it is assumed to be 50 per cent for each. The NAS statement on COICOP provides these components household consumption expenditure. For Tourism, the individual consumption expenditure component is obtained from the demand side information through DTS while the imputed consumption that relate to “social transfers in kind” is obtained from COICOP.
Financial Intermediation Services Indirectly Measured (FISIM) on purchases related to tourism trips: This is obtained using the share of FISIM in PFCE (as in NAS) and applying it on total internal tourism consumption expenditure.
Imputed consumption of services rendered by vacation residences provided by producers for the benefit of their employees: This refers to the cost borne by the companies (mostly private corporates) on the services that they provide in their guest houses for the benefit of employees. This is assumed to be about half per cent of the total output of organised private corporate sector.
Expenditure incurred by other households (mainly on food) on the visiting tourists when the tourists stay at the friends/relatives’ place: While the accommodation cost is recommended to be excluded from the tourism consumption when the tourists stay at the friends/relatives’ place while on trip, but the expenses incurred on food is taken into account. Notably, for the domestic tourists, in large number of cases friends and relatives provided accommodation not only when the trips were taken for social purpose but for other purposes too. The expenses incurred by these households on food provided to the visitors are to be added to
14The economic activities covered under owner occupied dwelling services include ownership of dwellings (occupied residential houses) and the imputed value of owner occupied dwellings.

Region al Tourism Satellite Account– Chhattishgarh, 2009-10
|76| National Council of Applied Economic Research
the imputed tourism consumption. This is obtained by multiplying the average per day expenditure of food (obtained from PFCE, NAS) with the number of days spent at friends/relatives’ place during all the tourist-trips taken in a reference year.
4.60. The sum of total internal tourism expenditure and imputed tourism consumption gives the total tourism consumption, which is presented in TSA Table 4.
4.61. The internal tourism expenditures and consumption refer to the year 2009-10. Price adjustments wherever necessary to the survey data have been carried out using implicit price deflators from the item-level PFCE.
4.62. The internal tourism expenditures and consumption are at purchasers’ prices and include the actual expenditures made on acquisition of goods.
PROD UCTI ONAC CO UN T OFTO URIS MINDUS TRIES
4.63. The TSA Table 5 presents the production accounts of tourism industries and other industries in the economy of reference. It conforms formally to the format established in the Systems of National Accounts (SNA) 1993 for production accounts. In the SNA, Production accounts are compiled for industries and institutions.
4.64. The main aggregate that is derived from this table is the gross value added of tourism industries (GVATI). The GVATI, however, has a limited role as being a relevant indicator of tourism’s contribution to the economy.
4.65. As recommended, the production account of the state economies with focus on tourism industries has been prepared using India’s Supply and Use Table (SUT) for the year 2009-10 that has specially been compiled for this TSA. In the first stage, the all India SUT was prepared for 130 industries and 130 products, the same dimension which CSO uses for its 5-yearly Input-Output Tables.
4.66. In the second stage, this SUT of 130 industries was further expanded to 142 sectors to include some of the tourism specific industries which were not separately identifiable in the 130-industry SUT. The 142 sector SUT was compiled by splitting some of the 130 sectors. Further, since the focus of this TSA is on 25-industry/products that are relevant from the tourism perspective, this 142- sector SUT was aggregated to arrive at 25-sector SUT. Of these 25 industries and products, 20 industries were the tourism specific industries, for which
Region al Tourism Satellite Account– Chhattishgarh, 2009-10
|77| National Council of Applied Economic Research
the information on tourism consumption is available and presented in TSA Table 4; and the remaining 5 industries and products are the tourism non-specific industries and products, which, however, would have linkages with tourism industries/products.
4.67. The 25 sector SUT15 and production accounts for 25 industries have been compiled with the desired disaggregation of output of each industry broken down by 25 product groups (at basic prices), intermediate consumption (at purchasers’ prices) broken down by 25 product groups and value added (at basic prices) broken down by its components of compensation of employees, other taxes on production, other subsidies on production, consumption of fixed capital and finally, the net operating surplus/mixed income. This table also includes employment in the 25 industries.
4.68. The source of data for Tables 5 and 6 is the detailed data on state domestic product, that has been provided by the CSO and the respective state Directorates of Economics and Statistics. The all-India ratios have been used for deriving output, intermediate consumption or for splitting of industries and products at state level, wherever there is lack of information by states.
TO URIS MINDUS TRYRATI OS ANDTDGVA
4.69. Table 6 is the core of the Tourism Satellite Account system as it is where the confrontation and reconciliation between domestic supply and internal tourism consumption take place. This table derives its conceptual basis from the supply and use tables of the System of National Accounts 1993. In this table, the total supply of goods and services in the economy of reference by products, which includes domestic production (production by resident industries) and imports, (including valuation adjustments), is compared to internal tourism consumption that has been derived in Table 4.
4.70. Using the results of Table 6, estimates can be derived regarding the gross value added attributable to tourism for each of the domestic industries that serve visitors. This provides the basic information that is necessary for the computation of tourism ratios for products and industries, TDGVA (Tourism Direct Gross Value Added) and TDGDP (Tourism Direct Gross Domestic Product) and their components. The
15 At State level, the supply table includes only the supplies of products at basic and purchasers’ prices from domestic industries (in the all India table, this table also includes imports and presents total supplies), while the use table includes the net exports of products (in the all India table, this table shows only the exports).

Region al Tourism Satellite Account– Chhattishgarh, 2009-10
|78| National Council of Applied Economic Research
table together with the associated use table16 provides a basis to compile input-output tables and input-output models that facilitate estimation of indirect contribution of tourism to the economy.
4.71. Conceptually, at the national level, rows of TSA Table 6 are identical to those of TSA Table 5. Regarding columns, there are three blocks:
The first block corresponds to the same columns as those of TSA Table 5 and represents industries.
The second block (imports, taxes less subsidies and trade and transport margins) represents the additional variables and valuation adjustments (imports, taxes less subsidies on products and trade margins and transport freight costs, that are needed to obtain domestic supply of individual products at purchasers’ prices.
The third block is made of only two columns - internal tourism consumption that has been derived in Table 4 and tourism ratio, which is the share of internal tourism consumption to the total supply at purchasers’ prices, for each product, shown in the rows.
4.72. The supply of each of the products by domestic producers is first added over industries to obtain the aggregate value of total output of domestic producers at basic prices for each of these products. Then, this column (which also corresponds to the last column of table 5 is added to the following column, Imports, cif17, which represents supply within the domestic economy of imported goods and services (besides imported goods, what concerns tourism refers to transport services within the domestic economy provided by non-resident producers, as well as insurance services or any other service provided by non-residents and purchased on the Internet or otherwise. Information on imports of services is generally available from the balance of payments statistics).
4.73. The sum of these two columns represents the total supply of each product at basic prices. This column is then added to a column of taxes less subsidies on products concerning domestic output and imports, and a last column representing trade and transport margins, in order to finally obtain the column of domestic supply at purchasers’
16Use table is not included in the TSA tables, although it has a role in the computation of production account of tourism industries discussed in Table 5 and also in providing coherence consistency to the supply table at product level. 17Imports cif are considered to be at basic price valuations.

Region al Tourism Satellite Account– Chhattishgarh, 2009-10
|79| National Council of Applied Economic Research
prices for each of the product. This presentation is similar in essence to that followed in the System of National Accounts 1993 to determine the supply and use tables.
4.74. Against this final column of supply at purchasers’ prices, the internal tourism consumption by products obtained from Table 4 is shown in the next column. The final column shows the Tourism ratio (in percentage) which is the ratio of internal tourism consumption to the total supply for each product. These tourism ratios allow for the estimation of the two main aggregates: TDGVA and TDGDP. The following paragraphs explain how these ratios are derived and their application for measuring tourism direct economic contribution in the economy of reference.
4.75. For each column of the supply table, a new column is added to indicate the share of internal tourism consumption within that industry. The values for this new column are generated based on the Tourism share shown in the last column of the supply table. Thus, in each row of the first block of rows representing industries, the total value of tourism shares is equal to the value of internal tourism consumption that appears in the last block of columns. In the case of the rows corresponding to goods (characteristic or other), as only the activity by which they are made available to visitors generates tourism direct value added, only the associated retail trade margin generates share. As a consequence, in the case of goods, the sum of the tourism share on supply is not equal to internal tourism consumption, but only to the value of retail trade services on those goods.
4.76. Through these calculations, it is possible, for each industry, to establish the tourism share of output (in value), as the sum of the tourism share corresponding to each product component of its output. Then, it is possible to establish, for each industry, a tourism ratio18 (ratio between the total value of tourism share and total value of output of the industry expressed in percentage form), to be applied to the components of intermediate consumption, so as to arrive at the value added. If intermediate consumption is broken down by products, this tourism ratio might be uniform for each product belonging to the intermediate consumption of an industry and thus be equal to that of total output, or it might also be possible to modulate these ratios according to the relative importance of the different components of its output that is consumed by visitors (for instance, in a hotel providing
18Tourism ratios can be generated and presented separately for both the products and the industries, based on their total output.

Region al Tourism Satellite Account– Chhattishgarh, 2009-10
|80| National Council of Applied Economic Research
also food-serving services, the ratio of accommodation services demanded by visitors might be different from that corresponding to food-serving services).
4.77. In all cases, from the difference between the values of output attributable to tourism consumption and the values of intermediate consumption attributable to tourism consumption, the part of gross value added generated in each industry by tourism consumption is compiled.
4.78. From the above sequence of steps, it is possible, for each industry, to derive an estimate of the fraction of its gross value added (at basic prices) corresponding to the contribution of its output to total internal tourism consumption, and these values can be added over all industries, both the tourism industries and all other industries. The sum of all these portions of value added over all tourism industries is the TDGVA.
4.79. To obtain the tourism direct GDP generated by internal tourism consumption (TDGDP), it is necessary to add to TDGVA the taxes less subsidies on products and imports related to tourism products that are compiled in the same way, using the corresponding share for each product (except goods for which the share only relates to retail trade margins19). Theoretically, these aggregates (TDGVA and TDGDP) should be independent of the detail in which calculations have been performed, and in particular be independent also of the possibility of identifying tourism industries. In practice, however, this is not the case because gross value added associated with a product is not directly observable20 and has to be estimated through the information provided by industries that produce this product.
4.80. The procedure that has been recommended for compiling Table 6 is applicable at national level. The absence of data on imports in the State from other states and countries hampers the adoption of recommended method for compiling Table 6 which enables the estimation of TDGVA and TDGDP. However, with the information
19No product taxes or product subsidies are shown in the Indian input output tables, therefore, net product taxes on retail trade for tourists are not available. However, in a VAT system, the cumulative taxes are borne by the final user, hence all product taxes net of subsidies on goods purchased by the tourists have been taken into account in the computation of TDGDP. 20Value added is a concept applicable for industries, which generally produce more than one product. Value added for products can only be derived through assumptions.

Region al Tourism Satellite Account– Chhattishgarh, 2009-10
|81| National Council of Applied Economic Research
available at state level, it is possible to compile TDGVA21 with some assumptions. The three possible options for computing TDGVA are:
4.81. The first option is to allocate the national TDGVA to states using the share of different states in tourism internal consumption (which has been estimated for state TSA Table 4 on Total Tourism Internal Consumption). However, this method implicitly assumes that share of imports in meeting the tourism internal consumption in a state is same as in all India and that tourism ratio of a product is same in the state and in all-India. The assumption of share of imports in meeting tourism demand being same in a state and all India is incorrect in the case of most states.
The second option is to apply tourism industries’ output ratios from national TSA to the tourism industries’ output of the states, to derive tourism direct gross output. This method implicitly assumes that the product profile of each industry in a state is same as that in all India (which can be a reasonable assumption considering that most tourism industries in India produce single output) and that the share of this output being used by residents and tourists is same both at state level and in all India.
STATETO URIS MINDUS TRYRATI O
4.83. The third option and the one finally adopted is to derive the state specific Tourism Industry Ratios (TIR) using an auxiliary parameter. This auxiliary parameter used here is the ratio of Tourism Consumption to Private Final Consumption Expenditure (PFCE) for each tourism industry. This ratio is calculated for both All-India and for the state of reference. The item-wise PFCE are estimated using the NSSO survey data of 66th round (for 2009-10) on “Household Consumption Expenditure”. If the ratio for All-India is Xi for ith industry and that for state is xi for the same industry, then state-specific TIR for its industry is estimated as:
(State TIR)i = xi / Xi * (National TIR)i
4.84. The third method is used to derive the state TIRs for only the tourism characteristic industries while the TIRs for tourism connected and non-tourism industries are assumed to be the same as national TIRs. This is because for tourism connected industries, these ratios are derived using only the retail trade services on goods and hence
21At state level, only gross value added at factor cost is computed in India, but not GDP (at purchasers’). Therefore, it is neither possible nor necessary to compute TDGDP at state level. However, GVA at basic prices by industry at state level has been estimated for the State TSA tables, using all-India ratios.

Region al Tourism Satellite Account– Chhattishgarh, 2009-10
|82| National Council of Applied Economic Research
are too low to show a variation across the states of India. Similarly, the ratios of non-tourism industries are very low for the obvious reason that non-tourism industries are only indirectly related to tourism and the magnitude to tourism component in these industries is bound to be small.
4.85. The use of an auxiliary parameter is somewhat similar to small area estimation technique which enables the estimation of small sub-populations using the estimates of larger populations which includes these sub-populations. The term “small area” generally refers to a small geographical area (here, state) within a larger area, which here is the country. When the reliable estimates are not available for the small area, it may be possible to use additional data that exists both for these small areas and for the larger area, in order to obtain the estimates for the desired parameters.
4.86. It may be noted that we have adopted this method due to the absence of requisite data for deriving the tourism industry ratios at state level although conceptually tourism consumption is by tourists whereas PFCE is by the residents. But we have assumed that the services (all tourism characteristic industries are services industries) are consumed at the time of production hence the figures may be comparable.
4.87. Also, since Also, since PFCE for some of the service industries is not captured clearly from the NSSO survey, we have assumed the tourism consumption to PFCE ratio for these industries to be same as for the closely related industry for which this ratio can be estimated. For example, consumption expenditure is not available separately for Hotels and Food serving services, hence the ratio for latter is assumed to be same as that of former. Similarly, transport equipment rental and travel agencies are given the same ratios. Further, ratios of cultural & religious services and that of sports & recreational services are the same.
4.88. Hence obtained TIRs for all 25 industries of Chhattisgarh are given in the table below

Region al Tourism Satellite Account– Chhattishgarh, 2009-10
|83| National Council of Applied Economic Research
TABLE 4.13: STATE-SPECIFIC TOURISM INDUSTRY RATIOS
Industries
Rat
io1
=
PF
CE
/To
uri
sm
Con
sum
pti
on
fo
r In
dia
Ind
ia T
IR
Rat
io2
= P
FC
E/
Tou
rism
C
onsu
mp
tio
n
for
stat
e
A =
Rat
io2/
R
atio
1
Sta
te T
IR =
A
*In
dia
TIR
1. Agriculture 0.00 0.00 0.00 0.00 0.00
2. Mining, other manufacturing, construction,electricity, gas and water supply
0.00 0.00 0.00 0.00 0.00
3. Trade 0.00 0.66 0.00 0.00 0.66
4. transport freight services 0.00 2.25 0.00 0.00 2.25
5. All non-tourism specific services 0.00 2.29 0.00 0.00 2.29
A 1. Tourism characteristic product
1. Accommodation services/Hotels 0.54 51.09 0.29 0.54 27.59
2 Food and beverage serving services/Restaurants
0.54 16.37 0.29 0.54 8.84
3 Railway passenger transport services 0.99 57.63 0.98 0.99 56.80
4 Road passenger transport services 0.77 54.42 0.18 0.23 12.37
5 Water passenger transport services 5.28 12.10 0.15 0.03 0.35
6 Air passenger transport services 4.71 77.20 0.71 0.15 11.65
7 Transport equipment rental services 14.63 28.82 19.45 1.33 38.32
8 Travel agencies and other reservation services/ Supporting and auxiliary transport activities
14.63 72.36 19.45 1.33 96.22
9 Cultural and religious services 0.95 17.06 0.66 0.69 11.80
10 Sports and other recreational services 0.95 3.84 0.66 0.69 2.66
11 Health and medical related services 0.31 30.05 0.53 1.73 51.93
A.2 Tourism connected products
12 Readymade garments 0.0 0.0 0.0 0.0 0.0
13 Processed Food 0.0 0.0 0.0 0.0 0.0
14 Tobacco products 0.0 0.0 0.0 0.0 0.0
15 Beverages 0.0 0.0 0.0 0.0 0.0
16 Travel related consumer goods 0.0 0.0 0.0 0.0 0.0
17 Footwear 0.0 0.0 0.0 0.0 0.0
18 Soaps, cosmetics and glycerin 0.0 0.0 0.0 0.0 0.0
19 Gems and jewellery 0.0 0.0 0.0 0.0 0.0
20 Books, journals, magazines, stationery etc. 0.0 0.0 0.0 0.0 0.0
Total
Source: NCAER computation

Region al Tourism Satellite Account– Chhattishgarh, 2009-10
|84| National Council of Applied Economic Research
EMPL OYMEN TIN TOURISMINDUS TRIES
4.89. TSA Table 7 presents the employment in tourism industries. According to TSA:RMF-2008, seasonality, high variability in the working conditions, flexibility and the informality of jobs in several small units are the major challenges in collecting data on employment in tourism industries. Further, labour is a factor of production and is generally associated with an establishment in which, usually, various products are produced. Therefore, relating employment to a specific product or group of products of a given establishment is a complex issue in measuring tourism direct employment.
4.90. While labour can be associated with the total output of an establishment, it cannot be assigned to any particular product without the use of specific assumptions and modelling procedures. For this reason, tourism employment, referring to the employment strictly related to the goods and services (tourism characteristic, tourism connected and other) acquired by visitors and produced by either tourism industries or other industries cannot be directly observed. Its measurement would require techniques that go beyond the present recommendations. As a result, the recommendations in the TSA:RMF 2008 are restricted to employment in the tourism industries.
4.91. Consequently, the measures proposed refer to the restrictive quantification of employment according to its statistical meaning (since not all volume of employment found in a given industry corresponds to tourism consumption) and coverage (since there are different levels of employment in other industries that partly correspond to tourism consumption).
4.92. Two major breakdowns of the number of jobs and hours worked are proposed: one according to the gender of the person employed, the other according to a simplified status in employment classification, where only employees are singled out from the rest of the labour force. The intensity of the use of the labour force is expressed in terms of number of jobs, number of hours worked (in the reference period) and number of full-time equivalent jobs (in the reference period) in order to make the measurements comparable and to wipe out the effects of part-time jobs.
4.93. Because the flow of visitors often presents marked seasonality, this phenomenon also characterizes employment, in particular in industries such as accommodation and food and beverage serving services. For this reason, countries are encouraged to measure employment at least twice a year, at peak and low tourism seasons.

Region al Tourism Satellite Account– Chhattishgarh, 2009-10
|85| National Council of Applied Economic Research
The number of jobs, hours of work and other characteristics of the labour force should provide basic information for understanding and monitoring the changing levels and contribution of tourism activity.
4.94. As recommended, Table 7 presents the total number of jobs (one employed person can take up more than one job, the other being of subsidiary nature) and number of people employed in the tourism specific industries. As part of Table 7, two tables on employment have been prepared – one table distinguishes the employment (number of jobs and headcount) in tourism industries by nature of employment (self-employed and employees) and by gender. The other table distinguishes employment by their formal and informal nature, since informal sector and informality of jobs is highly prevalent in India.
4.95. For preparing these tables, the unit level data of 66th Round of NSSO survey on “Employment-Unemployment” (EUS) has been analysed. For identifying the formal and informal nature of job, the person employed is classified accordingly using the information on his/her status of work and the enterprise in which employed. On the basis of this information, a person is identified as formal and informal using the mapping given in table below:
TABLE 4.14: IDENTIFICATION OF FORMAL/INFORMAL WORKERS (EUS)
Enterprise Type Formal Informal 1. Proprietary male
None All
2. Proprietary female3. Partnership with members of samehousehold 4. Partnership with members of diffhousehold 5. Public sector Status=Regular wage earner Status=Others
6. Public/Private limited company Status= Regular wage earner Status= Others 7. Co-operative societies/trust/othernon-profit institutions
Status= Regular wage earner and number of workers > 5 and job
contract is written and is for more than 1 year
Rest 8. Employer's households
9. Others
Source: NCAER COMPUTATIONS
NON-MONETARYINDICATORS
4.96. TSA Table 10 presents a few quantitative indicators that are important for the interpretation of the monetary information presented. The indicators include the number of trips by forms of tourism, classes of visitors and duration of the stay, physical

Region al Tourism Satellite Account– Chhattishgarh, 2009-10
|86| National Council of Applied Economic Research
indicators regarding types of accommodation, modes of transport used by non-resident visitors travelling to the economic territory of the country of reference, and the number and size of the establishments belonging to tourism industries. However, the set of non-monetary indicators may vary from country to country or from region to region depending on the availability of data.
4.97. For the states of India, and Chhattisgarh in particular, the following set of tables form TSA Table 10. It should be noted that there are not enough data on inbound or outbound tourism originating from the states. “India Tourism Statistics”, a publication of the Ministry of Tourism reports a table on state-wise domestic and foreign visits, which forms TSA Table 10.1. Rest of the tables are obtained from the DTS- 2008-09.
_________________

Region al Tourism Satellite Account– Chhattishgarh, 2009-10
|87| National Council of Applied Economic Research
5. TSA TABLES AND ACCOUNTS

Region al Tourism Satellite Account– Chhattishgarh, 2009-10
|88| National Council of Applied Economic Research

Region al Tourism Satellite Account– Chhattishgarh, 2009-10
|89| National Council of Applied Economic Research
TSA TABLES
TSA TABLE 1A: INBOUND TOURISM EXPENDITURE BY PRODUCTS AND BY TYPE OF FOREIGN TOURISTS (EXPENDITURE AT MARKET PRICE)
(Package + Non-package) (Rs. Lakh)
S. No Industries
Non-Resident Indians
Foreigner PIO
Foreigner Others
Total Inter-
national Demand
A 1. Tourism characteristic products 180.4 275.2 1362.3 1817.9
1 Accommodation services/Hotels 43.4 106.6 655.6 805.6
2 Food and beverage serving services/Restaurants 48.8 49.4 256.0 354.3
3 Railway passenger transport services 2.4 8.5 19.5 30.5
4 Road passenger transport services 19.9 23.3 81.0 124.2
5 Water passenger transport services 3.6 0.2 2.0 5.8
6 Air passenger transport services 18.5 40.1 125.6 184.1
7 Transport equipment rental services 4.0 8.8 23.5 36.4
8 Travel agencies and other reservation services/ Supporting and auxiliary transport activities 2.7 4.8 32.2 39.7
9 Cultural and religious services 3.6 8.4 21.0 32.9
10 Sports and other recreational services 18.0 20.4 42.9 81.3
11 Health and medical related services 15.6 4.6 102.9 123.1
A.2 Tourism connected products 171.7 79.0 325.3 576.0
12 Readymade garments 46.2 24.6 102.8 173.6
13 Processed Food 3.9 2.9 13.3 20.2
14 Tobacco products 0.5 3.1 3.1 6.6
15 Beverages 3.0 16.8 31.7 51.4
16 Travel related consumer goods 2.1 1.1 9.8 13.0
17 Footwear 4.5 3.3 16.9 24.6
18 Soaps, cosmetics and glycerin 0.6 0.3 1.8 2.6
19 Gems and jewellery 90.2 21.0 110.1 221.3
20 Books, journals, magazines, stationery etc. 20.7 6.0 35.9 62.7
Total 352.1 354.2 1687.6 2393.9
No. of tourists 275.8 220.3 1089.9 1586.0
Per tourist expenditure 127671.5 160784.0 154836.6 150939.4
Source: NCAER Computation

Region al Tourism Satellite Account– Chhattishgarh, 2009-10
|90| National Council of Applied Economic Research
TSA TABLE 1B: INBOUND TOURISM EXPENDITURE (INCURRED BY TOURISTS FROM OTHER STATES) BY PRODUCTS AND PURPOSES OF TRAVEL (EXPENDITURE AT MARKET PRICE)
(Package + Non-package) (Rs. Lakh)
S. No
Industries
Busi
ness
Leis
ure
Soci
al
Relig
ious
Educ
atio
n
& tr
aini
ng
Hea
lth &
m
edic
al
Shop
ping
Oth
er
All
A 1. Tourism characteristic products 31160 4853 23312 5542 732 1121 0 220 66940
1 Accommodation services/Hotels 5584 538 7 40 14 29 0 0 6211
2 Food and beverage serving services/Restaurants
4723 401 745 300 90 86 0 9 6353
3 Railway passenger transport services
17304 1516 8439 764 526 356 0 0 28904
4 Road passenger transport services 3302 2290 5491 2277 41 113 0 202 13714
5 Water passenger transport 0 0 0 0 0 0 0 0 0
6 Air passenger transport services 0 0 83 0 0 0 0 0 83
7 Transport equipment rental services
4 108 1757 2122 9 29 0 10 4039
8 Travel agencies and other reservation services/ Supporting and auxiliary transport activities
237 0 6751 20 53 0 0 0 7061
9 Cultural and religious services 3 0 24 15 0 0 0 0 43
10 Sports and other recreational services
3 0 0 2 0 0 0 0 5
11 Health and medical related services
1 0 16 1 1 508 0 0 527
A.2 Tourism connected products 226242 98 11398 169 23 156 0 2 238088
12 Readymade garments 162686 0 8000 0 7 128 0 0 170822
13 Processed food 10 2 741 33 0 13 0 2 800
14 Tobacco products 0 39 178 40 0 0 0 0 257
15 Beverages 0 0 60 0 0 0 0 0 60
16 Travel related consumer goods 63533 45 1951 95 10 0 0 0 65633
17 Footwear 0 0 315 0 0 14 0 0 329
18 Soaps, cosmetics and glycerine 0 10 52 1 4 0 0 0 68
19 Gems and jewellery 0 0 36 0 0 0 0 0 36
20 Books, journals, magazines, stationery etc.
13 3 65 0 2 1 0 0 84
Total 257402 4951 34710 5711 756 1277 0 222 305028
Estimated number of trips 170133 38663 495190 134666 7212 11394 0 1662 858919
Expenditure per trip (Rs.) 151295 12804 7009 4241 10477 11208 0 13362 35513
Source: NCAER Computation

Region al Tourism Satellite Account– Chhattishgarh, 2009-10
|91| National Council of Applied Economic Research
TSA TABLE 1C: TOTAL INBOUND TOURISM EXPENDITURE BY PRODUCTS AND BY TYPE OF TOURISTS (EXPENDITURE AT MARKET PRICE)
(Package + Non-package) (Rs. Lakh)
S. No Industries
Non-Resident Indians
Foreigner PIO
Foreigner Others
Indians from other
states
Total Inbound Demand
A 1. Tourism characteristic products 180.4 275.2 1362.3 66940.0 68757.9
1 Accommodation services/Hotels 43.4 106.6 655.6 6211.0 7016.6
2 Food and beverage serving services/Restaurants 48.8 49.4 256.0 6353.4 6707.7
3 Railway passenger transport services 2.4 8.5 19.5 28903.6 28934.0
4 Road passenger transport services 19.9 23.3 81.0 13714.2 13838.4
5 Water passenger transport 3.6 0.2 2.0 0.0 5.8
6 Air passenger transport services 18.5 40.1 125.6 82.7 266.8
7 Transport equipment rental services 4.0 8.8 23.5 4039.3 4075.6
8 Travel agencies and other reservation services/ Supporting and auxiliary transport activities
2.7 4.8 32.2 7061.0 7100.7
9 Cultural and religious services 3.6 8.4 21.0 42.8 75.8
10 Sports and other recreational services 18.0 20.4 42.9 4.8 86.1
11 Health and medical related services 15.6 4.6 102.9 527.2 650.3
A.2 Tourism connected products 171.7 79.0 325.3 238087.9 238663.9
12 Readymade garments 46.2 24.6 102.8 170822.0 170995.6
13 Processed food 3.9 2.9 13.3 799.5 819.7
14 Tobacco products 0.5 3.1 3.1 256.8 263.4
15 Beverages 3.0 16.8 31.7 59.9 111.3
16 Travel related consumer goods 2.1 1.1 9.8 65633.0 65646.0
17 Footwear 4.5 3.3 16.9 329.0 353.6
18 Soaps, cosmetics and glycerine 0.6 0.3 1.8 68.1 70.7
19 Gems and jewellery 90.2 21.0 110.1 35.8 257.1
20 Books, journals, magazines, stationery etc. 20.7 6.0 35.9 83.9 146.7
Total 352.1 354.2 1687.6 305027.9 307421.8
Estimated number of trips 275.8 220.3 1089.9 858919.4 0.0
Expenditure per trip (Rs.) 127671.5 160784.0 154836.6 35513.0 0.0
Source: NCAER Computation

Region al Tourism Satellite Account– Chhattishgarh, 2009-10
|92| National Council of Applied Economic Research
TABLE 2: DOMESTIC TOURISM CONSUMPTION (VISITORS FROM WITHIN THE STATE OF REFERENCE) BY PRODUCTS AND BY PURPOSE OF TRAVEL
(Package + Non-package) (Rs. Lakh)
S. No Industries
Bus
ines
s
Leis
ure
Soci
al
Rel
igio
us
Edu-
cati
on
& tr
aini
ng
Hea
lth
&
med
ical
Shop
ping
Oth
er
All
A 1. Tourism characteristic products 3238 10371 189212 18623 4075 38159 3897 4208 271784
1 Accommodation services/Hotels 149 143 135 266 74 383 87 73 1309
2 Food and beverage serving services/Restaurants 296 633 5106 695 296 956 56 412 8451
3 Railway passenger transport services 268 2622 6913 639 308 563 0 20 11332
4 Road passenger transport services 1505 4954 98255 11046 2643 10092 3665 2703 134862
5 Water passenger transport 0 0 6 0 0 0 0 0 6
6 Air passenger transport services 0 0 16 0 0 0 0 0 16
7 Transport equipment rental services 234 1720 65602 5061 153 511 75 38 73392
8
Travel agencies and other reservation services/ Supporting and auxiliary transport activities
666 264 12142 825 592 295 9 779 15571
9 Cultural and religious services 5 8 27 91 0 0 0 0 131
10 Sports and other recreational services 2 7 10 0 0 0 0 0 19
11 Health and medical related services 114 21 1001 0 9 25360 6 184 26695
A 2. Tourism connected products 1113 697 93258 2349 179 809 18863 500 117768
12 Readymade garments 560 272 55836 1383 68 184 358 15 58676
13 Processed food 200 120 3858 464 53 175 25 241 5135
14 Tobacco products 84 12 2386 139 1 165 1 72 2859
15 Beverages 46 113 618 58 0 9 1 75 920
16 Travel related consumer goods 223 101 12764 221 34 199 18433 82 32056
17 Footwear 0 19 2626 22 0 21 44 0 2732
18 Soaps, cosmetics and glycerine 1 17 133 4 13 6 1 14 190
19 Gems and jewellery 0 43 14973 32 0 50 0 0 15098
20 Books, journals, magazines, stationery etc. 0 0 64 26 10 0 0 0 100
Total 4351 11068 282470 20972 4254 38968 22761 4708 389551
Estimated number of trips 323490 466245 12914996 924066 195405 692537 121004 300387 15938130
Expenditure per trip (Rs.) 1345 2374 2187 2270 2177 5627 18810 1567 2444
Source: NCAER Computation

Region al Tourism Satellite Account– Chhattishgarh, 2009-10
|93| National Council of Applied Economic Research
TABLE 3: OUTBOUND TOURISM CONSUMPTION BY PRODUCTS AND BY PURPOSE OF TRAVEL (EXPENDITURE AT MARKET PRICE)
(Package + Non-package) (Rs. Lakh)
S. No Industries
Bus
ines
s
Leis
ure
Soci
al
Rel
igio
us
Educ
atio
n &
trai
ning
Hea
lth
&
med
ical
Oth
er
All
A 1. Tourism characteristic products 191 339 2 0 1174 0 63 1769
1 Accommodation services/Hotels 0 138 0 0 0 0 24 162
2 Food and beverage serving services/Restaurants 44 30 0 0 829 0 17 921
3 Railway passenger transport services 19 4 0 0 0 0 0 23
4 Road passenger transport services 61 54 2 0 27 0 20 164
5 Water passenger transport 0 0 0 0 0 0 1 2
6 Air passenger transport services 50 0 0 0 25 0 0 75
7 Transport equipment rental services 15 113 0 0 0 0 0 129
8 Travel agencies and other reservation services/ Supporting and auxiliary transport activities 0 0 0 0 0 0 0 0
9 Cultural and religious services 0 0 0 0 0 0 0 0
10 Sports and other recreational services 0 0 0 0 0 0 0 0
11 Health and medical related services 0 0 0 0 293 0 0 293
A.2 Tourism connected products 554 99 0 0 660 0 27 1340
12 Readymade garments 246 61 0 0 406 0 11 723
13 Processed food 46 16 0 0 22 0 10 95
14 Tobacco products 7 0 0 0 0 0 0 7
15 Beverages 0 6 0 0 0 0 0 6
16 Travel related consumer goods 255 16 0 0 146 0 3 420
17 Footwear 0 0 0 0 86 0 3 89
18 Soaps, cosmetics and glycerine 0 0 0 0 0 0 0 0
19 Gems and jewellery 0 0 0 0 0 0 0 0
20 Books, journals, magazines, stationery etc. 0 0 0 0 0 0 0 0
Total 745 439 2 0 1833 0 90 3109
Estimated number of trips 7675 9924 1053 0 31212 0 5795 55659
Expenditure per trip (Rs.) 9705 4420 183 0 5874 0 1550 5585
Source: NCAER Computation

Region al Tourism Satellite Account– Chhattishgarh, 2009-10
|94| National Council of Applied Economic Research
TSA TABLE 4: TOTAL INTERNAL TOURISM CONSUMPTION, 2009-10
(Package + Non-package) (Rs. Lakh)
S. No Industries
Inbound Tourism
Consumption
Domestic Tourism
Consumption
Outbound Tourism
Consumption
Total Tourism
Consumption
A 1. Tourism characteristic products 2945526.9 271783.7 1768.5 342310.1
1 Accommodation services/Hotels 7016.6 1308.7 161.7 8487.0
2 Food and beverage serving services/Restaurants 6707.7 8450.8 920.6 16079.1
3 Railway passenger transport services 28934.0 11331.8 23.3 40289.1
4 Road passenger transport services 13838.4 134862.4 164.2 148865.0
5 Water passenger transport 5.8 5.6 1.9 13.3
6 Air passenger transport services 266.8 16.0 75.4 358.2
7 Transport equipment rental services 4075.6 73392.4 128.6 77596.7
8 Travel agencies and other reservation services/ Supporting and auxiliary transport activities
7100.7 15570.8 0.0 22671.5
9 Cultural and religious services 75.8 131.0 0.0 206.8
10 Sports and other recreational services 86.1 19.1 0.0 105.2
11 Health and medical related services 650.3 26695.2 292.9 27638.4
A.2 Tourism connected products 238663.9 117767.7 1340.1 357771.8 12 Readymade garments 170995.6 58676.0 723.4 230395.0 13 Processed food 819.7 5135.4 94.8 6050.0
14 Tobacco products 263.4 2859.1 7.2 3129.7
15 Beverages 111.3 920.4 6.0 1037.8
16 Travel related consumer goods 65646.0 32056.4 419.6 98122.0
17 Footwear 353.6 2732.1 89.0 3174.7
18 Soaps, cosmetics and glycerine 70.7 190.2 0.0 260.9
19 Gems and jewellery 257.1 15098.4 0.0 15355.5
20 Books, journals, magazines, stationery etc. 146.7 99.5 0.0 246.2
A.3 Other imputed connected products 0.0 91340.7 0.0 91340.7
21 Vacation homes (assumed to be 1% of urban owner occupied dwelling services) 0.0 1978.6 0.0 1978.6
22 Social transfers in kind (50% of GFCE of tourism and cultural services) 0.0 2374.7 0.0 2374.7
23 FISIM (calculated from the share of FISIM in PFCE) 0.0 19973.7 0.0 19973.7
24 Producers' guest houses (.5% of private organised sector share in output) 0.0 35835.0 0.0 35835.0
25 Imputed expenditures of households on food for tourists staying with them 0.0 31178.7 0.0 31178.7
Total 307421.8 480892.1 3108.7 791422.6
Source: NCAER Computation

Region al Tourism Satellite Account– Chhattishgarh, 2009-10
|95| National Council of Applied Economic Research
TSA TABLE 5: PRODUCTION ACCOUNT OF TOURISM INDUSTRIES AND OTHER INDUSTRIES, CHHATTISGARH 2009-10
Supply table at basic prices 25 X 25 product X industry, 2009-10 (Rs. lakh)
S. No. Industry
Industry as per the Serial No. given in first column
1 2 3 4 5
1 Agriculture 2635880.3 8526.6 0.0 0.0 0.0
2 Mining, other manufacturing, construction, electricity, gas and water supply
7726.7 12007043.9 0.0 0.0 0.0
3 Trade 2515.1 131098.4 824064.7 0.0 0.0
4 Transport freight services 0.0 0.0 0.0 597953.5 0.0
5 All non-tourism specific services 0.0 898.2 0.0 0.0 2510976.0
6 Processed food products 15844.1 17224.9 0.0 0.0 0.0
7 Beverages 326.1 5211.3 0.0 0.0 0.0
8 Tobacco products 0.3 0.0 0.0 0.0 0.0
9 Readymade garments 0.0 56189.2 0.0 0.0 0.0
10 Printing and publishing 0.0 9029.2 0.0 0.0 0.0
11 Leather footwear 0.0 4210.8 0.0 0.0 0.0
12 Travel related consumer goods 0.0 15269.0 0.0 0.0 0.0
13 Soaps and cosmetics 0.0 10185.2 0.0 0.0 0.0
14 Gems and jewellary 0.0 5853.0 0.0 0.0 0.0
15 Railway passenger transport services 0.0 0.0 0.0 0.0 0.0
16 Land passenger transport including via pipeline 0.0 0.0 0.0 24356.7 0.0
17 Water passenger transport 0.0 0.0 0.0 0.0 0.0
18 Air passenger transport 0.0 0.0 0.0 0.0 0.0
19 Tourism related supporting and auxiliary transport activities 0.0 0.0 0.0 0.0 0.0
20 Hotels 0.0 0.0 0.0 0.0 0.0
21 Restaurants 0.0 0.0 0.0 0.0 0.0
22 Medical and health 0.0 0.0 0.0 0.0 0.0
23 Renting of transport equipment 0.0 212.2 0.0 0.0 0.0
24 Cultural and religious services 0.0 0.0 0.0 0.0 0.0
25 Sporting and recreational services 0.0 238.1 0.0 0.0 0.0
Total domestic output at basic prices 2662293 12271190 824065 622310 2510976
Source: NCAER Computation

Region al Tourism Satellite Account– Chhattishgarh, 2009-10
|96| National Council of Applied Economic Research
TSA TABLE 5: PRODUCTION ACCOUNT OF TOURISM INDUSTRIES AND OTHER INDUSTRIES, CHHATTISGARH 2009-10 (Contd.)
Supply table at basic prices 25 X 25 product X industry, 2009-10 (Rs. lakh)
S. No. Industry
Industry as per the Serial No. given in first column
6 7 8 9 10 11
1 Agriculture 195814.1 0.1 0.0 0.0 0.0 0.0
2 Mining, other manufacturing, construction, electricity, gas and water supply
12538.5 2594.8 39.7 1320.3 5359.9 3196.0
3 Trade 614.1 459.1 65.5 0.0 292.6 408.6
4 Transport freight services 0.0 0.0 0.0 0.0 0.0 0.0
5 All non-tourism specific services 6.1 115.4 0.5 0.0 0.4 0.0
6 Processed food products 230727.2 1149.0 507.2 0.0 0.0 0.0
7 Beverages 479.9 45861.1 0.0 0.0 0.0 0.0
8 Tobacco products 0.0 0.0 22833.7 0.0 0.0 0.0
9 Readymade garments 0.0 0.0 0.0 36720.8 0.0 3.4
10 Printing and publishing 0.0 0.0 0.0 0.0 22444.5 0.0
11 Leather footwear 0.0 0.0 0.0 0.0 0.0 2964.9
12 Travel related consumer goods 6.3 0.0 0.2 218.0 16.2 467.3
13 Soaps and cosmetics 116.3 21.7 70.8 0.0 0.0 0.0
14 Gems and jewellary 0.0 0.0 0.0 0.0 0.0 0.0
15 Railway passenger transport services 0.0 0.0 0.0 0.0 0.0 0.0
16 Land passenger transport including via pipeline 0.0 0.0 0.0 0.0 0.0 0.0
17 Water passenger transport 0.0 0.0 0.0 0.0 0.0 0.0
18 Air passenger transport 0.0 0.0 0.0 0.0 0.0 0.0
19 Tourism related supporting and auxiliary transport activities 0.0 0.0 0.0 0.0 0.0 0.0
20 Hotels 0.0 0.0 0.0 0.0 0.0 0.0
21 Restaurants 0.0 0.0 0.0 0.0 0.0 0.0
22 Medical and health 0.0 0.0 0.0 0.0 0.0 0.0
23 Renting of transport equipment 1.5 28.7 0.1 0.0 0.0 0.0
24 Cultural and religious services 0.0 0.0 0.0 0.0 0.0 0.0
25 Sporting and recreational services 0.0 0.0 0.0 0.0 2.2 0.0
Total domestic output at basic prices 440304 50230 23518 38259 28116 7040
Source: NCAER Computation

Region al Tourism Satellite Account– Chhattishgarh, 2009-10
|97| National Council of Applied Economic Research
TSA TABLE 5: PRODUCTION ACCOUNT OF TOURISM INDUSTRIES AND OTHER INDUSTRIES, CHHATTISGARH 2009-10 (Contd.)
Supply table at basic prices 25 X 25 product X industry, 2009-10 (Rs. lakh)
S. No. Industry
Industry as per the Serial No. given in first column
12 13 14 15 16 17
1 Agriculture 0.0 0.0 0.0 0.0 0.0 0.0
2 Mining, other manufacturing, construction, electricity, gas and water supply
3365.6 995.1 4790.3 0.0 0.0 0.0
3 Trade 64.0 124.9 6829.5 0.0 0.0 0.0
4 Transport freight services 0.0 0.0 0.0 0.0 22769.4 0.0
5 All non-tourism specific services 0.1 0.1 0.0 0.0 0.0 0.0
6 Processed food products 0.0 0.0 0.0 0.0 0.0 0.0
7 Beverages 0.0 0.0 0.0 0.0 0.0 0.0
8 Tobacco products 0.0 0.0 0.0 0.0 0.0 0.0
9 Readymade garments 5.5 0.4 0.0 0.0 0.0 0.0
10 Printing and publishing 1.6 0.0 0.0 0.0 0.0 0.0
11 Leather footwear 341.6 0.0 0.0 0.0 0.0 0.0
12 Travel related consumer goods 1016.5 0.2 8.2 0.0 0.0 0.0
13 Soaps and cosmetics 3.5 7840.8 26.3 0.0 0.0 0.0
14 Gems and jewellary 1.5 1.5 648121.3 0.0 0.0 0.0
15 Railway passenger transport services 0.0 0.0 0.0 72334.3 0.0 0.0
16 Land passenger transport including via pipeline 0.0 0.0 0.0 0.0 415945.3 0.0
17 Water passenger transport 0.0 0.0 0.0 0.0 0.0 1.0
18 Air passenger transport 0.0 0.0 0.0 0.0 0.0 0.0
19 Tourism related supporting and auxiliary transport activities 0.0 0.0 0.0 0.0 0.0 0.0
20 Hotels 0.0 0.0 0.0 0.0 0.0 0.0
21 Restaurants 0.0 0.0 0.0 0.0 0.0 0.0
22 Medical and health 0.0 0.0 0.0 0.0 0.0 0.0
23 Renting of transport equipment 0.0 0.0 0.0 0.0 0.0 0.0
24 Cultural and religious services 0.0 0.0 0.0 0.0 0.0 0.0
25 Sporting and recreational services 0.4 0.0 0.0 0.0 0.0 0.0
Total domestic output at basic prices 4800.3 8962.9 659775.6 72334.3 438714.7 1.0
Source: NCAER Computation

Region al Tourism Satellite Account– Chhattishgarh, 2009-10
|98| National Council of Applied Economic Research
TSA TABLE 5: PRODUCTION ACCOUNT OF TOURISM INDUSTRIES AND OTHER INDUSTRIES, CHHATTISGARH 2009-10 (Contd.)
Supply table at basic prices 25 X 25 product X industry, 2009-10 (Rs. lakh)
S. No. Industry
Industry as per the Serial No. given in first column
18 19 20 21 22 23
1 Agriculture 0.0 0.0 0.0 0.0 0.0 0.0
2 Mining, other manufacturing, construction, electricity, gas and water supply
0.0 0.0 0.0 0.0 0.0 0.0
3 Trade 0.0 0.0 0.0 0.0 0.0 0.0
4 Transport freight services 0.0 0.0 0.0 0.0 0.0 0.0
5 All non-tourism specific services 0.0 0.0 0.0 0.0 0.0 0.0
6 Processed food products 0.0 0.0 0.0 0.0 0.0 0.0
7 Beverages 0.0 0.0 0.0 0.0 0.0 0.0
8 Tobacco products 0.0 0.0 0.0 0.0 0.0 0.0
9 Readymade garments 0.0 0.0 0.0 0.0 0.0 0.0
10 Printing and publishing 0.0 0.0 0.0 0.0 0.0 0.0
11 Leather footwear 0.0 0.0 0.0 0.0 0.0 0.0
12 Travel related consumer goods 0.0 0.0 0.0 0.0 0.0 0.0
13 Soaps and cosmetics 0.0 0.0 0.0 0.0 0.0 0.0
14 Gems and jewellary 0.0 0.0 0.0 0.0 0.0 0.0
15 Railway passenger transport services 0.0 0.0 0.0 0.0 0.0 0.0
16 Land passenger transport including via pipeline 0.0 0.0 0.0 0.0 0.0 0.0
17 Water passenger transport 0.0 0.0 0.0 0.0 0.0 0.0
18 Air passenger transport 2037.3 0.0 0.0 0.0 0.0 0.0
19 Tourism related supporting and auxiliary transport activities 0.0 3723.2 0.0 0.0 0.0 0.0
20 Hotels 0.0 0.0 71825.1 1789.0 0.0 0.0
21 Restaurants 0.0 0.0 28070.2 316271.8 0.0 0.0
22 Medical and health 0.0 0.0 0.0 0.0 312687.7 0.0
23 Renting of transport equipment 0.0 0.0 0.0 0.0 0.0 3035.9
24 Cultural and religious services 0.0 0.0 0.0 0.0 0.0 0.0
25 Sporting and recreational services 0.0 0.0 0.0 0.0 0.0 0.0
Total domestic output at basic prices 2037.3 3723.2 99895.2 318060.7 312687.7 3035.9
Source: NCAER Computation

Region al Tourism Satellite Account– Chhattishgarh, 2009-10
|99| National Council of Applied Economic Research
TSA TABLE 5: PRODUCTION ACCOUNT OF TOURISM INDUSTRIES AND OTHER INDUSTRIES, CHHATTISGARH 2009-10 (Contd.)
Supply table at basic prices 25 X 25 product X industry, 2009-10 (Rs. lakh)
S. No. Industry
Industry as per the Serial No. given in
first column
Total domestic output at
basic prices
TTM
24 25
1 Agriculture 0.0 0.0 2840221.2 434623.3
2 Mining, other manufacturing, construction, electricity, gas and water supply
0.0 0.0 12048970.9 1090476.8
3 Trade 0.0 0.0 966536.5 -966536.5
4 Transport freight services 0.0 0.0 620722.9 -623374.9
5 All non-tourism specific services 0.0 0.0 2511996.8 0.0
6 Processed food products 0.0 0.0 265452.4 25404.6
7 Beverages 0.0 0.0 51878.4 2790.4
8 Tobacco products 0.0 0.0 22834.0 3427.8
9 Readymade garments 0.0 0.0 92919.3 4093.7
10 Printing and publishing 0.0 0.0 31475.3 3920.3
11 Leather footwear 0.0 0.0 7517.2 3131.2
12 Travel related consumer goods 0.0 0.0 17002.0 3109.8
13 Soaps and cosmetics 0.0 0.0 18264.6 546.7
14 Gems and jewellary 0.0 0.0 653977.3 18386.8
15 Railway passenger transport services 0.0 0.0 72334.3 0.0
16 Land passenger transport including via pipeline 0.0 0.0 440302.0 0.0
17 Water passenger transport 0.0 0.0 1.0 0.0
18 Air passenger transport 0.0 0.0 2037.3 0.0
19 Tourism related supporting and auxiliary transport activities 0.0 0.0 3723.2 0.0
20 Hotels 0.0 0.0 73614.0 0.0
21 Restaurants 0.0 0.0 344342.0 0.0
22 Medical and health 0.0 0.0 312687.7 0.0
23 Renting of transport equipment 0.0 0.0 3278.4 0.0
24 Cultural and religious services 23576.0 0.0 23576.0 0.0
25 Sporting and recreational services 0.0 116795.0 117035.7 0.0
Total domestic output at basic prices 23576.0 116795.0 21542700.5 0.0
Source: NCAER Computation

Region al Tourism Satellite Account– Chhattishgarh, 2009-10
|100| National Council of Applied Economic Research
TSA TABLE 5: PRODUCTION ACCOUNT OF TOURISM INDUSTRIES AND OTHER INDUSTRIES, CHHATTISGARH 2009-10 (Contd.)
Supply table at basic prices 25 X 25 product X industry, 2009-10 (Rs. lakh)
S. No. Industry Taxes Subsidies NIT
Total Supply at
purchasers' prices
1 Agriculture 12853.0 230758.7 -217905.7 3056938.8
2 Mining, other manufacturing, construction, electricity, gas and water supply
903039.1 211400.7 691638.4 13831086.1
3 Trade 0.0 0.0 0.0 0.0
4 Transport freight services 4216.9 1564.9 2652.0 0.0
5 All non-tourism specific services 43197.9 7562.8 35635.1 2547631.9
6 Processed food products 4731.6 1213.9 3517.7 294374.8
7 Beverages 12710.8 0.0 12710.9 67379.6
8 Tobacco products 8339.8 0.0 8339.8 34601.6
9 Readymade garments 1342.1 64.5 1277.7 98290.7
10 Printing and publishing 298.9 75.7 223.2 35618.8
11 Leather footwear 99.9 0.0 99.9 10748.3
12 Travel related consumer goods 574.6 201.3 373.3 20485.1
13 Soaps and cosmetics 2329.9 34.6 2295.2 21106.5
14 Gems and jewellary 4863.6 0.0 4863.6 677227.7
15 Railway passenger transport services 76.9 0.0 76.9 72411.2
16 Land passenger transport including via pipeline 1998.7 1364.1 634.6 440936.6
17 Water passenger transport 0.1 0.0 0.1 1.1
18 Air passenger transport 21.9 53.8 -32.0 2005.3
19 Tourism related supporting and auxiliary transport activities 114.7 0.0 114.7 3837.9
20 Hotels 62.0 31.5 30.5 73644.6
21 Restaurants 185.0 93.9 91.1 344433.1
22 Medical and health 0.0 0.0 0.0 312687.7
23 Renting of transport equipment 38.8 0.0 38.8 3317.2
24 Cultural and religious services 88.1 165.9 -77.7 23498.3
25 Sporting and recreational services 12682.4 21083.0 -8400.6 108635.0
Total domestic output at basic prices 1013866.6 475669.3 538197.4 22080897.9
Source: NCAER Computation

Region al Tourism Satellite Account– Chhattishgarh, 2009-10
|101| National Council of Applied Economic Research
TSA TABLE 5: PRODUCTION ACCOUNT OF TOURISM INDUSTRIES AND OTHER INDUSTRIES, CHHATTISGARH 2009-10
Use table at purchasers' prices 25 X 25 product X industry, 2009-10 (Rs. lakh)
S. No. Industry
Industry as per the Serial No. given in first column 1 2 3 4 5
1 Agriculture 390550.2 628722.1 0.0 14225.1 2797.0
2 Mining, other manufacturing, construction, electricity, gas and water supply
204437.6 6838128.7 46779.3 296102.6 153187.4
3 Trade 0.0 0.0 0.0 0.0 0.0 4 Transport freight services 0.0 0.0 0.0 0.0 0.0 5 All non-tourism specific services 29704.2 437644.9 49938.2 34236.7 144708.3 6 Processed food products 6558.7 49613.8 0.0 30.1 236.7 7 Beverages 0.0 4759.5 0.0 3.7 211.0 8 Tobacco products 0.0 19.9 0.0 0.0 0.0 9 Readymade garments 72.6 21051.9 60.4 316.4 1176.3
10 Printing and publishing 374.0 1731.3 2480.5 1177.8 1803.0 11 Leather footwear 0.0 622.0 0.0 208.0 0.0 12 Travel related consumer goods 18.6 4602.8 42.0 127.0 159.2 13 Soaps and cosmetics 0.0 4487.7 0.0 13.5 15.0 14 Gems and jewellary 0.0 1851.0 0.0 0.0 0.0
15 Railway passenger transport services 330.0 7707.4 79.6 343.7 2237.6
16 Land passenger transport including via pipeline 8382.2 49318.2 23615.0 4926.9 12981.0
17 Water passenger transport 4.9 14.9 0.4 0.4 0.0 18 Air passenger transport 123.4 21159.2 75.5 188.5 2845.9
19 Tourism related supporting and auxiliary transport activities 0.0 348.2 0.0 70.6 0.0
20 Hotels 1072.9 1716.6 3447.6 13741.1 9836.6 21 Restaurants 3154.3 5046.7 10135.6 40397.3 28918.5 22 Medical and health 0.0 0.0 0.0 920.3 6884.8 23 Renting of transport equipment 19.6 737.7 0.4 198.8 93.4 24 Cultural and religious services 13.6 4235.6 8.6 113.7 865.0
25 Sporting and recreational services 1762.4 17804.2 6.7 295.1 916.5
IC-PP 646579.2 8101324.5 136669.9 407637.2 369873.4 GVA-basic prices 2015713.4 4169865.4 687394.9 214673.0 2141102.6 CoE 304674.8 1670796.1 105476.1 77577.6 868222.8 OS/MI 1553104.4 1613394.4 560495.2 110319.9 1039285.8 CFC 140619.9 795438.4 17667.6 23923.9 191183.5 Net taxes on production 17602.6 93135.2 3865.9 2913.8 43394.8 GO-basic prices 2662292.6 12271190.0 824064.7 622310.2 2510976.0 Employment (lakh) 97.3 23.1 5.1 0.9 6.6
Source: NCAER Computation

Region al Tourism Satellite Account– Chhattishgarh, 2009-10
|102| National Council of Applied Economic Research
TSA TABLE 5: PRODUCTION ACCOUNT OF TOURISM INDUSTRIES AND OTHER INDUSTRIES, CHHATTISGARH 2009-10 (Contd.)
Use table at purchasers' prices 25 X 25 product X industry, 2009-10 (Rs. lakh)
S. No. Industry
Industry as per the Serial No. given in first column
6 7 8 9 10
1 Agriculture 342137.5 12351.2 3903.6 206.8 16.1
2 Mining, other manufacturing, construction, electricity, gas and water supply
36803.4 13360.3 2069.6 28781.6 19754.2
3 Trade 0.0 0.0 0.0 0.0 0.0 4 Transport freight services 0.0 0.0 0.0 0.0 0.0 5 All non-tourism specific services 8420.2 1129.2 884.6 3864.3 1439.1 6 Processed food products 16296.0 13184.6 1702.8 34.0 143.1 7 Beverages 83.9 3816.2 0.0 0.0 0.1 8 Tobacco products 0.0 0.0 5318.3 0.0 0.0 9 Readymade garments 22.9 0.0 0.0 1706.3 51.9
10 Printing and publishing 3.7 0.8 1.8 2.5 1039.4 11 Leather footwear 0.0 0.0 0.0 0.0 0.0 12 Travel related consumer goods 7.0 8.4 0.5 78.4 14.8 13 Soaps and cosmetics 5.1 39.6 207.1 183.5 32.9 14 Gems and jewellary 0.0 0.0 0.0 0.0 0.0
15 Railway passenger transport services 114.0 11.1 97.6 94.1 29.4
16 Land passenger transport including via pipeline 559.4 68.0 241.5 223.2 203.1
17 Water passenger transport 0.1 0.0 0.0 0.0 0.0 18 Air passenger transport 32.6 20.7 58.0 23.7 51.9
19 Tourism related supporting and auxiliary transport activities 0.0 0.0 0.0 0.0 0.0
20 Hotels 3.2 0.0 0.0 0.0 0.0 21 Restaurants 9.3 0.0 0.0 0.0 0.0 22 Medical and health 0.0 0.0 0.0 0.0 0.0 23 Renting of transport equipment 0.6 0.2 0.6 0.2 0.5 24 Cultural and religious services 14.1 0.0 1.4 102.3 25.1 25 Sporting and recreational services 31.8 10.9 249.7 157.4 24.8
IC-PP 404544.8 44001.2 14737.1 35458.3 22826.4 GVA-basic prices 35759.5 6228.7 8780.7 2800.9 5289.5 CoE 10659.4 358.1 1627.6 662.4 857.8 OS/MI 15552.0 4211.1 5294.5 1420.6 3173.2 CFC 8571.3 1489.4 1618.8 641.4 1114.0 Net taxes on production 994.0 173.1 244.1 77.9 147.0 GO-basic prices 440304.2 50229.8 23517.8 38259.2 28115.9 Employment (lakh) 0.6 0.2 0.3 0.9 0.0
Source: NCAER Computation

Region al Tourism Satellite Account– Chhattishgarh, 2009-10
|103| National Council of Applied Economic Research
TSA TABLE 5: PRODUCTION ACCOUNT OF TOURISM INDUSTRIES AND OTHER INDUSTRIES, CHHATTISGARH 2009-10 (Contd.)
Use table at purchasers' prices 25 X 25 product X industry, 2009-10 (Rs. lakh) S.
No. Industry Industry as per the Serial No. given in first column
11 12 13 14 15 1 Agriculture 337.3 300.2 283.2 0.0 0.5
2 Mining, other manufacturing, construction, electricity, gas and water supply
4050.1 1533.3 5401.8 246375.9 24908.3
3 Trade 0.0 0.0 0.0 0.0 0.0
4 Transport freight services 0.0 0.0 0.0 0.0 0.0
5 All non-tourism specific services 472.3 98.5 615.7 73734.5 1816.9
6 Processed food products 131.3 27.9 362.4 0.0 0.0
7 Beverages 0.0 0.6 22.4 0.0 0.0
8 Tobacco products 0.0 0.0 0.0 0.0 0.0
9 Readymade garments 59.8 8.4 0.0 0.0 0.6
10 Printing and publishing 0.2 0.0 3.6 0.0 17.0
11 Leather footwear 30.6 1.0 0.0 0.0 0.0
12 Travel related consumer goods 277.7 329.8 1.0 568.9 16.7
13 Soaps and cosmetics 0.0 1.0 1029.9 0.2 0.0
14 Gems and jewellary 0.3 3.8 0.0 170984.3 0.0
15 Railway passenger transport services 33.7 0.9 10.4 2546.9 30.5
16 Land passenger transport including via pipeline
67.0 11.0 78.8 25576.3 122.7
17 Water passenger transport 0.0 0.0 0.0 473.1 0.0
18 Air passenger transport 6.6 3.5 43.5 5380.0 5.3
19 Tourism related supporting and auxiliary transport activities
0.0 0.0 0.0 0.0 0.0
20 Hotels 0.0 0.0 0.0 0.0 27.1
21 Restaurants 0.0 0.0 0.0 0.0 79.8
22 Medical and health 0.0 0.0 0.0 0.0 899.9
23 Renting of transport equipment 0.2 0.0 0.1 50.7 133.7
24 Cultural and religious services 0.1 0.9 5.3 1139.9 0.0
25 Sporting and recreational services 38.2 13.0 27.9 719.1 12.7
IC-PP 5505.4 2333.8 7885.9 527549.6 28071.8
GVA-basic prices 1534.8 2466.6 1077.0 132226.0 44262.5
CoE 181.7 264.5 45.6 33939.2 30794.8
OS/MI 985.8 1614.7 750.4 75291.3 3862.3
CFC 325.5 543.6 251.5 19383.6 8318.0
Net taxes on production 42.7 44.5 29.9 3675.5 1287.4 GO-basic prices 7040.2 4800.3 8962.9 659775.6 72334.3
Employment (lakh) 0.1 0.0 0.0 0.0 0.0
Source: NCAER Computation

Region al Tourism Satellite Account– Chhattishgarh, 2009-10
|104| National Council of Applied Economic Research
TSA TABLE 5: PRODUCTION ACCOUNT OF TOURISM INDUSTRIES AND OTHER INDUSTRIES, CHHATTISGARH 2009-10 (Contd.)
Use table at purchasers' prices 25 X 25 product X industry, 2009-10 (Rs. lakh)
S. No. Industry
Industry as per the Serial No. given in first column
16 17 18 19 20
1 Agriculture 68315.8 0.0 0.0 0.0 48722.1
2 Mining, other manufacturing, construction, electricity, gas and water supply
137607.9 0.3 885.8 538.2 9823.0
3 Trade 0.0 0.0 0.0 0.0 0.0 4 Transport freight services 0.0 0.0 0.0 0.0 0.0 5 All non-tourism specific services 8562.2 0.0 128.3 387.4 804.8 6 Processed food products 84.7 0.0 0.0 0.0 4582.0 7 Beverages 0.0 0.0 0.0 0.0 1145.3 8 Tobacco products 0.0 0.0 0.0 0.0 0.2 9 Readymade garments 1.9 0.0 18.2 0.2 454.6
10 Printing and publishing 232.4 0.0 0.8 39.9 14.5 11 Leather footwear 1.8 0.0 0.0 0.0 0.0 12 Travel related consumer goods 14.9 0.0 3.5 0.6 0.7 13 Soaps and cosmetics 0.0 0.0 14.4 0.0 92.6 14 Gems and jewellary 0.0 0.0 0.0 0.0 0.0
15 Railway passenger transport services 8.3 0.0 0.2 14.7 8.0
16 Land passenger transport including via pipeline 45.3 0.0 67.5 311.5 58.0
17 Water passenger transport 0.0 0.0 0.0 0.0 0.0 18 Air passenger transport 10.5 0.0 0.4 0.9 22.8
19 Tourism related supporting and auxiliary transport activities 0.0 0.0 0.0 5.9 0.0
20 Hotels 6702.4 0.0 7.2 117.5 240.4 21 Restaurants 19704.4 0.0 21.2 345.5 706.7 22 Medical and health 0.0 0.0 0.0 0.0 0.0 23 Renting of transport equipment 69.5 0.0 1.1 0.1 0.1 24 Cultural and religious services 33.8 0.0 0.0 4.3 3.9 25 Sporting and recreational services 141.7 0.0 1.1 1.3 12.5
IC-PP 241537.6 0.4 1149.9 1767.9 66692.1 GVA-basic prices 197177.1 0.6 887.4 1955.3 33203.1 CoE 37238.6 0.1 660.4 1415.3 9130.9 OS/MI 141792.0 0.5 122.2 310.9 21066.6 CFC 17042.8 0.1 98.5 215.4 2751.6 Net taxes on production 1150.2 0.0 6.5 14.4 256.2 GO-basic prices 438714.7 1.0 2037.3 3723.2 99895.2 Employment (lakh) 0.8 0.0 0.0 0.1 0.1
Source: NCAER Computation

Region al Tourism Satellite Account– Chhattishgarh, 2009-10
|105| National Council of Applied Economic Research
TSA TABLE 5: PRODUCTION ACCOUNT OF TOURISM INDUSTRIES AND OTHER INDUSTRIES, CHHATTISGARH 2009-10 (Contd.)
Use table at purchasers' prices 25 X 25 product X industry, 2009-10 (Rs. lakh) S.
No. Industry Industry as per the Serial No. given in first column 21 22 23 24 25
1 Agriculture 164078.6 9177.2 0.0 0.0 297.3
2 Mining, other manufacturing, construction, electricity, gas and water supply
23339.1 78683.3 129.8 1474.7 18578.4
3 Trade 0.0 0.0 0.0 0.0 0.0 4 Transport freight services 0.0 0.0 0.0 0.0 0.0 5 All non-tourism specific services 1278.6 5532.2 218.5 1543.8 22395.9 6 Processed food products 15430.5 0.0 0.0 0.0 12.7 7 Beverages 3857.0 0.0 0.0 0.0 0.2 8 Tobacco products 0.7 0.0 0.0 0.0 0.0 9 Readymade garments 943.1 1849.1 0.0 0.0 36.8
10 Printing and publishing 20.3 317.3 0.0 6.3 60.1 11 Leather footwear 0.0 0.0 0.0 0.0 0.0 12 Travel related consumer goods 2.2 7.2 0.0 9.7 20.9 13 Soaps and cosmetics 64.6 0.0 0.0 0.0 57.0 14 Gems and jewellary 0.0 0.0 0.0 0.0 0.0
15 Railway passenger transport services 7.6 161.3 0.0 2.4 43.8
16 Land passenger transport including via pipeline 54.9 2084.5 11.2 3.1 57.4
17 Water passenger transport 0.0 0.0 0.0 0.0 0.0 18 Air passenger transport 21.6 26.3 0.2 5.0 15.8
19 Tourism related supporting and auxiliary transport activities 0.0 0.0 0.0 0.0 0.0
20 Hotels 809.5 5513.5 13.0 30.2 24.2 21 Restaurants 2379.9 16209.2 38.3 88.8 71.3 22 Medical and health 0.0 0.0 0.0 0.0 0.0 23 Renting of transport equipment 0.2 0.3 0.6 0.3 499.0 24 Cultural and religious services 13.2 44.1 2.0 43.4 788.2 25 Sporting and recreational services 42.2 114.9 0.0 11.5 11150.9
IC-PP 212343.8 119720.5 413.7 3219.1 54110.0 GVA-basic prices 105716.9 192967.3 2622.2 20356.9 62685.0 CoE 29072.3 112613.7 407.6 11880.1 33866.9 OS/MI 65737.2 69692.6 1533.3 7371.0 8211.1 CFC 8761.1 8918.5 612.5 940.9 19991.1 Net taxes on production 2165.1 2218.1 68.8 210.1 784.0 GO-basic prices 318060.7 312687.7 3035.9 23576.0 116795.0 Employment (lakh) 0.3 0.7 0.0 0.2 0.0
Source: NCAER Computation

Region al Tourism Satellite Account– Chhattishgarh, 2009-10
|106| National Council of Applied Economic Research
TSA TABLE 5: PRODUCTION ACCOUNT OF TOURISM INDUSTRIES AND OTHER INDUSTRIES, CHHATTISGARH 2009-10 (Contd.)
Use table at purchasers' prices 25 X 25 product X industry, 2009-10 (Rs. lakh)
S. No. Industry IC FD output
1 Agriculture 1686421.7 1370517.1 3056938.8
2 Mining, other manufacturing, construction, electricity, gas and water supply 8192734.4 5638351.7 13831086.1
3 Trade 0.0 0.0 0.0 4 Transport freight services 0.0 0.0 0.0 5 All non-tourism specific services 829559.2 1718072.7 2547631.9 6 Processed food products 108431.3 185943.5 294374.8 7 Beverages 13899.9 53479.7 67379.6 8 Tobacco products 5339.1 29262.5 34601.6 9 Readymade garments 27831.4 70459.3 98290.7
10 Printing and publishing 9327.0 26291.9 35618.8 11 Leather footwear 863.5 9884.9 10748.3 12 Travel related consumer goods 6312.5 14172.5 20485.1 13 Soaps and cosmetics 6244.1 14862.4 57959.5 14 Gems and jewellary 172839.5 504388.2 677227.7 15 Railway passenger transport services 13913.7 58497.5 72411.2 16 Land passenger transport including via pipeline 129067.8 311868.8 440936.6 17 Water passenger transport 493.9 -492.8 1.1 18 Air passenger transport 30121.9 -28116.6 2005.3
19 Tourism related supporting and auxiliary transport activities 424.7 3413.2 3837.9
20 Hotels 43303.2 30341.3 73644.6 21 Restaurants 127306.8 217126.3 344433.1 22 Medical and health 8705.0 303982.7 312687.7 23 Renting of transport equipment 1807.8 1509.4 3317.2 24 Cultural and religious services 7458.4 16039.8 23498.3 25 Sporting and recreational services 33546.6 75088.4 108635.0
IC-PP 11455953.3 10624944.5 22080897.9 GVA-basic prices 10086747.2 0.0 0.0 CoE 3342424.0 0.0 0.0 OS/MI 5304592.9 0.0 0.0 CFC 1270422.8 0.0 0.0 Net taxes on production 174501.8 0.0 0.0 GO-basic prices 21542700.5 0.0 0.0 Employment (lakh) 137.4 0.0 0.0
Source: NCAER Computation

Region al Tourism Satellite Account– Chhattishgarh, 2009-10
|107| National Council of Applied Economic Research
TSA TABLE 6: TOURISM DIRECT OUTPUT AND VALUE ADDED AT BASIC PRICES – CHHATTISGARH, 2009-10
S. No. Industries
Gro
ss O
utpu
t at
basi
c pr
ices
Inte
r-m
edia
te
Cons
umpt
ion
Gro
ss V
alue
A
dded
at
basi
c pr
ices
Tour
ism
ra
tios
TD
GVA
1 Agriculture 2662292.6 646579.2 2015713.4 0.0 0.0
2 Mining, other manufacturing, construction, electricity, gas and water supply
12271190.0 8101324.5 4169865.4 0.0 30.9
3 Trade 824064.7 136669.9 687394.9 0.7 4569.6
4 Transport freight services 622310.2 407637.2 214673.0 2.2 4822.8
5 All non-tourism specific services 2510976.0 369873.4 2141102.6 2.3 49030.4
6 Processed food products 440304.2 404544.8 35759.5 0.0 0.0
7 Beverages 50229.8 44001.2 6228.7 0.0 1.4
8 Tobacco products 23517.8 14737.1 8780.7 0.0 0.0
9 Readymade garments 38259.2 35458.3 2800.9 0.0 0.0
10 Printing and publishing 28115.9 22826.4 5289.5 0.0 0.0
11 Leather footwear 7040.2 5505.4 1534.8 0.0 0.0
12 Travel related consumer goods 4800.3 2333.8 2466.6 0.0 0.0
13 Soaps and cosmetics 8962.9 7885.9 1077.0 0.0 0.0
14 Gems and jewellery 659775.6 527549.6 132226.0 0.0 0.0
15 Railway passenger transport Services 72334.3 28071.8 44262.5 46.4 20522.4
16 Land passenger transport including via pipeline 438714.7 241537.6 197177.1 60.0 118215.0
17 Water passenger transport 1.0 0.4 0.6 0.2 0.0
18 Air passenger transport 2037.3 1149.9 887.4 77.2 685.1
19 Tourism related supporting and Auxiliary transport activities 3723.2 1767.9 1955.3 59.4 1160.7
20 Hotels 99895.2 66692.1 33203.1 6.9 2302.3
21 Restaurants 318060.7 212343.8 105716.9 2.2 2348.7
22 Medical and health 312687.7 119720.5 192967.3 17.8 34362.7
23 Renting of transport equipment 3035.9 413.7 2622.2 23.6 619.9
24 Cultural and religious services 23576.0 3219.1 20356.9 0.1 18.8
25 Sporting and recreational services 116795.0 54110.0 62685.0 0.0 13.1
Total 21542700.5 11455953.3 10086747.2 0.0 238703.9 Share in State aggregate 0.0 0.0 0.0 0.0 2.37
Source: NCAER Computation based on NSSO 66th Round survey on “Employment Unemployment”

Region al Tourism Satellite Account– Chhattishgarh, 2009-10
|108| National Council of Applied Economic Research
TSA TABLE 7A: NUMBER OF WORKERS IN TOURISM INDUSTRIES BY FORMAL/INFORMAL AND BY GENDER – CHHATTISGARH, RURAL – 2009-10
S. No. Industries
Number of Workers Number of Workers
Formal Informal
Male Female Total Male Female Total
Tourism characteristic industries 13227.2 9193.4 22420.5 67782.4 5032.8 72815.1
1 Accommodation services/Hotels 4160.2 1303.4 5463.6 204.6 0.0 204.6
2 Food and beverage serving services/Restaurants 0.0 0.0 0.0 13399.1 885.6 14284.7
3 Railway passenger transport services 0.0 0.0 0.0 0.0 0.0 0.0
4 Land passenger transport services 1285.2 0.0 1285.2 37163.7 0.0 37163.7
5 Water passenger transport services 0.0 0.0 0.0 0.0 0.0 0.0
6 Air passenger transport services 0.0 0.0 0.0 0.0 0.0 0.0
7 Transport equipment rental services 0.0 0.0 0.0 0.0 0.0 0.0
8
Travel agencies and other reservation services/ Supporting and auxiliary passenger transport activities
0.0 0.0 0.0 589.1 0.0 589.1
9 Cultural and religious services 0.0 0.0 0.0 10322.4 1475.3 11797.7
10 Sporting and other recreational services 0.0 0.0 0.0 0.0 0.0 0.0
11 Health and medical related services 7781.8 7889.9 15671.7 6103.4 2671.9 8775.3
Tourism connected industries 0.0 0.0 0.0 61970.9 1323.4 63294.3
12 Readymade garments 0.0 0.0 0.0 45007.4 521.2 45528.6
13 Processed Food 0.0 0.0 0.0 0.0 0.0 0.0
14 Tobacco products 0.0 0.0 0.0 16637.9 802.2 17440.0
15 Beverages 0.0 0.0 0.0 0.0 0.0 0.0
16 Travel related consumer goods 0.0 0.0 0.0 0.0 0.0 0.0
17 footwear 0.0 0.0 0.0 325.6 0.0 325.6
18 Soaps, cosmetics and glycerine 0.0 0.0 0.0 0.0 0.0 0.0
19 Gems and jewellery 0.0 0.0 0.0 0.0 0.0 0.0
20 Book, journals, magazines, stationery etc. 0.0 0.0 0.0 0.0 0.0 0.0
Source: NCAER Computation based on NSSO 66th Round survey on “Employment Unemployment”

Region al Tourism Satellite Account– Chhattishgarh, 2009-10
|109| National Council of Applied Economic Research
TSA TABLE 7B: NUMBER OF WORKERS IN TOURISM INDUSTRIES BY FORMAL/INFORMAL AND BY GENDER – CHHATTISGARH, URBAN – 2009-10
S. No. Industries
Number of Workers Number of Workers
Formal Informal
Male Female Total Male Female Total
Tourism characteristic industries 29969.2 6188.8 36158.0 83772.0 11215.6 94987.6
1 Accommodation services/Hotels 0.0 0.0 0.0 4130.0 175.6 4305.6
2 Food and beverage serving services/Restaurants 1843.6 0.0 1843.6 14219.7 999.8 15219.4
3 Railway passenger transport services 0.0 255.1 255.1 0.0 0.0 0.0
4 Land passenger transport services 1658.7 0.0 1658.7 38935.9 0.0 38935.9
5 Water passenger transport services 0.0 0.0 0.0 0.0 0.0 0.0
6 Air passenger transport services 0.0 0.0 0.0 0.0 0.0 0.0
7 Transport equipment rental services 0.0 0.0 0.0 0.0 0.0 0.0
8
Travel agencies and other reservation services/ Supporting and auxiliary passenger transport activities
175.6 0.0 175.6 3932.4 7989.0 11921.4
9 Cultural and religious services 0.0 0.0 0.0 5338.9 0.0 5338.9
10 Sporting and other recreational services 0.0 0.0 0.0 4578.1 0.0 4578.1
11 Health and medical related services 26291.3 5933.7 32225.0 12637.1 2051.3 14688.4
Tourism connected industries 1904.6 0.0 1904.6 99389.3 49502.2 148891.5
12 Readymade garments 0.0 0.0 0.0 7987.1 34556.7 42543.8
13 Processed Food 0.0 0.0 0.0 59741.9 0.0 59741.9
14 Tobacco products 0.0 0.0 0.0 102.2 14330.9 14433.1
15 Beverages 0.0 0.0 0.0 19226.3 0.0 19226.3
16 Travel related consumer goods 0.0 0.0 0.0 0.0 0.0 0.0
17 footwear 0.0 0.0 0.0 4435.0 614.5 5049.6
18 Soaps, cosmetics and glycerine 0.0 0.0 0.0 0 0 0
19 Gems and jewellery 0.0 0.0 0.0 4960 0 4960.198
20 Book, journals, magazines, stationery etc. 1904.6 0.0 1904.6 2937 0 2936.691
Source: NCAER Computation based on NSSO 66th Round survey on “Employment Unemployment”

Region al Tourism Satellite Account– Chhattishgarh, 2009-10
|110| National Council of Applied Economic Research
TSA TABLE 7C: NUMBER OF WORKERS IN TOURISM INDUSTRIES BY FORMAL/INFORMAL AND BY GENDER – CHHATTISGARH, TOTAL – 2009-10
S. No. Industries
Number of Workers Number of Workers
Formal Informal
Male Female Total Male Female Total
Tourism characteristic industries 43196.4 15382.1 58578.5 151554.4 16248.4 167802.7
1 Accommodation services/Hotels 4160.2 1303.4 5463.6 4334.6 175.6 4510.2
2 Food and beverage serving services/Restaurants 1843.6 0.0 1843.6 27618.8 1885.3 29504.1
3 Railway passenger transport services 0.0 255.1 255.1 0.0 0.0 0.0
4 Land passenger transport services 2943.9 0.0 2943.9 76099.6 0.0 76099.6
5 Water passenger transport services 0.0 0.0 0.0 0.0 0.0 0.0
6 Air passenger transport services 0.0 0.0 0.0 0.0 0.0 0.0
7 Transport equipment rental services 0.0 0.0 0.0 0.0 0.0 0.0
8
Travel agencies and other reservation services/ Supporting and auxiliary passenger transport activities
175.6 0.0 175.6 4521.5 7989.0 12510.5
9 Cultural and religious services 0.0 0.0 0.0 15661.3 1475.3 17136.6
10 Sporting and other recreational services 0.0 0.0 0.0 4578.1 0.0 4578.1
11 Health and medical related services 34073.1 13823.6 47896.7 18740.5 4723.2 23463.7
Tourism connected industries 1904.6 0.0 1904.6 161360.2 50825.5 212185.7
12 Readymade garments 0.0 0.0 0.0 52994.5 35077.9 88072.4
13 Processed Food 0.0 0.0 0.0 59741.9 0.0 59741.9
14 Tobacco products 0.0 0.0 0.0 16740.0 15133.1 31873.1
15 Beverages 0.0 0.0 0.0 19226.3 0.0 19226.3
16 Travel related consumer goods 0.0 0.0 0.0 0.0 0.0 0.0
17 footwear 0.0 0.0 0.0 4760.7 614.5 5375.2
18 Soaps, cosmetics and glycerine 0.0 0.0 0.0 0.0 0.0 0.0
19 Gems and jewellery 0.0 0.0 0.0 4960.2 0.0 4960.2
20 Book, journals, magazines, stationery etc. 1904.6 0.0 1904.6 2936.7 0.0 2936.7
Source: NCAER Computation based on NSSO 66th Round survey on “Employment Unemployment”

Region al Tourism Satellite Account– Chhattishgarh, 2009-10
|111| National Council of Applied Economic Research
TSA TABLE 7D: NUMBER OF JOBS IN TOURISM INDUSTRIES BY FORMAL/INFORMAL AND BY GENDER – CHHATTISGARH, RURAL – 2009-10
S. No. Industries
Number of Jobs Number of Jobs
Formal Informal
Male Female Total Male Female Total
Tourism characteristic industries 13227.2 9328.2 22555.4 68143.7 5032.8 73176.4
1 Accommodation services/Hotels 4160.2 1303.4 5463.6 204.6 0.0 204.6
2 Food and beverage serving services/Restaurants 0.0 0.0 0.0 13399.1 885.6 14284.7
3 Railway passenger transport services 0.0 0.0 0.0 0.0 0.0 0.0
4 Land passenger transport services 1285.2 0.0 1285.2 37163.7 0.0 37163.7
5 Water passenger transport services 0.0 0.0 0.0 0.0 0.0 0.0
6 Air passenger transport services 0.0 0.0 0.0 0.0 0.0 0.0
7 Transport equipment rental services 0.0 0.0 0.0 0.0 0.0 0.0
8
Travel agencies and other reservation services/ Supporting and auxiliary passenger transport activities
0.0 0.0 0.0 589.1 0.0 589.1
9 Cultural and religious services 0.0 0.0 0.0 10683.7 1475.3 12159.0
10 Sporting and other recreational services 0.0 0.0 0.0 0.0 0.0 0.0
11 Health and medical related services 7781.8 8024.8 15806.6 6103.4 2671.9 8775.3
Tourism connected industries 0.0 0.0 0.0 62301.2 1323.4 63624.6
12 Readymade garments 0.0 0.0 0.0 45337.8 521.2 45858.9
13 Processed Food 0.0 0.0 0.0 0.0 0.0 0.0
14 Tobacco products 0.0 0.0 0.0 16637.9 802.2 17440.0
15 Beverages 0.0 0.0 0.0 0.0 0.0 0.0
16 Travel related consumer goods 0.0 0.0 0.0 0.0 0.0 0.0
17 footwear 0.0 0.0 0.0 325.6 0.0 325.6
18 Soaps, cosmetics and glycerine 0.0 0.0 0.0 0.0 0.0 0.0
19 Gems and jewellery 0.0 0.0 0.0 0.0 0.0 0.0
20 Book, journals, magazines, stationery etc. 0.0 0.0 0.0 0.0 0.0 0.0
Source: NCAER Computation based on NSSO 66th Round survey on “Employment Unemployment”

Region al Tourism Satellite Account– Chhattishgarh, 2009-10
|112| National Council of Applied Economic Research
TSA TABLE 7E: NUMBER OF JOBS IN TOURISM INDUSTRIES BY FORMAL/INFORMAL AND BY GENDER – CHHATTISGARH, URBAN – 2009-10
S. No. Industries
Number of jobs Number of jobs
Formal Informal
Male Female Total Male Female Total
Tourism characteristic industries 29969.2 6188.8 36158.0 86145.1 11215.6 97360.7
1 Accommodation services/Hotels 0.0 0.0 0.0 4130.0 175.6 4305.6
2 Food and beverage serving services/Restaurants 1843.6 0.0 1843.6 14627.8 999.8 15627.6
3 Railway passenger transport services 0.0 255.1 255.1 0.0 0.0 0.0
4 Land passenger transport services 1658.7 0.0 1658.7 38935.9 0.0 38935.9
5 Water passenger transport services 0.0 0.0 0.0 0.0 0.0 0.0
6 Air passenger transport services 0.0 0.0 0.0 0.0 0.0 0.0
7 Transport equipment rental services 0.0 0.0 0.0 0.0 0.0 0.0
8
Travel agencies and other reservation services/ Supporting and auxiliary passenger transport activities
175.6 0.0 175.6 3932.4 7989.0 11921.4
9 Cultural and religious services 0.0 0.0 0.0 5338.9 0.0 5338.9
10 Sporting and other recreational services 0.0 0.0 0.0 4578.1 0.0 4578.1
11 Health and medical related services 26291.3 5933.7 32225.0 14602.1 2051.3 16653.3
Tourism connected industries 1904.6 0.0 1904.6 103646.5 49502.2 153148.6
12 Readymade garments 0.0 0.0 0.0 12113.3 34556.7 46670.0
13 Processed Food 0.0 0.0 0.0 59872.9 0.0 59872.9 14 Tobacco products 0.0 0.0 0.0 102.2 14330.9 14433.1 15 Beverages 0.0 0.0 0.0 19226.3 0.0 19226.3 16 Travel related consumer goods 0.0 0.0 0.0 0.0 0.0 0.0 17 footwear 0.0 0.0 0.0 4435.0 614.5 5049.6 18 Soaps, cosmetics and glycerine 0.0 0.0 0.0 0.0 0.0 0.0 19 Gems and jewellery 0.0 0.0 0.0 4960.2 0.0 4960.2
20 Book, journals, magazines, stationery etc. 1904.6 0.0 1904.6 2936.7 0.0 2936.7
Source: NCAER Computation based on NSSO 66th Round survey on “Employment Unemployment”

Region al Tourism Satellite Account– Chhattishgarh, 2009-10
|113| National Council of Applied Economic Research
TSA TABLE 7F: NUMBER OF JOBS IN TOURISM INDUSTRIES BY FORMAL/INFORMAL AND BY GENDER – CHHATTISGARH, TOTAL – 2009-10
S. No. Industries
Number of jobs Number of jobs
Formal Informal
Male Female Total Male Female Total
Tourism characteristic industries 43196.4 15517.0 58713.4 154288.8 16248.4 170537.1
1 Accommodation services/Hotels 4160.2 1303.4 5463.6 4334.6 175.6 4510.2
2 Food and beverage serving services/Restaurants 1843.6 0.0 1843.6 28026.9 1885.3 29912.3
3 Railway passenger transport services 0.0 255.1 255.1 0.0 0.0 0.0
4 Land passenger transport services 2943.9 0.0 2943.9 76099.6 0.0 76099.6
5 Water passenger transport services 0.0 0.0 0.0 0.0 0.0 0.0
6 Air passenger transport services 0.0 0.0 0.0 0.0 0.0 0.0
7 Transport equipment rental services 0.0 0.0 0.0 0.0 0.0 0.0
8
Travel agencies and other reservation services/ Supporting and auxiliary passenger transport activities
175.6 0.0 175.6 4521.5 7989.0 12510.5
9 Cultural and religious services 0.0 0.0 0.0 16022.5 1475.3 17497.8
10 Sporting and other recreational services 0.0 0.0 0.0 4578.1 0.0 4578.1
11 Health and medical related services 34073.1 13958.5 48031.6 20705.4 4723.2 25428.6
Tourism connected industries 1904.6 0.0 1904.6 165947.7 50825.5 216773.2
12 Readymade garments 0.0 0.0 0.0 57451.0 35077.9 92528.9 13 Processed Food 0.0 0.0 0.0 59872.9 0.0 59872.9 14 Tobacco products 0.0 0.0 0.0 16740.0 15133.1 31873.1 15 Beverages 0.0 0.0 0.0 19226.3 0.0 19226.3 16 Travel related consumer goods 0.0 0.0 0.0 0.0 0.0 0.0 17 footwear 0.0 0.0 0.0 4760.7 614.5 5375.2 18 Soaps, cosmetics and glycerine 0.0 0.0 0.0 0.0 0.0 0.0 19 Gems and jewellery 0.0 0.0 0.0 4960.2 0.0 4960.2
20 Book, journals, magazines, stationery etc. 1904.6 0.0 1904.6 2936.7 0.0 2936.7
Source: NCAER Computation based on NSSO 66th Round survey on “Employment Unemployment”

Region al Tourism Satellite Account– Chhattishgarh, 2009-10
|114| National Council of Applied Economic Research
TSA TABLE 10.1: DOMESTIC AND FOREIGN TOURISM VISITS TO STATES/ UTS DURING 2010-2014
(Rs. lakh)
S. No. State
2010 2011 2012 2013 2014
Dom
esti
c
Fore
ign
Dom
esti
c
Fore
ign
Dom
esti
c
Fore
ign
Dom
esti
c
Fore
ign
Dom
esti
c
Fore
ign
1 Andhra Pradesh 1558 3 1531 3 2072 3 980 1 933 1 2 Arunachal Pradesh 2 0 2 0 1 0 1 0 2 0 3 Assam 41 0 43 0 45 0 47 0 48 0 4 Bihar 185 6 184 10 214 11 216 8 225 8 5 Goa 22 4 22 4 23 5 26 5 35 5 6 Gujarat 189 1 210 2 244 2 274 2 309 2 7 Haryana 69 1 60 1 68 2 71 2 134 5 8 Himachal Pradesh 129 5 146 5 156 5 147 4 159 4 9 Jammu & Kashmir 100 0 131 1 124 1 109 1 94 1
10 Karnataka 382 4 841 6 941 6 980 6 1183 6 11 Kerala 86 7 94 7 101 8 109 9 117 9 12 Madhya Pradesh 381 3 441 3 532 3 631 3 636 3 13 Maharashtra 485 51 553 48 748 27 827 42 941 44 14 Manipur 1 0 1 0 1 0 1 0 1 0 15 Meghalaya 7 0 7 0 7 0 7 0 7 0 16 Mizoram 1 0 1 0 1 0 1 0 1 0 17 Nagaland 0 0 0 0 0 0 0 0 1 0 18 Odisha 76 1 83 1 91 1 98 1 108 1 19 Punjab 106 1 164 2 191 1 213 2 243 3 20 Rajasthan 255 13 271 14 286 15 303 14 331 15 21 Sikkim 7 0 6 0 6 0 6 0 6 0 22 Tamil Nadu 1116 28 1375 34 1841 36 2442 40 3276 47 23 Telangana 0 0 0 0 0 0 541 2 724 1 24 Tripura 3 0 4 0 4 0 4 0 4 0 25 Uttarakhand 302 1 259 1 268 1 199 1 220 1 26 Uttar Pradesh 1448 17 1554 19 1684 20 2265 21 1828 29 27 Chhattisgarh 6 0 143 0 150 0 228 0 245 0 28 Jharkhand 69 0 108 1 204 0 205 0 334 2 29 West Bengal 211 12 223 12 227 12 255 12 490 14 30 A &N Islands 2 0 2 0 2 0 2 0 3 0 31 Chandigarh 9 0 9 0 9 0 9 0 11 0 32 Daman & Diu 8 0 8 0 8 0 8 0 8 0 33 Delhi 136 19 154 22 185 23 202 23 226 23 34 Dadra & Nagar Haveli 5 0 4 0 5 0 5 0 6 0 35 Lakshadweep 0 0 0 0 0 0 0 0 0 0 36 Puducherry 8 1 9 1 10 1 10 0 12 1
All India 7402 179 8645 195 10450 183 11425 200 12901 226
Source: Different ITS Documents, MoT

Region al Tourism Satellite Account– Chhattishgarh, 2009-10
|115| National Council of Applied Economic Research
TSA TABLE 10.2: AVERAGE NUMBER OF OVERNIGHT TRIPS PER 100 HOUSEHOLDS IN DIFFERENT STATE /UTS
S. No. State
Average number of overnight trips (per 100 households)
Rural Urban Total 1 Andhra Pradesh 469 416 453 2 Arunachal Pradesh 332 171 297 3 Assam 223 258 227 4 Bihar 336 333 335 5 Chhattisgarh 370 366 370 6 Delhi 166 237 232 7 Goa 295 322 308 8 Gujarat 422 370 402 9 Haryana 578 424 530
10 Himachal Pradesh 791 593 769 11 Jammu & Kashmir 904 601 836 12 Jharkhand 343 360 346 13 Karnataka 384 376 381 14 Kerala 444 446 445 15 Madhya Pradesh 498 469 491 16 Maharashtra 453 269 371 17 Manipur 189 131 173 18 Meghalaya 279 178 260 19 Mizoram 232 188 212 20 Nagaland 317 293 310 21 Odisha 552 479 541 22 Punjab 504 417 470 23 Rajasthan 541 447 516 24 Sikkim 346 296 338 25 Tamil Nadu 334 328 331 26 Tripura 307 326 310 27 Uttarakhand 434 380 422 28 Uttar Pradesh 493 432 480 29 West Bengal 393 308 371 30 A &N Islands 418 181 340 31 Chandigarh 191 265 256 32 Dadra & Nagar 153 259 179 33 Daman & Diu 100 211 139 34 Lakshadweep 184 293 231 35 Puducherry 455 429 437
All India 440 365 418 Source: NCAER's computations based on NSSO's Domestic Tourism Survey, 2009-10.

Region al Tourism Satellite Account– Chhattishgarh, 2009-10
|116| National Council of Applied Economic Research
TSA TABLE 10.3: PERCENTAGE OF HOUSEHOLDS AND PERSONS UNDERTAKING OVERNIGHT TRIPS: STATES/UTS, LAST 365 DAYS
S. No. State Households Persons
Rural Urban Total Rural Urban Total 1 Andhra Pradesh 94.6 93.2 94.2 87.9 84.0 86.8 2 Arunachal Pradesh 70.3 61.5 68.5 38.0 30.8 36.6 3 Assam 79.8 88.6 80.8 50.7 59.1 51.5 4 Bihar 84.5 87.4 84.8 59.9 61.3 60.0 5 Chhattisgarh 92.5 91.9 92.4 84.3 84.2 84.3 6 Delhi 85.0 86.6 86.5 62.8 73.1 72.2 7 Goa 89.2 78.0 83.6 82.5 68.5 75.8 8 Gujarat 93.4 90.0 92.1 79.4 76.8 78.4 9 Haryana 95.7 89.7 93.8 82.1 79.7 81.4
10 Himachal Pradesh 99.8 86.0 98.3 89.8 88.6 89.7 11 Jammu & Kashmir 93.9 87.7 92.5 76.7 68.6 75.1 12 Jharkhand 92.6 92.5 92.6 76.8 79.2 77.1 13 Karnataka 88.6 94.9 90.9 79.0 85.7 81.3 14 Kerala 84.4 80.1 83.3 70.7 65.9 69.5 15 Madhya Pradesh 97.3 94.7 96.7 84.7 82.2 84.1 16 Maharashtra 94.5 85.1 90.3 80.1 71.6 76.6 17 Manipur 60.7 57.8 59.9 20.9 18.6 20.3 18 Meghalaya 77.1 70.3 75.8 45.5 43.0 45.1 19 Mizoram 65.1 59.3 62.5 26.3 22.0 24.4 20 Nagaland 82.2 89.8 84.4 39.8 45.3 41.3 21 Odisha 95.9 94.9 95.7 80.5 83.6 81.0 22 Punjab 90.5 90.0 90.3 83.2 82.3 82.9 23 Rajasthan 98.4 97.1 98.1 85.7 81.0 84.5 24 Sikkim 93.9 100.0 94.8 68.5 88.7 70.7 25 Tamil Nadu 90.6 91.6 91.1 81.8 84.0 82.7 26 Tripura 94.1 93.0 93.9 71.3 76.9 72.2 27 Uttarakhand 94.6 94.2 94.5 78.6 79.2 78.8 28 Uttar Pradesh 96.3 94.1 95.8 77.5 78.4 77.7 29 West Bengal 93.3 81.4 90.2 79.3 70.3 77.2 30 A &N Islands 86.9 75.7 83.2 72.0 58.7 67.7 31 Chandigarh 99.7 78.1 80.7 88.8 59.8 62.7 32 Dadra & Nagar Haveli 64.7 92.2 71.6 38.6 82.0 46.4 33 Daman & Diu 45.7 70.3 54.2 39.7 60.2 46.0 34 Lakshadweep 100.0 87.8 96.0 82.0 44.3 63.9 35 Puducherry 90.6 88.3 89.0 81.4 79.0 79.7
All India 92.6 89.9 91.8 77.4 77.3 77.4
Source: NCAER's computations based on NSSO's Domestic Tourism Survey, 2009-10.

Region al Tourism Satellite Account– Chhattishgarh, 2009-10
|117| National Council of Applied Economic Research
TSA TABLE 10.4: SHARE OF STATES IN THE TOTAL HOUSEHOLDS REPORTING OVERNIGHT VISITOR(S) AND TOTAL NUMBER OF OVERNIGHT VISITOR(S), SEPARATELY FOR EACH STATE/UTS
S. No. State
Rural Urban Total
Shar
e in
tota
l hou
se
hold
s re
port
ing
ov
erni
ght v
isit
ors
Shar
e in
tota
l num
ber
of o
vern
ight
vis
itor
s
Shar
e in
tota
l hou
se
hold
s re
port
ing
ov
erni
ght v
isit
ors
Shar
e in
tota
l num
ber
of o
vern
ight
vis
itor
s
Shar
e in
tota
l hou
se
hold
s re
port
ing
ov
erni
ght v
isit
ors
Shar
e in
tota
l num
ber
of o
vern
ight
vis
itor
s
1 Andhra Pradesh 9.3 8.4 10.0 9.2 9.5 8.6 2 Arunachal Pradesh 0.1 0.1 0.1 0.0 0.1 0.0 3 Assam 2.6 2.2 1.0 0.8 2.2 1.8 4 Bihar 7.9 7.1 2.5 2.1 6.3 5.8 5 Chhattisgarh 2.3 2.7 1.3 1.5 2.0 2.4 6 Delhi 0.1 0.1 3.7 3.6 1.1 1.0 7 Goa 0.1 0.1 0.2 0.2 0.1 0.1 8 Gujarat 4.3 4.4 6.6 6.9 4.9 5.1 9 Haryana 2.1 2.4 2.2 2.5 2.1 2.4
10 Himachal Pradesh 0.9 0.9 0.2 0.2 0.7 0.7 11 Jammu & Kashmir 0.7 0.8 0.5 0.5 0.7 0.7 12 Jharkhand 2.6 2.6 1.2 1.3 2.2 2.3 13 Karnataka 4.6 4.7 7.2 7.2 5.4 5.4 14 Kerala 3.3 2.8 2.7 2.4 3.1 2.7 15 Madhya Pradesh 6.2 6.9 4.8 5.5 5.8 6.5 16 Maharashtra 7.9 7.7 14.0 13.6 9.7 9.3 17 Manipur 0.1 0.1 0.1 0.1 0.1 0.1 18 Meghalaya 0.2 0.2 0.1 0.1 0.2 0.1 19 Mizoram 0.0 0.0 0.1 0.0 0.1 0.0 20 Nagaland 0.1 0.1 0.1 0.1 0.1 0.1 21 Odisha 4.6 4.3 2.1 2.1 3.8 3.7 22 Punjab 2.1 2.4 3.2 3.4 2.4 2.7 23 Rajasthan 5.7 6.7 5.1 5.5 5.6 6.4 24 Sikkim 0.1 0.1 0.0 0.0 0.1 0.0 25 Tamil Nadu 5.7 4.9 12.4 11.0 7.6 6.5 26 Tripura 0.4 0.4 0.2 0.2 0.4 0.3 27 Uttarakhand 0.9 1.0 0.6 0.7 0.8 0.9 28 Uttar Pradesh 16.2 18.0 10.9 12.9 14.7 16.6 29 West Bengal 8.6 8.1 6.4 5.9 8.0 7.5 30 A &N Islands 0.0 0.0 0.0 0.0 0.0 0.0 31 Chandigarh 0.0 0.0 0.3 0.2 0.1 0.1 32 Dadra & Nagar Haveli 0.0 0.0 0.0 0.0 0.0 0.0 33 Daman & Diu 0.0 0.0 0.0 0.0 0.0 0.0 34 Lakshadweep 0.0 0.0 0.0 0.0 0.0 0.0 35 Puducherry 0.1 0.0 0.3 0.3 0.1 0.1
All India 100.0 100.0 100.0 100.0 100.0 100.0
Source: NCAER's computations based on NSSO's Domestic Tourism Survey, 2009-10.

Region al Tourism Satellite Account– Chhattishgarh, 2009-10
|118| National Council of Applied Economic Research
TSA TABLE 10.5: PER 1000 DISTRIBUTION OF OVERNIGHT VISITOR-TRIPS BY PURPOSE OF TRAVELS OR EACH STATE/ UTS
S. No. State of main destination
Purpose
Bus
ines
s
Leis
ure
Soci
al
Rel
igio
us
Educ
atio
n
& tr
aini
ng
Hea
lth
&
med
ical
Shop
ping
Oth
ers
All
1 Andhra Pradesh 14 23 734 134 4 56 1 33 1000 2 Arunachal Pradesh 99 28 369 93 43 100 118 140 1000 3 Assam 55 23 694 63 14 109 8 34 1000 4 Bihar 22 15 767 66 7 104 5 13 1000 5 Chhattisgarh 16 30 822 63 7 44 5 12 1000 6 Delhi 55 49 693 21 37 56 16 72 1000 7 Goa 46 197 489 222 29 10 0 7 1000 8 Gujarat 14 21 771 140 7 38 1 8 1000 9 Haryana 10 5 858 39 2 58 0 27 1000
10 Himachal Pradesh 18 49 701 142 10 43 12 26 1000 11 Jammu & Kashmir 11 35 743 145 18 20 5 24 1000 12 Jharkhand 13 31 764 87 8 79 3 14 1000 13 Karnataka 16 34 710 178 6 32 0 24 1000 14 Kerala 12 24 730 84 5 78 0 67 1000 15 Madhya Pradesh 13 12 838 73 4 45 2 12 1000 16 Maharashtra 13 21 704 175 4 67 2 14 1000 17 Manipur 140 21 445 71 26 144 90 60 1000 18 Meghalaya 68 96 585 64 11 102 12 62 1000 19 Mizoram 196 90 480 46 26 77 48 36 1000 20 Nagaland 210 36 318 82 53 121 18 162 1000 21 Odisha 24 51 747 52 4 87 8 27 1000 22 Punjab 15 7 826 93 6 33 0 20 1000 23 Rajasthan 9 10 787 100 8 58 1 27 1000 24 Sikkim 39 138 438 121 22 72 5 165 1000 25 Tamil Nadu 11 42 689 195 4 39 1 18 1000 26 Tripura 3 49 837 12 3 68 0 22 1000 27 Uttarakhand 18 49 496 359 8 23 14 33 1000 28 Uttar Pradesh 12 15 823 62 8 48 3 30 1000 29 West Bengal 13 57 789 35 3 78 1 24 1000 30 A &N Islands 30 146 670 26 16 57 20 36 1000 31 Chandigarh 11 83 627 45 31 157 1 45 1000 32 Dadra & Nagar Haveli 1 2 973 2 1 21 0 0 1000 33 Daman & Diu 0 410 272 317 0 0 0 0 1000 34 Lakshadweep 11 213 671 13 2 50 0 40 1000 35 Puducherry 0 50 750 122 16 51 0 10 1000
All India 15 26 760 107 6 58 2 26 1000 Estd. no. of visitor-trips (’000) 30991 52751 1611817 222832 12505 126200 5413 54573 2117446
Source: NCAER's computations based on NSSO's Domestic Tourism Survey, 2009-10.

Region al Tourism Satellite Account– Chhattishgarh, 2009-10
|119| National Council of Applied Economic Research
TSA TABLE 10.6: AVERAGE NO. OF PLACES VISITED PER OVERNIGHT TRIP BY MAIN DESTINATION FOR EACH STATE/UTS OF DESTINATION
S. No. State of destination
Main destination
Within the district
Outside the district but within the state
Outside State
1 Andhra Pradesh 1.1 1 .2 1.6 2 Arunachal Pradesh 1.1 1 .2 1.3 3 Assam 1.1 1 .4 1.4 4 Bihar 1.0 1 .3 1.4 5 Chhattisgarh 1.1 1 .1 1.9 6 Delhi 1.3 1 .0 1.2 7 Goa 1.0 1 .0 2.0 8 Gujarat 1.0 1 .4 2.0 9 Haryana 1.1 1 .2 1.2
10 Himachal Pradesh 1.0 1 .1 1.9 11 Jammu & Kashmir 1.1 1 .2 2.1 12 Jharkhand 1.0 1 .2 1.5 13 Karnataka 1.0 1 .3 1.7 14 Kerala 1.1 1 .2 1.7 15 Madhya Pradesh 1.0 1 .1 1.3 16 Maharashtra 1.1 1 .3 1.8 17 Manipur 1.0 1 .1 2.9 18 Meghalaya 1.0 1 .0 1.8 19 Mizoram 1.0 1 .0 2.8 20 Nagaland 1.3 1 .6 1.4 21 Odisha 1.0 1 .2 1.6 22 Punjab 1.0 1 .1 1.1 23 Rajasthan 1.0 1 .1 1.5 24 Sikkim 1.0 1 .1 2.9 25 Tamil Nadu 1.1 1 .2 1.6 26 Tripura 1.0 1 .0 2.6 27 Uttarakhand 1.0 1 .1 1.8 28 Uttar Pradesh 1.0 1 .1 1.3 29 West Bengal 1.0 1 .1 1.6 30 A &N Islands 1.1 1 .3 0.0 31 Chandigarh 1.0 1 .0 1.4 32 Dadra & Nagar Haveli 1.0 1 .2 1.0 33 Daman & Diu 1.0 1 .0 1.2 34 Lakshadweep 1.0 0 .0 1.8 35 Puducherry 1.1 1 .1 1.2
All India 1.0 1 .2 1.5
Source: NCAER's computations based on NSSO's Domestic Tourism Survey, 2009-10.

Region al Tourism Satellite Account– Chhattishgarh, 2009-10
|120| National Council of Applied Economic Research
TSA TABLE 10.7A: PER 1000 DISTRIBUTION OF HOUSEHOLDS WHO ARE AWARE OF 'INCREDIBLE INDIA' CAMPAIGN AND OTHER TOURISM PROMOTIONAL CAMPAIGNS BY SOURCE OF INFORMATION ABOUT THE CAMPAIGN – CHHATTISGARH
S.No. Source of information
Chhattisgarh Incredible India
Campaign Other promotional
campaigns Rural Urban Total Rural Urban Total
1 Newspaper/Magazine 55 12 41 16 40 26 2 Radio 350 123 278 435 117 311 3 TV 487 736 567 200 448 297 4 Internet 1 8 3 0 9 3 5 Billboard/ Hoarding 22 1 15 150 54 112 6 More than one of these 83 107 90 198 322 247 7 Others 2 13 6 1 10 5
Any/Some/ All of these 1000 1000 1000 1000 1000 1000
Source: NCAER's computations based on NSSO's Domestic Tourism Survey, 2009-10.
TSA TABLE 10.7B: PER 1000 DISTRIBUTION OF HOUSEHOLDS WHO ARE AWARE OF 'INCREDIBLE INDIA' CAMPAIGN AND OTHER TOURISM PROMOTIONAL CAMPAIGNS BY SOURCE OF INFORMATION ABOUT THE CAMPAIGN – ALL INDIA
S. No. Source of information
All India Incredible India
Campaign Other promotional
campaigns
Rural Urban Total Rural Urban Total 1 Newspaper/Magazine 145 139 142 172 272 220 2 Radio 82 22 47 113 30 73 3 TV 547 661 614 318 385 350 4 Internet 3 20 13 1 8 5 5 Billboard/ Hoarding 10 5 7 66 40 53 6 More than one of these 186 145 162 265 248 257 7 Others 27 8 16 65 17 42
Any/Some/ All of these 1000 1000 1000 1000 1000 1000
Source: NCAER's computations based on NSSO's Domestic Tourism Survey, 2009-10.
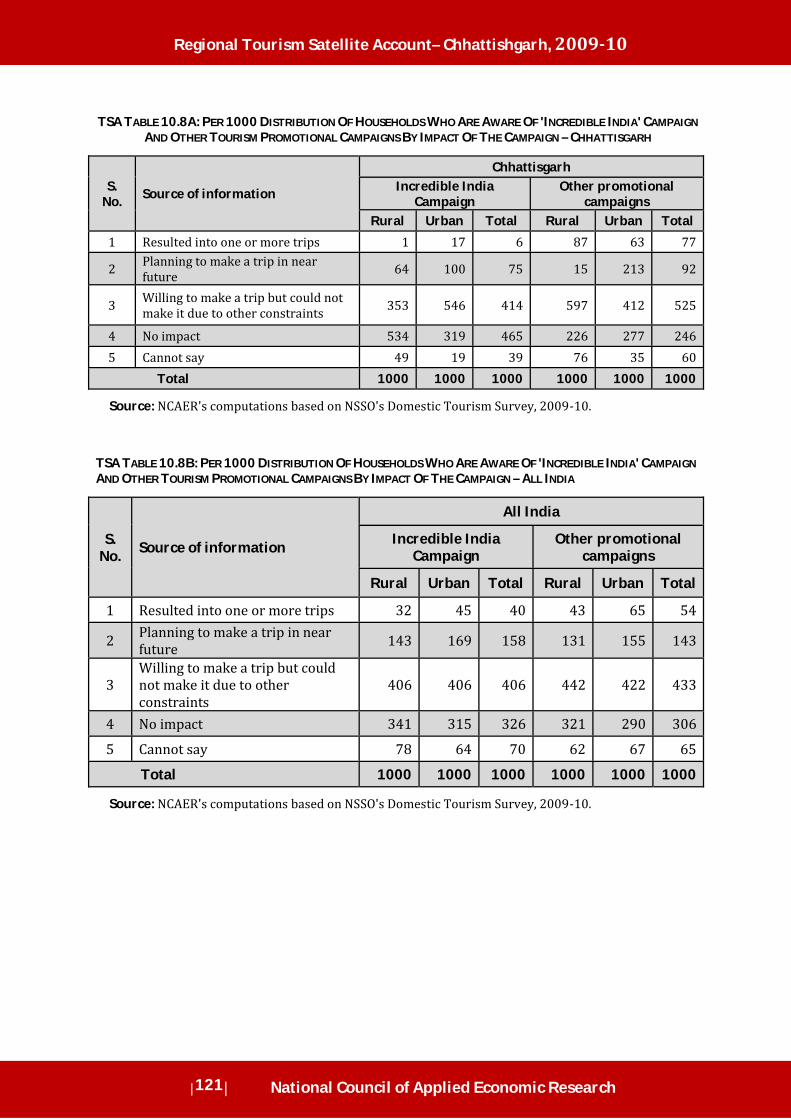
Region al Tourism Satellite Account– Chhattishgarh, 2009-10
|121| National Council of Applied Economic Research
TSA TABLE 10.8A: PER 1000 DISTRIBUTION OF HOUSEHOLDS WHO ARE AWARE OF 'INCREDIBLE INDIA' CAMPAIGN AND OTHER TOURISM PROMOTIONAL CAMPAIGNS BY IMPACT OF THE CAMPAIGN – CHHATTISGARH
S.No. Source of information
Chhattisgarh Incredible India
Campaign Other promotional
campaigns Rural Urban Total Rural Urban Total
1 Resulted into one or more trips 1 17 6 87 63 77
2 Planning to make a trip in near future 64 100 75 15 213 92
3 Willing to make a trip but could not make it due to other constraints 353 546 414 597 412 525
4 No impact 534 319 465 226 277 246
5 Cannot say 49 19 39 76 35 60
Total 1000 1000 1000 1000 1000 1000
Source: NCAER's computations based on NSSO's Domestic Tourism Survey, 2009-10.
TSA TABLE 10.8B: PER 1000 DISTRIBUTION OF HOUSEHOLDS WHO ARE AWARE OF 'INCREDIBLE INDIA' CAMPAIGN AND OTHER TOURISM PROMOTIONAL CAMPAIGNS BY IMPACT OF THE CAMPAIGN – ALL INDIA
S. No. Source of information
All India
Incredible India Campaign
Other promotional campaigns
Rural Urban Total Rural Urban Total
1 Resulted into one or more trips 32 45 40 43 65 54
2 Planning to make a trip in near future 143 169 158 131 155 143
3 Willing to make a trip but could not make it due to other constraints
406 406 406 442 422 433
4 No impact 341 315 326 321 290 306
5 Cannot say 78 64 70 62 67 65
Total 1000 1000 1000 1000 1000 1000
Source: NCAER's computations based on NSSO's Domestic Tourism Survey, 2009-10.

Region al Tourism Satellite Account– Chhattishgarh, 2009-10
|122| National Council of Applied Economic Research

Region al Tourism Satellite Account– Chhattishgarh, 2009-10
|123| National Council of Applied Economic Research
6. SUMMARY OF FINDINGS
NUM BE R OFTRI PS
Total domestic or intrastate trips undertaken in Chhattisgarh were 2.3 lakh in 2008-09 (DTS, 2008-09). This amounts to 0.02 per cent of the total domestic trips undertaken in India.
In addition to this, 13.9 thousand trips were undertaken in the state from the other states of India, constituting a part of inbound tourism activity in the state (DTS, 2008-09). The other part relates to the tourism activity by 14,615 tourists visiting the state from other countries (MoT Report).
With respect to outbound tourism, a total of 28.2 thousand people living in Chhattisgarh undertook foreign trips during 2010-11 (IPS, 2010-11). This is 0.26 per cent of the total outbound tourists of India (Table 6.1).
TABLE 6.1: TOTAL ESTIMATED NUMBER OF TRIPS/TOURISTS TO CHHATTISGARH AND INDIA
Item Chhattisgarh All India
Share of Chhattisgarh in All- India
(%) Total domestic trips (No.) - within state 1,59,38,130 93,90,32,132 1.70
Total Inbound trips (No.) – from other states 8,58,919 - -
Total Inbound tourists (No.) – from other countries 1,586 66,03,897 0.02
Total outbound tourists (No.) – to other countries 55,659 1,08,42,124 0.51
Source: NCAER Computations
INTE RN ALTO URIS MEXPE NDI TURE
Internal Tourism Expenditure comprises of Domestic, Inbound and Outbound Tourism Expenditure. Adding the imputed consumption to this gives the Total Internal Tourism Consumption.
The total Internal Tourism Expenditure of the state comes out to be Rs. 36,810 lakh which is 0.07 per cent of the total Tourism Expenditure for India (Table 6.2).

Region al Tourism Satellite Account– Chhattishgarh, 2009-10
|124| National Council of Applied Economic Research
TABLE 6.2: GROSS INTERNAL TOURISM EXPENDITURE OF CHHATTISGARH AND INDIA (RS. LAKH)
Item Chhattisgarh All India Share of
Chhattisgarh in All- India (%)
1. Domestic Tourism Expenditure 3,89,551 3,92,96,109 0.99
2. Inbound Tourism Expenditure 3,07,422 99,67,885 3.08
- Total Expenditure on trips from other states 3,05,028 - -
- Total Expenditure on trips from other countries 2,394 99,67,885 0.02
3. Outbound Tourism Expenditure 3,109 10,14,854 0.31
4. Gross Internal Tourism Expenditure (1+2+3) 7,00,082 5,02,78,848 1.39
Source: NCAER Computations
EMPL OYMEN TIN TO URIS MINDUS TRIES
The overall workforce (number of jobs) in Chhattisgarh was 1.51 lakh in 2009-10.
The number of jobs in tourism characteristic industries in the state stood at 0.19 lakh. This refers to the tourism employment of the state.
The direct share of tourism employment in total state employment is 12.82 per cent, as compared to the corresponding national share of 4.37 per cent (Table 6.3).
TABLE 6.3: TOTAL EMPLOYMENT IN TOURISM INDUSTRIES IN CHHATTISGARH AND INDIA
Item Chhattisgarh All India
Share of Chhattisgarh in All- India
(%) Total Employment (in lakh) 137.37 5355.4 2.57
Tourism Characteristic Industries 2.29 234.2 0.98
Tourism Connected Industries 2.19 203.7 1.07
Tourism Specific Industries 4.48 437.9 1.02
Shares in Total Employment (%)
Tourism Characteristic Industries 1.67 4.37 -
Tourism Connected Industries 1.59 3.80 -
Tourism Specific Industries 3.26 8.18 -
Source: NCAER Computations

Region al Tourism Satellite Account– Chhattishgarh, 2009-10
|125| National Council of Applied Economic Research
GROSS VAL UEADDED
According to the Supply and Use Table of the state, prepared using the state GSDP accounts, the Gross Value Added (GVA) of all industries was Rs. 418,325 lakh for the reference year of 2009-10.
The GVA of Tourism characteristic industries (GVATI) works out to be Rs. 70,667 lakh, which is 16.89 per cent of the total state GVA or GSDP (Table 6.4).
TABLE 6.4: GROSS VALUE ADDED OF TOURISM INDUSTRIES IN CHHATTISGARH AND INDIA
Item Chhattisgarh All India
Gross Value Added (GVA) at basic prices (Rs. Lakh) 1,00,86,747 61,86,95,000 Tourism Characteristic Industries (GVATI) 6,61,834 4,42,92,221 Tourism Connected Industries 1,96,164 1,82,16,126 Tourism Specific Industries (1+2) 8,57,998 6,25,08,347 Shares in GVA (%) Tourism Characteristic Industries (GVATI) 6.6 7.2 Tourism Connected Industries 1.9 2.9 Tourism Specific Industries 8.5 10.1 Tourism Direct GVA 2,38,703.9 2,34,91,181.0 Share of TDGVA in total GVA (%) 2.37 3.80
Source: NCAER Computations
DI RECT ANDINDIRE CTSH ARES INGSDP&EM PLOY MEN T
The Tourism Direct GVA (TDGVA) for the state is Rs. 30,197 lakh.
The share of TDGVA in the state GVA is 7.22 per cent. This is the direct share of tourism in the state GDP.
Using the GVA and employment multipliers, we arrive at the direct and indirect contribution of tourism in the state GDP and employment respectively.
The overall (direct + indirect) share of tourism in the state GDP is 14.65 per cent which is the share of TDGVA in overall GVA.
And the overall (direct + indirect) share of tourism employment in total state employment is 30.95 per cent (Table 6.5).

Region al Tourism Satellite Account– Chhattishgarh, 2009-10
|126| National Council of Applied Economic Research
TABLE 6.5: CONTRIBUTION OF TOURISM IN THE ECONOMY – CHHATTISGARH AND INDIA
Item Chhattisgarh All India
TDGVA - direct 2.37 3.80
GVATI-direct 6.56 7.16
Tourism Employment - direct 1.67 4.37
GVA multipliers 2.0446 1.8430
Employment multipliers 4.8901 2.3256
TDGVA - direct and indirect 4.84 7.00
GVATI-direct and indirect 13.42 13.19
Tourism Employment - direct and indirect 8.16 10.17
Source: NCAER Computations

Region al Tourism Satellite Account– Chhattishgarh, 2009-10
|127| National Council of Applied Economic Research
TABLE 6.6: STATE-WISE CONTRIBUTION OF TOURISM TO THE ECONOMY
S. No. States
Gro
ss V
alue
add
ed
(GV
A) a
t bas
ic p
rice
s (R
s. L
akh)
Tour
ism
Dir
ect G
ross
Va
lue
Add
ed (T
DG
VA in
R
s. L
akh)
Share of TDGVA in GVA
Stat
e Em
ploy
men
t (i
n la
kh n
umbe
rs)
Tour
ism
Dir
ect
Empl
oym
ent
(in
lakh
nu
mbe
rs)
Share of Tourism
Employment to Total State
Employment
Tourism
Labour Productivity - (Col.4/Col.8) (in Rs)
Dir
ect (
%)
Dir
ect a
nd
Indi
rect
(%
)
Dir
ect (
%)
Dir
ect a
nd
Indi
rect
(%
)
1 2 3 4 5 6 7 8 9 10 11
1 A & N Islands 418325 30197 7.22 14.65 1.51 0.19 12.85 30.95 158932
2 Andhra Pradesh 48166626 1856387 3.85 9.58 479.35 21.65 4.52 17.33 85745
3 Arunachal Pradesh 757671 14750 1.95 3.59 5.32 0.14 2.56 6.92 105357
4 Assam 9730973 265871 2.73 5.31 121.11 3.47 2.87 10.36 76620
5 Bihar 16524762 515201 3.12 6.13 308.96 9.94 3.22 9.69 51831
6 Chandigarh 1786755 61584 3.45 8.09 3.27 0.38 11.68 21.83 162063
7 Chhattisgarh 10086747 238704 2.37 4.84 137.37 2.29 1.67 8.16 104238
8 D & N Haveli 895494 3017 0.34 0.52 0.99 0.05 5.01 5.67 60340
9 Daman & Diu 787852 2457 0.31 0.48 0.87 0.06 6.71 7.74 40950
10 Delhi 22154351 937036 4.23 9.07 52.4 4.49 8.58 17.64 208694
11 Goa 2958592 218577 7.39 16.86 4.68 0.74 15.86 32.77 295374
12 Gujarat 16510594 584043 3.54 7.39 283.42 12.6 4.45 13.17 46353
13 Haryana 22717001 777799 3.42 7.14 101.68 3.94 3.87 11.35 197411
14 Himachal Pradesh 4895572 192797 3.94 9.12 42.07 1.13 2.68 14.27 170617
15 Jammu & Kashmir 4912896 193346 3.94 7.59 60.9 2.12 3.48 9.26 91201
16 Jharkhand 10223781 282299 2.76 5.32 123.5 3.53 2.86 9.37 79971
17 Karnataka 34348035 1097409 3.19 7.25 301.96 15.55 5.15 15.71 70573
18 Kerala 24164435 1130801 4.68 9.52 142.43 14.07 9.88 23.52 80370
19 Lakshadweep 49461 2875 5.81 11 0.3 0.03 11.49 20.86 95833
20 Madhya Pradesh 22854660 609438 2.67 5.23 331.3 6.38 1.93 7.23 95523
21 Maharashtra 87031584 2850738 3.28 7.46 548.84 31.43 5.73 16.16 90701
22 Manipur 837565 18250 2.18 4.16 9.68 0.32 3.33 8.4 57031
23 Meghalaya 1288953 27569 2.14 4.42 14.29 0.63 4.43 11.81 43760
24 Mizoram 533691 15365 2.88 5.27 5.56 0.14 2.59 6.62 109750
25 Nagaland 1068167 39315 3.68 7.43 8.5 0.32 3.79 10.11 122859
26 Odisha 16520188 580759 3.52 7.25 216.6 6.12 2.82 11.51 94895
27 Pondicherry 1252157 24417 1.95 4.03 5.01 0.46 9.19 14.86 53080
28 Punjab 20358388 568773 2.79 6.34 108.75 5.84 5.37 12.96 97393
29 Rajasthan 26989445 1003602 3.72 7.68 331.48 8.9 2.68 10.01 112764
30 Sikkim 628848 17782 2.83 5.09 3.36 0.2 6.03 9.83 88910
31 Tamil Nadu 48808673 1895119 3.88 8.1 353.12 20.42 5.78 14.99 92807
32 Tripura 1561572 47548 3.04 5.74 17.72 0.86 4.83 11.29 55288
33 Uttar Pradesh 53178944 1820425 3.42 6.84 758.35 26.14 3.45 9.85 69641
34 Uttarakhand 7181027 292411 4.07 9.68 46.91 1.6 3.42 17.1 182757
35 West Bengal 40856666 1365832 3.34 7.13 407.82 28.16 6.9 16.26 48503
Source: NCAER Computations

Region al Tourism Satellite Account– Chhattishgarh, 2009-10
|128| National Council of Applied Economic Research

Region al Tourism Satellite Account– Chhattishgarh, 2009-10
|129| National Council of Applied Economic Research
GLOSSARY

Region al Tourism Satellite Account– Chhattishgarh, 2009-10
|130| National Council of Applied Economic Research

Region al Tourism Satellite Account– Chhattishgarh, 2009-10
|131| National Council of Applied Economic Research
GLOSSARY
Basic Price The basic price is the amount receivable by the producer from the purchaser for a unit of a good or service produced as output minus any tax payable, and plus any subsidy receivable, on that unit as a consequence of its production or sale; it excludes any transport charges invoiced separately by the producer.
Business And Government Tourism Consumption
Also referred to as internal tourism consumption by domestic business and government visitors. Consists of the tourism consumption by resident businesses or governments on tourism related products within the economy.
Central Product Classification (CPC)
The central product classification (CPC) is a classification based on the physical characteristics of goods or on the nature of the services rendered; each type of good or service distinguished in the CPC is defined in such a way that it is normally produced by only one activity as defined in ISIC.
CIF Price The CIF price (i.e. cost, insurance and freight price) is the price of a good delivered at the frontier of the importing country, including any insurance and freight charges incurred to that point, or the price of a service delivered to a resident, before the payment of any import duties or other taxes on imports or trade and transport margins within the country; in SNA 1993 this concept is applied only to detailed imports.
Compensation of Employees
Compensation of employees is the total remuneration, in cash or in kind, payable by an enterprise to an employee in return for work done by the latter during the accounting period.
Consumption of Fixed Capital
Consumption of fixed capital represents the reduction in the value of the fixed assets used in production during the accounting period resulting from physical deterioration, normal obsolescence or normal accidental damage.
Direct Tourism Gross Domestic Product
Is direct tourism gross value added plus net taxes on products that are attributable to the tourism industry (tourism net taxes on products). Direct tourism GDP will generally have a higher value than direct tourism value added. Direct tourism GDP is a satellite

Region al Tourism Satellite Account– Chhattishgarh, 2009-10
|132| National Council of Applied Economic Research
account construct to enable a direct comparison with the most widely recognised national accounting aggregate, GDP. While it is useful in this context, the direct tourism gross value added measure should be used when making comparisons with other industries or between countries. See also Direct tourism gross value added and Tourism net taxes on products.
Direct Tourism Gross Value Added
The value of direct tourism output at basic prices, less the value of the inputs used in producing these tourism products. This measure is directly comparable with the value added of 'conventional' industries such as mining and manufacturing and should also be used for comparisons across countries. See also Direct tourism output and Direct tourism GDP.
Direct Tourism Output
The value of goods and services, at basic prices, which are consumed by visitors and produced in the economy by industries in a direct relationship with visitors.
Domestic Output
Domestic output is output produced by resident enterprises.
Domestic Tourism
The travel of domestic visitors is called domestic tourism. It comprises the activities of a resident visitor within the country of reference either as part of a domestic tourism trip or part of an outbound tourism trip.
Domestic Tourism Consumption
Consists of the tourism consumption by resident visitors on tourism related products within the economy. It is the sum of household tourism consumption and business and government tourism consumption.
Domestic Travel
Travel within a country by residents is called domestic travel.
Domestic Travellers
Those who undertake domestic travel are domestic travellers.
Domestic Trip A domestic trip is one with a main destination within the country of residence of the visitor.
Domestic Visitor
A domestic traveller qualifies as a domestic visitor if: (a) he/she is on a tourism trip and (b) he/she is a resident travelling in the country of reference.

Region al Tourism Satellite Account– Chhattishgarh, 2009-10
|133| National Council of Applied Economic Research
Domestic visitors are those who travel within the country to a place other than their usual place of residence and stay at hotels or other accommodation establishments run on commercial basis or in dharamshalas/sarais/musafirkhanas/ agrashalas/ choultries, etc for a duration of not less than 24 hours or one night and for not more than 12 months at a time.
Durable Consumer Goods
Durable goods are goods that “may be used repeatedly or continuously over a period of a year or more, assuming a normal or average rate of physical usage”. When acquired by producers, these are considered to be capital goods used for production processes as is the case of vehicles, computers, etc. When acquired by households, they are considered to be consumer durable goods.
Economic Activity
Any activity resulting in production of goods and services that add value to national product is considered as an economic activity. Such activities include production of all goods and services for market (market activities), i.e. production for pay or profit, and, among the non-market activities, the production of goods and household services with paid domestic employees and owner occupied dwellings for own consumption and own account production of fixed assets.
Employed Persons
Employed (or worker) persons are those who are engaged in any economic activity or who, despite their attachment to economic activity, abstain from work for reason of illness, injury or other physical disability, bad weather, festivals, social or religious functions or other contingencies necessitating temporary absence from work.
Employed Persons
Number of persons usually employed in the principal and subsidiary statuses.
Employed As Per Principal Activity Status
Those in labour force pursuing some economic activity for major time during the reference period of 365 days
Employed As Per Subsidiary Activity Status
Those in labour force pursuing some economic activity for a relatively shorter time (minor time) during the reference period of 365 days
Enterprise An enterprise is an institutional unit in its capacity as a producer of goods and services; an enterprise may be a corporation, a quasi-

Region al Tourism Satellite Account– Chhattishgarh, 2009-10
|134| National Council of Applied Economic Research
corporation, a non-profit institution, or an unincorporated enterprise.
Establishment An establishment is an enterprise or part of an enterprise that is situated in a single location and in which only a single (non-ancillary) productive activity is carried out or in which the principal productive activity accounts for most of the value added.
Exports of Goods
Exports of goods consist of exports of the following items from residents to non-residents: generally with a change of ownership being involved: general merchandise, goods for processing, goods procured in domestic ports by non-resident carriers and non-monetary gold.
Exports of Services
Exports of services consist of exports of the following services provided by residents to non-residents: transportation; travel; communications; construction; insurance; financial; computer and information; royalties and licence fees; other business services; personal, cultural, and recreational services; and government services n.i.e.
Excursionist Same day visitors are called excursionists.
Final Demand Transactions that involve purchases of produced goods and services for final uses are presented in final demand table. The “final” use for a good or service is that it is not used up entirely in the reference year as an intermediate input in the production of some other good or service. Transactions for goods and services that are completely used to produce other goods and services are shown in the intermediate input (or use) table of the accounts.
Final Output This is that part of total output of each industry sold either for final consumption by households, general government or for investment (including additions to inventories) and for export. In short, it represents total output sold to final buyers. For the whole economy, total final output is equal to the value of goods and services (both domestically produced and imported) available for consumption, investment and export.
Final Consumption
Final consumption consists of goods and services used up by individual households or the community to satisfy their individual or collective needs or wants.

Region al Tourism Satellite Account– Chhattishgarh, 2009-10
|135| National Council of Applied Economic Research
Final Consumption Expenditure of Government
Government final consumption expenditure consists of expenditure, including imputed expenditure, incurred by general government on both individual consumption goods and services and collective consumption services.
Final Consumption Expenditure of Households
Household final consumption expenditure consists of the expenditure, including imputed expenditure, incurred by resident households on individual consumption goods and services, including those sold at prices that are not economically significant.
Final Consumption Expenditure of Npishs
Final consumption expenditure of NPISHs (non-profit institutions serving households) consists of the expenditure, including imputed expenditure, incurred by resident NPISHs on individual consumption goods and services.
Fob Price The FOB price (free on board price) of exports and imports of goods is the market value of the goods at the point of uniform valuation, (the customs frontier of the economy from which they are exported); it is equal to the CIF price less the costs of transportation and insurance charges, between the customs frontier of the exporting (importing) country and that of the importing (exporting) country.
General Government
The general government sector consists of the totality of institutional units which, in addition to fulfilling their political responsibilities and their role of economic regulation, produce principally non-market services (possibly goods) for individual or collective consumption and redistribute income and wealth.
GDP Is the total market value of goods and services produced in the economy within a given period after deducting the cost of goods and services used up in the process of production but before deducting allowances for the consumption of fixed capital. Thus gross domestic product, as here defined, is ‘at market prices’.
Gross The term “gross” is a common means of referring to values before deducting consumption of fixed capital (generally used as in “gross capital stock” or “gross domestic product”).
Gross Domestic Product - Expenditure Based
Expenditure-based gross domestic product is total final expenditures at purchasers’ prices (including the FOB value of exports of goods and services), less the FOB value of imports of goods and services.

Region al Tourism Satellite Account– Chhattishgarh, 2009-10
|136| National Council of Applied Economic Research
Gross Domestic Product - Income Based
Income-based gross domestic product is compensation of employees, plus taxes less subsidies on production and imports, plus gross mixed income, plus gross operating surplus.
Gross Domestic Product - Output Based
Output-based gross domestic product is the sum of the gross values added of all resident producers at basic prices, plus all taxes less subsidies on products. Output-based GDP is the sum of the gross values added of all resident producers at producers’ prices, plus taxes less subsides on imports, plus all non-deductible VAT (or similar taxes).
Gross Fixed Capital Formation
Gross fixed capital formation is measured by the total value of a producer’s acquisitions, less disposals, of fixed assets during the accounting period plus certain additions to the value of non-produced assets (such as subsoil assets or major improvements in the quantity, quality or productivity of land) realised by the productive activity of institutional units.
Gross Margin The gross margin of a provider of reservation services is the difference between the value at which the intermediated service is sold and the value accrued to the provider of reservation services for this intermediated service.
Gross Value Added
Gross value added is the value of output less the value of intermediate consumption; it is a measure of the contribution to GDP made by an individual producer, industry or sector; gross value added is the source from which the primary incomes of the SNA are generated and is therefore carried forward into the primary distribution of income account.
Gross Value Added At Basic Prices
Gross value added at basic prices is output valued at basic prices less intermediate consumption valued at purchasers’ prices.
Gross Value Added of The Tourism Industries (GVATI)
Gross value added of the tourism industries is the total gross value added of all establishments belonging to tourism industries, regardless of whether all their output is provided to visitors and of the degree of specialization of their production process.
Household Tourism Consumption
Consists of the tourism consumption by resident households on tourism related products within economy.
Region al Tourism Satellite Account– Chhattishgarh, 2009-10
|137| National Council of Applied Economic Research
Imports of Goods
Imports of goods consist of imports of the following items from non-residents to residents, generally with a change of ownership being involved: general merchandise, goods for processing, goods procured in foreign ports by domestic carriers, and non-monetary gold.
Imports of Services
Imports of services consist of the following services purchased by residents from non-residents: transportation; travel; communications; construction; insurance; financial; computer and information; royalties and licence fees; other business services; personal, cultural, and recreational services; and government services n.i.e.
Imports of Goods And Services
Imports of goods and services consist of purchases, barter, or receipts of gifts or grants, of goods and services by residents from non-residents; the treatment of exports and imports in the SNA is generally identical with that in the balance of payments accounts as described in the Balance of Payments Manual.
Imputed Tourism Consumption
Consists of imputations made for the consumption by visitors of certain goods and services for which they do not make a payment. Imputation is confined to a small number of cases where a reasonably satisfactory basis for the valuation of the implied transaction is available, and where their inclusion is consistent with the production boundary in the core national accounts.
Inbound Travel Travel to a country by non-residents is called inbound travel.
Inbound Trip An inbound trip is one with a main destination outside the country of residence of the visitor.
Inbound Tourism
The travel of inbound visitors is called inbound tourism. It comprises the activities of a non-resident visitor within the country of reference on an inbound tourism trip.
Inbound Tourism Consumption
Inbound tourism consumption is the tourism consumption of a non-resident visitor within the economy of reference.
Input-Output Model
It provides a detailed breakdown of economic activity among business industries and a detailed breakdown of their inputs and outputs by commodity associated with some arbitrarily fixed exogenous demand. It also provides supply requirements from

Region al Tourism Satellite Account– Chhattishgarh, 2009-10
|138| National Council of Applied Economic Research
other sources such as imports and government production of goods and services. The input-output model is a structural model dealing primarily with resource allocation in the economy corresponding to an exogenously given demand.
Input-Output Tables
Input-output tables are derived from Supply and Use Tables, which show the process of flows of goods and services through the economic system between producers and consumers. The transactors involved in the production process are individuals (persons or households), establishments (production units of businesses and governments), non-business entities such as non-profit institutions, and governments. An input-output table presents a detailed analysis of the process of production and the use of goods and services (products) and the income generated in that production.; they can be either in the form of (a) supply and use tables or (b) symmetric input-output tables. These tables include the Imports Use and Domestic Use matrices, industry by industry and product by product matrices plus the Leontief inverse, multipliers and other analyses of their structure.
Intermediate Consumption
Intermediate consumption consists of the value of the goods and services consumed as inputs by a process of production, excluding fixed assets whose consumption is recorded as consumption of fixed capital; the goods or services may be either transformed or used up by the production process.
Intermediate Output
That part of the total output of each industry consumed by other industries in the production process.
Internal Tourism
Comprises domestic tourism and inbound tourism, that is, the activities of resident and non-resident visitors within the country of reference as part of domestic or international tourism trips.
Internal Tourism Consumption
Internal tourism consumption is the tourism consumption of both resident and non-resident visitors within the economy of reference. It is the sum of domestic tourism consumption and inbound tourism consumption.
International Tourism
Comprises inbound tourism and outbound tourism, that is, the activities of resident visitors outside the country of reference, either as part of domestic or outbound tourism trips and the activities of non-resident visitors within the country of reference on inbound tourism trips.

Region al Tourism Satellite Account– Chhattishgarh, 2009-10
|139| National Council of Applied Economic Research
International Tourism Consumption
Also referred to as internal tourism consumption by international visitors. Consists of the tourism consumption within the economy by non-residents on tourism related products.
International Travellers
Those who undertake international travel are considered as international travellers.
International Visitor
An international traveller qualifies as an international visitor with respect to the country of reference if: (a) he/she is on a tourism trip and (b) he/she is a non-resident travelling in the country of reference or a resident travelling outside of it.
ISIC ISIC is the United Nations International Standard Industrial Classification of All Economic Activities; the third revision of ISIC is used in the 1993 SNA.
Leontief Inverse (Input-Output) Table
The columns of the Leontief inverse (input-output) table show the input requirements, both direct and indirect, on all other producers, generated by one unit of output
Main Destination
The main destination of a tourism trip is defined as the place visited that is central to the decision to take the trip.
Main Purpose of A Trip
The main purpose of a trip is defined as the purpose in the absence of which the trip would not have taken place. The main purpose of a trip is one of the criteria used to determine whether the trip qualifies as a tourism trip and the traveller qualifies as a visitor. If the main purpose is to be employed and earn income (compensation for the labour input provided), then the trip cannot be a tourism trip and the individual taking the trip cannot be considered as a visitor (even though it is outside his/her usual environment and for less than 12 months), but as an “other traveller”.
Margin This is the difference between the resale price of a good and the cost to the retailer or wholesaler of the good sold. A transport margin consists of the transport charges invoiced separately by the producer in the delivery of a good.
Margin (Trade) A trade margin is the difference between the actual or imputed price realised on a good purchased for resale (either wholesale or retail) and the price that would have to be paid by the distributor to

Region al Tourism Satellite Account– Chhattishgarh, 2009-10
|140| National Council of Applied Economic Research
replace the good at the time it is sold or otherwise disposed of.
Margin (Transport)
A transport margin consists of those transport charges paid separately by the purchaser in taking delivery of the goods at the required time and place.
Multipliers An I-O multiplier is a quantitative measure created by a particular I-O based economic model. It is an analytical answer to a hypothetical question about how a certain expenditure is expected to impact the economy. The multipliers allow users to make estimates of the whole economy impacts of small changes in the economy.
National Tourism
Comprises domestic tourism and outbound tourism, that is, the activities of resident visitors within and outside the country of reference, either as part of domestic or outbound tourism trips.
National Tourism Consumption
National tourism consumption is the tourism consumption of resident visitors, within and outside the economy of reference. It is the sum of domestic tourism consumption and outbound tourism consumption.
Net Taxes on Products
Also referred to as taxes less subsidies on products. A tax or subsidy on a product is payable per unit of a good or service. The tax or subsidy may be a specific amount of money per unit of quantity of a good or service (quantity being measured either in terms of discrete units or continuous physical variables such as volume, weight, strength, distance, time, etc.), or it may be calculated ad valorem as a specified percentage of the price per unit or value of the goods or services transacted. A tax or subsidy on a product usually becomes payable when the product is produced, sold or imported, but it may also become payable in other circumstances, such as when a good is exported, leased, transferred, delivered, or used for own consumption or own capital formation. See also Other taxes on production and Taxes less subsidies on production and imports.
Other Taxes on Production
Consist of all taxes that enterprises incur as a result of engaging in production, except taxes on products. Other taxes on production include: taxes related to the payroll or workforce numbers excluding compulsory social security contributions paid by employers and any taxes paid by the employees themselves out of their wages or salaries; recurrent taxes on land, buildings or other structures; some business and professional licences where no

Region al Tourism Satellite Account– Chhattishgarh, 2009-10
|141| National Council of Applied Economic Research
service is provided by the Government in return; taxes on the use of fixed assets or other activities; stamp duties; taxes on pollution; and taxes on international transactions. See also Taxes less subsidies on production and imports.
Outbound Tourism
The travel of outbound visitors is called outbound tourism. It comprises the activities of a resident visitor outside the country of reference, either as part of an outbound tourism trip or as part of a domestic tourism trip.
Outbound Tourism Consumption
Outbound tourism consumption is the tourism consumption of a resident visitor outside the economy of reference. Also referred to as tourism imports. Consists of the tourism consumption by resident visitors outside of the economy while on an international trip.
Outbound Trip An outbound trip is one with a main destination outside the country of residence of the visitor.
Outbound Travel
Travel outside a country by residents is called outbound travel.
Output Output consists of those goods or services that are produced within an establishment that become available for use outside that establishment, plus any goods and services produced for own final use.
Output Multiplier
Output multiplier for a particular industry is defined to be the total of all outputs from each domestic industry required in order to produce one additional unit of output: that is, the column sums (Σi ) from Leontief inverse matrix (Lij).
Principal Activity
The principal activity of a producer is the activity whose value added exceeds that of any other activity carried out within the same unit. The output of the principal activity must consist of goods or services that are capable of being delivered to other units even though they may be used for own consumption or own capital formation.
Principal Usual Activity Status of Persons
The activity status of a person during the reference period of 365 days preceding the date of survey, which is determined on the basis of a person spending relatively longer time (i.e. major time criterion). Based on this a person is categorised as those (a) belonging to labour force and (b) not belonging to the labour force

Region al Tourism Satellite Account– Chhattishgarh, 2009-10
|142| National Council of Applied Economic Research
('neither working nor available for work'). Within the labour force, the criteria of (i) 'working' and (ii) ‘not working but seeking and/or available for work’ is again based on the major time criterion. The principal status workers are from (i) whereas the subsidiary status workers can be from either or both of (i) and (ii).
Principal Product
The principal product of an industry is the characteristic or main product produced by the relevant industry. Producing units are classified to industries according to which products they make. If they produce more than one product, they are classified according to whichever accounts for the greatest part of their GVA.
Production Production is an activity, carried out under the responsibility, control and management of an institutional unit that uses inputs of labour, capital and goods and services to produce outputs of other goods and services.
Production Account
The production account records the activity of producing goods and services as defined within the SNA; its balancing item, gross value added, is a measure of the contribution to GDP made by an individual producer, industry or sector.
Products Products, also called “goods and services”, are the result of production; they are exchanged and used for various purposes: as inputs in the production of other goods and services, as final consumption or for investment.
Purchaser’s Price
The purchaser’s price is the amount paid by the purchaser, excluding any deductible VAT or similar deductible tax, in order to take delivery of a unit of a good or service at the time and place required by the purchaser; the purchaser’s price of a good includes any transport charges paid separately by the purchaser to take delivery at the required time and place.
Same Day Visitor
A visitor (domestic, inbound or outbound) is classified as a same-day visitor (or excursionist) if his/her trip does not include an overnight stay.
Social Transfers in Kind
Social transfers in kind consist of social security and social assistance benefits in kind together with goods and services provided to individual household outside any social insurance scheme by non-market producers owned by government units or non-profit institutions (NPIS).

Region al Tourism Satellite Account– Chhattishgarh, 2009-10
|143| National Council of Applied Economic Research
Subsidies Subsidies are current unrequited payments that government units, including non-resident government units, make to enterprises on the basis of the levels of their production activities or the quantities or values of the goods or services which they produce, sell or import. They include the financing of deficits on public trading services deliberately run at a loss. There are two types, see subsidies on production and subsidies on products.
Subsidy on a Product
A subsidy on a product is a subsidy payable per unit of a good or service produced, either as a specific amount of money per unit of quantity of a good or service or as a specified percentage of the price per unit; it may also be calculated as the difference between a specified target price and the market price actually paid by a buyer. These are subsidies based on a quantity or value of goods or services sold.
Supply The supply of a good or service is the sum of the values of its domestic output (from all sectors), plus imports, c.i.f. when measured at basic prices. At purchasers’ prices, trade and transport margins and net taxes on products are also added.
Supply Table The main body of the Supply Table shows estimates of domestic industries’ output by type of product at basic prices. The columns represent the supplying industries and the rows represent the products supplied. Additional columns covering imports of goods and services, distributors’ trading margins and taxes (less subsidies) on products are added to show supply of all goods and services at purchasers’ prices.
Supply and Use Tables
Supply and use tables are in the form of matrices that record how supplies of different kinds of goods and services originate from domestic industries and imports and how those supplies are allocated between various intermediate or final uses, including exports.
Tax on a Product
A tax on a product is a tax that is payable per unit of some good or service, either as a specified amount of money per unit of quantity or as a specified percentage of the price per unit or value of the good or service transacted.
Taxes Taxes are compulsory, unrequited payments, in cash or in kind, made by institutional units to government units; they are described as unrequited because the government provides nothing in return

Region al Tourism Satellite Account– Chhattishgarh, 2009-10
|144| National Council of Applied Economic Research
to the individual unit making the payment, although governments may use the funds raised in taxes to provide goods or services to other units, either individually or collectively, or to the community as a whole.
Taxes on Production and Imports
Taxes on production and imports consist of taxes payable on goods and services when they are produced, delivered, sold, transferred or otherwise disposed of by their producers plus taxes and duties on imports that become payable when goods enter the economic territory by crossing the frontier or when services are delivered to resident units by non-resident units; they also include other taxes on production, which consist mainly of taxes on the ownership or use of land, buildings or other assets used in production or on the labour employed, or compensation of employees paid.
Taxes on Products
Taxes on products, excluding VAT, import and export taxes, consist of taxes on goods and services that become payable as a result of the production, sale, transfer, leasing or delivery of those goods or services, or as a result of their use for own consumption or own capital formation. These taxes are defined as product specific taxes, for example: value added tax, excise duties, air passenger tax, insurance premium tax and import duties, and are based on the volume or value of production sold.
Total Economy The total economy consists of all the institutional units which are resident in the economic territory of a country.
Total Final Expenditure
This is the sum total of final consumption, gross capital formation and exports of goods and services. Total final expenditure is the same as total demand by final buyers and is equal to total final output.
Total Intermediate Consumption
The total intermediate consumption of each industry is the industry’s total purchases of the outputs of other industries as well as purchases of imports of goods and services and intra-industry purchases for use in its production process. This is adjusted for the change in inventories of materials and fuels and excludes primary inputs.
Total Tourism Internal Demand
Total tourism internal demand, is the sum of internal tourism consumption, tourism gross fixed capital formation and tourism collective consumption. It does not include outbound tourism consumption.

Region al Tourism Satellite Account– Chhattishgarh, 2009-10
|145| National Council of Applied Economic Research
Total Output The total output of an industry is the aggregate value of the goods and services together with the work-in-progress produced by the industry. It is equal to the value of the industry’s sales plus any increase (and less any decrease) in the value of its inventories of finished products and work-in progress. Output is thus measured after deducting holding gains. The outputs of the distribution and service trades industries are measured on a ‘gross margin’ basis.
Taxes Less Subsidies on Production and Imports
Defined as ‘taxes on products’ plus ‘other taxes on production’ less 'subsidies on products' less 'other subsidies on production'. The taxes do not include any taxes on the profits or other income received by an enterprise. They are payable irrespective of the profitability of the production process. They may be payable on the land, fixed assets or labour employed in the production process, or on certain activities or transactions.
Tourism Comprises the activities of visitors.
Tourism Characteristic Industries
Are those industries that would either cease to exist in their present form, producing their present product(s), or would be significantly affected if tourism were to cease. Under the international TSA standards, core lists of tourism characteristic industries, based on the significance of their link to tourism in the worldwide context, are recommended for implementation to facilitate international comparison. Some countries use the criteria of at least 25 per cent of an industry’s output must be consumed by visitors to be a country-specific tourism characteristic industry.
Tourism Characteristic Products
These are defined in the international TSA standards as those products which would cease to exist in meaningful quantity, or for which sales would be significantly reduced, in the absence of tourism. Under the international TSA standards, core lists of tourism characteristic products, based on the significance of their link to tourism in the worldwide context, are recommended for implementation to facilitate international comparison. It is also recommended in the international TSA standards that country-specific tourism characteristic products are identified.
Tourism Connected Industries
Are those, other than tourism characteristic industries, for which a tourism related product is directly identifiable (primary) to, and where the products are consumed by visitors in volumes which are significant for the visitor and/or the producer. All other industries are

Region al Tourism Satellite Account– Chhattishgarh, 2009-10
|146| National Council of Applied Economic Research
classified as non-tourism industries, though some of their products may be consumed by visitors and are included in the calculation of direct tourism gross value added and direct tourism GDP.
Tourism Connected Products
Are those that are consumed by visitors but are not considered as tourism characteristic products. All other products in the supply and use table not consumed by visitors are classified as 'all other goods and services' in the TSA.
Tourism Consumption
Tourism consumption has the same formal definition as tourism expenditure. Nevertheless, the concept of tourism consumption used in the TSA goes beyond that of tourism expenditure. Actually, besides “the amount paid for the acquisition of consumption goods and services, as well as valuables for own use or to give away, for and during tourism trips” that corresponds to monetary transactions (the focus of tourism expenditure), it also includes services associated with vacation accommodation on own account, tourism social transfers in kind, and other imputed consumption. These transactions need to be estimated using sources different from information collected directly from the visitors such as reports on home exchanges, estimations of rents associated to vacation homes, calculations of FISIM, etc.
Tourism Demand
Expenditure made by, or on behalf of, the visitor before, during and after the trip and which expenditure is related to that trip and which trip is undertaken outside the usual environment of the visitor.
Tourism Direct Gross Domestic Product (TDGDP)
Tourism direct gross domestic product is the sum of the part of gross value added (at basic prices) generated by all industries in response to internal tourism consumption plus the amount of net taxes on products and imports included within the value of this expenditure at purchasers’ prices.
Tourism Direct Gross Value Added (TDGVA)
Tourism direct gross value added is the part of gross value added generated by tourism industries and other industries of the economy that serve directly visitors in response to internal tourism consumption.
Tourism Expenditure
The amount paid for the acquisition of consumption goods and services as well as valuables, for own use or to give away, for and during tourism trips. It includes expenditures by visitors themselves as well as expenses that are paid for or reimbursed by others.

Region al Tourism Satellite Account– Chhattishgarh, 2009-10
|147| National Council of Applied Economic Research
Tourism Exports
Tourism exports are domestically produced goods and services consumed by international visitors to the country.
Tourism Industry Ratio
This is the proportion of the total value added of an industry which is related to tourism.
Total Tourism Internal Demand
Computed by adding tourism internal consumption (domestic and inbound tourism consumption) with other components of internal demand, such as tourism collective consumption and tourism gross fixed capital formation.
Tourism Imports
Tourism imports are consumption of overseas produced goods and services by residents on overseas trips.
Tourism Net Taxes on Products
Consists of taxes paid less subsidies received on tourism related products which is attributable to productive activity of tourism related industries that are in a direct relationship with visitors. In the case of goods purchased by visitors, only the net taxes attributable to the value of retail trade services on those goods will be included.
Tourism Product Ratio
This is the proportion of the total supply of a product which is consumed by visitors.
Tourism Ratio For each variable of supply in the TSA, the tourism ratio is the ratio between the total value of tourism share and total value of the corresponding variable in the TSA expressed in percentage form.
Tourism Share Tourism share is the share of the corresponding fraction of internal tourism consumption to each component of supply. For each industry, the tourism share of output (in value), is the sum of the tourism share corresponding to each product component of its output.
Tourism Single Purpose Consumer Durable Goods
Tourism single-purpose consumer durables are a specific category of consumer durable goods that include durable goods that are used exclusively, or almost exclusively by individuals while on tourism trips.
Tourism Satellite Account
Tourism Satellite Account consists in analyzing in detail all the aspects of demand for goods and services which might be associated with tourism, in establishing the actual interface with the supply of such goods and services within the economy of

Region al Tourism Satellite Account– Chhattishgarh, 2009-10
|148| National Council of Applied Economic Research
reference, or outside and in describing how this supply (from domestic or imported origin) interacts with other economic activities, using the SUT as a reference.
Tourist A visitor (domestic, inbound or outbound) is classified as a tourist (or overnight visitor) if his/her trip includes an overnight stay.
Tourism Trip Trips which are undertaken by visitors.
Tourism Visit The term tourism visit refers to a stay in a place visited during a tourism trip. However, while discussing the different forms of tourism (domestic, inbound and outbound), the term visitor is often used instead of tourism visit or tourism trip.
Travel Travel refers to the activity of travellers.
Transportation in Balance of Payments Statistics
Transportation (BoP item 205) covers services provided by all modes of transportation - sea, air, and other, which includes space, rail, road, inland waterway and pipeline - that are performed by residents of one economy for those of another. The different types of services offered include transport of passengers, transport of freight and other supporting and auxiliary services (e.g., storage and warehousing).
Travel in Balance of Payments Statistics
The item Travel (BoP item 236) consists of goods and services which are acquired by residents who stay abroad or foreign travellers on the national territory for less than one year. Note that international transportation costs of the traveller to destination are recorded under the heading "transportation", but all movements within the country, including cruises, are entered under "travel".
Traveller A traveller is someone who moves between different geographic locations for any purpose and any duration. Travel within a country by residents is called domestic travel. Travel to a country by non-residents is called inbound travel, whereas travel outside a country by residents is called outbound travel. Those who undertake travel, be it domestic, inbound or outbound, will be called domestic, inbound or outbound travellers, respectively.
Trip A trip refers to the travel by a person from the time of departure from his usual residence until he/she returns to the same place: it thus refers to a round trip. A trip is made up of visits to different

Region al Tourism Satellite Account– Chhattishgarh, 2009-10
|149| National Council of Applied Economic Research
places. An inbound trip will correspond to the travel between arriving in a country and leaving, whereas a domestic trip or an outbound trip will correspond to the travel between leaving the place of residence and returning. A domestic trip has a main destination in the country of residence of the traveller, while an outbound trip has a main destination outside this country.
TSA Aggregates The compilation of the following aggregates, which represent a set of relevant indicators of the size of tourism in an economy is recommended: Internal tourism expenditure; Internal tourism consumption; Gross value added of the tourism industries (GVATI); Tourism direct gross value added (TDGVA); Tourism direct gross domestic product (TDGDP)
Uses The term refers to transactions in the current accounts that reduce the amount of economic value of a unit or sector, for example, wages and salaries are a type of use for the unit or sector that must pay them. By convention, uses are on the left-hand side of SNA accounts.
Usual Environment
The geographical area (though not necessarily a contiguous one) within which an individual conducts his/her regular life routines. This is made up of one or more areas in which a person undertakes their regular activities such as their residence, place of work, place of study and other places frequently visited. The usual environment criteria has two dimensions – frequency (places that are visited on a routine basis) and distance (locations close from home for overnight trips).
Usual Expenditures
In addition to the usual expenditures made by visitors while travelling (or preparing to travel) on commodities such as transport, meals or accommodation, these expenditures cover, inter alia, expenses incurred for the purposes of travel, such as suitcases which may be purchased some time before the planned trip. On the other hand, the measure excludes expenditure on capital equipment or other capital acquisition that may be made by a businessman while on a trip (even if that were the reason for the trip). If the trip were paid for by a non-visitor (such as parents paying for their child to visit them from abroad), it would be included because the expenditure was made on behalf of the visitor.

Region al Tourism Satellite Account– Chhattishgarh, 2009-10
|150| National Council of Applied Economic Research
Valuables Valuables are produced assets that are not used primarily for production or consumption, that are expected to appreciate or at least not to decline in real value, that do not deteriorate over time under normal conditions and that are acquired and held primarily as stores of value.
Visitor A visitor is a traveller taking a trip to a main destination outside his/her usual environment for less than a year and for any main purpose (business, leisure or other personal purpose) other than to be employed by a resident entity in the country or place visited.
_____________________

Region al Tourism Satellite Account– Chhattishgarh, 2009-10
|151| National Council of Applied Economic Research
APPENDIX

Region al Tourism Satellite Account– Chhattishgarh, 2009-10
|152| National Council of Applied Economic Research

Region al Tourism Satellite Account– Chhattishgarh, 2009-10
|153| National Council of Applied Economic Research
APPENDIX
ESTIMATION PROCEDURE
A.1. The unit-level data (micro-data) of the survey provides the estimated number of trips for both “last 30 days” and “last 365 days”. However, estimated number of trips by different categories such as main destination of trip, purpose and types of trip, mode of travel, etc. is available only for “last 30 days” and not for “last 365 days”. Therefore, to arrive at the estimates for “last 365 days”, it is assumed that the joint distribution for the last 365 days for households/trips/visitor-trips is the same as the joint distribution obtained for the last 30 days.
A.2. Accordingly, the distribution of trips by purpose of travel for “last 30 days” is applied on the marginal total estimated number of trips for “last 365 days” to arrive at the estimated number of trips by purpose of travel for the “last 365 days”. Also obtained is the estimated number of trips originating from each state when their main destination is the state of reference.
A.3. Further, the survey data provides information on item-wise expenditure incurred during the latest 3 overnight trips only that were undertaken during the “last 30 days”. This information is neither available for all the trips undertaken during “last 30 days” nor for trips undertaken during “last 365 days”.
A.4. Therefore, it is assumed that the average expenditure per trip based on last 3 overnight trips during the last 30 days for any group of trips or visitor/trips remains invariant for the last 30 days. Also, average expenditure for last 30 days for any group of trips or a particular category of expenditure is assumed to be the same for the last 365 days.
A.5. Under these assumptions, average expenditure per overnight trip for a group or category of trip is obtained as the ratio of total estimated expenditure incurred on the group or category of overnight trips to the estimated number of overnight trips on the basis of the latest three trips during the last 30 days for which the expenditure has been reported.
A.6. This ratio multiplied with the estimated total number of overnight trips during the “last 365 days” gives the total estimated expenditure for all the trips taken during “last 365 days”. It should be noted that these estimates are obtained at state-level such that the expenditures refer to those trips which originate from any state of India (other than the state of reference) and whose main destination is the state of reference.

Region al Tourism Satellite Account– Chhattishgarh,2009-10
|154| National Council of Applied Economic Research
A.7. The DTS also recorded item-wise expenditure incurred by non-package tourists and a lump sum expenditure incurred by package tourists. In such cases, the package cost is distributed across the items of expenditure in the same structure as observed in the expenditure pattern of non-package tourists.
A.8. Hence total item-wise expenditure incurred by package as well as non-package tourists is arrived at.
A.9. Since the reference period of DTS is 2008-09 whereas TSA is prepared for 2009-10, the expenditure data obtained from DTS are inflated for 2009-10 using the PFCE deflator.

Prin
ted
in In
dia
at: w
ww
.arc
hana
pres
s.co
m
NATIONAL COUNCIL OF APPLIED ECONOMIC RESEARCHParisila Bhawan, 11 Indraprastha Estate, New Delhi 110002, IndiaTel: + 91 11 2337 9861-3 Fax: + 91 11 2337 0164 Email: [email protected]
Related Documents