Regional Technical Assistance Consultant’s Report This consultant’s report does not necessarily reflect the views of ADB or the Government concerned, and ADB and the Government cannot be held liable for its contents. (For project preparatory technical assistance: All the views expressed herein may not be incorporated into the proposed project’s design. TA No. 6069-REG January 2010 National Performance Assessment and Subregional Strategic Environment Framework in the Greater Mekong Subregion (Financed by the ADB, GEF, UNEP and IGES/NIES) For Asian Development Bank

Welcome message from author
This document is posted to help you gain knowledge. Please leave a comment to let me know what you think about it! Share it to your friends and learn new things together.
Transcript
Regional Technical Assistance Consultant’s Report
This consultant’s report does not necessarily reflect the views of ADB or the Government concerned, and ADB and the Government cannot be held liable for its contents. (For project preparatory technical assistance: All the views expressed herein may not be incorporated into the proposed project’s design.
TA No. 6069-REG January 2010
National Performance Assessment and Subregional Strategic Environment Framework in the Greater Mekong Subregion (Financed by the ADB, GEF, UNEP and IGES/NIES)
For Asian Development Bank
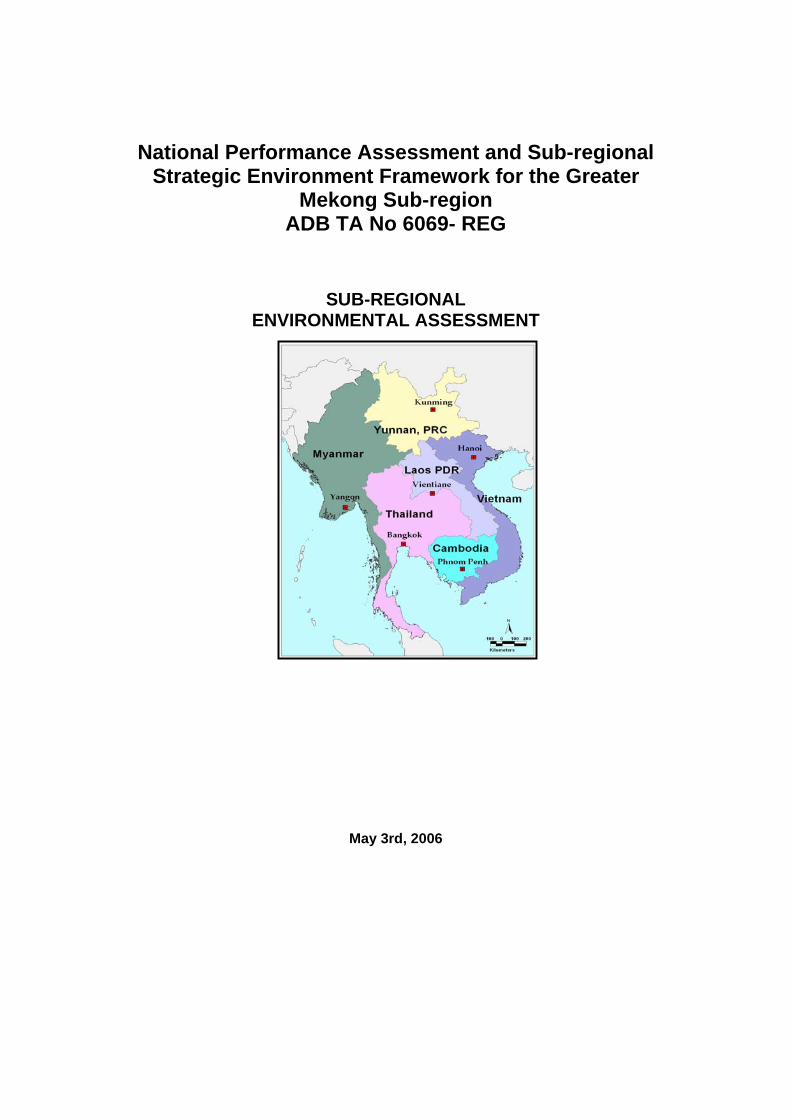
National Performance Assessment and Sub-regional Strategic Environment Framework for the Greater
Mekong Sub-region ADB TA No 6069- REG
SUB-REGIONAL ENVIRONMENTAL ASSESSMENT
May 3rd, 2006
TA 6069 SEF II, Sub-regional Environment Assessment Report (Draft)
i
TABLE OF CONTENTS
1. INTRODUCTION ...................................................................................................... 5 1.1. Background......................................................................................................... 5 1.2. Assessment of Performance in a Trans-boundary Context................................. 6
2. SUB-REGIONAL PRIORITY CONCERNS ........................................................... 11 2.1. Threats to the Mekong’s Vital Functions.......................................................... 11
2.1.1. The Context............................................................................................... 11 2.1.2. Application of P-S-R Model ..................................................................... 11 2.1.3. Initial Choice of Indicators ....................................................................... 13 2.1.4. A Closer Look at ‘Fisheries’..................................................................... 15 2.1.4.1. The State Indictors ................................................................................ 15 2.1.4.2. The Pressure Indicators......................................................................... 17 2.1.4.3. The Response Indicators ....................................................................... 18 2.1.4.4. Conclusions........................................................................................... 18 2.1.5. A Closer Look at ‘Navigation’ ................................................................. 19 2.1.5.1. The State Indicators .............................................................................. 19 2.1.5.2. The Pressure Indicators......................................................................... 20 2.1.5.3. The Response Indicators ....................................................................... 20 2.1.5.4. Conclusions........................................................................................... 21 2.1.6. Summary and Conclusions ....................................................................... 21
2.2. Illegal Trade in Wildlife Resources .................................................................. 22 2.2.1. The Context............................................................................................... 22 2.2.2. Application of P-S-R Model ..................................................................... 23 2.2.3. The State Indicators .................................................................................. 23 2.2.4. The Pressure Indicators............................................................................. 26 2.2.5. The Response Indicators ........................................................................... 29 2.2.6. Summary and Conclusions ....................................................................... 32
2.3. Remaining Biodiversity .................................................................................... 34 2.3.1. The Context............................................................................................... 34 2.3.2. Application of P-S-R Model ..................................................................... 36 2.3.3. The Pressure Indicator .............................................................................. 36 2.3.4. The State Indicator.................................................................................... 37 2.3.5. The Response Indicator............................................................................. 38 2.3.6. Summary and Conclusions ....................................................................... 41
2.4. Degree of Harmonization of Policies and Standards ........................................ 42 2.4.1. The Context............................................................................................... 42 2.4.2. Environmental Policies and Standards...................................................... 43 2.4.3. Objective and Scope of the Review.......................................................... 43 2.4.4. Environmental/NRM Policies and Plans in GMS Countries .................... 44 2.4.5. Environmental Quality Standards in GMS Countries............................... 46 2.4.6. Degree of Harmony in Policies................................................................. 48 2.4.6.1. Biodiversity........................................................................................... 49 2.4.6.2. Forest Resources ................................................................................... 49 2.4.6.3. Water Resources ................................................................................... 50
TA 6069 SEF II, Sub-regional Environment Assessment Report (Draft)
ii
2.4.6.4. Land Degradation.................................................................................. 51 2.4.6.5. Fisheries ................................................................................................ 52 2.4.6.6. Future Directions .................................................................................. 52 2.4.7. Degree of Harmony in Standards.............................................................. 53 2.4.7.1. Water Quality........................................................................................ 53 2.4.7.2. Air Quality ............................................................................................ 54 2.4.7.3. Forest Cover.......................................................................................... 55 2.4.7.4. Future Directions .................................................................................. 56 2.4.8. Sub-regional Cooperation Initiatives ........................................................ 56 2.4.9. Challenges to Sub-regional Cooperation .................................................. 60 2.4.10. GMS Environment Management Institutional Framework ...................... 61 2.4.11. Summary and Conclusions ....................................................................... 64
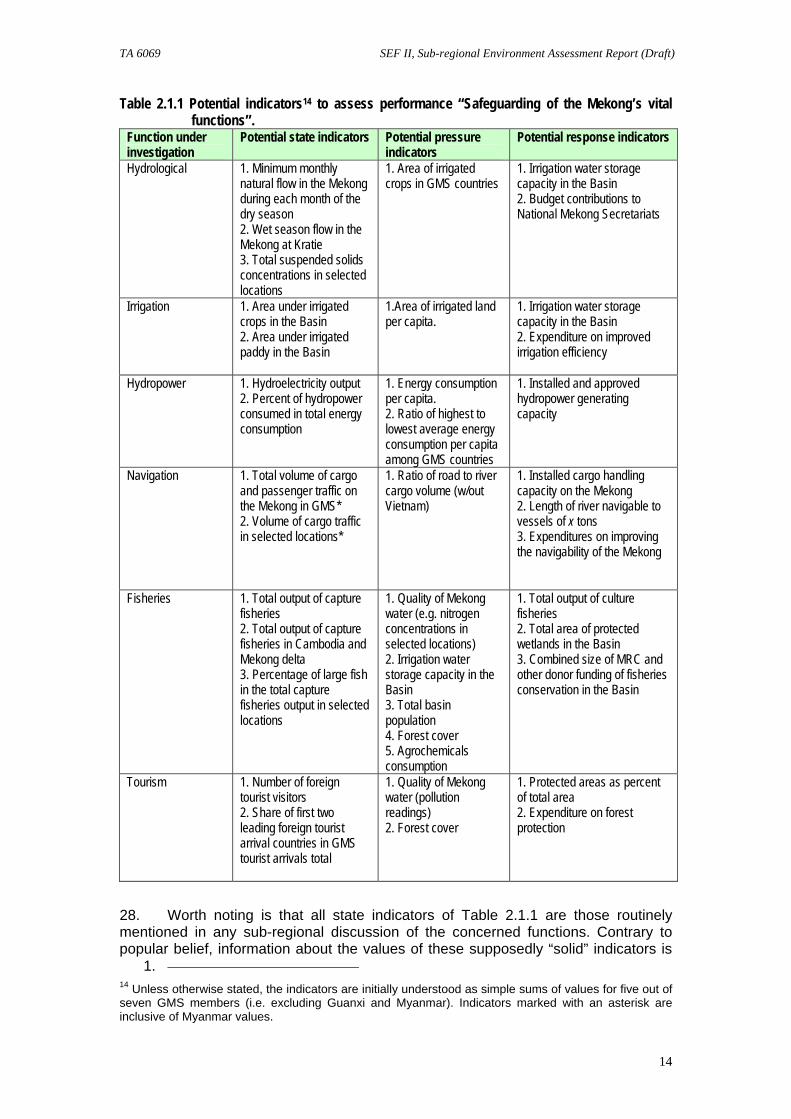
2.5. Environmental Sustainability Index.................................................................. 65 2.5.1. The Context............................................................................................... 65 2.5.2. Development of GMS Environmental Sustainability Index ..................... 66 2.5.3. Primary Results......................................................................................... 68 2.5.4. Summary and Conclusions ....................................................................... 69
3. CONCLUSIONS and RECOMMENDATIONS ...................................................... 71 3.1. General Conclusions ......................................................................................... 71 3.2. Specific Recommendations............................................................................... 72
3.2.1. Vital Functions of the Mekong ................................................................. 72 3.2.2. Illegal Trade of Wildlife Resources.......................................................... 73 3.2.3. Remaining Biodiversity ............................................................................ 73 3.2.4. Degree of Harmonization of Policy and Standards................................... 74 3.2.5. Environmental Sustainability Index.......................................................... 75 References................................................................................................................. 77
Appendices Appendix I: P-S-R Performance Assessment Model
Appendix II: Factsheets for Illegal Trade in Wildlife Resources
Appendix III: Factsheets for Remaining Biodiversity
Appendix IV: Technical Documentation for Environmental Sustainability Index
TA 6069 SEF II, Sub-regional Environment Assessment Report (Draft)
iii
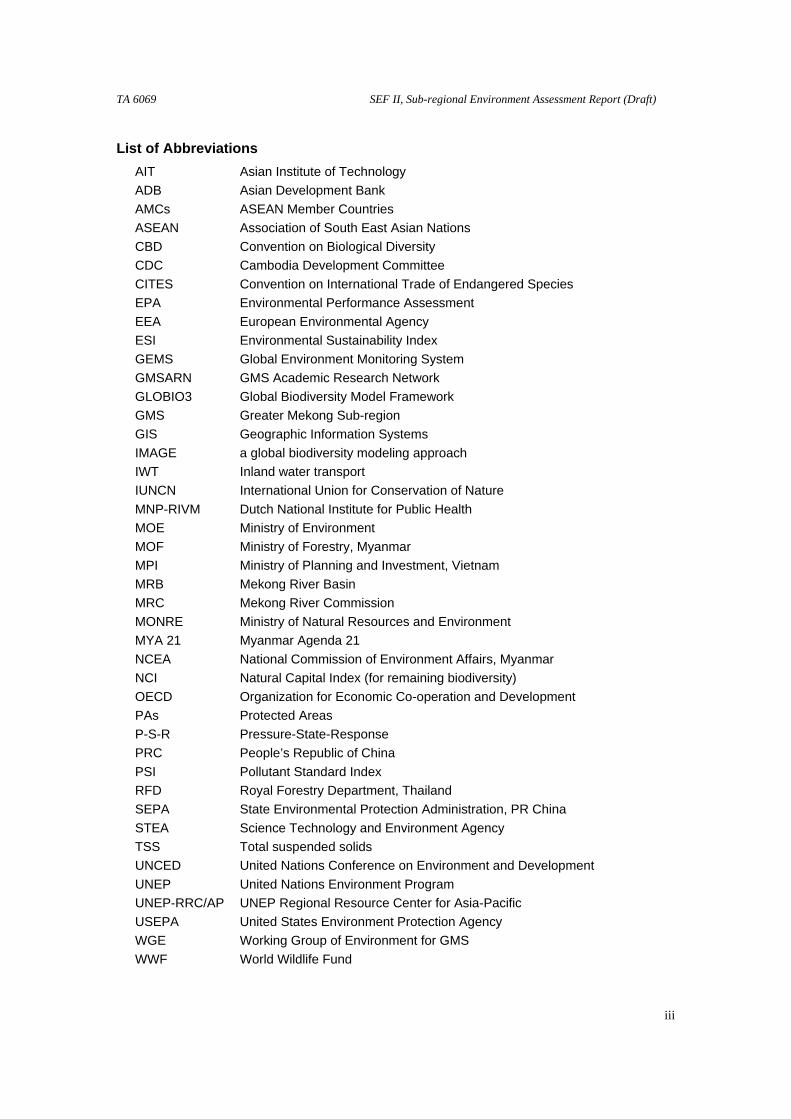
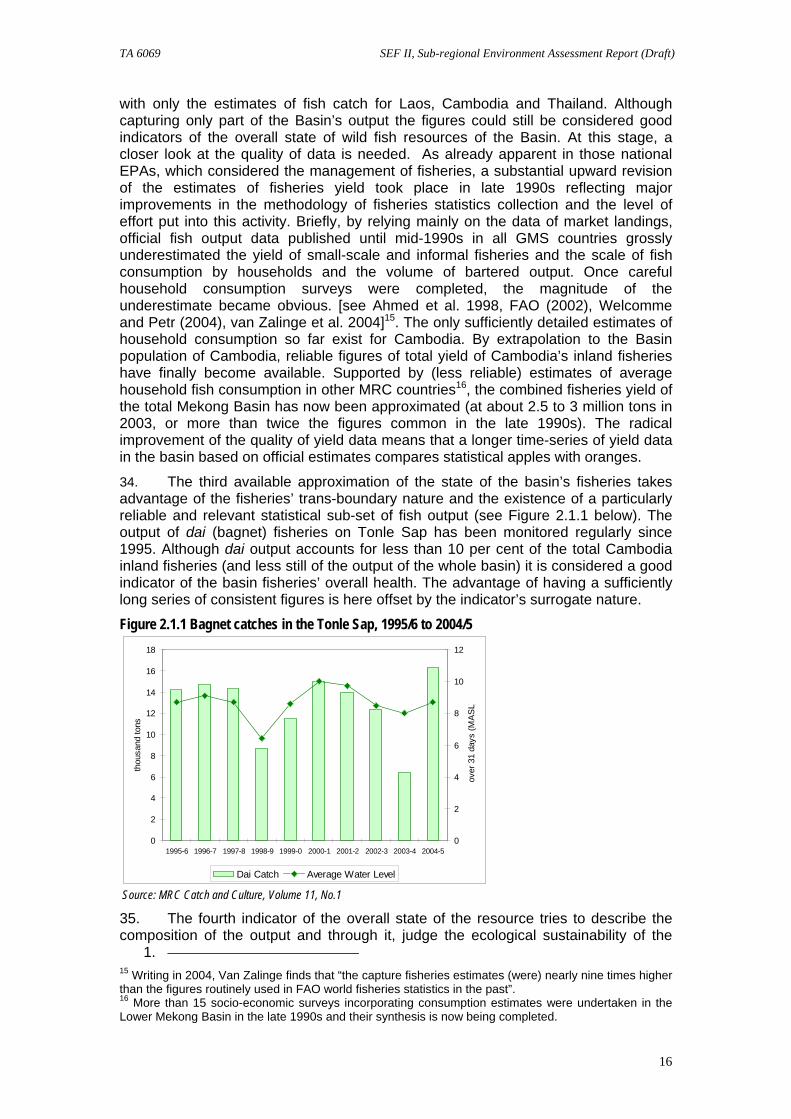
List of Abbreviations AIT Asian Institute of Technology ADB Asian Development Bank AMCs ASEAN Member Countries ASEAN Association of South East Asian Nations CBD Convention on Biological Diversity CDC Cambodia Development Committee CITES Convention on International Trade of Endangered Species EPA Environmental Performance Assessment EEA European Environmental Agency ESI GEMS
Environmental Sustainability Index Global Environment Monitoring System
GMSARN GMS Academic Research Network GLOBIO3 Global Biodiversity Model Framework GMS Greater Mekong Sub-region GIS Geographic Information Systems IMAGE a global biodiversity modeling approach IWT Inland water transport IUNCN International Union for Conservation of Nature MNP-RIVM Dutch National Institute for Public Health MOE Ministry of Environment MOF Ministry of Forestry, Myanmar MPI Ministry of Planning and Investment, Vietnam MRB Mekong River Basin MRC Mekong River Commission MONRE Ministry of Natural Resources and Environment MYA 21 Myanmar Agenda 21 NCEA National Commission of Environment Affairs, Myanmar NCI Natural Capital Index (for remaining biodiversity) OECD Organization for Economic Co-operation and Development PAs Protected Areas P-S-R Pressure-State-Response PRC People’s Republic of China PSI Pollutant Standard Index RFD Royal Forestry Department, Thailand SEPA State Environmental Protection Administration, PR China STEA Science Technology and Environment Agency TSS UNCED
Total suspended solids United Nations Conference on Environment and Development
UNEP United Nations Environment Program UNEP-RRC/AP UNEP Regional Resource Center for Asia-Pacific USEPA United States Environment Protection Agency WGE Working Group of Environment for GMS WWF World Wildlife Fund

TA 6069 SEF II, Sub-regional Environment Assessment Report (Draft)
iv
YNEPB Yunnan Environment Protection Bureau
TA 6069 SEF II, Sub-regional Environment Assessment Report (Draft)
5
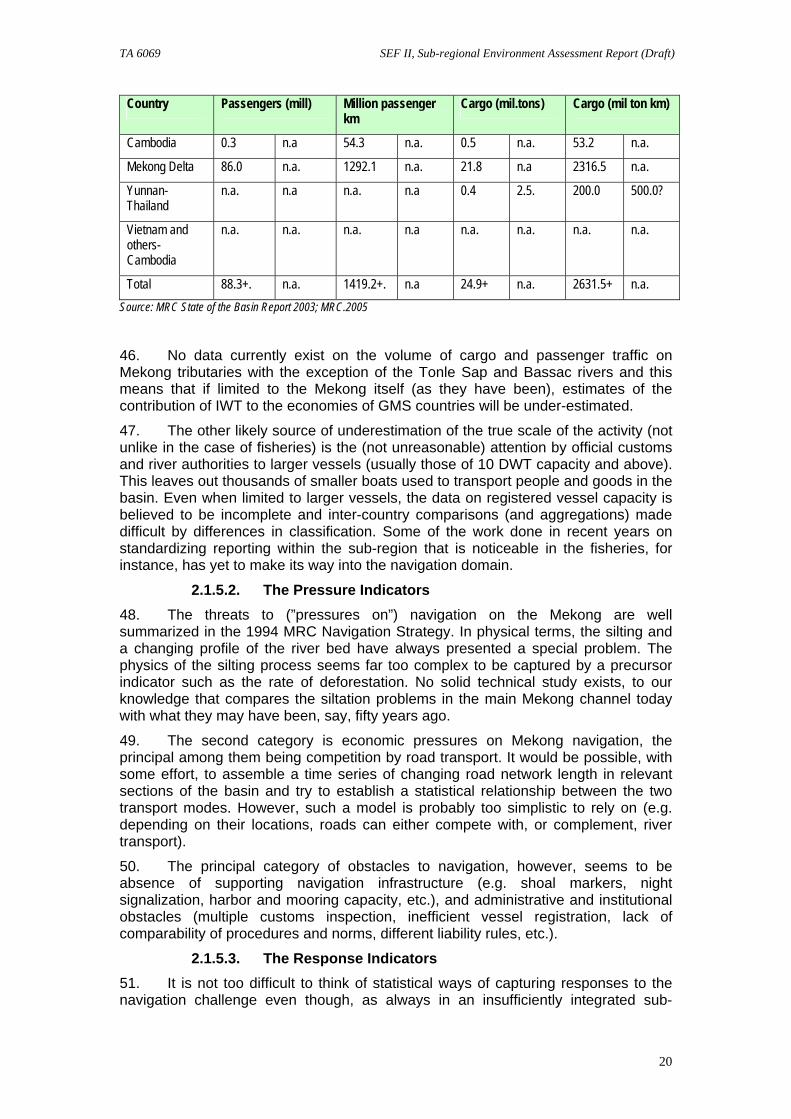
1. INTRODUCTION
1.1. Background 1. The principal objective of the National Performance Assessment and a Strategic Environmental Framework for the Greater Mekong Sub-region Project (“SEF II Project”) is to develop and mainstream a systematic approach to assessing environmental performance in GMS. This is to happen, first of all, at the national level (“How have we done, as a country, in addressing the most important environmental concerns?”), but the approach is to be extended both to local and sub-regional levels. The national and local EPAs (the latter in the form of case studies) are presented separately. In this volume, we deal with elements of sub-regional assessment (“How have we done, GMS as a whole, in addressing shared environmental concerns?”).
2. During the early phases of the SEF II Project, the Project GMS stakeholders identified the environmental concerns around which performance assessment was to be built. At the national level, these were grouped into up to thirteen (depending on the country) categories following an internationally accepted approach. At the sub-regional level, the concerns considered to be of the greatest common interest were three: (1) threats to the Mekong’s vital functions, (2) illegal trade in wildlife resources, and, by extension, biodiversity conservation (3) degree of harmonization of environmental policy and standards1. Performance assessment at the sub-regional level conducted under the SEF II Project then tries to answer the question of how well the GMS sub-region has performed in relation to these concerns. In the course of SEF II implementation, the analysis of the above three concerns was supplemented by biodiversity modeling that calculates the impact of various human activities on biodiversity in the GMS region, and by a formulation of a GMS-wide environmental sustainability index (ESI).
3. Mainstreaming EPA in each of the GMS countries and the sub-region as a whole consists of technical tasks (such as developing suitable indicators of performance and backing them up by reliable data) and communication of the principal results to policy makers and the public. The technical part, especially its data component, is critical as we explain in the report. The dissemination aspect of EPA is also important. It demands simplification that can be a source of either strength or weakness. The risk of oversimplifying complex subjects for the sake of communicating more effectively with stakeholders cannot be dismissed easily. Neither can the risk of confusing a simplification that makes virtue out of absence of relevant data with a simplification supported by adequate information and its analysis. It is not difficult to say which variant of simplification we support here.
4. For these and other reasons, our objective has been relatively modest, namely to explore and illustrate the scope for a structured assessment of environmental performance of GMS or other sub-regional groupings within GMS such as the MRC group of countries. To do this, a brief methodological detour is required.
1. 1 SEF II was by no means the only opportunity where sub-regional environmental priorities were spelt out. Of several earlier efforts in this direction, the Mekong River Basin Diagnostic Study (or MRBDS), undertaken in 1994 and published in 1997, is perhaps the most influential even if limited to only the Mekong River Basin (MRB) countries. It identifies no fewer than 24 “key MRB environmental issues” subdivided into those relating to physical resources, ecological resources, quality of life, and development (the last used as something of a catch all category). In relation to information, MRBDS found it “either fragmented, outdated or simply lacking”. It went on to say that “basin-wide and unified inventories, assessments and monitoring of natural resources, ecosystems, flora and fauna, and sources of pollution and environmental degradation, all require quality data. Information management systems should consolidate data scattered in various agencies and projects to be consistent in format and quality to enable sharing by all in-country and external agencies, and the public” The perceived need was “to develop a data collection and management system designed to support Basin planning and management”. That was said in 1997. At various places in this volume we touch on the question of how much has changed since then, many a project later.
TA 6069 SEF II, Sub-regional Environment Assessment Report (Draft)
6
1.2. Assessment of Performance in a Trans-boundary Context 5. Performance assessment is a comparison of stated objectives with actual achievements. In the context of environmental management, it has come to be anchored in a pressure-state-response (P-S-R) model (see Appendix 1 for a diagrammatical presentation). In that model, rather than a result of unspecified forces, environmental outcomes (the environment’s state –or “S”) are understood to reflect the actions of man, either those that exacerbate the problem (depletion, degradation and other pressures –or “P”-- factors) or those that are intended to mitigate or overcome the problem (regulatory restrictions, rehabilitation investments and other responses –or “R”-- factors). By extending the range of perspectives from which environmental outcomes are described, a better and policy-relevant understanding is gained of the concerns under assessment.
6. In most situations, the number of pressure factors, state variables and types of responses affecting environmental outcomes will be large. Complex inter-relationships will often exist among them. Many specialists devote their time to describing selected segments of the P-S-R “circle”. For the purposes of communicating this complex reality to a wider audience, only the most telling of the P, S, and R factors are used to describe past trends, and through them, performance. The selected variables then become environmental indicators. Suitably analyzed and sometimes accompanied by rating (see also Appendix 1) they facilitate the assessment of performance. This process is what is meant by EPA in this and related reports, and what has been used to develop national and local EPAs.
7. To assess performance, those setting the targets of policy (typically, the values of S variables) and shaping the responses are identified and it is their performance that is discussed. This creates few problems in the case of national or local performance assessment where the agencies responsible for managing the environment, and the domestic sources of pressures are known. The same is usually not the case in a multinational setting unless the responsibilities for the formulation and achievement of targets are delegated to a supranational body. This has not happened in GMS where all powers related to environmental management remain vested in national authorities. The same applies to several other sub-regional agreements that are either a sub-set of GMS membership or an intersecting set2. For the time being, therefore, no single institution can be held responsible for GMS environmental performance, the actual outcomes instead being a complex sum of only partly coordinated (or uncoordinated) national decisions and national behaviors. In addition, the membership of the body that comes closest to potentially performing the multinational management role (i.e. the Mekong River Commission) is incomplete (the two upstream countries not being members).
8. A quick review of the regional institutional picture will confirm this characterization. The 1995 MRC-brokered Agreement on the Cooperation for the Sustainable Development of the Mekong Basin sets only non-quantified targets for the management of the Mekong water with parties committed to no more than trying to reach an agreement in future on what the target values should be3. MRC or any other transnational body lack the power to implement measures that might contribute towards reaching the stated objectives, such measures being undertaken (or not) by national authorities. The 2003 ASEAN Agreement on Trans-boundary Haze has a similar limiting structure as do international environment conventions and agreements. Each GMS country may make honest efforts to, say, protect biodiversity on its territory, exchange
1. 2 It is also not our intention here to discuss the complexities of regional environment governance. Interested reader is referred to Dore (2003).and Hirsh et al (2006) 3 The statement is not intended to minimize the political importance of the Agreement. Para. 21 below elaborates on the commitments under the 1995 Agreement.
TA 6069 SEF II, Sub-regional Environment Assessment Report (Draft)
7
data with its GMS neighbors or the convention secretariat and do a number of other things expected of it under the convention but the responsibility for sub-regional biodiversity-related objectives remains unassigned.
9. For now, therefore, sub-regional performance in the widely accepted sense of the term performance cannot be assessed. Note that this is different from saying that the degree to which the country’s institutions succeed in meeting the obligations placed on them by international conventions cannot be assessed. It can (and has been, to varying degrees, under national EPAs). It is also different from saying that no useful insights can be acquired about the state of environment in GMS as a whole or those interactions of economic activities and environmental outcomes in GMS cannot be further studied and modeled, including their trans-boundary dimensions. There is much that can be said about certain environmental parameters in the sub region and ample room –and a great need-- for better environmental information in all corners of GMS. However, no amount of such efforts and technological sophistication can substitute for the reluctance of national governments to delegate some of their authority to trans-boundary entities or commit themselves to regionally determined benchmarks of national efforts4.
Sub-regional EPA : An alternative view
The position taken in this introduction on the preconditions for a meaningful sub-regional EPA is by no means the only one possible. Indeed the section dealing with biodiversity has adopted a more pragmatic approach noticeable, for instance, in the work of the European Environmental Agency (EEA). EEA puts emphasis not on the existence (or not) of EU-wide policy targets –even though a number of EU targets or standards do exist-- but rather on the use of identical indicators by each of its member countries. Once identical indicators are selected, a EU-wide assessment is no more (and no less) than a simple comparison or (depending on the context) a sum of national indicator values. Such simple comparisons or national indicator values can be rated either by reference to an average of national scores or to some other yardstick (e.g. EU emission standards). Under TA 6069, similar comparisons were (gingerly) made among GMS countries when interpreting the results of national EPA indicators such as the forest cover percentage. The biodiversity chapter of this volume refines this approach rather than questioning it. The alternative, given greater weight in the introduction, admits the possibility that in an interdependent trans-boundary setting (of which the Mekong basin is a very good example) a simple sum of national indicator values may not be a reliable indicator of how well the sub-region is performing. For instance, a large increase of forest cover in a less important part of the basin coexisting with a small decrease in a more important part may represent a deterioration overall, rather than an improvement. Similarly, comparisons with the sub-region’s averages will be valid if the desirable direction of action is the same in all of the sub-region’s constituent parts and if the desirable level of the average itself can be at least said to be higher or lower than the existing average but not otherwise (here, the reader is invited to engage in statistical experiments). Finally, the choice of identical indicators for each constituent part of the sub-region will facilitate sub-regional comparisons in one way (through standardization of indicators) but make it more difficult should the “prescribed” indicators be less meaningful in some of the sub-regional constituents.
1. 4 The theme of what and how much to delegate has permeated the work of MRC (and somewhat less so, GMS) over the years. A particularly apt example comes from the MRC Navigation Program. Referring to interventions needed to improve transboundary navigation, the Program notes: “In order to harmonize interventions, they should at least be defined and developed on a regional level. Implementation of interventions lends itself to national leadership. However, when national institutions are not yet sufficiently developed or where the size of the national waterborne transport sector cannot support fully fledged national institutions, regional institutions better support certain elements of implementation”. The document goes on to contrast the situation of the Mekong where no regional decision-making takes place at present with the Central Commission for Navigation on the Rhine. It concludes:..”future institutional structure of the MRC should at least ensure regional harmonization of interventions in the waterborne transport sector, but …cross-border navigation could be best supported when the MRC can reach binding decisions for its member states” MRC.2003. p.10). Much of what is said about navigation applies to other environment-related domains in the MRC zone and GMS.
TA 6069 SEF II, Sub-regional Environment Assessment Report (Draft)
8
The “EEA approach” can generate many interesting comparisons besides having the advantages of judging performance not by zeroing in on what was supposed to happen at the sub-region level (and either did or did not) bur rather by presenting outcomes in less “confrontational” terms, as cross-country comparisons. Finally, in relation to performance under global environmental concerns, the ambitious level of the global targets that makes the desirable direction of effort and indicator values the same in each country, makes simple comparisons with sub-region averages (let alone with global targets) meaningful. The view taken of the nature of sub-regional EPA will tend to influence future work priorities. Under the EEA approach, the first priority for GMS is to develop common and consistent indicators for each of the GMS countries. The absence of common indicators so far has undoubtedly deprived the sub-region of useful insight in all those cases where simple comparisons are valid. The alternative places greater emphasis in future efforts on spelling out the sub-regional objectives, creating a benchmark for performance evaluation, and assigning responsibility for the achievement of stated objectives.
10. While the absence of a trans-boundary management mandate and the non-binding nature of sub-regional environmental targets thus put in doubt the appropriateness of a performance-based approach in today’s institutional circumstances of the sub-region it is possible to take a more generous view of the scope for a meaningful environmental assessment at a sub-regional level. First it is possible to anticipate the emergence, over time, of shared trans-boundary targets that would go a long way towards making performance assessment possible5 . Indeed, as mentioned at the outset, one of the topics addressed in this volume is precisely the degree to which this is already taking place6. Second, it may be useful to view the performance assessment on a scale that begins with the least sophisticated (where sub-regional performance is no more than a simple sum of national environmental indicator values) and ends with the more intellectually satisfying (“true performance assessment”) variant described above.
11. While not sophisticated, a simple variant will often be not only useful but indispensable to future sub-regional action. For instance, any future harmonized action on fisheries management at a GMS-scale is unthinkable without “simple” summaries of national catches of wild fisheries. Such summaries may provide only an “S” or “P” parts of the P-S-R model but they help create the fundamentals of future, more complete, assessments. The above, namely attention to the degree to which different elements of future sub-regional performance assessment may exist or be under development, is the spirit in which the material of this sub-regional assessment has been developed.
12. Certain additional considerations apply to each of the sub-regional concerns addressed here. In connection with the assessment of illegal trade in wildlife and biodiversity conservation, the illegal aspect of the concern under scrutiny presents a particular challenge. Much more than in legal activities, the variable under scrutiny can only be guesstimated. It was for this reason and in order to capitalize on the work done at the national level, that the assessment under this concern was broadened to all aspects of biodiversity conservation in the GMS. Instruments that are available to control the illegal origins of some of the biodiversity loss become only one of the elements in that assessment.
13. In the biodiversity modeling work, a GLOBIO3 model was used. This is a P-S (pressure-state) model that derives biodiversity state as a weighted average of pressure
1. 5 Note, however, that even if there are such institutional breakthroughs, assessing performance requires a meaningful period of time during which the success of policies and institutional arrangements adopted can be judged. Performance assessment demands an introspective look, not a statement of what is planned for the future. 6 Here, a careful reading of basin-wide or GMS-wide strategies (for fisheries, navigation etc.) proves worthwhile for they sometimes contain elements of policy target quantification, direct or implied.
TA 6069 SEF II, Sub-regional Environment Assessment Report (Draft)
9
factors that include land use change, climate change, infrastructural development and pollution. The model’s output is the Natural Capital Index (NCI) or the remaining main species abundance, which compares the actual abundance of species relative to the abundance of these species in a pristine ecosystem. An overlay of NCI (as an “S” variable) with policy-related information (a response variable) is then used to estimate the significance of response and therefore completes the P-S-R type of analysis.
14. In the study of Mekong’s vital functions, one of the initial tasks is to choose and define these functions7. In terms of method, the functions are treated the same way as environmental concerns, i.e. as susceptible to being described (to varying degrees) in P-S-R terms. The mutually exclusive nature of the functions in some cases (e.g. fisheries vs. hydropower or fisheries vs. flood control) means that a better performance under one function may come at the expense of performance under other functions. It is unlikely that all performance indicators would point the same way (“improving”, “deteriorating”), even in an ideal world8.
15. The degree of harmonization of policy and targets reflects the forces that are influencing the environment policy framework in GMS, and its implementation and monitoring. Policy and environment standards setting is a complex process that needs to take into account the prevailing socio-economic profile of the country, the balance the country’s decision-makers are willing to strike between economic development and environment protection, availability of finance, existence of appropriate scientific and technical resources, role of the civil society, and others.
P-S-R model and its application Although the P-S-R model is something of a common methodological strand in this volume the reading of different chapters shows that the model has been applied with different degrees of depth and detail. The chapters dealing with biodiversity utilize it to the full and supplement the indicators with statistical factsheets (presented separately in the appendix) and rating. The section on the Mekong’s vital functions uses the model substantially (though not fully) without providing the statistical details or rating that the reader familiar with national EPA reports may be expecting. Similarly the section on harmonization of policy and standards does not utilize the P-S-R logic given the breadth of the topic and lack of quantified nature of policies and related discussion. After almost a decade and a half of international incantations of the model’s usefulness, the paucity of the model’s actual applications in Asia is striking. Read jointly with national EPAs, this volume may explain some of the reasons for this..
16. The Strategic Environment Framework II (SEF II) project aims to utilize the data and the systems generated by three previous environmental information projects to conduct environmental performance assessment (EPA) at both national and sub-regional levels. However, one problem encountered in the indicator selection is the heterogeneity among the countries, which makes it difficult to find common indicators for the sub-regional environmental performance assessment. Inspired by the achievements of ESI developed by Yale University and Columbia University, as well as
1. 7 In his message 2005 annual message, the Chairman of the MRC Council spoke of “the new orientation of the MRC to work towards Integrated Water Resources Management (IWRM) …providing MRC with an integrated approach for addressing development needs in the areas of navigation, flood management, fisheries, irrigation, hydropower, watershed management, environment management and human and institutional capacity” 8 In some cases (e.g. wild fisheries vs. flood protection) the functions are in direct conflict. The former benefits from the Mekong’s seasonal pulse, the latter’s principal purpose is to make the pulse smaller. In a situation where functions (or concerns) in a GMS- or basin-wide assessment are inter-related there will be many instances where the same indicator may appear several times in different “clothing”. For instance, combined storage capacity of water reservoirs may be an indicator of response under irrigation water management but an indicator of pressure under fisheries management.
TA 6069 SEF II, Sub-regional Environment Assessment Report (Draft)
10
other sustainability related indexes, this study is exploring the possibility of developing a common environmental sustainability indicator system for six GMS countries.
17. The modifications of the scope of sub-regional assessment in the course of TA 6069 implementation meant that the chapters of this volume were developed independently at first. Their integration into a single volume took place towards the very end this may explain the less-then-complete uniformity of presentation.
TA 6069 SEF II, Sub-regional Environment Assessment Report (Draft)
11
2. SUB-REGIONAL PRIORITY CONCERNS
2.1. Threats to the Mekong’s Vital Functions9 2.1.1. The Context
18. The Mekong River and the state of its basin help define GMS and are among the Sub-region’s key environmental determinants. The success of GMS countries in safeguarding the river’s vital functions is of obvious importance to five of GMS’s seven members (Guangxi not affected and Myanmar affected marginally) and of primordial importance to the downstream members (especially Cambodia and the Mekong delta in Vietnam).
19. Directly or indirectly, the fortunes of the river are linked to a number of economic and environmental considerations most of which have received attention, domestic as well donor-assisted. Both national authorities as well as regional and international bodies (especially the Mekong River Commission) have monitored some features of the Mekong and the basin, and much of this information is in the public domain. Whether related to wetlands or flood forecasting, to give just two examples, the body of work and comment is substantial. Indeed, each topic has spawned or has come to be associated with own institutions and discussion fora that continue to generate new results and insights. Despite –or perhaps because— of the wide scope of inquiry into problems associated with the Mekong, a concise picture of the Mekong vital functions is not easy to obtain, MRC’s State of the Basin a partial exception.
2.1.2. Application of P-S-R Model 20. Earlier on, in the introduction, the issue of simplification was raised. In this short report it would be presumptuous to try to reduce a subject of the ecological and socio-economic complexity of the Mekong’s vital functions to a form of digest that meets diverse reporting requirements of the GMS countries and their public. Furthermore, as we illustrate further below by reference to fisheries and navigation, much statistical work remains to be done before sub-regional assessments gain the necessary degree of credibility. Instead, the aim here is to explore and illustrate the scope for initiating a structured assessment of the Mekong’s vital functions that creates preconditions for a performance assessment, introduced at the very beginning of the paper. The intention is not to replicate (in miniature) the work of MRC that already monitors several vital hydrological and other parameters of the lower basin but to align this information with the “P-S-R” approach championed under the SEF II project.
21. As pointed out earlier, no quantified objectives have been set for the river and the basin by the riparian countries to this day although the 1995 Agreement on the Cooperation for the Sustainable Development of the Mekong River Basin (henceforth the 1995 Agreement, covering only the MRC members within the GMS grouping) identifies several parameters that deserve to be safeguarded10. Besides a general statement in favor of sustainable development of the Mekong River Basin to optimize multiple use and mutual benefits, the 1995 Agreement targets two hydrological parameters, namely:
1. 9 The authors of this chapter want to thank Hans Guttman, Suchart Ingthamjitr and Sin Chhay for advice and for facilitating access to data at MRC in March 2006. The opinions expressed here are, nevertheless, solely those of the authors. 10 See Phommachanh (2002) and Pichyakorn (2002) for detailed legal overviews of the 1995 Agreement.
TA 6069 SEF II, Sub-regional Environment Assessment Report (Draft)
12
i. acceptable minimum monthly natural flow in the Mekong during each month of the dry season;
ii. the wet season flow in the Mekong at Kratie that allows the reverse flow of the Tonle Sap to an agreed upon optimum level of the Great Lake;
22. The Agreement also provides for (iii) notification, prior consultation and evaluation on any proposed use for inter-basin diversions during the wet season from the mainstream as well as for intra-basin use or inter-basin diversions of these waters during the dry season, (iv) a call for “protection of the Mekong River Basin from pollution and other harmful effects resulting from any development plans and uses of water and related resources in the Basin” and, in Article 9, for (v) freedom of navigation.
23. The Mekong and its functions supply a particularly good illustration of the methodological difficulty, explained earlier on, of conducting environmental assessment in a trans-boundary context. The responsibility for achieving the targets, not specific enough, is not assigned whether this is under MRC, GMS or those global or multi-country international environmental and other conventions that come closest to relating to the Mekong’s vital functions, in particular the UN Convention on Biological Diversity, the Ramsar Convention on Wetlands (RC), CITES, and the UN Convention on EIA in a Trans-boundary Context11. The listing of obligations and objectives is extensive in each case and some quantified targets do exist (e.g. the obligation of RC contracting parties to designate at least one wetland area to be subjected to the provisions of the Convention) but the emphasis is on generalized responsibilities (e.g. to submit reports, prepare plans, pay the dues, etc.). Almost by definition, most programs of MRC (Integrated Water Resources Management Program (IWRM), Water Utilization Program (WUP), Fisheries Program etc.) target the Mekong’s vital functions. The targets implicit in these programs are typically of “improvement kind” only, i.e. the performance is measured by an un-quantified improvement over the (not always specified) baseline.
24. The institutional realities thus lower the applicability of performance-based approach to evaluating sub-regional environmental performance but they do not negate it completely. To start with, it is possible to simulate performance under assumed values of target variables. For instance, the success of GMS as a whole in ensuring the minimum inflow into the Tonle Sap during the dry season (to select one of the sub-regional objectives formulated in a non-quantified way in the 1995 Agreement) could be described in relation to different assumed values of a “reasonable” target (while waiting for the political process to lead to an agreement on what “reasonable” values might be12). The inflow data (the “S” variable in this case) could be then supplemented by several “P” and “R” indicators. An estimate of the volume of water used for irrigated agriculture in upstream locations (or proxies for this value such as acreage of irrigated crops) could be a succinct pressure indicator. In the absence of a single sub-regional management authority, the sub-regional
1. 11.The Convention (“Espoo Convention”) promoted by UN ECE has a European membership although several Asian countries of the former Soviet Union have recently joined. None of the GMS countries is among the signatories. Yet the demand for a transboundary agreement along the Espoo Convention lines in GMS clearly exists as shown by recent initiatives of MRC (see Horberry (2004)). In some cases, the Conventions have formulated sub-region-specific programs. Thus under the aegis of the Ramsar Convention, Mekong Wetlands Biodiversity Conservation and Sustainable Use Program (MWBP) is under formulation (2005). Other programs supported internationally with some links to international environmental conventions include, for instance, IUCN’s Water and Nature Initiative (WANI) that targets livelihood improvements through better management of water and wetland resources, or WWF Greater Mekong Program 12 Article 6 of the 1995 Agreement does call upon the Joint Committee to adopt guidelines for the location and level of flows. No such guidelines have been adopted yet.
TA 6069 SEF II, Sub-regional Environment Assessment Report (Draft)
13
responses would be some combinations of national responses (where these are of the same kind). Expenditure on improving irrigation efficiency might be one such indicator. To varying degrees, the approach could be generalized to other considerations. The “vital functions” would be first specified, and for each of them, the search for suitable P, S, and R indicators could begin. When it does, it soon becomes clear that the principal conceptual difficulty (as opposed to statistical difficulties that are many and described later) lies on the side of response indicators given the often different responses to sub-regional problems by the national authorities or different interpretations of what the problem is and what therefore an appropriate response should be. Put differently, while it may not be difficult to think of GMS-wide pressures, GMS-wide responses have been few and largely limited to consultations. Rather than the interplay of the P, S and R indicators helping to illustrate the degree of success of the region in reaching (simulated or implied) targets, the interplay of P, S, and R in the current sub-regional setting would more likely to illustrate the consequences of insufficient harmonization of national decisions or, if the uncoordinated responses turned out to be effective, illustrate the irrelevance of sub-regional institutions.
2.1.3. Initial Choice of Indicators 25. In what follows, the vital functions of the Mekong are first identified based on the text of 1995 Agreement text where, besides the basic hydrological functions, they are described as those related to irrigation, hydro-power, navigation, fisheries, timber floating, recreation and tourism13 . A review of existing documentation reveals a very limited role of timber floating in the recent history of the Basin and timber floating is dropped from further inquiry. Second, tourism and recreation are considered as largely synonymous and merged into a single function.
26. For each function, a number of P, S and R indicators are formulated based on own interpretation of principal causal relationships. Here, a large body of analysis of different aspects of the Basin’s functioning (see the list of references for only a small selection) facilitates the initial identification of suitable indicators.
27. The results are summarized in Table 2.1.1 below. The number of indicators is deliberately kept to a small number because of the need to simplify (in order to communicate) and because of serious data weaknesses about which more is said below.
1. 13 In an ideal world, the optimal value of the target itself would be based on a basin-wide assessment of social benefits (inclusive of environmental benefits) under different target values, an exercise as complex technically as it would be politically.
TA 6069 SEF II, Sub-regional Environment Assessment Report (Draft)
14
Table 2.1.1 Potential indicators14 to assess performance “Safeguarding of the Mekong’s vital functions”.
Function under investigation
Potential state indicators Potential pressure indicators
Potential response indicators
Hydrological 1. Minimum monthly natural flow in the Mekong during each month of the dry season 2. Wet season flow in the Mekong at Kratie 3. Total suspended solids concentrations in selected locations
1. Area of irrigated crops in GMS countries
1. Irrigation water storage capacity in the Basin 2. Budget contributions to National Mekong Secretariats
Irrigation 1. Area under irrigated crops in the Basin 2. Area under irrigated paddy in the Basin
1.Area of irrigated land per capita.
1. Irrigation water storage capacity in the Basin 2. Expenditure on improved irrigation efficiency
Hydropower 1. Hydroelectricity output 2. Percent of hydropower consumed in total energy consumption
1. Energy consumption per capita. 2. Ratio of highest to lowest average energy consumption per capita among GMS countries
1. Installed and approved hydropower generating capacity
Navigation 1. Total volume of cargo and passenger traffic on the Mekong in GMS* 2. Volume of cargo traffic in selected locations*
1. Ratio of road to river cargo volume (w/out Vietnam)
1. Installed cargo handling capacity on the Mekong 2. Length of river navigable to vessels of x tons 3. Expenditures on improving the navigability of the Mekong
Fisheries 1. Total output of capture fisheries 2. Total output of capture fisheries in Cambodia and Mekong delta 3. Percentage of large fish in the total capture fisheries output in selected locations
1. Quality of Mekong water (e.g. nitrogen concentrations in selected locations) 2. Irrigation water storage capacity in the Basin 3. Total basin population 4. Forest cover 5. Agrochemicals consumption
1. Total output of culture fisheries 2. Total area of protected wetlands in the Basin 3. Combined size of MRC and other donor funding of fisheries conservation in the Basin
Tourism 1. Number of foreign tourist visitors 2. Share of first two leading foreign tourist arrival countries in GMS tourist arrivals total
1. Quality of Mekong water (pollution readings) 2. Forest cover
1. Protected areas as percent of total area 2. Expenditure on forest protection
28. Worth noting is that all state indicators of Table 2.1.1 are those routinely mentioned in any sub-regional discussion of the concerned functions. Contrary to popular belief, information about the values of these supposedly “solid” indicators is
1. 14 Unless otherwise stated, the indicators are initially understood as simple sums of values for five out of seven GMS members (i.e. excluding Guanxi and Myanmar). Indicators marked with an asterisk are inclusive of Myanmar values.
TA 6069 SEF II, Sub-regional Environment Assessment Report (Draft)
15
often alarmingly incomplete and unreliable as we argue below. Particularly weak is our ability to establish long-term trends, an essential requirement in most evaluations of performance of the kind attempted here. In most cases, the sub-regional state indicators, where produced, will be simple sums of country indicators. Here, several problems are common. First, data of several indicators are not available on a relevant geographic basis (e.g. data specific to Yunnan, let alone Yunnan’s portion of the basin, continue to be insufficient for most sub-regional assessment purposes, Vietnam does not separately report many important parameters for the Mekong delta sub-area, even some Thai data are not available separately for the Mekong basin). Second, even where available for the correct geographical sub-area, the data are unreliable and in some cases have been found to contain a systematic bias as we show below by reference to fisheries.
29. In the case of pressure indicators, Table 2.1.1 embodies common assumptions about the direction of causal relationships affecting the Mekong’s functions. Here, the challenge is either to choose from a large number of factors believed to play a role in final outcomes (with varying degrees of empirical support given to such a selection) as is the case in fisheries, for instance, or to guess what the most suitable indicators might be in a situation where adequate analyses are rare (e.g. in tourism). In addition to the statistical difficulties mentioned in connection with the state indicators, the aggregation of single country data to the whole basin will face additional challenges. One of them is that the most suitable pressure indicators need not be the same in each country. Given the vastly different scale of agriculture in the Thai portion of the basin and in Laos, for instance, a pressure indicator built around some dimension of agricultural intensification (e.g. consumption of agro-chemicals) may be a suitable indicator of pressure on fisheries in Thailand but not in Laos where the scale of water impoundment may be a more relevant indicator. The larger and more diverse the geographical area where environmental performance assessment is to take place, the greater the difficulty of selecting a small number of appropriate indicators.
30. As to response indicators, their choice requires, both at a national let alone at a sub-regional level, a far greater use of proxies since responses –where sub-regional responses exist at all-- are often of a discontinuous nature making is harder to construct consistent time series of the variable in question.
2.1.4. A Closer Look at ‘Fisheries’
31. Some of the general points made above can be applied to individual functions of the Mekong. In the first case we look at the fisheries. Other than hydrology, fisheries have received the greatest amount of attention as a sub-regional concern, mainly through the work of MRC and other donor-financed fisheries projects in the Lower Mekong Basin. How well have the fisheries done, sub-regionally speaking?
2.1.4.1. The State Indictors 32. The total (i.e. basin-wide) volume of capture fisheries has all the right features of a state indicator. If known over long enough a period (to ensure that what is monitored are sustainable levels of catch rather than unsustainable short-term changes) it provides vital information, and an essential ingredient of a more rounded analysis of the causes of yield changes and effectiveness of responses. How much is known about capture fisheries in GMS?
33. The first approximation, a sum of national data for each of the GMS countries (available, for instance, from the FAOSTAT database) turns out to be of little value even if a long time series does exist. No data for Yunnan, and for Myanmar’s and Vietnam’s portions of the basin exist and the national totals substantially distort the picture in our context. The second approximation accepts this drawback and works
TA 6069 SEF II, Sub-regional Environment Assessment Report (Draft)
16
with only the estimates of fish catch for Laos, Cambodia and Thailand. Although capturing only part of the Basin’s output the figures could still be considered good indicators of the overall state of wild fish resources of the Basin. At this stage, a closer look at the quality of data is needed. As already apparent in those national EPAs, which considered the management of fisheries, a substantial upward revision of the estimates of fisheries yield took place in late 1990s reflecting major improvements in the methodology of fisheries statistics collection and the level of effort put into this activity. Briefly, by relying mainly on the data of market landings, official fish output data published until mid-1990s in all GMS countries grossly underestimated the yield of small-scale and informal fisheries and the scale of fish consumption by households and the volume of bartered output. Once careful household consumption surveys were completed, the magnitude of the underestimate became obvious. [see Ahmed et al. 1998, FAO (2002), Welcomme and Petr (2004), van Zalinge et al. 2004]15. The only sufficiently detailed estimates of household consumption so far exist for Cambodia. By extrapolation to the Basin population of Cambodia, reliable figures of total yield of Cambodia’s inland fisheries have finally become available. Supported by (less reliable) estimates of average household fish consumption in other MRC countries16, the combined fisheries yield of the total Mekong Basin has now been approximated (at about 2.5 to 3 million tons in 2003, or more than twice the figures common in the late 1990s). The radical improvement of the quality of yield data means that a longer time-series of yield data in the basin based on official estimates compares statistical apples with oranges.
34. The third available approximation of the state of the basin’s fisheries takes advantage of the fisheries’ trans-boundary nature and the existence of a particularly reliable and relevant statistical sub-set of fish output (see Figure 2.1.1 below). The output of dai (bagnet) fisheries on Tonle Sap has been monitored regularly since 1995. Although dai output accounts for less than 10 per cent of the total Cambodia inland fisheries (and less still of the output of the whole basin) it is considered a good indicator of the basin fisheries’ overall health. The advantage of having a sufficiently long series of consistent figures is here offset by the indicator’s surrogate nature.
Figure 2.1.1 Bagnet catches in the Tonle Sap, 1995/6 to 2004/5
0
2
4
6
8
10
12
14
16
18
1995-6 1996-7 1997-8 1998-9 1999-0 2000-1 2001-2 2002-3 2003-4 2004-5
thou
sand
tons
0
2
4
6
8
10
12
ove
r 31
days
(MAS
L)
Dai Catch Average Water Level
Source: MRC Catch and Culture, Volume 11, No.1
35. The fourth indicator of the overall state of the resource tries to describe the composition of the output and through it, judge the ecological sustainability of the
1. 15 Writing in 2004, Van Zalinge finds that “the capture fisheries estimates (were) nearly nine times higher than the figures routinely used in FAO world fisheries statistics in the past”. 16 More than 15 socio-economic surveys incorporating consumption estimates were undertaken in the Lower Mekong Basin in the late 1990s and their synthesis is now being completed.
TA 6069 SEF II, Sub-regional Environment Assessment Report (Draft)
17
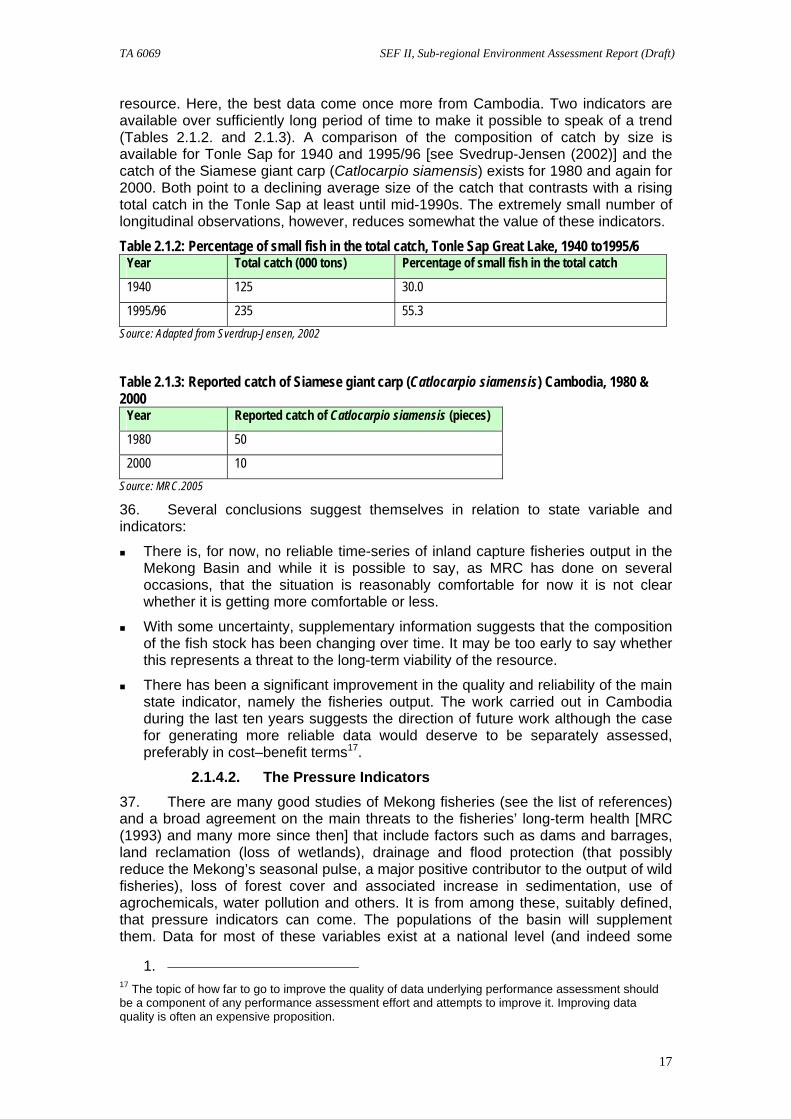
resource. Here, the best data come once more from Cambodia. Two indicators are available over sufficiently long period of time to make it possible to speak of a trend (Tables 2.1.2. and 2.1.3). A comparison of the composition of catch by size is available for Tonle Sap for 1940 and 1995/96 [see Svedrup-Jensen (2002)] and the catch of the Siamese giant carp (Catlocarpio siamensis) exists for 1980 and again for 2000. Both point to a declining average size of the catch that contrasts with a rising total catch in the Tonle Sap at least until mid-1990s. The extremely small number of longitudinal observations, however, reduces somewhat the value of these indicators.
Table 2.1.2: Percentage of small fish in the total catch, Tonle Sap Great Lake, 1940 to1995/6 Year Total catch (000 tons) Percentage of small fish in the total catch
1940 125 30.0
1995/96 235 55.3 Source: Adapted from Sverdrup-Jensen, 2002
Table 2.1.3: Reported catch of Siamese giant carp (Catlocarpio siamensis) Cambodia, 1980 & 2000
Year Reported catch of Catlocarpio siamensis (pieces)
1980 50
2000 10 Source: MRC.2005
36. Several conclusions suggest themselves in relation to state variable and indicators:
There is, for now, no reliable time-series of inland capture fisheries output in the Mekong Basin and while it is possible to say, as MRC has done on several occasions, that the situation is reasonably comfortable for now it is not clear whether it is getting more comfortable or less.
With some uncertainty, supplementary information suggests that the composition of the fish stock has been changing over time. It may be too early to say whether this represents a threat to the long-term viability of the resource.
There has been a significant improvement in the quality and reliability of the main state indicator, namely the fisheries output. The work carried out in Cambodia during the last ten years suggests the direction of future work although the case for generating more reliable data would deserve to be separately assessed, preferably in cost–benefit terms17.
2.1.4.2. The Pressure Indicators 37. There are many good studies of Mekong fisheries (see the list of references) and a broad agreement on the main threats to the fisheries’ long-term health [MRC (1993) and many more since then] that include factors such as dams and barrages, land reclamation (loss of wetlands), drainage and flood protection (that possibly reduce the Mekong’s seasonal pulse, a major positive contributor to the output of wild fisheries), loss of forest cover and associated increase in sedimentation, use of agrochemicals, water pollution and others. It is from among these, suitably defined, that pressure indicators can come. The populations of the basin will supplement them. Data for most of these variables exist at a national level (and indeed some
1. 17 The topic of how far to go to improve the quality of data underlying performance assessment should be a component of any performance assessment effort and attempts to improve it. Improving data quality is often an expensive proposition.
TA 6069 SEF II, Sub-regional Environment Assessment Report (Draft)
18
them have been generated in the course of the preparation of national EPAs). However, the aggregation of these figures into sub-regional indicators is not straightforward. As the Social Atlas of the Lower Mekong Basin [Hook et al (2003)] notes in relation to MRC countries, “getting comparable data for socio-economic indicators across four countries with differing social conditions, levels of development, and systems for the gathering and processing of statistics is necessarily a very difficult task. Given that data has been collected in Cambodia, Lao PDR, Thailand and Vietnam at different times using differing definitions and methodologies, it is often impossible to generate a dataset for an indicator that is perfectly comparable across the four countries. One major problem comes from having to compare data values that come from different years…..”. A review of what has been done in GMS to date shows that the only sub-regional time-series of pressure indicators relevant to fisheries that could be derived without major new statistical effort include only those of the basin population and some water quality parameters in selected locations (e.g. concentrations of N and TSS in selected locations). None of the others exist and their meaningful aggregation would require a level of effort that goes well beyond that available under SEF II Project.
2.1.4.3. The Response Indicators 38. No binding sub-regional policy targets on fish conservation and fisheries management exist in the Basin. At the same time, the extensive MRC fisheries program and other donor-supported fisheries activities can be said to be largely oriented towards ensuring sub-regional sustainability of the resource given the importance of regional training, co-ordination, and standardization elements in these activities. The deletion of components that are of purely national character is probably not practical and the combined expenditures under MRC fisheries program and other donor-funded fisheries activities could be considered an imperfect indicator of sub-regional response (accompanied by the usual assumption of complete harmony between donor funding and GMS countries’ intentions). The values of this indicator for the past decade could be generated.
39. The combined area of protected wetlands suggests itself as a possible indicator of sub-regional response as does, with less justification, an estimate of the total output of cultured fisheries.
2.1.4.4. Conclusions 40. It is possible, very imperfectly, to say what the state of the fish resources in the Mekong Basin. The information available makes it much more difficult to establish key trends. This is serious given the fisheries’ economic importance, for many years grossly underestimated.
41. The fisheries research of recent years presents well the complexity of the subject and interconnectedness. More than elsewhere, it forces the question of the legitimacy and form of indicator-driven simplifications. The tentative conclusion here is that it is possible and worthwhile to look for a small number of indicators provided attention to data, especially longitudinal data, is an integral part of this effort.
42. A sub-regional look at the fisheries provides a good illustration of the need for a P-S-R or similar structure of assessment of complex environmental management activities. Fisheries performance needs to be evaluated by reference to much more than output. The same widening of the assessment framework often generates important reminders of key links (e.g. the effect of sediment transport and seasonal fluctuations in the rive flow on fisheries yield).
TA 6069 SEF II, Sub-regional Environment Assessment Report (Draft)
19
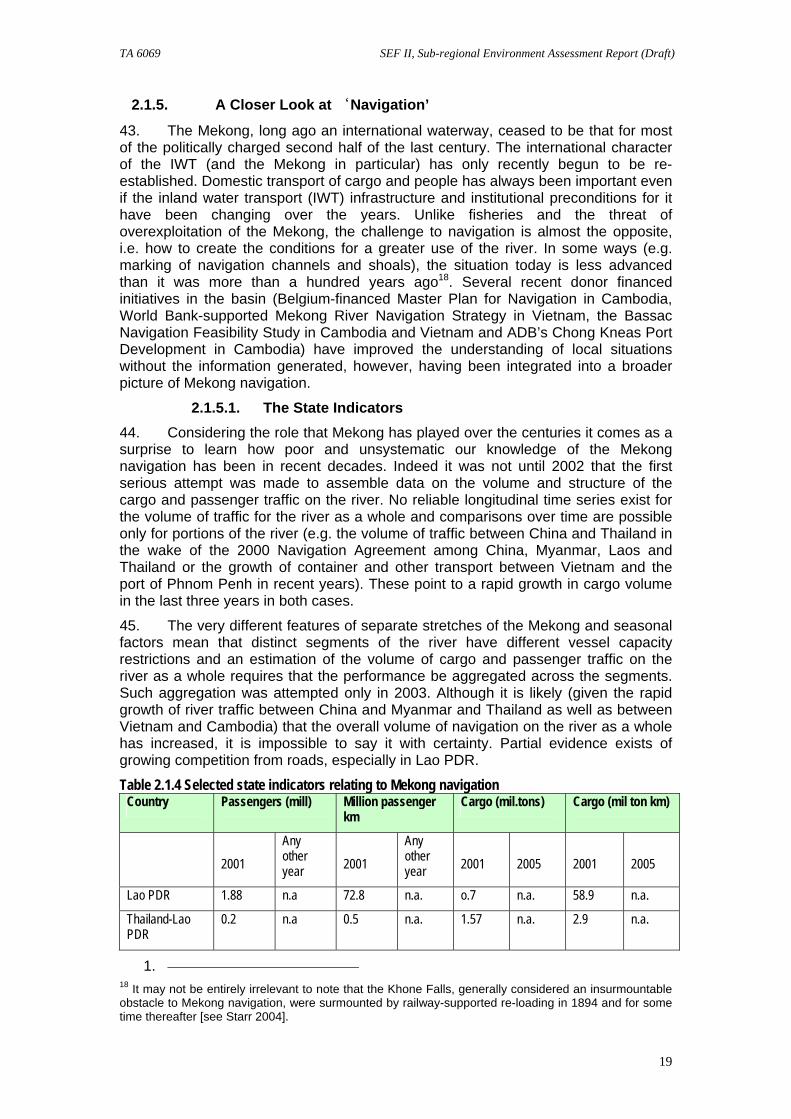
2.1.5. A Closer Look at ‘Navigation’
43. The Mekong, long ago an international waterway, ceased to be that for most of the politically charged second half of the last century. The international character of the IWT (and the Mekong in particular) has only recently begun to be re-established. Domestic transport of cargo and people has always been important even if the inland water transport (IWT) infrastructure and institutional preconditions for it have been changing over the years. Unlike fisheries and the threat of overexploitation of the Mekong, the challenge to navigation is almost the opposite, i.e. how to create the conditions for a greater use of the river. In some ways (e.g. marking of navigation channels and shoals), the situation today is less advanced than it was more than a hundred years ago18. Several recent donor financed initiatives in the basin (Belgium-financed Master Plan for Navigation in Cambodia, World Bank-supported Mekong River Navigation Strategy in Vietnam, the Bassac Navigation Feasibility Study in Cambodia and Vietnam and ADB’s Chong Kneas Port Development in Cambodia) have improved the understanding of local situations without the information generated, however, having been integrated into a broader picture of Mekong navigation.
2.1.5.1. The State Indicators 44. Considering the role that Mekong has played over the centuries it comes as a surprise to learn how poor and unsystematic our knowledge of the Mekong navigation has been in recent decades. Indeed it was not until 2002 that the first serious attempt was made to assemble data on the volume and structure of the cargo and passenger traffic on the river. No reliable longitudinal time series exist for the volume of traffic for the river as a whole and comparisons over time are possible only for portions of the river (e.g. the volume of traffic between China and Thailand in the wake of the 2000 Navigation Agreement among China, Myanmar, Laos and Thailand or the growth of container and other transport between Vietnam and the port of Phnom Penh in recent years). These point to a rapid growth in cargo volume in the last three years in both cases.
45. The very different features of separate stretches of the Mekong and seasonal factors mean that distinct segments of the river have different vessel capacity restrictions and an estimation of the volume of cargo and passenger traffic on the river as a whole requires that the performance be aggregated across the segments. Such aggregation was attempted only in 2003. Although it is likely (given the rapid growth of river traffic between China and Myanmar and Thailand as well as between Vietnam and Cambodia) that the overall volume of navigation on the river as a whole has increased, it is impossible to say it with certainty. Partial evidence exists of growing competition from roads, especially in Lao PDR.
Table 2.1.4 Selected state indicators relating to Mekong navigation Country Passengers (mill) Million passenger
km Cargo (mil.tons) Cargo (mil ton km)
2001
Any other year
2001
Any other year
2001
2005
2001
2005
Lao PDR 1.88 n.a 72.8 n.a. o.7 n.a. 58.9 n.a.
Thailand-Lao PDR
0.2 n.a 0.5 n.a. 1.57 n.a. 2.9 n.a.
1. 18 It may not be entirely irrelevant to note that the Khone Falls, generally considered an insurmountable obstacle to Mekong navigation, were surmounted by railway-supported re-loading in 1894 and for some time thereafter [see Starr 2004].
TA 6069 SEF II, Sub-regional Environment Assessment Report (Draft)
20
Country Passengers (mill) Million passenger km
Cargo (mil.tons) Cargo (mil ton km)
Cambodia 0.3 n.a 54.3 n.a. 0.5 n.a. 53.2 n.a.
Mekong Delta 86.0 n.a. 1292.1 n.a. 21.8 n.a 2316.5 n.a.
Yunnan-Thailand
n.a. n.a n.a. n.a 0.4 2.5. 200.0 500.0?
Vietnam and others-Cambodia
n.a. n.a. n.a. n.a n.a. n.a. n.a. n.a.
Total 88.3+. n.a. 1419.2+. n.a 24.9+ n.a. 2631.5+ n.a. Source: MRC State of the Basin Report 2003; MRC.2005
46. No data currently exist on the volume of cargo and passenger traffic on Mekong tributaries with the exception of the Tonle Sap and Bassac rivers and this means that if limited to the Mekong itself (as they have been), estimates of the contribution of IWT to the economies of GMS countries will be under-estimated.
47. The other likely source of underestimation of the true scale of the activity (not unlike in the case of fisheries) is the (not unreasonable) attention by official customs and river authorities to larger vessels (usually those of 10 DWT capacity and above). This leaves out thousands of smaller boats used to transport people and goods in the basin. Even when limited to larger vessels, the data on registered vessel capacity is believed to be incomplete and inter-country comparisons (and aggregations) made difficult by differences in classification. Some of the work done in recent years on standardizing reporting within the sub-region that is noticeable in the fisheries, for instance, has yet to make its way into the navigation domain.
2.1.5.2. The Pressure Indicators 48. The threats to (”pressures on”) navigation on the Mekong are well summarized in the 1994 MRC Navigation Strategy. In physical terms, the silting and a changing profile of the river bed have always presented a special problem. The physics of the silting process seems far too complex to be captured by a precursor indicator such as the rate of deforestation. No solid technical study exists, to our knowledge that compares the siltation problems in the main Mekong channel today with what they may have been, say, fifty years ago.
49. The second category is economic pressures on Mekong navigation, the principal among them being competition by road transport. It would be possible, with some effort, to assemble a time series of changing road network length in relevant sections of the basin and try to establish a statistical relationship between the two transport modes. However, such a model is probably too simplistic to rely on (e.g. depending on their locations, roads can either compete with, or complement, river transport).
50. The principal category of obstacles to navigation, however, seems to be absence of supporting navigation infrastructure (e.g. shoal markers, night signalization, harbor and mooring capacity, etc.), and administrative and institutional obstacles (multiple customs inspection, inefficient vessel registration, lack of comparability of procedures and norms, different liability rules, etc.).
2.1.5.3. The Response Indicators 51. It is not too difficult to think of statistical ways of capturing responses to the navigation challenge even though, as always in an insufficiently integrated sub-
TA 6069 SEF II, Sub-regional Environment Assessment Report (Draft)
21
regional setting, it will be difficult to separate truly sub-regional from national actions. The total volume of navigation on the Mekong may increase purely by increasing the traffic on the national segments of the river or by increasing trans-boundary traffic flow. And, to make matters more complicated, the trans-boundary traffic benefits from better national river infrastructure. While these questions can (and probably deserve to) be debated, the first priority remains to assemble data on the principal categories of responses regardless of how they are to be divided between national and sub-regional, i.e. indicators such as the length of Mekong (and Bassac) channels that can accommodate vessels of chosen minimum capacity, length of the channels equipped for night navigation, and combined capacity of river harbors. Institutional advances in facilitating the freedom and ease of navigation could be captured by the total expenditure by MRC and other donors on tackling legal and institutional obstacles to navigation. There are other potential indicators elements of which
52. At present, none of the above parameters is supported by well organized data and not surprisingly, any insights about the effectiveness of responses are few, both because the measures taken are too recent or because they apply to small portions of the river. If anything, available data suggest a very low level of national response though a somewhat greater responses by the donors (e.g. through the support of MRC’s navigation program)
2.1.5.4. Conclusions 53. The assessment conducted by MRC between 2002 and 2003 established a much overdue and welcome benchmark for future monitoring of several variables of interest. It appears, however, that the benchmark needs a number of additional elements and improvements to fulfill its role in monitoring the development of the Mekong’s navigation.
54. An uneven pattern of traffic growth has been taking place on the Mekong in the last five years, with the Simao-Luang Prabang and Mekong delta-Phnom Penh segments growing while no obvious trend is discernible for other stretches of the river.
55. The level and rate of national and sub-regional responses to various challenges to navigation improvements on the Mekong are poorly known making it difficult to assess their effectiveness.
2.1.6. Summary and Conclusions 56. A closer look at the statistical foundations of a structured assessment of the Mekong’s vital functions shows that major gaps and inaccuracies exist in several vital areas. This suggests that before such an assessment is formalized, the quality of the underlying information needs to be improved. Depending on the environmental concern under study, this improvement is either a matter of developing a benchmark where none exists or taking a hard look at the reliability of existing data.
57. Major improvements in the quality of the estimates of the basin’s yield of fisheries registered during the past decade and a drastic upward revision that has become necessary is an example of the scale of error that may go unnoticed in the study of the Mekong’s functions for a long period of time. The patient work of fishery statisticians and management specialists is also a powerful reminder of their work’s policy relevance. Only by deriving reliable estimates of long-term productivity of the resource can this resource be accurately valued and compared with other potential uses of the Mekong’s waters. That and similar comparisons are (or should be) at the heart of sub-regional decisions about how best to use the Mekong’s water for the often conflicting uses. They may also allow the national stakeholder more accurately judge how vital the “vital concerns” really are.
TA 6069 SEF II, Sub-regional Environment Assessment Report (Draft)
22
58. The P-S-R approach remains suitable for investigations of the Mekong’s vital functions despite continuing near-absence of quantified sub-regional environmental targets for which any sub-regional body is responsible.
2.2. Illegal Trade in Wildlife Resources 2.2.1. The Context
59. As mentioned in the introduction, the concern dealing with illegal trade in wildlife resources has been broadened to consider other sub-concerns to wildlife biodiversity, including illegal harvesting and trading. There are multiple reasons for this. One is to capitalize on the work already done at the national level to address other threats to biodiversity, other than illegal trade. This may in turn shed some light as to how much illegal trade has an impact on overall biodiversity conservation. Another reason is to focus on the variety of instruments that are available to conserve biodiversity and prevent illegal trade, including local laws and international conventions. But perhaps the most compelling reason is that the assessment of only the illegal activity would result in what is already well known as the root cause: lack of enforcement.
60. Looking again at the OECD assessment of biodiversity through its’ core indicators, a somewhat different approach is required in terms of selecting and defining indicators for performance assessment at the sub-regional level. Unlike national assessments where one indicator is representative of the country as a whole, a multi-national assessment requires identical or at least comparable indicators for each of the contributing countries. Fortunately in the concern of biodiversity conservation, some of these compatible and comparable indicators already exist.
61. While broadening the scope of the assessment there is also a requirement here to narrow down the contents of the assessment to what can reasonably be achieved within the limited timeframe and resources of the current project and perhaps more importantly, to what is within control of the GMS countries as a whole.
62. Illegal trade of wildlife resources is a global concern and the problem involves much more than the five countries and the one province of the GMS. There is probably more illegal trade of wildlife resources in and out of the GMS than there is within. There is also plenty of illegal trade of wildlife resources that happens outside the GMS. So unless the assessment is to be broadened to the entire globe, the assessment must be narrowed down to at least the wildlife resources of the sub-region. Furthermore, because some of those wildlife resources have a range outside the GMS, the assessment is further reduced to those wildlife resources that are endemic to the GMS.
63. Illegal trade of wildlife resources is normally understood as meaning illegal trade of “threatened species”. This again narrows down the current assessment to the threatened species that are endemic to the GMS. The current assessment is therefore hinged of the 109 threatened species that were identified as being endemic to the GMS through national and provincial threats to biodiversity assessments.
64. The 109 threatened species (see related fact sheet) include 35 mammals, 23 birds, 17 amphibians, 19 reptiles and 15 fish species, ranging in size from shrews and bats to monkeys and deer’s. Unfortunately it does not include some of the higher-priced game animals that are most often subject to illegal trade; these have a broader range outside the GMS.
65. As highlighted in the national assessments, there is currently very little meaning in the temporal aspect of the indicators developed from the 2004 IUCN Red List. The Red List has been in existence since 1996 but it is only until very recently

TA 6069 SEF II, Sub-regional Environment Assessment Report (Draft)
23
that temporal variations can be observed with confidence. To avoid confusion, the temporal aspect has been removed and the results of the analysis describe the situation as of the end of year 2004.
66. The contents of the assessment could have been broadened to some other scores of threatened species that are endemic to the GMS plus one or two neighboring countries. This however would have complicated the assessment because other jurisdictions come into play. Given more time and resources for database searching and analysis, the assessment could have been extended to the extinct, near threatened, lesser threatened and non-threatened species that are included in the IUCN Red List of Threatened Species. This remains an option for subsequent sub-regional assessments.
67. As a final note of introduction, it is to be remembered the P-S-R model and the set of indicators outlined below (and also the in the other chapter on Remaining Biodiversity) address only one of the many sub-concerns, which together constitute treats to biodiversity. As the CBD guidelines (UNEP/CBD/SDSTTA – 2003) on indicator development suggest, a small number (10-15) of “headline” or “aggregate” indicators can provide a high level overview of the overall concern to the public and politicians, but a larger number (50-150) of “core” indicators would be required to provide a more comprehensive picture across the range of policy issues included in action plans for policy makers.
2.2.2. Application of P-S-R Model 68. For the “Illegal Trade in Wildlife Resources” concern, the lack of a governing body to represent the GMS does not hinder the use of the P-S-R model to assess overall performance. Taking the OECD model and looking at the core indicators for the biodiversity concern, it is not the performance of the OECD office, which is being assessed, but rather the performance of each of the 30 member countries, which belong to the OECD. This same model can be applied to the assessment of biodiversity within the GMS.
69. For this particular concern however the illegal aspect of the concern presents a particular challenge. It is one thing to develop indicators around legal human activities such as logging, fishing or hunting but there are very few indicators developed around the illegal nature of those activities. Like illegal trade of wildlife resources, the pressures are well known, the activities are known to occur but the exact state of the activity can only be guesstimated, and the response is mainly a question of enforcement.
70. Conceptually, the P-S-R model could be applied to address the concern as defined in the original Kunming meeting. In practice however there would be very little data upon which to develop the state indicator and, being a trans-boundary concern, very little that individual GMS countries by themselves could do in response. For this reason and to capitalize on the work done at the national level, the concern for this assessment has been broadened to consider other aspects of biodiversity conservation in the GMS, with a focus on the instruments that are available to control the illegal nature of some of the loss of existing biodiversity.
2.2.3. The State Indicators 71. Consistent and comparable state indicators were developed in the national assessments to address the treats to biodiversity concern for all GMS parties, except for Thailand. The indicator was based on the number of threatened species as a percent of the number of globally threatened species, within each wildlife species group. The results of these national assessments (plus comparable figures for Thailand) are summarized in Table 2.2.1 below:
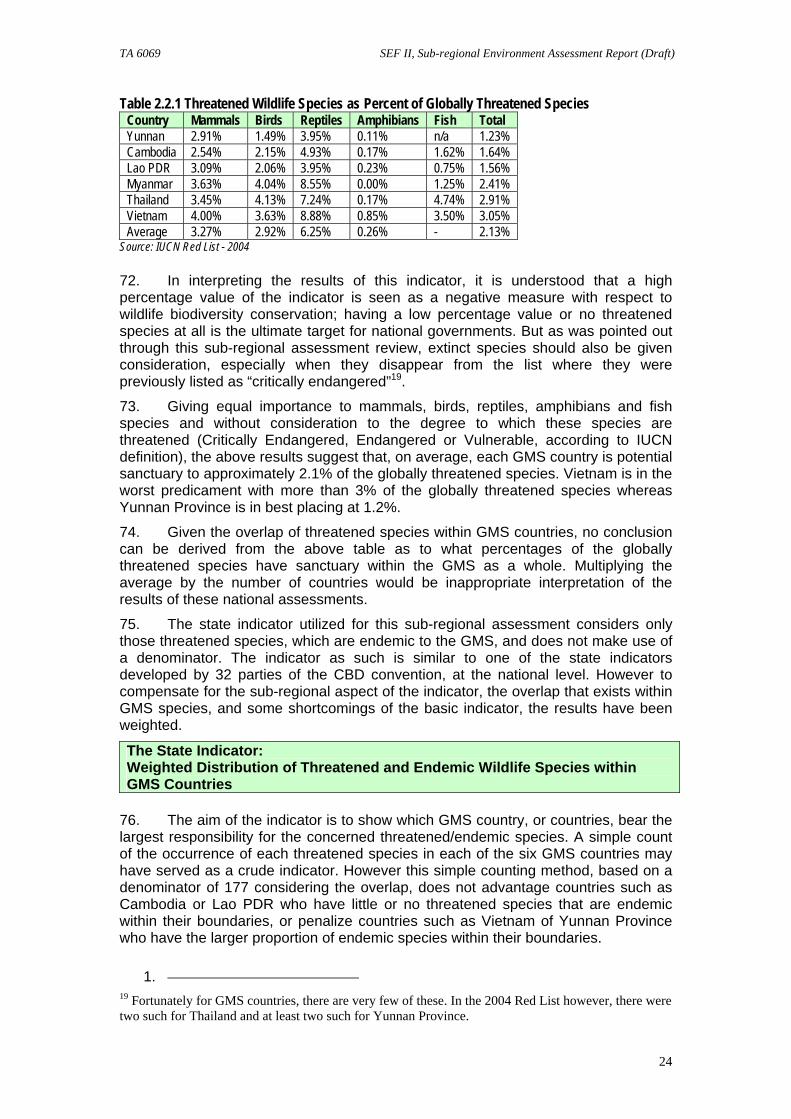
TA 6069 SEF II, Sub-regional Environment Assessment Report (Draft)
24
Table 2.2.1 Threatened Wildlife Species as Percent of Globally Threatened Species Country Mammals Birds Reptiles Amphibians Fish Total Yunnan 2.91% 1.49% 3.95% 0.11% n/a 1.23% Cambodia 2.54% 2.15% 4.93% 0.17% 1.62% 1.64% Lao PDR 3.09% 2.06% 3.95% 0.23% 0.75% 1.56% Myanmar 3.63% 4.04% 8.55% 0.00% 1.25% 2.41% Thailand 3.45% 4.13% 7.24% 0.17% 4.74% 2.91% Vietnam 4.00% 3.63% 8.88% 0.85% 3.50% 3.05% Average 3.27% 2.92% 6.25% 0.26% - 2.13%
Source: IUCN Red List - 2004 72. In interpreting the results of this indicator, it is understood that a high percentage value of the indicator is seen as a negative measure with respect to wildlife biodiversity conservation; having a low percentage value or no threatened species at all is the ultimate target for national governments. But as was pointed out through this sub-regional assessment review, extinct species should also be given consideration, especially when they disappear from the list where they were previously listed as “critically endangered”19.
73. Giving equal importance to mammals, birds, reptiles, amphibians and fish species and without consideration to the degree to which these species are threatened (Critically Endangered, Endangered or Vulnerable, according to IUCN definition), the above results suggest that, on average, each GMS country is potential sanctuary to approximately 2.1% of the globally threatened species. Vietnam is in the worst predicament with more than 3% of the globally threatened species whereas Yunnan Province is in best placing at 1.2%.
74. Given the overlap of threatened species within GMS countries, no conclusion can be derived from the above table as to what percentages of the globally threatened species have sanctuary within the GMS as a whole. Multiplying the average by the number of countries would be inappropriate interpretation of the results of these national assessments.
75. The state indicator utilized for this sub-regional assessment considers only those threatened species, which are endemic to the GMS, and does not make use of a denominator. The indicator as such is similar to one of the state indicators developed by 32 parties of the CBD convention, at the national level. However to compensate for the sub-regional aspect of the indicator, the overlap that exists within GMS species, and some shortcomings of the basic indicator, the results have been weighted.
The State Indicator: Weighted Distribution of Threatened and Endemic Wildlife Species within GMS Countries
76. The aim of the indicator is to show which GMS country, or countries, bear the largest responsibility for the concerned threatened/endemic species. A simple count of the occurrence of each threatened species in each of the six GMS countries may have served as a crude indicator. However this simple counting method, based on a denominator of 177 considering the overlap, does not advantage countries such as Cambodia or Lao PDR who have little or no threatened species that are endemic within their boundaries, or penalize countries such as Vietnam of Yunnan Province who have the larger proportion of endemic species within their boundaries.
1. 19 Fortunately for GMS countries, there are very few of these. In the 2004 Red List however, there were two such for Thailand and at least two such for Yunnan Province.
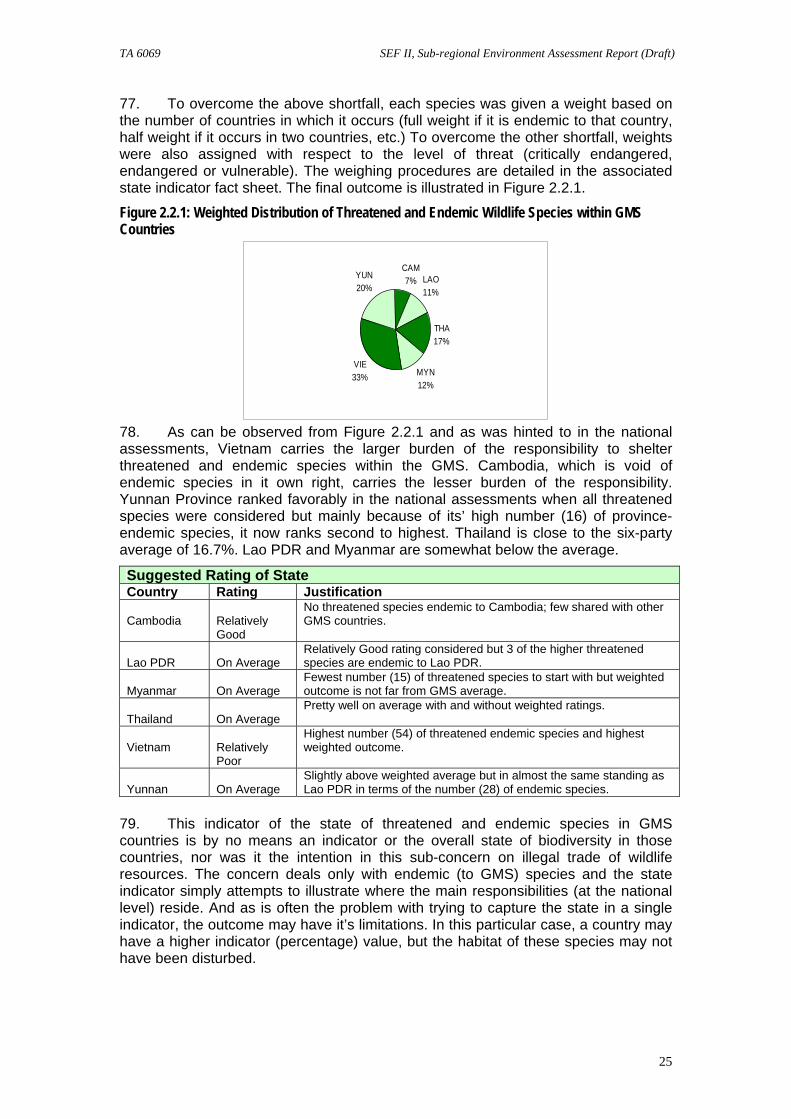
TA 6069 SEF II, Sub-regional Environment Assessment Report (Draft)
25
77. To overcome the above shortfall, each species was given a weight based on the number of countries in which it occurs (full weight if it is endemic to that country, half weight if it occurs in two countries, etc.) To overcome the other shortfall, weights were also assigned with respect to the level of threat (critically endangered, endangered or vulnerable). The weighing procedures are detailed in the associated state indicator fact sheet. The final outcome is illustrated in Figure 2.2.1.
Figure 2.2.1: Weighted Distribution of Threatened and Endemic Wildlife Species within GMS Countries
CAM7% LAO
11%
THA17%
MYN12%
VIE33%
YUN20%
78. As can be observed from Figure 2.2.1 and as was hinted to in the national assessments, Vietnam carries the larger burden of the responsibility to shelter threatened and endemic species within the GMS. Cambodia, which is void of endemic species in it own right, carries the lesser burden of the responsibility. Yunnan Province ranked favorably in the national assessments when all threatened species were considered but mainly because of its’ high number (16) of province-endemic species, it now ranks second to highest. Thailand is close to the six-party average of 16.7%. Lao PDR and Myanmar are somewhat below the average.
Suggested Rating of State Country Rating Justification Cambodia
Relatively Good
No threatened species endemic to Cambodia; few shared with other GMS countries.
Lao PDR
On Average
Relatively Good rating considered but 3 of the higher threatened species are endemic to Lao PDR.
Myanmar
On Average
Fewest number (15) of threatened species to start with but weighted outcome is not far from GMS average.
Thailand
On Average
Pretty well on average with and without weighted ratings.
Vietnam
Relatively Poor
Highest number (54) of threatened endemic species and highest weighted outcome.
Yunnan
On Average
Slightly above weighted average but in almost the same standing as Lao PDR in terms of the number (28) of endemic species.
79. This indicator of the state of threatened and endemic species in GMS countries is by no means an indicator or the overall state of biodiversity in those countries, nor was it the intention in this sub-concern on illegal trade of wildlife resources. The concern deals only with endemic (to GMS) species and the state indicator simply attempts to illustrate where the main responsibilities (at the national level) reside. And as is often the problem with trying to capture the state in a single indicator, the outcome may have it’s limitations. In this particular case, a country may have a higher indicator (percentage) value, but the habitat of these species may not have been disturbed.
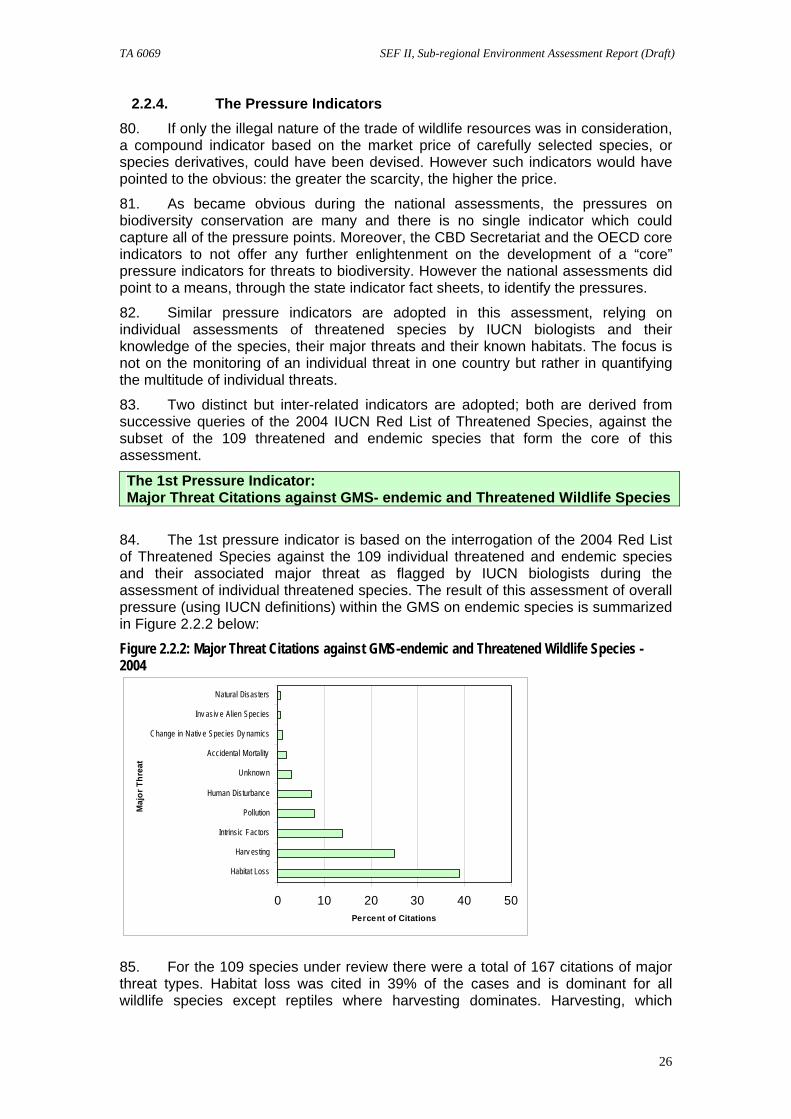
TA 6069 SEF II, Sub-regional Environment Assessment Report (Draft)
26
2.2.4. The Pressure Indicators 80. If only the illegal nature of the trade of wildlife resources was in consideration, a compound indicator based on the market price of carefully selected species, or species derivatives, could have been devised. However such indicators would have pointed to the obvious: the greater the scarcity, the higher the price.
81. As became obvious during the national assessments, the pressures on biodiversity conservation are many and there is no single indicator which could capture all of the pressure points. Moreover, the CBD Secretariat and the OECD core indicators to not offer any further enlightenment on the development of a “core” pressure indicators for threats to biodiversity. However the national assessments did point to a means, through the state indicator fact sheets, to identify the pressures.
82. Similar pressure indicators are adopted in this assessment, relying on individual assessments of threatened species by IUCN biologists and their knowledge of the species, their major threats and their known habitats. The focus is not on the monitoring of an individual threat in one country but rather in quantifying the multitude of individual threats.
83. Two distinct but inter-related indicators are adopted; both are derived from successive queries of the 2004 IUCN Red List of Threatened Species, against the subset of the 109 threatened and endemic species that form the core of this assessment.
The 1st Pressure Indicator: Major Threat Citations against GMS- endemic and Threatened Wildlife Species
84. The 1st pressure indicator is based on the interrogation of the 2004 Red List of Threatened Species against the 109 individual threatened and endemic species and their associated major threat as flagged by IUCN biologists during the assessment of individual threatened species. The result of this assessment of overall pressure (using IUCN definitions) within the GMS on endemic species is summarized in Figure 2.2.2 below:
Figure 2.2.2: Major Threat Citations against GMS-endemic and Threatened Wildlife Species - 2004
0 10 20 30 40 50
Habitat Loss
Harv esting
Intrinsic Factors
Pollution
Human Disturbance
Unknow n
Accidental Mortality
Change in Nativ e Species Dy namics
Inv asiv e Alien Species
Natural Disasters
Maj
or T
hrea
t
Percent of Citations
85. For the 109 species under review there were a total of 167 citations of major threat types. Habitat loss was cited in 39% of the cases and is dominant for all wildlife species except reptiles where harvesting dominates. Harvesting, which
TA 6069 SEF II, Sub-regional Environment Assessment Report (Draft)
27
includes hunting and gathering, was cited in 25% of the cases and is the 2nd most cited threat for mammal and bird species. Intrinsic factors affecting species’ population was cited in 14% of the cases and is overall the 3rd most cited threat. Pollution affecting habitat is a lesser significant threat for reptile, amphibian and fish species as is human disturbance for bird species.
The 2nd Pressure Indicator: Major Habitat Citations against GMS- endemic and Threatened Wildlife Species
86. The 2nd pressure indicator is based on a similar query using major habitat type; the results are summarized in Figure 2.2.3 below:
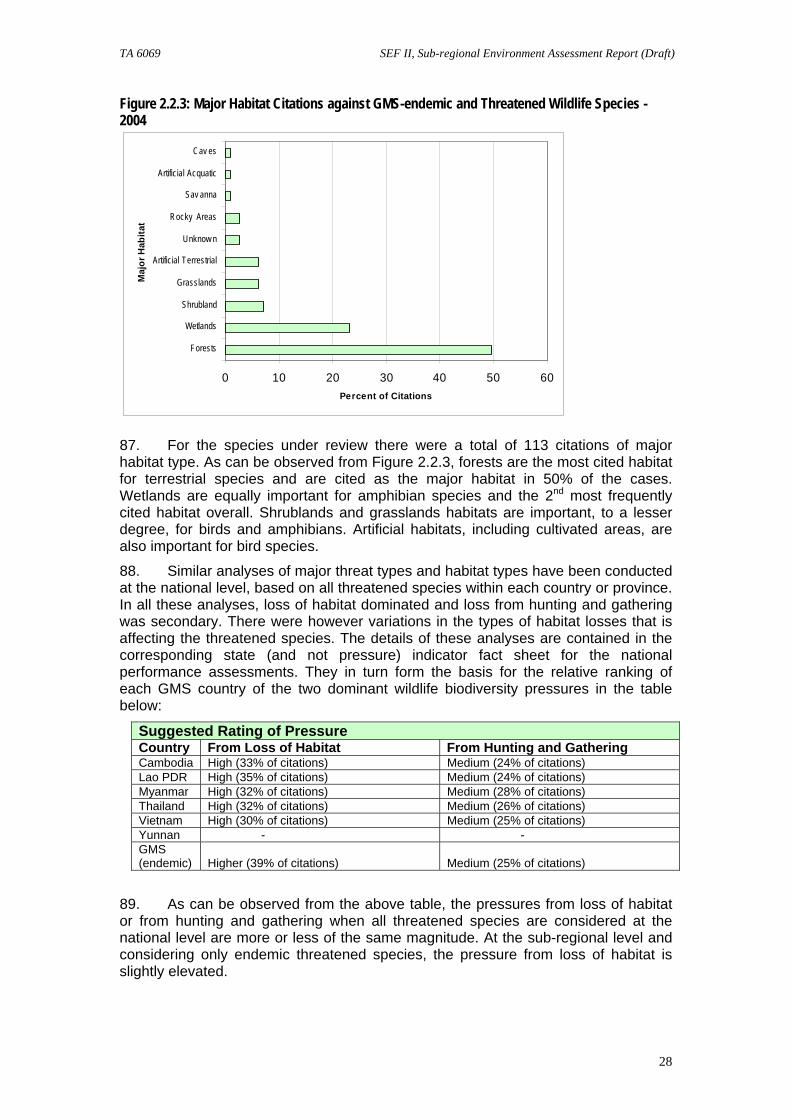
TA 6069 SEF II, Sub-regional Environment Assessment Report (Draft)
28
Figure 2.2.3: Major Habitat Citations against GMS-endemic and Threatened Wildlife Species - 2004
0 10 20 30 40 50 60
Forests
Wetlands
Shrubland
Grasslands
Artificial Terrestrial
Unknow n
Rocky Areas
Sav anna
Artificial Acquatic
Cav esM
ajor
Hab
itat
Percent of Citations
87. For the species under review there were a total of 113 citations of major habitat type. As can be observed from Figure 2.2.3, forests are the most cited habitat for terrestrial species and are cited as the major habitat in 50% of the cases. Wetlands are equally important for amphibian species and the 2nd most frequently cited habitat overall. Shrublands and grasslands habitats are important, to a lesser degree, for birds and amphibians. Artificial habitats, including cultivated areas, are also important for bird species.
88. Similar analyses of major threat types and habitat types have been conducted at the national level, based on all threatened species within each country or province. In all these analyses, loss of habitat dominated and loss from hunting and gathering was secondary. There were however variations in the types of habitat losses that is affecting the threatened species. The details of these analyses are contained in the corresponding state (and not pressure) indicator fact sheet for the national performance assessments. They in turn form the basis for the relative ranking of each GMS country of the two dominant wildlife biodiversity pressures in the table below:
Suggested Rating of Pressure Country From Loss of Habitat From Hunting and Gathering Cambodia High (33% of citations) Medium (24% of citations) Lao PDR High (35% of citations) Medium (24% of citations) Myanmar High (32% of citations) Medium (28% of citations) Thailand High (32% of citations) Medium (26% of citations) Vietnam High (30% of citations) Medium (25% of citations) Yunnan - - GMS (endemic)
Higher (39% of citations)
Medium (25% of citations)
89. As can be observed from the above table, the pressures from loss of habitat or from hunting and gathering when all threatened species are considered at the national level are more or less of the same magnitude. At the sub-regional level and considering only endemic threatened species, the pressure from loss of habitat is slightly elevated.
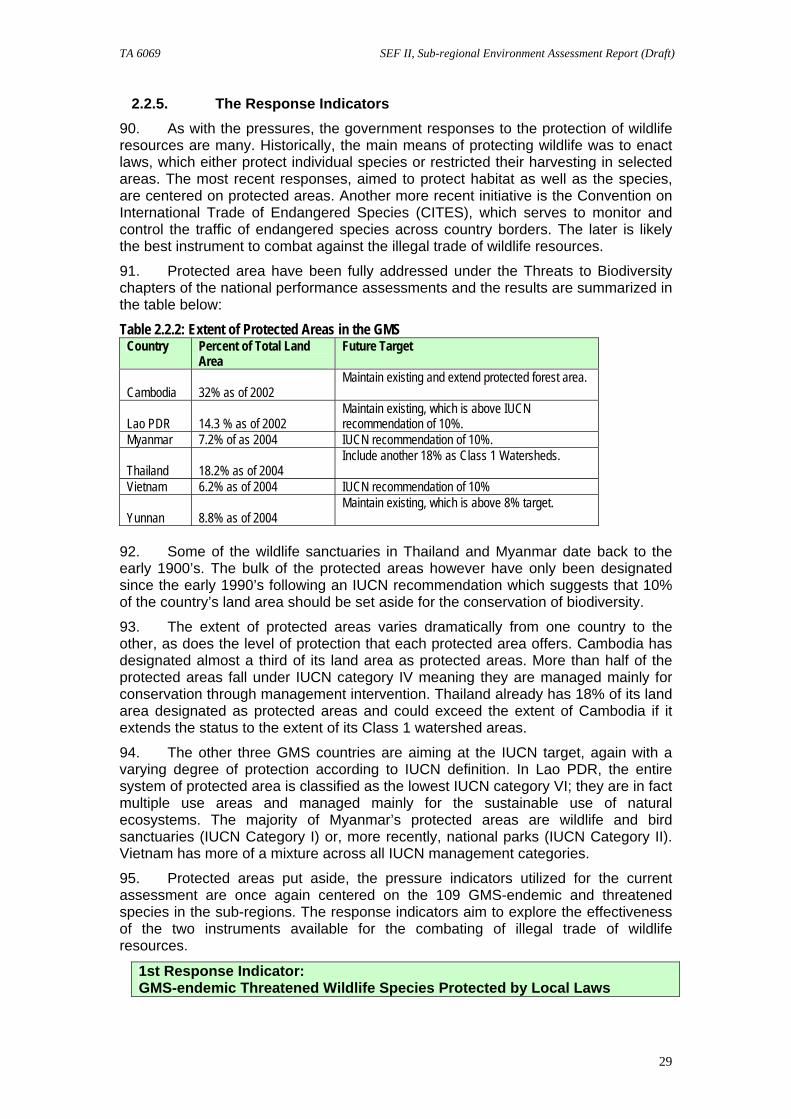
TA 6069 SEF II, Sub-regional Environment Assessment Report (Draft)
29
2.2.5. The Response Indicators 90. As with the pressures, the government responses to the protection of wildlife resources are many. Historically, the main means of protecting wildlife was to enact laws, which either protect individual species or restricted their harvesting in selected areas. The most recent responses, aimed to protect habitat as well as the species, are centered on protected areas. Another more recent initiative is the Convention on International Trade of Endangered Species (CITES), which serves to monitor and control the traffic of endangered species across country borders. The later is likely the best instrument to combat against the illegal trade of wildlife resources.
91. Protected area have been fully addressed under the Threats to Biodiversity chapters of the national performance assessments and the results are summarized in the table below:
Table 2.2.2: Extent of Protected Areas in the GMS Country Percent of Total Land
Area Future Target
Cambodia
32% as of 2002
Maintain existing and extend protected forest area.
Lao PDR
14.3 % as of 2002
Maintain existing, which is above IUCN recommendation of 10%.
Myanmar 7.2% of as 2004 IUCN recommendation of 10%. Thailand
18.2% as of 2004
Include another 18% as Class 1 Watersheds.
Vietnam 6.2% as of 2004 IUCN recommendation of 10% Yunnan
8.8% as of 2004
Maintain existing, which is above 8% target.
92. Some of the wildlife sanctuaries in Thailand and Myanmar date back to the early 1900’s. The bulk of the protected areas however have only been designated since the early 1990’s following an IUCN recommendation which suggests that 10% of the country’s land area should be set aside for the conservation of biodiversity.
93. The extent of protected areas varies dramatically from one country to the other, as does the level of protection that each protected area offers. Cambodia has designated almost a third of its land area as protected areas. More than half of the protected areas fall under IUCN category IV meaning they are managed mainly for conservation through management intervention. Thailand already has 18% of its land area designated as protected areas and could exceed the extent of Cambodia if it extends the status to the extent of its Class 1 watershed areas.
94. The other three GMS countries are aiming at the IUCN target, again with a varying degree of protection according to IUCN definition. In Lao PDR, the entire system of protected area is classified as the lowest IUCN category VI; they are in fact multiple use areas and managed mainly for the sustainable use of natural ecosystems. The majority of Myanmar’s protected areas are wildlife and bird sanctuaries (IUCN Category I) or, more recently, national parks (IUCN Category II). Vietnam has more of a mixture across all IUCN management categories.
95. Protected areas put aside, the pressure indicators utilized for the current assessment are once again centered on the 109 GMS-endemic and threatened species in the sub-regions. The response indicators aim to explore the effectiveness of the two instruments available for the combating of illegal trade of wildlife resources.
1st Response Indicator: GMS-endemic Threatened Wildlife Species Protected by Local Laws
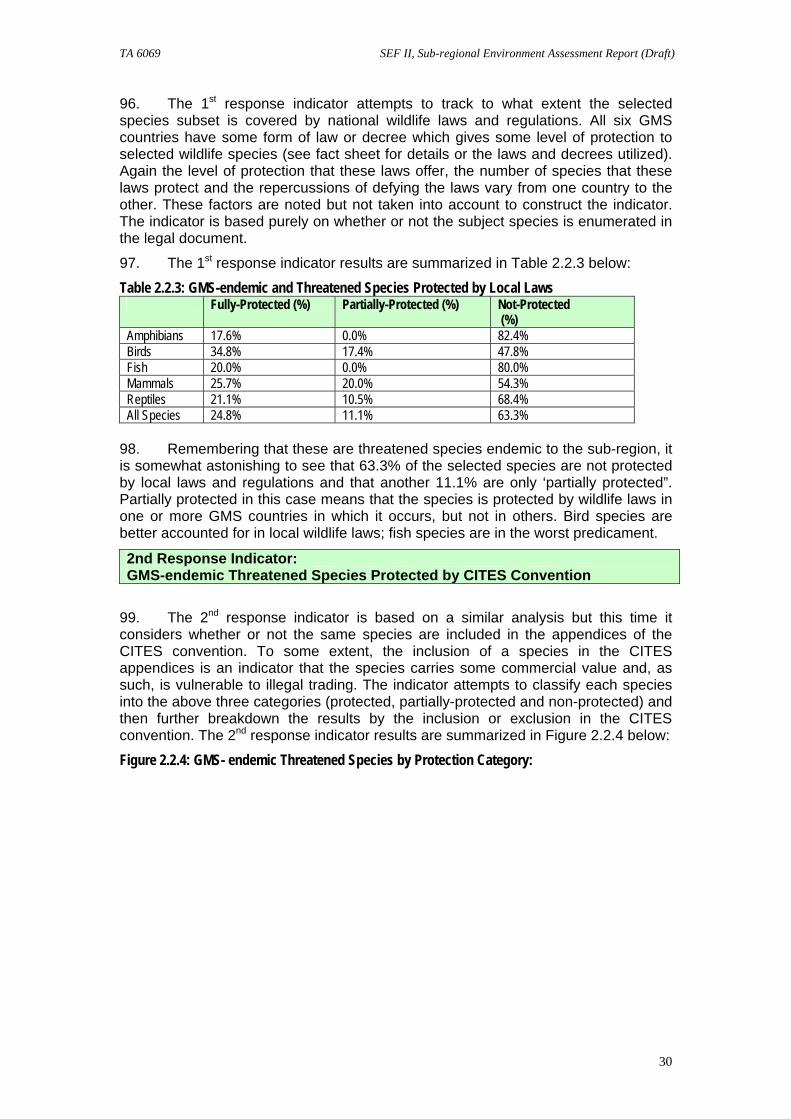
TA 6069 SEF II, Sub-regional Environment Assessment Report (Draft)
30
96. The 1st response indicator attempts to track to what extent the selected species subset is covered by national wildlife laws and regulations. All six GMS countries have some form of law or decree which gives some level of protection to selected wildlife species (see fact sheet for details or the laws and decrees utilized). Again the level of protection that these laws offer, the number of species that these laws protect and the repercussions of defying the laws vary from one country to the other. These factors are noted but not taken into account to construct the indicator. The indicator is based purely on whether or not the subject species is enumerated in the legal document.
97. The 1st response indicator results are summarized in Table 2.2.3 below:
Table 2.2.3: GMS-endemic and Threatened Species Protected by Local Laws Fully-Protected (%) Partially-Protected (%) Not-Protected
(%) Amphibians 17.6% 0.0% 82.4% Birds 34.8% 17.4% 47.8% Fish 20.0% 0.0% 80.0% Mammals 25.7% 20.0% 54.3% Reptiles 21.1% 10.5% 68.4% All Species 24.8% 11.1% 63.3%
98. Remembering that these are threatened species endemic to the sub-region, it is somewhat astonishing to see that 63.3% of the selected species are not protected by local laws and regulations and that another 11.1% are only ‘partially protected”. Partially protected in this case means that the species is protected by wildlife laws in one or more GMS countries in which it occurs, but not in others. Bird species are better accounted for in local wildlife laws; fish species are in the worst predicament.
2nd Response Indicator: GMS-endemic Threatened Species Protected by CITES Convention
99. The 2nd response indicator is based on a similar analysis but this time it considers whether or not the same species are included in the appendices of the CITES convention. To some extent, the inclusion of a species in the CITES appendices is an indicator that the species carries some commercial value and, as such, is vulnerable to illegal trading. The indicator attempts to classify each species into the above three categories (protected, partially-protected and non-protected) and then further breakdown the results by the inclusion or exclusion in the CITES convention. The 2nd response indicator results are summarized in Figure 2.2.4 below:
Figure 2.2.4: GMS- endemic Threatened Species by Protection Category:
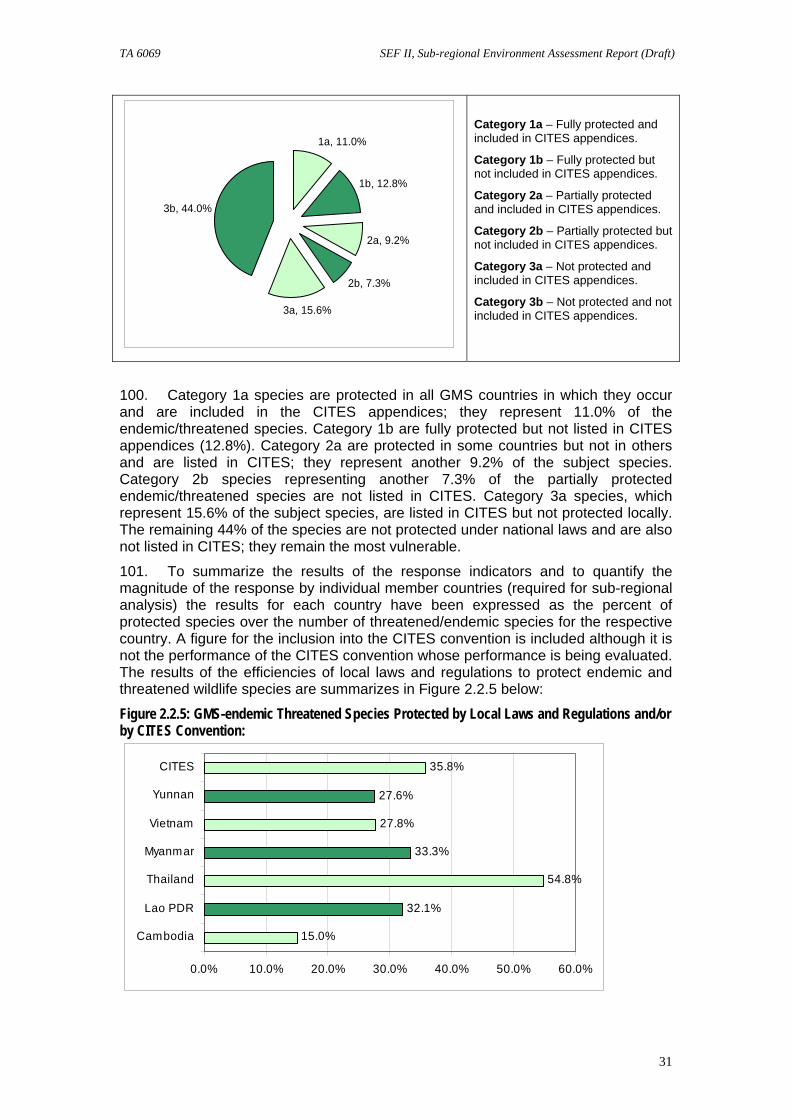
TA 6069 SEF II, Sub-regional Environment Assessment Report (Draft)
31
1a, 11.0%
1b, 12.8%
2a, 9.2%
2b, 7.3%
3a, 15.6%
3b, 44.0%
Category 1a – Fully protected and included in CITES appendices.
Category 1b – Fully protected but not included in CITES appendices.
Category 2a – Partially protected and included in CITES appendices.
Category 2b – Partially protected but not included in CITES appendices.
Category 3a – Not protected and included in CITES appendices.
Category 3b – Not protected and not included in CITES appendices.
100. Category 1a species are protected in all GMS countries in which they occur and are included in the CITES appendices; they represent 11.0% of the endemic/threatened species. Category 1b are fully protected but not listed in CITES appendices (12.8%). Category 2a are protected in some countries but not in others and are listed in CITES; they represent another 9.2% of the subject species. Category 2b species representing another 7.3% of the partially protected endemic/threatened species are not listed in CITES. Category 3a species, which represent 15.6% of the subject species, are listed in CITES but not protected locally. The remaining 44% of the species are not protected under national laws and are also not listed in CITES; they remain the most vulnerable.
101. To summarize the results of the response indicators and to quantify the magnitude of the response by individual member countries (required for sub-regional analysis) the results for each country have been expressed as the percent of protected species over the number of threatened/endemic species for the respective country. A figure for the inclusion into the CITES convention is included although it is not the performance of the CITES convention whose performance is being evaluated. The results of the efficiencies of local laws and regulations to protect endemic and threatened wildlife species are summarizes in Figure 2.2.5 below:
Figure 2.2.5: GMS-endemic Threatened Species Protected by Local Laws and Regulations and/or by CITES Convention:
15.0%
32.1%
54.8%
33.3%
27.8%
27.6%
35.8%
0.0% 10.0% 20.0% 30.0% 40.0% 50.0% 60.0%
Cambodia
Lao PDR
Thailand
Myanmar
Vietnam
Yunnan
CITES
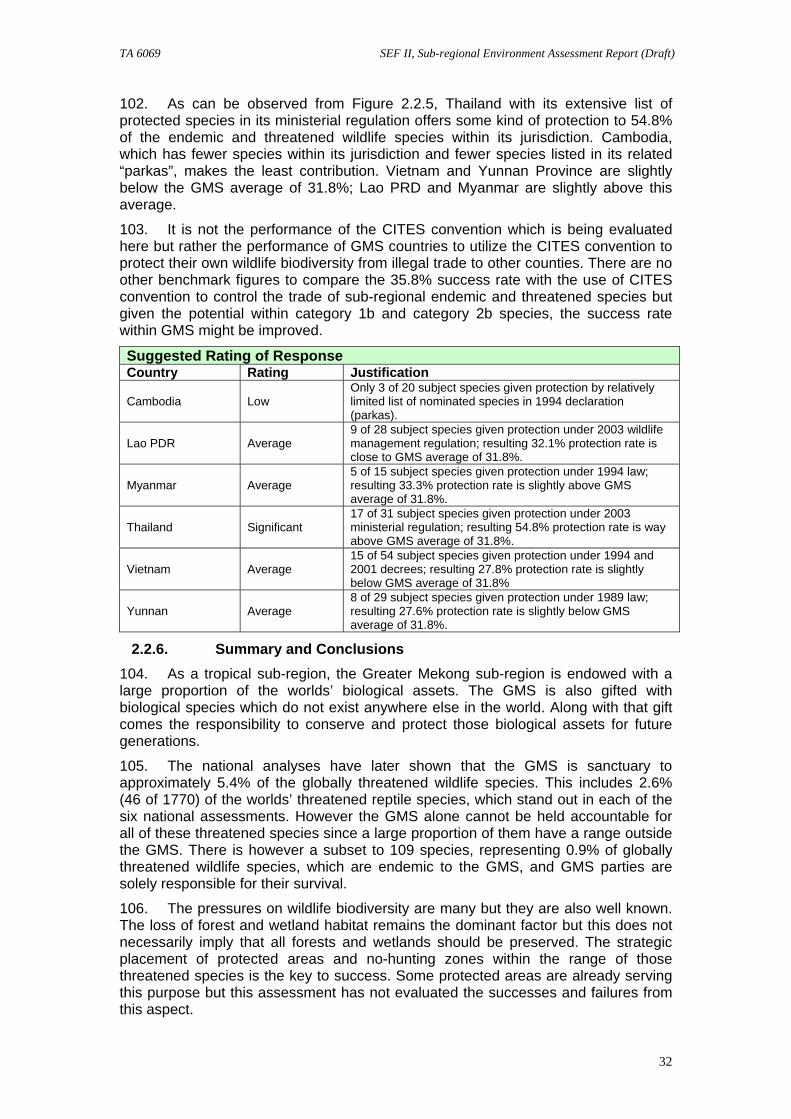
TA 6069 SEF II, Sub-regional Environment Assessment Report (Draft)
32
102. As can be observed from Figure 2.2.5, Thailand with its extensive list of protected species in its ministerial regulation offers some kind of protection to 54.8% of the endemic and threatened wildlife species within its jurisdiction. Cambodia, which has fewer species within its jurisdiction and fewer species listed in its related “parkas”, makes the least contribution. Vietnam and Yunnan Province are slightly below the GMS average of 31.8%; Lao PRD and Myanmar are slightly above this average.
103. It is not the performance of the CITES convention which is being evaluated here but rather the performance of GMS countries to utilize the CITES convention to protect their own wildlife biodiversity from illegal trade to other counties. There are no other benchmark figures to compare the 35.8% success rate with the use of CITES convention to control the trade of sub-regional endemic and threatened species but given the potential within category 1b and category 2b species, the success rate within GMS might be improved.
Suggested Rating of Response Country Rating Justification
Cambodia Low Only 3 of 20 subject species given protection by relatively limited list of nominated species in 1994 declaration (parkas).
Lao PDR Average 9 of 28 subject species given protection under 2003 wildlife management regulation; resulting 32.1% protection rate is close to GMS average of 31.8%.
Myanmar Average 5 of 15 subject species given protection under 1994 law; resulting 33.3% protection rate is slightly above GMS average of 31.8%.
Thailand Significant 17 of 31 subject species given protection under 2003 ministerial regulation; resulting 54.8% protection rate is way above GMS average of 31.8%.
Vietnam Average 15 of 54 subject species given protection under 1994 and 2001 decrees; resulting 27.8% protection rate is slightly below GMS average of 31.8%
Yunnan Average 8 of 29 subject species given protection under 1989 law; resulting 27.6% protection rate is slightly below GMS average of 31.8%.
2.2.6. Summary and Conclusions 104. As a tropical sub-region, the Greater Mekong sub-region is endowed with a large proportion of the worlds’ biological assets. The GMS is also gifted with biological species which do not exist anywhere else in the world. Along with that gift comes the responsibility to conserve and protect those biological assets for future generations.
105. The national analyses have later shown that the GMS is sanctuary to approximately 5.4% of the globally threatened wildlife species. This includes 2.6% (46 of 1770) of the worlds’ threatened reptile species, which stand out in each of the six national assessments. However the GMS alone cannot be held accountable for all of these threatened species since a large proportion of them have a range outside the GMS. There is however a subset to 109 species, representing 0.9% of globally threatened wildlife species, which are endemic to the GMS, and GMS parties are solely responsible for their survival.
106. The pressures on wildlife biodiversity are many but they are also well known. The loss of forest and wetland habitat remains the dominant factor but this does not necessarily imply that all forests and wetlands should be preserved. The strategic placement of protected areas and no-hunting zones within the range of those threatened species is the key to success. Some protected areas are already serving this purpose but this assessment has not evaluated the successes and failures from this aspect.
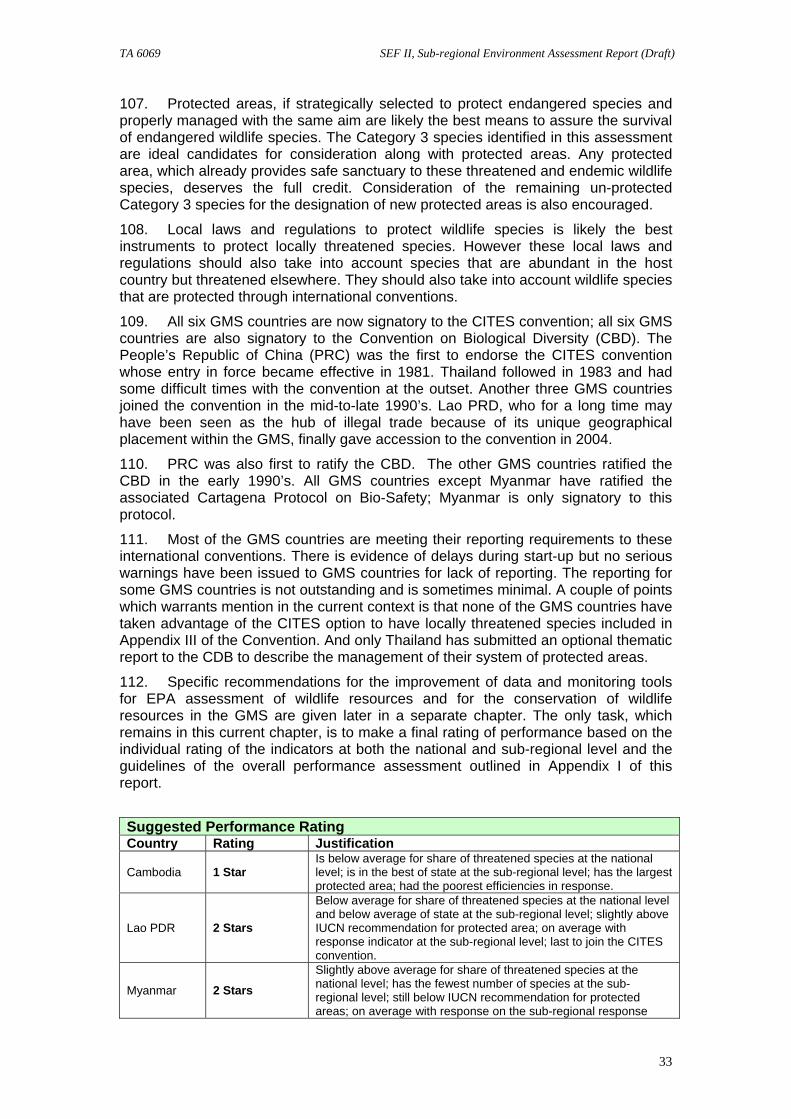
TA 6069 SEF II, Sub-regional Environment Assessment Report (Draft)
33
107. Protected areas, if strategically selected to protect endangered species and properly managed with the same aim are likely the best means to assure the survival of endangered wildlife species. The Category 3 species identified in this assessment are ideal candidates for consideration along with protected areas. Any protected area, which already provides safe sanctuary to these threatened and endemic wildlife species, deserves the full credit. Consideration of the remaining un-protected Category 3 species for the designation of new protected areas is also encouraged.
108. Local laws and regulations to protect wildlife species is likely the best instruments to protect locally threatened species. However these local laws and regulations should also take into account species that are abundant in the host country but threatened elsewhere. They should also take into account wildlife species that are protected through international conventions.
109. All six GMS countries are now signatory to the CITES convention; all six GMS countries are also signatory to the Convention on Biological Diversity (CBD). The People’s Republic of China (PRC) was the first to endorse the CITES convention whose entry in force became effective in 1981. Thailand followed in 1983 and had some difficult times with the convention at the outset. Another three GMS countries joined the convention in the mid-to-late 1990’s. Lao PRD, who for a long time may have been seen as the hub of illegal trade because of its unique geographical placement within the GMS, finally gave accession to the convention in 2004.
110. PRC was also first to ratify the CBD. The other GMS countries ratified the CBD in the early 1990’s. All GMS countries except Myanmar have ratified the associated Cartagena Protocol on Bio-Safety; Myanmar is only signatory to this protocol.
111. Most of the GMS countries are meeting their reporting requirements to these international conventions. There is evidence of delays during start-up but no serious warnings have been issued to GMS countries for lack of reporting. The reporting for some GMS countries is not outstanding and is sometimes minimal. A couple of points which warrants mention in the current context is that none of the GMS countries have taken advantage of the CITES option to have locally threatened species included in Appendix III of the Convention. And only Thailand has submitted an optional thematic report to the CDB to describe the management of their system of protected areas.
112. Specific recommendations for the improvement of data and monitoring tools for EPA assessment of wildlife resources and for the conservation of wildlife resources in the GMS are given later in a separate chapter. The only task, which remains in this current chapter, is to make a final rating of performance based on the individual rating of the indicators at both the national and sub-regional level and the guidelines of the overall performance assessment outlined in Appendix I of this report.
Suggested Performance Rating Country Rating Justification
Cambodia 1 Star Is below average for share of threatened species at the national level; is in the best of state at the sub-regional level; has the largest protected area; had the poorest efficiencies in response.
Lao PDR 2 Stars
Below average for share of threatened species at the national level and below average of state at the sub-regional level; slightly above IUCN recommendation for protected area; on average with response indicator at the sub-regional level; last to join the CITES convention.
Myanmar 2 Stars Slightly above average for share of threatened species at the national level; has the fewest number of species at the sub-regional level; still below IUCN recommendation for protected areas; on average with response on the sub-regional response
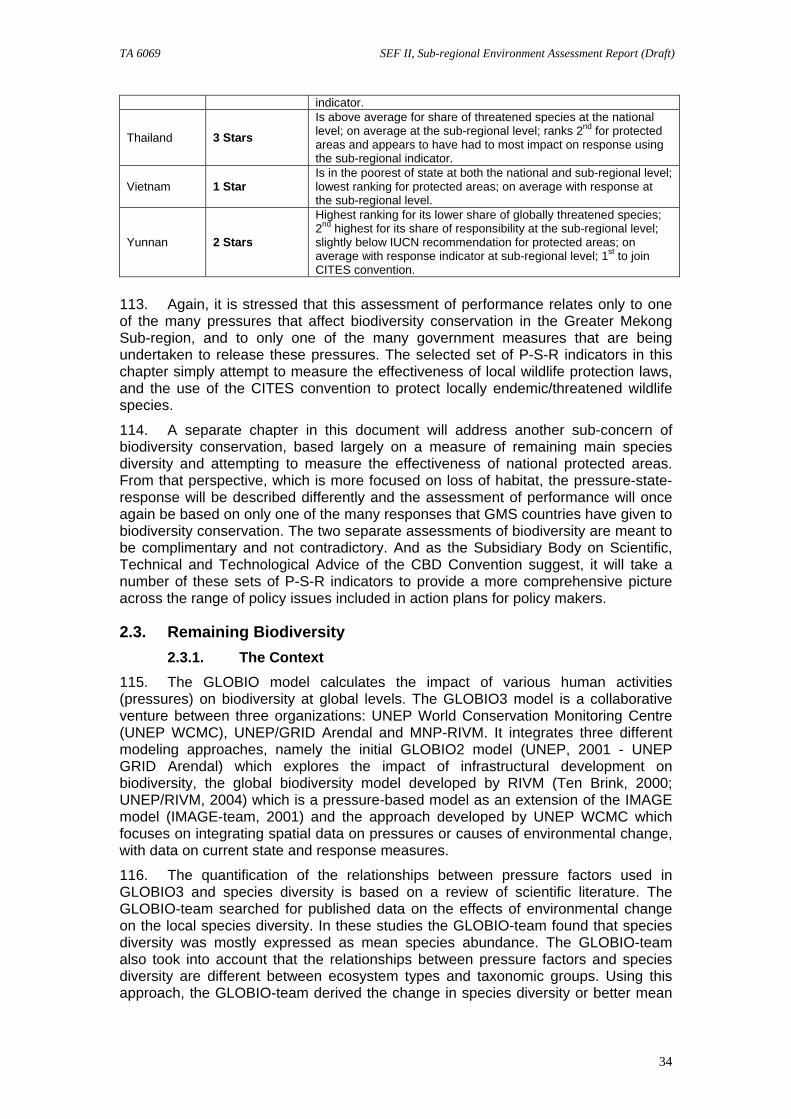
TA 6069 SEF II, Sub-regional Environment Assessment Report (Draft)
34
indicator.
Thailand 3 Stars Is above average for share of threatened species at the national level; on average at the sub-regional level; ranks 2nd for protected areas and appears to have had to most impact on response using the sub-regional indicator.
Vietnam 1 Star Is in the poorest of state at both the national and sub-regional level; lowest ranking for protected areas; on average with response at the sub-regional level.
Yunnan 2 Stars
Highest ranking for its lower share of globally threatened species; 2nd highest for its share of responsibility at the sub-regional level; slightly below IUCN recommendation for protected areas; on average with response indicator at sub-regional level; 1st to join CITES convention.
113. Again, it is stressed that this assessment of performance relates only to one of the many pressures that affect biodiversity conservation in the Greater Mekong Sub-region, and to only one of the many government measures that are being undertaken to release these pressures. The selected set of P-S-R indicators in this chapter simply attempt to measure the effectiveness of local wildlife protection laws, and the use of the CITES convention to protect locally endemic/threatened wildlife species.
114. A separate chapter in this document will address another sub-concern of biodiversity conservation, based largely on a measure of remaining main species diversity and attempting to measure the effectiveness of national protected areas. From that perspective, which is more focused on loss of habitat, the pressure-state-response will be described differently and the assessment of performance will once again be based on only one of the many responses that GMS countries have given to biodiversity conservation. The two separate assessments of biodiversity are meant to be complimentary and not contradictory. And as the Subsidiary Body on Scientific, Technical and Technological Advice of the CBD Convention suggest, it will take a number of these sets of P-S-R indicators to provide a more comprehensive picture across the range of policy issues included in action plans for policy makers.
2.3. Remaining Biodiversity 2.3.1. The Context
115. The GLOBIO model calculates the impact of various human activities (pressures) on biodiversity at global levels. The GLOBIO3 model is a collaborative venture between three organizations: UNEP World Conservation Monitoring Centre (UNEP WCMC), UNEP/GRID Arendal and MNP-RIVM. It integrates three different modeling approaches, namely the initial GLOBIO2 model (UNEP, 2001 - UNEP GRID Arendal) which explores the impact of infrastructural development on biodiversity, the global biodiversity model developed by RIVM (Ten Brink, 2000; UNEP/RIVM, 2004) which is a pressure-based model as an extension of the IMAGE model (IMAGE-team, 2001) and the approach developed by UNEP WCMC which focuses on integrating spatial data on pressures or causes of environmental change, with data on current state and response measures.
116. The quantification of the relationships between pressure factors used in GLOBIO3 and species diversity is based on a review of scientific literature. The GLOBIO-team searched for published data on the effects of environmental change on the local species diversity. In these studies the GLOBIO-team found that species diversity was mostly expressed as mean species abundance. The GLOBIO-team also took into account that the relationships between pressure factors and species diversity are different between ecosystem types and taxonomic groups. Using this approach, the GLOBIO-team derived the change in species diversity or better mean
TA 6069 SEF II, Sub-regional Environment Assessment Report (Draft)
35
species abundance relative to the most undisturbed locations for each study, further called the Natural Capital Index (NCI).
117. Within the GLOBIO model structure, this approach is applied to four main pressure groups: land use (agricultural and forest use), infrastructure (roads), pollution (nitrogen deposition) and climate change. For each of these pressure groups, separate, independent dose-response relationships have been defined using the following approaches and studies:
1) the relationship between land use change and relative species diversity is based on Alkemade et al. (in prep.) and for agricultural and grazing intensity we used the study of Tekelenburg et al. (in prep);
2) for infrastructure we used the study by UNEP (2001); 3) for nitrogen deposition we used study by Bobbink (2004) and 4) for climate change we used a combination of projected species and biome
shifts (Bakkenes et al. 2002; Leemans and Eickhout, 2003) 118. In order to perform a sub-regional application of the GLOBIO3 model under the SEF II framework, global datasets where replaced with national datasets of higher resolution, wherever available and feasible. Due to time constraints, the dose-response relationships defined for the global application of the GLOBIO3 model remain largely unchanged during the sub-regional application. In a next step, the scientific backing will be verified and updated using region-specific case studies to develop region-precise dose-response relationships and to define new pressure groups, if feasible. As a result, the current workflow of the sub-regional application of the GLOBIO3 model encompasses four principle steps:
o The model defines a benchmark of maximum biodiversity, which is the pristine ecosystem under the given bio-geophysical conditions. The sub-regional application of GLOBIO3 uses the biome classes defined through the IMAGE model, corresponding to the global application.
o The model defines four main pressures groups -land use (agricultural and forest use), infrastructure, pollution and climate change- that have a causal connection with biodiversity and its change. The pressure groups are consistent with the global application, no new pressure groups where added. However, within the most important pressure group (land use), global datasets have been replaced with national ones to increase resolution.
o The model transforms each of the generic pressure inputs into a biodiversity impact information on the basis of dose-response relationships derived from literature and expert opinions (conversion tables, coefficients, equations etc.). The sub-regional application uses the global assumptions.
o The model weighs between the biodiversity impacts of these four pressure groups and sums them up to the total impact on biodiversity, which is described by the Natural Capital Index (NCI).
119. Summing up, the main advantage of biodiversity modeling is 1) that it integrates several pressure factors into a complex relationship and 2) that this approach can be used to create non-available direct information from secondary interrelated source data. As the model is geographically explicit it allows precise identification of target areas and as such it is also compatible with GIS for further data integration and analyses.
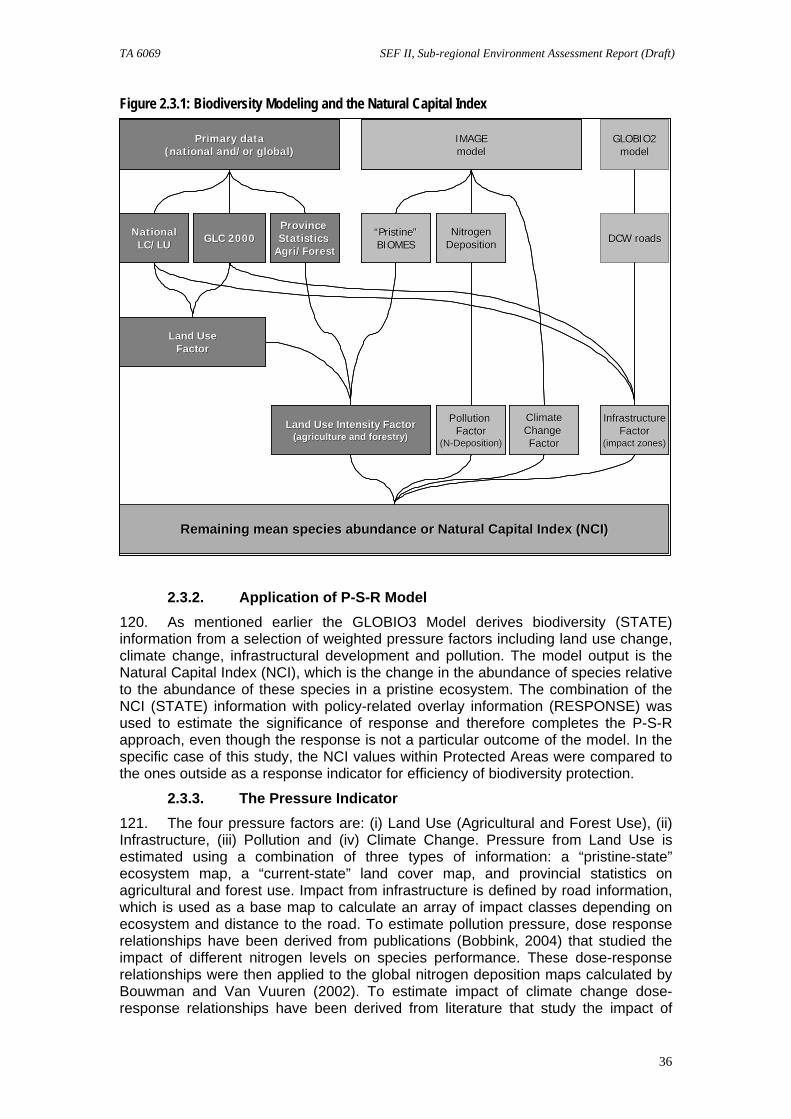
TA 6069 SEF II, Sub-regional Environment Assessment Report (Draft)
36
Figure 2.3.1: Biodiversity Modeling and the Natural Capital Index
2.3.2. Application of P-S-R Model 120. As mentioned earlier the GLOBIO3 Model derives biodiversity (STATE) information from a selection of weighted pressure factors including land use change, climate change, infrastructural development and pollution. The model output is the Natural Capital Index (NCI), which is the change in the abundance of species relative to the abundance of these species in a pristine ecosystem. The combination of the NCI (STATE) information with policy-related overlay information (RESPONSE) was used to estimate the significance of response and therefore completes the P-S-R approach, even though the response is not a particular outcome of the model. In the specific case of this study, the NCI values within Protected Areas were compared to the ones outside as a response indicator for efficiency of biodiversity protection.
2.3.3. The Pressure Indicator 121. The four pressure factors are: (i) Land Use (Agricultural and Forest Use), (ii) Infrastructure, (iii) Pollution and (iv) Climate Change. Pressure from Land Use is estimated using a combination of three types of information: a “pristine-state” ecosystem map, a “current-state” land cover map, and provincial statistics on agricultural and forest use. Impact from infrastructure is defined by road information, which is used as a base map to calculate an array of impact classes depending on ecosystem and distance to the road. To estimate pollution pressure, dose response relationships have been derived from publications (Bobbink, 2004) that studied the impact of different nitrogen levels on species performance. These dose-response relationships were then applied to the global nitrogen deposition maps calculated by Bouwman and Van Vuuren (2002). To estimate impact of climate change dose-response relationships have been derived from literature that study the impact of
IMAGEIMAGEmodelmodel
DCW roadsDCW roads
ClimateClimateChange Change FactorFactor
NitrogenNitrogenDepositionDeposition
InfrastructureInfrastructureFactorFactor
(impact zones)(impact zones)
Remaining mean species abundance or Natural Capital Index (NCI)Remaining mean species abundance or Natural Capital Index (NCI)
NationalNationalLC/LULC/LU GLC 2000GLC 2000
Province Province Statistics Statistics
AgriAgri/Forest/Forest
“Pristine”“Pristine”BIOMESBIOMES
Primary dataPrimary data(national and/or global)(national and/or global)
GLOBIO2GLOBIO2modelmodel
Pollution Pollution FactorFactor
(N(N--Deposition)Deposition)
Land UseLand UseFactorFactor
Land Use Intensity FactorLand Use Intensity Factor(agriculture and forestry)(agriculture and forestry)
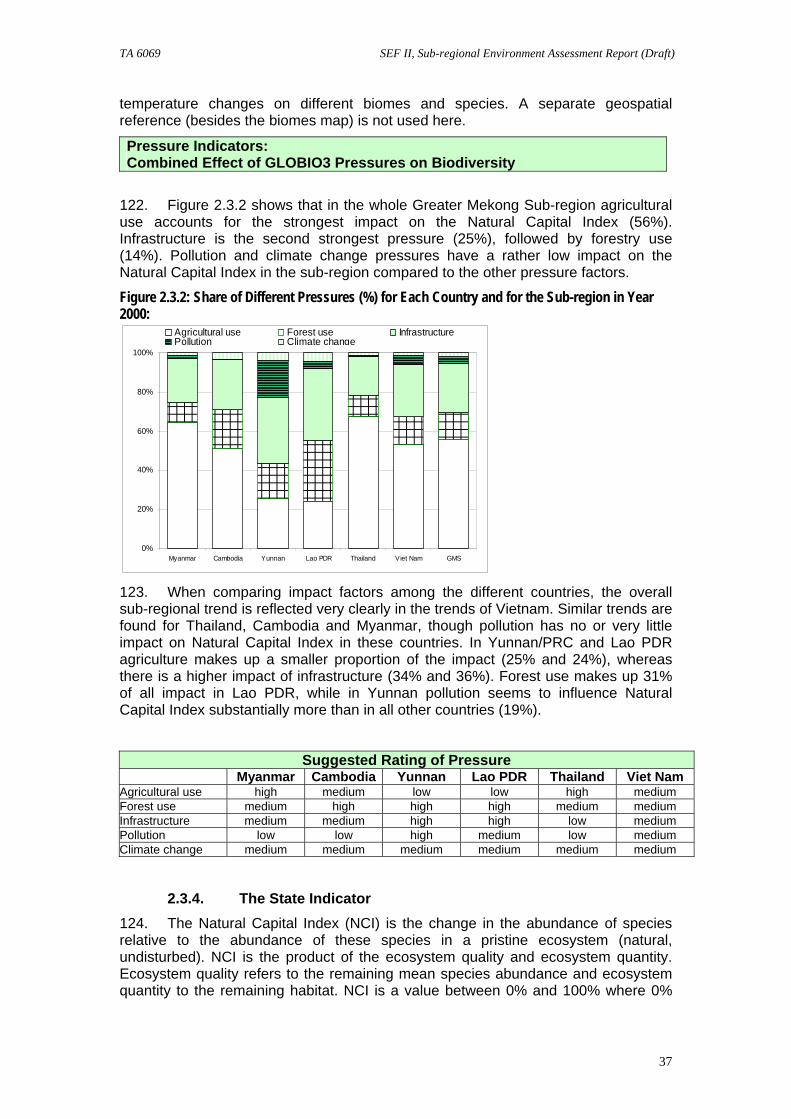
TA 6069 SEF II, Sub-regional Environment Assessment Report (Draft)
37
temperature changes on different biomes and species. A separate geospatial reference (besides the biomes map) is not used here.
Pressure Indicators: Combined Effect of GLOBIO3 Pressures on Biodiversity
122. Figure 2.3.2 shows that in the whole Greater Mekong Sub-region agricultural use accounts for the strongest impact on the Natural Capital Index (56%). Infrastructure is the second strongest pressure (25%), followed by forestry use (14%). Pollution and climate change pressures have a rather low impact on the Natural Capital Index in the sub-region compared to the other pressure factors.
Figure 2.3.2: Share of Different Pressures (%) for Each Country and for the Sub-region in Year 2000:
0%
20%
40%
60%
80%
100%
Myanmar Cambodia Yunnan Lao PDR Thailand Viet Nam GMS
Agricultural use Forest use InfrastructurePollution Climate change
123. When comparing impact factors among the different countries, the overall sub-regional trend is reflected very clearly in the trends of Vietnam. Similar trends are found for Thailand, Cambodia and Myanmar, though pollution has no or very little impact on Natural Capital Index in these countries. In Yunnan/PRC and Lao PDR agriculture makes up a smaller proportion of the impact (25% and 24%), whereas there is a higher impact of infrastructure (34% and 36%). Forest use makes up 31% of all impact in Lao PDR, while in Yunnan pollution seems to influence Natural Capital Index substantially more than in all other countries (19%).
Suggested Rating of Pressure Myanmar Cambodia Yunnan Lao PDR Thailand Viet Nam
Agricultural use high medium low low high medium Forest use medium high high high medium medium Infrastructure medium medium high high low medium Pollution low low high medium low medium Climate change medium medium medium medium medium medium
2.3.4. The State Indicator
124. The Natural Capital Index (NCI) is the change in the abundance of species relative to the abundance of these species in a pristine ecosystem (natural, undisturbed). NCI is the product of the ecosystem quality and ecosystem quantity. Ecosystem quality refers to the remaining mean species abundance and ecosystem quantity to the remaining habitat. NCI is a value between 0% and 100% where 0%
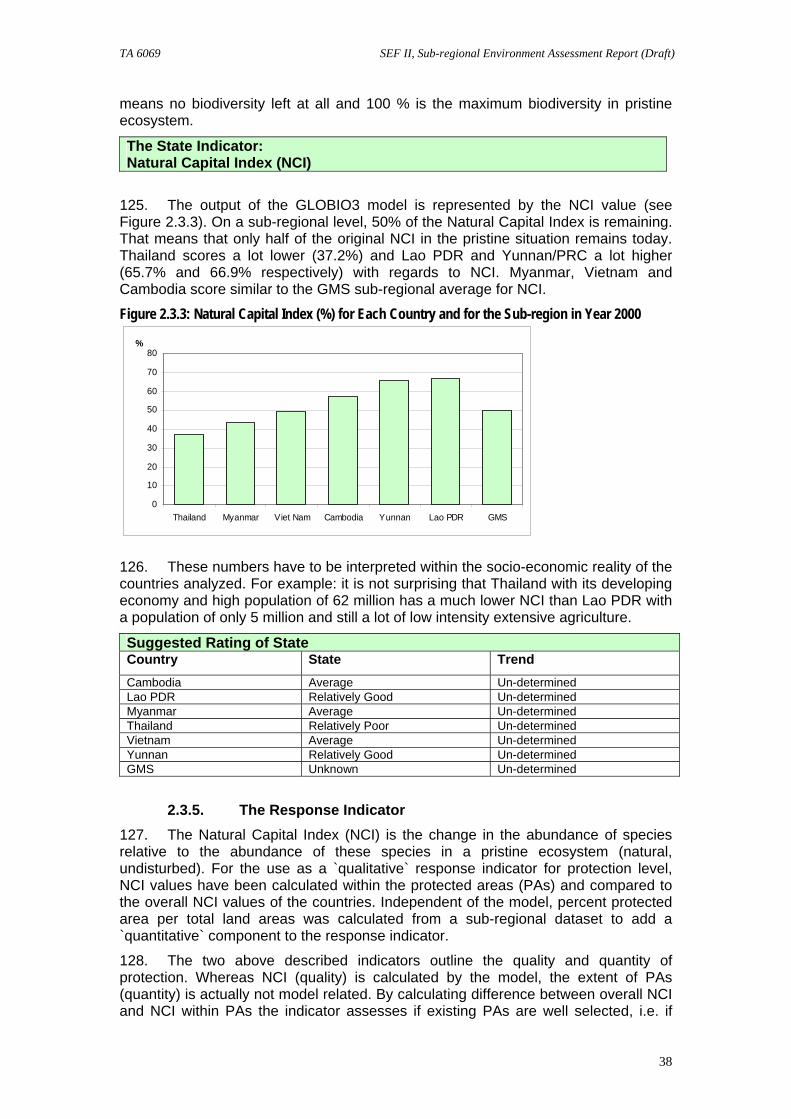
TA 6069 SEF II, Sub-regional Environment Assessment Report (Draft)
38
means no biodiversity left at all and 100 % is the maximum biodiversity in pristine ecosystem.
The State Indicator: Natural Capital Index (NCI)
125. The output of the GLOBIO3 model is represented by the NCI value (see Figure 2.3.3). On a sub-regional level, 50% of the Natural Capital Index is remaining. That means that only half of the original NCI in the pristine situation remains today. Thailand scores a lot lower (37.2%) and Lao PDR and Yunnan/PRC a lot higher (65.7% and 66.9% respectively) with regards to NCI. Myanmar, Vietnam and Cambodia score similar to the GMS sub-regional average for NCI.
Figure 2.3.3: Natural Capital Index (%) for Each Country and for the Sub-region in Year 2000
0
10
20
30
40
50
60
70
80
Thailand Myanmar Viet Nam Cambodia Yunnan Lao PDR GMS
%
126. These numbers have to be interpreted within the socio-economic reality of the countries analyzed. For example: it is not surprising that Thailand with its developing economy and high population of 62 million has a much lower NCI than Lao PDR with a population of only 5 million and still a lot of low intensity extensive agriculture.
Suggested Rating of State Country State Trend Cambodia Average Un-determined Lao PDR Relatively Good Un-determined Myanmar Average Un-determined Thailand Relatively Poor Un-determined Vietnam Average Un-determined Yunnan Relatively Good Un-determined GMS Unknown Un-determined
2.3.5. The Response Indicator 127. The Natural Capital Index (NCI) is the change in the abundance of species relative to the abundance of these species in a pristine ecosystem (natural, undisturbed). For the use as a `qualitative` response indicator for protection level, NCI values have been calculated within the protected areas (PAs) and compared to the overall NCI values of the countries. Independent of the model, percent protected area per total land areas was calculated from a sub-regional dataset to add a `quantitative` component to the response indicator.
128. The two above described indicators outline the quality and quantity of protection. Whereas NCI (quality) is calculated by the model, the extent of PAs (quantity) is actually not model related. By calculating difference between overall NCI and NCI within PAs the indicator assesses if existing PAs are well selected, i.e. if
TA 6069 SEF II, Sub-regional Environment Assessment Report (Draft)
39
they are established areas with significantly higher biodiversity compared to the unprotected areas. Additionally, the extent of PAs indicates if enough area is protected to ensure long term survival of major habitats. Both quality and quantity go hand in hand: if NCI in PAs is high but stretches only over a small area, or if NCI is low but covering a large area, then protection of biodiversity still may not be significant. Only if high NCI is protected over a large area of ecosystem, protection might be successful.
The Response Indicator: Comparison Overall NCI to NCI in Protected Areas & Percentage of Protected Areas per Total Land Cover
129. For sub-region as a whole the PAs have an NCI value of 66.9%, which is 16.9% higher than the overall NCI value (Figure 2.3.4). On a country-level, NCI is always higher inside protected areas, though its magnitude shows considerable variation among countries (average 14.9%, range 5.8% - 24.1%). This indicator gives an indirect estimate for the quality of the protected areas.
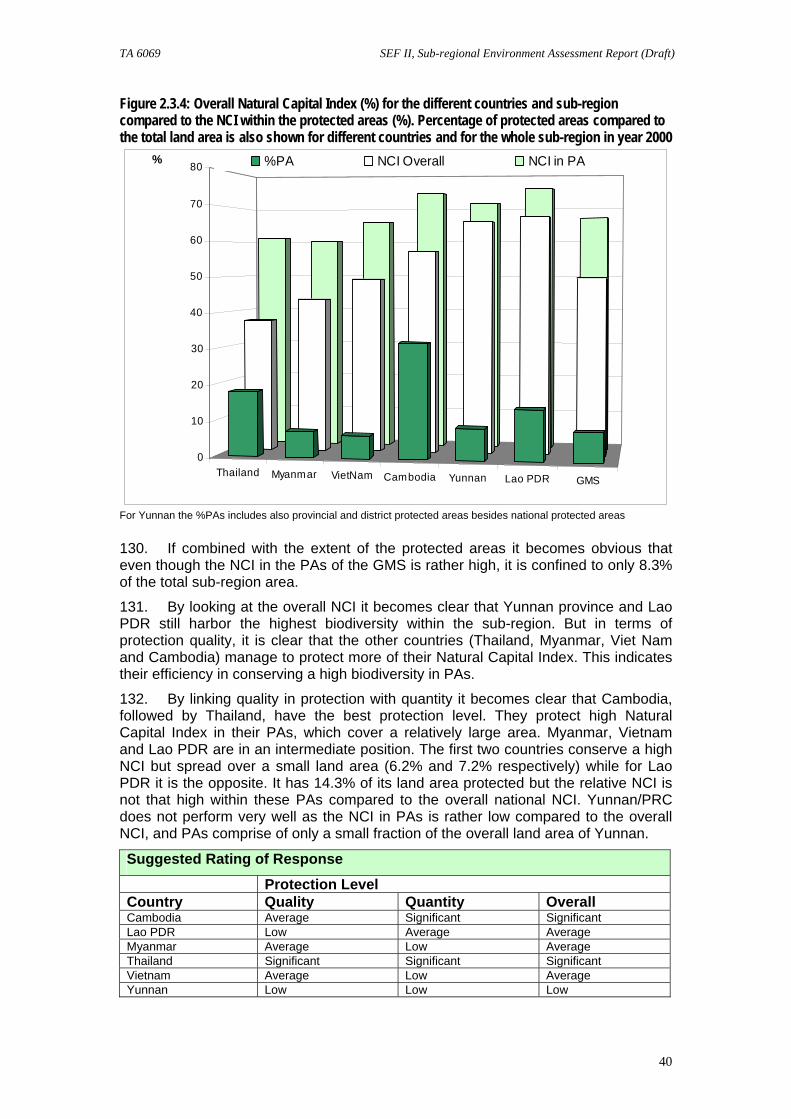
TA 6069 SEF II, Sub-regional Environment Assessment Report (Draft)
40
Figure 2.3.4: Overall Natural Capital Index (%) for the different countries and sub-region compared to the NCI within the protected areas (%). Percentage of protected areas compared to the total land area is also shown for different countries and for the whole sub-region in year 2000
Thailand Myanmar VietNam Cambodia Yunnan Lao PDR GMS
0
10
20
30
40
50
60
70
80% %PA NCI Overall NCI in PA
For Yunnan the %PAs includes also provincial and district protected areas besides national protected areas 130. If combined with the extent of the protected areas it becomes obvious that even though the NCI in the PAs of the GMS is rather high, it is confined to only 8.3% of the total sub-region area.
131. By looking at the overall NCI it becomes clear that Yunnan province and Lao PDR still harbor the highest biodiversity within the sub-region. But in terms of protection quality, it is clear that the other countries (Thailand, Myanmar, Viet Nam and Cambodia) manage to protect more of their Natural Capital Index. This indicates their efficiency in conserving a high biodiversity in PAs.
132. By linking quality in protection with quantity it becomes clear that Cambodia, followed by Thailand, have the best protection level. They protect high Natural Capital Index in their PAs, which cover a relatively large area. Myanmar, Vietnam and Lao PDR are in an intermediate position. The first two countries conserve a high NCI but spread over a small land area (6.2% and 7.2% respectively) while for Lao PDR it is the opposite. It has 14.3% of its land area protected but the relative NCI is not that high within these PAs compared to the overall national NCI. Yunnan/PRC does not perform very well as the NCI in PAs is rather low compared to the overall NCI, and PAs comprise of only a small fraction of the overall land area of Yunnan.
Suggested Rating of Response
Protection Level Country Quality Quantity Overall Cambodia Average Significant Significant Lao PDR Low Average Average Myanmar Average Low Average Thailand Significant Significant Significant Vietnam Average Low Average Yunnan Low Low Low
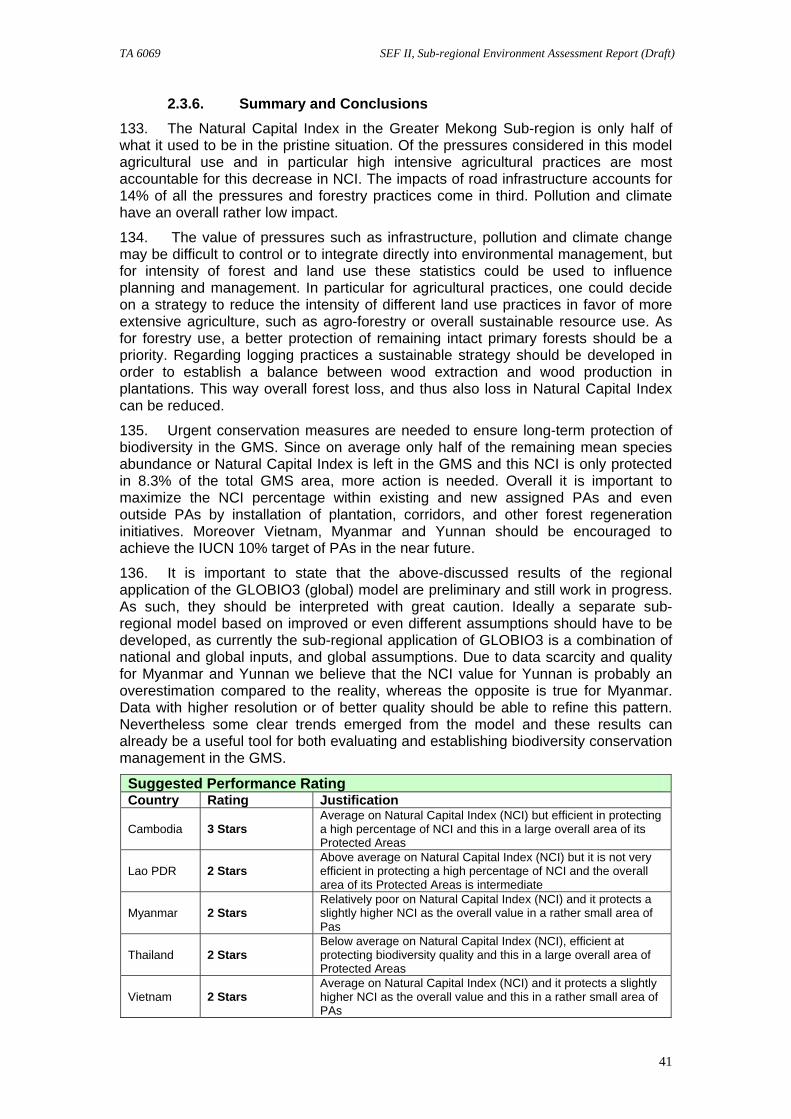
TA 6069 SEF II, Sub-regional Environment Assessment Report (Draft)
41
2.3.6. Summary and Conclusions 133. The Natural Capital Index in the Greater Mekong Sub-region is only half of what it used to be in the pristine situation. Of the pressures considered in this model agricultural use and in particular high intensive agricultural practices are most accountable for this decrease in NCI. The impacts of road infrastructure accounts for 14% of all the pressures and forestry practices come in third. Pollution and climate have an overall rather low impact.
134. The value of pressures such as infrastructure, pollution and climate change may be difficult to control or to integrate directly into environmental management, but for intensity of forest and land use these statistics could be used to influence planning and management. In particular for agricultural practices, one could decide on a strategy to reduce the intensity of different land use practices in favor of more extensive agriculture, such as agro-forestry or overall sustainable resource use. As for forestry use, a better protection of remaining intact primary forests should be a priority. Regarding logging practices a sustainable strategy should be developed in order to establish a balance between wood extraction and wood production in plantations. This way overall forest loss, and thus also loss in Natural Capital Index can be reduced.
135. Urgent conservation measures are needed to ensure long-term protection of biodiversity in the GMS. Since on average only half of the remaining mean species abundance or Natural Capital Index is left in the GMS and this NCI is only protected in 8.3% of the total GMS area, more action is needed. Overall it is important to maximize the NCI percentage within existing and new assigned PAs and even outside PAs by installation of plantation, corridors, and other forest regeneration initiatives. Moreover Vietnam, Myanmar and Yunnan should be encouraged to achieve the IUCN 10% target of PAs in the near future.
136. It is important to state that the above-discussed results of the regional application of the GLOBIO3 (global) model are preliminary and still work in progress. As such, they should be interpreted with great caution. Ideally a separate sub-regional model based on improved or even different assumptions should have to be developed, as currently the sub-regional application of GLOBIO3 is a combination of national and global inputs, and global assumptions. Due to data scarcity and quality for Myanmar and Yunnan we believe that the NCI value for Yunnan is probably an overestimation compared to the reality, whereas the opposite is true for Myanmar. Data with higher resolution or of better quality should be able to refine this pattern. Nevertheless some clear trends emerged from the model and these results can already be a useful tool for both evaluating and establishing biodiversity conservation management in the GMS.
Suggested Performance Rating Country Rating Justification
Cambodia 3 Stars Average on Natural Capital Index (NCI) but efficient in protecting a high percentage of NCI and this in a large overall area of its Protected Areas
Lao PDR 2 Stars Above average on Natural Capital Index (NCI) but it is not very efficient in protecting a high percentage of NCI and the overall area of its Protected Areas is intermediate
Myanmar 2 Stars Relatively poor on Natural Capital Index (NCI) and it protects a slightly higher NCI as the overall value in a rather small area of Pas
Thailand 2 Stars Below average on Natural Capital Index (NCI), efficient at protecting biodiversity quality and this in a large overall area of Protected Areas
Vietnam 2 Stars Average on Natural Capital Index (NCI) and it protects a slightly higher NCI as the overall value and this in a rather small area of PAs
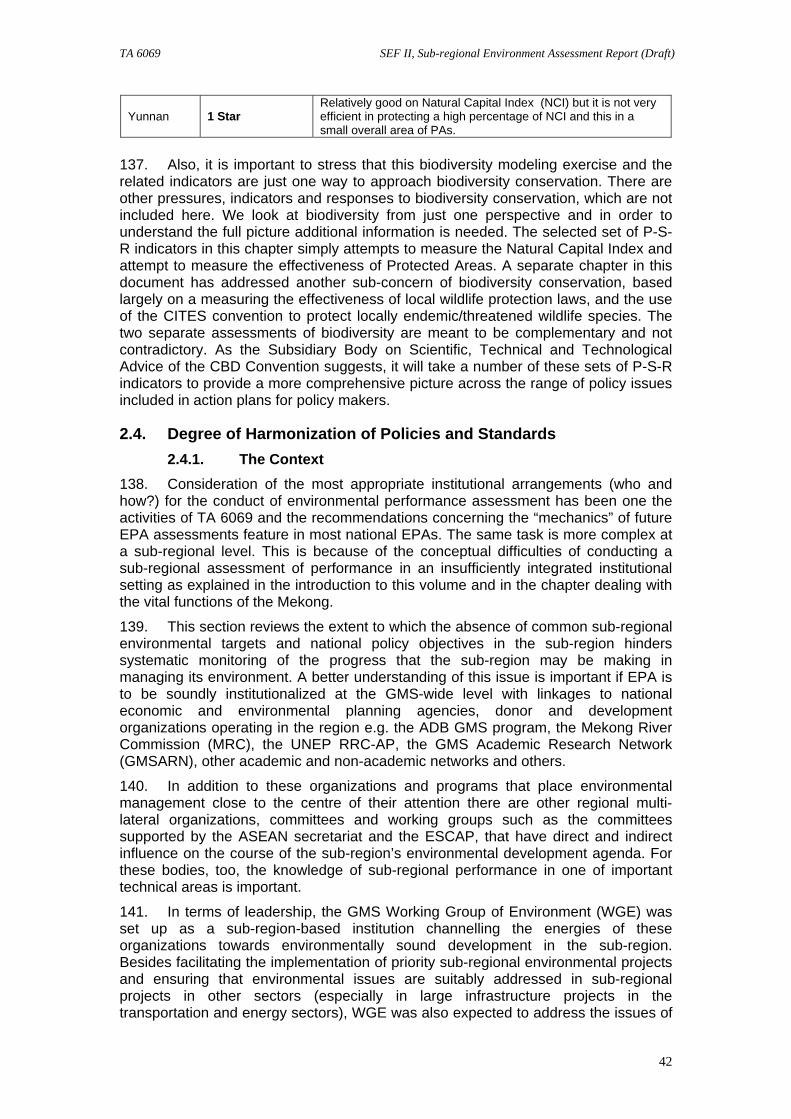
TA 6069 SEF II, Sub-regional Environment Assessment Report (Draft)
42
Yunnan 1 Star Relatively good on Natural Capital Index (NCI) but it is not very efficient in protecting a high percentage of NCI and this in a small overall area of PAs.
137. Also, it is important to stress that this biodiversity modeling exercise and the related indicators are just one way to approach biodiversity conservation. There are other pressures, indicators and responses to biodiversity conservation, which are not included here. We look at biodiversity from just one perspective and in order to understand the full picture additional information is needed. The selected set of P-S-R indicators in this chapter simply attempts to measure the Natural Capital Index and attempt to measure the effectiveness of Protected Areas. A separate chapter in this document has addressed another sub-concern of biodiversity conservation, based largely on a measuring the effectiveness of local wildlife protection laws, and the use of the CITES convention to protect locally endemic/threatened wildlife species. The two separate assessments of biodiversity are meant to be complementary and not contradictory. As the Subsidiary Body on Scientific, Technical and Technological Advice of the CBD Convention suggests, it will take a number of these sets of P-S-R indicators to provide a more comprehensive picture across the range of policy issues included in action plans for policy makers.
2.4. Degree of Harmonization of Policies and Standards 2.4.1. The Context
138. Consideration of the most appropriate institutional arrangements (who and how?) for the conduct of environmental performance assessment has been one the activities of TA 6069 and the recommendations concerning the “mechanics” of future EPA assessments feature in most national EPAs. The same task is more complex at a sub-regional level. This is because of the conceptual difficulties of conducting a sub-regional assessment of performance in an insufficiently integrated institutional setting as explained in the introduction to this volume and in the chapter dealing with the vital functions of the Mekong.
139. This section reviews the extent to which the absence of common sub-regional environmental targets and national policy objectives in the sub-region hinders systematic monitoring of the progress that the sub-region may be making in managing its environment. A better understanding of this issue is important if EPA is to be soundly institutionalized at the GMS-wide level with linkages to national economic and environmental planning agencies, donor and development organizations operating in the region e.g. the ADB GMS program, the Mekong River Commission (MRC), the UNEP RRC-AP, the GMS Academic Research Network (GMSARN), other academic and non-academic networks and others.
140. In addition to these organizations and programs that place environmental management close to the centre of their attention there are other regional multi-lateral organizations, committees and working groups such as the committees supported by the ASEAN secretariat and the ESCAP, that have direct and indirect influence on the course of the sub-region’s environmental development agenda. For these bodies, too, the knowledge of sub-regional performance in one of important technical areas is important.
141. In terms of leadership, the GMS Working Group of Environment (WGE) was set up as a sub-region-based institution channelling the energies of these organizations towards environmentally sound development in the sub-region. Besides facilitating the implementation of priority sub-regional environmental projects and ensuring that environmental issues are suitably addressed in sub-regional projects in other sectors (especially in large infrastructure projects in the transportation and energy sectors), WGE was also expected to address the issues of
TA 6069 SEF II, Sub-regional Environment Assessment Report (Draft)
43
harmonization of national environmental legislation and regulations within the sub-region. Relatively little has been achieved in this area so far. The subject matter of this review is therefore of obvious relevance to WGE.
142. An assessment of policy harmonization is an indirect test of the readiness of the WGE and other GMS institutions to address the region’s common trans-boundary environmental issues and their preparedness to help effectively manage them. Among other things, this review highlights the avenues for more efficient collaboration among the national agencies of GMS countries and between GMS and its development partners.
2.4.2. Environmental Policies and Standards 143. In different places in this review, attention is focused on the prevalent environmental policies, standards and plans in GMS. In general, environmental standards embody public health, political and financial considerations. Sometimes, especially in developing countries, the countries adopt the standards used in advanced economies, or guidelines formulated by international specialized bodies (e.g. WHO) are used. No easy generalizations can be made about the resulting pattern of the standards except to notice that sometimes standards are too lax allowing pollution to go unchecked, or they can be unrealistically high with little hope of being enforced.
144. Standards “imported” from outside the countries may not be the most suitable given the differences in the physical and economic conditions between the country of origin and the country of ultimate use. At the same time, such “imports”, where they exist, create areas of commonality, one of the concerns of this review.
145. Likewise environmental policies and plans need to take into account country’s socio-economic development needs and priorities. Policy harmonization across countries with varying degree of economic development goals is a challenging task; but essential to understand if a common sub-regional environmental management framework is to be developed.
2.4.3. Objective and Scope of the Review
146. The objective of this review can thus be summarized as:
Understanding the existing degree of harmony between environmental management policies and standards in the GMS countries, demonstrated through a few environmental concerns of a trans-boundary nature; and
Assessment of existing institutional framework to address environmental management issues including EPA at a sub-regional level.
147. While a review is made of various laws and policies, where applicable the argument is demonstrated by discussion of select environmental concerns. For instance in the case of environmental standards and targets namely (i) water quality; (ii) air quality and (iii) forest cover are utilized. The three invariably come up in national assessments of environmental performance and are widely understood to be of sub-regional importance. They are also of interest to other sub-regional (e.g. MRC, ASEAN) and international donors.
148. Avenues for possible policy harmonization are identified though recognizing that more work will be required to delineate the feasibility and mechanics of such harmonization including assessing its full natural and socio-economic impact.
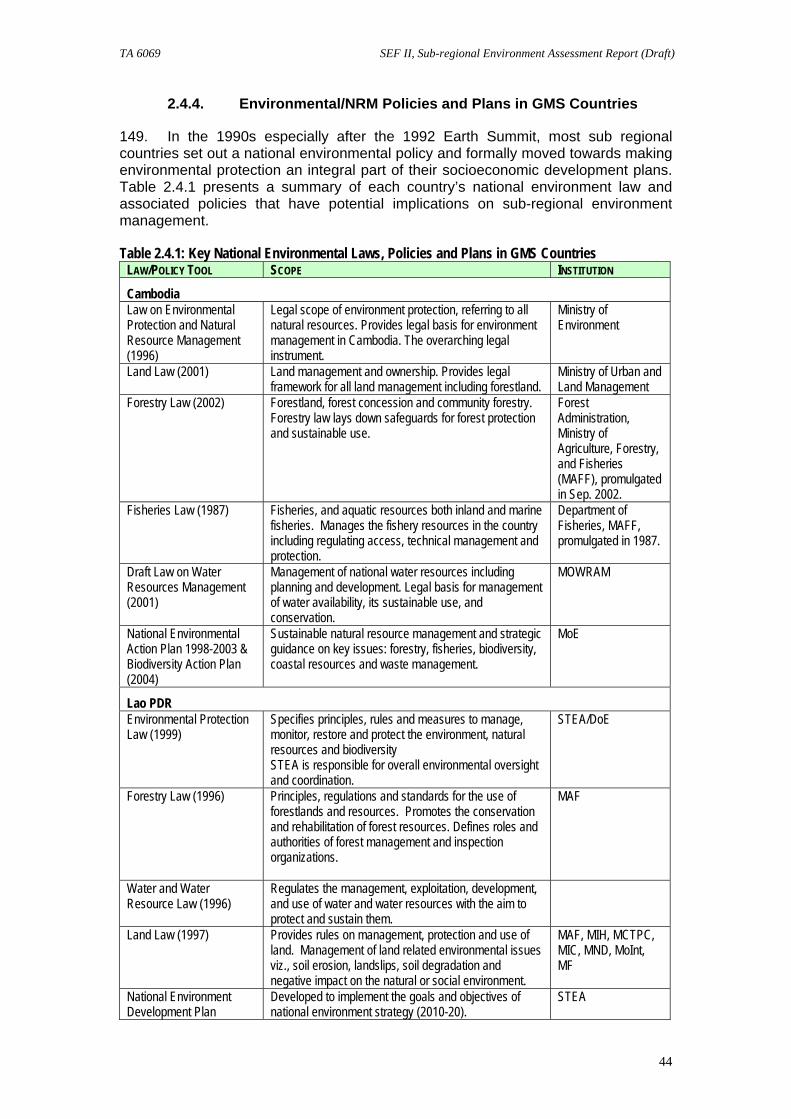
TA 6069 SEF II, Sub-regional Environment Assessment Report (Draft)
44
2.4.4. Environmental/NRM Policies and Plans in GMS Countries
149. In the 1990s especially after the 1992 Earth Summit, most sub regional countries set out a national environmental policy and formally moved towards making environmental protection an integral part of their socioeconomic development plans. Table 2.4.1 presents a summary of each country’s national environment law and associated policies that have potential implications on sub-regional environment management.
Table 2.4.1: Key National Environmental Laws, Policies and Plans in GMS Countries LAW/POLICY TOOL SCOPE INSTITUTION
Cambodia Law on Environmental Protection and Natural Resource Management (1996)
Legal scope of environment protection, referring to all natural resources. Provides legal basis for environment management in Cambodia. The overarching legal instrument.
Ministry of Environment
Land Law (2001) Land management and ownership. Provides legal framework for all land management including forestland.
Ministry of Urban and Land Management
Forestry Law (2002) Forestland, forest concession and community forestry. Forestry law lays down safeguards for forest protection and sustainable use.
Forest Administration, Ministry of Agriculture, Forestry, and Fisheries (MAFF), promulgated in Sep. 2002.
Fisheries Law (1987) Fisheries, and aquatic resources both inland and marine fisheries. Manages the fishery resources in the country including regulating access, technical management and protection.
Department of Fisheries, MAFF, promulgated in 1987.
Draft Law on Water Resources Management (2001)
Management of national water resources including planning and development. Legal basis for management of water availability, its sustainable use, and conservation.
MOWRAM
National Environmental Action Plan 1998-2003 & Biodiversity Action Plan (2004)
Sustainable natural resource management and strategic guidance on key issues: forestry, fisheries, biodiversity, coastal resources and waste management.
MoE
Lao PDR Environmental Protection Law (1999)
Specifies principles, rules and measures to manage, monitor, restore and protect the environment, natural resources and biodiversity STEA is responsible for overall environmental oversight and coordination.
STEA/DoE
Forestry Law (1996) Principles, regulations and standards for the use of forestlands and resources. Promotes the conservation and rehabilitation of forest resources. Defines roles and authorities of forest management and inspection organizations.
MAF
Water and Water Resource Law (1996)
Regulates the management, exploitation, development, and use of water and water resources with the aim to protect and sustain them.
Land Law (1997)
Provides rules on management, protection and use of land. Management of land related environmental issues viz., soil erosion, landslips, soil degradation and negative impact on the natural or social environment.
MAF, MIH, MCTPC, MIC, MND, MoInt, MF
National Environment Development Plan
Developed to implement the goals and objectives of national environment strategy (2010-20).
STEA
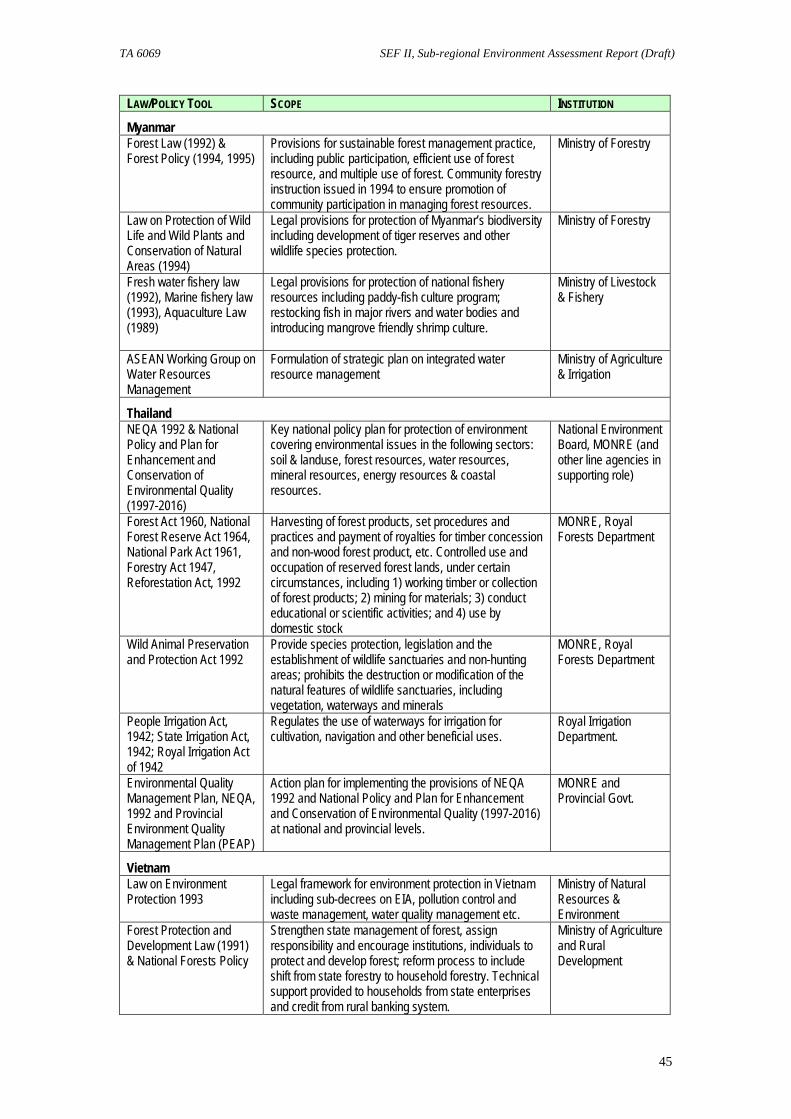
TA 6069 SEF II, Sub-regional Environment Assessment Report (Draft)
45
LAW/POLICY TOOL SCOPE INSTITUTION
Myanmar Forest Law (1992) & Forest Policy (1994, 1995)
Provisions for sustainable forest management practice, including public participation, efficient use of forest resource, and multiple use of forest. Community forestry instruction issued in 1994 to ensure promotion of community participation in managing forest resources.
Ministry of Forestry
Law on Protection of Wild Life and Wild Plants and Conservation of Natural Areas (1994)
Legal provisions for protection of Myanmar’s biodiversity including development of tiger reserves and other wildlife species protection.
Ministry of Forestry
Fresh water fishery law (1992), Marine fishery law (1993), Aquaculture Law (1989)
Legal provisions for protection of national fishery resources including paddy-fish culture program; restocking fish in major rivers and water bodies and introducing mangrove friendly shrimp culture.
Ministry of Livestock & Fishery
ASEAN Working Group on Water Resources Management
Formulation of strategic plan on integrated water resource management
Ministry of Agriculture & Irrigation
Thailand NEQA 1992 & National Policy and Plan for Enhancement and Conservation of Environmental Quality (1997-2016)
Key national policy plan for protection of environment covering environmental issues in the following sectors: soil & landuse, forest resources, water resources, mineral resources, energy resources & coastal resources.
National Environment Board, MONRE (and other line agencies in supporting role)
Forest Act 1960, National Forest Reserve Act 1964, National Park Act 1961, Forestry Act 1947, Reforestation Act, 1992
Harvesting of forest products, set procedures and practices and payment of royalties for timber concession and non-wood forest product, etc. Controlled use and occupation of reserved forest lands, under certain circumstances, including 1) working timber or collection of forest products; 2) mining for materials; 3) conduct educational or scientific activities; and 4) use by domestic stock
MONRE, Royal Forests Department
Wild Animal Preservation and Protection Act 1992
Provide species protection, legislation and the establishment of wildlife sanctuaries and non-hunting areas; prohibits the destruction or modification of the natural features of wildlife sanctuaries, including vegetation, waterways and minerals
MONRE, Royal Forests Department
People Irrigation Act, 1942; State Irrigation Act, 1942; Royal Irrigation Act of 1942
Regulates the use of waterways for irrigation for cultivation, navigation and other beneficial uses.
Royal Irrigation Department.
Environmental Quality Management Plan, NEQA, 1992 and Provincial Environment Quality Management Plan (PEAP)
Action plan for implementing the provisions of NEQA 1992 and National Policy and Plan for Enhancement and Conservation of Environmental Quality (1997-2016) at national and provincial levels.
MONRE and Provincial Govt.
Vietnam Law on Environment Protection 1993
Legal framework for environment protection in Vietnam including sub-decrees on EIA, pollution control and waste management, water quality management etc.
Ministry of Natural Resources & Environment
Forest Protection and Development Law (1991) & National Forests Policy
Strengthen state management of forest, assign responsibility and encourage institutions, individuals to protect and develop forest; reform process to include shift from state forestry to household forestry. Technical support provided to households from state enterprises and credit from rural banking system.
Ministry of Agriculture and Rural Development
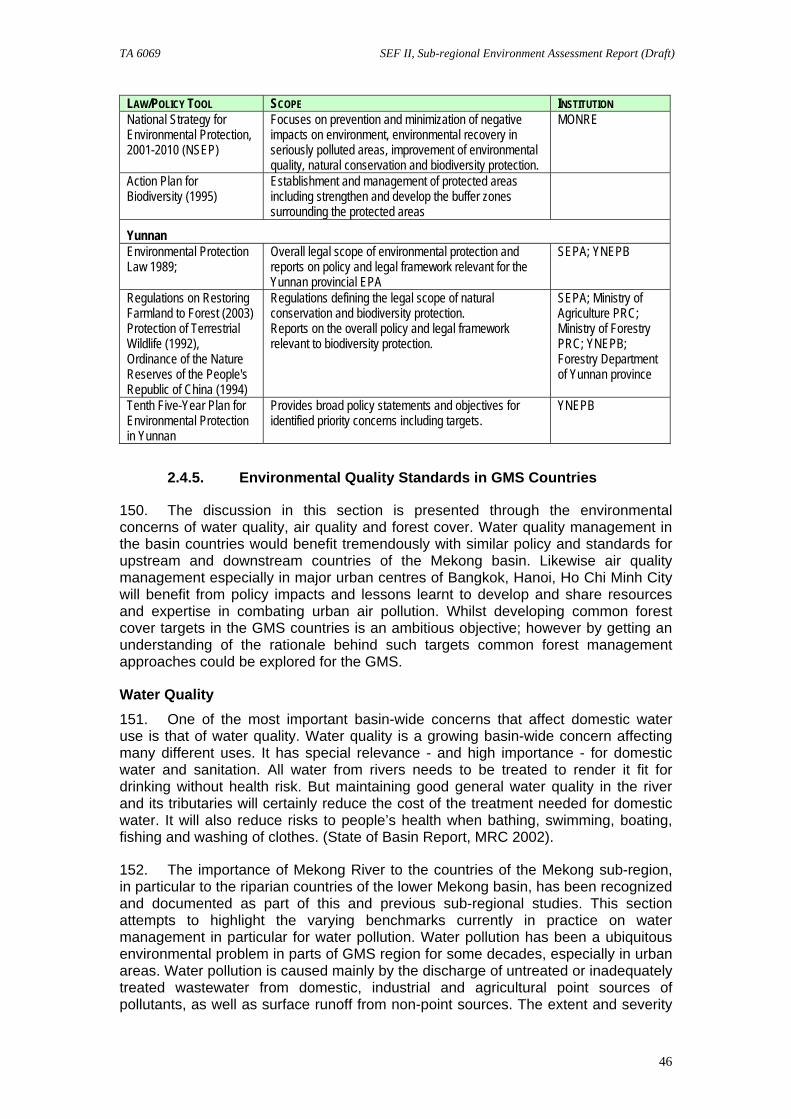
TA 6069 SEF II, Sub-regional Environment Assessment Report (Draft)
46
LAW/POLICY TOOL SCOPE INSTITUTION National Strategy for Environmental Protection, 2001-2010 (NSEP)
Focuses on prevention and minimization of negative impacts on environment, environmental recovery in seriously polluted areas, improvement of environmental quality, natural conservation and biodiversity protection.
MONRE
Action Plan for Biodiversity (1995)
Establishment and management of protected areas including strengthen and develop the buffer zones surrounding the protected areas
Yunnan Environmental Protection Law 1989;
Overall legal scope of environmental protection and reports on policy and legal framework relevant for the Yunnan provincial EPA
SEPA; YNEPB
Regulations on Restoring Farmland to Forest (2003) Protection of Terrestrial Wildlife (1992), Ordinance of the Nature Reserves of the People's Republic of China (1994)
Regulations defining the legal scope of natural conservation and biodiversity protection. Reports on the overall policy and legal framework relevant to biodiversity protection.
SEPA; Ministry of Agriculture PRC; Ministry of Forestry PRC; YNEPB; Forestry Department of Yunnan province
Tenth Five-Year Plan for Environmental Protection in Yunnan
Provides broad policy statements and objectives for identified priority concerns including targets.
YNEPB
2.4.5. Environmental Quality Standards in GMS Countries
150. The discussion in this section is presented through the environmental concerns of water quality, air quality and forest cover. Water quality management in the basin countries would benefit tremendously with similar policy and standards for upstream and downstream countries of the Mekong basin. Likewise air quality management especially in major urban centres of Bangkok, Hanoi, Ho Chi Minh City will benefit from policy impacts and lessons learnt to develop and share resources and expertise in combating urban air pollution. Whilst developing common forest cover targets in the GMS countries is an ambitious objective; however by getting an understanding of the rationale behind such targets common forest management approaches could be explored for the GMS.
Water Quality 151. One of the most important basin-wide concerns that affect domestic water use is that of water quality. Water quality is a growing basin-wide concern affecting many different uses. It has special relevance - and high importance - for domestic water and sanitation. All water from rivers needs to be treated to render it fit for drinking without health risk. But maintaining good general water quality in the river and its tributaries will certainly reduce the cost of the treatment needed for domestic water. It will also reduce risks to people’s health when bathing, swimming, boating, fishing and washing of clothes. (State of Basin Report, MRC 2002).
152. The importance of Mekong River to the countries of the Mekong sub-region, in particular to the riparian countries of the lower Mekong basin, has been recognized and documented as part of this and previous sub-regional studies. This section attempts to highlight the varying benchmarks currently in practice on water management in particular for water pollution. Water pollution has been a ubiquitous environmental problem in parts of GMS region for some decades, especially in urban areas. Water pollution is caused mainly by the discharge of untreated or inadequately treated wastewater from domestic, industrial and agricultural point sources of pollutants, as well as surface runoff from non-point sources. The extent and severity
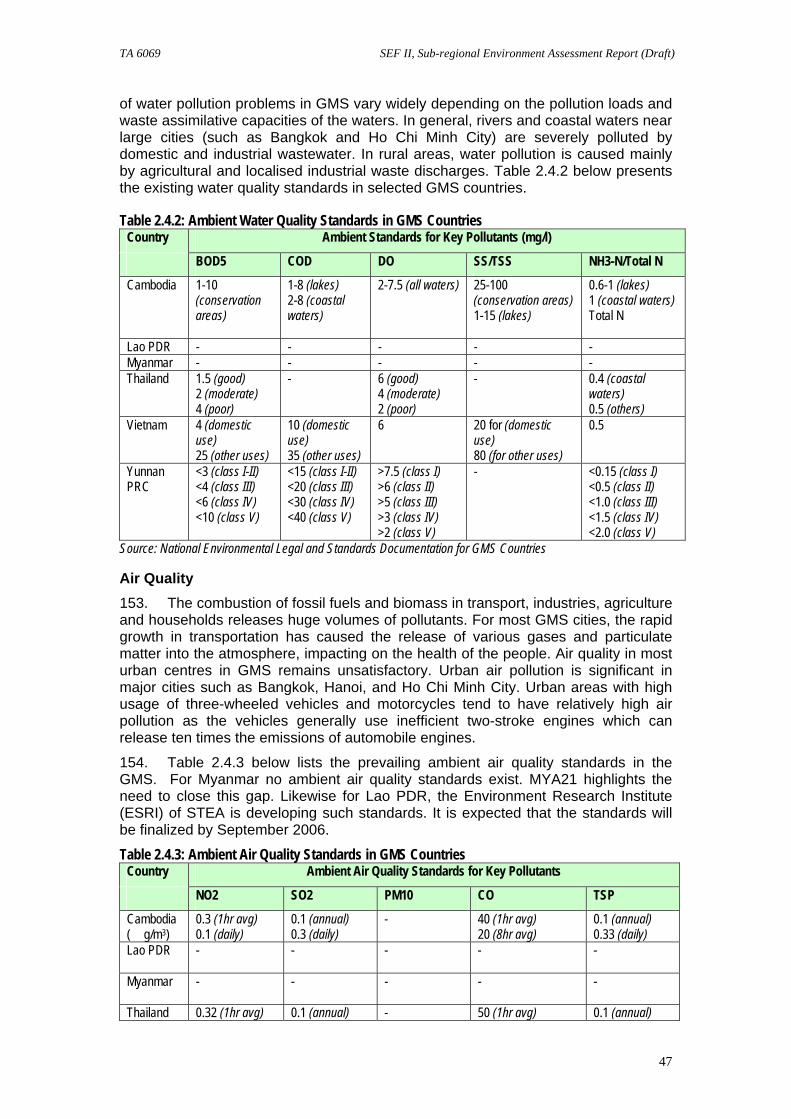
TA 6069 SEF II, Sub-regional Environment Assessment Report (Draft)
47
of water pollution problems in GMS vary widely depending on the pollution loads and waste assimilative capacities of the waters. In general, rivers and coastal waters near large cities (such as Bangkok and Ho Chi Minh City) are severely polluted by domestic and industrial wastewater. In rural areas, water pollution is caused mainly by agricultural and localised industrial waste discharges. Table 2.4.2 below presents the existing water quality standards in selected GMS countries.
Table 2.4.2: Ambient Water Quality Standards in GMS Countries Country Ambient Standards for Key Pollutants (mg/l)
BOD5 COD DO SS/TSS NH3-N/Total N
Cambodia 1-10 (conservation areas)
1-8 (lakes) 2-8 (coastal waters)
2-7.5 (all waters)
25-100 (conservation areas) 1-15 (lakes)
0.6-1 (lakes) 1 (coastal waters) Total N
Lao PDR - - - - - Myanmar - - - - - Thailand 1.5 (good)
2 (moderate) 4 (poor)
- 6 (good) 4 (moderate) 2 (poor)
-
0.4 (coastal waters) 0.5 (others)
Vietnam 4 (domestic use) 25 (other uses)
10 (domestic use) 35 (other uses)
6
20 for (domestic use) 80 (for other uses)
0.5
Yunnan PRC
<3 (class I-II) <4 (class III) <6 (class IV) <10 (class V)
<15 (class I-II) <20 (class III) <30 (class IV) <40 (class V)
>7.5 (class I) >6 (class II) >5 (class III) >3 (class IV) >2 (class V)
- <0.15 (class I) <0.5 (class II) <1.0 (class III) <1.5 (class IV) <2.0 (class V)
Source: National Environmental Legal and Standards Documentation for GMS Countries Air Quality 153. The combustion of fossil fuels and biomass in transport, industries, agriculture and households releases huge volumes of pollutants. For most GMS cities, the rapid growth in transportation has caused the release of various gases and particulate matter into the atmosphere, impacting on the health of the people. Air quality in most urban centres in GMS remains unsatisfactory. Urban air pollution is significant in major cities such as Bangkok, Hanoi, and Ho Chi Minh City. Urban areas with high usage of three-wheeled vehicles and motorcycles tend to have relatively high air pollution as the vehicles generally use inefficient two-stroke engines which can release ten times the emissions of automobile engines.
154. Table 2.4.3 below lists the prevailing ambient air quality standards in the GMS. For Myanmar no ambient air quality standards exist. MYA21 highlights the need to close this gap. Likewise for Lao PDR, the Environment Research Institute (ESRI) of STEA is developing such standards. It is expected that the standards will be finalized by September 2006.
Table 2.4.3: Ambient Air Quality Standards in GMS Countries Country Ambient Air Quality Standards for Key Pollutants
NO2 SO2 PM10 CO TSP
Cambodia ( g/m 3)
0.3 (1hr avg) 0.1 (daily)
0.1 (annual) 0.3 (daily)
- 40 (1hr avg) 20 (8hr avg)
0.1 (annual) 0.33 (daily)
Lao PDR - -
- - -
Myanmar - - - - -
Thailand 0.32 (1hr avg) 0.1 (annual) - 50 (1hr avg) 0.1 (annual)
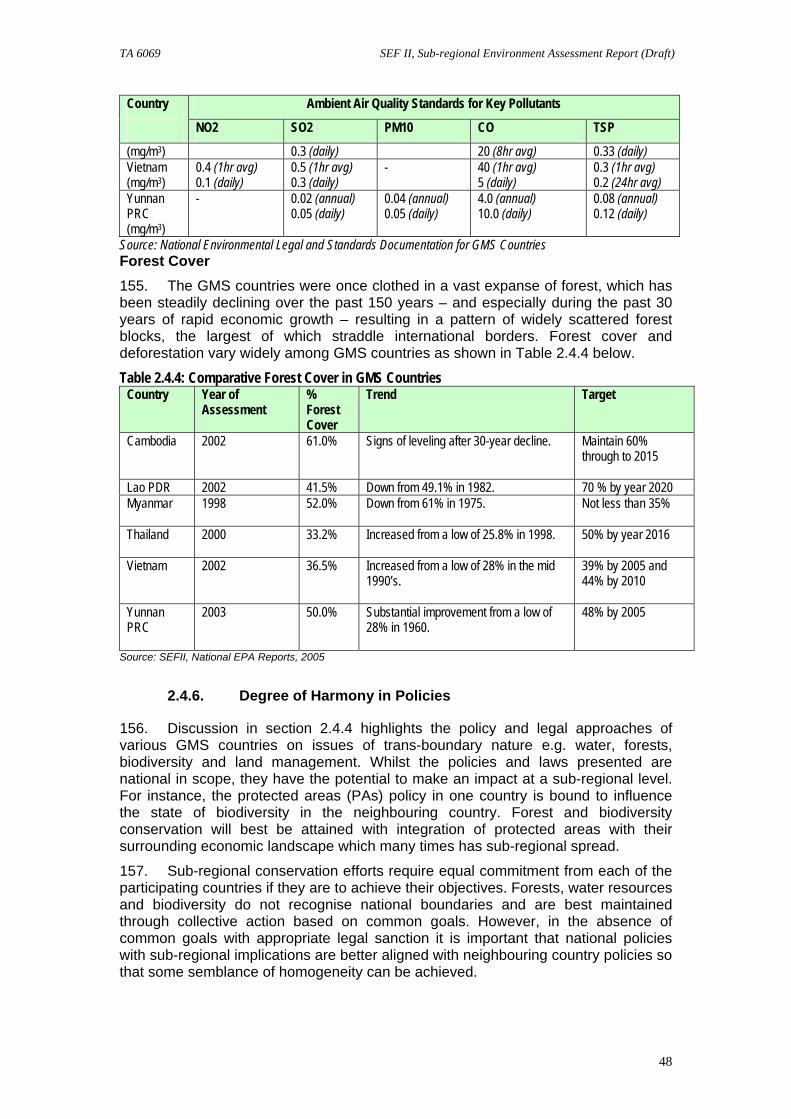
TA 6069 SEF II, Sub-regional Environment Assessment Report (Draft)
48
Country Ambient Air Quality Standards for Key Pollutants
NO2 SO2 PM10 CO TSP
(mg/m3) 0.3 (daily) 20 (8hr avg) 0.33 (daily) Vietnam (mg/m3)
0.4 (1hr avg) 0.1 (daily)
0.5 (1hr avg) 0.3 (daily)
- 40 (1hr avg) 5 (daily)
0.3 (1hr avg) 0.2 (24hr avg)
Yunnan PRC (mg/m3)
- 0.02 (annual) 0.05 (daily)
0.04 (annual) 0.05 (daily)
4.0 (annual) 10.0 (daily)
0.08 (annual) 0.12 (daily)
Source: National Environmental Legal and Standards Documentation for GMS Countries Forest Cover 155. The GMS countries were once clothed in a vast expanse of forest, which has been steadily declining over the past 150 years – and especially during the past 30 years of rapid economic growth – resulting in a pattern of widely scattered forest blocks, the largest of which straddle international borders. Forest cover and deforestation vary widely among GMS countries as shown in Table 2.4.4 below.
Table 2.4.4: Comparative Forest Cover in GMS Countries Country Year of
Assessment % Forest Cover
Trend Target
Cambodia 2002 61.0% Signs of leveling after 30-year decline. Maintain 60% through to 2015
Lao PDR 2002 41.5% Down from 49.1% in 1982. 70 % by year 2020 Myanmar 1998 52.0% Down from 61% in 1975. Not less than 35%
Thailand 2000 33.2% Increased from a low of 25.8% in 1998. 50% by year 2016
Vietnam 2002 36.5% Increased from a low of 28% in the mid
1990’s. 39% by 2005 and 44% by 2010
Yunnan PRC
2003 50.0% Substantial improvement from a low of 28% in 1960.
48% by 2005
Source: SEFII, National EPA Reports, 2005
2.4.6. Degree of Harmony in Policies
156. Discussion in section 2.4.4 highlights the policy and legal approaches of various GMS countries on issues of trans-boundary nature e.g. water, forests, biodiversity and land management. Whilst the policies and laws presented are national in scope, they have the potential to make an impact at a sub-regional level. For instance, the protected areas (PAs) policy in one country is bound to influence the state of biodiversity in the neighbouring country. Forest and biodiversity conservation will best be attained with integration of protected areas with their surrounding economic landscape which many times has sub-regional spread.
157. Sub-regional conservation efforts require equal commitment from each of the participating countries if they are to achieve their objectives. Forests, water resources and biodiversity do not recognise national boundaries and are best maintained through collective action based on common goals. However, in the absence of common goals with appropriate legal sanction it is important that national policies with sub-regional implications are better aligned with neighbouring country policies so that some semblance of homogeneity can be achieved.
TA 6069 SEF II, Sub-regional Environment Assessment Report (Draft)
49
2.4.6.1. Biodiversity
158. The following are identified as some key areas in strengthening of GMS policy environment in biodiversity that will assist with harmonizing management approaches.
Legislative Gaps: absence of appropriate legislation prohibits the development of coherent protection initiatives. In Cambodia for instance MoE is drafting the Law on Wildlife and hence the debate on mandate, roles and responsibility over wildlife protection continues20. Whilst Royal Decree on Protected Areas covers areas under the fisheries and forestry laws, it gives no clear mandate to MoE or other ministries to manage these areas, and does not establish penalties, as these are to come from other laws or sub-decrees. The result is a situation of unclear institutional mandates and weak enforcement mechanisms;
Livelihood and Community Development: Laws related to wildlife do not lay enough emphasis on the role of local communities in protecting the biodiversity, hence eliminating local ownership of the resources. Lack of alternative livelihoods and financial incentives for forest communities limit options when conservation measures are implemented and restrictions are imposed upon livelihood options, this results in the local people being excluded from the conservation policies. The hill tribes in Thailand, Lao PDR and the Central Highlands are often in conflict with areas designated by the government for forest protection as these conservation zones can severely restrict the livelihoods of the communities.
Protected Areas Management: whilst protected areas have been instituted in GMS countries; their geographical extent poses a challenge. Although they are the appropriate entities for conservation planning, they rarely fall neatly within international boundaries. There is potential for cross-border biodiversity reserves between Cambodia and Vietnam where the habitats of important plant and animal communities spread across the two countries.
Data Management: databases on biodiversity inventory also need to be completed and assessed for accuracy. Absence of credible baseline data severely compromises the conservation and management efforts across the sub-region and hampers any coordinated programming.
2.4.6.2. Forest Resources
Forest Management Practices: All countries in the region have policies promoting forest conservation and sustainable forest management but the implementation of these policies has not always been successful for a variety of reasons including: (i) lack of resources or capacity to design and regulate management practices in the field; (ii) lack of technical and silvicultural knowledge about the particular species or forests being managed (including regeneration needs and growth rates); (iii) inability to enforce regulatory mechanisms or codes of practice designed to prevent over harvesting and environmental damage; and (iv) confusing and sometimes inadequate legal framework (ICEM, 2003).
Logging Ban: logging ban has created imbalances, a complete ban on further logging of natural forests and restrictions on exports in one country results in the neighbouring country becoming a net exporter of timber and non-timber forest
1. 20 Biodiversity Action Plan (2004) exists though and the first comprehensive legislation focusing on protective areas was passed in 1993 in the form of a royal decree, the “Declaration of the Protection of Natural Areas.” It created the present system of 23 protected areas.
TA 6069 SEF II, Sub-regional Environment Assessment Report (Draft)
50
products. Consumption patterns and policies such as bans or limitations on further harvesting of forests in Thailand, Vietnam and in neighbouring countries such as China bring increasing pressures on forests in Lao PDR and Cambodia and in other nearby countries. Also, the incapacity to regulate the current logging practices and limit the areas in which it is carried out is the most serious problem, which is now leading to a decline in forest quality. These impediments are difficult to overcome - at least in the short term.
Community Forestry: all GMS countries realize the special needs of traditional forest dwelling people; this has not necessarily led to these communities being granted land rights. Policies that improve the wellbeing of these people, including land allocation and poverty reduction programs and moves towards various types of collaborative management of forests within and outside protected areas is required.
Decentralization: decentralization of forest planning is an important initiative in the sub-region. However, if not appropriately planned it can lead to an apparent reduced management presence because of a lack of resources and capacity at local level. Sometimes new players have taken advantage of these vacuums in authority such as illegal loggers.
Institutional & Legislative Constraints: forestry legislation overlaps with other legislation such as the “Law on Environmental Management” and the “Law on Commune Administration” in Cambodia. The Law on Commune Administration tasks Commune Councils with natural resource management in their respective communes/provinces including forest, fisheries and biodiversity. However, this law limits commune council’s authority over forestry. At the same time, there is confusion over the roles and responsibilities of Forestry Administration and MoE over the management of forests inside and outside the protected areas. Adequate regulatory staff is also needed to ensure the State receives agreed benefits from logging and harvesting non-timber forest products. For example, in 1996 the government in Cambodia should have received over US$100 million from logging when in fact it received only US$10.7 million (ICEM, 2003).
159. These types of problems are partly a consequence of inadequate supervision and partly due to the lack of a well-designed and supportive legal framework. There is a strong case for a unified approach for legal reform across the lower Mekong Basin in light of the linkages that exist between the policy decisions of one country and the exploitation of timber and non-timber forest products in another country.
2.4.6.3. Water Resources
Intra-basin Developments: intra basin development schemes undertaken by the upstream countries can at times be at the expense of downstream countries:
o In order to alleviate the poor socio-economic conditions in northeast Thailand, the government has targeted large-scale water development projects based on supply side projections. In the long term, this can have environmental costs, in part due to unsuitable saline soils.
o Even developments as far upstream as in Yunnan can impact on Cambodia. In 1993, water levels decreased as the Manwan reservoir was filling up in Yunnan while in 1994, the levels increased as water was released from that reservoir (Hirsch and Cheong, 1996).
Forest Practices: deforestation leading to lower water discharge in the dry season and greater sediment loads and floods in the wet impact agriculture development in lower Mekong countries. Stalinization is occurring in NE Thailand
TA 6069 SEF II, Sub-regional Environment Assessment Report (Draft)
51
where deforestation has resulted in rising water tables, a situation exacerbated by the presence of underlying salt domes.
Water Use Practices: Flood management works create significant impacts on the natural hydrological cycle of the Mekong water systems. Increasing abstraction is also altering flow patterns and surface water is becoming increasingly scarce in the dry season due to greater municipal and industrial demands, which tend to be relatively constant all year round. Draining of wetlands, clearing of mangroves, and replanting of catchments with exotic species also substantially interferes with the water cycle and water balance. A sub-region wide approach is required to such development. Saline intrusion occurs in the Mekong Delta during the dry season, as insufficient fresh water flows out to prevent the ingress of tidal seawater. Salt intrusion in coastal areas throughout Vietnam is becoming a significant issue. The salinity of water in all major rivers exceeds the standards for crops in the low flow season for up to 30-40 km from their mouths. Increasing water abstractions bring salinity intrusion further inland (ICEM, 2003). Likewise increased use of pesticides and fertilizers leads to pollution in waterways especially for downstream users.
Navigation: the Mekong Secretariat had carried out a strategy study for developing upper Mekong navigation (1994), which found that freight transport could only increase appreciably with improvement works to the Lancang-Mekong River. However, making Mekong navigable will need to be carefully assessed against impacts on fishery and related livelihood practices along lower Mekong countries.
Institutional & Legislative Gaps: absence of water management laws e.g. in Cambodia which is still in draft form is expected to improve water management issues. Ministry of Water Resources was only established in 1998 and is still developing the appropriate institutional and legal mechanisms for effective water resources management. Absence of an approved legislation leads to overlapping roles and confusion over jurisdiction and water use rights. Conflicts of water use result in water imbalances in the sub-region leading to water shortages on the one hand and flooding on the other.
2.4.6.4. Land Degradation
Irrigation Development – development of reservoirs and other water resources projects in Northeast Thailand will worsen salinity problems by raising the water table; soil quality in Isan is generally poor, showing low clay content and salinity problems. It is estimated that saline soils and unsuitable topography make about 75% of land in the northeast poorly suited to unsuitable for reservoir development.
Agriculture Development – in Lao PDR there is a lack of a strategic national plan for agrarian development and the government does not look to the rural sector for foreign exchange earnings, rather for food sufficiency (Evans 1995). Most land degradation in Lao PDR is officially associated with shifting agriculture and Lao upland farmers face significant problems of lowering soil fertility, weed infestation and rapid loss of soil moisture due to declining fallow periods.
Lack of alternative livelihoods: policy or strategy especially for rural farmers with small landholdings results in over farming of the lands with aggressive use of chemicals and fertilizers leading to long-term degradation of land.
Land Ownership & Management Issues: uncertain land tenure, limited knowledge of land capability, absence of community approaches to land
TA 6069 SEF II, Sub-regional Environment Assessment Report (Draft)
52
management does not encourage the farmers to adopt sustainable land management practices.
Land Use Policy: land use conflicts erupt in the absence of clear mandates; Current emphasis in most countries is on optimizing agricultural production. No policy target exists in Myanmar for instance on management of land resources such as land zoning or demarcation of land into conserved or critical areas. In the absence of such a policy measure the risks to continued land degradation whether from erosion or uncontrolled deforestation is immense with sub-regional implications.
Databases: development of sub-regional soil maps, topographic map, land capability and suitability maps, and land cadastral maps by using geo-informatics technology is essential for adopting a coherent sub-regional approach to land management.
2.4.6.5. Fisheries
Fish Habitat: destruction of fish habitat in Cambodia in the Tonle Sap system is partly due to timber demand in the sub-region including outside of Cambodia. Tonle Sap fish habitats also support fisheries in Thailand. Not only is the protection of the Tonle Sap system including the maintenance of the annual floods crucial to the welfare of Cambodia but also to maintain the regional balance of fish stock, enabling the continued production of a large proportion of rice and fisheries for lower Mekong.
Water Flows: Cambodia shares the Mekong Delta with Vietnam to which it is an immediate upstream partner. Any natural resource development in Cambodia, which reduces the quantity or quality of Mekong-Bassac River flow is of grave concern to Vietnam. There is concern in Lao PDR, especially by fisherfolk near the border at Khone Falls that dynamiting by Cambodian fisherfolk is affecting their fish yields (Sluiter 1992). While Lao PDR fisherfolk have been complaining about decreasing yields from the Khone Falls area, it is difficult without more substantial research to confirm this (Roberts (a) 1993). The Tonle Sap system supports fish that migrate upstream as far as Yunnan. The conservation and management of the Tonle Sap system is therefore of regional significance. This is a classic case where there are clear reciprocal effects in an upstream-downstream trajectory.
Aquaculture: attention given to developing aquaculture (frequently at the expense of capture fisheries) is driven by a fisheries/industry sectoral approach, with little regard for food security or poverty alleviation. This emphasis on aquaculture in the long term is to the detriment of wild fish stocks in the sub-region.
Integrated Fisheries Management: lack of an integrated approach to fishery development resulting in impacts from projects like dams, weirs whose assessments are limited in spatial scope and sectors, many a times not considering impacts well downstream of the immediate development; what may be an opportunity for one sector may constitute a threat to another.
2.4.6.6. Future Directions
160. Legislative and policy gaps need to be addressed taking into account stakeholder and community development approaches. Local people in particular ethnic minorities and hill tribes participation is essential in developing sustainable and integrated planning approaches to forest, biodiversity, land and water management.
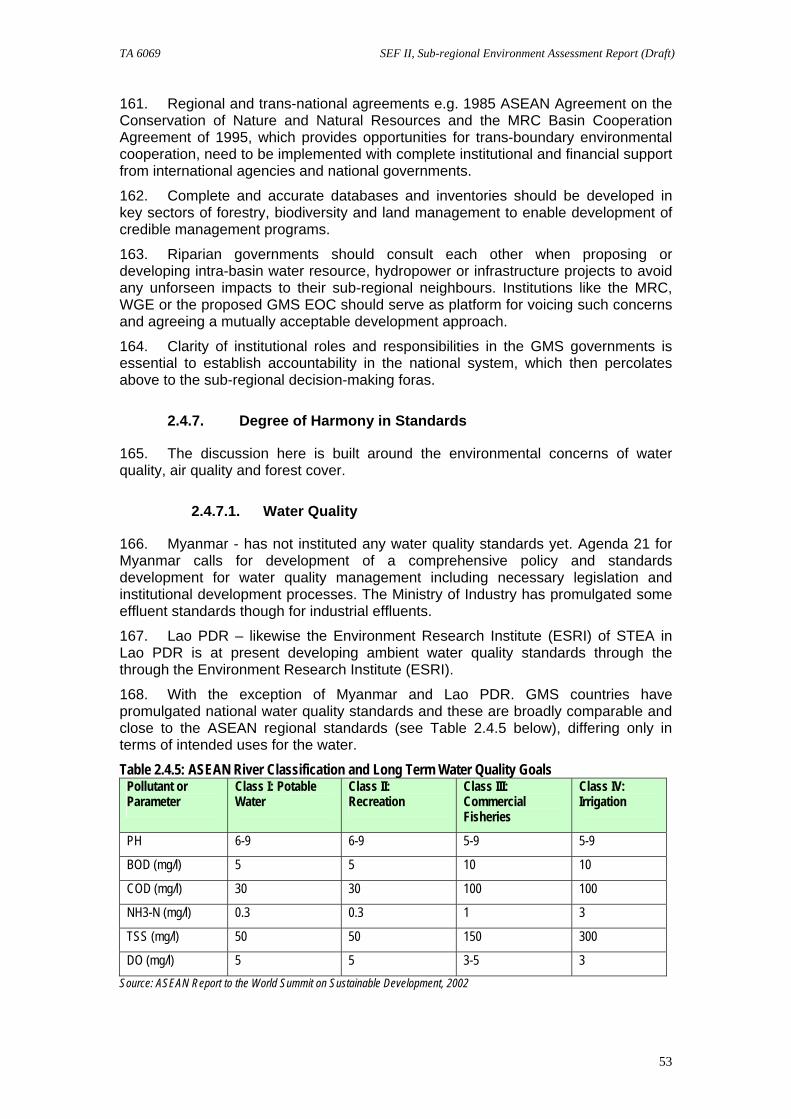
TA 6069 SEF II, Sub-regional Environment Assessment Report (Draft)
53
161. Regional and trans-national agreements e.g. 1985 ASEAN Agreement on the Conservation of Nature and Natural Resources and the MRC Basin Cooperation Agreement of 1995, which provides opportunities for trans-boundary environmental cooperation, need to be implemented with complete institutional and financial support from international agencies and national governments.
162. Complete and accurate databases and inventories should be developed in key sectors of forestry, biodiversity and land management to enable development of credible management programs.
163. Riparian governments should consult each other when proposing or developing intra-basin water resource, hydropower or infrastructure projects to avoid any unforseen impacts to their sub-regional neighbours. Institutions like the MRC, WGE or the proposed GMS EOC should serve as platform for voicing such concerns and agreeing a mutually acceptable development approach.
164. Clarity of institutional roles and responsibilities in the GMS governments is essential to establish accountability in the national system, which then percolates above to the sub-regional decision-making foras.
2.4.7. Degree of Harmony in Standards
165. The discussion here is built around the environmental concerns of water quality, air quality and forest cover.
2.4.7.1. Water Quality
166. Myanmar - has not instituted any water quality standards yet. Agenda 21 for Myanmar calls for development of a comprehensive policy and standards development for water quality management including necessary legislation and institutional development processes. The Ministry of Industry has promulgated some effluent standards though for industrial effluents.
167. Lao PDR – likewise the Environment Research Institute (ESRI) of STEA in Lao PDR is at present developing ambient water quality standards through the through the Environment Research Institute (ESRI).
168. With the exception of Myanmar and Lao PDR. GMS countries have promulgated national water quality standards and these are broadly comparable and close to the ASEAN regional standards (see Table 2.4.5 below), differing only in terms of intended uses for the water.
Table 2.4.5: ASEAN River Classification and Long Term Water Quality Goals Pollutant or Parameter
Class I: Potable Water
Class II: Recreation
Class III: Commercial Fisheries
Class IV: Irrigation
PH 6-9 6-9 5-9 5-9
BOD (mg/l) 5 5 10 10
COD (mg/l) 30 30 100 100
NH3-N (mg/l) 0.3 0.3 1 3
TSS (mg/l) 50 50 150 300
DO (mg/l) 5 5 3-5 3 Source: ASEAN Report to the World Summit on Sustainable Development, 2002
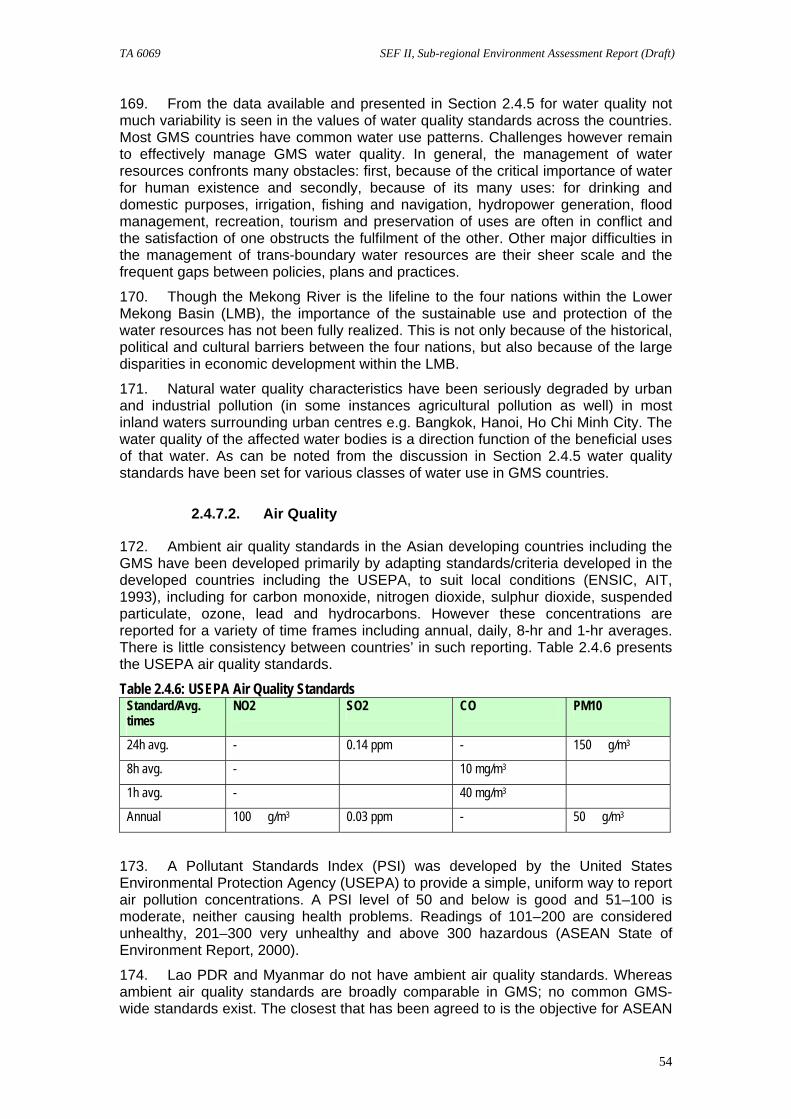
TA 6069 SEF II, Sub-regional Environment Assessment Report (Draft)
54
169. From the data available and presented in Section 2.4.5 for water quality not much variability is seen in the values of water quality standards across the countries. Most GMS countries have common water use patterns. Challenges however remain to effectively manage GMS water quality. In general, the management of water resources confronts many obstacles: first, because of the critical importance of water for human existence and secondly, because of its many uses: for drinking and domestic purposes, irrigation, fishing and navigation, hydropower generation, flood management, recreation, tourism and preservation of uses are often in conflict and the satisfaction of one obstructs the fulfilment of the other. Other major difficulties in the management of trans-boundary water resources are their sheer scale and the frequent gaps between policies, plans and practices.
170. Though the Mekong River is the lifeline to the four nations within the Lower Mekong Basin (LMB), the importance of the sustainable use and protection of the water resources has not been fully realized. This is not only because of the historical, political and cultural barriers between the four nations, but also because of the large disparities in economic development within the LMB.
171. Natural water quality characteristics have been seriously degraded by urban and industrial pollution (in some instances agricultural pollution as well) in most inland waters surrounding urban centres e.g. Bangkok, Hanoi, Ho Chi Minh City. The water quality of the affected water bodies is a direction function of the beneficial uses of that water. As can be noted from the discussion in Section 2.4.5 water quality standards have been set for various classes of water use in GMS countries.
2.4.7.2. Air Quality
172. Ambient air quality standards in the Asian developing countries including the GMS have been developed primarily by adapting standards/criteria developed in the developed countries including the USEPA, to suit local conditions (ENSIC, AIT, 1993), including for carbon monoxide, nitrogen dioxide, sulphur dioxide, suspended particulate, ozone, lead and hydrocarbons. However these concentrations are reported for a variety of time frames including annual, daily, 8-hr and 1-hr averages. There is little consistency between countries’ in such reporting. Table 2.4.6 presents the USEPA air quality standards.
Table 2.4.6: USEPA Air Quality Standards Standard/Avg. times
NO2 SO2 CO PM10
24h avg. - 0.14 ppm - 150 g/m 3
8h avg. - 10 mg/m3
1h avg. - 40 mg/m3
Annual 100 g/m 3 0.03 ppm - 50 g/m 3
173. A Pollutant Standards Index (PSI) was developed by the United States Environmental Protection Agency (USEPA) to provide a simple, uniform way to report air pollution concentrations. A PSI level of 50 and below is good and 51–100 is moderate, neither causing health problems. Readings of 101–200 are considered unhealthy, 201–300 very unhealthy and above 300 hazardous (ASEAN State of Environment Report, 2000).
174. Lao PDR and Myanmar do not have ambient air quality standards. Whereas ambient air quality standards are broadly comparable in GMS; no common GMS-wide standards exist. The closest that has been agreed to is the objective for ASEAN
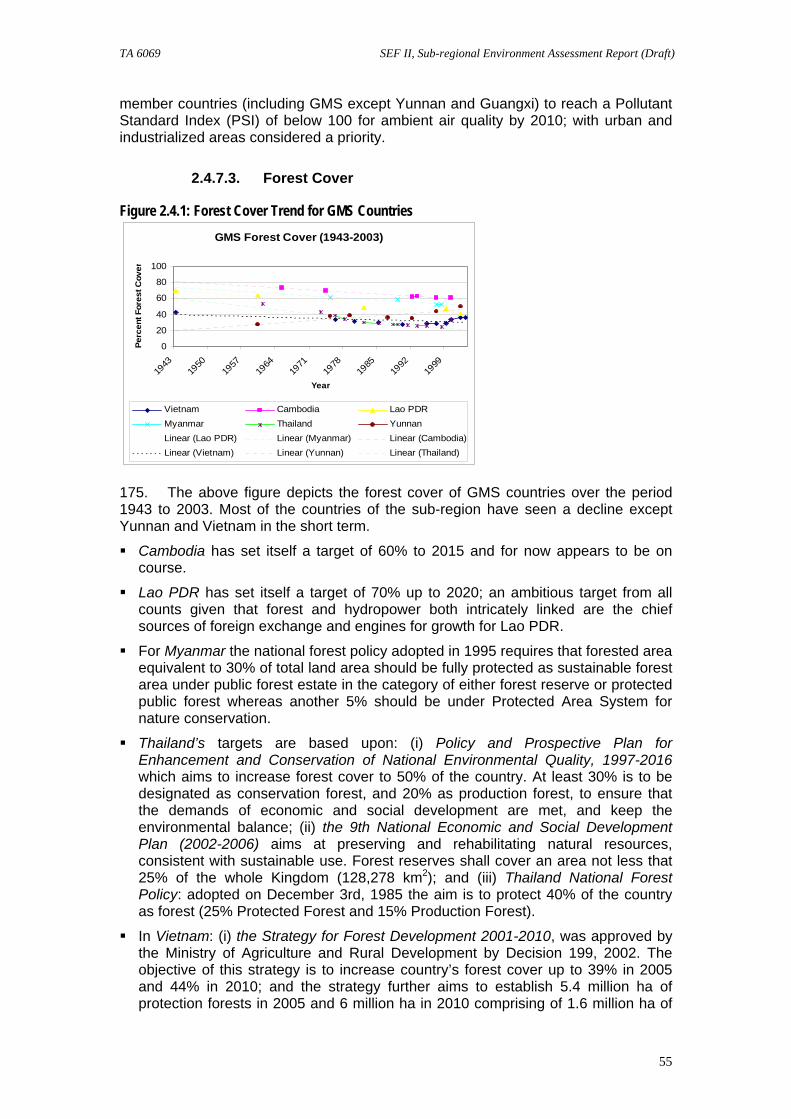
TA 6069 SEF II, Sub-regional Environment Assessment Report (Draft)
55
member countries (including GMS except Yunnan and Guangxi) to reach a Pollutant Standard Index (PSI) of below 100 for ambient air quality by 2010; with urban and industrialized areas considered a priority.
2.4.7.3. Forest Cover
Figure 2.4.1: Forest Cover Trend for GMS Countries GMS Forest Cover (1943-2003)
0
20
40
60
80
100
1943
1950
1957
1964
1971
1978
1985
1992
1999
Year
Perc
ent F
ores
t Cov
er
Vietnam Cambodia Lao PDRMyanmar Thailand YunnanLinear (Lao PDR) Linear (Myanmar) Linear (Cambodia)Linear (Vietnam) Linear (Yunnan) Linear (Thailand)
175. The above figure depicts the forest cover of GMS countries over the period 1943 to 2003. Most of the countries of the sub-region have seen a decline except Yunnan and Vietnam in the short term.
Cambodia has set itself a target of 60% to 2015 and for now appears to be on course.
Lao PDR has set itself a target of 70% up to 2020; an ambitious target from all counts given that forest and hydropower both intricately linked are the chief sources of foreign exchange and engines for growth for Lao PDR.
For Myanmar the national forest policy adopted in 1995 requires that forested area equivalent to 30% of total land area should be fully protected as sustainable forest area under public forest estate in the category of either forest reserve or protected public forest whereas another 5% should be under Protected Area System for nature conservation.
Thailand’s targets are based upon: (i) Policy and Prospective Plan for Enhancement and Conservation of National Environmental Quality, 1997-2016 which aims to increase forest cover to 50% of the country. At least 30% is to be designated as conservation forest, and 20% as production forest, to ensure that the demands of economic and social development are met, and keep the environmental balance; (ii) the 9th National Economic and Social Development Plan (2002-2006) aims at preserving and rehabilitating natural resources, consistent with sustainable use. Forest reserves shall cover an area not less that 25% of the whole Kingdom (128,278 km2); and (iii) Thailand National Forest Policy: adopted on December 3rd, 1985 the aim is to protect 40% of the country as forest (25% Protected Forest and 15% Production Forest).
In Vietnam: (i) the Strategy for Forest Development 2001-2010, was approved by the Ministry of Agriculture and Rural Development by Decision 199, 2002. The objective of this strategy is to increase country’s forest cover up to 39% in 2005 and 44% in 2010; and the strategy further aims to establish 5.4 million ha of protection forests in 2005 and 6 million ha in 2010 comprising of 1.6 million ha of
TA 6069 SEF II, Sub-regional Environment Assessment Report (Draft)
56
special use forests in 2005 and 2 million ha in 2010; and 6.2 million ha of production forests in 2005 and 8 million ha in 2010.
For Yunnan according to the Tenth Five-Year Plan for Environmental Protection of Yunnan Province approved by the State Council on 26 December 2001, the target figure for forest cover for Yunnan Province is 48% by year 2005.
176. Varying standards and targets exist for forest protection in GMS dependent upon each country’s topographical characteristics and national development priorities and conservation agenda.
2.4.7.4. Future Directions
177. Ambient water quality standards in various GMS countries are similar, a reflection of their common water use patterns. However, more efficient water quality monitoring is required to assess their continuous relevance in the face of growing economic development of GMS, and in the development of appropriate effluent standards.
178. Whereas ambient air quality standards in GMS are similar, there is little consistency between countries’ in reporting formats. Also insufficient information exists about emissions, meteorology, and effectiveness of air pollution control measures to test the appropriateness of the standards. Greater co-relation needs to be established between air pollution control programs, growing urbanization and industrialization and the prevailing ambient air quality standards. For air quality standards to be meaningful, they need to be matched with a cost-benefit analysis of the air pollution management programs in GMS.
179. Targets for forest cover differ in the GMS countries. Different countries aim for different percentage forest cover, normally based on the topographic characteristics of the country and it’s socio-economic development objectives/pressure. No country is aiming for 100% forest cover. Common environmental targets are not conceivable at this stage given the differing developmental needs of the GMS countries and their utilisation of forest resources.
2.4.8. Sub-regional Cooperation Initiatives
180. Countries normally pursue their own national interests in utilising natural resource systems, instead of equitably sharing the joint benefits that can accrue from integrated multi-country management. The GMS has over the years adopted several sub-region wide initiatives in environmental management. This section discusses GMS efforts in standardizing environmental management approaches from a policy and institutional development perspective; that then can serve as building blocks for a sub-region wide EPA. Only some of the key initiatives are mentioned here noting that there could be other programs that are actively addressing sub-regional GMS environment management issues.
ASEAN 181. Association of South East Asian Nations (ASEAN) includes all the GMS countries except Yunnan. ASEAN region wide environment programs include ASEP I (1978-1982), ASEP II (1983-1987) and the Strategic Plan of Action on Environment (1994-98) (ADB GMS Atlas, 2004). Further ASEAN’s environment agenda includes the ongoing work associated with the Regional Haze Action Plan – responding to transborder haze problems (SEF I, 2002). The regional haze action plan has served to form the basis for transboundary air pollution management initiatives as part of the
TA 6069 SEF II, Sub-regional Environment Assessment Report (Draft)
57
Hanoi Plan of Action and Strategic Plan Action for Environment (1994-2004). (ADB GMS Atlas, 2004)
182. The ASEAN Senior Officials on the Environment (ASOEN) now have three working groups – nature conservation and biodiversity, coastal and marine environments, and multilateral environmental agreements – in addition to the ASOEN Haze Technical Task Force.
Mekong River Commission 183. In 1995, the four lower Mekong basin governments established a new organisation – the Mekong River Commission (MRC). Cambodia, Lao PDR, Thailand and Vietnam are the current signatories to the 1995 Mekong Agreement (MRC, 1995). Myanmar and PRC are ‘dialogue partners’.
184. MRC provides for a coordinated approach to water management in Mekong basin by carrying out strategic programs and providing policy and scientific advice. MRC has three core programs: the Basin Development Plan, the Water Utilization Program, and the Environment Program. The Basin Development Plan promotes knowledge sharing, capacity building and sound environmental management and is expected to guide investment into irrigated agriculture, watershed management, fisheries, hydropower, and other key sectors. The Water Utilization Program provides the necessary tolls and knowledge to understand the hydrology of the Mekong River and its linkages to the natural environment. The Environment Program focuses on trans-boundary environmental monitoring including EIA systems and capacity building and environment management (ADB GMS Atlas 2004).
UN Initiatives21 United Nations Commission for Sustainable Development (UNCSD): UNCSD
offers a mechanism for UN member countries to pursue sustainable development initiatives through sessions/activities in which countries agree to carry out tasks with help from various development bodies. All six sub-regional countries are active participants of UNCSD sessions and activities. Member countries present reports pertaining to national initiatives and their progress towards compliance with commitment to Agenda 21. Current commitments are based on the Johannesburg Summit, including the formulation of national strategies for sustainable development and ways to be involved in the planning those who will be affected by development projects.
Economic and Social Commission for Asia and the Pacific (ESCAP): ESCAP is responsible for the regional cooperation and integration in Asia-Pacific region. In the area of environment and sustainable development, ESCAP contributes to strengthening national capacities to design and implement policies and strategies. Its initiatives include a two-phase project to integrate environmental and socioeconomic planning and to involve stakeholders through national councils for sustainable development.
United Nations Development Programme (UNDP): UNDP cooperates closely with ESCAP to promote and implement the UN agenda. UNDP’s projects are funded under the Global Environment Facility and assisted by the Capacity 21 Program, which was key to the creation of numerous local and national sustainable development strategies under Agenda 21.
1. 21 As abstracted from the ADB GMS Atlas 2004
TA 6069 SEF II, Sub-regional Environment Assessment Report (Draft)
58
United Nations Environment Programme (UNEP): While UNEP’s main area of responsibility is the environment, it has been very active in sustainable development. UNEP has supported projects in the sub-region in partnership with ADB, MRC and other institutions. Its Regional Resource Centre for Asia and Pacific worked closely with ADB, ESCAP, and UNDP for the Johannesburg Summit, involving preparation of sub-regional and regional sustainable development platforms. UNEP has been co-implementing projects under the GMS Program and is supporting the formulation of national sustainable development strategies in the sub-region.
Asian Development Bank – GMS Program22 185. ADB has strongly supported the GMS Program since the latter’s establishment in 1992. The Program has helped develop infrastructure to link the sub-region and develop its resource base, and has supported initiatives for resolving policy, regulatory, and other non-physical barriers to cross-border traffic and trade. The GMS Strategic Framework adopted in 2001, which will guide cooperation into the next decade, articulates the shared vision of a Mekong sub-region that is more integrated, prosperous and equitable. This is to be realized through five thrusts that include protecting the environment and promoting sustainable use of shared resources. The GMS Strategic Framework has been strongly endorsed by the GMS leaders at various forums.
186. Cooperation in environmental concerns is an important part of the GMS Program because natural resources provide the base for the sub-region’s socioeconomic development. When infrastructure projects threatened to have an adverse environmental impact, ADB focused its assistance under the GMS Program promoting the early integration of social and environmental issues in the planning process, and on strengthening monitoring and evaluation capabilities. Some of the key ADB initiatives are summarized below (noting that there are other programs of relevance which may not be mentioned here for sake of economy):
GMS Working Group on Environment (WGE): ADB supported the establishment of the GMS Working Group on Environment (WGE), which ensured that environmental dimensions are addressed in various projects and activities of the GMS Program. The Working Group also coordinated the implementation of the environmental projects under the GMS Program. These projects involved (i) the development and implementation of a common framework (the Strategic Environment Framework) among sub-regional countries, (ii) cooperation in the management of shared environmental resources, such as watersheds and wetlands; and (iii) institutional strengthening to share information and undertake joint environmental monitoring.
GMS Flagship Programs: The Strategic Framework for the Greater Mekong sub-region (GMS) adopted by the 10th GMS Ministerial Conference in November 2001 envisions a well-integrated and prosperous Mekong sub-region – free of poverty and committed to protecting the environment so vital to the sub-region’s future wellbeing. The GMS Program focuses on five strategic development thrusts to achieve these goals: (i) strengthen infrastructure linkages through a multisectoral approach, (ii) facilitate cross-border trade and investment, (iii) enhance private sector participation in development and improve its competitiveness, (iv) develop human resources and skill competencies, and (v) protect the environment and promote sustainable use of the sub-region’s shared natural resources. ‘Flagship’ programs in 11 key areas have been designed for implementation in pursuit of
1. 22 As abstracted from the ADB GMS Atlas 2004
TA 6069 SEF II, Sub-regional Environment Assessment Report (Draft)
59
these strategic thrusts. They include transportation/economic corridors, telecommunications and energy interchanges, cross-border trade and investment, support for greater private sector participation in development, development of human resources, joint initiatives for the management of the sub-region’s shared environment and natural resources, and the promotion of the GMS as a single tourism destination.
GMS Program on Environment: amongst the early projects undertaken to promote sub-regional cooperation in resolving cross border externalities were:
a. Sub-regional Environmental Monitoring and Information System (SEMIS) and the Sub-regional Environmental Training and Institutional Strengthening (SETIS). SEMIS provided training in geographic information system (GIS) technologies, data standards and other aspects, while SETIS focused on raising environmental awareness and capability among government staff.
b. A more recent project, the Strategic Environment Framework (SEF I), sought to improve the decision-making processes to minimize the social and environmental costs of development. This first phase came up with an Early Warning Information System (EWIS) and identified a number of identified “hotspots” – areas of special environmental sensitivity.
c. The current second phase of SEF has assisted in developing methods, tools, databases, and indicators to improve assessment and monitoring of environmental performance that will assist with developing effective national and sub-regional environment management policies.
d. Two other regional technical assistance (RETA) initiatives focusing on some of the most degraded resources in the GMS- wetlands and watersheds were also undertaken. These projects (Poverty Reduction and Environmental Management in Remote GMS Watersheds and Protection and Management of Critical Wetlands in the Lower Mekong Basin) were designed to protect and promote sustainable management of regionally significant wetlands and watersheds, while advancing poverty reduction goals in these areas.
GMS Core Environment Program (CEP): is a proposed WGE course of action to meet the need for a more strategic and effective approach in managing and conserving the sub-region’s environment and natural resources for sustainable development. Through the CEP the GMS governments are introducing a major new and proactive environment program to be overseen by the GMS WGE as a critical part of the overall development strategy for the sub-region. The GMS CEP creates a vision and framework for long term investment in sub-regional environmental governance and institution building, achieving sustainability and environmental protection in the main development sectors and economic corridors and conserving biodiversity within protected areas and across the landscapes linking them. The CEP provides the framework for reorienting the nature and quality of development strategies, plans and investments to have more sustainable and equitable outcomes and identifies areas of coordination, cooperation collaboration among and between GMS development partners. The WGE-10 also endorsed the proposal for creating an Environment Operations Center (EOC) to provide technical and secretariat support to the WGE and to operationalize and manage the CEP, including the BCCI.
GMS Biodiversity Conservation Corridors Initiative: GMS BCCI is the flagship of the CEP. The primary goal of the BCCI is that by 2015, GMS countries will endeavor to maintain and improve the cover, condition, and biodiversity of forestlands and associated ecosystems in priority biodiversity conservation landscapes and corridors. It has five components (i) poverty alleviation through
TA 6069 SEF II, Sub-regional Environment Assessment Report (Draft)
60
sustainable use of natural resources and development of livelihoods, (ii) clear definition of optimal land uses and harmonized land management regimes, (iii) restoration and maintenance of ecosystem connectivity, (iv) capacity building in local communities and government staff and (v) sustainable financing mechanisms and structures integrated with government planning and budgeting procedures. The emphasis of each component is poverty reduction, integrated land use planning and management, restored ecosystem connectivity, capacity building and sustainable financing.
Non-Governmental Organizations 187. A number of international non-governmental organisations have developed basin-level initiatives to promote environmental sustainability and natural resource conservation. These include the World Conservation Union (IUCN), the World Wide Fund for Nature (WWF), CARE, Wildlife Conservation Society (WCS), Oxfam, Fauna and Flora International, BirdLife International, and WildAid and so on. The initiatives are to strengthen the capacity of governments, civil society groups and other key stakeholders to work together at a regional level in finding solutions to basin-wide and trans-boundary environmental problems and continuing this collaboration for the long term.
188. Additionally local NGOs and resource centres are also active in some of the GMS countries, like Yunnan Environmental Monitoring Central Station, Environment Supervision and Management Station, and the Yunnan Environmental Science Institute in Yunnan; Asian Elephant Foundation of Thailand, the Bird Conservation Society of Thailand, the Hornbill Research Foundation, the Seub Nakhasthein Foundation, and Wildlife Fund Thailand. There are several other local NGOs making valuable contribution to synergizing conservation efforts in the sub-region at the grassroots level.
2.4.9. Challenges to Sub-regional Cooperation
189. The preceding discussion highlights some of the ongoing sub-regional programs and initiatives in GMS. The Mekong Basin is a complex region politically, socially and in terms of its environment. There are many players: international organisations and multilateral development agencies, and many provincial and local level government organisations. Civil society organisations complete the mix, and these range from large international organisations to small local groups including unions, cooperatives and conservation groups (MRC, 2003).
190. However a lot needs to be done before a truly regional collaboration and governance can framework can come true. Clearly any planning process must achieve some sort of consensus on what the basin’s sustainable development objectives should be. The technical aspects of planning, development and environmental management are relatively simple in comparison with the challenge of identifying the preferred outcome for the basin and securing a consensus for it.
191. Some of the key institutional challenges for achieving harmonious sustainable development of Mekong basin are:
a. Political Constituency - it is true that the GMS is lacking a truly regional body equipped with adequate legal mandate to develop and monitor compliance of a shared vision and action of sustainable development in the basin. To have all six GMS countries to get more actively and closely involved in a well structured and clearly mandated international cooperation for its sustainable development and management is a daunting task.
TA 6069 SEF II, Sub-regional Environment Assessment Report (Draft)
61
b. Congestion of Regional Initiatives - management and coordination of the ‘congestion’ of the Mekong regional initiatives and frameworks is a complex issue that deserves full attention. Numerous regional entities, and programs either bilateral or multilateral, and stakeholders are present and effective coordination of their efforts remains a challenge.
c. Role of Donor Community and Civil Society - Financing institutions, donors and cooperation partners, like ADB, World Banks and other civil society groups, may have some leverage on improved regional governance for the Mekong Basin. Constructive engagement by international institutions with constituent government needs to be encouraged and formalized.
d. Lack of Legislative Framework – key obstacles for a broad-based participation include the lack of enabling legislation and consistent practice, and weak capacity at grassroots level with combination of poverty, illiteracy and past experience of suppression and civil strife.
e. Role of Sub-Regional Scientific Community - the regional scientific and research community needs to play a more active role in developing an integrated regional scientific perspective to meet the challenges of decision-making in the context of change and close engagement with a strong policy network capable of facilitating regional governance.
2.4.10. GMS Environment Management Institutional Framework
192. In view of the discussion above, the argument for a sub-regional institutional framework becomes compelling. Whereas GMS is influenced by several of existing sub-regional governance frameworks that have a charter inclusive of environment protection, no agency clearly has a sub-regional mandate that allows it to supervise or co-opt the management of sub-region’s environmental functions, a perquisite to developing an institutional framework for EPA at the sub-region level.
193. WGE is one of the key sub-regional environment group with a mandate tailored to address the trans-boundary environmental concerns of the GMS. There is a policy vacuum at the sub-regional level concerning sustainability and environmental protection not to mention environmental performance. The challenge for WGE is to build on global, regional and national sustainable development policies and to adapt and extend them to the sub-regional level. In doing so a clear definition of WGE’s distinct role from the other committees and institutions, such as MRC and ASEAN, and its future relationship with these existing forums, is required. The discussion below provides a few possibilities to broaden WGE’s role in GMS sustainable development planning from a point of view of developing sub-regional environment management and EPA systems. It should be noted that the discussion here makes indicative proposals only; the WGE and other relevant GMS stakeholders will need to consider this as part of an evolutionary process alongside ADB GMS CEP and other similar programs.
194. Goals – WGE needs to consider amongst its other objectives building the following goals in the context of strengthening integrated economic-cum-environment decision making in GMS:
a. Define the framework of sustainability and environmental safeguards, guidelines and codes of practice within which sub-regional development can proceed;
b. Integrate environmental concerns into sub-region development planning process.
195. Scope – in the context of EPA methodology and systems developed under the SEFII project, the following tools could be useful in assisting WGE establish its
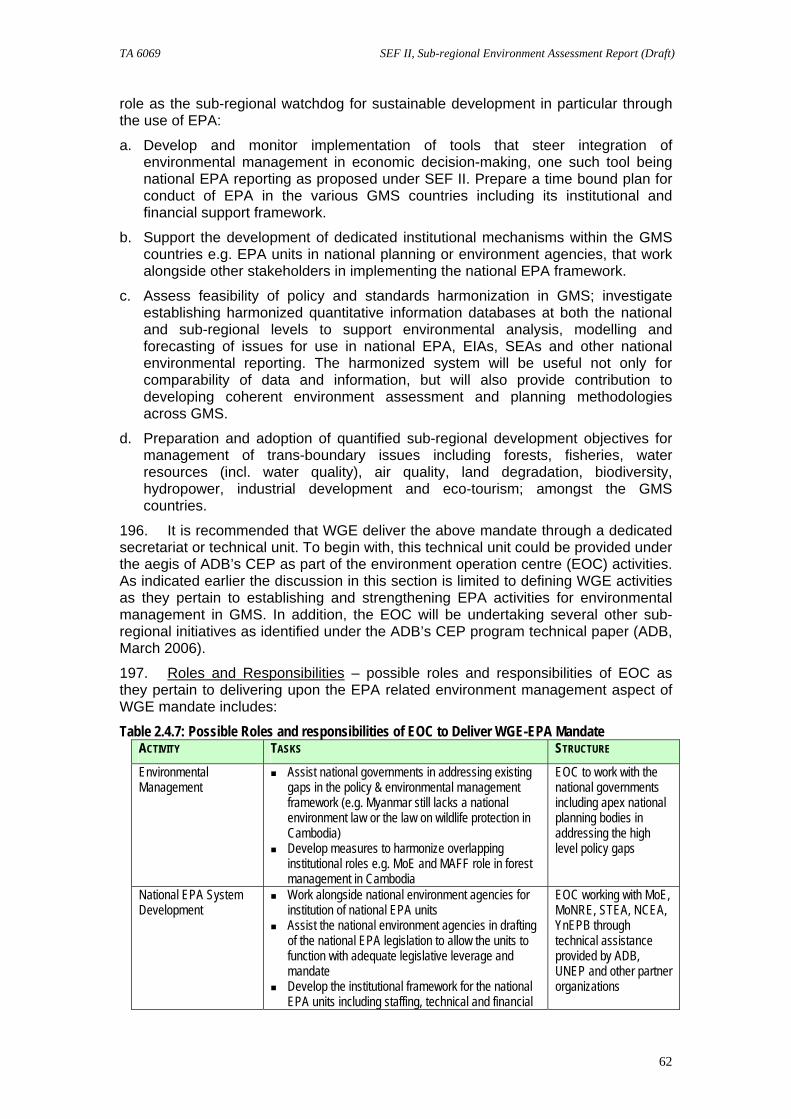
TA 6069 SEF II, Sub-regional Environment Assessment Report (Draft)
62
role as the sub-regional watchdog for sustainable development in particular through the use of EPA:
a. Develop and monitor implementation of tools that steer integration of environmental management in economic decision-making, one such tool being national EPA reporting as proposed under SEF II. Prepare a time bound plan for conduct of EPA in the various GMS countries including its institutional and financial support framework.
b. Support the development of dedicated institutional mechanisms within the GMS countries e.g. EPA units in national planning or environment agencies, that work alongside other stakeholders in implementing the national EPA framework.
c. Assess feasibility of policy and standards harmonization in GMS; investigate establishing harmonized quantitative information databases at both the national and sub-regional levels to support environmental analysis, modelling and forecasting of issues for use in national EPA, EIAs, SEAs and other national environmental reporting. The harmonized system will be useful not only for comparability of data and information, but will also provide contribution to developing coherent environment assessment and planning methodologies across GMS.
d. Preparation and adoption of quantified sub-regional development objectives for management of trans-boundary issues including forests, fisheries, water resources (incl. water quality), air quality, land degradation, biodiversity, hydropower, industrial development and eco-tourism; amongst the GMS countries.
196. It is recommended that WGE deliver the above mandate through a dedicated secretariat or technical unit. To begin with, this technical unit could be provided under the aegis of ADB’s CEP as part of the environment operation centre (EOC) activities. As indicated earlier the discussion in this section is limited to defining WGE activities as they pertain to establishing and strengthening EPA activities for environmental management in GMS. In addition, the EOC will be undertaking several other sub-regional initiatives as identified under the ADB’s CEP program technical paper (ADB, March 2006).
197. Roles and Responsibilities – possible roles and responsibilities of EOC as they pertain to delivering upon the EPA related environment management aspect of WGE mandate includes:
Table 2.4.7: Possible Roles and responsibilities of EOC to Deliver WGE-EPA Mandate ACTIVITY TASKS STRUCTURE
Environmental Management
Assist national governments in addressing existing gaps in the policy & environmental management framework (e.g. Myanmar still lacks a national environment law or the law on wildlife protection in Cambodia)
Develop measures to harmonize overlapping institutional roles e.g. MoE and MAFF role in forest management in Cambodia
EOC to work with the national governments including apex national planning bodies in addressing the high level policy gaps
National EPA System Development
Work alongside national environment agencies for institution of national EPA units
Assist the national environment agencies in drafting of the national EPA legislation to allow the units to function with adequate legislative leverage and mandate
Develop the institutional framework for the national EPA units including staffing, technical and financial
EOC working with MoE, MoNRE, STEA, NCEA, YnEPB through technical assistance provided by ADB, UNEP and other partner organizations
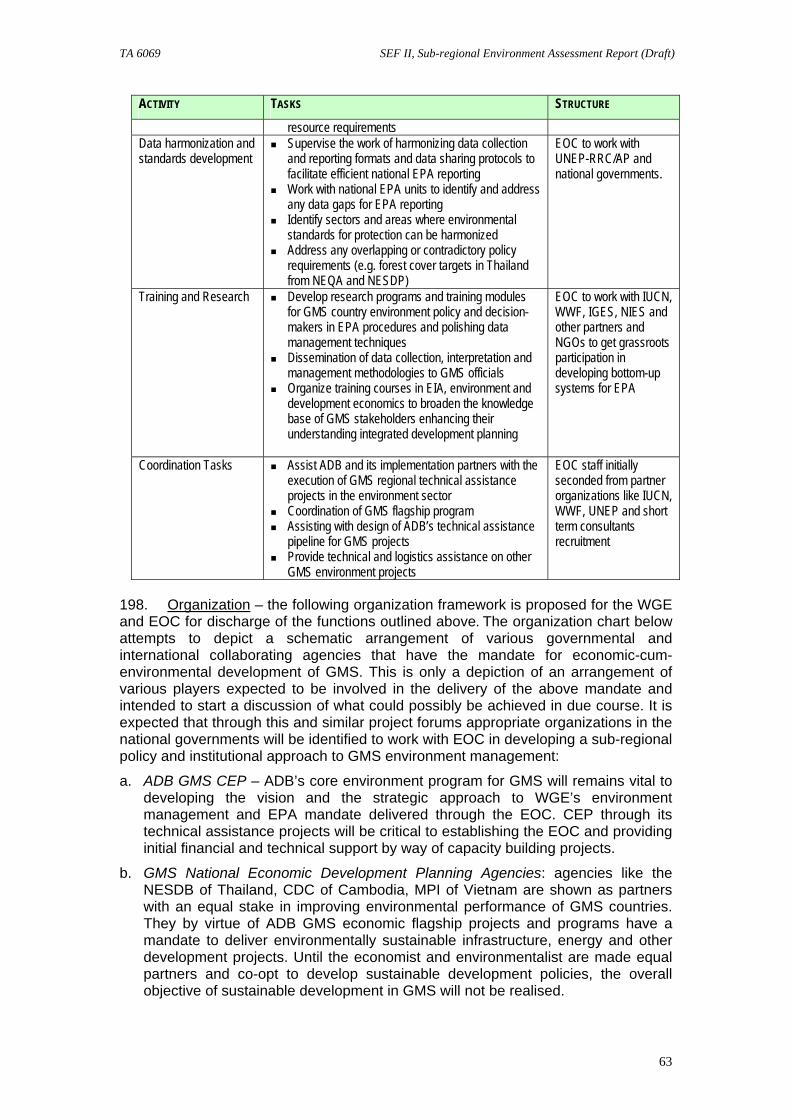
TA 6069 SEF II, Sub-regional Environment Assessment Report (Draft)
63
ACTIVITY TASKS STRUCTURE
resource requirements Data harmonization and standards development
Supervise the work of harmonizing data collection and reporting formats and data sharing protocols to facilitate efficient national EPA reporting
Work with national EPA units to identify and address any data gaps for EPA reporting
Identify sectors and areas where environmental standards for protection can be harmonized
Address any overlapping or contradictory policy requirements (e.g. forest cover targets in Thailand from NEQA and NESDP)
EOC to work with UNEP-RRC/AP and national governments.
Training and Research Develop research programs and training modules for GMS country environment policy and decision-makers in EPA procedures and polishing data management techniques
Dissemination of data collection, interpretation and management methodologies to GMS officials
Organize training courses in EIA, environment and development economics to broaden the knowledge base of GMS stakeholders enhancing their understanding integrated development planning
EOC to work with IUCN, WWF, IGES, NIES and other partners and NGOs to get grassroots participation in developing bottom-up systems for EPA
Coordination Tasks Assist ADB and its implementation partners with the execution of GMS regional technical assistance projects in the environment sector
Coordination of GMS flagship program Assisting with design of ADB’s technical assistance
pipeline for GMS projects Provide technical and logistics assistance on other
GMS environment projects
EOC staff initially seconded from partner organizations like IUCN, WWF, UNEP and short term consultants recruitment
198. Organization – the following organization framework is proposed for the WGE and EOC for discharge of the functions outlined above. The organization chart below attempts to depict a schematic arrangement of various governmental and international collaborating agencies that have the mandate for economic-cum-environmental development of GMS. This is only a depiction of an arrangement of various players expected to be involved in the delivery of the above mandate and intended to start a discussion of what could possibly be achieved in due course. It is expected that through this and similar project forums appropriate organizations in the national governments will be identified to work with EOC in developing a sub-regional policy and institutional approach to GMS environment management:
a. ADB GMS CEP – ADB’s core environment program for GMS will remains vital to developing the vision and the strategic approach to WGE’s environment management and EPA mandate delivered through the EOC. CEP through its technical assistance projects will be critical to establishing the EOC and providing initial financial and technical support by way of capacity building projects.
b. GMS National Economic Development Planning Agencies: agencies like the NESDB of Thailand, CDC of Cambodia, MPI of Vietnam are shown as partners with an equal stake in improving environmental performance of GMS countries. They by virtue of ADB GMS economic flagship projects and programs have a mandate to deliver environmentally sustainable infrastructure, energy and other development projects. Until the economist and environmentalist are made equal partners and co-opt to develop sustainable development policies, the overall objective of sustainable development in GMS will not be realised.
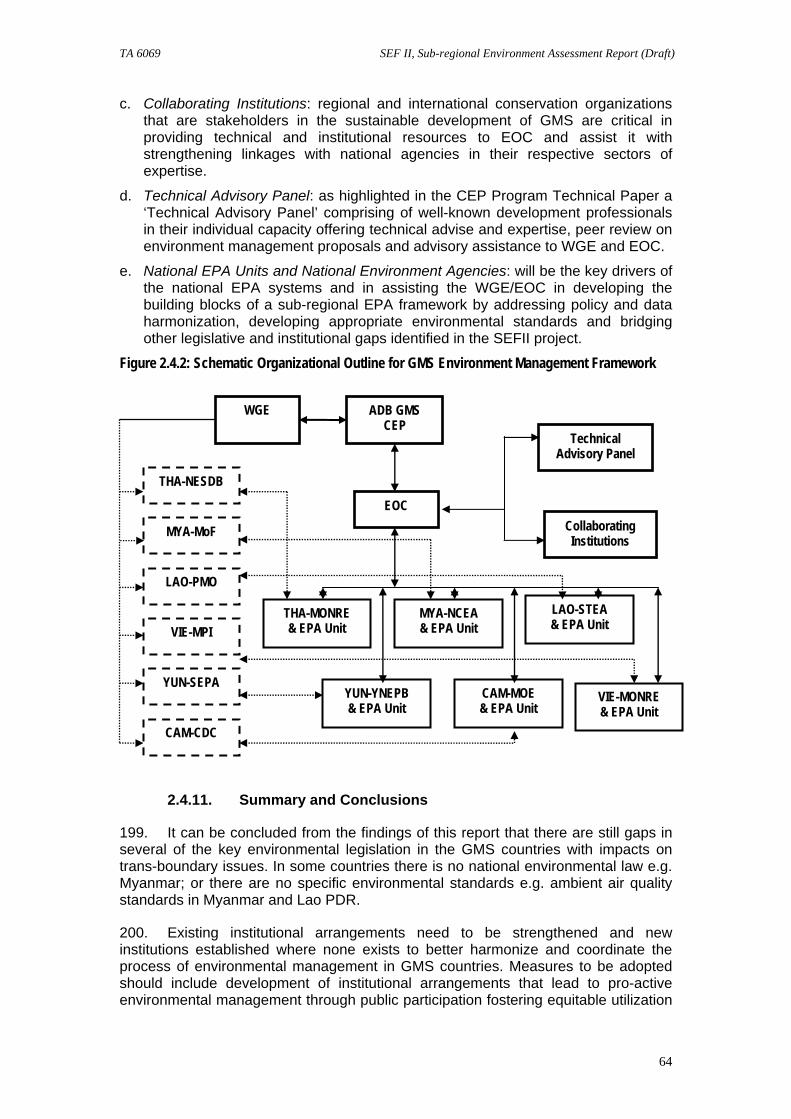
TA 6069 SEF II, Sub-regional Environment Assessment Report (Draft)
64
c. Collaborating Institutions: regional and international conservation organizations that are stakeholders in the sustainable development of GMS are critical in providing technical and institutional resources to EOC and assist it with strengthening linkages with national agencies in their respective sectors of expertise.
d. Technical Advisory Panel: as highlighted in the CEP Program Technical Paper a ‘Technical Advisory Panel’ comprising of well-known development professionals in their individual capacity offering technical advise and expertise, peer review on environment management proposals and advisory assistance to WGE and EOC.
e. National EPA Units and National Environment Agencies: will be the key drivers of the national EPA systems and in assisting the WGE/EOC in developing the building blocks of a sub-regional EPA framework by addressing policy and data harmonization, developing appropriate environmental standards and bridging other legislative and institutional gaps identified in the SEFII project.
Figure 2.4.2: Schematic Organizational Outline for GMS Environment Management Framework
2.4.11. Summary and Conclusions
199. It can be concluded from the findings of this report that there are still gaps in several of the key environmental legislation in the GMS countries with impacts on trans-boundary issues. In some countries there is no national environmental law e.g. Myanmar; or there are no specific environmental standards e.g. ambient air quality standards in Myanmar and Lao PDR.
200. Existing institutional arrangements need to be strengthened and new institutions established where none exists to better harmonize and coordinate the process of environmental management in GMS countries. Measures to be adopted should include development of institutional arrangements that lead to pro-active environmental management through public participation fostering equitable utilization
ADB GMS CEP
WGE
EOC
THA-NESDB
MYA-MoF
THA-MONRE & EPA Unit
MYA-NCEA & EPA Unit
YUN-YNEPB & EPA Unit
CAM-MOE & EPA Unit
LAO-PMO
VIE-MPI
YUN-SEPA
CAM-CDC
LAO-STEA & EPA Unit
VIE-MONRE & EPA Unit
Technical Advisory Panel
Collaborating Institutions
TA 6069 SEF II, Sub-regional Environment Assessment Report (Draft)
65
of environmental resources. Improved coordination amongst various government agencies is essential to avoid duplicity of tasks resulting in delayed implementation of measures.
201. Whilst several sub-regional policy and institutional initiatives have been undertaken, still more work needs to be done in terms of coordinating and harmonizing their implementation activities.
202. No projects or programs either exist to standardize water and air quality standards in the GMS or seem practical at this stage. Initiatives are underway to develop common institutional and policy approaches to combat trans-boundary and other regional air and water quality issues though. Similarly, standardizing a common forest cover target for GMS does not seem practical given the varying socio-economic profiles of the GMS countries. The effort is more to integrate common sustainable development principles in economic development of forests in GMS.
203. GMS is not ready for a sub-region-wide EPA analysis, as neither the institutions nor policies/standards exist that would make such an assessment possible or meaningful today. However, this study has been able to identify the areas where more work is required in order to build a common policy and institutional framework for development of common environment management approaches including the EPA.
2.5. Environmental Sustainability Index 2.5.1. The Context
204. Various international agencies such as OECD, ADB and UNDP have developed different indicators to monitor the progress of a country towards achieving sustainable development goals. Environmental Sustainability Index (ESI), a single index that measures overall progress towards environmental sustainability, was developed by Yale University and Columbia University to rank countries on 21 elements of environmental sustainability covering natural resource endowments, past and present pollution levels, environmental management efforts, contributions to protection of the global commons, and a society’s capacity to improve its environmental performance over time.
205. In 2005 ESI report, it was pointed out that the ESI provided a valuable policy tool, allowing benchmarking of environmental performance country-by-country and issue-by-issue. It was realized that identifying a relevant peer group against whom to benchmark results turns out to be a critical element of good environmental policymaking. This is of significant importance for the performance evaluation among GMS countries, which share similar natural resources, culture, and economic development levels.
206. Though not perfect, the ESI proved to be powerful, robust and useful tool in managing the environment. A reduced version of 2005 ESI could be estimated under data constraint situations. This simplified ESI enables benchmarking of progress towards meeting immediate policy objectives, facilitating judgments about environmental performance and can be used to identify important differences in performances that may warrant interventions or further investigations.
207. In the framework of 2005 ESI, environmental sustainability is a function of five factors: i) state of the environmental systems; ii) stresses on the environmental system; iii) human vulnerability to environmental change; iv) social and institutional capacity to cope up with environmental challenges; and v) the ability to respond to the demands of global stewardship. ESI has its advantages, that is, 1) It permits cross-national comparison of environmental progress in a systematic and quantitative
TA 6069 SEF II, Sub-regional Environment Assessment Report (Draft)
66
fashion; 2) It is a more analytically driven approach to environmental decision making; and 3) ESI balances a range of dimensions including both national and global perspectives, and environmental and socio-economic aspects of sustainability.
208. The SEF II project has selected 13 national level policy concerns and 3 trans-boundary policy concerns as the core areas for indicator selection. While there are a number of overlaps in the current SEF II approach and ESI approach, estimating ESI indicators for the GMS countries, parallel to SEF II environmental performance assessments, will add value in number of ways: 1) It provides a single indicator, by aggregating large number of variables, that facilitates inter-country comparison of environmental performances; 2) It incorporates a global perspective into analysis; 3) It adds socio-economic aspects to analysis by assessing the human vulnerability and thus balances between environmental and social aspects of sustainability; 4) It provides an opportunity to utilize the data and systems developed by the previous three environmental information projects more efficiently; and 5) It generates synergy between SEF II project and National Sustainable Development Strategy (NSDS) Project. Therefore, the proposed estimation of ESI will enrich the ongoing work of SEF II and enhance its relevance to environmental policies and targets.
209. The proposed ESI can serve as a tool in setting targets and developing sustainable development strategies. Environmental sustainability has been increasingly embraced as an important goal; however, actual measurements are rare at regional and international levels. There is a need in this specific region. Thailand has already taken some initiatives to develop an indicator for sustainable development. China developed a sophisticated indicator system to measure its sustainable cities and eco-cities. These indicator systems are also applied in Yunnan Province.
210. The Index provides comparability across a wide range of countries by creating a series of comparative benchmarks of environmental conditions in different countries and the possibility of shifting environmental decision-making onto a more fact-based and analytically rigorous foundation. An index provides a clue to a matter of larger significance or makes perceptible a trend or phenomenon that is not immediately detectable. It is a sign or symptom that makes something known with a reasonable degree of certainty. An index reveals and gives evidence and serves as a working prototype meant to encourage debate, dialogue and learning.
211. The proposed GMS ESI will not lose the foundation for indicators and EPA, other than help the understanding of the process and the decision-making process. The process of developing GMS ESI will enhance the capacity building process, and enrich the ongoing work of SEF II and enhance its relevance to environmental policies and targets.
2.5.2. Development of GMS Environmental Sustainability Index 212. GMS ESI is a simplified version of 2005 ESI and in accordance with the current “P-S-R” framework in the process of indicator selection. The GMS ESI will adopt the following approaches: 1) participatory approach. GMS countries are given the flexibility to modify the index; 2) analytical approach. The selection of the indicators is based on a balanced analysis of sustainability and data restraints; 3) allow spatial and temporal comparison only when possible; 4) be dynamic. Indicators can be modified in the future by a specific country; 5) be practical. Selected indicators should be based on data availability and related to policymaking; 6) be integrated. Environmental, economic and social indicators should all be considered in indicator selection; and 7) flexible. Countries will be given the flexibility for deciding indicators and weights if needed.
TA 6069 SEF II, Sub-regional Environment Assessment Report (Draft)
67
213. In the ESI main report, there are several limitations of ESI calculation system, especially the missing data or incomplete data. GMS may argue that the data used did not reflect the whole range of performance in the region. Therefore, ESI in GMS countries will be conducted in collaboration with the country teams using a participatory approach, especially during the data preparation and verification process. A group of core indicators and to calculate GMS ESI. GMS countries could decide which indicators they will use in formulating their own ESI. By doing so, data constraints could be reduced. Each GMS country could select a group of supportive indicators and set a target value for a single indicator so they could help policy-making based on a gap analysis of both GMS ESI itself and various indicators.
214. GMS ESI system is useful to understand a country's position in comparison to others. However, to help answer the questions "how" and "why" or provide analysis of causal linkage between the variables/indicators and environmental sustainability, the proposed index could use EPA analysis to support the understanding of GMS ESI.
215. GMS ESI will not solve all the problems since there are data limitations and no index is perfect. Development of GMS ESI is a process of performance assessment. ESI exercise is complementary to disaggregated EPA analysis. It is not a substitution of EPA but additional tool to enhance the output and outcome of the projects. EPA results and GMS ESI results should be used only with the understanding about their usefulness and limitations.
216. Methodology used for 2005 ESI calculation is very sophisticated, which, together with the difficulty of data gathering, may make it very difficult to update the ESI regularly. Therefore, the proposed GMS ESI adopts a simple “normalization-weighting” approach. The maximum value of GMS ESI is 1.0. A higher GMS ESI means better environmental sustainability. Details about the calculation of GMS are provided in the Appendix IV.
217. GMS ESI includes both socio-economic and environmental indicators. All indicators are divided into both core and supportive indicators. EPA of SEF II has 13 candidate concerns. In the EPA process, each country has own choices of policy concerns. It is suggested that all the core and supportive indicators (variables) for GMS ESI should come from these concerns, except for socio-economic indicators. In this study, categories that have more concerns go to the core indicators. Only concerns covered by more than 5 countries will be used for core indicator selection. In this sense, water resources, inland water pollution, forest resources, threats to biodiversity, and land degradation are included. With a global perspective in mind, climate change is chosen as a policy concern also. The GMS ESI does not address trans-boundary issues. Firstly, trans-boundary issue may be related to a few countries. Secondly, data on the same indicator may have different values between countries. Unless there is a third party organization to provide bilaterally accepted values, it will cause confusion.
218. Based on studies conducted in ESI 2005 and other literatures, it is argued that economic level, employment, education, health and government management are five key components for achieving sustainable development. Therefore, GDP per capita, unemployment rate of urban residents, enrolment rate of primary school, children under five mortality rate per 1,000 live births, and government effectiveness are used to measure the socio-economic aspects in a sustainability performance evaluation.
219. Within each concern, we choose only one indicator to represent status. This indicator could be a pressure, state or response variable. When possible, all the environmental indicators will come from EPA report. In this study, the six environmental indicators are: freshwater availability per capita, percentage of
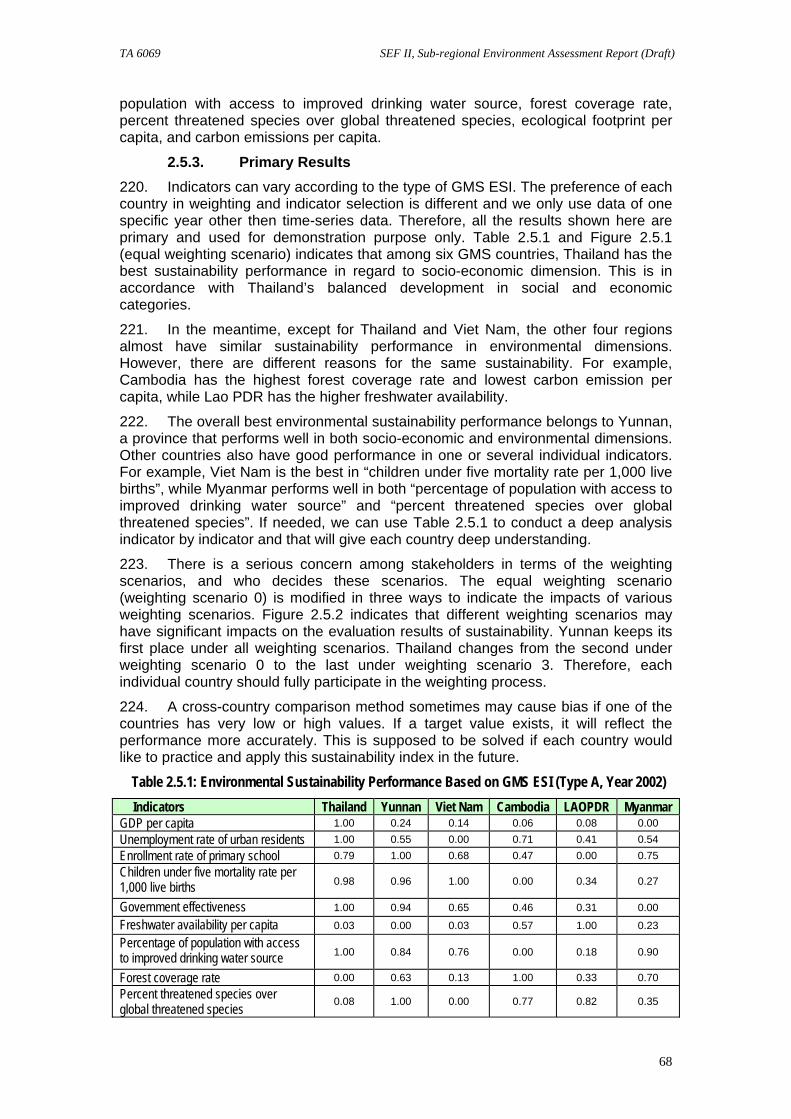
TA 6069 SEF II, Sub-regional Environment Assessment Report (Draft)
68
population with access to improved drinking water source, forest coverage rate, percent threatened species over global threatened species, ecological footprint per capita, and carbon emissions per capita.
2.5.3. Primary Results 220. Indicators can vary according to the type of GMS ESI. The preference of each country in weighting and indicator selection is different and we only use data of one specific year other then time-series data. Therefore, all the results shown here are primary and used for demonstration purpose only. Table 2.5.1 and Figure 2.5.1 (equal weighting scenario) indicates that among six GMS countries, Thailand has the best sustainability performance in regard to socio-economic dimension. This is in accordance with Thailand’s balanced development in social and economic categories.
221. In the meantime, except for Thailand and Viet Nam, the other four regions almost have similar sustainability performance in environmental dimensions. However, there are different reasons for the same sustainability. For example, Cambodia has the highest forest coverage rate and lowest carbon emission per capita, while Lao PDR has the higher freshwater availability.
222. The overall best environmental sustainability performance belongs to Yunnan, a province that performs well in both socio-economic and environmental dimensions. Other countries also have good performance in one or several individual indicators. For example, Viet Nam is the best in “children under five mortality rate per 1,000 live births”, while Myanmar performs well in both “percentage of population with access to improved drinking water source” and “percent threatened species over global threatened species”. If needed, we can use Table 2.5.1 to conduct a deep analysis indicator by indicator and that will give each country deep understanding.
223. There is a serious concern among stakeholders in terms of the weighting scenarios, and who decides these scenarios. The equal weighting scenario (weighting scenario 0) is modified in three ways to indicate the impacts of various weighting scenarios. Figure 2.5.2 indicates that different weighting scenarios may have significant impacts on the evaluation results of sustainability. Yunnan keeps its first place under all weighting scenarios. Thailand changes from the second under weighting scenario 0 to the last under weighting scenario 3. Therefore, each individual country should fully participate in the weighting process.
224. A cross-country comparison method sometimes may cause bias if one of the countries has very low or high values. If a target value exists, it will reflect the performance more accurately. This is supposed to be solved if each country would like to practice and apply this sustainability index in the future.
Table 2.5.1: Environmental Sustainability Performance Based on GMS ESI (Type A, Year 2002) Indicators Thailand Yunnan Viet Nam Cambodia LAOPDR Myanmar GDP per capita 1.00 0.24 0.14 0.06 0.08 0.00 Unemployment rate of urban residents 1.00 0.55 0.00 0.71 0.41 0.54 Enrollment rate of primary school 0.79 1.00 0.68 0.47 0.00 0.75 Children under five mortality rate per 1,000 live births 0.98 0.96 1.00 0.00 0.34 0.27
Government effectiveness 1.00 0.94 0.65 0.46 0.31 0.00
Freshwater availability per capita 0.03 0.00 0.03 0.57 1.00 0.23
Percentage of population with access to improved drinking water source 1.00 0.84 0.76 0.00 0.18 0.90
Forest coverage rate 0.00 0.63 0.13 1.00 0.33 0.70 Percent threatened species over global threatened species 0.08 1.00 0.00 0.77 0.82 0.35
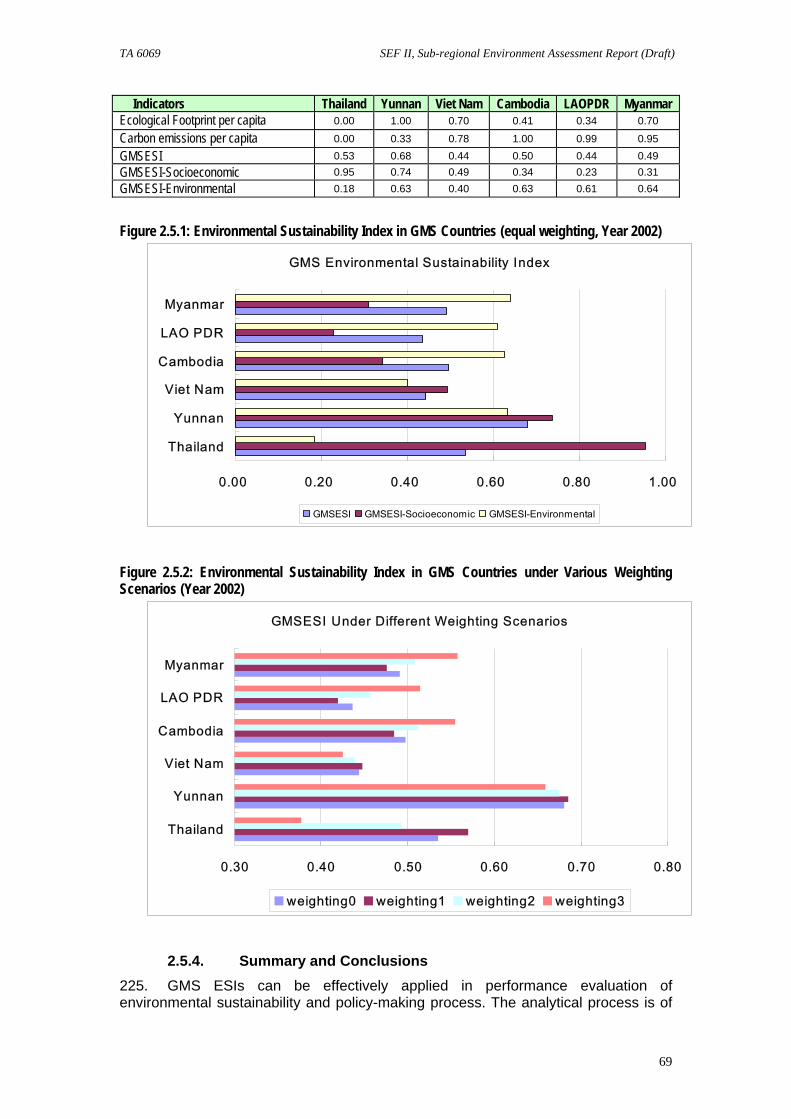
TA 6069 SEF II, Sub-regional Environment Assessment Report (Draft)
69
Indicators Thailand Yunnan Viet Nam Cambodia LAOPDR Myanmar Ecological Footprint per capita 0.00 1.00 0.70 0.41 0.34 0.70
Carbon emissions per capita 0.00 0.33 0.78 1.00 0.99 0.95
GMSESI 0.53 0.68 0.44 0.50 0.44 0.49 GMSESI-Socioeconomic 0.95 0.74 0.49 0.34 0.23 0.31 GMSESI-Environmental 0.18 0.63 0.40 0.63 0.61 0.64
Figure 2.5.1: Environmental Sustainability Index in GMS Countries (equal weighting, Year 2002)
GMS Environmental Sustainability Index
0.00 0.20 0.40 0.60 0.80 1.00
Thailand
Yunnan
Viet Nam
Cambodia
LAO PDR
Myanmar
GMSESI GMSESI-Socioeconomic GMSESI-Environmental
Figure 2.5.2: Environmental Sustainability Index in GMS Countries under Various Weighting Scenarios (Year 2002)
GMSESI Under Different Weighting Scenarios
0.30 0.40 0.50 0.60 0.70 0.80
Thailand
Yunnan
Viet Nam
Cambodia
LAO PDR
Myanmar
weighting0 weighting1 weighting2 weighting3
2.5.4. Summary and Conclusions 225. GMS ESIs can be effectively applied in performance evaluation of environmental sustainability and policy-making process. The analytical process is of
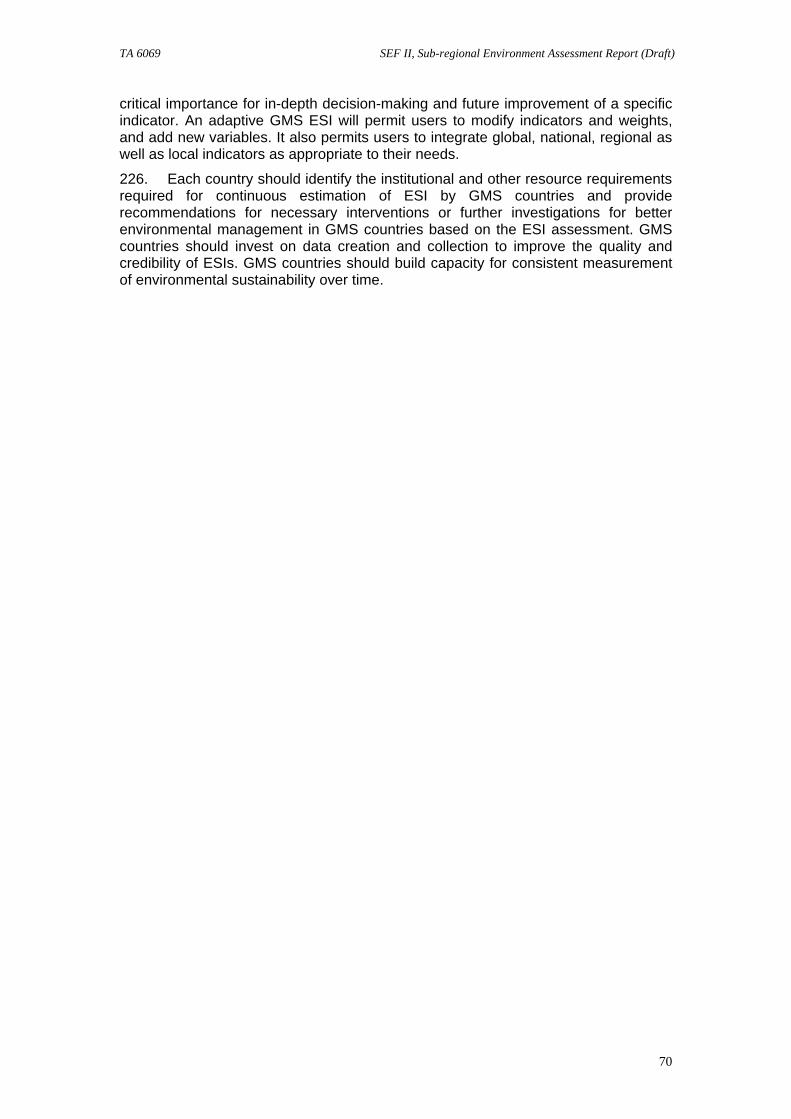
TA 6069 SEF II, Sub-regional Environment Assessment Report (Draft)
70
critical importance for in-depth decision-making and future improvement of a specific indicator. An adaptive GMS ESI will permit users to modify indicators and weights, and add new variables. It also permits users to integrate global, national, regional as well as local indicators as appropriate to their needs.
226. Each country should identify the institutional and other resource requirements required for continuous estimation of ESI by GMS countries and provide recommendations for necessary interventions or further investigations for better environmental management in GMS countries based on the ESI assessment. GMS countries should invest on data creation and collection to improve the quality and credibility of ESIs. GMS countries should build capacity for consistent measurement of environmental sustainability over time.
TA 6069 SEF II, Sub-regional Environment Assessment Report (Draft)
71
3. CONCLUSIONS and RECOMMENDATIONS
3.1. General Conclusions 227. The material of this volume illustrates the range and complexity of any assessment of sub-regional environmental performance. Such undertaking needs to deal with (i) conceptual problems related to the sub-regional institutional structure (ii) technical challenges centered on availability, relevance and reliability of data, and (iii) the need for clear presentation of main results.
228. Assessment of this kind also needs to reconcile the demands for a rigorous quantified framework and the ability to support such a framework by good data. The chapter on remaining biodiversity and the ESI chapter illustrate the possibilities in the former direction while the section dealing the vital functions of the Mekong explores the latter dimension of the task (and finds serious weaknesses).
229. The material presented is an extension of the work on national EPAs of GMS member countries. Like them, it is structured around a “P-S-R” model that has the virtue of going beyond a simple description of the changing state of environment to quantify also the main factors contributing to the observed trends. The text shows that at least parts of the model can be applied to a meaningful degree in the sub-regional context provided this is not done dogmatically. However, for the time being, the applicability of the model as a whole is reduced by present-day institutional circumstances of GMS.
230. The potential value of a sub-regional EPA lies not only in informing the principal stakeholders about “how things are going”. Accurate assessment of true magnitudes of key variables is indispensable to a reasoned multiple-use approach to the Mekong’s management in which the competing alternatives are accurately valued. By reference to Mekong fisheries, the potential pay-off to improving the accuracy of underlying data is made clear pointing to one of the directions of future effort.
231. Improving the quality of data needed for environmental performance assessment is not without a cost and the calls for more statistical work have to be treated sympathetically but with caution. One of the contributions of this volume, a form of “unfinished sub-regional EPA”, is to have identified some of the areas where additional statistical effort may bear the greatest fruit.
232. The systematic assessment of endemic and globally threatened species within the GMS has only scratched the surface in addressing the primary concern of illegal trade of wildlife species. Nevertheless the documented assessment has proven that the conventional P-S-R model can be applied to any sub-regional level assessment, no matter the concern.
233. The sub-regional assessment of wildlife biodiversity highlights the importance of having similar and consistent indicators at the national level, from which regional assessments can be made. All six GMS countries had identical state indicators; most had the same choice of response indicators. The pressure indicators were not always the same but this sub-regional assessment did not suffer from such and may have set the standard as to what pressure indicators should be at the national level.
234. The SEFII sub-regional biodiversity modeling was a first step towards demonstrating the applicability of biodiversity modeling to environment performance assessment. The model fits the P-S-R approach and can generate relevant data for a subregional assessment of biodiversity. The model’s reliability can be further increased by 1) a revision of the model’s pressure coefficients using subregion-specific case studies, and 2) incorporating into the model high precision, subregional
TA 6069 SEF II, Sub-regional Environment Assessment Report (Draft)
72
standardized GIS and statistical datasets to ensure equal quality of modeling results across the countries.
235. Environmental standards and policies are not uniform in a developing region like GMS, where most of the member countries are still at relatively early stages of their economic development and where different development priorities affect the way in which available resources are allocated towards environmental management. Policy and environment standards harmonization is desirable but will best be achieved through a sustained process of institutional strengthening and capacity building of environmental institutions in the GMS and appropriate stakeholder participation.
236. ESI can help policy making and performance evaluation in GMS countries by helping track the gap between the region and other parts of the world. By developing three variants of ESI, each with a particular focus, the indicators make it easier to focus on selected aspects of sustainable development. Sustained use of ESI demands additional capacity in GMS countries in areas such as data collection, institutional development, and policy-setting. ESI or ESI-type indicators are far from perfect. Their reliability is hampered by lack of data, and geographic and socio-economic heterogeneity across the GMS. Sensible use of ESI demands attention to the context and ESI will therefore ideally be used alongside the EPA process which provides such an analytical context.
237. GMS ESI is supportive in policy making and performance evaluation. It will help GMS countries track the gap existing in the region and the whole world. By exercising three types of ESI, the analytical process is especially helpful for targeting specific needs in promoting sustainable development. The application of ESI raise a new level for capacity building in GMS countries in many aspects, such as data collection, institutional development, and more balanced policy-setting process. However, GMS ESI is not a panacea. It is limited by the lack of data, geographic and socio-economic heterogeneity among GMS countries. Therefore, a wise use of GMS ESI is necessary, specifically; it should be used together with EPA process, which provides a fundamental analysis for the understanding of ESI.
3.2. Specific Recommendations 3.2.1. Vital Functions of the Mekong
238. The GMS and other sub-regional bodies should seriously study the reasons for what appears to be an inadequate factual basis for the formulation and monitoring of policies on the optimum use of the Mekong and its waters, and the growing gap between policy and strategic statements on the one hand, and the statistical foundations on which such statement rest (or not).
239. The improvement in the quality of data on inland fisheries in the Mekong during the late 1990s offers a number of valuable lessons about the magnitude of errors in official statistics of various features of the Mekong and the basin, the levels of effort required to improve the reliability of data or create a needed benchmark for future assessments, and the likely economic viability of similar efforts. These lessons should be publicized and applied to other dimensions of the Mekong basin environmental monitoring.
240. The GMS governments and its development partners should formulate a plan of basin monitoring and evaluation with an emphasis on: (1) agreed priority areas for Mekong database development, reconciliation and improvement; and (2) assignment of lead responsibility for data quality control and improvement for each technical area.
TA 6069 SEF II, Sub-regional Environment Assessment Report (Draft)
73
3.2.2. Illegal Trade of Wildlife Resources 241. Specific recommendations to improve data sources and monitoring tools to facilitate future assessments of wildlife biodiversity include:
Continued and consistent monitoring of both locally threatened and globally threatened wildlife species at the national level.
Development of a secondary response indicator, at the national level, based on the model of this sub-regional assessment, but with a species subset which includes, in addition to threatened endemic species as identified in this assessment, threatened species that are listed in the CITES appendices, regardless of their range. This will broaden the number of subset species to those which are endemic to the region, plus those which are susceptible to illegal trade.
Better publication and digital access to local lists of protected species, linked by scientific name to other online databases such as those of the IUCN or the CITES secretariat.
Continued and consistent monitoring and reporting of protected areas at the national level, qualified by IUCN management category, with a link to the wildlife species, which they attempt to protect (Myanmar and Vietnam have already exhibited good examples of these).
242. Specific recommendations to improve the welfare of wildlife resources and to curtail the illegal trade of wildlife resources include:
Assess Category 1a species as identified in this assessment for their level of protection in national systems of protected areas.
Consideration of Category 1b species as identified in this assessment, or as identified in future assessments, for inclusion in CITES III appendices, noting that not all these category 1b species warrant inclusion. Only those, if any, that are suspect of trading should be given serious consideration.
Inclusion of Category 2a species in local laws and regulations, remembering that these threatened and endemic species, locally protected by neighboring GMS countries and listed in the CITES convention to which all countries are signatory.
Inclusion of Category 2b species in local laws and regulations, remembering that the CITES convention does not offer them protection but that neighboring GMS countries are giving them protection.
For harmony between national laws and regulations and international conventions, inclusion of Category 3a species in local laws and regulations, remembering that these species are listed in either Appendix I or Appendix II of the CITES convention.
Consideration of Category 3b species for inclusion in local laws and regulations, remembering that they are globally threatened and endemic to the GMS.
Widespread publication and public awareness of locally protected wildlife species, on the Internet and in relevant public places, before the species are transported to border crossings.
3.2.3. Remaining Biodiversity 243. Specific recommendations to improve data sources for future biodiversity or Natural Capital Index modeling include:
Land cover maps: high resolution national land cover maps with sufficient land cover classes, especially for agricultural and forest use instead of global maps;
TA 6069 SEF II, Sub-regional Environment Assessment Report (Draft)
74
Statistical data: more province and district level data on land use (agricultural and forest use) in addition to national level. Statistics on forestry use should include details on plantation and timber regime as well as different classes of primary, secondary and degraded forest. Ideally more data on shifting cultivation should be made available;
Road dataset: generation of a sub-regional roadmap (using national sources) is needed. To merge national road maps, road classes need to be redefined and cross-border roads have to be stitched.
Capacity building of local staff in data collection and management is needed to ensure high quality and compatibility of national and sub-national datasets.
244. Specific recommendations to improve the biodiversity model include:
A sub-regional model has to be developed rather than running an application of the global model with regional data inputs:
This model has to be based on scientific assumptions for all pressure factors that are backed up by case studies from the region only
In particular changing the conversion factors for current land use and impact classes of road by using WWF eco-regions as benchmark
Developing a new key for conversion for the impact of land use on biodiversity based on sub-regional WWF eco-regions rather than the currently used key based on coarser IMAGE biomes.
More research on possible exclusion of currently used indicators (e.g. Pollution, Climate Change) and the introduction of new indicators (e.g. Population Density, Poverty) that fit the sub-regional pressure situation better than the global template.
245. General recommendations to improve the outcome of the biodiversity modeling exercise include:
A calculation of time series values for the Natural Capital Index (1970, 2000, 2030) should be provided in the future for decision-making regarding policy in the sub-region.
3.2.4. Degree of Harmonization of Policy and Standards 246. Some of the specific recommendations relating to sub-regional policy and institutional development for EPA are as follows. Most of these immediate steps will need to be undertaken by the GMS core environment program (as recommended in Section 2.4.10):
Work with WGE in expanding its role and mandate to gradually shift from a program review forum to a proactive permanent body responsible for shaping development of the sub-region from the earliest stages of planning, through implementation, monitoring and reporting on performance, and ultimately take on a role in enforcement;
Initiate a process for harmonization of policy and environmental standards e.g. development of appropriate air and water quality standards in Lao PDR and Myanmar; finalization of national environment law in Myanmar. Undertake technical advisory and research work to standardize data reporting formats, data sharing protocols, adequate financial support for data collection, establishment of data libraries etc.;
Undertake technical assistance with support from ADB and other multilateral assistance agencies to bridge the legislative and policy planning gaps in the national environmental management framework of GMS countries especially
TA 6069 SEF II, Sub-regional Environment Assessment Report (Draft)
75
those with trans-boundary implications (e.g. develop a national biodiversity plan for Myanmar; finalization of the industrial waste management plan for Thailand).
Draft a GMS environment policy addressing the conservation issues associated with the environmental concerns studied during SEF II project thereby laying the foundation of a GMS wide environment policy framework against which future GMS EPAs can be conducted;
Initiate the development of EPA units in each of the GMS countries with technical support from the WGE/EOC as part of of ADB’s Core Environment Program;
Institutionalize EPA in the GMS counties with the drafting of appropriate legislation and other institutional and financial support;
Investigate standardizing of environmental standards in air and water quality control to the extent possible and within the limitation of local socio-economic development paradigms e.g. explore development of a PSI for GMS.
3.2.5. Environmental Sustainability Index 247. Recommendations related to GMS ESI are as follows.
The development of ESI reflects a painful data digging process. It exposes the lack of quality data in GMS regions, let alone time series data. Therefore, GMS countries should start the data gathering process in a systematic and internalized manner.
There is a serious lack of integrity of indicators among GMS countries. Except for a few socio-economic indicators, most environmental and socio-economic indicators adopted in these countries do not have the same definitions and calculation methods. There is an urgent need for regional and international organizations to help the coordination of developing a group of useful indicators that could be used to promote sustainable development in the region. Core indicators and suggested supportive indicators in this study could be used at the first stage.
Since the development of indicators and data collection is resources consuming and GMS countries are lack of the capacity to complete the tasks within a short period, international organizations may provide specific aid for the capacity building process.
The usefulness of GMS ESI not only relies on the quality of index but the willingness of GMS countries to adopt it. GMS countries should explore the possibility of applying ESI in the policy making and implementation process. When possible, modify the index system to make it more suitable for a specific country. Each country should develop its target value system to adopt type B and C indexes.
GMS may use the GMS ESI to help the monitoring of sustainable development in this region and establish a regional warning system for sustainable development.

TA 6069 SEF II, Sub-regional Environment Assessment Report (Draft)
76
TA 6069 SEF II, Sub-regional Environment Assessment Report (Draft)
77
References Vital Functions of the Mekong
General
Al-Soufi, R. W. 2000. Proceedings of the Workshop on Hydrologic and Environmental Modeling in the Mekong Basin, Phnom Penh, 11-12 September 2000, Mekong River Commission, Phnom Penh
Browder, Greg and Ortolano, L., The Evolution of an International Water Resource Management Regime in the Mekong River Basin, 40 Nat. Resources J. 499 (2000)
Dore J. (2003), "The Governance of Increasing Mekong Regionalism." Presented at Politics of the Commons: Articulating Development and Strengthening Local Practices Meeting, Chiang Mai, Thailand, July 11-14, 2003
FAO/MRC/Government of Laos, 1999. Proceedings of the Regional Workshop on Flood Management and Mitigation of the Mekong River and its Tributaries, Vientiane 18 to 21 March 1998, FAO Regional Office for Asia and the Pacific, Bangkok
Gooch, J. 2005. “The Mekong Agreement in Light of International Principles Relating to Sustainable Use of Transboundary Watercourses”, A Master’s thesis submitted to the University of Lund
Hirsh, P., Jensen, K.M., FitzGerald, S., Boer, B., Lyster, R. and N. Carrard. 2006. National Interests and Transboundary Water Governance in the Mekong, Draft report, Australian Mekong Resource Centre in collaboration with Danida
Hook J., Novak. S. and R. Johnston. 2003. Social Atlas of the Lower Mekong Basin, Mekong River Commission, Phnom Penh
Horberry, J. 2004. “Environmental Assessment in a Transboundary Context: Development of an EIA and SEA System for the Lower Mekong Basin”, Powerpoint presentation at UNECE Conference in Cavtat, 2–4 June 2004, www.unece.org/env/eia/documents/cavtat
Hu, D. 2002. “International Watercourses: Law, Policy and Practice of People’s Republic of China”, a University of Dundeed research paper, <www.dundee.ac.uk/iwlri/documents>
Imhoff, Aviva, Power Struggle: The Impacts of Hydro-Development in Laos, in Conference on the Mekong River at Risk: The impact of development on the river, her delta, and her people, Mekong Forum ( May 8, 1999)
Japan Science and Technology Agency, MRC and RR 2002 Research Group (2005), Proceedings of the International Conference on “Advances in Integrated Mekong River Management”, 25-27 October 2004, Vientiane, Lao PDR, Yamanashi, Japan
Kristensen, J. 1999. “Experience in International Cooperation for Planning and Sustainable Development of the Mekong River Basin’ paper presented at the WCD’s Easy/South-East Asia Regional Consultation in Hanoi, 26-27 February 2000
Makkonen K. 2005. “Regional power play and China in the Greater Mekong Sub-region”, in JSTA/MRC/RR2002. 2005, pp. 246-255
Mekong River Commission (MRC). 1997. Mekong River Basin Diagnostic Study, UNEP and MRC, Bangkok
-----------1998a. Long-Term Environment Programme 2001-2005, Phnom Penh
-----------1998b. Water Utilization Program Preparation Project, A consultant report to MRC and GEF, SMEC International Pty Ltd
TA 6069 SEF II, Sub-regional Environment Assessment Report (Draft)
78
-----------2000a. Agriculture, Irrigation and Forestry Programme for 2001-2005, Phnom Penh
-----------2000b, Sustainable Land and Water Use for Basin Health and People, Phnom Penh
-----------2001a. Strategic Plan 2001 to 2005, Phnom Penh
-----------2001b. MRC Work Programme 2002, Phnom Penh
-----------2001c. Strategic Master Scheme for Hydro-Meteorological Network in the Mekong River Basin, Phnom Penh
-----------2001d. MRC Hydropower Development Strategy, Phnom Penh
-----------2002a. MRC Work Programme 2003, Phnom Penh
-----------2002b. Flood Management Prgramme, Phnom Penh
-----------2004. MRC Work Programme 2005, Vientiane
-----------2005. Overview of the Hydrology of the Mekong Basin, Mekong River Commission, Vientiane
MRC and ARCADIS Euroconsult. 2000. Strategy Study on the Development of the Watershed Management/Forestry Sector in the Lower Mekong Basin
MRC/UNDP 1999. A Natural Resources Based Development Strategy for the Tonle Sap Area, Cambodia, Phnom Penh
Nguyen Huu Chung, Vietnam and the Development of the Mekong. Conference on the Mekong River at Risk: The impact of development on the river, her delta, and her people, MekongForum (May 8, 1999)
Pitchyakorn, B. 2002, “Sustainable Development and International Watercourses Agreements: The Mekong and the Rhine”, paper prepared for the Johanneburg Summit, International Union for the Conservation of Nature, www.iucn.org/themes/law
Phommachanh, K. 2002, “Information Exchange, Notification and Consultation: The Case of the Mekong Framework Agreement”, www.iucn.org/themes/law
Radosevich, G.E. and Olson, D.C. 1999. “Existing and Emerging Basin Arrangements in Asia: Mekong River Commission Case Study” paper to Third Workshop on River Basin Institutional Development, June 24, 1999, World Bank, Washington D.C.
Verwy, A. 1999. “Flood forecasting and river modelling of the Mekong Basin” in Proceedings of the Regional Workshop on Flood Management and Mitigation of the Mekong River and its Tributaries, Vientiane 19-21 March 1998, FAO Regional Office for Asia and the Pacific, Bangkok
Woods, K. 2003. “Transboundary Environmental Governance in the Mekong River Basin: Civil Society Spaces for Transboundary Cooperation”, in Worby, E. ed. 2003. Environmental and Development: Dilemmas of Power and Place
Fisheries Ahmed, M., Navy, H, Vuthy L, and Tiongco, M. 1998. Socio-Economic Assessment of Freshwater Capture Fisheries of Cambodia: Report on a Household Survey, MRC, Phnom Penh
Arthington, A.H. et al. 2004. “River Fisheries: Ecological Basis for Management and Conservation’, in Welcomme and Petr (eds) 2004, pp. 21-60
TA 6069 SEF II, Sub-regional Environment Assessment Report (Draft)
79
Burnhill, T.J. and Hewitt M.M. (eds.) 2005, Proceedings of the 6th Technical Symposium on Mekong Fisheries, Pakse, 26-28 November 2003, MRC Conference Series No. 5, Mekong River Commission, Vientiane.
Coates, D. 2002. Biodiversity and Fisheries Management Opportunities in the Mekong River Basin
Coates, D. et al. 2004, “Information, Knowledge and Policy”, in Welcomme and Petr (eds.) 2004, pp 93-120
Clayton, T. (ed.). 2003. New approaches for the improvement of inland capture fisheries statistics in the Mekong Basin, Proceedings of an ad hoc consultation, Udon Thani, 2-5 September 2002, Mekong River Commission and FAO
FAO. 2002. New Approaches for the Improvement of Inland Capture Fishery Statistics in the Mekong Basin, expert consultation Udon Thani, Thailand 2 to 5 September 2002, FAO Regional Office for Asia and the Pacific, Bangkok
FAO. 2004. Handbook on regional fishery bodies and arrangements in Asia and the Pacific 2004, FAO Regional Office for Asia and the Pacific, Bangkok Hambery, J. 2002. Financial analysis and risk assessment of selected aquaculture and fishery activities in the Mekong Basin, MRC Technical Paper No.5, Mekong River Commission, Phnom Penh
Hartman, W. et al.. 2004, “People and Fisheries Management”, in Welcomme and Petr (eds). 2004, pp 61-92
Hirsh, P. 2003. “The Politics of Fisheries Knowledge in the Mekong basin”, in Welcomme R. L and Petr T. eds. Sustaining Livelihoods and Biodiversity in the New Millennium, Proceedings of the Second International Symposium on the Management of Large Rivers for Fisheries, Phnom Penh 11 - 14 February 2003, Volume II, FAO Regional Office for Asia and the Pacific, Bangkok
Hortle, K.G. and S.R. Bush. 2000, “Consumption in the Lower Mekong Basin as a Measure of Fish Yield”, in Clayton, op. cit. pp76-88
In MRC. 1992. Fisheries in the Lower Mekong Basin, Interim Committee for the Coordination MB
MRC. 2004. Fisheries Information in the Lower Mekong Basin, CD-based database containing, inter alia, catch assessment databases, and about 300 technical papers on the subject of fisheries management in the LMB.
MRC. 2005. Framework for Fisheries Programme Phase 2, 2006-2010, Phnom Penh
Svedrup-Jensen, S. 2002. Fisheries in the Lower Mekong Basin: Status and Perspectives, MRC Technical paper No. 6. Mekong River Commission, Phnom Penh
Van Zalinge et al. 2004, “The Mekong River System”, in Welcomme and Petr (eds) 2004, pp.335-357
Welcomme, R.L. and T. Petr. (eds). 2004. Proceedings of the Second International Symposium on the Management of Large Rivers for Fisheries, 11-14 February 2003, Phnom Penh, Mekong River Commission
Navigation De Bruin, D. 2003. “Institutional Development and Capacity Building”, in Proceedings of the Regional Consultation Workshop on MRC Navigation Programme, MRC, Phnom Penh 3-4 September 2003
TA 6069 SEF II, Sub-regional Environment Assessment Report (Draft)
80
Dezeure, J. and H. Ghoos. 2004. Report on the Transit of Containers on the Mekong River between Phnom Penh and Ho Chi Minh City, a consultant case study for the Mekong River Commission, MRC, Phnom Penh
Hodgkinson, P. and L. Geerink, “Trade and transport”, in MRC. 2003. State of the Basin Report, pp. 217-242
Hooydonk, van E. 2003, “Legal Framework for Cross Border Navigation”, Proceedings of the Regional Consultation Workshop on MRC Navigation Programme, MRC, Phnom Penh 3-4 September 2003
MRC. 2003. MRC Navigation Strategy, Mekong River Commission, Phnom Penh
MRC. 2004. MRC Navigation Programme, (Vol.1: Socio-Economic Analysis and Regional transport Planning , Vol. 2: Legal Framework and Cross-Border Navigation, Vol.3: Traffic Safety and Environmental Sustainability, Vol.4: Information, Promotion and Coordination, Vol. 5: Institutional Development) Mekong River Commission, Phnom Penh
Starr, P. 2004. The People’s Highway: Past Present and Future Transport in the Mekong River System, Mekong Development Series No.3. Mekong River Ciommission, Phnom Penh
Urban, L. 2003. “Information, Promotion and Coordination”, Proceedings of the Regional Consultation Workshop on MRC Navigation Programme, MRC, Phnom Penh 3-4 September 2003
Wu, Z. 2003 “Chinese Vision for Lancang-Mekong Navigation”, in Proceedings of the Regional Consultation Workshop on MRC Navigation Programme, MRC, Phnom Penh 3-4 September 2003
Illegal Trade of Wildlife Resources
UNEP/CBD/SBSTTA/9/10 (2003). Monitoring and Indicators: Designing national-level monitoring programmes and indicators.
Sub-regional Biodiversity Modeling
Alkemade, J. R. M., Simons, H., Bakkenes, M., and Van Oorschot, M. Impacts of land-use changes on species diversity: a global overview. in prep. Bakkenes, M., Alkemade, J.R.M., Ihle, F., Leemans, R. and Latour, J.B. (2002) Assessing effects of forecasted climate change on the diversity and distribution of European higher plants for 2050. Global Change Biology 8, 390-407.
Bobbink, R. (2004) Plant species richness and the exceedance of empirical nitrogen critical loads: an inventory. Utrecht: Utrecht University IMAGE-team (2001) The IMAGE 2.2 implementation of the SRES scenarios. A comprehensive analysis of emissions, climate change and impacts in the 21st century. 481508018, Bilthoven: National Institute for Public Health and the Environment.
Leemans, R. and Eickhout, B. (2003) Analysing changes in ecosystems for different levels of climate change. OECD workshop on benefits of climate policy: improving information for policy makers
Tekelenburg, T. and Alkemade, J. R. M. Impacts of intensifiation of agricultural production on species diversity. In prep.
Ten Brink, B.J.E. (2000) Biodiversity indicators for the OECD Environmental Outlook and Strategy; A feasibility study. 402001014, Bilthoven: RIVM.
TA 6069 SEF II, Sub-regional Environment Assessment Report (Draft)
81
UNEP (2001) GLOBIO. Global methodology for mapping human impacts on the biosphere. 01-3.
UNEP/RIVM Potting, J. and J. Bakkes, (Eds.) (2004) The GEO-3 Scenarios 2002-2032: Quantification and analysis of environmental impacts. UNEP/DEWA/RS.03-04; RIVM 402001022, Nairobi, Kenya; Bilthoven, The Netherlands.
Degree of Harmonization of Policies and Standards
ADB Greater Mekong Subregion Core Environment Program and Biodiversity Conservation Corridors Initiative, Program Technical Paper, March 2006
ASEAN, Report to the World Summit on Sustainable Development, 2002
ASEAN, Second ASEAN State of the Environment Report, 2000
ENSIC, Appropriate Environmental Standards for Developing Countries, Environment Systems Review, 1993
ICEM, Regional Report on Protected Areas and Development, Lower Mekong River Region, 2003
MRC, State of the Basin Report, 2003
Nurit Kliot, Deborah Shmueli and Uri Shamir, Development of Institutional Framework for Management of Transboundary Water Resources, 2001
Evans, Grant, 1992, “Internal Colonialism in the Central Highlands of Vietnam”, Sojourn, 7(2) 274-304.
Dr. George E. Radosevich & Mr. Douglas C. Olson, Existing and Emerging Basin Arrangements in Asia: Mekong River Commission Case Study, Third Workshop on River Basin Institution Development, 1999, The World Bank, Washington, DC.
Philip Hirsch and Gerard Cheong, Natural Resource Management in the Mekong River Basin: Perspectives for Australian Development Cooperation, University of Sydney, 1996
Regional Characteristics and Water Issues: From Mekong River Basin Perspectives, Sokhem Pech, 2004
Roberts, Tyson R (1993a) Artisanal fisheries and fish ecology below the great waterfalls of the Mekong River in southern Laos. Nat. Hist. Bull. Siam Soc., 41: 31-62.
Roberts, Tyson R (1993b) Just another damned river? Negative impacts of Pak Mun dam on fishes of the Mekong Basin. Nat. Hist. Bull. Siam Soc., 41: 105-133.
Roberts, Tyson (1995) Mekong mainstream hydropower dams: run-of-the-river or ruin-of-theriver? Nat. Hist. Bull. Siam Soc., 43: 9-19.
Rongxing Guo and Kaizhong Yang (2002), ‘The Political Economy of Transnational water Pollution: What Do the LMBs Data Say?’ Regional Science Association of China (RSAC), Beijing, PR China
Sluiter, Liesbeth (1992) The Mekong Currency, Project for Ecological Recovery/TERRA, Bangkok.
WWF, Working for Sustainable Development in Grater Mekong Sub-region, 2005
Environment Sustainability Index
2005 Environmental Sustainability Index: Benchmarking National Environmental Stewardship, Yale Center for Environmental Law and Policy, Yale University and Center for International Earth Science Information Network, Columbia University, 2005
TA 6069 SEF II, Sub-regional Environment Assessment Report (Draft)
82
Human Development Report 2005: International Cooperation at a Crossroads, UNDP, 2005
Related Documents


