Sport, recreation and phySical activity profile: taranaki reGion 2007/08

Welcome message from author
This document is posted to help you gain knowledge. Please leave a comment to let me know what you think about it! Share it to your friends and learn new things together.
Transcript

8/14/2019 Regional Sports Trust Profile Taranaki
http://slidepdf.com/reader/full/regional-sports-trust-profile-taranaki 1/20
Sport, recreation and
phySical activity profile:taranaki reGion
2007/08
8/14/2019 Regional Sports Trust Profile Taranaki
http://slidepdf.com/reader/full/regional-sports-trust-profile-taranaki 2/20
ISBN:1-877356-80-8
Citation:Sport and Recreation New Zealand. (2009). Sport, Recreation and Physical Activity Profile:
Taranaki Region 2007/08. Wellington: SPARC.
Published in 2009 by Sport and Recreation New Zealand.
This document is available at www.sparc.org.nz.
8/14/2019 Regional Sports Trust Profile Taranaki
http://slidepdf.com/reader/full/regional-sports-trust-profile-taranaki 3/20
REGIONAL PROFILE TARANAKI 1
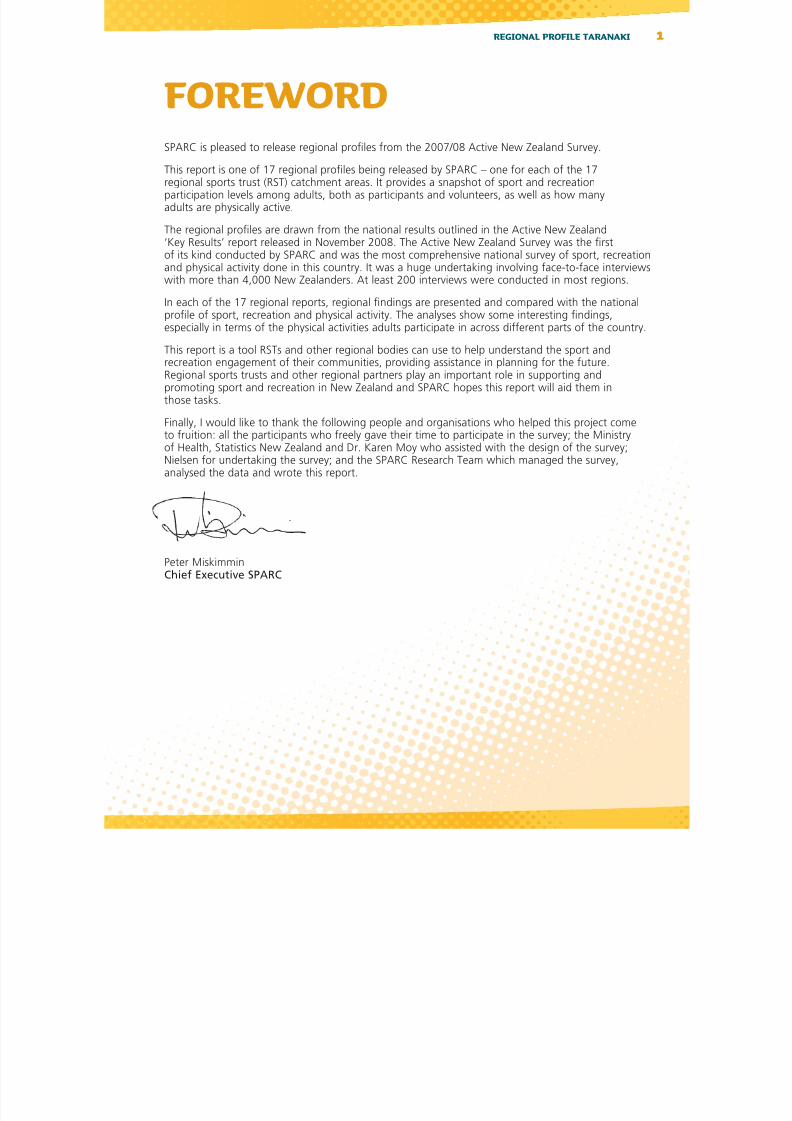
FOREWORDSPARC is pleased to release regional profiles from the 2007/08 Active New Zealand Survey.
This report is one of 17 regional profiles being released by SPARC – one for each of the 17regional sports trust (RST) catchment areas. It provides a snapshot of sport and recreationparticipation levels among adults, both as participants and volunteers, as well as how manyadults are physically active.
The regional profiles are drawn from the national results outlined in the Active New Zealand‘Key Results’ report released in November 2008. The Active New Zealand Survey was the firstof its kind conducted by SPARC and was the most comprehensive national survey of sport, recreationand physical activity done in this country. It was a huge undertaking involving face-to-face interviewswith more than 4,000 New Zealanders. At least 200 interviews were conducted in most regions.
In each of the 17 regional reports, regional findings are presented and compared with the nationalprofile of sport, recreation and physical activity. The analyses show some interesting findings,especially in terms of the physical activities adults participate in across different parts of the country.
This report is a tool RSTs and other regional bodies can use to help understand the sport andrecreation engagement of their communities, providing assistance in planning for the future.Regional sports trusts and other regional partners play an important role in supporting andpromoting sport and recreation in New Zealand and SPARC hopes this report will aid them inthose tasks.
Finally, I would like to thank the following people and organisations who helped this project come
to fruition: all the participants who freely gave their time to participate in the survey; the Ministryof Health, Statistics New Zealand and Dr. Karen Moy who assisted with the design of the survey;Nielsen for undertaking the survey; and the SPARC Research Team which managed the survey,analysed the data and wrote this report.
Peter MiskimminChief Executive SPARC
8/14/2019 Regional Sports Trust Profile Taranaki
http://slidepdf.com/reader/full/regional-sports-trust-profile-taranaki 4/20
REGIONAL PROFILE TARANAKI2
CONTENTSForeword 1
Executive Summary 3
Report Content 3
Key Findings 3
Introduction 4
The 2007/08 Active NZ Survey 4
Methodology 4
Reported Findings 5
The Taranaki Region 5
Participation in Sport and Recreation 6
Popular Activities 6
Participation in an Organised Competition or Event Over 12 Months 9
Received Instruction for a Sport or Recreation Activity Over 12 Months 9
Involvement in a Sport or Recreation Club or Centre Over a Month 10
Volunteers
Volunteer Levels 11
Most Common Volunteer Roles 11
National Physical Activity Guidelines 12
Physical Activity Levels 12
Physical Activity Levels Among Adults in the Taranaki Region
by Gender 13
Physical Activity Levels Among All New Zealand Adults 14
The Number of Days Adults Achieved at Least 30 Minutes 14a Day of Moderate Intensity Physical Activity
Comparisons 15
Taranaki Region and New Zealand Physical ActivityProfiles Compared 15
Regional Comparisons 16

8/14/2019 Regional Sports Trust Profile Taranaki
http://slidepdf.com/reader/full/regional-sports-trust-profile-taranaki 5/20
REGIONAL PROFILE TARANAKI 3
EXECUTIVE SUMMARYReport ContentBased on information collected through the 2007/08 Active NZ Survey, this report provides anoverview of physical activity behaviours among adults (aged 16 years and over) living in the Taranakiregion, in particular, their level of involvement with sport and recreation as participants andvolunteers and their overall level of physical activity. The findings for the Taranaki region are alsocompared with the national profile for sport, recreation and physical activity in this report.
Key FindingsThe sport, recreation and physical activity profile for the Taranaki region was similar to the nationalprofile. Compared with New Zealand adults, a similar percentage of adults in the Taranaki region:
participated in at least one sport or recreation activity per week (New Zealand: 79%;• Taranaki: 76%) and per year (New Zealand: 96%; Taranaki: 93%);
participated in at least one organised competition or event per year (New Zealand: 37%;•Taranaki: 40%);
were members of clubs or centres in order to take part in sport and recreation activities•(New Zealand: 35%; Taranaki: 38%);
received instruction from a coach, instructor, teacher or trainer to help improve their performance•(New Zealand: 40%; Taranaki: 42%);
were volunteers for a sport or recreation activity (New Zealand: 25%; Taranaki: 32%); and•
achieved the national physical activity guideline by undertaking 30 minutes or more of moderate•intensity physical activity on at least five days out of seven (New Zealand: 48%; Taranaki: 47%).
In the Taranaki region:
walking was the most popular sport and recreation activity;•
tennis was on the 10 most popular activities list for adults in the Taranaki region, but not on the•list for New Zealand adults;
tramping, bowls and hunting were on the 10 most popular activities list for men in the Taranaki•region, but not on the list for New Zealand men;
fishing and tennis were on the 10 most popular activities list for women in the Taranaki region,•but not on the list for New Zealand women; and
men were significantly more likely than women in the Taranaki region to have participated in an•organised competition or event per year (Men: 55%; Women: 30%).

8/14/2019 Regional Sports Trust Profile Taranaki
http://slidepdf.com/reader/full/regional-sports-trust-profile-taranaki 6/20
REGIONAL PROFILE TARANAKI4
INTRODUCTIONThe 2007/08 Active NZ SurveyThe Active NZ Survey is a national-level survey run by Sport and Recreation New Zealand (SPARC) tomonitor physical activity, in particular, sport and recreation participation among New Zealand adults.
The sampling methodology was designed to enable SPARC to provide high-level informationabout sport, recreation and physical activity levels at a regional level, based on the geographicalareas serviced by New Zealand’s 17 regional sports trusts (RSTs). At least 200 participants wereinterviewed in each region, with the exception of Gisborne, where the interview target was 100(fewer participants were targeted because of the geographical spread of the Gisborne population).
Methodology
The SurveyThe Active NZ Survey consists of two data collection methods:
a sport and recreation survey; and1.
a seven-day physical activity recall diary.2.
The Active NZ Survey collected information about adult participation in different physical activitydomains (i.e. sport and recreation, active travel including walking or cycling to a destination,occupational activities and incidental activities like washing the car). Information about howfrequently people participated in physical activities, the variety of physical activities that eachindividual participated in, membership in clubs or centres for sport and recreation purposes andvolunteering in various roles to support sport and recreation activities was also collected.
The SampleData were collected within each region of New Zealand. A total of 4,443 adults aged 16 years and overwere interviewed face-to-face, of which 238 interviews were completed within the Taranaki region.The interviews were completed over a 12-month period beginning in March 2007. An overall responserate of 61 percent was achieved for the total New Zealand sample, with a response rate of 69 percentfor the Taranaki region.
Total Number of Completed Interviews and Weighted PopulationNumbers for the Taranaki Region
Number Interviewed(n)
Weighted PopulationNumbers (n)
RegionalPopulation 238 89,181
Gender
Men 86 36,071
Women 152 53,110

8/14/2019 Regional Sports Trust Profile Taranaki
http://slidepdf.com/reader/full/regional-sports-trust-profile-taranaki 7/20
REGIONAL PROFILE TARANAkI 5
Reported FindingsIn this report:
regional fndings (based on the total regional sample) are compared to national fndings; and•
within each region, comparisons by gender are made (i.e. men versus women).•
The regional fndings presented in each o the 17 regional reports are associated with margins oerror ranging between ±4% and ±12%. Findings based on the total regional sample have marginso error at the lower end o this range. When the data are analysed by gender, the fndings areassociated with margins o error at the higher end o this range.
The sample size per region, thereore, is large enough to produce reliable high-level fndings
according to the aorementioned comparisons, but is not large enough to produce reliable fndingsbased on more in-depth analyses (e.g. regional fndings by age). The comparisons noted in thisreport provide insights into how the regional activity profle compares with the activity profle or allNew Zealanders and any dierences in participation that may exist between men and women.
Although dierences between regional and national fndings or between male and emale fndingswithin a specifc region may be large, these dierences may not always be (statistically) signifcant.I regional fndings are signifcantly dierent to national fndings or i there are signifcant dierencesbetween men and women within a specifc region, this will be noted in the text o this document.More inormation regarding margins o error is available at www.sparc.org.nz.
The Taranai RegionIn this report, the Taranaki region reers to the geographical area serviced by the regional sportstrust, Sport Taranaki.
8/14/2019 Regional Sports Trust Profile Taranaki
http://slidepdf.com/reader/full/regional-sports-trust-profile-taranaki 8/20
REGIONAL PROFILE TARANAKI6
W a l k i n g
G a r d
e n i n
g
E q u i p m
e n t -
b a s e d e x e r c i s e 2
C y c l i n
g 1
0%
20%
30%
40%
50%
60%
10%
58.8%
31.5%26.1% 24.8%
23.0%
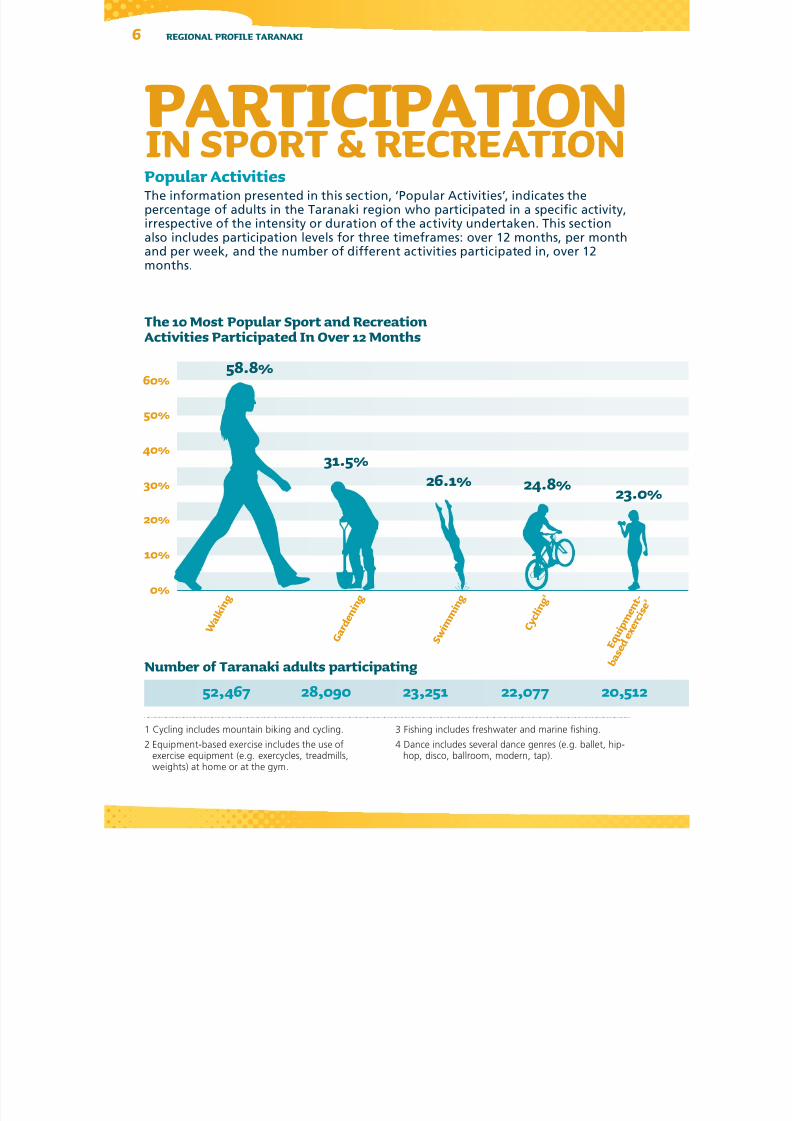
PARTICIPATIONIN SPORT & RECREATIONPopular ActivitiesThe information presented in this section, ‘Popular Activities’, indicates thepercentage of adults in the Taranaki region who participated in a specific activity,irrespective of the intensity or duration of the activity undertaken. This sectionalso includes participation levels for three timeframes: over 12 months, per monthand per week, and the number of different activities participated in, over 12months.
The 10 Most Popular Sport and RecreationActivities Participated In Over 12 Months
1 Cycling includes mountain biking and cycling.2 Equipment-based exercise includes the use of
exercise equipment (e.g. exercycles, treadmills,weights) at home or at the gym.
3 Fishing includes freshwater and marine fishing.4 Dance includes several dance genres (e.g. ballet, hip-
hop, disco, ballroom, modern, tap).
52,467 28,090 22,07723,251 20,512
Number of Taranaki adults participating
S w i m
m i n
g

8/14/2019 Regional Sports Trust Profile Taranaki
http://slidepdf.com/reader/full/regional-sports-trust-profile-taranaki 9/20
REGIONAL PROFILE TARANAKI 7
J o g g i n
g / R u n
n i n g
D a n c
e 4
T e n n i s
T r a m
p i n g
F i s h i n
g 3
22.0%
14.8%10.8% 10.6%
18.2%
5 Includes both indoor and outdoor versionsof this activity.
6 Hunting includes general hunting, deerstalkingand pig hunting.
19,655 16,214 13,182 9,4309,652
Walking was the most popular activity for both men and women.•
Six of the 10 most popular activities were the same for men•and women.
Activities uniquely popular with women were dance, pilates/yoga,•aerobics and tennis, while jogging/running, tramping, bowls andhunting were uniquely popular among men.
The 10 Most Popular Sport and RecreationActivities Participated In Over 12 MonthsBy Gender
WomenActivity %
Walking 68.7Gardening 36.7Swimming 32.5Dance 25.4
Equipment-based exercise 24.2Cycling 19.5Fishing 18.7Pilates/Yoga 11.6
Aerobics 11.4
Tennis 11.0
MenActivity %
Walking 44.3Cycling 32.5Fishing 26.9Gardening 23.9Equipment-based exercise 21.2Jogging/Running 20.4
Swimming 16.6Tramping 16.2
Bowls5 16.1
Hunting6 13.1

8/14/2019 Regional Sports Trust Profile Taranaki
http://slidepdf.com/reader/full/regional-sports-trust-profile-taranaki 10/20
REGIONAL PROFILE TARANAKI8
Participation in Sport or Recreation ActivityOver Different Timeframes
Percentage of adults who took part in at least one sport orrecreation activity…
Among adults:
75.6 percent participated in sport and recreation per•week; and
the participation level increased to 92.8 percent over 12 months,•indicating that most adults took part in at least one sport orrecreation activity.
OVER12 MONTHS
RegionalPopulation
GenderMen
Women
RegionalPopulation
GenderMen
Women
RegionalPopulation
GenderMen
Women
PER MONTH
PER WEEK
Number of Sport and Recreation Activities Participated In Over 12 Months
Over 12 months:
81.4 percent of adults participated in at least•two different types of sport or recreationactivity; and
on average, adults participated in 4.1•different sport or recreation activities.
92.8
90.894.1
87.7
83.190.9
75.6
67.880.9
Percentage of adults who took part in…
One sport orrecreationactivity
Two sport orrecreationactivities
Three ormore sportor recreationactivities
Averagenumber of sportand recreationactivities
RegionalPopulation 92.8 81.4 64.7 4.1
Gender
Men 90.8 80.0 63.1 4.4
Women 94.1 82.4 65.7 3.9

8/14/2019 Regional Sports Trust Profile Taranaki
http://slidepdf.com/reader/full/regional-sports-trust-profile-taranaki 11/20
REGIONAL PROFILE TARANAKI 9
Over 12 months:
41.9 percent of adults received instruction from a•coach, instructor, teacher or trainer to help improvetheir performance.
7 Examples of organised competition and events included one-offevents such as a 5km run/walk or cycle event as well as organisedclub competition. The survey question excluded exercising at home(gym/callisthenics/pilates/yoga) and gardening as organised activities.
Over 12 months:
41.9 percent of adults received instruction from a•coach, instructor, teacher or trainer to help improvetheir performance.
Over 12 months:
41.9 percent of adults received instruction from a•coach, instructor, teacher or trainer to help improvetheir performance.
Over 12 months:
40.4 percent of adults participated in at least one organised• competition or event; and
men were significantly more likely than women to have•participated in an organised competition or event.
Participation in an Organised7 Competition or Event Over 12 Months
Received Instruction for a Sport orRecreation Activity Over 12 Months
%
RegionalPopulation 41.9
Gender
Men 37.2
Women 45.1
%
RegionalPopulation 40.4
Gender
Men 55.2
Women 30.4
ve

8/14/2019 Regional Sports Trust Profile Taranaki
http://slidepdf.com/reader/full/regional-sports-trust-profile-taranaki 12/20
REGIONAL PROFILE TARANAKI10
The Active NZ Survey examined the percentageof adults who had been members of thefollowing types of club or centre in order to takepart in a sport or recreation activity:
sport or physical activity club;•
gym or fitness centre;•
social club/work team; and•
other type of club/centre.•
Involvement in a Sport or RecreationClub or Centre Over a Month
8 Participants could choose multiple club/centre typesnoted in this table. As a consequence, the sum of thepercentages for each club/centre type does not equal37.5 percent.
Member of Any Club or Centre Member of a SpecificClub or Centre Type8
%
Sport/Physical activity club 24.6
Gym/Fitness centre 9.9
Social club/work team 4.0
Other type of club 3.2
Among the different types of clubsand centres:
24.6 percent of adults were members of•a sport/physical activity club in order toparticipate in sport and recreation activities.
During any month:
37.5 percent of adults were members of•clubs or centres in order to take part insport and recreation activities.
%
RegionalPopulation 37.5
Gender
Men 45.3
Women 32.6
8/14/2019 Regional Sports Trust Profile Taranaki
http://slidepdf.com/reader/full/regional-sports-trust-profile-taranaki 13/20
REGIONAL PROFILE TARANAKI 11
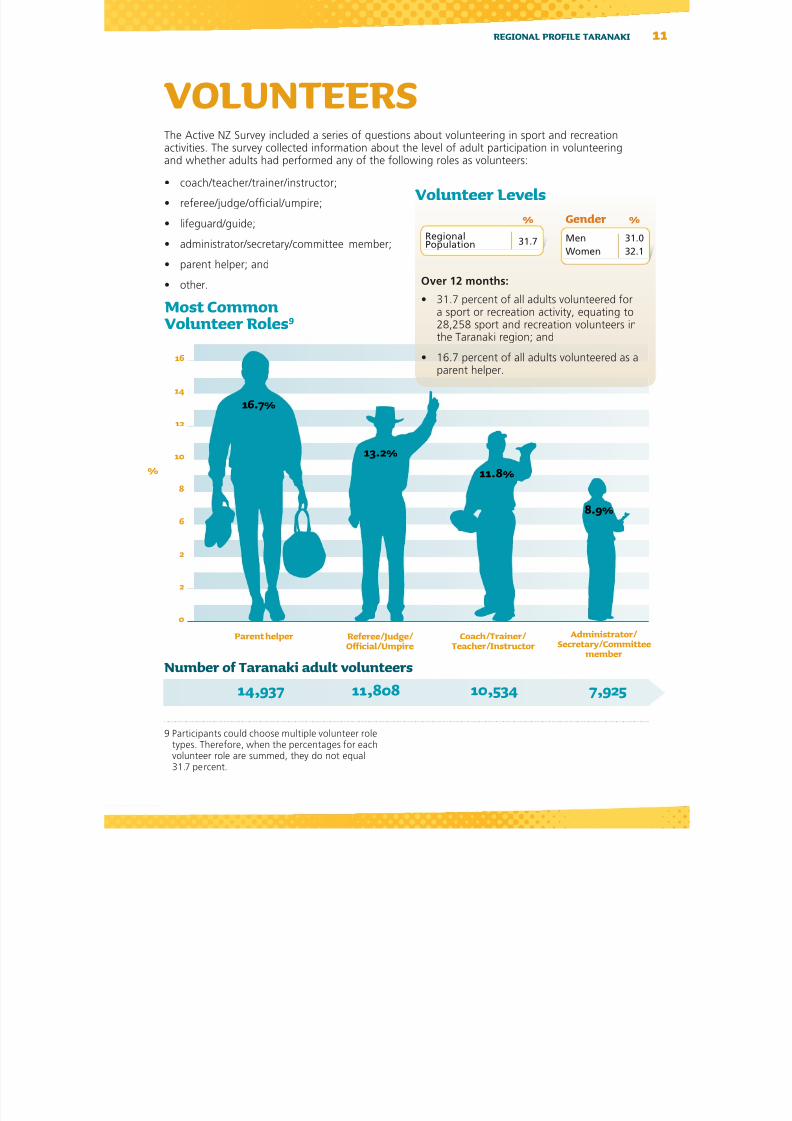
9 Participants could choose multiple volunteer roletypes. Therefore, when the percentages for eachvolunteer role are summed, they do not equal31.7 percent.
VOLUNTEERS
Most Common Volunteer Roles9
Coach/Trainer/ Teacher/Instructor
Referee/Judge/ Of ficial/Umpire
Administrator/ Secretary/Committee
member
10
12
14
16
8
6
2
2
0
11.8%11.8%
16.7%
8.9%8.9%
The Active NZ Survey included a series of questions about volunteering in sport and recreation
activities. The survey collected information about the level of adult participation in volunteeringand whether adults had performed any of the following roles as volunteers:
coach/teacher/trainer/instructor;•
referee/judge/official/umpire;•
lifeguard/guide;•
administrator/secretary/committee member;•
parent helper; and•
other.• Over 12 months:
31.7 percent of all adults volunteered for•a sport or recreation activity, equating to28,258 sport and recreation volunteers inthe Taranaki region; and
16.7 percent of all adults volunteered as a•parent helper.
Volunteer Levels
14,937 11,808 10,534 7,925
Gender %
Men 31.0
Women 32.1
%
RegionalPopulation 31.7
Parent helper
13.2%13.2%
Number of Taranaki adult volunteers
%
8/14/2019 Regional Sports Trust Profile Taranaki
http://slidepdf.com/reader/full/regional-sports-trust-profile-taranaki 14/20
REGIONAL PROFILE TARANAKI12
11 Sport and Recreation New Zealand.(2005). Movement = Health MeKorikori Ka Ora. Wellington: SPARC.
10 When summed, the percentagesper region may not equal 100%because of rounding.
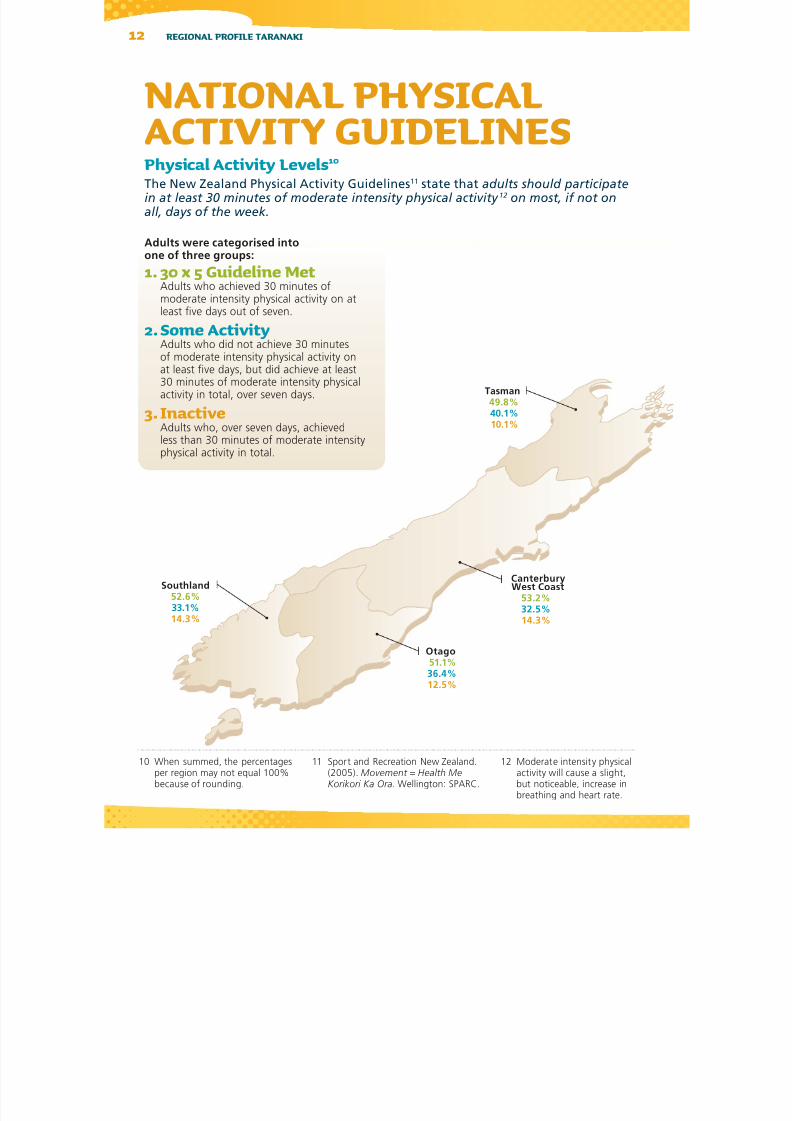
Adults were categorised intoone of three groups:
30 x 5 Guideline Met1.
Adults who achieved 30 minutes ofmoderate intensity physical activity on atleast five days out of seven.
Some Activity2.Adults who did not achieve 30 minutesof moderate intensity physical activity onat least five days, but did achieve at least30 minutes of moderate intensity physicalactivity in total, over seven days.
Inactive3.Adults who, over seven days, achieved
less than 30 minutes of moderate intensityphysical activity in total.
12 Moderate intensity physicalactivity will cause a slight,but noticeable, increase inbreathing and heart rate.
Tasman49.8%40.1%10.1%
Southland52.6%33.1%14.3%
CanterburyWest Coast53.2%32.5%14.3%
Otago51.1%36.4%12.5%
NATIONAL PHYSICAL
ACTIVITY GUIDELINESPhysical Activity Levels10
The New Zealand Physical Activity Guidelines11 state that adults should participatein at least 30 minutes of moderate intensity physical activity 12 on most, if not onall, days of the week.

8/14/2019 Regional Sports Trust Profile Taranaki
http://slidepdf.com/reader/full/regional-sports-trust-profile-taranaki 15/20
REGIONAL PROFILE TARANAKI 13
Counties Manukau51.0%35.0%14.0%
Taranaki47.0%40.7%12.2%
Wellington47.6%42.7%
9.7%
Northland44.5%39.9%15.6%
Wanganui43.0%40.3%16.8%
Waitakere54.3%35.7%
9.9%
Auckland44.0%40.3%15.7%
Over seven days:
the percentage of adults in the Taranaki•region who achieved the national physicalactivity guideline was similar to thepercentage for New Zealand adults(New Zealand: 48.2%; Taranaki: 47.0%).
Manawatu43.6%42.3%14.2%
Hawkes Bay53.3%37.0%9.7%
Gisborne35.2%38.6%
26.2%
Bay of Plenty47.5%37.2%15.4%
Physical Activity LevelsAmong Adults in the
Taranaki Region by Gender
North Harbour42.5%45.8%11.7%
Waikato45.9%46.4%
7.7%
Men49.6%35.5%14.9%
Women45.3%44.3%10.4%

8/14/2019 Regional Sports Trust Profile Taranaki
http://slidepdf.com/reader/full/regional-sports-trust-profile-taranaki 16/20
REGIONAL PROFILE TARANAKI14
0Taranaki
10
20
30
40
50
60
New Zealand
%
The Number of Days Adults Achieved at Least30 Minutes a Day of Moderate Intensity Physical Activity
16.7 19.447.0 48.236.3 32.4
Over seven days:
36.3 percent of adults in the Taranaki region•engaged in 30 minutes of moderate intensityphysical activity on a maximum of two days;
16.7 percent engaged in 30 minutes of•moderate intensity physical activity on threeto four days; and
47.0 percent achieved 30 minutes of•moderate intensity physical activity on atleast five days out of seven.
0–2 days 3–4 days 5–7 days
48.2%(1,578,046 adults)
30 x 5 Guideline Met
12.7 %(416,419 adults)
Inactive
39.1%(1,281,265 adults)
Some Activity
Physical Activity Levels AmongAll New Zealand Adults
Over seven days:
48.2 percent of all New Zealand adults•achieved 30 minutes of moderate intensityphysical activity on at least five days,equating to 1,578,046 adults meeting thenational physical activity guideline (30 x 5).
8/14/2019 Regional Sports Trust Profile Taranaki
http://slidepdf.com/reader/full/regional-sports-trust-profile-taranaki 17/20
REGIONAL PROFILE TARANAKI 15
COMPARISONSTaranaki Region and New Zealand Physical ActivityProfiles ComparedIn this section, comparisons between the findings for the Taranaki regionand New Zealand13 are presented.
Popular ActivitiesTennis was on the 10 most popular activities list for adults in the Taranaki region, but not on the•list for New Zealand adults.
Tramping, bowls and hunting were on the 10 most popular activities list for men in the Taranaki•region, but not on the list for New Zealand men.
Fishing and tennis were on the 10 most popular activities list for women in the Taranaki region,•but not on the list for New Zealand women.
Organised Competition/Event Participation, Club/Centre Involvementand Instruction
Compared with New Zealand adults, a similar percentage of adults in the Taranaki region:•
– participated in at least one organised competition or event (New Zealand: 36.9%;Taranaki: 40.4%);
– were members of clubs or centres in order to take part in sport and recreation activities
(New Zealand: 34.9%; Taranaki: 37.5%); and
– received instruction from a coach, instructor, teacher or trainer to help improve theirperformance (New Zealand: 39.9%; Taranaki: 41.9%).
VolunteeringThe level of volunteering for adults in the Taranaki region (31.7%) was similar to the level for•New Zealand adults (25.3%).
Physical Activity LevelsThe percentage of adults in the Taranaki region who achieved the physical activity guideline was•
similar to the percentage for New Zealand adults (New Zealand: 48.2%; Taranaki: 47.0%).
13 Findings for New Zealand adults can be found in the SPARC (2008) report titled Sport, Recreation and Physical Activity Participation Among New Zealand Adults: Key Results of the 2007/08 Active New Zealand Survey .This report is available at www.sparc.org.nz.
8/14/2019 Regional Sports Trust Profile Taranaki
http://slidepdf.com/reader/full/regional-sports-trust-profile-taranaki 18/20
REGIONAL PROFILE TARANAKI16
Popular Activities OrganisedCompetition/ EventParticipation
Instruction
% of adults who participatedin at least one sport orrecreation activity...
Averagenumberof activitiesper adult
per year
% of adults whoparticipated inat least one sportor recreationorganised
competition orevent per year
% of adultswho receivedinstructionfor a sportor recreation
activityper year
over 12months
permonth per week
New Zealand 96.0 ± 2 90.0 ± 2 79.0 ± 2 4.6 36.9 ± 2 39.9 ± 2
Northland 95.8 ± 6 94.3 ± 6 85.5 ± 6 5.5 38.0 ± 6 31.1 ± 6*
North Harbour 97.8 ± 6 92.6 ± 6 79.8 ± 6 4.1 33.0 ± 6 45.4 ± 6
Waitakere 97.3 ± 6 89.5 ± 6 76.6 ± 6 3.9 34.9 ± 6 34.9 ± 6
Auckland 96.3 ± 6 90.6 ± 6 78.9 ± 6 4.3 35.9 ± 6 41.3 ± 6
Counties Manukau 97.1 ± 6 84.6 ± 6 71.8 ± 6 4.1 36.3 ± 6 40.3 ± 6
Waikato 96.3 ± 6 91.6 ± 6 81.9 ± 6 4.6 38.2 ± 6 38.6 ± 6
Bay of Plenty 95.8 ± 6 89.6 ± 6 77.4 ± 6 4.3 31.5 ± 6 36.7 ± 6
Gisborne 97.8 ± 8 93.3 ± 8 81.1 ± 8 6.4 37.0 ± 8 45.4 ± 8
Hawkes Bay 92.6 ± 6 81.9 ± 6 72.9 ± 6 3.8 42.7 ± 6 44.3 ± 6
Taranaki 92.8 ± 6 87.7 ± 6 75.6 ± 6 4.1 40.4 ± 6 41.9 ± 6
Wanganui 95.3 ± 6 90.3 ± 6 75.0 ± 6 4.3 31.5 ± 6 28.1 ± 6*
Manawatu 97.6 ± 6 91.1 ± 6 79.2 ± 6 4.6 26.2 ± 6* 34.4 ± 6
Wellington 96.0 ± 5 91.7 ± 5 80.2 ± 5 5.4 39.7 ± 5 38.4 ± 5
Tasman 97.9 ± 6 93.2 ± 6 85.4 ± 7 5.0 32.0 ± 7 35.7 ± 7
Canterbury West Coast 94.2 ± 6 89.0 ± 6 79.6 ± 6 4.6 36.9 ± 6 41.3 ± 6
Otago 96.6 ± 6 92.8 ± 6 84.4 ± 6 5.1 45.0 ± 6 46.0 ± 6
Southland 96.8 ± 6 89.7 ± 7 79.5 ± 7 5.8 50.7 ± 7* 49.1 ± 7*
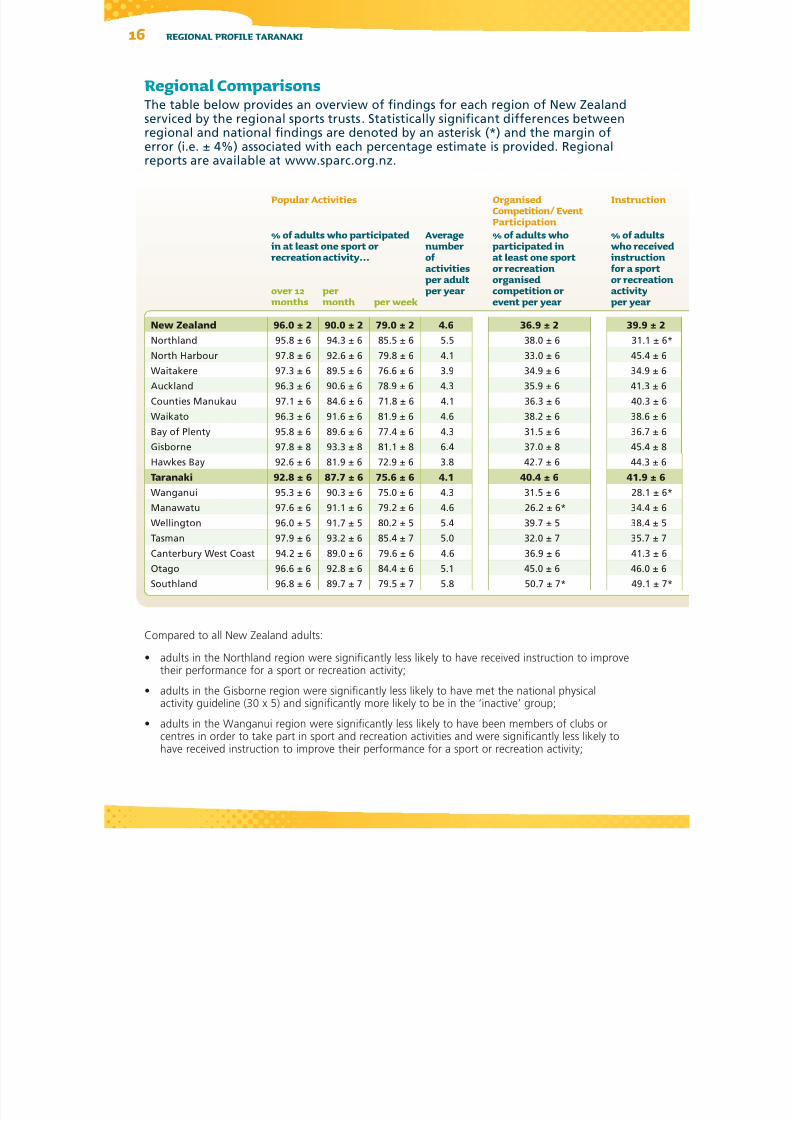
Regional ComparisonsThe table below provides an overview of findings for each region of New Zealandserviced by the regional sports trusts. Statistically significant differences betweenregional and national findings are denoted by an asterisk (*) and the margin of
error (i.e. ± 4%) associated with each percentage estimate is provided. Regionalreports are available at www.sparc.org.nz.
Compared to all New Zealand adults:
adults in the Northland region were significantly less likely to have received instruction to improve•their performance for a sport or recreation activity;
adults in the Gisborne region were significantly less likely to have met the national physical•activity guideline (30 x 5) and significantly more likely to be in the ‘inactive’ group;
adults in the Wanganui region were significantly less likely to have been members of clubs or• centres in order to take part in sport and recreation activities and were significantly less likely tohave received instruction to improve their performance for a sport or recreation activity;
8/14/2019 Regional Sports Trust Profile Taranaki
http://slidepdf.com/reader/full/regional-sports-trust-profile-taranaki 19/20
REGIONAL PROFILE TARANAKI 17
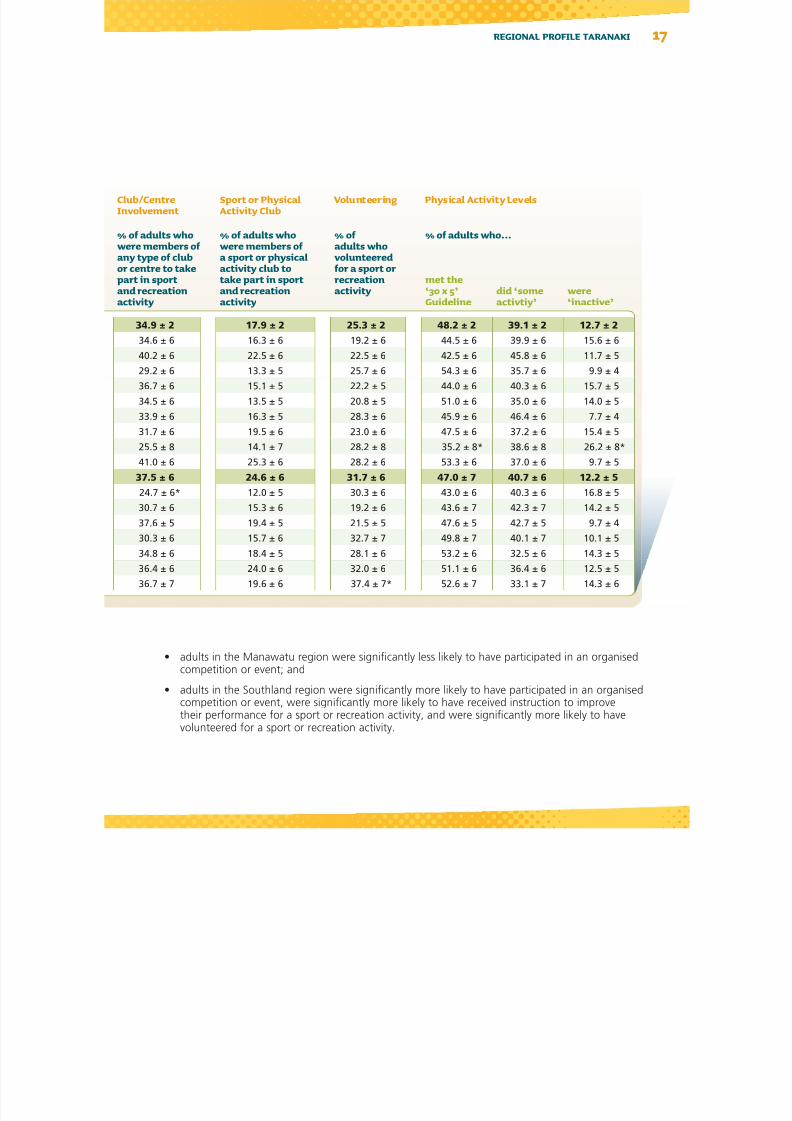
Club/CentreInvolvement
Sport or PhysicalActivity Club
Volunteering Physical Activity Levels
% of adults whowere members of any type of clubor centre to takepart in sport
and recreationactivity
% of adults whowere members of a sport or physicalactivity club totake part in sport
and recreationactivity
% of adults whovolunteeredfor a sport orrecreation
activity
% of adults who...
met the
‘30 x 5’Guideline
did ‘someactivtiy’
were‘inactive’
34.9 ± 2 17.9 ± 2 25.3 ± 2 48.2 ± 2 39.1 ± 2 12.7 ± 2
34.6 ± 6 16.3 ± 6 19.2 ± 6 44.5 ± 6 39.9 ± 6 15.6 ± 6
40.2 ± 6 22.5 ± 6 22.5 ± 6 42.5 ± 6 45.8 ± 6 11.7 ± 5
29.2 ± 6 13.3 ± 5 25.7 ± 6 54.3 ± 6 35.7 ± 6 9.9 ± 4
36.7 ± 6 15.1 ± 5 22.2 ± 5 44.0 ± 6 40.3 ± 6 15.7 ± 5
34.5 ± 6 13.5 ± 5 20.8 ± 5 51.0 ± 6 35.0 ± 6 14.0 ± 5
33.9 ± 6 16.3 ± 5 28.3 ± 6 45.9 ± 6 46.4 ± 6 7.7 ± 4
31.7 ± 6 19.5 ± 6 23.0 ± 6 47.5 ± 6 37.2 ± 6 15.4 ± 5
25.5 ± 8 14.1 ± 7 28.2 ± 8 35.2 ± 8* 38.6 ± 8 26.2 ± 8*
41.0 ± 6 25.3 ± 6 28.2 ± 6 53.3 ± 6 37.0 ± 6 9.7 ± 5
37.5 ± 6 24.6 ± 6 31.7 ± 6 47.0 ± 7 40.7 ± 6 12.2 ± 5
24.7 ± 6* 12.0 ± 5 30.3 ± 6 43.0 ± 6 40.3 ± 6 16.8 ± 5
30.7 ± 6 15.3 ± 6 19.2 ± 6 43.6 ± 7 42.3 ± 7 14.2 ± 5
37.6 ± 5 19.4 ± 5 21.5 ± 5 47.6 ± 5 42.7 ± 5 9.7 ± 4
30.3 ± 6 15.7 ± 6 32.7 ± 7 49.8 ± 7 40.1 ± 7 10.1 ± 5
34.8 ± 6 18.4 ± 5 28.1 ± 6 53.2 ± 6 32.5 ± 6 14.3 ± 5
36.4 ± 6 24.0 ± 6 32.0 ± 6 51.1 ± 6 36.4 ± 6 12.5 ± 5
36.7 ± 7 19.6 ± 6 37.4 ± 7* 52.6 ± 7 33.1 ± 7 14.3 ± 6
adults in the Manawatu region were significantly less likely to have participated in an organised•competition or event; and
adults in the Southland region were significantly more likely to have participated in an organised•competition or event, were significantly more likely to have received instruction to improvetheir performance for a sport or recreation activity, and were significantly more likely to have
volunteered for a sport or recreation activity.
8/14/2019 Regional Sports Trust Profile Taranaki
http://slidepdf.com/reader/full/regional-sports-trust-profile-taranaki 20/20
PO Box 2251, Wellington, New Zealand
Phone: +64 4 472 8058 Fax: +64 4 471 0813
Related Documents