Regional Reports on Renewable Energies 30 Country Analyses on Potentials and Markets in: West Africa (17) East Africa (5) Central Asia (8) Energy-policy Framework Papers, Section »Energy and Transport« Eschborn, December 2009 Promotion of Renewable Energies

Welcome message from author
This document is posted to help you gain knowledge. Please leave a comment to let me know what you think about it! Share it to your friends and learn new things together.
Transcript

Regional Reports on Renewable Energies30 Country Analyses on Potentials and Markets in:
West Africa (17) East Africa (5) Central Asia (8)
Energy-policy Framework Papers,
Section »Energy and Transport«
Eschborn, December 2009
Promotion ofRenewable Energies

Renewable Energies in West AfricaRegional Report on Potentials and Marktes – 17 Country Analyses
Energy-policy Framework Papers,
Section »Energy and Transport«
Promotion ofRenewable Energies

IMPRINT
Authors of Country Chapters Benin Daniel Finagnon Assogba (Dipl.-Eng.) Burkina Faso Bassirou Quedraogo (Dipl. Eng.) Souleymane Sow (Eng.) Cameroon Emmanuel Ngnikam (Dipl.) Cape Verde Louis Seck (MSc., DEA, MBA) Côte d’Ivoire Kouame Kadjo (Ing.) Gambia Bah F. M. Saho (Dipl. Agr., MSc. RE) Ghana Vincent Yankey (MBA, BSc) Guinea Bocar Sada Sy (Eng.) Guinea-Bissau Louis Seck (Msc., DEA, MBA) Liberia Augustus V. Goanue (MSc. Reg. Sc., BA Eng.) Mali Souleymane Diallo (Dr. Ing. Eng.) Mauritania Mohamed Elhacen Ould Khouna (Dipl. Eng.) revised version by Louis Seck (MSc., DEA, MBA) Niger Safiatou Alzouma (MSc. Eng.) Nigeria Prof. Anthony O. Adegbulugbe Dr. Adeola Adenikinju Sierra Leone Michael A. Conteh (MSc. Eng.) Togo Mawé Afo Aledjou (Dipl. Eng.)
Coordination and Review of the Country Chapters Anton Hofer (MSE, Dipl.-Ing. /FH, M. A.) Dr. Rainer Janssen WIP-Renewable Energies www.wip-munich.de Munich, Germany
Contribution by Rolf-Peter Owsianowski, Energy Expert for West Africa
Editor Deutsche Gesellschaft für Technische Zusammenarbeit (GTZ) GmbH Department Water, Energy, Transport Dag-Hammarskjöld-Weg 1–5 65760 Eschborn, Germany www.gtz.de
On behalf of Federal Ministry for Economic Cooperation and Development (BMZ)
Editorial staff Diana Kraft Tel: +49 (0)6196 79 4101 Fax: +49 (0)6196 79 80 4101 Email: [email protected]
Disclaimer/ Citation The data used in this report is based on publicly accessible sources, as well as on non-public papers and partly also on personal expert
interviews. Although the information given in this report is the best available to the authors at the time, GTZ, BMZ or the authors cannot be held liable for the
accuracy and correctness of the data included in the report.
GTZ is solely authorized for all forms of use of the publication. Duplication, reproduction or distribution of the report a s a whole or of parts of the report for
commercial purposes, require the prior written consent of GTZ. Other uses, including duplication, reproduction and distribution of the report as a whole or of
parts of the report for non-commercial purposes is permitted, provided the following appropriate citation of the GTZ publication as source is considered.
Deutsche Gesellschaft für Technische Zusammenarbeit – GTZ (2009): Regional Reports on Renewable Energies. 30 Country Analyses on Potentials and Markets in
West Africa (17), East Africa (5) and Central Asia (8). Frankfurt /Eschborn
Copyright © 2009 Deutsche Gesellschaft für Technische Zusammenarbeit (GTZ) GmbH.
Renewable Energies in West AfricaIMPRINT

BENIN, BURKINA FASO, CAPE VERDE, CAMEROON, COTÊ D’IVOIRE, GAMBIA, GHANA, GUINEA
GUINEA BISSAU, LIBERIA, MALI, MAURITANIA, NIGER, NIGERIA, SENEGAL, SIERRA LEONE, TOGO
Renewable Energies in West Africa 1
FOREWORD
BackgroundIn recent years a large number of developing and emerging countries have changed the structure of their energy sec-tors, often accompanied by a liberalization of their markets. In many cases, Renewable Energies (RE) are a more and more important strategic component for the countries’ diversifica-tion of their national energy supply.
A growing energy demand deriving from the increasing energy consumption of growing economies worldwide, accompanied by volatile prices for fossil fuels and by increasing environ-mental and climate challenges, boosts the demand for RE technologies. RE have a competitive advantage because they provide a long-term energy supply (for electricity, heating or cooling) based on locally available RE sources and thus help to reduce dependency on energy imports. In addition, RE provide appropriate technological solutions for the electrifi-cation of rural or semi-urban areas where they can be used independently from grid-connection. RE are a key for the pro-vision of modern energy services in these areas and contrib-ute to the local economic and social development.
While the technical potential for RE resources such as wind, solar, hydropower, biomass or geothermal energy is consid-ered high in most developing and emerging countries, these regions are still faced with significant barriers for the devel-opment of commercially driven and sustainable RE markets. The lack of appropriate policies and the respective business environment are constraints that restrict the dissemination of RE in these countries. The success of comprehensive policy frameworks for the promotion of RE – such as RE feed-in-tariffs or incentive instruments like tax relieves – can be ob-served in more and more countries, for example Germany or France. However today, also developing countries and emerg-ing markets such as South Africa, Kenya or the Philippines reveal the significance of adequate policy frameworks for favo-rable market conditions. Investments in RE markets, in partic-ular by the private sector, very much depend on the existence of these national or regional framework conditions, incentives and financing options on the one hand, but also on sufficient transparency and knowledge about these conditions, which are thus part of the bottleneck for the deployment of RE.
ObjectiveCurrent and accurate information and data availability are – as stated above - important prerequisites for the development of RE energy markets and a broader dissemination of com-mercial activities – particularly in markets where information is scarce and where framework conditions are under transi-tion. The Regional Reports on Renewable Energies comprising 30 country analyses on RE potentials and markets in West Africa, East Africa and Central Asia are a substantial contribution to the dissemination of comprehensive and precise knowl-
edge on RE markets and related investment options and thus help to further pave the way for the promotion of RE in these regions.As such the publication addresses potential businesses and investors – including manufacturers, technology providers, wholesalers, suppliers, project developers, operators, serv-ices companies, planning offices, consultancy firms, as well as financing institutions. The Regional Reports are both meant for those who are already active in the assessed RE markets, but also for those exploring new markets for their business activities. Of course, the publication also serves as a data-base with country-specific insights into the assessed African and Central Asian regions for interested actors from the pub-lic and civil sector.
The geographical scope of this publication is twofold: the Regional Reports on Renewable Energies focus on West Africa and East Africa which are mainly represented by develop-ing countries and economies, and on Central Asia as a re-gion predominantly characterized by countries in transition. All of these regions are promising markets for the RE industry and for potential investors as they offer remarkable, but still largely untapped RE potentials. Although market conditions which spur the promising RE potentials still need to be im-proved in almost all of the assessed countries, positive trends for the promotion and deployment of RE can be observed in many cases. Even in those countries, where the policy level still needs to be convinced of RE, political reformers more and more commit to take action for RE on the rise.
Deliverables The Regional Reports on Renewable Energies showcase com-prehensive, but still selective information on the specific characteristics of the energy sectors of the 30 assessed coun-tries – 17 in West Africa, 5 in East Africa and 8 in Central Asia.Key facts and figures on these energy markets and their RE potential is given in the executive summary of each regional report.Each country analysis comprises an introduction to the socio-economic, geographical and political background of the country. It also includes an overview on the national energy sectors, including figures on power generation capacities, energy con-sumption and price levels as well as information on relevant market structures. This is followed by a presentation of the respective energy policy framework conditions. The chapter on the status quo of RE presents data on country-specific techni-cal and economic RE potentials, as well as and on current RE investment projects and possible RE business opportunities. In addition, the report gives information on market challenges and risks. A snapshot of the relevant actors of the energy sec-tor (private, as well as public, civil and scientific) is also in-cluded and serves as a source for identifying potential (busi-ness) partners for RE projects. Finally, each country analysis includes a bibliography and an annex containing additional graphs and figures on RE sources and technologies.

BENIN, BURKINA FASO, CAPE VERDE, CAMEROON, COTÊ D’IVOIRE, GAMBIA, GHANA, GUINEA
GUINEA BISSAU, LIBERIA, MALI, MAURITANIA, NIGER, NIGERIA, SENEGAL, SIERRA LEONE, TOGO
Renewable Energies in West Africa 2
The presented regional reports series is part of the Energy-policy Framework Papers of the “Energy and Transport” sec-tion of Deutsche Gesellschaft für Technische Zusammenarbeit (gtz) GmbH.
The Regional Reports are also available for free of charge download on the GTZ website:http://www.gtz.de > Themes > Sustainable Infrastructure > Energy >
Renewable Energy > Further information > Downloads; or http://www.gtz.de/de/themen/umwelt-infrastruktur/energie/4552.htm
The editorial team – Eschborn, December 2009
AcknowledgementsThe editorial team – also on behalf of the Federal Ministry for Economic Cooperation and Development (BMZ) – would like to thank all contributors, in particular all authors and coordinators (especially Anton Hofer of WIP, Rafael Wiese of PSE AG and Dr. Klaus Jorde of Entec AG) who have contrib-uted to this publication by sharing their valuable insights and experiences.
Special thanks also to Rolf-Peter Owsianowski for his ef-forts to identify appropriate local experts as authoring con-tributors, to Barbara Meder for editing of the reports and to “die Basis – Kommunikation. Ideenwerk. Design.” for the design of the publication.

CONTENTS REGIONAL REPORT WESTAFRIKA
Renewable Energies in West Africa 3
REGIONALREPORT SUMMARY 4
BENIN 9
BURKINA FASO 24
CAMEROON 38
CAPE VERDE 52
COTÊ D’IVOIRE 62
GAMBIA 76
GHANA 87
GUINEA 103
GUINEA BISSAU 118
LIBERIA 128
MALI 144
MAURITANIA 164
NIGER 176
NIGERIA 192
SENEGAL 210
SIERRA LEONE 211
TOGO 230
NOTE:Main references/indications of sources are provided in the respective country chapters and not in this summary of the country chapters.
CONTENTS

BENIN, BURKINA FASO, CAPE VERDE, CAMEROON, COTÊ D’IVOIRE, GAMBIA, GHANA, GUINEA
GUINEA BISSAU, LIBERIA, MALI, MAURITANIA, NIGER, NIGERIA, SENEGAL, SIERRA LEONE, TOGO
Renewable Energies in West Africa 4
Author of the Regional Report Summary Anton Hofer (MSE, Dipl.-Ing. /FH, M. A.)Wip-Renewable Energies www.wip-munich.deMunich, Germany
REGIONAL REPORT SUMMARY –
BASED ON THE 17 COUNTRY CHAPTERS
BENIN, BURKINA FASO, CAPE VERDE, CAMEROON, COTÊ D’IVOIRE, GAMBIA, GHANA, GUINEA, GUINEA BISSAU,LIBERIA, MALI, MAURITANIA, NIGER, NIGERIA, SENEGAL, SIERRA LEONE, TOGO

BENIN, BURKINA FASO, CAPE VERDE, CAMEROON, COTÊ D’IVOIRE, GAMBIA, GHANA, GUINEA
GUINEA BISSAU, LIBERIA, MALI, MAURITANIA, NIGER, NIGERIA, SENEGAL, SIERRA LEONE, TOGO
5
ACRONYMS AND ABBREVIATIONS
REGIONAL REPORT SUMMARY
ECOWAS ECONOMIC COMMUNITY OF WEST AFRICAN STATES (COMMUNAUTÉ ÉCONOMIQUE DES ÉTATS DE L‘AFRIQUE DE L‘OUEST – CEDEAO)
EBID ECOWAS BANK FOR INVESTMENT AND DEVELOPMENT GDP GROSS DOMESTIC PRODUCT USD UNITED STATES DOLLAR RE RENEWABLE ENERGIES WAPP WEST AFRICAN POWER POOL CHP COMBINED HEAT AND POWER ERC ENERGY REGIONAL CENTER EE ENERGY EFFICIENCY UNIDO UNITED NATIONS INDUSTRIAL DEVELOPMENT ORGANIZATION GEF GLOBAL ENVIRONMENTAL FACILITY
MEASUREMENTS
KWH KILOWATT HOUR KM KILOMETER M² SQUARE KILOMETER MW MEGAWATT HOUR
Renewable Energies in West Africa
WEST AFRICA SUMMARY

BENIN, BURKINA FASO, CAPE VERDE, CAMEROON, COTÊ D’IVOIRE, GAMBIA, GHANA, GUINEA
GUINEA BISSAU, LIBERIA, MALI, MAURITANIA, NIGER, NIGERIA, SENEGAL, SIERRA LEONE, TOGO
6
1 INTRODUCTION TO THE REGION OF THE ECONOMIC COMMUNITY OF WEST AFRICAN STATES (ECOWAS)
1.1 GENERAL OVERVIEWThe Economic Community of West African States (ECOWAS or in French: CEDEAO)1 is a regional alliance of fifteen countries2 established in 1975. As defined in Article 3 of the ECOWAS Treaty3, the overall goal of the community is to promote co-operation and integration in order to establish an economic union in West Africa. The union intends to raise the living standards of its inhabitants, to maintain and enhance eco-nomic stability, to foster relations among the member states and to contribute to the progress and development of the African continent.
In order to achieve these aims, ECOWAS shall, by stages, ensure both the harmonization and coordination of all national policies and the promotion of integration pro-grams, projects and activities focusing on various sectors (especially food, agriculture and natural resources, industry, transport and communications, environment trade, finance, ta-xation, economic reform, science, technology, legal matters and energy). Moreover, ECOWAS aims at the establishment of a common market with a total liberalization of trade between its member states. Structure-wise, the Economic Community of West African States consists of four major institutions, namely:
The Commission (formerly “ECOWAS Secretariat”) and the ECOWAS Bank for Investment and Development (formerly “Fund for Cooperation, Compensation and Development”) are the two central institutions to support the implementation of programs and development projects in ECOWAS member states.
1.2 GEOGRAPHIC AND ECONOMIC CONDITIONS OF THE ECOWAS REGION
According to official figures issued by ECOWAS, the current population is estimated at 220 million inhabitants, which amounts to roughly 40 % of the total population of Sub-Saharan Africa. It is estimated that by 2015, about 325 mil-lion people will live in the ECOWAS region. The area of the ECOWAS territory is 6.1 million km². The Gross Domestic Product (GDP) of ECOWAS reaches a total of 106.7 billion USD.
2 ENERGY MARKET OF THE WEST AFRICAN COMMUNITY REGION
2.1 OVERVIEW OF ENERGY SITUATION AND RENEWABLE ENERGY POTENTIAL
Currently, the ECOWAS region suffers from a huge demand/supply gap (more than 40 %) in modern energy services. About 64 % of the total energy supply are covered by ther-mal power plants, 31 % are generated with Hydro Power, 5 % come from imports and other energy resources such as Renewable Energies (RE). With a total contribution of 80 %, traditional biomass is currently a vital part of the primary energy consumption within ECOWAS. Moreover, the region is strongly dependent on fossil fuels. Less than 10 % of the ru-ral population have access to electricity and modern energy services. Therefore it is necessary to utilize local and RE sources in order to enhance the energy situation within the ECOWAS region.
The hydroelectricity potential of the ECOWAS region is estimated at 25,000 MW. Up to now, only 16 % are deve-loped and utilized. With regard to the utilization of wind en-ergy, considerable wind speeds are encountered along the coasts and the desert zones. The average solar irradiation in West Africa offers a significant solar energy potential of 4–6 kWh/m²/day.
2.2 EXISTING IMPEDIMENTS AND DEFICIENCIESThe development of existing RE sources is currently neither limited by missing local availability nor by lack of technical feasibility. The illustrated potentials for sustainable RE sup-plies, however, are rather handicapped by a variety of obsta-cles and deficiencies in the ECOWAS region:
fossil fuels, lack of financing facilities)
technical and administrative area)
& equipment (expensive imports)
rural areas and peri-urban areas)
and feed-in-tariffs)
the energy supply structure-
ergy sector and energy markets
Renewable Energies in West Africa
1 A PRESENTATION WITH MORE DETAILED INFORMATION ON ECOWAS IS AVAILABLE ON
THE ECOWAS WEBSITE: WWW.COMM.ECOWAS.INT/SEC/EN/PPS/ECOWAS.PPS
2 BENIN, BURKINA FASO, CAPE VERDE, CÔTE D‘IVOIRE, GAMBIA, GHANA, GUINEA, GUINEA
BISSAU, LIBERIA, MALI, NIGER, NIGERIA, SENEGAL, SIERRA LEONE, TOGO. ALTHOUGH
MAURITANIA IS NO LONGER A MEMBER STATE OF THE ECOWAS (MAURITANIA LEFT THE
COMMUNITY IN 2001), IT IS ALSO CONSIDERED AS COUNTRY CHAPTER OF THE REPORT
“RENEWABLE ENERGIES IN WEST AFRICA – REGIONAL REPORT AND MARKET ANALYSIS”.
3 ECOWAS, AS OF 2007
WEST AFRICA SUMMARY

BENIN, BURKINA FASO, CAPE VERDE, CAMEROON, COTÊ D’IVOIRE, GAMBIA, GHANA, GUINEA
GUINEA BISSAU, LIBERIA, MALI, MAURITANIA, NIGER, NIGERIA, SENEGAL, SIERRA LEONE, TOGO
7
3 (RENEWABLE) ENERGY FRAMEWORK CONDITIONS AND POLICY INITIATIVES
Faced with significant deficiencies in the energy supply sec-tor, the ECOWAS member states have adopted ambitious re-gional policies, committing themselves to harmonize national energy legislation, to increase the autonomy of energy supply and to significantly raise the level of access to modern en-ergy services. In order to achieve these goals, various policy initiatives and programs have been developed in the ECOWAS region.
The Common Energy Policy covers the introduction of an integrated energy planning system, the promotion of RE and the speeding up of the connection of interlinked systems for electricity grids in cooperation with ECOWAS.
The ECOWAS Energy Protocol4 is a legal text forma-lizing the juridical framework of enterprises in the energy sector. It was designed as a guarantee for foreign direct in-vestments in the energy sector. The adoption and ratification of this convention is an eligibility criterion for access to the World Bank Facility for the West African Power Pool (WAPP).
The White Paper5 aims to provide energy access to at least half of the population living in rural and peri-urban areas by 2015. It has formulated three major specific objec-tives: (i) the reinforcement of regional integration, (ii) the promotion of coherent, institutional and political frameworks for improved access to energy services in the ECOWAS region and (iii) the development of coherent energy programs with focus on poverty reduction. Within its specific objectives, the White Paper focuses on capacity building of private and pu-blic actors, the enhanced availability of soft loans, grants and private sector funds for energy services in rural or peri-urban areas, the improved exchange, promotion and dissemination of sub-regional experiences in view of energy services and the promotion of local energy production and energy services.
The West African Power Pool (WAPP)6 aims at the in-tegration of national electricity grids in a number of West African countries (i. e. Nigeria, Benin, Togo, Ghana, Côte d’Ivoire, Niger, Burkina Faso and Mali) by building up more than 5,600 km of interconnection lines. The medium- to long-term goal is to guarantee the citizens of ECOWAS member states a stable and reliable electricity supply at affordable costs. In order to reach this goal, the framework conditions of national energy markets within the ECOWAS region need to be harmonized.
The West African Gas Pipeline aims to strengthen the energy supply through a gas pipeline system. Based on na-tural gas imports from Nigeria, it is planned that Combined Heat and Power (CHP) plants in Benin, Ghana and Togo (to-tal capacity of 3,000 MW) will be supplied via a 678 km gas pipeline network.
4 OUTLOOK AND ACTIVITIES FOR RENEWABLE ENERGIES
Based on the White Paper’s goal for improving energy access in West Africa, the ECOWAS will shortly establish a West African ECOWAS Regional Center for Renewable Energy and Energy Efficiency (ERC) hosted by Cape Verde. The specific goal of the center is to provide a platform for leading and co-ordinating the implementation of the ECOWAS Regional White Paper on Energy Access focusing on RE and also on Energy Efficiency (EE). This will be facilitated through the center’s four major activities: funds mobilization, policy and capacity development, knowledge management and communications and the demonstration of RE/EE technologies.
One of the major financing and promotion programs is the recently initiated Energy Program for West Africa issued by the United Nations Industrial Development Organization (UNIDO) and the Global Environmental Facility (GEF) which comprises – besides the 15 ECOWAS countries – also Mauritania, Chad and Burundi. The program with an overall project budget of 46 million USD focuses on three main ob-jectives: (i) taking a programmatic approach in promoting RE and EE projects at the national level in the countries of the region, (ii) scaling up access based on RE and promoting EE measures in the industry, households and the public sector and (iii) creating markets to catalyze private sector invest-ments. Among the main program components are demons-tration projects, support for policy or regulatory framework, capacity building and RE based mini-grids for productive uses in rural areas.
A more detailed insight into the individual country RE market situations in the ECOWAS region is provided by the 16 analyses7 of this regional report on RE in West Africa.
Renewable Energies in West Africa
4 ECOWAS, AS OF 2003
5 ECOWAS/UEMOA, AS OF 2005
6 SEE WEBSITE OF THE WAPP: WWW.ECOWAPP.ORG
7 THE REGIONAL REPORT WEST AFRICA DOES NOT INCLUDE A SEPARATE COUNTRY
CHAPTER FOR THE ECOWAS COUNTRY OF SENEGAL, AS THE KEY INFORMATION ON THE
SENEGALESE RE MARKET IS ALREADY AVAILABLE BY TWO OTHER STUDIES EDITED AND
COMPILED BY GTZ ON BEHALF OF THE GERMAN GOVERNMENT. REFERENCE: GTZ/TERNA
(2004): ENERGY POLICY FRAMEWORK CONDITIONS FOR ELECTRICITY MARKETS AND RE-
NEWABLE ENERGIES – 21 COUNTRY ANALYSES, PART SENEGAL (IN ENGLISH) => WWW.
GTZ.DE/DE/DOKUMENTE/DE-PROJEKTERSCHLIESSUNG-SENEGAL-LAENDERREPORT.
PDF <WWW.GTZ.DE/DE/DOKUMENTE/DE-PROJEKTERSCHLIESSUNG-SENEGAL-LAENDER-
REPORT.PDF>
WEST AFRICA SUMMARY

BENIN, BURKINA FASO, CAPE VERDE, CAMEROON, COTÊ D’IVOIRE, GAMBIA, GHANA, GUINEA
GUINEA BISSAU, LIBERIA, MALI, MAURITANIA, NIGER, NIGERIA, SENEGAL, SIERRA LEONE, TOGO
5 BIBLIOGRAPHY
int/sec/index.php?id=treaty&lang=en)
(www.comm.ecowas.int/sec/en/protocoles/WA_EC_Protocol_English-_DEFINITIF.pdf)
policy (www.gm.undp.org/Reports/ECOWAS%20energy%20white%20paper.pdf)
8Renewable Energies in West Africa
WEST AFRICA SUMMARY

COUNTRY CHAPTER:
BENIN Author of Country Chapter Daniel Finagnon Assogba (Dipl.-Ing.)
Coordination and Review of the Country ChapterAnton Hofer (MSE, Dipl.-Ing./FH, M.A.)WIP-Renewable Energies www.wip-munich.deMunich, Germany
Editor Deutsche Gesellschaft für Technische Zusammenarbeit (GTZ) GmbHDepartment Water, Energy, TransportDag-Hammarskjöld-Weg 1-565760 Eschborn, Germanywww.gtz.de
On behalf of Federal Ministry for Economic Cooperation and Development (BMZ)
Editorial staffDiana KraftTel: +49 (0)6196 79 4101Fax: +49 (0)6196 79 80 4101Email: [email protected]
Renewable Energies in West Africa 9

CONTENTS BENIN
ACRONYMS, ABBREVIATIONS AND MEASUREMENTS 11
SUMMARY 13
1 COUNTRY INTRODUCTION 14 1.1 Geography and Climatic Conditions 14 1.2 Political, Economic and Socio-economic Conditions 14
2 ENERGY MARKET IN BENIN 15 2.1 Overview of the Energy Situation 15 2.2 Energy Capacities, Production, Consumption and Prices 15 2.3 Market Actors and Regulation Structures 15
3 POLICY FRAMEWORK FOR RENEWABLE ENERGIES 18 3.1 Policies, Strategies and Programs for Renewable Energy Promotion 18 3.2 Regulations, Incentives and Legislative Framework Conditions 18
4 STATUS AND POTENTIAL FOR RENEWABLE ENERGIES 19 4.1 Biomass/Biogas 19 4.2 Solar Energy 19 4.3 Wind Power 19 4.4 Hydro Power 19
5 MARKET RISKS AND BARRIERS 19
6 RENEWABLE ENERGY BUSINESS INFORMATION AND CONTACTS 20
7 BIBLIOGRAPHY 21
8 ANNEX 22
Renewable Energies in West Africa 10CONTENTS
BENIN

ACRONYMS AND ABBREVIATIONS BENIN
ABERME Agence Béninoise d‘Electrification Rurale et de la Maîtrise
(Benin Agency for Rural Electrification and Energy Control)
ACP Africa, Caribbean, Pacific
AFD Agence Française de Développement (French Development Agency)
AU African Union
BIC Bénéfices Industriels et Commerciaux (tax on industrial and trade benefits)
BOAD Banque Ouest Africaine de Développement (West African Development Bank)
CBRST Centre Béninois de la Recherche Scientifique et Technique
(Beninese Scientific and Technical Research Center)
CCIB Chambre de Commerce et d‘Industrie du Bénin (Beninese Chamber of Trade and Industry)
CEB Communauté Electrique du Bénin (Beninese Electricity Community)
CENAPI Centre National de la Propriété Industrielle (National Intellectual Property Center)
CFE Centre de Formalités des Entreprises (Enterprises Formality Center)
CIA Central Intelligence Agency
DGE Direction Générale de l‘Energie (General Directorate of Energy)
ECOWAS Economic Community Of West African States
EDF Electricité de France (Electricity of France)
EU European Union
GDP Gross Domestic Product
HDI Human Development Index
IDA International Development Association
IEPF Institut de l‘Énergie et de l‘Environnement de la Francophonie
(French Speaking Countries Environment and Energy Institute)
IMF International Monetary Fund
INSAE Institut National de Statistique et de l‘Analyse Economique du Bénin
(National Institute of Statistics and Economy Analysis)
IPC Investments Promotion Center
IPP Independent Power Producer
IUT Institut Universitaire de Technologie (University Technology Institute)
LIFAD Laboratoire d‘Ingénierie, de Formation et d‘Assistance en Développement Local
(Laboratory of Engineering, Training and
Local Development Association)
LPG Liquefied Petroleum Gas
NGO Non-Governmental Organization
MIC Ministère de l’Industrie et du Commerce (Ministry of Industry and Trade)
MEE Ministère de l‘Energie et L’Eau (Ministry of Energy and Water)
NDF Nordic Development Fund
OHADA Organisation pour l‘Harmonisation en Afrique du Droit des Affaires
(Organisation for the Harmonization of Business Law in Africa)
ONAB Office National du Bois (National Wood Ressources Office)
PFSE Projet de Fourniture de Services d‘Energie (Energy Services Provided Project)
PV Photovoltaic
RE Renewable Energy
RPTES Review of Politics and Traditional Energy Sector
SBEE Société Béninoise d’Energie Electrique (Beninese Electric Energy Company)
S.I. e. Système d’Information de l’Energie du Bénin (Energy Information System Benin)
SONACOP Société Nationale de Commercialisation des Produits Pétroliers (National Oil Company)
SUCOBE Sucrerie Complant du Bénin
TBE Table of Board of Energy
UAC Université d‘Abomey-Calavi (Abomey-Calavi University)
UNDP United Nations Development Programme
USD United States Dollar
VAT Value Added Tax
WAEMU West African Economic and Monetary Union
Renewable Energies in West Africa 11ACRONYMS, ABBREVIATIONS AND MEASUREMENTS
BENIN

Renewable Energies in West Africa 12MEASUREMENTS
BENIN
MEASUREMENTS
GWh gigawatt hour (1 GWh = 1,000,000 kilowatt hours (kWh)) km² square kilometres MW megawatt (1 MW = 1,000 kW) m³ cubic meter mm millimeters toe tons of oil equivalent kV kilovolt m/s meters per second € Euro

SUMMARY
The Country Study of Benin is to provide an overview of the country’s energy market and to support decision-making for private investments for the Renewable Energy (RE) sector in Benin. The study is structured as follows:
Chapter one provides Background Information on Benin. This includes an overview of geographical and climatic condi-tions, as well as the most important facts in view of political, economic andsocio-economic conditions of Benin.
Chapter two summarizes facts and figures of Benin’s Energy Market including stakeholders and market actors involved as well as sector related regulations.
Chapter three presents the currently existing Political Frame-work for Renewable Energies in Benin. This includes an over-view of support mechanisms for photovoltaic (PV) as well as existing regulations, incentives and legislative framework con-ditions concerning other RE technologies.
Chapter four provides a brief overview of the Status Quo and Potential for Renewable Energies in Benin.
Chapter five summarizes the existing and potential Market Risks and Barriers in general with focus on RE.
Chapter six presents a compilation of the most relevant Renew-able Energy Business Information and Contacts of Benin.
Renewable Energies in West AfricaSUMMARY 13
BENIN
1 COUNTRY INTRODUCTION
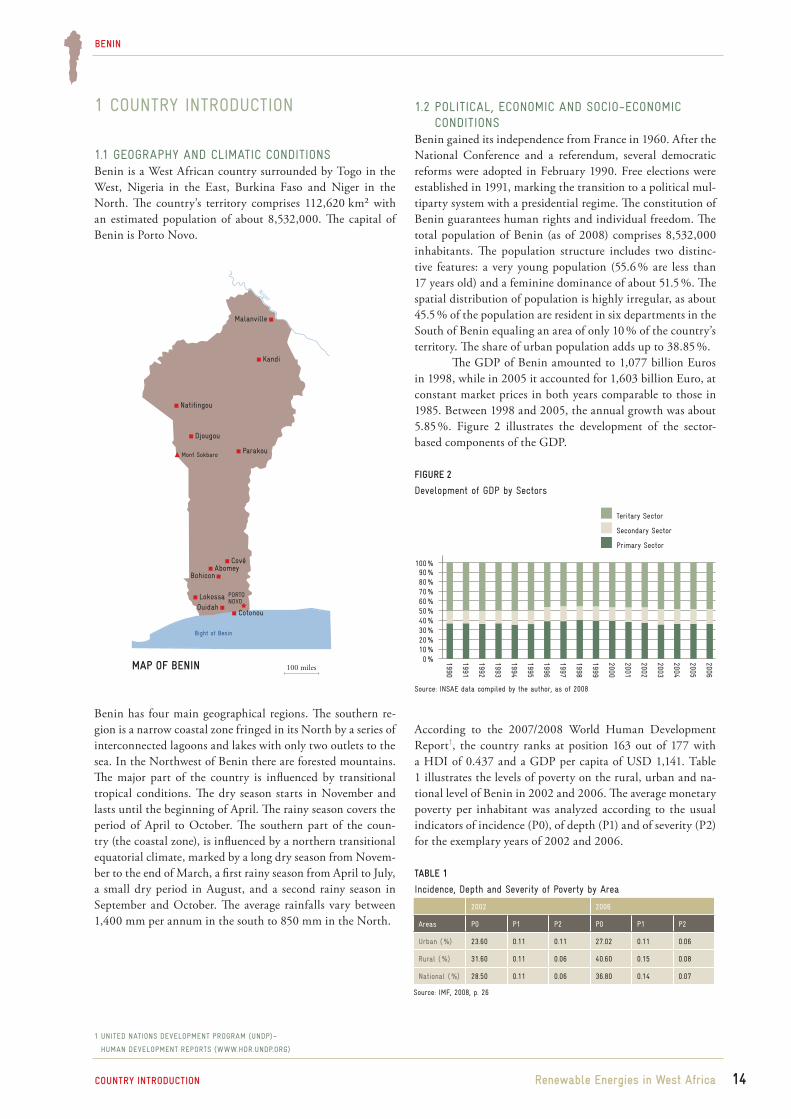
1.1 GEOGRAPHY AND CLIMATIC CONDITIONSBenin is a West African country surrounded by Togo in the West, Nigeria in the East, Burkina Faso and Niger in the North. The country’s territory comprises 112,620 km² with an estimated population of about 8,532,000. The capital of Benin is Porto Novo.
Benin has four main geographical regions. The southern re-gion is a narrow coastal zone fringed in its North by a series of interconnected lagoons and lakes with only two outlets to the sea. In the Northwest of Benin there are forested mountains. The major part of the country is influenced by transitional tropical conditions. The dry season starts in November and lasts until the beginning of April. The rainy season covers the period of April to October. The southern part of the coun-try (the coastal zone), is influenced by a northern transitional equatorial climate, marked by a long dry season from Novem-ber to the end of March, a first rainy season from April to July, a small dry period in August, and a second rainy season in September and October. The average rainfalls vary between 1,400 mm per annum in the south to 850 mm in the North.
Renewable Energies in West Africa 14
BENIN
COUNTRY INTRODUCTION
1.2 POLITICAL, ECONOMIC AND SOCIO-ECONOMIC CONDITIONS
Benin gained its independence from France in 1960. After the National Conference and a referendum, several democratic reforms were adopted in February 1990. Free elections were established in 1991, marking the transition to a political mul-tiparty system with a presidential regime. The constitution of Benin guarantees human rights and individual freedom. The total population of Benin (as of 2008) comprises 8,532,000 inhabitants. The population structure includes two distinc-tive features: a very young population (55.6 % are less than 17 years old) and a feminine dominance of about 51.5 %. The spatial distribution of population is highly irregular, as about 45.5 % of the population are resident in six departments in the South of Benin equaling an area of only 10 % of the country’s territory. The share of urban population adds up to 38.85 %.
The GDP of Benin amounted to 1,077 billion Euros in 1998, while in 2005 it accounted for 1,603 billion Euro, at constant market prices in both years comparable to those in 1985. Between 1998 and 2005, the annual growth was about 5.85 %. Figure 2 illustrates the development of the sector-based components of the GDP.
According to the 2007/2008 World Human Development Report1, the country ranks at position 163 out of 177 with a HDI of 0.437 and a GDP per capita of USD 1,141. Table 1 illustrates the levels of poverty on the rural, urban and na-tional level of Benin in 2002 and 2006. The average monetary poverty per inhabitant was analyzed according to the usual indicators of incidence (P0), of depth (P1) and of severity (P2) for the exemplary years of 2002 and 2006.
Natitingou
Djougou
Malanville
Kandi
Parakou
CovéAbomey
LokossaOuidah
Mont Sokbaro
Niger
PORTO NOVO
Bohicon
Cotonou
Bight of Benin
MAP OF BENIN
FIGURE 2
Development of GDP by Sectors
1 UNITED NATIONS DEVELOPMENT PROGRAM (UNDP)–
HUMAN DEVELOPMENT REPORTS (WWW.HDR.UNDP.ORG)
TABLE 1
Incidence, Depth and Severity of Poverty by Area
2002 2006
Areas P0 P1 P2 P0 P1 P2
Urban ( %) 23.60 0.11 0.11 27.02 0.11 0.06
Rural ( %) 31.60 0.11 0.06 40.60 0.15 0.08
National ( %) 28.50 0.11 0.06 36.80 0.14 0.07
20 %30 %40 %50 %60 %70 %80 %90 %
1991
1992
1993
1994
1995
1996
2003
2004
2005
100 %
0 % 2006
2002
2001
2000
1999
1998
1997
1990
10 %
Primary Sector
Teritary Sector
Secondary Sector
Source: INSAE data compiled by the author, as of 2008
Source: IMF, 2008, p. 26
100 miles

2 ENERGY MARKET IN BENIN
2.1 OVERVIEW OF THE ENERGY SITUATIONBenin is characterized by a predominance of biomass energy in the overall energy mix.
The major part of the total energy consumption can be al-located to households, with a total of approximately 63.9 %. The transport sector accounts for 23.2 %, the service sector for 10.6 % and the barely developed industry sector of Benin con-sumes about 2.3 %. Figure 3 visualizes the energy consump-tion per sector, while Figure 4 presents the detailed consump-tion of the industry sector.
Renewable Energies in West Africa
BENIN
COUNTRY INTRODUCTION
2.2 ENERGY CAPACITIES, PRODUCTION, CONSUMPTION AND PRICES
Electricity SectorThe electricity sector of Benin has a total production capac-ity of 97,484 MW; only 60 MW, however, are continuously available. The existing shortage in energy production capac-ity results in an insecurity of power supply (mainly caused by a lack of production capacities) and has forced industrial enterprises to set up stand-by power generators of their own. In 2007, the total power output of the National Power Utility was estimated at 180 GWh. The electricity sector of Benin is state-owned and managed by the Benin National Power Utility (SBEE), the exclusive owner of thermal power sta-tions and the national electricity network. Figure 5 shows the national electricity production between 1996 and 2005; Figure 6 presents the electricity consumption by sector.
TABLE 2
Energy Mix of Benin
BIOMASS PETROLEUM PRODUCTS
ELECTRICITY
Consumption (toe) 1,338,714 866,540 50,628
Contribution (%) 59.40 38.40 2.20
Source: S.I. e. Benin, as of 2006
15
FIGURE 4
Energy Consumption of the Industry Sector
Electricity
Diesel
Fuel Oil
Total Energy Consumption
10000
70000
60000
50000
40000
30000
20000
01996 1997 1998 1999 2000 2001 2002 2003 2004 2005
Source: S.I. e. Benin with data from DGE, as of 2006
FIGURE 5
National Electricity Production (MWh)
1996 1997 1998 1999 2000 2001 2002 2003 2004 20050
20000
40000
60000
80000
100000
120000
Source: S.I. e. Benin with data from DGE, as of 2006
0
200
400
600
800
1000
1200
1400
1600
Households Transportation Services Industry
FIGURE 3
Energy Consumption per Sector (toe)
Source: S.I. e. Benin with data from DGE, as of 2006
Industry
Households
Services
Total
FIGURE 6
Electricity Consumption by Sector (MWh)
10000
60000
50000
40000
30000
20000
01996 1997 1998 1999 2000 2001 2002 2003 2004 2005
Source: S.I. e. Benin, as of 2006

Renewable Energies in West Africa 16
BENIN
COUNTRY INTRODUCTION
1 LAW 027-2002/AN OF 9 OCTOBER 2002, REFERRING TO THE AUTHORIZATION OF
BURKINA FASO’S ACCESSION TO THE KYOTOPROTOCOL
(JOURNAL OFFICIEL NO. 47 DU 21 OCTOBRE 2002)
Since its foundation in 1973, SBEE has been changing electric-ity tariffs four times. The tariff structure, however, remained the same. The electricity tariffs are appointed by the Govern-ment and are standardized throughout Benin. The detailed electricity prices are summarised in table 3.
Petroleum SectorBenin has no national oil refinery. Therefore, all petroleum products are imported to Benin via licensed (the national oil company Société Nationale de Commercialisation des Pro-duits Pétroliers – SONACOP) and unlicensed (informal mar-ket) importers. As the majority of imports are carried out by unlicensed importers, the respective numbers need to be esti-mated. The overall amount of imported petroleum products reached 837,000 tons in 2005. Table 4 indicates figures of the national petroleum product consumption of 2005.
TABLE 5
Prices of Petroleum Products
PRODUCT PRICE
Gasoline 0.533 Euro/litre
Kerosene 0.533 Euro/litre
Diesel 0.572 Euro/litre
LPG 0.640 Euro/kg
Source: Ministry of Industry and Trade, as of February 2009
TABLE 4
National Petroleum Product Consumption in 2005 (tons)
FUEL-OIL DIESEL KEROSENE GASOLINE BUTANE
40,526 118,190 294,536 376,229 7,609
Source: S.I. e. Benin with data from DGE, as of 2006
TABLE 3
Electricity Tariffs for Different Types of Use
TYPE OF USE
SOCIAL SLICE SLICE 1 SLICE 2
Quantities invoiced
Price/ kWh Quantities invoiced
Price/ kWh Quantities invoiced
Price/ kWh
Domestic use(light, air-condition etc.)
0–20 kWh 0,08536 € 21–250 kWh 0,12957 € > 251 kWh 0,14482 €
Professional use (shops, restaurants, hotels etc.)
total consumption 0,134.15 € total consumption 0,134146 € total consumption 0,13415 €
Source: SBEE, as of 2008
Benin is highly dependent on foreign imports of petroleum products. In 2005, these imports accounted for 2.2 % of the country’s GDP (about 33.54 million €). Benin has several crude oil reserves that are officially subdivided in 17 blocks. Seven blocks have already been granted to companies who are currently actively exploring existing resources. From 1982 to 1998, Benin has exploited a small offshore oil field. The cumu-lated production is an estimated 22 million barrels of crude oil. Potential reserves are assessed at more than 5 billion bar-rels of crude oil and more than 91 billion m³ of natural gas. Therefore, several multinational oil companies are investigat-ing in the availability and sites of local reserves.
Benin’s tax policy allows selling electricity and petro-leum products at the same price all over the country. Prices are officially fixed by the Government and maintained by cooperating with licensed distributors. The current prices of petroleum products are indicated in table 5.

Renewable Energies in West Africa 17
BENIN
COUNTRY INTRODUCTION
2 DATA OF THE AFRICAN CASHEW ALLIANCE: WWW.AFRICANCASHEWALLIANCE.ORG.
Biomass SectorThe potential resources of wood energy were surveyed in 1999. The potential of wood energy includes contributions generated through National Reforestation Campaigns as well as alloca-tions of the National Wood Resources Office. The objective of the dedicated firewood project is to increase the supply of wood energy on the market by enlarging plantations in the South of Benin. In this respect, the involvement of the Na-tional Wood Resources Office also contributes to the reduc-tion of deforestation in the natural forests. Table 6 presents the current and future potential of traditional wood energy, while related prices (as of 2005) are indicated in table 7.
Besides traditional wood energy, a substantial poten-tial of about 5 million tons is identified for agricultural resi-dues. With regard to potential resources for biofuels, there are currently only few production capacities for ethanol. For example, Benin sugar plant “Sucrerie Complant du Bénin“ (SUCOBE) produces ethanol at an output capacity of 40,000 tons of sugar and 4,200 m³ of ethanol per year. Furthermore, the YUEKEN Benin International plant has an output of 3,000 m³ of ethanol per year deriving from cassava. Due to the missing distribution infrastructure however, this amount is currently not used for energy or transport purposes.
Currently, Benin is characterized by the prepon-derance of traditional biomass energy. Future plans aim at modern biomass energy utilization like biogas, biofuels and various residues. In the following, a more detailed overview is presented. BiogasThe utilization of biogas is currently only planned for the large-scale level. Pilot production units for biogas from ani-mal residues are planned at former state-owned farms with financing from private investors. Several pilot electricity pro-duction units and three bigger production units (mainly using household residues) will be gradually implemented at 5 MW per time in 2011, 2018 and 2024.
BiofuelsConsidering the assumed demand for diesel and the potential substitution with biodiesel, this development is expected to generate a market for the future. Various vegetable oils like pourghère oil, castor oil, palm oil, cotton, soy and peanut oil could be used for the production of biodiesel. In order to develop a market for biofuels, a regulatory, institutional and legal framework is needed to support the promotion and de-velopment of the sector.
In Benin there are few plants that can process vegetable oil to transport fuels. Two plants with a combined capacity of 210,000 tons are located in Bohicon. Furthermore, there is a palm oil plant in Hinvi. The capacities of these plants are not fully exploited yet (currently just about 30 % are being used).
A utilization of ethanol at an admixture rate of 15 % will create a market of about 33,000,000 liters per annum. Regulatory, institutional and legal provisions need to be im-plemented in order to support the creation of industrial etha-nol plants in Benin. A recent survey identified a substantial potential of 46.5 million liters in 2011, 116 million liters in 2015 and 229 million liters in 2020. If the marketplace of the European Union is taken into account, these figures are even higher.
Wood and Agricultural ResiduesIn Benin, several wood processing plants produce waste and residues that could be used for energy production. The Na-tional Wood Resources Office (ONAB) plant in Bohicon, for example, creates about 14,000 m³ waste and residues per year. Currently, these materials are used by households for cooking. They could, however, also contribute to the production of elec-tricity from biomass. With regard to agricultural residues, it is planned to install power production units (5 MW by 2010, 30 MW by 2020) in cotton production areas of Benin.
The cashew nut industry in Benin is growing fast (average growth of 40–50 % per annum during the past 15 years)2 and is currently the second largest source of agricul-tural exports (cotton being the most important). The cashew industry offers many attractive features, especially for the uti-lization of residues for energy production. Up to now, how-ever, the actual processing is still a marginal activity in Benin, with some 97 % of raw cashew being exported. Furthermore, promising by-products such as cashew apple and shells are not being exploited yet. Especially the development of the ethanol production from the apple of cashew nuts in the North Zou and Collines districts is a very promising opportunity for the future.
TABLE 6
Potential of Traditional Wood Energy
YEAR 1997 2002 2007 2012 2017 2022 2027
(tons/year) 6,719,469 6,554,064 6,392,754 6,235,436 6,082,012 5,932,386 5,786,462
Source: LIFAD Survey, as of 2005
WOOD CHARCOAL
0.034 Euro/kg 0.533 Euro/litre
TABLE 7
Medium Price of Traditional Wood EnergyPrices of Petroleum Products
Source: LIFAD Survey, as of 2005

Renewable Energies in West Africa 18
BENIN
COUNTRY INTRODUCTION
2.3 MARKET ACTORS AND REGULATION STRUCTURES
Electricity SectorThe Ministry of Energy and Water (Ministère de l‘Energie et l’Eau – MEE) is responsible for the overall electricity sec-tor and all related policies in this field. Furthermore, it is in charge of managing the Hydro Power potential as well as all matters related to alternative energy sources in Benin. Be-sides the Ministry of Energy and Water, three main public operators are involved. The Communauté Electrique du Bénin (CEB) is the state-owned international electricity company of Benin and Togo. CEB is fully in charge of the production, distribution and import of electricity in both countries and is therefore jointly owned and managed by Benin and Togo. Furthermore, CEB is responsible for the development of the electricity infrastructure of both partner countries. The Be-nin National Power Utility (SBEE) is largely involved in the overall electricity distribution within the national territory of Benin. SBEE is also responsible for the development and up-grade of the interconnection of the North Togo/North Benin networks. The Benin Agency for Rural Electrification and En-ergy Control (ABERME) was founded in 2004 and is respon-sible for the implementation of policies in the field of rural electrification. ABERME aims to implement a wide spectrum of energy efficiency measurements in Benin.
Petroleum SectorThe MEE controls and supervises the petroleum sector of Be-nin. It is the major regulatory institution and decides all mat-ters within this sector. Besides the Ministry of Energy and Water, several oil companies are involved in the petroleum sector of Benin. The national oil company SONACOP, to-gether with several licensed companies such as TOTAL BE-NIN, TEXACO BENIN S. A. and ORYX BENIN S. A. is in charge of import and distribution activities in Benin. Fur-thermore, several unlicensed importers and distributors have created an informal market for petroleum products. Decree No 95–139 of May 3rd 1995 relating to the means of import-ing and distributing oil products puts the accent on safety measures for the importing, storage and distribution of oil products and their derivatives. Only the State has authority over this activity. The authorities of Benin have just approved of the installation of private companies. Official distributors need a license issued by the Ministry of Industry and Trade (Ministère de l’Industrie et du Commerce – MIC) to conduct their business.
Biomass SectorThe Ministry of Environment and Nature Protection is in charge of the management of forest resources and environment problems. The corresponding regulatory framework is current-ly being updated and improved in order to promote biofuels for local and national transport as well as renewable bioenergy in Benin. In reality, however, the biomass sector of Benin is basically governed by producers and traders of firewood and charcoals, the National Wood Resources Office (ONAB) and several wood processing and service companies. Furthermore, a number of NGOs are operating in Benin, especially in the field of reforestation and the rational use of the wood energy.
3 POLICY FRAMEWORK FOR RENEWABLE ENERGIES
3.1 POLICIES, STRATEGIES AND PROGRAMS FOR RE-NEWABLE ENERGY PROMOTION
The existing policies for renewable energy aim to promote and develop the utilization of available RE resources in order to satisfy the demand of energy in remote and rural areas. The objective is to increase the national electricity production and to promote a significant contribution of RE to the overall energy supply of Benin. Therefore, the promotion of locally available RE resources will help to establish an energy supply with broad self-sufficiency. In particular energy from biomass will play a significant role in this process.
The strategy for an improved efficiency of wood energy utilization includes the eased access to cost-effective cooking stoves as well as the substitution of traditional, for example fossil fuel based methods with alternative energy resources. This is to significantly reduce the dependence on wood energy and to create regulated energy markets in the rural areas of Benin. The objective is to diversify the energy mix in order to meet the demand in a more sustainable way. Therefore, it is necessary to establish an adequate institutional, legal and regulatory framework that supports the development and implementation of RE. Although already defined in various policy and strategy documents of Benin, the promising sector RE does not always receive adequate and sufficient attention.
3.2 REGULATIONS, INCENTIVES AND LEGISLATIVE FRAMEWORK CONDITIONS
In order to solve the problem of insufficient energy supply, several national initiatives have been started in Benin. This includes the PV electrification of 38 villages by the Beninese Agency of Rural Electrification with funds from the Islamic Development Bank and the national budget of Benin. An-other initiative is the Energy Services Supply Project (PFSE) aiming to increase the access to modern and affordable energy services in urban and rural areas of Benin. Furthermore, the project is to reduce the deforestation, to promote renewable fuels and to diversify the overall energy supply of Benin. The project is financed by the International Development Associa-tion (IDA), the West African Development Bank (BOAD), the Nordic Development Fund (NDF), the Benin National Power Company (SBEE), the Benin Electric Community (CEB) and the Government of Benin.
Other initiatives are dealing with the implementation of new gas turbine power stations, the electrification of rural localities, the upgrading of existing Hydro Power plants, the implementation of PV installations and the utilization of mod-ern biomass energy. With regard to increased energy efficiency and the diversification of the energy supply, several dedicated policies and strategies are currently under development. In order to reduce the utilization of small diesel generators, the Government is going to implement a project to interconnect urban and rural areas via the national power grid. This grid expansion includes one power line (161 kV) from Ouake to Bembereke and one (63 kV) from Djougou to Natitingou.

Renewable Energies in West Africa 19
BENIN
COUNTRY INTRODUCTION
4 STATUS AND POTENTIAL FOR RENEWABLE ENERGIES
4.1 BIOMASS/BIOGASThe utilization of traditional biomass contributes significantly to the overall energy mix of Benin. On top of that, a signifi-cant potential of sustainable biomass resources is available for heat and electricity production. This includes residues from agricultural products as well as waste from agro-industries, food processing and households. These residues are estimated to be sufficient to produce about 1,500 GWh of electricity. In urban areas of Benin, substantial amounts of household refuse could be used for energy production. According to studies of the city of Cotonou, more than 700 tons of refuse would be available every day. The waste and residues from wood process-ing plants is identified as another potential source for electric-ity generation. Another significant potential lies in the cashew nut industry. Up to now, however, the actual processing is still a marginal activity in Benin. Especially energy relevant by-products such as cashew apple and shells are not utilized yet.
4.2 SOLAR ENERGYThe solar energy potential of Benin varies between 3.9 kWh/m² and 6.2 kWh/m², depending on the location. Table 8 presents selected PV installations in Benin.
4.3 WIND POWERAccording to the available data of the National Meteorologi-cal Office, the wind speed varies between 3 and 6 m/s. More detailed information is not available; therefore it is not pos-sible to give a complete overview of the existing potential.
4.4 HYDRO POWERBenin has a significant potential of Hydro Power that can be used for electricity production. A recent survey shows that the potential of the Oueme River is sufficient to install twenty sites with a total capacity of 760 MW and an annual output of more than 280 GWh. Moreover, approximately 80 other sites are equipped with small-scale hydro power installations for rural electrification.
5 MARKET RISKS AND BARRIERS
In spite of already implemented mechanisms that support the investment in the energy sector, there are still some major ob-stacles to be found in this sector. It is, for example, difficult to register for a purchase agreement as potential investors have to discuss their application with two state monopolists (CEB for the production and the SBEE for the distribution of energy).
There are also some risks in legal aspects. These are, however, not a major constraint for investment in this field. Outdated technology, the lack of technical knowledge and in-adequate finance are major barriers in the implementation of RE in Benin. Also, no incentive measures like exemption from taxes or other benefits are available for potential investors.
The high costs of RE equipment on the one hand and the low level prices for conventional energy on the other hand are not encouraging potential investors at all. Benin has sev-eral local experts in the field of RE mostly in technical depart-ments, universities and research centers. There is, however, a need for technical cooperation in the energy sector.The Government of Benin set up an Investment Facilitation Department in order to support cooperation and investment of the private sector and foreign investors. The Investment Promotion Center was established in order to assist investors in the setting-up of business, the identification of local part-ners and the correspondence with institutions. The Formali-ties Center of the Enterprises (CFE) supports investors during the foundation of an enterprise. Furthermore, several other departments are engaged to support the promotion of invest-ment in the energy sector. Benin is implementing structural and economical reforms in order to promote private invest-ment. Table 9 presents the results of the World Bank Ease of Doing Business Survey 2008 for Benin.
TABLE 8
PV Installations in Benin
Source: DGE and ABERME, as of 2002
TYPE OF INSTALLATION/FUNDING SCHEMENUMBER OF INSTALLATIONS
CAPACITY
PV units at villages, funded by Government 14 56 kW
PV units at villages, funded by Govern-ment & Islamic Development Bank
24 182 kW
PV unit at public health centres n.a. 50 kW
Domestic use n.a. 10 kW
Solar system for telecommunication 50 150 kW
TABLE 9
“Ease of Doing Business”–Benin 2008 Ranking
Source: “Ease of Doing Business”, World Bank, as of 2008
TOPIC RANKING
Ease of doing business 157
Starting a business 142
Dealing with construction permits 123
Employing workers 117
Registering property 120
Getting credits 141
Protecting investors 148
Paying taxes 162
Trading across borders 130
Enabling contracts 174
Closing a business 109

Renewable Energies in West Africa 20
BENIN
COUNTRY INTRODUCTION
6 RENEWABLE ENERGY BUSINESS INFORMATION AND CONTACTS
INSTITUTION CITY FIELD OF ACTIVITY CONTACT
Electric Community of Benin (CEB) Lome, Togo Production, distribution and import of electricity
BP 1368, Lome, TogoPhone: +228 2215795
La Société Béninoise d’Energie Electrique (SBEE)
Cotonou Import and distribution of electricity 01 BP 123, CotonouPhone: +229 21312145
Société Nationale de Commercialisation des Produits Pétroliers (SONACOP)
Cotonou Import, storage and distribution of petroleum products
01.BP 245, CotonouAvenue Jean-Paul IIPhone: +229 21311347
Society Oryx Benin Cotonou Import, storage and distribution of petroleum products
CotonouPhone: +229 21306547
Society TOTAL Cotonou Import and distribution of petroleum products
08 BP 701, CotonouAvenue Jean-Paul II
ENERDAS Cotonou Distribution and installation of solar systems and solar equipment
02 BP 8155, CotonouPhone: +229 21301490
MIERT Cotonou Distribution and installation of solar systems and solar equipment
07 BP 1244, CotonouPhone: +229 21325010
SOLARISS Cotonou Distribution and installation of solar systems and solar equipment
05-BP 24522, CotonouLot 4053 J Sodjeatinmè
Sucrerie Complant du Bénin (SUCOBE)–Benin sugar plant
Cotonou Sugar and ethanol producer BP 6, CotonouPhone: +229 21305537
Yueken International Benin Cotonou Producer of ethanol from cassava roots
071 BP 75, CotonouLot 1436Phone: +229 21384606
Investments Promotion Center (IPC) Cotonou Promotion and development of foreign investments in Benin
01 BP 2022, CotonouPhone: +229 21303062www.cpibenin.com
Formalities Center of the Enterprises Chambre de Commerce et d’Industrie du Benin
Cotonou Business creation and modification 01 BP 31, CotonouPhone: +229 21314386www.ccibenin.org
TABLE 10
List of Selected Business Partners
MINISTRY ADDRESS CONTACT PERSON
Ministry of Energy and Water Av. Jean Paul VI01 BP363 CotonouPhone: +229 312429
Assogba Daniel
Ministry of Industry and Trade Av. Jean Paul VI01 BP363 CotonouPhone: +229 21303024
Senou Louise
Ministry of Agriculture, Animal Husbandry and Fishing
Av. Jean Paul VI01 BP363 CotonouPhone: +229 300410
Gbehounou Galbert
TABLE 11
List of Selected Ministries of Benin

Renewable Energies in West Africa 21
BENIN
BIBLIOGRAPHY
7 BIBLIOGRAPHY
African Cashew Alliance: (www.africancashewalliance.org) Association Nationale des Praticiens de la Microfinance du Bénin, Consortium ALAFIA (2002/2005)
Analysis and Prospective Vision of the Electric Energy Sector in Benin (1998)
CEB (1984): Report on Hydro Power: Togo and Benin Hydroelectric Potential Resources and Leading Plan of the Production and the Transportation
Central Intelligence Agency – CIA (2009): World Fact Book (www.cia.gov/library/publications/the-world-factbook)
Code on Water in the Republic of Benin (1987) Government of Benin (1997/1998): Compilation of the Laws on the Decentralization (law no 97 – 028 on the ori-entation of the organization of territorial administration, law no 97 – 029 on the organization of the communes, law no 98 – 005 on the organization of communes having a particular status, law no 98 – 006 on the communal and municipal electoral system, law no 98 – 007 on the finan-cial regime of the communes)
Power Sector Development Policy and Strategy in Benin Government of Benin (January 2008): Financial law 2007 – 33
INSAE (2008): Various sets of data LIFAD (1999): Annual Survey LIFAD (2005): Annual Survey Ministry of Agriculture, Animal Husbandry and Fishing (2008): Strategic Plan for Agricultural Sector Development in Benin
Ministry of Environment (1998): National Program of Actions for Struggle Against the Desertification
MEE (2003): Energy Policy and Strategy MEE (2004): Rural Electrification Policy Head State of Office (2008): Politics and Strategy Docu-ment on Electric Energy Sector Development in Benin
Ministère Charge du Plan, de la Prospective et du Dévelop-pement/INSAE (2004): Rapport de la Première Session Ordinaire de l’Année 2004, Cotonou (Population Census Report Benin of 2004)
President Office (2007): Document of the Think-Tank on the Vision of the Electric Energy Sector
Report on the development of ethanol gel fuel as cooking energy in the WAEMU (2007)
SBEE (2007): Annual Report Direction Générale de l’Énergie – DGE (2006): Energy Information System in Benin
International Monetary Fund – IMF (2008): Republic of Benin: Growth Strategy for Poverty Reduction, Country Poverty Reduction Strategy Paper for 2007 (www.imf.org/external/pubs/ft/scr/2008/cr08125.pdf)
UNDP (2009): Human Development Reports (www.hdr.undp.org)
World Bank (2008): Ease of Doing Business Government of Benin (2006): Strategic Orientations of Benin Development (2006–2011) Government Program

ANNEX Renewable Energies in West Africa 22
BENIN
8 ANNEX
FIGURE 7
High and Medium Voltage Electricity Grid in Benin
Source: Data compiled by the author, as of 2008
TABLE 12
Quantity of Residues and Potential Electricity Production
Source: S.I. e. Benin with data from DGE, as of 2006
CROPS AVAILABLE RESIDUES (TONS) POTENTIAL (GWH/YEAR)
Local maize 2,453,952 1,962.6
Improved maize 742,233 593.6
Sorghum 518,429 407.1
Small millet 92,044 72,3
Rice 80,872 68.2
Cotton 1,378,619 1,577.7

FIGURE 8
Potential Hydro Power Sites in Benin
Source: DGE, as of 2008
ANNEX Renewable Energies in West Africa 23
BENIN

COUNTRY CHAPTER:
BURKINA FASO
Authors of Country Chapter Bassirou Quedraogo (Dipl. Eng.)Souleymane Sow (Eng.) Coordination and Review of the Country ChapterAnton Hofer (MSE, Dipl.-Ing./FH, M.A.)WIP-Renewable Energies www.wip-munich.deMunich, Germany
Editor Deutsche Gesellschaft für Technische Zusammenarbeit (GTZ) GmbHDepartment Water, Energy, TransportDag-Hammarskjöld-Weg 1-565760 Eschborn, Germanywww.gtz.de
On behalf of Federal Ministry for Economic Cooperation and Development (BMZ)
Editorial staffDiana KraftTel: +49 (0)6196 79 4101Fax: +49 (0)6196 79 80 4101Email: [email protected]
Renewable Energies in East Africa 24

CONTENTS BURKINA FASO
ACRONYMS, ABBREVIATIONS AND MEASUREMENTS 26
SUMMARY 27
1 COUNTRY INTRODUCTION 28 1.1 Geography and Climatic Conditions 28 1.2 Political, Economic and Socio-economic Conditions 28
2 ENERGY MARKET IN BURKINA FASO 28 2.1 Overview of the Energy Situation 28 2.2 Energy Capacities, Production, Consumption and Prices 28 2.3 Market Actors and Regulation Structures 29
3 POLICY FRAMEWORK FOR RENEWABLE ENERGIES 30 3.1 Policies, Strategies and Programs for Renewable Energy Promotion 30 3.2 Regulations, Incentives and Legislative Framework Conditions 30
4 STATUS AND POTENTIAL FOR RENEWABLE ENERGIES 30 4.1 Biomass/Biogas 30 4.2 Solar Energy 32 4.3 Wind Power 32 4.4 Hydro Power 32
5 MARKET RISKS AND BARRIERS 32
6 RENEWABLE ENERGY BUSINESS INFORMATION AND CONTACTS 33
7 BIBLIOGRAPHY 34
8 ANNEX 35
25CONTENTS
BURKINA FASO
Renewable Energies in West Africa

ACRONYMS AND ABBREVIATIONS
BURKINA FASO
ADDAX Name of supplier based in Geneva AIJ Activities Implemented Jointly APEES Association Pour la Promotion de l’Exploitation de l’Énergie Solaire (Association for the Promotion and Use of Solar Energy) BMZ Bundesministerium für wirtschaftliche Zusammenarbeit und Entwicklung (German Federal Ministry for Economic Cooperation and Development) CCA Centres de Communication et d’Activités (Centers of Communication and Activities) CET Common External Tariff CFAF CFA Franc CIF Cost, Insurance and Freight price for import/export of petroleum products CIFAME Commission Intersectorielle de Facilitation de l’Approche Multisectorielle dans le Domaine de l’Énergie (Interdepartmental Committee for Multisector Approach Facilitation in the Sector of Energy) CILSS Comité Permanent Inter-Etats de Lutte contre la Sécheresse dans le Sahel (Interstate Committee for Desertification Control) DDO Direct De-oxygenation (Fuels for Electricity Generation) DMN Direction de la Météorologie Nationale (National Direction of Meteorology) ERD Electrification Rurale Décentralisée (Decentralized Rural Electrification) FDE Fonds Développement de l’Électrification (Electrification Development Fund) GDP Gross Domestic Product GTZ Deutsche Gesellschaft für Technische Zusammenarbeit (German Technical Cooperation Agency) IRSAT Institut de Recherches en Sciences Appliquées et Technologies (Research Institute of Applied Sciences and Technology) LBN Libre Blanc National (National White Book Investment Plan) MEPRED Mainstreaming Energy for Poverty Reduction and Economic Development Project n.a. not applicable PNGT Programme Nationale de Gestion des Terroirs (National Community Land Management Program) PRS Programme Régional Solaire (Regional Solar Energy Program) PV Photovoltaic RE Renewable Energies RPTES Regional Program for the Traditional Energy Sector SIR Société Ivoirienne de Raffinage (name of Ivorian Refinery Company) SME/SMI Small and Medium Sized Enterprises/Small and Medium Sized Industries SSD Sociétés de Services Décentralisées (Societies of Decentralized Services, e. g. CCA of Gomboro, Bognounou & Bokin) TPA Taxe Patronale et d’Apprentissage (Employers’ and Learning Tax) VAT Value Added Tax WAEMU West African Economic and Monetary Union XOF West African CFA Franc (as opposed to XAF = Central African CFA Franc)
MEASUREMENTS
GWh gigawatt hour (1 GWh = 1,000,000 kilowatt hours (kWh)) m² square meter MW megawatt (1 MW = 1,000 kW) MVA megavolt-ampere Wp Watt-peak (1 kWp = 1,000 Wp)
26ACRONYMS, ABBREVIATIONS AND MEASUREMENTS
BURKINA FASO
Renewable Energies in West Africa

SUMMARY
The Country Study of Burkina Faso is to provide an overview of the country’s energy market and to support decision-mak-ing for private investments for the Renewable Energy (RE) sector in Burkina Faso. The study is structured as follows:
Chapter one provides Background Information on Burkina Faso. This includes an overview of geographical and climatic conditions, as well as the most important facts in view of po-litical, economic and socio-economic conditions of Burkina Faso.
Chapter two summarizes facts and figures of Burkina Faso’s Energy Market including stakeholders and market actors in-volved as well as sector related regulations.
Chapter three presents the currently existing Political Frame-work for Renewable Energies in Burkina Faso. This includes an overview of support mechanisms for Photovoltaic (PV) as well as existing regulations, incentives and legislative frame-work conditions concerning other RE technologies.
Chapter four provides a brief overview of the Status Quo and Potential for Renewable Energies in Burkina Faso.
Chapter five summarizes the existing and potential Market Risks and Barriers in general with focus on RE.
Chapter six presents a compilation of the most relevant Re-newable Energy Business Information and Contacts of Burki-na Faso.
Renewable Energies in West AfricaSUMMARY 27
BURKINA FASO

1 COUNTRY INTRODUCTION
1.1 GEOGRAPHY AND CLIMATIC CONDITIONSBurkina Faso is a landlocked country surrounded by Mali in the North, Niger in the East, Benin in the Southeast, Togo and Ghana in the South, and Côte d’Ivoire in the Southwest. The country’s territory comprises 274,000 km² with an esti-mated population of about 13,200,000. The capital of Burki-na Faso is Ouagadougou.
Burkina Faso has a primarily tropical climate with two seasons. The dry season lasts from eight months in the North to five or six months in the South, followed by the rainy season with up to 1300 millimeters of rainfall per annum. There are three climatic areas in Burkina Faso: the Sudanian zone with extensive rainfalls during the rainy season, the Sudano-Sahe-lian zone, located in the centre, and the Sahelian zone with a very short and moderate rainy season. The climatic situa-tion of Burkina Faso includes long dry periods and therefore causes serious problems in view of sufficient water supply.
1.2 POLITICAL, ECONOMIC AND SOCIO-ECONOMIC CONDITIONS
Burkina Faso’s constitution of 2 June 1991 established a semi-presidential government with a parliament. The presence of this new political stability allowed the country to set up vari-ous institutions that are now fully capable of acting. During the last decade the democratic process was being consolidated significantly. With approximately 13,340,000 inhabitants from of about sixty ethnic groups, Burkina Faso is one of the most populated countries of West Africa. Approximately 82.6 % of the overall population lives in rural areas. Burkina Faso is one of the poorest countries in the world with more than 40 % of the population still living below the poverty line. The annual per capita income is less than 1,000 Euro. Since the 1990s, Burkina Faso has been starting a series of economic reforms with the support of the World Bank and the International Monetary Fund in order to streamline the economy, stimulate economic growth and to reduce poverty.
Renewable Energies in West Africa 28
BURKINA FASO
COUNTRY INTRODUCTION
2 ENERGY MARKET IN BURKINA FASO
2.1 OVERVIEW OF THE ENERGY SITUATIONBesides the utilization of Hydro Power, the electricity produc-tion of Burkina Faso mainly relies on diesel generators. Due to high production costs, fluctuating oil prices and a steadily increasing demand for electricity, Burkina Faso has started to import electricity from its neighbors Ghana and Côte d’Ivoire. Currently, only 10 % of the country are connected and have access to electricity. Due to the lack of fossil fuel resources, the country is completely dependent on fuel imports. In rural areas of Burkina Faso, energy requirements are almost com-pletely met by the utilization of traditional biomass.
2.2 ENERGY CAPACITIES, PRODUCTION, CONSUMPTION AND PRICES
Electricity SectorThe electricity consumption of Burkina Faso is met by local production and imports from Ghana and Côte d’Ivoire. The monopolist SONABEL is fully responsible for the production, import and distribution of electricity in Burkina Faso. Table 1 shows characteristic data of the country’s electricity sector.
TABLE 1
Characteristic Data of the Electricity Sector (2004–2007)
OuagadougouFada N’Gourma
Tenkodogo
Kaya
Ouahiouya
Koudougou
BoboDioulasso
Banfora
Gaoua
Po
Dori
Sirba
Koulpeleopo
Volta
Noire
Volta Blanche
Volta Rouge
MAP OF BURKINA FASO
100 miles
YEAR 2004 2005 2006 2007
Electricity imported (kWh) 96,183,557 125,337,589 139,323,910 123,910,359
Thermal production (kWh) 371,789,678 415,751,943 467,728,921 501,295,228
Hydro production (kWh) 101,458,980 100,472,905 80,668,451 111,416,699
Average cost per kWh (XOF) 113.19 117.89 121.21 129.62
Average cost per kWh (EURO)
0.17234632 0.17950268 0.18455781 0.19736311
Number of thermal plants 30 30 29 28
Number of hydro plants 4 4 4 4
Thermal power installed (MVA)
181 204 223 217
Hydro power installed (MW) 32 32 32 32
Source: SONABEL, as of November 2008

BURKINA FASO
COUNTRY INTRODUCTION
As indicated above, the electricity supply of Burkina Faso is still in the process of development. Especially the intercon-nection of rural areas is an important issue. Within the frame-work of the Electrification Development Fund (FDE), several villages have now got access to electricity, either via regular connection to the grid of SONABEL or decentralized diesel generators. Regarding this, the challenge is to provide rural areas with reliable and cost effective electricity.
The electricity tariffs in Burkina Faso vary according to the level of consumption and the type of utilization. Table 2 provides an overview of past (up to June 2005) and present electricity prices, tariff structures and consumption levels.
Petroleum SectorThe state-owned company SONABHY has supply contracts with the Ivorian Refinery Company (SIR) and ADDAX, a sup-plier based in Geneva. Furthermore, petroleum products are bought at international spot markets and imported through the Port of Lomé. Additional imports come from the Tema re-finery in Ghana. SONABHY has two depots in Burkina Faso, one in Bingo (Ouagadougou) and the other in Bobo Dioulasso. The price structure of petroleum products is fully regulated by the Ministry of Trade. Fuels for electricity generation (DDO) as well as for cooking purposes are subsidized. For all other purposes, petroleum products are regularly taxed.
2.3 MARKET ACTORS AND REGULATION STRUCTURES
For the planning and regulation of the energy sector, vari-ous ministries are involved in Burkina Faso. The legal and regulatory framework of the energy sector is managed by the Ministry of Energy in close cooperation with the ministries in charge of trade, finance and environment. Moreover, the sectors of education, health, agriculture and hydraulics, also being related to the energy sector, are involved through the corresponding ministries in charge.
Electricity SectorIn November 2007, the Parliament adopted law No 027/AN1 in order to regulate the general electric energy supply of Burkina Faso. This law is to enhance the qualitative and quantitative security of energy supply. It also aims at the reduction of the overall electricity costs by liberalizing the production and dis-tribution of electricity within Burkina Faso because currently the electricity sector is dominated by the monopolist SONA-BEL. In the overall reorganization of the electricity sector, several authorities are involved:
The Ministry of Energy (responsible for energy policy, general control and planning)
The Ministry of Trade (responsible for the fixation of the electricity price)
Independent control authorities for electricity price fixation and consumer protection
Authorities issuing regulations to support the overall price setting process
Authorities providing fund management for the develop-ment of rural electrification
Petroleum SectorThe supply of petroleum products is fully organized and con-trolled by SONABHY, a state-owned company. The Ministry of Trade supervises SONABHY with regard to import and trade issues, while the Ministry of Finance coordinates and controls all financial matters. The Burkina Bureau of Mines and Geology is in charge of the quality control for retailed petroleum products. The overall tasks of SONABHY can be summarized as follows:
Renewable Energies in West Africa
1 LAW 027-2002/AN OF 9 OCTOBER 2002, REFERRING TO THE AUTHORIZATION OF
BURKINA FASO’S ACCESSION TO THE KYOTO PROTOCOL (JOURNAL OFFICIEL NO. 47
DU 21 OCTOBRE 2002)Source: SONABEL, as of November 2008
TABLE 2
Electricity Tariffs Provided by SONABEL
29
TARIFF STRUCTURE
CONSUMP-TION LEVEL (kWh)
ENERGY CHARGE (XOF) 1 EURO = 656.759 XOF
Sept. 2004 until June 2005 July 2006 until now
Tariff 1 Domestic
Tariff A
0–50 73 75
51–00 120 128
Above 100 125 138
Min. charge 1,132 1,132
Tariff B
0–50 86 96
51–200 90 102
Above 200 95 109
Min. charge 381–637 (dep. on amperage) 457–764 (dep. on amperage)
Tariff 2 Domestic and locomotive tasks
Tariff C
0–50 86 96
51–200 95 108
Above 200 100 114
Min. charge 1,022–1,144 (dep. on amperage) 1,226–1,373 (dep. on amperage)
Tariff 3 Non-domestic (low voltage)
Tariff D1(non-indus-trial)
Peak Hour 143 165
Full Hour 77 88
Min. charge 7,115 8,538
Tariff D2 (Industrial)
Peak Hour 110 140
Full Hour 51 75
Min. charge 5,929 7,115
Tariff 4 Non-domestic (average voltage)
Tariff E1(non-indus-trial)
Peak Hour 121 139
Full Hour 56 64
Min. charge 7,115 8,538
Tariff E2 (industrial)
Peak Hour 110 118
Full Hour 51 54
Min. charge 5,929 7,115
Tariff 5 Street lighting
Tariff FUnique tariff 120 122
Min. charge n.a. n.a.
One phase5 A to 15 A 0 381
Above 20 A 0 637
Three phase 10 A to 15 A 0 1,022
Above 20 A 0 1,144

30
BURKINA FASO
Import, storage, conditioning and marketing of petroleum products and gas
Construction of storage infrastructures to guarantee sufficient distribution
Support of research activities for alternative energy resourc-es and energy conservation
Biomass SectorThe biomass sector of Burkina Faso is mainly administrated by the Ministry of Environment that focuses on the sustain-able production of firewood and charcoal. The Ministry of Trade regulates the transport of these commodities as well as related tax issues. The Ministry of Energy plans and regulates the firewood and charcoal demand in urban areas of Burkina Faso.
3 POLICY FRAMEWORK FOR RENEWABLE ENERGIES
3.1 POLICIES, STRATEGIES AND PROGRAMS FOR RENEWABLE ENERGY PROMOTION
Despite the considerable potential of RE resources in Burkina Faso, up to now, there are no policies or strategic directions for the utilization of RE. However, a guiding principle for PV was expressly outlined in a program to supply basic energy services. Adopted in 2007, the Strategy for Rural Electrifica-tion strongly supports solar energy for the electrification of ru-ral areas currently lacking connection to the SONABEL grid. The implementation of PV projects supports the promotion of solar energy and could help to achieve a supportive policy framework for RE in Burkina Faso. A list of selected projects and programs can be found in Chapter 8 (Annex). Table 3 provides an overview of already existing support mechanisms for PV.
3.2 REGULATIONS, INCENTIVES AND LEGISLATIVE FRAMEWORK CONDITIONS
The new regional policy supporting the access to energy serv-ices for rural areas of Burkina Faso, known as the Regional White Paper, was approved of and adopted on 12 January 2006 by the ECOWAS Authority of Heads of States. The regional policy aims at an effective contribution of energy to achieve the Millennium Development Goals (MDG) and to reduce poverty. In order to reach this goal, all members of ECOWAS need to develop appropriate policies for energy services.
Recently, a national multiple stakeholder group, the Interdepartmental Commission of Multisector Approach Fa-cilitation in the Sector of Energy (CIFAME) was formed by the Ministry of Mines and Energy by ministerial decree 06–21/MCE/SG/DGE2 of 5 May 2006. After several meetings, the commission drafted the National White Paper (LBN) fo-cusing on the provision of modern energy services to the en-tire population of Burkina Faso by the year 2020. Therefore, renewable energy is considered to be a major contributor to this ambitious goal.
4 STATUS AND POTENTIAL FOR RENEWABLE ENERGIES
4.1 BIOMASS/BIOGASIn many provinces of Burkina Faso, especially in the Sudano-Sahelian and Sudanian Zone, sufficient biomass resources are available.3 Particularly the forest areas of the East, the West and Southwest are offering substantial biomass resources. An analysis of the correlation between rural/Urban consumption and production is shown in Figure 2 and Figure 3.
Within the framework of the “Biogas for Better Life” initiative, a feasibility study was carried out by GTZ in 20074 in order to identify the potential for biogas installations. The study envisages the installation of 15,000 biogas production units at farms and another 20,000 units in semi-urban house-holds.5 The costs of such biogas installations vary between CFAF 450,000 and CFAF 650,000, depending on size and location. Moreover, it is foreseen to implement 2,000 biogas production facilities for agro-business SME/SMIs by 2015. A total of 25,000 units are to be realized by 2015 and more than 100,000 units by 2030. Table 4 presents the number of the projected biogas installations in Burkina Faso.
Renewable Energies in West Africa
2 CIFAME, AS OF 2009
3 SEE ALSO COMPETE, 2008
4 GTZ, 2007
5 EXISTING INSTALLATIONS ARE BASED ON MULTIPLE TECHNOLOGIES (FLOATING DRUM,
PLUG FLOW, FIXED DOME, BATCH, SEMI-BATCH). SEE ALSO GTZ, 2007, P. 43
TABLE 3
Existing Support Mechanisms for PV Solar Energy
COUNTRY INTRODUCTION
TYPE PROJECTS
Beneficiary
- ERD Ganzourgou PV component, subsidies 40 % to 45 %
- PV FONDEM/Kouritenga Appropriations, subsidizes 35 % to 45 %
Management committee
- National Community Land Management Program II (PNGT II)415.751.943
- Burkina Faso Plan- Activities Implemented Jointly (AIJ)/Regional
Program for the Traditional Energy Sector (RPTES)- Spanish project- Regional Solar Energy Program I (PRS I),
subsidizes 100 % of equipment costs
Users Association- Kouritenga Energy services, subsidizes
90 % of equipment costs
Group or co-operative society- COOPEL Electric systems, subsidizes
60 % of equipment costs
Private promoter- Societies of Decentralized Services (SSD) ex.
CCA of Gomboro, Bognounou & Bokin, subsidizes 100 % of equipment costs
Source: Césaire SOME, Modes of Funding Basic Energy Services for Burkina Faso, MEPRED, as of 2008

31
BURKINA FASO
COUNTRY INTRODUCTION Renewable Energies in West Africa
FIGURE 3
Rural/Urban Consumption and Production: Sudanian Zone
Source: The Second Phase of National Plan of Electrification, as of 2006
tons
1000
2000
3000
4000
7000
02004 2005 2006 2007 2008 2009 2010 2011 2012 2013 2014
6000
8000
urban consumption
rural consumption
production
FIGURE 2
Rural/Urban Consumption and Production: Sudano-Sahelian Zone
Source: The Second Phase of National Plan of Electrification, as of 2006
tons
1000
2000
3000
4000
5000
6000
7000
02004 2005 2006 2007 2008 2009 2010 2011 2012 2013 2014
urban consumption
rural consumption
production
TABLE 5
Solar PV Installation Situation in 1998 and in 2002
Source: Energy Services Financing, National White Paper, MEPRED, as of May 2008
YEAR 1998 2002
Energy Services Capacity (Wp) Part ( %) Capacity (Wp) Part ( %)
Water pumping 209 19 205.20 15
Telecommunication 220 20 218.88 16
Lighting 671 61 0 0
Video and television 0 0 41.04 3
Lighting and refrigeration 0 0 902.88 66
Total 1,100 100 1,368 100
Source: GTZ, as of July 2007
YEAR 2008 2009 2010 2011 2012 2013 2014 2015 2030
Phases Pilot Phase Implementation Phase
Stages 0 I II III IV V VI Midterm Long term
Demonstration 50 50
Rural households
0 250 1000 2500 3000 3500 3750 14000 90267
Peri-urban households
100 400 1000 1500 3000 4000 10000 20000
Agro-business 100 120 160 170 200 250 1000 1343
Total 50 500 1520 3660 4670 6700 8000 25000 111610
TABLE 4
Projected Biogas Producing Units (2008–2030)

BURKINA FASO
COUNTRY INTRODUCTION
4.2 SOLAR ENERGYBurkina Faso has strong potential in the field of solar energy. According to a study of the Research Institute of Applied Sciences and Technology (IRSAT) and the Direction of Na-tional Meteorology (DMN), the average potential is estimat-ed at 5,5 kWh/m2/day for 3,000 to 3,500 hours per annum. Currently, PV solar systems are used for refrigeration, water pumping, communication, lighting, video and television. Ta-ble 5 provides an overview of capacities installed in 1998 and 2002.
4.3 WIND POWERDue to the western location of Burkina Faso, the potential for wind power is very limited. The average wind speed ranges between 1 and 3 meters per second, while the maximum only to be obtained in the North of the country. Therefore, a large-scale utilization of wind energy is not advisable. However, small-scale generators at suitable sites and for selective pur-poses (e. g. water pumping, desalination systems etc.) might be reasonable.
4.4 HYDRO POWERA survey of hydroelectric sites was done within the EDF-SONABEL – Centre National d’Equipement Hydraulique (National Centre of Hydraulic Equipment) study. The study covers large-scale hydroelectric sites as well as small-scale in-stallations. The capacity ranges between 65 and 550 kW with 5 to 15 GWh/year and 550 to 1,700 kW with at least 5 GWh/year. The study shows that the Hydro Power potential of rural areas is sufficient for a decentralized electricity production. The study identifies some sites where the estimated produc-tion cost ranges between CFAF 100 and 175 per kWh, several other sites with estimated costs of at least CFAF 200 per kWh. The current hydroelectricity utilization covers about 20 % of the national electric consumption (incl. imports from Ghana and Côte d’Ivoire).
Renewable Energies in West Africa
TABLE 7
Burkina Faso – Ease of Doing Business 2008 Rankings
6 SMALLER AND SMALLEST APPLICATIONS ARE LESS COST-INTENSIVE IN SOME
RESPECTS. OFTEN INITIAL INVESTMENTS, HOWEVER, ARE STILL HIGH FOR THE
CORRESPONDING USER GROUPS SUCH AS LOW-INCOME PRIVATE CLIENTS OR SMES.
5 MARKET RISKS AND BARRIERS
Regarding market risks and barriers, there are several issues to be considered in Burkina Faso. Besides corruption, the lack of local expertise and outdated technical equipment, high costs for research and development as well as mostly capital intensive technologies6 are substantial barriers for the broad implementation of RE. Due to the lack of financial resources, many companies in Burkina Faso need to operate with sup-plier credits or documentary credits. National financial insti-tutes hardly contribute to the financing of projects aiming at the provision of energy services for rural areas. As to the ac-cess of rural population to basic energy services, only people banks – “Caisses Populaires” – offer very limited credits to facilitate the acquisition of PV kits. As other financial institu-tions charge high interest rates, such credits are not suitable to finance PV equipment. Even though there are microfinance institutions in Burkina Faso – which in general provide more adequate financial support services to low income groups and also SMEs – their credits are only granted for short term peri-ods limited to a maximum of three years.
According to the World Bank’s Ease of Doing Busi-ness report of 2008, Burkina Faso moved from position 164 in June 2007 to 148 in 2008. The country is one of the ten world leaders in regulatory reforms aiming to facilitate busi-ness activities. Burkina Faso, for example, reduced the cor-porate tax rate from 35 to 30 percent and the dividend tax from 15 to 12.5 percent. Table 7 provides an overview of the country specific rating.
In terms of tax incentives, the import of energy equipment is subject to the WAEMU common external tar-iff (CET). The country’s value added tax (VAT) rate is cur-rently 18 % while the employers and training tax (TPA) is 4 % (8 % for foreigners).
32
Source: Inventory of Burkina Faso Hydroelectric Sites, EDF-SONABEL-CNEH, as of March 1999
TABLE 6
Distribution of the Mini /Micro Hydro Sites in Burkina Faso
LOCATION CAPACITY (MW)
Center, South 2.5
Boucle du Mouhoun 2.5
Southwest 5
Center, East 1.2
Center, West 6.25
East 7.5
Cascades 5
Sahel 3.125
Hauts Bassins 3.125
SELECTED INDICATOR RANKING
Ease of doing business 148
Starting a business 113
Dealing with construction permits 106
Employing workers 57
Registering property 148
Getting credit 145
Protecting investors 142
Paying taxes 132
Trading across borders 173
Enforcing contracts 110
Closing a business 110
Source: Ease of Doing Business, World Bank, as of 2008

33
BURKINA FASO
COUNTRY INTRODUCTION Renewable Energies in West Africa
TABLE 9
Donor Aid Investments in Renewable Energies by Stakeholders
TABLE 8
RE Companies and Stakeholders in Burkina Faso
6 RENEWABLE ENERGY BUSINESS INFORMATION AND CONTACTS
Currently, there are several ongoing investment initiatives and projects in the field of RE such as the Regional Solar En-ergy Program Phase II (funded by the European Union), the Regional Biomass Energy Program (funded by a Dutch co-operation through WAEMU) and the National White Paper Investment Plan. Concerning transregional banking institu-tions, the ECOWAS Community Investment and Develop-ment Bank (BIDC) raises funds dedicated to the development of RE in ECOWAS member states. Table 9 provides an over-view of ongoing RE investments in Burkina Faso.
ORGANIZATION FIELD OF ACTIVITY LOCATION/CONTACT
CB Energie Supply, installation andmaintenance of solar systems
DédougouPhone: +226 20 52 10 [email protected]
MICROSOW Supply & maintenance of solar systems, solar cookers, charging units for cell phones
SomgandéPhone: +226 5035 63 22 [email protected]
SOLTECH Supply and installation of solar energy and electricity equipment, energetic audit and training
OuagadougouPhone:+226 50 34 23 02Email: [email protected]
OMA-SENISOT SA Solar energy installation,installation of electricity
OuagadougouPhone: +226 50 31 42 [email protected]
Sahel Énergie Solaire
Solar pumps and community systems within the Regional Solar Energy Program,electrification of 150 departmental administration centers
OuagadougouPhone: +226 50 30 69 [email protected]
K&K International Solar lighting,solar pumps and refrigerators
OuagadougouPhone: +226 50 31 17 [email protected]
INTELFAC Solar water heating systems,PV systems in health facilities and households
OuagadougouPhone: +226 50 36 37 [email protected]
ATESTA Installation of solar systems at social housings
OuagadougouPhone: +226 50 36 35 [email protected]
TLE NAFA Supply and installation of solar cookers
Bobo-DioulassoPhone: +226 20 98 11 [email protected]
Association for the Promotion and Use of Solar Energy (APEES)
Oil and solar energy cookers,installation of solar energy collectors and solar water heating systems
Institute of Applied Research in Sciences and Technologies (IRSAT)
Production, installation and cont-rol of photovoltaic systems
Phone: +226 50 35 70 [email protected]
STAKEHOLDER SOURCE OF TARGETED RENEWABLE ENERGY
World BankPhotovoltaic and solar thermal energy (dryers, water heaters), biofuels, sustainable wood energy, fuel efficient stoves
Dutch cooperation Biogas, modern valorization of traditional biomass
NGOs, AssociationsPhotovoltaic and solar thermal energy (dryers, cookers), Jatropha Curcas
Private promoterPhotovoltaic and solar thermal energy (dryers, cookers), Jatropha Curcas
BMZ via GTZ Fuel efficient stoves
Danish cooperation Sustainable forestry, sustainable wood energy
Luxembourg cooperation Sustainable forestry, sustainable wood energy
Japanese cooperation Sustainable forestry, sustainable wood energy
European UnionInstitutional cooperation in the field of sustainable forestry
Canadian Development Agency
Training program in the field of solar energy, cooperation with the University of Ouagadougou
Source: data compiled by the author
Source: Ease of Doing Business, World Bank, as of 2008

34
BURKINA FASO
7 BIBLIOGRAPHY
CIFAME (2008): Investment Plan of the National White Paper
Commission Intersectorielle de Facilitation de l’Approche Multisectorielle dans le domaine de l’Energie – CIFAME (2009): Organisation de la CIFAME (www.cifame.org/index_fichiers/Page346.htm)
COMPETE (2008): National Policies and Strategies on Bioenergy in Africa. Case Study: Burkina Faso (www.compete-bioafrica.net/policy/.../COMPETE-032448-NationalBioenergyPolicy-BurkinaFaso-0801.pdf)
Government of Burkina Faso (2005): Legislation on the Electricity Sector in Burkina Faso, Loi No 016-05 sur la Réglementation Générale de l‘Approvisionnent du BF en Énergie Électrique (www.mines.gov.bf/SiteMines/docu-ments/autres/decret-fonds.pdf)
Government of Burkina Faso (1998): Legislation on the Provision of Electricity in Burkina Faso, Loi No016-05 Portant Réglementation Générale de l’Approvisionnement du Burkina Faso en Énergie Électrique (www.mines.gov.bf/SiteMines/documents/autres/loi-060-98-an.pdf)
GTZ (2007): Feasibility Study for a National Domestic Biogas Program in Burkina Faso
MEPRED (2008): Models of Funding Basic Energy Services in Burkina Faso, Césaire Some
MEPRED (2008): Energy Services Financing, National White Paper
Ministry of Economy and Finance (2005–2007): Burkina Faso. Poverty Reduction Strategy Paper. Priority Actions Plan
Ministry of Mines and Energy (2002): Letter for the Development Policy of the Energy Sector (www.mines.gov.bf/SiteMines/textes/lpde.pdf)
Ministry of Mines and Energy (2006): National Plan of Electrification; The Second Phase of National Plan of Electrification
Ministry of Mines and Energy (2007): Rural Electrifica-tion Strategy Document
Ministry of Mines and Energy (2009): Rapport National d’Investissement Burkina Faso (www.mines.gov.bf/SiteMines/index.jsp)
National Geographic Institute (2003): Map of Burkina Faso
OECD/AfDB (2002) African Economic Outlook. Burkina Faso, page 59–70
Ouedraogo, B. (2008) Bioenergy, Agriculture and Rural Development. National Report on Burkina Faso. Study Commissioned for input to the Regional Report on Bioenergy, Agriculture and Rural Development in UEMOA Countries (in prep.)
SAWADOGO, A./Government of Burkina Faso (1997) Code on Environment from January, (www.sos-dechets.bf.refer.org/imprimersans.php3?id_article=52)
SONABEL (2004–2007): Activity Reports (www.sonabel.bf)
SONABHY (2006): Activity Report
Renewable Energies in West AfricaBIBLIOGRAPHY
World Bank (2008): Ease of Doing Business (www.doingbusiness.org)
Ministère du Commerce, de la Promotion de l‘Entreprise et de l‘Artisanat / Ministry of Trade, Promotion of Entre-preneurship and Handikrafts (http://www.commerce.gov.bf, as of 2008)

35
BURKINA FASO
Renewable Energies in West AfricaANNEX
8 ANNEX
LIST OF SELECTED PROJECTS AND PROGRAMS (ALREADY IMPLEMENTED)
1. The Regional Solar Energy Program (PRS) is a region-wide project implemented by the Standing Interstate Committee on Desertification Control (CILSS) in the years 1990–1998. The program aimed to set up:
Photovoltaic equipment for water pumping (800 Wp to 3.6 kWp)
Photovoltaic equipment for electricity generation (120 Wp) at schools and community centers Photovoltaic standard lamps for street lighting Electrical equipment (refrigerators, color TVs, radio cassette players, etc.)
Project Costs: Installed systems: 3,412,000,000 XOF Supportive actions: 28,180,000 XOF Total cost of PRS I: 3,440,180,000 XOF
Funding Scheme: European Union funding the total costs Governmental fund raising with taxes, serving to finance maintenance costs
2. The „Spanish“ Project is a project supporting PV installations. It was implemented in the years 1998–2000. The project is laid out to provide:
Photovoltaic equipment for electricity generation (120 Wp) at schools and community centers
Photovoltaic powered street lighting
Project Costs and Funding: 5,950,000,000 XOF subsidized by the government of Spain
3. A Joint Project within the Regional Program for Traditional Energy Sector supplied photovoltaic equipment for 6 villages and was implemented in the years 1998–2004. The installed equipment included:
Photovoltaic equipment for electricity generation at schools and community centers
Photovoltaic lamps for street lighting Total installation of 9.45 kWp
Project Costs and Funding: 500,000,000 XOF, funded by Norway under the adminis-tration of the World Bank
4. The National Community Land Management Program (PNGT) running from 2002–2005 focused on the implemen-tation of PV equipment in schools, literacy centers, hospitals etc. The overall achievements included 262 PV installations:
27 installations at schools (lighting purposes) 76 installations at literacy (lighting purposes) 125 installations at hospitals and health care centers (lighting purposes)
3 installations at hospitals and health care centers (refrigeration purposes)
4 water pumping installations 27 individual installations of PV kits
Project Costs and Funding: There is no reliable information available.
5. The Burkina Faso PV Plan was implemented in the years 1999–2007 and funded about 130 individual PV installations for schools, community centers, hospitals and healthcare cent-ers, offices etc.
Project Costs and Funding: There is no reliable information available.
6. The Ganzourgou Decentralized Rural Electrification (ERD) project was realized between 2000 and 2001. Within the project, two different types of PV kits were tested.
Project Costs and Funding: Total costs of 300,000,000 XOF financed by the French Development Agency and the people banks (Caisses Populaires) of Burkina Faso
7. The National White Book Investment Plan (LBN) corre-sponds to the objectives of the Regional White Book and will be implemented in the years 2008–2015. It mainly aims to provide modern energy services to semi-urban and rural areas of Burkina Faso.
Project Costs and Funding: About 65 to 90 billion XOF invested by The World Bank, the Government of Burkina Faso, SONABEL and intern-tional cooperation initiatives
4. The National Community Land Management Program (PNGT) running from 2002–2005 focused on the implemen-tation of PV equipment in schools, literacy centers, hospitals etc. The overall achievements included 262 PV installations:
27 installations at schools (lighting purposes) 76 installations at literacy (lighting purposes) 125 installations at hospitals and health care centers (lighting purposes)
3 installations at hospitals and health care centers (refrigeration purposes)
4 water pumping installations 27 individual installations of PV kits
Project Costs and Funding: There is no reliable information available.

BURKINA FASO
ANNEX Renewable Energies in West Africa 36
5. The Burkina Faso PV Plan was implemented in the years 1999–2007 and funded about 130 individual PV installations for schools, community centers, hospitals and healthcare cent-ers, offices etc.
Project Costs and Funding: There is no reliable information available.
6. The Ganzourgou Decentralized Rural Electrification (ERD) project was realized between 2000 and 2001. Within the project, two different types of PV kits were tested.
Project Costs and Funding: Total costs of 300,000,000 XOF financed by the French Development Agency and the people banks (Caisses Populaires) of Burkina Faso
7. The National White Book Investment Plan (LBN) corre-sponds to the objectives of the Regional White Book and will be implemented in the years 2008–2015. It mainly aims to provide modern energy services to semi-urban and rural areas of Burkina Faso.
Project Costs and Funding: About 65 to 90 billion XOF invested by The World Bank, the Government of Burkina Faso, SONABEL and intern tional cooperation initiatives
TABLE 10
Sectoral Contribution to GDP Growth (in %) to (2003–2007)
YEAR 2003 2004 2005 2006 2007
Primary sector 2.94 –0.87 3.50 0.26 –0.13
Food crops –2.74 –2.05 2.56 0.50 0.85
Cash crops 0.36 0.82 0.22 –0.81 –1.43
Livestock 5.25 0.25 0.56 0.44 0.32
Forestry 0.06 0.09 0.13 0.10 0.12
Fishing 0.01 0.01 0.02 0.01 0.01
Secondary sector 2.16 1.25 1.28 1.18 1.79
Mining 0.01 0.04 0.09 0.18 0.55
Modern drinks and tobacco
0.20 0.31 0.52 –0.13 –0.06
Cotton shelling 0.70 0.50 –0.61 0.01 –0.63
Electricity, gas and water
0.45 –0.19 0.25 0.14 0.27
Other modern proces-sing industries
0.78 0.25 –0.12 –0.74 1.08
Informal processing industries
–0.42 0.51 0.51 1.05 0.07
Building works 0.45 –0.17 0.65 0.66 0.52
Services sector 3.38 3.29 2.22 3.37 1.52
Market services 2.01 2.88 1.96 2.55 0.89
Trade 0.60 0.44 0.45 0.03 0.10
Transport 0.22 0.57 0.17 0.34 0.20
Mail and telecommu-nications
0.12 0.22 0.10 0.08 0.02
Financial services 0.13 0.20 0.11 0.15 0.01
Other market services 0.95 1.44 1.12 1.95 0.55
Non-market services 1.38 0.42 0.26 0.82 0.64
Import duties and taxes
–0.37 1.11 0.19 0.82 0.73
SIFIM –0.10 –0.15 –0.09 –0.12 –0.01
G.D.P. (Market price) 8.0 4.6 7.10 5.5 3.9
Source: data compiled by the author

BURKINA FASO
ANNEX Renewable Energies in West Africa 37
TABLE 11
Price Structure of Petroleum Products at Ouagadougou (Bingo) Depot (July 2008)
PRICE XOF PER LITER 1 Euro = 656.759 XOF
GASOLINE PARAFFIN OIL GAS OIL DDO(ELECTRICITY PRODUCTION)
1. CIF price at coastal depots 310.49 328.33 357.67 352.32
2. Charges at coastal depots 15.55 15.53 15.19 15.45
3. Transport and transit 43.70 43.70 43.70 43.70
4. Importers expenses and spreads 28.41 28.39 28.31 27.92
5. Outside depot excluding taxes 398.15 415.95 444.87 439.39
6. Customs duties and taxes 40.51 24.05 45.89 25.61
7. Petroleum products dues 125.00 0.00 50.00 0.00
8. Value-added taxes 96.34 0.00 92.24 0.00
9. Outside depot including all taxes 660.00 440.00 633.00 465.00
10. Subsidy 0.00 0.00 0.00 0.00
11. Distributors expenses and spreads 36.00 25.00 40.00 31.00
12. Retailers expenses and spreads 24.00 25.00 22.00 5.00
13. Pump selling price 720.00 490.00 695.00 501.00
Source: Ministry of Trade, Promotion of Entrepreneurship and Handikrafts, as of July
TABLE 12
Price Structure of Petroleum Products at Bobo Dioulasso Depot (July 2008)
PRICE XOF PER LITER 1 Euro = 656.759 XOF
GASOLINE PARAFFIN OIL GAS OIL DDO(ELECTRICITY PRODUCTION)
1. CIF price at coastal depots 310.49 342.42 357.67 352.32
2. Charges at coastal depots 11.17 10.95 10.92 10.70
3. Transport and transit 38.04 38.04 38.04 38.04
4. Importers expenses and spreads 28.18 26.08 27.94 27.80
5. Outside depot excluding taxes 387.88 417.49 434.57 428.86
6. Customs duties and taxes 39.72 24.51 45.12 25.14
7. Petroleum products dues 125.00 0.00 50.00 0.00
8. Value-added taxes 94.40 0.00 90.31 0.00
9. Outside depot including all taxes 647.00 442.00 620.00 454.00
10. Subsidy 0.00 0.00 0.00 0.00
11. Distributors expenses and spreads 40.00 24.00 35.00 32.00
12. Retailers expenses and spreads 21.00 24.00 19.00 2.00
13. Pump selling price 708.00 490.00 674.00 488.00
Source: Ministry of Trade, Promotion of Entrepreneurship and Handikrafts, as of July 2008

COUNTRY CHAPTER:
CAMEROON
Author of Country Chapter Emmanuel Ngnikam (Dipl.)
Coordination and Review of the Country ChapterAnton Hofer (MSE, Dipl.-Ing./FH, M.A.)WIP-Renewable Energies www.wip-munich.deMunich, Germany
Editor Deutsche Gesellschaft für Technische Zusammenarbeit (GTZ) GmbHDepartment Water, Energy, TransportDag-Hammarskjöld-Weg 1-565760 Eschborn, Germanywww.gtz.de
On behalf of Federal Ministry for Economic Cooperation and Development (BMZ)
Editorial staffDiana KraftTel: +49 (0)6196 79 4101Fax: +49 (0)6196 79 80 4101Email: [email protected]
Renewable Energies in West Africa 38

CONTENTS CAMEROON
ACRONYMS, ABBREVIATIONS AND MEASUREMENTS 40
SUMMARY 41
1 COUNTRY INTRODUCTION 42 1.1 Geography and Climatic Conditions 42 1.2 Political, Economic and Socio-economic Conditions 42
2 ENERGY MARKET IN CAMEROON 43 2.1 Overview of the Energy Situation 43 2.2 Energy Capacities, Production, Consumption and Prices 43 2.3 Market Actors and Regulation Structures 46
3 POLICY FRAMEWORK FOR RENEWABLE ENERGIES 47 3.1 Policies, Strategies and Programs for Renewable Energy Promotion 47 3.2 Regulations, Incentives and Legislative Framework Conditions 47
4 STATUS AND POTENTIAL FOR RENEWABLE ENERGIES 47 4.1 Biomass/Biogas 47 4.2 Solar Energy 48 4.3 Wind Power 48 4.4 Hydro Power 48
5 MARKET RISKS AND BARRIERS 48
6 RENEWABLE ENERGY BUSINESS INFORMATION AND CONTACTS 49
7 BIBLIOGRAPHY 50
8 ANNEX 51
Renewable Energies in West Africa 39CONTENTS
CAMEROON

ACRONYMS AND ABBREVIATIONS CAMEROON
AER Agence de l’Énergie Rural (Rural Electricity Board)
AES-Sonel AES Corporation – Société Nationale d‘Électricité du Cameroun (National Electrical Society of Cameroon)
ARSEL Agence de Régulation du Secteur de l’Électricité (Electricity Regulation Board)
CCNUCC Convention-cadre des Nations Unies sur les Changements Climatiques (United Nations Conventions on Climatic Changes)
CDM Clean Development Mechanism
CEMAC Communauté Économique et Monétaire de l‘Afrique Centrale (Monetary and Economic Community of Central Africa)
CPLC Cameroon Power and Lighting Company
CREF Cameroon Renewable Energy Fund
E+CO Investment company for local energy businesses in Africa, Asia & Latin America
ERA Environnement Recherche Action au Cameroun (Environmental Studies Action of Cameroon)
FCFA Franc de la Communauté Financière d‘Afrique (CFA Franc; 1 Euro = 655,957 FCFA)
GDP Gross Domestic Product
IEA International Energy Agency
INS Institut National de la Statistique du Cameroun (National Institute of Statistics)
MDG Millennium Development Goals
MINEE Ministère de l’Eau et de l’Énergie du Cameroun (Ministry of Energy and Water Resources)
MINIMIDT Ministère de l’Industrie, des Mines et du Développement Technique (Ministry of Industry, Mines and Technology
Development)
MSE Medium Size Enterprise
n.a. not applicable
NEAPRP National Energy Action Plan for the Reduction of Poverty
pm post meridiem
PRSP Poverty Reduction Strategy Paper
RE Renewable Energies
SCDP Société Camerounaise de Dépôt Pétroliers (Cameroon Petroleum Depot Society)
SNH Société Nationale des Hydrocarbures (National Hydrocarbons Corporation)
SNI Société Nationale d‘Investissement du Cameroun (National Investment Corporation)
SONARA Société Nationale de Raffinage (National Refinery Corporation)
SONEL Société Nationale d‘Électricité (National Electricity Corporation)
UNDP United Nations Development Program
USD United States Dollar
WAEMU West African Economic and Monetary Union
MEASUREMENTS
€ Euro (1 Euro = 655.957 FCFA)
d day
GWh gigawatt hour (1 GWh = 1,000,000 kilowatt hours (kWh)
km² square kilometer
kVA kilovolt ampere
kW kilowatt
kWh kilowatt hour
m² square meter
m³ cubic meter
mm millimeters
MW megawatt (1 MW = 1,000 kW)
º degree
t tons
TJ terajoule
toe tons of oil equivalent
TWh terawatt hour
Renewable Energies in West Africa 40ACRONYMS, ABBREVIATIONS AND MEASUREMENTS
CAMEROON

SUMMARY
The Country Study of Cameroon is to provide an overview of the country’s energy market and to support decision-making for private investments for the Renewable Energy (RE) sector in Cameroon. The study is structured as follows:
Chapter one provides Background Information on Cameroon. This includes an overview of geographical and climatic condi-tions, as well as the most important facts in view of political, economic and socio-economic conditions of Cameroon.
Chapter two summarizes facts and figures of Cameroon’s Energy Market including stakeholders and market actors in-volved as well as sector related regulations.
Chapter three presents the currently existing Political Frame-work for Renewable Energies in Cameroon. This includes an overview of support mechanisms for photovoltaic (PV) as well as existing regulations, incentives and legislative framework conditions concerning other RE technologies.
Chapter four provides a brief overview of the Status Quo and Potential for Renewable Energies in Cameroon.
Chapter five summarizes the existing and potential Market Risks and Barriers in general with focus on RE.
Chapter six presents a compilation of the most relevant Re-newable Energy Business Information and Contacts of Cam-eroon.
Renewable Energies in West AfricaSUMMARY 41
CAMEROON

1 COUNTRY INTRODUCTION
1.1 GEOGRAPHY AND CLIMATIC CONDITIONSCameroon is a unitary republic of Central and Western Africa and is bordered by Nigeria in the West; Chad in the North-east; the Central African Republic in the East and Equatorial Guinea, Gabon, and the Republic of the Congo in the South. With a total area of about 475,000 km² the country extends over 1,200 km from latitude 2 ° North to 13 ° North and over 800 km from longitude 3 ° East to 16 ° East. Cameroon is di-vided into 10 provinces that are again divided in divisions, subdivisions and districts.
Cameroon represents all major geographical, climatic and vegetation related characteristics of the African conti-nent, i. e. coastal, desert, mountain, rainforest, and savannah regions. The coastal plain extends over 150 kilometers from the Gulf of Guinea and is characterized by a hot and humid climate with a short dry season. The southern plateau is domi-nated by the equatorial rainforest with a less humid climate than the one in the coastal plain. In general, Cameroon has a humid climate with extensive rainfalls of up to 3,000 mm/year in the Northwest and up to 8,000 mm on the slopes of Mount Cameroon.
Renewable Energies in West Africa 42
CAMEROON
COUNTRY INTRODUCTION
1.2 POLITICAL, ECONOMIC AND SOCIO-ECONOMIC CONDITIONS
In comparison with other African countries, Cameroon en-joys a substantial political and social stability. Nevertheless, corruption and poverty are still major problems to be solved. The economic development of Cameroon – as in most devel-oping countries – is mainly based on the primary sector. With the production and export of primary products like cocoa, coffee, cotton, banana, pineapple rubber etc., Cameroon’s ag-ricultural sector is the largest in Central Africa. Incomes from farming and agricultural resources and the profits from the oil and forestry sectors, provide a solid basis for economic devel-opment in Cameroon. In 2002, the Gross Domestic Product (GDP) was estimated at 11.6 billion €, accounting for almost 50 % of the entire CEMAC zone with 25.34 billon €. The growth of GDP averaged 4 % during the period 1998–2005, almost the same level of growth as in the CEMAC zone, but above the average growth rate of 2.9 % in the West African Economic and Monetary Union (WAEMU/UEMOA) zone. Figure 2 presents the trend of GDP growth in 1998–2005.
With the implementation of the Poverty Reduction Strategy Paper (PRSP) in 2006, Cameroon reached the com-pletion point permitting creditors of Cameroon to grant debt alleviations of USD 28,000 million. In the overall socio-eco-nomic development, the availability of energy plays a crucial role. The improvement of economic profitability is necessary to attract private investors, to increase economic activity and to reduce poverty.
The initial analysis of the poverty reduction document made clear that too little attention had so far been given to the energy sector. In order to cope with this shortcoming, the Government of Cameroon – together with the United Nations Development Program (UNDP) and the World Bank – adopt-ed a national energy plan1 to reduce poverty and improve the access to energy in rural and urban areas of Cameroon.
1 PLAN D‘ACTION NATIONAL ÉNERGIE POUR LA RÉDUCTION DE LA
PAUVRETÉ (HTTP://GO.WORLDBANK.ORG/KFS10MN8V0)
MAP OF CAMEROON
Maroua
Garoua
Ngaoundéré
Bamenda
Bafoussam
Nkongsamba
DoualaYAONDEÉ
BIGHT OF BIAFRA
LimbohTerminal
FIGURE 2
Trend of GDP Growth in Cameroon, CEMAC and WAEMU
Source: Banque de France, Rapport Annuel de la Zone Franc, as of 2001, 2002, 2003, 2005
Cameroon
CEMAC
WAEMU
rate
of gr
owth
( %
)
1998 2001 2002 2003 2004 2005
2
1
4
7
8
5
3
0
6
20001999-1

Renewable Energies in West Africa
CAMEROON
COUNTRY INTRODUCTION
2 ENERGY MARKET IN CAMEROON
2.1 OVERVIEW OF THE ENERGY SITUATIONThe energy supply of Cameroon is mainly met by petroleum products and electricity. In the overall energy assessment of Cameroon, household cooking continues to be the prime fac-tor in energy consumption. Cameroon has a comparatively high RE potential. Especially the country’s Hydro Power potential offers a number of opportunities for future devel-opment. Table 1 provides the country’s energy mix, table 2 presents an overview of the country’s energy production and consumption by sector and source.
2.2 ENERGY CAPACITIES, PRODUCTION, CONSUMPTION AND PRICES
Hydroelectricity SectorCameroon has the second highest hydroelectric potential in Africa (after the Democratic Republic of Congo with about 774 TWh/year)2. The hydroelectric potential of Cameroon is estimated at 294 TWh/year. Table 3 presents an overview of the hydroelectricity potential.
43
Petroleum SectorEven though Cameroon is the seventh largest producer in Africa, the national production of hydrocarbons is modest. About 56 oilfields are currently in operation with an overall production of 84,000 barrels per day. Within the petroleum sector, the focus is on the rational management and the recov-ery of production associated gas (850 million m per annum). The foreseen decrease in oil production (about 50 % in less than 20 years) stimulated the National Hydrocarbons Corpo-ration (SNH) to take care of this issue. An active campaign towards the promotion of alternative energy resources aims at the doubling of available energy resources within a period of five years. Table 4 presents imports and exports of petroleum products.
Biomass SectorBiomass energy is used in both, the industrial and the resi-dential sector of Cameroon. About 75 % of the residential sector’s energy consumption is covered by biomass resources. Within the industrial sector of Cameroon, more than 90 % of the overall energy requirements are covered by energy from biomass. Since 2005, the utilization of biodiesel from palm oil has been developing as a new and promising market. Cur-rently, the produced biodiesel is mainly used for agricultural purposes. Almost 108,000 hectares of land are used for the oil palm cultivation. From 2001–2006, the cultivation area was enlarged by about 30,000 hectares in order to extend the existing cultivation area. The key issue for the future is to adopt and apply principles and criteria for sustainable palm oil production. Table 5 presents the consumption of biomass for energy purposes.
2 UNECA, 2009
TABLE 1
Energy Mix of Cameroon
Source: IEA, as of 2005
YEAR 1990 1995 2000 2002
Consumption of petroleum products (TJ)
38,560.0 36,383.0 40,403.0 41,449.3
Consumption of electricity (97 % hydro)
8,438.4 7,837.2 9,788.4 9,133.2
Consumption of biomass (TJ 159,987.0 183,000.0 208,740.0 218,137.0
Total consumption (TJ) 206,985.0 227,220.0 258,931.0 268,720.0
TABLE 2
Overview of Energy Production and Consumption Figures by Sector and Source
Source: IEA, as of 2005
TYPE OF SOURCE (TOE) 1990 1995 2000 2001 2002 2003
Production of crude oil 7,930.0 6,208.0 7,346.0 7,025.0 6,439.0 6,419.0
Production of RE 3,820.5 4,370.0 4,984.7 5,094.4 5,209.1 5,322.3
Production of charcoal n.a. n.a. 49.5 50.5 51.5 52.5
Thermal production of electricity 3,526.0 2,752.0 3,268.0 5,762.0 10,148.0 13,416.0
Hydroelectricity 228,416.0 236,758.0 296,012.0 298,800.0 273,652.0 303,408.0
Production of petroleum products 838.0 1,220.0 1,543.0 1,49.00 1,177.0 1,401.0
Export of crude oil –7,067.0 –4,945.0 –5,717.0 –5,452.0 –5,146.0 –4,957.0
Export of petroleum products –42.0 –343.0 –545.0 –519.0 –275.0 –467.0
Consumption of petroleum products 921.0 869.0 965.0 946.0 990.0 1,010.0
Industry sector n.a. n.a. n.a. n.a. 67.0 63.0
Transport sector 603.0 593.0 647.0 662.0 721.0 732.0
Consumption of electricity 201,584.0 187,222.0 233,834.0 226,352.0 218,182.0 241,402.0
Industry sector 116,874.0 109,994.0 130,376.0 122,980.0 96,148.0 108,876.0

Renewable Energies in West Africa
CAMEROON
COUNTRY INTRODUCTION 44
TABLE 4
Exports and Imports of Petroleum Products
YEAR 1990 1995 2000 2001 2002 2003
Crude oil (1,000 t) 7,930 6,208 7,346 7,025 6,439 6,419
Export of crude oil (1,000 t) –7,067 –4,945 –5,717 –5,452 –5,146 –4,957
Import of crude oil (1,000 t) –42 –343 –545 –519 –275 –467
Production of petroleum products (1,000 t)
838 1,220 1,543 1,490 1,177 1,401
Final consumption of petro-leum products (1000 t)
921 869 965 946 990 1,010
Consumption in the trans-port sector (1,000 t)
603 593 647 662 721 732
Source: IEA, as of 2005
TABLE 5
Consumption of Biomass (in tons)
YEAR 1999/2000 2000/2001 2001/2002 2002/2003 2003/2004
Firewood 9,120,070 9,375,432 9,423,210 9,468,152 9,288,530
Charcoal 81,303 83,580 84,790 86,100 90,500
Source: MINEE, Cameroon Statistics Directory, as of 2006 and INS, 2006
TABLE 6
Production and Consumption of Electricity by Sector (in million kWh)
YEAR 2000/2001 2001/2002 2002 2003 2004 2005
Global production 3,534,599 3,300,587 3,413,104 3,686,444 3,919,679 4,003,825
Thermal 61,023 118,728 110,511 157,619 190,364 231,552
Hydro Power plan 3,473,576 3,181,859 3,302,593 3,528,826 3,729,315 2,772,273
Network transmission 3,443,524 3,271,202 3,374,998 3,654,626 3,885,116 3,956,161
Consumption 2,799,249 2,511,997 n.a. 2,802,320 3,094,773 3,264,407
Low voltage 751,480 773,449 n.a. 846,128 977,889 1,071,965
Mid – low voltage 618,157 620,287 n.a. 707,553 724,103 747,815
Special customers 1,429,611 1,118,261 n.a. 1,248,639 1,392,781 1,444,626
Number of subscribers 452,994 484,563 493,766 505,361 507,838 528,049
Low voltage subscribers 1,151 1,154 1,207 1,214 1,258 n.a.
High voltage subscribers 5 5 3 3 3 3
Source: AES-SONEL, Cameroon Statistics Directory, as of 2006 and INS, 2006
Overall Energy ConsumptionThe overall energy consumption per inhabitant is estimated at 0.4 toe and 200 kWh of electricity produced with Hydro Power. Due to the limited availability of sufficient data, con-sumption figures are only valid for 2002 and 2003. In 2003, about 65,595 GWh of RE (94.4 % from biomass and 5.6 % from Hydro Power) were produced in Cameroon. In the same year, the residential sector’s energy mix consisted of 75 % RE, essentially biomass (48,938 GWh) and hydroelectricity (428 GWh). The industrial sector consumed almost 17.4 % of RE, especially biomass (1,0150 GWh) and hydroelectricity (1,266 GWh). Table 6 presents an overview of the electricity production and consumption by sector.
Electricity PricesIn Cameroon, electricity tariffs are established at national lev-el by a joint decision of the Ministry of Energy and the Min-istry of Trade in agreement with AES-Sonel and ARSEL. The tariffs are standardized throughout the day but vary in two seasonal tariffs (dry season with higher prices compared to the rainy season). The price for average voltage is distinguished in two billing periods, the rush-hours (between 6–11 pm) and the slack period. The actual price for electricity is determined according to the overall consumption and the subscribed tar-iff. High voltage tariffs are directly negotiated between the individual consumer and the producer. The various electricity tariffs of Cameroon are presented in Tables 6 a–d.
Source: MINEE, as of 2006
TABLE 3
Hydroelectricity Potential in Cameroon
REGION SITE/RIVER NATURAL POTEN-TIAL (TWH)
DEVELOPMENT POTENTIAL (TWH)
HYDRO POWER PLAN (MW)
SanagaSanaga 162 72 5,600
Mbam n.a. n.a. 1,600
Southwest
Nyong 17 7 700
Ntem 22 8 1,000
Other Region 8 3 500
West
Wouri (Noun) 10 5 3,300
Katsina 9 5 n.a.
Manyu Munaya 6 2 n.a.
Other Region 7 2 650
East
Dja 13 4 n.a.
Boumba 8 2 n.a.
Kadei 5 1 n.a.
Other Region 2 1 350
NorthBenoue Faro 14 2 n.a.
Vina du Nord 10 2 n.a.
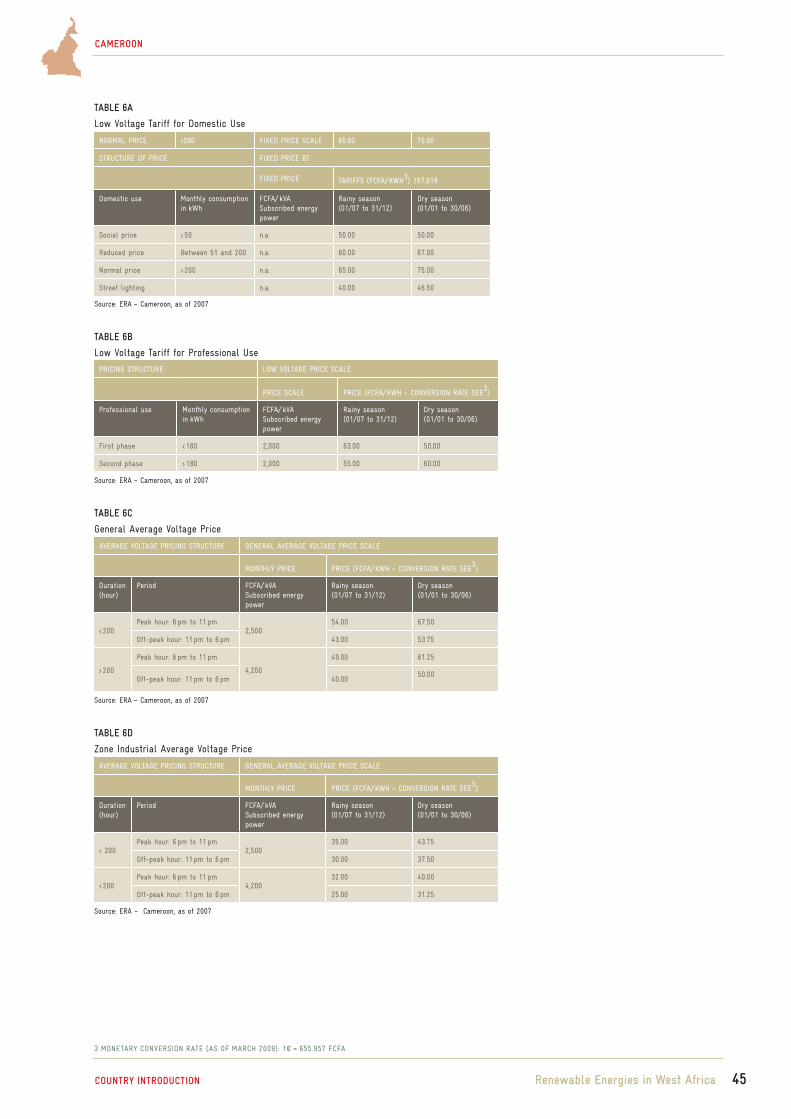
Renewable Energies in West Africa 45
CAMEROON
COUNTRY INTRODUCTION
TABLE 6A
Low Voltage Tariff for Domestic Use
NORMAL PRICE >200 FIXED PRICE SCALE 65.00 75.00
STRUCTURE OF PRICE FIXED PRICE BT
FIXED PRICE TARIFFS (FCFA/ KWH3) 157,619
Domestic use Monthly consumption in kWh
FCFA/ kVASubscribed energy power
Rainy season(01/07 to 31/12)
Dry season(01/01 to 30/06)
Social price < 50 n.a. 50.00 50.00
Reduced price Between 51 and 200 n.a. 60.00 67.00
Normal price > 200 n.a. 65.00 75.00
Street lighting n.a. 40.00 46.50
Source: ERA – Cameroon, as of 2007
TABLE 6B
Low Voltage Tariff for Professional Use
PRICING STRUCTURE LOW VOLTAGE PRICE SCALE
PRICE SCALE PRICE (FCFA/ KWH – CONVERSION RATE SEE3)
Professional use Monthly consumption in kWh
FCFA/ kVASubscribed energy power
Rainy season(01/07 to 31/12)
Dry season(01/01 to 30/06)
First phase < 180 2,000 63.00 50.00
Second phase > 180 2,000 55.00 60.00
Source: ERA – Cameroon, as of 2007
TABLE 6C
General Average Voltage Price
AVERAGE VOLTAGE PRICING STRUCTURE GENERAL AVERAGE VOLTAGE PRICE SCALE
MONTHLY PRICE PRICE (FCFA/ KWH – CONVERSION RATE SEE3)
Duration(hour)
Period FCFA/ kVASubscribed energy power
Rainy season(01/07 to 31/12)
Dry season(01/01 to 30/06)
< 200Peak hour: 6 pm to 11 pm
2,50054.00 67.50
Off-peak hour: 11 pm to 6 pm 43.00 53.75
> 200
Peak hour: 6 pm to 11 pm
4,200
49.00 61.25
Off-peak hour: 11 pm to 6 pm 40.0050.00
Source: ERA – Cameroon, as of 2007
TABLE 6D
Zone Industrial Average Voltage Price
AVERAGE VOLTAGE PRICING STRUCTURE GENERAL AVERAGE VOLTAGE PRICE SCALE
MONTHLY PRICE PRICE (FCFA/ KWH – CONVERSION RATE SEE3)
Duration(hour)
Period FCFA/ kVASubscribed energy power
Rainy season(01/07 to 31/12)
Dry season(01/01 to 30/06)
< 200Peak hour: 6 pm to 11 pm
2,50035.00 43.75
Off-peak hour: 11 pm to 6 pm 30.00 37.50
> 200Peak hour: 6 pm to 11 pm
4,20032.00 40.00
Off-peak hour: 11 pm to 6 pm 25.00 31.25
3 MONETARY CONVERSION RATE (AS OF MARCH 2009): 1€ = 655.957 FCFA
Source: ERA - Cameroon, as of 2007

Renewable Energies in West Africa 46
CAMEROON
COUNTRY INTRODUCTION
4 MONETARY CONVERSION RATE (AS OF MARCH 2009): 1€ = 655.957 FCFA.
5 PECTEN CAMEROON, NOBLE ENERGY, PETRONAS CARIGALI SDN BHD, PERENCO
CAMEROUN, KOSMOS ENERGY, ADDAX PETROLEUM CAMEROON, GLENCORE EXPLORA-
TION LTD, AFEX GLOBAL LTD, STERLING OIL & GAS, EUROIL LTD, RSM PRODUCTION
CORPORATION, RODEO RESOURCES, PETROVIETNAM EXPLORATION PRODUCTION LTD,
PRONODAR LTD.
Price of Petroleum ProductsThe actual price of petroleum products is fixed by the Gov-ernment and depends on the fluctuation of the international crude oil price. Figure 3 presents the price trend of various petroleum products. The current prices of the main petroleum products are presented in Table 7.4
Market StrategiesIn order to improve the framework conditions of the energy market in Cameroon, several strategies are to be implemented. This includes the development of new electricity production facilities (mainly for Hydro Power), the modernization of the national electricity network and distribution infrastructure and the promotion of modern energy services (with special focus on rural areas). Therefore, the National Energy Action Plan for the Reduction of Poverty (NEAPRP) aims to provide modern energy services to 1,263 education centers, 923 health centers and 191 drinking water supply networks. Within the petroleum sector of Cameroon, the Government aims to liber-alize the market and promote private investments. Several re-forms are already being implemented in order to improve the overall market for oil refinery sector. Up to now, no Govern-mental strategy has been realized for the promotion of RE.
2.3 MARKET ACTORS AND REGULATION STRUCTURESThe energy sector of Cameroon consists of several market ac-tors and institutional stakeholders. Law 1998/022 of 24 De-cember 1998 was passed to reform the institutional frame-work of the electricity sector in Cameroon.
The National Electricity Corporation (SONEL) is ex-clusively in charge of the electricity supply in urban areas of Cameroon, whereas the electricity supply in rural areas is not regulated at all.
The Ministry of Energy and Water Resources (MI-NEE) defines policies in the overall energy sector and grants concessions and licenses to market actors. Other tasks include the development of the energy sector, the planning of rural electrification and the promotion of RE. The main focus of activities is on the electricity sector. Up to now, only the En-ergy Master Unit, a service of the department of electricity, is taking initial steps towards the promotion of RE.
The Electricity Regulation Board (ARSEL) supervises and regulates the electricity sector, ensures the financial sta-bility and approves of investments. Further tasks include the management of concessions and licenses, the authorization of electricity supply in rural areas, consumer protection and the promotion of private investments.
The Rural Electrification Board ensures the promotion of modern electricity services by granting operators and con-sumers technical and financial assistance in order to develop and implement RE for rural electrification strategies.
The National Operator AES-Sonel is the main elec-tricity producer and supplier in Cameroon. The company is controlled by the AES Corporation, the Government of Cam-eroon and the AES Cameroon Holding.
The petroleum sector of Cameroon is dominated by the National Hydrocarbon Corporation (SNH), the National Refinery Corporation (SONARA) and the Société Cameroun-aise de Dépôt Pétroliers (SCDP). The distribution sub-sector has been liberalized, and activities are being shared between multinational companies like MOBIL, TOTAL and TEXA-CO. On top of that, several approved national companies5 are active in the petroleum sector of Cameroon.
TABLE 7
Prices of Petroleum Products
Product End Consumer Price Additional Charge
Gasoline 594 FCFA 5 to 15 FCFA
Diesel 549 FCFA 5 to 15 FCFA
Lamp oil 350 FCFA 5 to 20 FCFA
Source: ERA – Cameroon, as of 2007
FIGURE 3
Price Trend of Petroleum Products (July 1999–July 2008)
Source: INS, as of 2006, and Cameroon Tribune, as of 29 July 2008
01999 2000 2001 2002 2003 2004 2005 2006
200
400
700
800
500
300
100
2007 2008
kerosene
gasoil
petrol

Renewable Energies in West Africa 47
CAMEROON
COUNTRY INTRODUCTION
3 POLICY FRAMEWORK FOR RENEWABLE ENERGIES
3.1 POLICIES, STRATEGIES AND PROGRAMS FOR RENEWABLE ENERGY PROMOTION
The Government of Cameroon has already developed a strat-egy aiming at the modernization of the country’s electricity sector. Even though this includes several measures to facilitate the introduction of RE, no fiscal incentives are available so far.
For the provision of modern energy services to rural areas of Cameroon, the Government has implemented the Rural Electrification Board. The board’s task is to support the allocation of licenses for electricity production in order to in-crease the production capacity in rural areas of Cameroon.
The investment company E+CO and the National In-vestment Corporation (SNI) have created the Fund for Mod-ern and Renewable Energy Resources (Cameroon Renewable Energy Fund – CREF). The fund’s mission is to increase the availability of modern energy services through the provision of capital and expertise for the development of energy projects in the field of Hydro Power and biomass energy. Moreover, CREF offers an opportunity to mobilize concession-based fi-nancing and private sector investments. The involvement of new market actors aims to promote the development of a pro-duction and distribution infrastructure and to ease the trans-fer of knowledge and modern technologies.
3.2 REGULATIONS, INCENTIVES AND LEGISLATIVE FRAMEWORK CONDITIONS
The recent reform of the national electricity sector of Cam-eroon aims to liberalize the overall electricity sector. After a transitional period of five years, the monopolist SONEL will be privatized. Moreover, the wholesale market for electricity will be liberalized in order to allow consumers to choose freely between several suppliers.
The free access for new market actors and operators through competitive calls for tender is supplemented by the creation of a solid management structure for the distribution network. The enhanced involvement of the local authorities aims to improve the implementation of policies for rural elec-trification. This includes the adoption of the National Rural Electrification Plan and the Energy Plan for Poverty Reduc-tion.
For the implementation of the Clean Development Mechanism (CDM), Cameroon has ratified the United Na-tions Framework Convention on Climate Change on 19 Oc-tober 1994 and the Kyoto Protocol on 23 July 2002. Moreo-ver, Cameroon has created a designated national authority for CDM in 2006 while the Ministry of Environment and Nature Protection established a national committee for the implementation of CDM projects. The criteria and indica-tors defined for the promotion of a sustainable development in Cameroon serve as a basis for approving of future CDM projects.
4 STATUS AND POTENTIAL FOR RENEWABLE ENERGIES
4.1 BIOMASS/BIOGASFor small and medium size enterprises operating in the forest sector, there are numerous opportunities to produce energy from biomass. In 2006, 66 units with a transformation capac-ity of 2.7 million m3 were identified. Nine of the sites were equipped with a biomass drying machine and with gasoline generators for the production of the required in-house elec-tricity.
An inventory of the electricity in-house production structures in 2006 identified the new energy technologies al-ready in use. The most used technologies are based on cogen-eration, namely of steam turbines using gas or biomass. The cogeneration technologies from biomass are mainly applied in the food industry sector. The overall capacity of steam tur-bines using biomass is estimated at 12.8 MW. This shows that local enterprises already have a good grasp of this technology. Table 8 presents an overview of companies that already have implemented steam turbines for energy cogeneration.
The identified biomass potential of Cameroon mainly originates from national agro- and wood industries. Table 9 presents available biomass residues from wood transformation activities. Table 10 presents available biomass residues for the most relevant crops.
TABLE 8
Companies Using Steam turbines for Energy Cogeneration
Source: ERA – Cameroon, as of 2007
COMPANY UNITS TOTAL CAPACITY (kW)
PAMOL (Lobe) 1 310
PAMOL ( Mudemba) 1 450
SPFS (Fermes Suisses, Edea farms) 1 1,124
SOSUCAM (Nkoteng) 1 9,054
SODECOTON 1 400
Global 8 12,801
TABLE 9
Biomass Residues of the Wood Transformation Sector
Source: ERA – Cameroon, as of 2007
SECTOR COMPANIES ANNUAL CAPACITY (m3)
Simple sawmills and sawmills with drier 45 1,475,000
Integrated sawmill with carpentry 13 792,000
Roll-out factory, jib board or cutting 8 412,000
Global 66 2,679,000
TABLE 10
Available Biomass Residues from Crops
Source: ERA – Cameroon, as of 2006
CROP RESIDUES ANNUAL CAPACITY (m3 / tons)
Rubber Timber 132,000 m3
Cotton Cotton/seed cake 147,642 tons/45,780 tons
Robusta coffee Chaff 145,900 tons
Sugar cane Bagasse/molasses 244,750 tons/32,040 tons
Palm oil Stalks/palm kernel shells 57,695 tons/28,847 tons

48
CAMEROON
COUNTRY INTRODUCTION
4.2 SOLAR ENERGYThe solar energy potential is abundant, but not sufficiently developed (South: up to 4 kWh/d/m2; North: up to 5.8 kWh/d/m2). Currently, only about 50 small PV installations are implemented in Cameroon. The sites include several health care centers, telecommunication relay stations, isolated train stations, churches and police stations. Only very few PV mod-ules are installed at private households (as of 2006, only 6 installations were identified).
4.3 WIND POWERThe potential for wind power is but marginal. In the North and in some coastal zones there are some favorable sites for wind energy. Currently, only two rapid wind turbines are in-stalled at a hotel in Douala.
4.4 HYDRO POWERThe potential for small Hydro Power installations (up to 1 MW) is estimated at 1.115 TWh, mainly in the eastern and western regions of Cameroon. In spite of the considerable po-tential, small Hydro Power installations are almost non-existent in Cameroon. Very few are located in the North and the South-west of the country. Projected investments for the construction of Hydro Power installations are estimated at 1,330.7 million Euros (80 % of the global investment). 38.1 million Euros are to be invested in the construction of small Hydro Power instal-lations that will guarantee the electricity supply for seven iso-lated areas of Cameroon. Table 11 presents future investments in the Hydro Power sector of Cameroon.
5 MARKET RISKS AND BARRIERS
The development of industrial and commercial activities in the field of RE in Cameroon is currently hindered by sev-eral constraints. In general, the institutional environment of Cameroon does not encourage investments at all. This is due to insufficient investment regulations and a lack of standards and quality control mechanisms. The misjudgment of poten-tial risks for RE projects makes it almost impossible to col-laborate with traditional financial institutes. Therefore, many progressive projects are blocked due to inadequate financing mechanisms.
The lack of basic prerequisites makes it very difficult to establish a national market for RE. Unreliable infrastruc-ture, insufficient distribution networks, anticompetitive com-mercial framework as well as administrative bottlenecks and financial insecurity are the most important risks and barriers.
Recently, the institutional landscape of electricity pro-duction and electricity supply has been revised. New laws for the liberalization of the overall electricity sector are already implemented. The company AES-Sonel emanated from the privatization of Sonel and now holds a concession for the sup-ply sector.
As of now, the production and distribution for large-scale consumers (more than 1 MW of subscribed capacity) is fully open to competition. The rural areas of Cameroon are not affected by the concession, therefore the production, transport and distribution of electricity is entirely liberalized. Since there are only very few large-scale consumers, the most profitable urban zone is almost exclusively supplied by AES-Sonel which again creates a monopoly.
New operators are forced to join the market at the conditions of AES-Sonel. As the cost of transportation within the existing network has not been defined yet, there are several uncertainties that prevent investments.
Renewable Energies in West Africa
TABLE 11
Future Investments in the Hydro Power Sector of Cameroon (2005–2015)
Source: Ngnikam, as of 2007
SITE/CAPACITY INVESTMENT (MIO €)
Edea/Song Loulou (30 MW) 76.22
Lom Pamgar (170 MW) 76.22
Nachtigal (280 MW) 228.67
Warak (75 MW) 114.33
Song Dong (280 MW) 266.78
Meve ‚Elé (200 MW) 304.9

Renewable Energies in West Africa 49
CAMEROON
COUNTRY INTRODUCTION
6 RENEWABLE ENERGY BUSINESS INFORMATION AND CONTACTS
INSTITUTION CONTACT FIELD OF ACTIVITY
RWKING Corporation P.O Box 4022 DoualaPhone: +237 33 42 59 45Fax: +237 33 42 22 [email protected]
Specialized in the supply and main-tenance of industrial equipment and energy equipment
OMNIUM SIRA P.O Box 15474 DoualaStreet DrouotPhone: +237 33 37 74 86Fax: +237 33 37 74 [email protected]
Supplier and service provider in the field of RE
MAGUYSAMA Technologies P.O Box 5033 DoualaPhone: +237 33 40 92 81Fax: +237 33 40 92 [email protected]
Energy supply systems for private and commercial applications
Environnement Recherche Action au Cameroun (ERA – Cameroun)
P.O Box 3356 YaoundéPhone: +237 22 31 56 [email protected]
NGO active in the bioenergy sector
Cameroon Power andLighting Company (CPLC)
P.O Box 2425 DoualaPhone: +237 99 82 92 [email protected]
Supplier of solar equipment
GECOSER P.O Box 20440 YaoundéPhone: +237 22 21 23 62Fax: +237 22 20 04 [email protected]
Supplier of solar equipment
TABLE 12Local Business Partners
MINISTRY/CORPORATION CONTACT FIELD OF ACTIVITY
Ministry of Energy and Water Resources(MINEE)
Minister’s Cabinet:Phone: +237 22 22 34 00Fax: +237 22 22 61 77
Department of Electricity:Phone: +237 22 22 20 99
Definition of policies regarding energy, granting concessions and licenses, promotion of RE
Ministry of Industry, Mines and Technology Development (MINIMIDT)
Phone: +237 22 22 38 71Fax: +237 22 22 95 86
Definition of policies regarding mines and technology development, control of industrial installations
Electricity Regulation Board (ARSEL) P.O Box. 6064 YaoundéPhone: +237 22 21 10Fax: +237 22 21 10 14
Supervision and regulation of the electricity sector
Rural Electricity Board (AER) P.O Box 30704 YaoundéPhone: +237 22 21 23 84Fax: +237 22 21 23 81
Promotion of rural electrification
National Investment Corporation (SNI) P.O Box. 423 YaoundéPhone: +237 22 22 44 22Fax: +237 22 23 13 [email protected]
Financing of development projects and projects in the electricity sector
National Hydrocarbon Corporation (SNH) P.O Box.955 YaoundéPhone: +237 22 20 19 10Fax: +237 22 20 98 61
P.O Box.955 YaoundéPhone: +237 22 20 19 10Fax: +237 22 20 98 61
TABLE 13Sector-specific Ministries and Corporations of Cameroon

Renewable Energies in West Africa 50
CAMEROON
BIBLIOGRAPHY
7 BIBLIOGRAPHY
ARSEL (2006): Energy Survey Work Document CEMAC (2006): Action Plan for the Promotion of Energy in the CEMAC Zone (final report of the study realized by “IED”)
Central Intelligence Agency – CIA (2009): World Fact Book (www.cia.gov/library/publications/the-world-factbook)
ERA – Cameroon, ENEFIBIO (2006): The Cameroon Preliminary Report
(www.cgdev.org) ERA – Cameroon, ENEFIBIO (2007): Cameroon Medium Size Enterprises (MSE) Investigation Report, EU, COPENER ProgramIEA (2005): Statistics of Energy of the Non-member Countries of OCDE 2002–2003
International Rivers (2005): LOM PANGAR DAM, CAMEROON. Drought Could Cripple Cameroon’s Hydro-Heavy Energy Sector (www.irn.org/programs/lom-pangar/pdf/050105lpfact.pdf)
MINEE (2006): Long-term Development Plan of the Electricity Sector 2006
MINEPAT (2003): Cameroon: Progress of the Millennium Goals for Development (MGD)
Ministry of Environment and Forestry (2001): Initial National Communication of Cameroon within the Framework of the United Nations Conventions on Climatic Changes (CCNUCC), Yaoundé
National Institute of Statistics – INS (2003): Second Investigation in Cameroon Done in Households: Poverty and Gender in Cameroon in 2001
National Institute of Statistics – INS (2004): Third Health Population Investigation (EDS III)
National Institute of Statistics – INS (2002): Second Investigation in Cameroon Done in Households: Poverty and Job Market in Cameroon in 2001
National Institute of Statistics – INS (2002): The Living Conditions of the Population and the Poverty Profile in Cameroon in 2001
National Institute of Statistics – INS (2006): Cameroon Statistical Yearbook 2006, Yaoundé
Ngnikam, E. (2007): Reinforcing the Resilience to the Climatic Change, Cameroon Report Yaoundé
Ngnikam, E. (2006): World Observatory of Energy Viability: Cameroon Report, Yaoundé
Ngnikam, E., Tanawa E. (1998): World Observatory of Energy Viability: Cameroon Report (available on the website of Helio International, www.helio-international.org)
Republic of Cameroon (2005): Strategy Reduction Poverty Paper (the June 2005 revised version), Yaoundé
Republic of Cameroon (2003): Strategy Reduction Poverty Paper, Yaoundé
Tamba, J. C., Tchatchouang; Doua, R. (2007): The Central Africa, the Paradox of Resources: Extractives Industries, Governance and Social Development in the CEMAC States
The World Bank (2007): Plan d‘Action National Énérgie pour la Réduction de la Pauvreté (http://go.worldbank.org/KFS10MN8V0)
United Nations Economic Commission for Africa – UNECA (2009): African Transport & Energy Infrastruc-ture Atlas (http://geoinfo.uneca.org/africaninfrastructure/?pageToDisplay=energy)

ANNEX Renewable Energies in West Africa 51
CAMEROON
8 ANNEX
FIGURE 4
Map of the Northern Electricity Network of Cameroon
Source: MINEE, as of 2006
FIGURE 5
Map of the Southern Electricity Network of Cameroon
Source: MINEE, as of 2006

COUNTRY CHAPTER:
CAPE VERDE
Author of Country Chapter Louis Seck (MSc., DEA, MBA) Coordination and Review of the Country ChapterAnton Hofer, (MSE, Dipl.-Ing./FH, M.A.)WIP-Renewable Energies www.wip-munich.deMunich, Germany
Editor Deutsche Gesellschaft für Technische Zusammenarbeit (GTZ) GmbHDepartment Water, Energy, TransportDag-Hammarskjöld-Weg 1-565760 Eschborn, Germanywww.gtz.de
On behalf of Federal Ministry for Economic Cooperation and Development (BMZ)
Editorial staffDiana KraftTel: +49 (0)6196 79 4101Fax: +49 (0)6196 79 80 4101Email: [email protected]
52Renewable Energies in West Africa

CONTENTS CAPE VERDE
ACRONYMS, ABBREVIATIONS AND MEASUREMENTS 54
SUMMARY 55
1 COUNTRY INTRODUCTION 56 1.1 Geography and Climatic Conditions 56 1.2 Political, Economic and Socio-economic Conditions 56
2 ENERGY MARKET IN CAPE VERDE 57 2.1 Overview of the Energy Situation 57 2.2 Energy Capacities, Production, Consumption and Prices 57 2.3 Market Actors and Regulation Structures 58
3 POLICY FRAMEWORK FOR RENEWABLE ENERGIES 58 3.1 Policies, Strategies and Programs for Renewable Energy Promotion 58 3.2 Regulations, Incentives and Legislative Framework Conditions 58
4 STATUS AND POTENTIAL FOR RENEWABLE ENERGIES 59 4.1 Biomass/Biogas 59 4.2 Solar Energy 59 4.3 Wind Power 59 4.4 Hydro Power 59
5 MARKET RISKS AND BARRIERS 59
6 RENEWABLE ENERGY BUSINESS INFORMATION AND CONTACTS 60
7 BIBLIOGRAPHY 61
53CONTENTS
CAPE VERDE
Renewable Energies in West Africa

ACRONYMS AND ABBREVIATIONS
CAPE VERDE
ARE Agência de Regulação Económica (Agency for Economic Regulation) CVE Cape Verdean Escudo (1 Euro = 1,010 CVE) DGIE Direcção Geral da Indústria e Energia (General Direction of Industry and Energy) GDP Gross Domestic Product HDI Human Development Index LPG Liquefied Petroleum Gas MDG Millennium Development Goals ONG/NGO Organisation Non Gouvernementale (Non Governmental Organization) PAICV Partido Africano da Independência de Cabo Verde (African Party for the Independence of Cape Verde) PAIGC Partido Africano da Independência da Guiné e Cabo Verde (African Party for the Independence of Guinea-Bissau and Cape Verde) PROMEX Centro de Promoção Turística, do Investimento e das Exportações de Cabo Verde (Center for Tourism and Export Promotion of Cape Verde) PRS Programme Régional Solaire (Solar Regional Program) PV Photovoltaic RE Renewable Energies UNDP United Nations Development Program USD United States Dollar
MEASUREMENTS
€ Euro (1 Euro = 1,010 Cape Verdean Escudo) km kilometer km² square kilometer kWh kilowatt hour m/s meters per second mm millimeters MW megawatt (1 MW = 1,000 kW) ºC degree Celsius toe tons of oil equivalent
54ACRONYMS, ABBREVIATIONS AND MEASUREMENTS
CAPE VERDE
Renewable Energies in West Africa

SUMMARY
The provision of modern energy services is a crucial aspect for economic development and the enhancement of social stand-ards. The limited access to energy in general and modern en-ergy services in particular, is a massive barrier towards future development of semi-urban and rural areas.
Likewise the lack of appropriate policies and regulations are significant constraints towards the development of an efficient market for Renewable Energies.
The Country Study of Cape Verde is to provide an overview of the country’s energy market and to support decision-making for private investments for the Renewable Energy (RE) sector in Cape Verde. The study is structured as follows:
Chapter one provides Background Information on Cape Verde. This includes an overview of geographical and climat-ic conditions, as well as the most important facts in view of political, economic and socio-economic conditions of Cape Verde.
Chapter two summarizes facts and figures of Cape Verde’s Energy Market including stakeholders and market actors in-volved as well as sector related regulations.
Chapter three presents the currently existing Political Frame-work for Renewable Energies in Cape Verde. This includes an overview of support mechanisms for photovoltaic (PV) as well as already existing regulations, incentives and legislative framework conditions concerning other RE technologies.
Chapter four provides a brief overview of the Status Quo and Potential for Renewable Energies in Cape Verde.
Chapter five summarizes the existing and potential Market Risks and Barriers in general with focus on RE.
Chapter six presents a compilation of the most relevant Renewable Energy Business Information and Contacts of Cape Verde.
Renewable Energies in West AfricaSUMMARY 55
CAPE VERDE

1 COUNTRY INTRODUCTION
1.1 GEOGRAPHY AND CLIMATIC CONDITIONSCape Verde is an archipelago off the western coast of Afri-ca, located between the equator and the Tropic of Cancer at 15 ° 02’ North and 23 ° 34’ West. It is situated about 455 km from the West African coast (Dakar, Senegal) and 1,400 km South South-West of the Canary Islands. With a surface of 4.033 km2, it consists of ten major islands and about eight islets. The relief is mountainous and of vol-canic origin. Cape Verde has a Sahelian climate tempered by the oceanic position of the country.
Rainfalls vary from 300 mm/year in the South West to 1,500 mm/year in the North East of the island. Rainfall is very irregular from one year to another and poorly distributed in space. The driest areas are located at the coast. They receive an average of 0 to 300 mm of water per year. The slopes un-der wind receive more rain and areas of altitude above 600 m may receive up to 800 mm of rain per year. The rainy season is between July and October in low altitude, but mountain areas may also receive small rains during the dry season. The seasons are marked by the alternation of winds from North and East during the dry season (November to July) and by marine winds in South East South direction during the rainy season. In the dry season, the winds of the North provide a cool climate and weather, while winds of continental North East – corresponding to the Harmattan1 – bring a dry climate. These winds can be violent during the winter for several days. Extreme temperatures remain within a relatively restricted in-terval because of the oceanic position of the territory. These temperatures rarely exceed 38 °C in summer, while minimum temperatures around 0 °C can be observed at high altitudes e. g. on the volcano of Fogo, particularly during the months of December and January. The average temperature per month varies between 22 °C and 28 °C. It is higher during the wet season, sometimes softened by the ocean, with maximum val-ues in September and minimum values in February.
1.2 POLITICAL, ECONOMIC AND SOCIO-ECONOMIC
CONDITIONSCape Verde is a former Portuguese colony and one of the first countries in Sub-Saharan Africa to switch from a single-party to a pluralistic democratic system. During the first years af-ter independence (achieved in 1975), the political landscape is dominated by the African Party for the Independence of Guinea-Bissau and Cape Verde (PAIGC), transformed in 1981 after the separation from Guinea Bissau to the African Party for the Independence of Cape Verde (PAICV).
The population of the Cape Verde is estimated at 487,118 inhabitants in 2006. 53 % of the population is fe-male. In the two major urban centers – Praia and Mind-elo – approximately 39 % of the population are concentrated. 700,000 inhabitants of Cape Verde constitute the Diaspora and live abroad. The growth rate of the population between 2000 and 2006 is 1.8 %. The life expectancy is 72.3 years while the rate of schooling is 72 % (for young people) and 79 % (for adults).
Renewable Energies in West Africa 56
CAPE VERDE
COUNTRY INTRODUCTION
In spite of the good development of its economy (see below), the unemployment of young people under 25 years is 21.1 % in Cape Verde. The general poverty rate rose from 30 % in 1989 to 37 % in 2002, while the rate of extreme poverty changed from 14 % to 20 % over the same period. 70 % of the poor and 85 % of very poor live in rural areas. In general, poverty rate and unemployment are on the decline.
The economy of the Cape Verde is characterized by the prevalence of the following sectors: tourism (177 hotels), fish-ing (14 % of the population), construction, trade and services of public administration. The agricultural sector is fragile, but constitutes the principal activity of the rural population by employing more than 50 % of the working population. In-sufficiency of local resources is compensated by the flow of goods and services from outside the country, financed by in-ternational cooperations in form of gifts and loans and by the Diaspora (the latter is providing approximately 140 million USD per year).
The revenue per capita has risen from 190 USD in 1975 to 2,316 USD in 2006. Primary school enrolment is about 100 % while life expectancy is over 70 years. There has been a strong and continuous improvement in human devel-opment. The Human Development Index (HDI) increased from 0.587 in 1990 to 0.722 in 20062. Today, Cape Verde has already achieved some of the Millennium Development Goals (MDP) while it is on target to achieve the rest by 2015. Between 2001 and 2006, the Gross Domestic Product (GDP) showed an average growth of 6.2 % (10.9 % in 2006) while inflation remained weak at around 2 %. Table 1 presents an overview of the economy of Cape Verde.
1 THE HARMATTAN IS A DRY AND DUSTY WEST AFRICAN TRADE WIND, BLOWING SOUTH
FROM SAHARA INTO THE GULF OF GUINEA BETWEEN THE END OF NOVEMBER AND THE
MIDDLE OF MARCH (WINTER).
2 UNDP, AS OF 2006
Santo Antão
MINDELO
SãoVicente
Santa LuziaSão Nicolau
Boa Vista
SANTA MARIA
Sal
Maio
SãoTiago
PRAIAFogo
TARRAFAL
Brava
North AtlanticOcean
I lhas do Bara ivento
I lhas
do Sotavento
FIGURE 1
Map of Cape Verde
80 miles

CAPE VERDE
COUNTRY INTRODUCTION
2 ENERGY MARKET IN CAPE VERDE
2.1 OVERVIEW OF THE ENERGY SITUATIONThe energy sector of Cape Verde strongly depends on imported petroleum products, primarily imported oil. The use of solar power is quite negligible. The electrical network covered 60 % of the country in the year 2000 (against 25 % in 1990).
2.2 ENERGY CAPACITIES, PRODUCTION, CONSUMPTION AND PRICES
The energy sector of Cape Verde comprises of three sub-sec-tors: petroleum, electricity with RE and biomass. Figure 2 presents the energy mix of Cape Verde.
The main energy consumers are the transport sector (47 %) and the residential sector (34 %). A major part of the energy consumption is for domestic use, transport, electricity production and water desalination.
Electricity SectorConcerning electrical power, the overall production regis-tered a growth rate of 8.8 % between 2002 and 2006. The main company Electra produced 236,000 MWh in 2005 and 250,000 MWh in 2006. Cogeneration capacities of steam turbines at water desalination plants contributed a total of 4.4 %. Figure 3 presents the annual increase of electricity pro-duction.
The electricity production by wind power went down from 16 % in 1995 to 3 % in 2005 in the total production of electricity. This decrease is due to the lack of investments in the wind energy production during this period. Electric-ity tariffs are fixed according to decree No. 03/2008. Table 2 presents an overview of current electricity tariffs.
Petroleum SectorCape Verde has no proven oil reserves. Therefore, the country has to import petroleum products to meet its requirements. The overall fuel demand of Cape Verde includes diesel, gaso-line, kerosene for cooking, LPG, lubricants, marine diesel and Jet A1. Diesel (43,378 toe) and LPG (12,927 toe) are the most important in terms of oil product consumption. The major consumption of LPG is due to the country’s lack of biomass resources (firewood and coal). Figure 4 visualizes the amount of imported petroleum products while table 3 presents the prices for different petroleum products.
Renewable Energies in West Africa
3 1 EURO = 1,010 CAPE VERDEAN ESCUDO (CVE)
Source: Bank of Cape Verde and National Institute of Statistics, as of 2007
TABLE 1 Cape Verde Economy Overview (2001–2006)
FIGURE 2 Energy Mix of Cape Verde
Source: Direction General of Industry and Energy of Cape Verde, as of 2003
CATEGORY PRICE (CVE/ kWh)3
up to 40 kWh 23,91
> 40 kWh 33,41
Street lighting 19,31
Special low voltage 25,75
Medium average 20,91
TABLE 2
Electricity Tariffs
Source: Direction General of Industry and Energy of Cape Verde, as of 2008
Gasoil41 %
Fuel16 %
Kerozene1 %
Biomass19 %
Wind Energy1 %
LPG9 %
Gasoline5 %
Jet8 %
57
2001 2002 2003 2004 2005 2006
GDP growth (%) 6.1 5.3 4.7 4.4 5.8 10.9
Inflation (%) 3.4 1.9 1.2 61.9 0.4 5.4
Budgetary deficit (%) 4.8 3.4 3.4 1.3 4.0 4.7
Source: Direction General of Industry and Energy of Cape Verde, as of 2006
FIGURE 3
Evolution of Electricity Production (1,000 MWh)
0
100
200
300
250
150
50
2002
178,871
2003
198,053
2004
218,816
2005
236,057
2006
250,921

58
CAPE VERDE
Biomass SectorDue to the climatic conditions, Cape Verde has a very low biomass potential. The total production was estimated at 22,264 toe in 2004. This is a problem for households, espe-cially in rural areas with the urgent need for biomass energy for cooking purposes.
2.3 MARKET ACTORS AND REGULATION STRUCTURESThe management of the energy sector in Cape Verde is under the control of the General Direction of Industry and Energy (Direcção Geral da Indústria e Energia – DGIE) of the Min-istry of the Economy, Growth and Competitiveness and the multisector Agency for Economic Regulation (Agência de Regulação Económica – ARE). The DGIE is responsible for the formulation and the implementation of the policy, while the ARE is in charge of regulatory issues. The National As-sembly enacts the laws and provides the statues under which the agency manages the energy sector.
In the petroleum sector, the National Company Fuel – ENACOL and Shell Cape Verde are responsible of the commercial system of supply.
For the production and the distribution of electric power and water produced by desalination, the Company of Electricity and Water (Electra) is fully in charge.
The biomass sector is managed by the Ministry of En-vironment, Rural Development and Marine Resources. This ministry also ensures the implementation of the production, the assembly of the wind pumps and the construction of im-proved stoves. It coordinates the Solar Regional Program – PRS (phase 1 and 2) of the European Union.
3 POLICY FRAMEWORK FOR RENEWABLE ENERGIES
3.1 POLICIES, STRATEGIES AND PROGRAMS FOR RENEWABLE ENERGY PROMOTION
The Government of Cape Verde already took important meas-ures to create incentives for the implementation of RE. Article 16 of the law nº 20/VII/2007, for example, allows the import of RE equipment such as solar panels, wind generators etc. with remarkable tax exemptions. The Government further in-tends to strengthen the role of RE within its upcoming energy policies. The major objective is to reduce the high depend-ence on imported fossil fuels. The Government thus intends to meet 50 % of the overall energy needs (as opposed to presently 3.2 %) by 2020 through RE resources5 . In the same period, the Government wants to reduce energy costs that are cur-rently about 70 % above the European Union average.
The strategy for implementing this ambitious program is to open the energy market to national and international private sector investments and to reorganize and privatize Electra. Using the various existing international instruments for RE management and promotion and creating a national conscience in favor of RE are the key elements of this strategy. The development of incentives for RE is a key objective of this policy; it will increase the participation of the private sector and facilitate the building and securing of the RE sub-sec-tor in the country. Cape Verde will only achieve its vision of a fossil-fuel-free future through the investment in, and the development and adoption of technologies and innovative ap-proaches that will reduce its energy use and dependency on oil products. It is why the country has decided to develop special partnerships with innovative firms in the area of RE and alter-native energy. Capacity building will be facilitated, especially through the University of Cape Verde, to increase national ca-pabilities. Strategic experimentation and public-private part-nership will be encouraged.
3.2 REGULATIONS, INCENTIVES AND LEGISLATIVE FRAMEWORK CONDITIONS
The implementation of Cape Verde’s energy policy will rein-force the rural electrification. Thus, after having invested 500 Million CVE in the rural electrification over the 2005–2008 period, the Government intends to considerably increase the investments in this sub-sector of the energy sector. For pro-viding rural energy services, the Government has decided the promotion of concessions. There will be two concession areas: one comprising the Santiago Island and the other compris-ing the remaining nine inhabited islands of Cape Verde. The concessions will not have geographic monopolies, but will be free to operate wherever chosen within a designated conces-sion area. Concessions will be allowed for ten years and will be awarded via a competitive tender for which detailed bidding documents have been prepared. Concessions will have three
Renewable Energies in West AfricaCOUNTRY INTRODUCTION
0LPG gasoline jet A1 diesel fuel
40,000
80,000
100,000
60,000
20,000
12,638 8,821 90,918 87,197 35,660
FIGURE 4
Imports of Petroleum Products in toe
Source: Direction General of Industry and Energy of Cape Verde, as of 2004
4 COSTS OF FUEL IN CAPE VERDE HAVE FALLEN STRONGLY IN 2009; SEE ALSO WEBSITE
OF ARE ( WWW.ARE.CV > ELECTRICIDADE > COMBUSTÍVEIS > TRANSPORTES)
5 SEE ALSO REN21, VIEWED IN SEPTEMBER 2009
PRODUCT (IN CVE/LITER)
GASOLINE DIESEL DIESEL ELECTRICITY GENERATION
MARINE DIESEL
KEROSENE
Price (March 2003) 145.80 106.30 94.30 78.70 78.60
Price (January 2009) 160.00 112.40 105.07 84.60 83.50
TABLE 3
Prices for Petroleum Products4
Source: ARE, as of 2009

59
CAPE VERDE
COUNTRY INTRODUCTION
main responsibilities: (i) sell off-grid electrification systems for either cash or credit, (ii) sell electricity or electricity services by a fee-for-service arrangement for consumers and (iii) man-age publicly owned equipment. For isolated sites where the extension of the network is difficult or impossible, innovating solutions of electrification for these zones will be developed with focus on applications for solar energy.
4 STATUS AND POTENTIAL FOR RENEWABLE ENERGIES
4.1 BIOMASS/BIOGASDue to the existing climatic conditions, the status and future potential of biomass energy in Cape Verde is very low.
4.2 SOLAR ENERGYThe potential of solar energy of Cape Verde is very high. The solar irradiation is one of the highest of the ECOWAS coun-tries: 6 kWh/m²/day. Due to the high potential of solar en-ergy, it is intended to cover 2 % of the total energy consump-tion by 2010. Up to now, there are several successful PV-based applications for water pumping, lighting and telecommunica-tion systems.
4.3 WIND POWERThe average wind velocity in Cape Verde is more than 6 m/s; thus Cape Verde is one of the rare ECOWAS countries with an unuaually high and interesting potential for wind energy. Cape Verde has been exploiting wind energy mainly for elec-tricity production and desalination since 1995. This proves that the economic potential for this resource is substantial.
4.4 HYDRO POWERLike the biomass potential, there is almost no (economically feasible) potential for Hydro Power.
Renewable Energies in West Africa
5 MARKET RISKS AND BARRIERS
Cape Verde offers many advantages in view of business activi-ties for the development of RE. Over the last years, successful investment strategies gained up to 1 billion USD (as was the case in 2007). Trough the commitment of the Cape Verde Government adequate taxation, tariffs and financial mecha-nisms in favor of RE have been promoted.
This is mainly due to the existence of a reliable legal framework with guarantees for intellectual property rights and guaranteed safety for investments. In addition to this, Cape Verde offers good infrastructural prerequisites (three interna-tional airports, ports, hotels, the University of the Cape Verde, a large number of specialized educational institutions etc.).The conditions for setting up a company are very flexible in Cape Verde. The Government adopted the Foreign Investment Law (Law No. 89/IV/93)6 and the Industrial Statute (Decree Law No. 108/89)7 establishing general conditions, rights and guaranteed measurements for investments in the country.
The Foreign Investment Law defines the conditions for foreign direct investment in any sector of economic activi-ties. All sectors are open to investment unless the enterprise is a threat to national security, the environment or public health or violates domestic laws and regulations (see section IV.3 (d) for further discussion on the Foreign Investment Law).
The new investment policy ensures that applicable procedures are open, efficient and transparent. Investors can easily obtain clear guidance on these procedures from the Center for Tourism and Export Promotion of Cape Verde (PROMEX), a Government department under the supervi-sion of the Ministry of Economy, Growth and Competitive-ness in charge of promoting trade and investment opportuni-ties in Cape Verde.
Cape Verde offers quite a range of investment incen-tives and guarantees for foreign investors, companies in free trade zones and companies producing goods and services ex-clusively for exports.
6 PUBLISHED IN THE OFFICIAL BULLETIN 13/12/93
7 PUBLISHED IN THE OFFICIAL BULLETIN 30/12/89

CAPE VERDE
COUNTRY INTRODUCTION Renewable Energies in West Africa
6 RENEWABLE ENERGY BUSINESS INFORMATION AND CONTACTS
NAME CONTACT /ADDRESS PROFILE
Association of the Friends of the Nature (ONG) S/C Direction of Environment and Sustainable DevelopmentPhone: +238 261 8984
Capacity building and distribution of RE products
General Direction of Industry and Energy Phone: +238 261 48 00Fax: +238 261 33 [email protected]
Energy policy (fossil and RE)
Direction of Environment and Sustainable Development
Phone: +238 261 89 84 Environment and energy policy (biomass)
National Institute of Management of Hydraulic Resources
Phone: +238 261 24 [email protected]
Hydraulic and energy policy (solar and wind pumping)
Fuel ENACOL Phone: +238 251 1120Fax: +238 231 4873
Distribution of oil products
Authority Regulation (ARE) Phone: +238 260 0424Fax +238 261 [email protected]
Regulation of energy sector and other sectors such as water, communication etc.
Electra Phone: +238 230 3030Fax. +238 232 44 46
Electricity production, transport and distribution
TABLE 4
Local Business Partners
60

61
CAPE VERDE
COUNTRY INTRODUCTION Renewable Energies in West Africa
7 BIBLIOGRAPHY
BAD/OCDE (2008): Perspectives Économiques en Afrique 2008: Le Cap Vert
Banque Mondial/ PNUD (without year): Étude de Stratégies pour l’Énergie Domestique
Cap Vert-UE (2007/08): Document de Stratégie de Coopération pour la Période 2001-2007
DGIA of Cape Verde (2004): Rapport Bilan Énergétique du Cap Vert
DGIE (2008): Document de Politique Énergétique du Cap Vert
ECOWAS (2005): White Paper on Access to Energy Services
World Bank (2000): Regulatory Approaches to Rural Electrification and Renewable Energy: Case Studies from Six Developing Countries (Working Paper), Eric Martinot and Kilain Reiche
Gouvernement du Cap Vert (2001): Mémoire à la 3éme Conférence des Nations Unies sur les Pays les Moins Avancés, Bruxelles
Institut National des Statistiques du Cap Vert (2006): Cap Vert en Chiffres
DGIE (1996): Politiques et Stratégies de l’Énergie et de l’Environnement, Lopes Back Santos
M. Abdallah SAMBA, CILSS/AGRHYMET, Niamey et M. Inussa BARRY, Consultant National Cap Vert (2008): Rapport de la Mission Conjointe CILSS/FAO/FEWS-NET/Gouvernement d’Évaluation de la Campagne Agricole 2008/2009 au Cap Vert, Praia
CEAN, IEP-Université Montesquieu-Bordeaux IV (without year): Politique Institutionnelle au Cap Vert, Boubacar Issa Abdourhamane
Ministry of Environment of Cape Verde (1999): National Communication on the Climatic Changes
Ministry of Finances of Cape Verde (1990): Rapport de l’Aide Bilatéral
N. N. (2004): National Assessment of the Barbados Program “Action + 10” Review, Praia
Prof. Ogunalde Davidson (2008): Scaling Up-Market for Renewable Energy in Africa, Thematic Background Paper for International Conference on Renewable Energy in Africa, Dakar
N. N. (2004): Rapport sur les OMD: Cap Vert – une Évaluation des Efforts
Renewable Energy Policy Network for the 21st Century – REN21 (2009): various publications (www.ren21.net/pledges/detail.asp?id=1031)
United Nations Development Program – UNDP (2006): Human Development Report
Agência de Regulação Económica (Agency for Economic Regulation) – ARE: (www.are.cv)

COUNTRY CHAPTER:
CÔTE D’IVOIRE
Author of Country Chapter Kouame Kadjo (Ing.)
Coordination and ReviewAnton Hofer, (MSE, Dipl.-Ing./FH, M.A.)WIP-Renewable Energies www.wip-munich.deMunich, Germany
Editor Deutsche Gesellschaft für Technische Zusammenarbeit (GTZ) GmbHDepartment Water, Energy, TransportDag-Hammarskjöld-Weg 1-565760 Eschborn, Germanywww.gtz.de
On behalf of Federal Ministry for Economic Cooperation and Development (BMZ)
Editorial staffDiana KraftTel: +49 (0)6196 79 4101Fax: +49 (0)6196 79 80 4101Email: [email protected]
Renewable Energies in West Africa 61

CONTENTS CÔTE D’IVOIRE
ACRONYMS, ABBREVIATIONS AND MEASUREMENTS 64
1 COUNTRY INTRODUCTION 66 1.1 Geography and Climatic Conditions 66 1.2 Political, Economic and Socio-economic Conditions 66
2 ENERGY MARKET IN CÔTE D’IVOIRE 67 2.1 Overview of the Energy Situation 67 2.2 Energy Capacities, Production, Consumption and Prices 67 2.3 Market Actors and Regulation Structures 68
3 POLICY FRAMEWORK FOR RENEWABLE ENERGIES 69 3.1 Policies, Strategies and Programs for Renewable Energy Promotion 69 3.2 Regulations, Incentives and Legislative Framework Conditions 69
4 STATUS AND POTENTIAL FOR RENEWABLE ENERGIES 69 4.1 Biomass/Biogas 69 4.2 Solar Energy 70 4.3 Wind Power 70 4.4 Hydro Power 70
5 MARKET RISKS AND BARRIERS 70
6 RENEWABLE ENERGY BUSINESS INFORMATION AND CONTACTS 71
7 BIBLIOGRAPHY 73
8 ANNEX 74
Renewable Energies in West Africa 62CONTENTS
CÔTE D’IVOIRE

ACRONYMS AND ABBREVIATIONS CÔTE D’IVOIRE
AIPO African Intellectual Property Organization
ANARE Agence Nationale de Régulation de l’Électricité (National Regulatory Agency)
ANDE Agence Nationale de l‘Environnement (National Environmental Agency)
BNETD Bureau National d’Étude Technique et de Développement (National Office for Technological Studies and Development)
CACI Cour d’Arbitrage de Côte d’Ivoire (Côte d’Ivoire Arbitration Court)
CET Common External Tariff
CFAF CFA Franc (1 Euro = 655,957 CFAF)
CICA Cour d‘Arbitrage de Côte d’Ivoire englische Erklärung ergänzen
CIE Compagnie Ivoirienne d’Électricité (The Ivorian Electricity Company)
CIPREL Compagnie Ivoirienne de Production d‘Électricité (The Ivorian Electricity Production Company)
CME Centre des Métiers d’Electricité (Electricity Trade Center)
CNR Canadian National Resources International CI
CNRA Centre National de Recherche Agronomique (National Center for Agricultural Research)
CTFT Centre Technique Forestier Tropical (Technical Center for Tropical Forestry)
EDF Électricité de France (Electricity of France)
GDP Gross Domestic Product
GESTOCI Société de Gestion des Stocks Pétroliers de la Côte d’Ivoire (Petroleum Product Management Company of Côte d’Ivoire)
I2T Institut de Technologie Tropicale (Tropical Technology Institute)
IMF International Monetary Fund
IPP Independent Power Producer
IREN Institut de Recherche sur les Energies Renouvelables (Research Institute on Renewable Energies)
MDP Mécanisme pour un Développement Propre (Clean Development Mechanism – CDM)
MP Member of Parliament
NGO Non-governmental Organization
OIPI Office Ivoirien de la Propriété Industrielle (Ivorian Industrial Property Office)
PETROCI Société Nationale d’Opérations Pétrolières de la Côte d’Ivoire (National Petrol Society)
SIR Societé Ivoirienne de Raffinage (Ivorian Refinery Society)
SMB Société Multinationale des Bitumes (Multinational Bitumen Society)
SODEDAM Société d’Exploitation et de Développement Aéroportuaire, Aéronautique et Météorologique
(Society for Airport Operation and Development, Aviation and Meteorology)
SODEFOR Société pour le Développement Plantations Forestières (Forest Plantation Development Society)
SOGEPE Société de Gestion du Patrimoine du Secteur de l’Electricité
(Company for the Management of the Electricity Sector’s Patrimony)
SOPIE Société d’Opération Ivoirienne d’Electricité (National Electricity Operation Society)
UN United Nations
VAT Value Added Tax
WAEMU Western African Economic and Monetary Union
WAPP West African Power Pool
MEASUREMENTS
bbl/d barrels per day
kWh kilowatt hour
m/s meter per second
m² square meter
m³ cubic meters
MW megawatt
MWh megawatt hour
toe tons of oil equivalent
TWh terawatt hour
63ACRONYMS, ABBREVIATIONS AND MEASUREMENTS
CÔTE D’IVOIRE
Renewable Energies in West Africa

SUMMARY
The Country Study of Côte d’Ivoire is to provide an overview of the country’s energy market and to support decision-mak-ing for private investments for the Renewable Energy (RE) sector in Côte d’Ivoire. The study is structured as follows:
Chapter one provides Background Information on Côte d’Ivoire. This includes an overview of geographical and cli-matic conditions, as well as the most important facts in view of political, economic and socio-economic conditions of Côte d’Ivoire.
Chapter two summarizes facts and figures of Côte d’Ivoire’s Energy Market including stakeholders and market actors in-volved as well as sector related regulations.
Chapter three presents the currently existing Political Frame-work for Renewable Energies in Côte d’Ivoire. This includes an overview of support mechanisms for photovoltaic PV as well as existing regulations, incentives and legislative frame-work conditions for other RE technologies.
Chapter four provides a brief overview of the Status Quo and Potential for Renewable Energies in Côte d’Ivoire.
Chapter five summarizes the existing and potential Market Risks and Barriers in general with focus on RE.
Chapter six presents a compilation of the most relevant Re-newable Energy Business Information and Contacts of Côte d’Ivoire.
Renewable Energies in West AfricaSUMMARY 64
CÔTE D’IVOIRE

1 COUNTRY INTRODUCTION
1.1 GEOGRAPHY AND CLIMATIC CONDITIONSLocated in West Africa and in the intertropical zone, Côte d’Ivoire has a land area of 322,462 km2. It is bordered by the Atlantic Ocean in the South and shares borders with Ghana in the East, Burkina Faso and Mali in the North and Guinea and Liberia in the West. The country is influenced by two air masses: a moist equatorial air mass called Monsoon and a dry tropical air mass coming along with a drying wind named Harmattan, with a saturation of 65–90 %.
There are four major climate zones in Côte d’Ivoire, namely an equatorial climate (or Attiean climate), a semi-damp tropical climate (or Baoulean climate), a dry tropical climate (or Sudano-Guinean climate) and a wet tropical climate (or mountain climate). Three types of vegetations can be found in the country: One vegetation area spans over the southern half of the country and the coastal basin; the Sudanese area in the North is characterized by a scattered vegetation covering (savannah). In-between these regions, a pre-forest area spans East to West with dense bush formations and gallery forests along watercourses.
The geography of Côte d’Ivoire includes plains in the South with swampy areas and a few hills no higher than 200 meters. Plateaus covering the center and the North form iso-lated hills or hill chains with a height of 200 to 500 meters. In the West of the country, there are chains of mountains with a height of more than 1,000 meters and single peaks of 1,300 meters and even 1,752 for Nimba Mount, the highest summit.
1.2 POLITICAL, ECONOMIC AND SOCIO-ECONOMIC CONDITIONS
In Côte d’Ivoire, a new constitution has been drafted in 2000, providing three separated powers: the executive power held by a Government headed by a President, the legislative power held by the parliament which consists of Members of Parliament (MPs) from several political parties and a judicial power. The political and social unrests, violence, coups d’état and rebellions did not allow the population to reap the fruit of this democratic system. The administrative system is de-centralized and run by elected local representatives. Examples are the General Councils at regional level and municipalities (mayors) for the direct management of the population’s needs. Since its independence, the country has been establishing a free market economic system.
Côte d’Ivoire has an estimated population of 20,807,216 inhabitants (as of 2008) with over 26 % of immi-grants coming mainly from neighboring countries. There are around 60 ethnic groups belonging to four major affiliations: Gurs, Mandés, Akans and Krus. Côte d’Ivoire is a lay coun-try with several coexisting religious denominations, the major ones being Islam (38.6 %), Christianity (35.8 %) and Ani-mism (25.6 %). The country has two capital cities: Yamous-soukro, the political capital, and Abidjan, the economic capi-tal. Moreover, Côte d’Ivoire is characterized by a significantly high urbanization rate and a population with about 40.3 % of its members being 15 years and under.
Renewable Energies in West Africa 65
CÔTE D’IVOIRE
COUNTRY INTRODUCTION
The economy of Côte d’Ivoire has been experiencing a slow decline since the outbreak of an armed rebellion in Septem-ber 2002. As a consequence, most of the foreign aid flow was interrupted (except for humanitarian assistance), thus increasing the internal and external debt burden and induc-ing a severe downturn in foreign and domestic investments. The Gross Domestic Product (GDP) growth rate was 0.9 % in 2006 and 1.7 % in 2007. The IMF anticipates a positive GDP growth rate of 3.8 % in 2008. The Ivorian economy is largely dependent on external factors such as weather condi-tions and international raw material prices. The standard of living of the population and the state of infrastructure has deteriorated since 2002. The inflation rate was approximately 2.5 % in 2007.
The economy of the country rests on agriculture providing jobs for two thirds of the national manpower and contributes to the GDP to the tune of 20 %. Côte d’Ivoire is the leading world cocoa exporter with a yearly production of several million tons. Some mining activities such as gold, diamond and manganese mining are also conducted in the country. In 2005, however, the UN Security Council banned diamond export because it served to fund arms procurement. Industrial and material development sectors account for ap-proximately 22 % of the GDP while the tertiary sector con-tributes 57 %.
Côte d’Ivoire is the hub for trade activities in Western Africa, and foreign trade accounts for 90 % of the GDP. Côte d’Ivoire is a member of WAEMU (Western African Econom-ic and Monetary Union) applying a common external tariff (CET). It is also a member of the CFAF Zone. Its top three export partners are France, the United States and the Neth-erlands. Cocoa is the country’s main export good (generating 40 % of its export receipts). In terms of import, the top three partners of Côte d’Ivoire are France, Nigeria and Singapore. The main import goods are fuels and oils, vehicles, ships and vessels, grains and machinery.
KorhogoOdenné
KatiolaTouba
Séguéla
Man
Daloa
Sinfra
Gagnoa
Divo
Bouaké
Bondoukou
AbengouroDimbokro
AdzopéAgboville
AboissoAbidjanDabou
San-Pédro
Monts Nimba
Gulf of Guinea
YAMOUSSOUKRO
KomoéLAO DE KOSSOU
Bandama
Sassandra
LAC DE BUYO
MAP OF CÔTE D’IVOIRE

CÔTE D’IVOIRE
COUNTRY INTRODUCTION
2 ENERGY MARKET IN CÔTE D’IVOIRE
2.1 OVERVIEW OF THE ENERGY SITUATIONCôte d’Ivoire’s oil industry started to take off in 2001 dur-ing the period of civil war. By 2007, oil exports accounted for 28 % of the Governments export revenues. The majority of Côte d’Ivoire’s electricity is generated through stations powered with natural gas and hydroelectricity accounting for around 20 %. More than half of the domestic energy needs are met by combustible renewable resources and waste, mainly in the form of biomass. Table 1 presents the production/con-sumption figures of Côte d’Ivoire.
2.2 ENERGY CAPACITIES, PRODUCTION, CONSUMPTION AND PRICES
Electricity SectorAs of 2005, Côte d’Ivoire had installed an electric generation capacity of 1,210 megawatts (MW). In 2005, Côte d’Ivoire generated about 5.4 billion kWh of electricity, while consum-ing about 2.9 billion kWh. Electricity is exported through the West African Power Pool (WAPP). Most of the electric-ity is generated through conventional thermal power stations (> 70 %), with hydroelectricity supplying the remainder. The 288 MW Azito Power Station, in operation since 1999, is lo-cated in Abidjan‘s suburbs and produces more than a third of the country‘s electricity. The phased construction of a third turbine in Azito has been delayed. Côte d’Ivoire’s main hydro-electric plants include Ayame I and II, Kossou, Taabo, Buyo and Grah. Table 2 presents the electricity production capaci-ties; Table 3 indicates the current electricity tariffs.
Renewable Energies in West Africa
TABLE 1
Energy Production/Energy Consumption
Source: Direction Générale de l’Energie (Energy Information System), as of 2004–2007
66
TYPE OF ENERGY 2004 2005 2006 2007
Production
Electricity (MWh) 5,403,895 5,570,205 5,543,9164 5,515,481
Electricity (MWh) 5,403,895 5,570,205 5,543,9164 5,515,481
Petroleum products (1,000 tons) 1,302 2,044 3,135 2,418
Natural gas (million m³) 1,555 1,738 1,708 1,398
Consumption
Electricity (MWH) 2,989,808 3,004,062 3,262,877 3,432,915
Petroleum products (1,000 TONS) 799 695 813 833
Natural gas (MILLION M³) 1,708 1,555 1,738 1,708 1,398
TABLE 2
Electricity Production Capacities
Source: Société d’Opération d’Electricité, SOPIE, as of 2008/2009
HYDRAULIC POWER PLANTS INSTALLED POWER (MW)
Ayamé 1 20
Ayamé 2 30
Kossou 174
Taabo 210
Buyo 165
Grah 5
Total 604
THERMAL POWER PLANTS
Vridi 100
Ciprel 210
Azito 288
Total 606
Overall 1,210
TABLE 3
Electricity Cost (in CFAF)
Source: Agence Nationale de Régulation de l’Électicité (ANARE), prices including VAT
Source: Agence Nationale de Régulation de l’Électicité (ANARE), prices including VAT,as of 2008/2009
LOW VOLTAGE COST PRICE FOR LOW VOLTAGE
Household use Price ET Professional use Price ET
Fixed price per kWh 1,176 Fixed price 1,664.98
Nominal tariff rate/ kWh 36.05 1st price band 92.59
General tariff rate/ kWh 57.43 2nd price band 78.75
CATEGORY OF SUBSCRIBER MEDIUM VOLTAGE COST HIGH VOLTAGE COST
Short-term use
Fixed price/ kW/year 18,850.76 46,658.33
kWh cost for busy hours 63.59 57.01
kWh cost for peak hours 98.40 104.41
kWh cost for non-busy hours 45.68 32.15
General use
Fixed price 25,936.38 63,120.76
kWh cost for busy hours 51.71 38.46
kWh cost for peak hours 75.95 104.41
kWh cost for non-busy hours 46.09 32.15
Long-term use
Fixed price 37,686.39 79,563.98
kWh cost for busy hours 53.47 34.42
kWh cost for peak hours 67.91 38.46
kWh cost for non-busy hours 46.48 32.71

67
CÔTE D’IVOIRE
COUNTRY INTRODUCTION
Petroleum SectorCôte d’Ivoire has proven crude oil reserves of 100 million barrels; the vast majority is located offshore. Oil production increased from around 15,000 barrels per day (bbl/d) in 2002 to approximately 62,000 bbl/d in 2006. Production problems at the so-called Baobab field constrained the oil production in 2007 to almost 52,000 bbl/d. The production is expected to increase to 70,000 bbl/d by 2009 following repairs at three of the five shut-in wells at the Baobab field. Côte d’Ivoire cur-rently has one refinery: the SIR (Société Ivoirienne de Raffi-nage) located in Abidjan with a capacity of 65,000 bbl/d. The refinery receives crude oil from West African and other coun-tries, then exports products to neighboring countries (detailed production figures are available in the Annex/Table 10 of this report). An oil pipeline connects the SIR refinery to the so-called Lion and Panther fields. The state currently owns 47.3 % of SIR; other partners include the Government of Burkina Faso, Total, Shell, ExxonMobil and Chevron. A petroleum product depot, adjacent to SIR, stores petroleum products for domestic use as well as for export (to Mali, Burkina Faso, Niger and Chad). Other fuel depots are located in Bouake and Yamoussoukro. In 2006, the national oil consumption reached 26,000 bbl/d with about 36,000 bbl/d being exported. Table 4 presents the current prices for petroleum products.
2.3 MARKET ACTORS AND REGULATION STRUCTURESThe institutional framework of the overall energy sector is rather complex as several ministries have direct or indirect influence on this keysector.
The Ministry of Mining and Energy, through its tech-nical body named Office for the Promotion of Energy Effi-ciency (Bureau des Économies d’Énergie) and through the Sub-Directorate of Energy Control and Renewable Energies (Sous-Direction de la Maîtrise de l’Énergie et des Énergies Renouvelables), ensures the promotion of energy efficiency ac-tions and RE development actions. For that purpose, the two bodies jointly carry out the following actions:
Monitoring of the “Improved Stoves Popularization Program”
Monitoring of power billing for public buildings in con-sultation with the Laboratory of Construction and Civil Engineering (Laboratoire du Bâtiment et des Travaux Publics) of the Ministry of Economic Infrastructures
Monitoring of the use of residues in some industrial companies
Monitoring of the activities of charcoal producers in cooperation with the National Center for Agricultural Research (Centre National de Recherche Agronomique) of the Ministry of Higher Education and Research
Monitoring of experimental solar stations in cooperation with the Research Institute on Renewable Energies (In-stitut de Recherche sur les Energies Renouvelables) of the Ministry of Higher Education and Research
The Ministry of Agriculture and Forestry also ensures control of wood and charcoal sub-sectors.
The Ministry of Higher Education and Research coordinates the activities of the research centers involved in the energy sector, i. e. the Research Institute on Renewable Energies (IREN), the Tropical Technology Institute (Institut de Technologie Tropicale – I2T) and the National Center for Agricultural Research (CNRA).
The petroleum sector of Côte d’Ivoire is regulated and supervised by the Société Nationale d‘Opérations Pétrolières de la Côte d’Ivoire (Petroci). In 1998, Petroci was divided into four units: Petroci Holding (responsible for portfolio manage-ment of the oil sector), Petroci Exploration/Production (re-sponsible for upstream hydrocarbon activities), Petroci-Gaz (responsible for the natural gas sector), and Petroci Industries Services (responsible for all other related services).
The electricity sector of Côte d’Ivoire includes the fol-lowing market actors:
SOGEPE manages the asset base and financial flow of the power sector. SOPIE supervises the provision of facilities with focus on the implementation of the rural electrification program. The National Regulatory Agency (Agence Nationale de Régulation – ANARE) is the regulatory authority for the electricity sector. The Ivorian Electricity Company (Compagnie Ivoirienne d’Électricité – CIE) has been granted concession for the power utility and exploits electricity generation, convey-ance and distribution facilities. Private electricity generation operators (Independent Power Producers – IPP) including CIPREL and AZITO ENERGY and new IPPs such as EEI and LAUCHAN are about to sign an agreement with the Government, which contributes considerably to the implementation of the energy policy.
Renewable Energies in West Africa
PRODUCT PRICE (CFAF)
Butane (12.5 kg bottle) 4,500
Unleaded gasoline 790
Kerosene (jet) 495
Diesel 685
DDO 793.61
FO180 471.99
TABLE 4
Price of Oil Products
Source: Direction des Hydrocarbures, as of November 2008

68
CÔTE D’IVOIRE
COUNTRY INTRODUCTION
3 POLICY FRAMEWORK FOR RENEWABLE ENERGIES
3.1 POLICIES, STRATEGIES AND PROGRAMS FOR RENEWABLE ENERGY PROMOTION
The development of RE is hindered by a lack of comprehensive planning as Côte d’Ivoire does not have a clearly defined en-ergy policy with substantial financial means to promote RE. On the institutional level, the management of RE is incum-bent on the Energy Directorate and is ensured through the Sub-Directorate of Energy Control and Renewable Energies (see 2.3). Several operators and institutions (ministries, re-search institutes and centers, etc.), however, are active in this sector without genuine coordination. In 2005, the decision to establish a Renewable Energy Directorate (Direction des Énergies Renouvelables) within the Ministry of Mining and Energy has set a distinctive hallmark in the official RE devel-opment policy.
3.2 REGULATIONS, INCENTIVES AND LEGISLATIVE FRAMEWORK CONDITIONS
As already mentioned, there is a massive lack in legal and fiscal framework conditions for the implementation and promotion of RE. Up to now, there are no specific regulations, incentives or legislative framework conditions available. The new regula-tions currently being drafted at the Ministry of Mines and Energy will, however, provide the necessary environment to develop the RE sub-sector in Côte d’Ivoire.
Several private enterprises are getting involved in ru-ral electrification after securing the approval of SOPIE, the principal contractor for the provision of electrical facilities. In order to obtain this approval, all enterprises applying have to give evidence of their financial and technical capacities.
The National Authority (AN-MDP) is responsible for the MDP (Mécanisme pour un Développement Propre - Clean Development Mechanism (CDM)) implementation in Côte d’Ivoire. The AN-MDP Focal Point is housed at the National Environmental Agency (Agence Nationale de l‘Environnement – ANDE). The National Work Plan on the MDP has been validated since May 2003.
Several projects (development of household wastes, sustainable forest management etc.) are currently being evalu-ated in order to classify them as projects liable to be funded within the opportunities provided by the MDP.
Renewable Energies in West Africa
4 STATUS AND POTENTIAL FOR RENEWABLE ENERGIES
4.1 BIOMASS/BIOGASBiomass energy is the most common energy source in Côte d’Ivoire. Up to 60 % of the overall energy requirements are covered by this energy source, including:
Fuel wood and charcoal for households, small restaurants, bakeries, arts and crafts centers (smithies, jewelry-making shops, potteries etc.). Agricultural and forest residues for the production of steam and/or electricity in some agro-business companies (oil works, sugar refineries etc.) and sawmills
The anaerobic generation of biogas was experimented with in several pilot projects, but was not implemented in regular operation up to now. Currently, some private investors are ap-plying for the authorization to produce electricity from house-hold wastes, especially in Abidjan. The main sources of supply in fuel wood are natural forests, savannah woodlands and tree and bush savannahs, productive farms as well as fallows and tree plantations.
Comprising 16 million hectares of moist forests at the beginning of the previous century, the forest stand has dimin-ished to presently 6.38 million hectares including 4.2 million hectares of highly degraded forests and two million hectares of protected areas. Resources from agro-industrial residues, crops and plantations are estimated at over 4.3 million toe per year. They represent a key energy source and the most directly useable RE potential. Table 5 presents the available biomass potential.
TABLE 5
Biomass Potential
Source: Direction Générale de l’Énergie, 2008
GEOGRAPHIC AREA FORM OF ENERGY VALUE IN TOE
North Bagasse 120,000
Sugar cane molasses 30,000
Cotton seed shell 10,475
Center and South Cobs, palm fiber and shell 100,000
Shell, coffee hull 32.15
General use Cocoa beans 74,000
Cocoa cops and shells 25,000
Rice husk 10,000
Urban waste 104.41
District of Abidjan > 1,000,000 tons

CÔTE D’IVOIRE
4.2 SOLAR ENERGYCôte d’Ivoire enjoys abundant sunshine with a good sunshine average, estimated at 4–5 kWh/m²/day with a daily sunshine time of 6 hours (more detailed information can be found in the Annex/Figure 3 of this report). Despite this satisfactory potential, solar energy has not been developed significantly up to now. Some PV solar energy systems have been implemented in the framework of small-scale projects developed by private initiatives or NGOs for electricity supply for households, schools and health facilities. Moreover, several telecommuni-cation facilities have also been equipped with PV solar energy systems for stand-alone energy supply. Thermal solar energy is sometimes used for water heating and solar drying purposes while solar ovens and cookers have not yet started being popu-larized. Recently, some private operators have started activities basically oriented towards the import, sale and installation of solar equipment.
4.3 WIND POWERThere are no wind measurements available beside those for civil aviation compiled by the “Société d’Exploitation et de Dével-oppement Aéroportuaire, Aéronautique et Météorologique (SODEXAM) services. These measurements taken at 12 m above the ground generally range from 1–2 m/s. San Pedro on the western shoreline and Korhogo in the North record wind frequencies between 20–35 % for wind speeds above 6 m/s. Bouake in the Center,and Tabou on the western shoreline are swept by winds with frequencies from 20–45 % and speeds faster than 4 m/s. There are no other wind tapping projects known to date except those in Touba and Korhogo.
4.4 HYDRO POWERUp to now, four large identified hydroelectric sites have not been developed yet. These sites have a power capacity ranging from 5–288 MW. Several other sites have potential for small Hydro Power plants with capacities of 0.5–5.0 MW, but have also not been exploited yet. The potential identified in the context of a study conducted by Électricité de France in 1980 adds up to an estimated theoretical hydroelectricity capacity of 46 TWh. The economically exploitable potential equals 12.4 TWh, i. e. 27 % of the theoretical potential. Table 6 presents the avail-able Hydro Power potential of Côte d’Ivoire. A detailed map of Hydro Power potential is available in the Annex of this report (Figure 4).
5 MARKET RISKS AND BARRIERS
The business environment in Côte d’Ivoire is ruled by national and regional legal institutions and instruments:
The OHADA Treaty is a legal purview regulating business law in the sixteen states signed in to the treaty including Côte d’Ivoire. It comprises common legal rules designated as the “Uniform Acts”. The Labor Code developed in 1995 aims at three goals: enabling companies to meet their requirements in terms of manpower and competitiveness; preserving the workers’ fundamental rights; rehabilitating enterprises and confirm-ing their prominent place in the economic and socio-devel-opment process through their capacity to generate wealth and employment. The Environment Code of 1996 is the legal basis of the environmental protection and preservation policy in Côte d’Ivoire. The Rural Land Code was passed in 1998 and is amended in Article 26 in 2004. The Côte d’Ivoire Arbitration Court (Cour d’Arbitrage de Côte d’Ivoire – CACI) and the Common Ohada Justice and Arbitration Court (Cour Commune de Justice et d’Arbitrage de l’OHADA) are redress bodies in case of conflicts.
Côte d’Ivoire is allied with several European Union countries through bilateral agreements tending to avoid double taxation and to prevent tax evasion in terms of income tax. The Ivorian Industrial Property Office (Office Ivoirien de la Propriété In-dustrielle – OIPI) is the national entity cooperating with the African Intellectual Property Organization (AIPO), which protects intellectual works such as inventions, brands, draw-ings or industrial design or trademarks. It ensures an effective control of counterfeiting and unfair competition.
Renewable Energies in West AfricaCOUNTRY INTRODUCTION 69
SITE RIVER POTENTIAL CAPACITY (MW)
Soubré Sassandra 288
Ndielesso Comoé 100
Malamalasso Comoé 90
Louga Sassandra 280
Singrobo Bandama 67
Kokumbo Bandama 78
Bouloubré Sassandra 156
Daboitié Bandama 91
Gribo popoli Sassandra 112
Tiassalé Bandama 51
TABLE 6
Hydroelectric Potential
Source: based on a study conducted by Électricité de France, as of 1980

70
CÔTE D’IVOIRE
COUNTRY INTRODUCTION
There are several private and public universities in the coun-try. Public universities and engineering colleges like the In-stitut Polytechnique Houphouët Boigny, as well as research centers like the CNRA and Institut de Technologie Tropicale (I2T) also serve as centers of cooperation with external organ-izations and provide for incentives to invest in Côte d’Ivoire. This type of investment encouragement has been reinforced since the outbreak of the September 2002 crisis to support the private sector.
Special privileges are granted by the four specific legal texts: the Investment Code, the Mining and Oil Code, the Law Establishing Information and Communication and the Law Establishing a Biotechnology Free-Trade Zone. Common law privileges are recorded in the General Tax Code and are applied every year by a Tax Schedule to the Appropriation Act. Customs measures: The WAEMU Treaty has established a common market by the enforcement of the Common External Tariff (TEC). Third party countries are in general subject to the following import duties: custom duties rang-ing from 0–20 %, a statistics due of 1 % in general and the Community Solidarity Levy of 1 % of the total value of the products
Renewable Energies in West Africa
TABLE 7
Authorities and Societies in the Energy Market
6 RENEWABLE ENERGY BUSINESS INFORMATION AND CONTACTS
NAME ADDRESS PROFILE
Société Natio-nale d’Opérations Pétrolières de la Côte d’Ivoire (PETROCI)
Building Les Hévéas14, Boulevard Carde PlateauBP V194 AbidjanPhone: +225 20 20 25 00Fax: +225 20 21 68 [email protected]
Ensures the promotion of the Ivorian sedimentary basin and the development of its oil and gas resources through the exploration and exploitation of the Ivorian oil and gas deposit in partnership with key interna-tional companies
Société de Gestion des Stocks Pétroliers de la Côte d’Ivoire(GESTOCI)
GESTOCI Abidjan15 BP 89 Abidjan 15Phone: +225 21 75 98 00Fax: +225 21 2717 82 [email protected]
Ensures the management of security stocks for a SIR shut-down period of 60 days and also manages the means of transport between the three depots Abid-jan, Bouaké, Yamoussoukro
Société d’Opération Ivoirienne d’Electricité(SOPIE)
II Plateaux 7ème Tranche01 BP 8529 Abidjan 01Phone: +225 22 52 76 00Fax: +225 22 52 76 [email protected] www.sopie.ci
Supervision of works in the electricity sector
Autorité Nationale de Régulation du Secteur de l’Electricité(ANARE)
Tour EECI16 BP 1106 Abidjan Phone: +225 20 20 63 18Fax: +225 20 20 61 [email protected]
Monitoring of compliance with regulations and conventions; arbitration of conflicts between the players of the electricity sector; defense of consumers’ interests
Société de Gestion du Patrimoine du secteur de l’Electricité(SOGEPE)
Tour EECI01 BP 1345 Abidjan 01Phone: +225 20 20 60 [email protected]
Management of the power sector assets and financial flows
Société Ivoirienne de Raffinage(SIR)
Vridi Boulevard Petit Bassam01 BP 1269 Abidjan 01Phone: +225 20 20 25 00Fax: +225 20 21 68 [email protected]
State-of-the-art refinery with two atmospheric distribution units, and one of the only two hydrocrackers existing in Africa
Société Multinationale des Bitumes(SMB)
Vridi Boulevard Petit Bassam12 BP 622 Abidjan 12Phone: +225 21 23 70 70www.smb.ci
Specialized in bitumen production.
Société des pour le Développement Plan-tations Forestières(SODEFOR)
01 PB 3770 Abidjan 01Phone: +225 22 44 46 16Fax: +225 22 44 02 40
Reforestation program to fight deforestation, to enhance bush fire control, to participate in public sales and to control quota of timber for export
Bureau National d’Etude Technique et de Développement(BNETD)
04 BP 945 Abidjan 04Phone: +225 22 44 28 05Fax: +225 22 44 56 66www.bnted.sita.net
Development and implementation of public or private investment projects of all kinds in all sectors of economy (including energy)
Agence Nationale de l’Environnement(ANDE)
II Plateaux, 7ème tranche08 BP 09 Abidjan 08Phone: +225 22 42 70 93
Protection of the environment and promotion of RE
Chambre de Commerce et de l‘Industrie de Côte d’Ivoire
6, Avenue Joseph Anoma01 BP 1399 Abidjan 01Phone: +225 20 33 16 00Fax: +225 20 32 39 [email protected]
Training and information concerning economy, finance and commerce (for members)
Cour d‘Arbitrage de Côte d’Ivoire(CICA)
Phone: +225 20 31 90 73 Fax: +225 20 21 72 [email protected]@fnisci.ci
Management and handling of enquiries related to energy development projects
Bourse de Sous-Traitance et de Paternariat de Côte d’Ivoire
Phone: +225 20 33 88 94Fax: +225 20 32 02 [email protected]
Promotion of the market of subcontractors, development of conditions for an optimal use and performance of business capacities
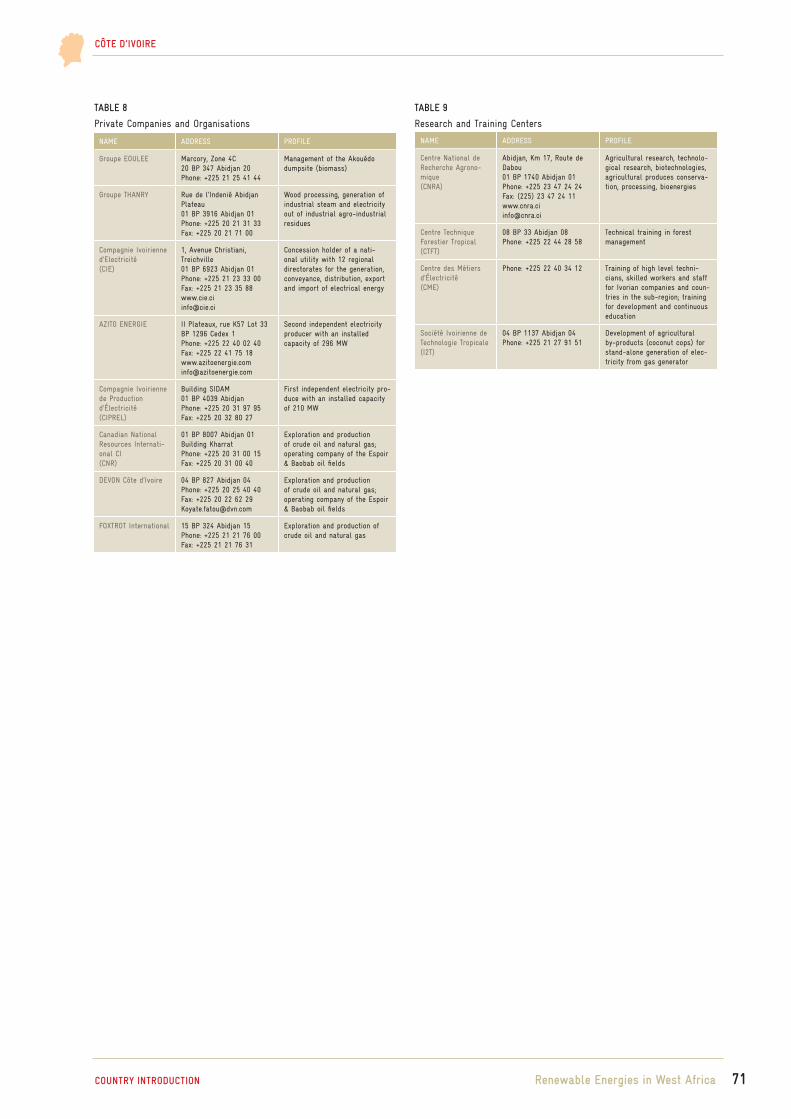
71
CÔTE D’IVOIRE
Renewable Energies in West AfricaCOUNTRY INTRODUCTION
TABLE 8
Private Companies and Organisations
NAME ADDRESS PROFILE
Groupe EOULEE Marcory, Zone 4C20 BP 347 Abidjan 20Phone: +225 21 25 41 44
Management of the Akouédo dumpsite (biomass)
Groupe THANRY Rue de l’Indenié Abidjan Plateau01 BP 3916 Abidjan 01Phone: +225 20 21 31 33Fax: +225 20 21 71 00
Wood processing, generation of industrial steam and electricity out of industrial agro-industrial residues
Compagnie Ivoirienne d’Electricité(CIE)
1, Avenue Christiani, Treichville01 BP 6923 Abidjan 01Phone: +225 21 23 33 00Fax: +225 21 23 35 [email protected]
Concession holder of a nati-onal utility with 12 regional directorates for the generation, conveyance, distribution, export and import of electrical energy
AZITO ENERGIE II Plateaux, rue K57 Lot 33BP 1296 Cedex 1Phone: +225 22 40 02 40Fax: +225 22 41 75 [email protected]
Second independent electricity producer with an installed capacity of 296 MW
Compagnie Ivoirienne de Production d‘Électricité(CIPREL)
Building SIDAM01 BP 4039 AbidjanPhone: +225 20 31 97 95Fax: +225 20 32 80 27
First independent electricity pro-duce with an installed capacity of 210 MW
Canadian National Resources Internati-onal CI(CNR)
01 BP 8007 Abidjan 01Building KharratPhone: +225 20 31 00 15Fax: +225 20 31 00 40
Exploration and production of crude oil and natural gas; operating company of the Espoir & Baobab oil fields
DEVON Côte d’Ivoire 04 BP 827 Abidjan 04Phone: +225 20 25 40 40Fax: +225 20 22 62 [email protected]
Exploration and production of crude oil and natural gas; operating company of the Espoir & Baobab oil fields
FOXTROT International 15 BP 324 Abidjan 15Phone: +225 21 21 76 00Fax: +225 21 21 76 31
Exploration and production of crude oil and natural gas
TABLE 9
Research and Training Centers
NAME ADDRESS PROFILE
Centre National de Recherche Agrono-mique(CNRA)
Abidjan, Km 17, Route de Dabou01 BP 1740 Abidjan 01Phone: +225 23 47 24 24Fax: (225) 23 47 24 [email protected]
Agricultural research, technolo-gical research, biotechnologies, agricultural produces conserva-tion, processing, bioenergies
Centre Technique Forestier Tropical(CTFT)
08 BP 33 Abidjan 08Phone: +225 22 44 28 58
Technical training in forest management
Centre des Métiers d’Électricité(CME)
Phone: +225 22 40 34 12 Training of high level techni-cians, skilled workers and staff for Ivorian companies and coun-tries in the sub-region; training for development and continuous education
Société Ivoirienne de Technologie Tropicale(I2T)
04 BP 1137 Abidjan 04Phone: +225 21 27 91 51
Development of agricultural by-products (coconut cops) for stand-alone generation of elec-tricity from gas generator

7 BIBLIOGRAPHY
BBC (2009): Country profile (http://news.bbc.co.uk/2/hi/africa/country_profiles/1043014.stm) Centre de Promotion des Investissements en Côte d’Ivoire – CEPICI (2009): Accueil CEPICI (www.cepici.ci, last viewed October 2009) Central Intelligence Agency – CIA (2009): World Fact Book (www.cia.gov/library/publications/the-world-factbook) Direction Générale des Douanes – Direction de l‘Informatique (2009): Douanes de Côte d’Ivoire. Site Officiel (www.douanes.ci) Énergie Electrique de la Côte d’Ivoire (2008): Rapport Annuel Gallagher, Kevin (2008): Handbook on Trade and Environment International Energy Agency (2008): Energy Statistics of Non-OECD Countries International Monetary Fund – IMF (1996): Côte d’Ivoire – Statistical Annex Le Système d’Information Énergétique (2008): Rapport 2008 NASA (2008): Scientific Centre on Atmospheric Data (http://eosweb.larc.nasa.gov) OECD/African Development Bank (2003/2004): African Economic Outlook Présidence de la République de Côte d’Ivoire (2007): Le site Officiel de la Présidence de la République de Côte d’Ivoire (www.cotedivoirepr.ci, last viewed October 2009) Profil Environnemental de la Côte d’Ivoire (2006): Final Report United Nations Department of Economic and Social Affairs (2005): Statistics Pocketbook United Nations Statistics Division – UNSD (2006): Energy Statistics Yearbook USA International Business Publications (2008): Energy Policy, Laws & Regulation Handbook World Bank (2009): Climate Change and the World Bank GroupWorld Bank (2006): World Development Indicators World Bank (1996): Lending for Electric Power in Sub-Saharan Africa
72
CÔTE D’IVOIRE
Renewable Energies in West AfricaBIBLIOGRAPHY

CÔTE D’IVOIRE
ANNEX Renewable Energies in West Africa 73
FIGURE 2
Electricity Network of Côte d’Ivoire
FIGURE 3
Overview of Sun Energy Potential
8 ANNEX
Source: unknown
Source: unknown

TABLE 10
Production Figures of Petroleum Products (SIR–2007)
PRODUCT 2007 2006 Variation ( %)
Butane 83,588 76,367 9.46
Unleaded gasoline 564,284 604,840 –6.71
Kerosene (paraffin/jet) 932,828 975,842 –4.41
Gasoil 1,088,501 1,209,526 –10.01
DDO 146,530 58,990 148.40
HVO 74,033 84,411 –12.29
Fuel oil 289,309 521,446 –44.52
Total for petroleum products
3,179,073 3,531,422 –9.98
Source: Direction des Hydrocarbures, as of 2008
CÔTE D’IVOIRE
ANNEX
FIGURE 4
Map of Available Hydro Power Potential
Source: unknown
Renewable Energies in West Africa 74

COUNTRY CHAPTER:
GAMBIA Author of Country Chapter Bah F. M. Saho (Dipl. Agr., MSc. RE)
Coordination and Review of the Country ChapterAnton Hofer, (MSE, Dipl.-Ing./FH, M.A.)WIP-Renewable Energies www.wip-munich.deMunich, Germany
Editor Deutsche Gesellschaft für Technische Zusammenarbeit (GTZ) GmbHDepartment Water, Energy, TransportDag-Hammarskjöld-Weg 1-565760 Eschborn, Germanywww.gtz.de
On behalf of Federal Ministry for Economic Cooperation and Development (BMZ)
Editorial staffDiana KraftTel: +49 (0)6196 79 4101Fax: +49 (0)6196 79 80 4101Email: [email protected]
Renewable Energies in West Africa 76

CONTENTS GAMBIA
ACRONYMS, ABBREVIATIONS AND MEASUREMENTS 78
SUMMARY 79
1 COUNTRY INTRODUCTION 80 1.1 Geography and Climatic Conditions 80 1.2 Political, Economic and Socio-economic Conditions 80
2 ENERGY MARKET IN GAMBIA 81 2.1 Overview of the Energy Situation 81 2.2 Energy Capacities, Production, Consumption and Prices 81 2.3 Market Actors and Regulation Structures 82
3 POLICY FRAMEWORK FOR RENEWABLE ENERGIES 83 3.1 Policies, Strategies and Programs for Renewable Energy Promotion 83 3.2 Regulations, Incentives and Legislative Framework Conditions 83
4 STATUS AND POTENTIAL FOR RENEWABLE ENERGIES 84 4.1 Biomass/Biogas 84 4.2 Solar Energy 84 4.3 Wind Power 84 4.4 Hydro Power 84
5 MARKET RISKS AND BARRIERS 84
6 RENEWABLE ENERGY BUSINESS INFORMATION AND CONTACTS 85
7 BIBLIOGRAPHY 86
Renewable Energies in West Africa 77CONTENTS
GAMBIA

ACRONYMS AND ABBREVIATIONS GAMBIA
CFL Compact Fluorescent Lamp
CRR Central River Region
DMCI Development Management Consultant International
DoSPEMR Department of State for Petroleum, Energy and Mineral Resources
DoSFEA Department of State for Finance and Economic Affairs
DoSFNRE Department of State for Forestry, Natural Resources and the Environment
DoSLGL&RA Department of State for Local Government, Lands & Religious Affairs
EE Energy Efficiency
GDP Gross Domestic Product
GEF Global Environment Facility
GIPFZA Gambia Investment Promotion and Free Zone Agency
GREC Gambia Renewable Energy Centre
HFO Heavy Fuel Oil
ICT Information and Communication Technologies
IPP Independent Power Producer
LAG Local Government Area
LPG Liquefied Petroleum Gas
LRR Lower River Region
NAWEC National Water and Electricity Company
NBR North Bank Region
NEA National Environment Agency
PRSP Poverty Reduction Strategy Paper
PURA Public Utilities Regulatory Authority
PV Photovoltaic
R&D Research and Development
SPA Strategy for Poverty Alleviation
UNIDO United Nations Industrial Development Organization
URR Upper River Region
USD United States Dollar
WR Western Region
MEASUREMENTS
€ Euro (1 Euro = 33.21 Dalasi)
GWh gigawatt hour
km kilometer
km² square kilometer
kW kilowatt
kWh kilowatt hour
kWp kilowatt peak
m meter
m² square meter
m³ cubic meter
mm millimeter
MW megawatt
ºC degree Celsius
s second
Renewable Energies in West Africa 78ACRONYMS, ABBREVIATIONS AND MEASUREMENTS
GAMBIA

SUMMARY
The Country Study of Gambia is to provide an overview of the country’s energy market and to support decision-making for private investments for the Renewable Energy (RE) sector in Gambia. The study is structured as follows:
Chapter one provides Background Information on Gambia. This includes an overview of geographical and climatic condi-tions, as well as the most important facts in view of political, economic and socio-economic conditions of Gambia.
Chapter two summarizes facts and figures of Gambia’s Energy Market including stakeholders and market actors involved as well as sector related regulations.
Chapter three presents the currently existing Political Frame-work for Renewable Energies in Gambia. This includes an overview of support mechanisms for photovoltaic (PV) as well as already existing regulations, incentives and legislative framework conditions concerning also other RE technolo-gies.
Chapter four provides a brief overview of the Status Quo and Potential for Renewable Energies in Gambia.
Chapter five summarizes the existing and potential Market Risks and Barriers in general with focus on RE.
Chapter six presents a compilation of the most relevant Re-newable Energy Business Information and Contacts of Gam-bia.
Renewable Energies in West AfricaSUMMARY 79
GAMBIA

Renewable Energies in West Africa 80
GAMBIA
COUNTRY INTRODUCTION
per River Region) plus Banjul. Gambia has eight Local Gov-ernment Areas (LGAs): Janjanbureh (Georgetown), Kun-taur, Kanifing, Banjul, Basse, Brikama, Kerewan and Mansa Konko. The next level of administrative division is the district level, which comprises of a total of 39 districts. In addition, there are two municipalities: Banjul City Council and Kanif-ing Municipal Council. Politically, the relevant units are the LAGs, districts, wards and villages.
The economy is primarily agrarian, with agriculture employment equaling about 70 % of the labor force and ac-counting for about 30 % of the Gross Domestic Product (GDP). The services sector accounts for over 50 % of the GDP resulting from re-export trade and tourism. Financial Services and Information and Communication Technologies (ICT) are also emerging and gaining importance. The manufacturing sector contributes 5 % to the GDP reflecting the low level of manufacturing activities. This is very little compared to aver-age levels registered in the region of the ECOWAS (Economic Community of West African States or CEDEAO – Commu-nauté Économique Des États de l ‚Afrique de l‘Ouest). With an average GDP growth rate of 5 %, Gambia has one of the most liberalized and best performing economies in the West African sub-region. The country is well positioned as a trading hub for the West Africa – Europe trade and transshipment. Sustained economic growth has, however, been constrained by the prevailing undiversified economic base, poor infra-structure, particularly roads/transportation and energy, slow pace in the implementation of policies and reforms, low levels of human capital and the lack of a culture of public-private partnership.
Gambia is among the poorest countries in the world with a per capita income of about 302 USD per year and ranked 155 out of 177 in 2005. The population was 1.3 mil-lion people in 2003 as compared to 1.03 million in 1993 equaling a growth rate of 2.8 % in this period. The population density grew from 97 to 128 persons per m2 over the same pe-riod, representing one of the highest in Africa. About 61.2 % of the population mainly living in rural areas are considered as poor. High levels of unemployment in the urban areas have contributed an increase in urban poverty. Significant progress was made in gender parity, education, water and sanitation as well as moderate gains in health services. The country has been implementing programs addressing poverty since 1994 when the launch of its First Strategy for Poverty Alleviation (SPA) took place. Poverty reduction, however, continues to be evasive as the number of people living in poverty is rising rather than decreasing. Moreover, poverty studies conducted in 1998 and 2003 indicate that in addition to the increase in the prevalence and severity of poverty, inequality is also on the increase.
Using the upper poverty line, based on per capita con-sumption, the head count index (i.e. the percentage of poor people) is calculated at 61.2 %. The poverty gap is calculated at 25.9 % whilst the poverty severity accounts for about 14.3 %. Data obtained in 2003 indicate that the overall poverty has been on the increase in both rural (from 61 % in 1998 to 63 % in 2003) and urban (from 48 % to 57 %) areas. The rise in rural poverty is partly associated with the poor performance of the agricultural sector particularly as it relates to declining
FIGURE 1
Map of Gambia
S E N E G A L
North Atlantic Ocean
S E N E G A L
BANJUL Gambia
BrikamaGambiaSerekunda
Basse Santa Su
1 COUNTRY INTRODUCTION
1.1 GEOGRAPHY AND CLIMATIC CONDITIONSGambia is located in the valley of the Gambia River on the West coast of Africa stretching as a narrow band of land ap-proximately 480 km long and varying in width from 48 km near the estuary of the river to 24 km inland with an overall land area of 10,689 km². The country is bordered on three sides by Senegal and dissected by the Gambia River into North and South Bank. The current population of 1.36 million (as of 2003) is estimated to grow by 2.77 % per year.
Stretching between latitude 13 ° 3’ and 13 ° 49’ North and lon-gitude 16 ° 48’ and 13 ° 47’ West, Gambia is situated in the South of the Sahel zone, a region which is largely semi-arid with only one rainy season in the year and a dry period of 6–7 months. The wet season starts in June and ends in Septem-ber, while the dry season lasts from October till May. Average daily temperatures in the dry season are 30 °C and fall slightly to 27 °C in the wet season. There are three main agro-eco-logical zones: (i) the Sahelian zone which is a small concave in the extreme North of the Central River Region (CRR North) with a rainfall of less than 600 mm, (ii) the Sudano-Sahe-lian zone with a rainfall ranging from 600 to 900 mm covers the remaining parts of CRR North, all of CRR South, the Lower River Region (LRR) and parts of the North Bank Re-gion (NBR), the Upper River Region (URR) and the Western Region (WR) and (iii) the Sudano-Guinean Zone which oc-cupies the western ends of WR and NBR with a rainfall of 900 to 1,210 mm.
1.2 POLITICAL, ECONOMIC AND SOCIO-ECONOMIC CONDITIONS
The Gambia gained independence from Britain in 1965, be-came a republic in 1971 and was one of the very few mul-tiparty democracies in Africa at that time. A military coup in 1994 briefly interrupted the country’s democratic process, which was restored in 1996 through Presidential elections fol-lowed by National Assembly elections in 1997 completing the return to a civilian government.
Administratively, the Gambia is divided into five re-gions or provincial divisions (Western Region, North Bank Region, Lower River Region, Central River Region and Up-
FarafenniSukuta
Georgetown
50 miles
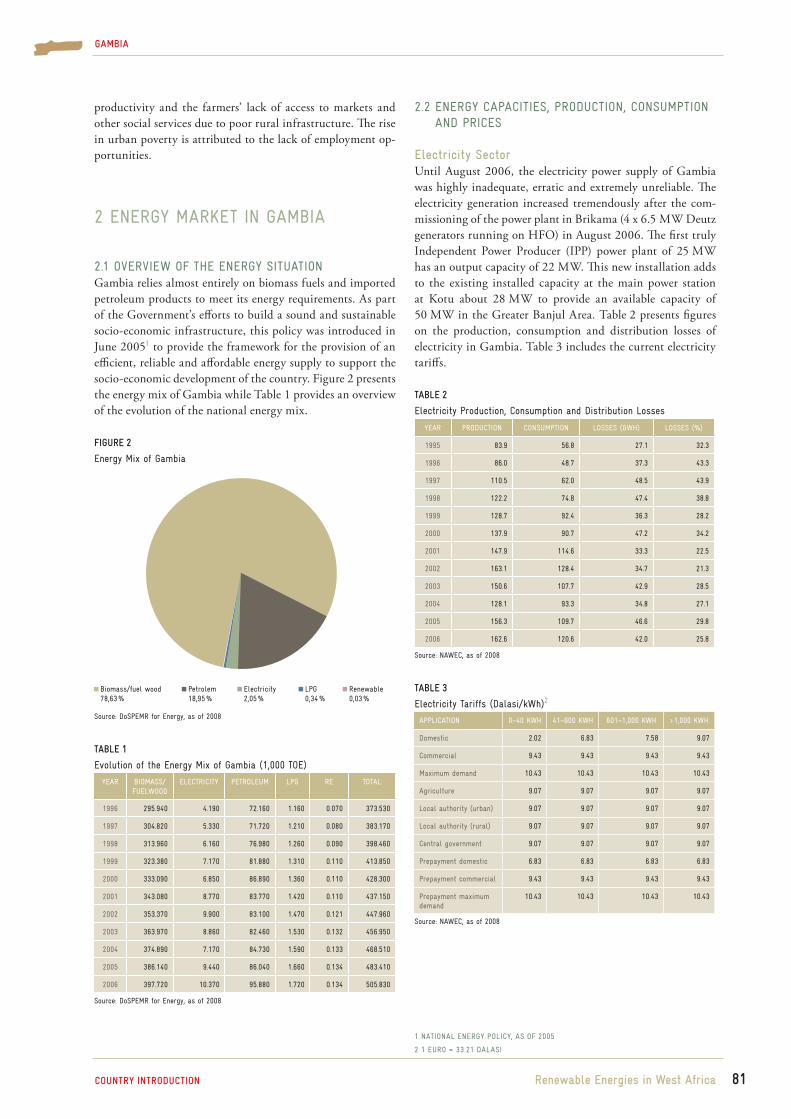
FIGURE 2
Energy Mix of Gambia
Source: DoSPEMR for Energy, as of 2008
Biomass/fuel wood78,63 %
Petrolem18,95 %
Electricity2,05 %
LPG0,34 %
Renewable0,03 %
YEAR BIOMASS/ FUELWOOD
ELECTRICITY PETROLEUM LPG RE TOTAL
1996 295.940 4.190 72.160 1.160 0.070 373.530
1997 304.820 5.330 71.720 1.210 0.080 383.170
1998 313.960 6.160 76.980 1.260 0.090 398.460
1999 323.380 7.170 81.880 1.310 0.110 413.850
2000 333.090 6.850 86.890 1.360 0.110 428.300
2001 343.080 8.770 83.770 1.420 0.110 437.150
2002 353.370 9.900 83.100 1.470 0.121 447.960
2003 363.970 8.860 82.460 1.530 0.132 456.950
2004 374.890 7.170 84.730 1.590 0.133 468.510
2005 386.140 9.440 86.040 1.660 0.134 483.410
2006 397.720 10.370 95.880 1.720 0.134 505.830
TABLE 1
Evolution of the Energy Mix of Gambia (1,000 TOE)
Source: DoSPEMR for Energy, as of 2008
YEAR PRODUCTION CONSUMPTION LOSSES (GWH) LOSSES (%)
1995 83.9 56.8 27.1 32.3
1996 86.0 48.7 37.3 43.3
1997 110.5 62.0 48.5 43.9
1998 122.2 74.8 47.4 38.8
1999 128.7 92.4 36.3 28.2
2000 137.9 90.7 47.2 34.2
2001 147.9 114.6 33.3 22.5
2002 163.1 128.4 34.7 21.3
2003 150.6 107.7 42.9 28.5
2004 128.1 93.3 34.8 27.1
2005 156.3 109.7 46.6 29.8
2006 162.6 120.6 42.0 25.8
TABLE 2
Electricity Production, Consumption and Distribution Losses
Source: NAWEC, as of 2008
APPLICATION 0–40 KWH 41–600 KWH 601–1,000 KWH > 1,000 KWH
Domestic 2.02 6.83 7.58 9.07
Commercial 9.43 9.43 9.43 9.43
Maximum demand 10.43 10.43 10.43 10.43
Agriculture 9.07 9.07 9.07 9.07
Local authority (urban) 9.07 9.07 9.07 9.07
Local authority (rural) 9.07 9.07 9.07 9.07
Central government 9.07 9.07 9.07 9.07
Prepayment domestic 6.83 6.83 6.83 6.83
Prepayment commercial 9.43 9.43 9.43 9.43
Prepayment maximum demand
10.43 10.43 10.43 10.43
TABLE 3
Electricity Tariffs (Dalasi/kWh)2
Source: NAWEC, as of 2008
1 NATIONAL ENERGY POLICY, AS OF 2005
2 1 EURO = 33.21 DALASI
Renewable Energies in West Africa
GAMBIA
COUNTRY INTRODUCTION
2.2 ENERGY CAPACITIES, PRODUCTION, CONSUMPTION AND PRICES
Electricity SectorUntil August 2006, the electricity power supply of Gambia was highly inadequate, erratic and extremely unreliable. The electricity generation increased tremendously after the com-missioning of the power plant in Brikama (4 x 6.5 MW Deutz generators running on HFO) in August 2006. The first truly Independent Power Producer (IPP) power plant of 25 MW has an output capacity of 22 MW. This new installation adds to the existing installed capacity at the main power station at Kotu about 28 MW to provide an available capacity of 50 MW in the Greater Banjul Area. Table 2 presents figures on the production, consumption and distribution losses of electricity in Gambia. Table 3 includes the current electricity tariffs.
productivity and the farmers’ lack of access to markets and other social services due to poor rural infrastructure. The rise in urban poverty is attributed to the lack of employment op-portunities.
2 ENERGY MARKET IN GAMBIA
2.1 OVERVIEW OF THE ENERGY SITUATIONGambia relies almost entirely on biomass fuels and imported petroleum products to meet its energy requirements. As part of the Government’s efforts to build a sound and sustainable socio-economic infrastructure, this policy was introduced in June 20051 to provide the framework for the provision of an efficient, reliable and affordable energy supply to support the socio-economic development of the country. Figure 2 presents the energy mix of Gambia while Table 1 provides an overview of the evolution of the national energy mix.
81

PERIOD GASOLINE DIESEL KEROSENE
Up to 10/01/03 15 12 7
11/01/03–08/10/04 19 18 9
08/10/04–15/08/05 22 21.5 9
15/08/05–23/04/07 27 25 12
23/04/07–20/05/08 30 28 21
20/05/08 to date 33 32 26
TABLE 5
Prices of Petroleum Products (Dalasi/liter)3
Source: Energy Division, DoSPEMR for Energy, as of 2008
YEAR DIESEL GASOLINE KEROSENE HFO TOTAL
1995 27.00 17.58 12.30 13.53 70.38
1996 40.14 16.00 14.00 10.80 80.94
1997 35.60 15.89 18.18 23.44 93.11
1998 40.66 15.12 19.06 22.18 97.02
1999 47.01 15.47 17.17 24.44 104.09
2000 56.56 14.51 13.56 18.83 103.46
2001 57.17 13.27 11.19 25.59 107.22
2002 52.44 12.33 16.18 35.39 116.34
2003 48.93 13.48 17.86 31.13 111.40
2004 49.79 17.71 14.90 30.95 113.35
2005 45.80 19.60 18.20 31.76 115.36
2006 48.23 20.73 24.63 34.36 127.51
TABLE 4
Import of Petroleum Products (1,000 tons)
Source: Shell Marketing Gambia Ltd., as of 2008
3 1 EURO = 33.21 DALASI
1995 1996 1997 1998 1999 2000 2001 2002 2003 2004 2005 2006
653.0 672.6 692.8 713.6 735.0 757.0 779.7 803.1 827.2 852.0 877.6 903.9
TABLE 6
Evolution of Fuel Wood Consumption (1,000 m³)
Source: DoSPEMR for Energy, as of 2008
Renewable Energies in West Africa 82
GAMBIA
COUNTRY INTRODUCTION
Petroleum SectorGambia is heavily dependent on imports to meet its require-ments of petroleum products. These include Liquefied Petro-leum Gas (LPG) as a cooking fuel substitute and diesel and HFO for generating electricity. This is the second most im-portant source of energy in the country accounting for about 18 % of the total primary energy needs as specified in the 2006 energy balance. In 2006, The Gambia imported 128 thou-sand metric tons of petroleum products, and there has been an increasing trend since 1995. Table 4 presents an overview of imported petroleum products. Table 5 presents the prices of various petroleum products.
Biomass SectorMore than 90 % of the population depend on fuel wood as their domestic energy source for cooking. This situation and the fast-growing number of inhabitants especially in the ur-ban areas contribute to the rapid deforestation. Table 6 indi-cates the evolution of fuel wood consumption.
2.3 MARKET ACTORS AND REGULATION STRUCTURESThe energy sector of Gambia is controlled by the Depart-ment of State for Petroleum, Energy and Mineral Resources (DoSPEMR) created in September 2007. It serves as the main policy adviser regarding all aspects of energy. Prior to this pe-riod, the energy sector was under the purview of the Office of the President from February 2002. Previous to that, the energy sector was under the Department of State for Trade, Industry and Employment. The Public Utilities Regulatory Authority (PURA) was created by the Government of Gambia in order to regulate the electricity, water and telecommunica-tion sectors of the country.
The Petroleum Act (2004) on exploration and pro-duction was enacted to rule the administration and manage-ment of the upstream sector of the petroleum industry. The Commissioner on Petroleum Exploration and Production ad-ministers this Act. Currently a license has been issued to the company of “Buried Hill of Canada” for some blocks in the identified potential area. The DoSPEMR has drafted a bill for petroleum products that was expected to be validated in late 2008. Until now, the management of the downstream petro-leum has not had a coordinated management structure at cen-tral Government level. The Department of State for Finance and Economic Affairs (DoSFEA) sets the price of the products according to the taxes levied on petroleum products importa-tion as a tax-based economy. LPG prices are not regulated and there is no Government tax levied.
The Gambia Renewable Energy Centre (GREC) is the technical supporter of the DoSPEMR responsible for Renew-able Energy research activities as well as the development and promotion of RE. The Forestry Department (under the De-partment of State for Forestry, Natural Resources and the En-vironment – DOSFNRE) is responsible for the management of the nation’s forest resources. The Forestry Act provides for the commercial trade in fuel wood and for the regulation of the movement of forest produce requiring valid licenses for production and sale of fuel wood.
The Department of Community Development is the technical supporter of the Department of State for Local Gov-ernment, Lands & Religious Affairs (DoSLGL&RA) and is responsible for community mobilization. The department is engaged in promoting the efficient management of fuel wood resources through the promotion of substitutes and through improved end-use appliances for firewood such as improved cooking stoves and biogas research.The National Environment Agency (NEA) is entrusted to en-sure harmony between man and his environment and is tasked with the formulation, implementation, monitoring and com-pliance with environment standards.

Renewable Energies in West Africa 83
GAMBIA
COUNTRY INTRODUCTION
3 POLICY FRAMEWORK FOR RENEWABLE ENERGIES
3.1 POLICIES, STRATEGIES AND PROGRAMS FOR RENEWABLE ENERGY PROMOTION
The National Energy Policy is consistent with the overall de-velopment policy objectives of Government as outlined in the Vision 2020 and the Poverty Reduction Strategy Paper (PRSP). The long-term aim of Gambia’s Government for the energy sector is to maximize the efficient development and utilization of scarce energy resources to support economic de-velopment in an environmentally friendly way. The Govern-ment’s overall objectives for the sector are to:
Improve and expand existing energy supply systems through private sector partnership with the public sector
Promote a domestic fuel sub-sector clearly focusing on sustainable management of forest resources
Widen the population’s access to modern forms of energy in order to stimulate development and reduce poverty
Strengthen institutional and human resource capacity and enhance Research and Development (R&D) in energy development
Provide adequate security of energy supply
According to the National Energy Policy document, the aim of the RE sub-sector is to ensure the promotion and consider-ate utilization of RE to support the sustainable development of the country. The specific objectives are to (i) promote the utilization of renewable forms of energy such as solar, wind and bio-mass (ii) promote the use and develop a domestic pro-duction capacity for RE fuels and technologies and (iii) ensure the sustainable supply of RE fuels, devices and technologies at competitive prices through private sector participation.
The Policy also encourages the use of alternative fu-els and technologies as a substitute for petroleum products through the following strategies: (i) exploring the prospects of using gas, HFO, modern biomass (including bio-energy, groundnut shell and sawdust briquettes and bagasse) for en-ergy generation, (ii) complement the Gambian Government’s fiscal incentives with donor assistance to promote the use of efficient fuels and technologies, (iii) continue to provide fiscal incentives in the form of duty releases for fuel supply to the rural electrification project and (iv) encourage investment in efficient alternative technologies for energy generation.
To promote the utilization of new and RE technolo-gies, the following strategies have been formulated: (i) popu-larize the use of solar PV, solar thermal and other RE systems to provide energy for various applications, particularly in ru-ral areas, (ii) facilitate local and international donor interven-tion on the provision of grants, interest-free loans as well as other fiscal incentives for the acquisition of renewable energy devices including solar PV and thermal, wind and biomass systems, (iii) promote the use of solar water heaters in insti-tutional facilities, hotels and private households, (iv) create awareness of the economic and environmental benefits of us-ing RE technologies through public education (TV, radio and other media), (v) promote adaptive research and development
of RE devices, (vi) encourage the production/assembly of RE devices in The Gambia, (vii) encourage utilization of efficient RE technologies by providing tax-free concessions on the technologies themselves and proven energy-efficient devices and (viii) encourage and support private sector participation in the promotion and development of RE fuels, devices and technologies at competitive prices.
3.2 REGULATIONS, INCENTIVES AND LEGISLATIVE FRAMEWORK CONDITIONS
There is no legislation for the RE sector at the moment. It is, however, expected to be formulated under the Renewable Energy and Energy Efficiency program of the GEF-UNIDO Energy Program for West Africa. To cater for this present drawback, the Electricity Act provides the framework for reg-ulation relating to electricity generation from renewable ener-gies on a commercial basis, standards in terms of electricity generating or consuming devices and personnel to be licensed for any electrical works etc. For other RE fuels, provision has been made in the draft Petroleum Products Legislation. For the devices in the domestic energy sub-sector, e. g. improved cook-stoves, there are no provisions for regulation, legislation or standardization. These are produced according to regional or sub-regional specifications and track records.
For rural electrification, concessions and other in-centives would be the only basis to encourage investment in rural areas, as these are otherwise unattractive for potential investors. At the moment, the national utility of NAWEC is the only provider of grid-electricity in the rural areas. The DoSPEMR, however, is encouraging the use of RE in the rural electrification program through private sector partici-pation. A number of private parties have, however, installed stand-alone PV systems and solar water pumping systems in some of the villages.
With regards to incentives for RE and energy efficient devices, the Government of The Gambia has adopted a policy in March 2008 to encourage the use of RE and energy ef-ficiency (EE) by granting a zero-import tax status to all solar PV panels, solar water heaters, wind energy equipment and energy efficient light bulbs (compact fluorescent lamps). In addition, there is no license fee for operators in the electricity sub-sector using RE.
As the national policy encourages the use of RE and EE, the Government welcomes and facilitates all initiatives of companies or other investors planning to invest in RE and EE devices. In most instances, additional incentives are provided by the Gambia Investment Promotion and Free Zone Agency (GIPFZA) for investments especially in energy and RE.

Renewable Energies in West Africa 84
GAMBIA
COUNTRY INTRODUCTION
4 STATUS AND POTENTIAL FOR RENEWABLE ENERGIES
4.1 BIOMASS/BIOGASThe use of fuel wood and residues from wood processing for electricity generation is not encouraged because of the already present constraints in the utilization of wood for domestic cooking. More than 90 % of the population rely on wood to meet their energy needs. The use of other types of biomass is quite low due to the limited availability of agricultural waste and other potential sources.
There are some limited activities in the field of biofuels mainly produced from jatropha. Several projects were initi-ated by the Government in the 1980s in order to search for fuel alternatives to reduce the country’s dependence on fuel wood and charcoal. This included the promotion of improved cooking stoves using firewood or charcoal and groundnut shell briquettes.
Biogas was subject to research activities in the early 1980s, but its implementation was rejected due to cultural barriers. Recently, however, the DoSPEMR participated in the promotion of biogas through the Peri-Urban Project for Agriculture. Within this, 20 biogas digesters in rural and peri-urban areas were implemented. At least two of these sites are running satisfactorily.
4.2 SOLAR ENERGYWith respect to solar energy, Gambia has a substantial poten-tial of 4.5–5.3 kW/m²/day. Therefore, solar energy is one of the most promising RE sources of the country. By the end of 2006, PV installations with a capacity of more than 700 kWp were installed in Gambia. In addition to PV applications, the implementation of solar cookers and solar water heating units helps to reduce the high demand in electricity consumption.
4.3 WIND POWERThe available wind power potential of Gambia is about 3 m/s. Presently about 20 wind power applications are in operation for water pumping purposes. Even though the available wind power potential is modest, the coastal areas of Gambia offer substantial opportunities for the future.
4.4 HYDRO POWERGambia has no national Hydro Power potential. The country, however, cooperates with Guinea, Senegal and Guinea Bissau in order to construct two large-scale Hydro Power electricity generation units at Sambagalo and Kaleta.
5 MARKET RISKS AND BARRIERS
The promulgation of an Electricity Act (Electricity Act 2005) and the finalization of the Petroleum Products Bill expected to be legislated this year will provide the necessary environ-ment for private investor participation with laws protecting the interests of both the consumers and investors. The Public Utilities Regulatory Authority (PURA) regulates the sector through the Acts.
The Gambian Government has made the process for private sector participation as transparent as possible in order to minimize the issue of corruption as much as possible. The Government has ratified the international Law on Intellectual Property Rights through the National Assembly in 2006 thus acknowledging the value and inviolability of innovations and creativity.
Private sector participation is the cornerstone of Gov-ernment policy, including the National Energy Policy that ac-knowledges and encourages investments by the private sector. Domestic and foreign private sector commitment is most wel-comed especially for the production and delivery of goods and services and employment creation. The GIPFZA acts as a one-stop shop for all investors to the country. This agency provides investment certificates and incentives for qualified investors in the energy sector. There are no restrictions on transfer of mar-gins or profit, and the banking sector is completely liberalized including foreign exchange rates and transactions and transfer of foreign currency.
Capacity for trained personnel has been recognized as inadequate. Therefore, the DoSPEMR collaborates with other partners in order to provide training seminars on basic energy technology and RE technologies.

Renewable Energies in West Africa 85
GAMBIA
COUNTRY INTRODUCTION
6 RENEWABLE ENERGY BUSINESS INFORMATION AND CONTACTS
NAME ADDRESS PROFILE
Department of State for Petroleum, Energy & Mineral Resources
2nd Floor, Futurelec BuildingBertil Harding Highway, KotuPhone: +220 890 51 [email protected]
Policy adviser to the Government in all aspects of energy responsible for policy formulation, implementation and monitoring
Gambia Renewable Energy CentreDoSPEMR TK Motor Road, KanifingPhone: Tel: +220 439 28 38
Technical supporter of the Department of Energy respon-sible for RE research, development and promotion
Department of Forestry Phone: +220 448 48 44Responsible for forest resource protection and manage-ment including the management of fuel wood supply
National Environment Agency (NEA)Fitzgerald Street, BanjulPhone: +220 422 38 [email protected]
Formulation, implementation and monitoring of environ-mental standards
National Water and Electricity Company (NAWEC)
53 Mamadi Manjang Highway P. O. Box 609, BanjulPhone: +220 437 62 33Fax: +220 437 59 [email protected]
Electricity, water and sewage services in the urban and peri-urban areas
Public Utilities Regulatory Authority (PURA)Bertil Harding Highway, KololiPhone: +220 446 51 [email protected]
Regulatory body for electricity, water and telecom-munication
Gambia Investment Promotion and Free Zone Agency (GIPFZA)
Phone: +220 437 73 [email protected]
Support and promotion of investments in Gambia
Development Management Consultant International (DMCI)
P. O Box 5342, Brikama NyambiaPhone: +220 448 45 [email protected]
Provides consultancy services in the energy sector and other sectors as well
RC Engineering Phone: +220 990 94 [email protected]
Consultancy Services for solar power and water pumping systems
CESPhone: +220 437 82 [email protected]
PV and electrical equipment services
Sun Power Phone: +220 422 92 [email protected]
PV and water pumping systems
ESEIM Solar Phone: +220 990 60 [email protected]
PV and water pumping systems
Solar Project Gambia Phone: +220 439 90 [email protected]
Solar drying and cooking
Power Systems Engineering Phone: +220 984 28 [email protected]
PV and wind energy
Gambia Electrical Phone: +220 439 21 [email protected]
Electrical sales and contractor
SWE-GAM Co Ltd Phone: +220 437 24 [email protected]
Water pumping systems and PV
JECCO Phone: +220 446 17 [email protected]
PV, pumps, borehole & well equipment
ABC Gaye’s AssociationPhone: +220 437 06 [email protected]
Improved stoves
Gam SolarPhone: +220 985 63 [email protected]
PV and water supply systems
TABLE 7
Local Business Partners and Institutions

7 BIBLIOGRAPHY
Republic of The Gambia/European Community (2007): Country Strategy Paper And National Indicative Program. For the period 2008-2013 (http://ec.europa.eu/develop-ment/icenter/repository/scanned_gm_csp10_en.pdf)
Development Management Consultants International – DMCI (2005): Report Household Energy Strategy for Gambia (HES)
N. N. (without year): Review of Traditional Energy Sector (RPTES), Country Study 1st Draft, Banjul
The Government of The Gambia (1998): Forest Bill de Bakker, Peerke (2003): The Gambia Country Side – Eu-ropean Union Energy Initiative for the Eradication of Poverty and Sustainable Development (EUI), Banjul
N. N. (1982): Energy Survey and Master Plan Report, Draft Final Report, Banjul
N. N. (without year): Report of the Study on The Feasibil-ity of Producing Charcoal Briquettes in Gambia
N. N. (2005): National Energy Policy 2005, Part I – Over-view of the Situation and Part II – Policies and Strategies
Government of The Gambia (1994): Vision 2020 Inc. Energy Department, Department of State for Energy (2008): National Energy Data
N. N. (2005): Project for the Construction of a New Power Station in Gambia
Management Development International – DMCI (2005): Final Report on a National Household Energy Consump-tion Survey in Gambia
Department of State for Finance and Economic Affairs (2005/06): Gambia – The Second Strategy for Poverty Alleviation (SPAII). Poverty Reduction Strategy Paper (2003–2005)
Lahmeyer International GmbH (2007): Final Feasibility Study – Solar Home System Program
Lahmeyer International GmbH (2006): Final Feasibility Study – Small Scale Wind
Renewable Energies in West Africa 86
GAMBIA
BIBLIOGRAPHY

COUNTRY CHAPTER:
GHANA Author of Country Chapter Vincent Yankey (MBA, BSc)
Coordination and Review of the Country ChapterAnton Hofer, (MSE, Dipl.-Ing./FH, M.A.)WIP-Renewable Energies www.wip-munich.deMunich, Germany
Editor Deutsche Gesellschaft für Technische Zusammenarbeit (GTZ) GmbHDepartment Water, Energy, TransportDag-Hammarskjöld-Weg 1-565760 Eschborn, Germanywww.gtz.de
On behalf of Federal Ministry for Economic Cooperation and Development (BMZ)
Editorial staffDiana KraftTel: +49 (0)6196 79 4101Fax: +49 (0)6196 79 80 4101Email: [email protected]
Renewable Energies in West Africa 87

CONTENTS GHANA
ACRONYMS, ABBREVIATIONS AND MEASUREMENTS 89
SUMMARY 90
1 COUNTRY INTRODUCTION 92 1.1 Geography and Climatic Conditions 92 1.2 Political, Economic and Socio-economic Conditions 92
2 ENERGY MARKET IN GHANA 93 2.1 Overview of the Energy Situation 93 2.2 Energy Capacities, Production, Consumption and Prices 93 2.3 Market Actors and Regulation Structures 95
3 POLICY FRAMEWORK FOR RENEWABLE ENERGIES 96 3.1 Policies, Strategies and Programs for Renewable Energy Promotion 96 3.2 Regulations, Incentives and Legislative Framework Conditions 96
4 STATUS AND POTENTIAL FOR RENEWABLE ENERGIES 97 4.1 Biomass/Biogas 97 4.2 Solar Energy 97 4.3 Wind Power 97 4.4 Hydro Power 97
5 MARKET RISKS AND BARRIERS 98
6 RENEWABLE ENERGY BUSINESS INFORMATION AND CONTACTS 100
7 BIBLIOGRAPHY 102
Renewable Energies in West Africa 88CONTENTS
GHANA

ACRONYMS AND ABBREVIATIONS GHANA
AGSI Association of Ghana Solar Industries
ATK Aviation Turbine Kerosene
BST Bulk Supply Tariff
CDM Clean Development Mechanism
DANIDA Danish International Development Agency
DSC Distribution Service Charge
DSTC Deng Solar Training Center
EC Energy Commission
ECG Electricity Company of Ghana
EPA Environmental Protection Agency
ERP Economic Recovery Program
EUT End User Tariffs
GDP Gross Domestic Product
GEDAP Ghana Energy Development and Access Project
GEF Global Environment Fund
GHp Ghana Pesewas (1 GHp = 0.6313 Euro)
GHS Ghana Cedi (currency of Ghana; 1 Ghana Cedi (GHS) = 100 Ghana Pesewas)
GIPC Ghana Investment Promotion Center
GPRS Growth and Poverty Reduction Strategy
GRIDCO Grid Company Limited
GT Ghana Telecom
GVCTF Ghana Venture Capital Trust Fund
Hi-fi high-fidelity (quality standard for audio technique)
IPP Independent Power Producers
KITE Kumasi Institute of Technology, Energy and Environment
LPG Liquefied Petroleum Gas
M2+ key economic indicator and term used to forecast inflation
MIGA Multilateral Investment Guarantee Agency
NED Northern Electricity Department
NES National Electrification Scheme
NREL National Renewable Energy Laboratory
PURC Public Utilities Regulatory Commission
PV Photovoltaic
RESPRO Renewable Energy Services Project
RFO Residual Fuel Oil
SHS Solar Home System
SLTV-HV Solar Lamps and Television – high voltage
SLTV-LV Solar Lamps and Television – low voltage
SLTV-MV Solar Lamps and Television – medium voltage
SME Small/Medium Enterprise
SMME Small Micro and Medium Enterprises
SOE State Owned Enterprises
TAPCO Takoradi Power Company
TICO Takoradi International Company
TSC Transmission Service Charge
UNDP United Nations Development Program
USD United States Dollars
VAT Value Added Tax
VRA Volta River Authority
Renewable Energies in West Africa 89ACRONYMS, ABBREVIATIONS AND MEASUREMENTS
GHANA

MEASUREMENTS
GWh gigawatt hour
koe kilograms of oil equivalent
kVA kilovolt ampere
kWh kilowatt hour
m2 square meter
m3 cubic meter
MJ mega joule
mm millimeter
MW megawatt
° C degree Celsius
t ton
toe tons of oil equivalent
Renewable Energies in West Africa 90ACRONYMS, ABBREVIATIONS AND MEASUREMENTS
GHANA

SUMMARY
The Country Study of Ghana is to provide an overview of the country’s energy market and to support decision-making for private investments for the Renewable Energy (RE) sector in Ghana. The study is structured as follows:
Chapter one provides Background Information on Ghana. This includes an overview of geographical and climatic condi-tions, as well as the most important facts in view of political, economic and socio-economic conditions of Ghana.
Chapter two summarizes facts and figures of Ghana’s Energy Market including stakeholders and market actors and involved as well as related regulations.
Chapter three presents the currently existing Political Frame-work for Renewable Energies in Ghana. This includes an over-view of support mechanisms for photovoltaic (PV) as well as already existing regulations, incentives and legislative frame-work conditions, concerning other RE technologies.
Chapter four provides a brief overview of the Status Quo and Potential for Renewable Energies in Ghana.
Chapter five summarizes the existing and potential Market Risks and Barriers in general with focus on RE.
Chapter six presents a compilation of the most relevant Renew-able Energy Business Information and Contacts of Ghana.
Renewable Energies in West AfricaSUMMARY 91
GHANA

1 COUNTRY INTRODUCTION
1.1 GEOGRAPHY AND CLIMATIC CONDITIONSLake Volta, which runs through most of the eastern side of the country, is the world’s biggest artificial lake, which re-sulted from the construction of the national power plant at Akosombo. Offshore hydrocarbon deposits explored at Cape Three Points have proven crude oil reserves, estimated at 1.8 billion barrels. The geographical location of the country also permits extensive fishing in the Atlantic Ocean. Ghana has tropical climatic conditions. It is warm and comparatively dry along the southeastern coast, hot and humid in the South-west, hot and dry in the North. The country consists mostly of low plains with dissected plateaus in the southern central areas. The hottest months are March and April when the tem-perature reaches 31 °C. The wettest month is June when aver-age rainfall is estimated at 178 mm, after which the main food harvest comes.
FIGURE 1
Map of Ghana
1.2 POLITICAL, ECONOMIC AND SOCIO-ECONOMIC CONDITIONS
In 1957, Ghana became the first country in Colonial Africa to gain independence. A series of coups following independence resulted in the suspension of the constitution in 1981 and the proscription of political parties by the military government of that time. A new constitution, restoring multiparty politics, was approved in a national referendum in 1992. Flt. Lt. Jerry John Rawlings, head of state from 31 December 1981, won the presidential elections in December 1992 and December 1996. He was constitutionally barred from running for a third term in the 2000 elections, which was won by John Agyekum Kufour.
Presently, a consensus on economic paradigm is de-veloping. Both the current and the previous Government welcome private sector participation and believe in economic and structural reforms including privatization of State Owned Enterprises (SOEs). Political stability is prevailing. Although
Renewable Energies in West Africa 92
GHANA
COUNTRY INTRODUCTION
general elections were expected to be held in December 2008, there was no real apprehension of the direction of the econo-my irrespective of the winner of the next elections.
Ghana’s educational system is rated as one of the best in the sub-region. 68 % of the population have at least basic education. There are several universities and institutions of high learning catering for the needs of natives and foreigners. There is also a reasonably large pool of both skilled and un-skilled labor, and for both wages are relatively low.
Road transport accounts for 98 % of all freight that is moved. The railway system, which has been reconstructed, consists of a triangular network connecting Accra, Kumasi and Sekondi-Takoradi. Ghana’s two ports in Tema and Ta-koradi, however, are in a good state, and cargo handling has been increasing continuously. Whereas Tema concentrates on imports, Takoradi handles mainly exports. Ghana is well con-nected via international airlines including the national carrier of Ghana International Airlines.In mid-2008, the Government sold 70 % of its 100 % share in Ghana Telecom (GT) to Vodacom from the United King-dom. A second network operator, Western Telesystems Lim-ited (now Zain), is also licensed to provide telephone and data services.
The main framework guiding Ghana’s overall develop-ment is the Ghana Growth and Poverty Reduction Strategy (GPRS II). It aims to lift the country to middle-income status by 2015. Therefore, the Government has projected a per capita income of 1,020 USD (799.58 Euro) by 2015, a figure that many analysts see as unrealistic, looking at the pace of cur-rent economic development. Analysts and market watchers, however, agree that Ghana has experienced impressive growth rates over the last years, significantly rising from an annual growth rate of 3.7 % in 2000 to 6.4 % by the end of 2007.
Ghana’s recent fiscal policy has tended to focus on cre-ating an enabling macro-environment for private businesses and streamlining the operations of Government organizations to enable them to operate on full cost recovery basis by fix-ing the appropriate level of tariffs. Therefore, institutions such as the Public Utilities Regulatory Commission (PURC), the Petroleum Tender Board and the National Communications Authority were established to regulate tariffs. Petroleum and utility tariffs (water, electricity and telephone) were raised sev-eral times over the last three years in order to enable the Gov-ernment to cut back on subsidies and hence reduce its high budget deficits.
The focus of the monetary policy over the years was on bringing down both interest rate and inflation or at least keeping them at manageable levels. This means the Central Bank has been averse to growth in broad money (the so-called M2+). It also pursues aggressive open market operations and complements this with deposit auctions.
100 miles
Lake Volta
Bolgatanga
Tamale
Kumasi
Bight of Benin
Asamankese
Tarkwa
Nsawam
Takoradi
Tema
Ho
Golf of Guinea
Cape Coast
ACCRA
B U R K I N A F A S O
B E N I N
T O G OC O T E D ' I V O I R E

Renewable Energies in West Africa
GHANA
COUNTRY INTRODUCTION
2.2 ENERGY CAPACITIES, PRODUCTION, CONSUMPTION AND PRICES
Electricity SectorGhana’s power generation sources comprise two major in-stalled hydroplants at Akosombo and Kpong with an overall generation capacity of 1,180 megawatts, constituting 68 % of total generation capacity. Two diesel-powered thermal gener-ating plants in Takoradi have a total capacity of 550 mega-watts, constituting the remaining 32 % of the total generation capacity. The electricity generation capacities are summarized in table 1.
Ghana’s power generation trend from 2000–2007 has been erratic. The minimum reservoir elevation of the Akosom-bo dam, which generates about 56 % of the nation’s electric-ity, is 238 feet. This level is required to generate hydroelectric power of 16 GWh/day. Table 4 presents the trend in electricity generation between 2000 and 2007. The main consumers of electricity are households, industry and commerce including educational institutions and health facilities. Consumption figures of these consumers are shown in table 5.
2 ENERGY MARKET IN GHANA
2.1 OVERVIEW OF THE ENERGY SITUATIONThe bulk of Ghana’s energy consumption is covered by bio-mass (in the form of firewood and charcoal) accounting for about 59 % of the total energy consumption. Electricity prod-ucts account for 9 % and petroleum products for 32 %. The per capita energy consumption is estimated at 360 kilograms of oil equivalent (koe). The overall energy consumption of Ghana is estimated at 6.6 million toe. The situation is worse in the rural areas where as much as 82 % still use kerosene, candles and other traditional fuels as sources of light. Their share of grid electricity accounts for only 17.1 %. Generators, dry cell and automotive batteries account for the remaining 0.9 %.
In the last few years, the predominant source of electric power and major energy source in Ghana was hydro. Biomass, including firewood and charcoal, forms the bulk of energy for cooking and water heating in the residential & commercial sector. Solar energy plays a significant role in the agricultural sector (crop production, drying etc.) and more recently in the tourist industry and educational institutions. Moderate wind speed identified in the southern part, particularly along the coastal belt, is yet to be exploited. The most recent develop-ment is the identification of crude oil in commercial quanti-ties. Up to now, all crude oil and some petroleum products have been imported. The native natural gas deposits are too small to be commercially exploited, and there are also no nu-clear or coal power plants in operation.
93
SOURCE CAPACITY (MW) SHARE ( %)
Total Hydro Power 1,180 68 %
Akosombo hydroplant 1,020 59 %
Kpong hydroplant 160 9 %
Total thermal power 550 32 %
TAPCO thermal power plant 330 19 %
TICO thermal power plant 220 13 %
Total energy capacity installed 1,730 100 %
TABLE 1:
Electricity Generation Capacity of Ghana
Source: VRA, as of 2006
SITE LIGHT CRUDE OIL DISTILLATE FUEL OIL
TAPCO 356,187 258
TICO 479,327 677
Total 835,514 935
TABLE 2:
Consumption of Light Crude Oil for Thermal Electricity Generation (m3)
Source: VRA, as of 2006
THERMAL GENERATION (ON AVERAGE) ENERGY SOURCE CONSUMPTION (T)
1 GWh of electricity by TAPCO combined cycle gas turbine
Light crude oil 221
1 GWh of electricity by TICO single cycle gas turbine
Light crude oil 332
1 GWh of electricity by diesel power generators less than 1.2 MVA
Diesel oil 300 (average)
TABLE 3:
Average Thermal Generation and Energy Consumption
Source: VRA, as of 2007
YEAR 2000 2001 2002 2003 2004 2005 2006 2007*
Hydro 6,610 6,608 5,036 3,885 5,281 5,629 5,619 3,727
Shares ( %) 92 84 69 77 87 83 67 53
Thermal 613 1,251 2,260 2,015 758 1,159 2,810 3,251
Shares ( %) 8 16 31 34 13 17 33 47
Total Generation 7,223 7,859 7,296 5,900 6,039 6,788 8,429 6,978
TABLE 4:
Trend in Electricity Generation (GWh) 2000–20071
Source: VRA, Energy Commission of Ghana, as of 2007
1 NOTE: THE REDUCTION IN 2007 IS DUE TO THE DROP IN ENERGY GENERATION FROM THE
AKOSOMBO PLANT CAUSED BY DROUGHT.
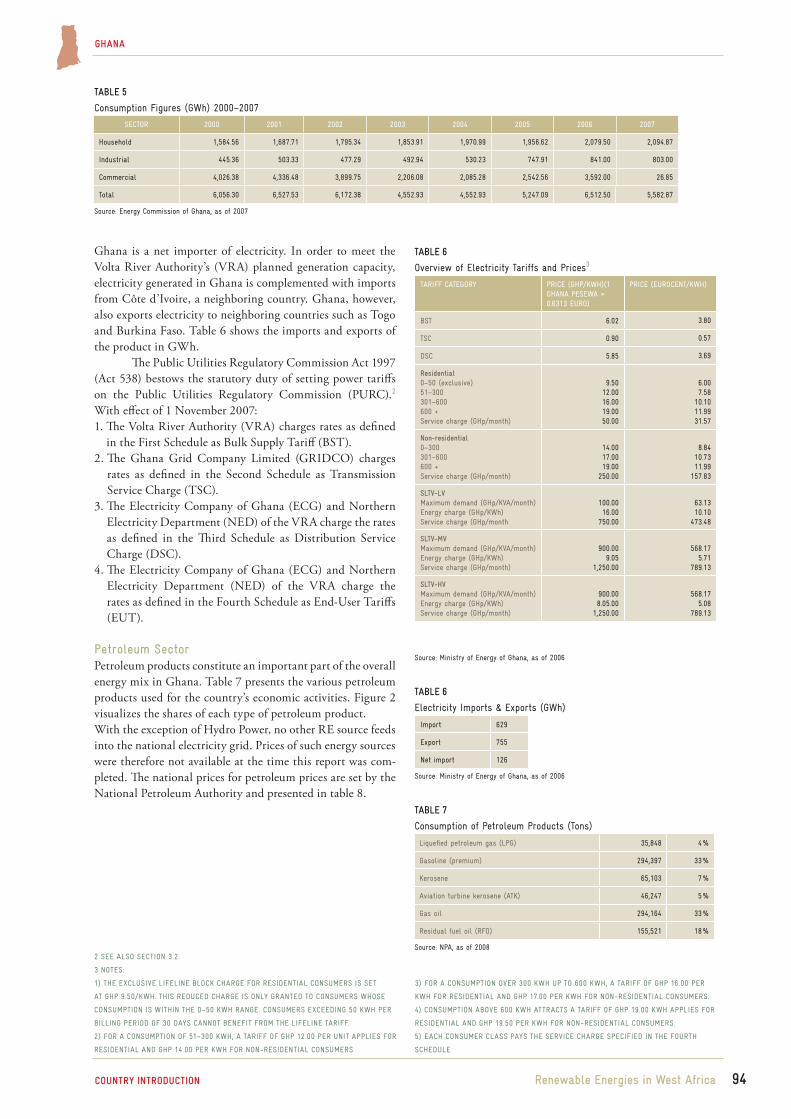
Renewable Energies in West Africa 94
GHANA
COUNTRY INTRODUCTION
Ghana is a net importer of electricity. In order to meet the Volta River Authority’s (VRA) planned generation capacity, electricity generated in Ghana is complemented with imports from Côte d’Ivoire, a neighboring country. Ghana, however, also exports electricity to neighboring countries such as Togo and Burkina Faso. Table 6 shows the imports and exports of the product in GWh.
The Public Utilities Regulatory Commission Act 1997 (Act 538) bestows the statutory duty of setting power tariffs on the Public Utilities Regulatory Commission (PURC).2 With effect of 1 November 2007:1. The Volta River Authority (VRA) charges rates as defined
in the First Schedule as Bulk Supply Tariff (BST).2. The Ghana Grid Company Limited (GRIDCO) charges
rates as defined in the Second Schedule as Transmission Service Charge (TSC).
3. The Electricity Company of Ghana (ECG) and Northern Electricity Department (NED) of the VRA charge the rates as defined in the Third Schedule as Distribution Service Charge (DSC).
4. The Electricity Company of Ghana (ECG) and Northern Electricity Department (NED) of the VRA charge the rates as defined in the Fourth Schedule as End-User Tariffs (EUT).
Petroleum SectorPetroleum products constitute an important part of the overall energy mix in Ghana. Table 7 presents the various petroleum products used for the country’s economic activities. Figure 2 visualizes the shares of each type of petroleum product. With the exception of Hydro Power, no other RE source feeds into the national electricity grid. Prices of such energy sources were therefore not available at the time this report was com-pleted. The national prices for petroleum prices are set by the National Petroleum Authority and presented in table 8.
SECTOR 2000 2001 2002 2003 2004 2005 2006 2007
Household 1,584.56 1,687.71 1,795.34 1,853.91 1,970.99 1,956.62 2,079.50 2,094.87
Industrial 445.36 503.33 477.29 492.94 530.23 747.91 841.00 803.00
Commercial 4,026.38 4,336.48 3,899.75 2,206.08 2,085.28 2,542.56 3,592.00 26.85
Total 6,056.30 6,527.53 6,172.38 4,552.93 4,552.93 5,247.09 6,512.50 5,582.87
TABLE 5
Consumption Figures (GWh) 2000–2007
Source: Energy Commission of Ghana, as of 2007
Import 629
Export 755
Net import 126
TABLE 6
Electricity Imports & Exports (GWh)
Source: Ministry of Energy of Ghana, as of 2006
2 SEE ALSO SECTION 3.2.
3 NOTES:
1) THE EXCLUSIVE LIFELINE BLOCK CHARGE FOR RESIDENTIAL CONSUMERS IS SET
AT GHP 9.50/KWH. THIS REDUCED CHARGE IS ONLY GRANTED TO CONSUMERS WHOSE
CONSUMPTION IS WITHIN THE 0–50 KWH RANGE. CONSUMERS EXCEEDING 50 KWH PER
BILLING PERIOD OF 30 DAYS CANNOT BENEFIT FROM THE LIFELINE TARIFF.
2) FOR A CONSUMPTION OF 51–300 KWH, A TARIFF OF GHP 12.00 PER UNIT APPLIES FOR
RESIDENTIAL AND GHP 14.00 PER KWH FOR NON-RESIDENTIAL CONSUMERS
3) FOR A CONSUMPTION OVER 300 KWH UP TO 600 KWH, A TARIFF OF GHP 16.00 PER
KWH FOR RESIDENTIAL AND GHP 17.00 PER KWH FOR NON-RESIDENTIAL CONSUMERS.
4) CONSUMPTION ABOVE 600 KWH ATTRACTS A TARIFF OF GHP 19.00 KWH APPLIES FOR
RESIDENTIAL AND GHP 19.50 PER KWH FOR NON-RESIDENTIAL CONSUMERS.
5) EACH CONSUMER CLASS PAYS THE SERVICE CHARGE SPECIFIED IN THE FOURTH
SCHEDULE
TARIFF CATEGORY PRICE (GHP/KWH)(1 GHANA PESEWA = 0.6313 EURO)
PRICE (EUROCENT/KWH)
BST 6.02 3.80
TSC 0.90 0.57
DSC 5.85 3.69
Residential0–50 (exclusive)51–300301–600600 +Service charge (GHp/month)
9.5012.0016.0019.0050.00
6.007.58
10.1011.9931.57
Non-residential0–300301–600600 +Service charge (GHp/month)
14.0017.0019.00
250.00
8.8410.7311.99
157.83
SLTV-LVMaximum demand (GHp/KVA/month)Energy charge (GHp/KWh)Service charge (GHp/month
100.0016.00
750.00
63.1310.10
473.48
SLTV-MVMaximum demand (GHp/KVA/month)Energy charge (GHp/KWh)Service charge (GHp/month)
900.009.05
1,250.00
568.175.71
789.13
SLTV-HVMaximum demand (GHp/KVA/month)Energy charge (GHp/KWh)Service charge (GHp/month)
900.008.05.00
1,250.00
568.175.08
789.13
TABLE 6
Overview of Electricity Tariffs and Prices3
Source: Ministry of Energy of Ghana, as of 2006
Liquefied petroleum gas (LPG) 35,848 4 %
Gasoline (premium) 294,397 33 %
Kerosene 65,103 7 %
Aviation turbine kerosene (ATK) 46,247 5 %
Gas oil 294,164 33 %
Residual fuel oil (RFO) 155,521 18 %
TABLE 7
Consumption of Petroleum Products (Tons)
Source: NPA, as of 2008

Renewable Energies in West Africa 95
GHANA
COUNTRY INTRODUCTION
2.3 MARKET ACTORS AND REGULATION STRUCTURESThe main actors for energy planning and regulation in Ghana are the relevant public institutions responsible for producing and enacting laws that regulate the distribution and tariffs. Recently, the private sector has been involved in the promo-tion of RE as an additional contributor to the national energy mix. The main actors are:
Volta River Authority (VRA). The VRA is responsible for the generation and transmission of electricity in Ghana and supplies electricity in bulk to ECG for onward distri-bution to the southern part of the country. It also distrib-utes power in northern Ghana through its subsidiary, the Northern Electricity Department (NED).
The Energy Commission (EC) and the Public Utilities Regulatory Commission (PURC). Both function as regula-tory agencies and have been established by Acts of Parlia-ment to ensure the smooth cooperation of all players in the energy sector and to create the necessary environment for the protection of private investment in the sector.
The EC was established in accordance with the Energy Commission Act of 1997 (Act 541). Its roles include the regulation and administration of utilization of energy resources in Ghana.
The PURC Act of 1997 (Act 538) established the Public Utilities Regulatory Commission to regulate and oversee the provision of utility services by the public sector to consumers and related matters.
Ghana aims at achieving medium income status by the year 2015. Analysts believe that in order to achieve this goal, the Gross Domestic Product (GDP) has to triple. Energy is a criti-cal success factor in this plan. As the economy is poised for growth, demand for energy also increases. Industries have to be supplied with adequate consumption levels to facilitate the production of goods and services. Households and education-al institutions cannot be left out if all spheres of the economy will experience this considerable growth level. In this regard, modern energy is the main topic of discussion in different fo-rums. The Minister of Energy, Felix Kwasi Owusu-Adjapong, claims that “Ghana needs to increase its power generation ca-pacity beyond 4,000 MW within the next four years in order to attain a medium income status”.
Ghana’s Vision 2020 as framed within the scope of the National Electrification Scheme (NES) comprises a Gov-ernment policy of achieving 100 % electrification by the year 2020 (as opposed to presently 54 %). The current generation level is inadequate for a nationwide extension of the grid, mainly due to energy shortfalls. These existing insufficiencies shift responsibility on policy makers to promote alternative energy sources such as RE for an overall growth of the energy sector.
Source: NPA, as of 2006
FIGURE 2
Shares of Petroleum Products
LPG 4 %
RFO 18 %
Gas Oil 33 %
Gasoline 33 %
Kerosene 7 %
ATK 5 %
PRODUCT 2000 2001 2002 2003 2004 2005 2006 2007
Gasoline 14.20 23.21 23.2 44.44 44.44 68.52 81.90 92.53
Diesel 13.25 19.56 19.56 38.89 38.89 61.33 76.61 87.31
Kerosene 13.25 24.64 24.64 38.89 38.89 50.36 64.47 77.44
LPG 20.70 22.00 22.00 38.00 38.00 53.84 68.46 82.32
Source: NPA, as of 2007
TABLE 8
Retail Prices4 of Petroleum Products (GHS/liter)5
4 ANNUAL AVERAGE PRICES
5 CONVERSION RATE: 1 GHS = 0.6313 EURO, AS OF OCTOBER 2008

Renewable Energies in West Africa 96
GHANA
COUNTRY INTRODUCTION
3 POLICY FRAMEWORK FOR RENEWABLE ENERGIES
3.1 POLICIES, STRATEGIES AND PROGRAMS FOR RE-NEWABLE ENERGY PROMOTIONTechnical advice to the Ministry of Energy is vested in the Energy Commission. The Commission has recommended the integration of RE technologies as alternative sources to the en-ergy mix of Ghana. One of the policies being developed by the Energy Commission in collaboration with the World Bank is the Renewable Energy Law. No valid regulations for RE, e.g. for the pricing of biodiesel as an alternative to fossil diesel, are in place. Tariffs for energy generated by wind turbines are not available at present. The Commission, however, has received funds for drafting and implementing the Renewable Energy Law that will cover all technologies found in Ghana including wind, solar, waste-to-energy and biomass. The Government’s objective is to create an enabling environment that will lead to the integration of RE technologies as alternatives to the main and yet unsustainable energy sources found in the country. To demonstrate its commitment to strengthen the industry, the Government currently provides certain incentives to promote specific technologies and to provide a level playing field for all competitors throughout the industry.
3.2 REGULATIONS, INCENTIVES AND LEGISLATIVE FRAMEWORK CONDITIONS
For investors importing generators to invest in the RE sector, the following specific incentives are available:1. Total exemption from import duty on RE generators includ-
ing solar generators, wind turbines and municipal waste2. Exemption from VAT in importing RE products only if
the components are brought in whole (i. e. not in separate pieces) into the country
3. Exemption from the payment of customs import duties on plant, machinery, equipment and accessories imported spe-cifically and exclusively to establish the enterprise
RE legislation in Ghana is ruled by the Energy Commission Act of 1997 (Act 541) and the Public Utilities Regulatory Commission Act (Act 538). The Renewable Energy Division of the Energy Commission is responsible for developing na-tional policies and strategies for all RE resources, technologies, demand and supply side management and generation such as solar PV systems for both stand-alone and grid connected ap-plications wind energy resource assessment and generation, small hydro development in Ghana covering mini and micro projects, biomass/biofuel and wood fuel resource assessment, development and generation. The objectives of the Renewable Energy Division of the EC include the following objectives:1. To develop codes and standards for solar, wind and bio-
energy systems in order to support the deployment of RE technologies (especially for rural development and envi-ronmental care) as well as to enhance energy efficiency and supply for economic growth
2. To promote RE energy projects
3. To ensure that all RE service providers are provided with licenses/permits
4. To develop regulations and codes of practice to guide op-erations of charcoal exporters in the charcoal industry in order to ensure the conservation of the national forests
5. To ensure that RE service providers comply with licens-ing terms and conditions, regulations and codes of practice through effective monitoring and supervision
6. To collaborate with other divisions in order to strategically plan national energy resources and usage
Other regulatory institutions involved in the RE industry are the Environmental Protection Agency (EPA) and the Ghana Standards Board. The Ghana Standards Board’s certification of product and environmental permit issued by the EPA are required for importing and selling solar systems in Ghana. Companies buying from the Ghanaian open market, however, are allowed to operate with the permits and licenses of the wholesalers until they start their own solar system importa-tion.
The current level of national electrification is 54 %. Electrification is mainly accessible to the regional capitals, district capitals and commercial towns leaving most of the rural areas off the national electricity grid. The National Elec-trification Scheme, framed within Ghana’s Vision 2020, in-culcates a Government policy of achieving a one hundred per cent (100 %) electrification by the year 2020. Policy makers are confronted with meeting modern energy needs of rural Ghana. In order to endow this objective with appropriate funds, the Government has sought a grant from the World Bank and implemented the Ghana Energy Development and Access Project (GEDAP). Under this program, a 6 million USD revolving fund is managed by rural banks enabling ru-ral households to access sustainable lighting products such as solar lanterns. The rural banks are loaning between 20–25 % per annum based on the profile of clients.
It has been suggested that RE can fill the gap in the rural-urban energy sector. One of the major projects aimed at addressing rural energy needs is the UNDP/Global Environ-ment Fund (GEF), a joint project of the National Renewable Energy Laboratory (NREL), the USA and the Government of Ghana’s Renewable Energy-Based Electricity for Rural, Social and Economic Development (RESPRO) in the East Mampru-si district of the Northern Region of Ghana aiming to provide solar energy on a user for fee basis. RESPRO is already oper-ating solar systems in over 100 communities in 13 Districts of the three northern regions as well as in the Brong Ahafo Region. For the most remote communities, i.e. as islands that are off-grid, the Government aims at subsidizing the upfront investment cost for solar PV products.
The EC is the final statutory body required to is-sue licenses for organizations to establish a RE business in Ghana. Specific ventures such as municipal waste-to-energy, however, also require approval from the respective regulatory bodies such as the Accra Metropolitan Authority and Kumasi Metropolitan Authority mandated to carry out waste man-agement. For hydroprojects, the PURC is responsible of the kilowatt pricing of electricity per hour whereas the VRA has

Renewable Energies in West Africa 97
GHANA
COUNTRY INTRODUCTION
to issue a permission for independent generators to feed into the national grid and EC has to agree to purchase the energy for distribution to consumers. Hence, depending on the RE technology, the approval has to be sought from the applicable body among all of the mentioned organizations.
4 STATUS AND POTENTIAL FOR RENEWABLE ENERGIES
4.1 BIOMASS/BIOGASApart from firewood and charcoal, energy derived from bio-mass is very unpopular. Biodiesel derived from plants such as jatropha was in the past promoted by the Government of Ghana. The lack of an adequate framework for the pricing and use of the technology as an alternative to fossil fuel, however, did not encourage the private sector to participate. Biogas from organic and municipal waste is gaining popularity in Ghana. There are a few companies that are developing biogas digesters for utilizing the methane generated for domestic use (in cooking and lighting). Biofuels have not yet gained popularity as an alternative source of fuel for automobiles and industrial engines against the e.g. conventionally used diesel. In the past, the Government was encouraging the promotion of biodiesel from the jatropha plant with the result that many farmers opted for jatropha plantation in place of cassava and maize. This, however, was strongly criticized by social authori-ties thus rendering the program unpopular. There are a few entrepreneurs who still believe biofuel could be profitable but lack the financial support to produce in commercial quanti-ties.
There is no doubt that efficient use of biomass-based energy such as charcoal and biogas generated from municipal waste as well as biodiesel from appropriate organic materials saves money for users and trees for Ghana as a whole while re-ducing carbon dioxide emission for the world. Wood fuel ac-counts for 85.8 % of primary energy used in Ghanaian homes and provides income-generating activity (charcoal producers, transporters and retailers) to a substantial part of the rural community. In 2000, 16 million metric tons of wood fuel was consumed, 9 million of which was converted to charcoal. As of 2001, the rate of deforestation in Ghana was 740,000 hec-tares per year (equaling 1.7 % of the overall forestation).
Charcoal, which is used as a fuel source in most bio-mass cooking stoves, is still being produced in a crude way by the informal sector. In Ghana there is a lot of potential re-newable raw material for charcoal production in the relatively large palm oil extraction factories such as found in Kade in the eastern region. These factories use part of the spines and shells to power their operation, but much is left to go waste. This process in itself presents investors with tremendous joint venture opportunities for more scientific production methods in biomass energy production. There is evidence of continued use of biomass energy (from charcoal or firewood) for cooking in most households in Ghana. One of the main reasons is the prevailing traditional method of how to cook maize and other cereal-based meals that require this source of fuel. In aiming
at the reduction of deforestation, a few non-governmental or-ganizations have introduced and promoted the use of various types of efficient biomass cook stoves on the Ghanaian mar-ket as alternatives to traditional cooking stoves. These stoves reduce charcoal consumption for household and commercial cooking. However, the efficiency in the use of charcoal as main fuel source could still be improved and thus contribute to carbon emission reductions which could then be monetized on international derivatives markets for carbon certificates under the Clean Development Mechanism (CDM).
4.2 SOLAR ENERGYThe main solar technology applications on the Ghanaian mar-ket are rural solar home systems (especially lanterns and torch lights), urban solar home systems (household appliances, lan-terns), solar systems for schools, systems for lighting health centers, vaccine refrigeration, solar water heaters, solar water pumps, telecommunication, battery charging stations and so-lar streetlights. Solar technology spans the urban, peri-urban and rural Ghana. The dynamics of the distribution of specific products, however, differ from one place to another due to two main factors: Firstly, the generally occurring opportunity cost for deploying solar energy as an alternative energy source and secondly, the far distances of the locations from the national electricity grid in Ghana where solar energy is applied (off-grid locations).
In urban and peri-urban areas most of the towns are on the national grid making the use of solar energy unpopular in these locations. Solar energy uses in such areas are found in the form of solar water heaters in hotels and guesthouses. New hotels springing up in Accra, the capital city of Ghana, are deploying solar water heaters for various reasons. Solar energy generates long term cost savings although the initial capital outlay is high. Generally, the use of solar water heaters is still not very widespread in the country. Solar home systems are found among a few wealthy residents who use the technology to power basic electrical gadgets such as television and Hi-fi audio systems. Solar home systems have still not been able to penetrate the Ghanaian market.
Solar energy is predominant in clinics and other pub-lic places such as educational institutions that are off the na-tional grid. Most of these projects have been deployed by the Ministry of Energy with the assistance of donor agencies such as UNDP, DANIDA and GEF. It is important to note that most of the solar activities in Ghana are carried out through public-private partnerships. In rural Ghana, solar technology is found in the form of lanterns, torch lights and cell phone battery chargers. Also, solar energy in the form of sunlight is the main energy for drying cloth and farm produce such as cocoa in the country.
Ghana is generously endowed with solar energy by vir-tue of its location within the tropics. Sunshine is even more pronounced in the northern regions with an annual solar radiation of 16–29 MJ/m2. In Ghana, solar PV remains the main alternative energy (besides hydroenergy) for lighting in educational institutions, health facilities and households. The country has 54 % level of electrification. This is the percentage of communities on the national grid. The remaining 46 % use

Renewable Energies in West Africa 98
GHANA
BIBLIOGRAPHY
other sources of energy. Solar streetlights are gaining popular-ity in rural and peri-urban communities. Solar lanterns are displacing their kerosene counterparts due to long term cost savings and a major reduction of indoor pollution.
Also available on the Ghanaian market are solar water heaters. Larger units of solar water heaters are usually deployed in the hotel industry. Single units of 130–190 liter boilers are also available with or without electric booster heater. Solar wa-ter heaters, however, are unpopular in Ghana due to the fact that most people are not used to taking hot showers or baths. Although solar water heaters are available to large-scale indus-tries such as hotels as well as small individual households, it has been observed that majority of such facilities still use grid connected electric water heaters.
The World Bank is a strong partner in promotion of solar energy in Ghana and has demonstrated this with the introduction of the Ghana Energy Development and Access Project (GEDAP) aiming at deploying over 7,500 PV systems to schools, hospitals and off-grid communities in Ghana. Within the GEDAP, end-users of solar products receive a 50 % grant (of the purchase price) while the rest is spread over a maximum term of three years with Apex Bank, an SME fo-cused bank in Ghana. Barclays Bank is also considering end-user finance of solar products with the traditional rotating saving and credit funds known as “Susu” schemes. The par-ticipants of these schemes are organized in associations. These associations are the vehicles through which participants are educated on the acquisition of solar lanterns. Table 9 presents available PV applications in Ghana.
4.3 WIND POWERThere is general perception that wind speeds in Ghana are too low to generate energy. Recently, however, the Energy Com-mission has identified the costal belt, particularly the Volta and Central Regions, as viable places for harvesting enough wind for energy generation. The discovery has encouraged very little private participation so far, and major wind farms have been constructed yet. A few individuals have installed wind turbines to backup the intermittent power supply in some parts of the country. Industrial use of wind farms is un-
der 1 % of the range of RE technologies in Ghana. Studies by the Energy Commission have shown that there is enough po-tential to generate wind energy in Ghana. The coastal belt and the Volta and Central Regions in particular have wind speeds of 3–5 miles per second which is enough to drive turbines to generate wind energy. The technology, however, has been vir-tually untapped by the private and public sectors.
4.4 HYDRO POWERHydroenergy is the most tangible RE technology that has been deployed in Ghana. The main hydroelectric plants are the Akosombo and Kpong dams which supply electricity to most parts of Ghana. Since 2008, the Government of Ghana has, started to build yet another major hydroelectric dam at Bui in the Brong Ahafo Region for 562 million USD (440 million Euro). When completed after the scheduled two-year building time, the Bui dam will serve the northern part of Ghana which falls in line with the National Electrification Scheme of targeting 100 % electrification of the country. There are about thirteen other river sites that have been ear-marked for mini hydro projects requiring public private part-nerships to implement.
As of 2006, the data available showed that the VRA planned to meet Ghana’s total energy demand of 9,518 GWh with the following mix: 5,862 GWh from hydroenergy 2,856 GWh from thermal energy and 800 GWh from im-ports from Côte d’Ivoire. The generation level from hydroen-ergy from 2006 to 2008 was 5,619 GWh. This shortfall of 243 GWh of hydroenergy presents opportunities for investors and local engineers to install mini hydro systems on 13 rivers earmarked for such facilities by the VRA.
The latest crisis was experienced in the year 2007 and early 2008. This energy crisis sparked off the creation of op-portunities for foreigners who wish to enter joint ventures with local partners for the construction of mini hydro dams. Fiscal incentives are available for such ventures and modalities for Independent Power Producers (IPP) are under discussion.
5 MARKET RISKS AND BARRIERS
The Ghana Investment Promotion Center (GIPC) Act 478 was issued in 1994 to enable the GIPC to adopt and imple-ment an investor-friendly set of rules and regulations to boost private sector investments. Through the GIPC, the Govern-ment is now a facilitator and promoter of investments, un-like previously when its interest was in investment regula-tion. Currently, private sector investors are benefiting from the macroeconomic and sectoral reforms introduced under the Economic Recovery Program (ERP) as well as from the activities of the GIPC. These benefits include the rehabilita-tion of economic and social infrastructure, the liberalization of imports and foreign exchange and the eased remittance of dividends, profits and fees abroad.
All this has been made possible on account of the po-litical stability that Ghana has enjoyed over the past couple
TABLE 9
Solar Photovoltaic Applications in Ghana
Source: Energy Commission of Ghana, as of 2004
SOLAR SYSTEMSINSTALLED CAPACITY
GENERATION (GWH)
Rural Solar Home Systems (SHS) 450 0.70–0.90
Urban SHS 20 0.05–0.06
Systems for schools 15 0.01–0.02
Systems for lightng health centres 6 0.01–0.10
Vaccine refrigeration 42 0.08–0.09
Solar water pumps 120 0.24–0.25
Telecommunication 100 0.10–0.02
Battery charging stations 10 0.01–0.02
Grid connected systems 60 0.10–0.12
Solar Streetlights 30 0.04–0.06
Total 853 1.34–1.82

Renewable Energies in West Africa 99
GHANA
of decades. The Government of Ghana has committed itself to establishing a new “Golden Age of Business” for the pri-vate sector. The Government therefore envisages an economy where the production and distribution of goods and services will be mainly the business of the private sector. This new production arrangement is anchored on a new robust collabo-rative partnership between a focused but strong public sector and a vibrant private sector. Ghana is a member of the World Bank’s Multilateral Investment Guarantee Agency (MIGA). MIGA provides investment guarantees for certain non-com-mercial risks (i.e. a political risk insurance) to encourage for-eign investors for qualified investments in developing member countries. MIGA guarantees cover the following risks: trans-fer restriction, expropriation, breach of contract and war and civil disturbance. The Government’s pro-business orientation coupled with benefits deriving from MIGA ensures that inves-tors obtain insurance cover against social and political busi-ness risks.
Trading across borders is very relevant to the RE sec-tor given that most of the technology and equipment is usu-ally imported. The Investment Climate Study looks at the procedural requirements as well as the time and cost of these procedures for both exported and imported goods transported by waterway. For importing goods, the procedures evaluated start at the vessel’s arrival at the port of entry and end at the shipment’s delivery at the importer’s warehouse. For export, the study starts to evaluate procedures from the time the goods are packed at the factory to their departure from Tema, Ghana’s port of exit. The costs of importing and exporting include import and export duties, levied by the Customs Ex-cise and Preventive Services, as well as administrative charges. Specific incentives on imports of RE products are provided as described in Section 3.1. Specific incentives on exports are embodied in various mandates provided by Ghana Export Promotion Council, Ghana Investment Promotion Council and Africa Growth and Opportunity Act. Ghana’s economic policy keeps shortening the procedural requirements in order to make the country more competitive globally and to put an end to frequent demands of bribes during import and export procedures.
Various incentives and benefits are generally offered to most investors under Ghana’s new Investment Promotion Act (GIPC Act 1994, Act 478). In addition, entrepreneurs who invest in declared areas of priority (including energy and ag-riculture) are offered special/specific incentives. The general investment incentives are largely automatic and are granted in various forms to most investors. They incentives include the following: (i) exemption from the payment of customs import duties on specified inputs, plant, machinery and equipment required for the enterprise, (ii) increased capital allowance rates, (iii) tax reliefs for establishing enterprises at specified locations, (iv) retention of at least 35 % of exports earnings in an external account, (v) automatic immigrant quota for ex-patriate personnel in accordance with size of investment, (vi) guarantee against expropriation. The current corporate tax rate is 25 % of profits chargeable to tax.
COUNTRY INTRODUCTION
Shareholders are protected by local regulations. They are also considered as the ‘legal backing’ of Commercial Courts as they have access to the company’s internal documents. Ghana’s Companies Code of 1963 defines the rights and obligations of shareholders and directors of limited liability companies. The Code covers approval procedures, requirements for immediate disclosure of transactions and availability of external reviews of transactions before they take place and disclosure in peri-odic filings and reports. A director liability includes the pos-sibility for investors to hold a director or a board of directors liable of damages. Moreover, investors’ interests are protected by the Ghana Investment Promotion Center.
The laws that govern intellectual property rights in Ghana are the Copyright Act 2005 (Act 690) and the Patent Law of 1992. This section of the study looks at the number of procedures required to register a property as well as the time and cost it takes. In general, a large amount of properties in Ghana are not formally registered, and the process of register-ing a property is often difficult. Unfortunately, non-registered properties cannot be used as a guarantee for obtaining loans thus limiting financing opportunities for businesses. It takes a minimum of 5 procedures and an average of 34 days in regis-tering an intellectual property in Ghana. The cost of the prop-erty is usually about 1.2 % of its value.
RE technologies are growing, although at a low pace. There is, however, local expertise in all the technologies found in Ghana, although limited. The VRA boasts of one of the finest assemblies of local engineers some of whom are periodi-cally drawn to offer technical expertise to neighboring West African countries. There are not many solar energy engineers. The few SMEs involved in solar energy, however, are very competent. Biomass technologies are mostly implemented by academics having opted to commercialize them. Biogas tech-nologies are employed in the tourist industry and educational institutions. Bio-fuel experts are few but exist.
There are some governmental regulations related to employment. To measure the ease or difficulty of employ-ing workers, the study establishes two indicators: a rigidity of employment index and a firing cost measure. The rigidity of employment index comprises difficulty of hiring, rigidity of hours and difficulty of firing. Ghana has relatively less rigid regulations of employment. The firing cost indicator reflects the cost of firing an employee in terms of advance notice re-quirements, severance payments and penalties.

Renewable Energies in West Africa 100
GHANA
COUNTRY INTRODUCTION
6 RENEWABLE ENERGY BUSINESS INFORMATION AND CONTACTS
NAME ADDRESS FIELD OF ACTIVITY
GECAD Ghana Ltd
38 Independence AvenueP. O. Box C74, Cantonments, Accra, GhanaPhone: +233 21 [email protected]
Power generation, supplier of parts and services for installations, operations and maintenance on gas turbines
DENG Solar Training Center Ltd(DSTC)
C12/13 Southeast AlajoP. O. Box AN 19996, Accra, GhanaPhone: +233 21 257100Fax: +233 21 [email protected]
Expertise include RE (solar PV), power generation, control and transmission, water filtration and irrigation, civil engineering, industrial supplies, precision scales and balances, project ma-nagement, training and education
Wise EnergyAbofu 1st Junction, Off Achimota, PMB 21, Kanda, Accra, GhanaPhone: +233 21 [email protected]
Targets areas with no access to the national electricity grid and provides high quality, thoroughly tested and approved components to build the necessary PV systems
ecoZone6 Vermont Plaza, Medlab Building, S.O.S. Road, Comm. 6, Tema, GhanaPhone: +233 22 214 [email protected]
Distributor of solar power systems, lighting, and water purification equipment to hospitals, schools, hotels, homeowners, contractors, Government, & non-governmental organizations & rural communi-ties and other remote sites without electricity
Wilkins Engineering
No. 35 Dadeban Road, North Industrial Area, Kaneshie, AccraPhone: +233 21 23567Fax: +233 21 [email protected]
Wholesales, retails, installs and maintains PV solar home systems (SHS) to households, public and private commercial institutions in Ghana
Toyola Energy LimitedH/No.011 Opa Road Sarpeiman, P. O. Box OF 266, Ofankor, AccraPhone:+233 245 [email protected]
Manufactures, distributes and sells biomass efficient cooking stoves (Gyapa stoves, www.enterpriseworks.org), to rural and peri-urban households and institutional customers in selected regions in Ghana
Biogas Technologies West Africa Limited
14/2 Guava crescent, community 19, Lashibi, Tema, GhanaPhone: +233 22 [email protected]
Biogas digester construction company in West Africa; provision of organic waste for useful energy and nitrogen-rich plant fertilizer as well as manufacturing of biogas stoves and biogas manometers
EnterpriseWorks Ghana
Crn. Josiah Tongogara/North Labone AveP. O. Box CT 4808,AccraTel: (021) 765454/[email protected]
Active in the domestic energy sub-sector, providing financial and technical assistance to the USAID-funded Kenya Ceramic-Lined Stove Project including the Household Energy Program in Ghana, funded by USAID and Shell Foundation funding (focusing on ma-nufacturing and commercialization of consumer-oriented stoves)
Raford TechnologiesP. O. Box AN 7172, Accra-North, Ghana, Phone: +233 21 [email protected]
Wind powered electrical plants
TABLE 10
Local Business Partners
NAME ADDRESS FIELD OF ACTIVITY
Association of Ghana Solar Indus-tries (AGSI)
P. O. Box 19996, Accra, GhanaPhone: +233 21 233779Fax: +233 21 [email protected]
Aims at raising the profile of the solar industry, improving the quality of design/installation, administering a membership accre-ditation programs, promoting the development of standards within the industry. Makes presentations for the Government in order to abolish taxes on solar components and to negotiate training agreement with Deng Solar Training Center (DSTC)
Ghana Venture Capital Trust Fund (GVCTF)
Premier Towers, 12th Floor, Ministries, Accra, Private Mail Bag, CT 449, Cantonments, AccraPhone: +233 21 [email protected]
Governmental body responsible for providing investment capital to local SME’s through existing venture capitalists; oversees the promotion of venture capital/private equity investments in Ghana
Kumasi Institute of Technology, Energy and Environment (KITE)
72 Old Achimota Road, Dzorwulu, P. O. Box AT 720, Achimota, Accra Phone: +233 21 256800–1Fax: +233 21 [email protected]
Non-governmental organization specialized in environmentally sound technical solutions and related policy interventions for sustainable development
Ghana Investment Promotion Center (GIPCI)
P. O. Box M193, Accra, GhanaTel: +233 21 665125–[email protected]
Encourages, promotes and facilitates investments in all sectors of the economy except mining, petroleum, free zones activities, privatization of Government enterprises and portfolio investments
TABLE 11
Local Business Related Institutions

Renewable Energies in West Africa 101
GHANA
COUNTRY INTRODUCTION
TABLE 12
List of Companies and Related Business Organizations
NAME ADDRESS FIELD OF ACTIVITY
Energy Commission (EC)FREMA House, Plot 40, Spintex Rd. P.M. B. Ministries, Accra – GhanaPhone: +233 21 [email protected]
RE technologies advisor to Ghana’s Government
Ministry of Energy
P. O. Box SD 310, Stadium, AccraPhone: +233 21 [email protected]
Responsible for implementing all energy issues in Ghana
United Nations Development Pro-gram (UNDP)/Global Environment Facility (GEF)
P. O. Box 1423, AccraPhone: +233 21 [email protected]
Global partnership to address global environmental issues while supporting national sustainable development initiatives
IFC Lighting Africa Program
No. 1 Central Link Street, South Legon,P. O. Box CT 2638, Accra, GhanaPhone: +233 21 [email protected]
Aims to recognize the success and vitality of the Africa small, micro and medium enterprises (SMME) sector; annual awards program specifically to acknowledge, encourage and celebrate excellence amongst African SMMEs
Environmental Protection Agency (EPA)
P. O. Box M326, Accra, GhanaPhone: +233 21 664697Fax: +233 21 [email protected]
Ensures all social practices and businesses (including but not limited to renewable energy practices) are not detrimental to the Ghanaian environment
Electricity Company of Ghana (ECG)
Electro-Volta House, 28 th February Road, Accra Postal Address Post Office Box GP 521 Telephone+233-21–676727/676747 Fax +233–21–666262 [email protected]/ecgweb
State–owned entity responsible for the distribution of electricity to consumers in southern Ghana, namely Ashanti, Central, Greater Accra, Eastern and Volta Regions of Ghana
Energy Foundation Ghana (EF)
P. O. Box CT 1671 Accra, Ghana Tel: (+233 21) 515610/515611/515612 Fax: (+233 21) 515613 Mail: [email protected]
Non-profit, public-private partnership institution (founded in col-laboration of the Government of Ghana), devoted to the promotion of energy efficiency and renewable energy

Renewable Energies in West Africa 102
GHANA
BIBLIOGRAPHY
7 BIBLIOGRAPHY
Agyemang-Bonsu W. K. (2008): The DNA’s CDM Ap-proval Process and Preparedness for CDM Activities in Ghana, Austria JI/CDM Workshop
Africa Growth and Opportunities Act – AGOA (without year): (www.agoa.gov)
Government of Ghana (1963): Companies Code The World Bank Group/International Finance Corpora-tion – IFC (2009): Doing Business, Measuring Business Regulations, (www.doingbusiness.org/ExploreEconomies/?economyid=76)
ECOWAS (without year): Energy Protocol A/P4/1/03, (www.ecowapp.org/member_utilities.html)
Energy Commission of Ghana (2006): Energy Supply to the Economy, Woodfuels and Renewables
Energy Commission Act (1997): Act 541 (www.lexadin.nl/wlg/legis/nofr/oeur/lxwegha.htm)
Food and Agriculture Organization – FAO (2003): The State of the World‘s Forests
Ghana Association of Bankers (without year): (http://ghanaassociationofbankers.com)
Ghana News Agency – GNA (2008): Section Economics/Business/Finance
KITE (2000): Implementation of Renewable Energy Tech-nologies – Opportunities and Barriers: Ghana Country Study
Ministry of Energy (2003): Household Energy in Ghana N. N. (2002): Energy News Public Utilities and Regulatory Commission (2007): Publi-cation of Electricity Tariffs
Public Utilities and Regulatory Commission - PURC (1997): Act 538 (www.purc.com.gh/legislation.php)
Statistical Service (2000): Population and Household Census
Statistical Service (without year): Ghana Living Standards Survey-4
Websites Ghanaweb: (www.ghanaweb.com) Global Environment Facility: (www.gefweb.org)

COUNTRY CHAPTER:
GUINEA
Author of Country Chapter Bocar Sada Sy (Eng.) Coordination and Review of the Country ChapterAnton Hofer, (MSE, Dipl.-Ing./FH, M.A.)WIP-Renewable Energies www.wip-munich.deMunich, Germany
Editor Deutsche Gesellschaft für Technische Zusammenarbeit (GTZ) GmbHDepartment Water, Energy, TransportDag-Hammarskjöld-Weg 1-565760 Eschborn, Germanywww.gtz.de
On behalf of Federal Ministry for Economic Cooperation and Development (BMZ)
Editorial staffDiana KraftTel: +49 (0)6196 79 4101Fax: +49 (0)6196 79 80 4101Email: [email protected]
Renewable Energies in West Africa 103

CONTENTS GUINEA
ACRONYMS, ABBREVIATIONS AND MEASUREMENTS 105
SUMMARY 107
1 COUNTRY INTRODUCTION 108 1.1 Geography and Climatic Conditions 108 1.2 Political, Economic and Socio-economic Conditions 108
2 ENERGY MARKET IN GUINEA 109 2.1 Overview of the Energy Situation 109 2.2 Energy Capacities, Production, Consumption and Prices 109 2.3 Market Actors and Regulation Structures 111
3 POLICY FRAMEWORK FOR RENEWABLE ENERGIES 112 3.1 Policies, Strategies and Programs for Renewable Energy Promotion 112 3.2 Regulations, Incentives and Legislative Framework Conditions 113
4 STATUS AND POTENTIAL FOR RENEWABLE ENERGIES 114 4.1 Biomass/Biogas 114 4.2 Solar Energy 114 4.3 Wind Power 114 4.4 Hydro Power 114
5 MARKET RISKS AND BARRIERS 115
6 RENEWABLE ENERGY BUSINESS INFORMATION AND CONTACTS 116
7 BIBLIOGRAPHY 117
Renewable Energies in West Africa 104CONTENTS
GUINEA

ACRONYMS AND ABBREVIATIONS GUINEA
ADB African Development Bank
ADB Asian Development Bank
BERD Bureau Électrification Rural Décentralisé (Rural Electrification Decentralized Office)
CEDEAO Communauté Économique Des États de l ‚Afrique de l‘Ouest (Economic Community of West African States – ECOWAS)
DNEF Direction National des Eaux et Forêts (National Division of Water and Forestry)
DNHE Direction Nationale de l’Hydraulique et de l’Energie
ECOWAS Economic Community of West African States
EDG Electricité de Guinée (Guinea Electricity)
EU European Union
GDP Gross Domestic Product
GNF Guinea Francs
GTZ Deutsche Gesellschaft für Technische Zusammenarbeit
(German Technical Cooperation Agency)
HDI Human Development Index
HIPC Heavily Indebted Poor Country
HV high voltage
IEPF Institut de l‘Énergie et de l‘Environnement de la Francophonie
(Institute for Energy and the Environment in French Speaking Countries)
IFAD International Fund for Agricultural Development
LPG Liquefied Petroleum Gas
LPDSE Lettre de Politique de Développement du Secteur de l’Énergie
(Policy Letter for the Development of the Energy Sector)
LV low voltage
MDG Millennium Development Goals
MSF Médecins Sans Frontières
MV medium voltage
NDE National Division of Energy
NGO Non-governmental Organization
NMG National Multisectoral Group
OPEC Organization of Petroleum Exporting Countries
PDE Direction Préfectorales de l’Éducation (Prefectoral Directorate for Education)
PREP Poverty Reduction Program
PRSP Poverty Reduction Strategic Paper
PV Photovoltaic
SGP Société Guinéenne de Pétrole (Guinean Oil Company)
SOGUIP Société Guinéenne des Pétroles (Guinean Oil Society)
TSPP Taxe Spéciale sur les Produits de Pétrole (Special Taxes on Petroleum Products)
UNDP United Nations Development Program
USAID United States Agency for Internal Development
USD United States Dollar
WB World Bank
105ACRONYMS, ABBREVIATIONS AND MEASUREMENTS
GUINEA
Renewable Energies in West Africa

MEASUREMENTS
€ Euro (1 EUR = 7,291 GNF; 1000 GNF = 0.13715 €).
GWh gigawatt hour (1 GWh = 1,000,000 kilowatt hours (kWh))
km² square kilometer
kWh kilowatt hour
kWp kilowatt peak
m/s meters per second
m³ cubic meter
mm millimeters
MW megawatt (1 MW = 1,000 kW)
Wp Watt-peak
º degree
106ACRONYMS, ABBREVIATIONS AND MEASUREMENTS
GUINEA
Renewable Energies in West Africa
SUMMARY
The Country Study of Guinea is to provide an overview of the country’s energy market and to support decision-making for private investments for the Renewable Energy (RE) sector in Guinea. The study is structured as follows:
Chapter one provides Background Information on Guinea. This includes an overview of geographical and climatic condi-tions, as well as the most important facts in view of political, economic and socio-economic conditions of Guinea.
Chapter two summarizes facts and figures of Guinea’s Energy Market including stakeholders and market actors involved as well as sector related regulations.
Chapter three presents the currently existing Political Frame-work for Renewable Energies in Guinea. This includes an overview of support mechanisms for photovoltaic (PV) as well as existing regulations, incentives and legislative framework conditions concerning other RE technologies.
Chapter four provides a brief overview of the Status Quo and Potential for Renewable Energies in Guinea.
Chapter five summarizes the existing and potential Market Risks and Barriers in general with focus on RE.
Chapter six presents a compilation of the most relevant Renew-able Energy Business Information and Contacts of Guinea.
Renewable Energies in West AfricaSUMMARY 107
GUINEA

1 COUNTRY INTRODUCTION
1.1 GEOGRAPHY AND CLIMATIC CONDITIONSThe Republic of Guinea1 is located in West Africa between latitudes 7 ° 05‘ and 12 ° 51‘ South and longitudes 7 ° 30 and 15 ° 10‘ West. Its geographic size equals 245,857 km². It is bor-dered in the East by Mali and the Ivory Coast, in the West by the Atlantic Ocean (with 300 km of coastline) and Guinea-Bissau, in the North by Mali and Senegal and in the South by Sierra Leone and Liberia. Guinea comprises four physi-ographic provinces characterized by different climates, soils, vegetations and landscapes.
Guinea has a humid tropical climate with two alternating seasons, the dry season and the rainy season. The rainy sea-son lasts an average of eight months in Forested Guinea and five months in High Guinea. Thus, Guinea is one of the few West African countries with high rainfalls, varying between 1,200 and 4,000 mm per annum. Most rivers of the West Af-rican region (Gambia, Senegal, Niger) spring from the Fouta Djallon Massif; that is why Guinea is called the “Water Tow-er” of Western Africa.
Maritime Guinea or Flat Guinea covers 18 % of the country’s territory and is characterized by mangrove swamps. The coastal area has a huge water supply potential and offers opportunities for farming and fishing. The maritime region of guinea produces rice, fruit, vegetables, tubers, salt and palm oil but also bauxite and various manufacturing products.
The Middle Guinea or Fouta-Djalon covers 22 % of the territory and is characterized by tree and bush savanna. Farming and livestock breeding are the predominant activities
Renewable Energies in West Africa 108
GUINEA
COUNTRY INTRODUCTION
of its economy with 39 % of all country’s livestock breeders being based in Middle Guinea. The region’s main products are fruit, vegetables, grain (fonio2, corn and rice) and tubers (cassava, sweet potato and potato). Another important source of income is the crafts industry. Besides that, there is also a significant potential for the development of a tourism industry in this region.
High Guinea is characterized by tree and bush as well as grassy savanna covering 40 % of the territory. Being an auriferous region “par excellence”, both industrial gold pro-duction and traditional gold washing are being performed. Livestock breeding (with 27 % of identified livestock breeders ranking on position 2 behind Middle Guinea), farming and continental fishing in the Niger River basin further contribute to the region’s economy. People are also active in subsistence farming and commercial farming. These sectors, however, suf-fered from major production difficulties in the last few years. As a consequence, the industrial fruit and cotton processing units have ceased to operate for the time being. In the craft industry sector, traditional pottery is well developed.
The Forested Guinea is dominated by tropical rainfor-est and stretches over 20 % of the territory. It is characterized by mining, agro-pastoral activities and forestry as well as craft industry activities. In addition to growing crops for their own livelihood, people are active in the production of products for export purposes, namely coffee, cocoa, tobacco, tea and rub-ber. Forestry resources are being exploited with both tradi-tional and industrial methods.
1.2 POLITICAL, ECONOMIC AND SOCIO-ECONOMIC CONDITIONSThe Republic of Guinea is one of the very first French speaking countries in West Africa gaining independence in 1958. The following separation had a very positive effect on the political development and economic growth. In fact, Guinea clearly opted for stopping exchange and cooperation with former colonizers through its choice of a total and immediate inde-pendence. As a result of this, France decided the immediate withdrawal of the colonial administration. As an independent country, Guinea faced several difficulties and decided to enter a partnership with the Soviet Union. The country experienced a particularly active stage of political and social evolution dur-ing the liberation wars in Guinea-Bissau and Cape-Verde. The so-called “First Republic” (1958 to 1984) was characterized by a socialist and centralized type of state controlled economy. The state was intervening in all economic sectors including the productive sector, the commercial sector and even the banking system. The Second Republic (1985 up till now) is characterized by an open market economy with substantial economic and financial reforms.
The total population of Guinea is estimated at 9.4 mil-lion as of 2008 when the last general population census took place. Its gender distribution comes to 48.7 % of men and 51.3 % of women. The Guinean population lives mainly in ru-ral areas (71.2 %) with less than a third (28.8 %) of its people living in urban areas. Conakry, the capital city of the country,
FIGURE 1
Map of Guinea
2 WHITE FONIO (D. EXILIS) IS THE MOST IMPORTANT OF A DIVERSE GROUP OF WILD
AND DOMESTICATED DIGITARIA SPECIES THAT ARE HARVESTED IN THE SAVANNAS
OF WEST AFRICA.
1 THE NATION IS SOMETIMES CALLED GUINEA-CONAKRY TO DISTINGUISH IT FROM
ITS NEIGHBOUR GUINEA-BISSAU.
NIGERBoké
Nzérékoré
CONAKRY
KankanFria
Kindia
Labé
Macenta
Siguiri
S E N E G A L
S I E R R A L E O N E
L I B E R I A
M A L I
G U I N E A -B I S S A U
T H E G A M B I AC
ÔTE
D
'IVO
IRE
Kamsar
100 miles
NorthAtlantic Ocean

2 ENERGY MARKET IN GUINEA
2.1 OVERVIEW OF THE ENERGY SITUATIONGuinea has a significantly low rate of access to electricity, with less than an estimated 17 % for the entire population. As a result of the insufficient production capacity, there are seri-ous malfunctions and blackouts in the electric power sector of Guinea. As to hydrocarbons, Guinea does not have proven re-serves despite of ongoing researches at various sites. Therefore, the bulk of the country’s demand is covered by imports.
2.2 ENERGY CAPACITIES, PRODUCTION, CONSUMPTION AND PRICES
Electricity SectorThe installed electricity production capacity equals approx-imately 239 MW and is provided by 9 hydroplants and 18 thermal power plants. The production capacity of the 9 hy-droplants is 127 MW. Table 2 presents an overview of existing electricity production facilities. Table 3 provides information on the cost structure of thermal electricity production.
The major performance indicators of the electricity sector are: (i) the low rate of access to electricity (less than 17 %, i.e. 1.5 out of 9 million inhabitants), (ii) the very low billing rate (53 %), (iii) the low rate of recovery/collection (an estimated 80 %). As a result of this particularly dilapidated state of the electric power industry, Guinea is suffering from a severe drop of its electrification rate.
In Guinea, electric power tariffs are fixed by joint or-der of the Ministry of Energy and Hydraulic (MEH) and the Ministry of Economy and Finance. The electricity tariffs of Guinea are presented in Table 4.
ISSUE RATING IN GUINEA RATING IN AFRICA
Life expectance at birth 49 53
Infant mortality rate 11,4 % 7,8 %
Access rate to health facilities 58 % 60 %
Access rate to potable water 48 % 60 %
Gross primary school enrolment 63 % 81 %
Gross secondary school enrolment 13 % 29 %
TABLE 1
Human Development Indicators (HDI) of Guinea
Source: UNDP, as of 2003, and UNDP / Human Development Report, as of 2009
FIGURE 1
GDP Growth Rate and Inflation Rate (2002–2006)
Source: IMF/Guinean Ministry of the Economy, Finances and Planning: PRSP, as of August 2007
Development of Inflation and GDP growth rate in Guinea: 2002–2006
Development of Inflation rate
2002 2005 200620042003
10,00 %
5,00 %
15,00 %
25,00 %
40,00 %
45,00 %
30,00 %
20,00 %
35,00 %
0,00 %
Development of GDP growth rate
TABLE 3
Thermal Production Cost Structure (per kWh)
DESIGNATION (2006 SITUATION) COST PER kWh (EURO) % OF TOTAL COSTS
Procurement of fuel 0,0302 € 33 %
Operation and maintenance 0,0064 € 7 %
Personnel costs 0,0093 € 10 %
Financial charges 0,0032 € 3 %
Depreciation expenses 0,0125 € 13 %
Provision 0,0306 € 33 %
Taxes 0,0006 € 1 %
Total costs 0,0928 € 100
Source: IDEACONSULT: LPDSE, as of 2006
TABLE 2
Existing Electric Power Production Facilities
Source: IDEACONSULT: LPDSE, as of 2006
TYPE PRODUCTION CAPACITY (MW)
Thermal Production (interconnected) 99,5
Hydroelectricity 127,16
Other Thermal Production Units (not interconnected) 12,26
TOTAL 238,92
concentrates more than one half of the total urban popula-tion. This is why it grows faster than most of the big cities in the sub-region. Guinea is one of the less developed HIPC (Heavily Indebted Poor Country) countries. The country ranks at 156th out of 177 countries with a per capita GDP of 375 USD and a Human Development Index (HDI) of 0.466 (as of 2003). High Guinea and Middle Guinea remain the poorest regions of the country. Table 1 presents a summary of the country specific HDI figures.
The Guinean social situation still remains unstable, mainly because of consumer prices rocketing with a nearly 40 % rise in basic goods’ prices, namely for rice, sugar, milk and cook-ing fuels. More than half of the Guinean population (approx. 53.6 %) lives on less than half a USD a day. A large group of the population (about 19 %) lives under extreme poverty, i.e. on less than USD 0.32 per day. Figure 2 illustrates the GDP growth compared to the development of the country’s infla-tion rate.
The rapid inflation, shifting from 6 % in 2002 to nearly 40 % in 2006, made some donor partners (WB, ADB, IFAD, OPEC etc.) suspend ongoing projects and programs in Guinea.
COUNTRY INTRODUCTION Renewable Energies in West Africa 109
GUINEA
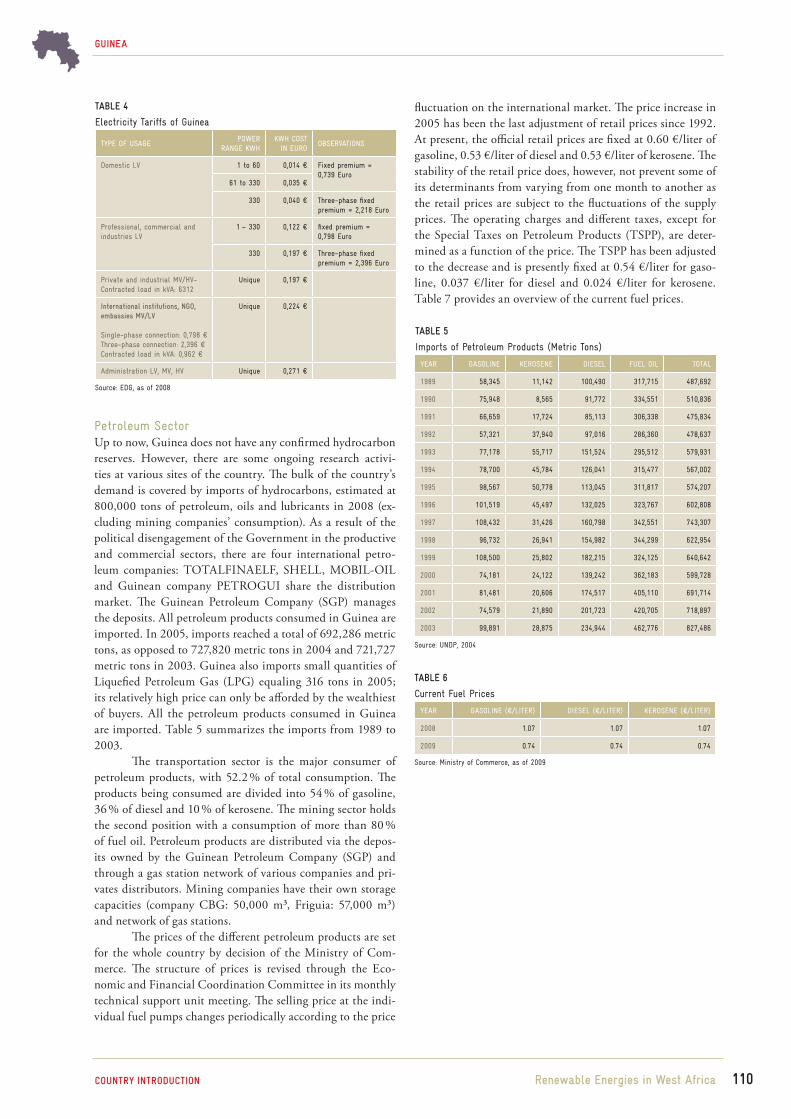
Petroleum SectorUp to now, Guinea does not have any confirmed hydrocarbon reserves. However, there are some ongoing research activi-ties at various sites of the country. The bulk of the country’s demand is covered by imports of hydrocarbons, estimated at 800,000 tons of petroleum, oils and lubricants in 2008 (ex-cluding mining companies’ consumption). As a result of the political disengagement of the Government in the productive and commercial sectors, there are four international petro-leum companies: TOTALFINAELF, SHELL, MOBIL-OIL and Guinean company PETROGUI share the distribution market. The Guinean Petroleum Company (SGP) manages the deposits. All petroleum products consumed in Guinea are imported. In 2005, imports reached a total of 692,286 metric tons, as opposed to 727,820 metric tons in 2004 and 721,727 metric tons in 2003. Guinea also imports small quantities of Liquefied Petroleum Gas (LPG) equaling 316 tons in 2005; its relatively high price can only be afforded by the wealthiest of buyers. All the petroleum products consumed in Guinea are imported. Table 5 summarizes the imports from 1989 to 2003.
The transportation sector is the major consumer of petroleum products, with 52.2 % of total consumption. The products being consumed are divided into 54 % of gasoline, 36 % of diesel and 10 % of kerosene. The mining sector holds the second position with a consumption of more than 80 % of fuel oil. Petroleum products are distributed via the depos-its owned by the Guinean Petroleum Company (SGP) and through a gas station network of various companies and pri-vates distributors. Mining companies have their own storage capacities (company CBG: 50,000 m³, Friguia: 57,000 m³) and network of gas stations.
The prices of the different petroleum products are set for the whole country by decision of the Ministry of Com-merce. The structure of prices is revised through the Eco-nomic and Financial Coordination Committee in its monthly technical support unit meeting. The selling price at the indi-vidual fuel pumps changes periodically according to the price
TABLE 4
Electricity Tariffs of Guinea
TYPE OF USAGEPOWER
RANGE KWHKWH COST
IN EUROOBSERVATIONS
Domestic LV 1 to 60 0,014 € Fixed premium = 0,739 Euro
61 to 330 0,035 €
330 0,040 € Three-phase fixed premium = 2,218 Euro
Professional, commercial and industries LV
1 – 330 0,122 € fixed premium = 0,798 Euro
330 0,197 € Three-phase fixed premium = 2,396 Euro
Private and industrial MV/HV-Contracted load in kVA: 6312
Unique 0,197 €
International institutions, NGO, embassies MV/LV
Single-phase connection: 0,798 € Three-phase connection: 2,396 € Contracted load in kVA: 0,962 €
Unique 0,224 €
Administration LV, MV, HV Unique 0,271 €
Source: EDG, as of 2008
TABLE 5
Imports of Petroleum Products (Metric Tons)
YEAR GASOLINE KEROSENE DIESEL FUEL OIL TOTAL
1989 58,345 11,142 100,490 317,715 487,692
1990 75,948 8,565 91,772 334,551 510,836
1991 66,659 17,724 85,113 306,338 475,834
1992 57,321 37,940 97,016 286,360 478,637
1993 77,178 55,717 151,524 295,512 579,931
1994 78,700 45,784 126,041 315,477 567,002
1995 98,567 50,778 113,045 311,817 574,207
1996 101,519 45,497 132,025 323,767 602,808
1997 108,432 31,426 160,798 342,551 743,307
1998 96,732 26,941 154,982 344,299 622,954
1999 108,500 25,802 182,215 324,125 640,642
2000 74,181 24,122 139,242 362,183 599,728
2001 81,481 20,606 174,517 405,110 691,714
2002 74,579 21,890 201,723 420,705 718,897
2003 99,891 28,875 234,944 462,776 827,486
Source: UNDP, 2004
TABLE 6
Current Fuel Prices
Source: Ministry of Commerce, as of 2009
YEAR GASOLINE (€/LITER) DIESEL (€/LITER) KEROSENE (€/LITER)
2008 1.07 1.07 1.07
2009 0.74 0.74 0.74
GUINEA
COUNTRY INTRODUCTION
fluctuation on the international market. The price increase in 2005 has been the last adjustment of retail prices since 1992. At present, the official retail prices are fixed at 0.60 €/liter of gasoline, 0.53 €/liter of diesel and 0.53 €/liter of kerosene. The stability of the retail price does, however, not prevent some of its determinants from varying from one month to another as the retail prices are subject to the fluctuations of the supply prices. The operating charges and different taxes, except for the Special Taxes on Petroleum Products (TSPP), are deter-mined as a function of the price. The TSPP has been adjusted to the decrease and is presently fixed at 0.54 €/liter for gaso-line, 0.037 €/liter for diesel and 0.024 €/liter for kerosene. Table 7 provides an overview of the current fuel prices.
Renewable Energies in West Africa 110

TABLE 8
Accessible Volume of Wood Energy
Source: World Bank/RPTES – Final Report Guinea, as of 1998
TYPE SURFACE
(1,000 ha)GROSS
PRODUCTION m³ACCESS AND
USE m³
Mangrove swamps 260 1,690.0 338.0
Tropical rainforest 800 3,200.0 640.0
Open woodland forest 2,700 4,250.0 1,700.0
Savanna woodland and tree and bush savanna
12,000 18,000.0 9.000.0
Bush and fallow land 6,150 412.5 2,063.0
TABLE 7
Current Status of Disposable Woodland Areas in Guinea
Source: World Bank/RPTES – Final Report Guinea, as of 1998
TYPE OF FORMATION SURFACE (1,000 HA) %
Mangrove swamps 250 1.02
Moist forests 700 2.85
Open woodland forest and tropical forest 1,600 6.51
Savanna woodland 10,636 43.25
Sub-total wood formations 13,186 53.63
Fallow lands and tree and bush savanna 7,500 30.51
Total forest wood formations 20,686 84.14
Agricultural utilization 1,700 6.10
Others 2,200 9.76
Total 24,586 100
111
GUINEA
COUNTRY INTRODUCTION Renewable Energies in West Africa
Biomass SectorAs it is the case in most West African countries, the energy bal-ance of Guinea is highly dominated by the use of fuel woods (wood, charcoal). This is why biomass resources are ranking at the top of the country’s energy resources. Despite of the high predominance of fuel woods in the energy balance of the country, its potential remains unknown. No comprehensive studies covering the entire national territory were conducted to assess the available potential. Due to several estimates3, the accessible volume is about 8.5 million to 14 million m3. Table 8 presents the current status of disposable woodland areas. Table 9 summarizes the accessible volume of wood energy for production.
As to the distribution of the forestry resources, the data show a highly imbalanced distribution from one region to the other. The very low national coverage ratio (4.8 %) testifies a signifi-cant discrepancy as compared to the ecologically recommend-ed standard (30 %). Due to this situation, there are various considerations how to create stronger awareness and policies for sustainable wood energy management.
2.3 MARKET ACTORS AND REGULATION STRUCTURESThe Ministry of Energy and Hydraulics (MEH) is the gov-ernmental authority responsible for the energy sector. The sector management, however, is shared with other ministerial departments involved in the various segments related to the energy sector:
The Ministry of Environment is in charge of water and for-estry issues, thus playing an important role in the constitu-ent dealing with traditional domestic wood fuel (biomass).
The Ministry of Mines and Geology is in charge of oil prospection, thus managing the upstream segment of the hydrocarbon sector.
The Ministry of Commerce and Competitiveness manages the downstream segment of the hydrocarbon sector.
The Ministry of Economy and Finance plays a transversal role and is related to all governmental actions and segments in the energy sector.
The National Division of Energy (NDE – Direction Nationale de l’Énergie – DNE) is responsible for defining and conduct-ing the country’s energy related policy, except policy concern-ing hydrocarbons. The NDE comprises two divisions: the Energy Planning and Regulation Division and the Renewable Energies Division. A third division (Division of Electricity) was being planned when the study team visited the country in November 2008. The Energy Planning and Regulation Divi-sion comprises three sections: i) the Planning and Energetic Infrastructures Section, ii) the Regulation Section and iii) the Project Preparation Section. The Renewable Energies Division consists of four sections as depicted in the organizational chart presented below. Biofuels will be assigned to the bioenergy section in the course of the planned internal restructuring.
Biomass SectorOne of the characteristics of the traditional energies sector in Guinea is the fact that there have been but few stately inter-ventions. Two departments are directly involved in this sec-tor, namely the MEH for energy demand side aspects and the Ministry of Agriculture, Waters and Forests (MAWF) for offer aspects:
As for the MEH, the strategy adopted for the Program of Economic and Financial Development includes a restruc-turing of the conventional, carbon-based energies sector through the improvement of management and operation structures and the development of a favorable environment for private investments. Up to now, however, traditional energies have not been taken into account.
In the forestry domain, most of the programs aiming at the protection of the environment failed to integrate the energy dimension of the wood. The programs’ priority was to fight soil erosion, forest fires and deforestation. What in-deed has been constituted as a priority is the protection of inshore water bodies of the Fouta Djallon region4, as well as essential activities for the preservation of the country’s agricultural potential and ecological equilibrium.
4 MOUNTAINOUS REGION OF WEST-CENTRAL GUINEA, WHICH ALSO SERVES AS WATER-
SHED FOR SOME OF WESTERN AFRICA’S GREATEST RIVERS3 WORLD BANK/RPTES REPORT AND OTHERS

6 SEE WEBSITE WORLD BANK: > COUNTRIES > AFRICA > GUINEA > PROJECTS & PROGRAMS
> ALL PROJECTS (HTTP:// WEB.WORLDBANK.ORG/EXTERNAL/DEFAULT/MAIN?MENUPK=35
1830&PAGEPK=141143&PIPK=399272&THESITEPK=351795),
AS OF 2009
112
GUINEA
COUNTRY INTRODUCTION
The National Division of Water and Forestry (DNEF) under the ministry in charge of forestry (MAWF) is re-sponsible for the fuel woods production sub-sector (energy woods) without having any real organic relation with the DNE under the MHE. All offer-related energy wood is-sues – as mentioned already above – are handled by this division namely the development of strategies and the reali-zation of forestry projects and programs.
Electricity SectorThe legal base for the electricity sector has been established by the laws of 1993 and by Law L/98/0125 of June 1st 1998 relat-ing to the foundation, construction, operation, maintenance and transfer of production infrastructures. The first section of this law defines institutions in charge of the management of the sector as well as their respective roles. These are:
The MEH is in charge of the supervision, control and regu-lation of the sector. It defines and implements the energy policy and the structure of the tariffs.
The National Council for Electricity acts as consultative organ. It consists of representatives of several ministerial departments, delegates of the dealers, the representatives of consumers and independent experts. The council is the instrument of mediation between the various actors of the electricity sector.
The Electricité de Guinée (EDG) Company is in charge of the electricity sector.
The Electricity Sector Regulatory Body was created in Sep-tember 2005. It still lacks a clear definition of its mission.
Between 1994 and 2001, the electric power sector was man-aged by two companies: ENELGUI, the state owned company in charge of managing the electric power production and in-frastructure, and the operating company SOGEL in charge of electric power transport and distribution. This organizational sub-division resulting from various reforms did, however, not meet the Government’s expectations and ended with the termination of SOGEL’s lease in October 2001. Since then, EDG, a business corporation established by the Government with the State as a majority shareholder, has been managing the sector. EDG is managing the capital and operation related rights and obligations and is responsible for the maintenance, restoration and development of electric power production, transportation and distribution facilities and equipment in order to guarantee public electric power service.
Petroleum SectorIn the petroleum sector of Guinea, the energy reform was im-plemented in 1992 thus permitting a thorough restructuring on the institutional level and allowing the transfer of storage, transport and distribution of petroleum products to private operator. Along this process,, an upstream regulation of the petroleum sector was implemented to ensure the technical control of the petroleum companies operating in Guinea. A regulatory framework body has been adopted and established
Renewable Energies in West Africa
by the Government for controlling and supervising compli-ance with these regulations. This implementation was done in cooperation with the World Bank6.
In 2005, these structures have slightly been changed by an alteration of the responsibilities of the Ministries of ref-erence and the National Directions that depend on this sector. For example, research is currently in the hands of the National Direction of Oil Research (belonging to the Ministry of Mine and Geology). The technical control of oil setups is performed by the National Direction of Hydrocarbons (belonging to the Ministry of Energy and Hydraulics). This direction is also re-sponsible for addressing the country’s need for oil products and is in charge of issuing the certificates of conformity and validation for the establishment of gas stations and fuel stor-age tanks. The National Direction of Energy (belonging to the Ministry of Energy and Hydraulics) is responsible for the oil product sector. This includes the compilation of consumption figures, import statistics and overall information on sector-related policies.
The oil imports are managed by the Importing Com-mittee consisting of representatives of oil companies, the min-istries in charge of commerce and finance, the Central Bank and the Government. The role of the committee is to define the quantities to be imported and to process calls to tender in order to acquire oil products.
The storage of oil products is in the hands of the Gui-nean Oil Company (SGP). The company is responsible for handling, storage and wholesale shipping of oil products. Transportation and distribution are performed by oil com-panies (Totalfinal, Shell and Petrogui) and by private Gui-nean companies. The Ministry of Economy and Finance is responsible for the collection of various taxes and is heading the Importing Committee. The official retail prices are fixed by order of the Ministry of Commerce and Competitiveness. The Ministry of Mines and Geology promotes the exploration of potential oil resources. Activities in this direction started in 1974 with the establishment of the Société Guinéenne des Pétroles (SOGUIP – Guinea Oil Society). Up to now, these activities have brought no tangible results despite promising findings in bordering countries. At present, there are no prov-en oil reserves in Guinea.
3 POLICY FRAMEWORK FOR RENEWABLE ENERGIES
3.1 POLICIES, STRATEGIES AND PROGRAMS FOR RENEWABLE ENERGY PROMOTION
Up to now, there is no institutional framework for Renewable Energies (RE). In general, however, the RE sector is subject to the same regulations as the other energy sectors. Thus, the energy sector policy document of 1992 (LPDSE 92) can be considered as the so far appropriate RE development policy framework in force in Guinea, also referring to RE related
5 SEE ALSO WEBSITE OF DROIT AFRIQUE
WWW.DROIT-AFRIQUE.COM/INDEX.PHP/CONTENT/VIEW/104/220, AS OF 2009

TABLE 9
RE Achievements in Guinea
Source: LPDSE, as of 2008
SYSTEM IMPLEMENTED NUMBER IMPLEMENTATION PERIOD COST IN 1,000 USD DONOR OPERATING STATUS
Solar/photovoltaic 800 kWp 1984–2008 10,000EU, WB GTZ , GTZ, R.W,
USAID, RW80 %
Biogas 92 1977–2004 59 China, EU, IEPF, Etat 30 %
Micro Hydro Power plant 2 1983–2004 2,500 North Korea, Canada 80 %
Wind pump 2 1990–2004 5 EU, MSF, China 60 %
Biomass (wood saving) – fuel saving oven
1992–2004 2,000 EU 85 %
113
GUINEA
COUNTRY INTRODUCTION
institutional aspects. A new policy document for the energy sector is being prepared (as of 20087). It will be based on the new Electrification Master Plan that is under validation.
Since 2008, an energy sector development policy document is under preparation and validation. It is based on the achievements of the past few years resulting from major reforms in the energy sector and on the data compiled in the Electrification Master Plan. The DNEF is implementing sev-eral forestry programs and projects operating with wood en-ergy components. It promotes natural vegetation development actions (moist forest and mangrove swamps), state controlled reforestation as well as community-based and private refor-estation in order to enhance the production. On the political and statutory scale, the DNEF established a forestry policy document (in 1988) along with a six year Action Plan and For-estry Code8 (in 1989), which are currently the major forestry resources’ management tools (that need to be updated).
The Poverty Reduction Strategy Paper (PRSP)9, passed in 2002, only considers the electric power sector in terms of basic infrastructures and accelerated economic growth. The proceeded PRSP revision is also an opportunity for the bet-ter consideration and integration of all energy sub-sectors (not only the electricity sector) within the PRSP in order to cope with the urgent demand for energy services and access in Guinea.
The ECOWAS Energy Services Access Program is part of the active membership of Guinea within the ECOWAS (Economic Community of West African States). With support of UNDP (through its Poverty Reduction Program (PREP), based in Dakar, Senegal) multisectoral consultations on the implementation of the objectives defined in the ECOWAS White Book in Guinea have been set up. At 20 September 2005, Order No 4545/MHE/SGG/200510 established the National Multisectoral Group (NMG) by defining its com-position, its objectives and its attributes. The objectives of the NMG are defined as follows:
Renewable Energies in West Africa
Review the existing institutional and strategic framework for energy services and poverty reduction
Analyze the national energy status in order to define an energy service access vision for Guinea
Define the long-term objectives for energy services access at the national level
Assess necessary investments
3.2 REGULATIONS, INCENTIVES AND LEGISLATIVE FRAMEWORK CONDITIONS
All regulations, incentives and legislative framework condi-tions are defined by the MEH and the Decentralized Rural Electrification Office (Bureau Electrification Rural Décentral-isé – BERD). While the Ministry coordinates all energy sector specific regulations, the BERD executes a program designed to enhance the access to modern energy services in rural areas of Guinea. The project started in 2003 and was finished in December 2008.
Currently the emphasis of the Decentralized Rural Electrification Office is on training activities for private play-ers operating energy services at decentralized sites. The train-ing units consist of promotional activities, onsite technical capacity building and the provision of adequate calculation and management tools. So far, ten consulting companies and around twenty electrification operators were trained on RE projects’ implementation. The overall incentives included the electrification of ten sites through “pico-diesel networks”11 and the electrification of three sites via installation of PV so-lar kits. The PV incentive includes three service levels. The first level includes two solar lights (30 Wp), the second two lights plus one alternating current socket (60 Wp) and the third three lights plus one alternating current socket (90 Wp). Table 9 summarizes the RE achievements of Guinea.
7 IDEACONSULT, AS OF 2008
8 DROIT AFRIQUE, AS OF 2009
9 IMF/GUINEAN GOVERNMENT, 2002; SEE ALSO LATEST PRSP VERSION: IMF/
GUINEAN MINISTRY OF THE ECONOMY, FINANCES AND PLANNING, AS OF 2007
10 DROIT AFRIQUE, AS OF 2009
11 THE TERM ‘PICO’ CHARACTERIZES A VERY SMALL DIESEL-BASED ELECTRICITY
NETWORKS OR GRIDS.

FIGURE 10
Sunshine Duration in Guinea
Source: DNE/Bah, as of 2007
Kankan
Siguiri
Mean Sunshine Duration Hours of sun shine
2
1
3
5
8
9
6
4
7
0
10
Dec
Jan
Mar
Apr
Jul
Aug
Sep
Oct
Nov
JunFe
bMa
y
Month
Source: DNE/Bah, as of 2007
Faranah
Kankan
Siguiri
Dec
Jan
Mar
Apr
Jul
Aug
Sep
Oct
Nov
JunFe
bMa
y
2,5
m/s
0
0,5
2
3
1
1,5
Month
Mean Wind Speed (m/s)
TABLE 10
Regional Distribution of the Hydro Power Potential
Source: LPDSE, as of 2008
REGION CAPACITY (MW) %
Maritime Guinea 2,800 47 %
Middle Guinea 2,600 43 %
High Guinea 500 8 %
Forested Guinea 100 2 %
Total 6,000 100 %
114
GUINEA
COUNTRY INTRODUCTION
Between 2004 and 2008, further incentives contributed significantly to the increase of RE utilization. This includes the implementation of 800 kWp at health care centers, solar pumping facilities, street lighting and some private house-holds.
In the field of hydroelectricity, governmental incen-tives started feasibility studies at 13 target sites with a total capacity of 23.6 MW. The so called “hydraulic ram program” aimed at installing ten hydraulic rams to supply 5 m³ of water per day for the supply of villages with 500 inhabitants in Mid-dle Guinea. This program was very promising in the begin-ning, but was finally shut down due to lack of sustainability.
4 STATUS AND POTENTIAL FOR RENEWABLE ENERGIES
4.1 BIOMASS/BIOGASThe biomass potential in Guinea is essentially based on wood energy. Despite the high predominance of fuel woods (wood and charcoal) in the energy balance of the country, its actual potential remains unknown. No comprehensive studies cover-ing the whole national territory were conducted to assess the available potential. According to various estimations12, the ac-cessible volume is about 8.5 million to 14 million m3.
4.2 SOLAR ENERGYThe assessment of the Guinean solar power potential lacks a systematic and concise approach and structure. The informa-tion available indicates an average annual insolation at the rate of 4.8 kWh/m² per day and a mean sunshine duration of 2,700 hours per year (as almost encountered at the location of Kankan in High Guinea). The figures clearly demonstrate that the solar potential is considerable throughout the terri-tory. Figure 10 provides information on the specific sunshine duration of Guinea.
Renewable Energies in West Africa
4.3 WIND POWERThe assessment of the Guinean wind power potential likewise lacks a systematic and concise approach. The data indicating the average annual wind velocity range from 2 to 4 m/s in Maritime Guinea and Middle Guinea. Such poor potential does not allow for overall exploitation. It is, however, possi-ble to use wind energy for pumping systems using mechanic windmills. Figure 11 indicates the mean wind speed at dif-ferent sites.
4.4 HYDRO POWERGuinea has a considerable Hydro Power potential of about 6,000 MW that corresponds to an annual ensured production capacity of 19.300 GWh. Up to now, only 2 % of the avail-able potential is being exploited. The regional distribution of the national Hydro Power potential is presented in Table 10. Table 11 presents the distribution of actual Hydro Power pro-duction sites. Figure 12 indicates the location of Hydro Power production sites.
The Hydro Power potential is high throughout the whole of Guinea. Potential sites are classified below according to their related expected productive power:
Four sites with a potential productive power exceeding 200 MW: Amaria (665 MW), Souapiti (515 MW), Kouk-outamba (281 MW), Kaleta (240 MW)
Three sites with a potential power of 150 MW to 200 MW Ten sites with a potential power of 100 to 150 MW
FIGURE 11
Mean Wind Speed (m/s)
12 WORLD BANK/RPTES REPORT AND OTHERS

115
GUINEA
COUNTRY INTRODUCTION
Sixteen sites with a potential power of 50 to 100 MW Forty-eight sites with a potential power of 10 and to MW Thirty-seven sites with a potential power under 10 MW
5 MARKET RISKS AND BARRIERS
The lack of appropriate institutional framework is one of the major risks constraining the development of the RE market. At present, the sector’s development remains highly dependent on the establishment of an intervention framework promoting private operators’ involvement. Consequently, approval of a new LPDSE taking into account the whole of the current ref-erence frameworks (PSRP, MDGs, PDE, ECOWAS, etc.) is a must to secure the sector’s future. In addition, the political stability of the country also represents a risk constraining the country’s economic growth in general and the energy sector’s growth in particular. The development of the RE market is constrained by several factors:
Institutional constraints: The energy sector’s institutional frame does not authoritatively take RE into account. It is, however, expected that its current development will over-come this constraint.
Financial constraints: Due to the lack of appropriate financ-ing mechanisms, access costs for RE, namely solar equip-ment (initial investment), remain very high.
Fiscal constraints: Currently, there are no fiscal incentives supporting RE.
Socioeconomic constraints: The overall income level is rather poor.
Renewable Energies in West Africa
In order to promote and encourage investments in the major development objectives, Guinea has established an investment code (Law L/95/029/CTRN of 6/30/1995). This law stipulates that anybody is allowed to take up commercial, industrial, mining, farming and service provision activities in the terri-tory of the Republic of Guinea as long as the activities comply with the laws and regulations of the Republic. With regard to exchange regulations, the code guarantees investors the pos-sibility to transfer their profits in convertible currency to any destination of their choice. The investment code also protects private investments against any expropriation attempts for na-tionalization purposes. In addition to those guarantees offered to private investors, the code provides major fiscal benefits (e. g. exemption in the first year of investment, reduction of tax base etc.) for investments in priority fields and areas tar-geted by the code. Table 12 presents Guinea’s position within the Ease of Doing Business ranking.
TABLE 11
Distribution of Hydro Power Production Sites
Source: LPDSE, as of 2008
REGION NUMBER OF SITES TOTAL CAPACITY (kW)
Middle Guinea 53 18,510
Forested Guinea 33 19,150
Maritime Guinea 28 15,610
High Guinea 16 4,220
Total 130 54,490
TABLE 12
Ease of Doing Business Ranking
SELECTED INDICATOR RANKING
Doing business 171
Starting a business 177
Dealing with construction permits 162
Employing workers 114
Registering property 157
Getting credit 163
Protecting investors 170
Paying taxes 168
Trading across borders 110
Enforcing contracts 131
Closing a business 109
Source: World Bank Group/International Finance Corporation – IFC, as of 2009

116
GUINEA
COUNTRY INTRODUCTION Renewable Energies in West Africa
6 RENEWABLE ENERGY BUSINESS INFORMATION AND CONTACTS
TABLE 13
Key Actors in the Field of Energy in Guinea
INSTITUTION ADDRESS PROFILE
Ministry of Hydraulics and Energy -MEH
BP 1217 Conakry, GuineaPhone: +224 30 45 10 65Fax: +224 30 45 10 71
Administrative authority re-sponsible for the institutional management of the entire energy sector
The Rural Electrification Decentralized Office – BERD
Villa 30 Cité des Nations BP 3186 Conakry, GuineaPhone: +224 30 43 14 98Fax: +224 30 43 15 [email protected]
A project funded by the World Bank, the GEF and the Guinean Government designed to imple-ment decentralized rural electri-fication strategies
Electricité de Guinée – EDG B.P : 1463 Conakry, République de GuinéeTel : +224 - 60-59-88-28 ou 30-45-43-09 ou 60-25-75-23 ou 60-25-27-57 ou 60-25-31-20
Public corporation in charge of public electric power service throughout Guinea
SES BP 2952, Conakry, GuineaPhone: +224 60 22 18 [email protected]
Private company involved in solar equipment sale
Guinea Solar n. a. Private company involved in solar equipment sale
AGUIPER n. a. Guinean Association for the promotion of RE
TOPERGUI n. a. Rural electrification lease holder
FIGURE 12
Location of Hydro Power Production Sites
Source: LPDSE, Cartographies Potential Hydro Power Dams in Guinea, as of 2008

117
GUINEA
BIBLIOGRAPHY Renewable Energies in West Africa
7 BIBLIOGRAPHY
CEDEAO (2005): Monographie Pays/Etude CEDEAO: Cas de la République de Guinée – Rapport Final, by Ousmane Bah (Conseiller à la DNE)
Central Intelligence Agency – CIA (2009): World Fact Book. Guinea ( www.cia.gov/library/publications/the-world-factbook)
Direction Nationale de l’Energie – DNE(2007): Thème 4 – Les Énergies Renouvelables dans le Développement du Secteur Énergétique de la Guinée – Stage de Formation sur l’Utilisation des Énergies Renouvelables pour le Dévelop-pement Durable, Conakry
Direction Nationale de l’Energie – DNE (2006): Projet de Déclaration de Politique Générale de Développement du Secteur de l’Énergie de la République de Guinée
Direction Nationale de l’Énergie – DNE (2005): Memorandum à l’Attention de Madame le Ministre de l’Hydraulique et de l’Énergie sur les Études du Plan Direc-teur d’Électrification et du Projet d’Électrification Rurale, by Fodé Moussa Soumah
Direction Nationale de l’Énergie – DNE (2004): Evalu-ation Interne du Programme d’Appui National pour l’Économie du Bois Énergie – Avril 2004 – DP N°3 – Rapport Final, by Ousmane Bah
Droit Afrique (2009): Guinée (www.droit-afrique.com/index.php/content/view/104/220)
Électricité de Guinée – EDG (2005): Annual Report Government of Guinea (1995): Law L/95/029/CTRN of 6/30/1995
IDEACONSULT (2008): LPDSE - Lettre de Politique de Développement du Secteur de l’Énergie
International Monetary Fund – IMF/Guinean Govern-ment (2002): Poverty Reduction Strategy Paper: Republic of Guinea, January 2002 (www.imf.org/External/NP/prsp/2002/gin/01/013102.pdf)
International Monetary Fund – IMF/Guinean Ministry of Economy, Finance and Planning – Permanent Secretariat on Poverty Reduction Strategy – SP-SRP (2007): Poverty Reduction Strategic Paper DSRP2 (2007–2010)
Mody Amadou Oury Barry (2007): Évaluation des Besoins pour l’Atteinte des OMD en Guinée – Secteur Ciblé: ENERGIE – Rapport évaluation des Coûts
United Nations Development Programm – UNDP (2003) Human Development Report 2003. Africa (www.africaaction.org/docs03/hdr0307.htm and www.undp.org/hdr2003)
United Nations Development Programm - UNDP (2009): Human Development Report 2009. Guinea HDI Rank – 170 (http://hdrstats.undp.org/en/countries/data_sheets/cty_ds_GIN.html)
United Nations Development Programm – UNDP (2004): Rapport National sur le Développement Humain (RNDH). Guinée.
World Bank Regional Program on Traditional Energy Sector – RPTES (1998): Final Report Guinea
THIAM (2006): Monographie – Pays (Guinée Conakry) – Draft Version.
World Bank (2009): Guinea. All Projects (go: > Countries > Africa > Guinea > Projects & Programs > All Projects; or: http:// web.worldbank.org/external/default/main?menuPK=351830&pagePK=141143&piPK=399272&theSitePK=351795)
World Bank Group/International Finance Corporation – IFC (2009): Doing Business. Measuring Business Regula-tions (www.doingbusiness.org)

COUNTRY CHAPTER:
GUINEA-BISSAU Author of Country Chapter Louis Seck (MSc., DEA, MBA)
Coordination and Review of the Country ChapterAnton Hofer, (MSE, Dipl.-Ing./FH, M.A.)WIP-Renewable Energies www.wip-munich.deMunich, Germany
Editor Deutsche Gesellschaft für Technische Zusammenarbeit (GTZ) GmbHDepartment Water, Energy, TransportDag-Hammarskjöld-Weg 1-565760 Eschborn, Germanywww.gtz.de
On behalf of Federal Ministry for Economic Cooperation and Development (BMZ)
Editorial staffDiana KraftTel: +49 (0)6196 79 4101Fax: +49 (0)6196 79 80 4101Email: [email protected]
Renewable Energies in West Africa 118

CONTENTS GUINEA-BISSAU
ACRONYMS, ABBREVIATIONS AND MEASUREMENTS 120
SUMMARY 121
1 COUNTRY INTRODUCTION 122 1.1 Geography and Climatic Conditions 122 1.2 Political, Economic and Socio-economic Conditions 122
2 ENERGY MARKET IN GUINEA-BISSAU 122 2.1 Overview of the Energy Situation 122 2.2 Energy Capacities, Production, Consumption and Prices 123 2.3 Market Actors and Regulation Structures 124
3 POLICY FRAMEWORK FOR RENEWABLE ENERGIES 124 3.1 Policies, Strategies and Programs for Renewable Energy Promotion 124 3.2 Regulations, Incentives and Legislative Framework Conditions 124
4 STATUS AND POTENTIAL FOR RENEWABLE ENERGIES 125 4.1 Biomass/Biogas 125 4.2 Solar Energy 125 4.3 Wind Power 125 4.4 Hydro Power 125
5 MARKET RISKS AND BARRIERS 125
6 RENEWABLE ENERGY BUSINESS INFORMATION AND CONTACTS 126
7 BIBLIOGRAPHY 127
Renewable Energies in West Africa 119CONTENTS
GUINEA-BISSAU

ACRONYMS AND ABBREVIATIONS GUINEA-BISSAU
AD Action for Development
AUDCG Acte Uniforme Relatif au Droit Commercial General (Uniform Act on General Commercial Law)
BCEAO Banque Centrale des États de l’Afrique de l’Ouest (Central Bank of West African States)
CFAF CFA Franc (1 Euro = 655,957 CFAF)
DGE Direction Générale de l’Énergie (General Direction of Energy)
EAGB Electricidade e Águas de Guinea-Bissau (Electricity and Water Company of Guinea-Bissau)
GDP Gross Domestic Product
INEC Instituto Nacional de Estatística e Censos (National Institute of Statistics and Census)
LPG Liquefied Petroleum Gas
OHADA Organisation Pour l’Harmonisation en Afrique du Droit des Affaires (Organization for the Harmonization of
Business Law in Africa)
PRS Poverty Reduction Strategy
PV Photovoltaic
RE Renewable Energy
SIE Système d‘Information Énergetique (Energy Information System)
TEC Common External Tariff
UEMOA Union Économique et Monétaire Ouest Africaine (West African Economic and Monetary Union)
Renewable Energies in West Africa 120ACRONYMS, ABBREVIATIONS AND MEASUREMENTS
GUINEA-BISSAU
MEASUREMENTS
ºC degree Celsius € Euro (1 Euro = 655.957 Francs CFA) GWh gigawatt hour (1 GWh = 1,000,000 Kilowatt hours (kWh)) h hours km² Square kilometer ktoe kilotons of oil equivalent (= 1,000 toe) kVAh kilovolt ampere hour kWh kilowatt hour kWp kilowatt peak m/s meters per second m2 square meter m3 cubic meter mm millimeters MW megawatt (1 MW = 1,000 kW) toe tons of oil equivalent

SUMMARY
The Country Study of Guinea-Bissau is to provide an overview of the country’s energy market and to support decision-mak-ing for private investments for the Renewable Energy (RE) sector in Guinea-Bissau. The study is structured as follows:
Chapter one provides Background Information on Guinea-Bissau. This includes an overview of geographical and climat-ic conditions, as well as the most important facts in view of political, economic and socio-economic conditions of Guinea Bissau.
Chapter two summarizes facts and figures of Guinea-Bissau’s Energy Market including stakeholders and market actors in-volved as well as sector related regulations.
Chapter three presents the currently existing Political Frame-work for Renewable Energies in Guinea-Bissau. This includes an overview of support mechanisms for photovoltaic (PV) as well as already existing regulations, incentives and legislative framework conditions concerning other RE technologies.
Chapter four provides a brief overview of the Status Quo and Potential for Renewable Energies in Guinea-Bissau.
Chapter five summarizes the existing and potential Market Risks and Barriers in general with focus on RE.
Chapter six presents a compilation of the most relevant Renewable Energy Business Information and Contacts of Guinea-Bissau.
Renewable Energies in West AfricaSUMMARY 121
GUINEA-BISSAU

Primary Sector
Primary Sector
Secondary Sector
Source: National Institute of Statistics and BCEAO Guinea-Bissau, as of 2005
200 %
400 %
600 %
0 %1997 1998 1999 2003 2004 2005
FIGURE 2
GDP by Sector (in Mio €)
1 COUNTRY INTRODUCTION
1.1 GEOGRAPHY AND CLIMATIC CONDITIONSGuinea-Bissau is located in West Africa and limited by the Atlantic Ocean, Senegal and the Republic of Guinea. The to-tal area is 36,125 km² with approximately 28,000 km² con-stituting the continental part. Offshore, there are about sixty small islands of which the archipelago of Bissagos is the most important one.
With the exception of the islands, Guinea-Bissau is domi-nated by a marshy coastal plain. The relief rises gradually towards the East and forms a shelf culminating in 360 me-ters of altitude in the South East. Numerous rivers flow from West to South and form vast estuaries at their mouth. Many of them are navigable and constitute the principal means of transport. The country is subject to a hot and wet tropical climate, with annual average temperatures of around 25 °C. From one season to another, the variation of temperature is not very significant.
The rainy season lasts from June to November with wind blowing from South West; the annual average precipi-tation is around 1,200 mm. The dry season extends from December to May with Harmattan blowing from the North East.
1.2 POLITICAL, ECONOMIC AND SOCIO-ECONOMIC
CONDITIONSThe former Portuguese colony of Guinea-Bissau gained its independence in 1974. Since then, several political changes have occurred in the country. In order to comply with human rights, the National Assembly approved of a package of consti-tutional amendments in line with the guarantee of fundamen-tal rights in February 1993. But respect for these rights by the elements in power is not always the case. In August 1991, the Guinean League of Human Rights was established.
122
GUINEA-BISSAU
COUNTRY INTRODUCTION
According to the National Institute of Statistics and Cen-sus (INEC), the population of Guinea-Bissau is estimated at 1,366,412 inhabitants with a population density of 34 inhab-itants per km². The country counts approximately 1,500 vil-lages, mainly with dispersed habitat. Guinea-Bissau consists of five major ethnic groups. The Balantes represent approxi-mately 30 % of the population, the Fula 20 %, the Mandjac 15 %, the Mandingo 13 % and the Pepels 8 %. The language mostly used in Guinea-Bissau is Portuguese Creole, however the official language is Portuguese.
The economy of Guinea-Bissau mainly depends on the primary sector. The agricultural potential of the country is enormous and accounts for almost 62 % of Gross Domes-tic Product (GDP). More than 90 % of the exports and the employment of 550,000 people are related to this important sector. Agriculture is dominated by the production of rice and cashews. Another important source of income is the fishing sector exporting about 500 million tons per year thus ac-counting for 7,500,000 Euro. Figure 2 illustrates the GDP development within the last few years.
2 ENERGY MARKET IN GUINEA-BISSAU
2.1 OVERVIEW OF THE ENERGY SITUATIONThe energy sector in Guinea-Bissau is divided in three parts, i. e. the electricity sub-sector, the petroleum sub-sector and the biomass sub-sector. In 2007, according to the Guinea-Bis-sau energy balance, the final total consumption of the country was 345,000 toe with biomass consumption as the dominant factor. Figure 3 presents the final energy consumption and the related energy sources.
FIGURE 1:
Map of Guinea-Bissau
Renewable Energies in West Africa
NorthAtlantic Ocean
80 miles
G U I N E A
Farim
BafatáGabúCacheu
S E N E G A L
Catió
Mansôa
BISSAU

250
300
350
150
200
100
50
2000
262
2001
270
2002
273
2003
278
2004
284
2005
290
2006
296
2005
296
0
Source: SIE, Guinea-Bissau, as of 2008
FIGURE 3
Final Energy Consumption by Type of Energy (1,000 toe)
Total
Biomass
Electricity
Oil products
15
20
10
5
25
2000
20,07
2001
19,9
2002
18,5
2003
16,7
2004
13,3
2005
16,2
2006
20,4
2005
3,3
0
Gwh
Source: EAGB, as of 2007
FIGURE 4
Electricity Production
0,29
0,3350,330,325
0,34
0,2950,30,3050,310,3150,32
2001 2002 2003 2004 2005 2006 2007
Source: EAGB, as of 2007
FIGURE 5
Evolution of the Electricity Access Rate
TARIFFS FOR HOUSEHOLDS
Level kWh Price/kWh in CFAF(1 Euro = 655.957 CFAF)
Price/KVAH in CFAF
Power Tax CFAF
1 0–50 78 1,000
2 51–200 161 2,000
3 > 200 322 2,100
TARIFFS FOR GOVERNMENTAL OFFICES, SHOPS, ETC.
With meter > 0 255 48 6,400
Without meter > 0 320 48 6,400
TARIFFS FOR INDUSTRY
Single > 0 165 50 50,000
Source: EAGB, as of 2008
TABLE 1
Electricity Tariffs
Source: SIE, Guinea-Bissau, as of 2008
0
500
400
600
100
200
300
2001 2002 2003 2004 2005 2006 20072000
FIGURE 6
Evolution of Petroleum Product Consumption in the Transport Sector
Gazole/diesel oil
Transport
Gasoline
2.2 ENERGY CAPACITIES, PRODUCTION, CONSUMPTION AND PRICES
Electricity SectorGuinea-Bissau’s infrastructures of electricity production are in a bad state and the capacity is very insufficient. There is a considerable lack and malfunction of infrastructures for elec-tricity production. The electricity production of Guinea-Bis-sau is thermal-based (diesel) and is based on a major thermal power plant in Bissau (with a capacity of 17.5 MW) as well as on secondary production centers (with a capacity of about 7 MW) operating in the center of the country. The peak capac-ity is estimated at 20 MW (figure 4). In 2006, the availability of the power station of Bissau did not exceed 3.9 MW. Today, the available capacity is 5.5 MW.
During 2002–2007, the electricity access rate de-creased due to insufficient and disordered production and dis-tribution infrastructures. Figure 5 presents the evolution of the electricity access rate.
As to electricity prices, Guinea-Bissau has the most expensive tariffs in the region. Current prices are indicated in Table 1.
Renewable Energies in West Africa
GUINEA-BISSAU
COUNTRY INTRODUCTION
Petroleum SectorGuinea-Bissau has not proven oil reserves. Therefore, all pe-troleum products are imported thus charging the country’s economy with high expenses. According to the energy balance of 2007, the consumption of petroleum products is mainly dominated by the transport sector (40,614 ktoe), followed by electricity production (0.946 ktoe) and the residential sector (0.240 ktoe). The evolution of consumed petroleum products in the transport sector is presented in Figure 6.
Prices of petroleum products are determined by the Ministry of Energy and Industry and are to be revised on a monthly basis. Table 2 presents the prices of petroleum prod-ucts.
123

As of:
PRODUCT (PRICES IN CFAF)(1 EURO = 655.957 CFAF)
Diesel DieselElectricity Generation
Gasoline Kerosene Gasoline LPG
20/03/08 569 452 670 455 524 776
20/06/08 729 575 801 606 600 776
10/08/08 696 540 777 577 580 776
14/11/08 570 433 609 475 480 776
19/12/08 542 410 609 401 472 776
12/02/09 500 375 545 348 440 776
Source: Ad Hoc Committee for Oil Products Prices of the Ministry of Energy and Natural Resources,as of 2009
TABLE 2
Prices of Petroleum Products (March 2008–February 2009)
200
250
100
50
300
150
242
2000
249
2001
254
2002
259
2003
276
2006
281
2005
270
2005
264
20040
Source: SIE, Guinea-Bissau, as of 2008
FIGURE 7
Biomass Consumption (1,000 tons)
Charcoal
Firewood
Renewable Energies in West Africa 124
GUINEA-BISSAU
COUNTRY INTRODUCTION
Biomass SectorThe biomass represents over 95 % of the total energy consumed by households in Guinea-Bissau. Wood is the dominant fuel with a demand that exceeds 500,000 tons per year, followed by charcoal being the most-used fuel in the capital. The quan-tity of the biomass used is around 738,000 tons.
The price of wood varies according to the demand and requested amount. Charcoal is sold by bag or measure for about 0.10 Euro.
2.3 MARKET ACTORS AND REGULATION STRUCTURESIn Guinea-Bissau, the energy sector is under the supervision of the Ministry for Trade, Energy, Industry and Environment also in charge of the definition of any policies in the overall sector and the promotion of RE.
A General Direction of Energy (DGE) is in charge of the execution of this policy. Its tasks are the elaboration of the legal and regulatory orders in the energy field and the control of their application. It is also entrusted with the realization of prospective studies, the promotion of new technologies and the follow-up of the studies of installation. Within the DGE, the service of RE is the executive body in charge of all activi-ties related to these energy resources.
The electric system of Guinea-Bissau is managed by the Electricity and Water Company of Guinea-Bissau (Electrici-dade e Águas de Guinea-Bissau – EAGB). Within the existing market structure, there are several private energy producers in Guinea-Bissau. Self-sufficient producers of electricity are also
feeding part of their production into the distribution network of EAGB.
As to forest resources and domestic fuels, the overall sector is controlled by the Directorate General of the Forests supervised by the Ministry for Rural Development and Agri-culture.
The development of local energy resources is control-led by the National Institute on Research and Applied Tech-nologies under the supervision of the Ministry for Natural Resources. At the regulatory level, the Ministry of Energy de-livers import and export licenses for all types of energy prod-ucts and technologies.
For the overall regulation aspects, a multisector regu-lation unit is currently being planned. This authority will con-trol the telecommunication sector, harbor activities and the overall transport sector. In a next step, the integration of the electricity sector in this very unit is planned.
3 POLICY FRAMEWORK FOR RENEWABLE ENERGIES
3.1 POLICIES, STRATEGIES AND PROGRAMS FOR RENEWABLE ENERGY PROMOTION
Up to now, Guinea-Bissau does not have any explicit Renew-able Energies (RE) policies. Even though a draft was devel-oped by the Government as early as 2004, the document has not been adopted yet. Furthermore, a strategic plan for RE was elaborated during 2004–2008. Due to a lack of funds, it has not been implemented yet.
At the regional level, the Common External Tariff (TEC) of the West African Economic and Monetary Union (UEMOA) was established in 2000. Within this union, there is no promising tax incentive for RE yet. Recently, UEMOA started to review the situation and is now moving towards the implementation of tax incentives that are more favorable to the development of RE. UEMOA is committed to encouraging and developing the use of RE in all member states. Therefore, it is expected that UEMOA will establish various incentives to support the sustainable development of energy supply.
3.2 REGULATIONS, INCENTIVES AND LEGISLATIVE FRAMEWORK CONDITIONSUp to now, there are no regulations, incentives and legislative framework conditions that support the implementation of RE in Guinea-Bissau. As to rural electrification, it is planned to create ambitious regulations that allow private operators to conduct business in this sector thus offering promising op-portunities for the utilization of RE.
The Governmental body in charge is the Directorate General for Energy. Up to now, however, all projects and in-centives in the field of RE were realized by the investors with-out any involvement of the Ministry of Energy or the Directo-rate General for Energy. No permissions are currently required to develop RE projects. In terms of feed-in tariffs and other necessary regulations, there are no laws or regulations at all.

SITE FUNDER UTILIZATION
Bafata and Gabu PRS Pumping and lighting
Bafata and Gabu PRSII Pumping and lighting
Bissau Bissau/Hop.Raoul PRSII Lighting
Rural Area PRSII Lighting
Rural Area PRSII Pumping
Rural Area PRSII Pumping
Bissau Guinean Telecom Communication
Source: compiled by Julio Antonio and the author, as of 2008
TABLE 3
Existing PV Installations in Guinea-Bissau
Renewable Energies in West Africa 125
GUINEA-BISSAU
COUNTRY INTRODUCTION
4 STATUS AND POTENTIAL FOR RENEWABLE ENERGIES
4.1 BIOMASS/BIOGASThe forest areas of Guinea-Bissau are estimated at about two million hectares. The available amount of biomass is about 48.3 million m³. The annual consumption of wood for energy purposes is estimated at 625,000 m³ and leads to a significant reduction of existing forest areas. The available biomass po-tential from agricultural products, wood processing residues and livestock manure is about 67,000 m³ per year. In terms of bio fuel production, there is a potential of about 10,000 m³ from cashew and about 20 hectares of jatropha plantations.
4.2 SOLAR ENERGYGuinea-Bissau has an important solar radiation: 4.5 to 5.5 kWh/m²/day over an average of 8 hours per day (3,000 h of insulation per year). In spite of this promising potential, up to now merely 450 kWp of PV installations are being used for communication networks, water pumping stations and house lighting. The Government plans to significantly increase the utilization of PV in order to cover up to 2 % of the overall energy consumption by 2015. Table 3 presents an overview of existing PV installations.
4.3 WIND POWERThe average wind speed is estimated at 2.5 to 7 m/s along the coast and on some of the islands. Even though there is a very promising potential, there is no mentionable utilization of wind power in Guinea-Bissau so far.
4.4 HYDRO POWERThe available Hydro Power potential of Guinea-Bissau is esti-mated at about 184 MW from the rivers Corubal and Geba. Even though there is a very promising potential available, up to now there is no mentionable utilization of Hydro Power in Guinea-Bissau.
5 MARKET RISKS AND BARRIERS
The lack of consistent policies in the field of RE is the most critical of all existing market risks and barriers. Furthermore, the weakness of industrial and private sectors, together with a lack of clear direction and leadership from Governmental institutions is blocking the development of RE in Guinea-Bis-sau. Therefore, it is important to create a favorable environ-ment for the private and industrial sector in order to enable them to operate effectively and encourage them to expand their investments in RE projects. The most critical technical barrier is the lack of accurate data on available RE resources.
As to necessary investments, Guinea-Bissau has no incentives or benefits in order to attract potential investors. The political instability after the civil war is still discourag-ing national and international investments. Other substantial risks and barriers include corruption, high costs, insufficient human resources and the absence of a coherent institutional and regulatory framework.
The foundation of a company in Guinea-Bissau is not very difficult. The OHADA Uniform Act on general commer-cial law (Acte Uniforme Relatif au Droit Commercial Gener-al – AUDCG) regulates the exploitation and trade of natural resources as well as intermediate operations. In the specific activities related to RE sub-sector, the exercise of commercial activities requires a license or a permit issued by the Govern-ment. This license is granted for a period of 10 years and it is automatically renewed as long as prerequisites are met. The granted period for the permit is 5 years following the same renewal conditions.
Concerning foreign investment, the Investment Code of Guinea-Bissau was created in 1991 and amended in 1996. Due to the Investment Code, individuals and legal entities from all nations around the world are invited to make invest-ments in the country. The Investment Code of Guinea-Bissau guarantees that there are no restrictions for foreign investment and no obligation to employ local staff. Moreover, the equal treatment of companies, the freedom of commercial manage-ment and easy capital transfer procedures are guaranteed.

TABLE 4
Local Business and Trade Partners
Renewable Energies in West Africa 126
GUINEA-BISSAU
COUNTRY INTRODUCTION
6 RENEWABLE ENERGY BUSINESS INFORMATION AND CONTACTS
NAME ADDRESS FIELD OF ACTIVITY
Associação Comercial, Industrial e Agrícola a Guiné-Bissau (Commercial Association of the Industrial and Agricultural Sector)
B. P. 88, BissauPhone: +245 22 30 84
Commercialization of the industrial and agricultural sector
Action for Development (AD) Phone: +245 251 [email protected]
Promotion activities for solar energy
Direcção General dos Geologia e dos Minas (General Direction for Geology and Mines)
B. P. 399, Santa LuziaPhone: +245 222 329
Regulation of the mining sector
Direction Général de l�Énergie (DGE) Phone: +245 664 43 47Bissau
Energy policy
Electricidade e Águas de Guinea-Bissau (Electricity and Water Company of Guinea-Bissau – EAGB)
Rua Eduardo MondlaneBissauPhone: +245 20 11 84
Production and distribution of electricity
Empresa Distribuidora de Combustivos e Lubrificantes B. P. 3, BissauPhone: +245 201 262
Distribution of fuels and lubricants
Institut National de la Recherche et Technologie Appliquée (National Institute on Research and Applied Technologies)
Rua da Guinea-BissauBissauPhone: +245 22 20 80
Research
Ministry of Agriculture and Rural Development B. P. 71, BissauPhone: +245 221 200
Domestic energy policy management
Ministry of Energy and Industry B. P. 311, BissauPhone: +245 21 5659 245
Regulation of the energy and industry sector
Secretaria de Estado da Energia, dos Recursos Naturais e do Ambiente (State Secretary for Energy, Natural Resources and Environment)
B. P. 399, BissauPhone: +245 22 19 25
Energy, environment and natural resources

Renewable Energies in West Africa 127
GUINEA-BISSAU
BIBLIOGRAPHY
Réunion Annuelle ICA (2008): Point sur la Production de l’Énergie Électrique en Afrique
Tabucci, Antonio (2000): Suspecte Lusophonie, Le Monde, Paris
Bernard Krief Consultants (2006): Country Profile Guinea-Bisseau. Investment Conference in Construction & Civil Engineering Central & West Africa (www.africon-struct.org/.../studies/Sector_Profile_Guinea_Bissau.pd)
7 BIBLIOGRAPHY
BCEAO, Guinea-Bissau (2005): Various publications International Monetary Fund – IMF/Ministry of Econ-omy, Republic of Guinea Bissau (2007): Guinea-Bissau: Poverty Reduction Strategy Paper (PRSP)
C. Boccaletti, G. Fabbri, J. Marco, E. Santini (2008): An Overview on Renewable Energy Technologies for Develop-ing Countries: The Case of Guinea-Bissau (www.icrepq.com/icrepq-08/295-boccaletti.pdf)
DGI/Guinea-Bissau (2004–2008): Strategic Plan on Energy Sector
Direction General of Energy of Guinea-Bissau (years unknown): Various documents of projects and programs, rapports and texts
ECOWAS (2005): White Paper on Access to Energy Services
Encyclopédie Microsoft Encarta (2004): Guinée-Bissau, Pour la Partie Historique
ENDA (2005): Country monograph ENDERS, Armelle (1994): Histoire de l’Afrique Luso-phone, Paris, Éditions Chandeigne
Energy Information Administration (2006): West Africa (ECOWAS)
Issa Mare DIAW (2004): Situation et Évolution du Secteur de l’Énergie en Afrique de l’Ouest/Régulation dans le Con-texte du Système d’Échanges d’Énergie Électrique Ouest Africain”, 2nd Global Regulatory Network Conference Bamako, Mali, 26–27 July 2004
Ministry of Environment (1999): Initial National Commu-nication on Climatic Changes
Ministerio das Finança, Gabinete do Ministro (2007): Despacho No. 48/07
M. Boubacar Issa Abdourhamane (without year): Politique Institutionnelle en Guinée-Bissau, CEAN, IEP Université Montesquieu-Bordeaux IV (last viewed in August 2009 (www.etat.sciencespobordeaux.fr/institutionnel/gbissau.html)
National Institute of Statistics (2005): Various publications Ogunalde Davidson (2008): Scaling Up Market for Re-newable Energy in Africa, Thematic Background Paper for International Conference on Renewable Energy in Africa, Dakar, Senegal
Orlando MENDES (2007): Agro Climatologie de la Pro-duction de l’Anacardier en Guinée-Bissau, Agrhymet
Performance Management Consulting (2008): Rapport Définitif sur l’Étude pour l’Élaboration d’une Stratégie Durable de la Résolution de la Crise Électrique au Sein des États Membres de l’UEMOA
PREDAS (2004): Stratégie Energie Domestique de Guinée-Bissau, Bissau
Rapport National d’Investissement Guinée-Bissau (2008): Conférence de Haut Niveau sur l’Eau pour l’Agriculture et l’Énergie en Afrique: Les Défis du Changement Clima-tique, Syrte, Jamahiriya Arabe Libyenne, 15–17 Décembre 2008
RECIPES: Developing Renewables (2006): Country En-ergy Information, Guinea-Bissau

COUNTRY CHAPTER:
LIBERIA
Author of Country Chapter Augustus V. Goanue(MSc. Reg. Sc., BA Eng.) Coordination and Review of the Country ChapterAnton Hofer, (MSE, Dipl.-Ing./FH, M.A.)WIP-Renewable Energies www.wip-munich.deMunich, Germany
Editor Deutsche Gesellschaft für Technische Zusammenarbeit (GTZ) GmbHDepartment Water, Energy, TransportDag-Hammarskjöld-Weg 1-565760 Eschborn, Germanywww.gtz.de
On behalf of Federal Ministry for Economic Cooperation and Development (BMZ)
Editorial staffDiana KraftTel: +49 (0)6196 79 4101Fax: +49 (0)6196 79 80 4101Email: [email protected]
Renewable Energies in West Africa 128

CONTENTS LIBERIA
ACRONYMS, ABBREVIATIONS AND MEASUREMENTS 130
SUMMARY 132
1 COUNTRY INTRODUCTION 133 1.1 Geography and Climatic Conditions 133 1.2 Political, Economic and Socio-economic Conditions 133
2 ENERGY MARKET IN BURKINA FASO 134 2.1 Overview of the Energy Situation 134 2.2 Energy Capacities, Production, Consumption and Prices 134 2.3 Market Actors and Regulation Structures 136
3 POLICY FRAMEWORK FOR RENEWABLE ENERGIES 136 3.1 Policies, Strategies and Programs for Renewable Energy Promotion 136 3.2 Regulations, Incentives and Legislative Framework Conditions 137
4 STATUS AND POTENTIAL FOR RENEWABLE ENERGIES 137 4.1 Biomass/Biogas 137 4.2 Solar Energy 138 4.3 Wind Power 138 4.4 Hydro Power 138
5 MARKET RISKS AND BARRIERS 139
6 RENEWABLE ENERGY BUSINESS INFORMATION AND CONTACTS 141
7 BIBLIOGRAPHY 143
Renewable Energies in West Africa 129CONTENTS
LIBERIA

ACRONYMS AND ABBREVIATIONS
LIBERIA
CBL Central Bank of Liberia
CPA Comprehensive Peace Agreement
EC European Commission
EE Energy Efficiency
EPA Environmental Protection Agency
EPP Emergency Power Program
FDA Forestry Development Authority
GDP Gross Domestic Product
GEF Global Environment Facility
GoL Government of Liberia
IMC Inter-Ministerial Committee
IMPTC Inter-Ministerial Petroleum Technical Committee
IPRS Interim Poverty Reduction Strategy
LACC Liberia Anticorruption Commission
LCC Liberia Chamber of Commerce
LEAP Liberia Energy Assistance Program
LEC Liberia Electricity Corporation
LIBA Liberia Business Association
LPG Liquefied Petroleum Gas
LPRC Liberia Petroleum Refining Company
MIC Ministry of Industry & Commerce
MLME Ministry of Lands, Mines and Energy
NEP National Energy Policy
NIC National Investment Commission
NTGL National Transitional Government of Liberia
PPP Public-Private Partnership
PRS Poverty Reduction Strategy
PST Petroleum Storage Terminal
PV photovoltaic
RE Renewable Energy
RESCos Rural Energy Service Companies
RFTF Results Focused Transitional Framework
RREA Rural and Renewable Energy Agency
SME Small and Medium Enterprise
UN United Nations
UNDP United Nations Development Program
USD United States Dollars
WAPP West African Power Pool
130ACRONYMS, ABBREVIATIONS AND MEASUREMENTS
LIBERIA
Renewable Energies in West Africa

MEASUREMENTS
°C degree Celsius
dam³ cubic decameter (1 dam³ = 1000 m³)
GWh gigawatt hour
Kg kilogramm
km kilometer
km² square kilometer
kVA kilovolt ampere
kW kilowatt
kWh kilowatt hour
kWp kilowatt peak
m² square meter
m³ cubic meter
mm millimeter
MW megawatt
yr year
131Renewable Energies in West AfricaACRONYMS, ABBREVIATIONS AND MEASUREMENTS
LIBERIA

SUMMARY
The Country Study of Liberia is to provide an overview of the country’s energy market and to support decision-making for private investments for the Renewable Energy (RE) sector in Liberia. The study is structured as follows:
Chapter one provides Background Information on Liberia. This includes an overview of geographical and climatic condi-tions, as well as the most important facts in view of political, economic and socio-economic conditions of Liberia.
Chapter two summarizes facts and figures of Liberia’s Energy Market including stakeholders and market actors involved as well as sector related regulations.
Chapter three presents the currently existing Political Frame-work for Renewable Energies in Liberia. This includes an over-view of support mechanisms for photovoltaic (PV) as well as already existing regulations, incentives and legislative frame-work conditions for other RE technologies.
Chapter four provides a brief overview of the Status Quo and Potential for Renewable Energies in Liberia.
Chapter five summarizes the existing and potential Market Risks and Barriers in general with focus on RE.
Chapter six presents a compilation of the most relevant Renewable Energy Business Information and Contacts of Liberia.
Renewable Energies in West AfricaSUMMARY 132
LIBERIA

1 COUNTRY INTRODUCTION
1.1 GEOGRAPHY AND CLIMATIC CONDITIONSLiberia is situated on the southwestern corner of the West Coast of Africa between longitudes 7 ° 30’ and 11 ° 30’ West and latitudes 4 ° 18’ and 8 ° 30’ North. The country is bounded by the Atlantic Ocean in the South, by Côte d’Ivoire in the East, by the Republic of Guinea in the North and by the Re-public of Sierra Leone in the West. Liberia covers an area of 111,370 km2 split into 15,050 km2 of water and 96,320 km2 of land. The total land boundaries extend to 1,585 km (Guinea 563 km, Côte d’Ivoire 716 km and Sierra Leone 306 km).
There are four tropical regions each with its own dis-tinct physical features and height above sea level. The Coastal Plain stretches along the seacoast for 563 km. It consists of an almost unbroken sand strip rising up to 30 meters above sea level. The Coastal Plain flanked by a belt of flooded plateaus followed by a belt of high lands and rolling hills in the North and Northwest. The maximum elevation of Liberia is Mount Wutivi in the Northern highlands with a height of 1,350 me-ters. The average annual rainfall along the coastal belt is over 4,000 mm and declines to 1,300 mm at the forest/savanna boundary in the North. The relative humidity is generally high throughout the country.
There are four tropical regions each with its own distinct physical features and height above sea level. The Coastal Plain stretches along the seacoast for 563 km. It consists of an al-most unbroken sand strip rising up to 30 meters above sea level. The Coastal Plain flanked by a belt of flooded plateaus followed by a belt of high lands and rolling hills in the North and Northwest. The maximum elevation of Liberia is Mount Wutivi in the Northern highlands with a height of 1,350 me-
NorthAtlantic Ocean
S I E R R A L E O N E
G U I N E A
C Ô T E D ' I V O I R E
Tubmanburg
Harbel
Gbarnga
Greenville
Vionjama
Harper
Zwedru
Buchanan
Yekepa
Robertstown
MONROVIA
Renewable Energies in West Africa 133
LIBERIA
COUNTRY INTRODUCTION
ters. The average annual rainfall along the coastal belt is over 4,000 mm and declines to 1,300 mm at the forest/savanna boundary in the North. The relative humidity is generally high throughout the country.
1.2 POLITICAL, ECONOMIC AND SOCIO-ECONOMIC CONDITIONS
After winning the 1997 presidential elections following an eight-year civil war, former President Charles Taylor did not manage to keep rebel groups from trying to oust him by force. Rebel attacks in Monrovia, coupled with two years of sanc-tions imposed by the UN crippled the Taylor-led Government, thus prompting Taylor’s handing over power to his successor in August 2003. A transitional Government – composed of rebel factions, government, political parties and civil society groups – took control in October 2003 after the signing of the Accra Comprehensive Peace Agreement (CPA). Gyude Bryant, who had a two-year mandate to coordinate efforts to restore peace and rebuild Liberia, headed the transitional Government as its Chairman. Since then, Liberia has steadily been mak-ing progress towards political stability in conditions of peace and security. Successful multiparty presidential and legislative elections, held in October and November 2005, culminated in the formal inauguration of President Ellen Johnson Sirleaf and a new 94 member legislative body constituted by 14 political parties and 8 independent candidates in January 2006. Thanks to uninterrupted political and civil stability, the Government of Liberia (GoL) has been able to vigorously pursue an agenda of reconstructing post-war Liberia since 2006.
Liberia has a population of 3.5 million people. With a GDP of about 190 USD1 per capita, Liberia is one of the poorest countries in the world. Poverty is pervasive, and is par-ticularly acute in rural and remote areas of the country. 63.8 % of the country’s population live below the poverty line2. Pov-erty has many dimensions, including low levels of income and consumption, poor nutrition and food security, low health and education indicators as well as inadequate infrastructure. It is reinforced by inequities, especially in access to juridical and economic opportunities.
The Government of Liberia has embarked on a number of national development initiatives with external assistance. These development initiatives have been structured around the Results Focused Transitional Framework (RFTF)3 of February 2004–January 2006, the 150 Day Deliverables or Action Plan of February–June 2006 and the Interim Poverty Reduction Strategy (IPRS) of July 2006–June 20084, offering guidance to donor interventions as an addition to continuing programs and activities previously initiated on an emergency relief scope employing short-term recovery strategies.
In April 2008, the Government of Liberia finalized the Poverty Reduction Strategy (PRS) as a macro-economic policy framework document to guide socio-economic development activities and national reconstruction between 1 July 2008 and 30 June 2011. The PRS was designed around four major objectives: (i) consolidating peace and security, (ii) revitalizing the economy, (iii) strengthening governance and the validity of law and (iv) rehabilitating infrastructure and delivering basic services.
FIGURE 1
Map of Liberia
1 PRS, AS OF 2008
2 LISGIS, CWIQ, AS OF 2007
3 SEE ALSO UNITED NATIONS/WORLD BANK, AS OF 2005
4 IMF, AS OF 2007

LIBERIA
COUNTRY INTRODUCTION
The Liberian economy is characterized by a structural imbal-ance between a modern enclave and the traditional sector. The modern sector basically depends on foreign investment and technological skill and is geared towards mining, rubber and forest products. Before the war, this sector accounted for 70 % of export earnings and almost 50 % of the Gross Domestic Product (GDP). The traditional sector, on the other hand, is rural based and relies in general on indigenous capital and ru-dimentary technology for subsistence agriculture supports and comprises nearly 70 % of the population. There is no connec-tion between the two sectors whatsoever. The modern sector’s link to the rest of the economy is generally weak and exists mainly in the form of profit sharing with the Government, the payment of royalties, income tax levied on employers and du-ties on imported materials in some instances.
2 ENERGY MARKET IN LIBERIA
2.1 OVERVIEW OF THE ENERGY SITUATIONThe current energy market in Liberia is dominated by petrole-um products imported in refined forms and traditional wood biomass consumed primarily for cooking and heating as in most Sub-Sahara African countries. The market for petrole-um products is considered as formally institutionalized, while that of wood biomass is rather informal. Currently, there are no sufficient disaggregated data on the overall energy mix of Liberia in view of production and consumption.
2.2 ENERGY CAPACITIES, PRODUCTION, CONSUMPTION AND PRICES
Electricity SectorBefore the civil war, the total installed electricity generation capacity – including the private sector – was about 412 MW. The Liberia Electricity Corporation (LEC) provided approxi-mately 191 MW, while the concessionaires delivered 212 MW. The installed capacity of the rural electrification program to-taled 13 MW and consisted of small isolated rural systems powered by plants ranging from 300 to 1,300 kW. All facili-ties were completely damaged during the 14-year civil war. Figure 2 presents the available electricity generation capacities before and after the civil war.
The LEC small scale operations started in late Novem-ber 2003 after the inauguration of the National Transitional Government (NTGL) with the financial and fuel supply sup-port of the European Commission (EC). They ended by the first week of April 2004 as a result of the LEC’s inability to fi-nance the fuel oil supply component of its operation. The high electricity theft rate in the LEC distribution network was the main reason for the utility’s inability to sustain its operations. 22.6 % of the energy production could not be accounted for during the period January 1 to 31 March 20045.Launched in 2006, the Emergency Power Program (EPP) was designed to re-establish public power supply in Monrovia and its immediate environs. The EPP initially installed a total
power of 2.5 MW, which has now been increased to 9.6 MW. There is no generation capacity outside Monrovia besides privately owned generators and scattered donor-funded solar power pilot projects. A very large number of diesel generating units (ranging from 15–250 kVA) are in everyday use through-out the country. All institutions, agencies, commercial entities and a large number of private households generate their own electrical power. A combined capacity of small diesel units is conservatively estimated to be over 15 MW. There are no reliable data on the overall electrical energy consumption in Liberia as there are numerous privately owned generators of various capacities scattered across the country. Recently ob-tained production and consumption data from the LEC are presented in Table 1.
The current electricity tariff is fixed irrespective of consumer type (residential, commercial or industrial). Al-though only laid out to cover operational and maintenance costs, the current electricity prices are relatively high. Due to dependence on fossil fuel and fuel price instability, electricity tariffs have been ranging between 0.34 USD and 0.60 USD per kWh (based on fuel adjustment costs) since the inception of the EPP. Current tariffs stand at 0.43 USD per kWh. This price, however, is lower than the cost of self-generation, which is estimated at a minimum of 0.75 USD per kWh. Currently, there are no tariffs for RE implemented as RE projects still are in a rudimentary and non-commercial stage.
Renewable Energies in West Africa
5 LEC ANNUAL REPORT, AS OF 2004
Capa
city
(M
W)
FIGURE 2
Pre-War vs. Post-War Electricity Generation (MW)
Source: Liberia Electricity Corporation (LEC), as of 2004-2008
Pre-war Current
Public (LEC)
Private
Generation
0
50
100
150
200
250
TABLE 1
Annual Electrical Energy Production and Consumption (GWh)
Source: Liberia Electricity Corporation, as of 2004–2008
Year Energy Production Energy Consumption
2004 1.95 1.51
2005 0.00 0.00
2006 2.05 1.64
2007 8.23 6.70
2008 11.25 9.16
134

135
LIBERIA
Petroleum SectorYearly volumetric imports of approximately 35.2 million US gallons consist mainly of gasoline, diesel fuel and to a less-er extent jet fuel and kerosene. Presently, a number of large and small vendors hold licenses to import and distribute pe-troleum products. Although the Liberia Petroleum Refining Company (LPRC) is the major player in the downstream pe-troleum sector, the wholesale and retail business is dominated by the private sector, namely West Oil Investment, Monrovia Oil Trading Company, Aminata & Sons, SRIMEX Enterprise, Origin Oil & Gas, TOTAL International, Gulf Trading Com-pany and LIB-AFRIC. West Oil is the leading importer with a market share of about 34 % . Table 2 presents an overview of imports in the petroleum sector.
Local pricing of petroleum products in Liberia is sub-ject to external fluctuations in the price of oil on the world market. Import tariffs, port handling charges and stor-age fees also affect the price of petroleum products. The current pump prices of gasoline, diesel and kerosene are 2.50 USD, 3.00 USD and 2.90 USD per US gallon respectively. Table 3 provides wholesale, distributor and pump prices of petroleum products between 1997 and 2005.
The use of kerosene and Liquefied Petroleum Gas (LPG) for heating and cooking is limited to a very small number of expatriate workers and wealthy Liberians who re-side in Monrovia. The price per kg of LPG is about 2.5 USD.
Biomass SectorTraditional wood biomass (firewood and charcoal) is the pri-mary energy source for cooking and heating. In 2004, it was estimated that over 95 % of the population relied on firewood, charcoal and palm oil for their energy needs7. According to the Central Bank of Liberia (CBL), the charcoal production amounted to 255,600 kilograms in 1999. Data obtained from the National Charcoal Union of Liberia (NACUL) in 2005 revealed that 36,500,000 kg (36,500 tons) of charcoal were produced per annum. Though there are no reliable data on firewood consumption in Liberia, forecasts for the country estimate an annual increase in demand of about 0.6 m3 per household8.
Renewable Energies in West Africa
6 LPRC ANNUAL REPORT, 2006
7 CSET, AS OF 2004
8 CSET, AS OF 2004
COUNTRY INTRODUCTION
TABLE 2
Annual Petroleum Imports in US Gallons
YEAR GASOLINE DIESEL KEROSENE JET–A1
2000 11,528,818 15,089,206 456,408 1,472,509
2001 9,961,590 15,299,071 260,011 1,119,020
2002 8,837,731 12,290,039 328,047 1,535,958
2003 7,209,339 10,797,827 435,446 2,025,402
2004 13,170,250 21,595,384 640,862 6,381,150
2005 17,107,913 24,657,097 644,046 6,115,622
2006 20,487,703 30,678,151 1,054,258 5,156,645
Source: Liberia Petroleum Refining Company (LPRC), as of 2006
YEAR
GASOLINE DIESEL KEROSENE
Whole-saleDistributorPrice
PumpPrice
Whole-saleDistributorPrice
PumpPrice
Whol-saleDistributorPrice
PumpPrice
2005 3.02 3.07 3.25 3.12 3.17 3.25 2.49 2.55 2.70
2004 2.39 2.45 2.60 2.44 2.50 2.65 2.49 2.55 2.70
2003 No data available
2002 No data available
2001 2.79 2.85 3.00 2.69 2.75 2.90 2.49 2.55 2.70
2000 2.12 2.18 2.30 2.12 2.18 2.30 2.12 2.18 2.30
1999 1.89 1.88 2.00 1.82 1.88 2.00 1.82 1.80 2.00
1998 1.58 1.64 1.75 1.58 1.64 1.75 1.58 1.64 1.75
1997 1.33 1.39 1.50 1.33 1.39 1.50 1.33 1.39 1.50
TABLE 3
Comparative Petroleum Product Prices per US Gallon, 1997–2005
Source: LPRC Petroleum Storage Terminal (PST) Status Report, as of 2007

136
LIBERIA
COUNTRY INTRODUCTION
2.3 MARKET ACTORS AND REGULATION STRUCTURES
Electricity SectorUnder the current legislation, the Liberia Electricity Corpora-tion is the only institution responsible for the generation, trans-mission, distribution and sale of electricity under policy guid-ance of the Ministry of Lands, Mines and Energy (MLME). LEC used to supply the major cities and towns connected to the grid or with stand-alone diesel plants. Additional power was produced within the various mining and agricultural concessions. Due to the LEC monopoly, private investments have not been attracted to the electricity sub-sector. The draft National Energy Policy (NEP), however, has stressed the need for the liberalization of the electricity market.
Petroleum SectorThe Government’s institutional framework for the petrole-um sector comprises an office responsible for hydrocarbons in the MLME and two state-owned enterprises dedicated to upstream and downstream operations. NOCAL and LPRC are the two Government institutions established by law to ad-minister and regulate the petroleum sector of Liberia under the policy guidance and supervision of the MLME. NOCAL is responsible for the upstream petroleum sector, while the downstream petroleum is under the jurisdiction of the LPRC. In the upstream sub-sector, petroleum exploration and de-velopment is one of the Liberia’s top priorities. Although the current law does not provide for separation of policy-setting, monitoring and operation roles, in practice the MLME is in-volved in policy-setting in the upstream sector as it chairs the Inter-Ministerial Petroleum Technical Committee (IMPTC) in charge of analyzing applications for licenses and negotiat-ing concession agreements. The IMPTC is the executive body of the Inter-Ministerial Committee (IMC) chaired by the Minister. In accordance with regulations and procedures, it decides on the granting of licenses and concessions. NOCAL receives applications from interested investors, submits them to the IMPTC (to which it provides technical advice) and then supervises the implementation of the resultant conces-sion agreements. In the downstream sub-sector, the LPRC is responsible for the importation, refining, storage and distribu-tion of petroleum products. At present, there is no operational refinery in the country. All of the country’s refined products are imported by companies licensed by the LPRC and through LPRC’s offloading and storage facilities. Even though there is no detailed study currently available indicating whether the refinery can be retrofitted or not, it is obvious that the requi-site financial resources for any restorations are not available, even if it made sense from an economic point of view.
Biomass SectorAlthough there is no public entity established by law to plan and regulate the biomass sector where charcoal and firewood predominate, the Forestry Development Authority (FDA), a Government entity created by law in 1976, is responsible for the regulation and management of the forestry sector. One
Renewable Energies in West Africa
of the FDA’s objectives is to stop waste and destruction of forests and the associated natural resources by bringing about the profitable harvesting of all forest products while assur-ing that supplies of these products are perpetuated. However, FDA’s mandate does not include any explicit policy and reg-ulatory oversight for the biomass energy sector. The already mentioned National Charcoal Union of Liberia (NACUL), a holding group of commercial charcoal producers established in 2005, is working closely with the FDA in order to coordi-nate the production and sale of charcoal in the sector.
3 POLICY FRAMEWORK FOR RENEWABLE ENERGIES
3.1 POLICIES, STRATEGIES AND PROGRAMS FOR RENEWABLE ENERGY PROMOTION
The formulation of Liberia’s first NEP started in early 2006 with provisions in the 150 Day Plan deliverables, followed by a National Energy Stakeholders Forum in October 2006, the publication of the National Energy Sector White Paper, the in-terim Poverty Reduction Strategy Process and the final Poverty Reduction Strategy. NEP contains Liberia‘s national vision for the energy sector from the emergency phase, which is nearing completion, to the capacity building and development phases. As part of its policy and strategy, the Government is consid-ering various international models based on best practices in order to develop and ensure that its poverty reduction policy is fully supported by the provision of sustainable energy serv-ices to all consumers. The Government believes that the pri-vate sector and Public-Private Partnership (PPP) arrangements will play a key role in the medium to long-term development of the energy sector. The Government began to transform the National Energy Sector White Paper into a National Energy Policy in mid 2007. The Renewable Energy (RE) and Energy Efficiency (EE) Policy and Action Plan for Liberia is to:
Establish a legal/regulatory framework for the development of RE & EE sub-sector in Liberia
Attract private investment to the RE sub-sector through fiscal and tax incentives
Develop and expand the RE market in Liberia through PPP Transfer technology and build local capacity in the RE & EE sub-sector through training
Following the drafting of the RE and EE Policy and Action Plan of Liberia, the Government embarked on the formulation of the broader National Energy Policy, which comprehensively addresses key policy issues needed to reform the overall energy sector of Liberia. NEP addresses access, quality, cost and in-stitutional framework as the major strategic issues implied in the principal policy objective for energy supply. These issues refer to the overall necessity for energy products and services to be available, acceptable, affordable and adequate.

LIBERIA
COUNTRY INTRODUCTION
NEP reaffirms the Government’s conviction that economic development is impossible without access to reliable, acces-sible, affordable and environmentally friendly energy. In-creased commercial energy access and use will contribute to the growth of Liberia’s economy. According to the NEP, the Government shall establish by legislation the appropriate in-stitutional framework and special incentives and financing mechanisms to facilitate the availability of affordable electric-ity supplies in remote and low-income rural communities. The development and growth of private and community-owned rural energy service companies (RESCOs) shall be supported. The Government also recognizes the need to provide efficient non-electric energy resources or off-grid electricity for those communities that cannot be connected to the grid in the near future due to affordability and resource constraints. Exam-ples of potential non-electric energy resources include high-efficiency charcoal or biomass stoves for cooking. Low-cost but highly efficient solar lights will be promoted. To generate employment and help to raise incomes for such communities, the Government – according to NEP – will prioritize the use of modern energy services for productive activities. With in-creased incomes, the demand for modern energy services en-suring a better quality of life will also grow.
3.2 REGULATIONS, INCENTIVES AND LEGISLATIVE FRAMEWORK CONDITIONS
There has been no explicit regulation/legislation for facilitat-ing the development of RE in Liberia. Legislative framework for rural electrification is restricted to the Government-owned LEC, which has never been able to provide sufficient capital to develop RE technologies.
To facilitate RE development and rural electrification, the NEP proposes to establish a Rural and Renewable Energy Agency (RREA) by law to facilitate the economic transforma-tion of rural Liberia through the development of RE tech-nologies. The RREA will be complemented by a Rural Energy Fund designed to support all economically sensible, socially acceptable and environmentally friendly rural energy projects and programs regardless of financial viability. The focus on RE is due to the fact that off-grid and RE technologies offer the best solution for remote communities and will comple-ment the targeted subsidies that will address the issue of af-fordability.
In this regard, a Bill to Adopt Liberia’s Energy Law has been drafted for submission to the National Legislature for enactment. The Draft Energy Law highlights the regula-tion promotion and development of the RE sub-sector and to establish the RREA and the Rural Energy Fund. Given that RE development is still generally in its basic stage as most of its resources have not been recently assessed on the scale need-ed for national development, the NEP highlights the need to conduct resource assessments and a National Energy Strategy and Master Plan. This will direct the future course for RE development in Liberia as highlighted in Table 4.
Renewable Energies in West Africa
Major developments for the use of RE are expected in the areas of hydro- and biomass power systems. In the case of the former, the long-term program involves Hydro Power for domestic consumption and interconnection with WAPP for export. The most promising site is the St. Paul River Basin, which has the potential to produce 824 MW. The planned rehabilitation of the Mount Coffee plant, which is part of the St. Paul River Basin, aims to produce 100 MW within 7–10 years. Moreover, the GoL has signed a concession agreement with Buchanan Renewable Energies for the construction of a 35 MW rubber wood-fired power plant (biomass power plant) to supply Monrovia and other nearby communities. Addition-ally, solar power systems for health, education and Small and Medium Enterprise (SME) development also form part of the medium term program.
4 STATUS AND POTENTIAL FOR RENEWABLE ENERGIES
Generally, the development of RE is still at a low level in Li-beria. There has been no previously defined long-term target for RE in the overall energy supply mix. The NEP, however, declares that by 2015, the share of RE in the overall energy consumption shall account for 30 % of the electricity produc-tion, 10 % of the overall energy consumption, and 5 % of the biofuels used for transport. There is no topical inventory of RE resources and no specific technology targets have been set. In addition, no evaluation of the RE utilization rate has been conducted. Regulatory and market/economic incentives for RE are non-existent.
4.1 BIOMASS/BIOGASLiberia is endowed with abundant biomass resources – rich forest, rubber plantations, oil palm, cassava, sugarcane, rice, and other crop residues. Wood biomass is the primary energy source used for domestic cooking and heating. More than 95 % of the population (most of whom are rural inhabitants) rely on firewood, charcoal and palm oil for their energy needs. Recently, the Liberia Energy Assistance Program (LEAP), funded by the United States Agency for International De-velopment (USAID), initiated a biomass resource assessment in July 2008. The only biogas digester in Liberia, which was destroyed during the civil conflict, was located in Galai (Sua-koko District, Bong County), just a few miles from the Cut-tington University campus.
137
TABLE 4
Phases of Renewable Energy Development in Liberia
PHASE PERIOD COMMENT
Emergency/pilot 2006–2008Launched in 2006 and ended in 2008 with the finalization of the NEP
Capacity building 2009–2015Building of local capacity for implementation of the National Energy Policy
Development Beyond 2015Developing the achievements of the capacity building phase to scale up RE development on a sustainable basis
Source: National Energy Policy of Liberia, as of 2008

138
LIBERIA
COUNTRY INTRODUCTION Renewable Energies in West Africa
The recent USAID funded biomass resource assessment re-vealed that a variety of biomass resources exist in the country in large quantities and with opportunities for expansion. It states that these resources are more than enough to cover the country’s annual electricity consumption of 297 GWh and oil consumption of 206 dam3. The study further estimates that of the total cropland in Liberia, only 6 % is currently cultivated and that the remaining cropland amounts to some 3 million hectares. While the contribution of food crop residues, ani-mal manure and municipal solid waste is small in comparison to other resources within the country, they could still play a valuable role in stand-alone electricity applications and be particularly effective for households in remote rural areas. On the other hand, cash crop and forest residues, resulting mainly from medium and large enterprises, provide opportunities for large-scale centralized power generation. Table 5 provides an overview of existing and potential biomass resources.
4.2 SOLAR ENERGYLiberia is endowed with solar resources that could be used for the benefit of the entire population. Due to the country’s equatorial position, Liberia receives vertical radiation at noon throughout the year giving rise to intensive insulation in all parts of the country with little monthly variations. Although Liberia has high rainfall, the annual solar insulation shows good prospects for the application of solar technologies. The global solar insulation map shows that the average solar ra-diation on horizontal surfaces in Liberia is between 4.0 and 6.0 kWh/m2/day. Figure 3 visualizes the available solar insula-tion throughout the year.
The current solar energy applications in Liberia are limited to donor-funded pilot projects with small-scale so-lar power systems for schools, health centers and small busi-nesses. Table 6 presents an overview of the current use of PV installations.
4.3 WIND POWERThere is little or no data available on wind speeds in Liberia as no formal assessment has been performed to date. Libe-ria, however, is situated in a low wind region, and except for mountainous and coastal areas, wind resources are expected to be relatively insignificant in most rural areas. Observations along the coastal regions have indicated good prospects for the development of wind power. Unlike in the case of solar energy, no wind energy pilot project has been conducted in the country so far.
4.4 HYDRO POWERLiberia has six major rivers running 66 % of the country’s wa-ter, namely the Mano, St. Paul, Lofa, St. John, Cestos and Cavalla Rivers. Before the Liberian civil war, there were three operational hydroelectric power plants in the country: Mount Coffee Hydro Power plant on the St. Paul River 27 km North East of Monrovia (64 MW); Firestone Rubber Plantation in Harbel (4 MW) and Yandahun, a community microhydro in Lofa County (30 kW). Apart from the privately owned 4 MW plant in Harbel, there is currently no working Hydro Power plant in the country. The United States Government funded a Feasibility Study for the rehabilitation of the Mount Coffee Hydro Power Plant. The long-term plan is to generate electric-ity for domestic consumption and export through the West African Power Pool (WAPP). Moreover, the United Nations Development Program (UNDP) and the GoL have signed a Memorandum of Understanding to conduct a feasibility study for the development of small Hydro Power plants in rural Li-
TABLE 5
Biopower and Bio Fuels from Existing and Potential Biomass Resources
EXISTING RESOURCESBIOPOWER (GWH/YR)
BIODIESEL (DAM3/YR)
ETHANOL (DAM3/YR)
Food crop residues 188 – –
Cash crop residues 5,889 – –
Biogas from animal manure 219 – –
Forest residues 15,248 – –
MSW (biogenic material only) 52 – –
Total 21,596 – –
POTENTIAL RESOURCES
Vegetable oils* 4,946 2,473 –
Sugarcane** – – 1,527
Crop residues*** 21,923 – 5,385
Sources: Assessment of Biomass Resources in Liberia, as of 2008
FIGURE 3
Solar Insulation per Month
Source: Solar Technology, Inc., Monrovia, as of 2007
Month
Insu
latio
n (k
w/m
2 /da
y)
Solar Insulation on Horizonatal Surface
Jan
Mar
Apr
Jul
Aug
Sep
Oct
Nov
Dec
Jun
1
3
4
5
6
7
0
2
Feb
May
CAPACITY INSTALLATIONS APPLICATION
29.22 kWp 50
Electricity for health clinics, schools, community centers, local Government offices, street lighting, small businesses, homes and entertainment
59.04 kWp 246 Refrigeration
0.96 kWp 3 Water pumping
TABLE 6
Current Use of PV Installations
Source: Center for Sustainable Energy Technology, as of 2008

139
LIBERIA
Renewable Energies in West AfricaCOUNTRY INTRODUCTION
beria. In addition, within the framework of the Global Envi-ronment Facility (GEF) and its new “Regional Programmatic Approach to Climate Change in Focal Areas of West Africa”, support is expected for small Hydro Power development in rural Liberia. Several pre-feasibility studies were conducted before the war identifying a number of potential Hydro Power sites as shown in Table 7.
5 MARKET RISKS AND BARRIERS
The stagnation of the Liberian economy due to the prolonged internal conflict has created numerous impediments to invest-ment and market development. The lack of energy policy and infrastructure (especially electricity), roads and good transport systems are major barriers for investment and trade. Moreover, the current monopoly of the National Power Utility continues to be an obstacle to private investment in the power sector. And last, but not least, endemic corruption on all levels of the society continues to be a major risk for the national market. The establishment of the Liberia Anti-Corruption Commis-sion (LACC) by law designed to fight corruption within both the public and private sector demonstrates the government’s commitment to fight corruption within the society.
The National Investment Commission (NIC) is the Government’s institution holding the mandate to promote and coordinate all investment-related activities in all sectors of Liberia’s economy. The Investment Code of Liberia defines all economic activities the Government wishes to encourage as well as the types of incentives it will offer to investors engaged in the defined industrial activities. According to the Code, the Government of Liberia encourages industrial enterprises which:
Utilize Liberian manpower at all levels and contribute to advancing their skills through training schemes (on-the-job) and other incentives to the highest possible extent
Utilize raw materials and products of Liberian origin to the highest possible extent
Utilize ancillary activities available in the productive and service sectors of the Liberian economy to the highest pos-sible extent
Contribute to make Liberia independent of imports of ba-sic goods to the extent of being economically feasible, thus saving foreign exchange
Contribute to the extension and diversification of Liberia’s exports
Contribute to increased employment all over the country
Both domestic and foreign investors may invest and partici-pate in any business enterprise in Liberia unless explicitly pro-hibited. Foreign investors may buy the shares of any Liberian business. Any individuals or companies desiring to engage in commercial and/or industrial activities in Liberia should be registered with the Ministry of Commerce and Industry be-fore taking up business operations.
Liberia’s Investment Laws are globally competitive. The country offers 100 % repatriation of funds and no cur-rency exchange restrictions e. g. profits and dividends (net of taxes), remittance of money (net of taxes) in the event of the sale or liquidation of the business, repayments of loans ac-quired from foreign banks etc. There is an overwhelming local acceptance of RE technologies. The major limitation is the low level of awareness and the limited number of trained local experts. The two main local universities (University of Libe-ria and Cuttington University) along with the Stella Maris Polytechnic plan to cooperate with local and international re-
RIVER BASIN
REGION SITE NAME AND CODE
DESIGN FLOW m3/SEC
HEAD (m)
POTENTIAL kW
Mano
Grand Cape Mount, Gbarpolu and Lofa
Mano River 1 10.4 30.0 2,474
Mano River 2 9.47 30.1 2,252
Mano River 3 8.09 25.0 1,603
Mano River 4 3.61 20.0 572
Mano River 5 2.43 12.0 231
Lofa
Lofa, Gbarpolu and Grand Cape Mount
Lofa River 1 55.7 17.0 7,508
Lofa River 2 37.10 20.0 5,884
Lofa River 3 3.48 55.0 1,517
Lofa River 4 3.42 10.0 271
Lofa River 5 3.35 7.0 186
Lofa River 6 3.25 6.0 153
Farmington MargibiFarmington River 1
16.90 15.0 20,100
St. JohnBassa, Bong and Nimba
St. John River 1 60.40 33.0 15,806
St. John River 2 57.50 28.0 12,767
St. John River 3 37.70 28.0 8,370
St. John River 4 2.32 25.0 460
Timbo Rivercess Timbo River 1 6.51 12.0 619
CestosGrand Gedeh and Nimba
Cestos River 1 8.30 12.0 789
Cestos River 2 7.35 10.0 582
Cestos River 3 6.51 15.0 774
Senkweh Grand Kru
Senkwen River 1
5.78 12.0 550
Senkwen River 2
3.47 12.0 330
Buto Grand Kru Buto River 1 0.26 20.0 44
Cavalla River Gee Cavalla River 1 0.66 25.0 130
TABLE 7
Potential Hydro Power Sites
Source: GEOSCIENCE srl., as of 1998

140
LIBERIA
Renewable Energies in West AfricaCOUNTRY INTRODUCTION
search institutes and other private institutions to promote and develop RE technologies.Liberian business law does not restrict business establishment but provides the basis for a range of businesses managed by both local and international investors. Business organizations include partnerships and sole proprietorships, joint stock and limited liability corporations as well as holding companies. A new business may be incorporated locally or abroad, its own-ership can be a combination of foreign and local ownership or foreign-owned.
Liberia has signed several international conventions on the protection of intellectual and industrial property rights. The act adopting the New Copyright Law of Liberia, approved on 23 July 1997, provides the legal and administra-tive framework for the effective implementation of programs intended to protect intellectual and industrial property rights in Liberia. Depending on the amount of capital, the sector and the location of the investment, investors may be eligible for investment incentives offered by the NIC.
The Customs and Revenue Code of Liberia provides the regulatory regime for custom duties and standards. Duties on imported goods range from 2.5 to 25 %. Import duties on RE equipment are about 2.5 to 10 %. In order to minimize the time it takes to clear goods from various ports of entries, businesses are requested to acquire a pre-shipment inspection certificate.
In the 2009 “Doing Business” assessment of the World Bank and the International Finance Corporation, Li-beria ranks 157 out of 181 in the respect of “ease of doing business”. This is a positive indicator as Liberia was ranked 167 out of 181 in the previous year. All countries are assessed based on local regulations that govern different stages of set-ting up a business. Table 8 presents Liberia’s ranking and its corresponding shift for 2008 and 2009.
INDICATOR RANK CHANGE IN RANK
2009 2008
Doing business (overall) 157 167 +10
Starting a business 88 145 +57
Dealing with construction permit 177 179 +2
Employing workers 105 105 0
Registering property 172 170 –2
Getting credit 131 141 +10
Protecting investors 142 141 –1
Paying taxes 59 51 –8
Trading across borders 115 108 –7
Enforcing contracts 165 166 +1
Closing a business 146 147 +1
TABLE 8
Ease of Doing Business in Liberia
Source: World Bank/IFC, Doing Business, as of 2009

LIBERIA
COUNTRY INTRODUCTION Renewable Energies in West Africa 141
6 RENEWABLE ENERGY BUSINESS INFORMATION AND CONTACTS
NAME CONTACT INFO PROFILE
Ministry of Commerce & Industry (MCI)Ashmun Street, P O. Box 9041Monrovia, Liberia
A GoL ministry responsible for issuing policies and regulating the commerce and industry sector
Ministry of Lands, Mines and Energy (MLME)Capitol Hill, P. Box 9024Monrovia, Liberia
A GoL ministry responsible for issuing policies and regulating the land, mineral and energy sector of Liberia
National Investment Commission (NIC)
Sinkor 12th Street Tubman Boulevard, P. O. Box 9043Monrovia, [email protected]
A GoL institution promoting and coordinating investment-related activities in all sectors of the Liberian economy
Liberia Business Association (LIBA)
C/o Corina Hotel24th Street SinkorTubman BoulevardMonrovia, Liberia
A consortium of small and medium Liberian businesses
Liberia Chamber of Commerce (LCC)
Capitol Hill,P. O. Box 9 Monrovia, Liberia Phone: +231–77857–805www.liberiachamber.com
An institution seeking to promote trade and investment in Liberia and ensure that businesses get fair treatment in their dealings with the government
Liberia Petroleum Refining Company (LPRC)Bushrod IslandMonrovia, Liberia
A Government owned company with the mandate to import and refine crude oil for distribution of the products on the Liberian market
Liberia Electricity Corporation (LEC)
Francis Cooper Chairman, LEC P. O. Box 10–165 Waterside–1000 Monrovia 10 Monrovia–LiberiaTelephone: .+231–6971934 e-mail: [email protected]
A Government owned company with the mandate to generate, transmit, distribute and sell electrical energy
National Oil Company of Liberia (NOCAL)
Episcopal PlazaRandall StreetMonrovia, Liberiawww.nocal-lr.com/
A Government owned company with the mandate to administer petroleum exploration program in Liberia
Environmental Protection Agency (EPA)
4th Street SinkorTubman BoulevardMonrovia, Liberiawww.epa.gov.lr/
A Government agency with the mandate to manage and regulate the environment
Source: Center for Sustainable Energy Technology, as of 2008
TABLE 9
Local Business Related Institutions
Source: data compiled by the author
PROGRAM/PROJECT CONTACT COLLABORATING INSTITUTION ROLE
Emergency Power Project (EPP) MLME/LECGovernments of Liberia, Ghana, USA, and Norway, the European Union, and the World Bank
A multilateral project restoring grid electricity to Monrovia and its environs
Liberia Energy Assistance Program (LEAP)
MLME/LEC Governments of Liberia and the US Government A bilateral program aiming to facilitate access to energy services and support to transparent energy sector reform and regulatory regimes
TABLE 10
Government Projects and Programs

LIBERIA
142COUNTRY INTRODUCTION Renewable Energies in West Africa
NAME OF BUSINESS CONTACT INFO CONTACT PERSON
Solar Technology Inc.Old Peugeot GaragePhone: +231 653 959 [email protected]
Reginald Gardiner
Alternative Energy, Inc.Randall Street Monrovia, LiberiaPhone: +231 652 650 [email protected]
Thomas Kpoto
Center For Sustainable Energy Technology
8th Street Sinkor Tubman BoulevardMonrovia, LiberiaPhone: +231 655 926 [email protected]
Augustus Goanue
Premier Solar
9th Street Sinkor Opposite LISGIS Monrovia, LiberiaPhone: +231 651 994 [email protected]
Nathan Reeves
Quantum Logistics
Adj. 101 Gas Station Pynesville City, LiberiaPhone: +231 621 338 [email protected]
Ronald Mitchell
Solar Electricity for Health clinic
Randall Street Monrovia, Liberiawww.energyforopportunity.org/projects/health-electricity-for-rural-health-centres/
Momo S. Kpoto
Equatorial Palm OilUN Drive MonroviaPhone:+231 561 221 [email protected]
David Parker
Buchanan Renewable Energy
Buchanan HouseCongo Town Tubman Boulevard MonroviaPhone: +217 779 841 [email protected]
Joel Strickland
TABLE 11
Contact Information of Businesses Involved in the Renewable Energy Sector
Source: Center for Sustainable Energy Technology, as of 2008

LIBERIA
BIBLIOGRAPHY Renewable Energies in West Africa 143
7 BIBLIOGRAPHY
Bongers, F., Poorter, L., Van Rompaey, R. S. A. R and Par-ren, M. P. E. (1999): Distribution of Twelve Moist Forest Canopy Trees Species in Liberia and La Cote d’Ivoire: Response Curves to a Climatic Gradients, IAVS; Opolus Press, Sweden
Center for Sustainable Energy Technology (2004): Bridg-ing the Energy Gap in Post-war Liberia: The Need for Alternative Energy Services
Center for Sustainable Energy Technology (2008): Renew-able Energy and Energy Efficiency Policy and Action Plan of Liberia
DECON – Dutch Energy Consultant (1983): Pre-feasibil-ity Study on the Development of Power in the Liberian Rural Areas
Department of Energy, Ministry of Lands, Mines & Ener-gy, Republic of Liberia (2002): Unpublished Energy Sector Report
GEOSCIENCE srl. (1998): Electricity Supply in Liberia; Project LBR/7ACP/21–16. European Commission Aid Coordination Office in Liberia
Liberia Electricity Corporation (2004–2007): Annual Reports
Liberia Institute of Statistics and Geo-information Services (2007): Core Welfare Indicator Questionnaire
Liberia Institute for Statistics and Geo-information Serv-ices (2008): Preliminary Results of 2008 National Popula-tion and Housing Census
Liberia Petroleum Refining Company (2003–2006): An-nual Reports
Mattick, R. E. (1982): Assessment of the Petroleum, Coal and Geothermal Resources of the Economic Community of West African states (ECOWAS) Region. U.S. Geologi-cal Survey
Milbrandt, Anelia (2008): Assessment of Biomass Resourc-es in Liberia. US National Renewable Energy Laboratory
Ministry of Lands, Mines and Energy (2008): Proceedings of the National Energy Policy Validation Workshops
Ministry of Lands, Mines and Energy (2006 & 2007): An-nual Reports
National Investment Commission (2008): Investor’s Guide to Liberia (www.nic.gov.lr)
Republic of Liberia (2001): Customs Revenue Code and Harmonized Description and Coding System of the Cus-toms Tariff Schedules of Liberia Act of 2000
Republic of Liberia (2004): National Biodiversity Strategy and Action Plan
Republic of Liberia (2007): Draft Action Plan and Ration-ale for Renewable Energy and Rural Development
Republic of Liberia (2008): Draft Final National Energy Policy: An Agenda for Action and Economic and Social Development
Government of Liberia (2006): 150 Day Action Plan. A Working Document for a New Liberia (www.allafrica.com/peaceafrica/resources/view/00010785.pdf)
Republic of Liberia (2008): Poverty Reduction Strategy
International Monetary Fund/Republic of Liberia (2007): Liberia. Interim Poverty Reduction Strategy Paper. Break-ing with the Past – From Conflict to Development; IMF Country Report No. 07/60 (www.imf.org/external/pubs/ft/scr/2007/cr0760.pdf)
National Renewable Energy Laboratory (1998): Interna-tional Programs Brochure: Global Solar Resource Map, (www.nrel.gov).
United Nations/World Bank (2005): Liberia. National Transitional Government of Liberia. Results Focused Transitional Framework Revision (www.reliefweb.int/li-brary/documents/2005/ntgl-lib-30apr.pdf)
World Bank/IFC (2009): Doing Business 2009 (www.doingbusiness.org)

COUNTRY CHAPTER:
MALIAuthor of Country Chapter Souleymane Diallo (Dr. Ing. Eng.) Coordination and Review of the Country ChapterAnton Hofer, (MSE, Dipl.-Ing./FH, M.A.)WIP-Renewable Energies www.wip-munich.deMunich, Germany
Editor Deutsche Gesellschaft für Technische Zusammenarbeit (GTZ) GmbHDepartment Water, Energy, TransportDag-Hammarskjöld-Weg 1-565760 Eschborn, Germanywww.gtz.de
On behalf of Federal Ministry for Economic Cooperation and Development (BMZ)
Editorial staffDiana KraftTel: +49 (0)6196 79 4101Fax: +49 (0)6196 79 80 4101Email: [email protected]
Renewable Energies in West Africa 144

CONTENTS MALI
ACRONYMS, ABBREVIATIONS AND MEASUREMENTS 146
SUMMARY 148
1 COUNTRY INTRODUCTION 149 1.1 Geography and Climatic Conditions 149 1.2 Political, Economic and Socio-economic Conditions 149
2 ENERGY MARKET IN MALI 150 2.1 Overview of the Energy Situation 150 2.2 Energy Capacities, Production, Consumption and Prices 150 2.3 Market Actors and Regulation Structures 153
3 POLICY FRAMEWORK FOR RENEWABLE ENERGIES 155 3.1 Policies, Strategies and Programs for Renewable Energy Promotion 155 3.2 Regulations, Incentives and Legislative Framework Conditions 156
4 STATUS AND POTENTIAL FOR RENEWABLE ENERGIES 156 4.1 Biomass/Biogas 156 4.2 Solar Energy 157 4.3 Wind Power 157 4.4 Hydro Power 158
5 MARKET RISKS AND BARRIERS 159
6 RENEWABLE ENERGY BUSINESS INFORMATION AND CONTACTS 160
7 BIBLIOGRAPHY 161
8 ANNEX 163
Renewable Energies in West Africa 145CONTENTS
MALI

ACRONYMS AND ABBREVIATIONS MALI
AMADER Agence Malienne pour le Développement de l‘Énergie
(Malian Agency for the Development of Domestic Energy and Rural Electrification)
AMARAP Agence Malienne de Radioprotection (Malian Agency for Radioprotection)
AUREP Autorité pour la Promotion de la Recherche Pétrolière au Mali (Authority for Oil Exploration)
CdR-ER frame of reference for the development of rural electrification
CEWR Commission of Electricity and Water Regulation
CFAF CFA Franc (1 Euro = 655,957 CFAF)
CILSS Comité Permanent Inter-Etats de Lutte contre la Sécheresse dans le Sahel
(Interstate Committee for Fight against the Drought in the Sahel)
CNESOLER Centre National de l‘Énergie Solaire et des Énergies Renouvelables
(National Center of Solar Energy and Renewable Energies)
CREE Commission de Régulation de l‘Electricité et de l‘Eau (Commission of Electricity and Water Regulation)
DGD Direction Générale des Douanes (Directorate General of Customs)
DNCC Direction Nationale du Commerce et de la Concurrence (National Directorate of Trade and Competition)
DNT Direction Nationale du Transport (National Directorate of Transport)
DNGM Direction Nationale de la Géologie et des Mines de la République du Mali (National Direction of Geology and Mines)
DSF Decentralized Services Firms
ECOWAS Economic Community of West African States
EDM – SA Énergie du Mali (Malian utility)
GDP Gross Domestic Product
GPP Groupement Professionnel des Pétroliers du Mali (Oil Industry Professionals Group)
IN Interconnected Network
KfW Kreditanstalt für Wiederaufbau (German Banking Group including KfW Entwicklungsbank/German Development Bank)
LEP Local Electrification Plan
LV low voltage
MEA Ministre de l’Environnement et de l’Assainissement (Ministry of Environment and Sanitation)
MEIT Ministry of Economy, Industry and Trade
MEMW Ministry of Energy, Mines and Water
MF Ministry of Finance
MV medium voltage
NGO Non-governmental Organization
OMVS Organisation pour la Mise en Valeur du Fleuve Sénégal (Organization for the Valorization of the Senegal River)
ONAP L‘Office National des Produits Pétroliers (National Office of Petroleum Products)
PCASER Projets de Candidatures Spontanées d‘Electrification Rurale
(Projects of Spontaneous Candidacy for Rural Electrification)
PPER Programme Prioritaire du Electrification Rural (Rural Electrification Priority Programs)
PRODER Programme Decennial du Electrification Rural (Decennial Program of Rural Electrification)
PV Photovoltaic
RE Renewable Energy
REF Rural Electrification Fund
SHS Solar Home Systems
SOGEM Société de Gestion de l’Énergie de Manantali (Manantali Energy Management Company)
SSD Societe de Services Decentralises (Decentralized Service Companies)
USD United States Dollar
VAT Value Added Tax
Renewable Energies in West Africa 146ACRONYMS, ABBREVIATIONS AND MEASUREMENTS
MALI

GWh gigawatt hours
ha hectare
kg kilogram
km² square kilometer
kWp kilowatt peak
mm millimeter
m³ cubic meter
MW megawatt
MWh megawatt hours
TOE tons of oil equivalent
ºC degree Celsius
MEASUREMENTS
ACRONYMS, ABBREVIATIONS AND MEASUREMENTS
MALI
147Renewable Energies in West Africa

SUMMARY
The Country Study of Mali is to provide an overview of the country’s energy market and to support decision-making for private investments for the renewable energy (RE) sector in Mali. The study is structured as follows:
Chapter one provides Background Information on Mali. This includes an overview of geographical and climatic conditions, as well as the most important facts in view of political, eco-nomic and socio-economic conditions of Mali.
Chapter two summarizes facts and figures of Mali’s Energy Market including stakeholders and market actors involved as well as sector related regulations.
Chapter three presents the currently existing Political Frame-work for Renewable Energies in Mali. This includes an over-view of support mechanisms for photovoltaic (PV) as well as already existing regulations, incentives and legislative frame-work conditions.
Chapter four provides a brief overview of the Status Quo and Potential for Renewable Energies in Mali.
Chapter five summarizes the existing and potential Market Risks and Barriers in general with focus on RE.
Chapter six presents a compilation of the most relevant Re-newable Energy Business Information and Contacts of Mali.
Renewable Energies in West AfricaSUMMARY 148
MALI

1 COUNTRY INTRODUCTION
1.1 GEOGRAPHY AND CLIMATIC CONDITIONSMali, a vast landlocked country in the heart of West Africa, is situated between latitudes 10 ° and 25 ° North and between longitudes 4 ° East and 12 ° West. It covers a total area of 1, 241,238 km2 and has 7,000 km of frontiers bordering seven countries, i. e. Senegal, Mauritania, Algeria, Niger, Burkina Faso, Côte d’Ivoire and Guinea.
The climate is tropical dry and is divided in four dif-ferent zones: a Saharan climate (desert) in the North (annual rainfall less than 200 mm), Sahel in the middle (annual rain-fall between 200 mm and 600 mm), Sudanian (annual rain-fall between 600 mm and 1,000 mm) and Sudano-Guinean in the South (rainfall > 1,000 mm). The temperatures are high and the average rainfall is low. The average maximum tem-perature varies between 34 and 37 °C, the average minimum between 21 and 23 °C. The maximum relative humidity oscil-lates between 31 and 75 %, the minimum between 11 and 38 %. Mali has two alternating seasons:
A dry season varying from a nine month period in the North (October to June) to a six month period in the South (November to April)
A rainy season lasting from May to October in the South and from July to September in the North adjourned by more or less intense inter-seasons with “neither rainy, nor dry’’ periods.
Mali’s geography is the reason why the country’s economy is largely rural based and explains the central role of hydrology in the energy sector.
1.2 POLITICAL, ECONOMIC AND SOCIO-ECONOMIC CONDITIONS
Mali gained its independence in September 1960. The route to democracy, however, has been a long and difficult quest occa-sionally marked by violent outbreaks. Political pluralism was introduced in March 1991 under challenging circumstances. The Constitution provides the creation of eight Republican institutions and guarantees their independence through a pre-defined balance of power and the respective means of control. The Government, reigned by the Prime Minister, sets out and conducts the nation’s policies and directs the armed forces. The Parliament, comprising of a single chamber, is called the National Assembly.
In 2007, Mali’s population was estimated at 13.9 mil-lion inhabitants. The northern region of the country (Tom-bouctou, Gao and Kidal), which covers more than 60 % of the territory, houses only 10 % of the total population. The overall population growth rate is about 3 %, whereas the ur-ban population is increasing at a rate of 5.2 % due to rural exodus. The majority of Malians, however, are still living in rural areas (70 %).
According to the 2007/2008 Human Development Report, Mali ranks at 173 out of 177 (South Africa: 121, Guinea: 160, Chad: 170 and Central African Republic: 171).
Renewable Energies in West Africa 149
MALI
COUNTRY INTRODUCTION
The Gross Domestic Product (GDP) per capita increased from USD 260 in 2000 to 500 in 2007. The Gross National Income per capita based on purchasing power per capita rose from USD 750 in 2000 to USD 1,040 in 2007.
Mali’s potential wealth lies in mining and the pro-duction of agricultural products, livestock and fish. In 2006, cotton, gold and livestock made up 80–90 % of Mali’s total export earnings. Small-scale traditional farming dominates the agricultural sector. About 90 % of the 1.4 million hectares (3.4 million acres) are under cultivation mainly for the subsist-ence farming of cereals, primarily sorghum, millet, and corn. Mali’s economy is largely dominated by agriculture (employ-ing 83.4 % of the active population) followed by industry and service sectors (employing 4.1 % respectively 12.5 %).
The real growth rate of the GDP has experienced an uneven evolution reflecting amongst other determinants the climate factor and the difficulty to access maritime ports of neighboring countries. Table 1 presents the evolution of the GDP and the growth rate. TABLE 1
Evolution of the GDP and the Growth Rate
Source: Commission de l’UEMOA, Comité de Convergence et BCEAO, as of April 2007
2002 2003 2004 2005 2006 2007
GDP (billions of CFAF) 2,223 2,454 2,632 2,893 3,125 3,356.5
Real growth rate in % 4.3 7.6 2.3 6.1 5.0 5.4
Niger
Taoudenni
Dori
Mopti
Kidal
GaoTimbuktu
Kayes
Ségou
Sikasso
KoulikoroBAMAKO
MAP OF MALI

MALI
COUNTRY INTRODUCTION
2 ENERGY MARKET IN MALI
2.1 OVERVIEW OF THE ENERGY SITUATIONThe total energy consumption of Mali was 3,212,560 toe in 2002, mainly based on consumption of wood and charcoal (81 %), followed by oil products (16 %) and electricity (3 %). The sector-based use of energy is separated in descending or-der of their significance as follows: households (approx. 86 %), transportation (nearly 10 %), industry (approx. 3 %, half of which is being used for mining) and agriculture (less than 1 %). This energy shares based on source and sector vary but little from one year to another. RE (solar, wind, Hydro Power etc.) is currently used at a rate insignificant to the energy bal-ance. There is no liquid or gaseous biomass energy as part of the official supply in Mali (only solid biomass such as wood).
2.2 ENERGY CAPACITIES, PRODUCTION, CONSUMPTION AND PRICES
Electricity SectorThe electricity industry was state owned up to the year 2000 when reforms in the sector transferred 60 % of the property to the so called “strategic partners” consisting of SAUR Inter-national and IPS West Africa. After five years of private op-eration, SAUR International gave up its ownership of proper-ties by selling shares to the Government of Mali (by October 2005). IPS West Africa is now holding 34 % of the Malian utility “Énergie du Mali” (EDM–SA). The majority of shares, however, are in the hand of the State of Mali. The reforms mentioned above lead to the foundation of the Malian Agency for the Development of Domestic Energy and Rural Electrifi-cation (AMADER). Its major objective is to handle rural elec-trification by dealing with private operators. According to the National Directorate of Energy (DNE), the rate of access to electricity in 2007 was estimated at 17 % on the national scale and 5 % in rural areas (as compared to merely 1 % in 2000 before reforms).
The total installed capacity of power supply of the Interconnected Network (IN), consisting of three hydro-electric power stations and two thermal power stations, was 130.49 MW in 2007 (not including the Manantali site, which jointly belongs to Mali, Mauritania and Senegal). In addition to the IN facilities, EDM–SA operates nineteen insulated cent-ers equipped with diesel generators and two centers supplied by a network from Côte d‘Ivoire. The total installed capacity of power supply of the insulated centers rose from 31.5 MW in 2005 to 38.3 MW in 2006 following the strengthening of the output in various centers including Mopti and Sikasso. Table 2 presents the evolution of power generation. Figure 2 illustrates the energy mix in the electricity sector of Mali.
EDM–SA’s gross electricity production increased by 8.9 % from 865.8 GWh in 2006 to 942.5 GWh in 2007. The purchase of energy originating from the hydroelectric power station of Manantali contributed with more than one third of the production on the IN equaling 294.4 GWh (35.4 %). The evolution of the thermal component in the total production of the system was subject to fluctuations during the last five
Renewable Energies in West Africa 150
years. It decreased from 26.7 % in 2002 (with the start up of Manantali) to 16.6 % in 2003 before increasing again to 19.2 % in 2004, 20.1 % in 2005, 22.8 % in 2006 and 40.7 % in 2007 (see Figure 3).
FIGURE 2
Energy Mix of the Electricity Sector
Thermal ( %)
Interconnections ( %)
Hydro Power ( %)
2008
12
10
8
6
4
2
0
2009
2010
2011
2012
2013
2014
2015
2016
2017
2018
2019
2020
2021
2022
2023
2024
2025
2026
2027
Source: graph compiled by the author with data from EDM–SA, as of 2008
TABLE 2
Evolution of Power Generation Capacity
Source: Énergie du Mali, 2005, 2006 and 2007 reports
2001 2002 2003 2004 2005 2006Growth
rate
Total installed capacity including: MW 146 249 248 251 245 255 4.3 %
Interconnected Network (IN) MW 115 117 109 109 109 113 3.4 %
Manantali MW 104 104 104 104 104
Insulated centers MW 31 29 35 38 32 38 21,6 %
Peak capacity of the IN MW 82 87 98 111 123 133 7.5 %
FIGURE 3
Share of Hydro Power and Thermal Power for the Electricity Production
02003
10
70
60
50
40
30
20
80
90
2004 2005 2006 2007
Thermal production ( %)
Hydro electricity ( %)
Source: Energie du Mali, 2005, 2006 and 2007 reports

151
MALI
COUNTRY INTRODUCTION
The electricity company EDM–SA is strongly supported by the Government in the respect of tariffs for oil products and the existing tax and customs system. In order to limit the increase in the effective EDM–SA tariffs (by reducing the expenses of the company), the Government has been granting exemp-tions on the purchases of fuels intended for the production of electricity since 2002. The current procedure is to refund the related customs duties and taxes as discharged by EDM–SA. Since June 2002, however, EDM–SA has been benefiting from the mode of the Mining Code1 granting exemptions of taxation at source for purchase of fuels; thus saving the com-pany a considerable amount of money. Moreover, within the framework of a rehabilitating program, EDM–SA is benefit-ing from an indistinct tax system with regard to its investment plan 1995–2005 implying both external financial resources and self-financing. The tax considers both big projects and spare parts intended for the reconditioning of generators, net-works materials and means of operation. In 2001 and 2002, the prices were increased. The increase of 2001 was partially cushioned by the Government through a compensation of more than 10 billion CFAF. In 2003, there was a first tariff decrease, and the missing revenues resulting from the tariff decrease were entirely compensated by the Government (up to 7.2 billion CFAF). In 2004, the Regulation Commission decided on a price reduction. Tariffs remained steady up to 2008. The evolution of electricity tariffs between 2001 and 2007 is presented in Table 5.
Renewable Energies in West Africa
1 LE PRÉSIDENT DE LA RÉPUBLIQUE MALI, 1999)
2 CURRENT CONVERSION RATE: 1 EURO = 655,95F CFAF, DEC. 2009
The total energy consumption between January and Decem-ber 2007 was 730.7 GWh, as opposed to 666.4 GWh in 2006. This corresponds to an increase of 9.7 %. Low voltage sales for the whole EDM–SA were 424.7 GWh 2007 as opposed to 373.5 GWh in 2006, equalling an increase of 13.7 %. Table 3 summarizes the overall electricity consumption of Mali.
The Interconnected Network had 151,324 consumers (LV + MV) in 2007 as opposed to 140,968 in 2006 equaling an increase of 7.3 %. IN & Insulated Centers together supplied 151,377 LV and 1,003 MV consumers in 2007, as opposed to 140,043 LV and 925 MV consumers in 2006. Table 4 presents the numeral evolution of individual electricity clients.
In spite of existing investment-related difficulties, a high growth rate can be observed in the sector of electricity and the distribution network in particular. The consumption of energy is growing at the same rate as the country’s economi-cal growth. The power supply in particular is constantly chal-lenged to meet a faster growing demand. To avoid critical situ-ations for the economy caused by energy shortage, a Watching Commission has been set up. Between 2006 and 2007, the to-tal installed capacity of the interconnected network increased by 16 %, but still could not fully meet to the actual needs. Electricity production on the whole increases by 8.9 % per year, while EDM–SA’s sales of LV and MV have increased by 13.7 % and 4.5 % thus leaving a considerable demand unsatis-fied. In fact, the average coverage rate of the major electrified city is only about 50 %. This situation is due to the difficulties of investing in the distribution networks for an environment characterized both by the low density of consumer locations and the weak income level throughout the population.
TABLE 3
Electricity Consumption
Source: Énergie du Mali, 2005, 2006 and 2007 reports
2001 2002 2003 2004 2005 2006 Growth rate
Total consumption of electricity MWh 377,682 432,326 484,198 541,102 616,230 662,510 7,5 %
of that
Medium voltage MWh 177,041 199,333 206,867 242,420 272,545 289,017 6,0 %
Low voltage MWh 200,641 232,993 257,329 298,682 343,685 373,494 8,7 %
TABLE 4
Number of Electricity Clients
RATE OF USING ELECTRICITY 2001 2002 2003 2004 2005 2006 Growth rate
Total number of users 90,953 112,703 131,029 145,479 160,201 174,152 8,7 %
of that
Medium voltage 712 771 884 951 1,019 1,109 8,8 %
Low voltage 90,241 111,932 130,145 144,528 159,182 173,043 8,7 %
Source: Énergie du Mali, 2005, 2006 and 2007 reports
TABLE 5
Evolution of Electricity Tariffs2
2001 2002 2003 2004 2005 2006 2007
CFAF 96.49 103.98 95.7 85.16 84.67 84.16 85.42
Eurocent 14.73 15.87 14.62 13.00 12.93 12.85 13.04
Source: Énergie du Mali, 2005, 2006 and 2007 reports

In 2004, the Commission of Electricity and Water Regula-tion (CREE) decided on a price reduction without compen-sation by the client. Since then, prices have remained steady in spite of the huge rise in international market prices for oil products and the continuous increase in the share of thermal production. The principles determining the prices in the field of rural electrification are (i) freedom of tariffs for entities be-ing subject to various authorizations and declarations and (ii) regulated prices for licenses in compliance with the contracts signed with clients.
AMADER ensures that prices for entities being subject to various authorizations and declarations remain compatible and that incentive measures are taken to avoid that operators under a monopoly situation achieve unjustified profits.
The sales within concession systems benefiting from a situation of exclusiveness or natural monopoly are subject to a price regulation by directive of CREE. Taking into account the variations of costs according to the demand, the regulated prices are defined per tariff period and are revised according to the directives of the Regulation Commission CREE. Within the conceded perimeter there is equalization of tariffs.
Petroleum SectorMali does not produce petroleum and has no refinery. There-fore, all petroleum products are imported trough principal trunk roads leading to the West African ports, i.e. Abidjan (Côte d’Ivoire), Cotonou (Benin), Dakar (Senegal), Lome (Togo), and Tema (Ghana). The consumption is dominated by diesel oil. Table 8 shows the volume of petroleum imported between 2001 and 2007. Some of the oil imports in the far North of the country may have been obtained informally from Algeria. Figure 4 indicates the evolution of imported petroleum products.
152
MALI
COUNTRY INTRODUCTION Renewable Energies in West Africa
The consumption of petroleum products is mainly divides into the following sectors: transport (70 %), industry (20 %), household: (8 %) and agriculture (2 %). Diesel oil is by far the most used fuel (see graph above). The storage capacities are mainly located in the capital city of Bamako, but some private operators are running tanks in the western region about 90 km from the Senegal border. Many mining companies are directly served from these storage capacities in the city of Kayes.
Petroleum products are strategic goods because of the dependencies that occur in a landlocked country to import them. The share in the energy mix and their respective contri-bution to the customs revenues increased from 31.6 % in 2000 to 37,6 % in 2004. The oil bill, however, rose to 242 billion CFAF in 2006 without any chance to raise the fiscal receipts at the same rate. The current price fixing system of oil products was established in July 2001 and entails a monthly change of the prices at pump stations. The tariffs follow the development of the international market prices and based on the average off these prices. The price structure in Mali is determined accord-ing to the mentioned import of petroleum products via prin-cipal trunk roads connected to West African ports (see above). Butane in cylinders of 2.75 kg and 6 kg is being subsidized by the Government of Mali in order to promote the substitution of fuel wood and charcoal. The pricing structure of petroleum products is presented in Figure 5.
The taxation of the oil sector is based on the Principle of Taxing Oil Products proposed by the Economic and Monetary Union of West Africa – UEMOA/ECOWAS. The overall taxing in-cludes customs duties, the statistical royalty, ECOWAS Com-munity Tax, the inland duty on oil products and VAT. Cur-rent price information (updates available at www.onapmali.com) on the most prominent fuels is presented in Table 6.
FIGURE 4
Evolution of Petroleum Imports (2001–2007)
2007
450 000
Source: graph compiled by the author with data from ONAP, as of 2008
50 000
150 000
200 000
250 000
300 000
350 000
02001 2002 2003 2004 2005 2006
Kerosene
Petrol
Jet A1
100 000
400 000
Diesel oil
Fuel oil
FIGURE 5
Pricing Structure of Petroleum Products
Source: graph compiled by the author with ONAP data, as of 2008
Super Kerosene Gasoil DDO Fuel_180 GPL
Duties & Taxes
Selling price
Margin
900
100
300
400
500
600
700
0
200
800
Subsidized selling price (Kg)

MALI
COUNTRY INTRODUCTION
Biomass SectorAs in most developing countries, especially in Sub-Saharan Africa, wood energy remains the most common fuel used in Malian households. The yearly consumption is approximately 6 million metrictons. Considering the relative prices of alter-native sources of energy, the existing practices and the tradi-tions of the population using wood energy, this situation is likely to remain unchanged. The wood energy consumed pri-marily comes from natural forests. The organized rural mar-ket meets an increasing share in the supply of urban centers as does the uncontrolled/informal operating system. A slow but sure transition from crude wood to charcoal as well as an increase in the requirements for primary energy sources can be registered.
2.3 MARKET ACTORS AND REGULATION STRUCTURESResponsibilities of the multiple energy issues are shared among four ministries, one Regulation body and eight public or para-governmental technical arms in Mali.
The Ministry of Energy, Mines and Water (MEMW) is in charge of defining the energy policy and general energy planning (demand and supply), as well as of the control and monitoring of the electricity (thermal and hydro) and renew-able energies sectors, and only partly petroleum products. The MEMW also supervises several institutions:
The National Direction of Energy – it’s role is to eval-uate the potential of energy resources and ensure their valori-sation; to study, control and supervise the energy production and to ensure compliance with technical specifications and safety requirements; to take part in co-operation projects in the fields of energy, to process the issuance of licenses for the realization of energy infrastructures by self producers, para-governmental and private operators, decentralized communi-ties and others.
The National Center of Solar Energy and Renewable Energies (CNESOLER): As a division of the National Direc-tion of Energy, the CNESOLER is in charge of the research and promotion of RE equipments, i.e. in the fields of biomass, micro-Hydro Power, solar and wind energies (aero generators and wind mills for water pumping systems).
The Malian Agency for the Development of Domestic Energy and Rural Electrification (AMADER) that is funded by the World Bank. The role of AMADER is to reduce the household energy consumption through energy efficiency and substitu-tion programmes. Furthermore, it is in charge of the develop-ment of access to modern energy services in rural and peri-urban areas.
The Malian Agency for Radioprotection (AMARAP) is in charge of pacific use of nuclear energy and protection against harmful ionizing radiations.
The National Direction of Geology and Mines (DNGM) in charge of oil geology, geophysics and exploration through the Authority for Oil Exploration (AUREP). DNGM also hosts the laboratories aiming to control the quality of all petroleum consumed in the country (all imported for now).
The Ministry of Environment and Sanitation (MEA) handles the biomass energy supply (particularly fuel wood and charcoal) through the forestry department. This depart-ment has one specialist working at AMADER in order to har-monize views, policies and practices.
The Ministry of Finance (MF) is the key body in the import and storage of petroleum products through the Na-tional Office of Petroleum Products (ONAP).
The Ministry of Economy, Industry and Trade (MEIT) is in charge of setting prices and regulating concurrence for petroleum products through the ONAP. Trade and Economy used to be in the same department than the Finance. ONAP is therefore in between the two ministries MF and MEIT.
The Commission of Electricity and Water Regulation (CEWR) is independent from government operators and has juridical personality and financial autonomy. CEWR is in charge of the regulation of the sector of electricity and pota-ble water. More specifically, CEWR ensures the application of tariff policies and regulates public services of electricity in urban areas. Furthermore, it is in charge of the development of public services, consumer protection, quality management and the approval and controlling of tariffs.
Electricity SectorAs already indicated the MEMW supervises the entire elec-tricity policy and planning activities. A deep reform of the sector undertaken from 1998 to 2000 primarily resulted in:
The privatization of the utility “Energie du Mali (EDM - SA)” on December 21, 2000.
The creation of the Commission of Electricity and Water Regulation (CREE), on March, 2000.
The establishment of a legislative and regulatory scope for the organization of the electricity sector on March 2000.
The streamlining of the role of the Government concern-ing policy, regulation, planning and coordination of the electricity sector.
The disengagement of the Government from operational activities of electricity industry, in particular production, transmission, and distribution.
The opening of the electricity sector to private operators of any origin.
Renewable Energies in West Africa
3 CURRENT CONVERSION RATE: 1 EURO = 655,95F CFAF, DEC. 2009
Source: table compiled by the author with ONAP data, as of 2009
TABLE 6
Current Price Information of Fuels3
PRODUCTCFAF PER LITER/KG (LPG ONLY)
Petrol 635
Kerosene 450
Gasoil/diesel oil 545
Fuel oil 352
Jet A1 Free
LPG (with subsidy; bottles 2.7 kg & 6 kg)
320
LPG (without subsidy)
739
153

154
MALI
COUNTRY INTRODUCTION
Today, a few operators of the private sector provide the public service of electricity, the most significant of which is Energie du Mali (EDM-SA) as a licensee for electricity public service in 38 urban localities. On the other hand, forty small companies got authorization of public service of electricity in rural zones (starting in 2004) including two Decentralized Services Firms (DSF). Other actors are made up of sub-regional entities:
Société de Gestion de l’Energie de Manantali - SOGEM (Trust company of Manantali Energy), public corporation of estate created by the Member States of the Organization for the Valorization of the Senegal River (OMVS), which include Mali, Mauritania and Senegal.
ESKOM Energie de Manantali (ESKOM Energy of Man-antali), Malian subsidiary of ESKOM Corporations (South Africa), in charge, on behalf of SOGEM, of operating and maintaining the dam, producing and transporting the energy of the hydroelectric power station of Manantali to the three countries.
Petroleum SectorThe petroleum sector falls under different ministries (Finance, Economy-Industry and Trade, as well as Energy). A reform of the sub-sector undertaken in 1992 resulted in the withdrawal of the State from any commercial activity (distribution, storage and marketing) at the profit of private operators. The State lim-ited its role to fundamental missions for supply planning and regulating the whole supply-delivery chain. These missions are ensured through its technical departments which are:
The National Office of the Petroleum products (O.N.A.P). The National Directorate of the Trade and Competition (D.N.C.C).
The National Directorate of Transport (D.N.T). The Directorate-General of Customs (D.G.D).
In 2003, there were twenty five agreed private oil operators were including the members of the “Oil Industry Professionals Group (GPP)” who are local subsidiaries of the multinational companies (Mobil, Shell, and Total-Mali). At present, there are almost sixty private oil operators. Mali counts five sedimentary basins covering about 900.000 square kilometers. From 1960 to 1968, the petroleum exploration was conducted by the na-tional company «SONAREM». From 1968 to 1985, the first petroleum Code was adopted. At that time, the sedimentary basins were opened to all potential investors. The permits were granted to five petroleum companies (Texaco, Sun, Murphy, Elf and Esso). The perimeters of the permits were mainly situ-ated in the Taoudenit basin and the Gao basin (1970-1985). Up to 2005, the history of petroleum exploration in Mali clearly indicates that the sedimentary basins of the country are under explored with a very low level of seismic coverage and a very little number of exploration wells (in average one well per basin). In total, five wells were drilled in the five sedimentary basins. To promote exploration during the last four years, the Government of Mali undertook some major activities:
Renewable Energies in West Africa
A review of the petroleum code. The new code has been adopted by the National Assembly on August 2004 and was proposed to the potential investors.
The creation of the ‘’Authority for the Petroleum Explora-tion Promotion in Mali (AUREP) in September 2004.
Biomass SectorBiomass-energy is under the supervision of MEA – respectively under its forestry department (see chapter 2.3) all aspects related to the supply, while the MEMW manages the demand aspects including also efficiency and substitution policies. Among the strategies implemented, one can quote the attempt to formalize the wood-energy business, the empowerment of rural commu-nities’ through the creation of rural markets, the improvement of the institutional and legal framework of the natural forests management and the promotion of alternative energy sources such as LPG. New forestry framework allows putting in place a better regulation and a more coherent legislation aiming at a sustainable management of forest resources, particularly with regards to household energy issues which need:
A good wood-fuel supply to urban centers at optimal cost to the consumer and the community surrounding the forest.
A sustainable management of the wood resources as a sig-nificant contribution to the fight against the desertification.
The new legislation put in place comprises two laws and one decree:
Law 95-004 of January 18, 1995 fixing the conditions of forest stock management.
Law 95-003 of January 18, 1995 organizing exploitation, transport and trade of wood fuels.
Decree 422/P-RM of December 5, 1995 fixing the rates and the distribution of taxes to be perceived during the exploitation of forest resources, replaced by decree N (402/P-RM of December 17, 1998 fixing the rates, modalities of recovering and distributing taxes perceived when harvesting state owned forested areas.
The adoption of this new legislation led to the set up of a Na-tional Strategy of Household Energy in Mali (1996) and eased:
Decentralization of management, tax perception and deliv-ery of transport documents.
Reinforcement of professional activities in the field of transport and trade of wood energy.
Constraint to the payment of tax and fees on wood – broad access to energy.
Rate of tax according to the origin or the mode of exploita-tion of wood energy.
Self-reliance of the rural sector in financing issues, foresta-tion and reforestation initiatives.
The decree fixing the rates and the distribution of the taxes is fa-vorable to managed forests where the tax is the lowest, compared to other areas which are not under control. It shares the benefits of taxes between the State and the decentralized Communities. The laws allows thus among populations, communities and the Government to generate incomes within the framework of a concerted and sustainable management of forest resources.

155
MALI
In the field of decentralized electrification, the Frame of Reference for the Development of Rural Electrification (CdR-ER) constitutes an inventory of the major principles which will guide the set up of the regulation in the sector of rural electrification.
From a fiscal point of view, the willingness to promote RE is expressed by the Government’s renunciation to certain taxes through:
The Decree 02-026/P-RM of January 30, 2002 stating sus-pension of the collection of VAT, import duties and taxes on solar and RE equipment is a result of this willingness to promote renewable energies.
The order 04-1360/MEF-SG of July 12, 2004 defining the tax and customs system applicable to the markets and con-tracts fulfilled under the responsibility of the AMADER.
The Rural Electrification Fund (REF) plays a key role in this policy for facilitating access to energy services which are based mainly on RE technologies. The Fund is made up of Government endowment, subsidies from development part-ners, donors, gifts and legacy, loans, 25 % of sales incomes or renewal of authorizations whose holders benefitted from the subsidy provided by AMADER. Its management as ensured by AMADER must be directed in priority towards the op-erational funding objectives of the investments. It must also reinforce the particular risks relating to the amount invested in the private sector through guarantee mechanisms.
REF is intended to have three types of accounts. Its Subsidy Account is the principal source of funding invest-ment operations in the sector of rural electrification. It is the only one implemented to date. The Guarantee Account of REF should be set up for private operators in order to provide them with guarantees from banks and decentralized finance companies. The Account of Credit, which is the third account type of the REF, is to create long-term sources of financing for operators of the RE sector, by placing long term financial resources at the disposal of banks and decentralized finance companies to ensure adequacy between incomes and expen-ditures.
Producers and distributors (private operators) regulate their status through a request for authorization or a declara-tion filed at AMADER. This regulation is a necessary con-dition before private operators can apply for funding from the REF for the development of their project, and – through this – enjoy exclusive title of exploitation on the area covered by the declaration or authorization.
In order to promote the establishment of the private sector as a major factor in rural electrification within the frame-work of a public/private partnership, AMADER launched with the assistance of the World Bank and KfW (Kreditan-stalt fuer Wiederaufbau – Entwicklungsbank/German Devel-opment Bank) the Decennial Program of Rural Electrification (PRODER). The implementation of this program includes two operating modes: the Rural Electrification Priority Pro-grams (PPER) which constitutes the top-down procedure of PRODER and the Projects of Spontaneous Candidacy for Ru-ral Electrification (PCASER) which constitutes the bottom-up procedure besides the central programming of PPERs.
Renewable Energies in West Africa
3 POLICY FRAMEWORK FOR RENEWABLE ENERGIES
3.1 POLICIES, STRATEGIES AND PROGRAMS FOR RENEWABLE ENERGY PROMOTION
The overall objective of the energy policy of Mali (enacted by the Government in March 2006) is to contribute to the sustainable development of the country, through the supply of energy services accessible to the highest possible number of the population at low cost, and supporting the promotion of socio-economic activities. Its specific objectives are to:
Fulfil the energy needs of the country in quality, quantity and at low cost.
Ensure protection of people, property and environment. Build capacities in orientation, management, control and strategic monitoring of the energy sector.
Maximize the advantages of international co-operation for the country in the field of energy.
The strategic paths include, among other, the valorization of national energy resources and the research for sustain-able solutions and lower cost for the implementation and utilization of energy services (production, conveying, distribution, use, and maintenance).
In other words, both the described specific objectives and the strategic paths of the national energy policy indicate the importance attached to the valorization of the RE potentials sources (RE) that the country abounds in the form of sun radiation, wind conditions, hydraulic resources and biomass. The integration of RE in the energy policy of Mali was con-cretized through institutional and regulatory measures, and also through the practical achievements mentioned further on in this document.
Mali doesn’t have a structured renewable energy mar-ket. The RE sub-sector still appears mainly as informal. How-ever, Mali has always had a proactive policy with regard to renewable energies, which was concretized by the creation of the „Laboratory of solar energy“ in 1964. More recently, a na-tional strategy for the development of RE was worked out and adopted in January 2006. The integration of RE in the energy policy of Mali was concretized through institutional, legisla-tive and regulatory measures including:
Taking into account the fight against poverty, thus echoed in the energy policy through the objective of satisfying the highest possible number of people with energy services; from that follows the creation of AMADER intended for rural areas, the creation of funds for rural electrification, strategies and research in progress for reducing the impact of energy consumption on households, and from which also results the adoption of adequate systems of environ-mental protection, etc.).
Taking into account the new reality of decentralization to better involve local authorities in energy services (delega-tion of the duties of client to the decentralized communi-ties).
COUNTRY INTRODUCTION

The top-down procedure relates to 10 zones of electrification which cover the whole Malian territory. Each zone, which has a Local Electrification Plan (LEP), will be assigned a permit holder following a competitive bidding organized by AMADER. This permit holder will enjoy exclusiveness in the electrification of the area covered by the permit. The LEP de-veloped in eight Multisectoral Electrification Zones envisage the initial electrification of 136 localities with a population of about 500,000 inhabitants in 2008. The PACSER can be implemented by local communities, groupings of ultimate consumers, NGOs and private investors.
The law provides that when an operator is assigned a Multisectoral Electrification Zone where there are preexisting Projects of Spontaneous Candidacy for Rural Electrification (PCASER), the PCASER actors and the permit holders can make agreements so that the latter could resume the project for a compensation whose amount will be defined during ne-gotiations under the aegis of AMADER.
Decentralized Service Companies (SSD) are added to these PCASERs, operating either at the level of a locality or several localities of a commune. They have a monopoly on the territories which are conceded to them. The first two are a) the SSD of Yeelen Kura which operates in the area of Koutiala and which currently proposes primarily domestic services using photovoltaic kits, and b) the SSD of Koraye Kurumba, which electrified four administrative centers of commune in the area of Kayes, using LV networks and diesel power stations work-ing five hours a day.
3.2 REGULATIONS, INCENTIVES AND LEGISLATIVE FRAMEWORK CONDITIONS
In the field of RE most activities and entrepreneurships relate to trade of equipments. Recent investments and businesses re-late especially to the opportunities offered by AMADER in the field of rural electrification and the almost feverish passion for biofuels. Small Hydro Power generating systems and solar energy are offering recent opportunities through the proce-dures of licensing at AMADER. There are certainly official engineering departments and achievements, but also much of informal trade of RE technologies. The following has been achieved so far:
Renewable energies adjusted to the concern of end-users. Nearly 700 solar PV pumps installed. More than 50,000 individual lighting systems are under operation.
Telecommunications using intensively photovoltaic equip-ments for the power supply of insulated sites, more than 750 kWp installed.
A significant decrease of the price of photovoltaic equip-ments: for example, the price of installed peak Watt decreased from 20,000 CFA Francs as at the beginning of the Eighties to approximately 6,000 (in 2008/2009).
156
MALI
Renewable Energies in West AfricaCOUNTRY INTRODUCTION
4 STATUS AND POTENTIAL FOR RENEWABLE ENERGIES
4.1 BIOMASS /BIOGASThe ecological diversity of Mali results in a very contrasted forest situation between shrubby savannas in the North of the country (covers less than 10m3/ha), striped bush with stem wood volumes sometimes reaching 20 to 40 m3/ha (covers 25 % of the southern part of the country), then forests of the Sudanian Guinean zone (covering between 50 and 80 m3/ha), and the forests galleries of the West of the country (which sometimes cover even more than 100 m3/ha). The national for-est estate is approximately 100 million ha for a production of approximately 21 million ha. The surface with controlled ex-ploitation is more than 350,000 ha. Forest surfaces and their productivity are in perpetual regression. According to various studies, 100,000 to 400,000 ha are lost every year due to an-thropogenic actions (such as deforestation, clear cuts etc.) and climatic variations. This regressive evolution of the forests oc-curring these last decades is - on the one hand - due to the cli-matic changes. Biomass represents nearly 90 % of the domestic energy source of the country, proving that the other conven-tional products still have a marginal role in the field.
The potential of animal wastes and plant residues is high and well distributed on the whole territory. Agricultural residues (straw, rice husk, stalks of cotton, millet, sorghum, corn, etc.) are significant almost everywhere except, of course, in the Saharan northern part of the country. The biomass is available, in particular around the agro-industrial units in-stalled in some areas (Office du Niger, Office Riz Segou, Office Riz Mopti and Office de la Haute Vallée du Niger). The enor-mous potential of biomass energy cultivation in the country (jatropha, sugar canes) would allow the production of vegeta-ble oils and alcohols that can be used as fuels in substitution to hydrocarbons.
The quantity of stems of cotton plant produced per annum is estimated at 400,000 tons in Mali. The potential production of waste from rice production is more interesting. As an example, the potential of biomass from the cultivation of rice in two areas of the region of Ségou is about 265,000 tons of straw and 55,000 tons of husk. In a study entitled “From the Rice husk to Energy”, realized in 2005 by an American company, it is specified that with a current annual produc-tion of 800.000 tons rice paddy, the production of rice straw would be approximately 168.000 tons and would make it pos-sible to produce (126 GWh). The study pointed out that the availability of the rice husk could be limited. This limitation is mainly due to the disappearance of large mills which, fol-lowing the privatization of the industry and the trade of rice at the beginning of the 90s, were closed for various reasons and were replaced by decentralized small systems run by village as-sociations. Raw materials are dispersed within a very extended area, resulting in high collection and transport cost to any en-ergy plant. This study stresses that the only active large mill in the town of Ségou currently produces 2.000 tons of rice husk per annum, while in a group of villages located in the zone of Niono, 10 mills with a capacity of two tons per hour (each) produce approximately 15.000 tons of rice husk per annum.

MALI
COUNTRY INTRODUCTION Renewable Energies in West Africa 157
These mills, which are located in a radius of 10-15 km, should be supplemented by 10 other mills of similar capacity, which would raise the total availability of husk to 30,000 tons per annum. In this context, the study specifies that a capacity of 15,000 tons per annum would make it possible to operate a unit of co-generation of 1.2 MW (consuming 45 tons of husk per day during 330 days per annum). Two other regions, Mopti and Tombouctou, produce enough rice husk which could feed co-generation units that can operate for base load and reduce considerably fossil fuel consumption in EDM – SA power sta-tions of these two towns that are far from being connected to the national grid.
With regards to further biomass applications, so far Mali does not have any significant liquid or gaseous bio-mass based plant or equipment under utilization. In the past, however, the rice agro-industry4 had experimented with two 100 kW power plants based on producing methane from rice husk for feeding a diesel engine. This equipment, a Chinese technology, did not overcome the experimental stage. In the same area, the sugar cane industry tested some engines using alcohol, but this small-scale experiment was never expand-ed. The only biomass based liquid energy producer is Mali Biocarburant. Since 2008, a small-scale bio diesel plant has been extracting jatropha oil and transforming it into biodiesel through an etherification process. The production is expected to reach about 4,500 tons per year. Further information is available at www.malibiocarburant.com.
4.2 SOLAR ENERGYThe average solar radiation is 6 kWh/m² per day. The average daily duration of sun lighting varies between 7 and 10 hours. With a little more than 700 PV solar pumping units, more than 50,000 Solar Home Systems (SHS), hundreds of household so-lar water heating installations solar drying system – the latter mainly used by women for food processing small businesses -, Mali has sufficient experience today to appreciate the root bar-riers in changing the scale in harnessing RE sources. However, other niches such as solar air-conditioning are experiencing a rather slow development compared to the local potentialities. The most relevant prediction may lie on forecasting electricity generation in isolated cities. The most recent significant RE investment in Mali is a centralized 75 kW PV plant aimed to supply electricity to Kimparana, a village situated in the cen-tral part of the country at up to 525 km from the capital city. Other investments in rural electrification, using RE technolo-gies are under preparation.
As a forecasting, there are a lot of possibilities of self generation (solar energy, bio-fuels, etc.), which allow the production of small quantities of electricity to those clients, invoiced on contractual basis, and ensure profitability of the operations. For example, EDM-SA is feeding remote medium sized cities with diesel engines reaching a total of 100 MW. A little share of 20 to 40 % of solar PV make a forecast of almost 27 to 54 MWp of PV panels. These prospects attract a lot of investors. Thus, on January 21, 2008 AMADER was able to sign agreements for a total of 3.2 billion CFA F. Of
that amount 2.3 billion were provided by AMADER (under World Bank funding), and 927 million by local private opera-tors. The agency indicated that out of the 30 operators that had expressed their interest for the subsidies, nine tenders of business plans were retained. These projects were subsidized at 65–75 % and 6,154 electrical connected consumers (house-holds and small businesses) will benefit from these projects of rural electrification.
4.3 WIND POWERFrom 2001 to 2004, GTZ supported the Direction de l‘Energie (DNE) within the Ministry of Energy in Mali (MMEE) in ap-praising a project aiming to integrate wind turbines into the diesel-fuelled isolated grid supplying the provincial capital city of Gao in the northeast of the country. Results of wind measurements (March 2001 - October 2003) showed a rela-tively low wind potential. Mean wind velocities are 5.3 m/s at a height of 41 m and 4.7 m/s at a height of 26 m. Based on these measurements and with the assistance of DNE and the power utility Energie du Mali (EDM), GTZ undertook a technical and economic feasibility study5 conducted by Lahmeyer. The study was finalised in July 2004 and showed a positive result. Total investment for a 900 kW wind farm is estimated at EUR 1,7 million. The relatively high level of feed-in tariffs that will be necessary for the wind turbine generating systems (roughly 18 €-cent/ kWh) can be justified on economic grounds, how-ever, as this is below the cost of diesel generation (at the time of the study: approx. 21 €-cent/ kWh). The high cost of diesel is due above all to the expensive and lengthy transport route for the fuel. The study, though, worked on the assumption of an average crude oil price of USD 25 per barrel as applicable in 2004, so the costs of electricity generation from diesel in Gao are likely to be considerably higher by now.
4 OFFICE DU NIGER, AS OF 1969
5 GTZ, AS OF 2004
FIGURE 6
Average Solar Insulation in 4 Cities of Mali (KWh/m2/day)
Source: Graph compiled by the author S. Diallo - 2009 (Data from NASA Surface meteorology and Solar Energy Data Set)
Mopti
Nioro
Tombouctou
Diré
Jan
Mar
Apr
July
Aug
Sep
Oct
Nov
Dec
Jun
1
3
4
5
6
7
0
2
Feb
May

MALI
COUNTRY INTRODUCTION Renewable Energies in West Africa 158
An exhaustive review shows that more than 150 wind pumps and more than 10 aero-wind pumps (for the production of electricity) were installed throughout Mali, especially in the Sahelian area. The energy services provided by these wind mills were mainly used for supply of drinking water and crea-tion of income generating activities (gardening/truck farm-ing, etc.) as well as for pastoral hydraulics.
4.4 HYDRO POWERA hydroelectric potential of about 1,050 GW and 5,000 GWh of average production is identified for the principal rivers and their tributaries: Out of this national hydroelectric potential, less than 15 % are currently exploited. Table 8 presents the hydro power sites currently in operation, Table 9 indicates the estimated capacity of potential sites for micro Hydro Power Generation.
TABLE 8
Hydro Power Site in Operation
SITES UNDER OPERATION
N˚ Name River Capacity MW Producible GWh
1 Sotuba I Niger 5.4 40
2 Felo I Sénégal 0.6 3
3 Sélingué Sankarani 44 180
4 Manantali Bafing 200 800
Total 244 1023
Source: Direction Nationale de l’Energie, 2006
N˚Name of the site
River or Region
Fall (H) in meters
Estimated Capacity (KW)
1 Seuil de Talo Bani 4,5 2400
2 Seuil de Djenné Bani 2/5 1000
3 Farako 1 Sikasso 7 50
4 Farako 2 Sikasso 15 25
5 Sirakorobougou Sikasso 7 3
6 Mimbougou Sikasso 3 8
7 Woroni Sikasso 60 350
8 Kéniéto Kéniébal/Kayes 90 250
TABLE 9
Potential Sites for Micro Hydro Power Generation
Source: Direction Nationale de l‘Energie, 2006
Direction (˚) 0 30 60 90 120 150 180 210 240 270 300 330
Wind (m/s) 5.3 5.0 5.7 5.8 5.5 4.9 4.8 4.8 5.2 4.6 4.0 5.3
Frequency ( %) 12. 9.6 15.2 10.9 5.6 5.0 8.4 7.2 8.9 6.7 3.8 6.4
TABLE 7
Speed and Frequency of Wind: Series of Measurements in Gao (2003)
Source: Direction Nationale de l’Energie, 2003

MALI
COUNTRY INTRODUCTION Renewable Energies in West Africa 159
5 MARKET RISKS AND BARRIERS
The main risk for the RE market development in Mali is the lack of the enforcement of the existing energy policy. Some merchants with a general license of trade could sell RE tech-nologies without any feedback for maintenance and other services, deserving the image of the energy source and/or technologies. There is no dedicated body for quality control at the borders of the country aiming to select good comparative standards for the market.
Investments in RE in Mali are not easily quantifiable because activities in this field are generally built-in as part of multi sector programs (including issues on health, education and energy), and it is often difficult to precisely evaluate the energy share of these projects. Until now, the most active seg-ment of the solar market is for water pumping which received important support from the CILSS (Inter-states Committee for Fight against the Drought in the Sahel) with funds of the European Union. Domestic” and “Community” segments “(the latter being mainly a market for refrigeration) are not very active compared to physical conditions and/or technical potential.
The segment of the professional energy applications offers many opportunities. However, the energy choice made by the national telecom operator was directed, so far, towards the diesel generators. A private company started at the begin-ning of the 1990s to install 18 solar PV systems (with an aver-age power output of about 2.5 kWp) for telecom relays.
The Code of Investments in Mali established a privi-leged tax system in order to promote the investments of pri-vate (national and foreign) capital for production activities and service deliveries. It offers the necessary guarantee to secure the investments made by the national and foreign op-erators intervening in the exploration, exploitation, convey-ance and refining of liquid or gas hydrocarbons. A survey of entrepreneurs and investors in Mali has identified the stable political climate, safety, costs of various factors (especially labor) and an advantageous tax regime as significant attrac-tions for foreign investors. The survey also emphasized that the institutional reforms and the new regulatory environment were encouraging a climate of trust. Only with respect to the judicial system the survey noted a wish/recommendation for more transparent decision-making processes. This new phase of development presents interesting investment opportunities in specific sectors such as mining, energy, infrastructure and service development (especially in the context of privatiza-tion), and cotton.
Any Malian or foreign corporation or individual may acquire or create a commercial, industrial, or banking and fi-nancial company in Mali. The Constitution guarantees free enterprise and property rights in Mali. There are no specific restrictions on access to various investment areas or on the creation of companies. And Malian legislation does not oblige foreign investors to make the Malian Government or a Malian person or corporation a partner in their companies, except in the mining and petroleum industries, where the Malian Gov-ernment reserves a minority interest of approximately 20 %.
The conditions of approval for the creation of a company are defined in Order 95-159/P-RM dated 12 April 1995. In order to minimize formalities, a structure known as the “Guichet Unique” (“single window concept”) was created by the Direc-tion Nationale des Industries (National Directorate of Indus-tries). The Guichet Unique is under the Ministry of Economy, Industry and Trade and is responsible for informing, advising and assisting investors concerning the procedures they must take. It has four sections: Registration; Manufacturing and Agricultural Activities; Buildings, Public Works and Real Es-tate; and Service Activities.
All areas of activity are covered by the Guichet Unique, except health care, education, communications, audiovisual, print media, purely commercial activities, petroleum and mine prospecting and exploitation, which are governed by other laws. The Guichet Unique is an ideal contact for project promoters, acting as their interface with the administration.
Recently, Mali sped up property registration by decen-tralizing and reorganizing their registries. The country also reformed business start-ups by introducing a single company identification number. Mali has also cut the time for start-up processes. However, the country’s rank is still very low in the “World Bank doing business profile” (166 out of 181 coun-tries). The results are presented in Table 10.
Further information regarding potential investments could be obtained at the “Agence pour la Promotion des In-vestissements au Mali”6.
TABLE 10
Ease of Doing Business Ranking of Mali
Source: World Bank, The Doing Business Project, 2008
6 SEE ALSO WEBSITE OF THE AGENCY: WWW.APIMALI.GOV.ML
SELECTED INDICATORS
Ease of doing business 166
Starting a business 162
Dealing with construction permis 106
Employing workers 94
Registering property 94
Getting credit 145
Protecting invastors 150
Paying t??? 156
Trading across boarders 166
Enforcing contracts 158
Closing a business 114

MALI
COUNTRY INTRODUCTION Renewable Energies in West Africa 160
6 RENEWABLE ENERGY BUSINESS INFORMATION AND CONTACT
TABLE 11
Governmental Institutions
NAME ADDRESS & TEL FIELD OF ACTIVITY EMAIL
Ministry of Energy, Mines and Water Colline de BadalabougouBP 19 Bamako - ex CRES
Policy and general planning(demand and supply)
www.mmee.gov.ml
National Direction of Energy Badalabougou BP 134 Bamako – ex CRES Evaluation of the potential of energyresources and ensuring of their valori-zation
The National Center of Solar Energy andRenewable Energies (CNESOLER)
Badalabougou BP 19 Bamako - ex CRES Research and promotion of RE [email protected]
National Engeneering School (ENI) BP 242 Bamako - Mali Training on energy issues [email protected]
The Malian Agency for the Development ofDomestic Energy and Rural Electrification (AMADER)
Badalabougou BP E 715 Bamako - Mali Household energy substitution programs and access to electricity in rural and peri-urban areas
National Office of Petroleum Products (ONAP) Quartier du fleuve, Bamako Pricing and regulation for petroleum products
National Representative of the Organization for the Valorization of the Senegal River (OMVS)
Zone industrielle-Route de Sotuba - Rue 851 Porte 407 BP E 2618 BAMAKO - MALI
Valorization of the Senegal River in coope-ration with Mali, Mauritania and Senegal
Trust Company of Manantali Energy (SOGEM) ACI 2000 - BP E 4015 BAMAKO - MALI Tel:20298350/20290422
Public corporation of estate created by the member states of the OMVS
Énergie du Mali (EDM-SA) Square Patrice LUMUMBA BP 69 BAMAKO - MALI
Licensee for electricity public service [email protected]/[email protected]
ESKOM Energy Manantali SA (ESKOM) Hyppodrome - Avenue Al Quods - Immeuble Boubacar Koïta - BAMAKO - MALI
Operation and the maintenance of the dam, production and transport of energy of the hydroelectric power station of Manantali
The Malian Agency for Radioprotection (AMARAP) Badalabougou ex – CRES BAMAKO - MALI Pacific use of nuclear energy and protec-tion against harmful ionizing radiations
The National Direction of Geology and Mines (DNGM)
Route de Sotuba, Bamako Tel: +223 221 78 81/Fax: +223 221 02 31
Oil geology, geophysics and exploration/quality control of petroleum products
www.dngm.net
The Commission of Electricity and WaterRegulation (CEWR)
Rue 23/23 B.P. 115 Bamako Regulatory body of the sector of electricity and potable water

MALI
COUNTRY INTRODUCTION Renewable Energies in West Africa 161
TABLE 12
Commercial Partners in the Field of Renewable Energies
Source: Table compiled by the author S. Diallo, 2009 (data from various documents & address books)
NAME ADDRESS & TEL FIELD OF ACTIVITY EMAIL
Ministry of Energy, Mines and Water Colline de Badalabougou BP
19 Bamako- ex CRES
Policy and general planning (demand
and supply)
www.mmee.gov.ml
National Direction of Energy Badalabougou BP 134 Bamako- ex
CRES
Evaluation of the potential of energy
resources and ensuring of their val-
orization
The National Center of Solar Energy and Renew-
able Energies (CNESOLER)
Badalabougou BP 19 Bamako- ex CRES Research and promotion of RE [email protected]
National Engeneering School (ENI) BP 242 Bamako - Mali Training on energy issues [email protected]
The Malian Agency for the Development of
Domestic Energy and Rural Electrification
(AMADER)
Badalabougou BP E 715 Bamako- Mali Household energy substitution
programs and access to electricity in
rural and peri-urban areas
National Office of Petroleum Products (ONAP) Quartier du fleuve, Bamako Pricing and regulation for petroleum
products
National Representative of the Organization for
the Valorization of the Senegal River (OMVS)
Zone industrielle-Route de Sotuba -
Rue 851 Porte 407 BP E 2618 BAMAKO
- MALI
Valorization of the Senegal River in
cooperation with Mali, Mauritania and
Senegal
Trust Company of Manantali Energy (SOGEM) ACI 2000 - BP E 4015 BAMAKO - MALI
Tel:20298350/20290422
Public corporation of estate created
by the member states of the OMVS
Énergie du Mali (EDM-SA) Square Patrice LUMUMBA BP 69
BAMAKO - MALI
Licensee for electricity public service [email protected]/[email protected]
ESKOM Energy Manantali SA (ESKOM) Hyppodrome - Avenue Al Quods - Im-
meuble Boubacar Koïta - BAMAKO
- MALI
Operation and the maintenance of
the dam, production and transport
of energy of the hydroelectric power
station of Manantali
The Malian Agency for Radioprotection (AMARAP) Badalabougou ex – CRES BAMAKO
- MALI
Pacific use of nuclear energy and
protection against harmful ionizing
radiations
The National Direction of Geology and Mines
(DNGM)
Route de Sotuba, Bamako Tel: +223
221 78 81/Fax: +223 221 02 31
Oil geology, geophysics and explora-
tion/quality control of petroleum
products
www.dngm.net
The Commission of Electricity and Water Regula-
tion (CEWR)
Rue 23/23 B.P. 115 Bamako Regulatory body of the sector of
electricity and potable water

MALI
BIBLIOGRAPHY Renewable Energies in West Africa 162
7 BIBLIOGRAPHY
Direction Nationale de l’Energie (2006): Sites de Microcentrales.
ECOWAS, EMUWA (2004). Country Profile Mali: Access to the energy services in rural and peri-urban area to achieve the Millennium Development Goals.
Energie du Mali-SA (2002-2007): Rapports annuels. GTZ (2004): Wind energy in Mali. Feasibility study (WWW.GTZ.DE/DE/DOKUMENTE/EN-WINDEN-ERGY-MALI-FEASIBILITY-STUDY-GAO-2004.PDF)
L’Observatoire des énergies renouvelables (2008): www.energies-renouvelables.org.
Malian Agency for Domestic Energies and Rural Elec-trification - AMADER (2004/2005): Textes de creation, manuel de procedures de l’AMADER.
Ministry of Energy, Mines and Water (2006): Document de politique énergétique.
Ministry of Energy, Mines and Water/Direction of Energy (2005): Multisector Committee of follow-up of the Euro-pean Initiative.
Ministry of Finance/Project Coordinating Unit (2004): Annual Report of First Year implementation of the Strate-gic Framework of Fight against Poverty, CSLP.
Ministry of Finance (2003): Ex-post evaluation Report on the results obtained within the framework of programs FASR/FRPC of the IMF.
Ministry of National Education of Mali (2000): Document of the „Decennial Education Project (PRODEC).
Ministry of Public Health: Document of the „Decennial Health Project (PRODES)“.
NASA (2008): Surface Meteorology and solar Energy Data Set (http://eosweb.larc.nasa.gov/sse).
National Center for Solar and Renewable Energies (CNE-SOLER)/UNDP Country Office Mali (2001): Reinforce-ment of the role of women in the promotion of Renewable energies/Impact studies on new and renewable energy technologies.
Office National des Produits Petroliers (2008): Structure indicative des Prix des Carburants.
Office National des Produits Pétroliers (2008): Valeurs en douane des produits pétroliers au titre des importations.
Plan National d’accès à l’Eau potable – PNAEP 2004-2015.
UEMOA (2007): Rapport du Comité de Convergence. UNCTAD (2001): An Investment Guide to MALI: Opportunities and Conditions.
UNDP Country Office Mali (2002): Project Document titled „Adoption of New and Renewable Energies on broad scale in Mali.
UNDP Country Office Mali (2004): Report of Follow-up of Implementation of the Millennium Development Goals (MDGs).
UNDP/Project PTF (2004): Improve living conditions in rural areas through access to energy/A review of the multi-purpose platform in Mali.

8 ANNEX
MALI
ANNEX Renewable Energies in West Africa 163
VOLUME OF PETROLEUM PRODUCTS IMPORTED IN MALI (TONS)
2001 2002 2003 2004 2005 2006 2007
Petrol 99.339 105.455 94.818 103.729 103.472 102.726 117.664
Kerosene 45.027 44.396 28.763 36.166 31.267 31.650 16.129
Jet A1 24.494 21.114 20.319 19.758 23.875 20.245 21.790
Diesel 268.180 277.668 21.6066 239.533 354.467 410.356 405.769
Full Oil 98.820 57.126 110.987 121.275 40.378 36.369 52.721
TABLE 13
Evolution of Petroleum Imports (2001–2007)
Source: Graph compiled by the author S.Diallo, Data from ONAP, 2008

COUNTRY CHAPTER:
MAURITANIA
Author of Country Chapter Mohamed Elhacen Ould Khouna(Dipl. Eng.)revised version by Louis Seck (MSc., DEA, MBA)
Coordination and Review of the Country ChapterAnton Hofer, (MSE, Dipl.-Ing./FH, M.A.)WIP-Renewable Energies www.wip-munich.deMunich, Germany
Editor Deutsche Gesellschaft für Technische Zusammenarbeit (GTZ) GmbHDepartment Water, Energy, TransportDag-Hammarskjöld-Weg 1-565760 Eschborn, Germanywww.gtz.de
On behalf of Federal Ministry for Economic Cooperation and Development (BMZ)
Editorial staffDiana KraftTel: +49 (0)6196 79 4101Fax: +49 (0)6196 79 80 4101Email: [email protected]
Renewable Energies in West Africa 164

CONTENTS MAURITANIA
ACRONYMS, ABBREVIATIONS AND MEASUREMENTS 166
SUMMARY 168
1 COUNTRY INTRODUCTION 169 1.1 Geography and Climatic Conditions 169 1.2 Political, Economic and Socio-economic Conditions 169
2 ENERGY MARKET IN MAURITANIA 170 2.1 Overview of the Energy Situation 170 2.2 Energy Capacities, Production, Consumption and Prices 170 2.3 Market Actors and Regulation Structures 171
3 POLICY FRAMEWORK FOR RENEWABLE ENERGIES 172 3.1 Policies, Strategies and Programs for Renewable Energy Promotion 172 3.2 Regulations, Incentives and Legislative Framework Conditions 172
4 STATUS AND POTENTIAL FOR RENEWABLE ENERGIES 172 4.1 Biomass/Biogas 172 4.2 Solar Energy 172 4.3 Wind Power 172 4.4 Hydro Power 173
5 MARKET RISKS AND BARRIERS 174
6 RENEWABLE ENERGY BUSINESS INFORMATION AND CONTACTS 174
7 BIBLIOGRAPHY 175
Renewable Energies in West Africa 165CONTENTS
MAURITANIA

ACRONYMS AND ABBREVIATIONS MAURITANIA
ADER Agence du Électrification Rural (Rural Electrification Agency)
ARM Agence de Régulation Multisectoriel (Multisector Regulation Agency)
AU African Union
CFPT Centre de Formation Professionnel et Technique (Center for Professional and Techical Training)
CSLP Cadre Stratégique de Lutte Contre la Pauvreté (The Strategic Framework of Fight against Poverty)
DRSP Document de la Stratégie de Réduction de la Pauvreté (Poverty Reduction Strategy Paper)
EAM Enquête Auprès des Ménages (Census of households)
ECOWAS Economic Community Of West African States
EEC European Economic Community
EPCV Enquête Permanente sur les Conditions de Vie des Ménages
(The Permanent Investigations into the Living Conditions of Households)
ESAF Enhanced Structural Adjustment Facility
FLM Federation Lutherans Mondale (Lutheran World Federation)
FOB Free One Board
GDP Gross Domestic Product
GRET Groupe de Recherche et d’Échanges Technologiques (Research Groupe on Technolgy Exchange)
IPPTE Initiative en Faveur des Pays Pauvres Très Endettés (Initiative of the Heavily in Debt Poor Countries)
IMF International Monetary Fund
IPP Independent Power Producer
LPG Liquified Petroleum Gas
MDG Millinium Developement Goal
MEP Ministry of Energy and Power
MTEF Medium Term Expenditure Framework
NTIC New Technologies of Information and Communication
PREDAS Programme Régional de Promotion des Énergies Domestiques et Alternatives au Sahel
(Regional Programme for the Promotion of Domestic and Alternative Energies of the Sahel Region)
PRS Programme Régional Solaire (Regional Solar Programme)
PRSP Poverty Reduction Strategy Paper
PSAE Projet d’Énergie Solaire Photovoltaïque (Project of Photovoltaic Solar Energy)
RE Renewable Energy
RPTES Regional Program for the Traditional Energy Sector
SHS Système Solaire Photovoltaïque (Solar Home Systeme)
SNDE Société Nationale Des Eaux (National Water Society)
SOMAGAZ Société Mauritanienne des Gaz (The Mauritanian Gas Company)
SOMELEC Société Mauritanienne d’Électricité (state owned national power company)
TER Technologie d’Energie Renouvelable (Renewable Energy Technology)
UNDP United Nations Development Programme
USD United States Dollar
WAEMU West African Economic and Monetary Union
Renewable Energies in West Africa 166ACRONYMS, ABBREVIATIONS AND MEASUREMENTS
MAURITANIA

Renewable Energies in West Africa 167ACRONYMS, ABBREVIATIONS AND MEASUREMENTS
MAURITANIA
MEASUREMENTS
GWh gigawatt hour (1 GWh = 1,000,000 Kilowatt hours (kWh))
kg kilogramm
km² square kilometer
ktoe kilotons of oil equivalent ( = 1,000 toe)
kWh kilowatt hour
kV kilovolt
m/s meters per second
m³ cubic meter
mm millimeters
Mtoe million tons of oil equivalent (1 Mtoe = 1,000,000 tons of oil equivalent)
MW megawatt (1 MW = 1,000 kW)
toe tons of oil equivalent
ºC degree Celsius

SUMMARY
The Country Study of Mauritania is to provide an overview of the country’s energy market and to support decision-making for private investments for the Renewable Energy (RE) sector in Mauritania. The study is structured as follows:
Chapter one provides Background Information on Mauritania. This includes an overview of geographical and climatic condi-tions, as well as the most important facts in view of political, economic and socio-economic conditions of Mauritania.
Chapter two summarizes facts and figures of Mauritania’s Energy Market including stakeholders and market actors in-volved as well as sector related regulations.
Chapter three presents the currently existing Political Frame-work for Renewable Energies in Mauritania. This includes an overview of support mechanisms mainly for PV as well as already existing regulations, incentives and legislative frame-work conditions also for other RE technologies.
Chapter four provides a brief overview of the Status Quo and Potential for Renewable Energies in Mauritania.
Chapter five summarizes the existing and potential Market Risks and Barriers in general with focus on RE.
Chapter six presents a compilation of the most relevant Re-newable Energy Business Information and Contacts of Mau-ritania
Renewable Energies in West AfricaSUMMARY 168
MAURITANIA

1 COUNTRY INTRODUCTION
1.1 GEOGRAPHY AND CLIMATIC CONDITIONSMauritania is located in the Sahara Desert belt of West Africa and shares borders with Morocco, Algeria, Mali and Senegal. The capital city and major port is Nouakchott, other major cities are Kaedi and Zouerate and the port of Nouadhibou. The country has a total area of 1,030,700 km² and possesses a 700 km Atlantic coastline; approximately 75 % of Mauritania is desert or semi-desert area. Due to the desert in the North and the Sahelien in the South, the climate of Mauritania is characterized by a continuous regression of precipitations, which shows great interannual variations that can exceed an 80 % deficit as compared to the normal.
The climate is generally hot and dry with mild and short winters (3 months). Rainfall varies between less than 50 mm in North and more than 450 mm in the South (see the chart of the isohyets for the period of 1961 to 1990 above). In most areas, the temperatures often exceed 40 °C during the hot season. The coercive and random climatic conditions are likely to predispose the country with the instability and the degradation of the natural resources.
1.2 POLITICAL, ECONOMIC AND SOCIO-ECONOMIC CONDITIONS
The Constitution of the Islamic Republic of Mauritania was approved of in 1991, providing for a multi-party system with an elected president, comparable to the French presidential model. The national economy is dominated by animal breed-ing, agriculture, fishing and mining activities. Mauritania’s major export industries are iron ore, fish and fish products, while it’s most important imports are machinery and equip-ment, petroleum products, capital goods, food and some con-sumer goods. Mauritania has only limited agrarian resources, but the country has remarkable mineral deposits of iron, cop-per and gold. Some crude oil reserves were discovered in vari-ous offshore oil fields in 2001.
Renewable Energies in West Africa 169
MAURITANIA
COUNTRY INTRODUCTION
The majority of Mauritania’s population still depends on agriculture and livestock, even though most of the rural in-habitants were forced into the cities by recurrent droughts in the 1970s and 1980s. In recent years, drought and economic mismanagement have resulted in a build-up of foreign debt. In March 1999, the Government signed an agreement with a joint World Bank – International Monetary Fund (IMF) mission on a USD 54 million Enhanced Structural Adjust-ment Facility (ESAF). The economic objectives have been set for 1999–2002. Privatization remains one of the key issues. Mauritania is unlikely to meet ESAF‘s annual GDP growth objectives of 4–5 %.
Mauritania has transformed from a country with limited economic base and poor social indicators to a highly urbanized and increasingly market-driven economy. How-ever, the rural sector still employs about 40 % of the labor force. Due to the recent stabilization and new revenues, the per capita income was about USD 938 in 2007. The average economic growth of Mauritania was 4.8 % between 2001 and 2004, reaching 5.4 % in 2005 and increasing to 11.4 % in 2006, mainly due to the start of oil production (non-oil GDP growth was 4.1 %).
Besides existing natural resources, the economic growth was mainly accomplished by the expansion of the secondary and tertiary sectors of the economy. The national economy, however, still suffers from high costs, underdevel-oped financial markets, low human resources and lack of ap-propriate infrastructures. Despite the recent socio-economic progress, Mauritania ranked at position 137 (out of 177 coun-tries) in the Human Development Index (HDI) of 20081.Since 1994, several programs and strategies of fight against poverty have been implemented. The Strategic Framework of Fight against Poverty (CSLP) worked out by the Mauritani-an Government in 2000 summarizes the main trends and is based on interdependent sector strategies. As a matter of fact, the strategy of fight against poverty consists of four major ob-jectives: (i) the acceleration of the economic growth and its 1 UNDP, 2008
2 ÉNERGIE ET PAUVRETÉ, TAMCHIR THIAM, 2004
Bîr Mohghrein
Zouérat
Tidjikdja
Kiffa NémaBogué
Kaédi
Rosso
Nouâdhibou
Atâr
S A H A R A
0
0 100
100 200 km
200 ml
NOUAKCHOTT
MAP OF MAURITANIA

Renewable Energies in West Africa
MAURITANIA
COUNTRY INTRODUCTION
2.2 ENERGY CAPACITIES, PRODUCTION, CONSUMPTION AND PRICES
Electricity SectorBetween 1960 and 1997, the country’s total installed and operating electricity-generating capacity was about 130 MW from 13 power stations all over the country driven by die-sel engine generator units. In 2009, the state owned national power company (SOMELEC) evaluated the current total in-stalled capacity excluding auto-producers (mining, industrial and commercial) at about 200 MW of which 49 MW are lo-cated in Nouakchott.
SOMELEC is exclusively responsible for the distribu-tion and commercialization of electricity in Mauritania. The company manages the electric utilities in 20 urban centers with a total capacity of 93.6 MW (against 75 MW in 2005) and 18 power stations in the center of the country. The net production is 402 GWh in 2006 (against 374 GWh in 2005). Due to the high demand for energy, total consumption ex-ceeds the national energy production with about 35–39 %. In 2000, the per capita electrical energy consumption was 190 kWh. Consumption increased to 320 kWh in 2002 and decreased gradually to 190 kWh in 2006. Even though there are several self-sufficient energy producers in the country (with an estimated capacity of 40 MW), the majority of min-ing companies, industrial, commercial and domestic consum-ers continue to be customers of SOMELEC.
The continuous decline of electricity generation by SOMELEC in Mauritania towards the end of 2007 can be explained by the appearance of Independent Power Producers (IPP) in the country. Moreover, the currently installed capaci-ties are not sufficient to meet the national demand, and some production capacities are not interconnected. Concerning the overall electrification rate, the proportion of the households connected to the electric network passed from 22 % in 2000 to 24 % in 2004 (with a rate of 47 % in wealthy areas). At the national level, the principal source of lighting for households remains nevertheless the torch, (51.2 %), while in urban areas 57.6 % of the households used electricity in 2004 (as com-pared to 49 % in 2000). In the capital of Nouatchott, this rate reaches 62.5 %, whereas it amounts to 64.6 % for Nouadhi-bou and more than 89.1 % for Zouerate.
The electricity provided by the SOMELEC is currently sold according to an official price fixed on 1 January 2002 by the Government (Multisector Regulation Agency (ARM). Ta-ble 2 presents the pricing structure of electricity in Mauritania. The Government of Mauritania intends to diversify the elec-tricity production and plans to set up appropriate regulations (technical issues and feed-in tariffs) for electricity from RE.
anchoring in the sphere of the poor; (ii) the development of human resources; (iii) the expansion of the basic services and (iv)the promotion of an institutional development and good governance.
2 ENERGY MARKET IN MAURITANIA
2.1 OVERVIEW OF THE ENERGY SITUATIONBased on figures of the Cellule de Contrôle de l’Énergie, the per capita energy consumption in Mauritania is estimated at 0.3 toe (0.17 toe without biomass) and 190 kWh of electricity. The energy balance of the Mauritania is composed of about 67 % of biomass (firewood and charcoal), followed by various petroleum products (33 %). The detailed energy consumption figures are presented in Table 1.
According to various investigations made from 1990 by the Regional Program for the Traditional Energy Sector (RPTES), the dominance of wood fuel (firewood and char-coal) was evident in the national energy balance. The wood energy (firewood and charcoal) accounted for 93 % in meet-ing the needs of cooking in households and more than 50 % in final energy consumption in the residential sector (59.5 % for charcoal and 27.5 % for firewood) against 9 % for butane gas, 3.4 % for electricity and 0.4 % for kerosene and for insignifi-cant traces of RE such as solar and wind power2.
The energy sector of Mauritania is characterized by an increasingly significant demand for domestic energy. The total consumption is more than the energy produced due to the high need of consumption of electricity in various sectors, which are estimated at 35–39 %. The energy sector is divided in three parts, i. e. the electricity sector, the petroleum sector and the biomass sector.
TABLE 1
Energy Consumption in Mauritania
PRODUCT CONSUMPTION (ktoe)
Gasoline 47.566
Jet fuel 79.054
Fuel oil 23.260
Gas oil 446.124
LPG 30.0866
Kerosene 13.650
Total consumption – petroleum products 626.228
Firewood 902.8
Charcoal 361.120
Total consumption – biomass 1,263.392
Total energy consumption 1,890.148
Source: Cellule de Contrôle de l’Énergie (reviewed by the author), as of 2004
CONSUMPTION KWH/MONTH FIXED COSTS/MONTH PRICE/ KWH
Up to 25 1.850 Euro 0.137 Euro
Between 25 and 120 4.550 Euro 0.213 Euro
More than 120 20.100 Euro 0.237 Euro
TABLE 2
Electricity Prices
Source: M. Ahmedou Ould Mohamed Mahmoud, Chef de Service ADER, Dakar Workshop on CDM, as of 2009
170

Renewable Energies in West Africa 171
MAURITANIA
COUNTRY INTRODUCTION
Petroleum SectorDue to recent discoveries of oil resources, Mauritania is re-ceiving increased international attention as a new player in the global oil industry. First supplies from the Chinguetti field started to flow in 2006, followed by the conducting of suc-cessful offshore explorations. Up to now however, the energy consumption of petroleum products is mainly covered by im-ported fuels.
In 2004, the utilization of LPG for cooking purposes reached a total of 35 %. Even though there was an increase of about 7 % (compared to 2000), the difference is still consider-able between the different social strata. In urban areas, about 62.8 % of the households are cooking with LPG as compared to only 16.2 % of the households in rural areas. Kerosene is mainly used for lighting purposes. The consumption, how-ever, remains more or less static due to the extension of the electrical network and the existence of other energy sources for lighting purposes. Table 3 presents the evolution of energy consumption by type of fuel. Figure 2 visualizes the figures.
According to Ordinance No. 2002–20053 of 28 March 2002, Mauritania’s prices for petroleum products are set by the individual distribution companies according to their ac-
tual economic costs. The liberalization of prices, the infor-mation requirements of users faced by distribution companies and the information to be regularly communicated to the competent authorities and to the National Commission of Hydrocarbons is specified by decree on the proposal of the Ministry of Energy and Power (MEP). As specified in Article 21, the National Commission of Hydrocarbons is in charge of monitoring the market prices on the basis of a determination system. This ensures free competition, high quality and just service standards as well as a market with fair prices and the protection of customers.
The selling price of LPG is fixed by a joint decree of the Ministries of Energy and Power and the Ministry for Trade and Industry (MTI). Since 1987, the price is given on the basis of quotation FOB (Free One Board) of the interna-tional market. The elements of the price are fixed by decree N 089.118 of 6 September 1989. In theory, the price for LPG is fixed every month according to the fluctuation of spot mar-ket prices; the prices, however, have not been modified since 18 July 2001. Table 4 presents an overview of current prices for petroleum products.
PRODUCT 1995 1996 1997 1998 1999 2000 2001 2002 2003 2004
Gasoline 42.16 41.66 38.33 37.90 33.63 26.18 23.31 27.40 26.61 27.98
Jet fuel 60.02 61.31 85.52 87.48 89.12 87.20 81.77 76.86 76.51 75.29
Kerosene 12.17 15.22 15.76 17.41 19.15 20.63 20.31 20.09 22.95 24.23
Diesel 207.34 220.90 214.78 206.48 210.57 228.64 258.52 280.26 290.49 318.66
LPG 13.99 16.76 17.03 14.76 19.07 17.84 18.72 20.72 22.58 26.62
TABLE 3
Consumption of Petroleum Products (10³ metric tons)
Source: Direction de l’Approvisionnement, Ministère Chargé de l’Énergie, as of 2006
PRODUCT PRICE
Gasoline 0.676 Euro/liter
Diesel 0.594 Euro/liter
Kerosene 0.119 Euro/liter
LPG 12.196 Euro/38 kg bottle
4.013 Euro/12.5 kg bottle
1.700 Euro/6 kg bottle
0.724 Euro/2.5 kg bottle
TABLE 4
Price of Petroleum Products
Source: market research by the author, as of 2009
3 DROIT AFRIQUE, 2005
FIGURE 2
Consumption of Petroleum Products (103 metric tons)
Source: Direction Provisioning, Ministry of Energy, as of 2006
0
500
300
100
400
200
50
150
250
350
450
1996 1997 1998 1999 2000 2001 20021995 2003 2004
total
LPG
diesel
gasoline
kerosene
jet fuel

Renewable Energies in West Africa 172
MAURITANIA
COUNTRY INTRODUCTION
Biomass sectorWood remains the first source of energy for cooking purpos-es with a total of about 44.6 %, while charcoal accounts for about 19.1 %. Table 5 and Figure 3 present an overview of consumption figures.
The prices of firewood and charcoal are freely deter-mined by the market. The MEP and the MTI, however, have fixed the general price structure. The most recent price struc-ture with the final selling price is presented in Table 6.
2.3 MARKET ACTORS AND REGULATION STRUCTURESThe Ministry of Energy and Power (MEP) is the governmental authority in charge of the energy and water sector. Its man-date includes dedicated policy formulation as well as sector planning and coordination. The MEP focuses on the electric power supply, including RE matters like Hydro Power, solar and wind energy.
The Ministry of Agriculture (MA) is in charge of all biomass issues (plant as well as animal derived matter) with special focus on wood. The overall market for petroleum products is coordinated by the Ministry of Trade and In-dustry (MTI) with participation of the Ministry of Finance (MF) playing a significant role in the import and storage of petroleum products. The ongoing and planned oil exploration and extraction is part of the responsibility of a Presidential Petroleum Commission. The Ministry of Mineral Resources (MMR) deals with the exploitation of minerals.
It is interesting to note that the special duties of every ministry are listed in the 2001 Local Government Regula-tions. For the MEP, however, only the specific fields of “rural water supply”, “community ownership of wells”, “bulk sup-ply of water” (except where privatized) and “sanitation” are considered and listed. There is no specific focus on energy and electricity provision for local communities under these regula-tions.
SOMELEC is the monopoly supplier of electricity in Mauritania. The company is exclusively responsible for power generation, transmission, distribution and supply in Mauri-tania.
PRODUCT 1995 1996 1997 1998 1999 2000 2001 2002 2003 2004
Firewood 348.8 340.0 326.9 312.0 296.9 284.0 270.9 252.6 240.6 225.7
Charcoal 72.5 74.9 78.8 82.4 86.9 89.9 90.5 95.2 97.8 98.6
TABLE 5
Consumption of Firewood and Charcoal (103 metric tons)
Source: Direction of Environment, as of 2008
PRICE ELEMENT EURO/kg
Forest tax 0.0042
Communal tax 0.0004
Remuneration of the 0.0200
Loading 0.0022
Transport 0.0150
Renewal bag 0.0010
Unloading 0.0009
Tax placing on tip 0.0004
Stroke owner 0.0430
Stroke wholesaler 0.0220
Price returned deposit 0.1090
Conditioning 0.0135
Remuneration of the retailer 0.0354
Final selling price 0.2670
TABLE 6
Price Structure of Firewood and Charcoal
Source: Direction of Environment, as of 2008
FIGURE 3
Consumption of Firewood and Charcoal
Source: Direction of Environment, as of 2008
firewood
charcoal
0
300
100
400
200
50
150
250
350
1996 1997 1998 1999 2000 2001 20021995 2003 2004

Renewable Energies in West Africa 173
MAURITANIA
COUNTRY INTRODUCTION
3 POLICY FRAMEWORK FOR RENEWABLE ENERGIES
3.1 POLICIES, STRATEGIES AND PROGRAMS FOR RENEWABLE ENERGY PROMOTION
Up to now, there is no adequate set of policy instruments to address the specific energy issues in Mauritania. The following overview presents the facts and figures available.
In 2001, the World Bank provided a dedicated fund-ing to Mauritania to be used for the formulation of a national energy policy. Furthermore, the Government of Mauritania adopted a law that is to open up the electricity market for broad competition. Another action was the release of the first Poverty Reduction Strategy Paper (PRSP) for the period of 2005–2007. Its objective is to strengthen the energy sector and to expand the access to modern energy services while im-proving the overall supply reliability. The draft energy policy document of Mauritania aims to provide an electricity access rate of 35 % for the country’s entire population by 2015. In view of RE, the key elements pointed out are:
Establishment of appropriate institutions in order to man-age the RE sector
Consideration of tax reduction for RE equipment Investments in and promotion of national production of RE technologies
In order to successfully reach these goals, it will be necessary to facilitate adequate financing schemes for RE by establish-ing sustainable financing mechanisms. Furthermore, it is necessary to establish appropriate norms, codes of practice, guidelines and standards for the overall RE sector.
Today, the Government of Mauritania is in the proc-ess of building a set of policies and strategies for the promo-tion of RE. The regulatory and legislative frameworks need to facilitate rural electrification with strong contribution from RE. This reconstruction process is currently being developed. The main targets are to increase the rural electrification rate from 3 % in 2001 to 40 % in 2020. Furthermore, the contri-bution of RE to the national energy mix is to be increased to 15 % in 2015 and 20 % in 2020.
3.2 REGULATIONS, INCENTIVES AND LEGISLATIVE FRAMEWORK CONDITIONS
As already mentioned, the focus within the electricity sec-tor is the increase of the rural electrification rate. Up to now, only about 1 % of the rural population has access to electric-ity mainly coming from fossil energy. The rural electrification framework of Mauritania is regulated by the MEP, the Regu-latory Authority, the Agency for the Promotion of Universal Access to Regulated Services and the Rural Electrification Development Agency. While the MEP determines the sector development policy including standards and decentralized electrification strategy, the Regulatory Authority prepares re-lated laws and regulations. Furthermore, it provides licenses and amends proposals on the regulatory authority. The Rural Electrification Development Agency deals with programs and
investment incentives for rural electrification. Recently, Mau-ritania joined the International Renewable Energy Agency (IRENA).
4 STATUS AND POTENTIAL FOR RENEWABLE ENERGIES
4.1 BIOMASS/BIOGASIn general, Mauritania offers a broad variety of biomass re-sources. Formerly, about 556,000 tons of crop waste (rice husk, rice straw, etc.) were produced annually and offered an energy potential of about 3.7 GWh. Due to the ten year civil war (1991–2001) and the drastic interruption of the coun-try’s agricultural output, these former estimates are not valid anymore and therefore need to be revised for a more accurate assessment of the energy potential of crop wastes. In 2006, the Direction of Energy presented figures that estimate the available land area to 3.5 million hectares (3.5 % of the overall territory), leading to a total output of about 100,000 m³.
4.2 SOLAR ENERGYThe solar energy potential of Mauritania is significant and offers around 4 to 6 kWh/m²/day with an average sunshine duration of 8 hours per day. Up to now, there is no detailed assessment of existing solar energy installations in Mauritania. Due to the significant solar energy potential, the implementation of PV in-stallations is highly promising. Table 7 presents an overview of the available solar energy potential at different sites.
4.3 WIND POWERAccording to data of the National Company of Meteorology of Mauritania, the wind potential of Mauritania is considerable, with an annual average of 5–8 m/s. A study of potential wind energy production capacities was conducted by the Depart-ment of Energy and the Electric Alizés project. Results show that two areas offer very high wind energy potential (Noua-dhibou and the Marine Band Trarza between Nouakchott and the Senegal River) with wind speeds of more than 7 m/s. Another promising area for wind energy is located around the eastern border of Mauritania, offering average wind speeds of 6 m/s. As for the rest of the country, the average wind speed is around 3 m/s. In general, Mauritania offers a significant potential for small and medium wind power installations, es-pecially in rural areas and in the North of the country.
4.4 HYDRO POWERThe hydroelectric network ensures an interconnection of the regional network of the Manantali dam that has been supply-ing the major cities of the valley (Rosso, Boghé and Kaédi) and the town of Nouakchott since 2002. The Manatali Hydro Power project was completed in 2003 and comprises of a 200 MW power station and a network of 1,300 km connecting the capitals of Mali, Mauritania and Senegal.

Renewable Energies in West Africa 174
MAURITANIA
COUNTRY INTRODUCTION
5 MARKET RISKS AND BARRIERS
The lack of adequate policies and an appropriate legal and regulatory framework are the most significant barriers for the broad implementation or RE and the increased electricity ac-cess rate. Up to now, there is no energy policy that allows and supports private sector investments in the energy sector in general and RE in particular. The existing uncertainties for potential investors strongly ask for a commitment of the Government to liberalize the overall power sector of Maurita-nia. Some of the issues relating to the development of entre-
preneurship for rural electricity supply and grid connection projects remain totally unclear.Another critical barrier is the lack of financing and funding mechanisms. Up to now, there is only very little interest in the exploitation of RE, as funding and collaboration is one of the main challenges. Operators and investors wanting to get involved in the sector have often abandoned their activities because of the lack of sufficient support mechanisms.
NOUAKCHOTT ATARBIR-MORGHREIN KIFFA NEMA NOUADHIBOU TIDJIKJ MINIMUM MAXIMUM AVERAGE
January 4.61 4.56 4.01 4.88 4.88 4.36 4.71 4.01 4.88 4.57
February 5.21 5.23 4.89 5.59 5.60 5.01 5.41 4.89 5.60 5.28
March 5.91 6.02 5.80 5.47 5.97 5.80 6.12 5.47 6.12 5.87
April 6.45 6.62 6.61 6.37 6.37 6.19 6.65 6.19 6.65 6.47
May 6.38 6.73 6.86 5.90 5.90 6.24 6.48 5.90 6.86 6.36
June 6.04 6.58 6.87 5.84 5.84 6.19 5.96 5.84 6.87 6.19
July 5.91 6.48 6.59 6.11 6.11 5.71 6.43 5.71 6.59 6.19
August 5.81 6.22 6.31 6.04 6.04 5.83 6.25 5.81 6.31 6.07
September 5.71 5.55 5.76 5.82 5.82 5.50 5.82 5.50 5.82 5.71
October 5.12 5.07 5.61 5.88 5.88 4.93 5.43 4.93 5.88 5.42
November 4.78 4.65 4.17 4.89 4.89 4.40 4.76 4.17 4.89 4.65
December 4.51 4.31 3.93 4.71 4.71 4.17 4.53 3.93 4.71 4.41
Minimum 4.51 4.31 3.93 4.71 4.71 4.17 4.53 3.93 4.71 4.41
Maximum 6.45 6.73 6.87 6.37 6.37 6.24 6.65 6.24 6.87 6.53
Average 5.54 5.67 5.62 5.63 5.67 5.36 5.71 5.36 5.71 5.60
TABLE 7
Solar Energy Potential (kWh/m²/day)
Source: SEMIS, as of 2003/2004
INSTITUTION PROFILE CONTACT
Ministry of Energy and Petrol (MEP) Electricity sector policy formulation, planning and coordination
BP 335 NouakchottPhone: +222 5252699
Ministry of Economic Affairs and Development
Economic affairs and development sector policy formulation, planning and coordination
BP 238, NouakchottPhone: +222 5290435
Ministry of Finance Sector policy formulation, planning and coordination BP 197, NouakchottPhone: +222 5253080
Ministry of Rural Development and Environment
Rural development and environment policy formulation, planning and coordination
BP 333, NouakchottPhone: +222 5251500
Ministry of Equipment and Transport Policy formulation, planning and coordination of the transport sector
BP 237, NouakchottPhone: +222 5255640
Ministry of Mining and Industry Policies, planning and coordination of the mining and industry sector
BP 199, NouakchottPhone: +222 5253582
Société Mauritanienne de l�Électricité(SOMELEC)
National company for water and electricity supply BP 335, NouakchottPhone: +222 5256783
TABLE 8
Relevant Institutions in Mauritania
6 RENEWABLE ENERGY BUSINESS INFORMATION AND CONTACTS

Renewable Energies in West Africa 175
MAURITANIA
BIBLIOGRAPHY
7 BIBLIOGRAPHY
APERE (2003/2004): Développement des Énergies Renouvelables en Mauritanie, renouvelle no8 6–7, 4e trimestre 2003 – 1er trimestre 2004 (www.apere.org/doc/0608-ER_mauritanie.pdf)
Cellule de Contrôle de l’Énergie (2004): various data reviewed by author
CIA – Central Intelligence Agency (2009): World Fact Book (www.cia.gov/library/publications/the-world-factbook)
CIE (2007): Les Énergies Renouvelables en Mauritanie République de Maurétanie (2001): Code de l‘Électricité 25/01/2001 Loi no 2001 – 19/ Portant 2001
Direction de l’Approvisionnement, Ministère en Chargé de l’Energie (2006): various publications (www.mauritania.mr/fr/index.php?niveau=6&coderub=4&codsoussous=124&codesousrub=9&codsoussous1=145)
Direction of Environment (2008): various publications (www.mauritania.mr/fr/index.php?niveau=6&coderub=4&codsoussous=124&codesousrub=9&codsoussous1=138)
Droit Afrique (2005): Mauretanie (WWW.DROIT-AFRI-QUE.COM/IMAGES/TExTES/MAURITAnIE/MAU-RITAnIE)
%20-%20PETROLE%20AVAL.PD N. N. (1999–2002): Document Tallies of Economic Policy of Universal Access
Fall Mamadou (2002): SEMIS – Traditional Energy Use in the Sahel in ESI Africa
FAO (without year): FOSA Document National de Pro-spective, par la FAO, Département des Forêts (www.fao.org/docrep/004/ab591f/AB591F09.htm)
Government of IRM (2002): Letter of Intent, Memoran-dum of Economic and Financial Policies, and Technical Memorandum of Understanding – IMF
Helimax Energie Inc (2004): Strategic Study of Wind Energy Deployment in Africa – Strategic Plan for Wind Energy Deployment in Africa (Executive Summary)
IMF (2007): Poverty Reduction Strategy Paper, January 2007, IMF Country Report No. 07/40
IMF (2003): Poverty Reduction Strategy Paper Progress Report, IMF, Country Report No.03/316
IMF (2002): Mauritania. Letter of Intent, Memorandum of Economic and Financial Policies and Technical Memo-randum of Understanding published by International Monetary Fund
Institut de l’Énergie et de l’Environnement de la Franco-phonie – IEPF (2006): various publications (www.iepf.org/ressources/ressources.php)
Islamic Republic of Mauritania (2002): Poverty Reduction Strategy Paper Implementation Report
Kazadi Beneki TSHIBINGU (2004): Eskom Energie Man-antali Presentation to NARUC
Ministry of Water and Energy (2004): Sustainable Energy Management Program
Ministère des Affaires Economiques et du Développement (2006): Rapport sur la Mise en Œuvre du Programme d‘Action de Bruxelles (2001–2010) en Faveur de Pays les Moins Avancés (PMA)
SEMIS (2003/2004): Plan d’Investissement pour l’Électrification Rurale en Mauritanie
SOMELEC (2005): Statistiques de Consommation Énergétique de SOMELEC
SOMELEC (2003): Coût des Facteurs de Production MAED
N. N. (2003): Synthetic Note on the Strategy of Universal Access to the Basic Services in 2003
UNCTAD (2006): Least Developed Countries Report 2006. Part II Chapter 5
UNDP (2005): Human Development Report 2005 – In-ternational Cooperation at a Crossroad. Aid, Trade and Security in an Unequal World, United Nations, New York
UNDP/International Institute for Sustainable Develop-ment (2005): Connecting Poverty and Ecosystem Services: Focus on Mauritania
UNDP (2008): Human Development Index 2008 (HTTP://HDR.UnDP.ORG/En/STATISTICS)
UNFPA (2005): State of World Population 2005 – The Promise of Equality. Gender, Equity, Reproductive Health and the Millennium Development Goals
UNIDO: Les Énergies Renouvelables et le MDP en Mau-ritanie:
(www.unido.org/fileadmin/import/ 42703_Mauritanie.pdf).
US Department of State (2006): Background Note Mau-ritania
World Bank: Mauritania Power and Water Sector Re-form – Technical Assistance Project Vol. 1

COUNTRY CHAPTER:
NIGERAuthor of Country Chapter Safiatou Alzouma (MSc. Eng.)
Coordination and Review of the Country ChapterAnton Hofer, (MSE, Dipl.-Ing./FH, M.A.)WIP-Renewable Energies www.wip-munich.deMunich, Germany
Editor Deutsche Gesellschaft für Technische Zusammenarbeit (GTZ) GmbHDepartment Water, Energy, TransportDag-Hammarskjöld-Weg 1-565760 Eschborn, Germanywww.gtz.de
On behalf of Federal Ministry for Economic Cooperation and Development (BMZ)
Editorial staffDiana KraftTel: +49 (0)6196 79 4101Fax: +49 (0)6196 79 80 4101Email: [email protected]
Renewable Energies in West Africa 176

CONTENTS NIGER
ACRONYMS, ABBREVIATIONS AND MEASUREMENTS 178
SUMMARY 180
1 COUNTRY INTRODUCTION 181 1.1 Geography and Climatic Conditions 181 1.2 Political, Economic and Socio-economic Conditions 181
2 ENERGY MARKET IN NIGER 182 2.1 Overview of the Energy Situation 182 2.2 Energy Capacities, Production, Consumption and Prices 182 2.3 Market Actors and Regulation Structures 184
3 POLICY FRAMEWORK FOR RENEWABLE ENERGIES 184 3.1 Policies, Strategies and Programs for Renewable Energy Promotion 184 3.2 Regulations, Incentives and Legislative Framework Conditions 185
4 STATUS AND POTENTIAL FOR RENEWABLE ENERGIES 186 4.1 Biomass/Biogas 186 4.2 Solar Energy 186 4.3 Wind Power 186 4.4 Hydro Power 186
5 MARKET RISKS AND BARRIERS 187
6 RENEWABLE ENERGY BUSINESS INFORMATION AND CONTACTS 188
7 BIBLIOGRAPHY 191
Renewable Energies in West Africa 177CONTENTS
NIGER

ACRONYMS AND ABBREVIATIONS NIGER
AIPO African Intellectual Property Organization
ALG Autorité du Liptako Gourma (Authority for Integrated Development of the Liptako Gourma Region)
ANDP Alliance Nationale pour la Démocratie et le Progrès (National Alliance for Democracy and Progress)
ARM Autorité de Régulation Multisectorielle (Authority of Multisector-based Regulation)
BIRD Banque Internationale pour la Reconstruction et le Développement
(International Bank for Development and Reconstruction)
CDM Clean Development Mechanism
CDS Convention Démocratique et Sociale (Social and Democratic Convention)
CFC Companies Formalities Center
CILSS Comité Permanent Inter-Etats de Lutte contre la Sécheresse dans le Sahel
(Interstate Committee for Fight Against the Drought in the Sahel)
CNPG Centre National de Perfectionnement et de Gestion (National Center for Perfection in Management)
CNEDD Conseil National de l’Environnement pour un Développement Durable
(National Environmental Council for a Sustainable Development)
CNIP Conseil National des Investissements Privés (Private Investors National Council)
CNL Conseil National de Liaison (National Connection Council)
ECOWAS Economic Community of Western Africa States
GDP Gross Domestic Product
GEF Global Environmental Facility
LPG Liquefied Petroleum Gas
MDG Millennium Development Goals
MFP Multifunctional Platforms Project
MNSD Mouvement National pour la Société de Développement (National Movement for a Development Society)
NDA National Designated Authority
NIGELEC Société Nigérienne d‘Électricité (Nigerian Electricity Society)
PAC Programme d’Actions Communautaires (Community Actions Program)
PEC Politique Énergétique Commune (Common Energy Policy)
PRASE Programme de Référence d’Accès aux Services Énergétiques (Reference Program of Access to Energies Services)
PRBE Programme Régional Biomasse Énergie (Regional Biomass Energy Programm)
PREDAS Programme Régional de Promotion des Énergies Domestiques et Alternatives au Sahel
(Regional Programm for Promotion of Domestic and Alternative Energies in the Sahel)
PV Photovoltaic
RAF Resource Allocation Framework
RE Renewable Energy
RSD Rassemblement Social et Démocrate (Social Democritic Assembly)
RDP Rassemblement pour la Démocratie et le Progrès (Assembly for Democracy and Progress)
SDR Stratégie du Développement Rural (Strategy of Rural Development)
SDRP Stratégie du Développement Accéléré et de la Réduction de la Pauvreté
(Strategy for Accelerated Development and Poverty Alleviation)
SNASEM Stratégie Nationale d’Accès aux Services Énergétiques Modernes (National Strategy Access to Modern Energy)
SNCC Société Nationale de Carbonisation du Charbon Minéral (National Company of Carbonization of Mineral Coal)
SONICHAR Société Nigérienne de Charbon (National Coal Company of Anou Araren)
SONIDEP Société Nigérienne des Produits Pétroliers (Nigerien Society of Petrol Products)
SONIHY Société Nigérienne des Hydrocarbures (Gas Company Niger)
SNER Stratégie Nationale sur les Énergies Renouvelables (National Renewable Energies Strategy)
SNED Stratégie Nationale des Énergies Domestiques (National Strategy for Domestic Energies)
UNDP United Nations Development Program
VAT Value Added Tax
WIPO World Intellectual Property Organization
UEMOA Union Économique et Monétaire Ouest Africaine (West African Economic and Monetary Union)
Renewable Energies in West Africa 178ACRONYMS, ABBREVIATIONS AND MEASUREMENTS
NIGER
Renewable Energies in West Africa 179ACRONYMS, ABBREVIATIONS AND MEASUREMENTS
NIGER
MEASUREMENTS
km kilometer
mm millimeter
kg kilogram
t tons
m3 cubic meter
m2 square meter
kWh kilowatt hours
kWp kilowatt peak
m/s meter per second
MW megawatt (1 MW = 1,000 kW)

SUMMARY
The Country Study of Niger is to provide an overview of the country’s energy market and to support decision-making for private investments for the renewable energy sector in Niger. The study is structured as follows:
Chapter one provides Background Information on Niger. This includes an overview of geographical and climatic conditions, as well as the most important facts in view of political, eco-nomic and socio-economic conditions of Niger.
Chapter two summarizes facts and figures of Niger’s Energy Market including stakeholders and market actors involved as well as sector related regulations.
Chapter three presents the currently existing Political Frame-work for Renewable Energies in Niger. This includes an over-view of support mechanisms for PV as well as already existing regulations, incentives and legislative framework conditions.
Chapter four provides a brief overview of the Status Quo and Potential for Renewable Energies in Niger.
Chapter five summarizes the existing and potential Mar-ket Risks and Barriers in general with focus on Renewable Energies.
Chapter six presents a compilation of the most relevant Renewable Energy Business Information and Contacts of Niger.
Renewable Energies in West AfricaSUMMARY 180
NIGER

1 COUNTRY INTRODUCTION
1.1 GEOGRAPHY AND CLIMATIC CONDITIONSThe Republic of Niger is an enclosed West African country, the nearest coast is about 600 km away. It is situated between longitudes 0 ° 16’ East and 16 ° East and latitudes 11 ° 1’ North and 23 ° 17’ North. The country is limited by Algeria and Lib-ya in the North, by Nigeria and Benin in the South, by Chad in the East and by Mali and Burkina Faso in the West.
The territory is divided into 8 areas, 36 provinces and 265 districts. The country is crossed by the Niger River, the coun-try’s only permanent river, covering a length of 550 km. Niger covers a surface area of 1,267,000 km² two-thirds of which are desert. According to the last population census of 2001, Niger’s population is estimated at 11,060,291 inhabitants with an annual average population growth of 3.1 %. In 2006, the population was estimated at approximately 13 million inhabitants equaling 4.7 % of the Economic Community of Western Africa States (ECOWAS) population estimated at over 270 million people. About 47.6 % of Niger’s population is under 15 years, and 83 % are living in rural areas.
Three quarters of the population live in the southern part of the country, representing 25 % of the total surface area of the country. The environmental constraints (decrease and bad repartition of rainfalls) were followed by a progressive decrease of the agricultural areas representing only 12 % of the national territory today. The climate is of Sahelian type characterized by two main seasons: a long dry season lasting up to nine months and a rainy season covering three to four months. The country has four agro climatic zones:
The Sahelo-Sudanese zone representing approximately 1 % of the total surface area of the country with up to 600 to 800 mm of rain during a normal year
The Sahelian zone covering 10 % of the country with 350 to 600 mm of rain
The Sahelo-Saharan zone representing 12 % of the total sur-face area of the country with 150 to 350 mm of rain per year
Renewable Energies in West Africa 181
NIGER
COUNTRY INTRODUCTION
The Saharan zone covering 77 % of the country with less than 150 mm of rain
1.2 POLITICAL, ECONOMIC AND SOCIO-ECONOMIC CONDITIONS
The Republic of Niger was a former French colony that gained its independence in August 1960. Since 1993, the country has been a multiparty democratic sovereign state with a semi-presidential government system where the deputies are elected democratically. The current President is Mr. Tandja Mama-dou from the MNSD (Mouvement National pour la Société de Développement – National Movement for a Development Society), the dominant political party of the country. The parliament counts 113 deputies from seven political parties. The Government includes ministers from the CDS (Con-vention Démocratique et Sociale – Social and Democratic Convention), RSD (Rassemblement Social et Démocrate – Social Democratic Assembly), RDP (Rassemblement pour la Démocratie et le Progrès – Assembly for Democracy and Progress) and ANDP (Alliance Nationale pour la Démocratie et le Progrès – National Alliance for Democracy and Progress) which were in coalition with the MNSD during the run-off election in 2004.
Classified as one of the poorest countries in the world, Niger’s Republic Gross Domestic Product (GDP) per capita was 216 Euro in 2006, representing 1.83 % of the GDP in the ECOWAS zone. All parameters related to the poverty level evaluation show that poverty still exerts high impact on the country. Poverty lines corresponding to a minimal annual spending of 220 Euro in urban areas and 161 Euro in rural ar-eas indicate that 62.1 % of Nigerians are poor (as of 2005 and without significant improvement up to now). In the house-hold sector, the impact of poverty is estimated at 53 %, about 66 % of the households consider themselves as relatively poor, while 20 % of them perceive themselves as being extremely poor. The relation is similar in both, rural and urban areas. Today, the struggle against poverty and the research for sus-tainable and steady economic growth are the most important issues for Niger.
Against this background, the SDRP (Stratégie du Développement accéléré et de la Réduction de la Pauvreté – Strategy for Accelerated Development and Poverty Allevia-tion) was adopted by the Government and approved of by the development partners for financial issues in 2007. The SDRP has seriously taken into account the fact that the reduction of poverty goes along with a strong and sustained growth of re-sources and creation of employment, notably in the sphere of people considered as poor and in rural areas, by guaranteeing an overall cross-linking of the existing sector-based programs and strategies.
The economy of Niger is dominated by the agro-pas-toral sector representing 36 % of the GDP (with 42 % of the earnings resulting from exportations) and employing 85 % of the population. In 2006, Niger’s exports within the ECOW-AS came to about 147,765 tons (consisting mainly of agro-pas-toral and forest-related products) with earnings of 58 million Euros. Niger’s major export customers are Nigeria (50.7 %), Ghana (29.3 %) and Côte d’Ivoire (11 %). The imports come
FIGURE1
Map of the Republic of Niger
M A L I
DossoMaradiNIAMEY
C H A D
Gaya
Zinder
Tahoua
Agadez
Diffa
Niger
A L G E R I A
B U R K I N A F A S O
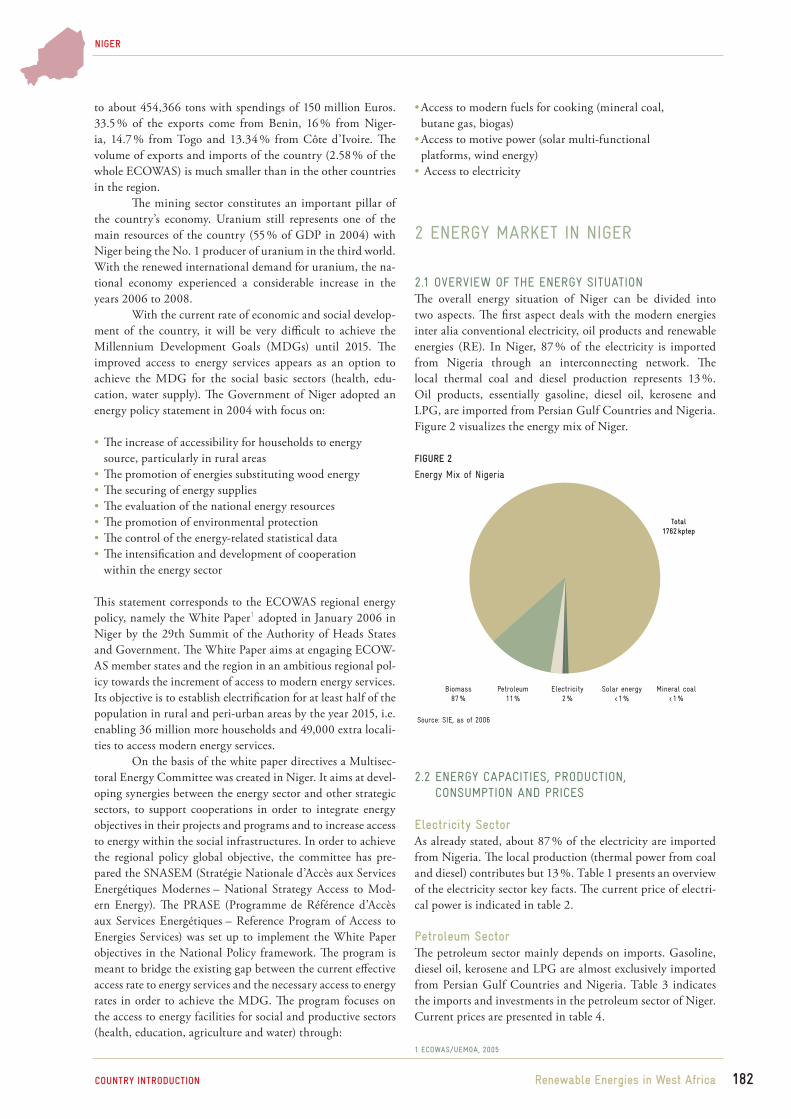
FIGURE 2
Energy Mix of Nigeria
Biomass87 %
Petroleum11 %
Mineral coal< 1 %
Solar energy< 1 %
Electricity2 %
Total1762 kptep
Renewable Energies in West Africa
NIGER
COUNTRY INTRODUCTION
Access to modern fuels for cooking (mineral coal, butane gas, biogas) Access to motive power (solar multi-functional platforms, wind energy) Access to electricity
2 ENERGY MARKET IN NIGER
2.1 OVERVIEW OF THE ENERGY SITUATIONThe overall energy situation of Niger can be divided into two aspects. The first aspect deals with the modern energies inter alia conventional electricity, oil products and renewable energies (RE). In Niger, 87 % of the electricity is imported from Nigeria through an interconnecting network. The local thermal coal and diesel production represents 13 %. Oil products, essentially gasoline, diesel oil, kerosene and LPG, are imported from Persian Gulf Countries and Nigeria. Figure 2 visualizes the energy mix of Niger.
2.2 ENERGY CAPACITIES, PRODUCTION, CONSUMPTION AND PRICES
Electricity SectorAs already stated, about 87 % of the electricity are imported from Nigeria. The local production (thermal power from coal and diesel) contributes but 13 %. Table 1 presents an overview of the electricity sector key facts. The current price of electri-cal power is indicated in table 2.
Petroleum SectorThe petroleum sector mainly depends on imports. Gasoline, diesel oil, kerosene and LPG are almost exclusively imported from Persian Gulf Countries and Nigeria. Table 3 indicates the imports and investments in the petroleum sector of Niger. Current prices are presented in table 4.
to about 454,366 tons with spendings of 150 million Euros. 33.5 % of the exports come from Benin, 16 % from Niger-ia, 14.7 % from Togo and 13.34 % from Côte d’Ivoire. The volume of exports and imports of the country (2.58 % of the whole ECOWAS) is much smaller than in the other countries in the region.
The mining sector constitutes an important pillar of the country’s economy. Uranium still represents one of the main resources of the country (55 % of GDP in 2004) with Niger being the No. 1 producer of uranium in the third world. With the renewed international demand for uranium, the na-tional economy experienced a considerable increase in the years 2006 to 2008.
With the current rate of economic and social develop-ment of the country, it will be very difficult to achieve the Millennium Development Goals (MDGs) until 2015. The improved access to energy services appears as an option to achieve the MDG for the social basic sectors (health, edu-cation, water supply). The Government of Niger adopted an energy policy statement in 2004 with focus on:
The increase of accessibility for households to energy source, particularly in rural areas
The promotion of energies substituting wood energy The securing of energy supplies The evaluation of the national energy resources The promotion of environmental protection The control of the energy-related statistical data The intensification and development of cooperation within the energy sector
This statement corresponds to the ECOWAS regional energy policy, namely the White Paper1 adopted in January 2006 in Niger by the 29th Summit of the Authority of Heads States and Government. The White Paper aims at engaging ECOW-AS member states and the region in an ambitious regional pol-icy towards the increment of access to modern energy services. Its objective is to establish electrification for at least half of the population in rural and peri-urban areas by the year 2015, i.e. enabling 36 million more households and 49,000 extra locali-ties to access modern energy services.
On the basis of the white paper directives a Multisec-toral Energy Committee was created in Niger. It aims at devel-oping synergies between the energy sector and other strategic sectors, to support cooperations in order to integrate energy objectives in their projects and programs and to increase access to energy within the social infrastructures. In order to achieve the regional policy global objective, the committee has pre-pared the SNASEM (Stratégie Nationale d’Accès aux Services Energétiques Modernes – National Strategy Access to Mod-ern Energy). The PRASE (Programme de Référence d’Accès aux Services Energétiques – Reference Program of Access to Energies Services) was set up to implement the White Paper objectives in the National Policy framework. The program is meant to bridge the existing gap between the current effective access rate to energy services and the necessary access to energy rates in order to achieve the MDG. The program focuses on the access to energy facilities for social and productive sectors (health, education, agriculture and water) through:
1 ECOWAS/UEMOA, 2005
Source: SIE, as of 2006
182

Renewable Energies in West Africa 183
NIGER
COUNTRY INTRODUCTION
2000 2001 2002 2003 2004 2005 2006
Production Sonichar (GWh) 134.870 134.400 143.670 148.830 154.750 158.470 167.500
Production Nigelec (GWh) 64.280 39.723 40.666 42.642 45.856 43.166 26.300
Total Production (GWh) 199.150 174.123 184.336 191.472 200.606 201.636 193.800
Imports (GWh) 203.826 219.882 210.995 234.766 295.340 339.002 356.590
Consumption 402.976 394.005 395.331 426.238 495.946 540.638 550.390
Investments (Euro) 3,810,996 7,454,159 10,113,288 7,650,690 13,156,298 18,420,650 13,595,391
TABLE 1 Consumption and Investment in the Electricity Sector
Source: Ministry of Mines and Energy and Ministry of Trade, Industry and Normalization, as of 2008
DOMESTIC USE INDUSTRIAL USE
0.122 Euro/ kWh 0.084 Euro/ kWh
TABLE 2
Electricity Prices
Source: Ministry of Mines and Energy and Ministry of Trade, Industry and Normalization, as of 2008
TABLE 3
Imports and Investments in the Petroleum Sector of Niger
Source: SONIDEP, as of 2007
TYPE OF FUEL 2000 2001 2002 2003 2004 2005
Kerosene (m³) 11,892 8,912 11,009 13,589 13,995 8,802
Gasoline (m³) 66,000 97,934 96,387 105,365 98,385 96,148
Jet (m³) 17,755 9,256 12,057 12,566 14,430 15,665
Diesel (m³) 72,466 70,061 85,210 90,500 96,616 105,818
Heavy fuel (m³) 10,832 8,288 5,511 9,974 11,544 3,658
Jet (t) 350 141 197 96 75 45
Lubricant (t) 2,829 3,853 3,496 2,966 391 3,123
Bitumen (t) 137 829 7,232 11,004 15,159 4,373
Investments (Million Euro) 78 69 74 84 98 115
TABLE 4
Price of Petroleum Products
Source: Ministry of Mines and Energy and Ministry of Trade, Industry and Normalization, as of 2008
DIESEL GASOLINE KEROSENE LPG
1.021 Euro/liter 0.983 Euro/liter 0.633 Euro/liter 0.671 Euro/kg

Renewable Energies in West Africa 184
NIGER
COUNTRY INTRODUCTION
Activities related to the import and distribution of LGP are carried out by the three local companies of SONIHY, Niger Gas and Total Gas.
3 POLICY FRAMEWORK FOR RENEWABLE ENERGIES
3.1 POLICIES, STRATEGIES AND PROGRAMS FOR RE-NEWABLE ENERGY PROMOTION
The statement for energy policy adopted by the Government in 2004 has been followed by many strategies and action plans for the promotion of RE. In the following, a brief overview of this policy is presented.
SNER (Stratégie Nationale sur les Énergies Renouve-lables – National Renewable Energies Strategy) aims at the increased contribution of RE to the national energy balance from less than 0.1 % in 2003 to 10 % by 2020 by:
Facilitating the promotion of supply systems based on RE Alleviating women‘s domestic tasks Reducing the impact on forest resources and reforestation of natural resources
Promoting rural electrification on the basis of RE resources Promoting education, training, research and the develop-ment related to RE technologies
SNASEM aims to improve the supply of a higher percent-age of the population with modern energies by 2015 through granting:
Access to modern fuels for cooking Access to motive power for villages with 1,000–2,000 inhabitants
Access to electricity for rural and peri-urban populations to reach a cover rate of 66 %
SNED (Stratégie Nationale des Energies Domestiques – National Strategy for Domestic Energies) aims at the creation of a global and coherent frame for intervention in the sub-sector of domestic energies by:
Assuring a sustainable use of forest resources and better reforestation
Promoting alternative sources of energy (other than wood) and improving the efficiency of the appliances
Strengthening the capacity of the main actors for a better management of the sector and setting up an adequate frame of operation
Setting up an adequate frame of communication to inform and educate the actors on issues related to the production and use of domestic energies
RE programs have been described in the major reference documents for the development of the country. The SDRP, as stated above, plans to endow the country with economic in-frastructures through its “Development of Infrastructures”. It
2.3 MARKET ACTORS AND REGULATION STRUCTURESThe import, transport, distribution and production of elec-tricity and oil products are controlled by the Ministry of Min-ing and Energy (MME), the Ministry of Trade, Industry and Normalization through numerous laws and their decree of implementation in collaboration with the ARM (Autorité de Régulation Multisectorielle – Authority of Multisector-Based Regulation). The Ministry of Environment and the MME are responsible for the management of traditional energies, re-spectively the matching of demand and supply. The legislation is governed by an order that regulates the organization of the marketing and the transport of firewood in big cities, the ap-plied tax system and the detailed guidelines.
Like other UEMOA/ECOWAS countries, Niger is subject to the Common Legislative System stipulating the free movement of people and materials and the application of the Common External Tariff for importation within the Com-munity.
The Ministry of Mining and Energy (MME) is in charge of sector-based policy and defines the legislative and statutory frame of the activities for production, transport, import, ex-port and distribution of energy in Niger.
The Ministry of Environment and Struggle Against the Desertification is in charge of the management of the sup-ply of the wood energy.
The Ministry of Trade, Industry and Normalization is in charge of the regulation of trade issues.
The CNEDD (Conseil National de l’Environnement pour un Développement Durable – National Environmental Council for a Sustainable Development) created by the Gov-ernment in January 1996 defines the orientation and coordi-nation of environmental policies related to sustainable devel-opment.
The ARM (Autorité de Régulation Multisectorielle – Authority of Multisector-Based Regulation) was created in 1999 and regulates the sectors of energy, telecommunication, transport and water.
The CNES (Centre National de l’Énergie Solaire – National Center of Solar Energy) is a public administrative structure created in 1998. It conducts research work and is in charge of the realization of prospective and diagnostic studies as well as of the involvement of the training and promotion of the distribution of equipments in the field of RE.
NIGELEC, a national electrical company created in 1968, has the monopoly of the transport and distribution of the electricity power supply nationwide.
SONICHAR, the national coal company of Anou Araren created in 1975, produces electricity from coal and provides it to mining companies and the neighboring towns.
SONIDEP was created in 1977 in order to assure the continuity and safety of hydrocarbons and sub-products sup-ply in the country, notably in terms of the constitution and the inventory control of safety in association with the other existing companies.
SNCC (Société Nationale de Carbonisation du Char-bon Minéral – National Company of Carbonization of Min-eral Coal) was created in 2004 and aims at the promotion of mineral coal as energy for cooking in households.

Renewable Energies in West Africa 185
NIGER
COUNTRY INTRODUCTION
is intended to stimulate the growth and to facilitate the access to social facilities by promoting RE. SDR (Stratégie du Dével-oppement Rural – Strategy of Rural Development) with its sub-program “4–4 – Renewable Energy and Rural Electrifica-tion” considers the access to electricity to help rural communi-ties in developing their local economy and the improvement of their living conditions. The same strategy plans in its program „10 – Environmental Protection“ the use of alternative sources of energy for the substitution of wood.
3.2 REGULATIONS, INCENTIVES AND LEGISLATIVE FRAMEWORK CONDITIONS
Up to now, RE is not subject to any legislative text of Ni-ger. A law on renewable energy, however, is currently being formulated. Through this law, the Government can provide support in the form of loans, subsidies, fiscal advantages etc. in order to promote the increased utilization of RE. This is very important because PRASE grants (see page 9) a privilege for RE projects.
Companies importing RE equipment can benefit from incentive measures facilitating the acquisition. At present, imported RE equipment is rated and taxed as electronic ma-terial. The new law intends to exonerate all imported equip-ment used in the field of rural electrification and rural water pumping from taxes. It also aims to create a national rural electrification fund.
Quite a number of sub-sectors are in charge of the implementation of projects regarding the CDM (Clean De-velopment Mechanism). As the national focal point of three “Post-Rio” Conventions, CNEDD was appointed as National Designated Authority (NDA) of the CDM in Niger on 5 June 2006. As such, the CNEDD registered and approved the first MDP project of the Niger “Initiative Bio-Carbon of the PAC” (Programme d’Actions Communautaires – Community Ac-tions Program). This project is financed by the World Bank2 One of its objectives is the restoration of land through the plantation of 23,000 trees (acacia senegal) throughout the whole territory.
RE attract increasing interest due to their advantages as compared to fossil fuel. Therefore, many financing mecha-nisms for promoting RE are being started on regional and international level. In Niger, the following actions have so far been taken:
Technical and Financial Partners’ Round Table for PRASE Financing in 2009
Resource Allocation Framework (RAF 4) of the Global Environmental Facility (GEF) Program
European Union Energy Facility Clean Development Mechanism (CDM) Small Grant Program of GEF for the RE Promotion The Regional Program for the Promotion of Household and Alternative Energies in the Sahel of the Permanent Inter States Committee for Drought Control in the Sahel
Regional Biomass Energy Program of UEMOA/ECOWAS Regional Program Energy Against Poverty of UNDP
Locally, the UNDP representation grants institutional sup-port and finances pilot projects in order to promote the use of the RE within the framework of its annual Country Program Support.
Governmental Projects and ProgramsThe Special Energy Program, which ended in 2001, is the last German RE program conducted in Niger. In 2004, dur-ing the Bonn International Conference for Renewable Ener-gies (renewables 2004), Germany has emphasized its interest to support the implementation of an RE strategy for Niger adopted by the Government in January. Just after this meet-ing, the RE sector was integrated into the Niger/Germany bi-lateral cooperation.
The Programme Régional de Promotion des Énergies Domestiques et Alternatives au Sahel (PREDAS) is imple-mented by the CILSS and the state members with financial support of the EU and the German Development Coopera-tion. It aims at helping the country members to organize sus-tainable supply and rational use of domestic energies by the inhabitants of Sahelian zone avoiding harmful impact on the environment.
The Programme Régional Biomasse Énergie (PRBE) is implemented by the ECOWAS/UEMOA with the financial support of the Netherlands. This program joins the framework of the implemented PEC (Politique Energétique Commune – Common Energy Policy) of the UEMOA and contributes to the long-term management of biomass energy in a policy to fight poverty and promote environmental protection.
ALG (Autorité du Liptako Gourma – Authority for Integrated Development of Liptako Gourma Region) has elaborated a plan for developing the energy sector in this re-gion (located between Burkina Faso, Mali and Niger) from 2007 to 2025. This plan aims to fight poverty and contribute to a harmonious and integrated development of the region through the introduction of modern forms of energy (elec-tricity, mobility) and the reduction of harmful environmental influences.
PRASE is part of the program to reduce poverty in Niger. The program focuses on the access to energy facilities for social and productive activities (cooking, motive power and electricity) for the entire population of Niger in order to achieve the MDG.
The GEF has accorded 1,525,000 Euro for the de-velopment of RE projects through its Resource Allocation Framework (RAF). Also GEF is financing some demonstra-tive projects for the promotion of RE through its Small Grant Program.
The Multi-Functional Platforms Project (MFP) aims at bringing motive power to rural areas. The project was initi-ated in Mali in 1996 with the backing of UNDP and UNIDO and has since then been extended to Senegal, Burkina Faso, Ghana, Nigeria and Guinea. Its goal is poverty reduction in general, but specifically poverty of rural women, by enabling them to create income generating opportunities through the supply of energy services.
2 BANQUE MONDIALE/WORLD BANK,2009

Renewable Energies in West Africa 186
NIGER
COUNTRY INTRODUCTION
4 STATUS AND POTENTIAL FOR RENEWABLE ENERGIES
4.1 BIOMASS/BIOGASThe potential for energy from biomass is substantial in Ni-ger. Table 5 presents the technical potential for energy from biomass. Biogas is only used at experimental scale. Currently, about 10 small-scale biodigesters (dome type) are in operation.
4.2 SOLAR ENERGYThe average solar energy potential ranges between 5–7 kW/m2 per day, while the average period of sunshine varies between 7 and 10 hours per day. In 2006, the power installed in the sector of solar photovoltaic (PV) was estimated at 1,170 kWp. The current use of solar thermal energy (hot water) accounts for about 2,000 m² of absorbers. The use of solar cooking and drying is very low. Table 6 presents an overview of solar en-ergy technologies already implemented in Niger.
4.3 WIND POWERThe average wind speed is 5 m/s in the northern part of the country and about 2.5 m/s in the South. Currently, about 30 small-scale installations are used for water pumping purposes.
4.4 HYDRO POWERNiger has more than 270 MW of economic Hydro Power po-tential that is only partially developed up to now. Potential and already exploited Hydro Power capacities are summarized in Table 7.
TYPE POTENTIAL EXPLOITED LOCALIZATION DETAILS
ForestAnimal wasteAgricultural waste
9.9 million ha55,018,000 tons4,084,200 tons
3.52 million ha50,180 tons40,842 tons
all over Niger Used for cooking purposes
Biofuels 999,451 ha 100 ha South of Niger Jatropha
TABLE 5
Technical Potential for Energy from Biomass
Source: Inventory 2006 CNES, as of 2006
TECHNOLOGY INSTALLATIONS UTILIZATION PURPOSE
Solar drying 31 Industrial drying of meat, cereals, fruit etc.
Solar water heating 600 Household use, industrial water heating
PV Systems no data available Lighting, ventilation, water pumping, refrigeration etc.
TABLE 6
Solar Energy Technologies in Niger
Source: CNES Inventory, as of 2006
POTENTIAL EXPLOITED LOCALIZATION DETAILS
125.0 MW 125.0 MW Kandadji Niger River since 2008
122.5 MW – Gambou Niger River not exploited yet
26.0 MW – Dyondounga Affluant Niger River not exploited yet
TABLE 7
Hydro Power Potential of Niger
Source: CNES Inventory, as of 2006

Renewable Energies in West Africa 187
NIGER
COUNTRY INTRODUCTION
5 MARKET RISKS AND BARRIERS
In view of administrative, economic and political issues, there are almost no risks for investments in Niger. In the promotion of the private sector, the legal security of business is a major ob-jective aiming at the implementation of business jurisdiction. The Chamber of Trade, Agriculture, Industry and Crafts is es-tablishing a Center of Promotion and Reference as a specialized institution for the promotion of business in Niger consisting of:
The CNPG (Centre National de Perfectionnement et de Gestion – National Center for Perfection in Management) for the intensification of the managing capacities of the human resources
The CFC (Companies Formalities Center) assisting compa-nies and individuals in dealing with formalities and official statements of all relevant regulations in the legal, adminis-trative, social, fiscal and statistical sector
The Center for Investments Promotion supporting poten-tial investors and providing orientation, advice and assist-ance as stated by the private investment promotion policy of Niger
As to scientific work, Niger applies the WIPO (World Intel-lectual Property Organization) and AIPO (African Intellec-tual Property Organization) legislation in a systematic way. The national office related to the Federal Ministry of Com-merce represents the African Intellectual Property Organiza-tion of CNL (Conseil National de Liaison – National Con-nection Council). This office is in charge of the application of the administrative procedures and the recordings at national level. In general, the rights of property are granted and guar-anteed. Professional activity is based on the principle of free enterprise complying with the liberalization of the economy. Only some activities related to the sectors of bars, cattle and meat, leather and skins as well as mining and oil exploitation are governed by legislative and statutory documents or a spe-cific organization. Investments are encouraged and put down by the implementation of the CNIP (Conseil National des Investissements Privés – Private Investors National Council) proposing measures for the elimination of problems inhibit-ing the creation and exploitation of companies. In order to fulfill the requirements for efficient commercial activities, the investment code defines the conditions for the implementa-tion of the investments and specifies guarantees and favors as well as the obligations involved.
In article 2, the code stipulates that the Republic of Niger guarantees a constant legal and judicial protection to all private investments in the realization of economic and so-cial development programs. Article 7states that the Republic of Niger Republic guaranties to existing or future enterprises not to undertake any act of expropriation or nationalization, except such cases that are of public use and at the same time covered by the law. If – in the latter case - measures of ex-propriation or nationalization are carried out compensation for the private actors concerned is also covered by the law. Article 6 of the same code states: “The settlement of problems
related to the validity, interpretation or implementation of the agreement act and the eventual determination of the allow-ance due to the ignorance or no respect to the commitment will be solved through a legal procedure established within the agreement act”, i. e.:
The possibility for citizens to appeal to the International
Center of Jurisdictional Court related to the investments created by the International Bank for Development and Reconstruction (BIRD, Banque Internationale pour la Reconstruction et le Développement)
According to article 9, the present code applies to both, physi-cal persons and companies of all nationalities operating or in-tending to operate on the following sectors:
a. Agricultural activities
b. Manufacturing/production activitiesc. Energy productiond. Exploitation of mineral products and substances as well as
the transformation, except those that are already governed by the mineral law and petroleum cod
e. Social habitation implementation program in the propose of selling or inheriting
f. Industrial equipment maintenance activitiesg. Air transportationh. Hotel construction and equipmenti. Telecommunication (telephone and internet)
Finally, the code allows three privileged regimes:
1. Regime A, related to promotional objectives, for invest-ments of less than 76,220 Euro during a period of 5 years; according to this regime, the enterprise in step of invest-ment has a total exoneration on:
Duty and tax excluding VAT on the statistics royalties Duty and tax with VAT of the services offering, services
related to the investment program
2. Regime B, related to priority objectives, for investments ranging from about 76,220 to 152,440 Euro; in this regime, the enterprises have the followings advantages (tax exemptions):
related to the investment program
But, in case of availability of an equivalent product, the im-portation of materials and equipments is not entitled to exon-eration. In the course of the implementation, a total exonera-tion is given to:
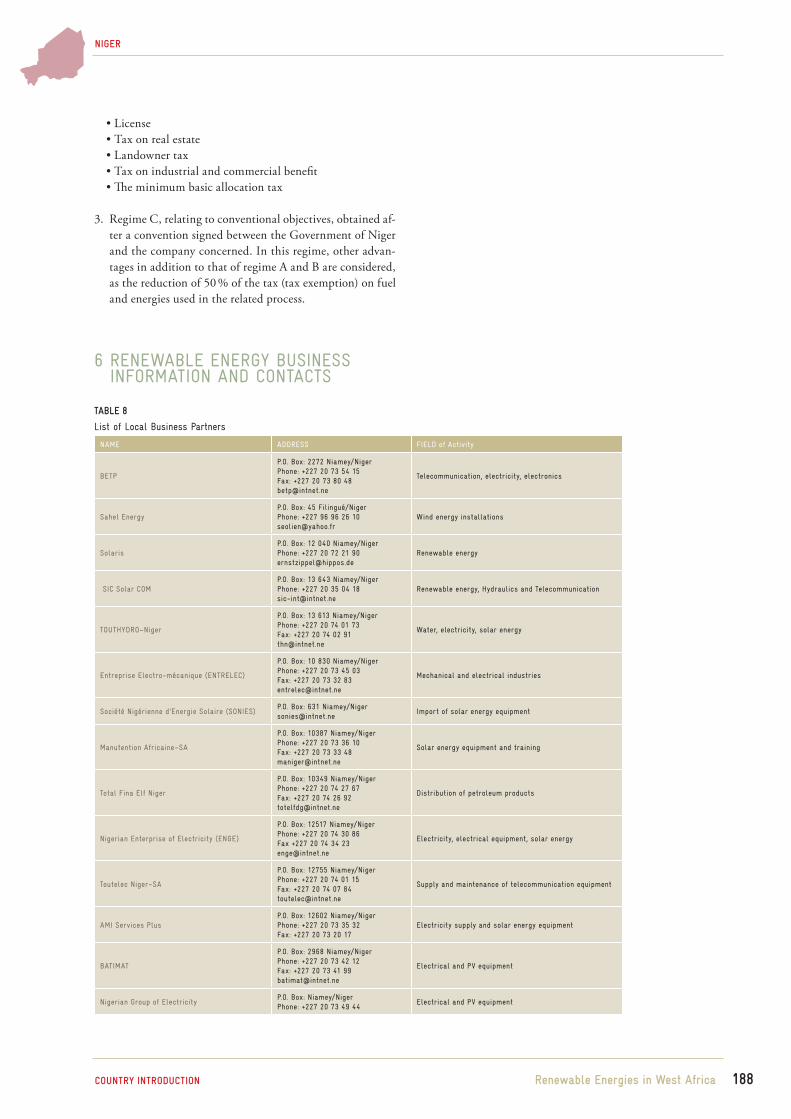
3. Regime C, relating to conventional objectives, obtained af-ter a convention signed between the Government of Niger and the company concerned. In this regime, other advan-tages in addition to that of regime A and B are considered, as the reduction of 50 % of the tax (tax exemption) on fuel and energies used in the related process.
6 RENEWABLE ENERGY BUSINESS INFORMATION AND CONTACTS
TABLE 8
List of Local Business Partners
NIGER
Renewable Energies in West Africa 188COUNTRY INTRODUCTION
NAME ADDRESS FIELD of Activity
BETP
P.O. Box: 2272 Niamey/NigerPhone: +227 20 73 54 15Fax: +227 20 73 80 [email protected]
Telecommunication, electricity, electronics
Sahel Energy P.O. Box: 45 Filingué/NigerPhone: +227 96 96 26 [email protected]
Wind energy installations
SolarisP.O. Box: 12 040 Niamey/NigerPhone: +227 20 72 21 [email protected]
Renewable energy
SIC Solar COMP.O. Box: 13 643 Niamey/NigerPhone: +227 20 35 04 [email protected]
Renewable energy, Hydraulics and Telecommunication
TOUTHYDRO–Niger
P.O. Box: 13 613 Niamey/NigerPhone: +227 20 74 01 73Fax: +227 20 74 02 [email protected]
Water, electricity, solar energy
Entreprise Electro-mécanique (ENTRELEC)
P.O. Box: 10 830 Niamey/NigerPhone: +227 20 73 45 03 Fax: +227 20 73 32 [email protected]
Mechanical and electrical industries
Société Nigérienne d’Energie Solaire (SONIES)P.O. Box: 631 Niamey/[email protected]
Import of solar energy equipment
Manutention Africaine–SA
P.O. Box: 10387 Niamey/NigerPhone: +227 20 73 36 10Fax: +227 20 73 33 [email protected]
Solar energy equipment and training
Total Fina Elf Niger
P.O. Box: 10349 Niamey/NigerPhone: +227 20 74 27 67Fax: +227 20 74 26 [email protected]
Distribution of petroleum products
Nigerian Enterprise of Electricity (ENGE)
P.O. Box: 12517 Niamey/NigerPhone: +227 20 74 30 86Fax +227 20 74 34 [email protected]
Electricity, electrical equipment, solar energy
Toutelec Niger–SA
P.O. Box: 12755 Niamey/NigerPhone: +227 20 74 01 15Fax: +227 20 74 07 84 [email protected]
Supply and maintenance of telecommunication equipment
AMI Services PlusP.O. Box: 12602 Niamey/NigerPhone: +227 20 73 35 32Fax: +227 20 73 20 17
Electricity supply and solar energy equipment
BATIMAT
P.O. Box: 2968 Niamey/NigerPhone: +227 20 73 42 12Fax: +227 20 73 41 [email protected]
Electrical and PV equipment
Nigerian Group of ElectricityP.O. Box: Niamey/NigerPhone: +227 20 73 49 44
Electrical and PV equipment

Renewable Energies in West Africa 189COUNTRY INTRODUCTION
NIGER
Technical Enterprise of Electromechanical Equipment
P.O. Box: 12096 Niamey/NigerPhone: +227 20 74 17 [email protected]
Installation, maintenance and repair of electrical equipment
KBCP.O. Box: 10541 Niamey/NigerPhone: +227 20 74 12 25Fax: +227 74 11 09
Electrical and PV equipment
CFAO Niger
P.O. Box: 204 Niamey/NigerPhone: +227 20 74 01 58Fax: +227 20 74 28 [email protected]
Air Conditioning and refrigeration
SNSP.O. Box: 11512 Niamey/NigerPhone: +227 20 310123
Hydraulics and solar equipment
NAME ADDRESS Field of Activity
DOGARI Ingenierie P.O. Box: 10470 Niamey/NigerPhone: +227 20 74 07 [email protected]
Engineering of solar energy and hydraulics
SCP Agence ARCHI Plus
P.O. Box: 638 Niamey/NigerPhone:+227 20 73 41 25Fax: +227 20 73 65 [email protected]
Engineering of solar energy, hydraulics and civil building
Techni-Consult
P.O. Box: 11732 Niamey/NigerPhone: +227 20 73 80 04Fax: +227 20 73 81 [email protected]
Engineering of hydraulics and civil building
NAMOSOLAR sarlP.O. Box: 11489 Niamey/NigerPhone: +227 96 99 70 [email protected]
Hydraulics engineering, civil engineering
KRB
P.O. Box: 10265 Niamey/NigerPhone: +227 20 73 47 53Fax +227 20 73 53 [email protected]
Hydraulics engineering, civil engineering, engineering in solar energy
BS RAP.O. Box 13646 Niamey/NigerPhone: +227 20 73 99 15bsira [email protected]
Hydraulics engineering, civil engineering, engineering in solar energy, biofuels
I3EAP.O. Box: 10209 Niamey/NigerPhone: +227 20 34 02 [email protected]
Engineering, water, energy and environment
TABLE 9
List of Local Experts
Source: UNESCO, Étude sur l’Identification des Centres d’Excellence en Énergies Renouvelables au Niger; as of 2007

NIGER
Renewable Energies in West Africa 190COUNTRY INTRODUCTION
NAME ADDRESS FIELD OF ACTIVITY
Ministry of the Mines and Energy–MME
P.O. Box: 11 700, Niamey/NigerPhone: +227 20 73 45 82Fax: +227 20 73 27 [email protected]
Mining, geology, energy
Direction of Renewable Energies and Domestic Energies–DERED / mmE
P.O. Box: 11 700 Niamey/NigerPhone: +227 20 73 65 30Fax: +227 20 73 27 [email protected]
Renewable energies and domestic energies
Energy Information SystemSIE–Niger
P.O. Box: 11 700 Niamey/NigerPhone: +227 20 73 97 [email protected]
Management of energy information
MME Rural Electrification Cellule P.O. Box 11 700 Niamey/NigerPhone: +227 96 53 48 37 [email protected]
Strategy of rural electrification
Ministry of Hydraulics and Environment P.O. Box: 257 Niamey/Niger Phone: +227 20 72 38 [email protected]
Environment and struggle against the desertification
Ministry of the Trade, Industry and Promotion of the Private Sector
Phone: +227 20 73 69 46Fax: +227 20 73 21 50
Trade, industry and promotion of the private sector
Ministry of Local Communities Development Phone: +227 20 72 53 22 Communities development
Ministry of the Population and Social ActionPhone: +227 20 72 23 30Fax: +227 20 73 61 65
Population and social aspects
Ministry of Economy & Finance Phone: +227 20 72 23 74 Economy and finance
Ministry of TransportPhone: +227 20 73 47 82Fax:+227 20 73 54 89
Transport
National Council of Environment and Sustainable Development–CNEDD
P.O. Box: 10193 Niamey/NigerPhone: +227 20 72 25 59Fax: +227 20 72 29 [email protected]
Environment, renewable energy, domestic energy
TABLE 10
List of Public Institutions
Source: UNESCO, Étude sur l’Identification des Centres d’Excellence en Énergies Renouvelables au Niger, as of 2007
NAME ADDRESS FIELD OF ACTIVITY
Abdou Moumouni University of Niamey–UAM
P.O. Box: 237/10896 Niamey/NigerPhone: +227 20 73 25 31Fax : +227 20 73 38 [email protected]
Research on energy, environment, hydraulics, health, education, agronomy, social science etc.
National Center of Solar Energy–CNES
P.O. Box: 621 Niamey/NigerPhone: +227 20 72 39 23Fax: +227 20 72 55 [email protected]
Renewable energies, energy efficiency research of solar energies
National Institute of Agronomic Research–INRAN Niger
P.O. Box: 429 Niamey/NigerPhone: +227 20 72 27 14Fax: +227 20 72 34 [email protected]
Research on solar energy, food conservation, agronomy and environmental aspects
School of Mining and Geology–EMIG
P.O. Box: 732 Niamey/NigerPhone: +227 20 31 51 00Fax: +227 20 73 37 [email protected]
School of engineering, training, research on solar energy, education, engineering, environment etc.
Regional Center of AGRHYMET–CRA
P.O. Box: 11 011 Niamey/NigerPhone: +227 20 73 31 16Fax: +227 20 73 24 [email protected]
School of engineering, training, research on solar energy, food security, climatology, energies
TABLE 11
List of Research Institutes

NIGER
BIBLIOGRAPHY Renewable Energies in West Africa 191
7 BIBLIOGRAPHY
ANCR (2006): Étude sur l‘Évaluation des Capacités à Renforcer
Banque Mondiale/World Bank (2009): Programme d’actions communautaires (http://go.worldbank.org/42CLOX67G0)
Cabinet du Premier Ministre (2007): Stratégie de Dévelop-pement Accéléré et de Réduction de la Pauvreté (SDRP)
CNEDD (2006): Inventaire des Gaz à Effet de Serre „Sec-teur de l’Energie“
CNEDD (2001): Réactualisation Bilan Diagnostic des stratégies programme et projets passés en cours et en at-tente dans le domaine des ER au Niger
CNEDD (2007): Seconde Communication Nationale, Inventaire des Gaz à Effet de Serre, Utilisation des Terres, Changement Affectation des Terres et Foresterie
CNEDD (2006): Etat des Lieux en Besoins de Renforce-ment des Capacités dans le Cadre de la Convention Cadre des Nations Unies sur les Changements Climatiques
CNES (2006): Inventaire des Installations Solaires Centre de Promotion des Investissements/Sis à la Chambre de Commerce d‘Agriculture,
d‘Industrie et d‘Artisanat du Niger (2009): Conditions et Opportunités d’Investissement au Niger (www.investir-au-niger.org/oportunites.htm)
Centre de Promotion des Investissements/Sis à la Chambre de Commerce d‘Agriculture,
d‘Industrie et d‘Atisanat du Niger (2009): Code Douanier du Niger (www.investir-au-niger.org)
ECOWAS/UEMEOA (2005): White Paper for a regional policy (www.gm.undp.org/Reports/ECOWAS%20energy%20white%20paper.pdf)
Ministère des Mines et de l’Énergie (2006): Étude sur la Définition d’une Stratégie et Élaboration d’un Plan d’Actions en Énergies Domestiques Ministère des Mines et de l’Énergie (2006): Stratégie Na-tionale d’Accès aux Services Énergétiques Modernes
Ministère des Mines et de l’Énergie (2005): Code de l’Électricité (www.sie-niger.ne)
Ministère des Mines et de l’Énergie (2004): Déclaration de Politique Énergétique
Ministère des Mines et de l’Énergie (2003): Stratégie Na-tionale et Plan d’Actions sur les Énergies Renouvelables
Ministère des Mines et de l’Énergie (2006): Stratégie du Développement Minier
Nigelec (2008): various data and information Société Nigérienne des Produits Pétroliers - Sonidep (2007): various publications (www.sonidep.com)
N. N. (2007) : Rapport d’Activités de la Direction des Energies Renouvelables et des Energies Domestiques
UNESCO (2007): Étude sur l’Identification des Centres d’Éxcellence en Énergies Renouvelables au Niger
Websites Comité Permanent Inter-Etats de Lutte contre la Sécheresse dans le Sahel, CILSS: www.cilss.bf
Economic Community of Western Africa States, ECOW-AS: www.ecowas.int
Système d‘Information Énergétique Niger, SIE: www.sie-niger.ne
Union Économique et Monétaire Ouest Africaine – UEMOA : www.uemoa.int

COUNTRY CHAPTER:
NIGERIA Authors of Country Chapter Prof. Anthony O. AdegbulugbeDr. Adeola Adenikinju
Coordination and Review of the Country ChapterAnton Hofer, (MSE, Dipl.-Ing./FH, M.A.)WIP-Renewable Energies www.wip-munich.deMunich, Germany
Editor Deutsche Gesellschaft für Technische Zusammenarbeit (GTZ) GmbHDepartment Water, Energy, TransportDag-Hammarskjöld-Weg 1-565760 Eschborn, Germanywww.gtz.de
On behalf of Federal Ministry for Economic Cooperation and Development (BMZ)
Editorial staffDiana KraftTel: +49 (0)6196 79 4101Fax: +49 (0)6196 79 80 4101Email: [email protected]
Renewable Energies in West Africa 192

CONTENTS NIGERIA
ACRONYMS, ABBREVIATIONS AND MEASUREMENTS 194
SUMMARY 196
1 COUNTRY INTRODUCTION 197 1.1 Geography and Climatic Conditions 197 1.2 Political, Economic and Socio-economic Conditions 197
2 ENERGY MARKET IN NIGERIA 198 2.1 Overview of the Energy Situation 198 2.2 Energy Capacities, Production, Consumption and Prices 198 2.3 Market Actors and Regulation Structures 199
3 POLICY FRAMEWORK FOR RENEWABLE ENERGIES 200 3.1 Policies, Strategies and Programs for Renewable Energy Promotion 200 3.2 Regulations, Incentives and Legislative Framework Conditions 200
4 STATUS AND POTENTIAL FOR RENEWABLE ENERGIES 201 4.1 Biomass/Biogas 202 4.2 Solar Energy 202 4.3 Wind Power 202 4.4 Hydro Power 202
5 MARKET RISKS AND BARRIERS 203
6 RENEWABLE ENERGY BUSINESS INFORMATION AND CONTACTS 204
7 BIBLIOGRAPHY 206
7 ANNEX 207
Renewable Energies in West Africa 193CONTENTS
NIGERIA

ACRONYMS AND ABBREVIATIONS NIGERIA
AES Applied Energy Services
CAC Corporate Affairs Commission
CDM Clean Development Mechanism
ECN Energy Commission of Nigeria
ECOWAS Economic Community of West African States
EPSR Electric Power Sector Reforms
FDI Foreign Direct Investment
FIIRO Federal Institute of Industrial Research Oshodi
FOTE Friends of the Environment
GDP Gross Development Product
HIV/AIDS Human Immunodeficiency Virus/Acquired Immune Deficiency Syndrome
IMF International Monetary Fund
IPP Independent Power Producer
IPPA Investment Promotion and Protection Agreement
ITCZ Inter-Tropical Convergence Zone
JV Joint Venture
LGHQs Local Government Headquaters
LPG Liquefied Petroleum Gas
N Nigerian Naira (currency of Nigeria, also NGN)
NAPEP National Poverty Eradication Program
NBRRI Nigerian Building and Road Research Institute
NCC National Coal Corporation
NDA Niger Dam Authority
NEEDS National Economic Empowerment and Development Strategy
NEPA Nigerian Electricity Power Authority
NERC Nigerian Electricity Regulatory Commission
NESCO Nigeria Electricity Supply Company
NGC Nigerian Gas Company
NGOs Non Governmental Organizations
NIMET Nigeria Meteorological Services
NIPC Nigerian Investment Promotion Commission
NNPC Nigerian National Petroleum Corporation
NNRA Nigerian Nuclear Regulatory Authority
NREMP National Renewable Energy Master Plan
PHCN Power Holding Company of Nigeria
PRODA Project Development Agency
R&D Research and Development
REA Rural Electrification Agency
REF Rural Electrification Fund
REMP Renewable Energy Master Plan
SESN Solar Energy Society of Nigeria
SHP Small Hydro Power
TCN Transmission Company of Nigeria
UNIDO United Nations Industrial Development Organization
USD United States Dollars
VAT Value Added Tax
Renewable Energies in West Africa 194ACRONYMS, ABBREVIATIONS AND MEASUREMENTS
NIGERIA

MEASUREMENTS
GWh gigawatt hour
kg kilogram
km kilometer
kV kilovolt ampere
kVA kilovolt
kWh kilowatt hour
kWp kilowatt peak
m meter
m2 square meter
/ meters per second
MJ megajoule
MVA megavolt ampere
MW megawatt (1 MW = 1,000 kW)
MWh megawatt hour
PJ petajoule (1 PJ = ca. 277,778 million kWh)
scf standard cubic feet
yr year
Renewable Energies in West Africa 195ACRONYMS, ABBREVIATIONS AND MEASUREMENTS
NIGERIA

SUMMARY
The Country Study of Nigeria is to provide an overview of the country’s energy market and to support decision-making for private investments for the Renewable Energy (RE) sector in Nigeria. The study is structured as follows:
Chapter one provides Background Information on Nigeria. This includes an overview of geographical and climatic condi-tions, as well as the most important facts in view of political, economic and socio-economic conditions of Nigeria.
Chapter two summarizes facts and figures of Nigeria’s Energy Market including stakeholders and market actors and involved as well as related regulations.
Chapter three presents the currently existing Political Frame-work for Renewable Energies in Nigeria. This includes an overview of support mechanisms for photovoltaic (PV) as well as already existing regulations, incentives and legislative framework conditions, concerning other RE technologies.
Chapter four provides a brief overview of the Status Quo and Potential for Renewable Energies in Nigeria.
Chapter five summarizes the existing and potential Market Risks and Barriers in general with focus on RE.
Chapter six presents a compilation of the most relevant Renewable Energy Business Information and Contacts of Ni-geria.
Renewable Energies in West AfricaSUMMARY 196
NIGERIA

Gulf of Guinea
N I G E R
Enugu
Zaria
Makurdi
Kaduna
KatsinaSokoto
Yola
Kano
Ilorin
Jos
Ogbomoso
Bight of BeninWarri
Ibadan
LagosBenin City
Oshogbo
ABUJA
Port HarcourtCalabar
B E N I N
C A M E R O O N
C H A D
Niger
1 COUNTRY INTRODUCTION
1.1 GEOGRAPHY AND CLIMATIC CONDITIONS
Nigeria covers a total area of 923,768 km². With over 140 mil-lion people (as of 2008), Nigeria is the most populated coun-try in Africa and the ninth populated country in the world. About 45 % of the inhabitants live in urban areas; nearly 42 % of the population is under 14 years. The fertility rate in 2008 was 5.01 and the population growth rate about 2.03 %. Life expectancy rate in 2008 was estimated at 46.5 years, while adult literacy is 68 %.1 In 2003, 5.4 % of adults lived with HIV/AIDS. Infant mortality in 2008 remained very high with 95.78 deaths per thousand live births2. Nigeria is divided in the geographical regions North, South, the Central Region and the Guinea coastlands.
Because of its location just north of the equator, Nigeria en-joys a truly tropical climate characterized by the hot and wet conditions associated with the movement of the Inter-Tropi-cal Convergence Zone (ITCZ) north and south of the equa-tor. It is important to note that the climatic conditions of the country vary considerably due to its close proximity to the Equator and the Tropic of Cancer. There are two main seasons prevalent in Nigeria. One is the rainy season from May to September in the northern part of Nigeria and from March to November in the southern part. The dry season, also known the Harmattan season in Nigeria, lasts from December till January.
The country experiences consistently high tempera-tures all year round. The seasonal pattern of climatic condi-tions over Nigeria gives rise to four seasons in the South and two in the North. This is the result of annual total rainfall occurrence and distribution, which is more predominant in the South than in the North.
Renewable Energies in West Africa 197
NIGERIA
COUNTRY INTRODUCTION
1.2 POLITICAL, ECONOMIC AND SOCIO-ECONOMIC CONDITIONS
Nigeria became an independent country on 1 October 1960 and a republic on 1 October 1963. The country operates as a federal system of governments, consisting of the Federal Government, 36 State Governments and 774 Local Govern-ments. While the country has been governed by a succession of military and civilian governments, Nigeria is currently experiencing the longest period of democracy since becom-ing an independent nation. The Fourth Republic started on 29 May 1999 with the election of President Olusegun Obas-anjo. Obasanjo was followed by the current President Umaru Musa Yar’Adua who was elected on 29 May 2007. While Ni-geria operated a Parliamentary System of Government when it gained its independence, the country currently operates a Presidential System of Government with three tiers of Gov-ernment, i. e. executive, legislative and judiciary.
Nigeria’s population consists of about 250 ethnic groups speaking 500 indigenous languages and following two major religious, i.e. Islam and Christianity. The largest ethnic groups are the Hausa-Fulani, the Yorubas and the Igbos. Ni-geria’s economy is primarily driven by oil and gas. Oil and gas account for 25 % of the country’s Gross Development Product of 115.4 billion USD (as of 2006) measured at current prices. Oil and gas account for over 80 % of governmental revenues and more than 95 % of total export earnings in 20063. GDP per capita has recently risen considerably to 858 USD as op-posed to 350 USD in 2000. The Nigerian economy is expe-riencing the fastest growth in over two decades due to the development in the energy sector, especially the oil and gas sub-sector. Growth averaged 5.7 per cent annually between 2000 and 2005, picking up across a broad range of sectors4. Nigeria’s vision is to become one of the 20 largest economies by the year 2020.
However, in spite of the massive revenue from oil (es-timated at over 600 billion USD since 1970), the standard of living is still very low, poverty is widespread and income distribution is highly skewed. Over 70 % of the population lives on less than 1 USD a day and 91 % live on less than 2 USD a day according to a 1990–2001 poverty study. In-come distribution is highly skewed with the poorest 10 % of the population controlling just 1.6 % of the wealth, while the richest 10 % control 40.8 % of total wealth.5 The Gini index stands at 50.6 %. Nigeria with a Human Development Index of 0.461 was classified among the countries with low human development by the United Nations. The International Mon-etary Fund (IMF) ranked Nigeria at 165 out of 179 countries in terms of per capita income in 2006. The major causes for poverty in Nigeria are bad governance, neglect of the agri-cultural sector, inadequate social and economic infrastructure and unstable policy environment.
FIGURE 1
Map of Nigeria
1 CIA, AS OF 2009
2 CIA, AS OF 2009
3 CBN, AS OF 2007
4 KWAKWA ET AL., AS OF 2008
5 NBS, AS OF 2005

Natural Gas Hydro CoalOil
0
60
20
40
10
30
50
70
20061986 1988 1990 200220001998199619941992198419821980
Renewable Energies in West Africa
NIGERIA
COUNTRY INTRODUCTION
Electricity SectorElectricity in Nigeria is supplied through large-scale ther-mal power and hydroelectric power plants and a 330 kV and 132 kV nationwide transmission network through the Power Holding Company of Nigeria (PHCN). Power demand de-veloped from 3,233 MW in 2002 to 3,479 MW in 2003 and 3,403 MW in 2004. The maximum power demand in 2003 exceeded the available capacity of 3,477 MW in 2005. The Government has clearly fallen short of the national targets de-fined in the National Economic Empowerment and Develop-ment Strategy (NEEDS) in order to increase the generation capacity of power facilities to 10,000 MW, the transmission capacity to 9,340 MVA and the distribution capacities to 15,165 MVA by the year 2007. Most of the generating facili-ties are old and outdated, yet cannot be overhauled due to the lack of reserve capacity. This situation was caused by insuffi-cient maintenance, the suspension of new investments and the high rate of auto-generation as a result of frequent large-scale blackouts.
The residential sector accounted for 63 % of the total electricity consumption in 2005, followed by the commercial sector (27 %) and the industrial sector (10 %). Natural gas dominates the electricity generation mix, accounting for an average of 63 % of the total power generation. After natural gas, hydro is also a significant factor in power generation, though its contribution has decreased. Figure 2 presents the evolution of the total power generation shares by type of fuel.
Meanwhile, the contribution of oil, though marginal since 1980, has also drastically decreased contributing as little as 3 % to the total power generation in 2004. In Nigeria, the problems in the Niger Delta have often affected the supply of gas to the power stations leading to major disruptions in electricity generation. Occasional low levels of water in the hy-drostations together with the gas disruptions lead to blackouts in most parts of the country. Energy prices in Nigeria are very low compared to other countries and relative to the marginal cost of production. The average electricity tariff in Nigeria is about 6.75 N per kWh (approximately 5 €-Cents per kWh). It is estimated that the generation cost of electricity from winds power in Nigeria is about 8–10 Euro Cent per kWh. The cur-rent electricity prices (as of November 2008) vary between 3 and 5 €-Cents per kWh.
2 ENERGY MARKET IN NIGERIA
2.1 OVERVIEW OF THE ENERGY SITUATIONNearly 60 % of the country’s 140 million people have no reli-able access to electricity from the national energy grid. Most people rely on lighting with kerosene lanterns, candles, torch-es etc. Nigeria has a National Energy Policy as well as a draft National Energy Master Plan and Renewable Energy Master Plan. The most important legislation guiding the power sector is contained in the Electric Power Sector Reforms (EPSR) Act of 2005. In 2008, the Government also approved of a new oil and gas policy.
2.2 ENERGY CAPACITIES, PRODUCTION, CONSUMPTION AND PRICES
Nigeria is fortunate to have huge energy resources enabling the country to transform its economy and the lives of its citi-zens. Nigeria sits astride of over 36 billion barrels of oil, 187 trillion cubic feet of gas, 4 billion metric tons of coal and lig-nite as well as huge reserves of tar sands, Hydro Power and solar radiation. An overview of Nigeria’s energy reserves is presented in table 1.
The energy mix of Nigeria is dominated by oil which accounts for about 57 %, followed by natural gas (36 %) and hydroelec-tricity (7 %) as of 2005. Other energy sources such as coal, nu-clear and renewable energies currently play no significant role in the country’s energy consumption mix. Between 1980 and 2005, the share of oil in energy mix decreased from 82 % to 56 %. Natural gas consumption increased from 9 % to 35 %. Hydroelectricity experienced a slight increase from 6.6 % to about 7 %.
Over the period of 1989–2005, the share of non-commercial energy in total energy consumption fluctuated within the range of 30–40 %. About 95 % of total fuel wood consumption falls to households for cooking and domestic industrial activities, which are closely related to household activities. A smaller proportion of the fuel wood and charcoal consumed are used in the service sector.
198
TABLE 1
Energy Reserves and Potential of Nigeria
Source: Sambo, as of 2008
Crude oil 35.2 billion barrels
Natural gas 187.44 trillion scf
Tar sands 30 billion barrels of oil equivalent
Coal & lignite 4 billion tons
Large Hydro Power 11,250 MW
Small Hydro Power 3,500 MW
Fuel wood 13,071,464 hectares
Animal waste 61 million tons/year
Crop residue 83 million tons/year
Solar radiation 3.5–7.0 kWh/m2/day
Wind 2–4 / at 10 m height
FIGURE 2
Share of Energy Sources in Total Power Generation (%)
Source: World Bank, as of 2006

FIGURE 3
Evolution of the Energy Consumption Mix in Nigeria (1980–2006)
(Quadrillion Btu)
Source: EIA, as of 2009
0
0,6
0,2
0,4
0,1
0,3
0,5
0,7
20061980 1982 1984 1992 1994 19961986 1988 1990 1998 2000 2002 2004
Hydro Natural Gas CoalOil
Renewable Energies in West Africa 199
NIGERIA
COUNTRY INTRODUCTION
Petroleum SectorThe commercial energy consumption mix in Nigeria is domi-nated by oil accounting for about 57 %, followed by natural gas (36 %). Besides hydroelectricity (7 %) and very little utili-zation of coal, other energy resources play no significant role in the country’s energy consumption mix. Figure 3 presents an overview of the country’s energy mix with main contribu-tions from oil and natural gas.
Refined petroleum products can be classified into two categories, namely those whose prices are still regulated (i.e. gasoline and kerosene) and those whose prices are fully de-regulated (i.e. diesel and LPG). Due to the poor state of local refineries, nearly 70 % of total consumption of refined prod-ucts in Nigeria are imported. The current prices of petroleum products (as of November 2008) are presented in table 3.
2.3 MARKET ACTORS AND REGULATION STRUCTURESThe Federal Ministry of Energy oversees the administration of the energy sector in Nigeria primarily through its two main executive bodies, namely the Nigerian National Petroleum Corporation (NNPC) and the PHCN. The NNPC’s primary function is to oversee the regulation of the Nigerian oil in-dustry while also being responsible for upstream and down-stream developments. The Nigerian Electricity Power Author-ity (NEPA) was established in 1972 as a result of the merger of the former Electricity Company of Nigeria and the Niger Dam Authority (NDA). NEPA was structured as a vertically integrated monopoly with responsibility to generate, transmit and distribute electricity throughout the country. The NEPA Act was further amended in 1990 and 1998 to pave way for further liberalization of the electricity industry.
One of the major institutional and legislative reforms in the power sector in recent years was the Electric Power Sector Re-form (EPSR) in 2005. The EPSR introduced important regu-latory changes, which involve dismantling the monopoly of NEPA. It aimed at encouraging competition and efficiency through private participation, especially in the generation and distribution of electricity. The EPSR provided for the division of NEPA into 18 autonomous companies consist-ing of 6 generating companies, 1 transmission company and 11 distributing companies. The Act also provided for the crea-tion of an independent regulatory agency, i.e. the Nigerian Electricity Regulatory Commission (NERC), and the Rural Electrification Agency (REA) to oversee the extension of elec-tricity to rural and peri-urban areas. The REA is supervised by the Federal Ministry of Energy. The Act also provided for the establishment of a Rural Electrification Fund to promote access of rural dwellers to electricity. In some areas, electric-ity supply is provided by the REBs of state governments or through an Independent Power Producer (IPP)) system such as NESCO (Nigeria Electricity Supply Company) or the AES Corporation.
There is, however, no agency with direct control of the RE sector in Nigeria. The responsibilities for RE objec-tives are shared between various Ministries, Departments and Agencies of the Government, e. g. the Energy Commission of Nigeria (ECN), REA, NNPC and the National Poverty Erad-ication Program (NAPEP). The ECN exercises jurisdiction over RE-related institutions in Nsukka and Sokoto, imple-ments pilot projects on both, technology utilizing solar heat and PV generation, and promotes the introduction of these RE technologies. Silicon is mined in Nigeria and research and development on the domestic manufacturing of PV modules is being planned.
Other key actors in the energy sector are the Nigerian Gas Company (NGC), the Nigerian Nuclear Regulatory Au-thority (NNRA) and the National Coal Corporation (NCC). The Ministry of Science and Technology is responsible of planning and policy matters related to research and develop-ment in the field of science and technology including energy. Other agencies and NGOs also considering RE include the Federal Institute of Industrial Research Oshodi (FIIRO), the Project Development Agency (PRODA), Friends of the Envi-ronment (FOTE), the Solar Energy Society of Nigeria (SESN) to mention but a few.
TYPE OF FUEL PRICE
Gasoline 0.46 Euro per liter
Diesel 0.92 Euro per liter
Kerosene 0.33 Euro per liter
LPG 17.71 Euro per 12.5 kg bottle
TABLE 3
Overview of Prices for Selected Petroleum Products
Source: market research conducted by the authors, as of November 2008

Renewable Energies in West Africa 200
NIGERIA
COUNTRY INTRODUCTION
3 POLICY FRAMEWORK FOR RENEWABLE ENERGIES
3.1 POLICIES, STRATEGIES AND PROGRAMS FOR RENEWABLE ENERGY PROMOTION
The NEP was drafted in 1993 by the ECN and represents a comprehensive energy policy that covers all energy sectors. The key objectives and targets for the power sector are:
To expand electricity access to 75 % of the population by 2020
To provide electricity supply for all 774 local government headquarters and other cities by 2010
(only 660 LGHQs have been electrified so far) To promote private sector participation The key elements in the national policy position on the de-velopment and application of RE and its technologies are:
To develop and promote the country’s RE resources and include all viable ones into the national energy mix
To promote decentralized energy supply, especially in rural areas, based on RE resources
To discourage the use of wood as fuel To promote efficient methods in the use of biomass energy resources
To keep abreast of international developments in RE tech-nologies and applications
At present, there are no special incentives for distributors, manufacturers and users of RE systems, also due to the huge subsidies granted for conventional energy, in particular con-ventionally generated electricity and petroleum products. The country is also yet to provide a PPA for developers of RE based electricity projects. The only RE sector that attracts special incentives is the biofuel industry. These incentives include (i) the granting of a pioneer status to all registered businesses engaged in activities related to the production of biofuels or the production of feed stocks for biofuel production and co-generation, (ii) exemptions from withholding tax and capi-tal gains tax; (iii) exemptions from the payment of customs duties, taxes and other charges of similar nature on biofuels imports and exports, imports of inputs and machineries, (iv) waivers on VAT payments on all products and services con-sumed by biofuel companies and (v) access to preferential loan arrangements with the Bank of Industry, the Nigerian Export and Import Bank, commercial banks, agriculture banks and other development finance agencies.
3.2 REGULATIONS, INCENTIVES AND LEGISLATIVE
FRAMEWORK CONDITIONSMost RE technologies are imported, as there is virtually no manufacturing capacity in the country. In Nigeria, customs tariffs for ordinary electrical products are applied for PV-re-lated equipment resulting in high tariffs which are lacking any incentives and are discouraging the country’s PV business. ECN has submitted an “Importation of Renewable Energy Equipment” bill to the Nigerian Senate in 2002, asking for tax exemptions for the import duty of PV equipment.
The Nigerian Government allows for 100 % foreign ownership or joint ventures (JV) with Nigerian partners in all sectors of the economy including the PV sub-sector. The Government has also effected an Investment Promotion and Protection Agreement (IPPA) which guarantees investors adequate and prompt payments in the event of expropriation, free transfer of funds as well as provisions for international arbitration in the event of disputes. This agreement is to facilitate the attrac-tion of Foreign Direct Investment (FDI) to the economy and protect investments in all sectors including the RE sub-sector. Additional incentives to encourage industrialists and inves-tors in all sectors of the economy including the RE sub-sector provide:
Five years tax holiday for pioneer products and industries Tax-free dividend for a period of three years 95 % capital allowance for replacement investment Elimination of double taxation Abolition of excise duty
All excise duties were abolished with effect from 1 January 1999. It should also be mentioned that any investments in the energy sector are rated as pioneer initiatives entitled to a tax holiday of 5–7 year.
The EPSR Act provided for the establishment of the Rural Electrification Agency. The Federal Government has set a target for increasing electricity access in rural areas from currently 40 % to 75 % by 2015. The rural electrification strategy and plan aim at the expansion of the main grid, the development of isolated and mini-grid systems, the creation of an enabling environment to promote investments in RE power generation and the fostering of public and private sec-tors partnerships designed to supply electricity for the rural population. The targets against which these policies will be measured are: (i) ensuring that 75 % of the rural population has electricity by 2010, (ii) providing electricity to all the 774 local government headquarters and other strategic towns by 2010 and (iii) reducing cost per connection of rural electricity schemes on a sustainable basis. The strategies being contem-plated by REA for expanding energy access comprise two ele-ments: pilot projects aimed at testing innovative approaches to expanding rural electricity and activities related to imple-mentation support for the National Renewable Energy Master Plan (NREMP).
To encourage the private sector for investing in ru-ral electrification, governmental subsidy is set at a 304.5 N/month flat rate. The REA and the Rural Electrification Fund (REF) were established in March 2006. Any organization in-tending to start a rural electrification project can do so by obtaining a business license from the REA without providing or being related to an existing distribution company in the relevant area. The REA will approve of the proposed site for a rural electrification project and allot funds for the REF in accordance with fair and transparent rules. The REA will also formulate and establish minimum safety regulations, techni-cal standards and criteria for the services level.
The NERC is a regulatory and supervisory organ for electric power entities (including private companies) working in power generation, transmission and distribution projects in

Renewable Energies in West Africa 201
NIGERIA
COUNTRY INTRODUCTION
general. Although rural electrification projects fall under the authority of NERC, projects with less than 1 MW generating facilities and 100 kW distribution facilities are not subject to their regulation, so off-grid rural electrification projects are not included for the time being.
In general there is no restriction for foreign companies and investors doing business in Nigeria. They must, however, incorporate a local vehicle before commencing business. All companies are approved and regulated by the Corporate Af-fairs Commission (CAC). Decree No. 16 pf (as of 1995) of the Nigerian Investment Promotion Commission (NIPC) allows for 100 % foreign participation in Nigerian businesses. It also allows for repatriation of capital and dividend without any inhibition from the Government. The NIPC is a one-stop of-fice for dealing with all requirements for investments in the country. The Companies and Allied Matters Act 1990 (The Companies Act) is the principal law regulating the incorpora-tion of businesses in Nigeria.
The approval procedures for foreign investors in Nigeria can be stated as follows: The first port of call is the NIPC office for enquiries about investment opportunities and procedures in Nigeria. Second step is the registration of the company with the CAC. Third is to notify the Industrial In-spectorate Department of the Federal Ministry of Industries of the intended capital expenditure. Next step is to ask for approval of location with the Federal Ministry of Industries. Moreover, approval or a proper business permit with or with-out expatriate quota allocation must be sought in writing from the Ministry of Internal Affairs. Finally, to know whether the company will obtain pioneer status, it must apply to the Fed-eral Ministry of Industry. The same Ministry also approves the user licenses.
There is an opportunity in the Nigerian power sector to lev-erage carbon finance from the energy loss reduction and ef-ficiency program embarked upon recently with the assistance of the World Bank. The Transmission Company of Nigeria (TCN) is currently finalizing the Emission Reduction Pur-chase Agreement. The conversion to a High Voltage Distribu-tion System lead to technical loss and therefore a substantial reduction of carbon emissions due to avoided generation. This represents the first step for the Nigerian power sector in accessing the benefits of Clean Development Mechanism (CDM) under the Kyoto Protocol.
4 STATUS AND POTENTIAL FOR RENEWABLE ENERGIES
An overview of the status (as of 2005) and future potential (outlook by 2025) for RE is presented in Table 4.
The Renewable Energy Master Plan (REMP) envis-ages to aggregate the electrification demand of 14,000 MW by 2015 of which RE will constitute about 5 % (701 MW). In 2025, the electricity demand is projected to increase to 29,000 MW with new RE satisfying up 10 % of the country’s over-all energy demand. The mix of RE making up the 10 % is projected as follows: small Hydro Power 66 %, PV 17 %, bio-mass 14 %, wind 1.3 % and solar thermal 0.7 %. The REMP estimated the cost of REMP implementation up to 2025 at 4.8 billion USD. Table 5 presents the targets for electricity generation in Nigeria.
ENERGY SOURCE ESTIMATED POTENTIAL CURRENT UTILI-ZATION
SHARE OF ELECTRICITY SUPPLY ( %) UP TO 2005
SHARE OF ELECTRICITY SUPPLY BY 2025 ( %)
Large Hydro Power 14,750 MW 1,930 MW 29.30 25.00
Small Hydro Power 734 MW 30 MW 0.46 9.90
Fuel wood, animal waste and crop residue
144 million tons/ 0 0.41
Solar radiation 3.5–7.0 kWh/m2/day marginal 0 0.26
Wind 2–4 / marginal 0 0.02
TABLE 4
Technical Potential for Renewable Energy in Nigeria
Sources: ECN, Renewable Energy Master Plan, as of 2005/ECN, Energy Demand Projection Document, as of 2004
RESOURCE SHORT-TERM (2005–2007) MEDIUM-TERM (2008–2015) LONG-TERM (2016–2025)
Large Hydro Power 1,930 5,230 48,000
Small Hydro Power 100 3,500 19,000
Solar PV 5 120 500
Solar thermal – 1 5
Biomass 1 100 800
Wind 1 20 40
All renewables 2,036 6,905 68,345
All energy resources 15,920 30,210 192,000
% of renewables 13 % 23 % 36 %
TABLE 5
Targets for Electricity Generation (MW)
Source: Energy Commission of Nigeria, as of 2007

Renewable Energies in West Africa 202
NIGERIA
COUNTRY INTRODUCTION
4.1 BIOMASS/BIOGASThe biomass resources of Nigeria consist of wood, forage, grass and shrubs, animal wastes arising from forestry, agricultural, municipal and industrial activities as well as aquatic biomass. Biomass remains a leading source of energy for Nigeria con-tributing an estimated 37 % of total energy demand and being the energy of choice for the vast majority of rural dwellers and the urban poor. The country’s biomass energy resources are estimated at 144 million tons per year. Nigeria currently con-sumes 43.4 billion kg (equivalent 43.4* 109 kg) of fuel wood annually. The average daily consumption is about 0.5–1.0 kg of dry fuel wood per person. The rate of consumption hardly matches the rate of reforestation.
4.2 SOLAR ENERGYNigeria is situated in a belt of high sunshine. The solar ra-diation is fairly well distributed throughout the country. The annual average of total solar radiation varies from about 12.6 MJ/m2/day (equivalent 3.5 kWh/m2/day) in the coastal lati-tudes to about 25.2 MJ/m2/day (equivalent 7.0 kWh/m2/day) in the far North. This equals an average annual solar energy intensity of 1,934.5 kWh/m2/. Thus, over a whole year, an average of 6,372,613 PJ/year (1,770 thousand TWh/year) of solar energy falls on the entire land area of Nigeria. The na-tional average is 5.5 kWh/m2/day and the average solar radia-tion time is 6 hours/day, which are favorable conditions for PV power generation.
The only survey on the business units dealing with solar business in Nigeria shows that a total of 44 companies and 2 research centers were active in the importation and/or installation of PV systems. 30 of them were located in Lagos (68 %) and 14 in the rest of the country (32 %). Among the 27 respondents in the survey, 22 (81 %) were involved in so-lar business. The bulk of the companies were either consult-ants, vendors or contractors. Many of the existing companies claimed to be distributors for one foreign company or the oth-er. The survey identified only one manufacturer of solar PV components or systems, namely Solar Electric systems, based in Jos. It assembled solar-PV refrigerators and manufactured solar cookers and solar heaters.
The PV components which are marketed in the coun-try include modules, batteries, inverters, converters, charge controllers, bulb/tubes, refrigerators, lighting systems, solar lanterns, solar lamps, and junction boxes. The total module installation for 1999 was estimated at 264 kWp. The REMP estimated the PV modules installation in 2005 at 800 kWp. Most of the distributors of solar PV components and systems in Nigeria obtain their products from America (49 %), Ger-many (13.7 %) and Britain (21.5 %). Recently, the Asian coun-tries of India and China have taken over increasing shares of the market. One of the emerging issues in the Nigerian solar market, however, is product quality. The country is yet to es-tablish product standards. Presently, there are no capacities to actually test the products that are brought into the country.
Solar PV technologies are being more and more ac-cepted in Nigeria. Despite improvements in local R&D ef-forts, however, the knowledge of these technologies and their market potentials is considerably inadequate. Presently, all the
PV modules in the Nigerian market are imported. Solar PV systems are being extensively used for a wide range of electri-cal energy requirements including solar home systems, water pumping, refrigeration and telecommunication.
4.3 WIND POWERWind speeds in Nigeria range from 1.4 to 3.0 m/s in the southern areas and 4.0 to 5.12 / in the extreme North. Wind speeds in Nigeria are generally weak in the South except for the coastal regions and offshore locations. In Nigeria, peak wind speeds generally occur between April and August on most sites. Initial studies show that the actual total exploit-able wind energy reserve at a height of 10 m may vary from 8 MWh/ in Yola to 51 MWh/ in the mountainous areas of Jos plateau and rise to 97 MWh/ in Sokoto. Hence, Nigeria has poor to moderate wind conditions.
Wind energy utilization in Nigeria is practically minimal. The hundreds of wind pumps scattered all over the country are badly maintained and some have been abandoned altogether. Some state governments like Jigawa and Kano are making an effort to install new wind pumps. There is one pilot wind electricity project in operation, namely the 5 kWp Sayya Gidan Gada wind electricity project at Sokoto. Moreover, a 0.75 kWp wind electricity project in the center of the town is being run on an experimental basis to prove the viability of wind farming in the area.
4.4 HYDRO POWERAccording to NEPA’s most recent estimate, the country’s gross hydro potential is approximately 14,750 MW. On the basis of a 1980 survey of 12 of the old states of the federation, it was assessed that some 734 MW of small Hydro Power (SHP) could be harnessed from 277 sites. Unfortunately, the database on SHP in Nigeria is limited, incomplete and substantially obsolete. No new surveys have been conducted since those undertaken in only three states over 20 years ago to confirm or verify the data. The REMP, however, estimates that SHP potential is about 3,500 MW. More detailed information can be found in the Annex of this report.
Hydrogen, Marine, Ocean and Geothermal EnergyHydrogen, marine, ocean and geothermal energy are impor-tant in the long-term vision of providing secure, abundant, cost effective and clean sources of energy for Nigeria. Their impact, however, is still negligible at present. The Nigerian Energy Policy seeks to promote capacities to enable Nigeria to include these new energy sources in the country’s future energy mix. Nigeria has an Atlantic Ocean coastline stretch-ing over 800 km from Badagry to Bakassi. Tides in the coastal areas have a height range of 100–300 cm and an incursion of 30–40 km on the average. With respect to geothermal energy, there are two known geothermal resources in Nigeria: Ikogosi Warm Springs in Ondo State and the Wikki Warm Spring in Bauchi. Moreover, high geothermal gradient trends have been identified in the Lagos sub-basin, the Okitipupa ridge, the Auchi-Agbede within the Benin flank/hinge line as well as in the Abakaliki anticlinorium.

Renewable Energies in West Africa 203
NIGERIA
5 MARKET RISKS AND BARRIERS
Price distortions, poor regulatory environment and inadequate infrastructure define the current energy market conditions in Nigeria reducing the scope for competition, growth and in-novation in the market. The Nigerian business environment is characterized by weak infrastructure, poorly implemented incentives (especially fiscal and tariff regimes), massive smug-gling, counterfeiting and dumping of products, lack of stand-ardization required for international competitiveness, unfavo-rable international trade rules, a national trade policy stance which is endemically unpredictable (especially in the appli-cation of tariffs and exemptions), high transaction costs at ports, complicated customs clearance procedures, tariffs and non-tariff barriers which on the average exceed those of other ECOWAS countries and high level of official corruption.
The 2009 Report on “Doing Business Index” jointly authored by the World Bank and the International Finance Corporation shows that Nigeria dropped from position 108 out of 178 in 2008 to position 118 out of 181 in 2009. Ni-geria slides down on most of the scales used to measure ef-ficiency of business transactions. While the number of proce-dures required for obtaining licenses reduced from 18 to 16, the number of the days required in concluding the process increased from 350 to 360 days. Similarly, while the number of payments in business taxes reduced from 35 to 32, the per-centage of the tax (related to the company profit) rose from 29.9 %to 32.2 %. Nigeria, however, recorded some improve-ments such as the reduction of the number of procedures for registering a business from 9 to 8 or the reduction of the number of days required for the process from 34 to 31. The costs for registering a new business in Nigeria however raised from 56.6 % in the 2008 Report to 90.1 % in the 2009 Re-port (indicated as percentage of per capita income). Employers have high flexibility to hire and fire employees.
Moreover, there are no clear and consistent institu-tional structures helping to overcome barriers and create ex-panded opportunities for RE. Some of the current initiatives of various actors are rather spontaneous and lacking systematic approaches. The Government’s Agencies and Ministries active in the RE sector include the Energy Commission of Nigeria (through two of its renewable energy centers located at Sokoto and Nsukka), the Nigeria Meteorological Services (NIMET), the Nigerian Building and Road Research Institute (NBRRI), the Project Development Institute (PRODA), the Federal In-stitute of Industrial Research Oshodi (FIIRO), REA, the Fed-eral Ministry of Environment, the Federal Ministry of Science and Technology, the Federal Ministry of Energy as well as some of Nigeria’s universities and polytechnics.
There is a need to create a level playing field in the energy market by removing all price distortions, by granting special incentives to market operators for the introduction of RE technology systems and by encouraging consumers to ac-cess RE products.
COUNTRY INTRODUCTION

6 RENEWABLE ENERGY BUSINESS INFORMATION AND CONTACTS
NAME ADDRESS BUSINESS FOCUS
Jon Paca Investments Ltd. Suite 38, Kogi Street, Garki, AbujaPhone: +234 803 703 490 6
Solar water pumping systems, solar street lighting
Aero Systems & Tech Nig. Ltd. Plot 7, Durban Street Wuse 2, AbujaPhone: +234 806 602 033 3
PV systems, batteries, inverters, solar charge control-lers, solar water pumping systems
Solarec Engineering Ltd. 2nd Floor, 6A Ahmadu Bello Way, KadunaPhone: +234 301 568 05
PV modules, inverters, DC lighting, charge controllers, solar water pumping systems
Afri-Asia Global Services Ltd. 1, Ilesanmi Idowu, Ogudu GRA, Ogudu, Ojota, LagosPhone: +224 806 008 651 2 www.afasglobal.com
Hydroenergy system components, solar street lighting, solar water pumping systems, wind energy system components
EastWind Laboratories 8, Lagere Road, Ile-ife, Osun StatePhone: +234 803 455 154 6Web: www.eastwindlabs.com
Solar electric power systems, battery charge control-lers, PV module components, inverters
Pamtronics Nigeria Ltd. Suite C3 Royal Plaza, Area 3 Junction, Garki, AbujaPhone: +234 803 701 270 3Web: www.pamtronics.com
Solar electric power systems, batteries deep cycle, DC to AC power inverters sine wave, DC lighting, modules
Borodo & Co. Ltd. P.O. Box 7328, KanoPhone: +234 803 587 005 8
Solar electric power systems, lead acid batteries, solar modules, inverters
Cedicon Ltd. 13th Floor, Zenon House, No.2 Ajose Adeogun St., Victoria Island, LagosPhone: +234 806 572 208 5
Solar electric power systems, wind power plants, inverters
Rubitec Nigeria Ltd. 72 Adeniyi Jones Avenue, Ikeja, LagosPhone: +234 803 449 967 0
Solar lighting systems, solar water pumping systems, power inverters, water filtering and purification sys-tems, wind systems and small Hydro Power
Royal Power and Energy Ltd. Plot 10b, 2 Ashabi Adewale Close, Off Chief Harmann St., Lekki Phase 1, Lagos Phone: +234 176 096 83 www.rpeltd.com
Solar and wind power batteries, UPS and surge protectors
Solar Energy Services Ltd. No. 14, Muri Okunola St., Suite 2, Victoria Island, LagosPhone: +234 146 133 56
Solar streetlights, park lights, solar lighting
KXN Nig, Ltd. 3B, Ribadu Road, Ikoyi, LagosPhone: +234 177 478 [email protected]
Solar PV modules, refrigeration, batteries, controllers, water pumping, small home systems
OEIE Nig. Ltd. 14 Woji Road, Eugene Plaza, Rumuogba, Port HarcourtPhone: +234 846 100 452
Solar water borehole system, refrigeration, solar panels, streetlight billboards
Berekotry Detergents Ltd. KM 1, Oremoje Rd., Iseyin, Oyo StatePhone: +234 803 422 244 8
Biodiesel, bioplastics, cooking stoves
TABLE 6
Local Business Partners
NAME ADDRESS BUSINESS FOCUS
Lagos Chamber of Commerce and Industry 1 Idowu Taylor St., Victoria IslandPhone: +234 177 466 17Fax: +234 127 010 09 www.lagoschamberng.com
Pioneer Chamber of Commerce and Industry in Nigeria
Manufacturers Association of Nigeria MAN House, Ikeja, P.O. Box 3835, LagosPhone: +234 149 742 403Fax: +234 149 742 47 www.manufacturersnigeria.org
Umbrella body for all local manufacturers in Nigeria
Kaduna Chamber of Commerce and Industry Kaduna International Trade and Investment Centre, Km 4, Kaduna-Zaria Rd., P.O. Box. 728, KadunaPhone: +234 623 187 94Fax: +234 623 187 94 www.kadunachamberofcommerce.org
One of the leading chambers of commerce and industry in the North
Kano Chamber of Commerce and Industry Trade Fair Complex, Zoo Road, P.O. Box 10, Kano City, KanoPhone: +234 646 671 38Fax: +234 646 671 [email protected]
One of the leading chambers of commerce and industry in the North
Enugu Chamber of Commerce, Industry, Mines and Agriculture
Trade Fair Complex, Abakaliki Road, P.O. Box 734, EnuguPhone: +234 422 505 75Fax: +234 422 521 86 www.enuguchambers.net
One of the leading chambers of Commerce and Industry in the South East
Onitsha Chamber of Commerce and Industry Achike House, 38, Ogota Road, P.O. Box 2578, Onitsha, Anambra StatePhone: +234 464 141 40Fax: +234 462 511 [email protected]
One of the leading chambers of Commerce and Industry in the South East
Abuja Chambers of Commerce and Industry Abuja International Trade Fair Complex, Km8, Airport Road, P.M.B 86, Garki, AbujaPhone: +234 967 072 18
Leading chamber of commerce and Industry in the Federal Capital
TABLE 7
Local Business Institutions
Renewable Energies in West Africa 204
NIGERIA
COUNTRY INTRODUCTION

Renewable Energies in West Africa 205COUNTRY INTRODUCTION
NIGERIA
NAME ADDRESS AREA OF FOCUS
Energy Commission of Nigeria (ECN) Plot 701C, 358, Garki, Abuja, [email protected] www.energy.gov.ng
Strategic energy planning, coordination and perfor-mance, laying down guidelines on the utilization of energy types for specific purposes
Sokoto Energy Research Centre, Sokoto Uthman Dan fodio University, Sokoto www.edusok.edu.ng
Mandate for research of RE and implementation of relevant pilot programs
National Centre for Energy Research and Deve-lopment
University of Nigeria, Nsukka, Enugu State Mandate for research in renewable energy with a number of completed pilot projects
Rural Electrification Agency (REA) No. 16, Gwani Street, off IBB Way, Wuse Zone 4, PMB, 5072, Wuse, Abuja www.reang.ng
Provision of reliable and affordable electricity supply to all rural dwellers using both grid and non-grid options
UNIDO Regional Center for Small Hydro Power WAEC Building, Plot 10 (2nd Floor), Zambezi Crescent, Maitama, PMB 175, Garki, Abuja www.unidorc.org/nigerian
Established in Abuja for the promotion and acceleration of SHP in the region; development of cost effective technologies, capacity building and training
Renewable Energy Section (NNPC) Block B, NNPC Towers, Central Business District, P.M.B. 190, Garki, Abuja www.nnpcgroup.com
National secretariat for biofuel policies and implementation
TABLE 8
Relevant Governmental Institutions and Agencies

Renewable Energies in West Africa 206
NIGERIA
BIBLIOGRAPHY
7 BIBLIOGRAPHY
Business Day (2008): Achieving a Sustainable Source of Energy (special report)
Central Bank of Nigeria (2006): Annual Report and State-ment of Accounts
Central Bank of Nigeria (2006): Statistical Bulletin, Vol. 17, Abuja
Corporate Affairs Commission (without year): ( www.cacnigeria.org)
Energy Commission of Nigeria (2004): Energy Demand Projection Document, Mimeo
Energy Commission of Nigeria (2005): Renewable Energy Master Plan (final draft report)
Energy Commission of Nigeria (2007): National Energy Databank: Compendium of Renewable Energy Systems Deployed in Nigeria
Energy Commission of Nigeria (2007): Draft National Energy Master Plan
Energy Information Agency (2009): Annual Report Energy Information Agency (without year): Energy Annual 1980–2005 ( www.eia.doe.gov/international)
Iloeje, O. C. (2002): Report of Business Activities in Solar PV in Nigeria, Technical Report No .ECN/EPA/02/3, Energy Commission of Nigeria
JICA (2006): The Federal Republic of Nigeria Master Plan Study for Utilization of Solar Energy (Interim Report)
Kwakwa, V. A., Adenikinju, P., Mousley and Owusu-Gyamfi, M. (2008): Binding Constraints to Growth in Nigeria (published in “Economic Policy Options for a Prosperous Nigeria”, Palgrave Macmillan, New York)
Maigida, S. (2008): Power Sector Infrastructural Develop-ment by 2020: Issues and Challenges (paper presented at the 1st International Conference of NAEE/IAEE)
National Bureau of Statistics (2005): The Nigerian Statisti-cal Fact Sheets on Economic Development, Lagos
Nigerian Investment Promotion Corporation (without year): ( www.nipc.gov.ng)
Oke, C. A. (2008): Resuscitating and Sustaining the Nigerian Power Sector (paper presented to the Nigerian Association for Energy Economics)
Power Holding Company of Nigeria (2008): (www.phc-nonline.com/my tariffs)
Sambo, A. S. (2008): Proposed National Master Plan for Nigeria (paper presented at the 1st International Confer-ence of NAEE/IAEE)
Theodora (2007): Maps of Nigeria ( www.theodora.com/maps, revised March, 28th 2007)
World Bank (2007): World Development Indicators (CD-Rom)

Renewable Energies in West Africa 207
NIGERIA
ANNEX
8 ANNEX
FIGURE 4
Map of Existing Transmission Lines in Nigeria
Source: Oke, as of 2008
TYPE INSTALLED CAPACITY (MW) %
Hydro
Kanji 760 28.9
Jebba 540
Shiroro 600
Gas turbines
Sapele 300 40.0
Afam 920
Delta 840
AES 270
AGIP 300
Steam turbines
Egbin 1,320 31.1
Sapele 720
Total capacity 6,570 100
TABLE 9
Installed Power Generating Capacity on the Nigerian Grid (2006)
Source: Oke, as of 2008

Renewable Energies in West Africa 208
NIGERIA
RESIDENTIAL CLASS
Class Demand Level Demand Charge/KVA Max. Charge/Month Fixed Charge Meter Maintenance Char-ge/Month
Energy Charge/KWH
R1 < 5 kVA – – 20 100.00 1.2
R2 < 5–15 kVA – – 30 100.00 4.0
R3 < 15–45 kVA – – 120 500.00 6.0
R4(MD) LV: < 45–500 kVA – 5,000.00 120 1,600.00 8.5
R5(MD) HV: < 500 kVA – 20 MVA – 31,250.00 – 2,200.00 8.5
COMMERCIAL CLASS
Class Demand Level Demand Charge/KVA Max. Charge/Month Fixed Charge Meter Main Charge/Month Energy Charge/KWH
C1 < 5–15 kVA 90 500.00 8.5
C2 < 15–45 kVA 120 1,600.00 8.5
C3(MD) LV:<45–500 kVA 230,00 5,000.00 240 2,200.00 8.5
C4(MD) HV: < 500 kVA – 20 MVA 230,00 31,250.00
INDUSTRIAL CLASS
Class Demand Level Demand Charge/KVA Max Charge /Month Fixed Charge Meter Main Charge/Month Energy Charge /KWH
D1 < 5–15 kVA – – 90 100.00 6.5
D2 < 15–45 kVA – – 120 500.00 8.5
D3 LV: < 45–500 kVA 230 5,000.00 240 1,600.00 8.5
D4 HV: < 500 kVA – 20 MVA 250 31,250.00 2,200.00 8.5
D5 > 20 MVA 270 – 1.5 M 2,200.00 8.5
PREPAYMENT CLASS
Tariff Index Rate Meter Maintenance Fee Fixed Charge
Residential 3 phase (R3) index 2 6.0 500 120
Commercial 3 phase (C2) index 5 8.5 500 120
Commercial 3 phase (C3) index 6 8.5 1,600 240
Residential single phase (R2) index 1 4.0 100 30
Commercial single phase (C1) index 4 6.5 100 90
TABLE 10
Electricity Tariffs in Nigeria
Source: PHCN, as of 2008
ANNEX

Renewable Energies in West Africa 209
NIGERIA
LOCATION RIVER POTENTIAL CAPACITY (MW)
Donka Niger 225
Zungeru II Kaduna 450
Zungery I Kaduna 500
Zurubu Kaduna 20
Gwaram Jamaare 30
Izom Gurara 10
Gudi Mada 40
Kafanchan Kongum 5
Kurra II Sanga 25
Kurra I Sanga 15
Richa II Daffo 25
Richa I Mosari 35
Mistakuku Kurra 20
Korubo Gongola 35
Kiri Gongola 40
Yola Benue 360
Karamti Kam 115
Beli Taraba 240
Garin Dali Taraba 135
Sarkin Danko Suntai 45
Gembu Dongu 130
Kasimbila Kasina Ala 30
Katsina Ala Katsina Ala 260
Makurdi Benue 1,060
Lokoja Niger 1,950
Onitsha Niger 1,050
Ifon Osse 30
Ikom Cross 730
Afokpo Cross 180
Atan Cross 180
Gurara Gurara 300
Mambilla Danga 3,960
Total 12,220
TABLE 11
NEPA Estimate of Current Exploitable Hydro Power Sites in Nigeria
Source: ECN, Renewable Energy Master Plan, as of 2005
STATE (PRE 1980) RIVER BASIN TOTAL SITES TOTAL CAPACITY (MW)
Sokoto Sokoto-Rima 22 30.6
Katsina Sokoto-Rima 11 8.0
Niger Niger 30 117.6
Kaduna Niger 19 59.2
Kwara Niger 12 38.8
Kano Hadeija-Jamaare 28 46.2
Borno Chad 28 20.8
Bauchi Upper Benue 20 42.6
Gongola Upper Benue 38 162.7
Plateau Lower Benue 32 110.4
Benue Lower benue 19 69.2
Rivers Cross River 18 258.1
Total 277 734.2
TABLE 12
Small Hydro Potential in Surveyed States of Nigeria
Source: ECN, Renewable Energy Master Plan, as of 2005
RIVER STATE INSTALLED CAPACITY (MW)
Bagel I Plateau 1
Bagel II Plateau 2
Ouree Plateau 2
Kurra Plateau 8
Lere I Plateau 4
Lere II Plateau 4
Bakalori Sokoto 3
Tiga Kano 6
TABLE 13
Existing Small Hydro Schemes in Nigeria
Source: ECN, Renewable Energy Master Plan, as of 2005
ANNEX

COUNTRY CHAPTER:
SENEGAL The Regional Report “Renewable Energies in West Africa” does not include a separate Country Chapter for the ECOWAS country Senegal, as key information on the Senegalese RE market is already available by two other studies edited and compiled by GTZ on behalf of the German Government:
GTZ / TERNA (2009): Energy policy Framework Conditions for Electricity Markets and Renewable Energies – 16 Country Analyses, part Senegal (in English)>> http://www.gtz.de/de/dokumente/gtz2009-en-terna-senegal.pdf
GTZ / Owsianowski, R.-P. (2007): Projekterschließung SenegalErneuerbare Energien und ländliche Elektrifizierung. Länderreport & Marktanalyse>> http://www.gtz.de/de/dokumente/de-projekterschliessung-senegal-laenderreport.pdf
Renewable Energies in West Africa 210

COUNTRY CHAPTER:
SIERRA LEONE Author of Country Chapter Michael A. Conteh (MSc. Eng.)
Coordination and Review of the Country ChapterAnton Hofer, (MSE, Dipl.-Ing. /FH, M.A.)WIP-Renewable Energies www.wip-munich.deMunich, Germany
Editor Deutsche Gesellschaft für Technische Zusammenarbeit (GTZ) GmbHDepartment Water, Energy, TransportDag-Hammarskjöld-Weg 1-565760 Eschborn, Germanywww.gtz.de
On behalf of Federal Ministry for Economic Cooperation and Development (BMZ)
Editorial staffDiana KraftTel: +49 (0)6196 79 4101Fax: +49 (0)6196 79 80 4101Email: [email protected]
Renewable Energies in West Africa 211

CONTENTS SIERRA LEONE
ACRONYMS, ABBREVIATIONS AND MEASUREMENTS 213
SUMMARY 214
1 COUNTRY INTRODUCTION 216 1.1 Geography and Climatic Conditions 216 1.2 Political, Economic and Socio-economic Conditions 216
2 ENERGY MARKET IN SIERRA LEONE 217 2.1 Overview of the Energy Situation 217 2.2 Energy Capacities, Production, Consumption and Prices 217 2.3 Market Actors and Regulation Structures 222
3 POLICY FRAMEWORK FOR RENEWABLE ENERGIES 223 3.1 Policies, Strategies and Programs for Renewable Energy Promotion 223 3.2 Regulations, Incentives and Legislative Framework Conditions 223
4 STATUS AND POTENTIAL FOR RENEWABLE ENERGIES 225 4.1 Biomass/Biogas 225 4.2 Solar Energy 225 4.3 Wind Power 226 4.4 Hydro Power 226
5 MARKET RISKS AND BARRIERS 226
6 RENEWABLE ENERGY BUSINESS INFORMATION AND CONTACTS 228
7 BIBLIOGRAPHY 229
Renewable Energies in West Africa 212CONTENTS
SIERRA LEONE

ACRONYMS AND ABBREVIATIONS SIERRA LEONE
APC All People’s Congress BADEA Arab bank for economic development in Africa) BHEP Bumbuna Hydroelectric Project BKPS Bo-Kenema Power Services CFL Compact Fluorescent Lamp DANIDA Danish International Development Agency DC Direct Current EFA Environmental Foundation for Africa e.g. ex gregie/for example FOB Free of Board GDP Gross Domestic Product GoSL Government of Sierra Leone GTG Global Trading Group HDI Human Development Index IEL Income Electrix Limited IPP Independent Power Producer JICA Japan International Cooperation Agency KPS Kingtom Power Station Le Leone (Sierra Leonean currency) LPG Liquefied Petroleum Gas MAFS Ministry of Agriculture and Food Security MEP Ministry of Energy and Power MF Ministry of Finance MFO Marine Fuel Oil MLIRSS Ministry of Labor, Industrial Relations and Social Security MMR Ministry of Mineral Resources MoU Memorandum of Understanding MTI Ministry of Trade and Industry NCP National Commission for Privatization NP National Petroleum Company NPA National Power Authority PIU Project Implementation Unit PPP Public-Private Partnerships PSP Private Sector Participation PU Petroleum Unit PV Photovoltaic RE Renewable Energy SDF Saudi Development Fund SHS Solar Home System SLEDIC Sierra Leone Export Development and Investment Corporation UNAMSIL United Nations Mission in Sierra Leone UNECA United Nations Economic Commission for Africa UNIDO United Nations Industrial Development Organization USD United States Dollar
Renewable Energies in West Africa 213ACRONYMS, ABBREVIATIONS AND MEASUREMENTS
SIERRA LEONE

Renewable Energies in West Africa 214ACRONYMS, ABBREVIATIONS AND MEASUREMENTS
SIERRA LEONE
MEASUREMENTS
GWh gigawatt hour (1 GWh = 1,000,000 Kilowatt hours (kWh)) kg kilogram km2 square kilometer kWh kilowatt hour kVA kilovolt-ampere m/s meters per second m3 cubic meters mm millimeter MW megawatt (1 MW = 1,000 kW) MWh megawatt hour MT million tons toe tons of oil equivalent yr year t ton W Watt Wp Watt-peak ºC degree Celsius € Euro (1 Euro = 4,233.01 Le)

SUMMARY
The Country Study of Sierra Leone is to provide an overview of the country’s energy market and to support decision-mak-ing for private investments for the Renewable Energy (RE) sector in Sierra Leone. The study is structured as follows:
Chapter one provides Background Information on Sierra Leone. This includes an overview of geographical and climat-ic conditions, as well as the most important facts in view of political, economic and socio-economic conditions of Sierra Leone.
Chapter two summarizes facts and figures of Sierra Leone’s Energy Market including stakeholders and market actors involved as well as sector related regulations.
Chapter three presents the currently existing Political Frame-work for Renewable Energies in Sierra Leone. This includes an overview of support mechanisms for RE technologies as well as other already existing regulations, incentives and legislative framework conditions.
Chapter four provides a brief overview of the Status Quo and Potential for Renewable Energies in Sierra Leone.
Chapter five summarizes the existing and potential Market Risks and Barriers in general with focus on RE.
Chapter six presents a compilation of the most relevant Renewable Energy Business Information and Contacts of Sierra Leone.
Renewable Energies in West AfricaSUMMARY 215
SIERRA LEONE

1 COUNTRY INTRODUCTION
1.1 GEOGRAPHY AND CLIMATIC CONDITIONSSierra Leone is a tropical country that stretches along the West coast of Africa between latitudes 7 ° North and 10 ° North, and longitudes 13 ° 30’ West and 10 ° 30’ West. It has a total surface area of 72,000 km2 (≈ 28,000 square miles). Its bor-ders are the Atlantic Ocean with a coastline of approximately 340 km (≈ 210 miles) in the West, Guinea in the North West and East and Liberia in the South East.
For administrative purposes, the country is divided into three Provinces (Northern Province, Southern Province and Eastern Province) and one Area (Western Area that hous-es the capital city of Freetown). The Provinces are further di-vided into twelve districts. The western area is divided into the Western Rural District and the Western Urban District. The Western Rural District consists of the following wards: Koya, Mountain rural, Waterloo and York rural, while the Western Urban consists of Central 1 and 2, East 1, 2 and 3 and West 1, 2 and 3.
The climate of Sierra Leone is tropical with constantly high temperatures and marked wet and dry seasons. The daily av-erage temperature varies but little throughout the year. The lowest average temperatures occur in the mid-wet seasonal months of July and August with thickest cloud cover. The highest temperatures occur in March and April when insula-tion is high and cloud cover low. Sierra Leone’s mean tem-perature throughout the year is about 27 °C. The country has a fairly high rainfall; it records an average of about 2,950 mm of rainfall in 2003 making it one of the wettest countries in West Africa.
Renewable Energies in West Africa 216
SIERRA LEONE
COUNTRY INTRODUCTION
1.2 POLITICAL, ECONOMIC AND SOCIO-ECONOMIC CONDITIONS
The Republic of Sierra Leone was a former British colony that gained its independence in April 1961. It is a multi-party dem-ocratic sovereign state that has just got over a ten-year rebel conflict, which devastated the country’s physical and social infrastructures. According to the 1991 constitution, the three arms of the Government are the Executive, the Parliament, and the Judicial. The current president is Dr. Ernest Bai Ko-roma (as to 2009). He is the leader of the All People’s Congress (APC), which is the dominant political party in the country.
For over two decades, the institution of local govern-ments was on hold. In 2004, however, local governance was once again reinstated through an Act of Parliament. 19 Lo-cal Councils (LCs) were established, covering all districts and town centers in Sierra Leone, including the capital of Free-town. According to section 20 (1) of the Act, the LCs are the highest political authority in their localities. They have legis-lative and executive power to be exercised in accordance with the Act or any other enactment. The LCs are responsible for promoting the development of their localities and the welfare of the people and are entitled to use any resources at their disposal including resources and capacities they can obtain from the central government and its agencies, national and international organizations and the private sector.
The LCs are financed through revenue collections of their own, by central Government grants for devolved func-tions and by transfers for services delegated from Government ministries. In terms of political stability, civil liberties, and political rights, Sierra Leone is now comparable to the average of the West African region. According to the 2004 census, the current population of Sierra Leone is 5,473,530 million with a growth rate of about 2.6 %. Women account for about 51 % of the population. The population is youthful; those in the age range of 15–64 years account for about 52 %. Over the years, the urban population has increased at a faster rate than the rural, largely due to rural neglect and the civil conflict. However, at least 65 % of the population still live in rural ar-eas and are mostly engaged in agricultural, mining and other non-farm activities.
Table 1 shows the projected national population. The country’s population is expected to reach about 6.5 million by 2015. Future percentage of the rural population is envisaged to decrease over the years due to migration to the urban areas for better life.
INDICATOR 2006 2007 2008 2009 2010 2011 2012 2013 2014 2015
Population (x 1000) 5,217 5,343 5,474 5,610 5,747 5,189 6,038 6,190 6,348 6,506
TABLE 1
Projected Demographic Indicators for Sierra Leone (2006–2016)
Source: SSL, as of 2005
FIGURE1:
Map of Sierra Leone
Shenge
Momaligi
BoKenema
Lunsar
Kambia
LungiPepel
Makeni
Koidu
Kailahun
Bonthe
Loma Mansa
Kabala
FREETOWN
SulimaNorth Atlantic Ocean
L I B E R I A

Renewable Energies in West Africa
SIERRA LEONE
COUNTRY INTRODUCTION
Though the country is endowed with substantial mineral re-sources – diamonds, rutile, bauxite, gold and iron ore as well as rich agricultural and marine resources (which are the major sources of its export earnings) – it is one of the least developed countries in the world. This is largely due to the undeveloped economic and social infrastructures, serious social disorders and the ten-year civil conflict that continues to hinder eco-nomic activities. As stated in the CIA World Fact Book 20081, the 2007 estimations show the country’s low level of social development: life expectancy is only 43 years, infant mortality is 15.6 %, about 64 % of those over 15 years are illiterate and about 93 % of the population have no access to electricity.
Sierra Leone’s economy is predominated by agricul-ture, followed by the service sector and industry. Agriculture accounts for about 45 % of the Gross Domestic Product (GDP) (see Fig 2), 61 % of employment and 12 % of export earnings. The service sector constitutes about 35 % of the GDP while industry accounts for about 8 %. Before the civil conflict in 1991, mining was the second most important economic activ-ity in the country, accounting for about 10 % of GDP, 14 % of total employment and 85 % of exports. Currently, alluvial and kimberlite diamond mining are the major sources of hard currency earnings. Manufacturing consists mainly of the processing of raw materials and of light manufacturing for the domestic market.
Figure 3 shows the nation’s GDP at constant market prices in 2001 and inflation from 2001–2007. The average growth rate (year-to-year) of the GDP is over 10 %. There was a steady increase in the economy over the period under consideration. Inflation in 2004 was the highest, equaling about 14 %, while the current inflation rate is about 8 %. The high inflation rates adversely affect the poor (representing the majority of people) by reducing their purchasing power.
Sierra Leone is a poor African country with tre-mendous inequality in income distribution. According to the 2007/2008 Human Development Report2, the country ranked 177 out of 177 with a Human Development Index (HDI) of 0.336 and a GDP per capita of 806 USD based on purchasing power parity.
The GINI index3 reveals the wide gap between the rich and the poor in Sierra Leone. Table 2 illustrates the levels of poverty in Freetown, rural areas, other urban areas and on the national level. On the national level, about 26 % of the population are poor in food meaning that they cannot afford adequate daily nutrition. When non-food basic needs are also taken into account, the total rate of poor people rises to about 70 %.
1 CIA, 2008
2 UNDP, 2007/2008
3 THE GINI COEFFICIENT IS A MEASURE OF STATISTICAL DISPERSION DEVELOPED
BY THE ITALIAN STATISTICIAN CORRADO GINI AND PUBLISHED IN HIS 1912 PAPER
„VARIABILITY AND MUTABILITY“. IT IS COMMONLY USED AS A MEASURE OF
INEQUALITY OF INCOME OR WEALTH.
217
4.000,00
3.500,00
3.000,00
2.500,00
2.000,00
1.500,00
1.000,00
500,00
4.500,00
5.000,00
0
2001 2002 2003 2004 2005 2006 2007
GDP
at C
onst
ant 20
01 M
arke
t Pr
ices
(Bill
ion
Le)
16
– 6
– 4
– 2
0
2
4
6
8
10
12
14
Infla
tion
( %
) Ye
ar-o
n-Ye
ar
Source: Bank of Sierra Leone, as of 2008
FIGURE 3
GDP and Inflation (2001–2007)
Source: Bank of Sierra Leone, as of 2001–2007
FIGURE 2
Sectoral Composition of GDP
2001 2002 2003 2004
10 %
20 %
30 %
40 %
50 %
60 %
70 %
80 %
100 %
90 %
2005 2006 2007
Agriculture Industry Services FISIM Import Taxes (Net)
0 %
TABLE 2
Incidence, Depth and Severity of Poverty by Area
Source: Sierra Leone PRSP, as of 2005
AREAS SHARE OF SAMPLE ( %)
FOOD POOR ( %)
TOTAL POOR P0 ( %)
POVERTY GAP INDEX P1 ( %)
POVERTY SEVERITY INDEX P2 ( %)
PROPORTION OF SIERRA LEONE’S POOR ( %)
INCOME GAP RATIO (P1/P0)
Freetown 10.4 2.0 15.0 4.0 4.0 2.2 27.0
Rural areas 64.4 33.0 79.0 34.0 19.0 72.8 43.0
Other urban areas 25.1 20.0 70.0 26.0 14.0 25.1 37.0
National 100.0 26.0 70.0 29.0 16.0 100.0 41.0

Renewable Energies in West Africa 218
SIERRA LEONE
COUNTRY INTRODUCTION
2 ENERGY MARKET IN SIERRA LEONE
2.1 OVERVIEW OF THE ENERGY SITUATIONOver the last 20 years, the supply of electricity has steadily de-creased in Sierra Leone. During the civil war, most of the pro-duction units and distribution infrastructure were destroyed. Sierra Leone is slowly emerging from the protracted civil war, yet the rebuilding of energy infrastructure takes more time than expected.
2.2 ENERGY CAPACITIES, PRODUCTION, CONSUMPTION AND PRICES
Electricity SectorThe electricity industry consists of the Western Area grid cen-tered in Freetown and the provincial systems. The provincial systems originally consisted of 12 isolated systems located in the headquarter towns. Due to the destruction during the civil conflict, all systems are beyond sensible economic repair except for the Bo-Kenema Power Services (BKPS) system. In general, the country’s power systems are operated by the Na-tional Power Authority (NPA) and BKPS.
In 2007, the electricity generation in Freetown was very unsatisfactory; it declined continuously and the available generating capacity by the end of the year was about 6 MW. As a result of the low available generating capacity, the elec-tricity market was opened to the private sector. Therefore, the Government of Sierra Leone (GoSL) engaged two Independ-ent Power Providers: the Global Trading Group (GTG) for the provision of 15 MW at Kingtom for one year (December 2007 to December 2008) and the Income Electrix Limited (IEL) for the provision of a total of 25 MW to be installed at Blackhall Road and other locations in Freetown to salvage the electricity supply crisis.
Between 1960 and 1995, the country’s total installed and operating electricity generating capacity was about 42 MW with 13 power stations located all over the coun-try using diesel engine generator units. Owing to the poor performance and the civil conflict, almost all the provincial thermal plants (except for Bonthe and Moyamba) have either deteriorated beyond sensible economic repair or have been completely destroyed. The current total installed capacity excluding auto-producers (from the mining, industrial and commercial sector) is about 41 MW with 33.14 MW in Free-town and the original capacities in Bo and Moyamba.
The national electricity production (by NPA and BKPS) between 2000 and 2007 was not satisfactory (see Figure 4). It peaked in 2002 with an annual generation of 142 GWh and drastically declined to 40 GWh in 2006 and 45 GWh in 2007. The peak generation in 2002 was due to the change in the NPA management in 2000 and the increased generating capacity (3 x 1.28 MW Caterpillar generating sets and the 6.3 MW Mirrless generating set). In 2003, another management was instituted, and due to its poor management there was a continuous decline in electricity generation be-tween 2003 and 2007. Within this period, the use of imported petrol/diesel generators became the only alternative for house-
holds as well as private and public sector businesses. The esti-mated national private generation is in the order of 80 MW. The insecurity of power supply coupled with the inadequate distribution capacity of the NPA has forced most businesses to rely on an energy generation of their own in spite of its high costs. This has led to high production costs, which, among other reasons, has limited the competitiveness and growth of the manufacturing sector.
Figure 5 shows the electricity consumption pattern by the various sectors. The total consumption is less than the energy produced due to the high system losses, which are es-timated at 30–38 %. In 2000, the per capita electrical energy consumption was 17 kWh. This increased to 30 kWh in 2002 and fell gradually to 7.7 kWh in 2006.This is far from being satisfactory, especially when compared to Ghana that had a per capita consumption of approximately 420 kWh in 2006.
The electricity tariffs over the years 1996–2005 are given in Table 3 with the corresponding dollar exchange rates (as of 2000–2007) depicted in Table 4. Up to 2000 there was a dif-ference in tariffs between state-run and private institutions. Presently there is no such distinction. The utility serves about 45,000 customers in the Western Area and about 10,000 in the BKPS region. The overall consumer base in Sierra Leone is about 7 % with the provincial towns and rural areas ac-counting for between 2–3 %. Due to the under-performance
Source: National Power Authority (NPA) & Bo-Kenema Power Services (BKPS), as of 2008
2000 2001 2002 2003
160.000
100.000
80.000
60.000
40.000
20.000
02004 2005 2006
120.000
140.000
2007
78.397
123.808
141.934129.609
106.734
75.349
40.292 45.204
FIGURE 4
National Electricity Production (MWh; 2000–2007)
National Power Authority (NPA)
Total
BKPS
Commercial
Industrial
Domestic
Total
Source: NPA & BKPS, as of 2008
FIGURE 5
Electricity Consumption Pattern by Sector
2000 2001 2002 2003 2004 2005 2006 2007
100.000
50.000
40.000
30.000
20.000
10.000
80.000
90.000
70.000
60.000 55.173
80.260
91.522
79.16075.110
55.449
28.35532.835
-

Renewable Energies in West Africa 219
SIERRA LEONE
COUNTRY INTRODUCTION
6 THESE GENERATORS ARE IMPORTED MAINLY FROM DUBAI AND EUROPEAN COUNTRIES.
7 THE UNIT OF ENERGY CONSUMED EQUALS 1 KWH.
8 1 EURO = 4,23301 LE
of the NPA, the sale of imported generators6 has become a very vibrant business in the country. The general cost is around 300 USD/ kVA depending on the brand. There is a cheap brand of generators producing at a cost of about 100 USD/ kVA, which has become very popular espe-cially for consumers with essential needs on the low load level, such as for lighting.
There are a number of auto producers meeting their own demand. They include the mining companies, industrial, commercial and domestic consumers who continue to be cus-tomers of the NPA and BKPS. It is estimated that their self-generation capacity is over 40 MW.
TARIFF
STRUCTURE
ENERGY CONSUMPTION
LEVELS (UNITS7)
ENERGY CHARGE (LE/ KWH)
1996 1998 2000 2003 2005
Tariff 1 Domestic
0–30 90 117 205 287 373
31–150 110 143 293 410 533
Above 150 130 169 389 545 709
Min. charge 2,500 3,250 6,143 8,600 11,180
Tariff 2 Non-domestic (commercial)
0–30 100 130 358 501 651
31–150 120 156 429 601 781
Above 150 130 169 465 651 846
Min. charge 3,000 3,900 10,725 15,015 19,520
Tariff 3 State-run institutions
All units 100 130 429 601 781
Min. charge 5,000 2,600 17,875 25,025 32,533
Tariff 3A Others
All units 120 156
Min. charge 5,000 6,500
Tariff 4 Industry
All units 150 195 517 724 941
Min. charge 50,000 65,000 65,000 91,000 118,300
Tariff 5 Street lighting
All units 120 156 435 609 792
Min. charge 7,500 9,750 796 20,475 26,618
Tariff 6 Temporary supplies
All units 200 260 - 700 910
Min. charge 5,000 6,500 - 8,680 11,284
Tariff 7 Welders
All units 200 260 546 764 993
Min. charge 10,000 13,000 19,500 27,300 35,490
TABLE 3
Electricity Tariffs (1996–2005)
Source: National Power Authority (NPA), as of 20068

Renewable Energies in West Africa 220
SIERRA LEONE
COUNTRY INTRODUCTION
Petroleum SectorPetroleum products (petrol, diesel and Marine Fuel Oil (MFO)) consumed in the country are imported in refined form. The annual average volume of imported petroleum products is about 200,000 metric tons, but this figure de-clined significantly during and after the war. Table 4 shows the volumes imported between 2000 and 2007.
The petroleum marketing and sales in the country are executed by Petro Leone, Sierra Leone National Petroleum Company (NP), Safecon, Total (formerly Mobil) and Leonoil. Though all companies import petroleum products, Petro Leo-ne is the main importer and provider. Among the other four companies, NP dominates the market with 50 %, followed by Safecon (24 %), Total (23.5 %) and Leonoil (2.5 %). Prices for petroleum products are fixed due to an agreement that takes into consideration the trade price and the exchange rate (see Table 5). Allowances are made for various levies and distribu-
tion costs. The prices of the above mentioned petroleum prod-ucts in the provinces vary due to varying transport distances from Freetown to the final destination. Due to the world mar-ket, the price of petrol, diesel and kerosene fluctuated between 14,000 Le and 16,500.00 Le (1 Euro = 4,233.01 Le) in 2008.
The industry is faced with a number of problems. Stor-age capacity is limited and this prevents huge quantities to be imported at any one given time. Also, foreign exchange is of-ten not readily available and this has a far-reaching effect. The petroleum products are mainly imported from Côte d’Ivoire (Abidjan). Therefore, the oil companies experience some sup-ply difficulties due to the unavailability of the products in Abidjan and bottlenecks in allocation or chartering of vessels. The procedures for procurement and delivery of products of-ten cause long delays and unreliable supplies.
YEAR PETROL(MT)
DIESEL(MT)
KEROSENE(MT)
JET A1(MT)
MFO(MT)
NAPHTA(MT)
TOTAL(MT)
2000 29,874 39,561 39,981 - 15,607 - 125,023
2001 28,370 31,540 35,701 - 26,824 - 122,435
2002 36,524 49,462 54,786 - 26,433 - 167,205
2003 47,498 59,203 56,009 - 26,988 - 189,698
2004 54,880 68,663 21,480 31,132 34,432 - 210,587
2005 54,105 177,931 16,740 16,347 18,768 - 283,891
2006 59,317 160,902 14,503 13,586 18,825 3,524 270,657
2007 49,792 128,597 9,956 11,675 8,799 - 208,820
Source: Petroleum Unit–Sierra Leone, as of 2008
TABLE 4
Volumes of Petroleum Products Imported in Sierra Leone (2000–2007)
PRICE COMPONENT PETROL DIESEL KEROSENE MFO
Product Import–Platt FOB/USD/MT 512.92 449.93 535.23 237.77
Freight/USD/MT 33.26 40.00 30.00 35.00
C & F (Freetown)/USD/MT 546.18 489.93 565.23 272.77
Import duty 5 % C & F 27.31 24.50 28.26 13.64
Storage 4.70 4.70 4.70 4.70
Port charges 3.00 3.00 3.00 3.00
Demurrage 2.00 2.00 2.00 2.00
Freight levy 2.00 2.00 2.00 2.00
Other charges (transfer, agency fees etc.) 5.68 4.96 5.51 3.07
Landed cost–USD/MT 590.87 531.09 610.70 301.18
Conversion IG/MT 300.00 256.00 275.00 236.00
Landed cost–USD/IG 1.97 2.07 2.22 1.28
Exchange rate adjustment–Le/USD 2,950.00 2,950.00 2,950.00 2,950.00
Landed cost Le/IG 5,810.20 6,119.94 6,551.11 3,764.73
Distribution cost 1,311.63 1,217.70 1,358.85 596.33
Petroleum fund 15.00 15.00 15.00 –
Excise duty 1,613.17 1,397.36 575.04 238.98
Road user charge 750.00 750.00 – –
Pump Price Le/IG (Freetown) 9,500.00 9,500.00 8,500.00 4,600.04
Source: Petroleum Unit–Sierra Leone, 2006
TABLE 5
Petroleum Product Pricing Formula (31st March 2005)

Renewable Energies in West Africa 221
SIERRA LEONE
COUNTRY INTRODUCTION
Liquified Petroleum Gas This type of fuel is very important from an environmental point of view to phase out the production and use of wood and charcoal, but its use and hence its market is very small. Table 6 shows an estimate of the share of each energy source in house-hold consumption. The percentage use of Liquefied Petroleum Gas (LPG) and electricity for cooking is almost negligible. The use of LPG in the near future will be zero if no policies are put in place to encourage its use. The LPG market is not well organized; individuals with the United Mission in Sierra Leone (UNAMSIL) import this energy source from neighbor-ing countries. The National Petroleum Company and Shell did use to import LPG, but have almost stopped because of problems with availability, cost and the size of its market.
Table 7 shows the current prices for LPG in Freetown and in the provinces. LPG is sold in metal containers of dif-ferent sizes. Affluent households, some hotels and restaurants and the marine industry use this energy source for cooking and heating.
Biomass SectorBiomass has been a source of energy for centuries. Due to the recent increase of oil prices in the world market, bioenergy (in form of biofuels) has been seen as an alternative to deal with the oil supply constraint. Though it plays an important role in reducing greenhouse gas emission, the negative direct and in-direct effects such as soil degradation, biodiversity loss, stress on water resources, trade-off with food supply etc. demand great attention. As far as Sierra Leone is concerned, little or almost nothing so far has been done in the direction of biofuel as an alternative to petroleum.
Fuel wood is the most widely used fuel in the country and is the most commonly used fuel for cooking and heat-ing. Most households in the provinc es collect fuel wood from shrubs and forests, although a significant percentage (about 90 % of households in Freetown) have to buy it. According to Conteh (1997), 7,868 tons per annum of fuel wood reach Freetown (see Table 8). Charcoal and kerosene are also widely used, though far less than fuel wood.
The retail prices of fuel wood and charcoal vary throughout the country and according to the two seasons (meaning higher prices during rainy season). Fuel wood is sold in bundles with an average mass of 4 kg and charcoal is sold in 50 kg bags. In 2008, town prices of fuel wood ranged between 250–400 Le while farm gate and road prices range between 150–250 Le. Charcoal prices range between 11,000–15,000 Le in Freetown and other regions, roadside prices range be-tween 6,000–8,000 Le.
FUEL WOOD CHARCOAL KEROSENE LPG ELECTRICITY
92.0 % 4.8 % 2.7 % 0.1 % 0.4 %
Source: National Energy Policy for Sierra Leone (final draft as of May 2004)
TABLE 6
Petroleum Product Pricing Formula (31st March 2005)
BOTTLE SIZE (LB) 4.41 14 28 33 50 86 120
PRICE (LE) 10,240 32,500 65,000 76,600 116,000 199,650 278,500
Source: market survey compiled by the author (as of 2004)9
TABLE 7
LPG Prices for Different Containers
1996 1997 1998 1999 2000 2001 2002
Fuel wood charcoal (m3)
2,450,860 2,507,475 2,565,398 2,624,658 2,685,288 2,747,318 2,810,781
Fuel wood (m3) 1,942,191 1,987,056 2,032,957 2,079,914 2,127,964 2,177,120 2,227,412
Wood for charcoal (m3)
4,069,352 4,163,352 4,259,528 4,357,920 4,458,592 4,561,584 4,666,952
Charcoal (MT) 508,669 520,419 532,441 544,740 557,324 570,198 583,369
Source: Redwood-Sawyerr and Conteh, as of 2005
TABLE 8Estimations of Wood Products Consumption (1996–2002)
9 1EURO = 4,23301 LE, AS OF 2004; 5,66560, AS OF 2009

Renewable Energies in West Africa 222
SIERRA LEONE
COUNTRY INTRODUCTION
2.3 MARKET ACTORS AND REGULATION STRUCTURESThe Ministry of Energy and Power (MEP) is the governmen-tal authority responsible for the electricity and water sectors. Its mandate includes sector policy formulation, planning and coordination. Besides the electricity sub-sector, various other sub-sectors of the wider energy sector of the Sierra Leonean economy fall within the scope of responsibilities of various ministries. The MEP handles matters related to electric power supply, including hydroelectric schemes and, nominally, RE matters related to solar and wind energy. The Ministry of Ag-riculture and Food Security (MAFS) handles biomass issues (plant- and animal-derived matter), especially fuel wood. Pe-troleum marketing and sales are handled by the Ministry of Trade and Industry (MTI); the Ministry of Finance (MF) also plays a significant role in the import and storage of petroleum products. Petroleum exploration and extraction is within the scope of responsibilities of a Presidential Petroleum Commis-sion. The Ministry of Mineral Resources (MMR) deals with extraction of minerals, including energy related minerals.
It is interesting to note that the devolved functions of each ministry are listed in the 2004 Local Government Regu-lations. Only the rural water supply and community owner-ship of wells, bulk supply of water (except where privatized) and sanitation, however, are listed, however, for the MEP. There is no specific mention of energy and electricity provi-sion for the local communities under the councils. This may, however, be subsumed under development issues counting as one the functions of the LCs.
Electricity SectorThe electricity industry in Sierra Leone is state owned and vertically integrated. It is operated by the NPA and the BKPS. The National Power Authority Act of 1982 established the NPA as the entity with the sole responsibility for carrying out power generation (including Hydro Power), transmission, dis-tribution and supply in the country. The 2005 NPA (Amend-ment) Act stipulated additional governance duties for NPA.
BKPS was established in 1991 as a semi-autonomous body. It resulted from an agreement between the Danish In-ternational Development Agency (DANIDA), the GoSL and the NPA to operate with a certain degree of autonomy. It was formed as a result of an NPA Board decision and was subse-quently established as an entity with its own Articles of As-sociation. Formally, the BKPS is not an operating division of the NPA, but reports to the NPA Board through its Steering Committee.
The NPA is the sole supplier of electricity in the coun-try. The BKPS, which is a semi-autonomous division of NPA, is responsible for the integrated supply of electricity for the townships of Bo and Kenema and their environs. The main legislative arrangements for the electricity sector are contained in the National Power Authority Act of 1982 and the National Power Authority (Amendment) Act of 2005.
The MEP is responsible for the entire electricity sec-tor. This Ministry was created in 1974 for establishing and implementing the state policy for electricity and other energy related sub-sectors. Therefore, up until 2002, the electricity industry was sector regulated through the MEP. In 2002, the National Commission for Privatization (NCP) was created
through an Act of Parliament. Its function, among others, is the privatization and reform of public enterprises with the NPA being part of the first schedule of public enterprises for divestiture. Therefore, operational oversight of NPA is now provided by a Board, which reports directly to the NCP in preparation for Private Sector Participation (PSP).
Though the ownership and supervisory role of the MEP for the NPA have been repealed and vested in the NCP, the MEP retains the overall responsibility for policy formu-lation, planning and coordination in the respect of the de-velopment and utilization of the country’s energy resources. Currently, the lack of appropriate staff in the ministry is a major barrier in view of policy-making, planning, control and coordination.
The Project Implementation Unit (PIU) for the Bum-buna Hydroelectric Project (BHEP) reports to the MEP. The 1982 NPA Act defines the NPA’s responsibilities and rights with respect to the development of hydroprojects in the coun-try. The NPA forms part of the Steering Committee which supervises the PIU, it is, however, questionable if all duties can actually be performed.
Petroleum SectorThe Petroleum Unit (PU) was set up in June 1992 under GoSL’s comprehensive Structural Adjustment Program for Macroeconomic Stabilization. This unit was meant to func-tion as an independent coordinator between the GoSL, donor institutions and the petroleum industry in and outside of Si-erra Leone. The PU is supervised by the MTI in close collabo-ration with the MF. The PU has been given a new mandate to serve as industry regulator/coordinator.
The petroleum exploration and production sector is regulated by the Petroleum Exploration and the Protection Act of 200110. This act provides for the establishment of the Petroleum Resources Unit, which is under the authority of the President and headed by a general manager. This unit as the main administrative body was established to represent the state exclusively in negotiations with interested parties for the exploration, development or production of petroleum, to act on behalf of the state in petroleum agreements and to regulate the petroleum industry in Sierra Leone.
Biomass SectorAs to the supply of firewood to households in the country, no governance and/or regulatory authority exist to oversee the suppliers’ activities. Producers and sellers of charcoal in the Western Area partially belong to the Coal Producers and Sellers Union, headquartered at Waterloo Street in the capital of Freetown. The union is registered with the Forestry Divi-sion of the MAFS. The Union is headed by a chairman, other members of the executive being the vice chairman, financial secretary, and secretary general. Membership in the Union is open to all coal producers and sellers for a minimal fee. The union pays annual taxes and dues to the Government.
10 LEXADIN/ THE WORLD LAW GUIDE, 2009

Renewable Energies in West Africa 223
SIERRA LEONE
3 POLICY FRAMEWORK FOR RENEWABLE ENERGIES
3.1 POLICIES, STRATEGIES AND PROGRAMS FOR RENEWABLE ENERGY PROMOTION
There used to be no policy instruments to address specific en-ergy issues in Sierra Leone. Therefore, the United Nations Eco-nomic Commission for Africa (UNECA) provided funding to the GoSL in the first quarter of 2004 for a study leading to the formulation of a national energy policy for the country.
CEMMATS, a local consultancy firm, was contracted to carry out an overview study. Based on an assessment of the existing institutional framework as well as energy demand and supply patterns, a document draft entitled “The Energy Policy for Sierra Leone” containing policy statements on spe-cific energy issues was produced. This document was present-ed for validation in a consultative session of stakeholders from 29–30 June 2004. It was also presented to the MEP, but up till now this document has not been ratified by the Parliament and thus established as a working document. As defined in the energy policy draft document, the main policy target for electricity is to provide access for 35 % of the population by 2015. Hence, no contribution of Renewable Energy to elec-tricity was mentioned.
The following policy statements, however, relate to the promotion of RE:
Appropriate financial and administrative institutions will be set up to manage RE
Consideration of tax reductions and incentives for RE equipment
Manufacturing of RE equipment to actively encourage promotion and provision of investments
Facilitation of adequate financing schemes for RE tech-nologies by establishing sustainable financing mechanisms to make them more accessible
Ensuring that RE producers and importers ascribe to certi-fied performance and technical standards
Encouragement of solar water heating in hospitals, clinics, boarding homes etc. for sterilization and hygiene purposes
Taking measures to allay the fear of using solar cookers in rural areas because of cultural and traditional practices
Encouragement of co-operatives and energy service com-panies in order to facilitate the financing mechanism for sustainable and transparent RETs
Establishment of appropriate norms, codes of practice, guidelines and standards for RE thus creating an enabling environment for sustainable development
Encouragement of local manufacturing of RE generator systems
According to the Sierra Leone first Poverty Reduction Strat-egy Paper (PRSP) for 2005–200711, the Government’s objec-tive in the energy sector was to expand the population’s access to reliable modern energy services while improving supply re-liability. In this regard, the planned strategy was to encourage both public and private investments, to promote an energy
mix with focus on RE resources and to improve the supply and demand management of traditional fuels.Owing to the pronouncement of His Excellency the President, electricity is the topmost priority of his Government aiming to restore electricity in the country. Thus, apart from other ex-isting projects, the current thinking of the MEP for rural elec-trification is to exploit the country’s small hydro potential.
3.2 REGULATIONS, INCENTIVES AND LEGISLATIVE FRAMEWORK CONDITIONS
Between 2006 and 2007, a number of offers by foreign private investors were made to the Government. A Memorandum of Understanding (MoU) was signed for some of these offers. Below is a list of some renewable energy related offers made to the Ministry:
Elsfield Energy (Elsfield Holdings Ltd.), 28 Felipe Road Chafford Hundred Grays Essex, UK
ENERGEON Inc., 2078 Willowbar Ct., Gold River, CA 95670, USA, by Prof. Balchandra, California: biomass power plant (medium- to long-term) of 100–500 MW capacity (biomass – such as tree branches, agricultural residues, municipal solid waste)
Waste to Energy (energy production using residues) by Alternative Use plc
5.0 MW solar system of electricity generation by NAANOVO Energy Inc. (through Chief Gbondo)
Biomass (Waste to Energy) project by Cinergex Solutions Ltd. (through David Donkor)
Bikongo hydro project
None of the listed projects have been realized so far, while the energy situation (electricity in particular) has deteriorated drastically. Table 9 shows the current installed and available capacity of the generators at the Kingtom Power Station (KPS) in Freetown and their status. The rest of the country is almost completely without electricity except the Bo-Kenema region, where there is a mix of hydro and thermal plants.
Owing to the deplorable electricity situation towards the end of 2007, the current President – on assumption of of-fice and in his first speech at the opening of Parliament – de-clared: “The utmost priority of my Government is the speedy provision of electricity supply.” Hence, to actualize the presi-dential declaration, a presidential Energy Emergency Task-force was created in order to develop a Strategic Plan/Road Map to address the energy crisis. This strategic plan is still be-ing worked on. Due to the status of electricity in the country, the main policy goals of the MEP and the respective strategies are depicted below. The main objective is to encourage both public and private sector investments in the energy sector and to promote energy security through the encouragement of the sustainable exploitation of Sierra Leone’s indigenous energy resources with focus on RE resources. The target areas to im-prove the current electricity supply are the Western Area and the provincial headquarter towns.
11 SIERRA LEONE PRSP, 2005-2007
COUNTRY INTRODUCTION

Renewable Energies in West Africa 224
SIERRA LEONE
In order to deal with the declining power generation in Free-town (Western Area) towards the end of 2007, the Govern-ment engaged two Independent Power Producers (IPP): the Global Trading Group (GTG) and the Income Electrix Lim-ited (IEL) for the provision of 15 MW and 25 MW respec-tively to salvage the electricity supply crisis. Currently, there is a slight improvement in the electricity supply in Freetown. In Addition to the emergency measures mentioned above, there are other projects in the pipeline for the improvement of elec-tricity supply in Freetown. These are as follows:
The repair of the Sulzer 4 (burnt alternator) and Mitsubishi (crankshaft problem) generators
The implementation of the Arab Bank for Economic De-velopment in Africa (BADEA) and the Saudi Development Fund (SDF) project for the installation of two 8.75 MW diesel generating units
The implementation of the Japan International Coopera-tion Agency (JICA) project for the supply and installation of two 5 MW generating sets at the Kingtom Power Sta-tion with an expected commissioning by mid 2009
It is hoped that the completion of the Bumbuna hydroelec-tric project phase I (50 MW) will suffice for the supply of the Western Area and parts of the Northern Province. With the start of the Bumbuna hydroelectric project and the imple-mentation of the other projects mentioned above, the available generating capacity is estimated at about 80 MW by 2010. The main challenge to receive and utilize such power is to install a transmission and distribution network. The current transport capacity of the network in Freetown is about 30 MW, but losses in the system are extremely high due to its age. Projects that are in progress for the expansion of the network are the Sierra Leone Power & Water Project (cr. 3945 – SL), the up-grading of the T&D network – 33 kV line as well as the con-struction of a sub-station at Regent by JICA with a 33 kV line from primary substation of Wilberforce toRegent and a 11 kV line from Kingtom Power Station to -Congo Cross Primary Substation and from there to Wilberforce. The Agency will also provide material for the 11 kV link between Falconbridge and Blackhall Road.
After the implementation of these projects, the trans-port capacity of the network will be strongly enhanced. In-creased generation capacity in the Bo-Kenema region is the
objective of the expansion of the Dodo Dam (Goma Hydro Power Station) and the repair of the thermal plant in Bo. Though the dam was upgraded from 4 MW to 6 MW by the Government of Sierra Leone in 2007, there is still room for a further upgrading of up to 12 MW. There are three generators with a total capacity of 5 MW installed at the Bo power sta-tion. Only one of them is functional with an available capac-ity of 0.7 MW. There is no further generation from the Bo power station due to lack of spares and fuel. Almost all other provincial electricity infrastructures are either in a state of dis-repair or in an unsatisfactory state. Few towns, as for exam-ple Moyamba, Pujehun, Makeni, Bonthe, Koidu and Kabala, have rudimental, yet incomplete electricity infrastructure. Other towns, e.g. Kambia, Rokupr, Port Loko, Lunsar, Njala and Kailahun, have no electricity infrastructure at all. In or-der to address the supply of electricity in the provinces, the following strategic actions are being implemented:
Connect towns along the Bumbuna transmission line (i.e. Magburaka, Makeni, Lunsar, Portloko and Masiaka) with the existing network
Exploit the country’s hydro potential with particular em-phasis on small and mini hydro projects
Explore the possibilities of alternative energy sources for power generation by engaging potential investors (IPPs) for biomass power, wind power and solar power
Set up pilot/demonstration solar energy plants (Solar Home Systems – SHS) in selected rural areas
GENERATOR INSTALLED CAPACITY [MW] AVAILABLE CAPACITY [MW] REMARKS
Sulzer 4 9.2 - Unavailable due to burnt alternator
Sulzer 5 9.2 7.5 Available
Mitsubishi 5.0 - Unavailable due to crankshaft problem
Mirrlees 2 6.9 - Unavailable due to cracks of cylinder heads
Mirrlees 3 6.3 - Unavailable due to burst engine block
Caterpillar 1 1.28 - Unavailable due to burst engine lock
Caterpillar 2 1.28 0.8 Available. Requires spare parts for overhauling as it has gone beyond the scheduled 9,000 hrs
Total 39.16 8.3
Source: Ministry of Energy and Power, as of 2007
TABLE 9
Installed and Available Generating Capacities at Kingtom Power Station–Freetown
COUNTRY INTRODUCTION

Renewable Energies in West Africa 225
SIERRA LEONE
4 STATUS AND POTENTIAL FOR RENEWABLE ENERGIES
4.1 BIOMASS/BIOGASThe biomass resources comprise residues from existing forests and deforested or otherwise degraded lands on which so-called energy plantations can be cultivated. Of the residues, 656,400 tons of crop waste (rice husk, rice straw, cocoa husk etc.) are being produced annually, with a total annual energy potential of 2,706 GWh. Table 10 provides an overview of estimated biomass production figures.
It should be noted that the 2,706 GWh per year en-ergy potential of crop residues (as calculated for 1996) cor-respond to the nation’s highest generation of electricity of 142 GWh per year in fiscal 2002. This gives an indication of the potential of a single biomass resource (e.g. crop residues) to adequately satisfy the country’s basic demand for electricity, which, assuming an average per capita requirement for basic human needs of 100 W, would turn out to be 4,800 GWh per year for a population of 5 million people using the power 24 hours a day throughout the year. Of the existing forests in Sierra Leone, the estimated incremental growth is between 770 and 1,500 m3 per year for closed high forests, 260 m3 per year for secondary forests and between 7,700 and 11,000 m3 per year for forest re-growth. Savannah woodland, coastal woodland and plantations account for the rest of the estimated 9,260–15,010 m3 of wood obtained from the forested area of the country (i.e., 730–2,250 m3 per year). Leaving out high and secondary forests, the rest of the forest types mentioned above can provide feedstock to biomass conversion technologies. Re-moval of the forest overgrowth in particular can increase the yields of the remaining high-quality wood. Deforestation in the country is estimated at 3,000 hectares per year. Deforested land can, however, be restored to productive use through the cultivation of energy crops. These energy plantations can also be established on the available savannah and coastal wood-lands. It should be noted that for all three biomass resources mentioned in the foregoing (residues, existing forests and de-forested or otherwise desolated land), an exhaustive quantita-tive assessment is a prerequisite to ensure an accurate overall assessment of their energy potential and a sustainable form of cultivation/forestation. Fuel wood and charcoal are the major renewable biomass energy forms used in Sierra Leone’s house-holds for cooking. About 87 % of the total energy demand in Sierra Leone are met by traditional energy resources. At the current deforestation rate and with 65 % of the population liv-ing in the rural areas, the harvesting of these traditional fuels can lead to serious environmental degradation entailing harm-ful health effects and other serious social impacts.
4.2 SOLAR ENERGYThe country experiences sunshine for most part of the year hence solar energy is available in abundance. A recent study estimated the average solar radiation at 1,460 to 1,800 kWh/m2/y, which points out the huge potential for solar power of the country. These data need revision since calculations were made from temperature and humidity measurements carried
out at only eight different sites across the country in 1996. The potential and economic feasibility of photovoltaic (PV) electricity generating costs needs to be further explored. Table 11 indicates figures before the civil war in Sierra Leone; now however, most of these PV installations are stolen or destroyed. Less than a quarter of these figures is based on information from the remote sites. The potential of redesigned installa-tions can be estimated at a total power output of 20.1 kW and more – considering that currently diesel generators are being used to power some of the stations instead of PV facilities.
Exemplary solar lighting systems were presented in 4 hinterland villages by the Competence Centre for Renew-able Energy at Allen Town, Freetown. The most recent solar power facility installed by Prof. J. A. S. Redwood-Sawyerr, Deputy Vice Chancellor of the University of Sierra Leone, at Tombo Village was commissioned by the Minister of Energy and Power, Haja Afsatu E. O. Kabba. Before the civil war, PV was used extensively in the telecommunication industry at repeater stations. Currently, repeater stations and cell sites are using diesel generators. Few SHS are used for lighting and entertainment, and one institution is using it for water pump-ing. The current installed capacity of solar PV in the country is about 25 kW with 60–80 % of this capacity being installed by the RCD Solar Company. It provides 120 W/4 kW solar systems for hospitals, secondary schools, domestic and com-mercial use. Significant work has also been done by the Envi-ronmental Foundation for Africa (EFA)12.
WASTE PRODUCED (1000 T/YR)
TOTAL ENERGY POTENTIAL (GWH/YR)
Rice husk 181.0 640
Rice straw 210.0 788
Cocoa husk 8.7 34
Coffee husk 30.5 130
Peanut shell 10.1 43
Palm kernel shell 75.9 346
Palm fruit fiber 47.5 306
Woody remains of palm fruit bunches 72.5 367
Bagasse 20.2 52
Total 656.4 2,706
Source: Swaray S.M and Keili A, as of August 2004
TABLE 10
Estimation of Annual Biomass Production
APPLICATIONS INSTALLATIONS CAPACITY (KW) OPERATING HOURS
Telecommunications only 38 13.36 24
Telecommunications and lighting
4 6.24 24
Lighting only 19 0.9 12
Lighting and refrigeration 3 1.2 24
Refrigeration only 10 2.0 24
Miscellaneous 7 1.5 -
Total 81 25.2 108
TABLE 11
PV Installations in Sierra Leone
Source: Redwood-Sawyerr and Sillah, as of 1999
12 EFA, AS OF 2009
COUNTRY INTRODUCTION

Renewable Energies in West Africa
SIERRA LEONE
4.3 WIND POWERData on wind speeds across the country are rare. The existing data on wind velocities indicate a countrywide average speed of 3–5 m/s. However, wind speeds of up to 12 m/s seem to be possible in some areas of the country. Should this in fact be the case, wind power may offer very promising opportunities for the overall energy sector of Sierra Leone. The MEP is cur-rently encouraging studies of sites around the country that may hold potential as economically exploitable resource bases. With wind turbines operated with low wind speed now on the market, there is a strong potential for these systems in the rural areas, especially the North of the country. There is cur-rently no known wind energy system applied in Sierra Leone.
4.4 HYDRO POWERThe estimated hydroelectric potential of Sierra Leone is 1,513 MW from about 27 different sites. Nearly all of them, how-ever, suffer from the enormous flow variation between the wet and dry seasons. According to the Lahmeyer International re-port (1996)13, only two of the 27 sites studied in the Master Plan are deemed to provide Hydro Power at attractive costs and with annual flow regulation. Yiben II, Benkogor III, Kambatibo, Betmai III, Yiben I and Bumbuna Falls are the most promising plants in terms of generation cost. Presently, Sierra Leone has built two hydroelectric plants. These are the 2.4 MW Guma plant, installed in 1967 in the Western Area, which has been out of service since 1982 due to electrical and mechanical damages, and the only operational 6 MW run of the river type located in the Eastern Province, some 380 km from Freetown and 69 km from the headquarter town of Ken-ema. This plant is operated by the BKPS consortium and is connected to a regional grid linking thermal power plants in Bo and Kenema. The consortium is made up of Danish ex-perts from DANIDA and a regional committee appointed by the Government.
One hydroelectric power plant has been under con-struction since 1990, i.e. the 50 MW Bumbuna Hydroelectric Power Plant. The Bumbuna HEP has been suffering from a protracted construction process and was further compounded by the political upheavals in the country. The source of gen-eration is the Rokel Seli River. Transmission lines, transform-ers etc. had already been installed before the war, which re-sulted in the damage of some of the pylons and transmission lines. The 161 kV transmission lines pass through a number of towns including Binkolo, Makeni, Lunsar, Masiaka and Wa-terloo. The sub-station at Kingtom, which has already been constructed, is intended to be used for distribution. The Bum-buna HEP is about 95 % completed and is expected to gener-ate 47.5 MW during the rainy season and less than 30 MW during the dry season. According to the NPA (Amendment) Act of 2005, a Special Purpose Company has been formed and registered to run the facility. It is also meant to form the backbone network for a national grid. The HEP’s total poten-tial is about 305 MW and plans are in progress to develop the second phase of the project.
Many of the rivers investigated suffice for only small to medium hydro systems (i.e. 1–100 MW) and there is also a potential for pico to mini hydro systems (5 kW to 1 MW).
The Master Plan, however, neglects potential resources un-der 2 MW. Hydro Power is expected to be an area of huge potential for Public Private Partnerships (PPP) and wider in-vestment by the private sector. Due to the lack of data from small capacities, the MEP (in collaboration with GTZ Sierra Leone) planned a basic study between 2006 and 2007 aimed at gathering hydrological data to feed into the design of small hydro projects with capacities of up to 1 MW. This study is yet to be executed. There exists a well-advanced plan for the construction of one Small Hydro Power Plant (1 MW) in Port Loko. The design has been completed and the project imple-mentation will start soon. It is a project funded by the Chinese Government, UNIDO and GoSL.
5 MARKET RISKS AND BARRIERS
The lack of an energy sector policy as well as a legal and regu-latory framework is a significant barrier to private sector entry in the electricity supply chain. As mentioned above, there is no legalized energy policy that creates a healthy environment for private sector investments in the energy sector and RE in par-ticular. This creates some uncertainties for investors regarding the commitment of the Government to liberalize the power sector. Relevant issues for the development of entrepreneur-ship in rural electricity supply in general and grid connected projects in particular remain unclear.
The current financial situation in the power sector is very unsatisfactory. NPA’s present tariffs for households are below production cost, and about 20 % of the consumption is not being paid for. Illegal connections and the lack of a proper customer census are some of the factors contributing to this situation. Though corruption is generally not very common, the amount of tips ensuring a smooth and successful business registration process is significant. Bureaucratic bottlenecks in-crease the cost of doing business e.g. in dealing with construc-tion permits and registering property (see table 12).
The major risk of solar appliances for a private business is the slow pace of the buying, installation and maintenance process. This is mainly due to the high costs involved resulting from high import tariffs. Import tariffs for solar appliances are between 40–50 % of their cost. Adding the necessary shipping costs, solar appliances can easily cost about two to three times as much as in Europe or America. The cost of a good quality CFL, for instance, is around 4.5 USD, a DC CFL is approxi-mately 17 USD, a solar lantern is about 75 USD, a 600 W power inverter is about 250 USD and an 80 Wp polycrystal-line solar module is about 700 USD.
The main thrust of the Government’s investment pro-motion policy is to eliminate the structural and physical dif-ficulties potential investors are currently facing. One of the key strategies is the simplification of business registrations and transactions through the consolidation of the role of the Sierra Leone Export Development and Investment Corporation (SL-EDIC) as a ‘one stop shop’. Any investor, whether domestic or foreign, may invest in any legitimate form of enterprise and
13 LAHMEYER, 1996
COUNTRY INTRODUCTION 226

Renewable Energies in West Africa
SIERRA LEONE
obtains a business name registration certificate, certificate of incorporation, business registration certificate and business license certificate. Thus, any person who wishes to invest in a business enterprise in the country shall, on request, be assisted by SLEDIC to obtain the above documents.
According to the Investment Promotion Act of August 2004, remittance of profits after taxes earned by a foreign in-vestor from a business enterprise is guaranteed and interna-tional transactions involving payments abroad shall be allowed without restriction. The Act also guarantees capital repatria-tion and loan remittance. No export license is required for the export of locally produced goods except gold, diamonds and selected other goods to be specified from time to time. A business enterprise requiring foreign labor should apply to the Ministry of Labor, Industrial Relations and Social Securi-ty (MLIRSS) for consideration in accordance with any enact-ment relating to labor matters. Foreign personnel with work permits are allowed to make remittances abroad through their commercial banks, as long as they pay their tax obligations as defined the Income Tax Act 200014.
In the case of a dispute between an investor and the state in respect of an investment business, the parties are obliged to settle their differences in accordance with the rules of procedure for arbitration of the United Nation Commis-sion on International Trade Laws. If a dispute between an investor and a non-governmental body cannot not settled amicably, the matter shall be referred to the relevant legal au-thority within Sierra Leone in accordance with the law bind-ing the transaction. Any person who, in the course of his of-ficial duties, transfers proprietary information obtained from an investor to any person to whom he is not authorized by any enactment commits an offence and is liable on conviction to a fine or imprisonment or both.
Apart from the hydroelectric projects, which the Government is implementing through the MEP, not many investments have been made in this sector. Few institutions and individuals are showing interest in the exploitation of RE in the country, but funding and collaboration is their main challenge. If any individual or institution intends to invest in this sector after registration of a company or NGO, the MEP helps to facilitate the implementation of any RE project. Since the Government intends to restore the electricity supply in the country, the MEP can intervene to facilitate the waiving of custom duties on imported machineries for electrification de-pending on the MoU signed between the investor and MEP.
In spite of a strong record of economic reforms, includ-ing those to promote private investment, Sierra Leone ranks low (at 163 out of 181 countries – as compared to Ghana at 82, Nigeria at 114, Gambia at 128 and Liberia at 167) on the World Bank’s 2008 Ease of Doing Business Survey (see Table 12). However, the country ranks high (49) on protecting inves-tors and satisfactory (94) on starting business.
14 THE PRESIDENT OF SIERRA LEONE, 2000
Ease of doing business 163
Starting a business 94
Dealing with construction permits 171
Employing workers 173
Registering property 175
Getting credit 141
Protecting investors 49
Paying taxes 154
Trading across borders 133
Enforcing contracts 139
Closing a business 144
TABLE 12
Sierra Leone–Ease of Doing Business 2008 Rankings
Source: Ease of Doing Business, World Bank, as of 2008
COUNTRY INTRODUCTION 227

Renewable Energies in West Africa
SIERRA LEONE
TABLE 13
Business Partners in Sierra Leone
INSTITUTION ADDRESS PROFILE
Ministry of Energy and Power (MEP) 4th Floor–Electricity House, 36 Siaka Stevens Street, FreetownPhone: +232 222 265 [email protected]
Governmental authority responsible for the electricity and water sectors
Fourah Bay College, University of Sierra Leone Fourah Bay College, Mount Aureol, University of Sierra LeonePhone:+232 302 070 65
College established in 1927
RCD Solar Company 64 Circular Road, FreetownGeneral Manager, Mr Crispin Gray. Phone: +232 766 178 83
Company catering for the sustainable energy supply systems or as back-up system for institutions, commercial enterprises, rural communities and domestic or home set up. It is an outlet for the sale of solar equipment.
The Environmental Foundation for Africa (EFA) 1 Beach Road, Lakka, Freetown Peninsula, PMB 34Phone: +232 766 114 [email protected]
NGO aiming to protect and restore the en vironment in West Africa. For over 15 years, it has led environmental education and awareness raising campaigns, restored degraded lands and conserved pristine forests, minimized the impacts of civil war on the environment and its inhabitants, and equipped thousands of people with sustainable livelihood skills such as agro-forestry. In 2007, solar initiative is EFA’s largest scale project; installing solar power systems in medical clinics, schools, visitor centers and training willing students and volunteers in the installation and maintenance of solar technologies.
Competence Centre for Renewable Energy 38 Safer Future Drive, Lower Allen Town, FreetownPhone: +232 766 079 90
NGO aiming to positively change the lives of young people. It is training young people in various trades including PV applications and had solar electrified four rural villages and also established a rural Electronic workshop at Safer Future farm.
Sonako International Services Limited 7 Percival Street, FreetownPhone +232 767 135 89
CDM Project Development
COUNTRY INTRODUCTION 228
6 RENEWABLE ENERGY BUSINESS INFORMATION AND CONTACTS

7 BIBLIOGRAPHY
CEMMATS Group Ltd. (2004): Study on the Formulation of a National Energy Policy (Draft). On behalf of the Min-istry of Energy and Power, Government of Sierra Leone
Central Intelligence Agency – CIA (2008): World Fact Book – Sierra Leone (www.cia.gov/library/publications/the-world-factbook/geos/sl.html)
Government of Sierra Leone (2005–2007): Sierra Leone Poverty Reduction Strategy Paper – PRSP (2005–2007): A National Program for Food Security, Job Creation and Good Governance
Government of Sierra Leone (2005): The National Power Authority Amendment Act
Government of Sierra Leone (2004): The Investment Pro-motion Act
Government of Sierra Leone (2004): The Local Government Act
Government of Sierra Leone (2002): The National Commission for Privatization Act
The Environmental Foundation for Africa - EFA (2009): Novel and Practical Conservation Strategies Following Mining in Sierra Leone
(www.efasl.org.uk/4_projects/mining.htm) Government of Sierra Leone (2001): The Petroleum Exploration and Production Act
Government of Sierra Leone (1982): The National Power Authority Act
Lahmeyer International (February 1996): Power Sector Master Plan – Sierra Leone. Appendix B, Vol. 1, Annex 10.2 (www.lahmeyer.de/en)
Lexadin/The World Law Guide (2009): Legislation Sierra Leone (www.lexadin.nl/wlg/legis/nofr/oeur/lxwesle.htm)
Massaquoi, J. G. M. Biomass Resource Assessment: A survey of Sierra Leone’s Energy potential from Agricultural and Forestry wastes
Redwood-Sawyerr J. A. S. and Conteh M. A. (2005): Sierra Leone’s Country Report on Access to Energy Services for Rural and Peri-urban Population for the Achievement of the Millennium Development Goals
Redwood-Sawyerr J. A. S. and Silla S. M. (1999): Distributed Electricity Services in Africa: The Sierra Leone Perspective, Forum on DES, Cape Town, South Africa, 1–5 June 1999
Statistics Sierra Leone (2001): Annual Statistics Digest Statistics Sierra Leone (2005): Provisional Results, 2004 Population and Housing Census
Swaray S. M. and Keili A. (August 2004): Sierra Leone Energy Sector Review; Poverty Alleviation Strategy Coordi-nating Office, African Development Bank, Final Report
The President of Sierra Leone (2000): The Truth and ReconciliationCommission Act 2000 (http:// www.sierra-leone.org/Laws/2000-8s.pdf)
UNDP (2007/2008): Human Development Report. Fight-ing Climate Change: Human Solidarity in a Divided World (http://hdr.undp.org/en/reports/global/hdr2007–2008)
World Bank (2008): Ease of Doing Business (www.doingbusiness.org, viewed 18th Sept. 2008)
BIBLIOGRAPHY Renewable Energies in West Africa
SIERRA LEONE
229

COUNTRY CHAPTER:
TOGO
Author of Country Chapter Mawé Afo Aledjou (Dipl. Eng.)
Coordination and Review of the Country ChapterAnton Hofer, (MSE, Dipl.-Ing. /FH, M.A.)WIP-Renewable Energies www.wip-munich.deMunich, Germany
Editor Deutsche Gesellschaft für Technische Zusammenarbeit (GTZ) GmbHDepartment Water, Energy, TransportDag-Hammarskjöld-Weg 1-565760 Eschborn, Germanywww.gtz.de
On behalf of Federal Ministry for Economic Cooperation and Development (BMZ)
Editorial staffDiana KraftTel: +49 (0)6196 79 4101Fax: +49 (0)6196 79 80 4101Email: [email protected]
Renewable Energies in West Africa 230

CONTENTS TOGO
ACRONYMS, ABBREVIATIONS AND MEASUREMENTS 231
SUMMARY 233
1 COUNTRY INTRODUCTION 234 1.1 Geography and Climatic Conditions 234 1.2 Political, Economic and Socio-economic Conditions 234
2 ENERGY MARKET IN TOGO 235 2.1 Overview of the Energy Situation 235 2.2 Energy Capacities, Production, Consumption and Prices 235 2.3 Market Actors and Regulation Structures 236
3 POLICY FRAMEWORK FOR RENEWABLE ENERGIES 236 3.1 Policies, Strategies and Programs for Renewable Energy Promotion 236 3.2 Regulations, Incentives and Legislative Framework Conditions 236
4 STATUS AND POTENTIAL FOR RENEWABLE ENERGIES 236 4.1 Biomass/Biogas 236 4.2 Solar Energy 236 4.3 Wind Power 236 4.4 Hydro Power 236
5 MARKET RISKS AND BARRIERS 237
6 RENEWABLE ENERGY BUSINESS INFORMATION AND CONTACTS 238
7 BIBLIOGRAPHY 239
8 ANNEX 240
Renewable Energies in West Africa 231CONTENTS
TOGO

ACRONYMS AND ABBREVIATIONS TOGO
ADB African Development Bank
ARSE Autorité de Réglementation du Secteur de l‘Électricité (Regulation Authority of the Electricity Sector)
AU African Union
CDM Clean Development Mechanism
CEB Communauté Électrique du Bénin (Electric Community of Benin)
CEET Compagnie Énergie Électrique du Togo (Electric Energy Company of Togo)
DGE Direction Générale de l‘Énergie (General Directory for Energy)
CGD Customs General Department
ECM mechanical construction company operating in Togo
ECOWAS/CEDEAO Economic Community of West African States (Communauté Économique Des États de l ‚Afrique de l‘Ouest)
CFAF Franc de la Communauté Financière d‘Afrique (1 Euro = 655,957 CFAF)
GDP Gross Domestic Product
HDI Human Development Index
IMF International Monetary Fund
OAPI Organisation Africaine de la Propriété Intellectuelle (African Organization of Intellectual Property)
OHADA Organisation Pour l‘Harmonisation en Afrique du Droit des Affaires (Organization for Harmonization of Business
Rights in Africa)
PAIP Priorities Actions Interim Program
PCHD Poor Countries Heavily in Debt
PRSP-I Poverty Reduction Strategy Paper Interim
PV Photovoltaic
RE Renewable Energy
STE storage company operating in Togo
STSL Société Togolaise de Stockage de Lomé (Togo Storage Company of Lomé)
UN United Nations
WAEMU/UEMOA West African Economic and Monetary Union (Union Économique et Monétaire Ouest Africaine)
WTO World Trade Organization
MEASUREMENTS
€ Euro
GWh gigawatt hour (1 GWh = 1,000,000 kilowatt hours (kWh))
kg kilogram
km² square kilometer
kVA kilovolt ampere
kWh kilowatt hour
m/s meters per second
m² square meter
m³ cubic meter
mm millimeter
MT million tons
MW megawatt (1 MW = 1,000 kW)
MWh megawatt hour
ºC degree Celsius
t ton
toe tons of oil equivalent
W Watt
Wp Watt-peak
yr year
232ACRONYMS, ABBREVIATIONS AND MEASUREMENTS
TOGO
Renewable Energies in West Africa

SUMMARY
The Country Study of Togo is to provide an overview of the country’s energy market and to support decision-making for private investments for the Renewable Energy (RE) sector in Togo. The study is structured as follows:
Chapter one provides Background Information on Togo. This includes an overview of geographical and climatic conditions, as well as the most important facts in view of political, eco-nomic and socio-economic conditions of Togo.
Chapter two summarizes facts and figures of Togo’s Energy Market including stakeholders and market actors involved as well as sector related regulations.
Chapter three presents the currently existing Political Frame-work for Renewable Energies in Togo. This includes an over-view of support mechanisms for photovoltaic (PV) as well as already existing regulations, incentives and legislative frame-work conditions concerning other RE technologies.
Chapter four provides a brief overview of the Status Quo and Potential for Renewable Energies in Togo.
Chapter five summarizes the existing and potential Market Risks and Barriers in general with focus on RE.
Chapter six presents a compilation of the most relevant Renewable Energy Business Information and Contacts of Togo.
Renewable Energies in West AfricaSUMMARY 233
TOGO

1 COUNTRY INTRODUCTION
1.1 GEOGRAPHY AND CLIMATIC CONDITIONSLocated in the southern part of West Africa, the Republic of Togo covers 56,600 km². Direction-wise it stretches for almost 600 km to the North, 55 km along the seaside on the Guinea Gulf and has a maximum width of 120 km from East to West. With a longitudinal stripe form, Togo is limited by Ghana to the West, by Benin to the East, in the North by Burkina Faso and in the South by the Atlantic Ocean. Togo is located in the northern hemisphere in West Africa between latitudes 6 ° and 11 ° North and longitudes 0 ° 30’ and 1 ° 30’ East. Togo is divided into five economic regions: the Savannah Re-gion, the Kara Region, the Central Region, the Plateau Re-gion and the Seaside Region. These regions are divided into 31 prefectures and four sub-prefectures. Country towns of prefectures are considered as urban commons.
As to the climatic situation, Togo has a tropical climate, char-acterized by very different climatic zones and seasons. The South has four seasons (two dry seasons and two rainy sea-sons) with annual rainfalls between 800 and 1,500 mm. The North has one dry and one rainy season and is characterized by annual rainfalls of 1,000–1,500 mm. The medium tem-peratures in Togo vary from 22 °C to 28 °C.
Renewable Energies in West Africa 234
TOGO
COUNTRY INTRODUCTION
1.2 POLITICAL, ECONOMIC AND SOCIO-ECONOMIC CONDITIONSAccording to estimations of the general statistic department, the total population of Togo has reached 5,590,000 inhabit-ants in 2008 at an average population growth rate of about 2.4 %. The gross of the population is living in the rural areas of Togo (66 %). In Togo, the distribution of population is very unbalanced. A high population concentration exists in the South of the country, mainly in the Plateau Region.
Togo received its independence on 27 April 1960. Since 1992, the political system has been characterized by democratic elections. Togo is a member of many internation-al, regional and sub-regional organizations such as the United Nations (UN), the African Union (AU), the World Trade Organization (WTO), the Organization for Harmonization of Business Rights in Africa, the African Organization of In-tellectual Property, the Economic Community of West Afri-can States (ECOWAS/Communauté Économique Des États de l ‚Afrique de l‘Ouest – CEDEAO), the West African Eco-nomic and Monetary Union (WAEMU/Union Économique et Monétaire Ouest Africaine – UEMOA) and the Electric Community of Benin (CEB).
The economic and social development of Togo is mainly based on the primary sector that represents about 40 % of the country’s Gross Domestic Product. The economic growth rate reached 2.9 % during the period 2000–2004. The inflation rate of Togo corresponds with the average 3 % of the WAEMU countries, except in 2005 when the prices of basic products increased to about 6.7 %. Other important sectors such as the industry sector, electricity sector, water and gas sector or the building sector represent another 19 % of the GDP. The service sector contributes with about 26 %, the trade sector with 11.6 % to the GDP.
The socio-political crisis (1990–2005) has greatly af-fected public investment activities, which have decreased from 13.8 % of the GDP in 1990 to 3.3 % in 2005. It also affected the annual growth average of the GDP which has not exceed-ed 1.1 % since 1991. In 2006, Togo was classified as a less developed country and in 2008 as one of the Poor Countries Heavily in Debt (PCHD). Today, Togo ranks at 147 out of 177 countries in the Human Development Index (HDI).
As for the revenues, the rate of the fiscal pressure re-mains low at 14 % of GDP which is three points under the standard of 17 % fixed by the mechanism of multilateral su-pervision of the WAEMU in 2005. Public debt is split into 72.4 % of engagements towards the World Bank, the Interna-tional Monetary Fund (IMF) and the African Development Bank (ADB) and 27.6 % of bilateral debts. The current ex-ternal debts are estimated at 783 billion CFAF of which near one third are overdue payments (2006–2007). In 2006, the weight of the total debt with regard to the GDP reached 96 % as opposed to 70 % in 1992.
FIGURE 1
Map of Togo
LOMÉ
Bight of Benin
Bassar
Mango
Danpaong
Soutouboua
Atakpamé
NotséKpalimé
Sokodé
Aného
Aného
Tsévié
Kpémé

TOGO
COUNTRY INTRODUCTION
2 ENERGY MARKET IN TOGO
2.1 OVERVIEW OF THE ENERGY SITUATIONTogo mainly relies on the utilization of energy from biomass. In 2006, up to 75 % of the total energy consumption was covered by biomass energy. Due to the fact that Togo has no proven re-serves, the total consumption of petrol products is covered by imports. The overall energy consumption per inhabitant was estimated at 0.27 toe in 2006, which is significantly less than the average of West African countries (0.45 toe).
2.2 ENERGY CAPACITIES, PRODUCTION, CONSUMPTION AND PRICES
Electricity SectorThe overall electricity production of Togo reached 221 GWh in 2006. The national production capacity includes thermal and Hydro Power installations under the management of the CEB, the Electric Energy Company of Togo (CEET) and some independent producers. The electricity production units of CEET include 17 thermal electric plants and one mini Hydro Power plant. The total amount of produced electric-ity reached 71 GWh in 2007. The second electricity producer CEB operates several gas turbines with an overall production of approximately 53 GWh (as of 2006). Furthermore, three mini Hydro Power plants contributed another 150 GWh to the electricity consumption. The overall contribution of small producers (mostly self-sufficient electricity generation in the industry sector) was estimated at 8 GWh in 2006. Additional imports of electricity origin from Ghana, Côte d‘Ivoire and Nigeria. Overall electricity imports are estimated at 505 GWh at a total consumption of 726 GWh in 2005. Table 1 presents the prices of imported electricity while the current electricity tariffs are presented in Table 2.
Petroleum SectorTogo is not a producer of petroleum products and therefore has to meet the final consumption by imports. In 2006, the overall import was estimated at 276,000 toe equaling 12 % of the total energy mix.
All imports are subject to be certified by the Ministry of Commerce and Transport. As far as hydrocarbons are con-cerned, Togo has total storage capacity of 255.315 m³, shared between the Togo Storage Company (STE) and the Togo Storage Company of Lomé (STSL). The price for petroleum products is presented in Table 3.
Renewable Energies in West Africa 235
Biomass SectorIn Togo, biomass energy comprises charcoal, wood and ag-ricultural waste. The total biomass energy production was estimated at 2,031,000 toe in 2006. Traditional biomass is the most prominent source of energy for cooking and heat-ing purposes in Togo. About 75 % of all households (mainly in rural areas) utilize wood energy, which causes an annu-al consumption of 347 kg per capita. Charcoal is the most prominent combustible of urban households with an annual consumption of 59 kg per capita. The annual consumption for household energy needs is estimated at about 1.63 million tons of wood and about 0.27 million tons of charcoal.
TABLE 1
Price of Imported Electric Energy and National Energy Production by Type
ORIGIN CÔTE D'IVOIRE GHANA NIGERIA TOGO
Hydro Power Thermal Gas Turbines CEETPurchase
CEETPurchase and Sale
€/kWh 0.050 0.040 0.034 0.038 0.170 0.210 0.076 0.082 to 0.140
Source:CEB, as of 2008
TABLE 2
Price of Electric Energy by Type of Use
TYPE OF USE PRICE (€/kWh)
Professional Use
slack period 0.08
full period 0.09
peak period 0.11
uni tariff 0.10
Public lighting 0.14
Free zone companies 0.08
Domestic Use0.10 (< 40 kWh)0.11 (40–300 kWh)0.14 (> 300 kWh)
Source: Conceded electricity service rule to Togo Électricité, as of 2002
TYPE OF ENERGY
CHARCOAL€/KG
WOOD€/KG
KEROSENE€/KG
BUTANE€/L
GASOLINE€/L
DIESEL€/L
Price 0.04 0.13 0.82 0.43 0.66 0.71
Source: Ministry of Commerce, as of 2009
TABLE 3
Price of Petroleum Products

TOGO
COUNTRY INTRODUCTION
access to modern energy services forces the elaboration of the master plan of rural electrification that will fix realistic ob-jectives for 2010 and 2015. It is planned to develop and im-plement goal-directed strategies with focus on institutional, technological and financial issues.
The fourth priority aims at activities in the field of RE and the hydrocarbon sector. This includes the implementation of legislative, institutional and regulation framework condi-tions, allowing the substitution of traditional energy sources. This should be done with tax exemptions for RE equipment, the definition of standards for rural electrification and the re-duction of relevant costs.
In order to help the population through the energy cri-sis and to promote RE on a large scale, the Ministers’ Coun-cil authorized the Customs General Department (CGD) on 8 April 1998 to issue a memorandum on import tax and VAT exemptions for generators and other energy equipment. This measure is in force till now.
4 STATUS AND POTENTIAL FOR RENEWABLE ENERGIES
4.1 BIOMASS/BIOGASThe biomass potential of Togo is estimated at 2.6 million toe and mainly consists of wood, charcoal, and vegetable waste. Table 4 provides an overview of the biomass consumption by region.
With regard to the production and utilization of bi-ogas, there are significant resources available, mainly from ag-ricultural waste (cotton, maize stem etc.) and livestock. Due to the lack of technology and knowledge, there are no existing biogas production sites in Togo up to now.
4.2 SOLAR ENERGYThe available solar radiation is between 4.4 and 4.5 kWh/m²/day.2 Up to now, there are already some experiences with ther-mal solar energy and photovoltaic (PV) energy available. This includes solar water heating, solar cooking and PV systems for telecommunication services, water pumping, railway stations and some other small scale applications. In order to improve the access to modern energy services in rural areas of Togo, there is still a significant need to promote the utilization of solar energy.
4.4 HYDRO POWERTogo has more than 50 rivers and waterfalls that offer abun-dant potential for mini- and micro-scale production of elec-tricity. About 40 sites, located at the rivers of Mono and Oti, offer a potential overall production capacity of 224 MW. Up to now, however, there are only very few Hydro Power instal-lations available for electricity generation. Table 5 presents an overview of the available Hydro Power potential of Togo.
Renewable Energies in West Africa 236
2.3 MARKET ACTORS AND REGULATION STRUCTURESThe energy sector of Togo is very complex due to numerous institutions involved in the sector. The Ministry of Mines, Energy and Water develops and implements policies for the overall energy sector.1 Moreover, it directs and coordinates relevant initiatives. The Ministry of Environmental and For-estry Resources develops and implements policies and regula-tions, monitors and controls the exploitation of forests and the production and supply of wood and charcoal. Many other institutions and organizations from private and public sector also participate in the overall management of this sector . This includes the CEB, the CEET and the Regulation Authority of the Electricity Sector (ARSE) as well as the STE and the STSL.
3 POLICY FRAMEWORK FOR RENEWABLE ENERGIES
3.1 POLICIES, STRATEGIES AND PROGRAMS FOR RENEWABLE ENERGY PROMOTION
In Togo, there are currently no dedicated policies for Re-newable Energies. According to the Togo Poverty Reduction Strategy Paper Interim (PRSP-I) for 2006–2008, however, the Government pursues several objectives in the energy sector. This includes the implementation of policies for the promo-tion of RE, the increase of electricity supply of rural areas and the implementation of regulatory institutions.
3.2 REGULATIONS, INCENTIVES AND LEGISLATIVE FRAMEWORK CONDITIONS
Based on a feasibility study on rural electrification, the imple-mentation of a rural electrification master plan was recently initiated. In the framework of the Priorities Actions Interim Program (PAIP) and the PRSP-I, several priorities were for-mulated.
The first priority concerns institutional reforms and the regulation of the energy sector and schedules three ac-tions: (i) strategic review and elaboration of reviewed energy policies, (ii) regulation and reduction of state electricity con-sumption by introducing energy-saving/-efficient measures in public buildings in accordance with Clean Development Mechanism (CDM) and (iii) capacity building by the general department of energy.
The second priority focuses on the rapid improvement of production capacities in order to end the energy crisis in a short time. Furthermore, capacity building in the electric energy production sector aims to promote the implementa-tion of gas turbines and Hydro Power installations in different regions of the country.
The third priority proposes a framework for rural elec-trification and prepares an investment program likely to al-leviate the high energy dependency of Togo. The restricted
1 SEE ALSO INSTITUTIONS MENTIONED IN CHAPTER 2.2
2 AS MEASURED BY LOMÉ UNIVERSITY AND THE NATIONAL METEOROLOGY
DEPARTMENT

237
TOGO
COUNTRY INTRODUCTION Renewable Energies in West Africa
4 MARKET RISKS AND BARRIERS
The major obstacle within the RE market development is the lack of appropriate policies. Furthermore, there is a significant lack of regulatory instruments for private investments to the sector. Up to now, there are no mechanisms or incentives that are suitable to attract investors from the private sector. The regulation institution ARSE has no master plan in the field of RE. On top of that, Togo has no independent agency that is in charge of the RE sector including the rural electrification.
Since 2000, Togo has been applying uniformed acts of the African Harmonization Affairs Law Organization (OHADA). This is part of the overall liberalization process in-tended to implement codes, principles and comminatory rules of ECOWAS/WAMEU. The regional harmonization proc-ess was implemented by ECOWAS/WAMEU in September 2005 and has been in force since January 2006. The national legislation regulating competition has been replaced in 2003 by a comminatory legislation that includes the objectives of ECOWAS/WAMEU. The national commission for competi-tion and consumption has been in operation since 2006.
Law 99-011 regulates the overall competition in Togo and aims at establishing successful and self-regulatory mar-kets. Within this, the establishment of appropriate prices, properties and services should help to prevent market distor-tions and discriminatory practices. According to the PRST-I, the Government intends to elaborate national policies against corruption and towards equitable and transparent markets.
REGION TYPE WOOD CHARCOAL VEGETABLE WASTE
Number of Households
%Number ofHouseholds
%Number of Households
%
Seaside
Whole 409 38.47 840 79,20 125 1.75
Urban 65 10.20 586 91,70 21 3.30
Rural 344 81.00 254 59,80 104 24.50
Plateau
Whole 578 77.79 379 51,00 83 11.17
Urban 64 47.70 113 84,07 05 3.60
Rural 514 84.40 266 43,06 78 12.80
Central
Whole 192 82.40 146 62,66 12 5.15
Urban 42 57.40 59 81,90 n/a n/a
Rural 150 93.40 87 53,70 12 7.40
Kara
Whole 214 83.59 169 66,01 84 32.81
Urban 66 62.20 103 96,70 15 14.40
Rural 148 99.20 66 44,40 69 46.00
Savanna
Whole 253 94.75 164 61,42 95 35.58
Urban 42 81.40 47 93,00 13 25.60
Rural 211 97.80 117 54,40 82 84.10
Total
Whole 1,646 64.24 1,698 66,27 399 15.57
Urban 279 27.81 908 90,52 54 5.38
Rural 1,367 87.68 790 50,67 345 22.12
TABLE 4
Biomass Consumption by Region
Source: DEF, as of 2008
SITE NAME RIVER POWER (MW)
Djédrame Danyi 3.000
Daye KondaDaye KondaAmou Oblo
Gban Hou1Gban Hou2
Amou
5.00010.0003.000
Tététou Mono 60.000
Nangbéto en aval du site Mono 20.000
Sérégbané (Kougnohou) Koroon 9.000
Bassar Cascade Sika 1.000
Kpessi Ogou 8.000
Dotékopé Mono 9.000
Gboamoa Amou 2.000
Gougou Ogou 7.000
Ezimé (Cascade) Koulassou 2.500
Langabou Assou Koko 5.000
Tomégbé Domi 8.000
Tomégbé Sin sin 1.600
Soukourou Souroukou 5.000
Sagada/Kpététa Mono 8.000
Fazao Kpaza 2.500
Bongoulou Bassar 1.250
Bangan (Bassar) Mô 6.000
Koueda Kpaza 9.000
Landa-pozanda Collège milit. Kara 17.000
Landa-pozanda Kara 0.200
Tihaléa Kara 9.000
Namon Kara n. a.
Titira Kéran 12.000
Mongo-Kantè (Atigbé) Kéran 5.000
Alokoegbé Sio 0.125
Wonougba Sio 0.165
Légouazeladè Mô 0.100
Aklowa Cascade 800.000
Landa-pozanda Kara (Kpizindè) 0–110.000
TABLE 5
Available Hydro Power Potential
Source: DGE, as of 2006

TOGO
COUNTRY INTRODUCTION
5 RENEWABLE ENERGY BUSINESS INFORMATION AND CONTACTS
Renewable Energies in West Africa 238
INSTITUTION ADDRESS PROFIL
Solaire Ingenierie Phone: +228 320 63 82Fax: +228 221 35 [email protected]
PV technology
Mechanic Construction Company (ECM) P.O Box. 31277, LoméPhone: +228 925 21 [email protected]
Solar equipment and service provider
ESTN Phone: +228 923 33 08 Solar equipment
Direction Générale de l'Energie (GE) P.O Box 335, LoméPhone: +228 223 14 39Fax.+228 220 86 46
Stately institution
Action Communautaire pour le Développe-ment Intégral et Solaire(ACDI SOLAR)
07 BP 128606, LoméPhone: +228 966 25 67 Email: www.acdisolar06.blog.co.uk(www.riaed.net/IMG/pdf/ONG_ACDI_Solar_au_Togo_0507.pdf)
NGO for the promotion of solar energy
UL/ ENSI P.O. Box. 1515, LoméPhone: +228 902 86 07
Electric equipment
Lomé UniversitySolar Energy Laboratory
P.O Box 1515, LoméPhone: +228 901 25 18www.ub.tg
Solar energy research
CFIT Phone: + 228 999 88 65 Solar equipment and training
JVE Volunteers Youth for Environment P.O Box 88236, LoméPhone: +228 913 48 21
NGO
ENERGIA SOLAIRE Phone: + 228 939 35 13 Solar equipment
Ministry of Mines, Energy and Water (Mi-nistère des Mines et de l�Energie)
P.O Box 4227, LoméPhone: +228 220 07 62Fax: +228 220 08 [email protected]
Regulatory institution
Ministry of Economy and Finance, (Minis-tère de l’Economie et des Finances)
P.O Box 387, LoméPhone: +228 221 09 05
Regulatory institution
Ministry of Environment and Forestry Resources (Ministère de l�Environnement et des Ressources forestière)
P.O Box 48235, LoméPhone: +228 221 30 78www.merf.tg
Regulatory institution
TABLE 6
Local Partners

239
TOGO
BIBLIOGRAPHY
6 BIBLIOGRAPHY
DEF (2008): Biomass Consumption by Economic Region Ministry of Trade (2007): Commercial Activities Paper CEB/CEET (2002): Decree No 2002–075/PR on Energy Sale and Price Fixation in Togo
Ministry of Economy and Finances (2007): Duties in Togo DGE (2007): Electric Energy Sector in Togo DGE (2008): Energy sector policies and projects/ current and future programs
N. N. (2004): Ethic, Energy and Sustainable Development of LIAISON Energy-francophone No 62–1fs term
DGE, CEET, STSL, SIE (2008): Final Consumption Share by Source of Energy
DGE (2008): Government Projects at PIAP DGE, STSL, SIE (2006): Households’ Energy Consumption
DGSCN (2006): Households’ Percentage According to type of Energy Use
DGE (2007): Infrastructures Access in Energy Service – Atlas Energy Togo
AOIP Togo (2007): Intellectual Property Paper in Togo N. N. (2003): International Forum on Energy Market and the Role of Energy in Fight Against Poverty
SIE (2007): Investigation Report Paper on Domestic Energy Consumption in Togo
National Assembly (1999): Law on Competition Organization in Togo
N. N. (without year): National Rapport on MDGs N. N. (2007): Interim Poverty Reduction Strategy Paper of 2007
ARSE Office (2006): Relatives to Electricity Sector and its Application Decree
African bulletin (2006): Poverty Reduction: Renewable Energies Can Truly Contribute
University of Lomé (2006): Private Renewable Energies Fitting in Togo
DGE (2007): Sustainable Development World Summit in 2002
General Direction of Tax (2008): Tax Conditions in Togo Ministry of Plane (2008): Temporaries Programs Paper of Priorities Actions (PATP)
UNDP (2007): UNDP Paper on Profile of Poverty and Vulnerability in Togo
PNAE (2002): Wood Demand Growing in Togo – Biological Diversity Document
LIAISON energy-francophone (2004): World’s Solar Program of No 46-1fs term
Renewable Energies in West Africa

240
TOGO
Renewable Energies in West Africa
7 ANNEX
ANNEX
FIGURE 6
Electricity Network Map of Togo
Source: CEET, as of 2008

Renewable Energies in East AfricaRegional Report on Potentials and Marktes – 5 Country Analyses
Energy-policy Framework Papers,
Section »Energy and Transport«
Promotion ofRenewable Energies

IMPRINT
Authors of Country Chapters Burundi Godefroy Hakizimana (MSc. Eng.) Kenya Bernard Mutiso Osawa (MSc. RE, Phy.) Rwanda Emmanuel Kanigwa (MSc. Eng.) Tanzania Finias Magessa (Eng.) Uganda Dr. Eng. Mackay A. E. Okure Review / Coordination Dipl. Phys. Rafael Wiese PSE AG Freiburg, Germany www.pse.de
Editor Deutsche Gesellschaft für Technische Zusammenarbeit (GTZ) GmbH Department Water, Energy, Transport Dag-Hammarskjöld-Weg 1–5 65760 Eschborn, Germany www.gtz.de
On behalf of Federal Ministry for Economic Cooperation and Development (BMZ)
Editorial staff Diana Kraft Tel: +49 (0)6196 79 4101 Fax: +49 (0)6196 79 80 4101 Email: [email protected]
Disclaimer /Citation The data used in this report is based on publicly accessible sources, as well as on non-public papers and partly also on personal expert
interviews. Although the information given in this report is the best available to the authors at the time, GTZ, BMZ or the authors cannot be held liable for the
accuracy and correctness of the data included in the report.
GTZ is solely authorized for all forms of use of the publication. Duplication, reproduction or distribution of the report a s a whole or of parts of the report for
commercial purposes, require the prior written consent of GTZ. Other uses, including duplication, reproduction and distribution of the report as a whole or of
parts of the report for non-commercial purposes is permitted, provided the following appropriate citation of the GTZ publication as source is considered.
Deutsche Gesellschaft für Technische Zusammenarbeit – GTZ (2009): Regional Reports on Renewable Energies. 30 Country Analyses on Potentials and Markets in
West Africa (17), East Africa (5) and Central Asia (8). Frankfurt /Eschborn
Copyright © 2009 Deutsche Gesellschaft für Technische Zusammenarbeit (GTZ) GmbH.
IMPRINT Renewable Energies in East Africa

BURUNDI, KENYA, RWANDA, TANZANIA AND UGANDA Renewable Energies in East Africa 1
FOREWORD
BACKGROUNDIn recent years a large number of developing and emerging countries have changed the structure of their energy sec-tors, often accompanied by a liberalization of their markets. In many cases, Renewable Energies (RE) are a more and more important strategic component for the countries’ diversifica-tion of their national energy supply.
A growing energy demand deriving from the increasing energy consumption of growing economies worldwide, accompanied by volatile prices for fossil fuels and by increasing environ-mental and climate challenges, boosts the demand for RE technologies. RE have a competitive advantage because they provide a long-term energy supply (for electricity, heating or cooling) based on locally available RE sources and thus help to reduce dependency on energy imports. In addition, RE provide appropriate technological solutions for the electrifi-cation of rural or semi-urban areas where they can be used independently from grid-connection. RE are a key for the pro-vision of modern energy services in these areas and contrib-ute to the local economic and social development.
While the technical potential for RE resources such as wind, solar, hydropower, biomass or geothermal energy is consid-ered high in most developing and emerging countries, these regions are still faced with significant barriers for the devel-opment of commercially driven and sustainable RE markets. The lack of appropriate policies and the respective business environment are constraints that restrict the dissemination of RE in these countries. The success of comprehensive policy frameworks for the promotion of RE – such as RE feed-in-tariffs or incentive instruments like tax relieves – can be ob-served in more and more countries, for example Germany or France. However today, also developing countries and emerg-ing markets such as South Africa, Kenya or the Philippines reveal the significance of adequate policy frameworks for favo-rable market conditions. Investments in RE markets, in partic-ular by the private sector, very much depend on the existence of these national or regional framework conditions, incentives and financing options on the one hand, but also on sufficient transparency and knowledge about these conditions, which are thus part of the bottleneck for the deployment of RE.
OBJECTIVECurrent and accurate information and data availability are – as stated above - important prerequisites for the development of RE energy markets and a broader dissemination of com-mercial activities – particularly in markets where information is scarce and where framework conditions are under transi-tion. The Regional Reports on Renewable Energies comprising 30 country analyses on RE potentials and markets in West Africa, East Africa and Central Asia are a substantial contribution to the dissemination of comprehensive and precise knowl-
edge on RE markets and related investment options and thus help to further pave the way for the promotion of RE in these regions.As such the publication addresses potential businesses and investors – including manufacturers, technology providers, wholesalers, suppliers, project developers, operators, serv-ices companies, planning offices, consultancy firms, as well as financing institutions. The Regional Reports are both meant for those who are already active in the assessed RE markets, but also for those exploring new markets for their business activities. Of course, the publication also serves as a data-base with country-specific insights into the assessed African and Central Asian regions for interested actors from the pub-lic and civil sector.
The geographical scope of this publication is twofold: the Regional Reports on Renewable Energies focus on West Africa and East Africa which are mainly represented by develop-ing countries and economies, and on Central Asia as a re-gion predominantly characterized by countries in transition. All of these regions are promising markets for the RE industry and for potential investors as they offer remarkable, but still largely untapped RE potentials. Although market conditions which spur the promising RE potentials still need to be im-proved in almost all of the assessed countries, positive trends for the promotion and deployment of RE can be observed in many cases. Even in those countries, where the policy level still needs to be convinced of RE, political reformers more and more commit to take action for RE on the rise.
DELIVERABLES The Regional Reports on Renewable Energies showcase com-prehensive, but still selective information on the specific characteristics of the energy sectors of the 30 assessed coun-tries – 17 in West Africa, 5 in East Africa and 8 in Central Asia.Key facts and figures on these energy markets and their RE potential is given in the executive summary of each regional report.Each country analysis comprises an introduction to the socio-economic, geographical and political background of the country. It also includes an overview on the national energy sectors, including figures on power generation capacities, energy con-sumption and price levels as well as information on relevant market structures. This is followed by a presentation of the respective energy policy framework conditions. The chapter on the status quo of RE presents data on country-specific techni-cal and economic RE potentials, as well as and on current RE investment projects and possible RE business opportunities. In addition, the report gives information on market challenges and risks. A snapshot of the relevant actors of the energy sec-tor (private, as well as public, civil and scientific) is also in-cluded and serves as a source for identifying potential (busi-ness) partners for RE projects. Finally, each country analysis includes a bibliography and an annex containing additional graphs and figures on RE sources and technologies.

BURUNDI, KENYA, RWANDA, TANZANIA AND UGANDA Renewable Energies in East Africa 2
The presented regional reports series is part of the Energy-policy Framework Papers of the “Energy and Transport” sec-tion of Deutsche Gesellschaft für Technische Zusammenarbeit (gtz) GmbH.
The Regional Reports are also available for free of charge download on the GTZ website:http://www.gtz.de > Themes > Sustainable Infrastructure > Energy >
Renewable Energy > Further information > Downloads; or http://www.gtz.de/de/themen/umwelt-infrastruktur/energie/4552.htm
The editorial team – Eschborn, December 2009
ACKNOWLEDGEMENTSThe editorial team – also on behalf of the Federal Ministry for Economic Cooperation and Development (BMZ) – would like to thank all contributors, in particular all authors and coordinators (especially Anton Hofer of WIP, Rafael Wiese of PSE AG and Dr. Klaus Jorde of Entec AG) who have contrib-uted to this publication by sharing their valuable insights and experiences.
Special thanks also to Rolf-Peter Owsianowski for his ef-forts to identify appropriate local experts as authoring con-tributors, to Barbara Meder for editing of the reports and to “die Basis – Kommunikation. Ideenwerk. Design.” for the design of the publication.

CONTENTS REGIONAL REPORT EAST AFRICA
REGIONALREPORT SUMMARY 4
BURUNDI 12
KENYA 31
RWANDA 61
TANZANIA 82
UGANDA 106
3BURUNDI, KENYA, RWANDA, TANZANIA AND UGANDA Renewable Energies in East Africa
EAST AFRICA SUMMARY

BURUNDI, KENYA, RWANDA, TANZANIA AND UGANDA Renewable Energies in East Africa 4
REGIONAL REPORT SUMMARY –
BASED ON THE 5 COUNTRY CHAPTERS
BURUNDI, KENYA, RWANDA,TANZANIA, UGANDA
Author of the Regional Report Summary Dipl. Phys. Rafael Wiese PSE AG Freiburg, Germany www.pse.de

5BURUNDI, KENYA, RWANDA, TANZANIA AND UGANDA
ACRONYMS AND ABBREVIATIONS
REGIONAL REPORT SUMMARY
ACP African, Caribbean and Pacific Group of States BGR Bundesanstalt für Geowissenschaften und Rohstoffe (Federal Institute for Geosciences and Natural Resources) DGHER Directorate General of Hydraulics and Renewable Energies EAC East African Community ERA Electricity Regulatory Authority EU European Union GDP Gross Domestic Product IPP Independent Power Producer KenGEN Kenya Electricity Generating Company KPLC Kenya Power and Lighting Company MDG Millennium Development Goals MEM Ministry of Energy and Minerals PPP Purchasing Power Parity PREEEP Promotion of Renewable Energy and Energy Efficiency Program RE Renewable Energy REA Rural Energy Agency REF Rural Energy Fund REGIDESO Régie de Production et de Distribution d‘Eau et d‘Électricité (Urban Burundian Electricity Utility) RURA Rwanda Utilities Regulatory Authority SIDA Swedish Development Agency TANESCO Tanzania Electric Supply Company Limited UEB Uganda Electricity Board UETC Uganda Electricity Transmission Company USD United States Dollar VAT Value Added Tax
MEASUREMENTS
GWH gigawatt hour KM² square kilometer KWH kilowatt hour KWP kilowatt peak MW megawatt WP Watt-peak
Renewable Energies in East Africa
EAST AFRICA SUMMARY

6BURUNDI, KENYA, RWANDA, TANZANIA AND UGANDA Renewable Energies in East Africa
1 INTRODUCTION TO THE EAST AFRICAN COMMUNITY (EAC) REGION
1.1 REGIONAL STATISTICS EAST AFRICA COMMUNITY: GEOGRAPHY AND ECONOMICS1
The East African Community (EAC) is an intergovernmen-tal organization comprising the five East African countries of Burundi, Kenya, Rwanda, Tanzania and Uganda. The East African region covers an area of 1.8 million square kilometers with an overall population of about 122 million (based on census in 2007) with an average annual growth rate of 3 %. The annual child mortality in the region ranges from 103 to 137 per 1,000 births, while literacy rate is estimated between 62 and 74 % (as of 2007).
The EAC countries established a Customs Union in 2005 and are working towards the establishment of a Common Market by 2010, a subsequent Monetary Union by 2012 and ul-timately a Political Federation of the East African States.
The EAC recorded an overall average real growth of 6.8 % in 2007. The per capita income varies between 119 USD in Burundi and 725 USD in Kenya. The average annual infla-tion rate increased to 7.6 % in 2007. The highest increase was on food prices. On average, the main export products of the EAC region are coffee and tea. Coffee production in the region has been on the decline since 2003, while tea production has increased.
The heterogenic geographical and social situation between Rwanda and Burundi on the one hand and Kenya, Tanzania and Uganda on the other hand is reflected in the following statistics:
BURUNDI RWANDA KENYA TANZANIA UGANDA
Population 2007 (million) 8.2 9.7 36.5 38.7 31.4
Total area (km²) 27,834 26,340 583,000 945,087 241,020
Density (km²) 280 369 64,7 41 130
Total households (million) n. a. 1.7 7.2 7 5.1
Households – rural ( %) 90 % 83 % 19 % 82 % 85 %
Households – urban ( %) 10 % 17 % 81 % 18 % 15 %
Main export goods Tea, coffee Tea, coffee Tea, coffee, horticulture
Gold, coffee, nuts
Coffee, fish
GDP 2007 (million USD) 864 1,973 19,842 10,154 9,123
GDP per capita 2007 – at PPP (USD) 346 813 1,700 1296 963
GDP growth rate 2007 ( %) 3.6 % 7.9 % 7 % 6,2 % 9 %
Poverty rate / persons living below 1 USD/day (MDG 30 %, as of 2007)
60 % 40 % 48 % 33,4 % 35 %
Infant mortality rate (MDG 36/1,000)
165(2005)
83 (2008)
10 (2007)
77 (2007)
66 (2006)
1 SEE EAC, AS OF 2008
EAST AFRICA SUMMARY

7BURUNDI, KENYA, RWANDA, TANZANIA AND UGANDA Renewable Energies in East Africa
2 ENERGY MARKET OF THE EAST AFRICAN COMMUNITY REGION
2.1 ENERGY SITUATION OVERVIEWThe EAC region relies primarily on biomass. It is used in ru-ral and urban settlements mainly for cooking purposes. The primary energy supply is based on 90 % or more of informally collected wood. Only Kenya has a significant share in primary energy by petroleum at 22 % and electricity at 9 %.
The electrification of rural areas in the EAC region stands very poor at a 1–5 % level. The urban electrification rate is above 30–50 %.2
The following tables give an overview on the general energy situation. The data are gathered from the five country reports as part of this overall study and based on own calcu-lations or numbers found in the most recent EAC reports:3
2.2 ENERGY CAPACITIES, PRODUCTION AND CONSUMPTIONThe total generated electricity in the EAC region is 12,849 GWh. Hydro power was accounting for 65 % of the produced elec-tricity in 2007, while thermal power had a 28 % share. The electricity grid in all EAC countries suffers from high trans-mission and distribution losses.
The region is very much depended on rainwater. The 2001–2007 period has witnessed a decline in hydro power generation and an increase in thermopower generation. The following graph shows the correlation of hydro and thermal power of the EAC region.
Only Kenya is using geothermal power with a produc-tion of 989 GWh or 7,5 % of the electricity production in the EAC (as of 2007). In Kenya, Tanzania and Burundi, cogenera-tion power plants from the sugar cane industry are currently feeding into the national grid with a marginal electricity con-tribution. The feed-in tariff structure remains currently unre-gulated and is subject to bilateral negotiations.
TABLE 1
Energy Situation in the EAC Region
Source: table compiled by the author (PSE AG) based on data from EAC, as of 2008, and UNCTAD, as of 2005
BURUNDI RWANDA KENYA TANZANIA UGANDA
Main source of primary energy supply
Biomass 96 %
Biomass 95 %
Biomass 68 %
Biomass 90 %
Biomass 92 %
Main purpose Cooking Cooking Cooking Cooking Cooking
Total electrification rate 1.0 % 6.0 % 15.4 % 10.8 % 11.0 %
Rural electrification rate n. a. 1.0 % 4.0 % 2.0 % 5.0 %
Urban electrification rate n. a. 35.0 % 51.0 % 30.0 % 42.0 %
Average electricity consumption per capita per year
17 kWh 19,5kWh (2005)25,3 kWh (2006)
154 kWh 82 kWh 57 kWh
2 SEE REFERENCES ON PRIMARY ENERGY SOURCES AND ELECTRIFICATION RATES
GIVEN IN THE 5 COUNTRY CHAPTERS
3 SEE EAC, AS OF 2008, AND UNCTAD, AS OF 2005
EAST AFRICA SUMMARY
FIGURE 1
Hydro and Thermal Electricity Generation in Kenya, Uganda and Tanzania
0
1000
2000
3000
2500
1500
500
2001 2002 2003 2004 2005
Source: graph compiled by the author (PSE AG)
Tanzaniathermal
Kenyathermal
Ugandahydro
Kenyahydro
Tanzaniahydro
3500
4000
2006 2007

2.3 ENERGY PRICES All EAC countries depend on the international crude oil price fluctuations, but also on the exchange rates. Especially the landlocked countries are faced with high transport costs for petroleum fuels. Burundi diesel prices are twice as high as in Kenya. On the other hand, electricity prices in Burundi are only one third of the prices in Uganda. This indicates that the energy tariffs are still determined by political and social as-pects which hinder a leveled playing field towards the use of Renewable Energies (RE). Power supply suffers from unrelia-bility, forcing investors to maintain back-up generators which increase their costs of doing business.
Kenya Electricity generation, transmission and distribution are han-dled by the two state companies of KenGEN and the Kenya Power and Lighting Company (KPLC). KenGEN deals with power generation, while KPLC deals with transmission and distribution. A few Independent Power Producers (IPPs) have been registered.
Tanzania The electricity sub-sector is largely dominated by the state-owned Tanzania Electric Supply Company Limited (TANESCO), which has a vertically integrated monopoly in the generation, transmission and distribution of electricity in the country that is now being unbundled. Two independent IPP have been li-censed: Independent Power Tanzania Ltd. and Songas Ltd.
Uganda Generation, transmission and distribution were unbundled in 2001, ending the monopoly of the Uganda Electricity Board (UEB) with respect to these services. Generation and distribu-tion were concessioned in 2003–2004, while transmission is still the responsibility of the state-owned Uganda Electricity Transmission Company (UETC). The Electricity Regulatory Authority (ERA) has also been created.
RwandaThe public utility of ELECTROGAZ is entirely owned by the Government of Rwanda and offers all electricity services. The Rwanda Utilities Regulatory Authority (RURA) was es-tablished in 2001 for the regulation of certain public utilities including energy.
BurundiThe Urban Electricity Utility (REGIDESO) is the national power authority that owns all the country’s power plants and oper-ates the transmission distribution network. The Directorate General of Hydraulics and Renewable Energies (DGHER) is in-dependently developing rural electrification projects.
BURUNDI RWANDA KENYA TANZANIA UGANDA
Total electricity consumption 188.0 GWh (2007) 210.0 GWh 5,067.0 GWh (2007) 3,288.0 GWh (2007) 1,797.0 GWh (2007)
Nationally produced electricity 94.0 GWh (2006) 138.0 GWh (2007) 6,868.8 GWh (2007) 4,156.0 GWh (2007) 1,609.0 GWh (2006)
Of which in 2007
Hydro 117.0 GWh 96.6 GWh 3,592.0 GWh 2,576.0 GWh 1,190.0 GWh
Thermal 0 111.0 GWh 1,738.0 GWh 1,580.0 GWh 369.0 GWh
Geothermal 0 0 989.0 GWh 0 0
Capacity in operation 37.0 MW (2008) 54.0 MW (2007) 1,197.0 MW (2007) 1,226.0 MW (2007) 496.0 MW (2006)
Of which in 2007
Hydro 37.0 MW 24.0 MW 677.0 MW 591.0 MW 380.0 MW
Thermal 0 30.0 MW 389.0 MW 658.0 MW 150.0 MW
Geothermal 0 0 128.0 MW 0 0
Other 0 0 4.0 MW solar 0.4 MW wind 2.0 MW bagasse cogeneration
0 16.0 MW small hydro 22.0 MW bagasse cogeneration
TABLE 2
Electricity Capacities, Production and Consumption in the EAC Region
Source: table compiled by the author (PSE AG)
8BURUNDI, KENYA, RWANDA, TANZANIA AND UGANDA Renewable Energies in East Africa
BURUNDI RWANDA KENYA TANZANIA UGANDA
Average Petroleum at filling station in € / l (2007)
Diesel 1.35
Kerosene 0.80
Diesel 0.69
Diesel 0.78
Diesel 0.92
Electricity residential tariff in € Cent/kWh (< 1,000 kWh / year)
5.2 14.0 8.5 7.0 16.0
TABLE 3
Energy Prices in the EAC Region
Source: table compiled by the author (PSE AG)4
4 NOTE: IN THE INDIVIDUAL COUNTRY CHAPTERS THE ENERGY PRICES ARE PARTLY
INDICATED IN LOCAL CURRENCY (INSTEAD OF €).
EAST AFRICA SUMMARY
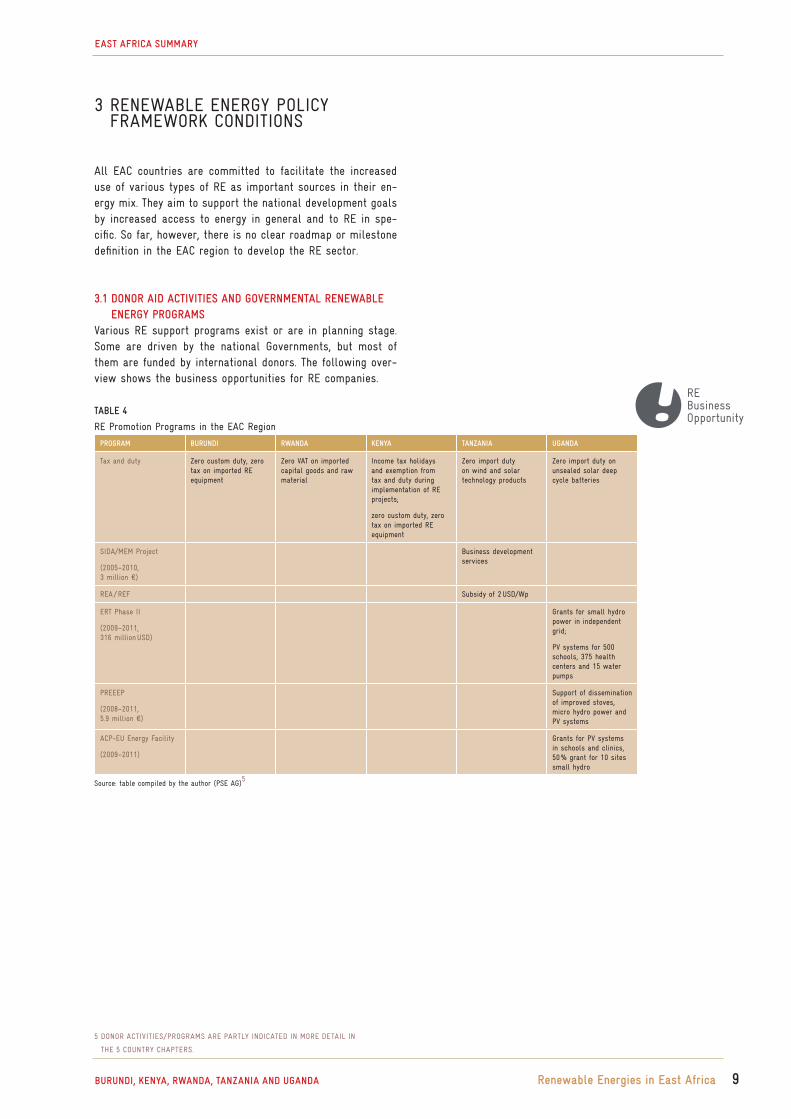
3 RENEWABLE ENERGY POLICY FRAMEWORK CONDITIONS
All EAC countries are committed to facilitate the increased use of various types of RE as important sources in their en-ergy mix. They aim to support the national development goals by increased access to energy in general and to RE in spe-cific. So far, however, there is no clear roadmap or milestone definition in the EAC region to develop the RE sector.
3.1 DONOR AID ACTIVITIES AND GOVERNMENTAL RENEWABLE ENERGY PROGRAMS
Various RE support programs exist or are in planning stage. Some are driven by the national Governments, but most of them are funded by international donors. The following over-view shows the business opportunities for RE companies.
5 DONOR ACTIVITIES/PROGRAMS ARE PARTLY INDICATED IN MORE DETAIL IN
THE 5 COUNTRY CHAPTERS.
TABLE 4
RE Promotion Programs in the EAC Region
Source: table compiled by the author (PSE AG)5
PROGRAM BURUNDI RWANDA KENYA TANZANIA UGANDA
Tax and duty Zero custom duty, zero tax on imported RE equipment
Zero VAT on imported capital goods and raw material
Income tax holidays and exemption from tax and duty during implementation of RE projects;
zero custom duty, zero tax on imported RE equipment
Zero import duty on wind and solar technology products
Zero import duty on unsealed solar deep cycle batteries
SIDA/MEM Project
(2005–2010, 3 million €)
Business development services
REA / REF Subsidy of 2 USD/Wp
ERT Phase II
(2009–2011, 316 million USD)
Grants for small hydro power in independent grid;
PV systems for 500 schools, 375 health centers and 15 water pumps
PREEEP
(2008–2011, 5.9 million €)
Support of dissemination of improved stoves, micro hydro power and PV systems
ACP-EU Energy Facility
(2009–2011)
Grants for PV systems in schools and clinics, 50 % grant for 10 sites small hydro
9BURUNDI, KENYA, RWANDA, TANZANIA AND UGANDA Renewable Energies in East Africa
EAST AFRICA SUMMARY

4 STATUS AND FUTURE OUTLOOK FOR RENEWABLE ENERGIES
In the following, only the most important existing business opportunities for private companies are highlighted. More de-tailed information can be found in the 5 country chapters.
4.1 BIOMASS / BIOGASIt seems that cogeneration of bagasse in large sugar cane industries in Kenya, Tanzania and Uganda is becoming more viable. All industries have recently started to feed into the national grid as IPPs. The tariff structures are not clear or only fixed on a preliminary stage. They are subject to bilateral negotiations between the IPP and the national utility and/or regulator.
In some countries, research and tests with small bi-ogas digesters were made, but with no commercial success was achieved so far. In Rwanda, biogas plants are used in pri-sons for example. Several private companies, which are plan-ning to develop biofuel plantations, have recently purchased or rented land in Tanzania and Kenya.
4.2 SOLAR ENERGYThe solar energy sector is the most developed sector in the EAC region due to a decade of international support programs in capacity building, training and subsidy programs. Thus a few hundred of well-trained solar technicians exist in the re-gion. As the number of PV system integrators and wholesal-ers is limited to about 50 companies in the entire EAC region, it is obvious that the private sector is underdeveloped. The companies are mainly situated in the capitals or commercial cities and have poor distribution channels into the targeted rural areas.
The miracle self-running PV market in Kenya is a niche market dominated by cash and carry sales as it can also be found in the other EA countries. Although a lot of attempts within the international programs were made to increase the awareness towards higher quality and after-sales services, PV market lacks of technical and commercial professionalism. The table below summarizes the current RE market.
4.3 WIND POWERWind energy is not exploited in the EAC region due to the lack of wind data or the non-compliance between resources and grid availability (especially in Kenya). 70 MW are under con-struction in two wind farms in Kenya.
4.4 GEOTHERMAL POWERThe huge potential of geothermal sources in the Rift val-ley is about to be explored, especially with the support of the German Development Cooperation and commissioned by the German Federal Institute for Geosciences and Natural Resources (BGR). Only Kenya is currently using 128 MW.
4.5 HYDRO POWER The wide availability of lakes and running waters in the EAC region entails a huge potential of small and large hydro power. Large-scale hydro power is used to a greater extend in the region. Burundi has a 99 % hydro power share in elec-tricity. The average was 65 % in 2007 as compared to 73 % in 2001. The potential for small hydro power plants are esti-mated as follows:
TABLE 5
PV Market Data in the EAC Region (as of 2008)
Source: table compiled by the author (PSE AG)
PROGRAM BURUNDI RWANDA KENYA TANZANIA UGANDA
Installed capacity 72 kWp n. a. 4,000 kWp 1,800 kWp n. a.
Market size per year n. a. n. a. n. a. 200 kWp 200 kWp
No of solar companies 3 < 5 20 18 17
Remark, special local condition
n. a. 250 kWp Kigali Solaire
ACP–EU Energy Facility
No financial support scheme available
Well-established trainings and awareness
ERT II program as main driver
BURUNDI RWANDA KENYA TANZANIA UGANDA
Geothermal potential n. a. 170–300 MW 2,000 MW 600 MW 450 MW
TABLE 6
Estimation of Geothermal Potential in the EAC Region
Source: table compiled by the author (PSE AG)
TABLE 7
Small Hydro power Potential in the EAC Region
Source: table compiled by the author (PSE AG)
BURUNDI RWANDA KENYA TANZANIA UGANDA
Small hydro power potential 300 MW 10 MW 3,000 MW 315 MW 210 MW
10BURUNDI, KENYA, RWANDA, TANZANIA AND UGANDA Renewable Energies in East Africa
EAST AFRICA SUMMARY

5 BIBLIOGRAPHY6
various documents with information on the institution, function and program activities of the EAC, (www.eac.int/about-eac.htm)
(www.eac.int/downloads/cat_view/73-facts-and-figures.html)
(www.unctad.org/Templates/WebFlyer.asp?intItemID=3450&lang=1)
11BURUNDI, KENYA, RWANDA, TANZANIA AND UGANDA Renewable Energies in East Africa
6 NOTE: OTHER MAIN REFERENCES AND INDICATIONS OF SOURCES ARE PROVIDED
IN THE RESPECTIVE COUNTRY CHAPTERS AND NOT IN THIS SUMMARY OF THE
COUNTRY CHAPTERS.
EAST AFRICA SUMMARY
COUNTRY CHAPTER:
BURUNDI
Author of Country Chapter Godefroy Hakizimana (MSc. Eng.) Coordination and Review of the Country ChapterDipl. Phys. Rafael Wiese PSE AGFreiburg, Germanywww.pse.de
Editor Deutsche Gesellschaft für Technische Zusammenarbeit (GTZ) GmbHDepartment Water, Energy, TransportDag-Hammarskjöld-Weg 1-565760 Eschborn, Germanywww.gtz.de
On behalf of Federal Ministry for Economic Cooperation and Development (BMZ)
Editorial staffDiana KraftTel: +49 (0)6196 79 4101Fax: +49 (0)6196 79 80 4101Email: [email protected]
Renewable Energies in East Africa 12

CONTENTS BURUNDI
ACRONYMS, ABBREVIATIONS AND MEASUREMENTS 14
SUMMARY 16 1 COUNTRY INTRODUCTION 17 1.1 Burundi Overview 17 1.2 Burundi Statistics: Geography and Economics 17
2 ENERGY MARKET IN BURUNDI 18 2.1 Energy Situation Overview 18 2.2 Energy Capacities, Production and Consumption 18 2.3 Electricity Prices 18 2.4 Market Actors for Planning, Regulation and Distribution 19
3 RENEWABLE ENERGY POLICY FRAMEWORK CONDITIONS 20 3.1 Policy and Renewable Energy Promotion Programs 20 3.2 Donor Aid Activities 20 3.3 Market Risks 21 3.4 Customs Duties and Taxes Related to Renewable Energy Products 21
4 STATUS AND FUTURE OUTLOOK FOR RENEWABLE ENERGIES 21 4.1 Biomass/Biogas 21 4.2 Solar Energy 21 4.3 Wind Power 22 4.4 Geothermal Power 22 4.5 Hydro Power 22
5 RENEWABLE ENERGY BUSINESS INFORMATION AND CONTACTS 23 5.1 Renewable Energy Companies & Business Related Organisations 23 5.2 Local Institutions Related to Renewable Energy Business 23 5.3 Governmental and Multilateral Donors Projects 24
6 BIBLIOGRAPHY 25
7 ANNEX 26
13CONTENTS
BURUNDI
Renewable Energies in East Africa

ACRONYMS AND ABBREVIATIONS
BURUNDI
AfDB African Development Bank
AIDS Acquired Immune Deficiency Syndrome
BIF Burundi Franc (1 BIF = 0.00056 €, as of November 2009)
BMZ Bundesministerium für wirtschaftliche Zusammenarbeit und Entwicklung (German Federal Ministry for Economic
Cooperation and Development)
CD Contractual Demand
CEBEA Centre d‘Études Burundais en Énergies Alternatives (Burundian Center of Renewable Energies)
CRE Crédit Régénération Économique (Economic Recovery Credits)
CSLP Cadre Stratégique de Croissance et de Lutte Contre la Pauvreté (Strategic Master Plan of Growth
and Fight against Poverty)
DGEE Directorat Général d’Eau et d’Énergie (Directorate General of Water and Energy)
DGHER Directorat Général de Hydrauliques et d’Énergie Renouvelable (Directorate General
of Hydraulics and Renewable Energies)
DR Congo Democratic Republic of the Congo
EAC East African Community
EIRP Electricity Infrastructures Rehabilitation Project
FCBN Forum de la Société Civile du Bassin du Nil (Nile Basin Burundian Civil Society)
F.O.B. Free On Board
GDP Gross Domestic Product
GHG Greenhouse Gas
GTZ Deutsche Gesellschaft für Technische Zusammenarbeit (German Technical Cooperation Agency)
HIPC Heavy Indebted Poor Countries
HIV Human Immunodeficiency Virus
ICRC International Committee of the Red Cross
IDA International Development Agency
IMF International Monetary Fund
ISN Interim Strategy Note
KfW Kreditanstalt für Wiederaufbau (German Banking Group - including KfW Entwicklungsbank
as German Development Bank)
MDG Millennium Development Goals
MEFCD Ministère de l’Economie, des Finances et de la Coopération au Développement
(Ministry of Economy, Finance and Development Cooperation)
MELM & PW Ministry of Environment, Land Management and Public Works
MIA Ministry of Internal Affairs
MWEM Ministry of Water, Energy and Mines
N. a. Not applicable
NBI Nile Basin Initiative
O & M Operation and Maintenance
ONATOUR Office National de la Tourbe (Peat National Utility)
PAP Priority Action Program
PREBU Programme pour la Réhabilitation du Burundi (Program for Rehabilitation of Burundi)
PRSP Poverty Reduction Strategy Papers
PTPCE Projet des Travaux Publics et de Création d‘Emplois (Public Works and Employment Creation Project of IDA –
International Development Association)
RDC République Démocratique du Congo (Democratic Republic of Congo)
REGIDESO Régie de Production et de Distribution d‘Eau et d‘Électricité (Urban Burundian Electricity Utility)
RE Renewable Energy
PSE Programme Spécial de l‘Énergie (Special Energy Program)
SHS Solar Home Systems
SINELAC Société Internationale des Pays des Grands Lacs (International Society of Electricity of the Great Lakes Countries)
SNEL Société Nationale d‘Électricité (Congolese National Electricity Utility)
SOSUMO Société Sucrière du Moso (Sugar Cane Industry of MOSO)
UNICEF United Nations Children’s Fund
USD United States Dollar
14ACRONYMS, ABBREVIATIONS AND MEASUREMENTS Renewable Energies in East Africa
BURUNDI

MEASUREMENTS
AC alternative current
bbl barrel
°C degree Celsius
DC direct current
€ Euro
ha hectare
HV high voltage
kV kilovolt
kWh kilowatt hour
LV low voltage
m meter (1 m = 1,000 mm)
m² square meter
MV medium voltage
MW megawatt (1 MW = 1,000 kW)
Wp Watt-peak (1kWp = 1,000 Watt-peak)
toe tons of oil equivalent (1 toe = 1,000 kgoe (kilogram of oil equivalent))
15ACRONYMS, ABBREVIATIONS AND MEASUREMENTS Renewable Energies in East Africa
BURUNDI

SUMMARY
ECONOMICAL STATUS AND DEVELOPMENT OF BURUNDIBurundi was one of the poorest countries in the world even be-fore the severe civil crisis and the ethnic conflict of the 1990s. An internationally brokered power-sharing agreement be-tween the Tutsi-dominated Government and the Hutu rebels in 2003 paved the way for a transition process. A new Consti-tution was established in 2005 and ethnic quota was formed for determining positions in Burundi‘s Government. To this day, conflicts between the Hutu and the Tutsi continue1.
Poverty in rural areas, where 91 % of the population live, rose from 35 % to 58 % in the decade between 1992 and 2002, standing now at 60 %. For the period of 1986 to 1992, Burundi knew a relatively constant real growth with an av-erage rate of 3,7 % without the structure of the productive apparatus changing. With the crisis of 1993, the Gross Domestic Product (GDP) dropped cumulatively by 20 %, the income per head, which was 210 USD in 1990, dropped to 110 USD in 2004 and 88 USD in 2007, placing Burundi in the third rank of the poorest countries2.
STRUCTURE OF ENERGY SUPPLY IN BURUNDINearly all of Burundi‘s gross energy demand is met by wood, charcoal or peat. Thus 95 % of the total primary energy supply in Burundi is met by biomass3.
Electricity Only 1 % of the population has access to electricity, which is mainly supplied to the capital city of Bujumbura and some other cities. Hydro power is the only source of electricity sup-ply with an operative capacity of 38 MW (as of 2008). The total electricity consumption of 188 GWh (as of 2007) was covered by national hydro power stations (58 %) and derives from imports. Transmission losses are high and average at around 24 %4.
Oil As Burundi has no oil reserves of its own, it is importing oil through the land corridor mainly from Mombasa. Since 2006, the prices for oil products have been jumping from 1.10 USD per liter of gasoline in 2006 to 2.00 USD in 20085.
The national thermal power stations with a total ca-pacity of 5.5 MW are not in operation due to low maintenance and high oil prices (that cannot be covered by the local plants’ operators).
Renewable Energies in East AfricaSUMMARY 16
BURUNDI
STATUS OF RENEWABLE ENERGIES IN BURUNDIRenewable Energy (RE) utilization is negligible in Burundi. Although there are huge potentials, the private and public RE sector is underdeveloped. Solar energy radiation is con-stant at 4–5 kWh/m² throughout the year6, but only three private companies7 are actively selling small Solar Home Sys-tems (SHS) and facilitating a current PV program targeting schools and clinics.
In total, only 24 small and medium size hydro power stations8 are currently in operation, rehabilitation or in plan-ning status. Hydro power is the only source of electricity in the country so far. Other sources have not yet been exploited.
1 INTEGRATED BUREAU OF THE UNITED NATIONS IN BURUNDI, AS OF 2007
2 IMF, AS OF 2007
3 REPUBLIC OF BURUNDI, AS OF 2006
4 REPUBLIC OF BURUNDI, AS OF 2007
5 MINISTRY OF INFRASTRUCTURE OF RWANDA, AS OF 2007
6 SEE ANNEX 7 - AFRICA SOLAR MAP
7 SEE CHAPTER 6.1 OF THIS REPORT – RENEWABLE ENERGY (RE) COMPANIES
8 SEE ANNEX 7.12 - LIST OF ACTUAL AND PLANNED HYDRO POWER SOURCES
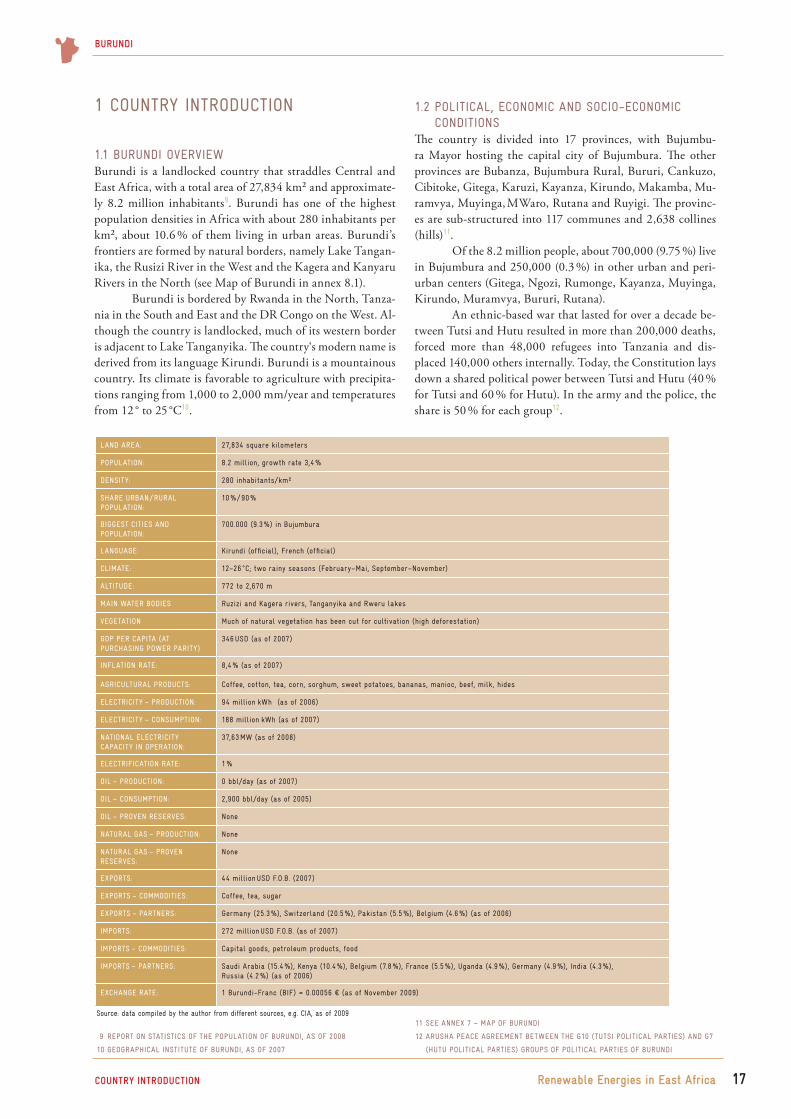
1 COUNTRY INTRODUCTION
1.1 BURUNDI OVERVIEWBurundi is a landlocked country that straddles Central and East Africa, with a total area of 27,834 km² and approximate-ly 8.2 million inhabitants9. Burundi has one of the highest population densities in Africa with about 280 inhabitants per km², about 10.6 % of them living in urban areas. Burundi’s frontiers are formed by natural borders, namely Lake Tangan-ika, the Rusizi River in the West and the Kagera and Kanyaru Rivers in the North (see Map of Burundi in annex 8.1).
Burundi is bordered by Rwanda in the North, Tanza-nia in the South and East and the DR Congo on the West. Al-though the country is landlocked, much of its western border is adjacent to Lake Tanganyika. The country‘s modern name is derived from its language Kirundi. Burundi is a mountainous country. Its climate is favorable to agriculture with precipita-tions ranging from 1,000 to 2,000 mm/year and temperatures from 12 ° to 25 °C10.
Renewable Energies in East Africa 17COUNTRY INTRODUCTION
1.2 POLITICAL, ECONOMIC AND SOCIO-ECONOMIC CONDITIONS
The country is divided into 17 provinces, with Bujumbu-ra Mayor hosting the capital city of Bujumbura. The other provinces are Bubanza, Bujumbura Rural, Bururi, Cankuzo, Cibitoke, Gitega, Karuzi, Kayanza, Kirundo, Makamba, Mu-ramvya, Muyinga, MWaro, Rutana and Ruyigi. The provinc-es are sub-structured into 117 communes and 2,638 collines (hills)11.
Of the 8.2 million people, about 700,000 (9.75 %) live in Bujumbura and 250,000 (0.3 %) in other urban and peri-urban centers (Gitega, Ngozi, Rumonge, Kayanza, Muyinga, Kirundo, Muramvya, Bururi, Rutana).
An ethnic-based war that lasted for over a decade be-tween Tutsi and Hutu resulted in more than 200,000 deaths, forced more than 48,000 refugees into Tanzania and dis-placed 140,000 others internally. Today, the Constitution lays down a shared political power between Tutsi and Hutu (40 % for Tutsi and 60 % for Hutu). In the army and the police, the share is 50 % for each group12.
BURUNDI
LAND AREA: 27,834 square kilometers
POPULATION: 8.2 million, growth rate 3,4 %
DENSITY: 280 inhabitants/km²
SHARE URBAN / RURAL POPULATION:
10 % / 90 %
BIGGEST CITIES AND POPULATION:
700.000 (9.3 %) in Bujumbura
LANGUAGE: Kirundi (official), French (official)
CLIMATE: 12–26 °C; two rainy seasons (February–Mai, September–November)
ALTITUDE: 772 to 2,670 m
MAIN WATER BODIES Ruzizi and Kagera rivers, Tanganyika and Rweru lakes
VEGETATION Much of natural vegetation has been cut for cultivation (high deforestation)
GDP PER CAPITA (AT PURCHASING POWER PARITY)
346 USD (as of 2007)
INFLATION RATE: 8,4 % (as of 2007)
AGRICULTURAL PRODUCTS: Coffee, cotton, tea, corn, sorghum, sweet potatoes, bananas, manioc, beef, milk, hides
ELECTRICITY – PRODUCTION: 94 million kWh (as of 2006)
ELECTRICITY – CONSUMPTION: 188 million kWh (as of 2007)
NATIONAL ELECTRICITY CAPACITY IN OPERATION:
37,63 MW (as of 2008)
ELECTRIFICATION RATE: 1 %
OIL – PRODUCTION: 0 bbl/day (as of 2007)
OIL – CONSUMPTION: 2,900 bbl/day (as of 2005)
OIL – PROVEN RESERVES: None
NATURAL GAS – PRODUCTION: None
NATURAL GAS – PROVEN RESERVES:
None
EXPORTS: 44 million USD F.O.B. (2007)
EXPORTS – COMMODITIES: Coffee, tea, sugar
EXPORTS – PARTNERS: Germany (25.3 %), Switzerland (20.5 %), Pakistan (5.5 %), Belgium (4.6 %) (as of 2006)
IMPORTS: 272 million USD F.O.B. (as of 2007)
IMPORTS – COMMODITIES: Capital goods, petroleum products, food
IMPORTS – PARTNERS: Saudi Arabia (15.4 %), Kenya (10.4 %), Belgium (7.8 %), France (5.5 %), Uganda (4.9 %), Germany (4.9 %), India (4.3 %), Russia (4.2 %) (as of 2006)
EXCHANGE RATE: 1 Burundi-Franc (BIF) = 0.00056 € (as of November 2009)
9 REPORT ON STATISTICS OF THE POPULATION OF BURUNDI, AS OF 2008
10 GEOGRAPHICAL INSTITUTE OF BURUNDI, AS OF 2007
11 SEE ANNEX 7 – MAP OF BURUNDI
12 ARUSHA PEACE AGREEMENT BETWEEN THE G10 (TUTSI POLITICAL PARTIES) AND G7
(HUTU POLITICAL PARTIES) GROUPS OF POLITICAL PARTIES OF BURUNDI
Source: data compiled by the author from different sources, e.g. CIA, as of 2009

The Burundian economy depends on coffee and tea exports, which account for 90 % of foreign exchange earnings. The socio-political crisis during the last ten years resulted in a considerable decrease of the interior production and a serious imbalance of the state account.
2 ENERGY MARKET IN BURUNDI
2.1 OVERVIEW OF THE ENERGY SITUATIONOverall, 96 % of Burundi‘s energy requirements are met by tra-ditional biomass. The biomass energy is composed of 70.80 % of fuel wood, 18.36 % of agricultural residues, 5.80 % of char-coal, 1.00 % of bagasse and 0.04 % of peat 0.04 %13.
Only 1 % of the population has access to electricity, which only accounts for about 1.5 % of energy requirements. Burundi’s energy sector and its problems have to be under-stood in light of the special conditions of this small, land-locked country. Energy consumption in Burundi is very low. The demand and use of energy is based on the location as well as the types of economic activities and local habitat.
The shares of energy supply are shown in the following figure 1.
2.2 ENERGY CAPACITIES, PRODUCTION AND CONSUMPTION
Burundi faces severe constraints in electricity supply, either national or imported. Most of the electricity supply is gen-erated by 24 hydroelectric plants with a combined installed capacity of 37.63 MW (as of 2008). These plants generated about 91 GWh in 2006 or nearly 100 % of the total national electricity production.
The utility REGIDESO (Régie de Production et de Distribution d‘Eau et d‘Électricité) exploits nine power sta-tions with a working installed capacity of 30.9 MW (around 90 GWh every year). The power stations of Rwegura with 18 MW and Mugere with 8 MW account for 82 % of the total capacity installed. The Directorate General of Hydraulics and Renewable Energies (DGHER) exploits five micro power sta-
Renewable Energies in East Africa 18COUNTRY INTRODUCTION
BURUNDI
tions with a total of 0.5 MW. In addition, private producers have ten micro power stations with 0.65 MW capacity14. An overview of all 24 hydro power stations is given in the annex (List of Actual and Planned Hydro Power Sources).
During the years of civil conflict, the electricity ac-cess rate in connected areas halved as the urban population doubled, while the number of REGIDESO’s customers barely increased to 41,074 by the end of 200715. The average electric-ity consumption per citizen in Burundi is among the lowest in Africa and averages at around 20 kWh/year.
Burundi also benefits from imports from the regional hydro plants of Rusizi I and II operated by Société Interna-tionale des Pays des Grands Lacs (SINELAC) and Société Nationale d’Électricité (SNEL) respectively. The supply defi-cit currently varies between 12.9 MW during the wet season and 23.5 MW during the dry season when the country’s main hydro power plants are running at reduced capacity. Assum-ing that the economic growth continues at the current pace, the supply deficit may reach 22 MW and 34 MW (during the wet and dry seasons, respectively) by 2014. At this point, sub-stantial generation capacity could be added through the com-missioning of the Mpanda and Kabu 16 (Burundi), Rusumo Falls and Rusizi III (Regional) hydro power plants.
The impact of power cuts was identified in the Interim Strategy Note (ISN, 2006–2007) as one of the major hur-dles to economic growth. Demand for electricity is expected to continue to rise steadily as the economy improves, return-ing refugees re-establish themselves and standards of living increase. Peak demand occurs during the evening hours and emanates mainly from household lighting needs. Due to the lack of maintenance and the supply deficit described above, the quality of service and operations is currently insufficient, with an estimated 48 GWh in combined technical and non-technical losses for 2007, representing nearly 25 % of total supply.
Technical losses are deemed to make up a large por-tion of these losses given the poor condition of the network, of the high voltage and medium voltage stations and of the low voltage distribution posts. The numbers of power inter-ruptions are high both on LV and on the HV/MV backbone network. The quality of the electricity delivered suffers from poor frequency and significant voltage deviations estimated to be in excess of the normal 10 % below and above 220 V.
2.3 ELECTRICITY PRICESDespite the 2007 tariff revision, the tariff structure remains inadequate to address issues of efficiency, financial viability and social equity among service users. A revised tariff re-gime is needed to adjust the tariff structure and its levels. The household electricity tariffs currently in place include subsi-dized pricing for up to 750 kWh per two-month billing cycle with an average of 5.2 Eurocent /kWh. In order to return to financial and operational viability, REGIDESO will need to:
FIGURE 1
Shares of Total Primary Energy Consumption
13 SEE ANNEX 7.9 – STRUCTURE OF GROSS ENERGY SUPPLY IN BURUNDI 2002–2007
14 SEE ANNEX 7.12 – LIST OF ACTUAL AND PLANNED HYDRO POWER SOURCES IN
BURUNDI
15 REGIDESO, 2002–2007
Source: Graph by PSE AG, based on data from Ministry of Water, Energy and Mines, as of 2008,
and from AfDB, Rehabilitation Project of Electrical Infrastructures in Burundi, as of 2007;
100
80
60
40
20
0Biomass Charcoal Petroleum Electricty
90.20 5.80 2.50 1.50

COUNTRY INTRODUCTION
Execute the financial restructuring before 31 December 2008 as agreed by the Government prior to negotiations
Have the tariff structure revised so that it is efficient, cov-ers at least operation and maintenance costs and is fair and equitable
Improve its technical and commercial performance through the execution of a performance contract between REGIDESO and the State
REGIDESO, with the Government’s support, has already taken a number of steps in these directions. As indicated above, tariffs were recently increased and the Government has authorized REGIDESO to apply for a 4 % surcharge to electricity tariffs when the thermal generation plant is in use. In April 2007, the Ministry of Finance and REGIDESO also signed an agreement for the settlement of approximately 50 % of the State’s debt to the utility by means of bonds.
The power tariff16 is going to be revised with the pro-posed Financial Restructuring Plan of REGIDESO financed through the World Bank‘s Multisectoral Water and Electric-ity Infrastructure Project.
Small thermal diesel generating sets are operated by REGIDESO with subsidies from the Government. A calcula-tion made by REGIDESO shows that a thermal kWh is worth 350 BIF while the kWh is sold only at 41 BIF for customers with a social status that is based on consumption of up to 150 kWh.
This is the reason why thermal diesel generating sets are used only for towns located far from the national grid. Stand-alone diesel generator sets and inverters are also in use, but are mainly limited to hotels and lodges or public institu-tions like military camps, hospitals and schools.
Oil ProductsIn a normal period, the oil products are mainly imported from the refineries of Mombasa, the oil terminal of Nairobi or directly from the Middle East. These products arrive in Burundi by two corridors: the northern corridor (Kenya-Uganda-Rwanda-Burundi) and the central corridor (through Tanzania). Importation and distribution of the oil products are carried out by national companies. Since the period of 1996–1999, the price has not ceased to increase, rising from 0.35 USD in 1999 to 1.10 USD per liter of gasoline in 2006 and 2.00 USD in 200817. Oil research in the Lac Tanganyika and the plain of Rusizi, which had been started with the Amo-co American Company in the Eighties, was stopped, but has been taken up again by Streamoil at block D18 in the South of the country.
2.4 MARKET ACTORS FOR PLANNING, REGULATION AND DISTRIBUTION
The public services DGEE, CEBEA, REGIDESO, DGHER, SINELAC, ONATOUR are under the authority of the Min-istry of Water, Energy and Mines (MWEM).
MWEM, DGEE, MEFCD, MELM & PWThe Ministry of Water, Energy and Mines (MWEM), through the Directorate General of Water and Energy (DGEE), is re-sponsible for the planning and regulations of the energy sec-tor. The Ministry of Economy, Finances and Development Cooperation (MEFCD), through the Deputy Ministry of Planning, is responsible for the programming of the energy projects within the National Plan of Priority Actions. The Ministry of Environment, Land Management and Public Works (MELM & PW) is responsible for the environmental aspects.
CEBEA During the Eighties, CEBEA (Centre d‘Études Burundais en Énergies Alternatives – Burundian Center of Renewable En-ergies) as a testing institute installed a number of PV systems and had a production schedule for solar cookers, solar heaters and solar dryers. Unfortunately, the national crisis blocked the project.
REDIGESCO The urban electricity utility (Régie de Production et de Dis-tribution d‘Eau et d‘Électricité – REGIDESO) is the national power authority that owns all of the country’s power plants, excluding those below 150 kW. REDIGESCO is responsible for power distribution in urban areas.
Moreover, REGIDESO operates Burundi‘s thermal power stations, most of which are located in Bujumbura and the surrounding areas, and a small amount of hydro capacity in the form of small units in rural areas. REGIDESO also operates the transmission system and the distribution network in Burundi.
REGIDESO in the capital Bujumbura purchases elec-tricity from the SINELAC site at RUSIZI via a 110 kV trans-mission line operated by RD Congo.
DGHER The rural electricity utility of DGHER (Directorate General of Hydraulics and Renewable Energies) independently devel-ops rural electrification projects.
SINELAC The regional electricity utility of SINELAC (Société Inter-nationale des Pays des Grands Lacs – International Society of Electricity of Great Lakes Countries) was established by Burundi, Rwanda and Zaire to develop international electric-ity projects of 40 MW. SINELAC pursues several other hydro projects presently in the study stage. RUSIZI III-145 MW and RUSIZI IV-205 MW are located between RD Congo and Rwanda. These projects include the 28 MW RUSIZI I hydro power plant, operated by RD Congo (SNEL).
Renewable Energies in East Africa
16 SEE ANNEX 7.11 – POWER TARIFFS FOR PRIVATE AND INDUSTRIAL USES, P.37. LATEST
INFORMATION ON POWER TARIFFS CAN BE CHECKED ON THE WEBSITE OF REGIDESO
(WWW.REGIDESORDC.COM/)
17 SAIC, AS OF 2008
18 THERE ARE 4 BLOCKS OF RESEARCH OF PETROLEUM IN BURUNDI (BLOCK A, B, C AND D).
19
BURUNDI

20
ONATOUR The national peat utility of ONATOUR (Office National de la Tourbe) is responsible for the exploitation of the peat in highlands of Burundi (Gisozi, Matana, Gitnga, Buyongwe).
SOSUMO The sugar cane utility of SOSUMO (Société Sucrière du Moso) is operating a cogeneration power station for bagasse (5 MW).
Biomass SectorThe biomass sector of Burundi is mainly administrated by the Ministry of Environment that focuses on the sustainable production of firewood and charcoal. The Ministry of Trade regulates the transport of these commodities as well as related tax issues. The Ministry of Energy plans and regulates the fire-wood and charcoal demand in urban areas of Burundi.
3 RENEWABLE ENERGY POLICY FRAMEWORK CONDITIONS
It must be noted that Burundi’s energy sector is dominated by the traditional sources of energy such as wood and charcoal accounting for nearly 96 % of the energy balance. Consump-tion far exceeds sustainable annual production if the forestry cover is to be reconstituted. As to the other energy forms, petroleum products (2.50 %) predominate consumption, fol-lowed by electricity accounting for only 1.50 % of the energy balance and peat accounting for 0.04 %19.
3.1 POLICY AND RENEWABLE ENERGY PROMOTION PROGRAMS
In the short and medium term, the Government of Burundi is planning to carry out the following actions for extending energy supply by RE:
Doubling the capacities of the hydro power stations of Nyemanga and Buhiga
Feasibility and implementation studies for the hydro power stations of Kabu 23, Ruzizi III and Mule 34
Development of rural electrification by the construction of mini hydro, solar and wind-power as well as of the use of biogas
Renovation of the hydroelectric power stations and electricity transmission and distribution networks
Construction of the power generation plant of Mpanda Extension of urban and rural electric networks and maintenance of existing power stations and networks
Organizational audit and financial turnaround of REGIDESO
The Government has given high priority to rehabilitating and extending electricity services. The MWEM recognizes that the provision of these services constitute a crucial factor for economic development of the country. Developing sustainable
services, however, requires considerable investments and an improved financial and operational management. Regarding the production of electricity, the MWEM favors hydroelec-tricity, while acknowledging that thermal power production needs to be utilized in the short run to bridge the gap between demand and supply. In addition, the MWEM would like to:
Restructure the energy sector by merging the electricity activities of REGIDESO and DGHER
Encourage private sector participation in electricity production
Fully enact the regulatory framework
The MWEM considers the direct subsidy of operation and maintenance (O & M) costs as inadequate and inefficient and adheres to a tariff policy of fully covering at least O & M costs.
3.2 DONOR AID ACTIVITIESAlthough limited investments took place during the period of conflict, REGIDESO and DGHER have indirectly benefited from donor-funded multisectoral activities to support the re-construction. Those activities included:
The Program for Rehabilitation of Burundi (PREBU) financed by the European Union and the IDA-financed Economic Recovery Credits (CRE)
The Social Funds and the IDA Public Works and Employ-ment Creation Project (PTPCE)
The Emergency Activities conducted by the ICRC (Inter-national Committee of the Red Cross) and United Nations Children’s Fund (UNICEF)
The Chinese cooperation financing the rehabilitation of the hydroelectric power plants of Mugere (8 MW) in 2003 and the rehabilitation of the micro hydro power plants Ruvyironza (1.28 MW) and Gikonge (0.85 MW) in 2005 for which work was completed in 2008.
For the period of 2007–2010, some donors have already agreed to finance the projects mentioned above. Those donors are:
World Bank AfDB Chinese Exim Bank Government of Denmark
The rationale for donors’ involvement is registered, for ex-ample, in line with the World Bank’s Interim Strategy Note (ISN) dated 11 April 2005 and the Poverty Reduction Strat-egy Paper (PRSP) of September 2006 and carries strategic im-portance in light of the Bank’s focus on poverty reduction and post-conflict assistance in IDA countries.
The proposed World Bank Multisectoral Project, the AfDB Electricity Infrastructures Rehabilitation Project (EIRP), the support of Chinese Government to manage the power generation of Mpanda and the Government’s solar
Renewable Energies in East Africa
19 HAKIZIMANA, AS OF 2008
COUNTRY INTRODUCTION
BURUNDI

21
rural electrification activities will contribute to both aspects by improving access to electricity, which has been identified in the ISN as requirements to achieve higher and sustained growth performance. These goals also coincide with those of the PRSP, which aims to promote sustainable economic growth and to develop human capacities. The scope of the projects is mainly focusing on rural water supply contribut-ing to achieve the Millennium Development Goals (MDGs) on water supply. In the case of electricity, the projects also seek to improve Burundi’s capacity to participate in a regional integrated network as well as to explore alternative sources of energy that would be less costly and more environmentally sustainable. There is an urgent need for investments in the electricity sector because electricity will play a crucial role in accelerating industrial and commercial activities and hence contribute to the country’s economic growth.
3.3 MARKET RISKS The conditions to lead businesses in Burundi are currently fa-vorable. As a matter of fact, all rebel movements signed the agreement of cease-the-fire, and the latest to date will enter in the political and administrative institutions. That made it possible for the donors of Burundi to organize a Round Table in May 2007 to financially support the country in order to leave poverty and to rehabilitate the economic infrastructures of production. Thus, legal certainty is also given for foreign in-vestors to employ local experts and trained technical personnel for the techniques of RE.
Intellectual property rights are acknowledged and protected by Burundi’s legislation. This legal basis makes it possible for investors to sell their equipment at lower risks. In addition companies investing in Burundi have now the right to transfer their margins, in accordance with the Code of In-vestments (which in particular gives a guarantee of non pay-ment of taxes for a certain period). The research institutes in the sector of energy (e. g. the University of Burundi / Faculty of Applied Sciences) are prepared to actively support research for rural development. The barriers hindering to promotion of the RE as identified recently were:
Missing capacities Low awareness of the purchasers of the equipment and of the population in general
Lack of policy attention and institutional framework Lack of quality and consistency in the RE technology made available, extending from the equipment itself right through to installation, operation and maintenance
Lack of incentives to promote technology transfer
3.4 CUSTOMS DUTIES AND TAXES RELATED TO RENEWABLE ENERGY PRODUCTS
In addition to the law liberalizing the electricity sector, the field of RE was declared as a priority for both the social and rural development. It is the reason why the Government of Bu-rundi decided to reduce tax for all imported RE components.Within this framework, the companies WATEL, ECOGEER and ENESCO, which are facilitating the electrification of
Renewable Energies in East Africa
health centers and the secondary schools pay neither customs duties nor other taxes for imported solar equipment.
SHORT BUSINESS INFOZero custom duty and zero tax on imported RE equipment.
4 STATUS AND FUTURE OUTLOOK FOR RENEWABLE ENERGIES
4.1 BIOMASS / BIOGASTraditional biomass-based fuels for cooking and heating are currently the most important source of primary energy in Bu-rundi with wood and charcoal consumption accounting for 96 % of the total consumption (rural 76 %, urban 24 %;)20. The total sustainable firewood biomass supply from all sources was estimated at 6,400,000 m³ in 2007.
Firewood comes from three main areas: the range-lands, Government forests and small farmlands. Before the civil war, the rangelands covered about 131,636 hectares and the Government forests 74,024 hectares, but now they are together about 188,000 hectares, which means that Burundi lost about 17,660 hectares.
According to a survey carried out by DGEE (as of 2004), 320 biogas plants for cooking and lighting purposes were in operation in Burundi by end of 1993. Most of these systems are between 4–16 m3 with a maximum gas capacity of 3 m3, which is considered sufficient to meet the cooking and lighting needs of a family of five persons21.
Peat offers an alternative to increasingly scarce fire-wood and charcoal as a domestic energy source. The Govern-ment is promoting peat production.
Cogeneration from bagasse, a waste product of the sugar cane industry, is used in two 2.5 MW power plants op-erated by SOSUMO. As the unit runs 300 hours per month and over a period of six months, the energy production in 2007 was 9 MWh. The electricity and heat is not fed into the national grid, but is used to power the SOSUMO sugar pro-duction facilities.
SHORT BUSINESS INFOBiomass commercial energy is used in cogeneration in the sugar industry (5 MW, 9 MWh).
4.2 SOLAR ENERGYBurundi has an estimated insolation of about 4–5 Wh/m²/day22. Solar radiation has been used traditionally for drying of crops, animal products and clothes. There is a large potential for PV electricity generation in rural parts of Burundi as most regions are not grid-connected. But application of PV in these areas is not very common. Actually, the MWEN is installing solar PV equipment in 60 health centers and colleges in rural areas. This
20 DGEE, AS OF 2006
21 GTZ / DGEE, AS OF 2004
22 SEE ANNEX 7 - AFRICA SOLAR/PV MAP
23 DIRECTORATE GENERAL OF WATER AND ENERGY, AS OF 2008
COUNTRY INTRODUCTION
BURUNDI

22
program will be implemented in the next two years to electrify 90 clinics and 90 schools23.
Health services are equipped with waiting rooms, con-sultation units, laboratories, administration and registration areas, family planning and maternity facilities, store rooms, sanitary facilities and housing for staff. Now the health cent-ers have lighting and sterilization facilities. Personnel working at the health centers have access to TV and lighting in their residences. At the community colleges, examination results have improved since students have had electric lighting for longer study hours.
The electrical installations in the health centers are in alternative current (AC) to allow not only lighting but also electricity supply for refrigerators, electron microscopes, com-puters and distillers. 2 kWp systems cost 21.000 USD per installation. The school systems are for lighting with an in-stalled direct current (DC) capacity between 600–700 Wp per school. Each PV installation costs between 10,000 and 11,000 USD24.
In Burundi, there is a lack of PV equipment in local markets. An intensive awareness-raising campaign is being implemented to gain support for the project from stakeholders who were initially reluctant to participate because they were unfamiliar with PV systems. The Government has released all taxes on the imported materials and equipment needed for the PV systems. Currently, mainly small (12–30 Wp) SHS are sold on a small commercial market. Until 1993, 1,678 PV kits with 72 kWp were installed for telecommunication sys-tems25 (56 %), water pumping (30 %), lighting26 (13 %) and refrigeration of medicine and vaccines27 (1 %), but 60 % were destroyed during the civil war. According to the ENESCO Report, 17 % were functional in 200228.
SHORT BUSINESS INFOCurrent solar electrification program for 90 schools (0,7 kW DC) and 90 clinics (2 kW AC)72 kW installed countrywide, 56 % telecom systems, 30 % water pumping, 13 % lighting, 1 % refrigeration
4.3 WIND POWERThe wind energy potential has not been explored so far in Burundi. No reliable data is available to estimate wind ve-locities and to locate potential sites for electricity production. No small-scale wind turbines have been installed in the coun-try29.
4.4 GEOTHERMAL POWERGeothermal resources have been identified in the West Rift Valley region in neighboring eastern DR Congo. Several geo-thermal indicators exist in Burundi, but very little useful data is available to assess their commercial viability. There is, how-ever, a strong need to carry out detailed exploration to quan-tify the available resource capacity.
Renewable Energies in East Africa
4.5 HYDRO POWERIn Burundi, 24 large and small hydro plants are currently in operation with a total national capacity of 37.63 MW (as of 2008). In 2006, the recorded electricity production was 152 GWh30.
Hydro power provides about 99 % of the country’s electricity power supply. The resource, however, is not fully exploited yet. There is considerable potential for further devel-opment, including micro, mini and small hydro power.
REGIDESCO exploits nine power stations with an installed capacity of 30.9 MW producing around 90 GWh every year. The power stations of Rwegura with 18 MW and Mugere with 8 MW account for 82 % of the installed capac-ity. DGHER exploits five micro power stations for a total of 0,5 MW, and private producers have ten micro power stations for a power of 0,65 MW.
The Lahmeyer International Studies of the Devel-opment of the Hydroelectric Resources of Burundi (as of 1983) showed that there is 1,700 MW of theoretical capacity of which 300 MW (from sites with capacities above 1 MW) could be economically installed31.
SHORT BUSINESS INFOCurrently, there are 24 small and large scale hydro pow-er units with total of 38 MW produce 152 GWh per year.The economically viable potential is about 300 MW of medium and large hydro stations.
24 NUMBERS OBTAINED FROM THE DGEE FOR IMPLEMENTATION OF SOLAR ENERGY IN
RURAL AREAS IN BURUNDI
25 THESE TELECOMMUNICATION SYSTEMS WERE PROVIDED BY THE COMPANIES/ORGANI-
ZATIONS ONATEL, NATIONAL RTV-RTNB, CONTROL OF THE AERONAUTICAL SERVICES-
RSA, ENERGY OF GREAT LAKES-EGL AND CARITAS.
26 REPORTS OF DGEE AND DGHER
27 REPORTS OF THE MINISTRY OF PUBLIC HEALTH
28 ENESCO, AS OF 2002
29 AS COUNTRY SPECIFIC WIND MAPS FOR BURUNDI ARE STILL MISSING PLASE SEE
GENI, 2010 FOR A GENERAL OVERVIEW ON WND ENERGY POTENTIAL IN AFRICA>
HTTP://WWW.GENI.ORG > LIBRARY> RENEWABLE ENERGY RESOURCE MAPS > AFRICA > WIND)
30 SEE ANNEX 7.12 - LIST OF ACTUAL AND PLANNED HYDRO POWER SOURCES
31 SEE ANNEX 7.13 - LIST OF POTENTIAL LARGE SCALE HYDRO POWER PROJECTS
COUNTRY INTRODUCTION
BURUNDI

23
5 RENEWABLE ENERGY BUSINESS INFORMATION AND CONTACTS
Renewable Energies in East Africa
The following information is mainly supplied by Dismas Ndit-abiriye, Ir. Godefroy Hakizimana and Marie-Ange Kigeme in ‘Comparative Study on the Ecological and Economic Advan-tages of the Various Sources of Energy exploited in Burundi, NBI-FCBN’, as of 2008.
COUNTRY INTRODUCTION
BURUNDI
NAME ADDRESS PROFILE ESTIMATED RELIABILITY
CHARCOAL
Associations of Women and Artisans
c/o ACVE Hotel NovotelBujumbura – BurundiPhone: +257 2222 2600
Sale and manufacture of improved stoves
Associations of women are promoting and selling improved stoves in rural areas in cooperation artisans
AGRICULTURAL AND URBAN WASTE
BRICOOP
Q. IndustrielBujumbura – Burundi(around SODECO)Phone: +257 22 22 5909
Densified agricultural wasteBRICOOP produces 40 tons per day of densified briquettes from coffee parch, sawdust, rice straw, cotton scrap, fibers of palm and dung as binder for the Army Force barracks
ADLP
Q. NyakabigaBujumbura – Burundi(around SOS School)Phone: +257 22 22 9555
Densified urban household wasteADLP manufactures 500 kg per day of densified briquettes pro-duced from household wastes (including household refuse in the peripheral districts of Bujumbura) for the National Police Force
SOLAR ENERGY PARTNERS
WATEL
Q. IndustrielBujumbura ¬ Burundi,Avenue de l‘ImprimerieCHANIC HousePhone: +257 22 22 6579
Import and sale of PV solar equipment
Contract for the electrification of health centers and communal colleges in the rural off-grid environment, awarded in October 2006 at WATEL by the Government
ECOGEERBujumbura – Burundi Phone: +257 79 916110
Import and sale of PV solar equipment
Contract for the electrification of health centers and communal colleges in the rural off-grid environment, was awarded in October 2006 at ECOGEER by the Government
ENESCORue des Eucalyptus,Bujumbura – Burundi,Phone: +257 79 934 212
Import and sale of PV solar equipments
Engineering and design office also working in PV solar electri-fication
ENVIRONMENTAL LEADERS
ACVEHotel NovotelBujumbura –BurundiPhone: +257 2222 2600
Association for green reforestation
Association dealing with programs of reforestation and protection of the environment via micro projects (in particular protection of banks in cities and promotion of improved stove cookers)
FCBNAvenue de l’AmitiéBuilding Radio Isanganiro – BurundiPhone: +257 22 21 7991
Burundian forum of the Civil Society for the Nile Basin
Grouping of associations dealing with the protection of the en-vironment by promoting projects of micro appropriations related to reforestation and popularization of improved stove cookers within the framework of the Basin of the Nile
NAME ADDRESS PROFILE ESTIMATED RELIABILITY
MINISTERIAL INSTITUTIONS
Ministry of Water, Energy and Mines (MWEM)
B.P. 745 Bujumbura – BurundiPhone: + 257 22 22 5909Fax: + 257 22 22 3337
Governmental Promotion of RE
Ministry of Environment, Land Management and Public Works (MELM & PW)
B.P. Bujumbura – BurundiFax: +257 22 22 [email protected]
Governmental Protection of environment
Ministry of Internal Affairs (MIA)
B.P. BujumburaPhone: + 257 22 22 4573 Fax: +257 22 22 4678
Governmental Mobilization
PUBLIC UTILITIES
Urban National Power Utility (REGIDESO)
B.P. 660 Bujumbura – BurundiPhone: +257 22 3412
Para-statelyProduction, distribution and sale of electricity in urban centers
Rural National Power Utility (DGHER)
B.P. 1192 Bujumbura – BurundiPhone: +257 22 22 5909E-Mail : [email protected]
Personalized administration Sales, production and distribution of electricity in rural areas
Alternatives Energies Burundian Centre (CEBEA)
–Governmentalproject
Research in thermal solar energy
OTHERS
University of Burundi
B.P. 906 Bujumbura – Burundi Phone: + 257 22 6220, Mobile: + 257 79 925701, 77 750200,Fax: + 257 22 3288
Personalizedadministration
Research and training in local material for utilization of thermal solar energy
5.1 RENEWABLE ENERGY COMPANIES & BUSINESS RELATED ORGANIZATIONS
5.2 LOCAL INSTITUTIONS RELATED TO RENEWABLE ENERGY BUSINESS

24COUNTRY INTRODUCTION Renewable Energies in East Africa
BURUNDI
GOVERNMENTAL PROJECTS AND PROGRAMS
TYPE OF PROJECT
DONORSFINANCING AMOUNT (USD)
DURATION OF THE PROJECTNATIONAL ANNUAL
BUDGETBILATERAL MULTILATERAL
Multisectoral Water and Electricity In-frastructure Project (HV switchyard and electric lines)
National – – World Bank 31 million 2008–2012
Electric Infrastruc-tures Project (MV Switchyard and electric lines)
National – –African Develop-ment Bank
11 million 2008–2012
Construction of Mpanda Hydroelec-tric Power Station (10.6 MW
National – Chinese Exim Bank – 42 million 2009–2011
Construction of Kabu 16 Hydroelec-tric Power Station (20 MW)
National – –Burundi / South Af-rican Public-Private Partnership
Under evaluation –
Construction of Mule 34 Hydroelec-tric Power Station (15 MW)
National – –Burundi / South Af-rican Public-Private Partnership
Under evaluation –
Annual projects of electrification of health centers and communal colleges by PV solar energy
NationalExtraordinary bud-get of investment
– – 1 Million Every year
Construction of Ru-sumo Hydroelectric Power Station
Regional – –World Bank / AfDBPublic-Private Partnership
Under evaluation 2012–2017
Construction of Ru-sizi III Hydroelectric Power Station
Regional – – European Union Under evaluation –
Construction of Eldoret-Kampala-Kigali-Bujumbura Pipeline
Regional – –Public-Private Partnership
Under evaluation –
Search for hydro-carbons along Lake Tanganika
Bi-Lateral with DRC – –Public-Private Partnership
Under evaluation –
EAC Energy Master Plan
Regional – – AfDB Under evaluation –
EAC Refineries Master Plan
Regional – – AfDB Under evaluation –
5.3 GOVERNMENTAL AND MULTILATERAL DONORS PROJECTS

BIBLIOGRAPHY
6 BIBLIOGRAPHY
African Development Bank – AfDB (2006): Overview of Potential Projects, Financing Electricity for Growth in Africa
African Development Bank – AfDB (2007): Electric Infrastructures Rehabilitation Project in Burundi
Cadre Stratégique de Croissance et de Lutte contre la Pauvreté – CSLP (2006): Priority Action Program (PAP) for the Implementation of the PRSP in Burundi 2007–2010
Centre d‘Études Burundais en Énergies Alternatives – CEBEA (1997): Rural Solar Electrification in Burundi.
Chinese CGGC International (2006): Hydroelectric Power Station of Mpanda
Central Intelligence Agency – CIA (2009): The World Fact Book – Burundi (www.cia.gov/library/publications/the-world-factbook/geos/by.html)
DGEE and DGHER (without year): Several reports Directorate General of Water and Energy – DGEE (2006): Report of 2006
Directorate General of Water and Energy – DGEE (2008): Project of Rural Electrification with Solar Energy, Report of 2008
Economist (1999): The Economist Intelligence Unit, Country Profile Rwanda and Burundi 1998–1999, pp. 16-18. London
EIA (2003): Energy Information Administration, Country Energy Balance Burundi
ENESCO (2002): Report Rwanda Fitchner (1997): Hydroplan Burundi Geographical Institute of Burundi (2007): Report Global Energy Network Institue - GENI (2009): Wind Energy Potential in Africa (http://www.geni.org/globalenergy/library/renewable- energy-resources/world/africa/wind-africa/index.shtml)
GTZ/DGEE (2004): Programme Spécial de l‘Énergie / Special Energy Program (PSE), Report 2004
Hakizimana, Ir. Godefroy (2008): EAC Strategy to Scale-Up Access to Modern Energy Services, Burundi Country Report GTZ/UNDP
Integrated Bureau of the United Nations Burundi (2007): Strategic Framework for Peace Building in Burundi
International Monetary Fund – IMF (2007): Burundi – Note on the Poverty Reduction Strategy Paper and Joint International Development Association (IDA)
Lahmeyer International (1983): Brief Report on Metallurgy and Energy Supply – Burundi Nickel Project, Düsseldorf
Ministry of Infrastructure Rwanda (2007): Feasibility Study for the Rwanda-Burundi Oil Products Pipeline – Capacity Market Analysis Phase 1, draft report
Ministry of Public Health (without year): Several reports Ministry of Water, Energy and Mines – MWEM (2007): Sectoral Policy of the Ministry of Water, Energy and the Mines, 2007–2010
Ministry of, Water, Energy and Mines (2007): Sectoral Policy of the Ministry of Water, Energy and Mines, Re-public of Burundi
Renewable Energies in East Africa
Multinational Nile Basin Initiative (2006): Rusumo Falls Hydro power Station (RFHS), Proposal for the Award of an AfDB Fund
N. N. ( 2006): Balance of Energy of the Republic of Burundi
N. N. (2008): Report on Statistics of the Population of Burundi
Nditabiriye, Dismas, Hakizimana, Ir. Godefroy, Kigeme, Marie-Ange (2008): Comparative Study on the Ecologi-cal and Economic Advantages of the Various Sources of Energy Exploited in Burundi, NBI-FCBN
PVGIS/European Communities (2001-2007) & Tele Atlas/Europe Technologies (2010): Photovoltaic Geograph-ical Information System – Interactive Maps - Africa (http://re.jrc.ec.europa.eu/pvgis/apps3/pvest.php?map=africa; viewed in December 2009).
REGIDESO (2007): Reports of National Electricity Utility REGIDESO 2002–2007 (www.regidesordc.com/)
Régie de Production et de Distribution d‘Eau et d‘Électricité – REGIDESO (2002) : Burundian-Chinese SHP Training Workshop, Presentation
Republic of Burundi, (2007): Sectoral Policy of the Ministry of Energy and Mines
Round Table on External Aid (2007): Report on the Project Profiles Prepared for the Round Table on External Aid Held at Bujumbura on May 2007
SAIC (2008): Several reports UNEP (2006): Environmental Future of Africa – Our Environment, Our Treasure
World Bank, SNC-LAVALIN International, Hydro Quebec International (2004): Strategic/Sectoral, Social and Environmental Assessment of Power Development Options in Burundi, Rwanda and Western Tanzania, Status Report (Draft Report No. 2)
World Bank (2008): Multisectoral Water and Electricity Infrastructures in Burundi
World Energy Council – WEC (2007): The Benefits and Deficiencies of Energy Sector Liberalisation
25
BURUNDI

26ANNEX Renewable Energies in East Africa
7 ANNEX
BURUNDI
Burundi Electrical National Grid Map Africa Solar / PV Map
250 50
kilometres
D .
R .
C O
N G
OD
. R
. C
O N
G O
T A N Z A N I AT A N Z A N I A
R W A N D AR W A N D A
M W A R OM W A R OM W A R OM W A R OM W A R OM W A R OM W A R OM W A R OM W A R OBUJUMBURABUJUMBURABUJUMBURABUJUMBURABUJUMBURABUJUMBURABUJUMBURABUJUMBURABUJUMBURABUJUMBURA
RURALRURALRURALRURALRURALRURALRURALRURALRURALRURAL
BUJUMBURABUJUMBURABUJUMBURABUJUMBURABUJUMBURABUJUMBURABUJUMBURABUJUMBURABUJUMBURABUJUMBURA
MAIRIEMAIRIEMAIRIEMAIRIEMAIRIEMAIRIEMAIRIEMAIRIEMAIRIEMAIRIE
M U R A M V Y AM U R A M V Y AM U R A M V Y AM U R A M V Y AM U R A M V Y AM U R A M V Y AM U R A M V Y AM U R A M V Y AM U R A M V Y AM U R A M V Y A
R U Y I G IR U Y I G IR U Y I G IR U Y I G IR U Y I G IR U Y I G IR U Y I G IR U Y I G IR U Y I G I
R U T A N AR U T A N AR U T A N AR U T A N AR U T A N AR U T A N AR U T A N AR U T A N AR U T A N A
G I T E G AG I T E G AG I T E G AG I T E G AG I T E G AG I T E G AG I T E G AG I T E G AG I T E G A
B U R U R IB U R U R IB U R U R IB U R U R IB U R U R IB U R U R IB U R U R IB U R U R IB U R U R I
K A R U Z IK A R U Z IK A R U Z IK A R U Z IK A R U Z IK A R U Z IK A R U Z IK A R U Z IK A R U Z I
K A Y A N Z AK A Y A N Z AK A Y A N Z AK A Y A N Z AK A Y A N Z AK A Y A N Z AK A Y A N Z AK A Y A N Z AK A Y A N Z AK A Y A N Z A
Kanyosha
Butaganzwa
Butaganzwa
RusakaMugongomanga
Mutimbuzi
Mukike
Mutambu
Nyabitsinda
Giharo
Nyanrusange
Ryansoro
Rutana
Buyengero
Rumonge
Mutumba
Shombo
Butezi
Gatara
Nyanza-Lac
Bwambarangwe
Kirundo
L a k eL a k eT a n g a n y i k aT a n g a n y i k a
M A K A M B AM A K A M B AM A K A M B AM A K A M B AM A K A M B AM A K A M B AM A K A M B AM A K A M B AM A K A M B A
B U B A N Z AB U B A N Z AB U B A N Z AB U B A N Z AB U B A N Z AB U B A N Z AB U B A N Z AB U B A N Z AB U B A N Z A
C I B I T O K EC I B I T O K EC I B I T O K EC I B I T O K EC I B I T O K EC I B I T O K EC I B I T O K EC I B I T O K EC I B I T O K E N G O Z IN G O Z IN G O Z IN G O Z IN G O Z IN G O Z IN G O Z IN G O Z IN G O Z I
C A N K U Z OC A N K U Z OC A N K U Z OC A N K U Z OC A N K U Z OC A N K U Z OC A N K U Z OC A N K U Z OC A N K U Z O
M U Y I N G AM U Y I N G AM U Y I N G AM U Y I N G AM U Y I N G AM U Y I N G AM U Y I N G AM U Y I N G AM U Y I N G A
K I R U N D OK I R U N D OK I R U N D OK I R U N D OK I R U N D OK I R U N D OK I R U N D OK I R U N D OK I R U N D O
Ndava
Bugarama
Burambi
Kabezi
Muhuta
Nyabiraba
Bururi
Vugizo
Vyanda
Mabanda
Mugamba
Songa
Gisozi
Bisoro
Matana
Kayokwe
Musigati
MpandaGihanga
Murwi
Buganda
Rugombo
Mugina
Bubanza
Mabayi
Bukinanyana
RangoBukeye
Muramvya
Isale
Rugazi
MubimbiRutegama
Kiganda
Mbuye
Matongo
Muruta
Kabarore
Gahombo
Kayanza
Busiga
Bugendana
Musongati
Gitanga
Makamba
Kibago
Rutovu
Kayogoro
Bukemba
Buraza
Gishubi
Nyabihanga
Giheta
Itaba
Bukirasazi
Gitega
Makebuko
Mpinga-Kayove
Kinyinya
Ruyigi
Nyabikere
Gisuru
BweruCendajuru
Gitaramuka
Gashikanwa
Mutaho
Muhanga
Ngozi
Bugenyuzi
Gihogazi
Ruhororo
Tangara
Marangara
MwumbaNyamurenza
Vumbi
Kiremba
Bugabira
Ntega
Buhinyuza
Cankuzo
Buhiga Mwakiro
Gisagara
KigambaMishiha
Gasorwe
Gashoho
Busoni
Gitobe
Butihinda
Muyinga
Giteranyi
The boundaries and names shown and the designations used on this map do not imply official endorsement or acceptance by the United Nations
L E G E N DL E G E N D
ProvinceProvince
CommuneCommune
Data SourceData Source
Administrative Boundaries: IGEBU, 2003Administrative Boundaries: IGEBU, 2003
Map by: OCHA Burundi, 11 June 2004Map by: OCHA Burundi, 11 June 2004 ��SCALE 1:700,000SCALE 1:700,000
OCHA-BDI-009-230604-E-A4
This map can be downloaded from www.ochaburundi.org
Note: The map also contains net connections to Rwanda, DRC and Tanzania.Source: REGIDESO, as of 2007
Note: Burundi is negotiating with KFW to realize a National Solar Map.Source: extracts from PVGIS / European Communities,
2001-2007; Tele Atlas / Europe Technologies 2010
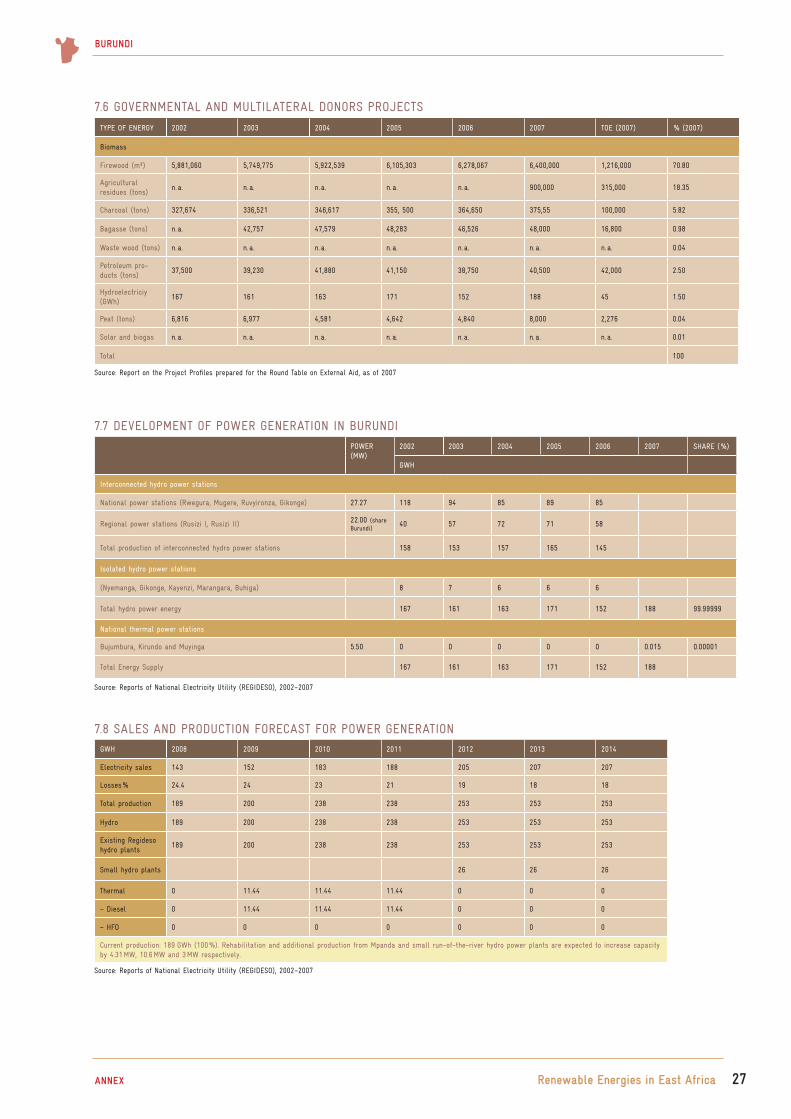
27Renewable Energies in East AfricaANNEX
BURUNDI
TYPE OF ENERGY 2002 2003 2004 2005 2006 2007 TOE (2007) % (2007)
Biomass
Firewood (m³) 5,881,060 5,749,775 5,922,539 6,105,303 6,278,067 6,400,000 1,216,000 70.80
Agricultural residues (tons)
n. a. n. a. n. a. n. a. n. a. 900,000 315,000 18.35
Charcoal (tons) 327,674 336,521 346,617 355, 500 364,650 375,55 100,000 5.82
Bagasse (tons) n. a. 42,757 47,579 48,283 46,526 48,000 16,800 0.98
Waste wood (tons) n. a. n. a. n. a. n. a. n. a. n. a. n. a. 0.04
Petroleum pro-ducts (tons)
37,500 39,230 41,880 41,150 38,750 40,500 42,000 2.50
Hydroelectriciy (GWh)
167 161 163 171 152 188 45 1.50
Peat (tons) 6,816 6,977 4,581 4,642 4,840 8,000 2,276 0.04
Solar and biogas n. a. n. a. n. a. n. a. n. a. n. a. n. a. 0.01
Total 100
7.6 GOVERNMENTAL AND MULTILATERAL DONORS PROJECTS
POWER(MW)
2002 2003 2004 2005 2006 2007 SHARE ( %)
GWH
Interconnected hydro power stations
National power stations (Rwegura, Mugere, Ruvyironza, Gikonge) 27.27 118 94 85 89 85
Regional power stations (Rusizi I, Rusizi II) 22.00 (share Burundi)
40 57 72 71 58
Total production of interconnected hydro power stations 158 153 157 165 145
Isolated hydro power stations
(Nyemanga, Gikonge, Kayenzi, Marangara, Buhiga) 8 7 6 6 6
Total hydro power energy 167 161 163 171 152 188 99.99999
National thermal power stations
Bujumbura, Kirundo and Muyinga 5.50 0 0 0 0 0 0.015 0.00001
Total Energy Supply 167 161 163 171 152 188
7.7 DEVELOPMENT OF POWER GENERATION IN BURUNDI
GWH 2008 2009 2010 2011 2012 2013 2014
Electricity sales 143 152 183 188 205 207 207
Losses % 24.4 24 23 21 19 18 18
Total production 189 200 238 238 253 253 253
Hydro 189 200 238 238 253 253 253
Existing Regideso hydro plants
189 200 238 238 253 253 253
Small hydro plants 26 26 26
Thermal 0 11.44 11.44 11.44 0 0 0
– Diesel 0 11.44 11.44 11.44 0 0 0
– HFO 0 0 0 0 0 0 0
Current production: 189 GWh (100 %). Rehabilitation and additional production from Mpanda and small run-of-the-river hydro power plants are expected to increase capacity by 4.31 MW, 10.6 MW and 3 MW respectively.
7.8 SALES AND PRODUCTION FORECAST FOR POWER GENERATION
Source: Report on the Project Profiles prepared for the Round Table on External Aid, as of 2007
Source: Reports of National Electricity Utility (REGIDESO), 2002–2007
Source: Reports of National Electricity Utility (REGIDESO), 2002–2007

BURUNDI
ANNEX Renewable Energies in East Africa 28
7.9 SHARE OF NATIONALLY GENERATED AND IMPORTED ELECTRICITY IN BURUNDI
OPERATING PERFORMANCE 2002 2003 2004 2005 2006 2007 SHARE ( %)
Total electricity available (GWh) 161 164 171 152 188 100
of which electricity produced nationally (GWh) 131 90 100 94 110 58.5
% growth (annual) n. a. n. a. 1.7 % 4.5 % –11.3 % 24.2 % n. a.
Electricity purchased from SINELAC (GWh) n. a. 30 42 51 41 52 n. a.
Electricity purchased from SNEL (GWh) n. a. n. a. 31 20 17 26 n. a.
Total electricity purchased / imported (GWh) 167 161 163 171 152 188
7.10 EVOLUTION OF NATIONAL ELECTRICITY CONSUMERS BY REGION
Source: Reports of National Electricity Utility (REGIDESO), 2002–2007
Source: Reports of National Electricity Utility (REGIDESO), 2002–2007
2002 2003 2004 2005 2006 2007RATE OF INCREASE( %)
Bujumbura 19,466 20,754 21,025 20,576 21,510 24,774 4.5
South Region 2,061 2,208 2,366 2,494 2,754 10.4
North Region 3,351 3,707 3,932 4,039 4,409 9.1
West Region 2,183 2,304 2,422 2,492 2,905 16.5
East Region 2,618 2,906 3,124 3,257 3,558 9.2
Large-scale consumers 64 64 0
Total 29,674 31,915 32,889 32,986 35,200 41,074 6.7
LV 34,800 35,335 37,946 37,660
MV 468 445 452 412
7.11 POWER TARIFFS FOR PRIVATE AND INDUSTRIAL USERS
Source: Reports of National Electricity Utility (REGIDESO), 2002–2007
CATEGORIES OF CUSTO-MERS
SLICE 1 SLICE 2 SLICE 3 SLICE 4 SLICE 5
INVOICED QUANTITIES(KWH)
PRICE/KWH
INVOICED QUANTITIES(KWH)
PRICE/KWH
INVOICED QUANTITIES(KWH)
PRICE /KWHINVOICED QUANTITIES
PRICE/KWHINVOICED QUANTITIES
PRICE/KWH
Households 0–150 41 BIF 151–300 46 BIF 301–750 85 BIF751 kWh and more
127 BIF – –
Trade 0–300 116 BIF 301–1,000 127 BIF 1,001 137 BIF – – – –
Administra-tion
All consumption
127 BIF – – – – – – – –
Medium Voltage
*CD(kW/month)
* extra premium
(kW/month)
3,231 BIF
6,462 BIF
CD + the peak(0–150 h/month)
122 BIF CD + the peak(151–450 h/month)
77 BIF 451 h and more
52 BIF Without peak and CD
138 BIF
DGHER(Rural Electricity Utility)
All consumption
53 BIF – – – – – – – –
Public lightingAll consumption
127 BIF – – – – – – – –
Note: The source from National Electricity Utility (REGIDESO) really reflects the daily market prices/tariffs. REGIDESO is one important of the two electricity utilities (REGIDESO, DGHER). Regarding the quantities of electricity (kWh) a household, trade or administration etc., consumes pay the price in accordance of the indicated slices (1–3) they are corresponding to.Source: National Electricity Utility (REGIDESO), as of 2009

BURUNDI
ANNEX Renewable Energies in East Africa 29
DENOMINATION OF THE POWERSTATION
OWNER YEAR OF START INSTALLED POWER (MW)
POWER SUPPLY ( MW)
2008 2010 2012 2015 2020
Regideso Thermo-power Plant
Bujumbura REGIDESO 5.50 5.50 5.50 5.50 5.50
Reinforcement Bujumbura
REGIDESO
Subtotal I 5.50
Regideso Hydro Power Plant
Rwegura REGIDESO 1986 18.00 18.00 18.00 18.00 18.00 18.00
Mugere REGIDESO 1982 8.00 8.00 8.00 8.00 8.00 8.00
Nyemanga REGIDESO 1988 1.44 1.44 2.88 2.88 2.88 2.88
Ruvyironza REGIDESO 1980/1984 1.50 1.50 1.50 1.50 1.50 1.50
Gikonge REGIDESO 1982 1.00 1.00 1.00 1.00 1.00 1.00
Kayenzi REGIDESO 1984 0.85 0.85 0.85 0.85 0.85 0.85
Marangara REGIDESO 1986 0.24 0.24 0.24 0.24 0.24 0.24
Buhiga REGIDESO 1984 0.24 0.00 0.80 0.80 0.80 0.80
Sanzu REGIDESO 1983 0.07 0.00 0.07 0.07 0.07 0.07
Mpanda REGIDESO 10.60 0.00 10.60 10.60 10.60 10.60
Kabu 16 REGIDESO 2012 20.00 0.00 20.00 20.00 20.00 20.00
Mule 34 REGIDESO 2012 20.00 0.00 20.00 20.00 20.00 20.00
Subtotal II 81.94 31.03 83.48 83.48 83.48 83.48
DGHER Hydro Power Plant
Kigwena DGHER 1986 0.05 0.05 0.05 0.05 0.05 0.05
Butezi DGHER 1990 0.24 0.24 0.24 0.24 0.24 0.24
Ryarusera DGHER 1984 0.02 0.02 0.02 0.02 0.02 0.02
Nyabikere DGHER 1990 0.14 0.14 0.14 0.14 0.14 0.14
Murore DGHER 1987 0.02 0.02 0.02 0.02 0.02 0.02
Subtotal III 0.45 0.45 0.45 0.45 0.45 0.45
Private Hydro Power Plant
Mugera Church 1962 0.03 0.03 0.03 0.03 0.03 0.03
Kiremba Church 1981 0.06 0.06 0.06 0.06 0.06 0.06
Masango Church 1979 0.03 0.03 0.03 0.03 0.03 0.03
Musongati Church 1981 0.01 0.01 0.01 0.01 0.01 0.01
Mutumba Church 1982 0.05 0.05 0.05 0.05 0.05 0.05
Mpinga Church 1983 0.02 0.02 0.02 0.02 0.02 0.02
Kiganda Church 1984 0.04 0.04 0.04 0.04 0.04 0.04
Gisozi Church 1983 0.02 0.02 0.02 0.02 0.02 0.02
Burasira Seminary 1961 0.03 0.03 0.03 0.03 0.03 0.03
Teza Tea Leaf Factory 1971 0.36 0.36 0.36 0.36 0.36 0.36
Subtotal IV 0.65 0.65 0.65 0.65 0.65 0.65
National power supply
37.63 90.08 90.08 90.08 90.08
Import to Burundi
Rusizi I SNEL 27.8 9
Rusizi II SINELAC 40 7 12 12 12
Rusumo Falls NELSAP 60 0 20 20 20
Rusizi III CEPGL 250 0
Total import supply
16 83.48 32
7.12 LIST OF ACTUAL AND PLANNED HYDRO POWER SOURCES
Source: Lahmeyer International Report, as of 1983

BURUNDI
ANNEX Renewable Energies in East Africa 30
PROJECTS PINST (MW)
PGAR (MW)
EPRIM (GWH)
COSTS (1 BN USD)
SPECIFIS COSTS
(USD/KWH) (USD/MWH)
STORAGE PROJECTS (8 H)
KITE 011 (Rushiha) 15.3 15.2 46.4 44.3 2,906 106
KITE 020 (Masango) 9.3 9.3 27.1 28.9 3,112 118
KAGU 006 (Kagunuzi B) 6.7 6.7 21.4 20.8 3,115 106
MPAN 049 (Mpanda A) 14.6 13.9 40.9 44.1 3,186 119
KAGU 010 (Kagunuzi A) 10.7 10.2 29.8 33.8 3,316 126
KAGU 016 (Kabulantwa V) 36.1 31.3 111.7 108.3 3,455 107
MUYO 029 (Muyovozi III) 6.0 5.7 18.0 21.4 3,746 131
KABU 023 (Kabulantwa IV) 21.5 16.8 61.6 69.6 4,136 125
CHAINS OF STORAGE PROJECTS (12 H)
KABULANTWA (023-016-009) 67.0 62.2 201.3 156.1 2,510 86
KITENGE-KAGUNUZI (020-011-010-006) 42.0 41.3 124.7 127.8 3,094 113
RUZIBAZI (028-021-014-012) 40.6 39.8 119.9 130.6 3,279 121
NYAMUHENDE / KIRASA (013-009-006-003) 38.3 36.7 111.0 126.0 3,437 126
KANYOSHA / KANIKI (016-010) 8.4 8.1 24.9 34.0 4,172 150
MUYOVOZI 8.2 7.7 24.0 37.8 4,920 174
PONDAGE PROJECTS (12 H)
LUA 035 (Lua) 10.8 10.8 47.4 40.5 3,745 95
KIKU 002 (Kikuka) 3.0 2.9 13.1 11.5 3,911 97
KABU 016 (Kabulantwa V) 15.4 14.3 67.3 58.3 4,085 96
RUZB 014 (Ruzibazi C) 3.6 3.6 15.7 16.3 4,571 116
RUVU 216 (Murongwe/Kunyanga) 6.2 4.7 25.9 21.7 4,632 93
RUZB 012 (Ruzibazi D) 3.2 3.2 13.8 15.6 4,935 125
CHAINS OF PONDAGE PROJECTS (12 H)
KABULANTWA (016-009) 16.9 15.8 74.0 65.7 4,159 99
RUZIBAZI (014-007) 11.8 11.8 57.2 39.5 3,347 79
RUN-OF-RIVER -PROJECTS (24 H)
JIJI 003 (Jiji) 7.5 7.5 65.8 18.3 2,430 31
SIKU 008 (Nyemanga) 2.5 2.5 21.9 6.4 2,539 32
MULE 034 (Mulembwe) 5.3 5.3 46.3 18.7 3,544 45
RUZB 007 (Ruzibazi E) 4.7 4.7 41.4 18.0 3,801 48
KABU 016 (Kabulantwa V) 7.3 7.3 64.0 28.7 3,919 50
KABU 023 (Kabulantwa IV) 2.7 2.7 23.5 12.5 4,658 59
NDAH 013 (Ndahangwa) 1.3 1.3 11.1 7.3 5,799 73
SIKU 011 (Sikuvyaye) 2.4 2.4 20.6 13.9 5,934 75
LUVI 012 (Ruvironza) 1.3 1.3 11.8 8.3 6,202 78
NYHE 006 (Nyamuhende/Kirasa C) 1.2 1.2 10.8 7.7 6,234 79
7.13 LIST OF POTENTIAL LARGE SCALE HYDRO POWER PROJECTS
Source: Lahmeyer International Report, as of 1983

COUNTRY CHAPTER:
KENYA
Author of Country Chapter Bernard Mutiso Osawa (MSc. RE, Phy.) Coordination and Review of the Country ChapterDipl. Phys. Rafael Wiese PSE AGFreiburg, Germanywww.pse.de
Editor Deutsche Gesellschaft für Technische Zusammenarbeit (GTZ) GmbHDepartment Water, Energy, TransportDag-Hammarskjöld-Weg 1-565760 Eschborn, Germanywww.gtz.de
On behalf of Federal Ministry for Economic Cooperation and Development (BMZ)
Editorial staffDiana KraftTel: +49 (0)6196 79 4101Fax: +49 (0)6196 79 80 4101Email: [email protected]
Renewable Energies in East Africa 31

CONTENTS KENYA
ACRONYMS, ABBREVIATIONS AND MEASUREMENTS 33
SUMMARY 35
1 COUNTRY INTRODUCTION 36 1.1 Kenya Overview 36 1.2 Kenya Statistics: Geography and Economics 36
2 ENERGY MARKET IN KENYA 37 2.1 Energy Situation Overview 37 2.2 Energy Capacities, Production and Consumption 37 2.3 Electricity Prices 39 2.4 Market Actors for Planning, Regulation and Distribution 40
3 RENEWABLE ENERGY POLICY FRAMEWORK CONDITIONS 41 3.1 Policy and Renewable Energy Promotion Programs 41 3.2 Donor Aid Activities 42 3.3 Market Risks 44
4 STATUS AND FUTURE OUTLOOK FOR RENEWABLE ENERGIES 45 4.1 Biomass/Biogas 45 4.2 Solar Energy 45 4.3 Wind Power 46 4.4 Geothermal Power 46 4.5 Hydro Power 46
5 RENEWABLE ENERGY BUSINESS INFORMATION AND CONTACTS 48 5.1 Renewable Energy Companies & Business Related Organisations 48 5.2 Local Institutions Related to Renewable Energy Business 50
6 BIBLIOGRAPHY 52
7 ANNEX 53
32CONTENTS
KENYA
Renewable Energies in East Africa

ACRONYMS AND ABBREVIATIONS
BURUNDI
AC Alternating Current
ACP African, Caribbean and Pacific States
AfDB African Development Bank
AFD Agence Française du Développement (French Development Agency)
AFREPREN/FWD African Energy Policy Research Network Limited
ATIA African Trade Insurance Agency
BMZ Bundesministerium für wirtschaftliche Zusammenarbeit und Entwicklung
(German Federal Ministry for Economic Development and Cooperation)
CDC Capital For Development (UK government-owned fund)
CDM Clean Development Mechanism
CI Commercial/Industrial
COMESA Common Markets of East and Southern Africa
DFID Department for International Development of the UK
DGCD Direction Générale de la Coopération au Développement (Directorate-General for Development Cooperation)
DGCS Direzione Generale per la Cooperazione allo Sviluppo (Directorate-General Development Cooperation in Italy)
DGEF Division of Global Environment Facility Coordination
DGIS Dutch Ministry of Foreign Affairs
DC Domestic Consumers
EAC East African Community
EDF Électricité de France (Electricity of France)
EE Energy Efficiency
EIB European Investment Bank
ELCI Environment Liaison Center International
EPA Energy Policy Act
ERC Energy Regulatory Commission
FIPA Foreign Investment Protection Act
GDC Geothermal Development Company
GDP Gross Domestic Product
GEF Global Environment Facility
GoK Government of Kenya
GTZ Deutsche Gesellschaft für Technische Zusammenarbeit (German Technical Cooperation Agency)
IBRD International Bank for Reconstruction and Development
ICO Instituto de Crédito Oficial (state-owned corporate entity of the Spanish Ministry of Economy and Finance)
ICSID International Centre for Settlement of Investment Disputes
IDA International Development Association
IEET Institute for Energy and Environmental Technology
IFC International Finance Corporation
IPC Investment Promotion Centre
IRSEAD Institute of Research in Sustainable Energy and Development
IPP Independent Power Producers
IT Interruptible off-peak supplies
JBIC Japan Bank for International Cooperation
JKUCAT Jomo Kenyatta University of Agriculture and Technology
KEBS Kenya Bureau of Standards
KNBS Kenya National Bureau of Statistics
KES Kenyan Shilling
KenGen Kenya Electricity Generating Company
KfW Kreditanstalt für Wiederaufbau
(German Banking Group including KfW Entwicklungsbank as German Development Bank)
KPC Kenya Pipeline Company
KPLC Kenya Power and Lighting Company
LCPDP Least Cost Power Development Planning
LPG Liquefied Petroleum Gas
MSTQ Metrology, Standards, Testing and Quality Management
33ACRONYMS, ABBREVIATIONS AND MEASUREMENTS Renewable Energies in East Africa
KENYA

MFA Ministry of Foreign Affairs
MHI Mitsubishi Heavy Industries
MIGA Multilateral Investment Guarantee Agency
NEMA National Environmental Management Authority
NGO Non-Governmental Organization
NOCK National Oil Corporation of Kenya
NORAD Norwegian Agency for Development Cooperation
NZG New Zealand Government
PPA Power Purchase Agreements
PPP Private-Public Partnership
PV Photovoltaic
R&D Research and Development
RE Renewable Energy
REA Rural Electrification Authority
REECON Renewable Energy Engineering Contractors
REP Rural Electrification Program
SC Small Commercial
SHS Solar Home Systems
SIDA Swedish International Development Cooperation Agency
SME Small and Micro Enterprise
SL Street Lighting
SWERA Solar and Wind Energy Resource Analysis
TBT Technical Barriers to Trade
TDA Tea Development Authority
UN United Nations
UNDP United Nations Development Program
UNEP United Nations Environment Program
USD United States Dollar
WTO World Trade Organization
MEASUREMENTS
°C degree Celsius
GWh gigawatt hours
km kilometer
km² square kilometer
kV kilovolt
kW kilowatt
kVA kilovolt ampere
kWh kilowatt hour
m meter
MW megawatt
MWp megawatt peak
s second
V volt
Wp Watt-peak
34ACRONYMS, ABBREVIATIONS AND MEASUREMENTS Renewable Energies in East Africa
KENYA

SUMMARY
ECONOMICAL STATUS AND DEVELOPMENT OF KENYAKenya is a major powerhouse in East and Central Africa. The capital of Nairobi is an important commercial and commu-nication hub for the East African Community (EAC) region and hosts a United Nation (UN) office and different UN programs, e. g. the United Nations Environment Program (UNEP) and the United Nations Human Settlements Pro-gram (HABITAT) as well as 22 other multinational bodies.Although the Gross Domestic Product (GDP) per capita is high (1,700 USD) with a stable growth rate of 6 %, the rate of poverty stands at 48 %. Tea and coffee are the main export commodities.
Kenya has developed its Vision 2030 Program, which aims to transform Kenya into a newly industrialized, “middle-income country providing a high quality life to all its citizens by the year 2030”. The program is an all-inclusive and par-ticipatory stakeholder consultative process and includes vari-ous business opportunities for private investment, which have been highlighted in the following paragraphs1.
STRUCTURE OF ENERGY SUPPLY IN KENYAOver two thirds of the population still rely on biomass like wood, animal waste and agricultural residues as primary energy source (68 %), which is mainly used for cooking. Commercial energy resources are petroleum (22 %), electric-ity (9 %) and other sources (1 %). The electricity demand of 5,000 GWh is fully met by national hydro power stations, thermal oil-fired stations and geothermal sources. The total installed capacity is 1,200 MW.
Around 80 % of the population live in rural areas, where the electrification rate is 4 %, while in the urban areas around 51 % are connected to the national grid2.
STATUS OF RENEWABLE ENERGIES IN KENYA
Hydro Kenya has a technical potential for large-scale hydro power stations of 1,300 MW. Half of it (currently 677 MW) is al-ready used. The small-scale hydro power potential is estimated at 3,000 MW, only a fraction of it is already developed. Cur-rently, micro and pico hydro power stations are implemented in the off-grid area around Mt. Kenya, 140 km North East of Nairobi.
Solar Around 4 MWp of small PV systems are installed in Kenya. The commercial sale and distribution network is well estab-lished with wholesalers in the commercial centers and small shops and retailers with access to off-grid areas. Thus the mar-ket is mainly driven by small residential systems for lighting and communication. Currently there is no solar support pro-gram in place.
Renewable Energies in East AfricaSUMMARY 35
KENYA
Wind The highest wind potential is in the district of Marsabit, which cannot be developed due to the lack of electricity grid. Currently, two wind farms (a 40 MW wind farm at Ngong Hills and a 30 MW wind farm at Kinangop) are under con-struction. Additionally, around 100 small wind turbines (400 MW) are in operation. Reliable wind measurements are not available, but the Solar and Wind Energy Resource Analysis (SWERA) database for Kenya is providing basic in-formation for further investigations3.
Geothermal Kenya is the only EAC country using geothermal power. A 128 MW station is providing electricity to the national grid. The potential in Kenya‘s Rift Valley is estimated at over 2,000 MW. The Government of Kenya has established enti-ties for test drillings and further development of geothermal resources. Funds of about 5 million € were made available for this development.
Biomass Biomass is mainly sold and used in the informal sector to sup-ply wood and charcoal to rural and urban households. The German Technical Cooperation Agency (GTZ) on behalf of the German Government has implemented agro-industrial biogas pilot projects for electricity generation with 160 kW and 20 kW capacities. The most important contribution of biomass for commercial energy supply is seen in cogeneration of bagasse. It has a potential of 340 MW provided by four state-owned sugar factories that are going to be privatized in the next two years.
1 FOR FURTHER INFORMATION SEE WEBSITE OF KENYA’S VISION 2030
(NATIONAL ECONOMIC & SOCIAL COUNCIL OF KENYA, AS OF 2008)
2 GVE/UNDP, AS OF 2005
3 UNDP, AS OF 2008
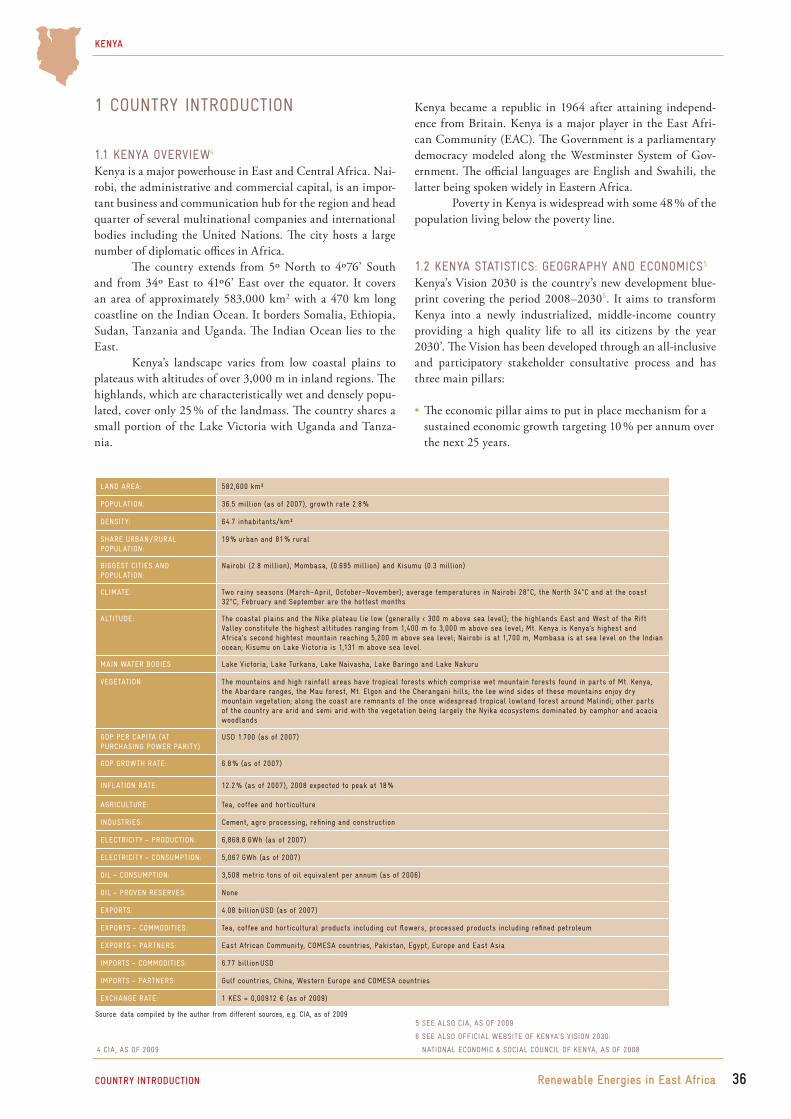
1 COUNTRY INTRODUCTION
1.1 KENYA OVERVIEW4
Kenya is a major powerhouse in East and Central Africa. Nai-robi, the administrative and commercial capital, is an impor-tant business and communication hub for the region and head quarter of several multinational companies and international bodies including the United Nations. The city hosts a large number of diplomatic offices in Africa.
The country extends from 5º North to 4º76’ South and from 34º East to 41º6’ East over the equator. It covers an area of approximately 583,000 km2 with a 470 km long coastline on the Indian Ocean. It borders Somalia, Ethiopia, Sudan, Tanzania and Uganda. The Indian Ocean lies to the East.
Kenya’s landscape varies from low coastal plains to plateaus with altitudes of over 3,000 m in inland regions. The highlands, which are characteristically wet and densely popu-lated, cover only 25 % of the landmass. The country shares a small portion of the Lake Victoria with Uganda and Tanza-nia.
Renewable Energies in East Africa 36COUNTRY INTRODUCTION
Kenya became a republic in 1964 after attaining independ-ence from Britain. Kenya is a major player in the East Afri-can Community (EAC). The Government is a parliamentary democracy modeled along the Westminster System of Gov-ernment. The official languages are English and Swahili, the latter being spoken widely in Eastern Africa.
Poverty in Kenya is widespread with some 48 % of the population living below the poverty line.
1.2 KENYA STATISTICS: GEOGRAPHY AND ECONOMICS5
Kenya’s Vision 2030 is the country’s new development blue-print covering the period 2008–20306. It aims to transform Kenya into a newly industrialized, middle-income country providing a high quality life to all its citizens by the year 2030’. The Vision has been developed through an all-inclusive and participatory stakeholder consultative process and has three main pillars:
The economic pillar aims to put in place mechanism for a sustained economic growth targeting 10 % per annum over the next 25 years.
KENYA
LAND AREA: 582,600 km²
POPULATION: 36.5 million (as of 2007), growth rate 2.8 %
DENSITY: 64.7 inhabitants/km²
SHARE URBAN / RURAL POPULATION:
19 % urban and 81 % rural
BIGGEST CITIES AND POPULATION:
Nairobi (2.8 million), Mombasa, (0.695 million) and Kisumu (0.3 million)
CLIMATE: Two rainy seasons (March–April, October–November); average temperatures in Nairobi 28°C, the North 34°C and at the coast 32°C, February and September are the hottest months
ALTITUDE: The coastal plains and the Nike plateau lie low (generally < 300 m above sea level); the highlands East and West of the Rift Valley constitute the highest altitudes ranging from 1,400 m to 3,000 m above sea level; Mt. Kenya is Kenya’s highest and Africa’s second hightest mountain reaching 5,200 m above sea level; Nairobi is at 1,700 m, Mombasa is at sea level on the Indian ocean; Kisumu on Lake Victoria is 1,131 m above sea level.
MAIN WATER BODIES Lake Victoria, Lake Turkana, Lake Naivasha, Lake Baringo and Lake Nakuru
VEGETATION The mountains and high rainfall areas have tropical forests which comprise wet mountain forests found in parts of Mt. Kenya, the Abardare ranges, the Mau forest, Mt. Elgon and the Cherangani hills; the lee wind sides of these mountains enjoy dry mountain vegetation; along the coast are remnants of the once widespread tropical lowland forest around Malindi; other parts of the country are arid and semi arid with the vegetation being largely the Nyika ecosystems dominated by camphor and acacia woodlands
GDP PER CAPITA (AT PURCHASING POWER PARITY)
USD 1.700 (as of 2007)
GDP GROWTH RATE: 6.8 % (as of 2007)
INFLATION RATE: 12.2 % (as of 2007), 2008 expected to peak at 18 %
AGRICULTURE: Tea, coffee and horticulture
INDUSTRIES: Cement, agro processing, refining and construction
ELECTRICITY – PRODUCTION: 6,868.8 GWh (as of 2007)
ELECTRICITY – CONSUMPTION: 5,067 GWh (as of 2007)
OIL – CONSUMPTION: 3,508 metric tons of oil equivalent per annum (as of 2006)
OIL – PROVEN RESERVES: None
EXPORTS: 4.08 billion USD (as of 2007)
EXPORTS – COMMODITIES: Tea, coffee and horticultural products including cut flowers, processed products including refined petroleum
EXPORTS – PARTNERS: East African Community, COMESA countries, Pakistan, Egypt, Europe and East Asia
IMPORTS – COMMODITIES: 6.77 billion USD
IMPORTS – PARTNERS: Gulf countries, China, Western Europe and COMESA countries
EXCHANGE RATE: 1 KES = 0,00912 € (as of 2009)
4 CIA, AS OF 2009
5 SEE ALSO CIA, AS OF 2009
6 SEE ALSO OFFICIAL WEBSITE OF KENYA’S VISION 2030:
NATIONAL ECONOMIC & SOCIAL COUNCIL OF KENYA, AS OF 2008
Source: data compiled by the author from different sources, e.g. CIA, as of 2009

Renewable Energies in East Africa 37COUNTRY INTRODUCTION
KENYA
The anticipated growth of demand requires specific efforts to generate more energy at a lower cost and increased efficiency in energy consumption, which are expected to be met through continued institutional reforms in the energy sector (encour-aging more private sector participation in power generation) and through separating transmission from distribution.
2.2 ENERGY CAPACITIES, PRODUCTION AND CONSUMPTION
The energy market can be divided in the four major sub-sec-tors of biomass, petroleum and electricity and others.
BiomassBiomass8 energy consumption constitutes 68 % of primary energy consumption. This sub-sector is the largest within the energy sector and remains largely unregulated and underde-veloped. Fuels include firewood, charcoal, wood waste and farm residues. The sector is dominated by households and small business.
For a majority of the population wood fuel remains the predominant fuel for cooking with 68.3 % households us-ing firewood and charcoal. Of that 80 % of the rural house-holds use firewood compared with 10 % for urban residents. Charcoal, derived from fuel wood, is the second most popular cooking fuel used by 13.3 % of the households in the coun-try, mostly in urban centers. Firewood is increasingly supplied by large private tree plantations, which offer a wide scope for commercial biomass businesses.
Petroleum Petroleum9 is Kenya’s major source of commercial energy ac-counting for about 80 % of the country’s requirements. Petro-leum, being the number one driver of the economy, reflects a consumption pattern corresponding to the economic activities.
Kerosene is the third of the predominant cooking fu-els and the most common in urban areas. Other fuels used in Kenya include Liquefied Petroleum Gas (LPG) employed by 3.5 % of the population, mainly urban dwellers. Kerosene is the most popular lighting fuel across the country used by over 75 % of the population. It is employed for lighting in off-grid rural locations and for lighting and cooking in urban settings without access to grid electricity.
Kenya has no known reserves of petroleum. Crude oil is imported and refined in Mombasa. Domestic consump-tion of petroleum products has progressively increased from 2.2 million tons in 2003 to 2.7 million tons in 2007, account-ing for 25.7 % of the country’s total import bill.
Electricity The national electrification rate averages at 15.4 %, but 51 % of urban households are connected to the national grid as compared to only 4 % of the rural households. Electricity10 is mainly used for lighting. Only 1.6 % of mainly off-grid house-holds in Kenya use solar photovoltaic (PV) for lighting.
8 GVEP / UNDP, AS OF 2005
9 DATA COMPILED BY THE AUTHOR FROM DIFFERENT SOURCES
10 DATA COMPILED BY THE AUTHOR FROM DIFFERENT SOURCES;
SEE ALSO KPLC 2004–20077 GVEP / UNDP, AS OF 2005
The social pillar addresses an agenda for a just and cohesive society enjoying equitable social development in a clean and secure environment
The political pillar provides that the country’s develop-ment is people-centered, result-oriented, and based on an accountable democratic political system.
These three pillars are anchored on the thematic subjects of macro-economic stability, continuity in governance reforms, enhanced equity and wealth creation opportunities for the poor, infrastructure, energy, science, technology and innova-tion, land reform, human resources development, security and public sector reforms. This long-term development plan will directly depend on the
availability of energy and the provision of en-ergy services and therefore offers enormous op-portunities for investment in the energy sector.
2 ENERGY MARKET IN KENYA
2.1 ENERGY SITUATION OVERVIEWThe Kenyan Government recognizes that without adequate and affordable energy services, the above-mentioned „Vision 2030“ cannot be achieved. Kenya targets a GDP growth rate of over 10 % per annum over the next 25 years with increased energy demand and high investments in the energy sector.
Today, wood fuel and other biomass account for 68 % of the total primary energy consumption, followed by petroleum with 22 %, electricity with 9 % and others with about 1 %7.
Petroleum and electricity dominate the country’s modern energy sector and supply primarily the commercial energy needs. Wood fuel supplies the energy needs of the largely non-commercial and informal sectors as well as of the rural and poor urban households. Other sources of energy include solar electricity, solar thermal and wind power, of which much is still untapped.
FIGURE 1
Shares of Total Primary Energy Consumption in Kenya
Source: data from GVEP/UNDP, as of 2005; graph compiled by PSE AG
100 %
80 %
60 %
40 %
20 %
0 % Biomass Petroleum Electricity Others
68.00 % 22.00 % 9.00 % 1.00 %

COUNTRY INTRODUCTION
Electricity consumption in rural areas is on average 544 kWh per household or 115 kWh per capita per year. In urban areas, the consumption is higher, amounting to 217 kWh per capita per year.
Electricity as sub-sector is second to petroleum in terms of commercial value and comprises power generation, transmission and distribution. The Electricity Act of 1999 set the prerequisites for separating the electricity sector in the two categories (i) generation and (ii) transmission and distri-bution.
Plans are underway to separate transmission and dis-tribution in single entities. The electricity demand is covered mainly by hydro power, thermal and geothermal power sta-tions (see also the following table).
Hydro power remains the largest single source. The total in-stalled capacity as of June 2007 was 1,197 MW with an effec-tive capacity of 1,153 MW. Peak demand reached 1,053 MW confirming a growth rate of 8.3 % up from 6.5 % in 2002, which was caused by grid extension to rural areas.
With 58 % of grid connected electricity being gener-ated by hydro, power cuts are common during the dry seasons when the river regimes are at their lowest. In recent times, as the reserve margins have decreased with increased demand and more erratic rains, the seasonal breakdowns have become more frequent. Furthermore, the recipients at the end of the lines of-ten suffer voltage drops that trigger power outages. This has caused the need for standby generators in the country, which in 2007 were estimated at approximately 100 MW in capacity.
Most of the line losses are attributed to the distances between generators and transformer stations and the low rate of maintenance. Transmission losses are estimated at 15 %, while theft of electricity is estimated at 2 %.
Grid extension is part of the Government’s strategy to increase access to electricity and is carried out in connection with the rural electrification projects. During 2007, the ex-pansion and upgrading of the distribution system led to about 22 % of network growth. About 500 km of distribution were projected to be constructed in 2008. The construction and upgrading of transmission lines and associated substations for other rural towns include a 122 km 132 kV transmission line between Kamburu and Meru and a 61 km 132 kV transmission line between Chemosit and Kisii.
Renewable Energies in East Africa 38
KENYA
Source: Kenya Power and Lighting Company, 2004–2007
TABLE 1
Installed Capacity and Generation of Electricity 2002–2007
SOURCE 2004 2005 2006 2007
Installed MW Net Gen. GWh Installed MW Net Gen. GWh Installed MW Net Gen. GWh Installed MW Net Gen. GWh
Hydro Power (local) 677.3 3,169.0 677.3 3,039 677.3 3,025.0 677.3 3,592.0
Hydro Power (imports)
– 162.0 – 28 – 10.8 – 22.6
Thermal (oil) 392.0 1,038.0 351.0 1,506 370.0 1,487.0 389.0 1,738.0
Solar PV 4.0 4.0
Wind 0.4 0.4 0.4 0.4 0.4 0.4 0.4 0.2
Geothermal 128.0 987.0 128.0 1,002 128.0 1,046.0 128.0 989.0
Thermal (emergency)
– – – – – – 105.0 523.0
Total power generated
1,198.0 5,564.0 1,156.0 5,57.4 1,177.0 5,568.2 1,303.7 6,868.8
TABLE 2
Total Power Generation and Interconnected Power Purchase by Utility
SOURCE INSTALLED
CAPACITY
(MW)
ENERGY
SUPPLIED TO
GRID (GWH)
SHARE OF
TOTAL ENERGY
( %)
Hydro (including imports) 697.2 3,290.0 54.2
Geothermal 128.0 1,013.0 16.7
Thermal (including IPPs) 390.2 1,763.0 29.0
Wind 0.4 4.0 0.1
Total 1,215.8 6,070.0 100.0
Source: KPLC, as of 2007

39
2.3 ELECTRICITY PRICESGrid electricity prices are set through a tariff process admin-istered by the Kenyan Energy Regulatory Commission. The tariffs are set to reflect the long-run marginal cost of energy services that allow the generation and distribution utilities to remain solvent. The table below summarizes the current electricity tariffs and rates. For an average consumption of 150 kWh per year, the private consumer price is 11.6 KES/kWh (12 € Cent/kWh) due to the high fixed monthly charges11.
In March 2008, the Ministry of Energy published a feed-in tariff policy for electricity generation from wind, small hydro and biomass. The tariff allows IPPs to sell and oblige distribu-tors to buy on a priority basis all RE sources generated elec-tricity at a fixed tariff for a given period of time. No project has been established in 2008, but the Agakhan Foundation is planning to scale down a planned 70 MW wind farm in Ngong Hills near Nairobi to 50 MW so that they can benefit from the tariff.
The tariffs are consistent with Section 103 of the En-ergy Act No. 12 of 200612 and shall apply for 15 years. Its objectives are to:
Facilitate resource mobilization by providing investment security and market stability for investors in RE electricity generation
Reduce transaction and administrative costs by eliminat-ing the conventional bidding processes
Encourage private investors to operate the power plant prudently and efficiently so as to maximize its returns
Renewable Energies in East AfricaCOUNTRY INTRODUCTION
KENYA
TABLE 3
Schedule of Retail Electricity Tariffs and Rates
Source: Kenya Gazette Notice, as of 2008
TARIFF TYPE OF CUSTOMER SUPPLY VOLTAGE (V)
CONSUMPTION (kWh/MONTH)
FIXED CHARGE (KES/MONTH)
ENERGY CHARGE(KES/kWh)
DEMAND CHARGE(KES/kVA/MONTH)
DC Domestic consumers
240 OR 415 0–50
120.00
2.00
–51–1,500 8.10
> 1,500 18.57
SC Small commercial 240 OR 415 ≤ 15,000 120.00 8.96 –
CI1Commercial/ industrial
415 3 PHASE> 15,000 800.00 5.75 600.00
CI2 11,000
NO LIMIT
2,500.00 4.73 400.00
CI3 33,000/40,000 2,900.00 4.49 200.00
CI4 66,000 4,200.00 4.25 170.00
CI5 132,000 11,000.00 4.10 170.00
ITInterruptible off-peak supplies
240 OR 415≤ 15,000
240.00 (WHEN USED WITH DC OR SC)
4.85 –
SL Street lighting 240 – 120.00 7.50 –
11 ELECTRICITY REGULATORY BOARD, AS OF 2005
12 PARLIAMENT OF KENYA, AS OF 2006
TABLE 4
Schedule of Retail Electricity Tariffs and Rates
TECHNOLOGY TYPE PLANT CAPACITY (MW)
MAXIMUM FIRM POWER TARIFF (USD/kWh) AT THE INTERCONNECTION POINT
MAXIMUM NON-FIRM POWER TARIFF (USD/kWh) AT THE INTER-CONNECTION POINT
Wind power (single wind farm)
0–50 0.090 0.090
Any individual capacity ≥ 50
TARIFF TO BE NEGOTIATED ON COMMERCIAL BASIS
TARIFF TO BE NEGOTIATED ON OMMERCIAL BASIS
Biomass derived electricity
0–40 0.070 0.045
Any individual capacity ≥ 40
TARIFF TO BE NEGOTIATED ON COMMERCIAL BASIS
TARIFF TO BE NEGOTIATED ON COMMERCIAL BASIS
Small hydro power 0.50–0.99 0.120 0.100
1–5 0.100 0.080
5.1–10 0.080 0.060
Any individual capacity ≥ 10
TARIFF TO BE NEGOTIATED ON COMMERCIAL BASIS
TARIFF TO BE NEGOTIATED ON COMMERCIAL BASIS
Source: Kenya Gazette Notice March, as of 2008

40
The development of retail prices for petroleum products be-tween 2002 and 2008 shows a substantial price increase for diesel from 40 KES/l to over 100 KES/l within the last six years. The fuels are subject to excise duty, petroleum develop-ment levy and road levy for diesel and petrol.
2.4 MARKET ACTORS FOR PLANNING, REGULATION AND DISTRIBUTION
The Ministry of Energy is responsible for the overall energy sector planning and investment. The primary objective is to ensure the cost effective and affordable supply of energy in ad-equate quality to meet the national demand for development. Planning for grid-based electricity is done in partnership with Kenya Power and Lighting Company (KPLC).
KPLC The Kenya Power and Lighting Company (KPLC) is 48 % state-owned. It is the sole electricity utility in Kenya responsi-ble for transmission and distribution.
KenGen Kenya Electricity Generating Company (KenGen) is 70 % state-owned. It is the largest generator of electricity in Kenya operating an array of hydro, geothermal and thermal genera-tors. The company generates more than 65 % of all electricity fed into the national grid.
ERC The Energy Regulatory Commission (ERC) is responsible for regulatory and tariff processes of the energy sector including negotiations with IPP.
Renewable Energies in East Africa
NEMA ERC is mandated by the National Environmental Manage-ment Authority (NEMA) to be the leading institution on en-vironmental matters related to energy including environmen-tal impact assessments and mitigation measures as well as the supervision of Clean Development Mechanism (CDM).
IPP Kenya’s private sector IPPs include Iberafrica Power, Tsavo Power, Simba Power and Agrekko Power (thermal) and Or Power (geothermal).
REA The Rural Electrification Authority (REA) manages the Rural Electrification Program and privatization or concessions for isolated systems.
COUNTRY INTRODUCTION
KENYA
Source: graph compiled by the author with data from KNBS, Leading Economic Indicators 2002–2008 and Economics Survey, as of 2009
FIGURE 2
Evolution of Retail Prices for Petroleum Fuels 2002–2008
Month
Mar‘ 0
2
Sep‘ 0
2
Jun‘ 0
3
Dec‘ 0
3
Jan‘ 0
3
Sept‘ 08
Mar‘ 0
4
Sep‘ 0
4
Jan‘ 0
5
Jun‘ 0
5
Dec‘ 0
5
Sep‘ 0
6
Mar‘ 0
6
Jan‘ 0
7
Mar‘ 0
7
May‘ 0
7
July‘ 07
Sept‘ 07
Nov‘ 0
7
Diesel
Kerosene
Premium
100
Retail price (KES/Litre)
0
20
80
120
40
60

41
3 RENEWABLE ENERGY POLICY FRAMEWORK CONDITIONS
Kenya has put greater emphasis on Renewable Energy (RE) resources through the Sessional Paper No. 4 of 2004 (see annex 7, Bibliography). It recognizes the importance of RE as well as the importance of energy efficiency (EE) and lays the policy framework for the development and provision of cost-effective, affordable and adequate quality energy services on a sustainable basis in the short to long term.
3.1 POLICY AND RENEWABLE ENERGY PROMOTION PROGRAMS
Kenya’s key policy aspects, amongst others, comprise the fol-lowing13:
Legal and Regulatory Framework Establishment of an independent energy regulator, the ERC, to facilitate prudent regulation, enhance stakeholder interests and boost investor confidence. The policy was consolidated in the Energy Policy Act (EPA) 97 and the Petroleum Act Cap. 116.
Institutional Arrangements Creation of the REA to accelerate rural electrification Promotion of privately or community-owned energy serv-ice entities operating RE power plants
Establishment of a state-owned Geothermal Development Company (GDC) to conduct geothermal resource assess-ment and sale of steam
Energy Trading Arrangements Creation of a domestic power pool with provision for a wholesale and retail market to create competition and hence reduce cost of electricity
Streamlining of biomass energy trading arrangements Increasing of lifeline tariff to recover the cost of electricity generation
Energy Security Encouragement of wider adoption and use of RE technolo-gies to enhance their role in the energy supply matrix
Formulation of plans for biomass energy development Development of a national energy research agenda The strategies proposed under the Energy Act 2006 to pro-mote the development and use of RE technologies include the following:
Formulation of a national strategy for coordinating re-search in RE
Provision of an enabling framework for the efficient and sustainable production, distribution and marketing of bio-mass, solar, wind, small hydro, municipal waste, geother-mal energy and charcoal
Promotion of fast-growing trees for energy production including biofuels and the establishment of commercial woodlots including peri-urban plantations
Renewable Energies in East Africa
Promotion of the production and use of gasohol and biodiesel
Promotion of energy production with municipal waste (not specified in detail)
Promotion of cogeneration of electric power by sugar mill-ers for sale to the national grid and directly to the consum-ers
Development of appropriate local capacity for the manu-facture, installation, maintenance and operation of basic RE such as bio-digesters, solar systems and hydro turbines
Promotion of international cooperation on programs focus-ing on RE sources
Harnessing of opportunities offered under the CDM and other mechanisms including carbon trading
Financial incentives14 supporting the RE policy include in-come tax holidays for RE projects as well as exemption from duties and taxes during the implementation of generation and transmission projects.
Exclusive RE products are exempt from customs and import duties. Depending on the expected benefits to the economy, however, specific projects may attract preferential treatment from the Treasury. Documentation and permits for tax holidays and other exemptions for energy projects can be obtained from the permanent Secretary of the Ministry of Energy. A comprehensive customs classification for goods can be obtained from the Commissioner of Customs at the Kenya Revenue Authority.
SHORT BUSINESS INFOIncome tax holidays and exemption from tax and duty during implementation of RE projectsZero custom duty, zero tax on imported RE equipment
13 PARLIAMENT OF KENYA, AS OF 2004
COUNTRY INTRODUCTION
KENYA
14 KRA, AS OF 2009

42
3.2 DONOR AID ACTIVITIESThe following table shows the contribution of donor aid activ-ities in the energy sector. It lists donor funded energy projects, including their lifeline total budget and the donors funding the project. As shown below, donor activity in the RE market in Kenya is limited.
Renewable Energies in East AfricaCOUNTRY INTRODUCTION
KENYA
PROJECT TITLE DONOR LIFELINE TOTAL BUDGET OBJECTIVES
The Energy Sector Recovery Project World Bank through IBRD/IDA
2004–2010 80.00 million USD Enhancing of the policy as well as the institu-tional and regulatory environment for private sector participation and sector development for efficient reliability and quality of services
Market Transformation for Efficient Biomass Stoves for Institutions and Small- and Medium-Scale Enterprises
GEF through UNDP 2006–2010 1.00 million USD Removing of market barriers for the adoption of sustainable biomass energy practices and technologies by institutions
The Rural Electrification Master Plan Stud
Finnish Government though MFA
2005–2010 9.94 million USD Upgrading of the rural electrification master plan prepared in 1997 with emphasis on the pro-poor rural electrification master plan
Renforcement Distribution Elec French Government through AFD
2005–2010 31.00 million USD The AFD Energy Program includes the French Rural Electrification Project Phase II (rehabili-tation of KPLC sub-stations etc.). AFD is pre-sent and highly active in the development of all energy sectors in Kenya. Through the AFD, France is a lead donor in Kenya’s energy sector and chairs the energy donor coordination group.
Olkaria II Extension (Electrical Distribution and Transmission)
European Commission through EIB
2005–010 40.00 million USD The loan contributes to the financing of a grid development project including the upgrading and construction of transformer sub-stations, the rehabilitation and extension of distribution lines and will allow to connect 320 000 new consumers. The project also includes the replacement of outdated network control and radio communication facilities.
KPLC Grid Development European Commission through EIB
2005–2010 53.00 million USD Enhancement of electrical distribution and transmission
Sondu/Miriu Hydro Power Project II Japan Government through JBIC
2005–2010 13.00 million USD Construction of hydro power station
No title Japan Government through JBIC
2005–2010 2.82 million USD Hydroelectric power plants
Tea Development Authority Integrated Energy Management
United States through TDA 2005 342,000 USD Feasibility sector study
No title United States through TDA 2005 396,000 USD Hydroelectric power plants
No title United States through USAID
2005 123,000 USD Assistance in energy policy and administrative management
No title United States through USAID
2005 2.64 million USD Electrical transmission and distribution
No title United States through AID 2005 397,000 USD Electrical transmission and distribution
No title United States through USAID
2005 398,000 USD Coal-fired power plants
No title United States through USAID
2005 388,000 USD Energy policy and administrative management
No title United States through USAID
2005 315,000 USD Energy policy and administrative management
No title Sweden through SIDA 2005 38,000 USD Power generation / non-renewable sources
No title Sweden through SIDA 2005 24,000 USD Power generation / non-renewable sources
No title United States through USAID
2005 4.70 million USD Energy policy and administrative management
No title Germany through KFW 2005 247,000 USD Power generation / renewable sources
Bonification d‘Intérêts Électricité, AF Belgium through DGCD 2005 249,000 USD Electrical transmission and distribution
Promotion of Private Sector Development in Agriculture
Germany through GTZ 2005–2012 6.9 million USD The project aim is to support small and medium-size agricultural entrepreneurs in making use of their market opportunities by implementing economically viable and environmentally sound practices. Particular consideration is given to the poorer segments of the population
TABLE 5
Donor Funded Energy Projects in Kenya

43COUNTRY INTRODUCTION Renewable Energies in East Africa
KENYA
PROJECT TITLE DONOR LIFELINE TOTAL BUDGET OBJECTIVES
Windenergienutzung Afrika Germany through BMZ 2005 97,000 USD Wind power
Jpo Fugelsnes Norway through MFA 2005 103,000 USD Energy policy and administrative management
SMYRNA Community Development Program – SMYRNA Clinic
Norway through NORAD 2005 6,000 USD Funding for the costs related to access to the electricity net
Jpo Fugelsnes Norway through MFA 2004 214,000 USD Energy policy and administrative management
Awareness Raising on Sustainable Energy Issues
United Kingdom through DFID
2004 5,000 USD To influence the GoK, the Parliament, the civil society and the private sector to develop a sustainable policy for energy use in Kenya
Natural Resources Sweden through SIDA 2004 66,000 USD Power generation / non-renewable sources
Training Support Norway through NORAD 2004 32,000 USD Power generation / renewable sources
No title Norway through NORAD 2004 214,000 USD Energy policy and administrative management
Not title Italy though DGCS 2004 16,000 USD Technical cooperation for power generation / re-newable sources
Olkaria Geothermal Power Plant Germany through KFW 2004 1.24 million USD Geothermal energy
Olkaria Geothermal Power Plant Germany through KFW 2004 9.47 million USD Geothermal energy
Olkaria II Geothermal Power Plant Germany through KFW 2004 858,000 USD Equipment for geothermal power plant
Windenergienutzung Afrika – Dezent-rale Energieversorgung und Windparks am Netz‘
Germany through BMZ 2004 29,000 USD Wind power generation
Bonification d‘Intérêts Électricité, AF Belgium through DGCD 2004 292,000 USD Electrical transmission and distribution
Olkaria Geothermal Power European Commission though EDF
2004 1.64 million USD Geothermal energy
No title Japan through JBIC 2004 1.99 million USD Hydroelectric power plants
No title Italy through DGCS 2004 263,000 USD Pilot plant for using solar energy to favor fishery in Kerio Valley
Tsavo Power Co Ltd. United Kingdom through CDC
2004 1.69 million USD Power generation / non-renewable sources
Extension of the Rural Electrification Network
Spain through ICO 2003 779,000 USD Electrical distribution net for several rural districts
No title Japan through JBIC 2003 1.596 million USD Hydr-electric power plants
No title New Zealand through NZG 2003 11,000 USD Geothermal energy
No title Japan through JBIC 2002 7.023 million USD Hydroelectric power plants
Source: EUEI, as of 2009 (http://ec.europa.eu/development/policies/9interventionareas/waterenergy/energy/initiative/bkcp/ related_project.htm > Projects Database > Choose a beneficiary country > Kenya > Find project)

COUNTRY INTRODUCTION
3.3 MARKET RISKS
Establishing a BusinessIn order to conduct business in Kenya, a company must be reg-istered with the Registrar of Companies as branch office of an overseas company or a locally incorporated company. Where the investment may have adverse impact on security, health or environment, clearance from the competent authorities (such as National Environment Management Authority (NEMA), Public Health authorities etc.) will be required before approv-al is granted. Clearance is required from parent ministries for investments in restricted areas before approval can be granted. Investments in energy and petroleum products require clear-ance from the Ministry of Energy. Apart from that, no specific restrictions apply to energy businesses in Kenya.
CorruptionKenya ranks number 142 out of 163 in the corruption index of Transparency International. Kenya Bribery Index is point-ing out that corruption causes damage to the economy worth 1 billion USD15.
The GoK is undertaking the following measures to mitigate corruption:
Zero-tolerance to corruption Establishing an anti-corruption police unit Emphasizing on the rule of law Enhancing transparency in the licensing process through enactment of an Investment Act
Streamlining Government procurement procedures (Pro-curement act enacted)
Enhancing accountability in the judicial system
Protection of InvestmentsKenya is a liberalized market in both trade and currency and does not limit the repatriation of business profits. Other as-pects of the investment climate include the Foreign Invest-ment Protection Act (FIPA) (Cap. 518). Under FIPA regula-tions, investors can repatriate the after tax profits including retained profits which have not been capitalized. Investors can also repatriate proceeds of investment after payment of the relevant taxes.
Kenya has concluded agreements with the EU and Germany, Belgium, Switzerland and India among other coun-tries. Other earlier agreements are being revised and/or nego-tiated. The original agreements were concluded between the African, Caribbean and Pacific States (ACP) under the Lome convention I to IV16.
The constitution of Kenya provides guarantees against expropriation of private property, which may only be executed for reasons of security or public interest. In this case, a fair and prompt compensation is guaranteed. Kenya is a member of the World Bank or more precisely of the affiliated Multi-lateral Investment Guarantee Agency (MIGA). MIGA issues guarantees for non-commercial risks to enterprises that invest in member countries. Kenya is also a member of the Interna-
Renewable Energies in East Africa
tional Center for Settlement of Investment Disputes (ICSID) and of the African Insurance Agency (ATIA).
Investment risks in Kenya are low given the stability of the economy. This was demonstrated by the speed with which the economy recovered from the post-election stalemate. With vision 2030 driving the economic development, the stability of the Kenyan economy has never been better.
The Kenya Intellectual Property Organization polices and regulates intellectual property.
Awareness and SecurityKenya is a cosmopolitan society where diverse cultures and nationalities do business together across the country. In fact, Kenya as an entrepreneur society has a high awareness for international business and investment opportunities and is sometimes said to be too welcoming to foreigners.
The security situation in Kenya is satisfactory and not worse than in many parts of the world. Adequate health fa-cilities of international standards are available, particularly in urban areas. High-quality education for investors relocating to Kenya is available for their families with overseas curricu-lars available in most of the international schools. Adequate transport and communication channels by air, road, sea, post and telecommunications are available to any destination in the world.
StaffInvestors must acquire class H work permits for directors and class A work permits for expatriate employees. Entry into Ken-ya will require visitors to obtain either business visa or visitors’ visas. Expatriate professionals, engineers or technicians who are required to install machineries or train local employees for a short period of time are issued with special passes. Local RE experts are available, but limited, while trained engineers and technicians are readily available. More than four technical universities are established in the country offering sufficient scope for cooperation and research.
Minimum wages defined by the Government depend on skills. Workers are allowed to join trade unions related to their sectors of work and receive wages negotiated through tripartite agreements (between trade unions, Government and employers.) Labor disputes are settled through the industrial court.
Kenya has a well-developed professional services sec-tor with a number of multinational professional companies operating regional offices in Nairobi. Most major insurance companies, banks and other private sector-related institutions have a presence in Kenya.
44
KENYA
15 TI, KENYA, AS OF 2009
16 FOR FURTHER INFORMATION SEE EU AID: ACP – LOME CONVENTION, AS OF 2009.
THE REVISIONS AND NEGOTIATIONS CAN BE FOUND AT ACP, AS OF 2000.

45COUNTRY INTRODUCTION Renewable Energies in East Africa
KENYA
4 STATUS AND FUTURE OUTLOOK FOR RENEWABLE ENERGIES
With the exception of biomass, which is largely consumed in its raw form, the utilization of RE in Kenya in contrast to its potential is extremely low. Commercial RE is dominated by large hydro and geothermal power, which also constitutes the largest percentage of grid-connected power at 58 % and 13 % respectively. The geothermal potential in Kenya is the biggest in the EAC.
Solar PV is, however, the most widely used off-grid source of RE and provides electricity especially to rural house-holds. About 2.2 % or 200,000 mainly off-grid households in Kenya use solar PV for lighting. A total capacity of 4 MW is installed with an average system size of 25 Wp. While more than 500,000 small PV systems have been sold, a large number of these are replacements for faulty a-Si PV modules and batteries. Small and Micro Enterprise (SME) private sec-tor businesses dominate the RE sector.
4.1 BIOMASS / BIOGASDespite heavy reliance on biomass, especially on firewood and charcoal, minimal planning and regulatory measures have been put in place by the Government. For example, even though the production of charcoal so far remains illegal while the consumption is legal, the ‘illegal’ trade is estimated to have a turnover of 320 million € annually17.
Traditional biomass energy supplies come from four distinct sources: natural vegetation (closed forests, woodlands and bush-lands), trees on farms, plantations and residues from crops and industrial wood. Firewood and residues are con-sumed largely for household cooking at or near source. The total sustainable biomass supply from all sources is estimated at 15 million tons with approximately 21 % from natural vege-tation, 60 % from farms, 5 % from plantations and 14 % from crop and wood residues.
Industries requiring thermal energy have on their own initiative as demonstrated by the use of raw biomass for en-ergy provision in their operations. Examples include tea, clay works, cement, edible oils and some small-scale furnace op-erators. Industrial solid biomass provides the largest opportu-nity for investment in the biomass sector.
At the Kilifi Plantations, a pilot installation for biogas production was installed by the German company agriKomp in cooperation with GTZ as part of a cooperation project un-der the Private-Public Partnership (PPP) program of German Development Cooperation18. Two cogeneration plants with total 160 kW are fed with animal dung and sisal. The elec-tricity and heat is supplied to a nearby milk farm. GTZ also worked on PPP base with a slaughterhouse in Kiserian Nai-robi to install a 20 kW biogas digester.
CogenerationAn estimated 43 MW of electricity cogeneration is currently installed in the five sugar factories operating across Kenya. Development of a 35 MW sugar bagasse cogeneration project by Mumias Sugar is ongoing as a CDM project.
A further potential of 340 MW of sugar bagasse cogen-eration is estimated at the state corporations of Chemelil, Sony Sugar, Nzoia and Muhoroni. These companies are expected to be privatized by the Government within the next two years. This proves an opportunity for private investment by local and international players in the cogeneration business.
SHORT BUSINESS INFOMost of biomass products are sold in the informal sectorCogeneration of bagasse has a potential of 340 MW in four state-owned sugar factories which are going to be privatized
Various jatropha plantation initiatives are ongoing with an estimated cultivation area of over 4,000 hectares. The biggest groups involved are Better Globe Forestry, an international commercial forestry developer, and Green Africa, a local Non-Governmental Organization (NGO). The Kenyan component of the Africa Biogas Initiative financed by the Dutch Ministry of Foreign Affairs (DGIS) targets at 10,000 domestic biogas digesters (4–16 m³) over the next 10 years. The Africa-wide project targets 2 million digesters in Africa. The Ministry of Energy invites bids from local companies and joint ventures to provide the development and installation services.
BiofuelsThe development of biofuels in Kenya is currently hampered by lack of policy framework. Measurements have, however, been taken to develop a comprehensive biodiesel strategy and a draft has been developed, which is awaiting cabinet approv-al. The initiative is coordinated by the Ministry of Energy through a National Biofuels Committee that incorporates stakeholders from all relevant Government ministries as well as civil society and private sector players. In addition, GTZ has completed and released a study on biofuels potentials and risks in Kenya in cooperation with the Kenyan Ministry of Agriculture in 200819. Much research, however, still needs to be done on the sub-sector as information is still inadequate.
4.2 SOLAR ENERGYKenya has relatively high insolation rates with an average of 5 peak sunshine hours in the most of the country. However, are-as in the highlands are affected by cloud cover with significant variations in radiation20. The most widely used applications for solar energy in Kenya are small domestic PV systems.
The installed PV capacity is estimated at more than 4 MW, mainly delivered by small PV systems of 14–120 Wp. An estimated 120,000 rural households use small Solar Home Systems (SHS). Larger PV systems for telecommunications and health institutions of typically 2–5 kW are also to be
17 DATA COMPILED BY THE AUTHOR FROM DIFFERENT SOURCES AND OWN RESEARCH
18 FOR MORE INFORMATION ON THE GERMAN DEVELOPMENT COOPERATION PPP
PROGRAM (DEVELOPPP) AND GTZ SERVICES IN THIS FIELD SEE
WWW.GTZ.DE/EN/LEISTUNGSANGEBOTE/2362.HTM.
19 GTZ/GOVERNMENT OF KENYA, AS OF 2008
20 UNEP, AS OF 2008
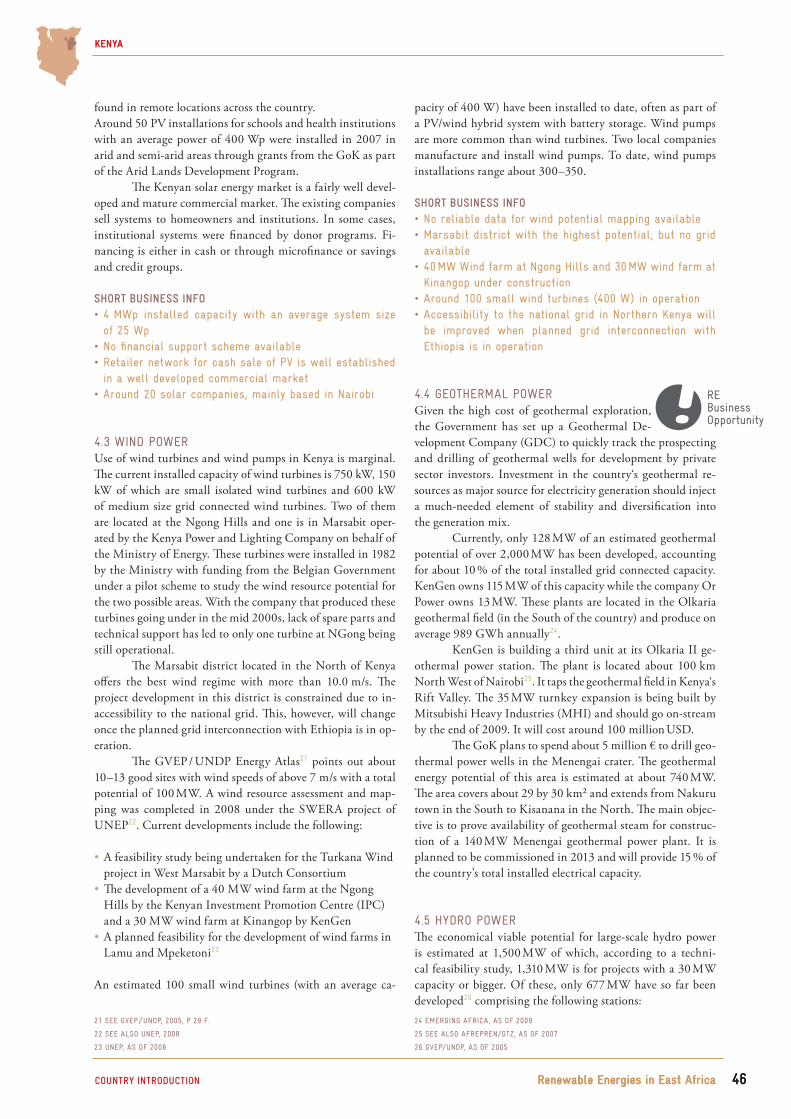
pacity of 400 W) have been installed to date, often as part of a PV/wind hybrid system with battery storage. Wind pumps are more common than wind turbines. Two local companies manufacture and install wind pumps. To date, wind pumps installations range about 300–350.
SHORT BUSINESS INFONo reliable data for wind potential mapping availableMarsabit district with the highest potential, but no grid available40 MW Wind farm at Ngong Hills and 30 MW wind farm at Kinangop under constructionAround 100 small wind turbines (400 W) in operationAccessibility to the national grid in Northern Kenya will be improved when planned grid interconnection with Ethiopia is in operation
4.4 GEOTHERMAL POWERGiven the high cost of geothermal exploration, the Government has set up a Geothermal De-velopment Company (GDC) to quickly track the prospecting and drilling of geothermal wells for development by private sector investors. Investment in the country‘s geothermal re-sources as major source for electricity generation should inject a much-needed element of stability and diversification into the generation mix.
Currently, only 128 MW of an estimated geothermal potential of over 2,000 MW has been developed, accounting for about 10 % of the total installed grid connected capacity. KenGen owns 115 MW of this capacity while the company Or Power owns 13 MW. These plants are located in the Olkaria geothermal field (in the South of the country) and produce on average 989 GWh annually24.
KenGen is building a third unit at its Olkaria II ge-othermal power station. The plant is located about 100 km North West of Nairobi25. It taps the geothermal field in Kenya‘s Rift Valley. The 35 MW turnkey expansion is being built by Mitsubishi Heavy Industries (MHI) and should go on-stream by the end of 2009. It will cost around 100 million USD.
The GoK plans to spend about 5 million € to drill geo-thermal power wells in the Menengai crater. The geothermal energy potential of this area is estimated at about 740 MW. The area covers about 29 by 30 km² and extends from Nakuru town in the South to Kisanana in the North. The main objec-tive is to prove availability of geothermal steam for construc-tion of a 140 MW Menengai geothermal power plant. It is planned to be commissioned in 2013 and will provide 15 % of the country’s total installed electrical capacity.
4.5 HYDRO POWERThe economical viable potential for large-scale hydro power is estimated at 1,500 MW of which, according to a techni-cal feasibility study, 1,310 MW is for projects with a 30 MW capacity or bigger. Of these, only 677 MW have so far been developed26 comprising the following stations:
46Renewable Energies in East Africa
KENYA
46COUNTRY INTRODUCTION Renewable Energies in East Africa
KENYA
found in remote locations across the country. Around 50 PV installations for schools and health institutions with an average power of 400 Wp were installed in 2007 in arid and semi-arid areas through grants from the GoK as part of the Arid Lands Development Program.
The Kenyan solar energy market is a fairly well devel-oped and mature commercial market. The existing companies sell systems to homeowners and institutions. In some cases, institutional systems were financed by donor programs. Fi-nancing is either in cash or through microfinance or savings and credit groups.
SHORT BUSINESS INFO4 MWp installed capacity with an average system size of 25 WpNo financial support scheme availableRetailer network for cash sale of PV is well established in a well developed commercial marketAround 20 solar companies, mainly based in Nairobi
4.3 WIND POWERUse of wind turbines and wind pumps in Kenya is marginal. The current installed capacity of wind turbines is 750 kW, 150 kW of which are small isolated wind turbines and 600 kW of medium size grid connected wind turbines. Two of them are located at the Ngong Hills and one is in Marsabit oper-ated by the Kenya Power and Lighting Company on behalf of the Ministry of Energy. These turbines were installed in 1982 by the Ministry with funding from the Belgian Government under a pilot scheme to study the wind resource potential for the two possible areas. With the company that produced these turbines going under in the mid 2000s, lack of spare parts and technical support has led to only one turbine at NGong being still operational.
The Marsabit district located in the North of Kenya offers the best wind regime with more than 10.0 m/s. The project development in this district is constrained due to in-accessibility to the national grid. This, however, will change once the planned grid interconnection with Ethiopia is in op-eration.
The GVEP / UNDP Energy Atlas21 points out about 10–13 good sites with wind speeds of above 7 m/s with a total potential of 100 MW. A wind resource assessment and map-ping was completed in 2008 under the SWERA project of UNEP22. Current developments include the following:
A feasibility study being undertaken for the Turkana Wind project in West Marsabit by a Dutch Consortium
The development of a 40 MW wind farm at the Ngong Hills by the Kenyan Investment Promotion Centre (IPC) and a 30 MW wind farm at Kinangop by KenGen
A planned feasibility for the development of wind farms in Lamu and Mpeketoni23
An estimated 100 small wind turbines (with an average ca-
21 SEE GVEP / UNDP, 2005, P 29 F.
22 SEE ALSO UNEP, 2008
23 UNEP, AS OF 2008
24 EMERGING AFRICA, AS OF 2009
25 SEE ALSO AFREPREN/GTZ, AS OF 2007
26 GVEP/UNDP, AS OF 2005

Seven Forks Hydro Stations have an installed capacity of 543 MW. They are situated along the lower part of the Tana River and comprise Masinga Power Station, Kambu-ru Power Station, Gitaru Power Station, Kindaruma Power Station and Kiambere Power Station.
Masinga Power Station has an installed capacity of 40 MW.
Kamburu Power Station has an installed capacity of 94.2 MW.
Gitaru Power Station has an installed capacity of 225 MW.
The hydro power project of Sondu Miriu (60 MW) has been completed, but has not been commissioned yet due to low water levels. The development of the 20 MW Sangoro pow-er project (also on the Sondu Miriu River) is ongoing. Both projects are threatened by the destruction of the Mau Forest, which is the main catchment zone of the Sondu Miriu River. Three other hydro power projects have been identified as feasi-ble for development within the next 15 years. These are Ewaso Ngiro South (220 MW), Mutonga (60 MW) and Low Grand Falls (70 MW).
Micro Hydro PowerThe potential for small hydro is estimated at 3,000 MW coun-trywide. The actual capacity available is, however, declining due to depletion of forests in key water catchment areas and the changing climate. While small hydro schemes are eco-nomically feasible for off-grid electrification, only a few have been developed mainly by private individuals and community groups. Small hydro remains largely underdeveloped with less than 15 MW connected to the grid27.
Over the past 3–4 years, 60 pico and micro hydro systems have been installed in the region of Mt. Kenya. This is driven mainly by availability of technical know-how and equipment following a pilot project in the area implemented
47Renewable Energies in East AfricaCOUNTRY INTRODUCTION
by the NGO of Practical Action through a community micro hydro scheme. Other sector players are involved in implement-ing small hydro projects in central Kenya including Clean Air Kenya and Greenpower Ltd.
The systems vary between 1–100 kW, the specific costs are around 4,000–6,000 USD/kW for pico systems and 3,500 USD/kW for micro systems. Systems are owned by lo-cal communities, which form associations or companies that own and operate them. The communities through their asso-ciations fully finance the systems and work with private sector developers to realize the projects. Two of the largest develop-ers and suppliers are Q-Energy Ltd. and Numerical Machines (K) Ltd. Households pay a standard monthly charge of 60–100 KES to cover maintenance and additionally contribute to the installation costs.
There is a remarkable scope for small, micro and pico hydro in all the drainage basins across Kenya. Independent SME and the NGO Practical Action (formerly Intermediate Technology Develop-ment Group – ITDG) as well as other international NGOs have completed over 35 projects (2 MW in total).
Major barriers to development include limited local capacity to develop schemes as well as capacity for local pro-duction of turbines. This offers business opportunities for for-eign producers.
SHORT BUSINESS INFOLarge-scale hydro potential: only 677 MW out of 1,300 MW exploitedSmall-scale hydro potential estimated at 3,000 MWMicro and pico hydro market around Mt. Kenya
The table below summarizes the financing opportunities and investment potential for RE in Kenya.
KENYA
27 MURIITHI/MOE, AS OF 2006
RENEWABLE RESOURCE ECONOMIC POTENTIAL BUSINESS OPPORTUNITY INVOLVED AND INTERESTED PROJECT FINANCIERS
Large hydro 1,400 MWe Not attractive as most of the remaining sites are outside the economic merit
Very few
Small hydro 1,000 MWe Attractive for off-grid power generation, especially targeting the tea industry and households, mechanical application also possible
Local and international RE development financing (IFC, KfW, AfDB, TRIODOS, GROFIN, K-REP, Equity, EADB etc.)
Geothermal > 2,000 MWe Investment open to IPPs and other thermal applications once prospecting is complete and wells drilled
International financing (IFC, AfDB, EDB)
Wind > 500 MWe Mapping shows high potential for grid-connected wind, mechanical use in water pumping demonstrated
International financing (IFC, AfDB, EDB)
Cogeneration 360 MWe Availability of bagasse, demand for steam and connectivity of plants to grid network
International financing (IFC, AfDB, EDB)
PV and solar thermal Not quantified Large off-grid market, mainly liberalized with high customer awareness
Local bank finance (Equity, GROFIN, K-REP etc.)
Biomass Not quantified Demand for cleaner and cost-effective thermal energy for industrial fuel switch
International and local finance, potential for CDM
TABLE 6
Economic Potential for RE Investments in Kenya
Source: table compiled by the author, as of 2009

KENYA
COUNTRY INTRODUCTION Renewable Energies in East Africa 48
5 RENEWABLE ENERGY BUSINESS INFORMATION AND CONTACTS
The overview names only potential partners for international business contacts. Besides these, there are numerous other smaller companies involved in retail and installation of small RE systems across Kenya.
5.1 RENEWABLE ENERGY COMPANIES & BUSINESS RELATED ORGANIZATIONS
COMPANY CONTACT ADDRESS PRODUCTS AND SERVICES
Chloride Solar Dunga Rd., Industrial Area P. O. Box: 20553 00200 Nairobi – Kenya Phone:+ 254 20 553322 Fax: +254 20 547865 Website: www.chlorideexide.com
Design, supply, installation, repair and maintenance of automotive batteries, solar systems, wind generators, power backup systems and solar water heating
Kenital Solar Ltd. Off Ngong Rd. P. O. Box 19764 00202 Nairobi – Kenya Phone: +254 20 2715960 Fax: +254 20 27145514 Website: www.kenital.com
Design, supply, installation, repair and maintenance of hybrid solutions, power backup, solar hot water systems, solar lighting kits, solar street lighting, water pumping, wind energy solutions
Davis and Shirtliff Ltd. Dundori Rd. P. O. Box 41762 00100 Nairobi – Kenya Phone: +254 20 6968 000, 558 335 d&[email protected] Website: www.dayliff.com
Design, supply, installation, repair and maintenance of pumps, swimming pools, water treatment, water supply equipment, solar equipment
Sollatek Electronics Kenya Ltd. Bamburi Off Malindi Rd. P. O. Box 34246 80118 Mombasa – Kenya Phone: +254 41 5486250/1/2/3 Fax: +254 41 5486259 [email protected] Website: www.sollatek.co.ke
Supply, installation, repair and maintenance of power control, wind and solar equipment
PHONEESALES Solar Bruce House, Kaunda Str. P. O. Box 45525, Nairobi – Kenya Phone: +254 22 13143 / 336027 Fax: +254 2 745 655 [email protected]
Retail sales, wholesale supplier of PV systems and components, solar water pumping systems, wind energy systems (small), emergency power back-up systems, rural communications and energy systems, energy efficient cookers, refrigerators and freezers, consulting, installation and project development services, site survey and assessment services, maintenance and repair services
Chardust Langata Hardy P. O. Box 24371 Karen, 00502 Nairobi – Kenya Phone: +254 020 270 0316, 353 89957, 350 5576 Website: www.chardust.com
Consultancy services on the salvage, recovery and conversion of charcoal waste to fuel briquettes including installation of machinery and training of operators
Bob Harries Engineering Limited – Kijito Wind Pump
Karamaini Estate P. O. Box 4001000 Thika – Kenya Phone: + 254 733723401Contact: Mike [email protected]
Manufacture, installation, repair and maintenance of Kijito wind pumps
Winafrique Technologies 3rd Floor Soin Arcade, Westlands P. O. Box 7319300200 Nairobi – Kenya Phone: +254 2 4453898/949 Fax: +254 2 4453988 [email protected]: www.winafrique.com
Design, supply, installation, repair and maintenance of hybrid remote alternative power systems, wind power solutions, solar power solutions, water pumping solutions, power enhancing solutions and energy storage systems
ASP Ltd. Old Airport Road NairobiP. O. Box 556038 Nairobi – Kenya Phone: +254 20 823901, 823411/6 Fax: +254 29 823905/10 [email protected]
Manufacture, distribution and installation of pipes, penstocks, solar water heaters and PV equipment
CAT Center for Alternative Technologies
Jos Hansen & Soehne Building Baba Dogo Road P. O. Box 64921 Nairobi – Kenya Phone: +254 20 8562034 / -8561253 Fax: +254 20 [email protected]
Wholesale distributors and system integrators of RE specializing in the sale of power backup so-lutions, wind electric turbines and equipment, DC energy efficient appliances, solar & wind powered water pumping solutions, solar water heating, solar pool water heating and filtration
Solar World EA Ltd. P. O. Box 78516-00507, Ring Road Parklands and General Mathenge Rd. Junction, WestlandsNairobi – KenyaPhone: +254 20 3599699 Fax: +254 20 3751998Website: www.solarworldea.com
Retail sales, wholesale supplier of solar electric power systems, backup power systems and bat-teries lead acid deep-cycle, solar water heating components, PV module components, LED lighting, solar torches, solar lanterns, solar caps, radios, solar mobile chargers, wind turbines, consulting, design, installation, engineering, contractor services, maintenance and repair services

KENYA
COUNTRY INTRODUCTION Renewable Energies in East Africa 49
COMPANY CONTACT ADDRESS PRODUCTS AND SERVICES
Adept Pacesetters Ltd. Cargen Hse, Harambee Ave.P. O. Box 55672 00200 Nairobi – Kenya Phone: +254 20 315117 / -315116
Wholesale supplier, exporter, importer of solar electric power systems, wind energy system com-ponents (small), wind energy systems (large), air cooling systems, solar water heating systems, air heating systems
Dial A Battery P. O. Box 27517– 00506 Nairobi – Kenya Phone: +254 20 5507I5 / -20 6750692 / +254 725 775555Fax: +254 20 530413
Retail sales of automotive starting batteries, emergency backup batteries, deep cycle batteries, battery chargers, DC to AC power inverters and solar lighting systems
Digi Communication Systems Ltd.
P. O. Box 56366 –00200 Nairobi – KenyaPhone: +254 20 609240Mobile: +254 73 3604668Fax: +254 20 604216
Retail sales, wholesale supplier, importer of solar water heating systems, solar water heating components, water heating systems, PV systems, VHF & HF Radio Networks, consulting, design, installation, engineering, maintenance and repair services
Renewable Energy Engineering Contractors (REECON)
Ngara Rd. 00600P. O. Box 31620Nairobi – KenyaPhone: +254 20 3752136Fax: +254 20 3751201Mobile: +254 722 [email protected]
Wood burning stoves and furnaces, biomass energy systems, composting systems, energy efficient homes and buildings, hydro energy system components (small), solar cooking systems, biogas plant, waste water, incineration, energy efficiency
CAMCO (formerly Energy for Sustainable Development Africa)
Muringa off Elgeyo Marakwet Rd.P. O. Box 76406 - 00508 Nairobi – KenyaPhone: +254 20 37851Website: www.esd.co.uk
RE Consulting, project development, management and evaluation, carbon asset development

Renewable Energies in East Africa 50COUNTRY INTRODUCTION
KENYA
5.2 LOCAL INSTITUTIONS RELATED RENEWABLE ENERGY BUSINESS
INSTITUTION CONTACT ADDRESS ROLE SERVICES
Petroleum Institute of East Africa
Bruce House 4th Floor Standard Street P. O. Box 8936 – 00200 Nairobi – KenyaPhone: +254 20 249081Fax: +254 20 313048Website: www.petroleum.co.ke/
Provides a forum for expertise and excellence in the oil industry in the East African region with the aim of promoting professionalism and free enterprise in petroleum business supported by the highest business and operating standards, adherence to environment, health and safety ideals
Development of petroleum standards, capacity building and policy, creation of public and con-sumer awareness on basic environment, health and safety issues touching on handling and use of petroleum products
Ministry of Energy 22-24 Floor Nyayo House, off Uhuru Highway P. O. Box 30334 – 00100 Nairobi – Kenya Phone: +254 20 310112 Fax: +254 334567 Website: www.energy.go.ke
Planning and management of national energy de-mand and supply to ensure adequate, qualitative, cost effective and affordable supply of energy to meet development needs, while protecting and conserving the environment
Energy policy and energy sector development
Kenya Industrial Research and Development Institute
Dunga / Lusaka Road P. O. Box 30650Nairobi – Kenya Phone: +254 20 535966/84/90 Fax : +254 20 555738Website: www.kirdi.go.ke
Enhances the national industrial technology innovation process as a strategy towards rapid socio-economic development, facilitates access by local enterprises to business development services, including cleaner production and industrial information
R&D and consultancy
Kenya Bureau of Standards (KEBS)
Kapiti Road, Off Mombasa Road P. O. Box 00200 – 54974 Nairobi – Kenya Phone: +254 20 605506 Fax: +254 20 604031Website: www.kebs.org
Ensures that no technical barriers to trade are created while providing services in standardiza-tion and conformity assessment
Trade facilitation services in metrology, stan-dards, testing and quality management (MSTQ) including the WTO / TBT National Enquiry Point, certification and accreditation
National Environmental Management Authority (NEMA)
Kapiti Road off Mombasa Road P. O. Box 67839 – 00200 Nairobi – Kenya Phone: +254 20 605522Fax: +254 20 608997 Website: www.nema.go.ke
Exercising general supervision and coordination over all matters relating to the environment and to be the principal instrument of Government in implementing all policies related to the environment
Coordination, research, facilitation and en-forcement
Energy Regulatory Commission Integrity Centre 1st floor, Valley RD P. O. Box 42681 – 00100 Nairobi – KenyaPhone: +254 20 2717627 Fax: +254 20 2717603Website: www.erb.go.ke/
Economic and technical regulation of power, RE and downstream petroleum sub-sectors
Setting, review and adjustment of tariffs, licen-sing, approval of power purchase and network service contracts, enforcement of environmental and safety regulations in the power sub-sector, complaint investigation and dispute settlement
Practical Action (ITDG) Practical Action East Africa AAYMCA Building P. O. Box 39493 Nairobi – Kenya Phone: +254 20 2719313 Fax: +254 20 2710083 Website: www.practicalaction.org
Support of poor communities to help them choose and use technology to improve their lives for today and generations to come
Campaigning, technical information service, education, consultancy and publishing
Jomo Kenyatta University of Agriculture and Technology (JKUCAT) - Institute for Energy and Environmental Technology (I.E.E.T)
Juja-Main Campus P. O. Box 62000-00200 Nairobi – Kenya Phone: + 254 06752711 Fax: + 254 0672164 Website: www.jkuat.ac.ke/
Research and training on energy and environ-mental technologies with emphasis on transfer of technology for efficient energy use
Consultancy services, waste treatment, environ-mental impact assessment and environmental and energy audit as well as biogas technology, research activities on development of biofuels/biodiesel, biomass biogas, small hydro power
Nairobi University Off Harry Thuku Road P. O. Box 30197 - 00100 Nairobi – Kenya Phone: + 254 (020) 318262 Ext. 28483 Fax: + 254 (020) 245566 [email protected] Website: www.uonbi.ac.ke
Development of knowledge in nuclear sciences and technology and their application for enhan-cement of life in our society
RE research and training as well as consultancy services
Kenyatta University –Depart-ment of Environmental Services
P. O. Box 43844-00100 Nairobi – Kenya Phone: +254 20 810901-19 Fax: +254 20 811575 [email protected] Website: www.ku.ac.ke/
Study of the environment, incorporating its structure and functioning in order to better evaluate the impacts of human activities on surrounding ecosystems
Training and research related to energy and environmental topics
United Nations Environmental Program (UNEP) – Division of Global Environment Facility Coordination (DGEF)
UNEP / Division of GEF Coordination P. O. Box 30552 Nairobi 00100, Kenya Phone: +254 20 7623424 Fax: +254 20 7624041 Website: www.dgef.unep.org/
Catalyzing of the development of scientific and technical analysis and advancing environmental management in GEF-financed activities
Guidance on relating the GEF-financed activities to global, regional and national environmental assessments, policy frameworks and plans, and to international environmental agreements
AFREPREN/FWD House, Elgeyo Marakwet CloseP. O. Box 30979 GPO 00100 Nairobi – KenyaPhone: +254 20 3866032Fax: +254 20 3861464Website: www.afrepren.org
Registered NGO with vast expertise on energy in East and Southern Africa and some experience in West and North Africa, brings together over 300 African energy researchers and policy makers from Africa with long-term interest in energy re-search and the respective policy-making process

Renewable Energies in East Africa 51COUNTRY INTRODUCTION
KENYA
INSTITUTION CONTACT ADDRESS ROLE SERVICES
Institute of Research in Sustainable Energy and Development (IRSEAD)
David Yuko, Executive DirectorKabarnet RoadP. O. Box 3576-00100Nairobi – KenyaPhone: +254 722 846260Fax: +254 20 [email protected], [email protected]
Climate Network Africa Wood Avenue, Kilimani, P. O. Box 76479 00508 Nairobi – Kenya Phone: +254 20 3864040 Fax: +254 20 3873737 [email protected], [email protected]: www.cnaf.or.ke
Tackle climate change, desertification, biodiver-sity loss, ozone depletion, energy, poverty and other environmental and development issues affecting the communities in which it operates
Environment Liaison Centre International (ELCI)
Environment Liaison Center International Kasarani RoadP. O. Box 72461-00200Nairobi – KenyaPhone: +254 20 8566172/3/4Fax: +254 20 [email protected]: www.elci.org
Global coalition of more than 800 NGOs working on issues of environment and sustainable deve-lopment in more than 80 countries
International Finance Corporation (IFC)
IFC Kenya, Hill Park Building Upper Hill Road Phone: +254 20 322-6340/400 Fax: +254 20 322-6383 Website: www.ifc.org/
Promote open and competitive markets in deve-loping countries, support companies and other private sector partners, generate productive jobs and deliver basic services, create opportunity for people to escape poverty and improve their lives
Project finance: financial products and services that enable companies to manage risk and broaden their access to foreign and domestic capital markets; Advisory services: advisory services in support of private sector development in developing countries
United nations Industrial Development Organization (UNIDO)
UNIDO Office Kenya P. O. Box 41609, United Nations Avenue, Gigiri, Block Q, Room 118 Nairobi – Kenya Phone: +254 20 7624369 Fax: +254 20 7624368 [email protected] Website: www.unido.org/
Mobilizes knowledge, skills, information and technology to promote productive employment, a competitive economy and a sound environment
De-linking intensity of energy use from economic growth, reducing the environmental damage that occurs with energy use
The K-Rep Group K-Rep Bank Limited Naivasha Road P. O. Box 25363-00603 Lavington, Nairobi – Kenya Phone: +254 20 3873229 Fax: +254 20 3873178 Website: www.k-rep.org
Development of appropriate microfinance products and services to create economic oppor-tunities for low income people and contribute to eliminating poverty
Developing, testing and promoting the adoption of appropriate microfinance models for impro-ving the accessibility of financial services to people with low incomes
GROFIN CIC Plaza Mara Rd, Upper Hill P. O. Box 19447 KNH 00202 Nairobi – Kenya Phone +254 20 273 0280 Fax: +254 20 273 0279 [email protected] Website: grofin.com/
Business development and finance company focused on providing business support and risk capital to small- and medium-sized enterprises in emerging markets underserved by traditional sources of capital
Advisory, financing and project development
Commissioner of Customs (at the Kenya Revenue Authority)
Times Tower, P. O. Box 40160 00100 Nairobi – KenyaPhone: + 254 20 310900, 2810000Fax: + 254 20 316872 Email: [email protected] Website: www.kra.go.ke

Renewable Energies in East Africa 52BIBLIOGRAPHY
KENYA
6 BIBLIOGRAPHY
AFREPREN / GTZ (2007): Successful Energy Policy Interventions in Africa (www.gtz.de/de/dokumente/en-successful-policy- interventions-2007.pdf)
Central Bureau of Statistics – CBS (2003): A Geographic Dimension of Well Being in Kenya (www.scribd.com/doc/2224390/geographic-Dimensions-of-WellBeing-in-Kenya)
Central Intelligence Agency – CIA (2009): The World Fact Book – Kenya (www.cia.gov/library/publications/the-world-factbook/geos/ke.html)
Data Exchange Platform for the Horn of Africa – Depha (2009): Provincial Map of Kenya (www.depha.org)
Electricity Regulatory Board (2005): Retail Electricity Tariffs Review Policy (www.erc.go.ke/retail-tariff.pdf)
Emerging Africa (2009): Emerging Africa Infrastructure Fund Finances Two Vital Environmental and Construction Projects in Kenya and Algeria (http://www.emergingafricafund.com/Files/MediaFiles/DRAFT%20PRESS%20RELEASE%20FMFM%20Olkaria%20and%20SMT%20Feb%2009%20Final%20(2).doc)
EU Aid, ACP – LOME Convention (2009): (http://homepages.uel.ac.uk/ben2417s/EUAid3.htm and www.acpsec.org/en/conventions/cotonou/accord1.htm)
European Union Energy Initiative – EUEI (2009): Projects Database (http://ec.europa.eu/development/policies/9interventionareas/waterenergy/energy/initiative/bkcp/related_project.htm > Projects Database > Choose a beneficiary country > Kenya > Find projects)
Gesellschaft für Technische Zusammenarbeit – GTZ (2009): Public-Private Partnership (www.gtz.de/en/leistungsangebote/2362.htm)
Global Village Energy Partner – GVEP / United Nations Development Program – UNDP (2005): Kenya Energy Atlas 2005 (www.ke.undp.org/KenyaEnrgyAtlas Final-UN.pdf), Nairobi
GTZ / Government of Kenya (2008): A Roadmap for Biofuels in Kenya Opportunities and Obstacles (www.bioenergywiki.net/.../Executive_Summary_Kenya_Biofuel_Roadmap.pdf)
Kenya Electricity Generating Company (2007): Annual Report 2007 (www.kengen.co.ke/AnnualReport.aspx?Status=1)
Kenya National Bureau of Statistics – KNBS (2007): Leading Economic Indicators (www.knbs.or.ke / > Leading Economic Indicators 2006–2007)
Kenya National Bureau of Statistics – KNBS (2009): Economic Survey 2009 Highlights, (www.knbs.or.ke / > Economic Survey)
Kenya Power and Lighting Company – KPLC (2007): Annual Report 2007 (www.kplc.co.ke/displayPageInside.asp?level_three_title_id=35&top_level_id=4&level_two_title_id=15)
Kenya Revenue Authority (2009): Domestic Taxes and Customer Service (www.kra.go.ke/customs/customsdownloads.php)
Meseret Teklemariam (2006): Overview of Geothermal Resource Utilization and Potential in East African Rift System. Presentation at the First International Conference on geothermal in the East African Rift Region, November 24-26, 2006, www.bgr.de/GEOTHERM/ArGeoC1/pdf /13 %20 %20M. %20Teklemariam %20Overview %20o-f %20geothermal %20resource %20utilization.pdf), Addis Abbeba
Ministry of Energy ¬– MoE (2002): Study on Kenya’s Energy Demand, Supply and Policy Strategy for House-holds, Small Scale Industries and Service Establishments
Ministry of Energy – MoE (2004): National Energy Policy of Kenya (www.energy.go.ke/)
Ministry of Energy – MoE (2004): Sessional Paper No. 4 on Energy
Ministry of Energy – MoE (2006): Geothermal Potential in Kenya
Ministry of Energy – MoE (2007): Annual Report 2007 (www.energy.go.ke/)
Ministry of Energy – MoE (2007): Kenya’s Least Cost Power Development Plan 2008–2080
Ministry of Energy (MoE) 2008. Geo-exploration depart-ment – Geothermal Potential in Kenya (www.energy.go.ke/geothermalnew.php)
Muriithi / Ministry of Energy – MoE (2006): Developing Small Hydro Power Infrastructure in Kenya (www.inshp.org/conclusion/apr2006/Develop-ing %20Small %20Hydro power %20Infrastructure %2-0in %20Kenya.pdf)
National Economic & Social Council of Kenya (2008): Kenya’s Vision 2030 (www.nesc.go.ke/News&Events/KenyaVision 2030Intro.htm)
Parliament of Kenya (2006): Energy Act 2006, (www.erc.go.ke/energy.pdf)
Practical Action East Africa: Microhydro in Kenya (http://practicalaction.org/?id=micro_hydrowww.practica-laction.org)
Secretariat of the African, Caribbean and Pacific Group of States – ACP (2000): The Cotonou Agreement (www.acpsec.org/en/conventions/cotonou/accord1.htm)
Solarnet (2009): Various publications (www.solarnet-ea.org/docs/publications.htm)
United Nations Environment Program – UNEP (2008): SWERA Report (http://swera.unep.net)
Websites Green Africa Foundation (www.greenafricafoundation.org)
Better Globe Group (www.betterglobegroup.com) Kenya Revenue Authority (www.kra.go.ke) Transparency International – TR, Kenya (www.tikenya.org/)

Renewable Energies in East Africa 53ANNEX
KENYA
Source: Depha, as of 2009
7.1 COUNTRY MAP
7 ANNEX

Renewable Energies in East Africa 54ANNEX
KENYA
Source: unknown
7.2 MAP OF THE NATIONAL GRID SYSTEM

Renewable Energies in East Africa 55ANNEX
KENYA
Source: UNEP, as of 2008
7.3 MAP OF WIND ENERGY SOURCES IN KENYA

Renewable Energies in East Africa 56ANNEX
KENYA
Source: UNEP, as of 2008
7.4 SOLAR RADIATION OF KENYA

Renewable Energies in East Africa 57ANNEX
KENYA
Source: Depha, as of 2009
7.5 MAPS OF HYDRO POWER SOURCES (MAJOR RIVERS) IN KENYA

Renewable Energies in East Africa 58ANNEX
KENYA
Source: Meseret Teklemariam, as of 2006
7.6 MAP OF GEOTHERMAL SOURCES IN KENYA
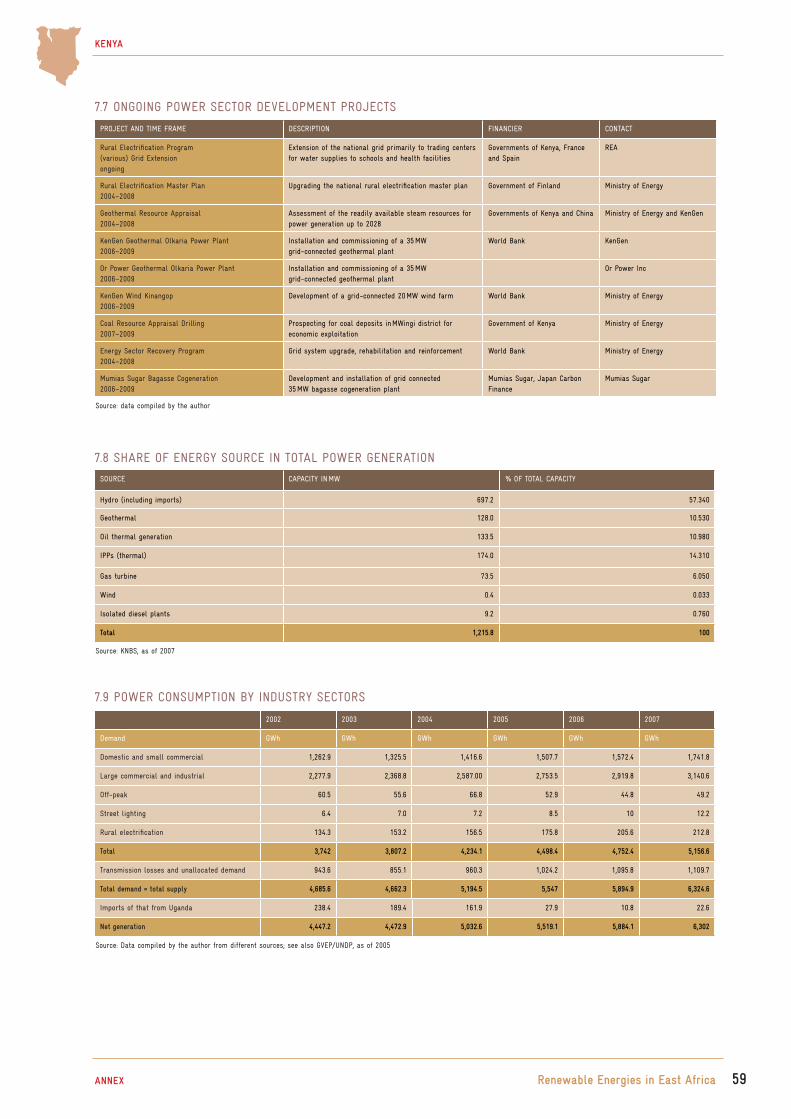
Renewable Energies in East Africa 59ANNEX
KENYA
7.7 ONGOING POWER SECTOR DEVELOPMENT PROJECTS
Source: data compiled by the author
PROJECT AND TIME FRAME DESCRIPTION FINANCIER CONTACT
Rural Electrification Program (various) Grid Extensionongoing
Extension of the national grid primarily to trading centers for water supplies to schools and health facilities
Governments of Kenya, France and Spain
REA
Rural Electrification Master Plan2004–2008
Upgrading the national rural electrification master plan Government of Finland Ministry of Energy
Geothermal Resource Appraisal2004–2008
Assessment of the readily available steam resources for power generation up to 2028
Governments of Kenya and China Ministry of Energy and KenGen
KenGen Geothermal Olkaria Power Plant2006–2009
Installation and commissioning of a 35 MW grid-connected geothermal plant
World Bank KenGen
Or Power Geothermal Olkaria Power Plant2006–2009
Installation and commissioning of a 35 MW grid-connected geothermal plant
Or Power Inc
KenGen Wind Kinangop2006–2009
Development of a grid-connected 20 MW wind farm World Bank Ministry of Energy
Coal Resource Appraisal Drilling 2007–2009
Prospecting for coal deposits in MWingi district for economic exploitation
Government of Kenya Ministry of Energy
Energy Sector Recovery Program 2004–2008
Grid system upgrade, rehabilitation and reinforcement World Bank Ministry of Energy
Mumias Sugar Bagasse Cogeneration 2006–2009
Development and installation of grid connected 35 MW bagasse cogeneration plant
Mumias Sugar, Japan Carbon Finance
Mumias Sugar
7.9 POWER CONSUMPTION BY INDUSTRY SECTORS
2002 2003 2004 2005 2006 2007
Demand GWh GWh GWh GWh GWh GWh
Domestic and small commercial 1,262.9 1,325.5 1,416.6 1,507.7 1,572.4 1,741.8
Large commercial and industrial 2,277.9 2,368.8 2,587.00 2,753.5 2,919.8 3,140.6
Off-peak 60.5 55.6 66.8 52.9 44.8 49.2
Street lighting 6.4 7.0 7.2 8.5 10 12.2
Rural electrification 134.3 153.2 156.5 175.8 205.6 212.8
Total 3,742 3,807.2 4,234.1 4,498.4 4,752.4 5,156.6
Transmission losses and unallocated demand 943.6 855.1 960.3 1,024.2 1,095.8 1,109.7
Total demand = total supply 4,685.6 4,662.3 5,194.5 5,547 5,894.9 6,324.6
Imports of that from Uganda 238.4 189.4 161.9 27.9 10.8 22.6
Net generation 4,447.2 4,472.9 5,032.6 5,519.1 5,884.1 6,302
Source: Data compiled by the author from different sources; see also GVEP/UNDP, as of 2005
7.8 SHARE OF ENERGY SOURCE IN TOTAL POWER GENERATION
Source: KNBS, as of 2007
SOURCE CAPACITY IN MW % OF TOTAL CAPACITY
Hydro (including imports) 697.2 57.340
Geothermal 128.0 10.530
Oil thermal generation 133.5 10.980
IPPs (thermal) 174.0 14.310
Gas turbine 73.5 6.050
Wind 0.4 0.033
Isolated diesel plants 9.2 0.760
Total 1,215.8 100

Renewable Energies in East Africa 60ANNEX
KENYA
7.10 POWER TARIFFS FOR PRIVATE AND INDUSTRIAL USERS
Note: Schedule of Retail Electricity Tariffs and Rates (effective as of 1July 2008)Source: Electricity Regulatory Board, as of 2005
TARIFF TYPE OF CUSTOMER SUPPLY VOLTAGE (V) CONSUMPTION (kWh/MONTH)
FIXED CHARGE (KES/MONTH)
ENERGY CHARGE(KES/kWh)
DEMAND CHARGE(KES/kVA/MONTH)
DC Domestic consumers 240 or 415 0–50 120.00 2.00 –
51–1,500 8.10
> 1,500 18.57
SC Small commercial 240 or 415 ≤ 15,000 120.00 8.96 –
CI1 415–3 phase > 15,000 800.00 5.75 600.00
CI2 Commercial / industrial 11,000 No limit 2,500.00 4.73 400.00
CI3 33,000 / 40,000 2,900.00 4.49 200.00
CI4 66,000 4,200.00 4.25 170.00
CI5 132,000 11,000.00 4.10 170.00
IT Interruptible off-peak supplies
240 or 415 ≤ 15,000 240.00 when used with DC or SC
4.85 –
SL Street lighting 240 – 120.00 7.50 –

61
RWANDA
Renewable Energies in East Africa
COUNTRY CHAPTER:
RWANDA Author of Country Chapter Emmanuel Kanigwa (MSc. Eng.) Coordination and Review of the Country ChapterDipl. Phys. Rafael WiesePSE AGFreiburg, Germanywww.pse.de
Editor Deutsche Gesellschaft für Technische Zusammenarbeit (GTZ) GmbHDepartment Water, Energy, TransportDag-Hammarskjöld-Weg 1-565760 Eschborn, Germanywww.gtz.de
On behalf of Federal Ministry for Economic Cooperation and Development (BMZ)
Editorial staffDiana KraftTel: +49 (0)6196 79 4101Fax: +49 (0)6196 79 80 4101Email: [email protected]

62
RWANDA
Renewable Energies in East Africa
CONTENTS RWANDA
ACRONYMS, ABBREVIATIONS AND MEASUREMENTS 63
SUMMARY 65
1 COUNTRY INTRODUCTION 67 1.1 Rwanda Overview 67 1.2 Rwanda Statistics: Geography and Economics 67
2 ENERGY MARKET IN RWANDA 68 2.1 Energy Situation Overview 68 2.2 Energy Capacities, Production and Consumption 68 2.3 Electricity Prices 69 2.4 Market Actors for Planning, Regulation and Distribution 69
3 RENEWABLE ENERGY POLICY FRAMEWORK CONDITIONS 70 3.1 Policy and Renewable Energy Promotion Programs 70 4 STATUS AND FUTURE OUTLOOK FOR RENEWABLE ENERGIES 71 4.1 Biomass / Biogas 71 4.2 Solar Energy 72 4.3 Wind Power 72 4.4 Geothermal Power 72 4.5 Hydro Power 73 4.6 Methane Gas 73 4.7 Peat 74
5 RENEWABLE ENERGY BUSINESS INFORMATION AND CONTACTS 74 5.1 Renewable Energy Companies & Business Related Organisations 74 5.2 Local Institutions Related to Renewable Energy Business 77
6 BIBLIOGRAPHY 77
7 ANNEX 79
CONTENTS

63
RWANDA
ACRONYMS AND ABBREVIATIONS
RWANDA
AfDB African Development Bank
ACP African, Caribbean and Pacific Group of States
AKFED Agakhan Fund for Economic Development
ARED Association Rwandaise pour Énergie Durable (Rwandan Association for Sustainable Energy)
ARD Associates in Rural Development
ARIPO African Regional Intellectual Property Organization
ATI African Trade Insurance Agency
BADEA Banque Arabe de Développement Économique en Afrique (Arab Bank for Economic Development in Africa)
BGR Bundesanstalt für Geowissenschaften und Rohstoffe (Federal Institute for Geosciences and Natural Resources)
BRGM Bureau de Recherche Géologique et Minière (Bureau of Geological and Mining Research)
BTC Belgian Technical Cooperation
CDM Clean Development Mechanism
CEPGL Communauté Économique des Pays des Grands Lacs (Economic Community of the Countries of the Great Lakes)
CIF Cost Insurance and Freight
CITT Center for Innovation and Technology Transfer
COMESA Common Market for Eastern and Southern Africa
DED Deutscher Entwicklungsdienst (German Development Service)
DGIS Directoraat Generaal Internationale Samenwerking (Dutch Directorate General for International Cooperation)
DNA Designated National Authority
EAC East African Community
EDPRS Economic Development and Poverty Reduction Strategy
EU European Union
€ Euro
EXIM Export and Import Bank in India
F.O.B. Free On Board
GEF Global Environmental Facility
GDP Gross Domestic Product
GoR Government of Rwanda
GTZ Deutsche Gesellschaft für Technische Zusammenarbeit (German Technical Cooperation Agency)
HFO Heavy Fuel Oil
IDA International Development Agency
IFC International Finance Cooperation
IPA Industrial Promotion Agency
IPP Independent Power Producer
IRST Institut de Recherche Scientifique et Technologique (Institute of Scientific and Technological Research)
KenGen Kenya Generating Company
KIST Kigali Institute of Science and Technology
KP1 Kibuye Project 1
MIGA Multilateral Investment Guarantee
MINAGRI Ministry of Agriculture
MINALOC Ministère d’Affaires Locales (Ministry of Local Governments)
MINECOFIN Ministère d’Économie et de Finances (Ministry of Finance and Economic Planning)
MINICOM Ministry of Commerce
MININFRA Ministry of Infrastructure
MINITER Ministère des Terres, de l’Environnement, des Forêts, de l’Eau et des Mines (Ministry of Lands, Environment,
Forests, Water and Mines)
MoU Memorandum of Understanding
NDBP National Domestic Biogas Program
NEDA National Energy Development Agency
NEPAD New Partnership for Africa’s Development
NTB National Tender Board
NUR National University of Rwanda
OGMR Office of Geology and Mines in Rwanda
OPEC Oil Producing and Exporting Countries
ACRONYMS, ABBREVIATIONS AND MEASUREMENTS Renewable Energies in East Africa
64
RWANDA
Renewable Energies in East Africa
PPP Private-Public Partnership
PV Photovoltaic
RE Renewable Energy
RIEPA Rwanda Investment and Export Promotion Agency
RURA Rwanda Utilities Regulatory Agency
RIG Rwanda Investment Group
RRA Rwanda Revenue Authority
RWF Ruanda Franc
SINELAC Société Internationale d’Électricité de Pays du Grand Lacs
(International Electric Society of the Countries ofthe Great Lakes)
UPEGAZ Unité de Promotion et d’Exploitation du Gaz Méthane
(Association for the Promotion and Exploitation of Methane Gas)
UNIDO United Nations Industrial Development Organization
USTDA US Trade and Development Agency
SLF Solar Electric Light Fund
SNEL Société Nationale d’Électricité (National Electricity Company)
SNV Stichting Nederlandse Vrijwilligers (Netherlands Development Organization)
UNDP United Nations Development Program
USAID United States Agency for International Development
USD United States Dollar
VAT Value Added Tax
WB World Bank
WTO World Trade Organization
MEASUREMENTS
bbl barrel
cbm cubic meters
GWh gigawatt hour
km² square kilometer
KW kilowatt
kWp kilowatt-peak
l liter
m meter
ACRONYMS, ABBREVIATIONS AND MEASUREMENTS

65
RWANDA
Renewable Energies in East Africa
SUMMARY
ECONOMIC STATUS AND DEVELOPMENT OF RWANDARwanda has made substantial progress in stabilizing its econ-omy after it has managed to overcome the genocide in 1994. Over 40 % of the population, however, live below poverty line. The GDP per capita is 250 USD, the economic growth has been stable since the year 2000 with an average rate of 5 % per year (with higher rates claimed over the last years) mainly driven by construction and agriculture. Coffee and tea are the central products in Rwanda’s economy, accounting for nearly two-thirds of the export value. Tourism is another important source of foreign income. The Government of Rwanda (GoR) remains committed to a strong and enduring economic cli-mate for the creation of a favorable investment conditions as proclaimed in its Vision 2020 with the issue of ‘Development of Entrepreneurship and the Private Sector‘ as one of its cen-tral objectives.1
STRUCTURE OF ENERGY SUPPLY IN RWANDAThe population still relies on biomass like wood, animal waste and crop residues as its primary energy source (85 %) used mainly for cooking. Commercial energy resources include hy-dro power, oil-fired thermal power stations and methane gas from lake Kivu.
Oil Rwanda‘s oil consumption averaged about 5,300 barrels per day (bbl/day) in 2007, which is almost all imported through the port of Mombasa, Kenya. Kerosene is used extensively in rural areas for lighting and, to some extent in urban areas, for cooking and lighting.
Electricity A national average of 6 % of the population is connected to the national grid, mainly in Kigali and other cities, only 1 % of the rural population uses electricity. Power stations in Rwanda produced 54 MW in 2007, of which 30 MW came from thermal oil-fired power stations and 24 MW from hydro electricity. Rwanda’s electricity consumption was 210 GWh, only 138 GWh were produced within the country (hydro and diesel power). 69 GWh was imported from Rusizi I power plant (Congo) as well as from Rusizi II (Uganda).
Rwanda’s Government is committed to diversify the country‘s sources of energy, and a number of large investments are underway (e. g. the Nyaborongo Hydro Power Dam of 27,5 MW, other small micro hydro power and lake Kivu meth-ane plants with an estimated 250 MW to be installed over the coming years. The country‘s electricity supply has been erratic in the early years of the decade because of the national grid‘s heavy reliance on hydroelectric power, which in turn depends on rainfall. In the past years, poor rainfall caused several elec-tricity shortages. Ongoing high transmission losses of around 25 % deteriorate the country‘s electricity supply.2 Currently, however, the electricity supply is stable due to the installation of diesel-powered generators.
Natural Gas Rwanda has proven natural gas reserves identified as methane in the Lake Kivu waters. Currently, 4,5 MW of electricity are generated in a pilot plant in the vicinity of Gisenyi. Other projects are underway for the expanded exploitation and use of this resource, one of them being operated by the Rwanda Investment Group (RIG) with a concession of 3.5 MW for a pilot project. The US-based Contour Global Group has a concession of 100 MW and construction has started to put the first 25 MW in operation by late 2010. The reserves of methane gas deposits in Lake Kivu are estimated be sufficient for 350 MW of electricity power and other uses for a period of up to 50 years. Similar reserves are available for the DR Congo with whom Rwanda is sharing the lake Kivu.3
STATUS OF RENEWABLE ENERGIES IN RWANDA
Biogas The National Domestic Biogas Program (NDBP) aims to in-stall at least 15,000 biogas digesters in rural households to provide sufficient energy for cooking and lighting. So far, over 300 biogas digesters have been installed in rural households.Biogas has also been used in prisons and schools where it is produced with waste from the latrines. Rwanda has even gained international recognition for its achievement, which has reduced the cost of cooking in prisons by 40 %. The Gov-ernment is now considering the expansion of this technology to more schools and hospitals.
Solar Africa’s so far largest grid-connected solar plant of Kigali Solaire is in operation at Mount Jali on the outskirts of Ki-gali. It has been constructed by the Ministry of Infrastructure with the support of the German utility of Stadtwerke Mainz and the German company of Juwi. The first phase of the project was started in June 2007. Through the solar plant, the Stadtwerke Mainz as an Independent Power Producer (IPP) currently feeds 250 kWp into the grid (from June 2007 to April 2009 production of 626,010 kWh) and is planning to expand to a capacity of 1 MWp.
PV systems have been implemented in recent decades by local and international organizations for the electrification of churches, schools and households in rural areas. Starting in 2009, the EU will contribute 10 million € for the sup-port of solar and hydro power rural electrification projects through funds from the ACP-EU Energy Facility.4
1 SEE MINECOFIN, AS OF 2000
2 SEE POVERTY ENVIRONMENT INITIATIVE RWANDA, AS OF 2006
3 SEE REPUBLIC OF RWANDA, AS OF 2009
4 FOR MORE INFORMATION ON THE ACP-EU ENERGY FACILITY SEE WEBSITE
(HTTP://EC.EUROPA.EU/EUROPEAID/WHERE/ACP/REGIONAL-COOPERATION/ENERGY/
INDEX_EN.HTM)
SUMMARY

66
RWANDA
Renewable Energies in East Africa
Hydro Several large hydro power projects are underway through in-ternational cooperation. 21 micro hydro power stations in vari-ous places are under construction and are expected to generate 10 MW in 2009. An additional 300 sites have been identified for the construction of micro hydro power stations. The con-struction of the 27,5 MW Nyaborongo dam has started early 2009 and the project is expected to be in operation by the end of 2012. Pre-feasibility studies are underway for a number of large projects with a total capacity of around 400 MW at the Ruzizi and Akagera rivers, which are shared with neighboring countries.
Wind Wind energy has not yet been given priority in Rwanda be-cause of the lack of detailed and reliable information on wind regimes and potential exploitation sites. A wind atlas has to be developed which requires detailed meteorological meas-urements5. A wind survey will be carried out in 2009/10 in selected locations.
Geothermal The exploitation of the geothermal potential is in its prelimi-nary stage. Studies and prospects have estimated a potential of 170–300 MW 6. Since June 2007, the German Federal Insti-tute for Geosciences and Natural Resources (BGR) has been assessing the geothermal potential.
Methane 55 billion cubic meters of methane are trapped at the bot-tom of Lake Kivu, roughly equivalent to 275 million barrels of oil. A pilot project of extraction started in 2008 to pump methane gas from a rig to a small on-shore power plant. Next steps will include projects with private investors for up to 250 MW of electric power. The Government is also looking at the opportunities to convert gas into liquid for transport and is cooperating with a South African investment group for this purpose.
CDM Rwanda is a signatory to Clean Development Mechanism (CDM) and has therefore created a Designated National Authority (DNA). A permanent secretariat has identified a number of projects, e. g. energy saving lamps, hydro power, biogas, methane gas, solar for water purification, voluntary credits for reforestation etc.
5 ALSO SEE REPUBLIC OF RWANDA, 2009
6 SEE MININFRA, 2009
SUMMARY

67COUNTRY INTRODUCTION
RWANDA
Renewable Energies in East Africa
1 COUNTRY INTRODUCTION
1.1 RWANDA OVERVIEWRwanda is a landlocked nation of rich culture and great natu-ral beauty. The country is situated in central Africa bordered by Uganda, Tanzania, Burundi and the Democratic Republic of Congo. The Republic of Rwanda comprises Kigali City and four provinces (North, East, South and West). The country is mainly rural with about 90 % of the population engaged in mainly subsistence agriculture. It is the most densely popu-lated country in Africa with few natural resources, minimal industry and coffee and tea as the primary foreign exchange earners. Over 40 % of the population live in poverty with less than 1 USD per day.
The 1994 genocide decimated Rwanda‘s fragile economic base. However, Rwanda has made substantial progress in stabiliz-ing and rehabilitating its economy to pre-1994 levels. Gross Domestic Product (GDP) has rebounded and inflation has been curbed. The Government has embraced an expansion-ary fiscal policy to reduce poverty by improving education, infrastructure, foreign and domestic investment and pursuing market-oriented reforms, although energy shortages, instabil-ity in neighboring states and lack of adequate transportation linkages to other countries continue to handicap growth.
LAND AREA: 26,340 square kilometers
POPULATION: 9.7 million (as of 2007), growth rate 2.35 %
DENSITY: 369 inhabitants/km² (as of 2007)
CLIMATE: Two rainy seasons (February–April, November–January), mild in mountains with frost and snow
AVERAGE TEMPERATURE: 24.6–27.6º C (hottest months: August–September)
ALTITUDE From 1,000–4,500 m above sea level, highest point is Karisimbi volcano (4,507 m)
MAIN WATER BODIES: Lake Kivu, Lake Muhazi, Lake Ihema, Lake Bulera, Lake Ruhondo, Lake Mugesera
VEGETATION Ranges from dense equatorial forest in the North West of the country to tropical savannah in the East
GDP PER CAPITA (AT PURCHASING POWER PARITY)
813 USD (as of 2007)
INFLATION RATE: 8 % (as of 2007)
AGRICULTURE: Coffee, tea, pyrethrum (insecticide made from chrysanthemums), bananas, beans, sorghum, potatoes, livestock
INDUSTRIES: Cement, agricultural products, small-scale beverages, soap, furniture, shoes, plastic goods, textiles, cigarettes
ELECTRICITY – PRODUCTION: 138.79 million kWh (as of 2007)
ELECTRICITY – CONSUMPTION: 210.13 million kWh (as of 2007)
ELECTRIFICATION RATE: 6 % (urban 35 %, rural 1 %; as of 2007/2008)
OIL – PRODUCTION: 0 bbl/day (as of 2007)
OIL – CONSUMPTION: 5,300 bbl/day (as of 2005)
OIL – PROVEN RESERVES: 0 bbl/day (as of 2007)
NATURAL GAS – PRODUCTION: 0 bbl/day (as of 2006)
NATURAL GAS – PROVEN RESERVES:
54.32 billion cubic meters (as of 2006)
EXPORTS: 170.8 million USD F.O.B. (as of 2007)
EXPORTS – COMMODITIES: Coffee, tea, hides, tin ore
EXPORTS – PARTNERS: China (10.3 %), Germany (9.7 %), USA (4.3 %) (as of 2006)
IMPORTS: 472.5 million USD F. O. B. (as of 2007)
IMPORTS – COMMODITIES: Food, machinery and equipment, steel, petroleum products, cement and construction material
IMPORTS – PARTNERS: Kenya (19.6 %), Germany (7.9 %), Uganda (6.8 %), Belgium (5.1 %) (as of 2006)
EXCHANGE RATE: 1 RWF = 0,00126 € (as of 2009)
1.2 RWANDA STATISTICS: GEOGRAPHY AND ECONOMICS
Source: data compiled by the author from different sources, e.g. CIA, as of 2009

68COUNTRY INTRODUCTION
RWANDA
Renewable Energies in East Africa
2 ENERGY MARKET IN RWANDA
2.1 ENERGY SITUATION OVERVIEWRwanda’s demand for energy has grown rapidly by 25 % per year due to population growth and the increase in econom-ic activities. Biomass accounts for 95 % of the total energy consumed and only 70.000 households (about 5 %) are con-nected to grid power. The electricity consumed in Rwanda has changed from almost entirely hydro-generated to largely thermal-generated at present. This has been a result of a high demand for electricity and unexpectedly low reservoir levels. The shares of the total primary energy consumption are shown below. It is obvious that the commercial energy sources con-tribute only 5 % to the total primary energy supply, for exam-ple electricity 0.6 %.
2.2 ENERGY CAPACITIES, PRODUCTION AND CONSUMPTION
The UNDP Human Development Report stated Rwanda’s electricity consumption per capita and year as 31 kWh.7 This figure was crosschecked by dividing the electricity produc-tion of 138 million kWh through 8.6 million inhabitants. On average, the per capita electricity consumption in Rwanda is 19,5 kWh (for 2005; for comparison: Germany has 7,442 kWh per capita per year).
Table 2 shows the electricity production by hydro power and thermal oil power stations.
In 2007, local hydro power stations produced 27.32 GWh and thermal oil-fired power stations 111.47 GWh. This results in 138.79 GWh in total. Another 69.34 GWh were imported. A more detailed table showing all power sta-tions of Rwanda can be found in annex 8.4 (Share of Local and Imported Energy Sources).
FIGURE 1
Shares of Total Primary Energy Consumption
TABLE 2
Electricity Sources, Capacities and Net Generation
Source: ELECTROGAZ, Electricity Department, as of 2007
TYPE OF ENERGY SOURCE
2002 2003 2004 2005 2006 2007
Cap.(MW)
Net Gener. (GWh)
Cap.(MW)
Net Gener. (GWh)
Cap.(MW)
Net Gener. (GWh)
Cap.(MW)
Net Gener. (GWh)
Cap.(MW)
Net Gener. (GWh)
Cap.(MW)
Net Gener. (GWh)
Hydro Power- of that
Local 24.44 233.90 24.44 117.64 24.44 84.32 24.44 65.73 24.44 41.17 24.44 27.32
Imports 135.69 120.92 115.81 89.05 90.02 69.34
Hydro Power total 24.44 233.90 24.44 238.56 24.44 200.13 24.44 154.78 24.22 121.19 24.44 96.66
Thermal power (oil) 2.00 0.00 2.00 0.00 14.57 6.25 24.57 50.14 29.57 127.40 29.57 111.47
Solar PV 0.00 0.00 0.00 0.00 0.00 2.00
Total capacity 26.44 26.44 39.01 49.01 54.01 54.01
Total power generated 233.90 238.56 238.21 204.92 248.59 210.13
100
80
60
40
20
0Biomass Petroleum
products Charcoal Electricty Other
Source: UNIDO, 2002, graph PSE AG
7 SEE UNDP, 2008

69COUNTRY INTRODUCTION
RWANDA
Renewable Energies in East Africa
2.3 ENERGY PRICESElectricity prices in Rwanda are one the highest amongst all East African countries with around 14 Eurocent/kWh, as shown table 3.
With the exception of kerosene, prices of all other pe-troleum products have been fluctuating since January 2007 and are heavily taxed although the Government sometimes reduces taxation to stabilize prices. Table 4 shows the trend of price from January 2007 to February 2008.
2.4 MARKET ACTORS FOR ENERGY PLANNING, REGULATIONS AND DISTRIBUTION
MININFRA The overall governance of the energy sector is in the respon-sibility of the Ministry of Infrastructure (MININFRA). The Department of Energy supervises the implementation of the energy policy, which is the main guidance for change, backed by legislation and regulation.
ELECTROGAZ While the ministry is responsible for policy, the public util-ity company of ELECTROGAZ (entirely owned by the Gov-ernment of Rwanda) offers electricity services. The Govern-ment has assigned the monopoly to produce and distribute electricity to ELECTROGAZ. It is currently in the process of restructuring ELECTROGAZ to increase private sector involvement in an attempt to improve managerial and opera-tional performance.
RURA Rwanda Utilities Regulatory Authority (RURA) was estab-lished in 2001 for the regulation of certain public utilities including those providing for energy. The regulatory author-ity promulgates rules to establish licenses and tariffs and dis-patches preferences for indigenous and foreign Renewable Energy (RE) producers of electricity in their production, transmission, distribution, system operation and international trade activities.
RIEPA The Rwanda Investment and Export Promotion Agency (RIEPA)8 has a mandate to promote investment opportuni-ties with local and foreign investors, to facilitate the estab-lishment and smooth operation of investor projects and the business development and export production. It also advises the Government on additional policies and initiatives needed to encourage and support investment in the country.
TABLE 3
Energy Prices in Rwanda
Source: MINICOM, as of 2007
ELECTRICITY (RWF/KWH) PREMIUM (RWF/L) GASOIL (RWF/L) KEROSENE (RWF/L)
Private Industrial Private Industrial Private Industrial Private Industrial
123 105 726 726 726 726 623 623
JAN FEB MAR APR MAY JUN JUL AUG SEP OCT NOV DEC JAN FEB
Petrol Price RFW 607 607 607 607 607 617 617 617 617 617 637 684 726 726
Subsidies (reduced taxes)
61 47 58 72 86 90 90 89 88 85 83 81 90 80
Diesel Price RFW 595 595 595 595 595 605 605 605 605 605 620 677 726 726
Subsidies(reduced taxes)
72 62 70 74 89 87 89 93 94 96 99 99 91 90
TABLE 4
Increasing Fuel Prices in Rwanda 2007–2008
Source: MINICOM, as of 2008
8 SEE WEBSITE OF RWANDA INVESTMENT AND EXPORT PROMOTION AGENCY - RIEPA
(WWW.RWANDAINVEST.COM)

70COUNTRY INTRODUCTION
RWANDA
Renewable Energies in East Africa
3 RENEWABLE ENERGY POLICY FRAMEWORK CONDITIONS
According to the East African Community (EAC) Develop-ment Strategy (2006–2010)9, only a small percentage of the EAC region specifically provides support for medium-term investments in the energy sector. Each country is compiling a detailed inventory of all RE technologies to be submitted to the EAC Secretariat for the integration in a regional inven-tory. Based on that the EAC region plans to develop standards and codes of practice on RE technologies.
3.1 POLICY AND RENEWABLE ENERGY PROMOTION PROGRAMS
The following regulations in Rwanda are in place:
Law on Investment:A new Law on Investment and Export Promotion and Fa-cilitation (No. 26/2005)10, which came into force in March 2006, is intended to assist investors in obtaining the necessary license and other activities. The principal features of the law include the following:
The law distinguishes between foreign and local investors and specifies that foreign investors qualify for an invest-ment certificate with an investment of 250,000 USD and local investors with an investment of 100,000 USD.
The law provides for free economic zones of three kinds: export-processing zones, single-export processing zones and free trade zones.
The provisions for fiscal incentives have been shifted to the new Law of Customs and the new Law of Income Tax, but were maintained as annexes to the Investment Law for ease of reference.
The law provides special non-fiscal incentives for investors who invest 500,000 USD in one step. These include perma-nent residence, citizenship and access to land.
RIEPA is required to make and communicate its decision regarding an investment certificate within 10 working days after receiving a complete application. Should RIEPA fail to act within 10 days, the investor may complain to the Minister of Commerce (MINICOM) who is in turn required to investigate the matter and communicate the result within five working days.
The law states that the holder of an investment certificate, amongst other benefits, is entitled to free residence and work permits for three members of the certificate holder’s management or technical staff, valid for one year and reus-able to the same or different persons.
Value Added Tax (VAT) on imported capital goods and raw material is subject to zero-rated tariffs. In contrast, a flat tax of 5 % on imported capital goods and raw materials - in lieu of all other duties (tariffs, excise and VAT) is not subject to zero-rated tariffs. Further conditions are that upon application for each transaction, an accelerated rate of depreciation of 40 % in the first year is available, if the
asset is held for the minimum of four years, increasing to 50 % for investments located outside Kigali or in one of the 10 priority sector. These regulations are specified by the 2005 Law on Investment and Export Promotion and Facilitation.
There are no special import conditions for RE products. Law No. 54 (as of 2006) – modifying and the complementing law No. 21 (as of 2006)11 which establishes the customs system – stipulates that capital goods, equipment, raw materials and imported goods by an investor in a free trade zone shall be relieved from customs duties when imported by an investor registered under the investment agency (RIEPA).
There are no clear legal guidelines for electricity pro-duction and feed-in tariffs into the power grid for RE or other sources. There is no separate incentive package for investors in RE or any special support program for RE investment.
At the end of 2008, the EU contributed 10 million € supporting solar and hydro power rural electrification projects through funds from the ACP-EU Energy Facility. The GoR has developed a five-year development plan to improve en-ergy access and rural development. The European Union is supporting Rwanda in achieving these objectives by financing half of this energy program. The program targets areas of the country beyond the reach of the national electricity network and will provide electricity primarily via solar PV systems to some 25 % of the currently non-electrified institutions such as health centers, schools and public offices, covering 350 in-stitutions in 150 of Rwanda‘s 419 sectors. In addition, micro hydro electricity plants will be installed at various sites serv-ing up to 70 villages (Umudugu) giving access to electricity to some 15,000 households. The program will support decen-tralization of education, health, water supply, telecommunica-tion and general administration functions. It is designed as a Private-Public Partnership (PPP), as the micro hydroelectric plants will be financed, constructed, managed and main-tained by private firms, thus leading to the promotion of the private sector and the creation of many new off-farm jobs in rural areas.12
SHORT BUSINESS INFOZero VAT on imported capital goods and raw materialNo feed-in tariff for RE electricity19 different projects planned in hydro, biogas, solar, geothermal10 Mio € for ACP-EU project on hydro and solar energy in rural areas
There are several reconstruction and development projects in the energy sector planned and/or under implementation, which are shown in the following table:
9 SEE EAC, 2006
10 SEE REPUBLIC OF RWANDA, AS OF 2005
11 SEE REPUBLIC OF RWANDA, AS OF 2006
12 FOR RECENT DEVELOPMENTS ON THE PROGRAM SEE WEBSITE OF MININFRA (WWW.
MININFRA.GOV.RW)

71COUNTRY INTRODUCTION
RWANDA
Renewable Energies in East Africa
4 STATUS AND FUTURE OUTLOOK FOR RENEWABLE ENERGIES
RE energy sources in Rwanda are less or even non-exploited. The Rwanda Government has given strong emphasis on the development of hydro power. Due to rising oil prices and the currently high electricity prices, the development of RE power supply can be financially viable within the near future.13
4.1 BIOMASS/BIOGASFirewood is clearly the main source of energy for cooking in Rwanda and is being used by more than 80 % of the house-holds. The other sources of energy used for cooking include charcoal (over 5 %) and other vegetal materials. Even in Ki-gali City, some 65 % of the households are using charcoal and around 25 % wood for cooking. This underlines the dominant role of biomass as a major energy source in Rwanda.
Households with two or more cows have the potential for a small biogas plant. A significant national domestic biogas program has been launched, staff has been recruited and funds have been made available by GoR. The program is especially viable because the national zero grazing policy makes the cow dung available close to the household.
On top of that, the one-cow-per-family program will enable more people to actually benefit from the biogas pro-gram. So far, 350 biogas digesters have already been installed in households . These digesters are built by local craftsmen with the support of the Center for Innovation and Technology Transfer (CITT) of the Kigali Institute of Science and Tech-nology and Management (KIST). Most of the digesters are made from stones and cement. There is also a pilot test phase for digesters made of fiberglass with help of Chinese engineers in Kirehe district. By December 2011, the project is aiming to install 15,000 biogas systems for cooking and lighting.Biogas plants using human feces are in operation in six prisons
PROGRAM RE TECHNOLOGY FINANCING PARTNERS COST IN RWF STATUS
Construction of the 3 micro hydro power stations Keya,Nkora and Cyimbili (1.6 MW)
Micro hydro Belgian Technical Cooperation (BTC) 1,185,740,158 Under construction
Study and construction of micro electric stations in Kibuye and Cyangugu Region
Micro hydro Belgian Technical Cooperation (BTC) 789,419,400 Planned (there is no tender body because the project is still under planning)
Construction of 8 micro hydro power stations (total capacity: 6.7 MW)
Micro hydro GoR 1,500,000,000 Under construction by the Sri-Lankan company of Hydro Power Internatio-nal Ltd.
Construction of hydroelectric power station at Rukarara (9.5 MW)
Hydro GoR 1,000,000,000 Under construction by Eco Power Global Ltd.
Construction of hydroelectric power station at Nyabarongo (27.5 MW)
Hydro GoR (through a grant) 4,725,776,000 Started
Construction of 6 hydro power stations (1.5 MW) Hydro Private Sector Participation (Rwandan Companies) with GTZ (financed by BMZ/ DGIS)
531,000,000 Under construction
Rehabilitation of 3 micro hydro power stations (Gihira, Mukungwa, Gisenyi)
Micro hydro Loan from BADEA/ OPEC and GoR 1,092,470,012 Feasibility has been advertised
Urgent electricity rehabilitation project for transmis-sion and distribution (20 MW)
/ GoR, IDA, Norwegian Fund 7,016,883,340 Under construction
Geothermal resource assessment Geothermal GoR and BGR 300,000,000 Ongoing
Rural energy facility / GoR and Grants 220,000,000 Planned (contact: MININFRA)
Electrification by solar Solar BTC 161,106,000 Planned (contact: MININFRA)
Network line for micro hydro power stations of 20 KW (Cyimbiri, Funda, Nkora)
Hydro BTC 513,391,120
Rehabilitation of Gikondo and urgent electrical material
/ GoR 270,000,000 Planned
Umutara rural electrification by solar energy Solar GoR 500,000,000 Planned (there is no tender body as the project is still under planning; contact: MININFRA)
Elaboration and study of electricity tariffs / GoR 55,000,000 Planned (contact: MININFRA)
Setting up of control system for stability of Lake Kivu
/ Grants 300,083,000 Planned (contact: MININFRA)
Project to substitute wood and wood/coal use in families by biogas
Biogas GoR, SNV, GTZ, SNV, DGIS 397,000,000 Being implemented
Project to substitute wood and wood/coal based stoves by improved stoves
Improved stoves GoR 332,000,000 Being implemented
TABLE 5
Planned and Implemented Energy Projects in Rwanda
Source: compiled by the author from various data sources
13 FOR A GENERAL CURRENT OVERVIEW SEE WEBSITE OF MININFRA, 2009

72COUNTRY INTRODUCTION
RWANDA
Renewable Energies in East Africa
with 30,000 inmates. KIST is expected to install three more plants every year.
Other players in the sector include SAM Muhiima, a community-based organization, which collects, sorts and processes garbage for high-quality biomass fuel briquettes for household (for cooking) and industrial use (to run engines and produce electricity). This project is financed by USAID through Associates in Rural Development Inc (ARD).
SHORT BUSINESS INFO95 % of primary energy source is „non-commercial“ bio-mass.NEDA facilitates a national domestic biogas plant pro-gram targeting implementation in 15,000 households by 2011.Biogas plants are used in prisons.
4.2 SOLAR ENERGYRwanda has favorable irradiation conditions of 5.15 kWh/m2 per day14, but the use of solar energy is still very limited. In Rwanda, solar energy has been exploited in recent decades by local and international organizations for the electrification of churches, schools and households in rural areas. However, the low income situation and the resulting high costs of so-lar systems have been a barrier to widespread dissemination until now . The Government has been able to attract efficient partners including the European Union (EU), the Belgian Technical Cooperation (BTC), the Global Environmental Fa-cility (GEF) and the United States Agency for International Development (USAID).
The GoR through the Ministry of Infrastructure (MININFRA) and with the support of Stadtwerke Mainz15
was able to inaugurate the first phase of a solar power genera-tion project in June 2007. The Kigali Solaire Plant is located on Mount Jali at the outskirts of the city and is currently feed-ing 250 kWp into the grid, operated by Stadtwerke Mainz as IPP and constructed by German Juwi GmbH. It is so far the largest solar power plant known in Africa. Stadtwerke Mainz in cooperation with MININFRA is looking into ex-panding the plant to a capacity of 1 MWp. Technicians from ELECTROGAZ have already been trained to take care of the maintenance of this system. With mixed financing of BTC, GEF, EU, USAID and German Technical Cooperation Agen-cy (GTZ) on behalf of the German Government, 268 health centers, 500 schools and 200 administrative offices will be electrified with solar systems by 2010.
Stadtwerke Mainz is investing in 50 small-scale solar plants of 1 kW each for remote off-grid villages. The solar sys-tems will supply refrigeration for medicine in health centers and will provide light for schools. The Public-Private Partner-ship (PPP) project of Stadtwerke Mainz and GTZ on behalf of the German Development Cooperation guarantees the smooth operation of the solar systems. GTZ trains electricians from the various rural districts and the capital as solar technicians. The cooperation project also includes the establishment of a micro-financing system for solar start-up companies16.
The private sector, which has been more or less inactive so far, is eventually emerging and starting to participate. A number of players in both thermal and PV are setting themselves up and some have already started to offer these services in isolated cases. The MININFRA is keen to assist such private initiatives in staff capacity building and other promotional logistics.
Solar Electric Light Fund (SELF) has installed solar diesel hybrid systems for the communities of Mulindi, Ru-sumo, Rukira, Nyarabuye and Kirehe. SELF was approached by Columbia University’s Mailman School of Public Health to carry out the solar electrification of clinics run by the School’s International Center for AIDS Care and Treatment programs. Through this collaboration, there are now 15 ad-ditional health centers enjoying the benefits of a solar-diesel hybrid power station in the country’s North and West (4 kWp each), with a total capacity of 60 kWp.
Through the ACP-EU Energy Facility, solar PV sys-tems shall electrify 25 % of the currently non-electrified in-stitutions such as health centers, schools and public offices, covering 350 institutions in 150 of Rwanda‘s 419 sectors.
SHORT BUSINESS INFOThe 250 kWp grid-connected PV Kigali Solaire Plant was put in operation by Stadtwerke Mainz.Training for solar technicians is carried out as PPP with Stadtwerke Mainz and GTZ (on behalf of German Devel-opment Cooperation).15 PV diesel hybrid systems for clinics (4 kWp each) were installed by SELF.ACP-EU Energy Facility is operational from 2009 with grants for PV systems in schools and clinics.
4.3 WIND POWERIn collaboration with the Belgian Government, a wind regime study is projected to develop a wind atlas in the country. A con-tract has been awarded to an international company to install wind metering equipment at a limited number of points with the highest potential in the country. It is expected that the first results of these measurements will be available by mid-2010.
4.4 GEOTHERMAL POWERThe investigation of geothermal energy is still in its prelimi-nary stage. Currently, the northern region (Virunga geother-mal prospect) is under investigation carried out jointly by GoR and the German Government organization of BGR. Further investigation is to follow for the southern section (Bugarama). The French bureau BRGM (Bureau de Recherche Géologique et Minière) has estimated the geothermal energy potential between 170 and 300 MW, based on the preliminary work carried out at geothermal springs in the northwestern part of the country.
In 2006, the US company of Chevron confirmed the results of BRGM. In June 2007, MININFRA submitted a pro-posal to BGR. Project activities started in November 2007. So far, the Virunga geothermal prospect has been assessed by structural analysis via aerial photographs and satellite images. 14 SEE ALSO ANNEX 7.3
15 POWER UTILITY IN THE FEDERAL STATE OF RHINELAND-PALATINATE, GERMANY
16 SEE GTZ, 2007, AND RENEWABLES MADE IN GERMANY, AS OF 2007

73COUNTRY INTRODUCTION
RWANDA
Renewable Energies in East Africa
In addition, a detailed geothermal sampling campaign and geophysical surveys are being conducted by BGR and Ken Gen from Kenya. Expected activities for 2009 are additional gas measurements and further geophysical studies. The first phase of the geo-scientific assessment will be completed in June 2009.
The ministry furthermore has plans to begin geother-mal exploratory drilling of appraisal wells once the best lo-cations have been selected, and is set to identify prospective investors.
SHORT BUSINESS INFOA potential of 170 to 300 MW has been identified is esti-mated by BRGM (as of 1984) and Chevron (as of 2006).A detailed assessment by BGR is currently ongoing.GoR is seeking for investors.
4.5 HYDRO POWER
Small Hydro Power A study conducted in 2007 with the support of the Belgian Government identified 333 potential sites for smaller hydro power stations, 125 located in the Western Province, 115 in the Southern Province, 92 in the Northern Province and 13 in the Eastern Province. As only very few of these sites are being exploited so far, this condition provides good invest-ment opportunities. The country has 23 lakes and numerous rivers, and the technical potential for small hydro power sta-tions is estimated at 10 MW, which would provide more than 40,000 households with electricity. The tributaries within the upper Kagera river catchment area offer particularly good prospects for hydro development, especially the Mukungwa, Nyabarongo, Rukarara and Akanyaru rivers in the West. Fur-ther projects could be built on the Ruzizi river, where a water head of approximately 664 m is available over a relatively short distance along the East Africa Rift. International agreements would be necessary to start such initiatives.
The Government is constructing a hydroelectric dam at Rukarara with a capacity of 9.5 MW and operational in 2009. Moreover, through cooperation with GTZ on behalf of the German Government, BTC, UNIDO, World Bank, AfDB and Private Partnership Program, 21 micro hydro pow-er stations in various places financed under different schemes are under construction and are expected to generate 10 MW in 2009. Eight micro hydro plants financed by the Govern-ment are currently being constructed by the Sri-Lankan com-pany of Hydro Power International Ltd. The sites are: Rugezi, Mukungwa II, Janja, Gashashi, Nyabahanga, Nyirabuhom-bohombo, Nshili I and Ruhwa. Construction works on these sites will be completed by the second half of 2009.
To ensure the sustainability of micro hydro power businesses through private sector participation, the GoR with financial support from the Dutch Directorate-General for In-ternational Cooperation (DGIS) and through GTZ initiated a project (as part of the international Energizing Development Program) consisting of the construction of the 6 micro hydro power plants. The program finances 50 % of the total cost, and the private developers cover the remaining 50 % through their
own equity and loan from financing institutions. They are getting technical assistance from GTZ who are advising the project developers in financial as well as engineering aspects. These 6 projects are expected to deliver a total of 1.5 MW by 2010.
Through an UNIDO/GoR partnership, 4 micro hy-dro power plants are being constructed while the construction of three micro hydro stations (Keya, Nkora and Cyimbiri) is ongoing in partnership with CTB. These projects are expected to yield 1.8 MW by the year 2009.
Rural electrification through micro hydro power pro-duction is being developed by the ACP-EU Energy Facility with a budget of 10 million €. 50 % of the construction costs for a total production capacity of 3 MW have been secured for 5–10 different sites. As financing has already been approved, project development is currently under way with the necessary feasibility studies to be conducted for tendering the construc-tion contracts. It is expected that the power plants will be op-erational also by 2010.17
Large Hydro Power The construction of the 27,5 MW Rukarara hydro dam, fi-nanced through domestic resources and with credit from the Indian Government banks, is ongoing and almost on track. Power output is expected by the end of 2009. The negotiations with an Indian company for the building of the Nyabaron-go hydro power plant are being finalized. The EXIM Bank (Export and Import Bank in India) will provide a portion of the financing through a grant. The Government will also invest own sources through direct funding of the project by taking a commercial loan. The total cost will be 126 million USD.
Some larger regional projects are being designed on the borders of Rwanda (Rusumo, Rusizi III and IV) and can only be developed from 2012 onwards.
SHORT BUSINESS INFO333 potential sites identified in the country3 MW for rural electrification under ACP-EU Energy Fa-cility as PPP with 50 % investment fundsSupply of 7,000 households and 350 small businesses in rural areas under DGIS/GTZ21 micro hydro stations (with total 10 MW as PPP)
4.6 METHANE GASThere is a high level of exploitable methane gas in Lake Kivu that can serve the country for a whole century. Lake Kivu is estimated to have over 55 billion m3 of methane gas of which 29 billion are economically exploitable. Such reserves are lo-cated at a depth of approximately 300 m. This resource is re-newable at the rate of 100 to 150 billion m3 per year as far as the large-scale exploitation of this resource is concerned. GoR is in negotiations with a number of parties to produce meth-ane from the lake at an initial development of 35 MW.It is expected that the cost of generation from the Lake Kivu IPP will be about 0.04–0.05 € Cent/kWh (as compared to current diesel generation cost of 0.17 € Cent/kWh), thereby dramatically lowering the overall costs of power generation.
17 SEE EUROPEAN COMMISSION – EC, AS OF 2009

74COUNTRY INTRODUCTION
RWANDA
Renewable Energies in East Africa
Switching to the proposed Lake Kivu IPP will also improve the reliability and stability of power.
The pilot plant of Kibuye Stage 1 (KP1) has a capacity of 4.5 MW. The project experienced considerable delays due to technical setbacks and the dispute with Dane Associates Ltd., an Israeli-Norwegian group. Since the end of Novem-ber 2008, the plant has been producing 1.5 MW of methane gas. Furthermore, Rwanda Investment Group (RIG) has been granted a gas concession of 50 MW. So far, it has two pilot projects under development (totaling around 7.5 MW) expect-ed to be commissioned in March 2009. RIG, GoR and the Industrial Promotion Service (IPS), part of the Agakhan Fund for Economic Development (AKFED), decided to join forces and form a consortium for a 100 MW project. Negotiations with an American investor (Contour Global) for the gas con-cession and the Power Purchase Agreement (PPA) have been completed early 2009. The investor Contour Global wishes to develop a 100 MW methane gas to power plant, starting with a first phase of 25 MW with equity funding. The Government has embarked on a monitoring program in partnership with the Democratic Republic of Congo. A Memorandum of Un-derstanding (MoU) was signed between the two governments for the monitoring of the stability of Lake Kivu.
SHORT BUSINESS INFO29 billion m3 are economically exploitable in 300 m depth.Rwanda Investment Group (RIG) holds a 50 MW gas con-cession.KP1 pilot project of 4.5 MW is in operation since May 2008.
4.7 PEATThere are several sites with peat reserves in Rwanda. The total amount of exploitable dry peat reserves is currently estimated at 155 million tons . Due to technical and economic difficul-ties and possible environmental impacts, however, there has been very little exploitation of peat yet. The Office of Geology and Mines in Rwanda (OGMR) mines peat in Rwabusoro on behalf of the MININFRA, while a concession has been given to ENEDOM, a local company, to mine peat in Rulindo. The Government is considering the use of peat for electricity gen-eration and has invited potential investors to come forward for power plants of 25–50 MW capacity.
5 RENEWABLE ENERGY BUSINESS INFORMATION AND CONTACTS
5.1 RENEWABLE ENERGY COMPANIES & BUSINESS RELATED ORGANIZATIONS
The following list shows RE companies and other business related organizations in Rwanda. None of the companies is manufacturing RE related products. There are also a number of companies involved in consultancy and research on the de-velopment of RE technology.
COMPANY SUB-SECTOR ADDRESS EXPERIENCE IN RE PHONE E-MAIL / WEBSITE
(ABC-R) Africa Business Consulting Rwanda
Wind, solar, hydro, bioenergy / / Phone: +250 (0)8803665/08302323
Coopérative pour l'Environnement et le Développement au Rwanda (COOPED)
Bioenergy / Established in 1999 as a waste coll-ection company; has now expanded to produce bioenergy
Phone: +250 (0)8508290-55101070
Rwanda Import Export (RIEX) Micro Hydro Power, solar P. O. Box 6165 Kigali – Rwanda
In final stage of implementing a micro hydro power plant project
Phone: +250 (0)8302845 [email protected]
Africa Business (AFRIBUS) Established as an ICT company; has now expanded to include micro hydro and solar
P. O. Box 1253Kigali – Rwanda
In the final stage of implementing a project to build a micro hydro power plant on river Masige in Kibuye
Phone: +250 (0)8305299-55101691
Société de Transformation Industrielle de Ruhengeri (SOTIRU)
Micro hydro / Constructing a micro hydro power plant on Mpenge river to cater for the factory’s power needs; has already experience in mini power plant management
Phone: +250 (0)8307455 [email protected]
SOGEMER s.a.r.l. Micro hydro / Currently constructing a 425 KW power plant on Musarara River in Gakenke District under the PSP Program
Phone: +250 (0)842 1191 [email protected]
Groupe de Travail Ruraue (GTR) Construction, distribution, commercialization of electricity to local population
P. O. Box 6445 Kigali – Rwanda
In the final phase of starting the construction of a 120 KW mini hydro power plant on River Mpenge Musanze
Phone: +250 (0)861 1946 [email protected]

75COUNTRY INTRODUCTION
RWANDA
Renewable Energies in East Africa
COMPANY SUB-SECTOR ADDRESS EXPERIENCE IN RE PHONE E-MAIL / WEBSITE
Association pour le Développement de Nyabimata (ADENYA a.s.b.l) Nyaruguru Southern Province
Micro hydro for rural electrification
P. O Box 226 Butare – Rwanda
Constructing a 250 KW micro power plant at Mazimeru river in Nyaruguru District under the PSP program through its affiliate company Energie Nyaruguru
Phone: +250 (0)842 1911 [email protected]
Rural Energy Solutions (RES) Micro hydro power / Constructing a 110 KW micro hydro power plant on River Kavumu MWange river in Gicumbi District under PSP Program
Phone: +250 (0)877 1385 [email protected]
Énergie Domestique (ENEDOM) Bioenergy P. O. Box 339 Nyarugenge – Muhima
Established in 2000 for purposes of manufacturing briquettes from waste materials using funds secured from UNDP and Swiss embassy. Full-scale operation of the briquetting process started in 2001.
Phone: +250 8501309 [email protected]
Biomass Renewable Energy Rwanda (BRER)
Promotion of biomass technology
/ Building a 600 KW bioenergy plant at the BRALIRWA plant in Rubavu
Phone: +250 (0)8304031-05106636
Construction and Renewable Energy Technologies (CRET s.a.r.l.)
Promotion of biofuel and biogas from organic waste
P. O. Box 1437 Kigali - Rwanda
Started operations in the field of construction and biogas technology. Design and construction of 60 m3 biogas plant at St. Gabriel Monastery, Nyarugenge. Don Bosco Secondary School in Gatsibo and 21 others are under construction
Phone: +250 (0)8561340-05102712
AFRISET/HYGEBAD Bioenergy and solar / Exploitation of the existing potentials in RE to provide alternative energy solutions
Phone: +250 8300327 [email protected]
Rwanda Energy Company (REC) Exploitation of methane gas / It has contracted the French Datat Environment Company and the German/Belgian group of Global Power Systems to carry out a 7.5 MW power project with Methane from Lake Kivu; project is expected to be commissioned in March 2009
Phone: +250 8303959 [email protected],[email protected]
Kibuye Power Ltd. Methane gas / KP1 pilot project of 4.5 MW commissioned in May 2008
Phone: +250 (0)8304499,58062/63
Rwanda investment Group (RIG s.a.r.l.)
Association of Rwanda’s business acumens
/ Currently in consortium with GoR and IPS to exploit methane gas from Lake Kivu
Phone: +250 8301452 [email protected],[email protected]
CRE Production of bioenergy / / Phone: +250 8305836 [email protected]
AHIG Promotion of bioenergy / / Phone: +250 8304001 [email protected]
Modern Technologies Services (MTS) s.a.r.l.
Hydro, solar / / Phone: +250 8352222 [email protected]
GIC / / Production of biogas, pollution reduction and environmental protection by lowering firewood consumption
Phone: +250 8450078 [email protected]
SEFIK Solar, micro hydro and wind / Sale and installation of solar equipment
Phone: +250 8303426 [email protected]
Bureau des Formations Medicales Agrées du Rwanda (BUFMAR).
Installation and maintenance of electricity by solar energy in rural areas
P. O. B 716 Kigali –Rwanda
Installation of solar equipment since 1975
Phone: +250 8300306 [email protected]
SOS Energy Sale and installation of solar equipment
/ Not operating Phone: +250 8301780 [email protected]
Rural Energy Production (REPRO)
Electricity power production, especially for rural areas
P. O. Box 5155 Kigali – Rwanda
Currently constructing a micro hydro plant on R. Rwishwa in Murunda, Kamonyi District
Phone: +250 8646404 [email protected]
SNV / P. O. Box 1049 Kigali –Rwanda
Dutch organization with 25 years of experience in Rwanda; carries out advisory services to develop a viable biogas sector
Phone: +250-504121 www.snvworld.org/en/Pages/default.aspx
Industrial Promotion Service (IPS)
Part of Agakhan Fund for Economic Development (AKFED)
/ Has formed consortium with Rwandan Government and RIG to exploit methane gas form lake KIVU
Phone: +41 22 909 7200
Fax: +4122 9097292
/
(ABC-R) Africa Business Consulting Rwanda
Wind, solar, hydro, bioenergy / / Phone: +250 (0)8803665/08302323
Coopérative pour l'Environnement et le Dévelop-pement au Rwanda (COOPED)
Bioenergy / Established in 1999 as a waste collection company; has now expanded to produce bioenergy
Phone: +250 (0)8508290-55101070
Rwanda Import Export (RIEX) Micro hydro power, solar P. O. Box 6165 Kigali - Rwanda
In final stage of implementing a micro hydro power plant project
Phone: +250 (0)8302845 [email protected]
Africa Business (AFRIBUS) Established as an ICT company; has now expanded to include micro hydro and solar
P. O. Box 1253Kigali –Rwanda
In the final stage of implementing a project to build a micro hydro power plant on river Masige in Kibuye
Phone: +250 (0)8305299-55101691
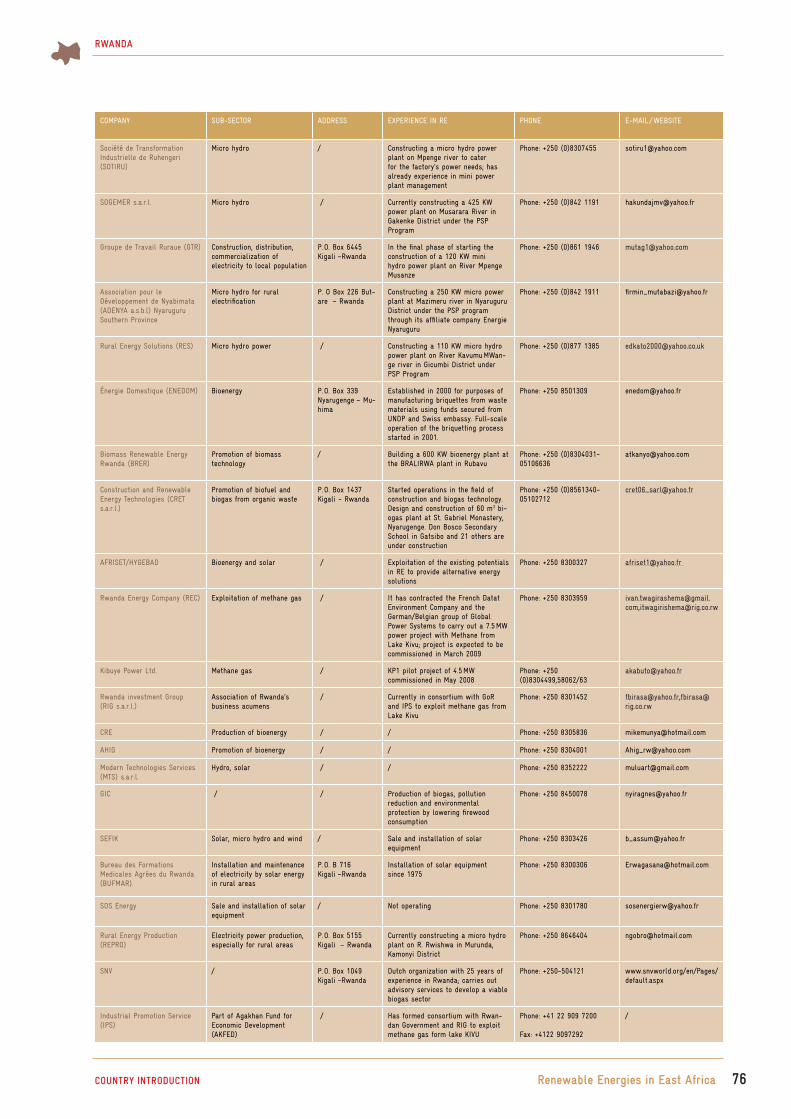
76COUNTRY INTRODUCTION
RWANDA
Renewable Energies in East Africa
COMPANY SUB-SECTOR ADDRESS EXPERIENCE IN RE PHONE E-MAIL / WEBSITE
Société de Transformation Industrielle de Ruhengeri (SOTIRU)
Micro hydro / Constructing a micro hydro power plant on Mpenge river to cater for the factory’s power needs; has already experience in mini power plant management
Phone: +250 (0)8307455 [email protected]
SOGEMER s.a.r.l. Micro hydro / Currently constructing a 425 KW power plant on Musarara River in Gakenke District under the PSP Program
Phone: +250 (0)842 1191 [email protected]
Groupe de Travail Ruraue (GTR) Construction, distribution, commercialization of electricity to local population
P. O. Box 6445 Kigali –Rwanda
In the final phase of starting the construction of a 120 KW mini hydro power plant on River Mpenge Musanze
Phone: +250 (0)861 1946 [email protected]
Association pour le Développement de Nyabimata (ADENYA a.s.b.l) Nyaruguru Southern Province
Micro hydro for rural electrification
P. O Box 226 But-are – Rwanda
Constructing a 250 KW micro power plant at Mazimeru river in Nyaruguru District under the PSP program through its affiliate company Energie Nyaruguru
Phone: +250 (0)842 1911 [email protected]
Rural Energy Solutions (RES) Micro hydro power / Constructing a 110 KW micro hydro power plant on River Kavumu MWan-ge river in Gicumbi District under PSP Program
Phone: +250 (0)877 1385 [email protected]
Énergie Domestique (ENEDOM) Bioenergy P. O. Box 339 Nyarugenge – Mu-hima
Established in 2000 for purposes of manufacturing briquettes from waste materials using funds secured from UNDP and Swiss embassy. Full-scale operation of the briquetting process started in 2001.
Phone: +250 8501309 [email protected]
Biomass Renewable Energy Rwanda (BRER)
Promotion of biomass technology
/ Building a 600 KW bioenergy plant at the BRALIRWA plant in Rubavu
Phone: +250 (0)8304031-05106636
Construction and Renewable Energy Technologies (CRET s.a.r.l.)
Promotion of biofuel and biogas from organic waste
P. O. Box 1437 Kigali - Rwanda
Started operations in the field of construction and biogas technology. Design and construction of 60 m3 bi-ogas plant at St. Gabriel Monastery, Nyarugenge. Don Bosco Secondary School in Gatsibo and 21 others are under construction
Phone: +250 (0)8561340-05102712
AFRISET/HYGEBAD Bioenergy and solar / Exploitation of the existing potentials in RE to provide alternative energy solutions
Phone: +250 8300327 [email protected]
Rwanda Energy Company (REC) Exploitation of methane gas / It has contracted the French Datat Environment Company and the German/Belgian group of Global Power Systems to carry out a 7.5 MW power project with Methane from Lake Kivu; project is expected to be commissioned in March 2009
Phone: +250 8303959 [email protected],[email protected]
Kibuye Power Ltd. Methane gas / KP1 pilot project of 4.5 MW commissioned in May 2008
Phone: +250 (0)8304499,58062/63
Rwanda investment Group (RIG s.a.r.l.)
Association of Rwanda’s business acumens
/ Currently in consortium with GoR and IPS to exploit methane gas from Lake Kivu
Phone: +250 8301452 [email protected],[email protected]
CRE Production of bioenergy / / Phone: +250 8305836 [email protected]
AHIG Promotion of bioenergy / / Phone: +250 8304001 [email protected]
Modern Technologies Services (MTS) s.a.r.l.
Hydro, solar / / Phone: +250 8352222 [email protected]
GIC / / Production of biogas, pollution reduction and environmental protection by lowering firewood consumption
Phone: +250 8450078 [email protected]
SEFIK Solar, micro hydro and wind / Sale and installation of solar equipment
Phone: +250 8303426 [email protected]
Bureau des Formations Medicales Agrées du Rwanda (BUFMAR).
Installation and maintenance of electricity by solar energy in rural areas
P. O. B 716 Kigali –Rwanda
Installation of solar equipment since 1975
Phone: +250 8300306 [email protected]
SOS Energy Sale and installation of solar equipment
/ Not operating Phone: +250 8301780 [email protected]
Rural Energy Production (REPRO)
Electricity power production, especially for rural areas
P. O. Box 5155 Kigali – Rwanda
Currently constructing a micro hydro plant on R. Rwishwa in Murunda, Kamonyi District
Phone: +250 8646404 [email protected]
SNV / P. O. Box 1049 Kigali –Rwanda
Dutch organization with 25 years of experience in Rwanda; carries out advisory services to develop a viable biogas sector
Phone: +250-504121 www.snvworld.org/en/Pages/default.aspx
Industrial Promotion Service (IPS)
Part of Agakhan Fund for Economic Development (AKFED)
/ Has formed consortium with Rwan-dan Government and RIG to exploit methane gas form lake KIVU
Phone: +41 22 909 7200
Fax: +4122 9097292
/

77
RWANDA
Renewable Energies in East Africa
5.2 LOCAL BUSINESS-RELATED INSTITUTIONS
NAME ADDRESS PROFILE ROLE
Kigali Institute of Science and Technology (KIST)
P. O. Box 3900 Kigali – Rwanda KIST was established through the combined efforts of Rwanda's Ministry of Education, UNDP Rwanda and the German Technical Cooperation Agency (GTZ) as the implementing agency.
The institute equips students with advanced skills and hands-on training and promotes research on energy, environment and other disciplines. It has established a center for innovation and technology transfer between various disciplines including RE.
The Institute of Scientific and Technological Research (IRST)
P. O. Box 227 Butare – RwandaPhone: +250 530395
The institute was established within the framework of research restructuring in Rwanda. Its innovative technologies help the Rwandan population to solve their socio-economical problems.
The institute specializes in research activities in energy (peat, solar, hydro electric micro central).
National University of Rwanda P. O. Box:117Butare – Rwanda Phone: +(250) 30122
The university was established in 1963 by the Government in cooperation with Quebec and focuses on science, technology and humanity science.
The university generates and disseminates high-quality multidisciplinary knowledge and promotes effective research, skills training and community service for sustainable socio-economic development .
6 BIBLIOGRAPHY
BBC (2006): Rwanda Fired up by Methane Plans, (http://news.bbc.co.uk/1/hi/world/africa/4698278.stm)
Butare A. (2008): Concentrated Effort to Spur Economic Growth and Integrated Development – the Perspective form the Energy Sector, (http://web.univ-pau.fr/~scholle/ecosystemes/2-dev/24-rwa/24-pg-en.htm)
Central Intelligence Agency- CIA (2009): World Fact Book - Rwanda (www.cia.gov/library/publications/the-world-factbook/geos/rw.html, viewed December 2009)
Dekeler, G. et al. (2005): Report on the Feasibility Study for a Biogas Program in the Republic of Rwanda
EAC (2006): EAC Development Strategy 2006–2010 – Deepening and Accelerating Integration (www.eac.int/about-eac/quick-links/unido-norad-programme/doc_download/159-eac-development-strategy-2006-2010.html)
European Commission – EC (2009): ACP-EU Energy Facility – First Energy Facility (http://ec.europa.eu/europe-aid/where/acp/regional-cooperation/energy/energy-facility-former-calls/former_calls_en.htm; viewed in December 2009)
Gatare, F. K. / Representative of H.E the President to NEPAD (2005): NEPAD Implementation in Rwanda. A Concept Paper: Rwanda at the Forefront of NEPAD Implementation – four years after adoption, December 2005 (www.nepad.gov.rw/docs/NEPAD_in_Rwanda_DPM_2005.pdf)
GTZ (2007): Ruanda – Sonnenstrahlen für die Wirtschaft (www.gtz.de/de/aktuell/20217.htm)
International Chamber of Commerce – ICC (without year): Investment Guide Kenya, Uganda, Tanzania, Rwanda (www.iccwbo.org/policy/trade/id9089/index.html)
MINCOFIN (without year): Economic Development and Poverty Reduction Strategy Paper 2008–2012
MINECOFIN (2000): Rwanda Vision 2020 (www.nur.ac.rw/IMG/pdf/Vision_2020.pdf)
MINICOFIN (2007): National Budget for fiscal Year 2008/2009
MININFRA (2009): Current Electricity Generation Ca-pacity (http://mininfra.gov.rw/index.php?option=com_content&task=view&id=114&Itemid=142)
MINNFRA (2007): Information Package on Investment Opportunities in the Energy Sector
Poverty Environment Initiative Rwanda (2006): Main-streaming Environment in Energy – Strategies to Address Poverty in Rwanda, Concept Note by Sustainable Energy Africa, (www.unpei.org/PDF/Rwanda-Mainstreaming-env-energy-stras.pdf)
Renewables Made in Germany (2007): Das größte Solarkraftwerk Afrikas ist in Kigali, der Hauptstadt von Ruanda, ans Netz gegangen (www.german-renewable-energy.com/Renewables/Navigation/Englisch/Solarenergie/case-studies,did=222930.html)
Republic of Rwanda (2005): Law No. 26/2005 of 17 De-cember 2005 Relating To Investment and Export Promo-tion and Facilitation, Official Gazette of the Republic of Rwanda (www.rwandainvest.com/pdfs/investment_code.pdf)
Republic of Rwanda (2006): Law Determining the State Finances for the 2007 Fiscal Year with Other Fiscal Laws, Official Gazette of the Republic of Rwanda (www.primature.gov.rw/index2.php?option=com_docman&task=doc_view&gid=349&Itemid=95)
Republic of Rwanda (2009): Government Sets Eyes on Alternative Energy (www.gov.rw/sub.php?page=print&id_article=22)
Republic of Rwanda, National Census Commission (2004): 3rd Census of Population and Housing of Rwanda, Census 2002 in Brief
Republic of Rwanda/ MINECOFIN (2002): Privatization Secretariat. Energy & Water (www.privatisation.gov.rw/documents/energy_water_e.pdf)
Republic of Rwanda/ MININFRA (2004): Energy policy for Rwanda – Final. October 2004 (http://www.upegaz.gov.rw/Rwanda___Energy_Policy_for_Rwanda__final____10_2004__W0695884_.DOC)
Rural Poverty Portal (2009): Rural poverty in Rwanda (www.ruralpovertyportal.org/english/regions/africa/rwa/agriculture_in_rwanda/CDRom/reports/donors/invest-mentO.doc)
BIBLIOGRAPHY

78
RWANDA
Renewable Energies in East AfricaBIBLIOGRAPHY
Rwanda Investment and Export Promotion Agency – RIEPA (2008): RIG Investments Grow to 25.1 Mil-lion USD (www.rwandainvest.com/spip.php?article559)
Rwanda Investment and Export Promotion Agency – RIEPA (2009): Various reports (www.rwandainvest.com)
Stadtwerke Mainz (2007): PV Microfinancing Rwanda 2007 – Market Analysis Study as Part of a PPP Coopera-tion Project between Stadtwerke Mainz and GTZ (available on request at Stadtwerke Mainz and GTZ)
Theodora.com (2009): Rwanda Economy 2009 (www.theodora.com/wfbcurrent/rwanda/rwanda_economy.html)
UNDP (2008): 2007/2008 Human Development Report, Rwanda, HDI Rank 161 (http://hdrstats.undp.org/coun-tries/data_sheets/cty_ds_RWA.html)
UNDP, Rwanda (2009): Energy and Environment (www.undp.org.rw/Energy_and_Environment.html)
UNFCCC (2009): Rwanda Electrogaz Compact Fluores-cent Lamp (CFL) Distribution Project (http://cdm.unfccc.int/Projects/Validation/DB/26PMKJ754ZO5ISWE8AWM5HC6HSY49K/view.html)
World Bank/ Watkins, A./ Verma, A. (2008): Build-ing Science, Technology and Innovation Capacity in Rwanda. Developing Practical Solutions to Practical Problems (http://siteresources.worldbank.org/EDUCA-TION/Resources/278200-1099079877269/547664-1099079975330/Building_STIcapacity_Rwanda.pdf)
Websites www.minaffet.gov.rw/magazine/investment-conference.pdf www.unctad.org/Templates/StartPage.asp?intItemID=2068
Rwanda Development Gateway (www.rwandagateway.org/article.24)
UNIDO (2002): (www.unido.org/file-storage/download/?file_id=8285)
Worldbank / Rwanda http://siteresources.worldbank.org/INTPSIA/Resources/4900231120841262639/ch7_rwanda.pdf
MINITERE (www.minitere.gov.rw) www.globalregulatorynetwork.org/files/PDFs/RwandaTar-iffReport.pdf, viewed in November 2009
Manna Energy Foundation. Powering Social Enterprise (www.mannaenergy.org)
UPEGAZ (www.upegaz.gov.rw) De Lorenzo, M./ American Enterprise Institute for Public Policy Research (2008): The Rwandan Paradox (www.aei.org/article/27476)

79
RWANDA
Renewable Energies in East AfricaANNEX
7 ANNEX
7.1 COUNTRY MAP OF RWANDA
Source: Institute National de la Statistique du Rwanda, Décembre 2005

80
RWANDA
Renewable Energies in East AfricaANNEX
7.2 MAP OF THE NATIONAL ELECTRICITY GRID
Source: BTC-CTB/CGIS-NUR, as of 2008

81
RWANDA
Renewable Energies in East AfricaANNEX
7.3 SHARE OF LOCAL AND IMPORTED ENERGY SOURCES
LOCAL ENERGY SOURCES 2002 2003 2004 2005 2006 2007
Type of power Power plant Net gen. (GWh) Net gen. (GWh) Net gen. (GWh) Net gen. (GWh) Net gen (GWh) Net gen. (GWh)
Hydro GIHIRA 6.91 6.57 5.55 5.91 5.91 5.95
Hydro GISENYI 5.70 4.78 4.54 4.38 3.81 4.53
Hydro MUKUNGWA 56.69 71.11 53.03 40.09 25.70 16.04
Hydro NTARUKA 28.91 35.17 21.20 15.35 5.75 0.80
Hydro Total 98.21 117.64 84.32 65.73 41.17 27.32
Diesel / light fuel oil Jabana 0.00 0.00 3.59 25.40 19.24 9.47
Diesel / light fuel oil Gatsata (old plant) 0.00 0.00 0.00 0.00 0.00 0.00
Diesel / light fuel oil Gatsata (new) 0.00 0.00 2.66 14.08 1.18 1.93
Diesel / light fuel oil Gikondo 0.00 0.00 0.00 10.66 82.26 66.22
Diesel / light fuel oil Mukugwa 0.00 0.00 0.00 0.00 24.72 33.85
Diesel / light fuel oil Total 0.00 0.00 6.26 50.14 127.40 111.47
Biomass 12,240.00 12,290.00 12,341.00 12,391.00 12,442.00 12,492.00
Solar JARI 0.00 0.00 0.00 0.00 0.00 2.00
Total energy produced locally 12,338.21 12,407.64 12,410.38 12,506.84 12,610.87 12,632.79
Imported energy sources
Hydro Power
Import of power RUSIZI 1 / SINELAC 7.44 2.52 20.09 20.89 36.45 15.06
Import of power GOMA SNEL / DRC 0.00 0.00 0.10 0.00 0.00 0.00
Import of power RUSIZI II / SINELAC 126.74 116.06 91.42 64.56 40.78 53.62
Import of power KABALE / UGANDA 1.52 2.33 4.19 3.59 2.79 0.66
Import of power Total 135.69 120.92 115.81 89.05 80.02 69.34
Oil 2,498.00 2,498.00 2,498.00 2,498.00 2,498.00 2,498.00
Total imported energy 2,633.69 2,618.92 2,613.81 2,587.05 2,578.02 2,567.34
Total energy (local and imported) 14,971.90 15,026.56 15,024.19 15,093.89 15,188.89 15,200.13
Energy imported to the total ( %) 17.60 17.40 17.40 17.40 17.00 16.90
Source: unknown

82
TANZANIA
Renewable Energies in East Africa
COUNTRY CHAPTER:
TANZANIA Author of Country Chapter Finias Magessa (Eng.)
Coordination and Review of the Country ChapterDipl. Phys. Rafael WiesePSE AGFreiburg, Germanywww.pse.de
Editor Deutsche Gesellschaft für Technische Zusammenarbeit (GTZ) GmbHDepartment Water, Energy, TransportDag-Hammarskjöld-Weg 1-565760 Eschborn, Germanywww.gtz.de
On behalf of Federal Ministry for Economic Cooperation and Development (BMZ)
Editorial staffDiana KraftTel: +49 (0)6196 79 4101Fax: +49 (0)6196 79 80 4101Email: [email protected]

83
TANZANIA
Renewable Energies in East Africa
ACRONYMS, ABBREVIATIONS AND MEASUREMENTS 84
SUMMARY 87
1 COUNTRY INTRODUCTION 89 1.1 Tanzania Overview 89 1.2 Tanzania Statistics: Geography and Economics 89
2 ENERGY MARKET IN TANZANIA 90 2.1 Energy Situation Overview 90 2.2 Energy Capacities, Production and Consumption 90 2.3 Electricity Prices 91 2.4 Market Actors for Planning, Regulation and Distribution 91
3 RENEWABLE ENERGY POLICY FRAMEWORK CONDITIONS 91 3.1 Policy and Renewable Energy Promotion Programs 92 3.2 Donor Aid Activities 93 3.3 Market Risks 94 4 STATUS AND FUTURE OUTLOOK FOR RENEWABLE ENERGIES 95 4.1 Biomass /Biogas 95 4.2 Solar Energy 96 4.3 Wind Power 96 4.4 Geothermal Power 97 4.5 Hydro Power 97
5 RENEWABLE ENERGY BUSINESS INFORMATION AND CONTACTS 98 5.1 Renewable Energy Companies & Business Related Organisations 98 5.2 Local Institutions Related to Renewable Energy Business 99
6 BIBLIOGRAPHY 101
7 ANNEX 102
CONTENTS TANZANIA
CONTENTS

84
TANZANIA
ACRONYMS AND ABBREVIATIONS
TANZANIA
AfDB African Development Bank
AREED African Rural Energy Enterprises Development
BGR Bundesanstalt für Geowissenschaften und Rohstoffe (Federal Institute for Geosciences and Natural Resources)
BDS Business Development Services
BEB Bio-Energy Berlin GmbH
BP British Petroleum
BRELA Business Registration and Licensing Authority
CAMARTEC Center for Agriculture Mechanization and Rural Technology
CDM Clean Development Mechanism
CEO Chief Executive Officer
CHP Combined Heat and Power
CNG Compressed Natural Gas
CoET College of Engineering and Technology
COSTECH Commission for Science and Technology
DIT Dar es Salaam Institute of Technology
DNA Designated National Authority
DRC Democratic Republic of Congo
E&CO Energy & Company (Enterprise for clean energy investments in developing countries)
DTP Deutsch-Tansanische Partnerschaft
E+Co Energy through Enterprise (international financing institution)
EE Energy efficiency
ESAMI Eastern and Southern Africa Management Institute
EU European Union
EWURA Energy and Water Utilities Regulatory Authority
FELISA Farming for Energy for Better Livelihoods in Southern Africa
GDP Gross Domestic Product
GEF Global Environment Facility
GENI Global Energy Network Institute
GTZ Deutsche Gesellschaft für Technische Zusammenarbeit (German Technical Cooperation Agency)
HFO Heavy Fuel Oil
IEA International Energy Agency
ICSID International Center for Settlement of Investment Disputes
ICT Information Communication Technology
IIRT International Investor’s Round Table
IPPs Independent Power Producers
IPTL Independent Power Tanzania Ltd.
KAKUTE Kampuni ya Kusambaza Teknolojia
KARADEA Karagwe Development Association
LIRT Local Investors’ Round Table
LPG Liquefied Petroleum Gas
MCC Millennium Challenge Corporation
MEM Ministry of Energy and Minerals
MFI Microfinance Institutions
MIGA Multilateral Investment Guarantee Agency
MIGESADO Miradi ya Gesi ya Samadi Dodoma
MLVTC Mafinga Lutheran Vocational Training Center
MRHP Mwanza Rural Housing Project
NAPA National Adaptation Program of Action
NEMC National Environment Management Council
NEP National Energy Policy
NG Natural Gas
NGO Non-governmental Organization
NORAD Norwegian Development Agency
PDD Project Design Document
ACRONYMS, ABBREVIATIONS AND MEASUREMENTS Renewable Energies in East Africa

85
TANZANIA
Renewable Energies in East Africa
PIN Project Idea Note
PPA Power Purchase Agreement
ProBEC Program for Biomass Energy Conservation
PSMP Power Sector Master Plan
PSOM Programma Samenwerking Opkomende Markten (Program for Cooperation with Emerging Markets)
R&D Research and Development
RE Renewable Energy
REA Rural Energy Agency
REB Rural Energy Board
REDCOT Renewable Energy Development Company Tanzania
REF Rural Energy Fund
RES Rural Energy Systems
SACCOS Savings and Credit Cooperative Society
SEECO Sustainable Energy and Environment Company
SGP Small Grant Program
SIDA Swedish International Development Agency
SIDO Small Industries Development Organization
SSMP Sustainable Solar Market Packages
SSPPA Standardized Small Power Purchase Agreement
SUDERETA Sustainable Development through Renewable Energy Tanzania
SUMATRA Surface and Marine Transport Regulatory Authority
TANESCO Tanzania Electric Supply Company
TANWAT Tanzania Wattle Company
TASEA Tanzania Solar Energy Association
TaTEDO Tanzania Traditional Energy Development and Environment Organization
TAZARA Tanzania Zambia Railway
TBS Tanzania Bureau of Standards
TCCIA Tanzania Chamber of Commerce, Industries and Trade
TCRA Tanzania Communication Regulatory Authority
TDTC Technology Development and Transfer Center
TEDAP Tanzania Energy Development Access Program
TFC Total Final Energy Consumption
TIC Tanzania Investment Center
TIRDO Tanzania Industries Research Development Organization
TPC Tanzania Planting Corporation
TPDC Tanzania Petroleum Development Corporation
TPES Total Primary Energy Supply
TPSF Tanzania Private Sector Foundation
TRA Tanzania Revenue Authority
TZS Tanzanian Shilling
UDSM University of Dar es Salaam
UK United Kingdom
UN United Nations
UNDP United Nations Development Program
UNIDO United Nations Industries Development Organization
USD United States Dollar
VAT Value Added Tax
VETA Vocational Education and Training Authority
WB World Bank
ZASEA Zanzibar Solar Energy Association
ACRONYMS, ABBREVIATIONS AND MEASUREMENTS

86COUNTRY INTRODUCTION
TANZANIA
Renewable Energies in East Africa
MEASUREMENTS
°C degree Celsius
m2 cubic meter
GWh gigawatt hour
kg kilogram
kgoe kilogram of oil equivalent
km kilometer
km2 square kilometer
kWh kilowatt hour
l liter
m meter
MW megawatt
MWe megawatt electrical
s second
toe tons of oil equivalent
Wp Watt-peak (kWp = kilowatt peak)

87
TANZANIA
Renewable Energies in East Africa
SUMMARY
ECONOMICAL STATUS AND DEVELOPMENT OF TANZANIATanzania is located at the Indian Ocean with Dar es Salaam as the country’s commercial capital.
Agriculture is the dominant sector in Tanzania, pro-viding livelihood, income and employment to over 80 % of the population. It accounted for 56 % of the Gross Domestic Product (GDP) and 60 % of export earnings in the past three years. It is also an important sector in terms of food produc-tion, employment generation, production of raw materials for industries and generation of foreign exchange. Poverty is one of the main problems affecting about 50 % of the households throughout the country and even more in rural areas1. The recently completed National Adaptation Program of Action (NAPA) is supposed to enable the country to further integrate adaptation issues in the development process. The program is focusing on high and shared growth, quality livelihood, peace, stability, unity, good governance, high-quality educa-tion and international competitiveness2.
Gold, coffee and cashew nuts are the main export goods. The economy is growing steadily at a rate of about 6 % (as of 2006).
82 % of the population live in rural areas and are mainly engaged in subsistence agriculture. The GDP per capi-ta is 1,400 USD. About 50 % of the population live below the poverty line, spending around one third of their income on energy products. Tanzania Development Vision 2025 aims at poverty alleviation by the year 2025.
STRUCTURE OF ENERGY SUPPLY IN TANZANIATanzania’s primary energy supply and consumption is dom-inated by biomass (90 %) followed by petroleum (7 %), gas (2 %) and hydro power (1 %)3. The majority of the population relies on biomass as fuel for cooking.
Electricity Electricity is generated from six hydro power stations (591 MW) and thermal gas or oil fired power stations (658 MW). Tan-zania also imports electricity from Uganda (8 MW) and Zambia (5 MW). The total capacity of 1,249 MW produced 4,156 GWh in 2008. In the last years, the share of Independ-ent Power Producers (IPP) increased from 14 % (as of 2002) to 42 % (as of 2008) due to the increase in private electricity generation by thermal sources increased from 190 GWh to 1,58 GWh4.
The electrification rate is at 10 % countywide with about 30 % of the urban population having access to the na-tional grid, while in rural areas access stands at 2 %. The aver-age per capita consumption is 82 kWh per year.
Oil Oil exploration is being pursued by more than eleven com-panies, but so far no oil has been found. The nation imports all of its liquid fuel for an annual demand of about 1.8 mil-lion metric tons. Petroleum consumption by sector was at the following levels in 2006: transport 76 %, industry 10 % and residential use 13 %. Presently, Tanzania spends more than 190 billion USD per year on the importation of petroleum products equaling about 26 % of the country’s total foreign currency earnings5.
It is important to note that a number of exploration agreements for petroleum have been signed between the Gov-ernment and oil exploring companies, namely Dodsal Hy-drocarbon and Power of India (exploration of Ruvu area), Funguo Petroleum of Australia (exploration of western Son-gosongo area) and Hydrotanz of Mauritius (exploration of northern Mnazi Bay area).
STATUS OF RENEWABLE ENERGIES IN TANZANIA
Biomass 90 % of Tanzania’s primary energy supply is covered by bio-mass as dominant source of energy with a per capita con-sumption of 1.13 m2 per year. To reduce deforestation, im-proved efficiency stoves were introduced many years ago. Today, around 15,000 improved stoves are produced and sold per month in Tanzania. In addition, around 6,000 small residential biogas plants for cooking purpose are currently in operation6.
The conversion of biomass into biofuels is currently under development with eight international companies hav-ing registered pilot projects. Moreover, a pilot biogas demon-stration plant for electricity production is in operation.
Solar The photovoltaic (PV) market in Tanzania has been devel-oped via international programs in the recent years. The total installed PV capacity is around 1,8 MW, while the annual installation rate is at around 200 kWp per annum with rising tendency. Around 20 registered solar companies are currently benefiting from two PV promotion projects, the Swedish De-velopment Agency (SIDA)/Ministry of Energy and Minerals (MEM) project and the United Nations Development Pro-gram (UNDP)/Global Energy Facility (GEF)/MEM project. In addition, residential PV systems of up to 100 Wp are sub-sidized at 2 USD per Wp by the Rural Energy Agency (REA) respectively the Rural Energy Fund (REF).
There are more than 300 technicians already trained for installation and after-sales service, but the distribution channels of the solar companies into the rural areas remain weak.
SUMMARY
1 SEE ALSO UNITED REPUBLIC OF TANZANIA/VICE PRESIDENT‘S OFFICE, AS OF 2007
2 SSN TANZANIA ADAPTATION TEAM, AS OF 2006
3 IEA, AS OF 2007
4 MINISTRY OF ENERGY AND MINERALS MEM, AS OF 2008
5 IEA, AS OF 2007
6 PROBEC, AS OF 2009

88
TANZANIA
Renewable Energies in East Africa
Hydro Over the years, the power sector of Tanzania has been domi-nated by hydro power at 50–75 % of the electricity supply. To date, the development of new hydro power capacities still of-fers the main business opportunity in the power sector.
Of the available 315 MW of small hydro potential in Tanzania, only less than 8 MW have been exploited. Feasibil-ity studies in seven regions were facilitated by MEM in 2006 and 2007 for further development.
Wind The potential for wind energy was quantified by the East Af-rica Meteorological Department in 1975 for the entire region. Since the data were measured at an insufficient height of about 2 m, they are not reliable. No wind map exists for Tanzania so far.
Geothermal A geological survey of Tanzania is being conducted since June 2006 by MEM and the Federal Institute for Geosciences and Natural Resources (BGR) of Germany. The estimated geo-thermal potential is about 600 MWe. Detailed surveys, how-ever, are still required to quantify the available potential.
SUMMARY

89COUNTRY INTRODUCTION
TANZANIA
Renewable Energies in East Africa
1 COUNTRY INTRODUCTION
1.1 TANZANIA OVERVIEWThe United Republic of Tanzania became a union of two sov-ereign states namely Tanganyika and Zanzibar on 26 April 1964. Tanzania borders Kenya and Uganda in the North and Rwanda, Burundi and Democratic Republic of Congo in the West. In the South, it borders Zambia, Malawi and Mozam-bique and in the East it the Indian Ocean.7
1.2 TANZANIA STATISTICS: GEOGRAPHY AND ECONOMICS
7 A COUNTRY MAP FOR VISUALIZATION IS ATTACHED AS ANNEX 7.1.
LAND AREA: 945,000 km2 (Tanzania mainland 881,000 km2, Zanzibar 2,000 km2)
LOCATION: Between longitudes 290 and 410 East and latitudes 10 and 120 South
POPULATION: 38.7 million (mainland 37.6, Zanzibar 1.1), growth rate 2.9 % (as of 2007)
ADMINISTRATIVE REGIONS: 26 administrative regions (21 are in the mainland and 5 in Zanzibar)
LANGUAGE Swahili (common language) and English
CAPITAL CITY: Dodoma region is the political capital city, located 309 km West of Dar es Salaam as commercial capital
POLITICAL: Free of ideological confrontations, ethnic problems and labor disputes; center of economic and political stability in Sub-Saharan Africa; multiparty democracy was adopted in 1992 and has not disturbed the peaceful political climate; country is home of a number of refugee camps for neighboring countries in the region (e.g. Burundi, Rwanda, Democratic Republic of Congo)
ROLE IN EAST AFRICA:
Easy networking; it boarders the Indian Ocean, has three international airports and extensive road networks; is strategically positioned as a hub for most surrounding landlocked countries including Malawi, Zambia, Burundi, Rwanda and Uganda as well as Eastern DRC; other sea ports include Zanzibar, Tanga, and Mtwara; Dar es Salaam Port and the international airport present themselves as gateways into East and Central Africa thus rendering Tanzania a logical investment destination for investors; furthermore, Tanzania is home of the East African Community Secretariat in Arusha
POPULATION DENSITY: 41 inhabitants / km² (as of 2007)
SHARE URBAN/RURAL POPULA-TION:
Urban 18 % and rural 82 %
BIG CITIES AND POPULATION: Dar es Salaam (2.5 million), MWanza (2.9 million), Mbeya (2.1 million), Arusha (1.3 million), Dodoma (1.7 million) and Tanga (1.6 million) (as of 2002)
CLIMATE:
Tropical climate; in highlands temperatures between 10 ° and 20 °C for both cold and hot seasons; rest of the country has an aver-age temperature of above 20 °C; hottest period between November and February (25 °–31 °C); coldest period between May and August (15 °C–20 °C); two rainfall regimes over Tanzania: unimodal (December–April, experienced in southern, southwestern, central and western parts of the country) and bimodal (October–December; March–May, found towards the northern coast)
PHYSIOGRAPHIC REGIONS: Islands and coastal plains to the East; inland saucer-shaped plateau; the highlands; Tanzania is also marked by the Great Rift Valley running from the North East of Africa through central Tanzania
ALTITUDE: Main mountains include Mount Kilimanjaro (5,895 m), Mount Meru (4,566 m) and Mount Rungwe (2,960 m); others are the Uluguru Mountains (2,648 m), Rubeho Mountains (2,576 m), Livingstone Mountains (2,521 m), Mbizi Mountain (2,418 m), Mahari Mountain(2,373 m) and Usambara Mountains (2,300 m)
MAIN WATER BODIES: Water surfaces cover 62,000 km2 and include Lake Victoria, Nyasa, Tanganyika, Rukwa, Kitangiri, Eyasi and Manyara; Tanzania also borders the Indian Ocean with significant part of the coastline, islands and waters within its boundaries
FOREST AND WOODLANDS: 3.350 km2
MINERALS: Gold, diamonds, tanzanite and various other gemstones, natural gas, iron ore, coal, spring water, phosphates, soda ash and salt
WILDLIFE: 12 National Parks, the Ngorongoro Conservation Area, 13 game reserves, 38 game controlled areas and about 120 national cultural heritage sites
FORESTRY: Non-reserved forest land (1,903.8 km2), forest/woodlands with national parks etc. (200 km2) and forest reserves (1,251.7 km2)
FISHERY: Practiced on the three large lakes, i. e. Victoria, Tanganyika and Nyasa, on Indian Ocean coastline, rivers and wetlands; potential yield of fish from natural waters is 730,000 metric tons annually; present catch is 350,000 metric tons
GDP – PER CAPITA (AT PURCHAS-ING POWER PARITY):
TZS 399,873 (as of 2006); 1,296 USD (as of 2007)
GDP SECTORS: Agriculture 45 %, industry 17 %, services 38 %
INFLATION RATE (CONSUMER PRICES):
7 % (as of 2007)
EXCHANGE RATE: 1 TZS = 0, 00053 € (as of 2009)
GDP GROWTH (2007): 6.2 %
POVERTY: About 35 % of the population live below poverty line (as of 2007), out of which 35.7 % are unable to access all basic needs (including energy services; the poor spend 35 % of household income on energy; the better off spend only 14,45 %)
CORRUPTION PERCEPTIONS INDEX 2007 (TRANSPARENCY INTERNA-TIONAL):
Rank 94 out of 179
AGRICULTURE: Tea, coffee, cotton, sisal, cashew nuts and horticulture
INDUSTRIES: Cement, agro processing, mining, textile, refining and construction industry

90COUNTRY INTRODUCTION
TANZANIA
Renewable Energies in East Africa
2 ENERGY MARKET IN TANZANIA
2.1 ENERGY SITUATION OVERVIEWSimilar to other East African countries, the majority of the population lives on biomass (90 %). The share of other energy sources is significantly lower with petroleum at 8 %, electric-ity at 1.2 % and others as solar, wind etc. at 0.8 %. Biomass is mainly used for cooking (primarily firewood and charcoal). Tanzania‘s energy demand and supply balance reflects the country‘s low level of industrialization and development. Tan-zania has no known petroleum or crude oil resources. There are substantial gas deposits and some coal is found, but the majority of used resources still comes from renewable biomass and waste. Concerning its petroleum products, Tanzania is fully dependent on imports. Electricity is generated mainly from hydro power and thermal (gas) plants8. Further detailed information about supply, resources and consumption is given in annex 7.
TABLE 3
Energy Prices November 2007/ Grid Electricity for Domestic Consumers
TOTAL ENERGY CONSUMPTION: 22 million toe or 0.7 toe per capita (energy consumption in rural areas accounts for about 85 % of total national energy consumption)
ELECTRICITY – PRODUCTION: 4,156 GWh (as of 2007)
ELECTRICITY – CONSUMPTION: 3,288 GWh (as of 2007)
ELECTRIFICATION RATE: urban 30 %, rural 2 %
PETROLEUM – CONSUMPTION: 1.45 million metric tonnes per annum (2005 est.)
OIL – PROVEN RESERVES: 45 million cubic metres (at Songo Songo and Mnazi Bay)
EXPORTS: 2.49 billion USD (as of 2008)
EXPORTS – COMMODITIES: gold, diamond, gemstones, nickel, tea coffee, cotton, cashew nuts and horticultural products including cut flowers
EXPORTS – PARTNERS: East African Community, SADC Countries, Europe, South Africa and East Asia
IMPORT – COMMODITIES: 5.901 billion USD (as of 2008)
IMPORT – PARTNERS: EU (22 %), South Africa (14 %), China (8 %), Japan (7 %), UAE (7 %), Kenya (5 %)
TOURISM (2006): 622,000 arrivals; 950 million USD revenue
8 SEE IEA, AS OF 2007 AND 2007
9 NOTE: THIS NUMBER ONLY CONSIDERS THE DECOMMISSIONED DOWAN’S POWER
PLANT AND THE AMOUNT OF POWER GENERATED UP TO JUNE 2008.
10 MAGESSA, 2008, P. 9.
11 THE MAJORITY OF HOUSEHOLDS USES WOOD OR CHARCOAL FOR COOKING; SEE ALSO
PROBEC, VIEWED IN 2009
2.2 ENERGY CAPACITIES, PRODUCTION AND CONSUMPTION
The table below (Table 1) shows the overall performance of the electric power sector:
A significant portion of electric energy is produced by hydro power followed by gas as the second important electric-ity source. The total installed capacity (hydro and thermal) was about 1,186 MW in 20089. Still, current hydro power re-source exploitation is estimated at less than 13 % of the avail-able potential10. The additional electricity demand is covered by small imports from Zambia and Uganda of around 2 % in 2006 and about 1 % in 2008.
The total electrification rate reached 10.8 % (as of 2008), of which urban electrification rate is around 30 % and the rural electrification rate only reaches 2 %. At the same time, 94 % of the rural population use biomass (such as wood or dung) as prior (non-electric) energy source. On household level, 12 % have access to the national grid, but only 1 % is able to use electricity for cooking11. This means that the vast majority of people have no access to electricity and the rural population is nearly completely excluded from this source of modern energy. Basically, the high costs of grid extension and connections as well as for the transport of petroleum products adversely impact on the pace of exploitation and extension of grid services especially to communities in rural areas. It costs more than 10,000 USD per kilometer to extend a high transmission line of 132 kW. The total number of customers connected to the grid is about 701,000. New connections are still limited to 3,255 connections per month. Regardless of connection bureaucracy at TANESCO, there are more than 100,000 applications for new connection per annum, which suggest an existence of a strong demand for the service12.
Regarding the sectoral energy consumption in Tanza-nia, the industry sector accounts for 11 % of the final energy consumption. The highest consumption is covered by other sectors such as residential, commercial and public services, agriculture etc. (83 %)13.
12 MAGESSA, 2008, P. 9-10 AND TANESCO, 2008
13 FOR DETAILS SEE ANNEX 8.5 – FINAL ENERGY CONSUMPTION BY ENERGY SOURCE
AND SECTOR, P. 42–43, AND IEA, AS OF 2007
Source: graph compiled by PSE AG with data from MEM (as of 2008) and from ProBEC,
as of 2009
Source: data compiled by the author from different sources, e.g. CIA, as of 2009
FIGURE 1
Shares of Total Primary Energy Consumption in Uganda
Biomass Petroleum Electricity Other
20 %
40 %
60 %
80 %
100 %
0 %
90 %
8 % 1.20 % 0.80 %

91COUNTRY INTRODUCTION
TANZANIA
Renewable Energies in East Africa
2.3 ENERGY PRICESThe average prices of energy sources in 2008 are provided in the table below. The prices fluctuate very much with crude oil prices and exchange rates.
2.4 MARKET ACTORS FOR PLANNING, REGULATION AND DISTRIBUTION
The Ministry of Energy and Minerals is responsible for policy planning, implementation and the facilitation of a conduc-tive atmosphere for the development and use of energy in the country. RE is a section in the Department of Energy of the MEM. Other energy sections include energy development and planning for electricity, petroleum and gas and are headed by Assistant Commissioners who report to the Commissioner for Energy and Petroleum Affairs.
Other actors who also take part in energy plan-ning, regulation and distribution include EWURA, REA, TANESCO and established IPPs. While REA is responsible for rural energy investment promotion, EWURA regulates en-ergy and water utilities. TANESCO is still the key generator, grid operator and distributor of grid power in the country.
3 RENEWABLE ENERGY POLICY FRAMEWORK CONDITIONS
The Government of Tanzania is committed to facilitate the increased use of RE as an important source in the energy mix and a major means to support the national development goals. Therefore, a number of legal framework measures, policies and strategies have been formulated and enacted to provide a con-structive atmosphere for industrial growth. In the following section, some of the existing policies and strategies adopted for the promotion and facilitation of an increased use of RE within the country are presented.
There are no Value Added Tax (VAT) and custom du-ties on solar and wind technology products. Other products and appliances are subject to a VAT of 20 %, while custom duties range from 20 to 30 %.
SHORT BUSINESS INFOZero import duty on wind and solar technology products.
ENERGY FORM PRICE REMARK
Diesel 1,430.00 TZS / l 0.780 € / l Price at filling station
Petroleum 1,340.00 TZS / l 0.730 € / l Price at filling station
Electricity 129.03 TZS / kWh 0.070 € / kWh For households
Electricity 70.00 TZS / kWh 0.039 € / kWh For industry
Kerosene 1,000.00 TZS / l 0.540 € / l Pump price
LPG 2,133.00 TZS / kg 1.160 € / kg Retail price at dealers
Charcoal 500.00 TZS / kg 0.270 € / kgNot sold per kg, but a bag of 60 kg is sold at 30,000 in TZS Dar es Salaam (differs in other townships)
TABLE 2
Average Energy Prices in Tanzania
Sources: data compiled by the author (as of 2008) with information on tariffs from EWURA
website (www.ewura.go.tz/fuelprices and www.tanesco.com)
TABLE 1
Power and Electricity Performance in Tanzania
Source: TANESCO, as of 2008
YEAR 2002 2003 2004 2005 2006 2007 JUNE 2008
Peak Demand (MW)Load Factor
474.969.5
50673.1
50976.1
55178.1
60367.9
65372.6
76074.7
Total Installed Capacity (MW) 882 871 911 953 958 1226 1186
Public %
71786
75587
63570
63366
61564
71558
71560
Private (IPPs) %
11514
11613
27630
32034
34336
51142
47140
Generation (GWh) by 2,892 3,239 3,394 3,771 3,588 4,156 2,154
Hydro 2,668 2,551 2,011 1,881 1,439 2,576 1,422
Thermal (mainly gas) 190 647 1,337 1,840 2,089 1,580 700
Imports from Zambia and Uganda 33.5 41.0 46.0 50.4 60.5 60.5 32.1
Electricity sales (GWh) 2,187 2,326 2,465 2,628 2,769 3,288 3,288
Total electricity customers 515,000 581,000 608,000 665,000 635,000 662,000 701,000

92COUNTRY INTRODUCTION
TANZANIA
Renewable Energies in East Africa
3.1 POLICY AND RENEWABLE ENERGY PROMOTION PROGRAMS
The current National Energy Policy (NEP) was issued in the year 2003. This is the second energy policy after launching the first NEP in 1992. Some legal framework measures and strategies have been formulated by the Government in order to enhance and guide the implementation of the energy pol-icy. These include the Rural Energy Act of 2005 established by the REA/REF, the Energy and Water Utilities Regulatory Authority (EWURA) Act of 2001 and the Electricity Act of 2008.
National Energy PolicyObjectives of the NEP14 are to ensure availability of reliable and affordable energy supply and use in a rational and sustain-able manner in order to support national development goals. Therefore the existing energy policy aims to establish energy production, procurement, transportation, distribution and end use systems in an efficient, environmentally sound, sus-tainable and gender-sensitized manner. The NEP comprises local and international political, economic, social, environ-mental and other structural changes. Key objectives of the NEP regarding RE technologies and services include:
Encourage efficient use of alternative energy sources Ensure priority on power generation capacity based on indigenous resources
Facilitate R&D and application of RE for electricity generation
Facilitate increased availability of energy services including grid and off-grid electrification of rural areas
Establish norms, codes of practice, standards and guidelines for cost-effective rural energy supplies and for facilitating the creation of an enabling environment for the sustainable development of RE sources
Introduce and support appropriate fiscal, legal and financial incentives for RE
Ensure the inclusion of environmental considerations in energy planning and implementation
Enhance co-operation with other relevant stakeholders Support R&D in RE technologies Promote entrepreneurship and private initiatives for the production and marketing of products and services for rural and renewable energy
Energy and Water Utilities Regulatory AuthorityEWURA, established by Act No. 11 of 2001 (amended as chapter 414)15, is responsible for water and energy regulation affairs. Being a legal corporate entity, EWURA promotes effective competition and economic efficiency, protects the interests of consumers and the financial viability of efficient suppliers and promotes the availability of regulated services to all consumers including low-income, rural and disadvantaged consumers. It also enhances public knowledge, awareness and understanding of the regulated sectors including:
Rights and obligations of consumers and regulated suppliers
Ways in which complaints and disputes may be initiated and resolved
Duties, functions and activities of EWURA
The key functions of EWURA include the issuing, renew-ing and canceling of licenses, the establishment of standards, terms and conditions for the supply of goods and services and the regulation of rates and charges. Other functions comprise performance monitoring of the regulated sectors with regard to investment, availability, quantity and standard of services, cost of services, efficiency of production and distribution of services. As to petroleum and natural gas, EWURA regulates transmission and distribution, facilitates the resolution of complaints and disputes, disseminates relevant information, consults with other regulatory authorities and administers the Act.
Rural Energy Act16
The Rural Energy Agency (REA) and the Rural Energy Fund (REF) are autonomous bodies established under the Rural Energy Act No. 8 of 2005. The Ministry of Energy and Min-erals (MEM) oversees the activities of REA/REF.As rural energy issues are diverse and characterized by vari-ous actors with different interests, an institutional framework was established in order to mobilize, coordinate and facilitate private and public initiatives for the development of a rural energy industry. In order to reach this goal, the REA/REF were established to:
Promote, stimulate, facilitate and improve modern energy access for social and commercial use in rural areas
Promote the rational and efficient production and use of energy
Utilize the REF to finance suitable rural energy projects Facilitate activities of key stakeholders with interest in rural energy
Provide capital subsidies to rural energy projects through a trust fund
Allocate resources to projects in a transparent manner and with well-defined criteria
The Act provides REF with funds from the following sources: Governmental budgetary allocations on an annual basis Contributions from international financial organizations, multilateral and bilateral agencies and other development partners
Levies of up to 5 % on the commercial generations of electricity from the national grid
Levies of up to 5 % on the generation of electricity in specified isolated systems
Fees for programs, publications, seminars, consultancy activities and other services provided by the agency
Interests or return on investment
REA/REF have already supported various off-grid projects with developers including 13 Small Hydro Power Projects, two Biomass Cogeneration Projects (TPCL & Sao Hill) and
14 SEE ALSO PARLIAMENT OF TANZANIA (WWW.PARLIAMENT.GO.TZ) > DOCUMENTS >ACTS
15 EWURA, AS OF 2001
16 SEE ALSO PARLIAMENT OF TANZANIA (WWW.PARLIAMENT.GO.TZ) > DOCUMENTS >ACTS

93COUNTRY INTRODUCTION
TANZANIA
Renewable Energies in East Africa
two Biomass Gasification Projects (Mafia & Mkonge Energy). These projects are currently at various stages of implementa-tion. The total expected capacity is 46.2 MW, 8,400 new con-nections are expected. The total expected costs for all projects are 118.9 million USD of which REA will contribute 4.2 million USD.
REA/REF support fiscal incentives for rural energy projects and programs and count amongst the national aid initiatives attracting international fiscal initiatives. The auton-omous agency provides capital subsidies and grants for suc-cessful rural energy projects developers. On top of the Gov-ernment subsidy to the REF, the agency is allowed to take up to 5 % surcharge on each unit of energy generated by commer-cial electricity producers. The REA/REF will grant a subsidy of 500 USD per rural connection that will be made.
REA/REF subsidies also support solar PV systems, but whereby all small rural PV systems need to be installed by a developer. The subsidy is Ltd. to 100 Wp for residen-tial systems and 300 Wp for Institutions. System subsidy is 2 USD per Wp. Bigger projects must be negotiated bilaterally with REA.
Electricity Act of 200817 The Act replaced the Electricity Ordinance Cap. 131 of 1931, which was amended eleven times and was stipulating monop-oly in the electricity sector. The act implements the NEP of 2003. It is opening up the sectors of electricity generation, transmission, distribution and sales to private sector participa-tion. The Act provides instruments for the regulator (EWU-RA), stipulates the roles of REA/REF and sets the general conditions for cost reflective tariffs and least-cost electrifica-tion options.
The Act recognizes other strategic Acts and legal enti-ties for the electricity sector such as the EWURA Act, Fair Competition Commission, Rural Energy Act, Standardized Small Power Purchase Agreement for 100 kW to 10 MW, Standardized Power Purchase Tariff and Fair Competition Tribunal. The act allows for electricity to be generated from any primary source (including RE). Moreover, the Act lays down that the Power Sector Master Plan (PSMP) be updated annually, which is an opportunity for new confirmed resourc-es to be accommodated as potential options for power sup-ply and use in the country. It also calls for the preparation of a Rural Electrification Strategy & Plan to promote access to electricity in rural Tanzania.
In general, the Electricity Act 2008 has opened up windows for increased RE promotion especially in rural areas. As to the aspects of least cost and cost effectiveness in elec-tricity supply, more research and development in RE would increase competitiveness of the same.
Finance SectorIn Tanzania there are 25 commercial banks, three financial institutions, more than 150 Bureau de Changes and a number of local Microfinance Institutions (MFIs) and savings and credit organizations. The participation of local financial enti-
ties in the promotion and support of RE businesses, however, has been Ltd..
A study on removing barriers for solar PV markets in Tanzania revealed the fact that a financing scheme for solar PV systems could raise the market segment of potential cus-tomers (those who can buy right away from shelves) from 10 % to 40 %. A number of international finance organizations like the World Bank, Triodos Bank of the Netherlands and E+Co are already lending money to energy projects and private com-panies involved in RE for the following projects:
The World Bank is supporting a solar PV scheme named Sustainable Solar Market Packages (SSMP) piloted in the Rukwa region. The region has been divided into three zones. Each of them will be served by one contractor. Education, health and community centers will be supplied with solar systems. In addition, commercial enterprises are being encouraged to develop their own supply chains and technical bases in the area. Currently tenders are being evaluated.
The Triodos Bank supported the private company Umeme Jua Ltd.. with a loan from the Dutch Program for Coop-eration with Emerging Markets (PSOM)18.
E+Co has been investing a total of 1.6 million USD in 13 Tanzanian enterprises since 2001. The companies include FREDKA, TaTEDO, ENSOL, ZARA SOLAR, RESCO, BETL, UMEME JUA, FADECO, FELISA, MENA WOOD, REX, OMK and AFROZONE. Zara Solar, for example, has been receiving 350,000 USD since 2002. Zara was established in 1998 by the local entrepreneur Mohammed Parpia and is selling SHS in MWanza. To date, Zara has sold over 10,000 SHS (due to legal require-ments other financial information for the companies can-not be quoted). The average interest rate is 8 % (in USD).
The Tanzania Investment Bank is the Trust Bank that handles and transacts REA/REF funds to rural energy developers.
3.2 DONOR AID ACTIVITIES
SIDA/MEM Solar PV ProjectThe MEM, with support from the Swedish International De-velopment and Cooperation Agency (SIDA), is engaged in a five-year national project to facilitate solar PV market develop-ment in rural Tanzania. The Swedish support makes up about 3 million USD in total. The project started in May 2005 and consists of four components:
Business development services (BDS) for existing and start-up companies
Marketing and public awareness Development of a solar network Policy reforms and institutional development
With BDS, capacity building is provided for regional dealers, suppliers, importers and local microfinance agents addressing specifically business planning, marketing, bookkeeping, ac-counting and product knowledge. Technicians are trained in
17 SEE PARLIAMENT OF TANZANIA (WWW.PARLIAMENT.GO.TZ) > DOCUMENTS >ACTS
18 FOR MORE INFORMATION ON THE PSOM SEE WEBSITE OF NL EVD INTERNATIONAAL
– PSOM (WWW.EVD.NL/HOME/FINANCIERING_PROJECTEN/INVESTEREN/PROGRAM-
MA.ASP?LAND=PSM)

94COUNTRY INTRODUCTION
TANZANIA
Renewable Energies in East Africa
PV system design, installation and maintenance. Both sup-pliers and dealers can apply for specific training and support. Support is granted to them on demand and on a case-by-case basis. The training of dealers and technicians is sub-contract-ed.
Regarding marketing, the component focuses on end users and involves awareness creation for solar technology, its availability and workability through physical demonstration. Other marketing strategies include promotional campaigns at national and regional level using TV, radio broadcasting, posters, brochures and other means. Suppliers and local deal-ers are made to actively participate in the campaign, and a special solar campaign targeted to Savings and Credit Coop-erative Society (SACCOS) is carried out.
The networking component aims at the development of a networking association of all solar PV stakeholders in the country. TASEA was chosen to support institutional capacity building, to support the SunENERGY magazine and to host solar energy days.
The policy and institutional development component aims at developing a system to enforce solar PV quality stand-ards through the Tanzanian Bureau of Standards. It also fo-cuses on taxation issues and on the dissemination and sharing of project findings among policy makers in various ministries and awareness creation in higher levels of the Government.
The SIDA/MEM solar PV project awarded small grants to six rural based solar market de-velopment projects activities. It granted 67 % of
the project costs with the remaining sum to be met by the project owners. The maximum grant from SIDA/MEM for solar PV projects is 20,000 USD. Njombe Electronics Center and Ensol Tanzania Ltd., for example, are among the six com-panies that received the grant. The Njombe Electronics Cent-er project involved solar PV market development campaigns in the Ludewa district and the training of rural electricians and sellers of solar PV systems. This training covered speci-fication, installation, troubleshooting and maintenance and aimed at building capacity at the local level. The Ensol Tanza-nia Ltd. project involved the development of a dealer network, technical training and market development campaigns in the Karatu, Ngorongoro, Hanang and Mbulu districts (further information can be found in chapter 7 Bibliography among the indicated internet sources).
UNDP/GEF/MEM Solar PV ProjectThe project is similar to the SIDA/MEM solar PV project and was piloted in MWanza region between 2002 and 2007. It eventually will be replicated in the lake zone. The project has four components covering policy support and institutional strengthening, awareness raising, private sector strengthen-ing, financial engineering and learning as well as replication. Under policy support, PV standards were developed. Under the awareness component, information about companies and institutions active in solar energy in the MWanza region was given. Regarding private sector strengthening, technical and business skills were imparted to target groups. Under the fi-nancial engineering, dealers received loans through a local bank and end users got consumer financing through two selected pilot SACCOS in the region. Moreover, actors will-
ing to enter solar income generating activities were supported through a subsidy to a maximum of 40 % of the system costs. After three years of project activities, learning and replication started in other lake zone regions.
The project supports part of the investment costs for pilot solar PV income generating activities in rural areas of MWanza, where more than 12 firms benefited. Such in-come generating activities included the provision of solar PV systems (80 Wp) for Phone charging in Sengerema district. The system owner at Kijiweni currently charges more than 60 cell phones at a rate of 300 TZS. The grant contributed was 30–40 %. Maximum contribution of the project was 3,000,000 TZS (about 2,500 USD) per project. The project cost is estimated at 2.5 million USD19.
NGO Initiatives: TASEA, TaTEDO and Clinton Foundation A number of NGOs are involved in promotion of RE. The Tanzania Solar Energy Association (TASEA) is a national as-sociation that brings together RE actors and stakeholders tar-geting improved sector dynamics. These include, among oth-ers, lobbying and advocacy for a sound sector environment, quality peer pressure creation, information dissemination, capacity building (training, magazines, workshops, solar days etc.) and networking.
The Tanzania Traditional Energy Development and Environment Organization (TaTEDO) is involved in capac-ity building for sustainable energy services. It implements RE projects in rural areas with support from development partners including the EU, Norway, the Netherlands and the UN. The Clinton Foundation is supporting solar PV installations for rural health facilities in Mtwara and Lindi regions to sup-port HIV reduction initiatives by powering vaccination fridg-es, wards, laboratories, computers and staff houses to motivate them to remain in rural areas.
3.3 MARKET RISKSBusiness environment in Tanzania is currently very stable with legal support through policies and framework measures as well as political will. The translation of political will is, however, not necessarily executed through budgets allocated for energy. That may result in delays and unimplemented com-mitments when it comes to decision-making on investments. Corruption in the energy sector needs a strong political will and commitment. If the current fight against corruption in the energy sector is not backed-up by high level political and Government leaders, it could negatively impact on investment planning and decision-making. So far, there is no restriction on transfer of margins in relation to investors’ interests.
19 FURTHER INFORMATION CAN BE FOUND AT THE CORRESPONDING PROJECT WEBSITE
SOLAR MWANZA (WWW.SOLARMWANZA.ORG)

95COUNTRY INTRODUCTION
TANZANIA
Renewable Energies in East Africa
4 STATUS AND FUTURE OUTLOOK FOR RENEWABLE ENERGIES
RE are still in an infancy stage with a Ltd. number of project developers, promoters, finance providers, service companies and planners. RE is a section in the Department of Energy of the MEM. Other sections include energy development, plan-ning, electricity, petroleum and gas, which are all headed by Assistant Commissioners who report to the Commissioner for Energy and Petroleum Affairs.
RE sources contribute less than 1 % of the national energy balance. Biomass energy within the RE section ac-counts for more than 90 % of the cooking resources in Tan-zania, but the budget allocated by the Government for RE (including biomass energy services) is Ltd. to less than 1 % of the annual energy development budget of the MEM. The budget for year 2007/2008 was 354 million USD, of which local contribution is 197 million USD. Out of this budget only about 300,000 USD were allocated for RE and energy efficiency (EE).
Nevertheless, RE applications in Tanzania have a good potential for powering development goals considering their local availability, the Ltd. energy per capita consump-tion, the sparsely populated communities and the ever-hiking prices of imported fossil fuels.
Presently, there is no manufacturer of RE products in Tanzania. REDCOT, a private company, and the College of Engineering and Technology (CoET) of the University of Dar es Salaam have recently started building up education facili-ties to stimulate entrepreneurship in the production sector.While the Tanzania Bureau of Standards (TBS) is strictly ad-vocating quality products, it has no testing facility for most of RE products.
The following RE education facilities can be found in Tanzania:
CoET: The college offers courses for the manufacturing and fabricating of RE technologies. Technologies such as windmills, solar water heaters and micro hydro turbines are being researched. In addition, a masters course on RE has recently been introduced.
University of Dar es Salaam: The university’s Physics De-partment is offering solar PV activities to physics students.
VETA: The Vocational Education and Training Authority has piloted a curriculum on solar PV systems.
MLVTC: The Mafinga Lutheran Vocational Training Center has been offering courses for empowering skills on RE for more than five years.
TASEA: The Tanzania Solar Energy Association has been offering short courses on the basics of solar PV systems including system components, system planning, sizing, installation, troubleshooting and maintenance.
KARADEA: The Karagwe Development Association has RE training facilities.
TaTEDO: The Tanzania Traditional Energy Development and Environment Organization also has training facilities for RE.
In total, approximately 300 technicians for basic solar PV sys-tems were trained in Tanzania over the last years. It is, how-ever, important to note that a number of Tanzanian experts on RE undertook studies in the Netherlands, Germany, UK, USA, Japan, India and China.
4.1 BIOMASS/BIOGASMore than 90 % of primary energy consumption in Tanzania come from biomass. The administration of the forests in Tan-zania covers 38.83 million hectares, and the fuel consumption in Tanzania in 2005 was 46.2 million cubic meters of solid round wood. However, biomass used in rural Tanzania is col-lected by the people themselves, but vendors from urban areas employ the rural poor to collect biomass for urban use. The majority of the urban population uses firewood and charcoal for cooking. A few people from the middle and upper class use electricity and LPG for cooking in urban areas. Fuel wood and charcoal business is largely practiced as an informal busi-ness.
In Tanzania around 6,000 small residential biogas plants for cooking purpose are in operation (Guardian news-paper of 26.7.07; and Citizen newspaper of 24.7.07). Tanzania has the power capacity for cogeneration of more than 200 MW from sugarcane residues (bagasse) in the four sugar factories of Mtibwa, Kilombero, Kagera and Tan-zania Planting Corporation (TPC). Mtibwa currently gener-ates 7 MW although it has the capacity to generate 15 MW. TPC has invested in the power plant generating 15 MW of which 7 MW will be fed into the national grid.
A total of eight developers have been registered by the Tanzania Investment Center (TIC) to develop biofuel activities in Tanzania including Sun Biofuels Tanzania Ltd., CAMS Agri-Energy Tanzania, and Sweden’s Sekab Company. A Germany company, PROKON, has mobilized 1,800 farmers in Rukwa region to plant jat-ropha with an agreement to buy seeds from them for biofuel production. These activities are part of a PPP project with German Development Cooperation. The company FELISA is involved in palm oil production for energy.
UNIDO is managing the implementation of a pilot project on Cleaner Integral Utilization of Sisal Waste for Bi-ogas and Bio-fertilizers initiated in 2001. It became a real-ity in May 2006 when Bio-Energy Berlin (BEB) of Germany was awarded the contract to supply equipment, material and parts for the construction, installation and commissioning of a pilot biogas demonstration plant at Hale Estate in Tanga Re-gion. BEB opted for steel tanks instead of concrete tanks and subcontracted the erection of the tanks to Sichuan Guojiao Energy and Environmental Protection Engineering Co. Ltd. from Chengdu in Sichuan Province of China. Jinan Diesel Engine Co. Ltd. from Jinan City was subcontracted to sup-ply a 180 kW biogas engine and generator (CHP unit). The pilot plant was operational by July 2007, six months after the construction started. This pilot biogas demonstration plant utilizes sisal biomass from the stationary decorticator and the hammer mills installed at Hale Estate. It utilizes only 30 % of the sisal biomass generated which is normally 100–130

96COUNTRY INTRODUCTION
TANZANIA
Renewable Energies in East Africa
tons. The plant has a 180 kW engine and generator. With one more storage tank added, the plant capacity can be increased to utilize 45 % of the leaf waste to produce up to 300 kW of electricity.
Other biomass initiatives include: KAKUTE of Arusha is promoting jatropha by buying jatropha seeds and processing biofuels for different uses.
Mgololo Paper Industry in Iringa Region generates about 40 MW from wood residues. The energy is used for run-ning paper making machineries.
Tanzania Wattle industry in Njombe generates about 2.5 MW from wattle tree residues, which are fed into the national grid. The industry is planning to generate 15 MW and sell to TANESCO. Research has established that 2.4 kg of wattle residues can generate 1 kWh of electricity.
The City of Dar es Salaam is in the process of generating 2.5 MW from waste from a closed dumpsite at Mtoni. Methane from the dumpsite is already being collected and burnt to protect the environment. It is expected that in a near future the gas could be used to generate electricity. This is the only Clean Development Mechanism (CDM) project in Tanzania.
The SADC Biomass Energy Conservation Project (ProBEC) under the MEM has developed, constructed and tested 60 prototype barns for curing tobacco in Tabora, where preliminary results show savings of up to 50 % of wood as compared to traditional curing barns.
TaTEDO has been involved in development, promotion and dissemination of improved firewood and charcoal stoves in Tanzania for more than 15 years. About 15,000 improved wood and charcoal stoves are produced and sold in the country per month.
Presently, the following private companies are generating electricity from biomass either for their own use or for sell-ing to TANESCO: sugar companies (generating 38 MW), TANWAT (wood/forestry, generating 2.5 MW), Sao Hill (wood/paper, generating 1.0 MW), Mufindi Paper Mills (generating 15 MW) and Hale Sisal Estate (sisal waste biogas, generating 300 kW).
SHORT BUSINESS INFOBiomass consumption per capita is 1.13 m3/year Cogeneration capacity (200 MW) in four sugar plants are nearly untapped8 developers have been registered to develop biofuels15,000 improved stoves are produced and sold per month6,000 small residential biogas plants are in operationBEB supplied equipment of a pilot biogas demonstration plant
4.2 SOLAR ENERGYTanzania is endowed with a global solar radiation of 4 to 7 kWh/m2/day. Tanzanian solar industry has been growing fast over the last five years. This is caused by various factors including frequent modern energy crises in the country, in-creased level of awareness in some communities where promo-tional projects are in progress, globalization that has brought
rural Tanzanians in touch with Information Communication Technology (ICT) and the growth of the number of organiza-
tions and commercial institutions op-erating in areas without electricity.The current total installed electricity generation from solar energy is esti-
mated at around 1.8 MW. The annual capacity was 100 kWp in 2005 and 200 kWp in 2006. The situation indicates a posi-tive growth in the sector, which can also be seen from the increase in the number of solar companies. While the number of solar companies was less than 10 in 2000, there were al-ready 20 in 2007. These companies rarely do have branches or established networks in rural areas. Promotional projects to stimulate market development and to remove market barriers are ongoing, e. g. the SIDA/MEM project and the UNDP/GEF/MEM project in the MWanza region (see also chapter 4.2 Donor Aid Activities).
The REA/REF subsidy goes to solar PV systems in general; in addition all small rural PV systems of up to 100 Wp that are installed by a developer will be subsidized with 2 USD per Wp (see chapter 4.1 Policy and Renewable Energy Promotion Programs).
The two associations active in solar energy market development, training and information dissemination are TASEA and TaTEDO. For more detailed description see chapter 4.2 Donor Aid Activities.
SHORT BUSINESS INFOInstalled PV capacity is around 1,8 MW.The annual installation rate is increasing to over 200 kWp.Two PV promotion projects with subsidy schemes are ongoing (the SIDA/MEM project and the UNDP/GEF/MEM project).20 solar companies are registered.PV systems up to 100 Wp will be subsidized with 2 USD/Wp by REA/REF.
4.3 WIND POWERThe potential for wind energy has not been quantified yet. According to Climatologic Statistics of East Africa (Part III), Tanzania, edited by the East Africa Meteorological Depart-ment in September 1975, the annual average wind speeds vary from 2.1 m/s in the Morogoro region to 6.3 m/s in Tanga re-gion. The data were measured in 17 regions, but in an insuf-ficient height of about 2 m.
Ongoing wind studies in the country considering sur-face roughness and heights over 30 m have already revealed some more potential sites for wind farms in Tanzania. The Singida region and Makambako in the Iringa region have for example revealed wind speeds of more than 8 m/s, which is good and promising for electricity generation at reasonable costs. Other areas with wind speeds of more than 4.5 m/s are Mkumbara, Karatu and Mgagao. Wind farms for commer-cial plants appear promising at Makambako and Kititimo in Singida as well as at Mkumbara, Karatu and Mgagao. Wind resource measurements in other areas are planned and include the Rift valley in Rukwa, the Livingstone Mountains, the Mafia island, Singida and Shinyanga, just to mention a few.

97COUNTRY INTRODUCTION
TANZANIA
Renewable Energies in East Africa
Good wind speeds are also expected along the eastern coast-line. Areas along rift valleys, the southern highlands and along Lake Victoria are reported to have some possibilities of potential wind sites as well.
Unfortunately, no reliable wind maps exist for Tan-zania so far. The lack of wind energy feed-in tariffs has nega-tively affected the development of wind energy. However, the national grid in such areas of high wind speeds is available.
Over the years, wind energy resources in Tanzania have been used for windmills to pump water. Less has been done in electricity generation. These wind mills (installed numbers of windmills indicated in brackets) are found in the Singida (36), Dodoma (25), Iringa (16), Shinyanga (6), Tabo-ra (4), Arusha (4), Klimanjaro (1) and Mara (8) regions. 44 % of them are still operational, the remaining ones are defunct.
4.4 GEOTHERMAL POWERThere is some potential of geothermal resources in Tanzania. Currently, the existing potential is being assessed by the Gov-ernment of Tanzania through the MEM. A geological survey of Tanzania has been conducted since June 2006 in collabora-tion between MEM and the Federal Institute for Geosciences and Natural Resources (BGR) of Germany. The project part-ners have been assessing the geothermal potential at Songwe. Songwe is located about 20 km west of Mbeya, which is the third largest city in Tanzania. The estimated geothermal po-tential there is about 600 MWe.
Detailed surveys, however, are still required to come up with realistic figures on the available potential.
4.5 HYDRO POWER
Small HydroOut of the available 315 MW small hydro potential in Tan-zania, less than 8 MW have been exploited by installing two power plants. The MEM has been effective in funding studies for small hydro power plants. Studies for seven regions includ-ing Ruvuma, Rukwa, Iringa, Kagera, Morogoro, Mbeya and Kigoma were facilitated by MEM in 2006 and 2007.
Large HydroOver the years, the power sector of Tanzania has been domi-nated by hydro power. Poor rainfalls in the past few years, however, have resulted in a shortage of water for the turbines. This has been further aggravated by agricultural activities that are going on upstream. The table below provides data on hy-dro electricity installations as of June 2007. All stations are operated by the national utility TANESCO.
Feasibility studies20 reveal the potential of hydro power as follows: Ruhudji (360 MW), Rumakali (222 MW), Nakatuta (15 MW) and Mandera (21 MW). Other potentials studied to a pre-feasibility level include Mpanga (144 MW), Masigira (118 MW), Malagarasi (11 MW) and Stiglers Gorge (2100 MW). All these are possible business opportunities that could be exploited.
STATION UNITS SIZE (MW)
INSTALLED CAPACITY (MW)
GENERATED ELECTRICITYIN 2007 (GWH)
SYSTEM
Kidatu 4 51.0 204 964 Great Ruaha River
Kihansi 3 60.0 180 662 Kihansi River
Mtera 2 40.0 80 363 Great Ruaha River
New Pangani falls 2 34.0 68 323 River Pangani
Hale 2 10.5 21 88 River Pangani
Nyumba ya Mungu 2 4.0 8 35 River Pangani
Total hydro / 198.5 561 2435 /
TABLE 3
Hydro Electricity Installations in Tanzania
Source: TANESCO, as of 2007
20 TANESCO, AS OF 2007

98
TANZANIA
Renewable Energies in East Africa
5 RENEWABLE ENERGY BUSINESS INFORMATION AND CONTACTS
The private and Government-related actors in Tanzania’s RE sector are manifold. In the following, a list of companies and organizations indicates this variety.
5.1 RENEWABLE ENERGY COMPANIES & BUSINESS- RELATED ORGANIZATIONS
NAME ADDRESS EMAIL WEB PAGE TECHNOLOGY SHORT DESCRIPTION
A. A. Power and Tools Ltd.
Along Zanaki StreetP. O. Box 1205Dar es Salaam – TanzaniaPhone: +255 22 2123284
/ / Solar energy systems Supplies of solar systems, equipment and balance of system
AGLEX Company Ltd.
Plot 302, Regent Estate, Victoria Area,Ali Hassan MWinyi Road, P. O. Box 9818Dar esSsalaam – TanzaniaPhone: +255 22 2700069
www.aglexcompany.com Solar energy systems Solar equipment and 2-way radios supply and installations
Artumas Group
Artumas Group Inc. 900, 606 – 4th Street SW, Calgary, Alberta, CanadaPhone: +(1) 403 294-1530
Dar es Salaam Office Artumas Energy (T) Ltd. P. O. Box 203, Plot 8/1,Tumbawe Road, Oyster Bay Dar es Salaam – TanzaniaPhone: +255 22 266 6622
Mtwara Office, P. O. Box 432 Mtwara – Tanzania Phone: +255 23 233333
www.artumas.com Oil and gas
Independent oil and gas exploration and production company with significant asset position and competitive advantage in the emerging resource basins of East Africa
BP (Tanzania) Ltd.Kurasini, Bandari Road, P. O. Box 9043, Dar es Salaam – TanzaniaPhone: +255 22211126972
www.bp.com Solar PV Supply of solar PV systems and equipment
Chloride Exide Tanzania Ltd.
Millenium Business Park, along Morogoro Road P. O. Box 12746Dar es Salaam – TanzaniaPhone: +255 22 2450
Solar energy technologies
Sale of solar energy systems and components
D. Light Design East Africa
Coral Lane Plot 580, Msasani Peninsula, P. O. Box 110297Dar es Salaam – TanzaniaPhone: +255 22 2601559
[email protected] www.dlightdesign.com Solar lanterns
International lighting and power company with design, manufacturing and distribution capabilities
Davis & Shirtliff (T) Ltd.
Nyerere Road, opposite Shoprite Supermarket,P. O. Box 10725, Dar es Salaam – TanzaniaPhone: +255 22 2112515
[email protected] www.tzdayliff.com Solar water pumpsSale and installation of solar PV systems and water pumps
Energy for Sustainable Development (T) Ltd.
P. O. Box 8694Dar es Salaam – TanzaniaPhone: +255 22 2667758
[email protected] www.esdt.co.tz Technology-freeConsulting firm in sustainable energy development
ENSOL (T) Ltd.
P. O. Box 422273rd Floor NSSF Ubungo Office Block,Dar es SalaamPhone: +255 22 2450468
[email protected] www.ensol.co.tzSolar energy technologies (PV and thermal)
Solar energy contractors for sales, services, solar water pumps, backup systems
Farming for Energy for Better Livelihoods in Southern Africa (FELISA)
P. O. Box 1349Kigoma – TanzaniaPhone: +255 28 2804909Fax: +255 28 2804904
/ Biofuels
Palm oil growing for biodiesel production, processing and electricity generation
GS Power Installations Ltd.
Gerezani Area,P. O. Box 45924Dar es SalaamPhone: +255 22 2183278
[email protected] www.gspower.piczo.comSolar energy equipment and control systems
Supply of solar equipment, balance of systems and security systems
Kagera Sugar Company
P. O. Box 16541Dar es Salaam – TanzaniaPhone: +255 22 2862661Fax: +255 22 2862667
[email protected]/ Cogeneration
Combined heat and electricity generation from bagasse
KAKUTE Ltd. (Kampuni ya Kusambaza Teknolojia)
Nane Nane Grounds, P. O. Box 13954,Arusha – TanzaniaPhone: +255 27 2544549
[email protected] / BiofuelsPromotion of jatropha growing and products
Katani Ltd.
Katani House, 1 Tasma Road, Bombo Area,P. O. Box 123Tanga – TanzaniaPhone: +255 272644401
[email protected] www.katanitz.com Biogas
Private firm generating biogas from sisal residues for electricity generation
COUNTRY INTRODUCTION

99
TANZANIA
Renewable Energies in East Africa
NAME ADDRESS EMAIL WEB PAGE TECHNOLOGY SHORT DESCRIPTION
Kilombero Sugar Company P. O. Box 50, Kidatu MorogoroPhone: +255 23 2626027/2119525
[email protected]@africaonline.co.tz
/ CogenerationCombined heat and electricity generation from bagasse
Locking Center Chromagen Solar water heaters
102 Kinondoni Road,P. O. Box Dar es Salaam – TanzaniaPhone: +255 22 2666547
/ / SolarSolar water heater supply and services
Mtibwa Sugar Factory
P. O. Box 16541Dar es Salaam – TanzaniaPhone: +255 22 2862661Fax: +255 22 2862667
Combined heat and electricity generation from bagasse
NORPLAN Tanzania Ltd.
Plot 127 Mafinga Street, P. O. Box 2820Dar es Salaam – TanzaniaPhone: +255 22 2668090/2667020Fax: +255 22 2668340
[email protected] www.norplan.comEnergy technologies and services
Consulting firm in energy
5.2 LOCAL INSTITUTIONS RELATED RENEWABLE ENERGY BUSINESS
PROJECTS AND DEVELOPMENT PARTNERS
NAME ADDRESS EMAIL WEB PAGE TECHNOLOGY SHORT DESCRIPTION
African Rural Energy Enterprise Development (AREED)
c/o TaTEDO, off Shekilango Road near National Socio Welfare InstituteP. O. Box 32794,Dar es Salaam – TanzaniaPhone: +255 22 2700438Fax: +255 22 2700438
[email protected] www.tatedo.orgSolar, wind, biomass, MFPs
NGO specializing in dissemination of sustainable energy services and biofuels
Biomass Energy Tanzania Ltd.c/o P. O. Box 1828 Tanga
[email protected] / Biomass Production of briquettes
Danish Embassy,
Embassy of Denmark Ghana Avenue P. O. Box 9171 Dar es Salaam – TanzaniaPhone: +255 (22) 211 3887 Fax: +255 (22) 211 6433
Wind technologies and services
Development partner in the wind industry
Deutsch-Tansanische Partnerschaft e. V. (DTP)
Deutsch-Tansanische Partnerschaft e. V. (DTP Furtredder 18, 22395 Hamburg, Germany
[email protected] www.d-t-p-ev.deWind, solar, biomass
Volunteer project in renewable energy and environment
Eastern and Southern African Management Institute (ESAMI)
ESAMI,P. O. Box 3030Arusha – TanzaniaPhone: +255 27 2508384-7
[email protected] www.esami-africa.orgSolar, wind and biomass
Training institute offering periodical renewable energy courses
German Technical Cooperation (GTZ)
GTZ Office Dar es Salaam, P. O. Box 1519, Dar es Salaam – TanzaniaPhone: +255 222 115901Fax: +255 222 116504
[email protected] www.gtz.deBiomass energy and conservation
Preparation, implementation and evaluation of technical cooperation projects
Germany Embassy
Umoja HouseGarden Avenue und Mirambo Street, P. O. Box: 9541, Dar es Salaam – TanzaniaPhone: +255 – 22 – 211 7409 –15 Fax: +255 – 22 – 211 2944
[email protected] www.daressalam.diplo.de/
Sustainable energy technologies
Development partner and key supporter of energy activities and initiatives
Japanese Embassy
P. O. Box 2577, Plot No. 1018, Ali Hassan MWinyi Rd, Dar es Salaam – TanzaniaPhone: +255-22 2115827/9Fax: +255-22 2115830
www.tz.emb-japan.go.jp/ Technology-freeDevelopment partner in environmental issues and climate change initiatives
Netherlands Embassy
PO Box 9534, Umoja House, 4th Floor, Corner Mirambo Street/Garden AvenueDar es Salaam – TanzaniaPhone: +255 22 2110000 Fax: +255 22 2110044
Solar and biomass
Development partner
Norwegian Embassy (NORAD)P. O. Box 2646, Dar es Salaam, Phone: +255 22 2113366/2139955Fax: +255 22 2116564
Biomass, solar, wind
Development partner, among others, key supporter of energy activities and initiatives
Project for Biomass Energy Conservation (ProBEC)
CoordinatorP. O. Box 1519Dar es Salaam – TanzaniaPhone: +255 713 420380
[email protected] BiomassSADC biomass conservation project administered by GTZ
SIDA/MEM Solar PV Project
SIDA/MEM Solar PV Project P. O. Box 71605Dar es SalaamPhone: 255 22 2667758
[email protected] www.esdt.co.tzSolar PV technology
Solar PV market development project
Swedish EmbassyMirambo Street/Garden Avenue, P. O. Box 9274, Dar es Salaam Phone: +255-22-219 6500/219 6503
www.swedenabroad.com/
Sustainable energy technologies
Development partner and key supporter of energy activities and initiatives
COUNTRY INTRODUCTION

100
TANZANIA
Renewable Energies in East Africa
NAME ADDRESS EMAIL WEB PAGE TECHNOLOGY SHORT DESCRIPTION
The European Commission’s Delegation in Tanzania
The European Commission’s Delegation in TanzaniaUmoja House, P. O. Box 9514Dar es Salaam, TanzaniaPhone: +255 22 2117473/6Fax: +255 22 2113277
www.deltza.ec.europa.eu/en/contact.htm
Solar, wind, biomass and climate change mitigation
Development partner supporting energy and climate research
UNDP/MEM PV Project MWanza
UNDP/MEM Solar PV Project,P. O. Box, Dar es SalaamPhone: 255 22 2500857Fax: 255 22 2500858
[email protected] www.solarmwanza.orgSolar PV technology
Solar PV market development project
United Nations Development Programme (GEF, SGP)
UNDP, Msimbasi Creek Housing Estate Ltd.Kings Way/Mafinga StreetPlot 134-140 Kinondoni P. O. Box 9182 Dar es Salaam – TanzaniaPhone: (255-22) 2199255
[email protected] www.tz.undp.org/Solar, wind, biomass, MFPs
Development partner in various sectors including energy and environment
United Nations Industrial Development Organisation (UNIDO)
UNIDO Msimbasi Creek Housing Estate Ltd.Kings way/Mafinga StreetPlot 134-140 P. O. Box 9182, Dar es Salaam – TanzaniaPhone: 255-22 2199264Fax: +255-22 2668749
[email protected] www.unido.orgBiomass, micro hydro, solar
Development partner
World Bank – SSMP
World Bank, 50 Mirambo Street, P. O. Box 2054, Dar es Salaam – TanzaniaPhone: +255-22 2163200Fax: +255-22 2163295/2113039
go.worldbank.org/PFHCJT2VM1
OR
web.worldbank.org/
Solar, biomass, wind, micro-hydro
Development partners supporting sustainable energy initiatives in Tanzania
NON-GOVERNMENTAL ORGANIZATIONS
NAME ADDRESS EMAIL WEB PAGE SHORT DESCRIPTION
Karagwe Development Association (KARADEA) Karadea Solar Training Facility, P. O. Box 299, Karagwe – TanzaniaPhone: +255 28 2222971
/ / Training and awareness creation on solar energy systems
Mafinga Lutheran Vocational Training Center P. O. Box 15, Mafinga, Iringa – TanzaniaPhone: 255 767 255780
/ Vocational training on renewable energy technologies
Miradi ya Gesi ya Samadi Dodoma (MIGESADO)
P. O. Box 9, Dodoma – Tanzania [email protected] / Promotion and dissemination of biogas and improved wood and charcoal stoves
Mwanza Rural Housing Programme (MRHP) P. O. Box 2745, MWanzaPhone: +255 754 654883
/ / Promotion, dissemination and installation of improved biomass stoves and solar PV systems credits
Sustainable Development through Renewable Energies in Tanzania (SUDERETA)
P. O. Box 3033, Arusha Phone: +255 27 2508855
[email protected]@yahoo.com
/ NGO promoting and disseminating RETs in Tanzania
Tanzania Solar Energy Association (TASEA) P. O. Box 32643, Dar es Salaam – TanzaniaPhone: +255 22 2457416Fax: +255 22 2457416
[email protected] www.tasea.org Information dissemination, lobbying, advo-cacy, networking and advisory services
Tanzania Traditional Energy Development and Environment Organisation (TaTEDO)
P. O. Box 32794, Dar es Salaam – TanzaniaPhone: +255-22-2700771/2700438Fax: +255-22-2774400
[email protected] www. tatedo.org NGO specialized in dissemination of sustainable energy services
Zanzibar Solar Energy Association (ZASEA) P. O. Box 3754Zanzibar – TanzaniaPhone: +255 24 5502232
Information dissemination, lobbying, advocacy, networking services
COUNTRY INTRODUCTION

101
TANZANIA
Renewable Energies in East AfricaBIBLIOGRAPHY
6 BIBLIOGRAPHY
Central Intelligence Agency – CIA (2009): World Fact Book – Tanzania (www.cia.gov/library/publications/the-world-factbook/geos/tz.html)
EWURA (2001): EWURA Act Chapter (www.ewura.go.tz/pdf/EWUREA-ACT-CHAPTER-414.pdf)
GTZ (2005): Liquid Biofuels for Transportation in Tanzania: Potential and Implications for Sustainable Agriculture and Energy in the 21st Century, Eschborn, Germany
IEA (2007a): Statistics 2007, Electricity/Heat for Tanzania (www.iea.org/Textbase/stats/electricitydata.asp?COUNTRY_CODE=TZ)
IEA (2007b): 2007 Energy Balances for Tanzania (www.iea.org/Textbase/stats/balancetable.asp?COUNTRY_CODE=TZ; viewed in September 2009).
Kaale, Bariki (2007): Introduction on Bitale MFP: Energy Mainstreaming into Regional and District Programs in Kigoma Region, UNDP/GVEP, Dar es Salaam, Tanzania
Kaale, Bariki (2007): Monitoring and Evaluation of Rural Energy Development in Kigoma Region, UNDP/GVEP, Dar es Salaam, Tanzania
Kiwele, Paul (2007): Status of Energy in Tanzania and its Implication to Poverty Reduction. A Paper presented at a Workshop on Mainstreaming Energy in Regional and District Programs in Kigoma July 2007, Ministry of En-ergy and Minerals, Dar es Salaam, Tanzania
Magessa, F. (2008): EAC Strategy to Scale-up Access to Modern Energy Services, Tanzania Country Report and Implementation Work Plan, Dar es Salaam, Tanzania
MEM/ TANESCO (1998): Study report on the potential wind sites for power generation in Tanzania, Dar es Sa-laam, Tanzania
Ministry of Energy and Minerals – MEM (2003): National Energy Policy of Tanzania, Dar es Salaam, Tanzania
Ministry of Energy and Minerals – MEM (2006): Register of Key Actors and Stakeholders of Rural Energy by Technology, Dar es Salaam, Tanzania
Ministry of Energy and Minerals – MEM (2008): Report on Joint Energy Sector Review for 2008, Dar es Salaam, Tanzania
Ministry of Energy and Minerals – MEM (2008): Solar Photovoltaic Market Prospects in Tanzania – Enhancing Energy Access: National Energy Goals and Strategies, Dar es Salaam, Tanzania
ProBEC (2009): Basic Energy & Conservation Interventions (www.probec.org/displaysection.php?czacc=&zSelectedSectionID=sec1194880064)
ProBEC (2009): Tanzania Country Profile (www.probec.org/displaysection.php?czacc=&zSelectedSectionID= sec1194880009)
Shilogile (2007): A Paper on Status of Energy Mainstream-ing in the Ministry of Natural Resources and Tourism. Presented at Energy Mainstreaming in Regional and District Programs and Projects Workshop in Kigoma July 2007, UNDP/GEF, Dar es Salaam, Tanzania
Solar MWanza PV Project (2009): Indicators of PV Market Potential in MWwanza Region (www.solarmwanza.org)
SSN Tanzania Adaptation Team (2006): Poverty and Climate Change: A South North Collaboration Summary of Tanzania Vulnerability and Adaptation to Climate Change, Variability and Extreme Events, Dar es Salaam, Tanzania
Tanzania Commission for Science and Technology (2006): Energy Resources in Tanzania: Volume 1, Dar es Salaam, Tanzania
TANESCO (2007): Tanzania Power Systems Master Plan TASEA (2007): SunENERGY: TASEA Renewable Energy Magazine – Issues I & 2, Dar es Salaam, Tanzania
N. N. (2009): Transformation of the Rural PV Mar-ket, MWanza Solar MWanza PV Project (www.solarmwanza.org)
UNDP Tanzania (2009): Energy and Environment Issues (www.tz.undp.org/ee_proj_intro.html)
United Republic of Tanzania/ Vice President‘s Office (2007): National Adaptation Program of Action (NAPA), (http://unfccc.int/resource/docs/napa/tza01.pdf)
Websites EWURA: (www.ewura.go.tz/fuelprices) Geothermal Potentials: (www.bgr.de) Global Energy Network Institute – GENI: (www.geni.org) Government of Tanzania: (www.tanzania.go.tz/vision.htm.)
Ministry of Energy and Minerals: (www.mem.go.tz) Parliament of Tanzania: (www.parliament.go.tz) Related Institutions for PV Projects, Publications and Trainings: (www.tasea.org or www.tatedo.org/publications.html)
TANESCO Tariffs: (www.tanesco.com) NL EVD Internationaal – PSOM: (www.evd.nl/home/fin-anciering_projecten/investeren/programma.asp?land=psm)

102
TANZANIA
Renewable Energies in East AfricaANNEX
7 ANNEX
7.1 COUNTRY MAP OF TANZANIA
Source: United Nations, as of 2005

103
TANZANIA
Renewable Energies in East AfricaANNEX
7.2 MAP OF ELECTRIFICATION RATE IN TANZANIA
Source: MEM, as of 2008
7.3 MAP OF NATIONAL ELECTRICITY GRID
Source: Global Energy Network Institute – GENI (www.geni.org, without year)

104
TANZANIA
Renewable Energies in East AfricaANNEX
7.4 PRIMARY ENERGY SUPPLY
Source: IEA, as of 2006* In thousand tons of oil equivalent (ktoe) on a net calorific value basis** Totals may not add up due to rounding
SUPPLY AND CONSUMPTION *
COAL AND PEAT
CRUDE OIL PETROLEUM PRODUCTS
GAS NUCLEAR HYDRO GEOTHERMAL, SOLAR ETC.
COMBUSTIBLE, RENEWABLES AND WASTE
TOTAL **
TPES 49 0 1,367 314 0 123 0 18,941 20,805
TPES % 0 % 0 % 7 % 2 % 0 % 1 % 0 % 91 % 100 %
7.5 FINAL ENERGY CONSUMPTION BY ENERGY SECTOR AND SOURCE
Source: IEA, as of 2006* In thousand tons of oil equivalent (ktoe) on a net calorific value basis** Totals may not add up due to rounding
ENERGY CONSUMPTION BY SECTOR
ENERGY FORM PRICE REMARK
Diesel 1,430.00 TZS/l 0.780 €/l Price at filling station
Petroleum 1,340.00 TZS/l 0.730 €/l Price at filling station
Electricity 129.03 TZS/kWh 0.070 €/kWh For households
Electricity 70.00 TZS/kWh 0.039 €/kWh For industry
Kerosene 1,000.00 TZS/l 0.540 €/l Pump price
LPG 2,133.00 TZS/kg 1.160 €/kg Retail price at dealers
Charcoal 500.00 TZS/kg 0.270 €/kgNot sold per kg, but a bag of 60 kg is sold at 30,000 in TZS Dar es Salaam (differs in other townships)
ENERGY CONSUMPTION BY SOURCE
SUPPLY AND CONSUMPTION *
COAL AND PEAT
CRUDE OIL PETROLEUM GAS NUCLEAR HYDRO GEOTHERMAL, SOLAR ETC.
COMBUSTIBLE, RENEWABLES AND WASTE
ELECTRICITY HEAT TOTAL**
TFC 19 0 1,359 0 0 0 0 14,787 190 0 16,355
TFC in % 0,05 % 0 % 7,95 % 0 % 0 % 0 % 0 % 90.00 % 1.00 % 0 % 100 %
Source: IEA, as of 2006* In thousand tons of oil equivalent (ktoe) on a net calorific value basis** Totals may not add up due to rounding
7.6 DOMESTIC ENERGY RESOURCES, IMPORTS AND EXPORTS
Source: IEA, as of 2006* In thousand tons of oil equivalent (ktoe) on a net calorific value basis** Totals may not add up due to rounding
SUPPLY ANDCONSUMPTION *
COAL AND PEAT
CRUDE OIL PETROLEUM PRODUCTS
GAS NUCLEAR HYDRO GEOTHERMAL, SOLAR ETC.
COMBUSTIBLERENEWABLES AND WASTE
ELECTRICITY HEAT TOTAL*
Production 49 0 0 314 0 123 0 18,941 0 0 19,427
Imports 0 0 1,389 0 0 0 0 11 0 1,400
Exports 0 0 0 0 0 0 0 0 0 0 0

105
TANZANIA
Renewable Energies in East AfricaANNEX
7.7 ENERGY SOURCES FOR ELECTRICITY AND HEAT PRODUCTION IN TANZANIA
Source: IEA, as of 2006* Includes production from pumped storage plants** Transformation sector includes electricity used by heat pumps and electricity used by electric boilers*** Energy Sector also includes own use by plant and electricity used for pumped storage
YEAR 2006 ELECTRICITY (GWH) HEAT (TJ) (NO INDICATIONS)
Production from
Coal 106 0
Oil 17 0
Gas 1,217 0
Biomass 0 0
Waste 0 0
Nuclear 0 0
Hydro* 1,436 0
Geothermal 0 0
Solar PV 0 0
Solar thermal 0 0
Wind 0 0
Tide 0 0
Other sources 0 0
Total production 2,776 0
Imports 123 0
Exports 0 0
Domestic supply 2,899 0
Statistical differences 0 0
Total transformation** 0 0
Electricity plants 0 0
Heat plants 0 0
Energy sector*** 106 0
Distribution losses 580 0
Total final consumption 2,213 0
Industry 1,138 0
Transport 0 0
Residential 871 0
Commercial and public services 0 0
Agriculture/forestry 0 0
Fishing 0 0
Other non-specified 204 0

106
UGANDA
Renewable Energies in East Africa
COUNTRY CHAPTER:
UGANDA Author of Country Chapter Dr. Eng. Mackay A.E. Okure Coordination and Review of the Country ChapterDipl. Phys. Rafael WiesePSE AGFreiburg, Germanywww.pse.de
Editor Deutsche Gesellschaft für Technische Zusammenarbeit (GTZ) GmbHDepartment Water, Energy, TransportDag-Hammarskjöld-Weg 1-565760 Eschborn, Germanywww.gtz.de
On behalf of Federal Ministry for Economic Cooperation and Development (BMZ)
Editorial staffDiana KraftTel: +49 (0)6196 79 4101Fax: +49 (0)6196 79 80 4101Email: [email protected]

107
UGANDA
Renewable Energies in East Africa
ACRONYMS, ABBREVIATIONS AND MEASUREMENTS 108
SUMMARY 110
1 COUNTRY INTRODUCTION 111 1.1 Uganda Overview 111 1.2 Uganda Statistics: Geography and Economics 111
2 ENERGY MARKET IN UGANDA 112 2.1 Energy Situation Overview 112 2.2 Energy Capacities, Production and Consumption 112 2.3 Electricity Prices 113 2.4 Market Actors for Planning, Regulation and Distribution 113
3 RENEWABLE ENERGY POLICY FRAMEWORK CONDITIONS 113 3.1 Policy and Renewable Energy Promotion Programs 114 3.2 Donor Aid Activities 114 3.3 Market Risks 115 4 STATUS AND FUTURE OUTLOOK FOR RENEWABLE ENERGIES 115 4.1 Biomass / Biogas 116 4.2 Solar Energy 116 4.3 Wind Power 117 4.4 Geothermal Power 117 4.5 Hydro Power 117
5 RENEWABLE ENERGY BUSINESS INFORMATION AND CONTACTS 118 5.1 Renewable Energy Companies & Business Related Organisations 118 5.2 Local Institutions Related to Renewable Energy Business 121
6 BIBLIOGRAPHY 122
7 ANNEX 123
CONTENTS UGANDA
CONTENTS

108
UGANDA
ACRONYMS AND ABBREVIATIONS
UGANDA
ACP African, Caribbean and Pacific Group of States
AfDB African Development Bank
ARGeo African Rift Geothermal Development Facility
BGR Bundesanstalt für Geowissenschaften und Rohstoffe (Federal Institute for Geosciences and Natural Resources)
BMZ Bundesministerium für wirtschaftliche Zusammenarbeit und Entwicklung (German Federal Ministry for Economic
Cooperation and Development)
BUDS-ERT Business Uganda Development Services – Energy for Rural Transformation
BOU Bank of Uganda
CDM Clean Development Mechanism
CERA Carbon Emission Reduction Association (in Uganda)
COMESA Common Market for Eastern and Southern Africa
GSMD Geological Survey and Minerals Department
DNA Designated National Authority
DWD Directorate of Water Development
EAC East African Community
EAP Energy Advisory Project
ERA Electricity Regulatory Authority
ERT Energy for Rural Transformation
EU European Union
F.O.B. Free On Board
GDP Gross Domestic Product
GEF Global Environment Facility
GTZ Deutsche Gesellschaft für Technische Zusammenarbeit (German Technical Cooperation Agency)
IPP Independent Power Producer
IPS Industrial Promotion Services Ltd.
JICA Japanese International Cooperation Agency
KfW Kreditanstalt für Wiederaufbau
(German Banking Group including KfW Entwicklungsbank as German Development Bank)
LPG Liquefied Petroleum Gas
MEMD Ministry of Energy and Mineral Development
MIGA Multilateral Investment Guarantee Agency
MOFPED Ministry of Finance, Planning and Economic Development
N. a. Not Applicable
NEMA National Environment Management Authority
NFA National Forestry Authority
NGO Non Governmental Organization
PPA Power Purchase Agreement
PPP Public Private Partnership
PSFU Private Sector Foundation
PREEEP Promotion of Renewable Energy and Energy Efficiency Program
PREPS Priority Rural Electrification Projects
PV Photovoltaic
RAP Resettlement Action Plan
RE Renewable Energy
REA Rural Electrification Agency
REB Rural Electrification Board
REF Rural Electrification Fund
SCOUL Sugar Corporation of Uganda Ltd.
SHS Solar Home Systems
SIDA Swedish International Development Agency
UAE United Arab Emirates
UBOS Uganda Bureau of Statistics
UEB Uganda Electricity Board
ACRONYMS, ABBREVIATIONS AND MEASUREMENTS Renewable Energies in East Africa

109
UGANDA
Renewable Energies in East Africa
UEDCL Uganda Electricity Distribution Company Ltd.
UEGCL Uganda Electricity Generation Company Ltd.
UERD Uganda Energy for Rural Development
UETCL Uganda Electricity Transmission Company Ltd.
UIA Uganda Investment Authority
UNBS Uganda National Bureau of Standards
UNDP United Nations Development Program
UNEP United Nations Environmental Program
UNIDO United Nations Industrial Development Organization
URA Uganda Revenue Authority
USD United States Dollar (US Cent = United States Cent)
USEC Uganda Sustainable Energy Company Limited
UG Shs Uganda-Shilling (100 UG Shs = 0.036 €, as of December 2009)
VAT Value Added Tax
WENRECO West Nile Rural Electrification Company
MEASUREMENTS
bbl Barrel
°C degree Celsius
GWh gigawatt hour (1 GWh = 1,000,000 kWh)
kg kilogram
kgoe kilograms of oil equivalent
kV kilovolt
km2 square kilometer
l liter
LPD liters per day
m meter
m3 cubic meter
MW megawatt (1 MW = 1,000 kW)
Wp Watt-peak (1kWp = 1,000 Watt-peak)
ACRONYMS, ABBREVIATIONS AND MEASUREMENTS

110
UGANDA
Renewable Energies in East Africa
SUMMARY
ECONOMIC STATUS AND DEVELOPMENT OF UGANDAUganda is a landlocked country but blessed with a huge vari-ety of fresh water. It is the source of the Great River Nile and home to Lake Victoria. 85 % of the population live in rural ar-eas and are mainly engaged in subsistence agriculture1. More than one third of the population lives below the poverty line. Coffee and fish are the main export goods. The economy is steadily growing with a last year rate of 9 %2.
STRUCTURE OF ENERGY SUPPLY IN UGANDAUganda’s primary energy supply and consumption are domi-nated by biomass with 92 % followed by petroleum (6 %) and electricity (2 %)3.
Electricity Electricity is generated from two hydro- (380 MW) and three thermal power plants (50 MW each). The countrywide electri-fication rate is 9 %. In urban areas, mainly in Jinja-Entebbe-Kampala, about 42 % of the population have access to the national grid, while in rural areas the rate is 3 %4. The average per capita consumption is 57 kWh per year.
Oil Uganda‘s oil consumption5 of 11.570 barrels a day (as of 2006) is met by imports from Kenya. Currently oil has been discov-ered in western Uganda after years of exploration. The pro-duction was expected to begin in 2009. The country plans to build an oil refinery, producing between 6,000 to 10,000 barrels a day.
STATUS OF RENEWABLE ENERGIES IN UGANDA
BiomassThe main source of the nation’s energy consumption is bio-mass, accounting for 92 % of the total primary energy supply. It is mainly used for cooking and water heating. A Dutch-German funded project has distributed around 600,000 im-proved stoves to decrease wood consumption. The sugar com-panies in the country are using bagasse for cogeneration. Out of the installed 22 MW capacity, around 12 MW are supplied to the national grid. So far, biogas technology is used on a small scale.
Solar The annual PV market potential is estimated at 200 kWp, mainly driven by the Energy for Rural Transformation (ERT) program6. Main applications in rural areas are small solar home systems (SHS) and institutional systems for schools and clinics.
Solar water heaters are typically installed in hotels and lodges, but have lately also become popular with high-income urban customers. The average time for return on investment is about two years.
Hydro Two large hydro power stations with a capacity of 380 MW are the backbone of the Ugandan electricity supply. A new dam with a capacity of 250 MW is currently under construc-tion.
More than 60 mini hydro power sites with a total po-tential of about 210 MW have been identified through differ-ent studies in Uganda and some are under construction.
1 RURAL POVERTY PORTAL, AS OF 2009
2 MOFPED, AS OF 2008
3 MEMD, AS OF 2007, AND UBOS, AS OF 2009
4 MEMD, P. 27, AS OF 2007
5 CIA, AS OF 2009
6 SEE MEMD, ERT FACT SHEET, AS OF 2009
SUMMARY
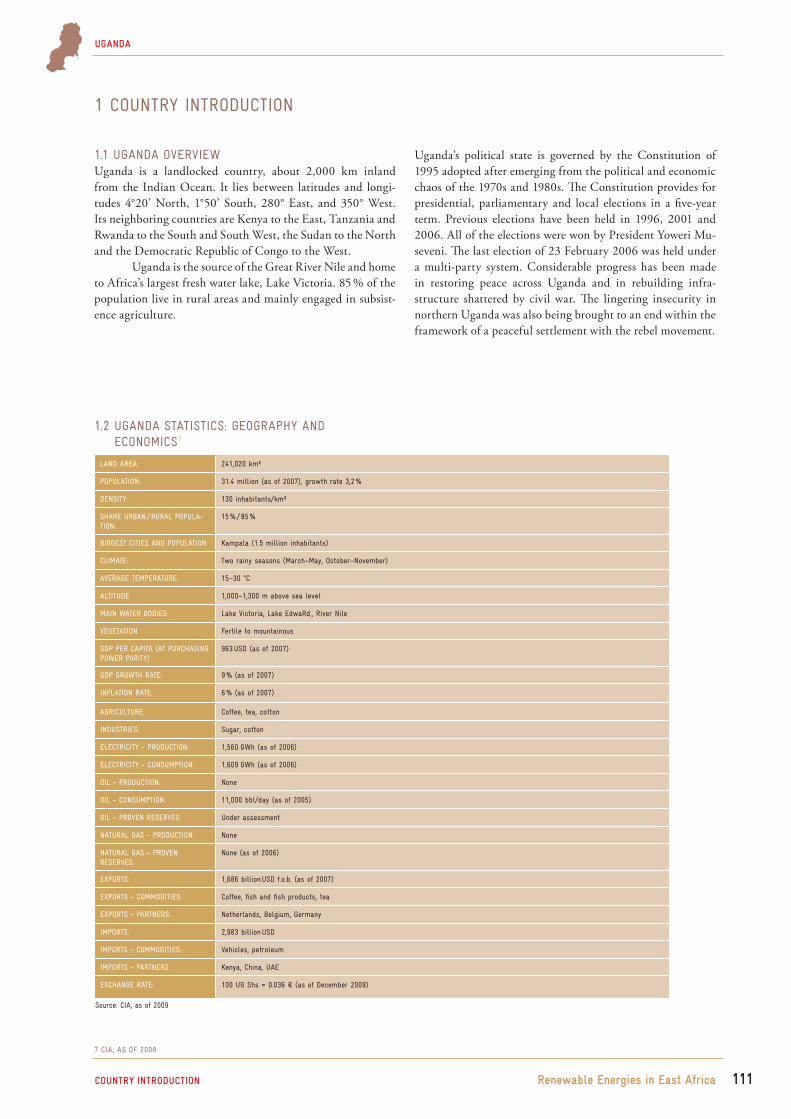
111COUNTRY INTRODUCTION
UGANDA
Renewable Energies in East Africa
1 COUNTRY INTRODUCTION
1.1 UGANDA OVERVIEWUganda is a landlocked country, about 2,000 km inland from the Indian Ocean. It lies between latitudes and longi-tudes 4°20’ North, 1°50’ South, 280° East, and 350° West. Its neighboring countries are Kenya to the East, Tanzania and Rwanda to the South and South West, the Sudan to the North and the Democratic Republic of Congo to the West.
Uganda is the source of the Great River Nile and home to Africa’s largest fresh water lake, Lake Victoria. 85 % of the population live in rural areas and mainly engaged in subsist-ence agriculture.
Uganda’s political state is governed by the Constitution of 1995 adopted after emerging from the political and economic chaos of the 1970s and 1980s. The Constitution provides for presidential, parliamentary and local elections in a five-year term. Previous elections have been held in 1996, 2001 and 2006. All of the elections were won by President Yoweri Mu-seveni. The last election of 23 February 2006 was held under a multi-party system. Considerable progress has been made in restoring peace across Uganda and in rebuilding infra-structure shattered by civil war. The lingering insecurity in northern Uganda was also being brought to an end within the framework of a peaceful settlement with the rebel movement.
LAND AREA: 241,020 km²
POPULATION: 31.4 million (as of 2007), growth rate 3,2 %
DENSITY: 130 inhabitants/km²
SHARE URBAN / RURAL POPULA-TION:
15 % / 85 %
BIGGEST CITIES AND POPULATION: Kampala (1.5 million inhabitants)
CLIMATE: Two rainy seasons (March–May, October–November)
AVERAGE TEMPERATURE: 15–30 °C
ALTITUDE 1,000–1,300 m above sea level
MAIN WATER BODIES: Lake Victoria, Lake EdwaRd., River Nile
VEGETATION Fertile to mountainous
GDP PER CAPITA (AT PURCHASING POWER PARITY)
963 USD (as of 2007)
GDP GROWTH RATE: 9 % (as of 2007)
INFLATION RATE: 6 % (as of 2007)
AGRICULTURE: Coffee, tea, cotton
INDUSTRIES: Sugar, cotton
ELECTRICITY – PRODUCTION: 1,560 GWh (as of 2006)
ELECTRICITY – CONSUMPTION: 1,609 GWh (as of 2006)
OIL – PRODUCTION: None
OIL – CONSUMPTION: 11,000 bbl/day (as of 2005)
OIL – PROVEN RESERVES: Under assessment
NATURAL GAS – PRODUCTION: None
NATURAL GAS – PROVEN RESERVES:
None (as of 2006)
EXPORTS: 1,686 billion USD f.o.b. (as of 2007)
EXPORTS – COMMODITIES: Coffee, fish and fish products, tea
EXPORTS – PARTNERS: Netherlands, Belgium, Germany
IMPORTS: 2,983 billion USD
IMPORTS – COMMODITIES: Vehicles, petroleum
IMPORTS – PARTNERS: Kenya, China, UAE
EXCHANGE RATE: 100 UG Shs = 0.036 € (as of December 2009)
7 CIA, AS OF 2009
1.2 UGANDA STATISTICS: GEOGRAPHY AND ECONOMICS7
Source: CIA, as of 2009

112COUNTRY INTRODUCTION
UGANDA
Renewable Energies in East Africa
2 ENERGY MARKET IN UGANDA
2.1 ENERGY SITUATION OVERVIEWUganda’s energy supply and consumption is dominated by biomass, which accounts for more than 92 % of the prima-ry energy supply. Other primary energy sources used in the country are petroleum and hydro. Since 2002, the shares of the different primary energy sources in the total supply have remained unchanged. Biomass is consumed in its traditional form as firewood and crop residues. Petroleum products are imported. Electricity is generated mainly from hydro power and thermal plants8.
The following table provides commercial energy con-sumption figures for the last three years.
8 UBOS, P. 48, AS OF 2009
9 MOFPED, AS OF 2008
10 SEE UMEM, WWW.UMEME.CO.UG, AS OF 2009
TABLE 1
Shares of Total Energy Consumption
Source: MEMD, as of 2007, and UBOS, as of 2008
ENERGY TYPE 2005 2006 2007
Electricity (GWh) 1857, 000 1609,000 1797,000
Petrol (m3) 174,054 198,125 191,713
Diesel (m3) 319,574 417,449 464,121
LPG (m3) 2,822 3,474 4,300
Kerosene 39,836 42,897 34,309
SOURCE OF ELECTRICITY PRODUCTION
2005
PRODUCED CAPACITY PRODUCED ELECTRICITY
2006
PRODUCED CAPACITY PRODUCED ELECTRICITY
Large hydro power (Nalubale and Kiira) 380.0 MW 1,698,535 145.0 MW1,160,456
Thermal power (oil fired) 50.0 MW 140,304 100.0 MW369,499
Small-scale hydro power 15.9 MW 21,262 15.9 MW30,021
Biomass (sugar) cogeneration(Kakira, Kinyara, SCOUL)
n. a. n. a. 22.0 MW n. a.
Imports (Kenya, Rwanda) n. a. 24,177 n. a. 49,027
TOTAL 445.9 1,884,278 495.9 1,609,003
TABLE 2
Electricity Production
Source: table compiled by the author with data from MEMD Annual Reports as of 2005, 2006, 2007
2.2 ENERGY CAPACITIES, PRODUCTION AND CONSUMPTION
Up to 2005, electricity generation was dominated by two large hydro power stations. The stations of Nalubale and Kiira are located at the Owen Dam Falls and have a total generation capacity of 380 MW. During 2005 and 2006, the country ex-perienced a drought enforcing the reduction of hydro power capacity to 145 MW.
Since 2006, three thermal oil-fired plants with a total capacity of 150 MW have been built, a fourth plant of 50 MW is under construction. The higher generation costs meant high-er tariffs which the Government subsidized to make electric-ity affordable to industry and other consumers. A subsidy of about 35 % is offered through the national budget. In order to increase the generation capacity of the cheaper hydro power, the Government has introduced an energy fund of about 100 million USD per year. The funds are used to invest in large hydro power plants9. The table below shows the electricity gen-eration capacity and supply to the grid.
Due to shortage of capacity on the national grid, power rationing currently takes place. At the worst, power cut-offs happen from 6:00 p. m. to 8:00 a. m. or alternately from 8:00 a.m. to 2:00 p.m. Usually, nighttime cut-offs take place once a week. For towns supplied with generators, power is available for only 4 hours from 7:00 p.m. to 11:00 p.m.10
The national system operator reports technical losses amounting to 4 %11. Commercial losses at about 35 % due to poor lines and transformers, power thefts and lack of billing are reported by the distributor12. There have been attempts to cut this rate but with limited success.
The national electrification rate is 9 %. It is 42 % in the urban area of Jinja-Entebbe-Kampala and 3 % in the ru-ral areas13. The average electricity consumption per capita is 57 kWh.
11 UETCL, AS OF 2007
12 UMEM, WWW.UMEME.CO.UG, AS OF 2009
13 MEMD, P. 27, AS OF 2007
Source: MEMD, 2007c, Graph: PSE AG
FIGURE 1
Shares of Total Primary Energy Consumption
Biomass Petroleum Electricity
92 %
20 %
40 %
30 %
10 %
50 %
60 %
70 %
80 %
90 %
100 %
0 %
6 % 2 %

113COUNTRY INTRODUCTION
UGANDA
Renewable Energies in East Africa
2.3 ENERGY PRICESEnergy prices in Uganda vary widely depending on the loca-tion and the supply situation. Electricity tariffs are, however, uniform on the grid and deviate slightly on mini grids. Cur-rent energy prices can be found in the table below.
Currently, feed-in tariffs for Independent Power Pro-ducers (IPP) are negotiated on a case-by-case basis14. Within the Renewable Energy (RE) policy, feed-in tariffs have been specified for the existing hydro power and cogeneration plants. Details can be found in annex 8.7.
Two sugar plantations have build cogeneration plants and are currently negotiating the tariff with the grid operator on avoided cost basis.
2.4 MARKET ACTORS FOR PLANNING, REGULATION AND DISTRIBUTION
MEMD The Ministry of Energy and Mineral Development (MEMD) is the lead Government body responsible for energy policy de-velopment, planning and programming, guidance and imple-mentation. A new Renewable Energy Division under MEMD was formed recently17.
MOFPED The Ministry of Finance, Planning and Economic Develop-ment (MOFPED) plays a key role in the energy market. Apart from the overall national macro-economic management, de-velopment planning and resource mobilization it is also in charge of budgetary allocation and disbursement. Specific funding to the energy sector is channeled through the Bank of Uganda to the banks that lend to project developers and pri-vate users depending on the funding mechanism. Its programs are subject to approval by the Parliament of Uganda.
DWD The Directorate of Water Development (DWD) provides per-mits for water extraction for hydro power plants. The local governments including district authorities, city councils and divisions, municipalities and lower level governments carry out approval, planning, implementation and monitoring of all activities under their jurisdiction. 14 MEMD, AS OF 2007
15 MEMD, AS OF 2007
Source: ERA, www.era.or.ug, viewed In June 2009; data on petroleum products and other fuels
compiled from open markets in and around Kampala.
ENERGY TYPE PRICE
Fuel wood (Kampala) 0.7 USD/kg
Fuel wood (outside Kampala) 0.4 USD/kg
Charcoal (Kampala) 0.21 USD/kg
Charcoal (outside Kampala) 0.10 USD/kg
Kerosene 1.17 USD/l
LPG 2.44 USD/l
Diesel 1.37 USD/l
Petrol 1.49 USD/l
Grid Electricity (without VAT) 0.25 USD/kWh
TABLE 3
Energy Prices November 2007/ Grid Electricity for Domestic Consumers
ERA The Electricity Regulatory Authority (ERA) is the national regulatory body in the power sector. It issues licenses for gen-eration, transmission and distribution of electricity.
NEMA The National Environment Management Authority (NEMA) enforces environment impact assessments and issues environ-mental permits.
UNBS The Uganda National Bureau of Standards (UNBS) develops, adopts and enforces standards for trade, industry and con-sumer protection. URA The Uganda Revenue Authority (URA) is in charge of taxa-tion and customs.
UIA The Uganda Investment Authority (UIA) facilitates invest-ments.
REB / REA The Rural Electrification Board (REB) with its secretariat, the Rural Electrification Agency (REA), is the key player in plan-ning increased rural electricity access.
UETCL The Uganda Electricity Transmission Company Limited (UETCL) as a public company owns and operates the high voltage transmission grid (above 33 kV) and acts as supplier, exporter, importer, and sole buyer of bulk power.
Further information on each of these institutions can be obtained from the corresponding websites given in chapter 7.
3 RENEWABLE ENERGY POLICY FRAMEWORK CONDITIONS
Uganda is a signatory of the EAC Customs Union treaty, which offers a common external tariff to gradually develop into a free trade area. Uganda is also a member of the Common Market for East and Southern Africa (COMESA). Uganda’s policies are clearly aligned with the regional market. During the lat-est Ugandian budget period for example, the import duty on unsealed deep cycle batteries for use with solar equipment was cut by all the EAC countries.
The Energy Policy for Uganda was published in 2002 with its stated goal to meet the energy needs of Uganda’s pop-ulation for social and economic development in an environ-mentally sustainable manner. The policy provides the vision for increased and improved modern energy supply for sustain-able economic development as well as improving the quality of life of the Ugandan population.
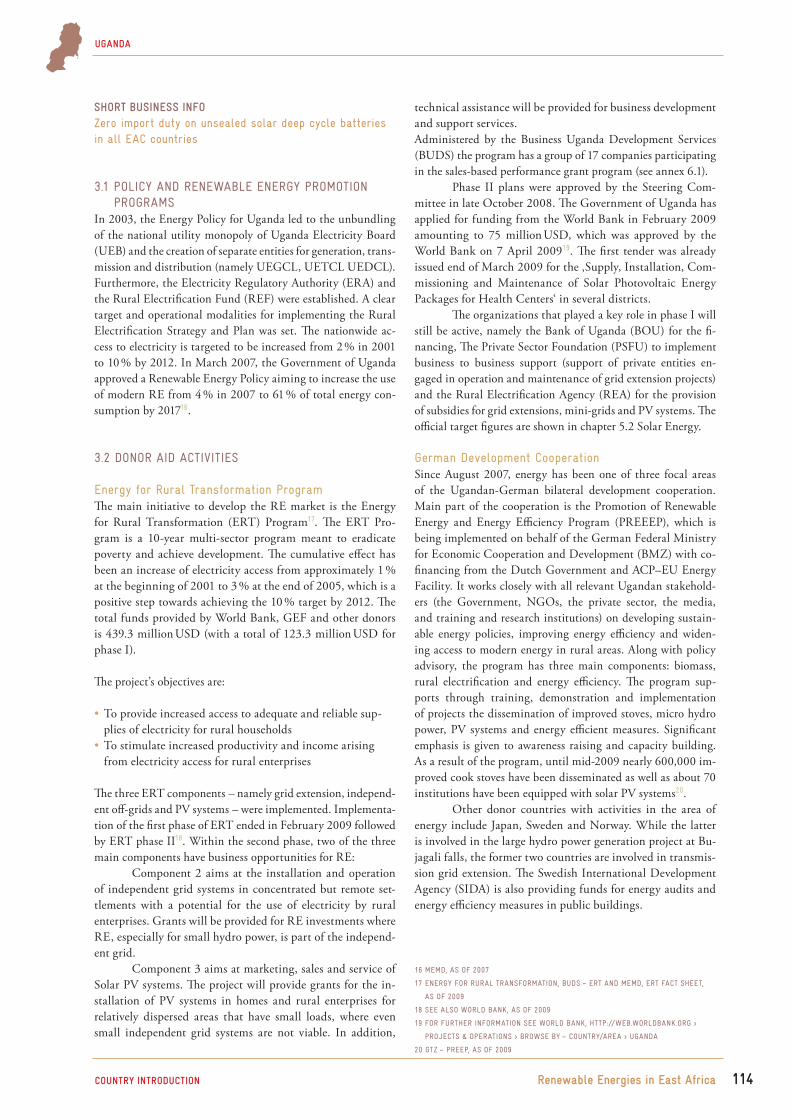
114COUNTRY INTRODUCTION
UGANDA
Renewable Energies in East Africa
SHORT BUSINESS INFOZero import duty on unsealed solar deep cycle batteries in all EAC countries
3.1 POLICY AND RENEWABLE ENERGY PROMOTION PROGRAMS
In 2003, the Energy Policy for Uganda led to the unbundling of the national utility monopoly of Uganda Electricity Board (UEB) and the creation of separate entities for generation, trans-mission and distribution (namely UEGCL, UETCL UEDCL). Furthermore, the Electricity Regulatory Authority (ERA) and the Rural Electrification Fund (REF) were established. A clear target and operational modalities for implementing the Rural Electrification Strategy and Plan was set. The nationwide ac-cess to electricity is targeted to be increased from 2 % in 2001 to 10 % by 2012. In March 2007, the Government of Uganda approved a Renewable Energy Policy aiming to increase the use of modern RE from 4 % in 2007 to 61 % of total energy con-sumption by 201716.
3.2 DONOR AID ACTIVITIES
Energy for Rural Transformation ProgramThe main initiative to develop the RE market is the Energy for Rural Transformation (ERT) Program17. The ERT Pro-gram is a 10-year multi-sector program meant to eradicate poverty and achieve development. The cumulative effect has been an increase of electricity access from approximately 1 % at the beginning of 2001 to 3 % at the end of 2005, which is a positive step towards achieving the 10 % target by 2012. The total funds provided by World Bank, GEF and other donors is 439.3 million USD (with a total of 123.3 million USD for phase I).
The project’s objectives are:
To provide increased access to adequate and reliable sup-plies of electricity for rural households
To stimulate increased productivity and income arising from electricity access for rural enterprises
The three ERT components – namely grid extension, independ-ent off-grids and PV systems – were implemented. Implementa-tion of the first phase of ERT ended in February 2009 followed by ERT phase II18. Within the second phase, two of the three main components have business opportunities for RE:
Component 2 aims at the installation and operation of independent grid systems in concentrated but remote set-tlements with a potential for the use of electricity by rural enterprises. Grants will be provided for RE investments where RE, especially for small hydro power, is part of the independ-ent grid.
Component 3 aims at marketing, sales and service of Solar PV systems. The project will provide grants for the in-stallation of PV systems in homes and rural enterprises for relatively dispersed areas that have small loads, where even small independent grid systems are not viable. In addition,
technical assistance will be provided for business development and support services.Administered by the Business Uganda Development Services (BUDS) the program has a group of 17 companies participating in the sales-based performance grant program (see annex 6.1).
Phase II plans were approved by the Steering Com-mittee in late October 2008. The Government of Uganda has applied for funding from the World Bank in February 2009 amounting to 75 million USD, which was approved by the World Bank on 7 April 200919. The first tender was already issued end of March 2009 for the ‚Supply, Installation, Com-missioning and Maintenance of Solar Photovoltaic Energy Packages for Health Centers‘ in several districts.
The organizations that played a key role in phase I will still be active, namely the Bank of Uganda (BOU) for the fi-nancing, The Private Sector Foundation (PSFU) to implement business to business support (support of private entities en-gaged in operation and maintenance of grid extension projects) and the Rural Electrification Agency (REA) for the provision of subsidies for grid extensions, mini-grids and PV systems. The official target figures are shown in chapter 5.2 Solar Energy.
German Development Cooperation Since August 2007, energy has been one of three focal areas of the Ugandan-German bilateral development cooperation. Main part of the cooperation is the Promotion of Renewable Energy and Energy Efficiency Program (PREEEP), which is being implemented on behalf of the German Federal Ministry for Economic Cooperation and Development (BMZ) with co-financing from the Dutch Government and ACP–EU Energy Facility. It works closely with all relevant Ugandan stakehold-ers (the Government, NGOs, the private sector, the media, and training and research institutions) on developing sustain-able energy policies, improving energy efficiency and widen-ing access to modern energy in rural areas. Along with policy advisory, the program has three main components: biomass, rural electrification and energy efficiency. The program sup-ports through training, demonstration and implementation of projects the dissemination of improved stoves, micro hydro power, PV systems and energy efficient measures. Significant emphasis is given to awareness raising and capacity building. As a result of the program, until mid-2009 nearly 600,000 im-proved cook stoves have been disseminated as well as about 70 institutions have been equipped with solar PV systems20.
Other donor countries with activities in the area of energy include Japan, Sweden and Norway. While the latter is involved in the large hydro power generation project at Bu-jagali falls, the former two countries are involved in transmis-sion grid extension. The Swedish International Development Agency (SIDA) is also providing funds for energy audits and energy efficiency measures in public buildings.
16 MEMD, AS OF 2007
17 ENERGY FOR RURAL TRANSFORMATION, BUDS – ERT AND MEMD, ERT FACT SHEET,
AS OF 2009
18 SEE ALSO WORLD BANK, AS OF 2009
19 FOR FURTHER INFORMATION SEE WORLD BANK, HTTP://WEB.WORLDBANK.ORG >
PROJECTS & OPERATIONS > BROWSE BY – COUNTRY/AREA > UGANDA
20 GTZ – PREEP, AS OF 2009
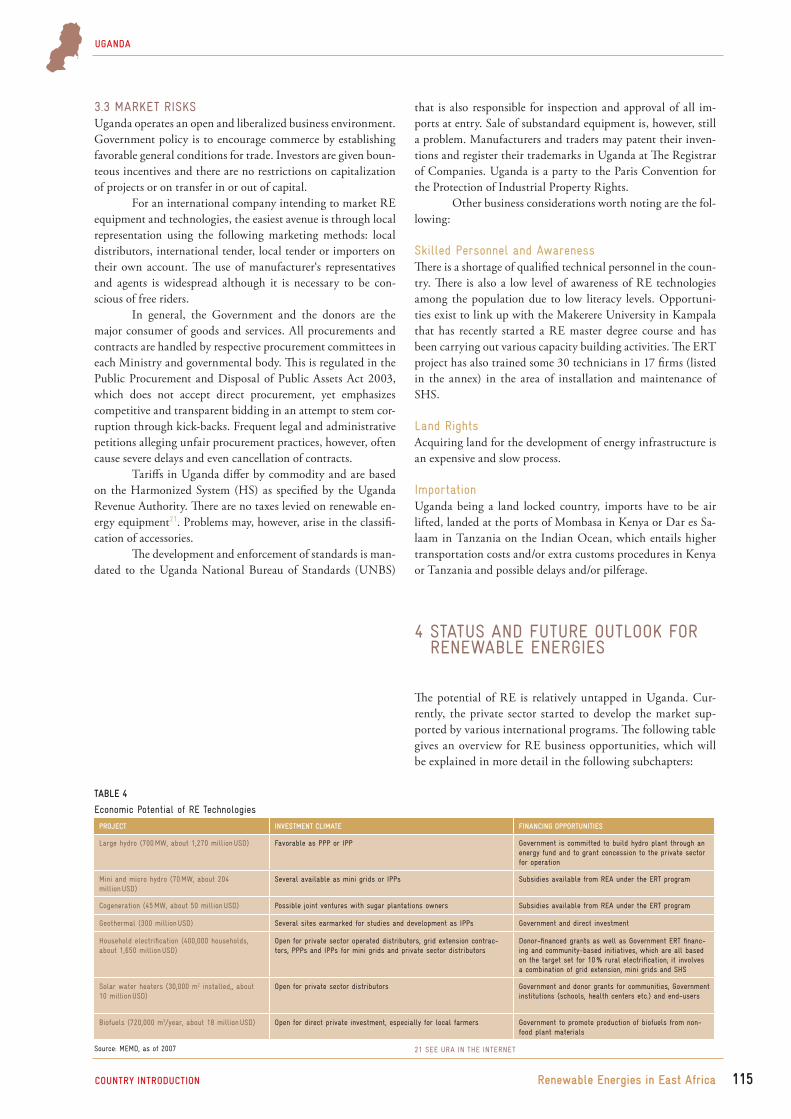
115COUNTRY INTRODUCTION
UGANDA
Renewable Energies in East Africa
3.3 MARKET RISKSUganda operates an open and liberalized business environment. Government policy is to encourage commerce by establishing favorable general conditions for trade. Investors are given boun-teous incentives and there are no restrictions on capitalization of projects or on transfer in or out of capital.
For an international company intending to market RE equipment and technologies, the easiest avenue is through local representation using the following marketing methods: local distributors, international tender, local tender or importers on their own account. The use of manufacturer‘s representatives and agents is widespread although it is necessary to be con-scious of free riders.
In general, the Government and the donors are the major consumer of goods and services. All procurements and contracts are handled by respective procurement committees in each Ministry and governmental body. This is regulated in the Public Procurement and Disposal of Public Assets Act 2003, which does not accept direct procurement, yet emphasizes competitive and transparent bidding in an attempt to stem cor-ruption through kick-backs. Frequent legal and administrative petitions alleging unfair procurement practices, however, often cause severe delays and even cancellation of contracts.
Tariffs in Uganda differ by commodity and are based on the Harmonized System (HS) as specified by the Uganda Revenue Authority. There are no taxes levied on renewable en-ergy equipment21. Problems may, however, arise in the classifi-cation of accessories.
The development and enforcement of standards is man-dated to the Uganda National Bureau of Standards (UNBS)
that is also responsible for inspection and approval of all im-ports at entry. Sale of substandard equipment is, however, still a problem. Manufacturers and traders may patent their inven-tions and register their trademarks in Uganda at The Registrar of Companies. Uganda is a party to the Paris Convention for the Protection of Industrial Property Rights.
Other business considerations worth noting are the fol-lowing:
Skilled Personnel and AwarenessThere is a shortage of qualified technical personnel in the coun-try. There is also a low level of awareness of RE technologies among the population due to low literacy levels. Opportuni-ties exist to link up with the Makerere University in Kampala that has recently started a RE master degree course and has been carrying out various capacity building activities. The ERT project has also trained some 30 technicians in 17 firms (listed in the annex) in the area of installation and maintenance of SHS.
Land RightsAcquiring land for the development of energy infrastructure is an expensive and slow process.
ImportationUganda being a land locked country, imports have to be air lifted, landed at the ports of Mombasa in Kenya or Dar es Sa-laam in Tanzania on the Indian Ocean, which entails higher transportation costs and/or extra customs procedures in Kenya or Tanzania and possible delays and/or pilferage.
21 SEE URA IN THE INTERNET
4 STATUS AND FUTURE OUTLOOK FOR RENEWABLE ENERGIES
The potential of RE is relatively untapped in Uganda. Cur-rently, the private sector started to develop the market sup-ported by various international programs. The following table gives an overview for RE business opportunities, which will be explained in more detail in the following subchapters:
PROJECT INVESTMENT CLIMATE FINANCING OPPORTUNITIES
Large hydro (700 MW, about 1,270 million USD) Favorable as PPP or IPP Government is committed to build hydro plant through an energy fund and to grant concession to the private sector for operation
Mini and micro hydro (70 MW, about 204 million USD)
Several available as mini grids or IPPs Subsidies available from REA under the ERT program
Cogeneration (45 MW, about 50 million USD) Possible joint ventures with sugar plantations owners Subsidies available from REA under the ERT program
Geothermal (300 million USD) Several sites earmarked for studies and development as IPPs Government and direct investment
Household electrification (400,000 households, about 1,650 million USD)
Open for private sector operated distributors, grid extension contrac-tors, PPPs and IPPs for mini grids and private sector distributors
Donor-financed grants as well as Government ERT financ-ing and community-based initiatives, which are all based on the target set for 10 % rural electrification; it involves a combination of grid extension, mini grids and SHS
Solar water heaters (30,000 m2 installed,, about 10 million USD)
Open for private sector distributors Government and donor grants for communities, Government institutions (schools, health centers etc.) and end-users
Biofuels (720,000 m3/year, about 18 million USD) Open for direct private investment, especially for local farmers Government to promote production of biofuels from non-food plant materials
Source: MEMD, as of 2007
TABLE 4
Economic Potential of RE Technologies

116COUNTRY INTRODUCTION
UGANDA
Renewable Energies in East Africa
4.1 BIOMASS/BIOGASEnergy for cooking and water heating in rural areas is mainly covered by biomass like firewood, shrubs, grasses, forest wastes and agro-industrial residues such as bagasse, husks, trash from sugar, oil milling and grain milling. Trading in charcoal con-tributes to the rural incomes, tax revenue and employment.Most urban households, institutions and commercial entities also rely on biomass. Biomass consumption per capita is 240 kg/year for firewood and 120 kg/year for charcoal. Further-more, crop residues and agro-industrial residues including husks, bagasse and oil residues play a significant role (about 5 %) in Uganda’s energy consumption. In total, biomass ac-counts for 92 % of the nation’s energy consumption.
The use of improved stoves is currently promoted by the MEMD with support of the PREEEP Program funded by German Development Cooperation. About 600,000 units had been distributed by June 2008 in various country dis-tricts. The activity is also supported by the Dutch Govern-ment with additional funding.
Currently, three factories in Uganda – namely Kakira Sugar Works Ltd., Kinyara Sugar Works Ltd. and Sugar Cor-poration of Uganda Ltd. – run cogeneration plants based on bagasse. The total capacity is 22 MW. Out of this, 12 MW from Kakira Sugar Works is supplied to the grid. The rest is used for internal power supply of the sugar companies.
In July 2003, the company signed a Power Purchase Agreement (PPA) to sell electricity to Uganda Electricity Transmission Company Ltd. (UETCL) after an extension of its cogeneration plant. With the increased production capac-ity to 4,000 tons of cane per day, this led to increased produc-tion of bagasse. The Government of Uganda under the ERT program phase I offered a subsidy worth 3,300,000 USD to support the project. The total cost of the extension works was 8,000,000 USD with private equity of 1,608,215 USD and the rest of the funding through a loan from the World Bank. The subsidy was through a refinance scheme offered through the East African Development Bank but administered by the Bank of Uganda22. The feed-in tariff was fixed in 2008 by the regulator without a significant assessment of the actual costs of bagasse cogeneration.
According to the Renewable Energy Policy 2007, bagasse cogeneration from sugar production is targeted at 35 MW by 2012 and at 67 MW by 2017.
SHORT BUSINESS INFOThe biomass consumption per capita is 240 kg / year of firewood and 120 kg / year of charcoal.360,000 improved stoves have been already installed.The potential for biogas digesters is 250,000 cattle keep-ing households.
Biogas technologies do not have a strong demand in Uganda. Attempts have been made by the MEMD but with limited success. More that 50 % of the estimated 500 existing biogas plants are not operating. There is limited statistics on the ac-tual number in operation. With over 250,000 „zero grazing“ farming households (method were cattle is kept in one place), there is potential for small household biogas digesters in the countryside. In addition, commercial dairy farmers and pig-geries could support several thousand larger biogas plants to cater for their own thermal and electricity needs.
4.2 SOLAR ENERGYThe average solar radiation is 5.1 kWh/m² per day on a hori-zontal surface. Solar energy technologies have generated keen interest in the high income and commercial sectors of the Ugandan economy. Many solar energy companies have sustained activity in the market and several new ones keep emerging. A list of companies is provided in annex 5.1.A small commercial market exists for solar thermal systems. High-income urban households as well as hotels and resorts are the typical client of such systems, and the interest in the technology has soared in the last years.
Due to their reliability and quick payback, solar ther-mal systems of about 100–150 liters per day (LPD) for domes-tic use and 3,000 LPD systems for hotels are in high demand. Several companies are involved in marketing and installation of these systems. A range of technologies is installed depending on the major international manufacturers that are represented locally. Almost all systems are flat plate collectors. Prices on the market vary depending on the type of the technology and the brand or the manufacturer, however, a typical 200 LPD system costs 2.0 million to 3.0 million UG Shs, while a 300 LPD system costs 3.5 million to 4.8 million UG Shs.
The total annual new installed PV capacity is estimated at 200 kWp for households, institutions and commercial use. Under the ERT program, 20 companies benefited from business de-velopment support, including sales grants of 10 to 15 % (see annex 6.1). The system costs were reduced from 20 USD/Wp to 16.5 USD/Wp because of the subsidy23.
Since 2002, companies have installed nearly 5,000 institutional and household systems under the ERT phase I program. In total, 3,799 Solar Home Systems were installed with a total capacity of 187 kWp. The system sizes range be-tween 14 Wp and 200 W. Around one-third of the systems were large systems (> 200 Wp). 635 systems had a capacity of around 50 Wp and the majority was below 30 Wp. Addition-ally, 1,928 institutional and 192 commercial PV systems were installed with a total power of 1,223 kWp.22 MEMD, AS OF 2007
23 MEMD, AS OF 2008.
ENERGY TYPE PRICE
Investment costs of domestic 3 kW electric heater 300,000 UG Shs
Annual energy consumption at 2 hours daily: 2,190 kWh
Annual electricity cost 2,190 kWh x 426 UG Shs/kWh x 1.18 (VAT): 1.11 million UG Shs
Investment costs of 150-liter solar water heater: 1.88 million UG Shs
Payback period: 17 months
SOLAR HOT WATER HEATER – EXAMPLE

117COUNTRY INTRODUCTION
UGANDA
Renewable Energies in East Africa
PLANNED IMPLEMENTATIONS UNDER PHASE II OF THE ERT PROGRAM ARE:
Approximately 16 million people in 3 million households cur-rently use kerosene wick lamps for lighting. There is an inter-est to market solar lighting to substitute kerosene lamps. The Rural Electrification Strategy and Plan intends to electrify 400,000 households. 20 % out of these shall be electrified with small Solar Home Systems, amounting to some 700 kWp by 2017. This is a 10 % contribution to the rural electrification target by 201724.
SHORT BUSINESS INFOThe demand for solar hot water heaters increases in the cities.The total PV market is estimated at 200 kWp per year with 20 PV companies.ERT Phase II will finance 20,000 SHS and another 2,000 larger PV systems with a total capacity of around 2 MWp.In addition, the Rural Electrification Strategy and Plan aims to install small Solar Home Systems, amounting to 700 kWp by 2017
4.3 WIND POWERWind speed is low in most areas of Uganda. The average wind speeds in low heights (less than 10 m) generally range from 2 m/s to about 4 m/s25. In some areas with complex terrain, the wind may speed up due to slopes of hills and escapements and tunneling effects. However, very few wind systems exist in Uganda. They are mainly used for water pumping in the remote arid centers in the North East and some cattle keeping areas in the center.
Recent studies26 also confirm that electricity genera-tion through wind is feasible, especially for small industries in rural areas with windmills in the range of 2.5 kW to 10 kW.
4.4 GEOTHERMAL POWERThere is a total geothermal energy potential estimated at 450 MW. Three potential areas, Katwe-Kikorongo, Buranga and Kibiro situated in the Western branch of the East African Rift Valley, are earmarked for detailed exploration for geo-thermal development.
The German Federal Institute for Geosciences and Natural resources (BGR) supports the Government of Ugan-da in the geo-scientific investigations at Buranga geothermal prospect. At the site, the MEMD through the Geological Sur-vey and Minerals Department (GSMD) foresees to produce electricity with support by ARGeo (African Rift Geothermal Development Facility)27.
4.5 HYDRO POWER
Small Hydro PowerThe Ugandan market for small hydro power is growing rapid-ly. More than 60 mini hydro power sites with a total potential of about 210 MW have been identified through different stud-ies in Uganda. Some of the sites can be developed for isolated grids, others as energy suppliers to the grid. Recently, KfW Entwicklungsbank (German Development Bank) advertised tenders for studies on two projects at Maziba in Kabale and the Bwindi Impenetrable Forest Reserve. Two plants are un-der construction under the ERT program – a 3.5 MW plant at Nyagak in West Nile and a 294 kW plant (upgraded from 60 KW) at Kisizi. In addition, 16 MW of independent gen-eration are currently in operation at other grid-connected two plants. They are located at the foothills of the Rwenzori Mountains in the West of Uganda. They are operated pri-vately by Kilembe Mines Ltd. (5.4 MW) and Kasese Cobalt Company Ltd. (10.5 MW)28.
Large Hydro Power Two hydro power plants at the source of the Nile River pro-vide the bulk of Uganda’s electricity supply. The two stations are located at the outlet of Lake Victoria – Nalubale and Ki-ira – with a total capacity of 380 MW. Both are owned by the Uganda Generation Company Ltd. They are being operated on a 20-year concession by Eskom Uganda Ltd., a subsidiary of Eskom South Africa, which started in 2003. The Govern-ment of Uganda is investing in large hydro power through Public-Private Partnership (PPP). The Bujagali hydro power plant of 250 MW is under construction and tenders associated with this project have been issued. In 2008, the construction for the Karuma dam with a 200 MW capacity was started. The Isimba dam, with a hydro power capacity of 100 MW is also in planning. Investment opportunities exist for engineer-ing, supply and services for these projects.
A list of planned projects can be found in annex 7 “Development of Hydro Power Projects on the Nile River“29.
SHS (average 30 Wp) 20,000 systems 600 kWp
Non-project institutional systems (average 465 Wp) 1,000 systems 465 kWp
Schools (average 455 Wp) 560 systems 255 kWp
Health centers (average 835 Wp) 464 systems 387 kWp
Water pumping (a. 13 kWp) 30 systems 392 kWp
TOTAL 22,054 SYSTEMS 2,099 KWP
24 MEMD, AS OF 2002
25 MEMD, AS OF 2007
26 MEMD, AS OF 2007
27 BGR, AS OF 2009
28 MEMD, AS OF 2007
29 ERA, AS OF 2009

118COUNTRY INTRODUCTION
UGANDA
Renewable Energies in East Africa
5 RENEWABLE ENERGY BUSINESS INFORMATION AND CONTACTS
This chapter provides a list of companies and related organiza-tions currently involved in the Ugandan RE market.
5.1 RENEWABLE ENERGY COMPANIES & BUSINESS RELATED ORGANIZATIONS
ERT – Participation in the Sales-based Performance Grants Program: Approved Companies in 200830
30 SEE BUDS-ERT, AS OF 2009
COMPANY CONTACT PERSON/ADDRESS
Uga Solar Supplies Ltd. Mr. Joseph MukasaPhone: [email protected]
Incafex Solar Systems Ltd. Mr. Henry NganwaPhone: +256-414-250008, [email protected]
Solar Energy (U) Ltd. Mr. Richard KanyikePhone: +256-414-232114, [email protected]
Solar Energy for Africa Ltd. Eng. Philip WalusimbiPhone: [email protected]
Ultra Tec (U) Ltd. Mr. Abhay ShahPhone: +256-414-501620, [email protected]
Energy Systems Ltd. Mr. Emmy Kimbowa Phone: +256-414-250920, [email protected]
Power Options Ltd. Mr. Musoke KivumbiPhone: +256-312-261127, [email protected]
Uganda Electronics & Computer Industries Ltd. Mr. Charles MulamataPhone: +256-75-2643027, [email protected]
Kasese Solar Power Ltd. Mr. Agaba AbbeyPhone: +256-483-44413, [email protected]
Magric (U) Ltd. Mr. Mike Magnay, Ms Jovia BogerePhone: [email protected]
Dembe Trading Enterprises Ltd. Mr. Anil DamaniPhone: [email protected]
Victoria Electricity Supply Co. Ltd. Mr. Fred MWesigyePhone: +256-77-2757712
Solar Sense Ltd. Mr. Francis S KibuukaPhone: +256-392-2961267, +256-71-2606088Fax: +256-414-568778
Ital Trade Ltd. Mr. Andrea MarinelliPhone: +256-77-2767862, [email protected]
Global Solar Systems Mr. Joel LekuPhone: +256-78-2441536, [email protected]
Uganda Batteries Ltd. Ms. Betty KiguliPhone: [email protected], [email protected]
Uganda Solar Power Supplies Ltd. Mr. Osbert TindimwebwaPhone: +256-78-2952020, [email protected]

119COUNTRY INTRODUCTION
UGANDA
Renewable Energies in East Africa
Renewable Energy Companies Active in Uganda
NAME ADDRESS TECHNOLOGY PROFILE
Uganda Electricity Generation Company Ltd.
Abercourt, 2–8 Faraday Rd.P. O. Box 1101 Jinja – UgandaPhone: +256 434 12081Fax: +256 434 123064
Hydro Public company that owns governmental hydro power plants
Eskom (U) Ltd. Nalubale Power Station Box 942 Jinja – UgandaPhone: +256 434 121416Fax: +256 434 123154
Hydro Has the 20 year concession to run and maintain the Nalubaale and Kira power stations
Norpak Power Ltd. Crusader House 1st Floor Portal AvenueBox 7544 Kampala – UgandaPhone: +256 414 340243/4/5Fax: +256 414 257861
Hydro Developer of the Karuma hydro power station
West Nile Rural Electrification Company Ltd.
Box 241 Arua – UgandaPhone: +256 47 4620076
Thermal/Hydro Operates the West Nile power grid and developer of the 3.5 MW Nyagak hydro power plant
Uganda Electricity Distribution Co Ltd.
Amber House Plot 23/33, Kampala Rd. P. O. Box 7390 Kampala – UgandaPhone: +256 31 2330300Fax: +256 41 [email protected]
Distribution (33 kV and lower) Owns the national electricity distribution network
UMEME Ltd. Rwenzori HousePlot 1 Lumumba Avenue Box 23841 Kampala - UgandaPhone: +256 31 2360600Fax: +256 41 [email protected]
Distribution (33 kV and lower) Has the 20 year concession to run the distribution business
Solar Construct Ltd. 15 Mulwana Rd.P. O. Box 26216 Kampala – UgandaPhone: +256 77 4290505 [email protected]: www.solarconstruct.com
Solar thermal Solar water heater fabrication and installation
Balton Uganda Ltd. Plot 47/51 Mulwana Rd.P. O. Box 852 Kampala – UgandaPhnoe: +256 31 2502300 / +256 753330767Fax: +256 41 [email protected]: www.baltoncp.com
Solar thermal Engineering firm, Cromagen solar water heaters repairs
Elektrex Ltd. 6th Street Industrial AreaPlot 201P. O. Box 11937, Kampala – UgandaPhone: +256 414 [email protected]
Solar PV Sale of solar PV systems
UltraTec (U) Ltd. P. O. Box 6832, Plot 4520 Kabalagala Close, Kam-pala – Uganda Phone: +256 772200007, +256 752 200007, +256 712 200007, +256 414 [email protected]: www.ultratecworld.com
Solar thermal, PV Solar kits and lanterns,solar heater
Uganda Stove Manufacturers Ltd. Kayemba Rd.P. O. Box 1265 Kampala – Uganda
Improved stoves Rocket stove manufacturers
AB Matra Uganda Ltd. 87 First St.P. O. Box 35022 Kampala – UgandaPhone: +256 414 348874, +256 712 330 [email protected]
Solar thermal, PV Solar kits and lanterns,Solar heater KOTAK URJA Rep.
Magric (U) Ltd. Plot103 Jinja RoadP. O. Box 3218 Kampala – [email protected]: www.magric.com
Solar PV Manufacturing representative of BP Solar (and others)
Kasese Solar Power (Ltd.) Plot 58 Rwenzori Rd.P. O. Box 299, Kampala – UgandaPhone: +256 483 444413, +256 752 865080Fax: +25641 [email protected]
Solar PV Solar systems distributor
K.K Electrical Engineering Ltd. Church Hostel BuildingPlot 50/52 Mbaguta Street,P. O. Box 14 Mbarara – KampalaPhone: +256 772 571888
Solar PV Solar systems distributor
Incafex Solar Systems Ltd. Gathani HousePlot 9/6 Bombo RoadP. O. Box 25995 Kampala – UgandaPhone: +256 41 4250008, +256 41 4231160, +256 41 [email protected]: www.incafexsolar.com
Solar PV Solar systems distributor
Solar Energy for Africa Plot 40 Bombo Rd.Carol House Box 4155 KampalaTelephone: +256 41 4250125 Fax: +256 41 [email protected] site: www.solarafrica.com
Solar Supply and installation of solar PV solar heating systems

120COUNTRY INTRODUCTION
UGANDA
Renewable Energies in East Africa
NAME ADDRESS TECHNOLOGY PROFILE
Power Options Ltd. Teachers House 1st floor Suite109Plot 28/30 Bombo Rd.P. O. Box 33435 Kampala – UgandaTelephone: +256 31 2264264, +256 41 4348442Fax: +256 41 434842
Solar PV Solar system distributor
Suntopway Solar (U) Ltd. Span House Rm 202Portal Avenue (next to Workers House)P. O. Box 11915 Kampala – UgandaPhone: +256 75 2099999, +256 77 [email protected]: www.suntopway.com
Solar Supply and installation of solar PV solar heating systems
Boomer Systems Plot 13/15 Sturrock Rd. KamokyaP. O. Box 70027 Kampala – UgandaPhone: +256 312 277709, +256 77 2401854Fax: +256 414 [email protected]@37.com
Solar Supply and installation of solar PV solar heating systems
Girasolar East Africa Ltd P. O. Box 6946 Kampala – UgandaPhone: +256 31 2279920, +256 77 2697049Fax: +256 41 [email protected]: www.girasolar.co.ug
Solar Supply and installation of solar PV solar heating systems
Uganda Solar Power Supplies 8th Street, Industrial AreaKampala – UgandaPhone: +256 782 952020
Solar PV and solar heating Design, installation and maintenance of solar and backup power systems, lighting water heating, pump-ing systems
Energy Systems Ltd. Plot 3 William Street, Get In House, Suite #109, P. O. Box 25928 Kampala – Uganda Phone: +256 414 250 920, +256 772 610904 +256 772 313470 Fax: +256 414 [email protected]: www.energysystemsug.com
Solar hybrid systems based on solar, wind, diesel, biomass, etc.
Retail sales, wholesale supplier, importer, mini grids, hybrid systems
African Alternative Energy Solu-tions, Ltd.
P. O. Box 100 NtindaKampala – Uganda Phone: +256 782 722 031
Solar PV and solar heating Consulting, design and installation of hybrid power systems, backup power systems, solar electric power systems, batteries emergency backup
Equatorsun Ltd. Plot 4643 Kisugu, P. O. Box 71312 Kampala – UgandaPhone: +256 772 602205, +256 312 277719 Fax: +256 312 277719
Solar water heating systems Supply and installation of solar electric power systems for hospitals, schools, hotels, and domestic applications
GITT Uganda Plot 4 Pilkington Road, Colline House, Kampala, – Uganda orP. O. Box 6511, Kampala – Uganda Phone: +256 414 375046 or +256-712 503440 Fax: +256 414 348112
Solar PV Supply, installing and servicing of solar PV systems
Power Consult (U) Ltd. P. O. Box 9375 Telephone: +256772504551
Solar Sales supplier
Davis & Shirtliff Solar Kitgum House, Jinja RoadPO Box 22824, Kampala – UgandaPhone: +256 4346337/6Fax: +256 4346335d&[email protected]: www.dayliff.com
Solar water heaters and solar pumps
Distributor of Dayliff solar water heaters
The Sugar Corporation of Uganda Ltd. (SCOUL)
Plot 135, 6th Street Industrial AreaP. O. Box 1185, Kampala – UgandaPhone: +256-41-25 50 36 Fax: +256 41 34 75 97 [email protected] Website: www.mehtagroup.com/Sugar.htm
Biomass Sugar manufacturer
Kakira Sugar Works Ltd. Kakira Estate, JinjaP. O. Box 121, Jinja – UgandaContact: Richard OrrPhone: +256 (0) 414 444000Fax: +256 (0) 414 444333Mobile: +256 (0) 75 2790055 [email protected] Website: www.kakirasugar.com
Biomass Sugar manufacturer, power export to national grid, confectionery manufacture, tea manufacture, soap manufacture
Kinyara Sugar Works Ltd. 34 Lumumba AvenueP. O. Box 7474, Kampala – UgandaContact: Jack McleanTelephone: +256 (0) 36 600200 [email protected] Website: www.kinyara.co.ug
Biomass Sugar manufacturers managed by UK Company Booker Tate Ltd. (current capacity 64,000 tons per year)

121COUNTRY INTRODUCTION
UGANDA
Renewable Energies in East Africa
5.2 LOCAL INSTITUTIONS RELATED RENEWABLE ENERGY BUSINESS
NAME ADDRESS PROFILE ROLE
Uganda Electricity Transmis-sion Company Ltd.
Amber House 29/33 Kampala Rd.P. O. Box 7625, Kampala – Uganda
Public company that owns grid, sole bulk electricity buyer
Operation, maintenance and development of the grid con-necting generation facilities to load centers and to neighbor-ing countries
Uganda National Chamber of Commerce and Industry
17/19 Jinja Road P. O. Box 3809 Kampala – Uganda
Organization of private business Promotion of private business interests as well as partner-ships
Private Sector Foundation Uganda
Plot 43 Nakasero Road P. O. Box 7683 Kampala – Uganda Phone: +256 41 342163 230956 Fax: +256 41 259109 [email protected]
Umbrella organization of busi-ness associations
Advocacy, capacity building and management of sales-based incentives on solar systems
Uganda Manufacturers As-sociation
Lugogo Show Grounds P. O. Box 6966 Kampala – Uganda Phone: +256 41 221034 / 220831 Fax: +256 41 220285
Association of manufacturers Capacity building, liaison and pressure group, organization of the Uganda International Trade Fair
Uganda Renewable Energy Association
[email protected] Association of businesses in the solar/ renewable energy sector
Liaison with Government and donor agencies
Energy Institute of Uganda Kisozi House ComplexP. O. Box 70826 Kampala – UgandaWebsite: www.energyinstug.org
Industry multidisciplinary organization
Capacity building and awareness raising
FINCA Uganda Plot 22 Ben Kiwanuka Street P. O. Box 24450 Kampala – Uganda Phone: +256 41 4 231134 Fax: +256 41 340 078 Contact: Fabian Kasi (Country Director) [email protected]
Financial institution providing financing services mainly for low-income entrepreneurs(to support job creation, asset building and improve living standards)
Village banking and working capital, solar loans, village phone loans, K O Net, savings accounts, money transfers etc.; as an industry leader, FINCA Uganda finances a significant proportion of its activities by mobilizing client savings

122
UGANDA
Renewable Energies in East Africa
6 BIBLIOGRAPHY
The Uganda Gazette (1999): Electricity Act 1999, No. 56 Vol. XCII, Kampala
Ministry of Energy and Mineral Development – MEMD (2001): Rural Electrification Strategy and Plan Covering the Period 2001 to 2010, Kampala
Ministry of Energy and Mineral Development – MEMD (2002): The Energy Policy for Uganda, (www.energyand-minerals.go.ug/EnergyPolicy.pdf), Kampala
Ministry of Energy and Mineral Development – MEMD (2004): Uganda Energy Balance, Kampala
Ministry of Energy and Mineral Development - MEMD (2005): Annual Report, Kampala
Ministry of Energy and Mineral Development - MEMD (2006): Annual Report, Kampala
Ministry of Energy and Mineral Development - MEMD (2007): ERT Quarterly Report, June – September 2007, (www.energyandminerals.go.ug/EnergyDocuments/ERT %20Bulletin %20 %202007.pdf)
Ministry of Energy and Mineral Development – MEMD (2007): The Renewable Energy Policy for Uganda, (www.energyandminerals.go.ug/EnergyDocuments/RENEWA-BLE %20ENERGY %20POLIC9-11-07.pdf), Kampala
Ministry of Energy and Mineral Development – MEMD (2007): Annual Report, Kampala
Ministry of Energy and Mineral Development – MEMD (2008): Evaluation of Phase I of the Energy for Rural Transformation, Kampala
Ministry of Energy and Mineral Development – MEMD (2009): ERT Fact Sheet, (www.energyandminerals.go.ug/ERT_Fact_Sheet.pdf)
Uganda Bureau of Statistics – UBOS (2006): 2002 Uganda Population and Housing Census. Analytical Report, Abridged Version, (www.ubos.org/nada/index.php?editable=no&page_type=catalog) Kampala
Uganda Bureau of Statistics – UBOS (2008): Statistical Abstract, Kampala
Uganda Bureau of Statistics – UBOS (2008): 2005/06 Uganda National Household Survey, (www.ubos.org/nada/index.php?editable=no&page_type=catalog), Kampala
Uganda Bureau of Statistics – UBOS (2009): Statisti-cal Abstract, (www.ubos.org/onlinefiles/uploads/ubos/pdf %20documents/2009Statistical_ %20Abstract.pdf), Kampala
Ministry of Finance, Planning and Economic Develop-ment – MOFPED (2008): Background to the Budget, Kampala
Ministry of Finance, Planning and Economic De-velopment – MOFPED (2008), Uganda’s Economic and Financial Overview 2007/08, (www.finance.go.ug/docs/Uganda %27s %20Economic %20and %2-0Financial %20Overview %202007-08.pdf)
National Environment Management Authority (2007): State of the Environment Report for Uganda 2006/07, Kampala
Uganda Investment Authority – UIA (2007): Brief Guide to Investing in Uganda, (www.ugandainvest.com/uia2.php?uhpl=guide&&uhpl1=Guide)
Uganda Investment Authority – UIA (2008): En-ergy Sector Profile, (www.ugandainvest.com/uia2.php?uhpl=mining_and_energy&&uhpl1=Mining)
Rural Poverty Portal (2009): Rural poverty in Uganda (www.ruralpovertyportal.org/web/guest/country/home/tags/uganda)
Central Intelligence Agency – CIA (2009 ): World Fact Book, Uganda Oil Consumption (www.cia.gov/library/publications/the-world-factbook/geos/UG.html)
Central Intelligence Agency – CIA (2009 ): World Fact Book: Uganda, (www.cia.gov/library/publications/the-world-factbook/geos/UG.html)
Bundesanstalt für Geowissenschaften und Rohstoffe – BGR (2009): African Rift Geothermal Facility (ARGeo), (www.bgr.de/geotherm/projects/argeo.html)
World Bank (2009): Uganda – Second Energy for Rural Transformation (ERT II) Project, (http://go.worldbank.org/KEP8IXU940)
Websites Electricity Regulatory Authority ¬ ERA: (www.era.or.ug). The site provides a wide range of information on legisla-tion, licensing, project opportunities, tariffs and power statistics.
Rural Electrification Agency – REA: (www.rea.or.ug). The site provides information on channels for the private sector and local communities to access rural electrification sub-sidy funds for projects. It also provides an Investor‘s Guide.
Business Uganda Development Scheme – Energy for Rural Transformation – BUDS-ERT: (www.psfuganda.org/buds-ert.asp, as of 2009). The site provides information on the ERT Program and business-related issues.
GTZ/PREEP: (www.gtz.de/en/themen/umwelt-infrastruk-tur/energie/16464.htm). The site provides a description of the GTZ activities in Uganda and links to other GTZ projects in the country.
Ministry of Energy and Mineral Development – MEMD: (www.energyandminerals.go.ug). Official government site on energy policy issues, providing policy documents, an-nual reports, energy balance and project documents.
Uganda Investment Authority – UIA: (www.ugandainvest.com). The site provides information on guidelines, invest-ment incentives and other information on investing in Uganda.
UMEME Ltd.: (www.umeme.co.ug). The site provides information on Uganda‘s electricity distribution network and other information regarding network operations.
Global Energy Network Institute – GENI: (www.geni.org). The site provides information on national energy grids including Uganda’s national grid.
Unimaps.com: (http://unimaps.com/uganda/mainmap.gif ). The site provides information on maps and maps of African countries including Uganda in particular.
World Bank: (http://web.worldbank.org)
BIBLIOGRAPHY

123
UGANDA
Renewable Energies in East Africa
7 ANNEX
ANNEX
Source: Unimaps.com, http://unimaps.com/uganda/mainmap.gif, as of 2005
FIGURE 2
Country Map of Uganda

124
UGANDA
Renewable Energies in East Africa
Source: UIA, as of 2008
FIGURE 3
Electricity Network of Uganda
ANNEX

125
UGANDA
Renewable Energies in East Africa
Source: MEMD, as of 2007
FIGURE 4
Wind Energy Sources
ANNEX

126
UGANDA
Renewable Energies in East Africa
Source: MEMD, as of 2007
FIGURE 5
Solar Radiation
ANNEX

127
UGANDA
Renewable Energies in East Africa
Source: MEMD, as of 2007
FIGURE 6
Geothermal Sources
ANNEX

128
UGANDA
Renewable Energies in East Africa
Source: MEMD, as of 2007
FIGURE 7
Large Hydro Power Sources
ANNEX

129
UGANDA
Renewable Energies in East Africa
Source: MEMD, as of 2007
FIGURE 8
Mini Hydro Power Sources
ANNEX
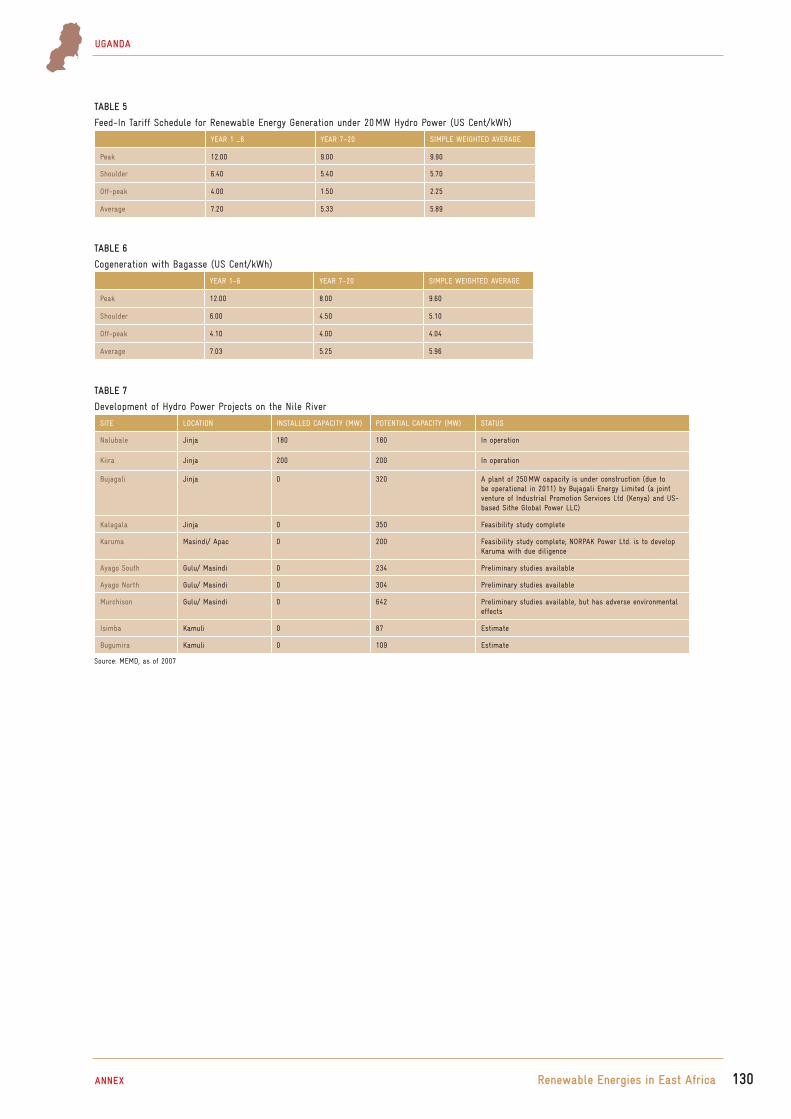
130
UGANDA
Renewable Energies in East Africa
YEAR 1 _6 YEAR 7–20 SIMPLE WEIGHTED AVERAGE
Peak 12.00 9.00 9.90
Shoulder 6.40 5.40 5.70
Off-peak 4.00 1.50 2.25
Average 7.20 5.33 5.89
TABLE 5
Feed-In Tariff Schedule for Renewable Energy Generation under 20 MW Hydro Power (US Cent/kWh)
TABLE 6
Cogeneration with Bagasse (US Cent/kWh)
YEAR 1–6 YEAR 7–20 SIMPLE WEIGHTED AVERAGE
Peak 12.00 8.00 9.60
Shoulder 6.00 4.50 5.10
Off-peak 4.10 4.00 4.04
Average 7.03 5.25 5.96
TABLE 7
Development of Hydro Power Projects on the Nile River
SITE LOCATION INSTALLED CAPACITY (MW) POTENTIAL CAPACITY (MW) STATUS
Nalubale Jinja 180 180 In operation
Kiira Jinja 200 200 In operation
Bujagali Jinja 0 320 A plant of 250 MW capacity is under construction (due to be operational in 2011) by Bujagali Energy Limited (a joint venture of Industrial Promotion Services Ltd (Kenya) and US-based Sithe Global Power LLC)
Kalagala Jinja 0 350 Feasibility study complete
Karuma Masindi/ Apac 0 200 Feasibility study complete; NORPAK Power Ltd. is to develop Karuma with due diligence
Ayago South Gulu/ Masindi 0 234 Preliminary studies available
Ayago North Gulu/ Masindi 0 304 Preliminary studies available
Murchison Gulu/ Masindi 0 642 Preliminary studies available, but has adverse environmental effects
Isimba Kamuli 0 87 Estimate
Bugumira Kamuli 0 109 Estimate
Source: MEMD, as of 2007
ANNEX

131
UGANDA
Renewable Energies in East Africa
NAME DISTRICT STATUS INSTALLED (MW) POTENTIAL (MW)
Maziba Kabale Out of operation-needs rehabilitation (KfW financing the rehabilitation) 1.00 1.00
Kuluva Moyo In operation, feeding Kuluva Hospital 0.12 1.00
Kagando Kasese In operation, feeding Kagando Hospital 0.06 1.00
Kisiizi Rukungiri In operation at 60 kW; expansion to 294 kW is in progress under the ERT program
0.06 0.30
Mobuku I Kasese Operated by Kilembe mines; supplies Kilembe and feeds into the main grid
5.40 5.40
Mobuku III Kasese Operated by Kasese Cobalt Co. and feeds into the main grid 10.50 10.50
Muzizi Kibale/Kabarole Under development by SN Power Invest AS; permit granted November/De-cember 2004 for 12 months; feasibility study still ongoing
20.00
Warugo Bushenyi Pre-feasibility study carried out by UNIDO 0 3.50
Rwizi Mbarara Pre-investment studies carried out 0 0.50
Kakaka Kabarole Feasibility studies carried out by SWECO (Swedish engineering firm), Eco Power has applied for permit
0 7.20
Nshungyezi Mbarara Electricity Distribution Management (Namibia) has permit to develop the site
0 20.00
Nyamabuye Kisoro Developer is the Uganda Sustainable Energy Company Limited (USEC); permit granted in February 2005; feasibility study was conducted by Norplan; USEC is yet to start on pre-investment study
0 2.20
Siti Kapchorwa Developer Mt. Elgon Power Company; permit issued in July 2002 and extended until September 2004
0 3.30
Sipi Kapchorwa Developer Mt. Elgon Power Company; permit issued in July 2002 and extended until September 2004
0 2.50
Anyau/ Olewa Arua WENRECO has exclusive rights to the site through the West Nile License 0 1.50
Haisesero Kabale Estimate 0 1.00
Kitumba Kabale Estimate 0 0.20
Mpanga Kabarole Estimate 0 0.40
Nyakibale Rukungiri Estimate 0 0.10
Leya Moyo Estimate 0 0.12
Amua Moyo Estimate 0 0.18
Mvepi Arua Estimate 0 2.40
Ela Arua Estimate 0 1.50
Agoi Arua Estimate 0 0.35
Ngusse Kibale Estimate 0 0.40
Kikagati Mbarara Old power plant used to operate at 1 MW; China Shang Sheng Industrial Company to rebuild and expand plant to 20 MW; permit granted on 29 July 2005
0 20.00
Sezibwa Mukono Estimate 0 0.50
Tokwe Bundibugyo Developer Uganda Energy for Rural Development (UERD) 0 0.10
Mgiita Bundibugyo Estimate 0 0.15
Miria Adua Arua Estimate 0 0.10
Ishasha Rukungiri Feasibility studies carried out by consultant; Eco Power has applied for a permit and is carrying out pre-investment studies
0 6.50
Buseruka Hoima Feasibility studies done by Hydromax; 12 months of the permit granted; effective 1 August 2005
0 10.00
Nengo Ridge Kanungu/ Rukungiri
Developer SN Power Invest AS; permit granted November/December 2004 for 12 months
0 7.50
Bugoye Kasese Developer SN power invest AS; permit granted November/December 2004 for 12 months
0 11.00
Mobuku II Kasese Developer SN power Invest AS; permit granted November/December 2004 for 12 months
0 13.00
Kyambura Bushenyi Pre-feasibility studies being carried out by Eco Power 0 0.00
Muyembe Sirinutyo Sironko Developer Mt. Elgon Power Company; permit issued July 2002 and extended until expiry in September 2004
0 2.60
Ririma Kapchorwa Developer Mt. Elgon Power Company; permit issued July 2002 and extended until expiry in September 2004
0 1.20
Mahoma Kamwenge/Kabarole Developer Uganda Energy for Rural Development, permit granted in November/December for 12 months
0 3.00
Rwebijoka Kabarole Developer Uganda Energy for Rural Development; permit granted in November/December for 12 months
0 1.00
TABLE 8
Non-Nile Mini/Micro Hydro Power Sites
ANNEX

132
UGANDA
Renewable Energies in East Africa
Source: MEMD, as of 2007
NAME DISTRICT STATUS INSTALLED (MW) POTENTIAL (MW)
Mitano Kanungu/Rukungiri Estimate 0 2.50
Rwempungu Bushenyi Estimate 0 2.30
Cresta Ibanda Estimate 0 2.00
Rwenzori Kasese Estimate 0 3.00
Mpanga Escarpment Kamwenge Estimate 0 14.00
Rwigo Bundibugyo Estimate 0 0.00
Nyahuka Bundibugyo Estimate 0 0.70
Nkussi Escarpment Hoima/Kibaale Estimate 0 11.00
Nkussi at Pachwa Hoima/Kibaale Estimate 0 0.38
Waki Hoima/Masindi Developer SN Power Invest AS; permit granted November/December 2004 for 12 month; feasibility study by Norplan
0 5.00
Sonso Masindi Estimate 0 1.40
Waisoke Masindi Estimate 0 1.70
Izizi Masindi Estimate 0 1.60
Esia Adjumani Developer Adjumani Rural Electrification Company 0 1.00
Kochi Koboko Estimate 0 0.91
Nyarwodo I Nebbi Estimate 0 0.00
Nyagak I Nebbi Feasibility study completed and ready for development; WENRECO was awarded concession in March 2003; conducting a Resettlement Action Plan (RAP); construction expected to begin January 2007
0 3.50
Nyagak II Nebbi Estimate 0 3.00
Ora Arua Estimate 0 0.90
Manafwa Manafwa Estimate 0 0.75
Simu Sironko Estimate 0 2.60
TABLE 9
Large Hydro Power Sites at Nile River
Source: MEMD, as of 2007
SITE LOCATION INSTALLED CAPACITY (MW) MAX. POTENTIAL CAPACITY (MW) STATUS
Nalubale (Owen Falls Dam) Jinja 180 180 In operation
Kiira (Owen Falls Extension) Jinja 200 200 In operation
Bujagali Jinja 250 320 IPS Consortium has started construction to generate 250 MW
Kalagala Jinja 0 350 Feasibility study complete
Karuma Masindi/Apac 200 200 Feasibility study complete; NORPAK Power Ltd. to develop site
Ayago South Gulu/Masindi 0 234 Preliminary studies available
Ayago North Gulu/Masindi 0 304 Preliminary studies available
Murchison Gulu/Masindi 0 642 Preliminary studies available, but has adverse environmental effects
Isimba Kamuli 0 100 Estimate
Bugumira Kamuli 0 109 Estimate
ANNEX

133
UGANDA
Renewable Energies in East Africa
Source: data compiled by the author, as of 2009
TABLE 10
Ongoing Energy Programs in Uganda
PROJECT INSTITUTION INVOLVED DESCRIPTION FUNDING STATUS
Energy for Rural Trans-formation(ERT)
Ministry of Energy and Mineral Development (MEMD)
A ten-year program that aims at increasing rural access to energy from the present 1 % to 10 % in ten years through three means: i) grid extensionii) IPPs (for mini grids) and iii) solar energy
World Bank and GEF have funded WENRECO hydro power, Kakira co-generation and Kisiizi hydro power projects; market development and capacity building in installation of solar home systems, electrification of pilot schools and health centers as well as water supply schemes
Phase I ending (covering institutional development, baseline studies, pilot projects in 12 districts, business de-velopment, establishment of refinancing scheme); Phase II to begin (emphasis on implementation and financing of projects)
Energy Advisory Project/ Promotion of Renewable Energy and Energy Efficiency Programme (PREEP)
German Development Cooperation / GTZ
A project based at the MEMD provides energy policy advisor services and facilitates im-proved access to modern sustainable energy services for the Ugandan economy and the Ugandan population, especially the poor
Provided support to the dissemina-tion of improved stoves, solar home systems through private companies and NGOs; has disseminated 600,000 stoves, electricity saving lamps to more than 10,000 households; some 69 institutions have been equipped with solar PV systems since September 2006
Phase III of the Energy Advisory project ran from June 2005 to May 2008; the new program on promotion of RE and energy efficiency started in 2008 and its first phase will be until May 2011 (funding available amounts to 5.9 million €)
Rural Electrification Projects
KfW Entwicklungsbank Investment financing in RE projects WENRECO, grid extension in West Nile (2007–2009), 4.0 million €; rehabilitation of Maziba Hydro Power Plant 1 MW (2007–2009), 2.5 million €;transmission line Entebbe–Mutundwe (2008–2010);mini hydro power plants in West Nile, 4 million €
Feasibility studies advertised and being undertaken
African Development Bank (AfDB)
AfDB Investment in large hydro power projects Bujagali hydro power project (2007–2011), 110 million USD;Bujagali Interconnection Project (2008–2010), 28 million USD;Rural Electrification Project (2009–2012), 30 million USD;Buseruka mini hydro power project (2008–2011), 8–10 million USD
ANNEX

Renewable Energies in Central AsiaRegional Report on Potentials and Marktes – 8 Country Analyses
Energy-policy Framework Papers,
Section »Energy and Transport«
Promotion ofRenewable Energies

IMPRINT
Authors of Country Chapters Azerbaijan Islam Rafibeily (LLM & MSc Geo. ) Dr. Ing. Klaus Jorde Axel Biegert (Dipl. Economist & Pol.) Georgia Grigol Abramia (Dipl. Env. Management & Lit.) Dr. Ing. Klaus Jorde Axel Biegert (Dipl. Economist & Pol.) Kazakhstan Dr. Ing. Klaus Jorde Axel Biegert (Dipl. Economist & Pol.) with contributions by Gulnar Daniyarova (MSc. Econ. & Management) Kirgistan Olga Terenteva (LL.M, MA Finance, BA Engl. & Lit.) Dr. Ing. Klaus Jorde Axel Biegert (Dipl. Economist & Pol.) Mongolia Axel Biegert (Dipl. Economist & Pol.) Dr. Ing. Klaus Jorde Tajikistan Dr. Ing. Klaus Jorde Axel Biegert (Dipl. Economist & Pol.) Turkmenistan Kurban Balliyev (Eng. Water Management & Dipl.) Dr. Ing. Klaus Jorde Axel Biegert (Dipl. Economist & Pol.) Uzbekistan Dr. Ing. Klaus Jorde Axel Biegert (Dipl. Economist & Pol.) Review/Coordination Dr. Ing. Klaus Jorde Entec Consulting & Engineering AG St. Gallen, Switzerland www.entec.ch
Editor Deutsche Gesellschaft für Technische Zusammenarbeit (GTZ) GmbH Department Water, Energy, Transport Dag-Hammarskjöld-Weg 1–5 65760 Eschborn, Germany www.gtz.de
On behalf of Federal Ministry for Economic Cooperation and Development (BMZ)
Editorial staff Diana Kraft Tel: +49 (0)6196 79 4101 Fax: +49 (0)6196 79 80 4101 Email: [email protected]
Disclaimer/ Citation The data used in this report is based on publicly accessible sources, as well as on non-public papers and partly also on personal expert
interviews. Although the information given in this report is the best available to the authors at the time, GTZ, BMZ or the authors cannot be held liable for the
accuracy and correctness of the data included in the report.
GTZ is solely authorized for all forms of use of the publication. Duplication, reproduction or distribution of the report a s a whole or of parts of the report for
commercial purposes, require the prior written consent of GTZ. Other uses, including duplication, reproduction and distribution of the report as a whole or of
parts of the report for non-commercial purposes is permitted, provided the following appropriate citation of the GTZ publication as source is considered.
Deutsche Gesellschaft für Technische Zusammenarbeit – GTZ (2009): Regional Reports on Renewable Energies. 30 Country Analyses on Potentials and Markets in
West Africa (17), East Africa (5) and Central Asia (8). Frankfurt /Eschborn
Copyright © 2009 Deutsche Gesellschaft für Technische Zusammenarbeit (GTZ) GmbH.
2IMPRINT Renewable Energies in Central Asia
Axel Biegert (Dipl. Economist & Pol.) INTEGRATION Umwelt & Energie GmbHGraefenberg, Germany www.integration.org

AZERBAIJAN, GEORGIA, KAZAKHSTAN, KYRGYZSTAN, MONGOLIA,
TAJIKISTAN, TURKMENISTAN, UZBEKISTAN
1Renewable Energies in Central Asia
FOREWORD
BackgroundIn recent years a large number of developing and emerging countries have changed the structure of their energy sec-tors, often accompanied by a liberalization of their markets. In many cases, Renewable Energies (RE) are a more and more important strategic component for the countries’ diversifica-tion of their national energy supply.
A growing energy demand deriving from the increasing energy consumption of growing economies worldwide, accompanied by volatile prices for fossil fuels and by increasing environ-mental and climate challenges, boosts the demand for RE technologies. RE have a competitive advantage because they provide a long-term energy supply (for electricity, heating or cooling) based on locally available RE sources and thus help to reduce dependency on energy imports. In addition, RE provide appropriate technological solutions for the electrifi-cation of rural or semi-urban areas where they can be used independently from grid-connection. RE are a key for the pro-vision of modern energy services in these areas and contrib-ute to the local economic and social development.
While the technical potential for RE resources such as wind, solar, hydropower, biomass or geothermal energy is consid-ered high in most developing and emerging countries, these regions are still faced with significant barriers for the devel-opment of commercially driven and sustainable RE markets. The lack of appropriate policies and the respective business environment are constraints that restrict the dissemination of RE in these countries. The success of comprehensive policy frameworks for the promotion of RE – such as RE feed-in-tariffs or incentive instruments like tax relieves – can be ob-served in more and more countries, for example Germany or France. However today, also developing countries and emerg-ing markets such as South Africa, Kenya or the Philippines reveal the significance of adequate policy frameworks for favo-rable market conditions. Investments in RE markets, in partic-ular by the private sector, very much depend on the existence of these national or regional framework conditions, incentives and financing options on the one hand, but also on sufficient transparency and knowledge about these conditions, which are thus part of the bottleneck for the deployment of RE.
ObjectiveCurrent and accurate information and data availability are – as stated above - important prerequisites for the development of RE energy markets and a broader dissemination of com-mercial activities – particularly in markets where information is scarce and where framework conditions are under transi-tion. The Regional Reports on Renewable Energies comprising 30 country analyses on RE potentials and markets in West Africa, East Africa and Central Asia are a substantial contribution to the dissemination of comprehensive and precise knowl-
edge on RE markets and related investment options and thus help to further pave the way for the promotion of RE in these regions.As such the publication addresses potential businesses and investors – including manufacturers, technology providers, wholesalers, suppliers, project developers, operators, serv-ices companies, planning offices, consultancy firms, as well as financing institutions. The Regional Reports are both meant for those who are already active in the assessed RE markets, but also for those exploring new markets for their business activities. Of course, the publication also serves as a data-base with country-specific insights into the assessed African and Central Asian regions for interested actors from the pub-lic and civil sector.
The geographical scope of this publication is twofold: the Regional Reports on Renewable Energies focus on West Africa and East Africa which are mainly represented by develop-ing countries and economies, and on Central Asia as a re-gion predominantly characterized by countries in transition. All of these regions are promising markets for the RE industry and for potential investors as they offer remarkable, but still largely untapped RE potentials. Although market conditions which spur the promising RE potentials still need to be im-proved in almost all of the assessed countries, positive trends for the promotion and deployment of RE can be observed in many cases. Even in those countries, where the policy level still needs to be convinced of RE, political reformers more and more commit to take action for RE on the rise.
Deliverables The Regional Reports on Renewable Energies showcase com-prehensive, but still selective information on the specific characteristics of the energy sectors of the 30 assessed coun-tries – 17 in West Africa, 5 in East Africa and 8 in Central Asia.Key facts and figures on these energy markets and their RE potential is given in the executive summary of each regional report.Each country analysis comprises an introduction to the socio-economic, geographical and political background of the country. It also includes an overview on the national energy sectors, including figures on power generation capacities, energy con-sumption and price levels as well as information on relevant market structures. This is followed by a presentation of the respective energy policy framework conditions. The chapter on the status quo of RE presents data on country-specific techni-cal and economic RE potentials, as well as and on current RE investment projects and possible RE business opportunities. In addition, the report gives information on market challenges and risks. A snapshot of the relevant actors of the energy sec-tor (private, as well as public, civil and scientific) is also in-cluded and serves as a source for identifying potential (busi-ness) partners for RE projects. Finally, each country analysis includes a bibliography and an annex containing additional graphs and figures on RE sources and technologies.

AZERBAIJAN, GEORGIA, KAZAKHSTAN, KYRGYZSTAN, MONGOLIA,
TAJIKISTAN, TURKMENISTAN, UZBEKISTAN
2Renewable Energies in Central Asia
The presented regional reports series is part of the Energy-policy Framework Papers of the “Energy and Transport” sec-tion of Deutsche Gesellschaft für Technische Zusammenarbeit (gtz) GmbH.
The Regional Reports are also available for free of charge download on the GTZ website:http://www.gtz.de > Themes > Sustainable Infrastructure > Energy >
Renewable Energy > Further information > Downloads; or http://www.gtz.de/de/themen/umwelt-infrastruktur/energie/4552.htm
The editorial team – Eschborn, December 2009
AcknowledgementsThe editorial team – also on behalf of the Federal Ministry for Economic Cooperation and Development (BMZ) – would like to thank all contributors, in particular all authors and coordinators (especially Anton Hofer of WIP, Rafael Wiese of PSE AG and Dr. Klaus Jorde of Entec AG) who have contrib-uted to this publication by sharing their valuable insights and experiences.
Special thanks also to Rolf-Peter Owsianowski for his ef-forts to identify appropriate local experts as authoring con-tributors, to Barbara Meder for editing of the reports and to “die Basis – Kommunikation. Ideenwerk. Design.” for the design of the publication.

CONTENTS REGIONAL REPORT CENTRAL ASIA
3
REGIONALREPORT SUMMARY 4
AZERBAIJAN 8
GEORGIA 32
KAZAKHSTAN 54
KYRGYZSTAN 74
MONGOLIA 98
TAJIKISTAN 133
TURKMENISTAN 155
UZBEKISTAN 171
NOTE:Main references/indications of sources are provided in the respective country chapters and not in this summary of the country chapters.
CONTENTS Renewable Energies in Central Asia

Author of the Regional Report Summary Dr. Ing. Klaus JordeEntec Consulting & Engineering AGSt. Gallen, Switzerlandwww.entec.ch
REGIONAL REPORT SUMMARY –
BASED ON THE 8 COUNTRY CHAPTERS
AZERBAIJAN, GEORGIA, KAZAKHSTAN,KYRGYZSTAN, MONGOLIA, TAJIKISTAN, TURKMENISTAN, UZBEKISTAN
AZERBAIJAN, GEORGIA, KAZAKHSTAN, KYRGYZSTAN, MONGOLIA,
TAJIKISTAN, TURKMENISTAN, UZBEKISTAN
4Renewable Energies in Central Asia

ACRONYMS AND ABBREVIATIONS
REGIONAL REPORT SUMMARY
DB DOING BUSINESS CPI CORRUPTION PERCEPTIONS INDEX MW MEGAWATT RE RENEWABLE ENERGY PV PHOTOVOLTAIC US CENT UNITED STATES CENT
AZERBAIJAN, GEORGIA, KAZAKHSTAN, KYRGYZSTAN, MONGOLIA,
TAJIKISTAN, TURKMENISTAN, UZBEKISTAN
5Renewable Energies in Central Asia
CENTRAL ASIA SUMMARY

1 INTRODUCTION AND GENERAL OVERVIEW
The potential for using Renewable Energies (RE) differs strongly among the eight Central Asian countries. Some of them have huge oil and gas reserves while others are endowed with large hydro power, wind or solar resources depending on their climatic and topographical conditions. The common fea-ture shared by all of them is that their political and economic development was influenced by the former Soviet Union to a large extent. Azerbaijan, Georgia, Kyrgyzstan, Kazakhstan, Uzbekistan, Tajikistan and Turkmenistan are former Soviet Republics. Mongolia was the only independent state, although it had very close ties to the Soviet Union as well.
All economies were affected by painful transitions from centrally planned to market economies. The eight coun-tries are recent members of the Commonwealth of Independent states, except Mongolia and Georgia, which has withdrawn in 2008, and Turkmenistan, which is not a full member.
As a result of their political and economic history, the energy systems of these countries were mainly developed to serve the energy needs of the united energy system of the Soviet Union. They are often not ideal for the energy needs of their present economies. A related result is that their occa-sionally vast potential of renewable energy sources remains largely untapped, with the exception of large hydro power. The majority of the existing energy infrastructure including generation facilities and transmission networks is in disre-pair or inefficiently operated causing huge energy and finan-cial losses.
Meanwhile, after almost twenty years of transition, these countries have overcome the economic trough and are now back to a robust growth pattern going along with incre-asing political stability. There is a growing awareness in the region of the potential of renewable energy sources and most Governments have formulated policies for the increased deve-lopment or RE. However, apart from smaller initiatives, there is still little initiative from the private sector to invest in RE projects. The key findings of each country are given below.
2 OVERVIEW OF THE ENERGY SITUATION AND RENEWABLE ENERGY POTENTIAL OF EACH COUNTRY
Georgia The Government of the Republic of Georgia has enacted a renewable energy promotion program for power plants up to 100 MW offering long-term purchasing agreements, fa-vorable feed-in-tariffs and license-free electricity genera-
tion for power plants up to 10 MW. Under the program, the Government is tendering 91 potential new hydro power sites with capacities ranging from 0.6 MW to 99 MW. Second on the hit list are small- and medium-scale wind energy plants. Feasibility studies are available. Georgia has the best invest-ment climate of the eight countries. However, investor con-fidence has suffered after the armed conflict with Russia in 2008. Rankings with regards to the Ease of Doing Business Index (DB)1 and the Corruption Perceptions Index (CPI)2 are: DB 11/CPI 66.
Mongolia The Republic of Mongolia strives to reduce its heavy de-pendence on imports of Russian petroleum and electricity and has recently passed a renewable energy law. Private in-vestors are offered pre-defined feed-in-tariffs ranging from 5 US Cent for hydro power to 18 US Cent for PV electricity. Stand-alone renewable energy supply systems are attractive for nomadic households. There are also numerous isolated grids in rural centers where small hydro power or wind could replace diesel generators. The investment climate is fair to good, although corruption remains a risk factor. Rankings for Mongolia are: DB 60/CPI 120.
AzerbaijanThe Republic of Azerbaijan is richly endowed with oil and gas resources, but these resources will be depleted within a few decades. The country is therefore diversifying its energy sector. A renewable energy law was introduced in 2004 with no market development impact so far due to a lack of fund-ing and political will to enforce the provisions of the law, as well as very low feed-in-tariffs. Small hydro power is the most promising field for RE with hundreds of sites that po-tentially could be developed. Unfortunately, only few feasibil-ity studies exist. Second most promising is the development of wind power plants at the Caspian Sea border. The invest-ment climate is fairly good, but corruption is also rather high. Consequently, Azerbaijan’s rankings are: DB 38/CPI 143.
Kazakhstan Kazakhstan has enormous gas and oil resources, which have largely prevented the development of a market for renew-able energy so far. Nevertheless, the country has embarked on a strategy and passed legislation to promote RE resources targeting a 5 % share of RE in the energy balance by 2024. Wind energy is the most promising renewable resource in Kazakhstan but all other renewable energy sources have an interesting potential as well. RE projects could be particu-larly attractive in isolated rural areas, which often suffer from energy shortage. Doing business in Kazakhstan is con-sidered less easy, and foreign investors usually require sup-port from local law experts. Corresponding rankings are: DB 63/CPI 120.
Kyrgyzstan Kyrgyzstan generates most of its electricity from abundant hydro power resources. However, the country is suffering from a serious energy crisis due to decreasing inflows into the large reservoirs. There is still a huge unutilized hydro
AZERBAIJAN, GEORGIA, KAZAKHSTAN, KYRGYZSTAN, MONGOLIA,
TAJIKISTAN, TURKMENISTAN, UZBEKISTAN
6Renewable Energies in Central Asia
1 WORLD BANK, DB 2010 (WWW.DOINGBUSINESS.ORG/FEATURES/HIGHLIGHTS2010.
ASPX), RANKINGS FROM 1–183, WITH FIRST PLACE BEING THE EASIEST.
2 TRANSPARENCY INTERNATIONAL, CPI 2009 (WWW.TRANSPARENCY.ORG/POLICY_
RESEARCH/SURVEYS_INDICES/CPI/2009), RANKINGS FROM 1–18, WITH FIRST
PLACE BEING THE LEAST CORRUPT.
CENTRAL ASIA SUMMARY

power potential and also a considerable solar energy poten-tial. While Kyrgyzstan is officially promoting the increased development of renewable energies, it could not yet attract the interest of private investors to develop smaller poten-tials. This is caused by the lack of a clear legal and regula-tory framework and poor data on the existing potentials. The general business climate is fairly good, but corruption is still rampant. Thus, rankings for Kyrgyzstan are: DB 41/CPI 162.
Tajikistan Tajikistan has an enormous hydro power potential of which a small part is being exploited by large hydro power plants. There are also plenty of opportunities for small hydro power development including isolated grids to supply energy to ru-ral communities who often suffer from fuel shortages. While Tajikistan generally acknowledges the need for developing RE sources, the lack of official power purchase tariffs and a poor regulatory framework are strong disincentives for pri-vate investors to enter the RE market. The general conditions for small foreign investors in Tajikistan are rather difficult. Enterprises can be fully foreign owned, but obtaining and ex-tending business licenses can be complicated and expensive. Tajikistan’s rankings are: DB 152/CPI 152.
Uzbekistan Uzbekistan is richly endowed with fossil energy sources, and the development of renewable energy does not yet enjoy high priority on the Government’s agenda with the exception of hydro power. Climatic conditions are especially favorable for utilizing solar energy. The promotion of RE is only rudimen-tarily addressed in the existing legislation providing virtually no real incentive for small investors. The difficult business environment is a further disincentive. Extensive state con-trols and rampant corruption hinder the functioning of mar-kets and the development of the private sector. Rankings for Uzbekistan are: DB 150/CPI 174.
Turkmenistan Turkmenistan has tremendous wind power potential and high solar potential as well, but this is overshadowed by the well-known wealth coming from oil and gas. Currently, electricity generated in thermal power plants is supplied free-or-charge to domestic consumers, which is virtually a knockout crite-rion for any RE solutions. This is particularly unfortunate as the wind potential is so large that it could even rival the republic’s natural gas reserves. There are energy efficiency and energy saving programs in place, and the Government is officially supporting the development of RE technologies. The development of a market for RE would, however, re-quire much more commitment from the Government. The busi-ness environment of Turkmenistan is one of the worst in the world. Without having a close relationship to a high-rank-ing Government official, it is very difficult to do business. Thus, Turkmenistan’s rankings comprise: DB not ranked yet/CPI 168.
3 CONCLUSION
The experiences with renewable energy technology are still very limited across all countries in Central Asia, with the ex-ception of large hydro power. The countries with a conductive business environment have a more or less clear legislation regarding the promotion of RE technology. The lack of experi-ence in applying these legislative prerequisites for concrete investment projects, however, adds to the investment risks particularly for small investors, who may not have the re-sources to fight through legal uncertainties. Besides the do-mestic promotion programs in the countries, supportive risk-reducing measures from donor countries may be required to trigger the utilization of RE sources by small foreign inves-tors. Moreover, donor support will also be required to review and support the improvement of existing renewable energy legislation and regulatory frameworks in these countries.
AZERBAIJAN, GEORGIA, KAZAKHSTAN, KYRGYZSTAN, MONGOLIA,
TAJIKISTAN, TURKMENISTAN, UZBEKISTAN
7Renewable Energies in Central Asia
CENTRAL ASIA SUMMARY

Renewable Energies in Central Asia 8
COUNTRY CHAPTER:
REPUBLIC OF AZERBAIJAN
Authors and Coordination ofCountry ChapterIslam Rafibeily (LLM & MSc Geo.)
Dr. Ing. Klaus JordeEntec Consulting & Engineering AGSt. Gallen, Switzerlandwww.entec.ch
Axel Biegert (Dipl. Economist & Pol.) INTEGRATION UMWelt & Energie GmbHGraefenberg, Germany www.integration.org
Editor Deutsche Gesellschaft für Technische Zusammenarbeit (GTZ) GmbHDepartment Water, Energy, TransportDag-Hammarskjöld-Weg 1-565760 Eschborn, Germanywww.gtz.de
On behalf of Federal Ministry for Economic Cooperation and Development (BMZ)
Editorial staffDiana KraftTel: +49 (0)6196 79 4101Fax: +49 (0)6196 79 80 4101Email: [email protected]

Renewable Energies in Central Asia
AZERBAIJAN REPUBLIC
9
CONTENTS AZERBAIJAN REPUBLIC
CONTENTS
ACRONYMS, ABBREVIATIONS AND MEASUREMENTS 10
1 SUMMARY 11
2 COUNTRY INTRODUCTION 12 2.1 Geography and Climatic Conditions 12 2.2 Political and Economic Development 12
3 ENERGY MARKET IN AZERBAIJAN 15 3.1 Important Players of the Azerbaijan Energy Market 15 3.2 Primary Energy Consumption, Transmission and Prices 15
4 POLICY FRAMEWORK FOR RENEWABLE ENERGIES 17 4.1 National Strategies and Programs to support Renewable Energies 17 4.2 Regulations, Incentives and Legislative Framework Conditions 17
5 POTENTIAL FOR RENEWABLE ENERGIES AND PRESENT USE 18 5.1 Bioenergies 18 5.2 Solar Energy 19 5.3 Wind Power 19 5.4 Geothermal Energy 20 5.5 Hydro Power 20
6 MARKET RISK ANALYSIS AND BARRIERS FOR MARKET ENTRY 21 6.1 General Situation 21 6.2 Business Development 21 6.3 Intellectual Property Rights 21 6.4 Taxation 22
7 RENEWABLE ENRGY BUSINESS INFORMATION AND CONTACTS 22
8 BIBLIOGRAPHY 23
9 ANNEX 24

Renewable Energies in Central Asia
AZERBAIJAN REPUBLIC
10
ACRONYMS AND ABBREVIATIONS AZERBAIJAN REPUBLIC
ADB Asian Development Bank
BP British Petroleum
CAR Central Asian Region
CDM Clean Development mechanism
CER CO2 Emission Reduction
CIS Commonwealth of Independent States
EBRD European Bank for Reconstruction and Development
EU European Union
f.o.b. Free On Board
GDP Gross Domestic Product
DL Distribution Line
HPP Hydro Power Plant
HVL High Voltage Lines
HVN High Voltage Network
IBRD International Bank for Reconstruction and Development
IPP Independent Power Producer
JSC Joint Stock Company
KfW Kreditanstalt für Wiederaufbau (KfW Bankengruppe)
MED Ministry of Economic Development
MIE Ministry of Industry and Energy
NATO North Atlantic Treaty Organization
OSCE Organization for Security and Cooperation in Europe
PfP Partnership for Peace
PCA Partnership and Cooperation Agreement
PREGA Promotion of Renewable Energy, Energy Efficiency and Greenhouse Gas Abatement
PV Photovoltaic
RE Renewable Energy
SOCAR State Oil Company of Azerbaijan Republic
TL Transmission Line
TPP Thermal Power Plant
UN United Nations
USD United States Dollars
VAT Value Added Tax
WB World Bank
MEASUREMENTS
°C degree celsius
€ Euro (1 € = 1.07 manat)
GWh gigawatt hour (1 GWh = 1,000,000 kWh)
kJ kilojoule (1 kj = 1,000 joules)
ktoe kilotons of oil equivalent (1ktoe = 11.63 GWh)
kV kilovolt
m meter
m3 square meter
MW megawatt (1 MW = 1,000 kW)
s second
TWh terawatt hour (1 TWh = 1,000,000,000 kWh
ACRONYMS, ABBREVIATIONS AND MEASUREMENTS

Renewable Energies in Central Asia
AZERBAIJAN REPUBLIC
11
1 SUMMARY
The Republic of Azerbaijan has abundant resources of oil and gas, which are used for domestic consumption, including elec-tricity generation, and also for export. The second source for electricity generation consists mainly of large Hydro Power Plants.
The government is generally committed to increase the use of Renewable Energy (RE), particularly small hydro power and wind, to be prepared for the future development, when fossil resources start declining. There is a significant po-tential of RE resources in certain regions of the country and in particular a considerable potential for solar energy in the whole of Azerbaijan.
In theory, the legal and regulatory terms and condi-tions for private and independent power producers appear to be favorable, especially since electricity from wind and small Hydro Power Plants is guaranteed to be purchased complete-ly. Reality, however, shows that there is no existing market for RE, and the process of granting licenses to private investors has not been practiced yet. It is therefore unpredictable what is going to happen if someone applies for a private power-gen-erating license.
First activities in this direction, however, can be ob-served at large private companies. Serious obstacles for private investments are the low tariffs for RE which are set and guar-anteed by law. There are no additional incentives at present, although some legal provisions seem to support this type of investment.
In general, the business climate invites foreign invest-ments in the energy sector, but up to today this is mostly re-stricted to the large gas and oil industry. Overall Azerbaijan could be an interesting future market for activities concerning RE.
SUMMARY

FIGURE 1
Map of Azerbaijan
Renewable Energies in Central Asia
AZERBAIJAN REPUBLIC
COUNTRY INTRODUCTION 12
2 COUNTRY INTRODUCTION
2.1 GEOGRAPHY AND CLIMATIC CONDITIONSAzerbaijan is located in the Caucasus region of Eurasia on the western shore of the Caspian Sea in the southeastern part of the Greater Caucasus mountains. Th e Lower Caucasus stretches along the western border, Russia is on its northeast-ern border, Georgia in the North West. Armenia borders it to the West, Iran to the South and a 10 km border with Turkey is in the South West (Nakhichivan Autonomous Republic).
Th e highest point in Azerbaijan is the mt. Bazard-euzeu in the Caucasus range with an altitude of 4,465 m. Th e country has plenty of oil and gas resources, much of which lies underneath the Absheron Peninsula and off shore underneath the Caspian shelf.
Th e climate of Azerbaijan is characterized by nine climatic zones. It alternates between extreme zones in the northern and western mountains and pleasantly moderate zones along the Caspian Sea. While semi-desert and dry steppe climates cover the central lowlands in Kur, a cold climate with heavy precipitation all year long predominates in the southern hills of the Great Caucasus.
Daytime temperatures vary between 22 °C and 30 °C through spring and summer (mid-April to October) while av-erage temperatures between 5 °C and 10 °C can be expected from December to march.
Water covers only 500 km² of the total area of the country. Th e biggest river is Kur, which fl ows from Tur-key through Georgia and Azerbaijan into the Caspian Sea. Th e total length of the river is 1,515 km. Th e world‘s larg-est lake, the Caspian Sea, covers an area of 400,000 km² and has a maximum depth of 1,025 m. Th e second biggest river is Araz, located in the South and forming the border with
Iran. medium-size rivers are the Qaniq (Alazan), Qabirli (Iori) in the North West, Terter in the West and Samur in the North, which is forming the border with Russia. Th ere are plenty of small rivers within the country. Th e country‘s rivers, excluding Kur, are not navigable. Th e average density of the river system of Azerbaijan is 0.39 km/km². In the plains, how-ever, the density is as low as under 0.05 km/km².
Th ere are several shallow lakes in the lowland of Azerba-ijan such as Sarisu (67.0 km²), Aghgoel (56.2, km²), mehman (35.0 km²), Boyukshor (9.2 km²), and Hadjigabul (8.4 km²).
Ten water reservoirs have been constructed in order to regulate the river fl ow and to provide water for irrigation. Th e largest of them are mingechevir, Shemkir, Araz and Serseng (on the Terter River). Th e building of these reservoirs is one of the measures that has been undertaken in order to manage and control the utilization of water and energy resources.
Th e large reservoirs are designed for various purposes, while most smaller ones are used exclusively for irrigation. Th e four largest reservoirs (mentioned above) are also used as a hydro energy resource.
Th e mingechevir reservoir with an area of 605 km² is the largest accumulation of water in Azerbaijan. It was won by damming the Kur in western Azerbaijan. Th e waters of the reservoir provide hydroelectric power and irrigation of the Kur–Araz plain.
2.2 POLITICAL AND ECONOMIC DEVELOPMENTAzerbaijan – with a majority of the population speaking Turk-ish and being Shiite muslims – was briefl y independent from 1918 to 1920. It regained its independence after the collapse of the Soviet Union in 1991. Azerbaijan joined the Common-wealth of Independent States (CIS) in 1993. After the political and economic crises of the early 90s, a drastic reduction of production and hyperinfl ation were characteristic for all post-Soviet Republics. Th e situation stabilized a few years later and a new economy growth occurred. Th e oil development strategy has become a crucial factor of this development. Th e signing of contracts with the world’s biggest companies for the exploration and development of oil and gas fi elds of Az-erbaijan and the construction of the Baku-Tbilisi-Ceyhan oil pipeline (which offi cially started operation in 2006) provided a signifi cant foreign investment fl ow into the country.
Despite a 1994 cease-fi re, Azerbaijan has yet to resolve its confl ict with Armenia over the Azerbaijani Nagorno-Kara-bakh region (largely Armenian populated). Th e Nagorno-Ka-rabakh region in the South West of Azerbaijan declared itself independent from Azerbaijan in 1991, but it is not recognized by any nation and therefore considered a legal part of Azerbai-jan. Azerbaijan has lost 16 % of its territory and has to support some 600,000 internally displaced persons as a result of the confl ict. Corruption is ubiquitous, and the Government has been accused of authoritarianism. Although the poverty rate has been reduced in recent years, the promise of widespread wealth from the development of Azerbaijan‘s energy sector re-mains largely unfulfi lled.
Th ere is one autonomous region on the territory of the Azerbaijan Republic – the Nakhchivan Autonomous Republic.Azerbaijan is important to the EU as the country is the EU‘s
BAKU
Caspian Sea
Xaçmaz
Laki
A R M E N I A
GãncäYevlax
Mingäçevir
Kûrdämir
Ali Bayrami
Astara
Xankändi
Säki
Naxçivan
R U S S I A
I R A N
G E O R G I A

YEAR 1996 1997 1998 1999 2000 2001 2002 2003 2004 2005 2006
Amount (Mio USD) 8,9 17,4 18,8 57,4 76,4 86,6 162,5 40,3 9,6 212,2 645,8
TABLE 1
Investments in the Energy Sector of Azerbaijan
Source: Ministry of Finance, as of 2006 (www.maliyyegov.az)
Renewable Energies in Central Asia
AZERBAIJAN REPUBLIC
COUNTRY INTRODUCTION 13
largest trade partner in the Caucasus region, primarily for oil. Trade has been steadily increasing since 1993, while there was a general decline during that period across the Commonwealth of Independent States. The integration into the EU is one of the strategic directions of Azerbaijan’s international policy. The Partnership and Cooperation Agreement (PCA, adopted in 1999) provides for wide-ranging cooperation in the areas of political dialogue, trade, investment, economic, legislative and cultural cooperation. It constitutes the core of the technical assistance and reflects its ideology. A special envoy of the Euro-pean Commission is currently present in the country, which is also a member of the United Nations, the OSCE, the Council of Europe, and the NATO Partnership for Peace (PfP) pro-gram. On 17 January 2001, Azerbaijan became a member of the Council of Europe.
Baku, the capital of Azerbaijan, is the main seaport of the Caspian Sea. more than a third of the population is con-centrated here. The occupation of a part of the country by Ar-menia is a heavy economic burden.
The national currency of Azerbaijan is the manat. In January 2006, a new denomination of the manat was in-troduced with the conversion rate of 1:5000. Currently, the new manat fluctuates around 0.8 €. With the booming econo-my, the manat tends to get stronger thus causing the pressure upwards on the inflation rate.
Since Azerbaijan gained its independence, the oil sector has been on the rise. The explored oil reserves in the coastline area have been estimated at up to 650 million tons. The explo-ration of these oil fields is the key to the future of Azerbaijan’s energy sector and its economy in general. Over the past years, however, the country’s economic policy has also aimed at the development of other sectors, one of them being the energy sector in general. The dynamics of investments into the energy sector development is shown in the table below.
The current focus of government policy is aiming at the development of the non-oil sector, targeting the stability of the country’s economy after the oil boom. To support this pol-icy, the following state programs have been launched: the State Program for Poverty Reduction and Economic Development 2003–2005 (launched in 2003), the measures for Acceleration of Social and Economic Development (launched in 2003) and the State Program for the Socio-economic Development of Re-gions 2004–2008 (launched in 2004). Under preparation is a new State Program for Poverty Reduction and Sustainable Development 2006–2015.1
According to the programs, the existing generating ca-pacities of the country’s power system are expected to reach 6,500–7,000 MW by 2015 through the construction of new thermal and Hydro Power Plants, the modernization of the existing generating units and the utilization of renewable power sources (small Hydro Power Plants, wind, solar power, thermal water etc.). The system will have a generating capac-
ity of 29–30 billion kWh by 2010 and 37–38 billion kWh by 2015.
The power demand is expected to grow by 4.7 % annu-ally through 2015. Therefore, the demand in 2015 will have in-creased by the factor 1.7 as compared to 2004. Thermal power plants will make an effort to reduce the fuel used to generate 1 kWh of electric power from 386 grams of conventional fuel to 260 grams by the construction of new generating capacities and the modernization of the old generating units.
To ensure the sustainable power supply, new power transmission and distribution lines will be constructed. Ex-isting transmission lines will be reconstructed together with necessary sub-stations. Similar works will be conducted in the distribution sector. System power losses will be reduced.
SHORT BUSINESS INFORMATIONOver the past years, Azerbaijan’s economic policy has aimed at the development of the energy sector in general. main strategy of the future development of the electric energy sector is hydro power development and the construction and renovation of the transmission and distribution grid including sub-stations.
Institutional reforms have started several years ago and still continue in Azerbaijan. These reforms have as a common aim the strengthening of ministries and state committees as well as reorganizing state bodies and namely their functions by trans-forming some of them into joint-stock companies fully owned by the Government. The latest example is the former Commit-tee on Amelioration and Water Business, which was initially converted into a State Agency attached to the Ministry of Ag-riculture and later into a joint-stock company.
The Ministry of Economic Development (MED) was founded in 2001 as the result of a merger of five previous Min-istries and other government bodies – the Ministry of State Property, the Ministry of Economics, the Ministry of Trade, the State Committee for Anti-monopoly Policy and Support for Enterprise and the Agency for Foreign Investment Promo-tion. In 2005, the State Property Privatization Department was de-coupled from the structure of the MED. The Charter of the New State Committee for management of State Property was signed by the President in 2005. As a consequence, Azerbaijan was cited as one of the top 10 reformers by the World Bank‘s 2008 Doing Business report.
As a result of the measures taken by the Government of Azerbaijan, the investment climate in the republic has be-come increasingly more favorable and foreign investment into the social and economic sectors constantly grew and is still growing. This is an important factor in the continuation of a stable social and economic development in the country. The growth rates of economic indices as shown in tables 2 and 3 are expected to average 15 % per year until 2015.
1 SOURCE: WEBSITE OF THE PRESIDENT OF THE AZERBAIJAN REPUBLIC
(WWW.PRESIDENT.AZ)
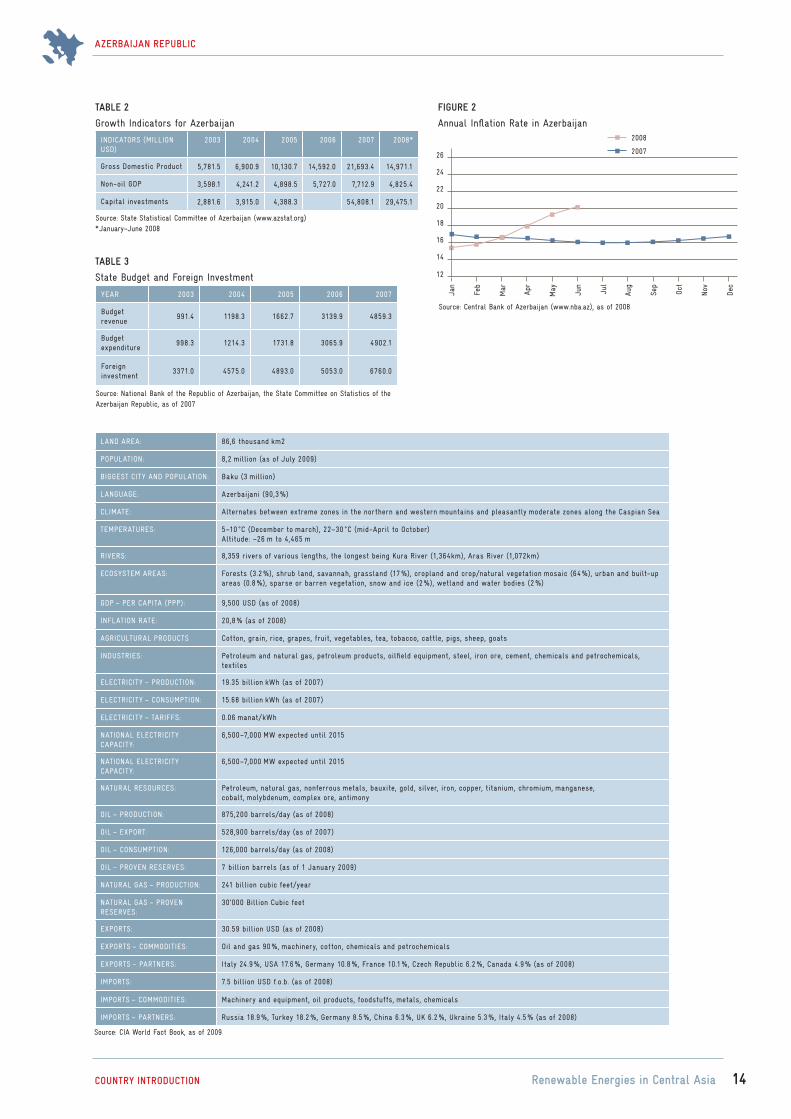
YEAR 2003 2004 2005 2006 2007
Budget revenue
991.4 1198.3 1662.7 3139.9 4859.3
Budget expenditure
998.3 1214.3 1731.8 3065.9 4902.1
Foreign investment
3371.0 4575.0 4893.0 5053.0 6760.0
Source: National Bank of the Republic of Azerbaijan, the State Committee on Statistics of the Azerbaijan Republic, as of 2007
TABLE 3
State Budget and Foreign Investment 12
Jan
16
20
22
18
14
24
26
Dec
Sep
Oct
Nov
FIGURE 2
Annual Inflation Rate in Azerbaijan
Source: Central Bank of Azerbaijan (www.nba.az), as of 2008
Feb
Mar Apr
May Jun
Jul
Aug
2007
2008
LAND AREA: 86,6 thousand km2
POPULATION: 8,2 million (as of July 2009)
BIGGEST CITY AND POPULATION: Baku (3 million)
LANGUAGE: Azerbaijani (90,3 %)
CLIMATE: Alternates between extreme zones in the northern and western mountains and pleasantly moderate zones along the Caspian Sea
TEMPERATURES: 5–10 °C (December to march), 22–30 °C (mid-April to October)Altitude: –26 m to 4,465 m
RIVERS: 8,359 rivers of various lengths, the longest being Kura River (1,364km), Aras River (1,072km)
ECOSYSTEM AREAS: Forests (3.2 %), shrub land, savannah, grassland (17 %), cropland and crop/natural vegetation mosaic (64 %), urban and built-up areas (0.8 %), sparse or barren vegetation, snow and ice (2 %), wetland and water bodies (2 %)
GDP – PER CAPITA (PPP): 9,500 USD (as of 2008)
INFLATION RATE: 20,8 % (as of 2008)
AGRICULTURAL PRODUCTS Cotton, grain, rice, grapes, fruit, vegetables, tea, tobacco, cattle, pigs, sheep, goats
INDUSTRIES: Petroleum and natural gas, petroleum products, oilfield equipment, steel, iron ore, cement, chemicals and petrochemicals, textiles
ELECTRICITY – PRODUCTION: 19.35 billion kWh (as of 2007)
ELECTRICITY – CONSUMPTION: 15.68 billion kWh (as of 2007)
ELECTRICITY – TARIFFS: 0.06 manat/kWh
NATIONAL ELECTRICITY CAPACITY:
6,500–7,000 MW expected until 2015
NATIONAL ELECTRICITY CAPACITY:
6,500–7,000 MW expected until 2015
NATURAL RESOURCES: Petroleum, natural gas, nonferrous metals, bauxite, gold, silver, iron, copper, titanium, chromium, manganese, cobalt, molybdenum, complex ore, antimony
OIL – PRODUCTION: 875,200 barrels/day (as of 2008)
OIL – EXPORT: 528,900 barrels/day (as of 2007)
OIL – CONSUMPTION: 126,000 barrels/day (as of 2008)
OIL – PROVEN RESERVES: 7 billion barrels (as of 1 January 2009)
NATURAL GAS – PRODUCTION: 241 billion cubic feet/year
NATURAL GAS – PROVEN RESERVES:
30‘000 Billion Cubic feet
EXPORTS: 30.59 billion USD (as of 2008)
EXPORTS – COMMODITIES: Oil and gas 90 %, machinery, cotton, chemicals and petrochemicals
EXPORTS – PARTNERS: Italy 24.9 %, USA 17.6 %, Germany 10.8 %, France 10.1 %, Czech Republic 6.2 %, Canada 4.9 % (as of 2008)
IMPORTS: 7.5 billion USD f.o.b. (as of 2008)
IMPORTS – COMMODITIES: Machinery and equipment, oil products, foodstuffs, metals, chemicals
IMPORTS – PARTNERS: Russia 18.9 %, Turkey 18.2 %, Germany 8.5 %, China 6.3 %, UK 6.2 %, Ukraine 5.3 %, Italy 4.5 % (as of 2008)
Source: CIA World Fact Book, as of 2009
Renewable Energies in Central Asia
AZERBAIJAN REPUBLIC
COUNTRY INTRODUCTION 14
INDICATORS (MILLION USD)
2003 2004 2005 2006 2007 2008*
Gross Domestic Product 5,781.5 6,900.9 10,130.7 14,592.0 21,693.4 14,971.1
Non-oil GDP 3,598.1 4,241.2 4,898.5 5,727.0 7,712.9 4,825.4
Capital investments 2,881.6 3,915.0 4,388.3 54,808.1 29,475.1
TABLE 2
Growth Indicators for Azerbaijan
Source: State Statistical Committee of Azerbaijan (www.azstat.org)* January–June 2008

Renewable Energies in Central Asia
AZERBAIJAN REPUBLIC
COUNTRY INTRODUCTION 15
3 ENERGY MARKET IN AZERBAIJAN
90 % of the overall energy market in Azerbaijan depends on fossil resources. The rest is characterized by a small number of large Hydro Power Plants. Other RE are only used in forms of domestic consumption of firewood.
In September 1994, a 30-year contract was signed be-tween the State Oil Company of Azerbaijan Republic (SO-CAR) and 13 oil companies, among them Amoco, BP, Exxon, LUKoil and Statoil. As Western oil companies are able to tap deepwater oilfields untouched by the Soviet exploitation, Az-erbaijan is considered one of the most important spots for oil exploration and development in the world.
CONTRACT OF THE CENTURYAn agreement has been signed in the Gulistan Palace of Baku on 20th September 1994, which was later named “Contract of the Century” due to its tremendous impor-tance. Production sharing agreements related to the de-velopment of Azeri/Chirag/Guneshli deepwater oil fields have been reflected on 400 pages and 4 languages. 13 companies (Amoco, BP, mcDermott, Unocal, SOCAR, LukOil, Statoil, Exxon, TPAO, Pennzoil, Itochu, Ramco and Delta) from 8 countries (Azerbaijan, USA, Great-Britain, Russia, Turkey, Norway, Japan and Saudi Arabia) have participated in signing of the Contract of the Century. This Contract has paved the way towards to the signature of another 26 contracts with 41 oil companies from 19 countries.
Azerbaijan is self-sufficient in energy production. The country fully meets its domestic demand for energy by its own natu-ral resources. Besides, oil and gas are main export products. During the last years, the generation capacity was sufficiently increased, which allowed to create export potential of electric-ity as well.
3.1 IMPORTANT PLAYERS OF THE AZERBAIJAN ENERGY MARKET
The Parliament of the Azerbaijan Republic exercises legislative power by adopting laws, ratifying international agreements and conventions etc. In accordance with the constitutional separation of the state power, the Parliament does not exer-cise management and control functions. Laws set the general framework of rules in the energy sector.
The Ministry of Industry and Energy (MIE) functions as the central executive body for formulating and providing Azerbaijan’s national policy in the fields of industry and en-ergy. The Ministry is also responsible for the supervision, regulation and control of the efficient use of the fuel and en-ergy complex and issues special permissions (licenses) in cases provided for by the legislation. The MIE prepares the annual fuel and energy balance and prepares and implements state programs on perspective development in the industry and en-ergy sector. The MIE is also responsible for the development of renewable resources in the Azerbaijan Republic.
The Ministry of Economic Development (MED) is responsi-ble for the preparation and implementation of socio-economic development programs, the coordination of activities related to economic reforms, economic regulations etc. The Minister of Economic Development is the chairman of the Tariff Coun-cil. The Tariff Council approves of wholesale and retail tariffs for electric power as well as for its transmission. The mED temporarily provides supervision on the three electric power distribution companies Bakielectricnetwork, Sumgayitelec-tricnetwork and Shekielektricnetwork.
The “Azerenergy” Joint Stock Company (JSC) was established by the reorganization of “Azerenergy” State Com-pany in 1996. The main functions of Azerenergy are:
Power generation Power transmission via high voltage transmission lines (500, 330, 220 and 110 kV)
Dispatch control Power distribution (excluding Baku and the Sumqayit and Sheki regions)
There is also a scientific research and design institute under the authority of Azerenergy.
There are 10 electrical power distribution compa-nies in Azerbaijan (excluding Nakhchivan Autonomous Republic):
Bakielectricnetwork supplies electricity in Baku and Absheron peninsula
Sumqayitelectricnetwork supplies electricity in Sumqayit and the coastal districts of the republic situated to the north of Sumqayit
Shekielektricnetwork supplies electricity in North West region
7 electrical power distribution companies supply power to the remaining 41 regions of the republic, these companies are subordinate to Azerenergy.
The distribution companies buy electric power from Azeren-ergy and sell it to commercial or industrial users and popula-tion alike.
The energy system of Nakhichivan Autonomous Re-public is out of Azerenergy’s sphere of influence. In this terri-tory, the management of the energy system is carried out by the Agency of the Nakhichivan Autonomous Republic.
3.2 PRIMARY ENERGY CONSUMPTION, TRANSMISSION AND PRICES
Reliable data on the total primary energy consumption could not be identified. Available statistical data do not clearly dif-ferentiate between primary and secondary energy. There-fore, some quantities are counted twice, e. g. when natural gas (which is a primary energy) is used to generate electrical power (which is a secondary energy). One recent number on total primary energy consumption that can be found amounts to 12.8 mio toe.2

2 NATIONMASTER, 2004 (SELECT ENERGY > PRIMARY ENERGY CONSUMPTION,
MILLION TOE); DATA INDICATED AS OF END OF 2004
Renewable Energies in Central Asia
AZERBAIJAN REPUBLIC
COUNTRY INTRODUCTION 16
According to data received from government agencies in Az-erbaijan, the sources of primary energy are 79 % from oil, 15 % from natural gas and 6 % electricity. About 80–90 % of the electricity is generated from natural gas. It is unclear, however, if this proportion is counted towards the natural gas percentage, the electricity percentage or both.
Transmission and Distribution SystemAzerbaijan’s electricity grid is not connected to the Central Asian Integrated System. Within the country, all cities and villages are grid-connected and electrified. Almost all custom-ers are metered. The new metering system, based on smart-card platforms, has been introduced in Ganja city, and the in-stallation of these new meters is continued in other cities and villages. The rate of collection in 2008 was remarkably over 80 % as compared to 38.6 % in 2006 and 68.0 % in 2007.
Mostly single circuit transmission lines are used in Az-erbaijan. The voltage levels and lengths of transmission (TL) and distribution (DL) lines are listed in the Annex. most of the electricity grid is old and needs to be renovated. A new 220 kV TL in the South of Azerbaijan and the 330 kV Khachmaz sub-station in the North have been constructed. A new project, a 330 kV TL from the center to the South (over a length of about 150 km) is started and another one 220 kV double cir-cuit TL from mingachevir to Absheron (255 km from West to East) will be started in 2009.
Losses in the transmission system are currently 3.7 %, in the distribution system losses are 14.7 %.
Electricity Sector and Natural ResourcesThe electricity generation in Azerbaijan is up to now entirely based on gas, heavy oil and hydro power. The state-owned joint stock company Azerenergy has a monopoly on power generation in Azerbaijan. Currently, it operates eleven ther-mal power plants (TPPs) with a combined installed capacity of 4,944 MW and six Hydro Power Plants (HPPs) with a total installed capacity of over 900 MW. These power plants turn out about 20–23 billion kWh per year (see figure 3), which is sufficient to cover domestic demand and to create some export potential.
The core of the power plant network in Azerbaijan is the group of thermal power plants that run on natural gas and black oil (mazut): the Azerbaijan TPP, the Albayramli (Shirvan) TPP, and the Shimal TPP. The primary source of hydroelectric power is the Kur River where the Hydro Power Plants mingachevir, Shamkir and Yenikend are located. The Annex holds list of the power plants included in the unified electricity network of Azerbaijan.
Today, the electric energy system has an average an-nual surplus capacity of 200–250 MW. The system is target-ing to increase its export potential to 1,000 MW within 2–3 years. At the same time, some shortages of capacity in peak load hours still occur during the winter season.
Around 60 % of the electricity is consumed the Ab-sheron Peninsula (in the East of the country), while the main generation facilities are located to the West of Azerbaijan, thus increasing technical losses and fuel transportation costs since fuel sources are located on the Absheron Peninsula and off-shore.
Azerbaijan’s major mineral wealth lies in its oil and gas re-serves. Offshore hydrocarbon structures in the Caspian Sea account for most of the country’s oil and gas production. Az-erbaijan’s proven crude oil reserves were estimated to range from 7 to 13 billion barrels. Azerbaijan has proven natural gas reserves of roughly 850 billion m3, and BP estimates that the country has about 1.4 trillion m3 of proven gas reserves.
PricesThe prices (tariffs) of energy are regulated by the Tariff Coun-cil. Tariffs approved by decisions of the Council are as fol-lows:
The price for electricity has increased significantly since 2006 for some consumer groups. Before that and since then the prices have been stable. Today, the prices are equal for all con-sumers at 0.06 manat per kWh. Details can be found in the Annex.
Growth Predictions for the Energy SectorThe energy sector in general is showing very significant growth rates, which are mostly due to the export of oil and gas products. The domestic consumption including the electric-ity demand shows only moderate growth rates with no clear trend. The population of the country is already connected to the grid and electricity has been accessible and inexpensive in the past. Therefore, there is already a high level of electrifica-tion throughout the country. Recent tariff jumps have slowed the growth in consumption, but the general economic growth will be followed by changes in the lifestyle of the population and will lead to an ongoing increase of the electricity demand in the country.
10000
15000
0
20000
5000
Source: diagram by the author with data collected from Azerenergy JSC, as of 2007
25000
2002 2003 2004 2005 2006 20072001
FIGURE 3
Electricity Generation in Azerbaijan
gas/oil
hydro power
GWh
elec
tric
ity
gene
ration

ELECTRIC ENERGY TARIFFSFOR 1 KVH IN MANAT (WITH VAT)1 € = 1.07 MANAT (AS OF 30 APRIL 2009)
1. Wholesale tariff
Azerenergy JSC generation 0.0410
Private small HPP generation 0.0250
Wind PP generation 0.0450
2. Retail tariff
All consumers 0.0600
3. Transit tariffs 0.0020
Source: Tariff Council of the Azerbaijan Repulic, (www.tariff.gov.az), as of 2009
Renewable Energies in Central Asia
AZERBAIJAN REPUBLIC
COUNTRY INTRODUCTION 17
4 POLICY FRAMEWORK FOR RENEWABLE ENERGIES
In general, all political plans to increase the share of Renew-able Energies are in the initial stage. Azerbaijan focuses on small hydro power and wind energy. The Government’s sup-port for the development of RE sources is proclaimed in the legal regulations, but neither proper mechanisms nor subsi-dies or government grants exist.
SHORT BUSINESS INFOThe feed-in tariffs, as described in chapter 3, are too low to stipulate private investments in RE projects without additional incentives.
Azerbaijan is part of the European Energy Charter, a frame-work for international cooperation between European and other industrialized countries aiming to develop the energy potential of Central and Eastern European countries and en-suring security of energy supply for the European Union.
4.1 NATIONAL STRATEGIES AND PROGRAMS TO SUPPORT RENEWABLE ENERGIES TO SUPPORT RENEWABLE ENERGIES
The State Program on the Use of the Alternative and Renew-able Sources in Azerbaijan Republic has been approved in 2004. The program stipulates conducting feasibility studies in the field of RE and the development of small hydro- and wind projects. The implementation of the measures has been planned to last from 2004 to 2013. Unfortunately, this pro-gram was not supported with the necessary funding and a lot of measures have not implemented within the fixed schedule.In general, private partnerships in the field of RE are welcome and correspond to the strategy of the responsible Ministry, the MIE . There are no restrictions for foreign investors, but the Government’s permission is needed.
4.2 REGULATIONS, INCENTIVES AND LEGISLATIVE FRAMEWORK CONDITIONS
The Azerbaijan legislation on electrical power consists of laws of the Azerbaijan Republic, decrees of the President, resolutions of the Cabinet of Ministers and by-laws (instructions) of the central bodies of executive power (ministries and other State agencies).
The following laws in the energy sector have been adopted by the Parliament:
Law on Utilization of Energy Resources 30.05.1996 Law on Electric Energy 03.04.1998 Law on Gas Supply 30.06.1998 Law on Energy 24.11.1998 Law on Electrical Power and Heat Stations 28.12.1999
Source: Compilation of Laws of the Azerbaijan Republic
There are no specific laws on RE in Azerbaijan, but some pro-visions concerning the matter are reflected in the laws about energy in general:
Law on Utilization of Energy Resources from 30 may 1996: Portions of the Fund of Rational Power Utilization shall be spent among other purposes also for “utilization of the Renewable Energy sources” (Article 15).
Subsidies from the Fund may be granted to enterprises for “examination of the Renewable Energy sources” (Article 16).
State power standards shall determine “ [...] proper de-mands for the energy resources and the renewable power sources.” (Article 19).
Law on Power from 24 November 1998: One of the objectives of state policy with regard to power is “use of renewable power sources” (Article 3).
Law on Electrical and Heating Power Stations from 28 December 1999:
“Construction of power plants which run with Renewable Energy sources can be subsidized by the State”.
At the same time “unlimited purchase of energy produced at these (small) plants is guaranteed.” (Article 3).
In accordance with Article 3 mentioned above, the following plants are deemed as small:
Solar power plants which produce electrical and heating energy
Wind power plants with a capacity from 10–100 kW, which generate electrical energy and are located at a distance from immovable property of any third person in accordance with relevant norms and standards
Hydro Power Plants with a capacity from 50–10,000 kW, which are located at a stable water stream (steady stream) and immediately provide returning of used water to its bed
Power plants, which produce electrical and heating energy by means of gas or other fuel about 80 % of which is ex-tracted from biomass, excluding natural firewood
There are no special provisions that support rural electrifica-tion by law.
SHORT BUSINESS INFOThere are no standard procedures in place for small scale independent power producers.

BAKU 30,400 tons 42.8 million m3
GANJA 5,100 tons 7.2 million m3
SUMQAYIT 4,900 tons 6.9 million m3
MINGACHEVIR 1,600 tons 2.3 million m3
SHIRVAN 1,200 tons 1.7 million m3
NAKHCHIVAN 1,200 tons 1.7 million m3
TABLE 4
Solid Waste Volumes
Source: Institute of Energy Research and Disine, Azerenergy JSC, without year
3 SOURCE: INSTITUTE OF ENERGY RESEARCH AND DISINE, AZERENERGY JSC
Renewable Energies in Central Asia
AZERBAIJAN REPUBLIC
COUNTRY INTRODUCTION 18
significant agricultural activities in the country, which could provide residues for biomass combustion. Azerbaijan is the largest of the republics of the former Soviet Union and fourth in the world in the production of raw cotton. The population of Azerbaijan is already using cotton and cereal crop waste as a fuel in private household equipment. No large-scale projects were identified, however, although in general it is feasible to further utilize these residues in larger applications.
Liquid (Bioethanol or Biodiesel)In general, Central Asian regions that now grow cotton have the potential to grow an indigenous plant, camelina sativa (also known as false flax, wild flax, linseed dodder, German sesame or Siberian oilseed) as a source for biofuel production. Camelina could possibly replace cotton crops because it needs less water and is drought-resistant. Presently, no projects could be identified in Azerbaijan.
BiogasReconstruction of treatment systems for municipal sewage in Baku and other large cities for the further utilization of bi-ogas has been envisioned. There is potential in Azerbaijan to extract biogas from livestock waste and domestic urban waste. There are presently 200 garbage dumps with a total area of about 900 ha in Azerbaijan. About 6–6.5 million m³ of solid waste are accumulated each year in this area. Volumes of solid waste and methane emissions from dumps in major cities were calculated as follows:
In accordance to a rough estimation of the Ministry of Ecology and Natural Resources, methane gas emission from livestock waste averages up to 40 million m3 per year. Tak-ing into account that 60 % of livestock is farm-owned, about 24 million m³/year of the gas could be collected and utilized.
There is no systematic database on existing projects. At the same time, it may be noted that an interest of using biomass to produce energy has increased among private farm-ers. One project is now developed at the farm Shahin LLC in the Quba region.
Clean Development mechanism (CDM)The Azerbaijan Republic has ratified the Kyoto Protocol in 2000. The authorized State body responsible for the imple-mentation of the UN Convention on Climate Changes, the keeping of the parameters of the Kyoto Protocol and the co-ordination of CDM in Azerbaijan is the Ministry of Ecology and Natural Resources. Business entities can conduct negotia-tions and conclude agreements on selling CO2 emission reduc-tions (CERs). Azerenergy has concluded two agreements with foreign partners concerning the right on selling CERs based on market prices.
5 POTENTIAL FOR RENEWABLE ENERGIES AND PRESENT USE
Azerbaijan is a country with vast fossil energy resources. But Azerbaijan’s oil reserves will only be exploitable for the next twenty to thirty years. Recent studies by the German Kredi-tanstalt für Wiederaufbau (KfW Bankengruppe) and the Eu-ropean Bank for Reconstruction and Development (EBRD) have shown that Azerbaijan has a significant potential for the development of alternative and renewable sources of energy. Initial surveys suggest that the Absheron peninsula has a good potential for wind energy, while the mountainous areas in the North and South West including Nakhchivan are endowed with attractive small hydro power resources.
The Azerbaijani Government has recognized this chal-lenge and launched new initiatives for the use of alternative energy. These alternative energy sources can be developed with profits generated by the exploitation and sale of the country’s oil reserves.
Reasons for the development of RE are the shrinking fossil fuel resources and the escalation of fossil fuel prices in the future as well as the ongoing growth of electricity con-sumption in the country.
In theory, there are sufficient reasons to promote the development of RE. In reality, however, there is no market for RE in Azerbaijan so far. The following chapters therefore focus on the possibilities and potentials of using mainly Renewable Energies.
5.1 BIOENERGIESThere is a considerable potential for the use of bioenergy from agricultural or forest wastes. Some statistical data have already been collected in order to evaluate the bioenergy potential (see Annex)3.
Solid BiomassAbout 14,400 km2 of the country’s area is forest, equaling mere-ly 3.2 % of the overall territory. The residuals from wood pro-duction or wood related processes are therefore very limited with less than 7,000 m3 in 2004. At the same time, there are

Renewable Energies in Central Asia
AZERBAIJAN REPUBLIC
COUNTRY INTRODUCTION 19
5.2 SOLAR ENERGYThe solar energy potential in Azerbaijan is huge due to fa-vorable climatic conditions. The table below shows data of three locations in Azerbaijan: Artem-Island, minguechaur and Nakhichevan. The first is located near Apsheron at Cas-pian Coast, the second in the North West part of the country, and the third in the Azerbaijan enclave between Armenia and Iran. In the Annex a map of annual sunshine hours across Az-erbaijan can be found.
The number of sun hours per year varies, depending on the area. Seasonal changes occur. In the Kur-Araz low-land, the numbers of sun hours average 2,200–2,400 per year, reaching up to 2,800 hours in areas along the Araz River.
In the Kur-Araz lowland as well as on the Absheron peninsula and Nakhchivan, the solar radiation reaches up to 0.8–1.2 kW per square meter.
In general, this radiation is perfectly suitable for use for solar-thermal applications (water heating mostly) and photovoltaic (PV) power generation. The generation costs for electricity from PV are still too high to be competitive with the low electricity tariffs in Azerbaijan. As long as there are no strong financial incentives, there will be no private invest-ment in PV installations. Presently, the utilization is limited to only one or two facilities for water heating of individual and isolated houses.
The use of solar energy could be difficult due to the high rate of air pollution and frequent sand storms, particu-larly on the Absheron peninsula.
5.3 WIND POWERClimatic conditions favor the use of wind power in Azerbai-jan. On the Absheron peninsula, average wind speeds vary between 7 and 8 m/s. These speeds were recorded on 280 days of the year. moreover, facilities for offshore wind power could be constructed in the Caspian Sea. They could border the oil platforms that can be seen by the dozen from Baku’s piers.
The average wind speed depends roughly on the dis-tance from the Caspian Sea. A wind map and average values for some specific areas can also be found in the Annex. In the coastal regions, the average speed is around 6 m/s, slows down to 4 m/s moving away from the sea and drops to 2 m/s
Source: NASA, as in EBRD, 2009
REGIONAL ANNUAL RADIATION [KWH/A]
ON HORIZONTAL SURFACES
ON NORMAL SURFACES
Artem Island 1,577 1,406
Minguechaur 1,432 1,322
Nakhichevan 1,723 1,817
TABLE 5
Annual Solar Radiation
Source: EBRD, 2009
Source: Institute of Energy Research and Disine, Azerenergy JSC, without year
PROJECTED OUTPUT
Biogas 132,000 m3/year
Biofertilizer 1,100 tons/year
Electricity 264,000 kWh/year
BIOGAS PROJECT, SAHIN FARM

Renewable Energies in Central Asia
AZERBAIJAN REPUBLIC
COUNTRY INTRODUCTION 20
in sub-mountain areas and 1 m/s in other regions. On an an-nual cycle, strong winds most often blow in the spring/sum-mer season lasting from march to July. The number of windy days in this region is between 245 and 280 per year.
Wind power could supply many smaller towns and villages, especially in the densely inhabited area around Baku. Connecting wind power plants with the electricity network has not yet been technically standardized. But in the Baku area, the grid is readily available everywhere and no additional costly large-scale electricity network would have to be cre-ated, so it would be possible to maintain stable energy costs in the long run. Since electricity prices tripled in 2007, the alternative of wind power is becoming competitive because the price for that type of electricity is uncoupled from oil and gas prices.
Despite many advantages and a generally positive attitude, there is no finalized and installed wind project in Azerbaijan. Two projects however are intended to be imple-mented or have already been started:
A wind park with a capacity of 20 MW in the Qobus-tan rayon is planned be constructed by the Korean STX Company as fixed in a contract between the company and the MIE. As of 2009, the contract has not been signed yet.
A wind park plant in the Siyazan rayon is presently being constructed. Two wind generators with a capacity of 0.87 MW each have already been installed.
Yet another wind park is already planned. The South Korean company KEPKO is presently negotiating details for the construction of a facility in Baku‘s Garadag district with the MIE.
In general, wind energy projects could primarily be developed in the Qobustan region and coastal zones including sea sites. While Absheron is the windiest region, the high prices of land particularly near Baku will hinder the progress of business.
5.4 GEOTHERMAL ENERGYStudies on geothermal resources in Azerbaijan were carried out in 1964–1970 and later in 1980–1989. Some potential was identified in seven areas, a complete list can be found in the Annex. The temperatures of the water sources are generally too low for technical use for power generation. Possible ap-plications include mineral water spas and heating purposes, especially for greenhouse heating.
As a consequence, there are no geothermal projects in Azerbaijan except for geothermal waters used for balneal pur-poses (hot hydrogen-sulfide wells in the Talish-Lenkaran area and mineral springs in Nakhchivan). Hot waters from min-eral springs of the mountainous Qarabagh area were used for heating of the resort Isti Su (meaning “Hot Water”). This area is now under occupation by Armenia. more information can be found in Ramazanov (1994).
5.5 HYDRO POWERThe development of small Hydro Power Plants is the most promising component in the RE sector. The region between the Large and Small Caucasus is rich in mountain streams and lakes. With a number of small plants installed, this RE source is already being used. According to statements from the Ministry of Energy, negotiations are currently underway to increase their number. Under existing conditions, it is tech-nically and economically feasible to develop a vast potential of small creeks, use drops on the irrigation canals and water releases from reservoirs, which will permit construction of small HPPs.
In the former Soviet Union and today’s Central Asian Region, the definition of small Hydro Power Plant is anything with a capacity below 10 MW. Smaller Hydro Power Plants are referred to as mini or micro Hydro Power Plants, equaling a capacity of less than 1 MW or 100 kW respectively. This report is covering all categories, as far as information is avail-able. Where technical potentials are mentioned, the sources of those estimates usually do not clearly specify what they mean by small HPP. Therefore the numbers found do vary.
Hydro Power Plants with a capacity between 1 and 10 MW are usually built and operated by utilities or larger companies, not so much by small private investors. Hydro Power Plants smaller than 1 MW are often built by private investors or Independent Power Producers (IPPs).
A number of still existing small Hydro Power Plants in Azerbaijan were built in the 1950s and 60s. Due to poor main-tenance and inexpensive energy from thermal plants and large Hydro Power Plants, the existing smaller Hydro Power Plants were largely neglected and are therefore in a very poor state or even completely dismantled.
The estimates of the usable potential in small hydro power are varying, depending on the source, and not very conclusive and reliable. The PREGA report mentions a total hydro power potential (including large sites) of 40,000 GWh, of which 5,000 GWh are technically usable potentials for small HPPs. This would refer to an installed capacity around 1,000 MW. Another report published by the ADB speci-fies more reliable results on the most promising 21 sites with capacities between 400 kW and 20 MW and a total of more than 150 MW. A list of those sites and a map of the locations can be found in the Annex.
Another estimation of the physical potential of small hydro power ranges from 200 MW to 400 MW. This estima-tion is mostly based on the opinion of individual specialists taking into account the number of small mountain rivers and the theoretical possibility to construct cascades of small power plants on each river.
Azerenergy JSC has prepared a program on hydro pow-er development including small hydro power. Prospective sites where power plants can be constructed have been identified. The total capacity is estimated at more than 1,300 MW. Financing sources for the program have not been identified yet and the feasibility of the sites was not investigated. Two projects have been started so far, namely the Sheki and mughan HPPs. Those are the sites 6 and 8 on the list of 21 recommended sites in the ADB report. There are also activities on the Yukhari Shirvan and Bash mil irrigation canals (sites 1 and 2 of the ADB report).
Renewable Energies in Central Asia
AZERBAIJAN REPUBLIC
COUNTRY INTRODUCTION 21
The conclusion drawn from patchy information is, that there is a significant potential for small hydro power development in the country. While there is some systematic information on small hydro power, there are no systematic studies on po-tentials for mini and micro hydro power. It is clear those po-tentials for sites with capacities of just a few kW up to a few hundred kW must be existent and those could be developed by private power producers.
6 MARKET RISK ANALYSIS AND BARRIERS FOR MARKET ENTRY
Probably the biggest obstacle for an entry into the Azerbai-jan energy market is that no activities in the RE market have been developed so far. While most relevant laws and regula-tions are in place, none of them have ever been applied so far. The pioneers in the market most likely will face regulatory and administrative hurdles when they start applying for licenses and have to negotiate with the power distributors. A general obstacle is that RE has to compete with very low market prizes from large hydro power and fossil fuels, but since tariffs are set, this is at least an obstacle that is defined and known and can be included in the financial analysis of any planned activity.
6.1 GENERAL SITUATIONThe registration of a new business is not difficult. In accord-ance with the new rules applied since 2008, the registration of enterprises is based on a one-window approach. In order to be registered, founders of firms or other entities as well as individual businessmen have to apply to the relevant regional body of the Ministry of Taxes only.
CorruptionThe corruption level is fairly high, with Azerbaijan listed on position 158 out of 180 on the 2008 Corruption Perceptions Index. It appears a situation where people are ready to pay for anything and it is considered to be normal.
Availability of Local Know-HowThe quantity of highly educated people is high. At the same time a lack of engineering-technical staff and career laborers appears. Over the last 15 years, young people primarily aimed to become lawyers, economists and doctors.
All high schools in Azerbaijan are named “University” or “Academy”. They are education entities only and practi-cally do not conduct any research. Of course, collaboration with universities is not prohibited and may be welcome, but scarcely will be successful.
Local AcceptanceThere are equal status and conditions both for local and for-eign entrepreneurs. No restrictions or exclusive rules for for-eign business exist. Non-natives, however, do not have property rights on land in Azerbaijan, but they can rent and use land and other property.
6.2 BUSINESS DEVELOPMENTForeigners and entities as well as physical persons are allowed to set up companies. The required registration can be acquired in one step. If the kind of activity is to be licensed, the license or special permission has to be obtained from the relevant au-thority. Foreign entities and physical persons can own 100 % of the shares of a company or its majority or less without any restrictions. There may be anti-monopoly limitations, which concern both foreign and local investors. In cases stipulated by the bank legislation, the capital of foreign banks in Az-erbaijan can be limited.
All natural persons in Azerbaijan are allowed to di-rectly contact foreign investors, conclude transactions, create joint ventures etc. ministries or other governmental bodies implement relationships with foreign investors in accordance with their responsibilities. No single governmental body is ex-clusively responsible to contact foreign investors.
The governmental institutions responsible for the reg-ulatory situation in the RE field are the Cabinet of Ministers, the MIE and the Tariff Council, which is responsible to fix unified prices.
In general, it is difficult to say how easy it is to get a license for a business in the energy field. It depends on the kind of activity the license has to be obtained for. In case of power plants, no such licenses have been issued, yet. There is no information available on how simple and predictable it will be to get one.
If some of the legal and regulatory provisions are not acceptable or reasonable, they may not apply in practice. In spite of that, investors can freely act while they comply with rules adopted in business practice of Azerbaijan, generate profit and transfer it without limitation. Both, local and for-eign investments are protected by the following Laws of the Azerbaijan Republic:
Law on Protection of Foreign Investments from 15 January 1992
Law on Investment Activity from 13 January 1995
6.3 INTELLECTUAL PROPERTY RIGHTSIntellectual property rights are protected under the Law on Copyright and Allied Rights from 5th June 1996. Besides, Azerbaijan has adopted and ratified the relevant international treaties.
Source: Compilation of Laws of the Azerbaijan Republic, as of 2009

AMOUNT OF MONTHLY TAXABLE INCOME TAX RATE
Up to 2,000 manats 14 %
Over 2,000 manats280 manats + 35 % of the amount exceeding 2,000 manats
Profit tax of legal entities 22 % (in general)
Value added tax 18 %
Excise tax rates defined by the Cabinet of Ministers
Property tax of legal persons 1 % of the value of the fixed assets
Land tax of legal personsrates defined dependently on profitability of land
Source: data compiled by the author
STATE TAXES ARE
Income tax of physical persons
Renewable Energies in Central Asia
AZERBAIJAN REPUBLIC
COUNTRY INTRODUCTION 22
6.4 TAXATIONThe Tax Code of Azerbaijan regulates State taxation in Azerba-ijan. If any provision on taxes stipulated in other laws contra-dicts to Tax Code of such provision, it shall not be applicable. Besides, there is the Law on Local Taxes, which defines munic-ipality taxes. Compulsory payments to Social Protection Fund are regulated by the Law on Social Protection.
The Tax Code establishes the maximum rates for all state tax-es. They can be annually reduced by law after approval of the state budget. Additionally, there are local or municipal taxes such as:
Land tax of physical persons Property tax of physical persons mining tax on raw materials for local construction Profit tax of enterprises that are in property of municipalitie
Import/ExportThere are no general restrictions for import and export. Import and export of goods and services are regulated by the Custom Code of Azerbaijan Republic, as well as by the Rules on Regu-lation of Import/export Transactions in the Azerbaijan Repub-lic” approved by a Decree of the President from 24 June 1997.
Custom duties and fees are defined by the Cabinet of Ministers. Import duty rates vary from 0 up to 15 % de-pending on type of goods and equipment.
All imported goods must pass customs in accordance with the legislation. One of the important documents for cus-toms clearance is the certificate of origin. In some cases, an expertise of goods or an agreement between the seller and the purchaser may be required.
7 BUSINESS INFORMATION AND CONTACTS
Ministry of Industry and Energy (MIE)Baku, Azerbaijan, Government BuildingPhone: (+994 12) 498 78 56, 598 16 75, 598 03 84, Fax: (+994 12) 598 16 78 E-mail: [email protected]
Ministry of Economic Development (MED)23, Niyazi Str, AZ1066, Baku, Azerbaijan Phone: (+994 12) 492 41 10Fax: (+994 12) 492 58 95E-mail: [email protected]
Ministry of Ecology and Natural Resources100 A,B.Aghayev str. Baku city, AzerbaijanContact phone numbers: 498-23-46; 439-11-11www.eco.gov.az/en
Ministry of Finance (MF)AZ 1022, Baku Azerbaijan, S.Vurgun Str, 83Phone: (+994 12) 493 81 03Fax: (+994 12) 493 05 62Web: maliyye.gov.az; finance.gov.azE-mail: [email protected]/index_en.jsp
Ministry of Taxes of the Republic of AzerbaijanAZ1073, 16, Landau Str., Baku,Azerbaijan RepublicPhones: (99412) 4038970Fax: (99412) 4038971E-mail: [email protected]
State Oil Company of Azerbaijan Republic (SOCAR)73 Neftchilar Av, Baku, AZ1000 AzerbaijanPhone: (+994 12) 4921789 Fax: (+994 12) 4971167 E-mail: [email protected]
Azerenergy Joint Stock Company (JSC)10 Academician Abdulkarim Alizade str., AZ 1005, Baku, AzerbaijanPhone: (+994 12) 492 31 09; 493 10 89Fax: (+994 12) 492 63 55E-mail: [email protected]

Renewable Energies in Central Asia
AZERBAIJAN REPUBLIC
23
RENEWABLE ENERGY – RELEVANT INSTITUTIONS
Ministry of Industry and Energy (MIE)Department of Renewable and EnvironmentHead: mirmehdi mirseyidov (+994 12) 493 82 14
Azerenergy Joint Stock Company (JSC)Energy Research Institute Director: Nariman Rahmanov (+994 12) 431 39 83Institute of Energy Research and DisineDirector: Nurali Yusifbeyli (+994 12) 431 42 08
Academy of Science:Institute of Radiation ProblemsDirector: Adil GaribovAZ1143, Azerbaijan Republic, Baku, F. Agayev, 9 Phone: (+994 12) 439 33 91, (+994 12) 438 32 24; Fax: (+994 12) 4398318E-mail: [email protected]
Laboratory of Transformation of Renewable Energy SourcesHead of Laboratory: Parviz Rzayev Phone: (+994 12) 438 32 24; (994 12) 439 33 89Fax: (+994 12) 439 83 18Main area of activity: Application of wind and solar-hydrogen powering for different technological processes.
Wind Power Engineering GroupHead of Group: Shamil Shahbazov Phone: (+994 12) 438 32 24; (+994 12) 439 33 89Fax: (+994 12) 439 83 18Main area of activity: Wind and solar power engineering
REFERENCES
8 BIBLIOGRAPHY
Asian Development Bank – ADB (2005): Promotion of Renewable Energy, Energy Efficiency and Greenhouse Gas Abatement (PREGA) – Azerbaijan Country Report
Asian Development Bank – ADB (2007): Renewable Energy Development Project – Final Report (ADB TA 4726-AZE)
Ramazanov (1994): Azerbaijan‘s Geothermal Energy Potential, IGA News, no. 16/1994, p. 5Central Intelligence Agency – CIA (2009): World Fact Book, Azerbaijan (www.cia.gov/library/publications/the-world-factbook/geos/aj.html)
Nationmaster (2004): Azerbaijan. Energy statistic (viewed in November 2009, www.nationmaster.com/red/country/aj-azerbaijan/ene-energy&all=1)
European Bank for Reconstruction and Development – EBRD (2009): Renewable Energy Initiative. Azerbaijan. Country Profile (https://ws99.myloadspring.com/sites/renew/Shared %20Documents/2009 %2-0Country %20Profiles/Azerbaijan.pdf)

Renewable Energies in Central Asia
AZERBAIJAN REPUBLIC
24
9 ANNEX
TABLE 9.2
Development of the GDP
YEARS MILLION MANAT
MILLION USD PER CAPITA
Manat US $
1995 2m133.8 2,415.2 282.1 319.3
1996 2,732.6 3,180.8 357.5 416.1
1997 3,158.3 3,960.7 409.2 513.2
1998 3,440.6 4,446.4 441.5 570.6
1999 3,775.1 4,583.7 480.1 582.9
2000 4,718.1 5,272.8 595.1 665.1
2001 5,315.6 5,707.7 665.2 714.3
2002 6,062.5 6,235.9 752.9 774.4
2003 7,146.5 7,276.0 880.8 896.8
2004 8,530.2 8,680.4 1,042.0 1,060.3
2005 12,522.5 13,238.7 1,513.9 1,600.4
Source: IMF Data and Statistics, as of 2008
Source: unknown
FIGURE 9.1
Climatic Zones of Azerbaijan
ANNEX

Renewable Energies in Central Asia
AZERBAIJAN REPUBLIC
25
TABLE 9.4
Generation expansion program (2008–2015)*
NAME OF STATION UNIT NO. TYPE OF POWER STATION TYPE OF FUEL INSTALLED CAPACITY (MW) DATE OF COMMISSIONING
Sumqayit 3 combined cycle gas 516 2009
Quba 12 piston (engine) gas 104 2009
Janub 6 combined cycle gas, mazut 780 2010
Azerbaijan 8 steam turbine gas, mazut 600 2010
Fizuli 2 hydro – 25 2010
Tovuz 2 (4) hydro – 380 2014
Small HPPs (intended) 30 2009–2012
TABLE 9.5
Transmission and Distribution System*
VOLTAGE LEVEL LENGTH NUMBER OF LINES
500 kV 450 km 2 TL
330 kV 1,207 km 14 TL
220 kV 1,230 km 19 TL
110 kV 2,484 km 175 TL
35 kV 4,800 km 350 DL
6–10 kV 37,900 km 3,200 DL
0.4 kV 61,000 km 60,000 DL
TABLE 9.6
Tariff Increases for Electricity Consumers*
USERS 2006 2007*
HOUSEHOLD 0.019 0.060
INDUSTRY AND CONSTRUCTION 0.026 0.060
BUDGETARY ORGANIZATIONS 0.026 0.060
AGRICULTURE 0.026 0.060
TRADE AND SERVICES 0.050 0.060
POWER PLANT NAME POWER PLANT TYPE NUMBER OF UNITS POWER PLANT CAPACITY (MW)
Installed Available
Azerbaijan Thermal Power Plant (AzDRES) condensing steam turbine 8 2,400 2,000
Alibayramli (Shirvan) Thermal Power Plant condensing steam turbine 7 1,050 900
Shimal Thermal Power Plantcombined cycle (gas turbine + recovery boiler + steam turbine)
1 400 350
Baku Heat and Power Plant 1 gas turbines + recovery boilers 2 106 100
Baku modular Thermal Power Plant drive system – reciprocating internal combustion engine
12 104 104
Astara modular Thermal Power Plantdrive system – reciprocating internal combustion engine
10 87 87
Sheki modular Thermal Power Plantdrive system – reciprocating internal combustion engine
10 87 87
Khachmaz modular Thermal Power Plantdrive system – reciprocating internal combustion engine
10 87 87
Nakhchivan modular Thermal Power Plantdrive system – reciprocating internal combustion engine
10 87 87
Mingachevir Hydro Power Plant hydro 6 400 360
Shamkir Hydro Power Plant hydro 2 380 190
Mingechaur Hydro Power Plant hydro 6 400 360
Varvara Hydro Power Plant hydro 3 16 10
Yenikend Hydro Power Plant hydro 4 150 100
Terter Hydro Power Plant* hydro 2 50 –
Araz Hydro Power Plant hydro 2 22 22
Sangachal modular Thermal Power Plant (commissioning date: 24 December 2008)
drive system – reciprocating internal combustion engine
18 300 300
Total capacity 5782 4944
Note: *) The Terter Hydro Power Plant is located on a territory temporarily occupied by Armenia.
TABLE 9.3
Electric Power Plants of Azerbajan*
ANNEX
* Sources Tabels 9.3 – 9.6 and 9.8: compiled by the authors from various data sources

President
Cabinet of Ministers
Gas Supervision Electricity and HeatSupervision
Azerneft(Oil and gasproduction)
Azerenergy(Electricity)
Azeriqaz(Gas supply)
Generation Transmission Distribution(7 Distributors)
Bakinetwork(Distributor)
Sumgaitnetwork(Distributor)
Shekinetwork(Distributor)
Ministry of Industryand Energy
Ministry of EconomicDevelopment
Renewable Energies in Central Asia
AZERBAIJAN REPUBLIC
26
FIGURE 9.7
Schematic Structure of Energy Sector Management
TABLE 9.8
Geothermal Sites Identified in Azerbaijan
NAME OF AREA PROVEN RESOURCES (M3/DAY)
TEMPERATURE (° C) EXTENT OF MINERALIZATION (G/L)
1. Yalama-Khachmaz 570,00021,000–25,000
40–85 3.0–25.0;up to 42
2. Talish-Lenkaran 25,600 31–64 7.0–43.0
3. Kur Lowland* 242,000100,000
30–71 4.4–40.0
4. mountainous Qarabagh 4,000–5,000 30–74 n. a.
5. Absheron Peninsula* 20,000 40–80 n. a.
6. major Caucasus 2,000 30–50 n. a.
7. Nakhchivan Autonomous Republic 3,000 40–50 n. a.
* mostly iodine-bromide water
ANNEX
Source: unknown

Renewable Energies in Central Asia
AZERBAIJAN REPUBLIC
27
FIGURE 9.9
Map of Geothermal Areas
ANNEX
Source: unknown

Renewable Energies in Central Asia
AZERBAIJAN REPUBLIC
28ANNEX
TABLE 9.10
Biomass Production of Azerbaijan
Source: EBRD, 2009
BIOMASS RESOURCE TYP TOTAL PRODUCTION PRODUCTION DENSITY
Percent of total land area covered by 14 %
Forests 17 %
Shrublands savanna and grasslands 64 %
cropland and crop/natural vegetation mosaic 1 %
Urban and built-up areas 2 %
Sparse or barren vegetation; snow and ice 2 %
Wetlands and water bodies 14 %
Primary crop production, ton (avg. 1999–2001 ton) (ton/1000 ha)
Total primary crops (rank among COO) 7,806,794 (18) 901 (19)
Top 10 primary crops
Mixet grasses, Legumes 2,600,000 300
Maize for forage & silage 1,200,000 139
Wheat 1,189,327 137
Potatoes 479,325 55
Tomatoes 370,678 43
Apples 281,767 33
Watermelons 252,579 29
Vegetables and Roots, Fodder 231,667 27
Barley 208,967 24
Vegetables fresh (misc) 133,000 15
Animal units, number (number) (number/1000 ha)
Cattle 1,933,270 223
Poultry 12,972,000 1,498
Pigs 22,900 3
Equivalent animal units 2,072,150 239
Annual roundwood production (1996 – 98,000m3) (m3/ha)
Total n .a. n .a.
Fuel n .a. n .a.
Industrial n .a. n .a.
Wood-based panels n .a. n .a.
(1996 – 98,000metric tons) (metric tons/ha)
Paper and paperboard n .a. n .a.
Recovered paper n .a. n .a.

Renewable Energies in Central Asia
AZERBAIJAN REPUBLIC
29
1. RAYONS (CITIES AND VILLAGES) AVERAGE WIND SPEED (M/S)
2. Imishli 2,9
3. Astara 2,8
4. Jalilabad 2,8
5. Shahbuz 2,7
6. Nakhchivan 2,6
7. Shamakhi 2,6
8. Lerik 2,6
9. Yevlakh 2,6
10. Julfa 2,5
11. Gedabey 2,4
12. Agstafa 2,4
13. Kurdemir 2,3
14. Khachmaz 2,3
15. Sheki 2,3
16. Dashkesan 2,2
17. Beylagan 2,2
18. Shemkir 2,2
19. Geokchay 2,1
20. Sabirabad 2,1
21. Quba 1,9
22. Kelbajar 1,8
23. Zardab 1,8
24. Aqdam 1,8
25. Lenkaran 1,8
26. Fizuli 1,7
27. Yardimli 1,6
28. Qazakh 1,3
29. Zaqatala 1,3
TABLE 9.11.3
Average Wind Speeds in Absheron Region – Weakly Windy (1–3 m/s)*
PANOHS (CITIES AND VILLAGES) AVERAGE WIND SPEED (M/S)
Neftchala 4,2
Nabran 4,1
Terter 4,0
Mingachevir 3,8
Alat 3,8
Qazimammad 3,7
Ganja 3,3
Maraza 3,2
Salyan 3,1
Bilasuvar 3,0
Jadrail 3,0
TABLE 9.11.2
Average Wind Speeds in Absheron Region – Relatively Windy (3–5 m/s)*
RAYONS (CITIES AND VILLAGES) AVERAGE WIND SPEED (M/S)
Shubani village 8,0
Guzdek village 7,5
Sumqayit city 7,0
Puta village 6,7
Pirallahi island 6,6
Bina village 6,4
Jilov island 6,4
Bakucity 6,3
Oily Rocks (oil-field in the see) 6,2
Mardakan village 5,9
Mashtaga village 5,8
TABLE 9.11.1
Average Wind Speeds in Absheron Region – Windy (5–8 m/s)*
FIGURE 9.12
Wind Speed map for Azerbaijan
ANNEX
* Sources Tabels 9.11.1 - 9.11.3 and Figure 9.12 unknown

Renewable Energies in Central Asia
AZERBAIJAN REPUBLIC
30
FIGURE 9.13
Sunshine map for Azerbaijan
ANNEX
TABLE 9.14
Identified Sites for Small Hydro Power Plants in Azerbaijan
Source: ADB, without year
No SITE NAME (SHPS) TYPE OF POWER PLANT NET HEAD, EST. (M) FLOW (M3/S) POWER (KW)
1 Yukhari Shirvan Irrigation channel 12.5 30 2,869
1a Yukhari Shirvan Irrigation channel 9.5 78 5,670
2 Bash Mil Irrigation channel 33.3 80 20,354
3 Varvara River 5.9 429 19,335
4 Yukhari Karabakh Irrigation channel 18.1 125 17,264
5 Katekh River 29 19.8 4,394
6 SHP Sheki Rehabilitation 179 0.94 1,287
7 Quba River 41.8 1.18 377
8 Mugan Irrigation channel 7.1 21 1,145
9 Chichakli River 83.1 1.38 878
10 Chinarli River 29.6 3 680
11 Nugadi River 66 1.5 758
12 Valishchay River 36.1 10.5 2,900
13 Akstafachay River 23.8 14 2,544
1 Akstafachay River 28.5 6 1,308
15 Ayrichay River 5.7 20.8 907
16 Qusarchay 6 River 29 7.5 1,664
17 Lenkaranchay 3 River 31 10.4 2,467
18 Arpachay River 50.8 28.5 11,084
19 Vayhir River 40.4 13.2 4,078
20 Alindjachay 6 River 10.4 46 3,645
21 Alindjachay 7 River 11.6 46 4,079
Source: unknown

Renewable Energies in Central Asia
AZERBAIJAN REPUBLIC
31
FIGURE 9.15
Overview of Potential SHP Sites in Azerbaijan
ANNEX
Source: ADB, without year

Renewable Energies in Central Asia 32
COUNTRY CHAPTER:
REPUBLIC OF GEORGIA
Authors and Coordination of Country Chapter Grigol Abramia (Dipl. Env. Management & Lit.)
Dr. Ing. Klaus JordeEntec Consulting & Engineering AGSt. Gallen, Switzerlandwww.entec.ch
Axel Biegert (Dipl. Economist & Pol.) INTEGRATION UMWelt & Energie GmbHGraefenberg, Germany www.integration.org
Editor Deutsche Gesellschaft für Technische Zusammenarbeit (GTZ) GmbHDepartment Water, Energy, TransportDag-Hammarskjöld-Weg 1-565760 Eschborn, Germanywww.gtz.de
On behalf of Federal Ministry for Economic Cooperation and Development (BMZ)
Editorial staffDiana KraftTel: +49 (0)6196 79 4101Fax: +49 (0)6196 79 80 4101Email: [email protected]
33
CONTENTS GEORGIA
CONTENTS
ACRONYMS, ABBREVIATIONS AND MEASUREMENTS 34
1 SUMMARY 36
2 COUNTRY INTRODUCTION 372.1 Geography and Climatic Conditions 372.2 Political and Economic Development 37
3 ENERGY MARKET IN GEORGIA 393.1 Important Players of the Georgian Energy Market 393.2 Primary Energy Consumption, Transmission and Prices 39
4 POLICY FRAMEWORK FOR RENEWABLE ENERGIES 424.1 National Strategies and Programs to support Renewable Energies 424.2 Regulations, Incentives and Legislative Framework Conditions 42
5 POTENTIAL FOR RENEWABLE ENERGIES AND PRESENT USE 445.1 Bioenergies 445.2 Solar Energy 445.3 Wind Power 445.4 Geothermal Energy 455.5 Hydro Power 46
6 MARKET RISK ANALYSIS AND BARRIERS FOR MARKET ENTRY 466.1 General Situation 466.2 Business Development 476.3 Intellectual Property Rights 476.4 Taxation 47
7 RENEWABLE ENERGY BUSINESS INFORMATION AND CONTACTS 47
8 BIBLIOGRAPHY 49
9 ANNEX 50
Renewable Energies in Central Asia
GEORGIA

34
ACRONYMS AND ABBREVIATIONS GEORGIA
ADB Asian Development Bank
CAR Central Asian Region
CCA Common Country Assessment
CENN Caucasus Environmental NGO Network (CENN)
CDM Clean Development Mechanism
CHP Combined Heat and Power Plant
CIS Commonwealth of Independent States
CO2 Carbon Dioxide
DDP Distribution Demonstration Project
EBRD European Bank for Reconstruction and Development
EEC Energy Efficiency Centre
ESCO Energy System Commercial Operator
FSU Former Soviet Union
GDP Gross Domestic Product
GEF Global Environmental Facility
GHG Greenhouse Gas Emissions
GNERC Georgian National Electricity Regulatory Commission
GNIA Georgian National Investment Agency – GNIA
GSE Georgian State Electro System
GWEM Georgian Wholesale Electricity Market
HPP Hydro Power Plant
HV High Voltage
HVL High Voltage Lines
HVN High Voltage Network
IBRD International Bank for Reconstruction and Development
IDA International Development Association
IEA International Energy Agency
JSC Joint Stock Company
MB&C Metering, Billing and Collection
MDG Millennium Development Goals
NATO North Atlantic Treaty Organization
O&M Operation and Maintenance
PREGA Promotion of Renewable Energy, Energy Efficiency and Greenhouse Gas Abatement
RAO UES Russian energy company
RE Renewable Energy
SPP Small Power Plant
SHPP Small Hydro Power Plant
SJSC State Joint Stock Company
UDC Unified Dispatch Center
UEDC United Energy Distribution Company
UNDAF UN Development Assistance Framework
UNDP United Nations Development Program
UPSCAR United Power System of Central Asia Republics
USAID United States Aid
USD US Dollar
US United States
VAT Value Added Tax
WB World Bank
ACRONYMS, ABBREVIATIONS AND MEASUREMENTS Renewable Energies in Central Asia
GEORGIA

35
MEASUREMENTS
°C degree Celsius
km kilometer
km2 square kilometer
km³ cubic kilometer
kV kilovolt (1kV = 1,000 V)
kWh kilowatt hour
l liter
m meter
m³ cubic meter
mm millimeter
MW megawatt (1 MW = 1,000 kW)
GWh gigawatt hour (1 GWh = 1,000,000 kWh)
TWh terawatt hour (1 TWh = 1,000,000,000 kWh)
kj kilojoule (1 kj = 1,000 Joules)
ktoe kilotons of oil equivalent (1 ktoe = 11,630,000 kWh)
Renewable Energies in Central Asia
GEORGIA
ACRONYMS, ABBREVIATIONS AND MEASUREMENTS

Renewable Energies in Central Asia
GEORGIA
36
1 SUMMARY
Georgia has vast resources of almost all types of Renewable Energy (RE) – solar, wind, geothermal, hydro and biomass. The achievable annual potential of all RE sources is estimated at 15,000 GWh per year. This is enough energy to meet over a third of Georgia’s annual primary energy needs. Apart from large hydro power resources, only a very small part of this potential is currently used. Below, please find an overview of the largely untapped achievable potentials:
The Georgian Government has been implementing a major restructuring of the energy sector since 2004. The main ob-jective for the long-term policy is to fully satisfy the country’s overall demand for electricity with domestic hydro resources. Besides tendering a number of new large Hydro Power Plants, the Ministry of Energy seeks foreign investors for the develop-ment of new small and medium Hydro Power Plants. On its official website, the Ministry of Energy has published a list of 91 potential sites with prospective capacities ranging from 0.6 MW to 99 MW1. Investors can be benefit from a guaran-teed purchasing agreement for the first 10 years of operation.
Since the Rose Revolution in 2003, Georgia has been making enormous progress towards the improvement of the investment climate. Today, the World Bank (WB) ranks Georgia 11th in the world in terms of ease of doing business, ahead of many industrialized countries like Japan and Ger-many. Investor confidence has, however, suffered after the armed conflict between Russia and Georgia in August 2008. Russia’s role as the main geopolitical player in the region has strengthened, and the relationship between the two states will play an important role in Georgia’s the future economic de-velopment.
SUMMARY
ACHIEVABLE POTENTIAL
Small hydro power 5,000 GWh
Wind energy 5,000 GWh
Biofuels 3,000–4,000 GWh
Solar energy 60–120 GWh
Geothermal energy 3,000 GWh
TABLE 1
Untapped Achievable Potentials
Source: data compiled by the author from different sources
1 SEE WEBSITE OF GEORGIA’S MINISTRY OF ENERGY: WWW.MINENERGY.GOV.GE/?LANG=ENG

Renewable Energies in Central Asia
GEORGIA
COUNTRY INTRODUCTION 37
2 COUNTRY INTRODUCTION
2.1 GEOGRAPHY AND CLIMATIC CONDITIONSGeorgia is located in the Caucasus region of south-western Asia with a land area of 69,700 km2. It is bordered to the West by the Black Sea (with a coastline of 310 km), to the South by Turkey and Armenia, to the East by Azerbaijan and to the North by Russia. Mountains are the dominant geographic fea-ture of Georgia. The northern border with Russia roughly runs along the crest of the Greater Caucasus mountain range – a commonly acknowledged boundary between Europe and Asia with highest peaks above 5,000 m. The southern part of the country is bounded by the Lesser Caucasus Mountains with elevations of less than 3,500 m.
Native Georgians constitute about 84 % of Geor-gia‘s current population of 4.6 million people (as of 2009). Other major ethnic groups include Azeris (6.5 %), Armenians (5.7 %), Russians (1.5 %) and numerous smaller groups. The country with the capital of Tbilisi (Tiflis) consists of nine ad-ministrative regions and two autonomous republics (Abchazia and Ajaria). Abchazia and the autonomous administrative dis-trict of South Ossetia have officially declared their independ-ence, but are only recognized by Russia, Nicaragua, Venezuela and Transnistria.
The climate of Georgia is extremely diverse, consider-ing the nation‘s small size. There are two main climatic zones, roughly separating the eastern and western parts of the coun-try. Much of western Georgia lies within the humid subtropi-cal zone with annual precipitation ranging from 1,000–4,000 mm. The climate of the region varies significantly with eleva-tion, and while many of the lowland areas of western Georgia are relatively warm throughout the year with average tempera-tures from 5–12 °C, the foothills and mountainous areas ex-perience cool, wet summers and snowy winters.
Eastern Georgia has a transitional climate from humid subtropical to continental. Annual precipitation ranges from 400–1,600 mm – considerably less than that of western Geor-gia due to influences by dry air masses from Central Asia.
2.2 POLITICAL AND ECONOMIC DEVELOPMENT Georgia has been an independent republic since its separation from the former Soviet Union in 1991. Georgia‘s main eco-nomic activities include the cultivation of agricultural prod-ucts such as grapes, citrus fruit and hazelnuts, the mining of manganese and copper and output of a small industrial sector producing alcoholic and non-alcoholic beverages, metals, ma-chinery, aircrafts and chemicals. Tourism is an increasingly significant part of the Georgian economy. About a million tourists brought 313 million USD to the country in 2006. The services sector contributed 59.6 % to the country’s Gross Domestic Production (GDP) in 2008 followed by industry 27.9 % and agriculture 12.5 %2.
The country’s economic transition from a centrally planned economy to a market economy was a difficult process. Like all post-Soviet states, Georgia faced a severe economic collapse, where its GDP fell by 20 % per year between 1990 and 1995. The civil war and military conflicts in South Osse-tia and Abkhazia aggravated the crisis. The country embarked on a slow pace of economic growth between 1998 and 2003 (3–3.5 %). This growth, however, was not enough to benefit the country’s impoverished majority. By 2003, an estimated 52 % of Georgians were living below the official poverty line. Growing dissatisfaction ultimately triggered Georgia‘s 2003 Rose Revolution – a national uprising that brought down the regime of Eduard Shevardnadze.
Since the end of the Rose Revolution, the Saakashvili Government has been achieving a remarkable progress: From administrative chaos, the virtual non-existence of an open na-tional economy and the stranglehold of mafia-like organiza-tions, Georgia has moved rapidly to reconstitute the state‘s authority, abandon the structures and practices that made corruption endemic, launched a campaign to fight criminal-ity, liberalized the national economy and opened it up to new disciplines and opportunities to play in global markets. With-in a period of four years, Georgia had not only constructed a proper state, but had also emerged as one of the world‘s fastest growing and most rapidly transforming econoMIEs.
The improved business environment led to a remark-able inflow of foreign capital fuelling the country’s economy. The World Bank recognized Georgia as the world‘s fastest-re-forming economy in its 2008 Doing Business Report, ranking in the same league as countries like Germany, Sweden and Estonia. GDP growth was above 9 % from 2005 to the first quarter of 20083.
Despite its internationally recognized borders, the country had to struggle to gain control over its territory since gaining independence. In August 2008, the conflict around the internationally not recognized republics of Abkhazia and South Ossetia escalated in a short war with Russia. The war caused severe damage to Georgia’s economic and financial system, a total collapse of military infrastructure, stopped direct investment flow into the country and significantly un-dermined the status of Georgia as safe and stable energy tran-sit country4. In combination with the global financial crisis, GDP growth dropped to 2.1 % in 2008 and is projected to further decrease to -4 % for 2009 before increasing again to 2 % in 20105.
2 CIA, AS OF 2009
3 WORLD BANK GROUP/IFC, AS OF 2008/2009
4 TRANSPARENCY INTERNATIONAL GEORGIA/BP GEORGIA, AS OF 2008
5 IMF, AS OF 2009
FIGURE 1
Map of Georgia
Black Sea Senaki
Zugdidi
K’ut’aisi Ts’khinvali
Akhalk’alak’i
Sup’sa
Bat’umi
Och’amch’ire
Sokhumi
P’oti
R U S S I A
T U R K E YA R M E N I A
TBILSISIRust’avi
Gori
Akhalts’khe
Black Sea
Kura
A Z E R B A I J A N

Renewable Energies in Central Asia
GEORGIA
COUNTRY INTRODUCTION 38
The roots of the war with Russia are related to Georgia’s geo-strategic location as an energy corridor for East Caspian re-sources (Kazakh oil and Turkmen gas) to western countries via Turkey. This is probably the most important reason for the growing US and EU influence in Georgia, notably through proposed EU and NATO membership, the US military assist-ance program and the construction of the Baku-Tbilisi-Cey-han pipeline. These projects have strained Tbilisi‘s relations with Moscow. The armed conflict between Russia and Geor-gia made it obvious that Russia’s role as the main geo-political player in the region has strengthened and that the safety of the South Caucasian transit infrastructure depends on the kind will of Russia. Meanwhile, Georgia’s strategic location has also lost some importance since the Caspian countries have now access to alternative routes towards China and Iran.
SHORT BUSINESS INFOSince the Rose Revolution, Georgia has been reconstituting the state‘s authority, abandoning the structures and prac-tices that made corruption endemic, launching a campaign to fight criminality, liberalizing the national economy and opening it up to new disciplines and opportunities to play in global markets. The World Bank recognized Georgia as the world‘s fastest-reforming economy in its 2008 Doing Business Re-port, ranking in the same league as countries such as Germany, Sweden and Estonia.
LAND AREA: 69,700 km²
POPULATION: 4.6 million (as of 2009)
DENSITY: 66 inhabitants/km²
BIGGEST CITIES AND POPULATION:
Tbilisi (1.48 million), Kutaisi (186,300)
LANGUAGE: Georgian
CLIMATE: Warm and pleasant; Mediterranean-like on Black Sea coast
AVERAGE ANNUAL TEMPERATURE:
In lower areas 5–12 °C, at 2,500 m above sea level < 0 °C
ALTITUDE: Sea level to Mt‘a Shkhara 5,201 m
RIVERS: 26,000 rivers
ECOSYSTEM AREAS: Forests (48 %), shrubland, savannah, grassland (11 %), cropland and crop/natural vegetation mosaic (39 %), urban and built-up areas (1 %), sparse or barren vegetation, snow and ice (1 %), wetland and water bodies (1 %)
INFLATION RATE: 11 % (as of 2008)
AGRICULTURAL PRODUCTS Citrus fruit, grapes, tea, hazelnuts, vegetables, livestock
INDUSTRIES: Steel, aircrafts, machine tools, electrical appliances, mining (manganese and copper), chemicals, wood products, wine
ELECTRICITY – PRODUCTION: 7,287 GWh (as of 2006)
ELECTRICITY – CONSUMPTION: 5,669 (as of 2006)
ELECTRICITY – TARIFFS: 8 USc/kWh
NATIONAL ELECTRICITY CAPACITY IN OPERATION:
4,388 GW
ELECTRIFICATION RATE: n. a.
NATURAL RESOURCES: Forests, hydro power, manganese deposits, iron ore, copper, minor coal and oil deposits, natural gas
OIL – PRODUCTION: 0.98 thousand barrels/day (as of 2007)
OIL – EXPORT: 2 thousand barrels/day (as of 2007
OIL – CONSUMPTION: 12.9 thousand barrels/day (as of 2006)
OIL – PROVEN RESERVES: 0.035 billion barrels (as of 2008)
NATURAL GAS – PRODUCTION: 1 billion cubic feet/year (as of 2005)
NATURAL GAS – PROVEN RESERVES:
300 billion cubic feet (as of 2008)
EXPORTS: 2.76 billion USD (as of 2008)
EXPORTS – COMMODITIES: Scrap metal, wine, mineral water, ores, vehicles, fruits and nuts
EXPORTS – PARTNERS: Turkey 13 %, US 11.2 %, Azerbaijan 6.3 %, UK 5.4 %, Bulgaria 5.1 %, Ukraine 5 %, Armenia 4.8 %, Turkmenistan 4.5 %, Canada 4.2 % (as of 2007)
IMPORTS: 7.3 billion USD (as of 2008)
IMPORTS – COMMODITIES: Fuels, vehicles, machinery and parts, grain and other foods, pharmaceuticals
IMPORTS – PARTNERS: Turkey 14 %, Russia 12.3 %, Ukraine 8.5 %, Azerbaijan 7.3 %, Germany 6.8 %, US 5 %, Bulgaria 4.6 % (as of 2007)
EXCHANGE RATE: 1 € = 2.5 Lari (as of 2009)
Source: CIA World Fact Book, as of 2009; IEA, as of 2006

Renewable Energies in Central Asia
GEORGIA
COUNTRY INTRODUCTION 39
3 ENERGY MARKET IN GEORGIA
Georgia imports nearly all its needed supplies of natural gas and oil products. The share of energy in the GDP of Georgia is three times greater than in the developed countries of Europe. The competitiveness of Georgia’s economy is, therefore, par-ticularly affected in times of high energy prices. The country, however, has a considerable hydro power potential, which can reduce its dependency on energy imports, if better developed.
Although Georgia does not own large-scale oil and gas resources, it can generate revenues from oil and gas transit because of its geo-strategic location. Despite its lucrative lo-cation, Georgia has been struggling to secure a basic energy supply for its citizens since its independence from the former Soviet Union. The civil war and the economic crisis in the early years of independence destroyed many state-owned en-ergy assets, while the remaining resources were severely dam-aged or abandoned in disrepair. The last sabotage against the electricity infrastructure took place in the period 2004–2005. Since then, the Saakashvili Government managed to stabilize the electricity sector. Generation units and transmission lines are being rehabilitated with budgetary funds and the assist-ance of foreign donors.
The Parliament’s Resolution on the Main Directions of Georgia’s Energy Sector Development, adopted in 2006, identified the transfer of energy units in private ownership as a main component in improving the country’s energy sector. Besides that, the state energy policy focuses on energy efficien-cy and saving, namely (i) on the reduction of energy consump-tion and loss in industrial and communal areas and (ii) the examination and implementation of measures necessary for creating cogeneration systems and for the utilization of Re-newable Energy sources (hydro, wind)6. Critics, however, say that there is too little political will to enforce that policy7.
3.1 IMPORTANT PLAYERS OF THE TURKMEN ENERGY MARKET
The majority of the Georgian energy sector is privatized and mostly in the hands of Russian-Georgian business groups. Despite the possible danger during and after the military conflict between Russia and Georgia in August 2008, Rus-sian-Georgian business groups stayed in business and did not stop supplying the population with electricity and gas. When the military conflict was over, the Georgian government posi-tively evaluated the activities of energy companies during the conflict and expressed readiness to continue receiving invest-ments from Russia.
RAO Telasi is the power distribution company of Tbi-lisi and has been in the Georgian energy market since 2003, when Inter RAO UES8 bought 75 % of stocks from the US firm AES with the remaining 25 % of stocks belonging to the municipality of Tbilisi. As part of the deal, RAO UES purchased the 600 MW Mtkvari gas fired power station from AES. RAO Telasi has signed electricity purchase agreements with the Enguri, Khrami and Zhinvali Hydro Power Plants. Energo Pro is a Czech Company, which entered the Georgian
energy market in 2007 and has been supplying the Georgian regions with electricity ever since. Besides the distribution network, the company owns several hydroelectric power sta-tions with a joint capacity of 354 MW. The company cannot meet consumer needs with only its own generation; therefore it also purchases electricity from Enguri and other hydroelec-tric power stations.
Georgian National Electricity Regulatory Commis-sion (GNERC) is responsible for the regulation of the power sector as well as the natural gas sector. GNERC is set up as an independent legal body with its Commission Chairman ap-pointed by the President of Georgia. The Commission has the authority to grant licenses and deal with licensees concerning generation, transmission and distribution within the Electric-ity and Natural Gas Sectors of Georgia. GNERC also has the mandate to set tariffs for generation, transmission and dis-tribution. The commission is to provide attractive terms and conditions for new private HPP investors.
Electricity System Commercial Operator (ESCO) was set up in 2006 with a mandate to be the market maker in the electricity system in Georgia. ESCO provides medium- and long-term purchase agreements with operators of power plants and trades with electricity in Georgia and neighbor-ing countries. ESCO guarantees the purchase of all electricity from newly built HPPs, which nominally reduces market risk. Questions remain regarding the viability of ESCO in the me-dium term, as its predecessor, the Georgian Wholesale Elec-tricity Market (GWEM), had to file for bankruptcy in 2004 because of the persistent lack of payment from its customers.
3.2 PRIMARY ENERGY CONSUMPTION, TRANSMISSION AND PRICES
In 2006, the total primary energy supply in Georgia was 3,344 ktoe (38,890 GWh). The total final consumption was 2,509 ktoe (29,179 GWh). 71 % of the supplied primary en-ergy in 2006 was imported, out of which 41 % was natural gas and 23 % oil products9. Local biofuels (mainly in the form of firewood) play an important role in primary energy supply. The consumption of firewood is in the same range as the con-sumption of electricity produced through the hydro power sta-tions. Firewood is mainly consumed in rural areas for cooking and heating purposes. The consumption of firewood is very inefficient due to the widespread practice of using woodstoves of very low efficiency (35–40 %). Transmission and Distribu-tion System
The gap between primary energy supply and consump-tion indicates that a significant part of energy is lost due to outdated distribution networks and theft. IEA estimates these losses in the range of 10 % (as of 2006) of the total primary energy supply (distribution losses and theft) which indicates that there is still a considerable need for technical and politi-cal measures to make the energy sector more efficient10.
8 INTER RAO UES IS A RUSSIAN ENERGY COMPANY ENGAGED IN POWER GENERATION
AND ELECTRICITY TRADING.
9 IEA, AS OF 2006
10 WORLD EXPERIENCE FOR GEORGIA, AS OF 2008
6 RESOLUTION ADOPTED BY THE PARLIAMENT ON 7 JUNE 2006
7 TRANSPARENCY INTERNATIONAL GEORGIA/BP GEORGIA, AS OF 2008

Renewable Energies in Central Asia
GEORGIA
COUNTRY INTRODUCTION 40
The Figure below shows the energy consumption by sector. The consumption by the residential sector is particularly large with 45 % of the total consumption, while the consumption in the industry sector is particularly low with only 10 %.
Electricity SectorThe installed electricity generation capacity in Georgia to-tals 4,470 MW of which 62 % are located in Hydro Power Plants. The other 38 % are located in thermal power plants mainly used to meet peak and winter demand. The average annual electricity generation in the 2000–2006 period totaled 8,180 GWh, of which 72.5 % was hydroelectricity, 13.5 % was generated in thermal power plants and 14 % was imported (see Annex 2).
A number of power plants have been privatized in re-cent years. Inter RAO UES purchased the 600 MW Mtkvari gas fired power station, while Energo Pro bought 6 medium-sized Hydro Power Plants with a total installed capacity of 361 MW in 2007. Other power plants are scheduled to be privatized. However, most of the important generation assets, such as the 1,300 MW Enguri HPP generating almost one third of the country’s electricity, remain state-owned. Other assets are partly controlled by Georgian municipalities11.
About 15 % of the generated electricity are used by the energy sector itself (e. g. for pumped storage) and 13 % are lost in the distribution network or by theft. Although losses are still significant, huge progress was made by improving the network in recent years. Final Electricity consumption totaled 5,669 GWh in 200612. The figure below shows electricity con-sumption by sector.
Until recently, Georgia’s electricity sector suffered from a surplus of hydraulic energy compared to system de-mand during the months of May–July. In this period, the water discharge in rivers strongly increases, and electricity us-age considerably decreases. Specialists estimate the amount of excessive energy at approximately 700–800 GWh annually, or about 10 % of in-country electricity generation. The main reason for this situation is that Georgian power plants were planned and constructed for peak operation in the united en-ergy system of the Soviet Union. After the breakdown of the Soviet Union and the isolation of the Georgian energy system, some of the capacity remained unused in the summer. This was a serious problem, which generally hindered the develop-ment of energy generation in Georgia, to say nothing about generation from new prospective small or big HPPs.
This situation changed in 2007, when the newly cre-ated market maker ESCO managed to develop an export po-tential by arranging seasonal energy swaps with neighboring countries. Today, almost all surplus hydroelectricity can be sold which will positively influence the development of small hydro power and other grid-connected RE solutions in the future.
11 ECON, AS OF 2007
12 IEA, AS OF 2006
FIGURE 2
Composition of Total Energy Supply
Total Primary Energy Supply and Consumption
Source: International Energy Agency (IEA), as of 2006
Gas 41 %
Others 1 %
Electricity 2 %
Hydro 14 %
Firewood 19 %
Petroleum products 23 %
FIGURE 2.1
Composition of Total Energy Supply
Total Final Consumption
Gas 22,6 %
Others 1 %
Electricity 19 %
Heat 1 %
Firewood 26 %
Petroleum products 30 %
Source: International Energy Agency (IEA), as of 2006
FIGURE 3
Final Energy Consumption by Sector
Source: International Energy Agency (IEA), as of 2006
Industry 10 %
Chemical ConversionProcesses 8 %
Agriculture/Forestry 2 %
Other Non-Specified 1 %
Transport 24 %
Residental 45 %
Commercial and Public Services 10 %
Source: International Energy Agency (IEA), as of 2006
FIGURE 4
Final Electricity Consumption by Sector
Residental 48 %
Transport 6 %
Industry 12 %
Commercial and Public Services 34 %

Renewable Energies in Central Asia
GEORGIA
COUNTRY INTRODUCTION 41
Natural Resources
Water resourcesWater resources take the first place among the natural riches of Georgia. The total length of Georgia’s rivers is estimated 60,000 km. Around 300 Rivers are significant in terms of energy production. Their technical hydroelectric potential is estimated at 90,000 GWh per year. The total renewable water resources of Georgia are estimated 63.3 km³.13
Oil and GasGeorgia does not have significant oil and gas resources. The country’s eleven oilfields with confirmed reserves of 28 mil-lion tons have yet to be explored. Larger oil reserves are as-sumed to exist. The oil potential of the Black Sea shelf is esti-mated at 70 million to 1.3 billion barrels. Oil extraction and exploration works are conducted by both Georgian and for-eign companies. In 2008, the crude oil production in Georgia totaled 52.800 tons, while the natural gas production totaled 17.000 toe14.
Coal There are no significant coal deposits in Georgia.
Transmission and Distribution System The transmission network in Georgia has been one of the ma-jor weaknesses of the electricity system. Much of the capacity is already utilized, and the construction of the larger planned HPPs (Khodoni and Namakhvani) will require significant investments in new transmission capacity, especially for even-tual exports to the Turkish market.
The backbone of the transmission grid is the 500 kV line connecting the main generation assets in Georgia with the Russian transmission network. The line is partly owned by RAO UES (50 %) and partly by the Georgian state (50 %). The Government also owns the transmission company of Georgian State Electro System (GSE), which is responsible for operating and maintaining the 35–300 kV grid and ensuring that new generation facilities are connected to the grid.
Historically, the losses in the transmission system in Georgia were very high, peaking in 2002 at almost 16 % of to-tal electricity transferred. The reasons for these exceptionally high losses were mismanagement of the system, theft and lack of investment in upgrading the network. Meanwhile, losses have been reduced to less than 2 %, comparable with trans-mission losses in the well-maintained European grid.
There are five distribution companies in Georgia. Two have approximately 1 million customers each: Telasi (respon-sible for Tbilisi and 75 % owned by RAO UES) and United Energy Distribution Company (UEDC; responsible for distri-bution outside Tbilisi and fully owned by Energo Pro). Adjara and Kakheti are smaller distribution companies, both in the process of being integrated into UEDC after being purchased by Energo Pro. There is also a state-owned distribution com-pany in Abkhazia, outside the control of the central Govern-ment in Tbilisi.
The newly created market maker, Energy System Commercial Operator (ESCO), is responsible for ensuring grid stability.
PricesThe January 2006 explosions on a gas pipeline between Rus-sia and Georgia severely strained Russian-Georgian relations. In view of these tensions, Russia increased the natural gas price from 110 to 235 USD per 1,000 m3. Naturally, such an increase in prices would be reflected in consumer tariffs on electricity and gas. The average tariff for electricity is now in the range of 8 US Cent per kWh. In order to create ad-ditional guarantees for social protection and for the promo-tion of rational consumption of electricity, rigid step tariffs were introduced: for the consumption of up to 100 kWh, for 101–300 kWh and for more than 301 kWh15.
The average regulated generation tariff in Georgia is relatively low with approximately 2.8 US Cent/kWh. Genera-tion tariffs, however, fluctuate widely between different power plants. The tariffs for power producers in Georgia are set by the independent regulator of GNERC, which is committed to facilitate private sector investments in the sector. Investors in new HPPs are allowed to negotiate the rate of return on equity with GNERC before committing to a project, which should ensure acceptable returns, especially when CDM credits are factored in. The returns - GNERC is operating with – are without CDM credits.
Power producers have two options when selling their electricity: (i) entering into a direct contract with a customer or (ii) selling the electricity to the ESCO for the price set by GNERC. After amendments to the Electricity Market Rules in June 2007, ESCO guarantees the purchase of all electricity from newly built HPPs. The expected average generation cost for new hydro in the first 7 years of operation would be in the range of 6–8 US Cent/kWh, falling to 2–3 US Cent/kWh after 7 years16.
Import and Export of EnergyGeorgia imports almost all natural gas and oil products con-sumed in the country. However, it provides an important part of the land corridor along which major volumes of Caspian oil and gas are transported in transit to European and Mediter-ranean markets.
Georgia is a net exporter of electricity during sum-mer while it imports electricity in winter. Imports totaled 756 GWh in 2006 as opposed to exports of 140 GWh in the same year17. With new HPPs in the planning stage it is ex-pected that Georgia will become a net exporter of electricity by 2011. The market maker ESCO is responsible for the con-tracting related to electricity export and import.
Growth Predictions for the Energy SectorThe electricity generation demand is forecasted to grow with a 0.6 GDP elasticity ratio. Although the times of double digit GDP growth rates may be over for the years to come, there is no doubt that Georgia will find back on a growth path requir-ing additional generation capacity.
13 INDEXMUNDI (WWW.INDEXMUNDI.COM/GEORGIA/) AS OF 2008
14 GNIA, AS OF 2009
15 TRANSPARENCY INTERNATIONAL, AS OF 2008
16 ECON, AS OF 2007
17 IEA, AS OF 2006

Renewable Energies in Central Asia
GEORGIA
COUNTRY INTRODUCTION 42
The easiest way to enhance generation capacity is the reha-bilitation and upgrading of existing sites. While Georgia has approximately 1,600 MW of hydro power capacity actually generating electricity at the moment, the installed capacity is around 2,700 MW. The rehabilitation and upgrading of HPPs could bring as much as 2,200–2,500 GWh of additional hy-droelectricity online. This is the least costly way to expand generation capacity and is given priority by the Government. Many of these rehabilitations are already underway.
Besides that, the Government is promoting 7 new HPPs with a total generating capacity of approximately 6,000 GWh. Thus, in a few years there will be more than 8,000 GWh of new electricity available with a considerable part of it being excess electricity. There are two possible markets for electricity excess: (i) export markets and (ii) the promotion of Georgia as a location for electricity intensive industry18.
4 POLICY FRAMEWORK FOR RENEWABLE ENERGIES
4.1 NATIONAL STRATEGIES AND PROGRAMS TO SUPPORT RENEWABLE ENERGIES TO SUPPORT RENEWABLE ENERGIES
As mentioned in the last chapter, the development of alterna-tive energy sources (wind, solar and geothermal energy) is an objective of Georgia’s State Energy Policy. This objective is also mentioned in the existing Law on Electricity and Gas19. However, no specific targets were defined for the share of en-ergy to be generated by renewable sources. There were discus-sions about drafting a more specific RE law20 in 2008. After the war from August 2008, however, these initiatives seem to have lost momentum.
The Government of Georgia has approved of a Renew-able Energy 2008 State Program21, which regulates and sup-ports the construction of new RE projects in Georgia with a capacity up to 100 MW. The program is designed to attract foreign investments. The program is largely focusing on the development of small and medium Hydro Power Plants. The Tax Code enacted in 2005 does not provide any tax benefits for the production, use, import and implementation of equip-ment for the production of RE or power saving equipment.
There are a number of relevant international docu-ments for the development of RE sources in Georgia. These include the Energy Charter Treaty22, the Framework Conven-tion on Climate Change and the Kyoto Protocol23, the Energy Community Treaty24, the European Neighborhood Policy25 and others.
For Georgia, who has joined or requested membership to or-ganizations that execute and/or bide by these regulating docu-ments, the implementation of the recommendations and op-portunities given by these documents is both beneficial and in some cases mandatory. In addition to providing technical assistance and guidance, several of these international energy agreements offer financial incentives and project financing op-portunities for Georgia to develop RE projects and undertake energy sector reforms to harmonize its energy legislation with international standards.
International institutions are playing the leading role in development of RE in Georgia up to now. USAID, the United Nations Development Program (UNDP), the German development Bank of KfW, the Global Environment Facil-ity (GEF), EBRD, the Norwegian Government and others are supporting a great number of activities including pilot projects, policy analysis, trainings and more.
SHORT BUSINESS INFOAlthough the development of RE is an objective of Geor-gia’s Energy Policy, there are no specific targets for the share of energy to be produced by RE.
4.2 REGULATIONS, INCENTIVES AND LEGISLATIVE FRAMEWORK CONDITIONS
On 7 June 2007, the Parliament of Georgia adopted the Reso-lution on Main Directions of Georgia’s State Energy Policy, which defines the concept of the state energy policy as well as the ways and means of its implementation. The Resolution is based on the Law of Georgia on Electricity and Gas (adopted in 1997). The main objectives of the policy are:
Full satisfaction of the industrial and communal demand for electricity by maximum utilization of local hydro power resources in the electricity sector
Development of alternative energy sources (wind, solar and geothermal energy)
Diversification of electricity and gas supply sources Inclusion of the country’s energy sector into the regional infrastructure through participation in region-wide export-import operations. For this purpose, existing electricity transmission lines and gas pipelines have to be repaired or new ones must be constructed.
Development of an energy corridor connecting Europe to Asia, which has to encompass West-East (from Caspian to the Black Sea to the European Union) as well as North-South directions
These objectives shall be achieved through the development of a commercially profitable economic model attractive to private investors by means of:
Simplifying licensing and other bureaucratic procedures and creating a favorable business environment for local and foreign companies that are interested in investing in the sector Gradual liberalization and deregulation of the electric-ity market, which ultimately will be reflected in direct
18 ECON, AS OF 2007
19 SEE GEORGIAN LAW ON ELECTRICITY AND NATURAL GAS
(WWW.MINENERGY.GOV.GE/INDEX.PHP?M=205&LANG=ENG), AS OF 1997
20 WELLER, J./ PIERCE ATWOOD LLP, AS OF 2008
21 MINISTRY OF ENERGY OF GEORGIA , AS OF 2008
22 ENERGY CHARTER SECRETARIAT, AS OF 2009
23 UN FRAMEWORK CONVENTION ON CLIMATE CHANGE – UNFCCC
(HTTP://UNFCCC.INT/)
24 EUROPEAN UNION, AS OF 2006
25 EUROPEAN COMMISSION – EC, AS OF 2004

Renewable Energies in Central Asia
GEORGIA
COUNTRY INTRODUCTION 43
contracting between wholesale electricity producers and wholesale buyers
Introduction of new market rules insuring the separation of rights and obligations and responsibilities among actors in the sector26
The Ministry of Energy has achieved remarkable improve-ments with the above policy. Improvements over the last few years include a more regular supply of electricity for most parts of the country, the rehabilitation of Enguri HPP and other HPPs, the rapid reduction in transmission losses and a much improved collection rate for the distribution companies. The development of RE in Georgia is regulated by the follow-ing legal and regulatory documents:
Law on Electricity and Natural Gas Main Directions of State Policy in Georgian Energy Sector Renewable Energy 2008 State Program Law on Use of Natural Resources Law on Forest Use Tax Code Customs Code Electricity Market Rules Gas Market Rules Legal Acts of the Ministry of Energy Legal Acts of GNERC Presidential Decree on Development of Non-traditional Energy Sources in Georgia
It should be noted that the above mentioned legal acts and regulations are not enough to create a sufficiently favorable environment for the development of all RE sources, which creates barriers in attracting investments in this field. Only electricity generation is addressed to some extent by Georgia’s legislation.
There has been a series of changes to the Law on Elec-tricity and Natural Gas as well as in Electricity Market Rules that are directed to creating a favorable environment for small grid-connected plants. Under recent amendments, for exam-ple, small hydroplants can sell all of their output to ESCO at average ESCO tariff.
In general, electricity generation, transmission, dis-patch and distribution without a valid license are forbidden ac-cording to the Law on Electricity and Natural Gas. Exemptions are made for individuals generating electricity for their own consumption and whose generating facility is not connected to the transmission or distribution grids. Moreover, small power plants declared as power plants up to 10 MW do not require a generation license27. The Georgian National Energy Regula-tory Commission (GNERC) has the authority to grant licenses and also regulate activities of licensees, importers, exporters, commercial system operator and suppliers within the electric-ity and natural gas sectors of Georgia. Licensing procedures and rules are regulated by four main documents. These are:
Georgian Law on Electricity and Natural Gas Georgian Law on Licenses and Permits GNERC Resolution #3 on Licensing Rules in Electricity and Natural Gas Sectors from 23 August 1999
GNERC Resolution #12 On Administrative Procedures of the Georgian National Energy Regulatory Commission from 7 August 2003
Clean Development Mechanism (CDM)Georgia ratified the UN climate change agreements in 1994, established a National Climate Protection Program in 1996 and acceded the Kyoto Protocol in 1999. Georgia meets the el-igibility requirements to sell emission reductions from projects in the international carbon market under the Clean Develop-ment Mechanism (CDM). In 2005, the Ministry of Environ-mental Protection and Natural Resources has been appointed as the Designated National Authority for executing the CDM. In the same year, a Coordination Board for the implementa-tion of the CDM was created28.
Georgia has no obligatory quota for reducing green-house gases under the Kyoto Protocol. In fact, after the disin-tegration of the Soviet Union (and the resulting collapse of the region’s energy intensive industries), Georgia’s greenhouse gas emissions were substantially reduced from 46 million tons of CO2 in 1990 to 14 million tons in 199729.
Georgia has considerable potential to develop a large number of CDM projects, especially in the RE and energy efficiency sectors. Georgia will have the possibility to generate tens of millions of dollars in carbon revenue over the next few years by leveraging investments in the energy, waste, forestry and agricultural sectors. Carbon reduction revenue is poten-tially available for projects that:
Increase the efficiency of power generation including the rehabilitation and modernization of existing Hydro Power Plants
Make use of RE technologies Minimize emissions associated with gas transportation and distribution
Decrease losses in power transmission and distribution Increase energy efficiency in the residential sector
On 31 August 2007, the first Emission Reductions Purchase Agreement (ERPA) was signed with participation from the International Bank for Reconstruction and Development, the Community Development Carbon Fund and the Energy Efficiency Centre of Georgia. As of December 2009, there were four CDM projects validated with a total average annual emission reduction of 273,177 tons CO2
30.
26 TRANSPARENCY INTERNATIONAL, AS OF 2007
27 THE LAW ONLY MENTIONS THAT SPP DO NOT REQUIRE A GENERATION LICENSE OR A
LICENSE IN GENERAL. IT IS NOT FURTHER SPECIFIED WHETHER FEEDING
ELECTRICITY INTO A GRID IS SUBJECT TO LICENSING OR NOT FOR SPPS.
28 WORLD EXPERIENCE FOR GEORGIA, AS OF 2008
29 TRANSPARENCY INTERNATIONAL, AS OF 2008
30 IGES, CDM PROJECT DATABASE, AS OF 2009

44
5 POTENTIAL FOR RENEWABLE ENERGIES AND PRESENT USE
Georgia has vast resources of almost all types of RE – solar, wind, geothermal, hydro and biomass. The achievable annual potential of all RE sources is estimated at 15,000 GWh. This is enough energy to meet over a third of Georgia’s annual pri-mary energy needs. Apart from large hydro power, only a very small part of this potential is already developed.
5.1 BIOENERGIES Georgia has a considerable potential of biomass resources. It is conditioned by its geographical position and a favorable cli-mate for growing forests and agricultural products. In some regions, it is even possible to have two yields per year.
Unfortunately, the current use of biomass in Georgia is rather inefficient and unsustainable. Firewood consumption is estimated at 8 million m³ per year, which covers almost 50 % of the population’s energy demand. This consumption is far above sustainable forest development level, which should not exceed 1 million m³ per year. Therefore, the RE potential of forest and forest residues must be set to 1 million m³ of bark energy, amounting to approximately 2,700 GWh.
The total energy potential of corn cultures’ residues amounts to 1,300 GWh/year, i. e. 112,000 toe. The total en-ergy potential of residues from farming and poultry breeding is 6,900 GWh/year.
Residential waste is another type of biomass. 900,000 tons of waste per year accumulate in the Tbilisi and Kutaisi dumps according to municipal data. An estimated 90 million m³ biogas can be obtained by re-treating these residues; this would equal 64 million m³ of natural gas.
Approximately 160 million m³ of biogas can be annu-ally obtained from the sewage water cleaning station of Tbilisi (with a population of 1.2 million). The resulting biogas energy is estimated to be 1,000 GWh/year equaling 100 million m³ of natural gas.
Therefore, the technical potential of the major biomass sources in Georgia amounts to 12,500 GWh. The achievable potential is estimated at 3,000-4,000 GWh. This estimate does not incorporate the potential of farming energy crops. For comparison, one can note that the total annual electricity generation in Georgia is in the range of 8,000 GWh.31
Apart from firewood, which is used for cooking and heating, and a few donor supported biogas initiatives, the bio-fuel potential remains untapped.
5.2 SOLAR ENERGYThe climatic conditions of Georgia are favorable for utilizing solar energy. Most regions of the country have 250–280 days of sunshine per year. Direct and global radiation reaches daily values of 3.5 to 5.3 kW/m² and an annual average of 1,550 kW/m². The potential of solar energy, however, is strongly seasonal and varies by a factor of more than four from mid-summer to mid-winter. The achievable potential of solar energy in Geor-gia is estimated at 60–120 GWh annually.
Renewable Energies in Central Asia
GEORGIA
COUNTRY INTRODUCTION
The conversion coefficient of PV modules is approximately 12–15 % and about 60–95 % for water heating collectors. Based on these estimates, one can calculate that on average about 190 kWh of electric energy can be annually obtained from one m² surface of solar PV panels and 1,200 kWh of thermal energy (hot water) from solar water heating panels.
The use of solar energy in Georgia still low, but during the last decade, solar water heaters became increasingly popu-lar. The cheapest systems provide about 110 l/day of hot water at a temperature of 60 °C. The 180 l/day systems cost approxi-mately 1,800–2,000 USD. For water heating systems, the in-vestment payback period is about 3–9 years; these are most profitable in applications where hot water expense is high and the main load is in summer (swimming pools, hotels).
Although more than 70 % of this potential is realiz-able in the months of April through September, solar power can contribute to reducing energy dependence by almost com-pletely replacing the need for gas currently used for hot water supply throughout the year.
There are a number of specialized private companies doing the installation of solar systems, namely SpecHelioT-bomontaji, Ekoeni, Aido, Solar House etc. Some of them manufacture cheap systems locally. Most of the systems, how-ever, are imported. Currently there are no legal acts or tax benefits supporting the development of solar energy use in Georgia.
5.3 WIND POWERThe potential of wind energy has been analyzed by the Wind Energy Research Center of Karenergo. The analysis was based on existing meteorological data (30 years of synoptic observa-tions) and their own perennial measurements and gives only the intensiveness of the wind and dynamics of seasons on the land area of Georgia. The findings were compiled in the Wind Energy Atlas of Georgia.32 The figure below shows the annual average wind speeds in Georgia. The analysis did not address important parameters for the planning of wind energy projects such as security, environmental protection or civil expediency. Based on the data in the Wind Energy Atlas, the technical potential of wind energy was assessed. The calculations have shown that about 2,000 MW of capacity and 5,000 GWh en-ergy per year can be obtained.
31 WORLD EXPERIENCE FOR GEORGIA, AS OF 2008
32 KARENERGO, AS OF 2004
FIGURE 5
Distribution of Daily Solar Irradiation in kW/m2/day
Source: Sustainable Energy Center – “Sun House”, Tbilisi, Georgia, as of 2009

Renewable Energies in Central Asia
GEORGIA
45
5.4 GEOTHERMAL ENERGYIn Georgia, thermal water has been used for hygienic and balneology purposes for centuries. Its utilization for energy purposes began in 1951. The forecasted reserve of thermal waters comprises 350 to 400 million m³/year corresponding up to 11,630 GWh of thermal energy33. There are more than 250 natural and artificial water channels with average tem-peratures from 30–110 °C. Their overall withdrawal comprises 160,000 m³/day (58 million m³/year). These water channels are grouped in 44 deposits.
More than 80 % of the geothermal deposits are in Western Georgia. In the Zugdidi-Tsaishi geothermal area, there are now 9 productive, 7 re-injection and 3 observation borehole wells which are considered to be exploitable. It is known that there are two independent horizons containing thermal water in the deposits from which it is possible to ob-tain up to 30,000 m³ of thermal water in case of re-injection per day.
The use of geothermal sources is already developed to a considerable extent. As the temperatures of geothermal sources are not very high, they are mostly used for heating and hot water supply. Poti, the main port city in Georgia, could be supplied with geothermal water through the Kvaloni and Menjisi water deposits. In Tbilisi, the output of geothermal water of 4,000 m³ per day is used to supply around 100 resi-dential blocks. The prices are not regulated and determined by the supplier. In other locations the geothermal water is used by the neighboring population in an unorganized way.
There are projects in the planning stage to better uti-lize and expand the use of thermal waters from the existing wells in Zugidi and Tbilisi. The feasibility of these and other projects requires further study in order to determine economi-cally viable options and volumes of geothermal energy utiliza-tion.
In order to promote the use of geothermal energy in other locations it is necessary to implement a number of policy measures including:
Transparent rules for obtaining licenses for geothermal wells
Clear regulations on land use and property rights for wells and pipe routes
Clear definitions on price regulations and subsidies for dif-ferent groups of consumers
Karenergo proposed a number of promising locations for me-dium- and large-scale wind farms in the range of 30–630 MW. Many of these potential wind farm sites show a favorable sea-sonal output pattern with maximum output in winter. This conforms best with seasonal domestic energy demand in Georgia, indicating that wind energy has good potential to offset external energy dependence in winter. There are other local places with high wind potential that are not reflected in the Karenergo report.
Currently, there is no wind energy capacity used in Georgia except for some small units (up to 6 kW each). In 2007, an MOU was signed between the Government of Georgia and the Georgian-American company of Karidani concerning the construction of a 24 MW wind plant in the suburbs of Tbilisi.
Feasibility studies of wind energy utilization in the Kutaisi and Mounteen-Sabueti regions were carried out by Japanese companies (Nichimen Corporation and Tomen Cor-poration) in 1999 and 2000. It was proved that the construc-tion of wind power plants can be cost effective in these regions and will make a significant contribution to the country’s over-all energy balance.
Furthermore, the wind energy research center of Karenergo has developed several business plans for wind farm development in other locations in order to attract potential investors. Despite the positive conclusions made by foreign experts, the aforementioned projects have not been developed for a variety of reasons. The main reasons were:
A wind power utilization tradition does not exist in Geor-gia; therefore, it was difficult to obtain state support
A guarantee of the generated energy purchase does not exist
The electricity tariff was deliberately low in that period
The last two points above have been addressed in the Renewa-ble Energy 2008 State Program. Although implicitly focusing on hydro power, the Program can also be applied to the devel-opment of wind farms up to an installed capacity of 100 MW. Under that Program, investors are offered a guaranteed pur-chasing agreement with ESCO in which the tariff is deter-mined based on negotiation with the investor and GNERC.
COUNTRY INTRODUCTION
33 N. TSERTSVADZE, G. BUACHIDZE, O.VARDIGORELI, AS OF 1998
FIGURE 6
Average Wind Velocities and Directions per Year
Source: Karenergo, as of 2004

46Renewable Energies in Central Asia
GEORGIA
COUNTRY INTRODUCTION
Investors can benefit from the incentives provided through the Renewable Energy 2008 State Program37. Under the program, new Hydro Power Plants up to 100 MW are offered a guaran-teed purchasing agreement with ESCO for the first 10 years of operation in which the tariff can be negotiated between the investor and GNERC. Alternatively, SHPP operators, i. e. HPPs with a capacity up to 10 MW, have the opportunity to sell electricity directly to consumers at tariffs negotiated bilaterally or even to export without the need for an export license. In any case, however, operators have to agree to sup-ply only domestic customers during the three winter months in a year.
The difficulties of SHPPs are caused by several factors listed below:
SHPPs (especially newly built ones) are not competitive with large and medium capacity power plants in the cost of generation.
SHPPs have profound seasonality and dependence on river run-off conditions.
They have an unfavorable annual generation profile, with maximum production in summer when power generation exceeds the consumption demand.
SHPPs have undefined power-wheeling tariffs. Transmission and distribution network connection fees are not defined.
SHORT BUSINESS INFOThe annual potential of RE sources is estimated to be ap-prox. 15,000 GWh, enough to meet over a third of Georgia’s annual primary energy needs.
6 MARKET RISKS AND BARRIERS FOR MARKET ENTRY
6.1 GENERAL SITUATION
CorruptionGeorgia has improved its performance in fighting corruption, but corruption is still perceived as significant. From 2005 to 2009 Georgia has advanced from rank 130 to 66 out of 180 countries in Transparency International‘s Corruption Percep-tions Index38. The World Bank‘s Anti-Corruption in Transi-tion 3 Report places Georgia among the countries showing the most dramatic improvement in the struggle against cor-ruption. The government has fired thousands of civil servants and police, and several high-level officials have been prosecut-ed for corruption-related offences39.
Availability of Local Know-howLike all former Soviet republics, Georgia has a good educa-tional system producing well-qualified specialists in a broad spectrum of subjects. More than 60 % of the workforce have completed a secondary education and 30 % have completed a tertiary education40.
5.5 HYDRO POWERIn Georgia there are 360 rivers with considerable energy po-tential. The total theoretical hydroenergy potential is in the range of 150,000 GWh per year. The technically available potential has been estimated at 81–90,000 GWh per year in-cluding the total hydroenergy potential of small Hydro Power Plants (SHPP) of 40,000 GWh/year and their technical po-tential estimated at 19,500 GWh per year. Although hydro power contributes more than 70 % to the country’s electric-ity production, only about 15 % of the technical potential has been developed so far.
The development of a small hydroelectric generation industry in Georgia started in the late 1920s. Over 300 SHPPs, most of them run-of-river schemes, were constructed until 1970 with capacities ranging from 20 kW to 10 MW. In the 1960s, Georgia was integrated in the central grid delivering power to all Soviet Republics whereupon small and less efficient SHPPs were displaced by large-scale Hydro Power Plants and thermal power plants. Only those SHPPs operating in remote locations with no grid access were kept operating. The others were taken out of operation and abandoned. At present, only 15 % of all SHPPs of the Soviet era are still operating.
Following Georgia’s independence in 1991, the priva-tization process of state-owned assets began. Many surviving SHPPs were transferred from state ownership to the private sec-tor. The USAID sponsored Rural Energy Program is support-ing the rehabilitation of existing SHPP in Georgia34.
Besides tendering a number of new large HPPs35, the Ministry of Energy pursues another initiative for the develop-ment of new small and medium Hydro Power Plants directed at foreign investors. On its official website, the Ministry of En-ergy has published a list of 91 potential small hydro power sites with a prospective capacity ranging from 0.6 MW to 99 MW. Most of these HPPs are expected to be run-of-the-river facili-ties. Investors interested in investing in Greenfield HPPs from the list have the possibility to download additional information for each location ranging from situation maps, topographical maps, technical data, economic calculations etc36.
34 USAID/ WINROCK INTERNATIONAL, AS OF 2006
35 ANNEX 3 PROVIDES A LIST OF THE NEW LARGE HPPS.
36 MINISTRY OF ENERGY OF GEORGIA, AS OF 2009
37 MINISTRY OF ENERGY OF GEORGIA, STATE PROGRAM RENEWABLE ENERGY,
AS OF 2008
38 SEE WEBSITE OF TRANSPARENCY INTERNATIONAL AT WWW.TRANSPARENCY.ORG
39 HERITAGE FOUNDATION, AS OF 2009
40 WORLD BANK, AS OF 2009
TABLE 2
Existing Geothermal Installations in 2005
Source: International Geothermal Association, as of 2009
GEOTHERMAL INSTALLE CAPACITY DIRECT IN
District 37 29
Greenhouse 165 1,17
Fish pond 25 13
Acricultrural 4 3
Industrial 7 5
Bathing 9 6
total 249 1,75

Renewable Energies in Central Asia
GEORGIA
COUNTRY INTRODUCTION 47
Although the changes to the law on electricity and natural gas provide incentives to new RE plants, there is still a need for further conceptual and technical improvements to make these provisions fully effective and beneficial.
The few existing provisions in legislation in support of RE development need to be expanded and supplemented by adequate implementation mechanisms such as special leg-islation, supplementary regulatory documents, tax incentives, implementation agencies and information campaigns. The initiatives for RE development should be coordinated under a state strategy, plan for energy sector development and be based on sound market principles and transparency.
6.3 INTELLECTUAL PROPERTY RIGHTSJudicial corruption is still a problem despite substantial im-provement in efficiency and fairness in the courts. Both for-eigners and Georgians continue to doubt the judicial system‘s ability to protect private property and contracts. The enforce-ment of laws protecting intellectual property rights is weak.
6.4 TAXATIONGeorgia has a moderate Income Tax and a low Corporate Tax. The top Income Tax rate is a flat 25 %, and the corporate tax rate is 15 % as compared to 20 % as of January 2008. Other taxes include a Value Added Tax (VAT), a Tax on Interest and a Tax on Dividends. In the most recent year, the overall tax revenue was 21.7 percent of the GDP.
7 RENEWABLE ENERGY BUSINESS INFORMATION AND CONTACTS
Ministry of Energy of GeorgiaBaratashvili 2, 0105 Tbilisi Phone: (+995 32) 35 78 00Fax: (+995 32) 35 78 00/28E-mail: [email protected] Department of International Relations and Investment ProjectsPhone: (+995 32) 35-78-25Website: www.minenergy.gov.ge
The Ministry of Energy provides information about possible investment projects for foreign investors and related legal re-quirements and supporting programs.
GNERC – Georgian National Energy Regulatory Commission Al. Kazbegi Ave No.45, 0177 TbilisiPhone: (+995 32) 31 10 43Fax: (+995 32) 24 10 40. E-mail: [email protected]: www.gnerc.org
Local know-how in the field of RE is available at numerous local organizations. There is also a multitude of international organizations pursuing projects in various fields of RE devel-opment in Georgia.
Local AcceptanceA considerable number of pilot projects in the field of RE were implemented in recent years. There were no reports that cer-tain technologies were not accepted for social reasons. If tech-nologies failed, the reasons were mostly related to technical and maintenance issues.
6.2 BUSINESS DEVELOPMENTSince the Rose Revolution in 2004, Georgia has made enor-mous progress toward improving the business climate. In 2006, the World Bank ranked Georgia as the number one eco-nomic reformer in the world because within one year it has improved from rank 112 to 18 in terms of ease of doing busi-ness. By 2010, Georgia will have advanced even further and will rank at 11 ahead of industrialized countries as Japan (15), Sweden (18), Switzerland (21) and Germany (25)41.
The overall freedom to conduct a business is relatively well-protected under Georgia‘s regulatory environment. Start-ing a business takes an average of three days, as compared to the world average of 38 days. Obtaining a business license requires less than the world average of 18 procedures and 225 days. Closing a business is relatively simple.
Foreign and domestic investments receive equal treat-ment. Exceptions may be made for investments in certain sectors. Foreign firms may participate freely in privatizations, though transparency has been an issue. Residents and non-residents may hold foreign exchange accounts. There are lim-its and tests for international payments and current transfers. Capital transactions are not restricted, but must be registered. Foreign individuals and companies may buy non-agricultural land. Only domestic entities may buy agricultural land, but agricultural land can be purchased by forming a Georgian corporation that may be up to 100 % foreign-owned.
There are a number of barriers (listed below) that need to be addressed by the Georgian Government in order to allow a more rapid development of RE sources:
The market for renewable electricity needs to be developed. Although Georgia does not produce enough energy to satisfy domestic demand, there is an excess of electricity from hydroplants in summer; thus there is no internal need for additional electricity from wind farms or SHPPs on the grid during this season.
A sound and reliable legal framework for RE development needs to be formulated. Otherwise the frequency and qual-ity of legislation changes may have a discouraging effect on investment decisions.
Information on the benefit developers and local com-munities can derive from RE development and utilization should be made widely available.
The fees and rules for grid connection, power wheeling tariffs, long term tariff methodology and other regulatory documents need to be developed.
41 WORLD BANK GROUP/ IFC, AS OF 2009
Renewable Energies in Central Asia
GEORGIA
COUNTRY INTRODUCTION 48
Institute of Water Management and Engineering EcologyChavchavadze 60, TbilisiPhone: (+995 32) 224094
Solar Water Heating System Providers
Sustainable Energy Center - Sun House 0159, Tbilisi, GeorgiaPhone: (+995 32) 516 804Phone/Fax: (+995 32) 525 969E.Mail: [email protected]: www.sun.org.ge
Specheliotbomontaji JSC Kvemo Alekseevka, Navtis [email protected] Phone: (+995 99) 452 210
AYDIO Agmashenebeli Alley 10 km, 0131 TbilisiPhone: (+995 32) 516 416
GNERC has the authority to set tariffs grant licenses for elec-tricity generation, transmission and distribution.
ESCO – Electricity System Commercial OperatorAl. Kazbegi Ave No.45, 0177 TbilisiPhone: (+995 32) 31 14 70/31 14 71Fax: (+995 32) 31-17-49E-mail: [email protected]: www.esco.ge
ESCO provides power purchase agreements (PPA) with oper-ators of power plants and purchasing guarantees for investors in new power plants smaller than 100 MW.
Georgian Chamber of Commerce and IndustryBerdznis Str. 29, TbilisiPhone: (+995 32) 72 07 10Fax: (+995 32) 72 31 90E.Mail: [email protected]: http://gcci.ge/
ABCO Georgia – Business ConsultingHead Office: 7, Kipshidze Str., Tbilisi 0162, GeorgiaPhone: +(995 32) 250085; 999077Fax: +(995 32) 933539E.Mail: [email protected]: www.abco.caucasus.net
RENEWABLE ENERGY: RELEVANT INSTITUTIONS
Energy Efficiency Centre (EEC) 19, D.Gamrekeli Str. VI floor, 0160 TbilisiPhone: (+995 32) 242540; 242541Fax: (+995 32) 242542E-Mail: [email protected]: www.eecgeo.org/
Caucasus Environmental NGO Network (CENN)27, Betlemi Str., 0105 TbilisiPhone: (+995 32) 75 19 03; 75 19 04; 75 19 06Fax: (+995 32) 75 19 05E-Mail: [email protected]: www.cenn.org
Karenergo Scientific Wind Energy CenterTsereteli Ave. 63-2-57, TbilisiPhone: (+995 32) 35 15 51, 899 50 93 93; Fax: (+995 32) 35 15 51E-Mail: [email protected]: www.gol.ge
Geothermia Ltd. – Geothermal ConsultingPhaliashvili Str. 87/3, TbilisiPhone: (+995 32) 525499Fax: (+995 32) 001153

Renewable Energies in Central Asia
GEORGIA
49
8 BIBLIOGRAPHY
Bodewig, K. (2007): Economic and Political Transi-tion in Georgia, NATO 2007 Annual Session Report 170 ESCEW 07 E rev 2 (www.nato-pa.int/default.Asp?SHORTCUT=1171)
G. Tsertsvadze, N. Buachidze, O. Vardigoreli (1998): Thermal Waters of Georgia, Tbilisi
Central Intelligence Agency – CIA (2009): The World Fact Book – Uzbekistan
ECON (2007): The Electricity Sector in Georgia – A Risk Assessment
Energy Charter Secretariat (2009): 1994 Energy Charter Treaty (www.encharter.org/index.php?id=28&L=0.)
European Commission (2004): European Neighbourhood Policy (http://ec.europa.eu/world/enp/documents_en.htm)
European Union (2006): The Energy Community Treaty. Official Journal of the European Union L 198/32, 20.7.2006 (http://eur-lex.europa.eu/LexUriServ/site/en/oj/2006/l_198/l_19820060720en00180037.pdf)
Heritage Foundation (2009): Index of Economic Freedom – Georgia
Georgian National Investment Agency – GNIA (2009): Invest in Georgia (www.investingeorgia.org)
Institute for Global Environmental Strategies – IGES (2009): IGES CDM Project Database (www.iges.or.jp/en/cdm/report_cdm.html)
IndexMundi (2008): Georgia (www.indexmundi.com/georgia)
International Energy Agency – IEA (2006): Statistics by Countries
International Monetary Fund – IMF (2009): Caucasus, Central Asia Feel Crisis Impact, but Set for Modest Up-turn, IMF Survey online (www.imf.org)
Karenergo (2004): Wind Energy Atlas of Georgia, Volume 1, Regional Estimations (http://minenergy.gov.ge/index.php?m=377)
Ministry of Energy Georgia (2009): various documents and data on Georgia’s energy sector and policy pub-lished on the Ministry’s website (www.minenergy.gov.ge/?lang=eng)
Ministry of Energy of Georgia (2009): Potential Hydro Power Sites in Georgia. Interactive Map (http://hpp.minenergy.gov.ge/)
Ministry of Energy of Georgia (2008): State Program Renewable Energy 2008 (www.georgia.gov.ge/pdf/2009_03_27_22_25_33_1.pdf)
The President of Georgia/E. Shevardnadze (1997): Geor-gian Law on Electricity and Natural Gas, (www.minen-ergy.gov.ge/index.php?m=205&lang=eng), Tbilisi
Transparency International Georgia/BP Georgia (2008): The Energy Sector and Georgia‘s Functions as a Transit State after the Russian-Georgian Armed Conflict in August 2008 (www.transparency.ge)
Transparency International Georgia/BP Georgia (2008): National Policy of Georgia on Developing Renewable Energy Sources (www.transparency.ge)
Transparency International Georgia/BP Georgia (2008): Georgia’s State Policy of Georgia on the Effective Utiliza-tion and Preservation of Energy (www.transparency.ge)
Transparency International (2008): State Policies of Georgia in the Energy Sector: Tariffs on Electricity and Gas (www.transparency.ge)
Transparency International Georgia/BP Georgia (2008d): Georgia’s State Policy in the Electricity Sector, Brief History and Ongoing Processes (www.transparency.ge)
Transparency International (2007): Georgia’s Energy Policy, Overview of Main Directions, (www.transparency.ge)
Transparency International (2007): Georgia’s Power Sector: Energy Crossroads in Uncertain Transition (www.transparency.ge)
USAID/ Winrock International (2006): Rural Energy Programme Georgia (http://winrock.ge)
Weller, J., Pierce Atwood LLP (2008): Draft Renewable Energy Law for Georgia, (http://winrock.ge/files/inga_ outline_of_re_law.ppt), Batumi
World Bank (2008): World Development Indicators 2008 – Composition of GDP (www.worldbank.org)
World Bank Group/ International Finance Corpora-tion – IFC (2008/2009): Doing Business. Georgia (www.doingbusiness.org/ExploreEconoMIEs/?economyid=74)
World Bank (2009): Education at a Glance: Georgia World Bank Group/ International Finance Corporation – IFC (2009): Doing Business. Economy Rankings (www.doingbusiness.org/economyrankings/)
World Experience for Georgia (2008): Energy Efficient Potential in Georgia and Policy Options for Its Utilization (http://weg.ge)
World Experience for Georgia (2008): Renewable Energy Potential in Georgia and the Policy Options for Its Utiliza-tion (http://weg.ge)
Websites Ministry of Energy of Georgia (www.minenergy.gov.ge/?lang=eng)
International Geothermal Association (www.geothermal-energy.org)
Transparency International (www.transparency.org) UN Framework Convention on Climate Change – UNFCCC ( http://unfccc.int/)
Sustainable Energy Center – “Sun House” – Tbilisi, Georgia (www.sun.org.ge/)
REFERENCES

Renewable Energies in Central Asia
GEORGIA
5050ANNEX
9 ANNEX
ANNEX 1
TABLE 3
Key Economic Indicators of Georgia 2002–2006
Source: ADB, as of 2006/2007
INDICATOR 2002 2003 2004 2005 2006
A) Income and Growth
1. GNI per Capita (Atlas method, currend USD) 730 860 1,050 1,300 1,590
2. GDP Growth (%) 5.5 11.1 5.9 9.6 9.4
B) Saving and Investment (current and market prices, % of GDP)
1. Gross Capital Formation 25.5 27.7 28.3 28.6 28.0
2. Gross National Saving 19.3 18.3 21.5 17.8 13.0
C) Money and Inflation (annual change)
1. Consumer Price Index (average annual % change) 5.6 4.8 5.7 8.2 9.0
2. Reserve 9.9 13.9 44.3 19.7 19.2
3. Broad Money (M3) 18 22.7 42.6 26.4 39.3
D) Government (% of GDP)
1. Revenue (including grants) 16.7 16.2 22.0 23.4 26.7
2. Expenditure and Onlending 17.8 17.5 19.7 25.0 28.7
3. Overall Fiscall Balance (cash basis) (1.0) (1.6) (0.3) (2.5) (2.2)
E) Balance of Payments
1. Merchandise Trade Balance (% of GDP) (14.4) (16.0) (17.7) (18.9) (26.0)
2. Current Account Balance (% of GDP) (6.2) (9.4) (6.7) (10.8) (14.9)
3. Merchandise Exports (USD) Growth, annual % change 9.0 37.4 37.9 32.8 11.5
4. Merchandise Imports (USD) Growth, annual % change 2.0 33.1 39.2 32.5 38.7
F) External Payments Indicators
1. Official reserve assets (USD million) in months of current year‘s imports of goods
202 196 387 479 939
2. External public and publicly guaranteed debt 23.4 12.6 11.6 7.2 6.7
3. External public and publicity guaranteed debt 53.3 46.4
G) Memorandum
1. GDP (GEL million) 7,456 8,564 9,824 11,621 13,784
2. Exchange Rate (end of period) 2.09 2.075 1.825 1.725 1.7135
3. Population (million) 4.6 4.6 4.5 4.5 4.5

Renewable Energies in Central Asia
GEORGIA
5151ANNEX
TABLE 4
Installed electricity capacity in Georgia 2006
Source: ECON, as of 2007
TITEL MW OWNERSHIP
Ltd Engurhesi 1300 State owned
JSC Tbilsresi TPP* 950 State owned (phase out 2011)
AES Mtkvari TPP* 600 Private (RAO UES)
Ltd Vardnilhesi Cascade 340 State owned (located in Abhasia)
JSC Khrami-1+2 227 State owned (managed by RAO UES)
JSC Vartsikhehesi 184 State owned
Energy Invest CCGT TPP* 150 Private
LTD Zhinvalhesi 130 In the process of being privatised
JSC Lajanurhesi 112 Private (Energo Pro)
JSC Dzevrulahesi 80 Private (Energo Pro)
JSC Gumathesi 67 Private (Energo Pro)
Ltd Rionhesi 48 Private (Energo Pro)
JSC Shaorhesi 38 Private (Energo Pro)
Ltd Zahesi 37 Private
Ltd Khadori 24 Private
Ltd Chitakhevihesi 21 Private
JSC Tboelektrocentrali 18 Private
Ltd Ortachalahesi 18 State owned (under privatisation)
Ltd Atshesi 16 Private (Energo Pro)
Ltd Satskhenhesi 14 Private
JSC Tetrikhevihesi 14 State owned
Ltd Bzhuzhahesi 12 Private
Other HPPs 70 Mostly private
Total 4470
ANNEX 2
TABLE 5
Annual Average Electricity Generation by Source in Georgia 2000–2006
Source: ECON, as of 2007
ELECTRICITY PRODUCERS AVERAGE TWH 2000-6 IN % OF TOTAL
Enguri HPP 2,57 31,44 %
Imports 1,15 14,03 %
A-E-S Mtkvary TPP 0,72 8,80 %
Varcixe HPP 0,66 8,13 %
Varduil HPP 0,4 4,83 %
Tbilsresi TPP 0,34 4,14 %
Jinvali HPP 0,33 4,02 %
Rioni HPP 0,3 3,73 %
Xrami-2 HPP 0,2 2,46 %
Gumati HPP 0,19 2,35 %
Xrami-1 HPP 0,18 2,17 %
Lajanuri HPP 0,16 1,90 %
Dzevrul HPP 0,13 1,64 %
Shaori HPP 0,1 1,26 %
Energy Invest TPP 0,04 0,55 %
Other HPPs 0,7 8,55 %
Total average 8,18 100 %

Renewable Energies in Central Asia
GEORGIA
5252ANNEX
TABLE 6
Potential of Small and Medium Hydro Power Projects in Georgia
NAME OF HPP RIVER INSTALLED CAPACITY (MW)
AVERAGE ANNUAL OUTPUT (GWH)
INVESTMENT COST (MIN USD)
Abuli Paravani 12.5 81.8 21.9
Alpana (Sairme) Rioni 73 398.9 131.4
Arakali Paravani 10.8 63.1 19.4
Avani Avanis khevi 4.6 18.6 7.8
Bakhvi 1 Bakhvistsqali 19.4 87.3 34.9
Bakhvi 2 Bakhvistsqali 24 139 36
Bakhvi 3 Bakhvistsqali 7 44.3 12.6
Boriti Dumala 6.4 33.8 10.9
Chelti 1 Chelti 4.8 25 8.2
Chelti 2 Chelti 4.8 25.09 8.2
Cheshura Cheshura 7.5 32.4 11.3
Tskhimra Tekhuri 29 159.6 52.5
Dariali Tergi 99 542.4 178.2
Duruji Duruji 1.7 10.7 2.96
Erjia Tekhuri 24.4 136.6 41.5
Poka Paravani 0.6 3.1 1
Stori Stori 11.8 56.8 20
Stori 3 Stori 13.7 60.6 24.7
Gubazeuli 6 Gubazeuli 7.8 38.3 8.3
Iori Iori 9.7 54 19.4
Jejora Jejora 15.8 86.6 28.4
Jonouli Jonouli 13 66.5 22.8
Jria Qvirila 9.2 53.1 18.4
Lebarde 1 Lebarde 4.6 19.8 9.1
Lebarde 2 Tekhuri 4.2 17.5 8.3
Lekarde Magana 20 107 36
Lesulukhe Tsachkuru 5.7 24.9 11.4
Lecheka Tekhuri 18.8 118.7 33.8
Magana Magana 20.6 106.38 37.1
Marelisi Bjholiskhevi 4.6 19.7 7.8
Medani Chanistqali 4.4 22.9 8.8
Merisi Akavreta 11.5 56.7 20.1
Nakra Nakra 29.2 162.5 52.5
Nakra 1 Nakra 19.6 102.6 34.3
Nenskra 1 Nenskra 22.4 116.4 38.1
Nenskra 2 Nenskra 24.4 125.1 41.5
Nenskra 3 Nenskra 24.4 122.9 41.5
Nenskra 4 Nenskra 46.2 234.1 78.5
Nenskra 5 Nenskra 29.6 149.4 50.3
Ninotsminda Paravani 8.2 47.1 14.8
Nobulevi Tekhuri 18.5 107.4 33.3
Ksani 1 Ksani 4 14.9 6.8
Ksani 2 Ksani 2.8 10.5 4.8
Ksani 3 Ksani 3.2 11.1 5.4
Ksani 4 Ksani 3.6 12.2 6.1
Ksani 5 Ksani 8.5 30.8 14.4
ANNEX 3
Samquirstsqali 1 Samquirstsqali 12.4 70.6 21.7
Samquirstsqali 2 Samquirstsqali 22.2 123.1 39.9
Sakhvlari Shavitsqali 5.3 23.2 9
Somitso Jejora 24.3 144.3 43.7
Stori 1 Stori 14 69.4 25.2
Stori 2 Stori 11.4 50.5 20.5
Skhalta Skhalta 5.3 29 10.6
Tazara Shavitqali 6 26.2 10.2
Tergi Tergi 14.6 65.3 26.3
Tekhuri 1 Tekuri 3.5 10 5.3
Tekhuri 2 Tekuri 3.5 10 5.3
Tekhuri 3 Tekuri 3.5 10 5.3
Tekhuri 4 Tekuri 3.5 10 5.3
Tekhuri 5 Tekuri 3.5 10 5.3
Tekhuri 6 Tekuri 3.5 10 5.3
Uraveli Uraveli 5 19.2 8.5
Tsablari 1 Tsablaristsqali 7.7 43.2 11.6
Tsablari 2 Tsablaristsqali 12 65.7 20.4
Chala Qvirila 9.1 45.6 18.3
Khala Chakvistsquali 13 92.4 22.8
Khan-Tsablari 3 Khans Tsablaris 9.4 58 15
Khani 7 Khanistsqali 7.3 46.1 12.1
Kheledula 1 Kheledula 18.8 94.3 33.8
Kheledula 2 Kheledula 21.6 102.8 38.9
Kheledula 3 Kheledula 44.3 229.4 79.7
Khobi Khobistsqali 50 246.9 90
Khobi Khobistsqali 25 132.8 45
Khobi Khobistsqali 11.1 59.4 20
Khumpreri Khumpreri 16.4 66.5 28.7
Khunevi Dzirula 11.3 61.6 19.8
Qvirila 3 Qvirilstsqali 5.2 20.5 8.8
Zestaponi 1 Qvirila 10.6 43.7 21.2
Zestaponi 2 Qvirila 10.6 43.7 25.4
Zestaponi 3 Qvirila 15.9 59.2 39.8
Zestaponi 4 Qvirila 15.9 59.2 39.8
Bakhvi 4 Bakhvistsqali 1.2 6.9 2
Bakhvi 5 Bakhvistsqali 2 10.9 3.4
Dzegvi Mtkvari 1.7 82.4 26.7
Truso Tergi 8.7 40.9 14.8
Kobi Tergi 11 45.4 18.7
Chkheri Chkheri 14.6 64.6 26.3
Amali Amali 14 66.8 23.8
Khdistqali Khdistsqali 9.3 41.1 15.8
Juta Juta 8.2 40.8 14
Tsodo Juta 72 383.7 129.6
Source: Ministry of Energy of Georgia, viewed in 2009 (The related database is accessible via the website of the Ministry of Energy of Georgia (http://hpp.minenergy.gov.ge/))

Renewable Energies in Central Asia
GEORGIA
5353ANNEX
TABLE 7
Potential of Large Hydro Power Projects in Georgia
Source: Ministry of Energy of Georgia, viewed in 2009
HPP PROJECT RIVER NAME PROJECTED INST. CAPACITY (MW)
1 Khudoni Enguri 700
2 Namakhvani-Namakhvani Rioni 250
3 Namakhvani-Zhoneti Rioni 100
4 Namakhvani-Tvishi Rioni 100
5 Oni Cascade Rioni 276
FIGURE 7
Seasonal Output of Wind Power Stations
Source: Ministry of Energy of Georgia, viewed in 2009
Paravani
Chorokhi
GWh
10,00
20,00
30,00
40,00
50,00
60,00
70,00
01 2 3 4 5 6 7 8 9 10 11 12
month
TABLE 8
Most Promising Sites for Wind Power Stations
Source: USAID/Ministry of Energy of Georgia, viewed in 2009
LOCATION CAPACITY (MW) ANNUAL ENERGY (BILLION KWH)
Poti 90 0,21
Chorokhi 90 0,24
Kutaisi 150 0,34
Tskhratskaro 100 0,26
Gori-Kaspi 200 0,48
Paravani 120 0,29
Rustavi 60 0,15
Djvari 30 0,075
Goderdzi 60 0,17
Likhi 630 2
Mukhrani 90 0,2
Tbilsi 150 0,35
ANNEX 4

Renewable Energies in Central Asia 54
COUNTRY CHAPTER:
REPUBLIC OF KAZAKHSTAN Authors and Coordination ofCountry ChapterDr. Ing. Klaus JordeEntec Consulting & Engineering AGSt. Gallen, Switzerlandwww.entec.ch
Axel Biegert (Dipl. Economist & Pol.) INTEGRATION UMWelt & Energie GmbHGraefenberg, Germany www.integration.org
With contributions by Gulnar Daniyarova (MSc. Econ. & Management)
Editor Deutsche Gesellschaft für Technische Zusammenarbeit (GTZ) GmbHDepartment Water, Energy, TransportDag-Hammarskjöld-Weg 1-565760 Eschborn, Germanywww.gtz.de
On behalf of Federal Ministry for Economic Cooperation and Development (BMZ)
Editorial staffDiana KraftTel: +49 (0)6196 79 4101Fax: +49 (0)6196 79 80 4101Email: [email protected]

Renewable Energies in Central Asia
KAZAKHSTAN
55CONTENTS
ACRONYMS, ABBREVIATIONS AND MEASUREMENTS 56
1 SUMMARY 57
2 COUNTRY INTRODUCTION 58 2.1 Geography and Climatic Conditions 58 2.2 Political and Economic Development 58
3 ENERGY MARKET OF KAZAKHSTAN 60 3.1 Important Players of the Kazakh Energy Market 60 3.2 Primary Energy Consumption, Transmission and Prices 60
4 POLICY FRAMEWORK FOR RENEWABLE ENERGIES 62 4.1 National Strategies and Programs to support Renewable Energies 62 4.2 Regulations, Incentives and Legislative Framework Conditions 62
5 POTENTIAL FOR RENEWABLE ENERGIES AND PRESENT USE 63 5.1 Bioenergies 64 5.2 Solar Energy 64 5.3 Wind Power 64 5.4 Geothermal Energy 65 5.5 Hydro Power 65
6 MARKET RISK ANALYSIS AND BARRIERS FOR MARKET ENTRY 66 6.1 General Situation 66 6.2 Business Development 67
7 RENEWABLE ENERGY BUSINESS INFORMATION AND CONTACTS 68
8 BIBLIOGRAPHY 69
9 ANNEX 70
CONTENTS

Renewable Energies in Central Asia
KAZAKHSTAN
56
ACRONYMS AND ABBREVIATIONS REPUBLIC OF KAZAKHSTAN
ADB Asian Development Bank
CDM Clean Development Mechanism
CIS Commonwealth of Independent States
GDP Gross Domestic Product
GEF Global Environmental Facility
GoK Government of Kazakhstan
EBRD European Bank of Reconstruction and Development
F.O.B. Free On Board
HPP Hydro Power Plant
IC Interagency Commission
ICWC Interstate Commission for Water Coordination
JSC Joint Stock Company
KEGOC Kazakhstan Electricity Grid Operating Company
MEMR Ministry of Energy and Mineral Resources
MDG Millennium Development Goals
NATO North Atlantic Treaty Organisation
OSCE Organization for Security and Cooperation in Europe
RE Renewable Energy
RERC Renewable Energy Resource Centre
SGP Small Grants Program
UN United Nations
UNDP United Nations Development Program
USD United States Dollars
USc United States Cent
USSR Union of Soviet Socialist Republics
VAT Value Added Tax
MEASUREMENTS
°C degree Celsius
GWh gigawatt hour (1 GWh = 1,000,000 kWh)
kJ kilojoule (1 kJ = 1,000 joules)
km kilometer
ktoe kilotons oil equivalent (1 ktoe = 11,630,000 kWh)
kV kV
m/s meters per second
m2 square meter
m3 cubic meter
MW megawatt (1 MW = 1,000 kW)
Toe tons of oil equivalent
TWh terawatt hour (1 TWh = 1,000,000,000 kWh)
ACRONYMS, ABBREVIATIONS AND MEASUREMENTS

Renewable Energies in Central Asia
KAZAKHSTAN
57
1 SUMMARY
The Republic of Kazakhstan has enormous resources in fossil fuels, mainly gas and oil. These resources are also utilized to generate almost 90 % of the electricity. Additionally, a small number of Hydro Power Plants are in operation. As a conse-quence of the abundance of domestic fossil resources and the centralized energy sector in the former Soviet Union, other sources of energy, also available in large quantities, have not been developed. Only recently has the Government started to initialize the utilization of Renewable Energy (RE) resources, namely considerable potentials of hydro power (large and small), wind and solar energy.
The legal situation in Kazakhstan favors private com-panies, including foreign investors, to invest into the energy sector. Therefore the oil & gas sector has attracted vast invest-ments from abroad. Dealing with local agencies and authori-ties regarding licenses, permits and taxes, however, can be-come very difficult. Foreign investors therefore usually have to team up with Kazakh partners and employ a large number of local accountants and attorneys to deal with administrative, regulatory and tax issues.
The result of this situation is that there are only very small pilot projects in the RE field so far, which are handled by large donor organizations in collaboration with the Gov-ernment or by large international investors. Based on its natu-ral potentials, Kazakhstan could become a highly attractive region for RE in the future.
SUMMARY

Renewable Energies in Central Asia
KAZAKHSTAN
COUNTRY INTRODUCTION 58
2 COUNTRY INTRODUCTION
Kazakhstan declared itself independent in December 1991 as the last of all Soviet republics. It is the ninth largest country in the world and is until today ruled by its Soviet era communist leader. Kazakhstan is considered to be the dominant state in Central Asia and is a member of many international organiza-tions including the United Nations, NATO‘s Partnership for Peace, the Commonwealth of Independent States and the Or-ganization for Security and Cooperation in Europe (OSCE).
2.1 GEOGRAPHY AND CLIMATIC CONDITIONSThe Republic of Kazakhstan is located at the border of two continents, Europe and Asia, at longitude 45–87° East and latitude 40–55° North. Kazakhstan stretches from the Cas-pian Sea and the Volga plains in the West to the Altai Moun-tains in the East and from the foothills of the Tien Shan in the South and South East to the West Siberian lowland in the North. The length of the territory from East to West is more than 3,000 kilometers and from North to South around 1,700 kilometers.
The capital of Kazakhstan is Astana. Kazakhstan is administratively divided into 14 regions with 2 major cit-ies – Almaty (formerly Alma Ata) and Astana – which have a special status due to their national significance, and the ter-ritory of Baikonur, which is the location of the Space Launch Center that is leased by the Russian Federation.
There are different types of landscapes in Kazakhstan. Forest/steppe and steppe land comprise 10 % of the territory, semi-desert and desert land about 60 % and highland about 5 %. All agricultural lands are characterized by low precipi-tation, ranging from 15 to 320 mm. There are major inland waterways in Kazakhstan, the biggest being the Caspian Sea, the Aral Sea and Lake Balkhash. The percentage of land and water is 98 % to 2 %. The climate is primarily continental. The average elevation is about 200 m, the highest point is Mount Khan Tengry (7,010 m), the lowest Vpadina Karagiye (132 m).
2.2 POLITICAL AND ECONOMIC DEVELOPMENTThe Republic of Kazakhstan is a unitary state with a presiden-tial form of governance. Nursultan Nazarbayev has been the President of the Republic of Kazakhstan since 1991 and the chairman of the Supreme Soviet since 1990. The bicameral Parliament consists of the Senate (47 seats of six-year terms) and the Mazhilis (107 seats of five-year terms). While Kazakh is the state official language, Russian is the language for inter-national communication.
The Gross Domestic Product (GDP) until 2008 was around 141 billion USD or 9,075 USD per capita. The in-dustry share is 29 % of the GDP. The annual growth of the GDP was about 8–9 %. There was, however, a sharp decrease following the economic crisis in 2008. More information can be found in the Annex.
Kazakhstan is one of the ten largest countries in the world. The country has the largest resources of uranium and lead in the world, the second largest resources of zinc and chromate ores, the fourth largest resources of copper and the seventh of gold. Moreover, it counts among the countries with the largest resources of coal, manganese, tungsten, molybde-num, gold, phosphorites and iron.
Kazakhstan owns about 0.5 % of the world’s mineral energy resources, equaling 90 billion tons of oil equivalent (toe). This number includes 70 % coal, 22 % oil and oil con-densate and 8 % gas. Since 2000, stable growth in production and consumption of coal, oil and gas has been observed.
The other important economic sector is agriculture. Kazakhstan has 220 million hectares of agricultural land, in-cluding 24 million hectares of arable land (10.8 %); 5 million hectares of haying land (2.2 %) and 189 million hectares of pasturable land (85.0 %). Kazakhstan is among the top ten world exporters of grain and flour. Cotton export comprises 15 % and leather and wool export 25 % of the total agricul-tural export. Oil and grain are the most important products to export from the country.
Kazakhstan is one of the most sparsely populated countries in the world with a density of 5.7 people per square kilometer. The population living in urban areas comprises 52.6 %. With regard to inequality, UNDP’s Human Devel-opment Report 2006 has ranked Kazakhstan 79 out of 177 countries. There is a discrepancy between the rural and urban population incomes. While 32 % of the rural population lives below the poverty line, the urban rate is only 16 %. Only a very small fraction (3.5 %) of the rural settlements do not have access to energy and electricity.
Kazakhstan has good trade relationships with other Central Asian countries. The Russian Federation is the biggest oil and gas exporter in Central Asia. The Central Asian en-ergy transmission system includes the national electric power systems of Kyrgyzstan, Tajikistan, Uzbekistan and Turkmeni-stan as well as the southern part of Kazakhstan. Kazakhstan is importing and exporting electricity.
FIGURE 1
Map of Kazakhstan
CaspianSea
Aktobe
Atyrau
Baykonyr
Semipalatinsk
Almaty
Ksotanay
Karaganda
TarazShymkent
Uralsk
Petropavlovsk
Öskemen
SYR Darya
Ertis
Ob’
Irtysh
AralSea
LakeBalkhash
ASTANA
Amu Darya
T U R K M E N .
K Y R G .
C H I N A
R U S S I AR U S S I A
U Z B E K .

Renewable Energies in Central Asia
KAZAKHSTAN
COUNTRY INTRODUCTION 59
LAND AREA: 2,725,000 km2
POPULATION: 15.66 million (as of 2008)
DENSITY: 5.7 inhabitants/km²
SHARE URBAN/RURAL POPULATION:
52.6 % vs. 47.4 %
BIGGEST CITIES AND INHABITANTS:
Capital of Astana (0.6 million), Almaty (1.3 million), Aktyubinsk (0.3 million), Karaganda (0.4 million), Shymkent (0.6 million)
LANGUAGE: Kazakh, Russian
CLIMATE: Continental
TEMPERATURES: In summer, the temperatures can reach more than 53 °C, and in winter, the temperatures can sink as low as –58 °CIn the South, the average temperature in winter is about –19 °C and in summer about 25 °C. In the East, the average temperature in winter is about –17 °C and in summer about 20 °C. In the West, the average temperature in winter is about –10 °C in and in summer about 26 °C.In Central Kazakhstan, the average temperature in winter is about –17 °C and in average about 28 °C.
ALTITUDE: 132m to 7,010 m, average elevation is 200 m
RIVERS: Irtysh (1,698 km), Bukhtaarma (405 km), Ili (768 km)
ECOSYSTEM AREAS: Forests (2 %), shrub land, savannah, grass land (61 %), cropland and crop/natural vegetation mosaic (29 %), urban and built-up areas (0.1 %), sparse or barren vegetation, snow and ice (4 %), wetland and water bodies (3 %)
GDP – PER CAPITA (PPP): 11,563 USD (as of 2008)
INFLATION RATE: 10,8 % (as of 2008)
AGRICULTURE: Kazakhstan is the biggest exporter of grain and flour. Cotton export comprises 15 % and leather and wool export comprises 25 % of the total agricultural export.
INDUSTRIES: The industry’s share is 39.4 % of GDP. The products comprise oil, coal, iron ore, manganese, chromite, lead, zinc, copper, titanium, bauxite, gold, silver, phosphates, sulphur, iron and steel, tractors and other agricultural machinery, electric motors, construction materials
ELECTRICITY – PRODUCTION: 71.6 billion kWh (as of 2006)
ELECTRICITY – CONSUMPTION: 61.8 billion Wh (as of 2007)
ELECTRICITY – TARIFFS: 2.5 USc/kWh
NATIONAL ELECTRICITY 18.8 GW
NATURAL RESOURCES: The world‘s largest reserves of barite, lead, tungsten and uranium; the second largest of chromite, silver and zinc; the third largest of manganese, significant deposits of copper, gold and iron ore
OIL – PRODUCTION: 1,444,000 barrels/day (as of 2007)
OIL – EXPORT: 1,213,000 barrels/day (as of 2007)
OIL – CONSUMPTION: 231,000 barrels/day (as of 2007)
OIL – PROVEN RESERVES: 35 billion barrels
NATURAL GAS – PRODUCTION: 906 billion cubic feet/y
NATURAL GAS – PROVEN RESERVES:
65,000 billion cubic feet
EXPORTS: 66.57 billion USD F.O.B. (as of 2008)
EXPORTS – COMMODITIES: Gas, Oil and oil products 59 %, ferrous metals 19 %, chemicals 5 %, machinery 3 %, grain, wool, meat, coal (as of 2001)
EXPORTS – PARTNERS: China (15.5 %), Germany (11.5 %), Russia (11.2 %), Italy (7.2 %), France (6.7 %)
IMPORTS: 37.5 billion USD F.O.B. (as of 2008)
IMPORTS – COMMODITIES: Machinery and equipment, metal products, food
IMPORTS – PARTNERS: Russia (35.4 %), China (22.1 %), Germany (8 %) (as of 2007)
EXCHANGE RATE: 1 Tenge = 0.005 Euro (as of 2009)
Source: CIA World Fact Book, as of 2009

Renewable Energies in Central Asia
KAZAKHSTAN
COUNTRY INTRODUCTION 60
Import and export operations are controlled by the Ministry of Industry and Trade of the Republic of Kazakhstan.
3.2 PRIMARY ENERGY CONSUMPTION, TRANSMISSION AND PRICES
Primary energy in Kazakhstan depends almost entirely on fos-sil resources, namely coal, oil and gas. The share of RE, mostly hydro power, is slightly above 1 % only. New forms of RE and waste are practically not used. Primary energy consump-tion dropped from a maximum of 78,000 ktoe in 1992 to less than 40,000 in 1999 and has climbed back to 6,000 ktoe in 2006. The shares of total primary energy supply in 2006 are indicated in figure 2. It should be mentioned that there was no information available on the use of traditional fuel sources such as firewood for domestic use.
Transmission and Distribution SystemKEGOC is responsible for transmission and dispatch control. The regional and inter-state electricity transmission lines oper-ate at 220 kV and more. The electric power network on voltages of 220–500 and 1,150 kV forms the Single Electric System of Kazakhstan. Inter-system connections with the energy systems of the Russian Federation, Kyrgyz Republic and Republic of Uzbekistan are based on 110, 220 and 500 kV lines.
The combined length of electricity transmission lines on voltages between 0,4 and 1,150 kV is 464,000 km and there are 3,419 electric power substations with a total capacity of 63 MW.
About 1 % of the population is not connected to the grid in rural regions. The losses of energy in the transmission and distribution process are 25–50 %.
Electricity Sector and Natural ResourcesIn 2006, the electricity generation in Kazakhstan was 71.6 billion kWh. About 70 % of the total generation comes from coal, 10.6 % from gas, 4.9 % from oil and 14.6 % from hydro power1. The structure of primary energy supply in 2005, the dynamics of the energy supply of 1990–2005 and the energy balances for 2005 are presented in the annex. Less than 2 % of the total energy is imported.
3 ENERGY MARKET OF KAZAKHSTAN
The power sector is one of the best developed sectors in Ka-zakhstan’s economy. The country is rich in reserves of fossil fuel – 4 % of the global fuel reserves – and covers 99 % of its energy from fossil sources. Kazakhstan also has significant resources of RE in form of hydro power, solar, wind and bio-mass. Except for hydro power, however, these resources have not been widely used so far. The fuel energy sector’s produc-tion contributes about 17 % of the GDP.
Kazakhstan has privatized all of its power plants, but the sale of regional electricity distribution companies has pro-ceeded more slowly. Moreover, the majority of the distribu-tion networks has not yet been privatized. The Kazakhstan Electricity Grid Operating Company (KEGOC) has granted management rights to several private companies, but main-tains control over high-voltage transmission lines, substations and the central dispatching apparatus.
The policy is focused on energy saving and optimiza-tion of the current electric plants with fossil energy sources. The state budget provides the capital to optimize the national power sector.
The Kazakh energy sector is attempting some re-structuring. In 2008, load balancing has received more focus, which requires information on real-time energy demand. This process calls for advanced modeling software on the consum-ers and producer’s side and also improved coordination in the dispatch centers.
The main problems people are facing with regard to energy and electricity is the low capacity of the centralized power stations in the southern part. High transmission losses (25–50 %) and the deterioration of transmission lines cause electricity shortages in remote rural areas.
SHORT BUSINESS INFODespite the low cost and the abundant availability of fos-sil power resources, there are also legislative initiatives in support of RE.
3.1 IMPORTANT PLAYERS OF THE KAZAKH ENERGY MARKET
The Ministry of Energy and Mineral Resources (MEMR) is the main agency responsible for the formation of the state policy in the area of electric power, mineral resources, coal mining, petrochemistry and oil and gas.
Electric power is produced by more than sixty electric power stations with different types of property. Most power producers in Kazakhstan are private companies with a foreign share of the property. The biggest electric power stations of Kazakhstan are presented in the Annex.
KEGOC JSC is the system operator of the Unified Grid System of Kazakhstan. The company is responsible for the transmission of electricity on an interregional and inter-state level and manages the operational dispatch control over the unified Kazakh grid.
Source: IEA, 2006
FIGURE 2
Primary Energy Sources in Kazakhstan
Other, renewable & waste 0,10 %
Gas 30,60 %
Coal/peat 49,40 %
Oil 18,80 %
Hydro 1,10 %
1 DATA FROM THE NATIONAL GRID COMPANY KEGOC JSC

Renewable Energies in Central Asia
KAZAKHSTAN
COUNTRY INTRODUCTION 61
The main power consumer is the industry with 68.7 % of the total consumption, while households account for 9.3 %, the service sector for 8 %, transportation for 5.6 % and agricul-ture for 1.2 %. The installed capacity for power generation in Kazakhstan equals 18,773 MW. There are no seasonal varia-tions of the power supply.
The current status of the Kazakh electricity sector is characterized by a centralized system with power plants up to 4,000 MW concentrated close to coal deposits. Combined power/heat generation plants also serve for industrial pur-poses. The share of hydro Power Plants (HPPs) with storage capacity is insufficient to balance the load effectively.
A vertical hierarchical system of supervisory control is exercised by the Central Supervisory Control department, regional control centers and consumers’ control centers.
The available generating capacities do not provide suf-ficient power. While the total installed capacity of the existing power plants is about 18.7 GW, the available capacity is only 14.6 GW because of the age and poor maintenance situation of the existing power plants, which are all over 25 years old.The northern zone including Akmolinskaya, East-Kazakhsta-ni, Kostanaiskaya and Pavlodarskaya has excessive power re-serves of 1,980 MW or 7.6 billion kWh annually, the surplus is transmitted to other regions of Kazakhstan and exported to Russia. The western zone (the Atyrau, Mangistau and West Kazakhstani regions) observes a capacity deficit of 77 MW or 0.2 billion kWh, which is covered by imports from Rus-sia. The eastern zone (the Almaty, Zhambyl, Kzyl-Orda and South-Kazakhstani regions) tends to experience considerable deficits of capacity, 956 MW or 4.8 billion kWh, which is compensated by power transmission from the northern zone and import from Central Asian republics. The central zone including the Karaganda region sees a capacity deficit of 619 MW. In the Aktobe region the deficit is 325 MW. Thus, all the regions of Kazakhstan, except for the power-ex-cessive northern zone suffer from regional deficit of capacity and power. A map of the transmission grid is presented in the Annex.
Kazakhstan is very rich in accessible mineral and fos-sil fuel resources. The development and exploitation of petro-leum, natural gas and minerals has attracted over 40 billion USD of foreign investment to Kazakhstan since 1993 and ac-counts for some 57 % of the nation‘s industrial output. Kaza-khstan currently has the 11th largest proven reserves of both oil and natural gas and is also an exporter of diamonds.
Oil explorations have shown that the deposits on the Caspian shore only represent a small part of a much larger deposit. It is assumed that 3.5 billion tons of oil and 2.5 tril-lion m3 of gas can be found in that area. The overall estimate of Kazakhstan‘s oil deposits is 6.1 billion tons. Much of the crude oil extracted is exported to Russia because of Kaza-khstan‘s limited processing capacity.
Because of Kazakhstan’s natural richness of tradition-al resources the RE potential, which is also available, has been widely neglected in the past.
PricesThe legislation does not regulate prices for the generation of electricity except for energy generating organizations that dominate. The transmission and distribution of electricity is a KEGOC monopoly, therefore tariffs are set by the regulatory body. Tariffs for generation, transmission, distribution and supply of heat are also regulated.
Electricity prices are 0.067 USD/kWh for private con-sumers and 0.052 USD/kWh for the industrial sector. Prices for other energy resources can be found in the Annex. There are no special tariffs for RE.
Non-payment of electricity bills, an inadequate collec-tion system and a lack of market-based transportation tariffs are obstacles for the promotion of large-scale investments in Kazakhstan‘s transmission and distribution sector. Under the former Soviet Union, Kazakhstan utilized a system of fixed electricity tariffs that were unrelated to production costs and investment needs.
Kazakhstan‘s State Anti-Monopoly Committee is working to bring electricity tariffs in line with those in other countries and to allow the market to determine transmission tariffs.
Import and Export of EnergyIn general, Kazakhstan has sufficient resources of fossil fuels to cover its own demand as well as to export large amounts. Due to insufficient processing capacities and regional differ-ences, oil and gas are also imported. Numbers on quantities can be found in the Annex.
Export of electricity to Russia amounted to 3.6 bil-lion kWh in 2007, import from Russia 2.2 billion kWh in the same period. Import from Kyrgyzstan was 1.2 billion kWh. The dynamics of 2000–2007 generation and consumption and energy import and export are presented in the Annex.
Growth Predictions for the Energy SectorThe Development Plan of the Power Industry of Kazakhstan published by the Ministry of Energy and Mineral Resources in 2007 predicts the following growth in electricity consump-tion:
YEARS 2006 2010 2015
Power consumption, billion kWh 71.8 91.5 124.0
Power production, billion kWh 71.5 85.0 94.5
Deficit, billion kWh 0.3 6.5 29.5
TABLE 1
The Dynamics of Power Consumption and Production
Source: MEMR, as of 2007

Renewable Energies in Central Asia
KAZAKHSTAN
COUNTRY INTRODUCTION 62
4 POLICY FRAMEWORK FOR RENEWABLE ENERGIES
There is a general government strategy for the period from 2007 to 2024 to support sustainable economic development in general, which includes ecologically effective power genera-tion and in particular the use of RE and power from waste.
The Republic of Kazakhstan has ratified more than twenty international environmental treaties. Based on these, a national environmental regulatory basis was developed, which includes a package of national laws, presidential decrees and resolutions of the Government, the responsible Ministries, lo-cal agencies and executive bodies.
As a result, the current political mechanisms generally support the use of RE resources. This is part of the concept of the Republic of Kazakhstan’s transmission towards sus-tainable development for the period of 2007–2024. The laws including the Law on Electric Power Industry and the Law on Power Saving refer to the necessity of development and us-age of RE resources. Chapter IV of the Law on Power Saving determines the usage of RE resources as follows:
1. Utilization of renewable power resources is considered to be the priority of power development programs and resolution of environmental issues in Kazakhstan.
SHORT BUSINESS INFOBy law, Kazakhstan is clearly devoted to support the de-velopment of the RE power sector. Many practical ques-tions are not resolved and implementation therefore is lagging.
2. In the Republic of Kazakhstan, necessary legal and eco-nomic conditions are created to integrate Renewable En-ergy resources into the power balance and develop power facilities on their basis.
3. An authorized body coordinates and is responsible for the elaboration and implementation of programs for involving Renewable Energy resources into the power balance.
4.1 NATIONAL STRATEGIES AND PROGRAMS TO SUPPORT RENEWABLE ENERGIES
The Government of Kazakhstan has ratified a number of pro-grams and strategies that provide the political framework for RE power generation:
Relevant programs and strategies:
Strategy 2030 Strategy of Industrial Innovative Development for the Period of 2003–2015
Ecological Code Concept of the Transition for a Sustainable Development for the Period 2007–2024
Concept for Ecological Safety for the Period of 2004–2015 Concept of Further Development of Market Relations in the Power Industry
Approved programs in the electric power industry:
State Program of Electric Power Development for 2030 Sectoral Program for the Development of a Single Electric Power Grid for the Period up to 2010 with Perspective up to 2015
Action Plan on the Development of the Electric Power Industry for the Period of 2007–2015
4.2 REGULATIONS, INCENTIVES AND LEGISLATIVE FRAMEWORK CONDITIONS
To improve the legislation regarding issues of sustainable de-velopment and the use of RE, the Ministry of Environmen-tal Protection – in cooperation with the Ministry of Energy and Mineral Resources and supported by a UNDP Project on wind power – developed the concept and the Draft Law on Support of Usage of Renewable Energy resources.
Some relevant direct and indirect incentives are provided by the state to support the development of the RE market:
A Renewable Energy resources certificate system has been introduced. The producers of RE shall issue RE certificates and sell them to the power producing institutions through the Agency on Renewable Power, which is the administra-tor of the certificates. This shall be done in order to balance the costs of power from traditional as well as RE resources.
Tenders are announced for the Kazakh development in the field of RE power in accordance with the Ecological Code.
The control of the compliance with ecological require-ments while extracting and using non-RE resources is to be enhanced.
The tax regime for the mineral wealth users in accordance with the Tax Code has been tightened since 2009.
A strategy of effective use of power and RE resources for the purpose of the sustainable development until 2024 was introduced.
The Council on Sustainable Development of the Republic of Kazakhstan is asked to pay more attention to the issue of RE development.
Basically, there are no special provisions regarding permits and licenses for independent power producers or investors in RE. For the construction of facilities serving the generation of RE, the same requirements apply as for other facilities and buildings. In order to obtain the required licenses, the follow-ing institutions need to be contacted:
centers of real estates registration public utilities, including the heating networks power networks and telecommunication services departments of architecture and land use fire services departments of ecology and nature
Renewable Energies in Central Asia
KAZAKHSTAN
COUNTRY INTRODUCTION 63
SHORT BUSINESS INFOThe regulatory framework required to attract private in-vestors to the RE power sector is presently developed under the auspices of a UNDP project on wind power.
The commissioning of a construction project shall be author-ized after being approved by the above-mentioned institutions and being compliant with the project documentation. The project institutions are subject to licensing in the Republic of Kazakhstan.
Laws and Enactments: Law on Electric Power of 30 June 2004 Law on Power Saving of 25 December 1997 Order of the Minister of Power and Mineral Resources of 30 September 2004 comprising rules on organization and functioning of the retail market for electric power as well as access and service provision on this market
Resolution of the Government on Wind Power Develop-ment of 25 August 2003
Order of the Minister of Power and Mineral Resources of 19 March 2008 comprising rules of functioning of balanc-ing the market of electric power
Order of the Minister of Power and Mineral Resources of 12 June 2006 comprising rules on approval of maximum tariffs for services and production of the subjects of natural monopolies
A Draft Law on Renewable Power and the National Program of Wind Electric Power Development until 2015 with the Per-spective until 2024 is currently being developed.
Clean Development Mechanism (CDM)Despite the misconception of economic impediments, the Government of Kazakhstan and local authorities pay more and more attention to environmental issues. In cooperation with international organizations and donor countries, the development of large-scale umbrella projects and programs is implemented. The following four priorities have been deter-mined: (i) the creation of an ecologically safe environment, (ii) a balanced use of natural resources, (iii) the conservation of biological diversity and (iv) environmental education to achieve these goals.
The Hydrocarbon Initiative launched in 1997 by sev-eral Ministries has its focus on the reduction of greenhouse gas emissions. Power saving became another priority in this initiative.
In March 1999, Kazakhstan signed the Kyoto Protocol without joining Annex 1 (which requires a commitment to re-duce green house gas emissions) and Annex B of the Protocol. Consequently, Kazakhstan did not take on any quantitative obligations on emission abatement. Later, in May of 1999, Ka-zakhstan declared its intention to join Annex 1 of the Conven-tion. The Interagency Commission (IC) on ratification issues and fulfillment of obligations of the Kyoto Protocol was formed in 2000 with nine participating Ministries. Since then the IC has held four meetings and developed a number of resolutions and recommendations none of which includes any commit-ment to greenhouse gas reduction from the energy sector.
5 POTENTIAL FOR RENEWABLE ENERGIES AND PRESENT USE
The present share of RE in Kazakhstan is very small, with the exception of some hydro power use. The main reason is the low price of fossil energy. Due to the growing power defi-cit and ecologically oriented projects of donor organizations and state initiatives, however, private companies have recently started to enter the Kazakh market. These initiatives are de-scribed later on in this chapter.
There is a big potential of RE resources in Kazakhstan as presented in table 2. The numbers date back to 1996 and the estimates on technical and economic potentials are most likely underestimated.
5.1 BIOENERGIESKazakhstan has a substantial potential for the production of different agricultural crops, which can be processed for energy purposes, in particular bioethanol and biodiesel as ecological-ly sound fuel for combustion engines. Table 3 shows estimates of available raw materials.
Solid BiomassIt is assumed that solid biomass (e.g. wood, cotton stalks or dung) are being used for domestic heat supply and cooking purposes mostly in rural areas, but no quantitative data are available.
Liquid (Bioethanol or Biodiesel)There is presently one producer, Biohim Co., of bioethanol in Kazakhstan. Biohim plans to build three more biofuel plants. According to data published by Biohim, the potential for biofuel development is huge. From 36 ktons/year, Biohim
ENERGY POTENTIAL
GROSSPOTENTIAL[BILLION KWH]
TECHN.POTENTIAL[BILLION KWH]
ECON.POTENTIAL[BILLION KWH]
ANNUAL ELECTRICITY PRODUCTION [BILLION KWH]
Hydro power 163 62 27 11
Geothermal 54,000 54 0.54* n. a.
Wind 2,000,000 1,820 1.71 n. a.
Solar 1,000,000 1,000 0.01* n. a.
Total 3,054,163 2,936 28.71 11
* assumption for renewable sources – international stimulated factor 1.8** assumption for renewable sources – international stimulated factor 1.8Source: estimation of Dukenbaev, 1996
TABLE 2
Energy Potentials
BIOFUEL POTENTIALS PROJECTED ANNUAL POTENTIAL[BILLION KWH]
Timber waste 2.3
Straw of cereal crops 2,326
Cattle waste 0.6
Sewage 0.02
Total 2328.92
Source: estimation of Dukenbaev,1996
TABLE 2
Projected Annual Potential

Renewable Energies in Central Asia
KAZAKHSTAN
COUNTRY INTRODUCTION 64
plans to increase the production to 480 ktons/year. Biohim is operating a large plant in northern Kazakhstan producing bioethanol with a capacity of 57 ktons/year. The production has access to the neighboring countries and European mar-kets. The markets of Kazakhstan regarding the consumption of liquid biofuels, however, are not developed.
The Ministry of Agriculture of Kazakhstan is prepar-ing to regulate the production of biofuel, which requires the coordination of different state agencies. There will also be safety requirements and regulations on biodiesel and gasoline with bioethanol components.
BiogasSome activities based on a UNDP funded project were iden-tified. The project involved the design, construction and in-stallation of biogas facilities by certain enterprises, farms and institutions within a community. Local farms contributed agricultural waste products, which are used to produce biogas in small domestic digesters. The farmers received gas to use for cooking and lighting and also gained fertilizer, which in-creases crop productivity.2
5.2 SOLAR ENERGYIn Kazakhstan there are 2,200–3,000 sunshine hours per year. The energy of the sunshine equals 1,300–1,800 kW/m2 annually. The most promising regions for utilizing solar en-ergy are the Aral Sea region, the Kzyl-Orda oblast and the southern Kazakhstan oblast. The territory of Kazakhstan has a continental climate with significant seasonal differences; sunshine in winter is less than summer sunshine.
Solar PhotovoltaicBased on the high theoretical potential, solar energy develop-ment is one of the promising fields of RE resources in Kaza-khstan. The present use of solar energy is not quantitatively known, but there are some private initiatives in the field of PV energy use in the market of Kazakhstan. A number of organi-zations are selling the respective equipment. These companies mainly offer components imported from Germany, Japan and China. Households and administrative entities are the main users of these devices. The design of large entities using power saving technologies will also be developed here. A construc-tion project of an ecologically friendly administrative build-ing for a business center is planned in Almaty. The Square Meter Group is the developer.
Solar Thermal EnergyPrivate households mainly in rural regions use solar-thermal energy. A market for the equipment, however, is not existent.
5.3 WIND POWERBeing a country located in the northern hemisphere’s wind belt, Kazakhstan theoretically has a high wind energy poten-tial. Wind power energy is the most promising RE resource in Kazakhstan. The highest wind power resources are located in the Dzhungarian Gates region, the Almaty oblast (17,000 kW/m2/year), Yermentau, Akmolinskaya oblast (3m700 kW/m2/year), Fort Shevchenko, Coast of Caspian Sea (4,300 kW/m2/year), and Korday, Zhambyl oblast (4,000 kW/m2/year). The analysis of the seasonal differences of wind speed shows an increase in generation in winter and a decrease in the summer period.
Table 5 shows an overview of possible installations.3
There is also a map of wind speeds in the Annex.
REGIONAL ANNUAL SOLAR INSOLATION ON HORIZONTAL SURFACE [KWH/YEAR] ON SURFACE NORMAL TO SUNLIGHT BEAMS [KWH/YEAR]
Shevchenko 1,491 1,515
Aral Sea 1,690 1,985
Almaty 1,449 1,492
Source: EBRD, 2009
TABLE 4
Annual solar insolation
LOCATION OF POTENTIAL WIND FARM PROJECTS REGION NUMBER OF WIND GENERATORS
PROJ. INST. CAPACITY [MW]
ANNUAL PROD. [BILLION KWH]
Mangystau mountains West 8,000 210 0.4
Peak Karatau South 7,800 190 0.23
Chu-Ili mountains South 6,800 180 0.27
Mount Ulutau Central 3,400 90 0.13
Erementau mountains Central 2,100 50 0.01
Mugojary mountains West 400 10 0.01
Djungarian gates South 1,100 200 0.66
Total 29,600 930 1.71
Source: unknown
TABLE 5
Perspective Regions for Wind Power Development
2 MORE INFORMATION CAN BE FOUND AT INFORSE-EUROPE, 2004-2006
3 THE SOURCE OF THESE DATA IS UNKNOWN. THE NUMBER OF WIND FARMS OBVIOUSLY
REFERS TO VERY SMALL UNITS WITH MODERN TECHNOLOGIES; THE UNITS WOULD
HAVE MUCH HIGHER CAPACITIES.

Renewable Energies in Central Asia
KAZAKHSTAN
COUNTRY INTRODUCTION 65
The larger part of the Kazakh territory has medium wind speeds (3.5–6 m/s), stronger winds are found in the western part with wind speeds of more than 6 m/s. Areas with low wind intensity are located in the southern part of Kazakhstan. Most of the considered territories are characterized by low density of population and practical unfitness for agriculture.There are several initiatives to develop wind farms:
In 1997–1998, the Government of the Netherlands pro-vided financial assistance for the implementation of the Wind Energy in Kazakhstan Project with the objective to evaluate the potential for wind energy development. As a conclusion, Kazakhstan was from the wind resources point of view classified as one of the most appropriate countries in the world to develop wind energy.
A project of the UNDP and the Kazakh Government is the Wind Power Energy Market Development Initiative (2004–2007). The objective of this project is to promote the development of a wind energy market in Kazakhstan by assisting the Government to formulate a National Program on Wind Energy Development, providing information for building the local capacity to develop wind energy prod-ucts in Kazakhstan and to organize their financing. This includes site mapping and the expansion of the wind speed measurement program. The program is meant to facilitate the construction of a first 5 MW wind farm to prepare ground and reduce the risks for further investments. Monitoring, analyzing and disseminating the experiences and lessons learnt during the implementation of the project are also intended. In the project schedule, the legislative basis for RE resources use shall be prepared including price recommendations for adoption by the Ministry of Energy and Mineral Resources.
Under the leadership of the Indian Company of NEPC India Ltd., two pilot wind power plants with a capacity of 250 kW each were built in Kentau city in the south Kazakhstan region, jointly with the Akimat (local executive body) of the South Kazakhstan region. If their profitability is proved in practice, such plants will be installed in other districts of the region. The project is under implementation.
The new National Program of Wind Power Development for the Period of 2008–2015 with a perspective up to 2024 is run by the Ministry of Energy and Mineral Resources and the UNDP. The program envisages the construc-tion of pilot wind power stations with a 5 MW capacity before 2010 and the construction of wind power stations of 2,000 MW on the territory of Kazakhstan before 2024.
In 2009, a Memorandum of Understanding between UNDP in Kazakhstan and JSC Samruk-Energo on the de-velopment of RE sources of energy and wind/sun power sta-tion construction projects was signed. The joint activity will focus on the wind power engineering capacity development and work out of proposals for the legal and technical base of wind power engineering development in Kazakhstan. Feasibility studies are to be prepared for the construction of wind power stations in the Dzhungar gates, Shelek corridor, Fort-Shevchenko. There are plans to establish a Wind Power Engineering Development Association in Kazakhstan.
5.4 GEOTHERMAL ENERGYAccording to studies, the technical potential of geothermal energy in Kazakhstan is estimated at 54 TWh.4 There is, how-ever, no information available how much of this potential is technically usable. Table 6 provides an overview.
The geothermal field of Kaplanbek (near the city of Chim-kent) with thermal water of temperatures around 80 °C is used for heat supply of residential buildings. Near the city of Almaty, thermal water with temperatures between 80 and 120 °C is used for heating green houses in winter and for air conditioning in summer. Only 33 % of the geothermal water has temperatures above 90 °C. A map of geothermal resources can be found in the Annex. More information can also be found on the EBRD webpage.
5.5 HYDRO POWERThe estimated physical potential of Kazakh hydro energy is 163 Billion kWh, the estimated technical potential 62 Bil-lion kWh and the estimated economical exploitable potential 27 Billion kWh. The Annex presents more detailed informa-tion. Most of the hydro energy resources are located in three major districts: the Irtysh river basin with its main tributar-ies (Bukhtarma, Uba, Ulba, Kurchum, Kardzhil), the south eastern zone with the Ili river basin and the southern zone basins of the Syrdaria, Talas and Chu rivers. The hydro power potential of these individual big rivers in Kazakhstan is also presented in the Annex.
Hydro power accounts for approximately 12 % of Ka-zakhstan’s total electricity generating capacity. The average annual hydro power generation is around 7.78 TWh. By ab-solute indices of potential hydro resources, Kazakhstan ranks third amongst the CIS countries.
Large Hydro PowerPresently, there are 15 large hydro power stations with a total capacity of 2,270 MW in operation including 8 large HPPs with more than 10 MW and 7 smaller HPPs (with ess than 10 MW (see Annex for list). Kazakhstan has sought interna-tional funding for some of its large hydro electric projects, particularly to complete its 300 MW Moinak HPP on the Charyn River, east of the former capital of Almaty. Moreover,
4 DUKENBAEV, AS OF 1996
LOCATION OF GEOTHERMAL RESOURCES
SHARE [ %] PROJECTED POS-SIBLE INSTALLED CAPACITY [MW]
PROJECTED ANNUAL PRODUCTION[BILLION KWH]
Mangystau 36 n. a. n. a.
West Kazakhstan Oblast 19 n. a. n. a.
Aktobe 13 n. a. n. a.
Atyrau 11 n. a. n. a.
Kzyl Orda 7 n. a. n. a.
Others 14 n. a. n. a.
total 100 0 0
Source: estimation of Dukenbaev, 1996
TABLE 6
Share of Geothermal Resources

Renewable Energies in Central Asia
KAZAKHSTAN
COUNTRY INTRODUCTION 66
a number of other large projects are under construction with participation of international investors.
Small Hydro Power The estimated potential of small hydro energy is about 96 Billion kWh, the estimated economical exploitable potential about 10 Billion kWh. The resources are located in East Kaza-khstan, Zhambyl, Almaty and the southern Kazakhstani ob-last. Indicators of the perspective small hydro power stations are presented in table 7.
According to EBRD, there are also programs for small hydro power development in Kazakhstan. These include the recon-struction and renovation of existing small HPPs, adding small HPPs to existing water management projects with small dams and reservoirs and the construction of new small HPPs for power supply in remote areas. Favorable factors for the devel-opment of small HPPs are:
Interest of regional authorities in small hydro Private investors of small hydro are provided with state short-term credits
There are some privileges (tax holidays) in realization of investment projects
Other InitiativesThere are a number of small initiatives targeting the use of RE, such as: The Renewable Energy Use for Potable Water Supply in Remote Villages of Depressed Region Project has a total budget of 115,000 USD and is funded by GEF. The project goal is to promote wind and solar water pumping sys-tems for clean water supply in a remote village of the poverty-stricken Aral Sea basin in Kazakhstan. At the same time this pilot initiative will promote RE use for similar initiatives in rural areas of Kazakhstan. The project consists of the follow-ing two parts:
1. Renewable Energy Use (Solar Energy) for Mobile Electrifi-cation in Remote Villages of the Depressed Region in Ka-zakhstan – Village of Bogen
2. Renewable Energy Use for Potable Water Supply in Remote Villages of the Depressed Region in Kazakhstan – Capacity Building and Renewable Energy Resource Centre (RERC)
The GEF Small Grants Program in Kazakhstan (with a total budget is 116,670 USD) is composed of the following modules:
Biogas (clean rivers) Demonstration of solar energy use as an alternative for water and premises heating purposes in the Kyzylorda maternity house
Energy created by wind Planning grant for Water Warmed by Sun Project proposal development
Planning grant for the pre-project activity “Energy Created by Wind”
Water of Life
6 MARKET RISK ANALYSIS AND BARRIERS FOR MARKET ENTRY
Large amounts of foreign investment have flown into Kaza-khstan’s economy, about 60 billion USD in 1991–2006, 75 % of that into the traditional fossil energy sector. There are some projects in the field of RE financed by foreign and interna-tional foundations.
6.1 GENERAL SITUATIONDuring the past few years, Kazakhstan has made some progress in transforming its economy to create a more transparent, less regulated and more market-driven business environment. Nonetheless, this progress has been progressively undermined by a number of developments, which have caused an increased concern for foreign investors and their governments alike. In general, a cumbersome bureaucracy, a changing and unevenly enforced legislation and a weak judiciary greatly complicate the process of doing business in Kazakhstan.
Legal and Regulatory RisksThere are a number of relevant concerns for foreign investors. The Constitution of Kazakhstan restricts the independent power of the judiciary significantly, which is subordinate to the executive. Foreign investors are not guaranteed the benefit of an impartial process regarding legal issues.5
Increased concerns are raised over interpretation of laws by the Central Government, which often is not in line with that of local officials, especially in the implementation of Kazakhstan’s system of taxation and collection of revenues.Kazakhstan has limitations on work permits for foreign manag-ers and technical staff, which greatly hinder the ability to rotate workers in and out which is often required on short notice.
Frequent harassments occur by local and national fi-nancial police and other taxation authorities through gener-ally intrusive inspections. Quite often, the settlement of these cases with the tax authorities has led to criminal charges by local governmental officials as a pressure tactic.Foreign concerns are raised over the Kazakh Government’s attempts to reinterpret existing contracts, particularly in the oil and gas and electricity generation sectors. In general, many foreign companies are successful because
Source: estimation of Dukenbaev, 1996
REGIONS OF POTENTIAL HP PROJECTS
NUMBER OF PROJECTS
PROJECTED INSTALLED CAPACITY [MW]
ANNUAL PRODUCTION [BILLION KWH]
East Kazakhstani oblast 68 349 1.7
Almaty oblast n. a. 1,762 8.7
Southern Kazakhstani oblast 112 421 1.8
Zhambyl oblast 77 175 0.7
total 180 2,532 12.2
TABLE 7
Potential for Small Hydro Power Projects
5 INFORMATION TAKEN FROM THE FEDERATION OF INTERNATIONAL TRADE
ASSOCIATIONS FITA, (WWW.FITA.ORG), AS OF 2009
Renewable Energies in Central Asia
KAZAKHSTAN
COUNTRY INTRODUCTION 67
they accept the above mentioned conditions as a cost of doing business in this country and they all do well by employing a large staff of attorneys, accountants and other helpful re-sources devoted to insure protection in Kazakhstan. Foreign businesses are pleased that Kazakhstan’s banking sector is well run and that they are free to repatriate their overseas income. Corruption
The Worldwide Corruption Perceptions Index pub-lished by Transparency International ranks Kazakhstan 145 out of 180 countries. Kazakhstan reaches 2.2 points out of 10, with the factor 10 indicating basically no corruption. Cor-ruption increases the cost and difficulty of doing business for foreign and local firms alike. Availability of Local Know-howAfter the disintegration of the USSR, the educational system has undergone changes and still keeps changing. The high-tech branch is not well developed. Therefore, know-how support at a local level is provided mainly with international funds in the form of grants. Know-how in the field of RE is delivered from abroad, meaning that the country has practically no know-how or information of its own in this field.
Local AcceptanceForeign investors form the basis of the industrial and banking sector of Kazakhstan. At the level of small and medium size businesses, there are many joint companies having the same business conditions as the local companies.
Intellectual Property RightsIn the area of intellectual property, Kazakhstan has signed all relevant international agreements. Kazakhstan has a National Institute of Intellectual Property and a Committee on Intel-lectual Property Rights, which can be consulted in English.6
6.2 BUSINESS DEVELOPMENTTo start a business in Kazakhstan it is necessary to define the organizational and legal form of the enterprise and to be registered with the Justice Department, the Statistics Agency and the Tax Department. If the intended activity demands licensing, it is necessary not only to obtain licenses, but also corresponding permissions. The greatest difficulty for a busi-ness start is the lack of an adequate research of the market, low demand and low solvency of the population and problems caused by the often changing legislation.
There are no particular obstacles for foreigners to start a business. There is, however, a serious restriction on land leas-ing to foreign citizens and foreign organizations – land cannot be leased for more than 10 years and cannot become the prop-erty of a foreign citizen or a foreign organization.
The Kazakh banking system has been developing rap-idly before the global crash and the National Bank has in-troduced deposit insurance in its campaign to strengthen the banking sector. Several major foreign banks have branches in Kazakhstan. Since the beginning of global financial crisis, the stability of the financial sector has been falling and there is a high dependency on foreign capital.Potential investors in the RE business will have to expect con-
siderable bureaucratic obstacles because of the dependency of the country on the oil capital and its influence, the low cost of traditional energy sources and high corruption levels.
TaxationThe country has embarked upon an industrial policy designed to diversify the economy away from over-dependence on the oil sector by developing its manufacturing potential. The pol-icy changed the Corporate Tax Code to favor domestic indus-try as a means to reduce the influence of foreign investment and foreign personnel.
Value Added Tax is 12 %. Company Tax Rates are 20 %. Capital gains are treated as normal income and taxed at the standard Corporate Tax Rate of 20 %. Tax benefits are granted to companies carrying out their activities in 4 special economic zones: Astana City, Information Technology Park, Aktau Sea Port and Ontustyk. These benefits concern income tax and can consist of a tax exemption on land and property. There are also tax benefits for the petrochemical industry, companies producing and selling very high value added prod-ucts as well as for those who have signed investment contracts with the government.
For companies from some countries there is a double taxation agreement with Kazakhstan, which is aimed to re-duce the tax burden.7
Import/ExportTaxes apply to the export of certain products and also on the import of some products. The tax policy is directed on import replacement. The list of import products on which the VAT is not compensated is defined in the tax code.
6 INFORMATION TAKEN FROM THE FEDERATION OF INTERNATIONAL TRADE
ASSOCIATIONS FITA, WWW.FITA.ORG
7 FOR MORE INFORMATION SEE FITA WEBPAGE AND KADYROV, 2006

Renewable Energies in Central Asia
KAZAKHSTAN
COUNTRY INTRODUCTION 68
7 RENEWABLE ENERGY BUSINESS INFORMATION AND CONTACTS
Ministry of Justice of the Republic of Kazakhstan The Left Bank, House of the Ministries, Entrance 13010000 AstanaPhone: office (7172) 74-07-37, central fax (7172) 74-09-54Phone hotlines (valid for all regions) – 119E-Mail: [email protected] in English with many links and the possibility to ask questions: www.minjust.kz/en
Agency of Statistics of the Republic of KazakhstanLeft Bank of Ishim River, Dom Ministerstv, Entrance 4Astana CityKazakhstan Phone: (7172) 749016, fax: (7172) 749494E-Mail: [email protected] with link to business registration (in Russian only): www.eng.stat.kz/Pages/default.aspx
Ministry of Finance of the Republic of KazakhstanWebsite: http://mf.minfin.kz/index.php?lang=eng
Tax Committee of the Ministry of Finance of the Republic of KazakhstanPobedy Avenue 11010000 AstanaPhone: (7172) 71-80-02Call center: 8 (7172) 58-09-09E-Mail: [email protected] with English version: www.salyk.kz/eng/Pages/default2.aspx
NAME OF ORGANIZATION AREA OF COMPETENCE ADDRESS AND CONTACT CONTACT PERSON
1 Ministry of Energy and Mineral Resources (MEMR)
Regulation of energy and mineral resources
Kabanbay Batyr Avenue 15 000001 Astana E-Mail: [email protected]
2 Agency of the GoK on Regulation of Natural Monopolies, Department of Heat and Power Engineering Regulation
Regulation of the prices of heat and power for private use prices
Bukeykhan Street 14 01000Astana Phone: 7 (7172)591637 Fax: 7 (7172) 21547 E-Mail: [email protected]
Shkarupa Anatoliy, Director of the Heat and power regulation department
3 KEGOC JSCKazakhstan Electricity Grid Operating Company
National grid operator/company Bogenbai Batyr Avenue 7/010000 AstanaPhone: 7 (7172) 319522, 970426 Fax: 7 (7172) 970455E-Mail: [email protected]: www.kegoc.kz
4 Ministry of Industry and Trade Transport Tower010000 AstanaPhone: 7 (7172) 241642Fax: 7 (7172)241901Website: www.mit.kz
5 Kazakhstani Research Center of Climate Change
Non-Governmental Organization Seyfullin Str. 597 050022 Almaty Phone: 7 (727) 2558395Website: www.ecoclimate.kz
6 Climate Change Coordinate Center Non-Governmental Organization 20 Abay Avenue, office 120, [email protected]
7 Kazselenergoproject Academia and Education Raiymbek Avenue 193 050050 AlmatyPhone: 7 (727) 2 33-34- 06/2333553
8 UNDP, Small Grants Programm (SGP) of GEF
Almaty UN Common Premises Tole Bi Street 67 050000 Almaty Phone: 7 (727) 2582643; 2582442 Fax: 7 (727) 2582645 E-Mail: [email protected]
9 Astana UN House/Liaison Office Bukei Khan Avenue 2601000 Astana Phone: 7 (7172) 592550 Fax: 7 (7272) 592540 E-Mail: [email protected]
RENEWABLE ENERGY – RELEVANT INSTITUTIONS

Renewable Energies in Central Asia
KAZAKHSTAN
69
8 BIBLIOGRAPHY
Aslanjan, G. S, Good Fellows C. . (2001): Financial Aspects of Expansion of Use of Non-conventional Energy Sources Power System
Dukenbaev, K. (1996): Energetika of Kazakhstan – Technical Aspects
Dukenbaev, K. (1996): Energetika of Kazakhstan and a Way of its Integration to Economy
European Bank for Reconstruction and Development – EBRD (2009): Kazakhstan. Country Profile (http://ebrdrenewables.com/sites/renew/countries/kaza-khstan/profile.aspx)
International Energy Agency – IEA (2006): Regular Review of Energy Efficiency Policies in Kazakhstan
International Energy Agency – IEA (2006): Statistics by Country. Kazakhstan: Statistics (www.iea.org/stats/coun-tryresults.asp?COUNTRY_CODE=KZ&Submit=Submit)
Kadyrov (2006): The Tax System of the Republic of Kazakhstan: General Information (www.worldwide-tax.com/articles/kazakhstan1.asp)
Makarov, A. A. (1998): World Power and the Euroasian Power Space – Energoatomizdat
Ministry of Energy and Mineral Resources – MEMR (2007): Development Plan of the Power Industry of Kazakhstan
Nekrasov, V. G. (1994): Perspectives of Bioenergetics Use in Kazakhstan – Power and Fuel Resources
Renewable Energy & Energy Efficiency Partnership – REEEP (2009): Fresh Wind from Kazakhstan: New Renewable Energy Law (www.reeep.org)
The International Network for Sustainable Energy – INFORSE-Europe (2004-2006): Creation of Kazak Biogas Training Center ‚Azure Flame‘ Project in 2004-2006 (www.inforse.org/europe/kz_biogas.htm)
Websites www.climate.kz www.fita.org www.iea.org www.memr.gov.kz/ www.nauka.kz/diss/detail.php?ID=190388 www.powerexpo.kz/ru/2006/power_resources/ www.reep.ru www.zakon.kz/our/news/news.asp?id=30161968 www.ebrdrenewables.de or http://ebrdrenewables.com/sites/renew/countries/kazakhstan/profile.aspx
BIBLIOGRAPHY

Renewable Energies in Central Asia
KAZAKHSTAN
70ANNEX
9 ANNEX
SUBJECT DESCRIPTOR GDP CURRENT PRICES(BILLION USD)
GDP PER CAPITA CURRENT PRICES(USD)
GDP BASED ON PURCHASING- POWER-PARITY OF COUNTRY GDP(BILLION CURRENT INTERNATIONAL DOLLAR)
GDP BASED ON PURCHASING- POWER-PARITY PER CAPITA GDP(CURRENT INTERNATIONAL DOLLAR)
2004 43.1 2,862 116.5 7,734
2005 57.1 3,785 131.7 8,732
2006 81.0 5,260 150.5 9,778
2007 104.8 6,748 168.3 10,837
2008 141.1 9,075 179.8 11,563
TABLE 9.2
GDP Development 2004–2008**
OIL(MILLION TONS)
GAS(BILLION M3)
COAL(MILLION TONS)
Extraction 67,0 18,0 94,4
Export 60,0 7,3 26,0
Import 3,4 3,3 0,0
Internal consumption 10,4 14,0 68,4
Export partners Russia, European Union, China, Azerbaijan Russia Russia, Ukraine
Import partners Russia Uzbekistan, Turkmenistan
TABLE 9.3
Kazakh Export and Import of Oil, Gas and Coal in 2007**
* price for export
RESOURCE PRIVATE SECTOR INDUSTRIAL SECTOR
KZT USD KZT USD
Electric power, 1 kWh 8.0 0.067 6,2 0.052
Natural gas, 1,000 m3 5,613.8 46.800 – 100.000–140.000*
Diesel fuel, 1 l 56 0.460 49 0.410
Gasoline, 1 l 100 0.833 100 0.833
Brown coal, 1 m3 – – – –
Oil “Brent”, 1 barrel – – – 100.790*
TABLE 9.4
Prices for Power Resources Used by Private and Industrial Use in October 2008 (Tariffs for renewable resources are not determined.)**
REGION NUMBER OF CONSIDERED RIVERS TOTAL LENGTH OF RIVERS(THOUSAND KM)
HYDROENERGY RESOURCES(BILLION KWTH)
East Kazakhstan 818 21.7 72.1
Southern Kazakhstan 1,257 37.6 92.0
Northern Kazakhstan 16 5.9 1.5
Central Kazakhstan 57 11.0 1.5
West Kazakhstan 25 6.9 2.8
Total 2,174 83.1 163.0
TABLE 9.5
Hydro Power Resources in Kazakhstan**
** Sources Tables 9.2 –9.5: compiled by the author from various data sources

Renewable Energies in Central Asia
KAZAKHSTAN
71ANNEX
Characteristics of Big Rivers
NAME OF RIVER LENGTH OF RIVER (KM)
FALLING OF RIVER (M) MID-ANNUAL FLOW/MAXIMUM BY LENGTH (M3/SEC)
CAPACITY (THOU-SAND KWT)
ENERGY(BILLION KWTH/YEAR)
Irtysh 1,698.0 336 924,0 2,263 19,825
Karakabe 154.0 1,838 40.6 192 1,679
Akkabe 106.0 1,988 18.4 102 895
Kaldjir 123.0 1,045 21.5 162 1,381
Kurchum 218.0 2,164 62.1 433 3,791
Bukhtarma 405.0 2,290 243.0 847 7,419
Ulba 98.0 388 98.0 165 1,449
Uba 286.0 483 170.0 461 4,040
Ili 768.0 191 463.0 808 7,079
Khorgos 160.0 2,719 16.3 307 2,174
Usek 142.0 2,726 17.9 491 4,306
Tekes 179.0 1,702 35.0 – 682
Charyn 346.0 2,609 35.6 – 3,810
Chylyk 240.0 3,649 33.0 – 4,126
Talgar 108.0 3,478 10.8 – 1,700
Lepsy 418.0 2,681 24.2 – 1,526
Tentek 180.0 3,144 46,9 – 3,027
Syrdarya 1,692.0 290 603 – 10,046
Arys 346.5 925 19,4 – 702
Talas 321.9 405 15,8 – 581
Chui 970.0 924 59,2 – 4,353
Source: unknown
FIGURE 9.6
Map of the East Kazakhstan Hydro Power Stations
Source: unknown

Renewable Energies in Central Asia
KAZAKHSTAN
72ANNEX
FIGURE 9.8
Geothermal Power Map of Kazakhstan
Source: unknown
FIGURE 9.7
Wind Power Map of Kazakhstan
Source: unknown

Renewable Energies in Central Asia
KAZAKHSTAN
73ANNEX
FIGURE 9.9
Electricity Infrastructure in Kazakhstan
Source: unknown

Renewable Energies in Central Asia 74
COUNTRY CHAPTER:
KYRGYZ REPUBLICAuthors and Coordination of Country ChapterOlga Terenteva (LL.M, MA Finance, BA Engl. & Lit.)
Dr. Ing. Klaus JordeEntec Consulting & Engineering AGSt. Gallen, Switzerlandwww.entec.ch
Axel Biegert (Dipl. Economist & Pol.) INTEGRATION UMWelt & Energie GmbHGraefenberg, Germany www.integration.org
Editor Deutsche Gesellschaft für Technische Zusammenarbeit (GTZ) GmbHDepartment Water, Energy, TransportDag-Hammarskjöld-Weg 1-565760 Eschborn, Germanywww.gtz.de
On behalf of Federal Ministry for Economic Cooperation and Development (BMZ)
Editorial staffDiana KraftTel: +49 (0)6196 79 4101Fax: +49 (0)6196 79 80 4101Email: [email protected]

Renewable Energies in Central Asia 75CONTENTS
ACRONYMS, ABBREVIATIONS AND MEASUREMENTS 76
1 SUMMARY 78
2 COUNTRY INTRODUCTION 79 2.1 Geography and Climatic Conditions 79 2.2 Political and Economic Development 79
3 ENERGY MARKET OF THE KYRGYZ REPUBLIC 80 3.1 Important Players of the Kyrgyz Energy Market 80 3.2 Primary Energy Consumption, Transmission and Prices 81
4 POLICY FRAMEWORK FOR RENEWABLE ENERGIES 83 4.1 National Strategies and Programs to support Renewable Energies 83 4.2 Regulations, Incentives and Legislative Framework Conditions 84
5 POTENTIAL FOR RENEWABLE ENERGIES AND PRESENT USE 85 5.1 Bioenergies 86 5.2 Solar Energy 86 5.3 Wind Power 87 5.4 Geothermal Energy 87 5.5 Hydro Power 87
6 MARKET RISK ANALYSIS AND BARRIERS FOR MARKET ENTRY 88 6.1 General Situation 88 6.2 Business Development 88 63 Intellectual Property Rights 89 6.4 Taxation 89
7 RENEWABLE ENERGY BUSINESS INFORMATION AND CONTACTS 89
8 BIBLIOGRAPHY 91
9 ANNEX 92
CONTENTS
KYRGYZ REPUBLIC

Renewable Energies in Central Asia
KYRGYZ REPUBLIC
76
ACRONYMS AND ABBREVIATIONS REPUBLIC OF KYRGYZ REPUBLIC
ADB Asian Development Bank
CAR Central Asian Region
CCA Common Country Assessment
CDM Clean Development Mechanism
CHP Combined Heat and Power Plant
CIS Commonwealth of Independent States
GDP Gross Domestic Product
GEF Global Environmental Facility
GHG Greenhouse Gas
DDP Distribution Demonstration Project
EBRD European Bank for Reconstruction and Development
EPC JSC Electric Power Plants (GenCo)
FSU Former Soviet Union
GEF Global Environment Facility
GHG Greenhouse Gas Emissions
HPP Hydro Power Plant
HV High Voltage
HVL High Voltage Lines
HVN High Voltage Network
IBRD International Bank for Reconstruction and Development
ICWC Interstate Commission for Water Coordination
IDA International Development Association
IEA International Energy Agency
IPP Independent Power Producers
JICA Japan International Cooperation Agency
JSC Joint Stock Company
KNG Kyrgyz Nefte Gas
KPC Kyrgyz Petroleum Company
MB&C Metering, Billing and Collection
MDG Millennium Development Goals
MEIFR Ministry of Energy, Industry and Fuel Resources
NEG National Electric Grid of Kyrgyzstan
NGO Non Governmental Organization
NPRS National Poverty Reduction Strategy
O&M Operation and Maintenance
PCCAR Power Council of Central Asia Republics
PREGA Promotion of Renewable Energy, Energy Efficiency and Greenhouse Gas Abatement
PRSP Poverty Reduction Strategy Paper
PV Photovoltaic
UDC Unified Dispatch Center
UNDP United Nations Development Program
UNDAF Development Assistance Framework
UNFCCC United Nations Framework Convention on Climate Change
UPSCAR United Power System of Central Asia Republics
UN United Nations
USAID United States Aid
USD United States Dollars
VAT Value Added Tax
WB World Bank
WTO World Trade Organization
ACRONYMS, ABBREVIATIONS AND MEASUREMENTS

Renewable Energies in Central Asia
KYRGYZ REPUBLIC
77
MEASUREMENTS
kV kilovolt (1kv = 1,000 V)
MW megawatt (1MW = 1,000 kW)
GWh gigawatt hour (1 GWh = 1,000,000 kWh)
TWh terawatt hour (1 TWh = 1,000,000,000 kWh)
kJ kilojoule (1 kJ = 1,000 Joule)
ktoe kilotons of oil equivalent (1ktoe = 11,630,000 kWh)
m meter
km2 square meter
km kilometer
kWh kilowatt hour
h hour
ACRONYMS, ABBREVIATIONS AND MEASUREMENTS

Renewable Energies in Central Asia
KYRGYZ REPUBLIC
78
1 SUMMARY
The Kyrgyz Republic generates most of its electricity from abundant hydro power resources in the mountainous areas. Due to an increasing demand and inflows into the large stor-age reservoirs that are lower than the average there is a serious energy crisis, which is enhanced by the slow deterioration of existing facilities and equipment. Other Renewable Energies (RE) are presently not exploited except for some very small private initiatives. There is still a vast potential of unutilized small, medium and large hydro power. The country does not have sufficient resources to develop this potential. While the large potentials are being tackled by international companies, the smaller ones are not being utilized because of the lack of a clear legal and regulatory framework, including tariffs and the licenses for the construction and operation.
There are also potentials for other RE sources, mostly solar, but no systematic data on physical, technical and eco-nomic potentials are available.
Presently, the major players are international donors and NGOs but while these efforts are locally effective and helpful they do not mitigate the general situation in the coun-try and do not support the overall provision of a safe, reliable and accessible energy supply from sustainable sources for the people, especially in rural areas.
While Kyrgyzstan is officially promoting the increased development of RE, has signed most relevant international treaties and its national legislation promotes investment from foreign and resident investors alike, the reality for private in-vestors is still too insecure to attract the increased efforts re-quired to develop the existing resources. It is also necessary that the country promote the collection and analysis of funda-mental data on the total amount and spatiotemporal distribu-tion of technical potentials of various Renewable Energies.
SUMMARY

Renewable Energies in Central Asia
KYRGYZ REPUBLIC
COUNTRY INTRODUCTION 79
2 COUNTRY INTRODUCTION
2.1 GEOGRAPHY AND CLIMATIC CONDITIONSThe Kyrgyz Republic (Kyrgyzstan) is located in the heart of Central Asia bordering Kazakhstan in the North and North West, Uzbekistan in the South West, Tajikistan in the South and China in the South East. Kyrgyzstan is a rugged country with the Tien Shan mountain range covering approximately 95 % of the whole territory. The mountain tops are covered with perennial snow and glaciers.
The country‘s generally mountainous terrain has an average elevation of 2,750 meters above sea level. 94 % of the country is over 1,000 m above sea level and about 41 % is over 3,000 m.
Kyrgyzstan is a landlocked country with a dry con-tinental to polar climate in high Tien Shan Mountains, sub-tropical climate conditions in Southwest (Fergana Valley) and temperate climate in the Northern foothill zone.
2.2 POLITICAL AND ECONOMIC DEVELOPMENT After gaining independence, Kyrgyzstan was progressive in carrying out market reforms such as an improved regulatory system and land reforms. Kyrgyzstan was the first Common-wealth of Independent States (CIS) country to be accepted into the World Trade Organization. Much of the Government‘s stock in enterprises has been sold. Drops in production had been severe after the breakup of the Soviet Union in Decem-ber 1991, but by mid-1995, production began to recover and exports began to increase. The economy is heavily weighted towards gold export, and a drop in output at the main Kumtor gold mine sparked a 0.5 % decline in Gross Domestic Product (GDP) in 2002 and a 0.6 % decline in 2005.
The Government made steady strides in controlling its substantial fiscal deficit, nearly closing the gap between revenues and expenditures in 2006, before boosting expen-ditures more than 20 % in 2007–08. The Government and international financial institutions have been engaged in a comprehensive medium-term poverty reduction and economic growth strategy. In 2005, Bishkek agreed to pur-sue a much-needed tax reform and, in 2006, became eligible for the Heavily Indebted Poor Countries (HIPC) initiative. Progress in fighting corruption, further restructuring of do-mestic industry and success in attracting foreign investment
are key elements to future growth. GDP grew more than 6 % per year in 2007–08, partly due to higher international gold prices, but growth is likely to decline from that level in 2009, due to declining demand and lower commodity prices in the wake of the international financial crisis.
SHORT BUSINESS INFOThe Kyrgyz Government is developing anti-crisis measures aimed at (i) load shedding, (ii) an increased production at Combined Heat and Power Plants (CHPs), (iii) imports of electricity and attracting investments into new generation facilities including small hydro power and (iv) the devel-opment of RE to improve the power supply and to reduce the deficit.
The Central Asian Republics (CARs) have large water and en-ergy resources, but their distribution is highly skewed. The two largest rivers, the Amu Darya and Syr Darya with an annual average flow of 116 km3/year originate from snowmelt and rainfall in the mountainous upstream countries of Tajikistan and the Kyrgyz Republic. The rivers then run for about 1,500 km through the arid plains of the downstream countries of Uzbekistan, Turkmenistan and Kazakhstan towards the Aral Sea. In terms of primary energy resources, Kazakhstan has significant reserves of hydrocarbons (oil and gas and coal); Uzbekistan has considerable amounts of gas and some oil and coal, whereas Turkmenistan has substantial reserves and pro-duction of natural gas. In contrast, the Kyrgyz Republic and Tajikistan have negligible amounts of commercially exploit-able fossil fuels, but enjoy generous water resources with an abundant hydro power potential.
The integrated water and power system developed un-der the Soviet system soon came under pressure given the new political and economic realities in the CARs. The main trans-boundary water and energy issue that has emerged concerns the operation of the Toktogul Reservoir where a conflict has arisen between the energy needs of the Kyrgyz Republic, the irrigation needs of the downstream riparian areas and the tim-ing of environmental flows to the Aral Sea.
FIGURE 1
Map of Kyrgyzstan
K A Z A K H S T A N
T A J I K I S T A N
BISHKEK
C H I N A
U Z B E K .
Ysyk-KölKarakol
Jalal-Abad
Sary-Tash
Kyzyl-KyyaOsh
Tokmok
BalykchyTalas
Naryn
K A Z A K H S T A N
T A J I K I S T A N

Renewable Energies in Central Asia
KYRGYZ REPUBLIC
COUNTRY INTRODUCTION 80
3 ENERGY MARKET IN THE KYRGYZ REPUBLIC
3.1 IMPORTANT PLAYERS OF THE KYRGYZ ENERGY MARKET
After the country’s independence, the Kyrgyz Government initiated an unbundling of the existing power system in 2000. The formation of a new joint stock company, JSC Electric Power Plants, took place in September 2001. This company owns the hydro power stations in Toktogul cascade, the two thermal power stations in Bishkek and Osh and various heat plants. The Joint Stock Company (JSC) National Grid is the legal successor to Kyrgyzenergo and includes the national dis-patching center, all High Voltage (HV) transmission lines of 110 kV and higher, any 35 kV lines that are an integral part of the transmission network and all associated substations. It can play a neutral and common role in an unbundled sector, although generation at this stage remains a near monopoly. Four state-owned distribution companies were formed:
Severo (North) Electro (Bishkek, Chui and Talas Oblasts) Vostok (East) Electro (Issyk-Kul and Naryn Oblasts) Oshelectro (Osh Oblast) Jalal-Abadelectro (Jalal-Abad Oblast)
The scheme below shows the unbundled power system: one generating company, one transmission company and four dis-tribution companies. The Ministry of Industry, Energy and Fuel Resources regulates the tariffs.
The transmission company functions as a common carrier and the generation company handles exports. Except for some small hydro power generators, there are no Inde-pendent Power Producers (IPP).
The Electricity Law and the Electricity Market Rules set regulations for basic requirements in the market interac-tion of electricity generation, transmission and distribution organizations as well as in the operation of all the economic entities engaged in electricity generation, transmission, distri-bution and sales, both in the domestic market and for exports, irrespective of their ownership.
LAND AREA: 191,000 km2
POPULATION: 5,43 million (as of July 2009)
DENSITY: 26 inhabitants/km2
BIGGEST CITIES AND INHABITANTS:
Bishkek (0.75 million), Osh (0.2 million)
LANGUAGE: Kyrgyz 64.7 % (official), Uzbek 13.6 %, Russian 12.5 % (official), Dungun 1 %, other 8.2 % (1999)
ALTITUDE: 132 m to 7,439 m (Pik Pobedy)
RIVERS: more than 40,000 rivers and streams with Naryn River 807 km being the longest river within the country
ECOSYSTEM AREAS: Forests (4 %), shrub land, savannah, grassland (56 %), cropland and crop/natural vegetation mosaic (27 %), urban and built-up areas (0.4 %), sparse or barren vegetation, snow and ice (7 %), wetland and water bodies (4 %)
GDP – PER CAPITA (PPP): USD 2,200 (as of 2008)
INFLATION RATE: 24.5 % (as of 2008)
AGRICULTURE – PRODUCTS: Tobacco, cotton, potatoes, vegetables, grapes, fruits and berries; sheep, goats, cattle, wool
INDUSTRIES: Small machinery, textiles, food processing, cement, shoes, sawn logs, refrigerators, furniture, electric motors, gold, rare earth metals
ELECTRICITY – PRODUCTION: 15.62 billion kWh (as of 2006)
ELECTRICITY – CONSUMPTION: 8.99 billion kWh (as of 2006)
ELECTRICITY – TARIFFS: 1.5 US Cent/kWh
NATIONAL ELECTRICITY CAPACITY IN OPERATION:
3600 MW
NATURAL RESOURCES: Abundant hydro power; significant deposits of gold and rare earth metals; locally exploitable coal, oil, and natural gas; other deposits of nepheline, mercury, bismuth, lead, and zinc
ELECTRIFICATION RATE: 965 barrel/day (as of 2007)
OIL – PRODUCTION: 0.28 thousand barrels/day (as of 2007)
OIL – EXPORT 2,534 barrel/day (as of 2005)
OIL – CONSUMPTION: 12,330 barrel/day (as of 2007)
OIL – PROVEN RESERVES: 40 million barrel/day (as of 2008)
NATURAL GAS – PRODUCTION: 18 million m3 (as of 2007)
NATURAL GAS – PROVEN RESERVES:
5,663 billion m3 (as of 2008)
EXPORTS: USD 1.85 billion (as of 2008)
EXPORTS – COMMODITIES: Cotton, wool, meat, tobacco, gold, mercury, uranium, natural gas, hydro power, machinery, shoes
EXPORTS – PARTNERS: Russia 29.4 %, Switzerland 16.2 %, Kazakhstan 15.1 %, Afghanistan 12.3 %, China 7.6 %, Uzbekistan 5.8 % (as of 2008)
Source: CIA World Fact Book, as of 2009

Renewable Energies in Central Asia
KYRGYZ REPUBLIC
COUNTRY INTRODUCTION 81
Source: unknown
FIGURE 2
Kyrgyz Power Sector
Policy and RegulationMinistry of Industry, Energy and Fuel
resources
JSC Electric Power Plants
JSC National Grid
End-use consumers
Sver (North) Elec-tro (Bishkeek, Chuj and Talas oblasts)
Vostok (East) Elec-tro (Issyk-KuI and
Naryn oblasts)
Oshelectro (Osh oblast)
Jalal-Abad electro (Jalal-Abad oblast
Independent small HPPs
Large industrial Consumers
SHORT BUSINESS INFOThere is no feed-in tariff for electricity from RE sources and the effective legal framework does not provide an ap-parent support to such projects.
Bulk electricity sales and purchases between the generation and distribution organizations, importers and large industrial consumers are based on power purchase contracts. Distribu-tion companies and independent small producers sell elec-tricity to end-users under a standard contract on supply of electricity developed and approved by the Government. The transmission company is not permitted to sell and purchase electricity.
The Kyrgyz Republic was the first country in the CIS to establish an independent regulatory agency for economic regulation of the energy sector – the State Energy Agency. In 2007, regulatory functions were taken over by the newly es-tablished Ministry of Industry, Energy and Fuel Resources. Standard power purchase contracts are now developed and approved by the sector regulator. Normally, the contracts are executed for one year. It is allowed to conclude long-term con-tracts if they are approved by the sector regulator.
3.2 PRIMARY ENERGY CONSUMPTION, TRANSMISSION AND PRICES
In 2005, the total primary energy consumption in the Kyrgyz Republic was 2798 ktoe as estimated by the International En-ergy Agency (IEA). See the following figures for the share of total primary energy supply in 2005:
45.8 % of the total primary energy supply is domes-tic production and 54.2 % is imported. See the annex for the share of domestic production, import and export.
FIGURE 4
Major Consumer Groups for Primary Energy
Source: International Energy Agency, as of 2005
Losses 13 %
Non Specified 24 %
Agriculture/Forestry 9 %
Residental 10 %
Transport sector 17 %
Industry sector 27 %
FIGURE 3
Share of Total Primary Energy Supply
Source: International Energy Agency, as of 2005
Oil 20,8 % %
Combined renewable & waste 0,1 %
Gas 20,4 %
Coal 18,2 %
Hydro 40,5 %

Renewable Energies in Central Asia
KYRGYZ REPUBLIC
COUNTRY INTRODUCTION 82
SHORT BUSINESS INFOThe losses in the distribution system are in the range of 40–50 %. Reliability is poor. Tariff collection rates range from 70–80 %.
As mentioned already in section 3.1, there are four electricity distribution companies set up on a regional basis which own and manage 65,000 km of local distribution lines (0.4–35 kV) and serve more than one million households and other con-sumers. Distribution companies are obliged to provide unin-terrupted electric power to all consumers in their respective re-gions, except in areas served by generating companies if there is a contract for direct supply. The distribution companies are also obliged to buy electricity from generators, except where they themselves generate electricity. The distribution compa-nies can import and export electricity via networks rated at 35 kV or less. Two out of four distribution companies – JSC Oshelectro and JSC Vostokelectro – export limited volumes of electricity to Tajikistan and China respectively. Distribu-tion companies provide collection services for consumers of electricity, which require significant financial assets and mod-ernization of metering and accounting.
Electricity Sector and Natural ResourcesThe bulk (around 90 %) of the Republic’s current total gener-ating capacity is hydro power. The total installed capacity of the Kyrgyz power sector is 3,680 MW, including 2,950 MW from 15 Hydro Power Plants of which 97 % originate from the Naryn Cascade and 730 MW from two Combined Heat and Power plants (CHPs). The actual production, however, is much lower due to deferred maintenance and old equipment waiting to be replaced.
SHORT BUSINESS INFOThe actual electricity deficit is estimated at 2 billion kWh annually and forced the Government to introduce strict limitations of electricity supply.
The CHP plants serve primarily industrial demands for heat and hot water and provide municipal district heating in the two biggest cities Bishkek and Osh.
According to the Energy Law, the Department of Regulation of the Power Sector under the Ministry of Industry, Energy and Fuel Resources is given the responsibility to establish pricing and tariff mechanisms. The tariff setting procedure, however, is still a politically sensitive issue in the Kyrgyz Re-public and existing electricity and heat tariff levels do not cover the costs of providing services. Furthermore, there are over twenty categories of customers who enjoy tariff discounts mandated by the Government. In 2008, tariffs for electricity ranged from approximately 1.5 to 2 cent/kWh, depending on the respective customer group.
More detailed tariff schedules and an overview of tar-iff increases for electricity and heat are attached in the annex.
The Transmission and Distribution SystemThe high voltage transmission network of the Kyrgyz Repub-lic was designed as part of the Central Asia Interconnected System and configured to meet both regional and national transmission needs. It is, however, essentially the result of un-even distribution of load and generation resources. The bulk of generation is located in the southern part of the country while a very substantial portion of the load is in the northern region in and around Bishkek. This spatial separation and the mountainous nature of the terrain resulted in two well-de-fined systems, North and South, with a relatively weak link in between that must carry substantial flows of energy.
The distribution system of the Kyrgyz Republic in-cludes all facilities at or below of 35 kV. It includes extensive 6/10 kV and 0.4 kV lines resulting in a design loss in the range of 12 %. This design characteristic leading to relatively high technical loss was accompanied by low construction quality leading to faster deterioration of structures, lines and substa-tions. The redistribution of demand among consumer groups led to the drop in the demand of the industrial and agricul-ture sectors and rapid growth of residential demand. This higher residential demand was stimulated by very low tariffs displacing more traditional energy resources for heating, hot water and cooking. Since electricity losses are higher in the residential sector, this also contributed to a four-fold increase in losses. This redistribution of demand resulted in a marked increase in the seasonal variation of the load representing a ratio of 3:1 between the month of highest demand (January) and that of lowest demand (May). Overloading of the systems in order to meet the high winter demand during the last ten years has accelerated the deterioration process and increased the number of service interruptions. About 30 % of the distri-bution systems need to be repaired or replaced.
Moreover, there is a serious problem of non-technical losses through lack of metering, inaccurate metering, fraud and inability of the utilities to properly track power flows and pinpoint problems. The table below represents the electricity balance of the Kyrgyz Republic including the overall level of losses, both technical and commercial.
According to local estimates, approximately 95 % of the population is connected to the grid.
Source: data compiled by the author
TABLE 1
Kyrgyz Power Sector
GENERATION FACILITY INSTALLED CAPACITY (MW)
PRODUCTION (GWH)
COMMISSIONING DATE
Toktogul HPP 1,2 4,787 1975
Kurpsay HPP 800 3,457 1982
Tashkymir HPP 450 2,006 1987
Shamaldisay HPP 240 915 1995
Uch-Kurgan HPP 180 973 1962
Atbashi HPP 40 150 1970
Small HPPs 40 50 1958
Bishek CHP-1 678 1,166 1977
Osh CHP 50 49 1986
Total Installed 3,678 13,553

Renewable Energies in Central Asia
KYRGYZ REPUBLIC
COUNTRY INTRODUCTION 83
In 2005, the total electricity production was 16,415 GWh of which 86,9 % were produced by hydro power, 9,5 % by gas and 3,6 % by coal.
Oil and GasKyrgyzstan contains five oil and gas fields with allegedly considerable resources that are, however, mostly unproved. Since demand for oil and gas is also moderate, Kyrgyzstan could eventually become self-sufficient in oil and gas, but for-eign capital is needed. Exploration and production licenses for hydrocarbons and coal are issued by the State Agency for Geology and Mineral Resources. Today, Kyrgyzstan produc-es minor amounts of natural gas, about 30 million m3 per year. Demand, on the other hand, sums up to around 700 million m3 per year, the difference is imported, mostly from Uzbekistan.
Coal In the country, considerable coal deposits are existing. Prob-able and possible coal resources are estimated at 6.73 billion tons of hard and bituminous coal and lignite. With recover-able coal resources estimated at 1.3 billion tons, Kyrgyzstan ranks fourth in the former Soviet Union after Russia, Kaza-khstan and Ukraine.
The largest consumer of used energy from coal in the country, however, is Bishkek. The CHPs were designed to use coal resources from Kazakhstan, which has to be imported.
Import and Export of EnergyThe hydro generation capacity in Kyrgyzstan has to mesh with the needs of the large irrigation schemes that have been built in Uzbekistan and Kazakhstan. The Kyrgyz Republic releases water from the Toktogul Reservoir for irrigation and produces more electricity than is needed for its own purposes during this time of the year. Excess electricity is exported to Uzbekistan and Kazakhstan, which in return supply gas, oil and coal to the Kyrgyz Republic for their thermal plants. Kyr-gyzstan has not imported electricity, yet. This year, the Kyrgyz Government is negotiating on the import of electricity from Turkmenistan to mitigate the upcoming energy crisis and to make up for the deficit of domestic generation. In the annex of this country analysis, power export/import data from Kyr-gyzstan to other CAR countries can be found.
Transport 1 %
Other non specified
Agriculture/Forestry 27 %
Residental 32 %
Industry 34 %
Source: International Energy Agency, as of 2005
FIGURE 5
Consumer Groups of Electricity
Growth Predictions for the Energy SectorThere are major problems in the Kyrgyz Republic concern-ing the demand management of electricity. Low tariffs and weak progress towards the electricity loss reduction provide space for a high growth in demand. One of the recent stud-ies conducted by the SNC Lavalin Company developed two scenarios for a demand forecast: one base case scenario assum-ing tariff increase and loss reductions whereas the second one is a high growth scenario. The base case scenario envisages a slow growth of 0,6 % in the years 2007–2011, 2,7 % in the years 2012–2014 and then a 3,2 % annual growth. The high demand case projects an annual growth of 3.2 %.
4 POLICY FRAMEWORK FOR RENEWABLE ENERGIES
4.1 NATIONAL STRATEGIES AND PROGRAMS TO SUPPORT RENEWABLE ENERGIES
For many years now, the Kyrgyz Republic has considered the development of its hydro power resources for the export mar-ket to be the central foundation of its overall economic devel-opment. Therefore, there is keen interest in attracting foreign investors as joint venture partners to complete the construc-tion of several large Hydro Power Plants that were started or planned some years ago. The development of small hydro pow-er resources and other RE resources has always been empha-sized as an important and necessary step, but no national plans have ever been consistently and comprehensively elaborated.
SHORT BUSINESS INFOIn 2008, the Kyrgyz Parliament approved the National En-ergy Program and Strategy for the Fuel and Energy Sector Development until 2025. This Strategy calls for a focus on the small hydro power sector as one of the priorities for the energy sector development.
The Kyrgyz Republic has ratified the following conventions in the field of environment protection:
The UN Framework Convention on Climate Change and Kyoto Protocol to the UN Framework Convention on Climate Change
The Convention on Access to Environmental Information and Public Participation in Decision-making on Environ-mental Issues
In 1999, the Legislative Assembly of Jogorku Kenesh of the Kyrgyz Republic adopted the following laws, thus taking a sub-stantial step towards the development of a comprehensive leg-islation for environment and rational use of natural resources:
Law on Environment Protection Law on Atmospheric Air Protection Law on Ecological Expertise Law on Biosphere Territories in the Kyrgyz Republic Law on Fauna

Renewable Energies in Central Asia
KYRGYZ REPUBLIC
COUNTRY INTRODUCTION 84
In Kyrgyzstan‘s National Poverty Reduction Strategy (NPRS) it is stated that the sector on electric power production and distribution is and will be the highest priority sector for the country, which provides the Republic’s independence in elec-tric power. It is also intended to reduce emissions from ther-mal-electric systems.
The Poverty Reduction Strategy Paper (PRSP) Progress Report of April 20041 mentions that measures for increasing the share of alternative and RE sources from 0.15 % of the total energy produced in 2001 to 3.5 % in 2005 include the development of solar heating systems, production of solar en-ergy collectors for heating and hot water supply.
According to Government Reports, emissions from energy production constitute about 35 % of the total Green-house Gas (GHG) emissions. The development of Kyrgyzstan’s hydroenergy and non-traditional energy sources is of consid-erable interest, both for the energy sector development and for simultaneous GHG emission reduction. The National Com-munication also stresses that a thoroughly planned policy of developing its energy sector would allow the Kyrgyz Republic to become the biggest electricity producer in the region. Not only would the industry be able to meet the current electric-ity needs of the population, it would also allow to switch to all-electric cooking and heating, thereby replacing the organic fuels which currently take up the greater part of energy con-sumption.
The forest coverage of currently around 4 % is further decreasing mainly due to illegal logging stimulated by high prices for firewood, which are due to an increasing demand in rural areas without reliable electricity supply. As the forest cover has already been removed from many mountainous ar-eas, floods and mudslides have become common phenomena, thereby further accelerating erosion. The decrease in forest ar-eas also negatively affects the country’s rich ecosystems, caus-ing a loss of biodiversity as many species live in the forests.
4.2 REGULATIONS, INCENTIVES AND LEGISLATIVE FRAMEWORK CONDITIONS
Over the last ten years, the Kyrgyz Republic has initiated a series of legal and regulatory reforms designed to improve the financial viability and quality of service of the power sector. These include the passage of the Energy Law and the Elec-tricity Law, the creation of an independent energy regulatory body and the adoption of the Government’s Program for re-structuring and privatizing the power sector. The respective actions are summarized below:
Enactment of the Energy Law in 1996 Establishment of an independent State Energy Agency charged with licensing and tariff setting authorities
Passage of the Electricity Law in 1997 to establish the legal framework for unbundling and privatizing the power sector
In February 2007, a new law on the structure of the Govern-ment of the Kyrgyz Republic was adopted and a new Min-istry of Energy, Industry and Fuel Resources (MEIFR) was established. The functions and responsibilities of regulatory
oversight of the power sector were given to the Department of Regulation, which is part of the MEIFR.
The Government of the Kyrgyz Republic has passed a large number of basic laws, which together provide the frame-work to regulate and restructure the power sector. Power gen-eration is currently a virtually Government-owned monopoly (more than 97 % of the installed capacity). Private ownership is now allowed but will occur mainly through private invest-ment in new small-scale generation systems. Transmission is also a Government monopoly, but the Government has agreed to privatize one of the four distribution companies as a pilot project.
The power sector is governed primarily by the Law on Electricity and the Law on Energy. There are also a number of other legislative acts, presidential decrees and Government resolutions regulating the production, transportation, distri-bution and consumption of electrical and heat energy.
The Law on Energy defines the general principles for energy supply efficiency, including the following provisions for a regulatory oversight in the sector:
Licensing of production, transportation and distribution of electrical and heat energy as well as gas
Assessment of tariffs De-monopolization of the industry and development of a competitive environment
Implementation of the state standards within the industry Implementation of an economic use of the electrical and heat energy and use of gas and oil
Construction of energy production or transmission facilities
The Electricity Law establishes the legal framework for regu-lating the production, transmission, distribution and con-sumption of electric energy in Kyrgyzstan including:
General provisions for licensing: With the exception of those entities generating electricity for their own use, all state and all non-state legal entities and individuals are prohibited from engaging in the generation, transmission, distribution or sale of electricity or thermal energy without first obtaining a license issued by the sector regulator. Any activity involving power generators of at least 1,000 kW or more are required to obtain licenses from the sector regulator. The Electricity Law also stipulates that any state or private entities as well as individuals engaging in the import, export or sale of electricity are required to obtain a license.
Rules on generation licenses: No generator shall be granted exclusive or monopoly rights under the legislation of the Kyrgyz Republic. Energy enterprises can sell the electric or thermal energy they generate to the national grid, distributors or major consumers. The market is open to all businessmen provided that they comply with the licens-ing requirements, the provisions of the National Energy Program and the legislation of the Kyrgyz Republic. The issuance of any license related to hydroelectric generation must be subject to a prior study concerning the impact on the water use for purposes other than electric generation.
1 IMF, AS OF 2004

Renewable Energies in Central Asia
KYRGYZ REPUBLIC
COUNTRY INTRODUCTION 85
The results of the study have to be transmitted to inform the local authorities of the territory in which the hydro-electric station will be constructed or will have effects.
New generation capacities: The sector regulator shall issue licenses for the construction of power plants and high voltage networks.
Third party access to the national grid: The holder of a transmission license cannot restrict access to the national grid or impose unreasonable requirements on users of or sellers to the national grid.
Environmental protection: License holders should bear the cost of preventing or attenuating pollution from their op-erations in accordance with the environmental protection laws and regulations of the Kyrgyz Republic. The decision to build a new Hydro Power Plant shall be subject to an environmental impact assessment prior to the issuance of a construction permit. The assessment reports must be avail-able to the public and subject to public inquiry in accord-ance with the legislation of the Kyrgyz Republic.
All hydrotechnical facilities located on Kyrgyz territory and utilizing water resources of the Kyrgyz Republic are regulated by the Land Code, the Water Law of the Kyrgyz Republic and other legal acts. The land plot under each hydro technical facility belongs to the Water Fund.
Payment of water use fees is usually not required if the water used for power generation is released into the same stream or canal it has been diverted from and if the same wa-ter is not further utilized in another way.
Transmission fees have to be paid to the owner of the grid (either JSC National Grid or one of the four electrical distribution companies) if existing transmission and distribu-tion facilities are used.
SHORT BUSINESS INFOThere are no standard procedures in place for small scale independent power producers.
Clean Development Mechanism (CDM)The reduction of greenhouse gas emissions in connection with CDM Projects in developing countries like Kyrgyzstan might be used by the developed countries to fulfill their Kyoto Protocol obligations. The developed countries are allowed to purchase a part of reduced greenhouse emissions from oth-er countries as expenses on such reduction in the developed countries are much higher than in developing ones.
Thus the CDM Projects are aimed to attract invest-ments, to stimulate the transfer of new technologies to the developing countries and at the same time to solve the envi-ronmental problem – particularly to mitigate the influences of the climate change. The implementation of projects gives new opportunities to organizations of the country independ-ent from their form of property and institutional subordina-tion to modernize manufactures that reduce greenhouse gas emissions.
The United Nations Development Program (UNDP) has recently launched a new project on CDM. The main project objective is to assist the Kyrgyz Republic to create in-stitutional and technical capacity for an effective management
of the commitment under the United Nations Framework Convention on Climate Change (UNFCCC) and the Kyoto Protocol. The latter provides opportunities for Kyrgyzstan to reduce its GHG emissions in the framework of the CDM Projects funded by the developed countries. Currently, it is too early to discuss any achievements or accomplishments of this project.
5 POTENTIAL FOR RENEWABLE ENERGIES AND PRESENT USE
Low tariffs and abundant hydroelectric power resources have constrained the development of RE sources in the Kyrgyz Re-public for years. However, recent initiatives of the Govern-ment towards the tariff increase, privatization of some energy facilities and severe climatic changes will change the attitude towards clean energy. Except for hydro, most of the other re-newable systems are due to individual efforts.
To date, only a few scattered and largely uncoordi-nated efforts have been made to develop the country’s rich RE resources such as mini/micro hydro power, biogas or solar technologies. The most significant among these initiatives are the Small Community Hydro Project in Jangy-Naukat fund-ed by United States Aid (USAID), Osh Oblast, the Financial Engineering Program for Development of Small hydro power Stations in Kyrgyzstan funded by the Government of Norway, the Renewable Energy Driven Pump Systems Initiative fund-ed by the Nordic Trust Fund, the Ecological Center Issyk-Kul funded by the German Government and the regional project for the Promotion of Renewable Energy, Energy Efficiency and Greenhouse Gas Abatement (PREGA) co-financed by the Netherlands and the ADB. Furthermore, a number of individ-ual RE installations have been implemented with the support of the Global Environment Facility (GEF) Small Grants Pro-gram in Kyrgyzstan, in particular micro hydro power stations, biogas and solar installations.
Recently the UNDP project Promotion of micro hy-dro power units for Sustainable Development of Mountain Communities in Kyrgyzstan was initiated. This project fo-cuses exclusively on compact micro hydro power generating units with capacities of less than 5 kW, which are operated in isolated mode and are sufficient to supply one or several rural households with electricity. The project also focuses on moun-tainous areas in or in the vicinity of nature reserves in Kyr-gyzstan. The Japan International Cooperation Agency (JICA) is considering the preparation and implementation of biogas projects in the rural areas of the Kyrgyz Republic introducing new technologies through pilot installations.
While all the aforementioned initiatives are highly recommendable in that they are pioneering the introduction of RE technologies in Kyrgyzstan, they lack a holistic ap-proach to specifically address the barriers that are currently hampering the widespread and sustainable introduction and distribution of these technologies in Kyrgyzstan’s rural com-munities. As a consequence, most of the scattered efforts have but a limited impact and therefore cannot significantly miti-

Renewable Energies in Central Asia
KYRGYZ REPUBLIC
COUNTRY INTRODUCTION 86
gate the challenges arising from the increasing use of fossil and local biomass fuel as a source of energy in rural areas in Kyrgyzstan. The majority of the rural population (65 %) has no opportunity to use clean fuels for cooking and heating pri-marily because of poverty. Therefore, the forests are cut down to use wood as fuel including the best ones and the so-called relic forests. Of the recommended policies for the develop-ment of RE systems identified by the World Bank a decade ago, few have been implemented and even fewer successfully. The main reasons for a high interest of the Kyrgyz Republic in a larger share of RE in the energy balance are the following:
Given the high degree of dependence of the country on imported fuels, the use of RE sources could reduce the country‘s dependence and export bill.
The high numbers of rural and nomadic population with no access to the electricity grid could be supplied by stand-alone (dispersed) RE systems.
5.1 BIOENERGIESThe technical potentials for bioenergy are not known and the use of bioenergy in its various application forms is limited to a few scattered operations initiated by individuals
Solid BiomassSince in the rural areas the living conditions are quite bad, people are changing from traditional energy sources like electricity, coal and oil products to dung and wood. This transfer in turn creates significant ecological problems. Dung is used as a fuel rather than a the fertilizer, which leads to soil degradation. The use of wood and bushes for fuel causes a deforestation problem. Solid biomass will become even more popular with the current outages of power, eventual tariff increase and world pricing trends. Modern solid biomass, such as fuel granules or fuel pellets, is not being utilized.
Liquid (Bioethanol or Biodiesel)There are no known activities related to bioethanol or biodie-sel. No estimates of the potentials are available. In general, Central Asian regions that now grow cotton have the poten-tial to grow an indigenous plant called camelina sativa (also known as false flax, wild flax, linseed dodder, German ses-ame or Siberian oilseed) as a source for biofuel production. Camelina could possibly replace cotton crops because it needs less water and is drought resistant.
BiogasKyrgyzstan‘s dominant agricultural crop is currently wheat. Biomass gasification for fixed-bed power gasifiers has been commercially proven only for wood, charcoal, rice husk and coconut shell feedstock. Among these four, only rice is grown in larger quantities in Kyrgyzstan, but its production is still quite low. The forest product industry also shows little prom-ise for biomass power generation – either for gasification or for direct combustion. Forest cover in the country has fallen from 7 % to nearly 4 % in recent years, and Kyrgyzstan‘s wood products are primarily imported from Russia. Not only is the
fuel supply limited, the economics of biomass gasification are also less favorable because disposal costs are low.
National electrification estimates also indicate that the market for power generation gasifiers will continue to be limited because of the availability of low-cost hydro power. The limited fuel supplies, small market potential and the low cost of the alternative (bulk power from the grid) lead to con-clusion that biomass power development is currently not an efficient use of scarce development resources.
Kyrgyzstan‘s 9 million hectares of natural mountain pastures and its one million additional hectares of arable valley land helped to make livestock production the mainstay of the country‘s agrarian output. At its peak, Kyrgyzstan provided 40 % of the former Soviet republics wool and exported large amounts of meat and dairy products to neighboring republics. With the dissolution of the Soviet Union and a subsequent disruption of traditional supply and trade links, livestock numbers fell sharply. As a result of the breakup of collectives, there is dispersed ownership of livestock and the econoMIEs of scale needed for economical, grid-connected biogas power generation are clearly absent. Family biogas digesters for cook-ing and for limited heating purposes show economic potential for the future, however. Rural families in Kyrgyzstan have high numbers of livestock, indicating a significant potential market for household-size digesters. Fossil fuels, primarily im-ported from Kazakhstan, Russia and Uzbekistan, are costly in Kyrgyzstan and many rural families are going back to the use of animal wastes for cooking or to electricity for cooking and heating whenever possible.
SHORT BUSINESS INFOFamily biogas digesters for cooking and for limited heating purposes show economic potential for the future.
There are around fifty biogas installations in the country. Half of them are operational, the rest is idle. Most of the plants with a capacity of 2–40 m3 have been constructed by individuals. The main outcome of the installations is gas for cooking and fertilizers. Most of these installations are handmade without proper design, manufacture and maintenance. To respond to these issues, JICA is planning to launch a project aiming at the pilot installations and technology introduction.
5.2 SOLAR ENERGYKyrgyzstan is between northern latitudes 39° and 43°. This would not normally be considered advantageous for solar po-tential. On the other hand, Kyrgyzstan‘s solar energy resources are stable and adequate because of its dry climatic conditions. There are about 2,600 hours of sunshine per year and radia-
Source: Renewable Development Initiative, as of 2009
TABLE 2
Annual Solar Radiation
REGIONAL ANNUAL RADIATION [KWH/A]
OON HORIZONTAL SURFACES
ON NORMAL SURFACES
Bishkek (plane) 1,540 1,560
Tien Shan (mountainous area 3614 masl)
1,850 1,913

Renewable Energies in Central Asia
KYRGYZ REPUBLIC
COUNTRY INTRODUCTION 87
tion is 1,500–1,900 kW/m2 per year.Kyrgyzstan claims two important industrial installa-
tions that produced about 30 % of the needs of the Former So-viet Union (FSU) in crystalline silicon for solid-state devices in the space and defense industries in the past. The Orlovka plant produces single-crystal silicon while the Tash-Kumyr plant, which has not been completed so far, was designed for the production of polycrystalline silicon. The Tash-Kumyr plant is currently producing silicon blocks for a foreign cus-tomer on a toll basis.
There aren’t any technologies to produce photovoltaic (PV) systems, however. Solar collectors for water heating are used by some resorts in the Issyk-Kul region and by the broad population. There is no local manufacturer of this equipment. Most of the installations are imported from China.The topography and land use are generally well suited for the use of solar energy. Kyrgyzstan‘s solar resources have fewer site-specific drawback factors; this could be advantageous for rural electrification, especially for nomadic people using portable PV applications. Kyrgyzstan‘s direct radiation is high, which is also good for solar water heating applications.
The main barriers for developing solar energy are of economic and institutional origin. The country is not able to mobilize the investments needed. There is no feed-in tariff for electricity from RE sources and no particular legal framework to support such projects. Nevertheless, the President of Kyr-gyzstan established the so-called Business Project KUN (kun in Kyrgyz means sun) for RE applications in 1999. KUN is an executive organ of state management under the Government and coordinates the state energy policy in the field of RE. As far as using solar energy, this project only foresees its use in water-heating devices.
SHORT BUSINESS INFOThe President of Kyrgyzstan established the so-called Business Project KUN for RE applications in 1999.
5.3 WIND POWERThere are no special studies on wind energy applications in the Kyrgyz Republic. A countrywide wind-atlas, however, is available, according to which there are some areas with wind speeds between 4–5 m/s. In addition, some technical experts mention the Issyk-Kul region, namely Balykchy town, where the conditions could be favorable for the development of wind installations. This direction needs to be further assessed and evaluated.
Currently there is no operative wind energy capacity in Kyrgyzstan. Moreover, there is no industry association or manufacturer in the country and no specific projects exist. There seems to be a technical potential of 2,500 MW installed capacity, but the feasible potential is uncertain. The most promising areas are in the northern part of the Chui district, the Osh district, the Issyk-Kul and the Djalal-Abad district. Hence, a comprehensive wind resource mapping study and wind monitoring program would be required. Wind resource assessments and mapping tools are available for other devel-oped and developing countries and have been applied there, for example in neighboring China. Although the development
of wind resources in the Republic of Kyrgyzstan cannot be supported at this time, the country could benefit from a wind resource assessment and monitoring program also. Bilateral and multilateral aid agencies are the most suitable vehicles for initiating and conducting such a program in Kyrgyzstan.
5.4 GEOTHERMAL ENERGYGeothermal resources are concentrated in the reservoirs formed in sediments of depressions and in the convective fis-sured hydrothermal systems of foothills.The geothermal resources of Kyrgyzstan are small and insuf-ficiently investigated. The application of thermal water is only used for bathing and spas. It is planned to use the thermal water in the area of the city Bishkek and in the valley of the lake Issyk-Kul.
At least 20 geothermal springs were identified and drilled in Kyrgyzstan during the time of the FSU. Examina-tions of temperature and flow data from these sites indicate low-grade heat resources with temperatures not above 55°C. Ak-Su, in the Karakol region, is the most promising site for geothermal development based on well temperatures and its proximity to a population centre. The 55 °C resource is in the marginal range of economic feasibility for heating purposes. Aside from the low temperature and low flow (83 m3/h), the site is 10 km away from Karakol meaning the reliability of such a project is very limited.
5.5 HYDRO POWERKyrgyzstan, being a mountainous country, has good sources of hydro power, but its potential has not been investigated in detail up to now. Kyrgyzstan‘s total hydro potential has been estimated to 162 billion kWh, while the technically exploitable resources are estimated at about 73 billion kWh and the economically exploitable to 48 billion kWh. Roughly 11 billion kWh have been exploited. The policy of the former-ly planned economy was to focus primarily on the exploita-tion of large projects. As a result, many small plants (up to 10 MW) that were in operation in the 1950s and 1960s were abandoned. A new study on hydro potential, which examines the main river basins of the country, is currently being under-taken. This study may prove that the real technically and eco-nomically exploitable hydro potential of the country (mainly in relation to small hydroelectric projects) is even greater.
Large Hydro PowerIt has already been said that the electricity generation depends mostly on large hydro power owned by the state. Additionally, there are three installations run by private businesses:
JSC Chakan GES, 29 MW JSC Kalininskaya GES, 1.4 MW Bystrovskaya GES, 9 MW
These companies are grid-connected and experience major problems with the regulatory framework such as tariff setting, transit through the distribution networks and access to new customers. All these issues are also in the scope of the UNDP

Renewable Energies in Central Asia
KYRGYZ REPUBLIC
COUNTRY INTRODUCTION 88
project Promotion of Micro Hydro Units, which deals with the institutional and regulatory aspects of hydro power.
Small Hydro PowerDespite regulatory problems, there are some individual efforts in the rural mountain areas to run mini and micro installa-tions of up to 10–20 kW. There is a continuous interest from the shepherds and farmers living in areas that are not grid-connected mainly in Issyk-Kul and Naryn regions.
The National Energy Program of the Kyrgyz Repub-lic for 2008–2010 refers to the construction of 92 potential new small Hydro Power Plants (178 MW total output ca-pacity), the restoration of 39 existing but abandoned small Hydro Power Plants (22 MW total output capacity) and the installation of water turbines at 7 existing irrigation reservoirs (75 MW total output capacity).
Upon request from the Kyrgyz Government, the Eu-ropean Bank for Reconstruction and Development (EBRD) has structured a technical cooperation
to carry out the strategic planning of mini/small (10 MW or less) and medium (30 MW or less) hydro power devel-opment in the country
to recommend investment/regulatory framework enhance-ments for development of small- and medium-sized hydro power projects
to prepare pilot projects for implementation together with a possible framework for EBRD financing products as well as public tender assistance for the award of respective concessions
The project is scheduled to start in 2009.
6 MARKET RISK ANALYSIS AND BARRIERS FOR MARKET ENTRY
The highest obstacle for entering into the Kyrgyz RE market is the apparent lack of clear framework conditions for investors, e. g. clear regulations on licensing and tariffs.
6.1 GENERAL SITUATION
CorruptionA survey in 2005, conducted by the international anti-cor-ruption group “Transparency International”, confirmed that graft is a serious problem in Kyrgyzstan, as it ranked in the top 20 % of the most-corrupt countries.2 The Government of the Kyrgyz Republic undertakes some critical actions to re-duce the level of corruption.
Availability of Local Know-howThere are two institutions in the Kyrgyz Republic that are educating professionals in the energy sector:
The Kyrgyz Technical University trains engineers for the
power sector and the different power companies in the generating, transmission and distribution sectors.
The Kyrgyz-Russian University has recently opened a spe-cial department on RE systems. This department prepares specialists to design and operate RE systems like hydro, wind and solar.
Kyrgyzstan like many other CIS countries faces high unem-ployment rates (11.2 % in 2008) and low wages. Due to the Soviet education system, however, many of the unemployed have a special and higher education. At the same time, there is a risk that with the upcoming privatization of at least three major power facilities the unemployment rate of the energy professionals will increase even further.
Especially in rural areas there is only very limited tech-nical know-how available on how to properly build, operate and maintain RE systems. Furthermore, while manufacturing facilities with most of the required equipment and machinery are available in Kyrgyzstan, there is a lack of technical and institutional capacities for the local manufacturing and repair of RE systems and the required quality management.
The potential for local manufacturing of RE equip-ment in Kyrgyzstan is generally regarded as promising, based on the following factors:
Intact workshop infrastructure: As a result of the efforts to introduce industrial production during the times of the Soviet Union, there are still a number of well-equipped workshops existing in Kyrgyzstan today.
Low labor cost: Due to the macroeconomic situation, labor costs in Kyrgyzstan are still comparatively low, which favors local production over imports.
On the other hand, the local capacity to manufacture specific products is hampered by a number of factors, such as the lack of qualified workers, lack of vocational training institutions and the general decline of locally manufactured quality equip-ment, which is being ousted by cheap Chinese imports.
Local AcceptanceGenerally, local acceptance of RE systems has been highest in areas with no or only very unreliable electricity supply, but people still prefer to be connected to the grid rather than to an isolated RE system. It can be assumed that with a further deteriorating of the grid all over the country, the acceptance of RE will increase.
6.2 BUSINESS DEVELOPMENTOne of the main directions of the economic policy pursued by the Government of the Kyrgyz Republic is the attraction of direct foreign investments.
Direct foreign investment promotes the creation of new highly technological manufactures, the creation of addi-tional workplaces, the introduction of advanced management techniques etc.
According to Article 14 of the Constitution, foreigners and stateless persons in the Kyrgyz Republic enjoy the rights and freedoms and bear the responsibilities of citizens on the 2 TRANSPARENCY INTERNATIONAL INDICATES RANK KYRGYZSTAN 130 OUT OF 152 FOR
IN THE CORRUPTION PERCEPTION INDEX 2005 (SEE TI, AS OF 2005).

Renewable Energies in Central Asia
KYRGYZ REPUBLIC
COUNTRY INTRODUCTION 89
basis and in accordance with the conditions and procedures stipulated by laws, state treaties and agreements.
In general, the Kyrgyz Republic and its own legisla-tion follow international laws and treaties.
The existing legal framework satisfies (at least in the-ory) the basic requirements of private investors. It mainly en-courages the development of large hydro power resources for the export market, however. Existing Government resolutions and programs are almost reticent about small-scale hydro power or other RE development and are focused on sites with capacities over several MW.
The absence of power purchase agreements and wheel-ing agreements tailored for small-scale generators allow all four distribution companies to abuse their geographical mo-nopolistic domination. The Electricity Law provides regula-tions for the access of third parties to transmission lines, but in reality distribution companies find many ways to prevent small-scale IPPs from supplying customers that are not direct-ly connected to the new generators.
The delayed tariff reform and absence of feed-in tariffs create another challenge for the development of RE.
The Kyrgyz Government recognizes the existing legal and regulatory vacuum for small-scale IPPs. In collaboration with the UNDP, the MIEFR is drafting a new Law on Renew-able Energy Development. It is expected that this year the new draft law will be submitted to the parliament for approval.
SHORT BUSINESS INFOIn theory, private investors are allowed to operate in the Kyrgyz energy market. All applicable laws and regulations, however, focus on relatively large hydro power develop-ment. In reality, the obstacles caused by missing legal frameworks are difficult to manage for potential IPPs.
6.3 INTELLECTUAL PROPERTY RIGHTSThe legal basis for intellectual property protection in the Kyr-gyz Republic is provided by relevant national legislation and international treaties, to which the Kyrgyz Republic is a party. This refers to patents, trademarks, copyrights, computer ap-plications etc.
In addition, since December 1998, the Kyrgyz Republic has been a member of the World Trade Organization (WTO). Developing its own intellectual property legislation, the coun-try takes into account provisions of the WTO Agreement on Trade-Related Aspects of Intellectual Property Rights.
The legislation of the Kyrgyz Republic provides for civil, administrative and criminal liability for violations in the field of intellectual property.
6.4 TAXATIONTaxation in the Kyrgyz Republic is regulated by the constitu-tion of the Kyrgyz Republic, the Tax Code of the Kyrgyz Re-public and 42 specific laws, regulations and instructions. The authorized agency responsible for the supervision of timely payment of taxes is the State Committee on Taxes and Duties of the Kyrgyz Republic.Currently, as many as 17 types of taxes and mandatory pay-
ments exist in the Kyrgyz Republic. National taxes are Value Added Tax (VAT), Income Tax, Profit Tax, Excise Tax and Automobile Road Tax.
Value Added Tax is applied to all taxable goods pro-duced in the territory of the Kyrgyz Republic including the imported products. The VAT rate is 20 % except for the excise tax and goods, which are subject to VAT zero rate. The cur-rently applicable legislation specifies the list of items, which are subject to VAT zero rates and also the list of products, works and services, which are exempt from VAT.
Income tax paid by natural persons is uniform and levied on the whole territory of Kyrgyzstan. The taxpayer pays income tax on all income received in Kyrgyzstan from any legal and/or natural person.
According to the Law on Foreign Investments of 24 September 1997, taxation of foreign investors and foreign in-vestments is carried out in accordance with the tax legislation of Kyrgyzstan, which is equally applicable to nationals and foreigners. However, foreign investors who had been regis-tered in Kyrgyzstan before the law came into force enjoy cer-tain privileges (specified in part one of Article 20 and Article 23 of the older Law on Foreign Investments of 28 June 1991) until the end of the validity term referred to therein.
Foreign investors must keep accounting records and accounts following the applicable rules of the Kyrgyz Repub-lic and submit accounts and information to tax authorities, statistical and other bodies in conformity with the established order.
7 RENEWABLE ENERGY BUSINESS NFORMATION AND CONTACTS
At the state level, the main counterparts for economic development are the following:
Ministry of Economic Development and TradeBishkek, Chuy Ave., 106Minister Japarov [email protected]
Ministry of Energy, Industry and Fuel Resources (MEIFR)Bishkek, Ahunbaev Str., 119Minister Balkibekov [email protected]
Ministry of Agriculture, Water Resources and Processing IndustryBishkek, Kievskaya Str., 96 AMinister Nogoev [email protected]
State Agency on Environment Protection and Forestry Bishkek, Toktogula Str., 228Director Davletkeldiev [email protected]

Renewable Energies in Central Asia
KYRGYZ REPUBLIC
90BIBLIOGRAPHY
There are some ongoing development projects focused on RE financed by the following donor organizations:
UNDP Micro Hydro Power Development ProjectThis project aims at the promotion of alternative and RE sources. It has introduced new energy efficiency technolo-gies and uses of alternative RE that can provide villages with regular heating and electricity without considerable financial spending and damage to the eco-balance.Contact person: Zharas Takenov, Senior International Advisor,[email protected]
UNDP CDM ProjectThe project’s main objective is to assist the Kyrgyz Republic in creating institutional and technical capacities for effec-tive management of commitment under the United Nations Framework Convention on Climate Change and the Kyoto Protocol. The latter provides opportunity for Kyrgyzstan to reduce greenhouse emissions in the framework of the CDM Projects funded by the developed countries. Contact person: Ryspek Satylkanov, Expert on Clean Development [email protected]
JICA Biogas ProjectThe main objective of this project is to introduce the new technology through two pilot installations in different regions of the country.Contact person: Aigerim Karmyshakova, Project [email protected]
EBRD Project Kyrgyzstan: Strategic Planning for Small- and Medium-Sized Hydro Power Development:Mr. Azamat Omorov, Leading Specialist, Power Generation and Transmission Department, Ministry of Industry, Energy and Fuel Resources of the Kyrgyz Republic, 119 Ahun-baeva, 720055 Bishkek, Kyrgyzstan, Tel: +996 312 561113, [email protected]
RENEWABLE ENERGY – RELEVANT INSTITUTIONS
Local organizations active in the field of RE and rural devel-opment would be the following:
Directorate on Development of Small and Medium Energy ProjectsBishkek, Isanova Str., 60Director Kulov [email protected] power
Kyrgyz Science Technical Center “Energiya”Bishkek, Akhunbaeva Str., 119Director Dikambaev Shamilhydro, solar, wind
Center of Issues of Utilization of Renewable Energy Sources “Kun”Bishkek,Director Obozov [email protected], wind
NGO “Fluid” Bishkek, Alma-Atinskaya Str., 1A,Director Vedenev [email protected], biogas
Kyrgyz-Russian (Slavic) University Bishkek, Kievskaya Str., 44Head of Renewable Energy Department Akkaziev [email protected] Energy
Kyrgyz Technical UniversityBishkek, Mir Ave., 66Head of Energy Department Apyshev [email protected] sector
Demonstration Zone for Energy and Water EfficiencyBishkek, Ahkunabeav Str., 119Director Shayahmetov [email protected] hydro, energy saving
JSC Severelectro Lebedinovka, Chkalova Str., 3Director Raimjanov Talant,Tel: (996 312) 63 12 85Power distribution company serving Bishkek, Chui and Talas regions
JSC VostokelectroKarakol, Fuchika Str., 24Director Muhamejanov Ryskul,[email protected] distribution company serving Naryn and Issyk-Kul regions
JSC JalalabatelectroJalalabat, Lenin Str., 159Director Sarbaev Nazir,[email protected] distribution company serving Jalalabat region
JSC OshelectroOsh, Razzakova Str., 19aDirector Bekmurzaev Doskul,[email protected] distribution company serving Osh and batken regions

Renewable Energies in Central Asia
KYRGYZ REPUBLIC
91BIBLIOGRAPHY
8 BIBLIOGRAPHY
ADB (2007): Opportunities and Pitfalls in Privatizing Distribution Company Management
Central Intelligence Agency – CIA (2009): World Fact Book. Kyrgystan (www.cia.gov/library/publications/ the-world-factbook/geos/kg.html#top)
Energy Charter Secretariat (2007): Review of the Invest-ment Climate and Market Structure
´ Energy Information Agency – EIA (2005): Kyrgyzstan – Energy Balance (www.eia.doe.gov/emeu/world/country/ cntry_KG.html)
GEF/UNDP (2006): Biogas Technologies in Kyrgyzstan´ International Energy Agency – IEA (2005): IEA Statistics, Kyrgyzstan (www.iea.org/Textbase/stats/countryresults.asp?COUNTRY_CODE=KG&Submit=Submit)
International Monetary Fund – IMF (2004): Kyrgyz Republic: Poverty Reduction Strategy Paper Progress Re-port (www.imf.org/external/pubs/ft/scr/2004/cr04200.pdf)
Jefferson Institute (2009): Developing the Potential for Energy Efficiency and Alternative Energy in the Kyrgyz Republic (www.jeffersoninst.org/Documents/Kyrgyz_ policy_paper.pdf)
N. N. (1999): Program of Development of Small Hydro Power
Kyrgyz Republic (2007): Country Develop-ment Strategy (http://webapps01.un.org/vaw/uploads/Kyrgyzstan %20- %20National %2-0Development %20Strategy %202007-2010.pdf)
N. N. (2008): Kyrgyz National Energy Program Nationmaster (2009): Map of Kyrgystan (http://images.nationmaster.com/images/motw/commonwealth/ kyrgyzstan_rel96.jpg)
Renewable Development Initiative (2009): Kyrgyzstan Country Profile (http://ebrdrenewables.com/sites/renew/countries/kyrgyzstan/profile.aspx)
Transparency International – TI (2005): Corruption Perception Index 2005 (www.transparency.org/policy_ research/surveys_indices/cpi/2005)
UNDP (2007): Environment and Natural Resources for Sustainable Development
US Department of State (2008): Investment Climate Statement – Kyrgyzstan 2008 (www.state.gov/e/eeb/ifd/2008/100902.htm)
USAID (2002): Assessment of Issues and Proposals for Syrdarya River Basin
USAID (2002): Support to Electricity Loss Reduction in the Kyrgyz Republic
World Bank (2004): Regional Electricity Potential Export Study
World Bank (2004): Water and Energy Nexus in Central Asia
World Bank (2007): Kazakhstan and Kyrgyzstan: Opportunities for Renewable Energies Development

Renewable Energies in Central Asia
KYRGYZ REPUBLIC
92
9.3 CENTRAL ASIA 500 KV POWER GRID, POWER TRANSMISSION FACILITIES AND DISTRIBUTION FACILITIES
FIGURE 1
Primary Energy Consumption (in ktoe)
9 ANNEX
9.1 DEVELOPMENT OF THE GROSS DOMESTIC PRODUCT
TABLE 1
Development of the GDP
YEARS SUM (BILLION) US$ (BILLION) PER CAPITA SUM PER CAPITA US$
2000 65.358 1.368 4,313.9 307.8
2001 73.883 1.525 4,506.3 321.7
2002 75.367 1.606 4,470.7 380.9
2003 83.872 1.919 4,740.5 435.2
2004 94.351 2.215 5,023.4 478.6
2005 100.899 2.460 4,965.9 546.0
2006 113.800 2.837 5,064.1 713.5
2007 139.749 3.748 5,419.7 895.4
9.2 PRIMARY ENERGY CONSUMPTION
TABLE 2
Primary Energy Consumption (in ktoe)
COAL CRUDE OIL PETROLEUM PRODUCTS
GAS HYDRO COMBUSTIBLES, RENEWABLES AND WASTE
ELECTRICITY TOTAL
Domestic production 122 74 0 21 1,226 4 0 1,447
imports 435 5 675 596 0 0 0 1,711
Exports -4 0 -125 0 0 0 -231 -360
TPES 552 79 550 617 1,226 4 -231 2,798
ANNEX
Source: unknown
Source: unknown
Source: unknown

Renewable Energies in Central Asia
KYRGYZ REPUBLIC
93
9.4 POWER CONSUMPTION AND TRANSMISSION AND DISTRIBUTION LOSSES, POWER IMPORT AND EX-PORT
TABLE 5
Power Balance 2004–2007
ANNEX
TABLE 3
Power Transmission Facilities in the Kyrgyz Republic
VOLTAGE LEVEL (KV) LENGTH OF LINES (KM) NUMBER OF SUBSTATIONS
500 546 2
220 1,453 13
110 4,558 177
Source: unknown
TABLE 4
Power Distribution Facilities in the Kyrgyz Republic
VOLTAGE LEVEL (KV) LENGTH OF HVL (KM) NUMBER OF SUBSTATIONS
35 4,318 325
10/6 26,959 19,048
0.4 27,94 -
Source: unknown
# ITEM UNIT 2004 2005 2006 2007
1 Generation GWh 14,944 14,686 14,326 14,645
2 import GWh 54 4 9 0
3 Export GWh 3,206 2,577 2,441 2,379
4 Output to network GWh 11,58 11,874 11,71 11,008
5 Losses GWh 4,926 5,133 4,872 4,534
6 Consumption GWh 6,609 6,814 6,855 7,258
6.1 Industry GWh 781 767 814 821
6.2 Budget GWh 632 625 629 681
6.3 Agriculture GWh 67 57 70 87
6.4 residential GWh 3,806 3,933 3,772 3,898
6.5 Others GWh 780 867 902 1,014
7 Direct customers GWH 530 538 639 756
Source: unknown
TABLE 6
Power Import/Export
YEAR TRADE PARTNER IMPORT (GWH) EXPORT (GWH)
2006 Kazakhstan 0 2,074.20
Uzbekistan 0 0
Tajikistan 0 366.30
China 0 0.91
2007 Kazakhstan 0 1,215.80
Uzbekistan 0 868.30
Tajikistan 0 294.10
China 0 0.97
Source: unknown

Renewable Energies in Central Asia
KYRGYZ REPUBLIC
94
9.5 NARYN – SYRDARYA RIVER BASIN POWER FACILITIES
FIGURE 2
Naryn – Syrdarya River Basin Power Facilities
9.6 NARYN – SYRDARYA RIVER BASIN POWER GRID
FIGURE 3
Naryn – Syrdarya River Basin Power Grid
ANNEX
Source: unknown
Source: unknown

Renewable Energies in Central Asia
KYRGYZ REPUBLIC
95ANNEX
9.7 ELECTRICITY TARIFF RATES
TABLE 7
Electricity Tariff Rates 2008 (excl. taxes and levies)*
I. PER 1 KWH OF CONSUMED ELECTRICITY
1.1 For residential customers 70 tyiyn
1.2 For agricultural pump station within the limits 68 tyiyn
1.3 For industrial customers 96 tyiyn
1.4 For agricultural customers 96 tyiyn
1.5 For customers financed from local or state budget 100 tyiyn
1.6 For all other customers 102 tyiyn
II. PER 1KW OF APPLIED OR INSTALLED CAPACITY PER MONTH
2.1 For residential customers for heating purposes (from October 1 to March 31) – per 1 kW of installed capacity 30 som
2.2 For residential customers for sauna and food – per 1 kW of installed capacity 60 som
2.3 For industrial customers throughout the whole year – per 1 kW of applied capacity 45 som
2.4 For agricultural customers with 3-phase input throughout the whole year – per 1 kW of applied capacity 45 som
2.5 For customers financed from local or state budget with 3-phase input throughout the year – per 1 kW of installed capacity 45 som
2.6 For all other customers with 3-phase input, except saunas and food throughout the year – per 1 kW of installed capacity 50 som
2.7 For all other customers for saunas and food throughout the year – per 1 kW of installed capacity 60 som
9.8 HEAT AND HOT WATER TARIFF RATES
TABLE 8
Heat and Hot Water Tariff Rates (Gcal)*
1 Residential for heating 500 som per 1 Gcal
2 Residential for hot water supply 250 som per 1 Gcal
3 Others for heating and hot water supply 860 som per 1 Gcal
TECHNICAL SERVICE OF HEATING SYSTEMS:
4 Residential 30 som per 1 Gcal
5 Other customers 40 som per 1 Gcal
TABLE 9
Hot Water Tariff Rates (ton)*
1 Residential 23,7 som per 1 ton
2 Others 51,8 som per 1 ton
TECHNICAL SERVICE OF HEATING SYSTEMS:
3 Residential 1,38 som per 1 ton
4 Others 1,84 som per 1 ton
TABLE 10
Hot Water Tariff Rates (lump sum for 4,8 tons/person/month)*
1 Residential 113,8 som/per person
TECHNICAL SERVICE OF HEATING SYSTEMS
2 Residential 6,62 som/per person
* Source: unknown

Renewable Energies in Central Asia
KYRGYZ REPUBLIC
96ANNEX
REGION TYPE OF CUSTOMER RATE (SOM/1,000 M3)
North Residential customers 7,296.20
Industrial, budget and commercial customers 8,982.91 (incl. VAT)
South Residential customers 6,988.72
Industrial, budget and commercial customers 8,541.94 (incl. VAT)
9.9 RESIDENTIAL TARIFF RATES FOR NATURAL GAS
FIGURE 11
Residential Tariff Rates for Natural Gas
9.10 ADMINISTRATIVE MAP OF THE KYRGYZ REPUBLIC
FIGURE 4
Administrative Map of the Kyrgyz Republic
Source: JSC “Kyrgyzgas”, as of 2008
Source: GIS Services Ltd.,as of 2001

Renewable Energies in Central Asia
KYRGYZ REPUBLIC
97ANNEX
9.11 POPULATION DENSITY MAP OF THE KYRGYZ REPUBLIC
FIGURE 5
Population Density Map of the Kyrgyz Republic
9.12 LAND USE MAP OF THE KYRGYZ REPUBLIC
FIGURE 6
Land Use Map of the Kyrgyz Republic
Source: unknown
Source: unknown

Renewable Energies in Central Asia 98
COUNTRY CHAPTER:
REPUBLIC OF MONGOLIA Authors and Coordination ofCountry ChapterDr. Ing. Klaus JordeEntec Consulting & Engineering AGSt. Gallen, Switzerlandwww.entec.ch
Axel Biegert (Dipl. Economist & Pol.) INTEGRATION UMWelt & Energie GmbHGraefenberg, Germany www.integration.org
Editor Deutsche Gesellschaft für Technische Zusammenarbeit (GTZ) GmbHDepartment Water, Energy, TransportDag-Hammarskjöld-Weg 1-565760 Eschborn, Germanywww.gtz.de
On behalf of Federal Ministry for Economic Cooperation and Development (BMZ)
Editorial staffDiana KraftTel: +49 (0)6196 79 4101Fax: +49 (0)6196 79 80 4101Email: [email protected]

Renewable Energies in Central Asia
MONGOLIA
99CONTENTS
ACRONYMS, ABBREVIATIONS AND MEASUREMENTS 100
1 SUMMARY 102
2 COUNTRY INTRODUCTION 103 2.1 Geography and Climatic Conditions 103 2.2 Political and Economic Development 103
3 ENERGY MARKET IN THE REPUBLIC OF MONGOLIA 106 3.1 Important Players of the Mongolian Energy Market 106 3.2 Primary Energy Consumption, Transmission and Prices 107
4 POLICY FRAMEWORK FOR RENEWABLE ENERGIES 111 4.1 National Strategies and Programs to support Renewable Energies 111 4.2 Regulations, Incentives and Legislative Framework Conditions 111
5 POTENTIAL FOR RENEWABLE ENERGIES AND PRESENT USE 114 5.1 Bioenergies 114 5.2 Solar Energy 114 5.3 Wind Power 115 5.4 Geothermal Energy 115 5.5 Hydro Power 116
6 MARKET RISK ANALYSIS AND BARRIERS FOR MARKET ENTRY 116 6.1 Cost of Renewable Energy Applications 116 6.2 Current Business and Investment Activities 116 6.3 General Situation 117 6.4 Business Development 117 6.5 Taxation 118 6.6 Import and Export 119
7 RENEWABLE ENERGY BUSINESS INFORMATION AND CONTACTS 119
8 REFERENCES 123
9 ANNEX 124
CONTENTS

Renewable Energies in Central Asia
MONGOLIA
100
ACRONYMS AND ABBREVIATIONS REPUBLIC OF MONGOLIA
ADB Asian Development Bank
ALGAS Asian Least Cost Greenhouse Gas Abatement Strategies
CAR Central Asian Region
C&A Casals & Associates, Inc.
CCA Common Country Assessment
CDM Clean Development Mechanism
CES Central Energy System
CHPP Combined Heat and Power Plant
CIS Commonwealth of Independent States
CNG Compressed Natural Gas
CSP Solar Thermal Power
DME Dimethyl Ether
DNA Designated National Authority
DoE Department of Energy
DP Democratic Party
DUC Democratic Union Coalition
EA Energy Authority
ECM Energy Conservation Measures
EES Eastern Energy System
ERA Energy Regulatory Authority
ERDC Energy Research and Development Centre
FIFTA Foreign Investment and Foreign Trade Agency of Mongolia
GDP Gross Domestic Product
GEF Global Environmental Facility
GHG Greenhouse Gas Emissions
GTZ Deutsche Gesellschaft fuer Technische Zusammenarbeit (German Technical Cooperation Agency)
GoM Government of Mongolia
HH Household
HPP Hydro Power Plant
HVL High Voltage Lines
HVN High Voltage Network
IBRD International Bank for Reconstruction and Development
ICWC Interstate Commission for Water Coordination
IDA International Development Association
IEA International Energy Agency
IPP Independent Power Producer
JICA Japan International Cooperation Agency
JSC Joint Stock Company
LPG Liquefied Petroleum Gas
MB&C Metering, Billing and Collection
MDG Millennium Development Goals
MFE Ministry of Fuel and Energy
MME Ministry of Mineral Resources and Energy
MNE Ministry of Nature and Environment
MoF Ministry of Finance and Economy
MoT Ministry of Trade
MPRP Mongolian People’s Revolutionary Party
MSY Mongolian Statistical Yearbook
n. a. not applicable
NGO Non-Governmental Organization
NREC National Renewable Energy Centre
NREL National Renewable Energy Laboratory
O&M Operation and Maintenance
OECD Organization for Economic Cooperation and Development
ACRONYMS, ABBREVIATIONS AND MEASUREMENTS
101
PPA Power Purchase Agreement
PRC People’s Republic of China
PREGA Promotion of Renewable Energy, Energy Efficiency and Greenhouse Gas Abatement
RE Renewable Energy
SHS Solar Home Systems
SUST State University for Science Technology of Mongolia
TDB Trade and Development Bank of Mongolia
TAF The Asia Foundation
UBEDO Ulaanbaatar Electricity Distribution Company
UN United Nations
UNCAC United Nations Convention Against Corruption
UDC Unified Dispatch Centre
UNDAF United Nations Development Assistance Framework
UNDP United Nations Development Program
UNFCCC United Nations Framework Convention on Climate Change
USCSP United States Country Studies Program
USAID United States Agency for International Development
USD United States Dollars
VAT Value Added Tax
WB World Bank
WES Western Energy System
WIPO World Intellectual Property Organization
WTO World Trade Organization
WTP Willingness to Pay
MEASUREMENTS
°C degree Celsius
bbl barrel
Gcal giga calorie
GW gigawatt hour (1 GW = 1,000,000 kWh)
kJ kilojoule (1 kJ = 1,000 Joules)
ktoe kilotons of oil equivalent (1 ktoe = 11 630 000 kWh)
kV kilovolt
kW kilowatt
kWh kilowatt hour
l liter
m meter
m2 square meter
MW megawatt (1MW = 1000 kW)
TWh terawatt hour (1 TWh = 1,000,000,000 kWh)
APPLIED CURRENCY CONVERSION FACTORS
2004: 1 USD = 1,212 MNT
2005: 1 USD = 1,227 MNT
2006: 1 USD = 1,165 MNT
2007: 1 USD = 1,170 MNT
2008: 1 USD = 1,265 MNT
2009: 1 USD = 1,460 MNT
ACRONYMS, ABBREVIATIONS AND MEASUREMENTS Renewable Energies in Central Asia
MONGOLIA

Renewable Energies in Central Asia
MONGOLIA
102
1 SUMMARY
The Mongolian energy sector is strongly dominated by fos-sil energy resources. Renewable Energy (RE) resources have remained largely unexploited due to low energy tariffs and the focus on the large local coal resource, which have been per-ceived as the main strategic energy resource to define the long-term economic development of the country. The development of RE resources has been strongly driven by the Government and international donors. Due to regulatory barriers, missing know-how and financial attractiveness, private investors have not become involved in the sector. The two areas where RE has played an important role are stand-alone electricity supply systems for nomadic households and isolated grid RE-Diesel hybrid systems for rural centers. Moreover, some small and mini Hydro Power Plants and wind farms have been built. RE sources currently represent about 3 % of country’s total electricity generating capacity. Especially solar, wind and hy-dro power as well as geothermal energy offer large untapped potentials. The improvement of the information base on tech-nical and economical potentials for energy system design pur-poses is under progress.
Compared to its neighboring countries, the general investment conditions in Mongolia are quite favorable for in-ternational investors and over the last two years, the perspec-tives for the private sector to develop RE in Mongolia have be-come more promising. In its attempt to diversify the country’s energy supply and reduce its dependence from international petroleum imports, the Government has introduced a feed-in tariff system for RE, allowed for independent power genera-tion to attract private investment and massively extended the grid. The rates for grid-connected RE resources range between 0.05 USD/kWh for hydro power and 0.18 USD/kWh for so-lar power. As private independent power generation practice is still rudimentary and economic feasibility of RE projects under the current conditions is still to be proved, the coopera-tion with international donor programs in the form of public private partnership or through joint ventures with local part-ners might be suitable for international investors to gain first experiences.
ACRONYMS, ABBREVIATIONS AND MEASUREMENTS
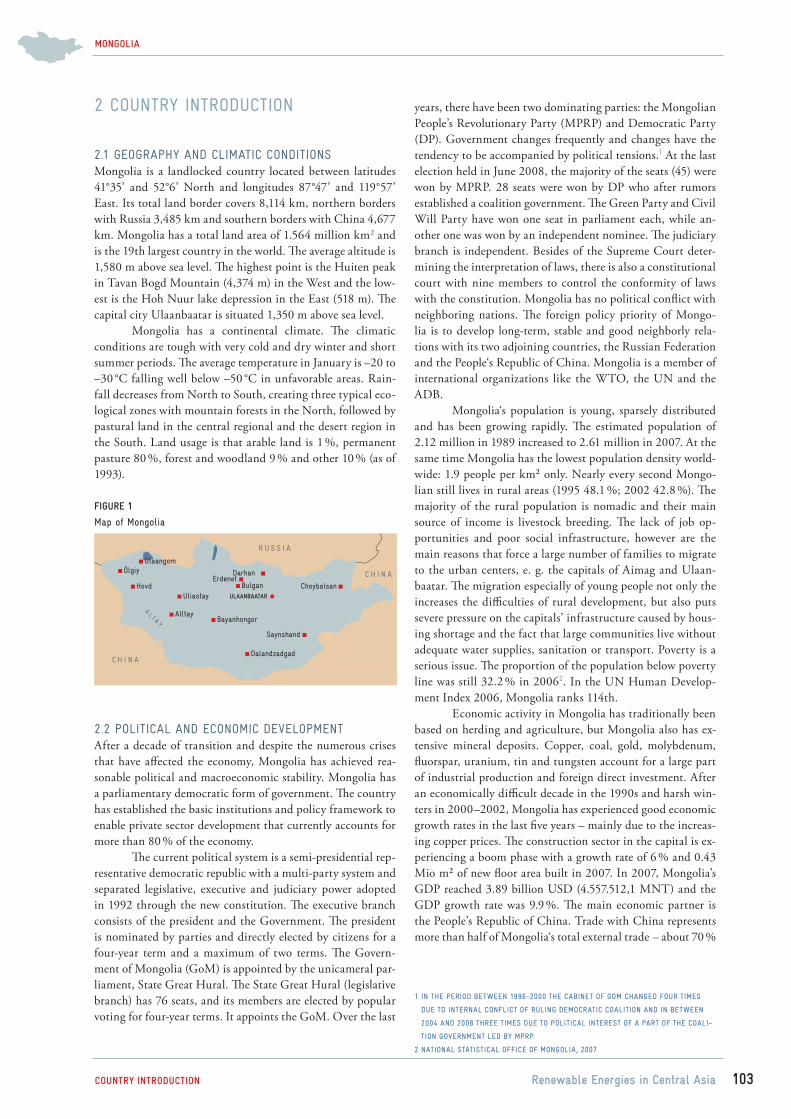
Renewable Energies in Central Asia
MONGOLIA
COUNTRY INTRODUCTION 103
2 COUNTRY INTRODUCTION
2.1 GEOGRAPHY AND CLIMATIC CONDITIONSMongolia is a landlocked country located between latitudes 41°35’ and 52°6’ North and longitudes 87°47’ and 119°57’ East. Its total land border covers 8,114 km, northern borders with Russia 3,485 km and southern borders with China 4,677 km. Mongolia has a total land area of 1.564 million km2 and is the 19th largest country in the world. The average altitude is 1,580 m above sea level. The highest point is the Huiten peak in Tavan Bogd Mountain (4,374 m) in the West and the low-est is the Hoh Nuur lake depression in the East (518 m). The capital city Ulaanbaatar is situated 1,350 m above sea level.
Mongolia has a continental climate. The climatic conditions are tough with very cold and dry winter and short summer periods. The average temperature in January is –20 to –30 °C falling well below –50 °C in unfavorable areas. Rain-fall decreases from North to South, creating three typical eco-logical zones with mountain forests in the North, followed by pastural land in the central regional and the desert region in the South. Land usage is that arable land is 1 %, permanent pasture 80 %, forest and woodland 9 % and other 10 % (as of 1993).
2.2 POLITICAL AND ECONOMIC DEVELOPMENTAfter a decade of transition and despite the numerous crises that have affected the economy, Mongolia has achieved rea-sonable political and macroeconomic stability. Mongolia has a parliamentary democratic form of government. The country has established the basic institutions and policy framework to enable private sector development that currently accounts for more than 80 % of the economy.
The current political system is a semi-presidential rep-resentative democratic republic with a multi-party system and separated legislative, executive and judiciary power adopted in 1992 through the new constitution. The executive branch consists of the president and the Government. The president is nominated by parties and directly elected by citizens for a four-year term and a maximum of two terms. The Govern-ment of Mongolia (GoM) is appointed by the unicameral par-liament, State Great Hural. The State Great Hural (legislative branch) has 76 seats, and its members are elected by popular voting for four-year terms. It appoints the GoM. Over the last
years, there have been two dominating parties: the Mongolian People’s Revolutionary Party (MPRP) and Democratic Party (DP). Government changes frequently and changes have the tendency to be accompanied by political tensions.1 At the last election held in June 2008, the majority of the seats (45) were won by MPRP. 28 seats were won by DP who after rumors established a coalition government. The Green Party and Civil Will Party have won one seat in parliament each, while an-other one was won by an independent nominee. The judiciary branch is independent. Besides of the Supreme Court deter-mining the interpretation of laws, there is also a constitutional court with nine members to control the conformity of laws with the constitution. Mongolia has no political conflict with neighboring nations. The foreign policy priority of Mongo-lia is to develop long-term, stable and good neighborly rela-tions with its two adjoining countries, the Russian Federation and the People‘s Republic of China. Mongolia is a member of international organizations like the WTO, the UN and the ADB.
Mongolia‘s population is young, sparsely distributed and has been growing rapidly. The estimated population of 2.12 million in 1989 increased to 2.61 million in 2007. At the same time Mongolia has the lowest population density world-wide: 1.9 people per km² only. Nearly every second Mongo-lian still lives in rural areas (1995 48.1 %; 2002 42.8 %). The majority of the rural population is nomadic and their main source of income is livestock breeding. The lack of job op-portunities and poor social infrastructure, however are the main reasons that force a large number of families to migrate to the urban centers, e. g. the capitals of Aimag and Ulaan-baatar. The migration especially of young people not only the increases the difficulties of rural development, but also puts severe pressure on the capitals’ infrastructure caused by hous-ing shortage and the fact that large communities live without adequate water supplies, sanitation or transport. Poverty is a serious issue. The proportion of the population below poverty line was still 32.2 % in 20062. In the UN Human Develop-ment Index 2006, Mongolia ranks 114th.
Economic activity in Mongolia has traditionally been based on herding and agriculture, but Mongolia also has ex-tensive mineral deposits. Copper, coal, gold, molybdenum, fluorspar, uranium, tin and tungsten account for a large part of industrial production and foreign direct investment. After an economically difficult decade in the 1990s and harsh win-ters in 2000–2002, Mongolia has experienced good economic growth rates in the last five years – mainly due to the increas-ing copper prices. The construction sector in the capital is ex-periencing a boom phase with a growth rate of 6 % and 0.43 Mio m² of new floor area built in 2007. In 2007, Mongolia’s GDP reached 3.89 billion USD (4.557.512,1 MNT) and the GDP growth rate was 9.9 %. The main economic partner is the People’s Republic of China. Trade with China represents more than half of Mongolia‘s total external trade – about 70 %
1 IN THE PERIOD BETWEEN 1996-2000 THE CABINET OF GOM CHANGED FOUR TIMES
DUE TO INTERNAL CONFLICT OF RULING DEMOCRATIC COALITION AND IN BETWEEN
2004 AND 2008 THREE TIMES DUE TO POLITICAL INTEREST OF A PART OF THE COALI-
TION GOVERNMENT LED BY MPRP.
2 NATIONAL STATISTICAL OFFICE OF MONGOLIA, 2007
FIGURE 1
Map of Mongolia
ULAANBAATAR
AlltayBayanhongor
Dalandzadgad
UliastayBulgan
Darhan
Saynshand
ChoybalsanHovd
ÖlgiyUlaangom
C H I N A
C H I N A
R U S S I A
A L T A Y
Erdenet

Renewable Energies in Central Asia
MONGOLIA
COUNTRY INTRODUCTION 104
TABLE 1
Key Dates & Indicators
INDICATOR 2000 2001 2002 2003 2004 2005 2006 2007
Population (million) 2.40 2.42 2.45 2.48 2.51 2.55 2.58 2.61
Population growth (annual) 0.80 % 0.80 % 1.20 % 1.20 % 1.20 % 1.60 % 1.2 % 1.1 %
GNI per capita, PPP (USD) 1,790 1,890 1,970 2,120 2,380 2,550 2,810 3,160
GDP (billion USD) 1.09 1.17 1.27 1.49 1.81 2.31 3.13 3.89
GDP growth (annual %) 0. % 3. % 4.70 % 7.00 % 10.60 % 7.30 % 8.6 % 9.9 %
Agriculture, value added ( % of GDP) 33 % 29 % 24 % 24 % 25 % 25 % 22 % 21 %
Industry, value added ( % of GDP) 20 % 21 % 22 % 25 % 30 % 34 % 42 % 35 %
Services, value added ( % of GDP) 47 % 50 % 54 % 51 % 45 % 41 % 36 % 44 %
Exports of goods and services ( % of GDP) 56 % 55 % 56 % 58 % 67 % 64 % 65 % n. a.
External debt, total (DOD; million USD) 896 885 1,035 1,472 1,518 1,327 1,444 n. a.
Foreign direct investment, net inflows (BoP, million USD)
54 43 78 131 93 185 344 n. a.
Official development assistance and official aid (million USD)
217 211 208 250 255 221 203 n. a.
Inflation rate (annual) 26.1 % 6.3 % 5.1 % 9.8 % 17.2 % 20.4 % 23.1 % 11.7 %
of Mongolia‘s exports go to China. The heavy dependence on climatic conditions, commodity production and trade also makes the economy highly vulnerable to natural adversities and price volatility in world commodity markets, limiting the country’s long-term prospects of economic development, especially since the revenues from the key commodities are the main sources of the Government‘s fiscal revenues and the country‘s foreign exchange earnings. Mongolia has recently
experienced the highest inflation rate in over a decade as consumer prices in 2007 rose 15 %, largely because of the in-creased costs of imported fuel and food. Although still nearly 50 % of economically active people are engaged in agriculture and stock farming, the employment sector also experiences a transition process towards an increased employment rate in the industrial and service sector.
Source: author’s compilation adapted from World Development Indicators database, as of 2009

Renewable Energies in Central Asia
MONGOLIA
COUNTRY INTRODUCTION 105
LAND AREA: 1,564,000 km2
POPULATION: 2.61 million (as of 2007)
DENSITY: 1.9 inhabitants/km²
BIGGEST CITIES Ulaanbaatar (1.00 million), Erdenet (0.09 million)
LANGUAGE: Khalkha Mongol
CLIMATE: Mongolia has a continental climate; the climatic conditions are tough with very cold and dry winters and short summer periods.
TEMPERATURES: The average temperature in January is -20°C to –30°C falling well below –50°C in unfavorable areas
ALTITUDE: 518 m to 4,374 m; average altitude: 1,580 m
RIVERS: There are about 3,800 small rivers with a total length of 65,000 km in Mongolia. The physical hydroenergy potential is currently estimated at 6,200 MW. Many rivers freeze over during the winter and cannot provide year-round electricity.
ECOSYSTEM AREAS: Forests and woodland (9 %), permanent pasture (80 %), arable land (1 %)
GDP – PER CAPITA (PPP): 3,160 USD (as of 2007)
INFLATION RATE: 11.7 % (as of 2007)
AGRICULTURE: Wheat, barley, vegetables, forage crops, sheep, goats, cattle, camels, horses
INDUSTRIES: construction and construction materials, mining (coal, copper, molybdenum, fluorspar, tin, tungsten, and gold), oil, food and beverages, processing of animal products, cashmere and natural fiber manufacturing
ELECTRICITY – PRODUCTION: 4.2 billion kWh (as of 2008)
ELECTRICITY – CONSUMPTION: 3.1 billion kWh (as of 2008)
ELECTRICITY – TARIFFS: 34–114 MNT/kWh
NATIONAL ELECTRICITY CAPACITY IN OPERATION:
828 MW
ELECTRIFICATION RATE: 87.5 %
NATURAL RESOURCES: Coal, copper, molybdenum, tungsten, phosphates, tin, nickel, zinc, fluorspar, gold, silver, iron
OIL – PRODUCTION: 3,216 barrels/day (as of 2007)
OIL – IMPORT: 17,680 barrels/day (as of 2007)
OIL – CONSUMPTION: 12,780 barrels/day (as of 2007)
OIL – PROVEN RESERVES: 0 billion barrels
NATURAL GAS – PRODUCTION: 0 billion cubic feet
NATURAL GAS – PROVEN RESERVES:
0 billion cubic feet
EXPORTS: 2.5 billion USD f.o.b. (as of 2008)
EXPORTS – COMMODITIES: Copper, apparel, livestock, animal products, cashmere, wool, hides, fluorspar, other non-ferrous metals, coal
EXPORTS – PARTNERS: China 71.9 %, Canada 10.7 %, US 4.8 % (as of 2007)
IMPORTS: 3.6 billion USD c.i.f. (as of 2008)
IMPORTS – COMMODITIES: Machinery and equipment, fuel, cars, food products, industrial consumer goods, chemicals, building materials, sugar, tea
IMPORTS – PARTNERS: China 32 %, Russia 29.4 %, South Korea 7.9 %, Japan 7.2 % (as of 2007)
EXCHANGE RATE: 1 EUR = 1,908 Mongolian Tugrik (4.2009)
Source: CIA World Fact Book, as of 2009

Renewable Energies in Central Asia
MONGOLIA
COUNTRY INTRODUCTION 106
The Ministry of Mineral Resources and Energy (MME) is the Ministry in charge of policy development. Its targets include the development of energy resources, energy use, import and export of energy, construction of power plants, lines and net-works, energy conservation, use of RE sources and the dis-semination of RE technologies. The MME is also responsible for monitoring the sector, approving rules and regulations for the sector and international cooperation projects.
The institution for regulating the energy generation, transmission, distribution, dispatching and supply of energy is the Energy Regulatory Authority of Mongolia (ERA). It was established in July 2001 as an independent regulatory organi-zation to implement the Law of Mongolia on Energy. ERA‘s main duties include the issuing of licenses to energy compa-nies and other organizations operating in the sector. ERA also reviews and approves energy tariffs throughout Mongolia. It monitors the implementation and compliance with the terms and requirements of the licenses as well as with approved pric-es and tariffs and is also the complaint and dispute resolving body.
Besides ERA, there is an MME implementing agency, i. e. the Energy Authority (EA). The EA is responsible for the organization of research, project and program implementation and technical monitoring for the construction of energy facili-ties in the country. The EA consists of an administration and management division, a projects and program implementation division, a financial and economic division, a Renewable En-ergy division, a research and information division, a conven-tional energy division and a technical inspection division. As part of the recent restructuring of the government, the former implementing agency of National Renewable Energy Center was merged into the Energy Authority. The National Renew-able Energy Center has become a state-owned company and is no longer involved in policy-making.
The electricity and heat sector is controlled by 18 large-scale shareholding companies. The shares of these companies are owned by the MME, the State Property Committee and the Ministry of Finance and Economy (MoF) according to the provision of relevant legislation. Among them, Darkhan-Selenge Electricity Distribution System is a private company. Since energy sector enterprises are state-owned, major invest-ments required for building transmission and distribution lines and networks have been implemented by the MoF. The MoF is also responsible for budget planning and budget su-pervision of ministries, agencies and local authorities.
A license for import or export of electricity through the main network is granted to a holder of a license for trans-mission through this network. The MME determines the quantity of electricity to be imported. A holder of a license for import or export of electricity shall agree with the dispatching center on time, duration and technical conditions.
Finally when it comes to the application and registra-tion of Clean Development Mechanism (CDM) projects, the Ministry of Nature and Environment (MNE) is acting as the Designated National Authority (DNA) for Clean Energy De-velopment Mechanism. It has formed the National Bureau of Clean Development Mechanism.
3 ENERGY MARKET OF MONGOLIA
The energy sector in Mongolia accounts for about 2.5 % of GDP, whereof 3.5 % are being directly employed in the sector. Currently, 12.5 % of the population lack electricity and about 40 % are not connected to any central heat grid3. The energy sector generated 4,200 GWh of electricity and 7.76 million Gcal of heat in 2008, an increase of 8 % and 0.5 % respectively as compared to the previous year4. The total energy consump-tion increased by 0.4 % in 2008. Mongolia has significant coal resources and production. Nonetheless Mongolia is strongly dependent on energy imports from Russia. 95 % of its petro-leum products and a substantial amount of electric power are purchased from Russia. The energy sector of Mongolia is the largest contributor to Greenhouse Gas (GHG) emissions. The cold continental climate, the reliance on wood and the low en-ergy value of Mongolian coal contribute to a high rate of CO2 emission when measured on a per-capita basis. The estimat-ed national CO2 emission for 1990 was 19.1 million tons or roughly 7.9 tons per-capita. This is higher than the per-capita rates for Southeast Asia (excluding Bangladesh and Malay-sia) and Africa and exceeds the world average. Using current estimates of population growth, Mongolia may experience a three-fold increase in energy demand by the year 20205. At the same time, the risk of climate change or even prolonged extreme climatic events could have dramatic impacts on its economy and natural systems and – in some cases – even run danger of irreversible damage to the ecosystem6.
Since 1990, Mongolia has been attempting to rehabili-tate, upgrade and expand its energy systems because it has rec-ognized that a sustainable economic and social development of Mongolia is strongly hampered without efficient, reliable and reasonably priced electricity and fuels. Heat is essential for survival, and the reliable supply of electricity is a key to im-prove economy and peoples’ daily lives. In its transformation from totally subsidized non-market operations to commer-cialized market-based operations, the country faces a number of important and often conflicting challenges.
SHORT BUSINESS INFOMongolia’s energy sector is the largest contributor to Green-house Gas (GHG) emissions. Since 1990 its Government has been rehabilitating and upgrading its energy system.
3.1 IMPORTANT PLAYERS OF THE KAZAKH ENERGY MARKET
The following key institutions are involved in regulating and managing the sector7:
As for all other national policies, the Parliament of Mongolia (Great Khural) is in charge of approving the state policy in energy sector.
3 INFORMATION FROM THE MINISTRY OF MINERAL RESOURCES AND ENERGY,
AS OF 2009
4 NATIONAL STATISTICAL OFFICE OF MONGOLIA, 2009
5 SEE GTZ/INT, 2004
6 AGRICULTURE, INCLUDING CROP AND LIVESTOCK PRODUCTION, WATER AND FOREST
RESOURCES AS WELL AS BIODIVERSITY ARE CONSIDERED TO BE AMONG THE MOST
VULNERABLE SYSTEMS (SEE MNE/NAPCC, 2006).
7 CONTACT DETAILS OF THE NAMED INSTITUTIONS CAN BE FOUND IN CHAPTER 7
Renewable Energies in Central Asia
MONGOLIA
COUNTRY INTRODUCTION 107
3.2 PRIMARY ENERGY CONSUMPTION, TRANSMISSION AND PRICES
Due to its growing population, Mongolia’s primary energy consumption has steadily increased over the last years while consumption intensity remained the same. In 2007, a total of about 5 million toe of primary energy was consumed in Mon-golia. With approximately 2 toe, the average consumption per capita is still relatively low, yet equals one fifth of the German average. The main primary energy resource is coal with a share varying between 83 and 87 %. Mongolia is a coal exporting country, mainly to China. With a share of 13–17 %, petro-leum products are the second most important primary energy resource. 95 % are imported from Russia, with strong depend-ency on the Russian petroleum company ROSNEFT, and the remaining 5 % originate from China. Some small but grow-ing amounts of raw petroleum have recently been produced in Mongolia and exported to China for processing (exported raw petroleum in 2007: 850,220 barrels)9. Although exact fig-ures are not available, the contribution of RE resources to the country’s primary energy supply can be considered as mar-ginal. RE (hydro power, wind and solar), however, gain stead-ily in importance, mainly in electricity generation for rural areas. The share of RE in total electricity generation capacities is 3 %10. Finally, Liquefied Petroleum Gas (LPG) plays a lim-ited but growing role in Mongolia. Since 1998, small amounts
are being imported for household consumption, transport, tourism and industry in canisters from China and trucked throughout Mongolia, which is a very expensive procedure. In 2007, approximately 30,000 customers in Aimags and Ulaanbaatar used LPG. There are 10 licensees to deliver and service LPG. The price of LPG in Ulaanbaatar is 1,100–1,300 MNT; in rural areas it is 1,500 up to 5,000 MNT per kg. In 2005, the GoM has approved a program promoting the use of Liquefied Flammable Gas (Liquefied Flammable Gas Pro-gram, Government resolution #140) and the development of an LPG network, which provides a legal basis to establish an industry delivering Compressed Natural Gas (CNG) for vehi-cles and Liquefied Petroleum Gas (LPG) for household con-sumption. This effort is aimed at diversifying energy sources as well as providing more efficient, less polluting and, in the case of LPG, possibly cheaper fuels than petrol, diesel and kerosene. The program is being implemented from 2006 to 2010. To date, four private companies have been working out the details of how to develop the market for these products, but data on their current levels of investment and future plans are not available. In 2007, the establishment of a laboratory for gas quality as well as for testing and certification of gas tanks and equipment has been started with a budget of 90 million MNT. A total investment of 360 million MNT has been planned for this project.11
Transmission and Distribution SystemBesides the CES, Mongolia’s electricity grid also consists of the Western (WES), the Eastern Energy System (EES) and five small independent power systems with diesel and thermal power stations, which are not connected to the three grids, and approximately 90 non-connected Soum centers. CES cov-ers 11 Aimag centers and 102 Soum centers; the WES covers 3 Aimag centers, 8 Soum centers; isolated Aimag energy systems cover 12 Soum centers and 3 Soum centers are connected to a thermal power station. The CES and the WES are connected to Russian power grid. Several Soum centers in the southern part of Mongolia are connected to the electricity grid of China through a 35 kV transmission line (for details see tables 5 and 6). A map of Mongolia’s grid and power transmission lines and substation figures can be found in annex 0.
In 2008, the electrification rate was 87.5 %. While people in urban areas have virtually all been electrified, only 43 % of the nomadic people have access to electricity and 80–
85 % of villages and Soum centers were electrified. Especially in the non-interconnected villages and Soum centers, supply is limited to 3–4 hours per day during wintertime as the fuel cost for diesel generators can hardly to be afforded by people.
Although technical and non-technical losses have been substantially reduced from 39 % in 2001 to 26 % in 2009, there is still substantial space for improvement espe-cially by replacing older facilities, by reducing power theft and by reducing the imbalance of power distribution on larger dis-tances in rural areas.12
8 FIGURES DO NOT INCLUDE ELECTRICITY IMPORTS OR ENERGY GENERATED FROM
RE RESOURCES.
9 MINERAL RESOURCES AND PETROLEUM AUTHORITY
10 SEE ALSO FIGURE 2 BELOW; THE 3 % OF RE SHARES HERE DERIVE FROM HPP,
AS WELL AS WIND AND SOLAR
11 STATUS OF IMPLEMENTATION OF NATIONAL PROGRAMS, GOVERNMENT WEBSITE:
WWW.OPEN-GOVERNMENT.MN
12 ACCORDING TO A BROCHURE OF CRETG INC., MORE THAN 50 % OF THE EQUIPMENT OF THE
CES GRID IS OLDER THAN 20 YEARS, 18,9 % THEREOF IS BETWEEN 30 AND 45 YEARS OLD.
TABLE 2
Primary Energy Consumption by Source (in ktoe)
2001 2002 2003 2004 2005 2006 2007 2008
CONSUMPTION – TOTAL8 4,177.90 4,399.00 4,189.30 4,269.00 4,459.00 4,704.40 5,025.60 5,045.30
Coal and coal equivalents 3,632.30 3,874.70 3,613.20 3,632.00 3,830.80 3,983.80 4,134.30 4,090.20
Natural gas n. a. 0.26 0.56 1.77 5.88 n. a. 7.34 11.00
Oil and petroleum products 545.60 524.00 575.60 635.30 622.40 720.60 884.00 943.70
Nuclear 0.00 0.00 0.00 0.00 0.00 0.00 0.00 0.00
Hydroelectric power n. a. n. a. n. a. n. a. n. a. n. a. n. a. 0.40
Other RE neg. neg. neg. neg. neg. neg. neg. neg.
Source: author’s compilation adapted from NSO, as of 2005 and 2009

Renewable Energies in Central Asia
MONGOLIA
COUNTRY INTRODUCTION 108
The erection of 7,000 km of new transmission lines is planned and will tie massive investments. During 2007–2008, 245 km of 110 kV, 1,807 km of 35 kV, 2,967 km of 15 kV, 342 km of 10 kV and total length of 5,361 km transmission lines were launched for construction.
Electricity Sector and Natural Resources
ElectricityGross generation capacities of electricity have continuously been expanded in the last years with rates of 1–4 %. In 2007, Mongolia’s total installed electricity generation capacity was 1,062 MW and the total electricity generated 3,700 GWh (as opposed to 4,000 GWh in 2008). About 87 % are generated in Mongolia; the rest is being imported from Russia and part-ly from Kyrgyzstan. The dominant generation facilities are 7 coal fired combined heat and power plants (CHPP) with a total generation capacity of 828.8 MW equaling 79 % of the total electricity generation capacity. Furthermore, 7 % of the capacity is provided by 600 small diesel generators with indi-vidual capacities of 60–1,000 kW as well as 13 hydroelectric power plans with a total capacity of 27.5 MW, two wind pow-er plants, two solar power plants and a solar/wind hybrid sys-tem with a capacity of 6.65 MW. The backing for the Western Energy System from Russia equals approximately a capacity of 160 MW which is supplied through interconnected Russian power plants (see Figure 1). More details on types, capacities and commissioning dates of individual generation facilities can be found in annex 0.
Electricity consumption figures in table 3 show that Mongo-lia’s electricity demand has been growing stronger than the supply with growth rates between 3.4 and 8 % between 2001 and 2007. In 2008, the total consumption was 3,093 GWh with a peak load of 576 MW. In the biggest energy system, CES, the lowest and peak load in 2004 has reached 240 MW and 560 MW, respectively. The largest consumer groups are industry and the construction business with a share of roughly 60 %, followed by households and community services (25 %) and transport and communication (5 %).
Source: data compiled by the author from different sources
FIGURE 2Composition of Electricity Generating Facilities by Sources in 2007
Import 160 MW 14 %
Diesel 40 MW 4 %
HPP 27.5 MW 2 %
Wind and Solar 6.65 MW 1 %
CHPP 828.3 MW 79 %
TABLE 3
Electricity Production and Consumption, Import & Exports (GWh)
YEARS 2001 2002 2003 2004 2005 2006 2007 2008
Production total 3,223.0 3,279.0 3,309.0 3,474.3 3,586.4 3,712.5 3,896.1 4,198.2
Gross generation 3,017.0 3,111.7 3,137.7 3,033.4 3,418.9 3,544.2 3,700.7 4,000.6
Import 196.0 167.3 171.3 170.8 167.5 168.3 195.4 197.6
Consumption total 1,948.0 2,031.7 2,194.6 2,357.0 2,534.0 2,619.7 2,829.1 3,093.3
Industry & Construction 1,204.0 1,260.1 1,361.1 1,458.8 1,569.1 1,627.0 1,745.6 1,918.1
Transport and Communication 87.0 84.7 91.5 98.5 105.8 109.4 117.3 128.7
Agriculture 17.0 22.0 23.8 25.6 27.5 24.3 26.1 32.6
Communal housing 476.0 487.1 526.1 567.6 609.3. 629.2 694.6 742.3
Other 164.0 177.8 192.1 206.5 222.3 229.8 245.5 271.5
Export 18.0 15.5 6.7 8.2 11.9 20.8 10.1 15.9
Technical losses 1,257.039 %
1,231.838 %
1,107.733 %
1,109.132 %
1,040.529 %
1,072.029 %
1,056.927 %
1,089.126 %
Source: author’s compilation adapted from NSO, Statistical Yearbooks of Mongolia 2004–2008

Renewable Energies in Central Asia
MONGOLIA
COUNTRY INTRODUCTION 109
Having no or only negligibly resources of gas and oil, coal is perceived as the main strategic energy resource to define long term economic development of the country.
CoalMongolia’s total coal inferred reserves of 150 billion tons have been acknowledged. The preliminary and detailed exploration activities resulted in about 20 billion tons of coal reserves. The total reserves to be used for energy generation is 12.2 billion tons including 1 billion tons of hard and coking coal and 10.1 billion tons of B1 and B2 type brown coal. The largest coal deposits with measured resources are Baganur, Shivee-Ovoo, Ovghudag, Tevshiin Gobi and Tsaidam Nuur brown coal de-posits, Nalaih, Sharyn Gol, Nuurst Hotgor and Ulaan-Ovoo hard coal deposits and Tavantolgoi coking coal deposits. About 90 % of the measured coal resources are located in the central economic region.
Currently 30 private, 3 local and 2 state-owned mines are in operation. The use of 9 million tons of coal in 2007 is the highest in the last 10 years, whereof Mongolia consumed 6 million tons and exported 3.3 million tons to the Chinese market13. A coal balance sheet is presented in annex 0.
Nuclear fuel and other fuels It is noted in the Uranium Redbook that Mongolia has large uranium resources, which are total about 0.03 % of the world uranium reserves (although some sources say 5–10 %)14. Ura-nium is the main source of nuclear fuel and there is a need to determine reserves by enhancing uranium exploration and to study the possibility of producing nuclear energy.
PricesThe Energy Regulatory Authority (ERA) is responsible for providing licenses to the various new operating entities in the energy sector and approves of their proposed tariff structures. In 2004, a new tariff setting method was approved by the Regulator’s Boards of the ERA. By this method, both cost covering and fair return are expected to be achieved. The new method determines the production cost on the base of the past three years’ records and adopts the rate basis method for re-turn, which determines the return by multiplying the value of employed assets by the average rate of interest (profit) accord-ing to the capital structure.
Electricity tariffs differ between the grids and user groups. In June 2008, ERA has introduced multi tariffs, progressive tariffs and base line tariffs for different consumer groups. Metered tariffs for residential customers in CES are between 58–68 MNT per kWh, in the WES and EES 34–68 MNT per kWh. Industry pays time-dependent rates between 39–114 MNT in CES and EES and 90 MNT per kWh in the WES. Transitioning from a totally subsidized electricity system, not all tariffs set by ERA can be considered as cost-covering. Cost-covering is a big problem especially in isolated Aimag diesel stations where operation costs well exceed rev-enues from tariffs. The Government still subsidizes a signifi-cant share of the difference between the operating costs and
revenue from tariffs, adding up to 5 million USD per year. While Aimag utilities are heavily subsidized, no subsidies are provided to Soum utilities, where households are relatively poor and the cost of electricity supply is higher.A comparable situation applies for heat tariffs. As shown in ta-ble 5, the heat prices have strongly increased since 1990 when heating was nearly supplied for free. A more detailed overview of electricity and heating tariffs for different consumers and grids are shown in the tables in the appendices 0 and 0.
The price of petroleum products is an important benchmark for RE technologies. As to be seen in table 6, the petroleum prices have increased strongly over the last four years. In December 2008, for example, the price of a liter of diesel was at 1.11 USD, for a liter of A-95 1.26 USD and for a kg of LPG 1.26 USD. Although the prices are expected to be reduced in the coming months following the world market price development, the prices of petroleum products are high and make e. g. diesel-generated electricity in rural areas quite expensive.
Import and Export of EnergyIn general, Mongolia has sufficient resources of fossil fuels to cover its own demand as well as to export large amounts. Due to insufficient processing capacities and regional differences, oil and gas are also imported. Numbers on quantities can be found in the Annex.
Export of electricity to Russia amounted to 3.6 bil-lion kWh in 2007, import from Russia 2.2 billion kWh in the same period. Import from Kyrgyzstan was 1.2 billion kWh. The dynamics of 2000–2007 generation and consumption and energy import and export are presented in the Annex.
Growth Predictions for the Energy SectorThe development of the power demand in the grid was estimat-ed in the Asian Development Bank supported Master Plan15. The plan indicates that generation and demand are scheduled to increase at an annual average growth rate of 2.9 % between 2001 and 2020. Based on an improved generation and trans-mission efficiency, the total amount of electricity sold is as-sumed to grow from 2,082 GWh in 2005 to 3,276 GWh in 2020 in the medium scenario. The sales figures are assumed to be conservative as actual sales figures are already exceed-ing the ADB forecast by approximately 8 %. Besides the need to improve efficiency in generation and transmission, estima-tions also raise the need for new generation capacities.
Concerning heat, the ADB has estimated the demand for Ulaanbaatar city to increase at an annual average growth rate of 2 % during 2001–2010 and 1 % during 2010–2020 in the medium scenario. Including 15 % losses, the gross dis-tributed heat in Ulaanbaatar city is assumed to grow from 5,570 GWh in 2005 to 7,970 GWh in 2020. Total heating power demand in 5 other urban centers with CHPPs is fore-casted to increase from 1,600 GWh in 2005 to 2,620 GWh in 2020. More details are shown in table 6.
13 SEE ALSO FRANKLIN/SOMERS, 2008
14 OECD NUCLEAR ENERGY AGENCY (NEA) AND IAEA, AS OF 1995
15 SEE ASIAN DEVELOPMENT BANK, 2002

Renewable Energies in Central Asia
MONGOLIA
COUNTRY INTRODUCTION 110
16 APPLIED CURRENCY CONVERSION FACTORS ARE AS FOLLOWS:
2004: 1 USD = 1,212 MNT; 2005 1 USD = 1,227 MNT; 2006 1 USD = 1,165 MNT;
2007 1 USD = 1,170 MNT; 2008 1 USD = 1,265 MNT
17 PERSONAL COMMUNICATION WITH DASHVAANJIL CO.,LTD
18 PRICE OF PETROLEUM PRODUCTS AS OF 28 DECEMBER 2008
TABLE 4
Historical Heating Price for Residential Users 1990–2007, MNT
YEARS 1990 1991–1992 1993 1994–1995 1996 1997 1998–1999 2000–2001 2002–2004 2005–2007
Residential consumers(MNT/m2)
3.0 4.5 19.0 30.0 48.0 60.0 65.0 160.0 160.0 160.0
Residential hot water(MNT/person)
0.8 1.6 6.8 42.0 67.0 100.0 109.0 400.0 520.0 620.0
Source: author’s compilation adapted from ERA, as of 2007
TABLE 5
Prices of Selected Petroleum Products 2004–2008
YEAR/PRICE16
A-80(PER L)
A-92(PER L)
A-95(PER L)
A-98(PER L)
DIESEL(PER L)
LPG17 (PER KG)
MNT USD MNT USD MNT USD MNT USD MNT USD MNT USD
2004 620 0.51 695 0.57 735 0.61 n. a. n. a. 0.59 710 n. a. n. a.
2005 730 0.59 790 0.64 830 0.68 n. a. n. a. 865 0.70 n. a. n. a.
2006 n. a. n. a. n. a. n. a. n. a. n. a. n. a. n. a. n. a. n. a. n. a. n. a.
2007 750–800 0.66 910–930 0.79 1030 0.88 1060 0.91 950–980 0.82 n. a. n. a.
200818 1,050 0.83 1,140 0.90 1,600 1.26 1,750 1.38 1,400 1.11 1,600 1.26
Source: Petrovis, information available on the Internet Archive www.archive.org (www.archive.org)
TABLE 6
Electricity Generation and Demand Forecast 2005–2020
YEAR CES GENERATED EES GENERATED WES GENERATED TOTAL GENERATED IN GRID
SHARE SOLD TOTAL SOLD IN GRID
2000 2,871.0 58.7 22.7 2,952.4 60 % 1,771.4
2005 3,206.0 65.6 25.3 3,296.9 63 % 2,082.4
2006 3,275.3 67.0 25.9 3,368.2 64 % 2,149.5
2007 3,346.2 68.5 26.4 3,441.1 64 % 2,218.6
2008 3,418.5 69.9 27.0 3,515.5 65 % 2,290.0
2009 3,492.5 71.5 27.6 3,591.5 66 % 2,363.7
2010 3,568.0 73.0 28.2 3,669.2 66 % 2,439.8
2011 3,654.5 78.0 29.1 3,761.7 67 % 2,527.1
2012 3,743.1 83.4 30.1 3,856.7 68 % 2,617.7
2013 3,833.9 89.2 31.1 3,954.2 69 % 2,711.6
2014 3,926.8 95.4 32.2 4,054.3 69 % 2,809.0
2015 4,022.0 82.3 31.8 4,136.1 70 % 2,895.3
2020 4,552.0 93.1 36.0 4,681.0 70 % 3,276.7
Source: author’s calculations based on Asian Development Bank, as of 2002
TABLE 7
Heat Generation and Demand Forecast of Urban Centers with CHPPs in GWh, 2005–2020
YEAR ULAANBAATAR DARKHAN ERDENET BAGANUUR CHOIBALSAN DALAN-ZADGAD TOTAL
2000 4,853 579 558 258 173 28 6,449
2005 5,573 665 641 296 199 33 7,407
2010 6,495 775 747 345 232 38 8,632
2015 7,171 856 825 381 256 42 9,531
2020 7,966 950 916 423 284 47 10,586
Source: ADB, as of 2002

Renewable Energies in Central Asia
MONGOLIA
COUNTRY INTRODUCTION 111
4 POLICY FRAMEWORK FOR RENEWABLE ENERGIES
4.1 NATIONAL STRATEGIES AND PROGRAMS TO SUPPORT RENEWABLE ENERGIES
At the beginning of the millennium, the GoM has acknowl-edged the benefits of RE and initiated in 2001 the 100,000 Solar Ger national program to electrify 100,000 herders in rural areas of Mongolia by subsidized SHS. In June 2005, the Parliament of Mongolia adopted the National Renewable En-ergy Program targeted to increase the share of RE in the total energy production by supporting the construction of RE pow-er sources in two stages. In the first stage (2005–2010, near-term) the country is supposed to reach a 3–5 % share of RE in the total energy production and in the second stage 20–25 % (2011–2020 mid-term). In the first stage of the program, the Durgun (12 MW) and Taishir (11 MW) Hydro Power Plants were constructed, the 100,000 Solar Ger national program was launched and 12 RE systems for Soum centers with a ca-pacity of 60–150 kW were constructed. By May of 2008, an-other 70,000 herder families received SHS subsidized by 50 %. Furthermore, the launching of the construction of Orkhon (100 MW) Hydro Power Plant, the conduction of feasibility studies for several hydro power sites and grid connected wind farms and research in new technologies such as fuel cell or hydrogen power sources were planned. In the long run, the program targets to introduce grid connected wind farms and large-scale PV power generating systems in the Gobi desert area. According to the decree of the Parliament of Mongolia on the approval of the National Renewable Energy Program, the GoM is charged to raise funds for implementing the pro-gram from sources such as state budget of Mongolia, involve-ment of domestic investors, international donors and use of CDM. Mongolia has ratified the United Nations Framework Convention on Climate Change (UNFCCC) in 1993 and the Kyoto Protocol in 1999 and is committed to its main objec-tive of stabilizing emissions of greenhouse gas at a level that prevents dangerous interference with the climate system.
Since 2007, Mongolia has a Renewable Energy Law. The law is meant to regulate generation and supply of energy utilizing RE sources. It also includes feed-in tariffs for electric-ity from RE plants. The first power purchase agreement (PPA) was signed for a 50 MW grid-connected wind farm near Ul-aanbaatar. The price and tariffs of RE are set for a minimum of ten years starting at the date of law’s entry into force. To support the set price of RE in rural area, the law obliges the Government to form a RE fund. The fund will be formed by 50 % of the carbon credits and is intended for state-funded RE projects and other potential sources. The fund will be spent for financing the difference in feed-in tariffs and consumer tariffs for stand-alone RE systems, capacity building, research and development of RE and RE resources assessment. The RE feed-in tariff stated is not applicable to state-funded RE power sources. The tariffs are shown in table 8.
Furthermore, the European Bank for Reconstruction and Development is currently providing technical assistance to the ERA with respect to the implementation of the Renew-able Energy Regulatory Development Road Map project. The
project will cover assessment and improvement of a feed-in tariff regime related to electricity produced utilizing RE, as-sess least-cost options for developing RE and affordability of RE in Mongolia and formulate a RE regulatory development road map up to 2020.
The Promotion of Renewable Energy in Mongolia project financed by the German and Dutch Development Cooperation is implemented by the MME and the Energy Authority as Mongolian project partners and by the German Technical Cooperation Agency (GTZ) as German project partner. The third stage of the project, started in 2008, fo-cuses on the following aspects: supporting the establishment of a RE regulatory framework, implementing projects on grid-connected RE systems, capacity building, supporting the introduction solar thermal applications and dissemination of technologies and supporting the set-up of RE professional training curriculum and training materials.
SHORT BUSINESS INFOSince 2005 Mongolia’s Parliament adopted the National Renewable Energy Program, targeted to increase the share of RE in two stages. In the first stage (from 2005–2010) it is planned to reach 3–5 % share of RE and in the second one, 20–25 % (from 2011–2020).
4.2 REGULATIONS, INCENTIVES AND LEGISLATIVE FRAMEWORK CONDITIONS
The transition from a centrally planned economy to a market oriented economy has brought many institutional changes. Since April 2001, when the new Energy Law came into force, fundamental changes have been occurring in the energy sector as well. By passing the new Energy Law19, the Parliament cre-ated the legal basis for restructuring the energy sector including the use of RE technologies. Under the new law, the GoM has implemented several important steps towards creating market conditions in the energy sector, e. g. separation of ownership from regulation or separation of regulation from policy-mak-ing. A crucial part of the energy sector restructuring has been the creation of an independent regulatory mechanism by the establishment of the ERA, which enables investment and op-eration by new domestic and foreign economic entities. There-fore, the state owned energy entities were dismantled accord-ing to their lines of business and 18 shareholding companies and companies with limited liabilities have been established in their place.
The Ministry of Fuel and Energy (MFE) has introduced several policies to render the energy supply more independent of imports. As Mongolia has enough coal resources for the next 500 years (about 150 million tons), the exploitation of coal re-sources, the gasification of coal and the hydrogenation of coal have been the main focus of GoM’s policy. The promotion of RE and energy efficiency improvements has been strongly fos-tered by foreign aid programs. In the last years, however, Mon-golia has recognized the value of reducing consumption and the value of RE sources and is now also undertaking the promotion of energy conservation and RE. Another focus has been grid extension to stabilize and electrify great parts of the non-elec-trified Soum centers. The building of 7,000 km of new trans-19 THE ENERGY LAW OF MONGOLIA TOOK EFFECT ON 1 JANUARY 2001.

Renewable Energies in Central Asia
MONGOLIA
COUNTRY INTRODUCTION 112
UNDP, as of 2008; State Budget Law of Mongolia, as of 2006, State Budget Law of Mongolia, as of 2007, State Development Fund Law of Mongolia, as of 2007; Renewable Energy Law of Mongolia; National Program for Renewable Energy of Mongolia
Renewable Energy Targets The National Program for Renewable Energy was adopted in 2005. The program is targeted to reach a 3–5 % share of RE in the total energy production by 2010 and reach a 20–25 %of share by 2020.
Renewable Energy Promotion Policies In 2007, the Renewable Energy Law was adopted.
Feed-in tariffs Depending on type of RE source, the followings tariffs have been set: - Grid connected wind power: 0.080–0.095 USD/kWh- Grid connected hydro power (up to 5 MW installed capacity): 0.045–0.060 USD/kWh- Grid connected solar power: 0.150–0.180 USD/kWh- Stand-alone wind power: 0.100–0.150 USD/kWh;- Stand-alone hydro power: 0.080–0.100 USD/kWh (up to 500 kW), 0.050–0.060 USD/kWh (501–2,000 kW),
0.0450–0.050 USD/kWh (2,001–5,000 kW)- Stand-alone solar power: 0.200–0.300 USD/kWh
Renewable portfolio standard –
Capital subsidies, grants, rebates –
Investment excise or other tax credits –
Sales tax, energy tax, or VAT reduction –
Tradable Renewable Energy certificates –
Energy production payments or tax credits –
Net metering –
Public investment, loans or financing –
Public competitive bidding The GoM invested in 12 RE systems for Soum centers in 2007–2008 according to procurement law of Mongolia (direct contract-ing method had been used).
Municipal Level Policies The GoM introduced RE in 4 Soum centers in 2006–2007 using public competitive bidding.
Rural Energy Policies Targeted to electrify all Soum centers using grid extension or RE technology (about 16 Soums shall be electrified by RE accord-ing to the Integrated Energy Systems of Mongolia program adopted in 2000 and updated in 2007). In 2001, the GoM initiated the 100,000 Solar Ger national program in order to electrify rural herders by PV systems. Up to May 2008, another 70,000 SHS had been delivered to herders at a subsidized price.
CDM Framework Convention on Climate Change ratified in 1993,Kyoto Protocol ratified in 1999
TABLE 8
Renewable Energy Policy Landscape
mission lines has been planned and ties massive investments.20 The most important policies include the Government’s Ac-tion Plan for the Energy Sector of Mongolia (2004–2008), the Mongolian Energy System Master Plan (2002–2020), the Governmental Program for an Integrated Energy System of Mongolia and Mongolia’s Sustainable Energy Strategy (2000–2010). With the National Program of 100,000 Solar Ger and the National Program for Renewable Energy, the share of RE shall be enhanced. Since 2007, Mongolia has a Renewable En-ergy Law with feed-in tariffs for electricity from RE plants, which has, however, not yet really been implemented.
The major laws for RE generation and rural electrifi-cation are the Energy Law and the Renewable Energy Law. Other relevant legislations include the Environment Protec-tion Law21, the Law on Environmental Impact Assessment22, the Law on Land23, the Law on Construction24 and the Law on Water25. The Energy Law regulates matters relating to en-ergy generation, transmission, distribution, dispatching and supply activities, construction of energy facilities and energy consumption that involve utilization of energy resources. The Renewable Energy Law of Mongolia regulates relations con-cerning generation and supply of energy utilizing RE sources. According to the RE law, the ERA of Mongolia is obliged to approve a model for a power purchase/sales agreement based on the feed-in tariff for RE depending on the utilized type of RE.26
LicensingThe ERA issues licenses for the following: electricity genera-tion, electricity transmission, heat transmission, dispatching, electricity distribution, heat distribution, regulated supply of energy, unregulated supply of energy, importation and expor-tation of electricity and construction of energy facilities. A li-cense for the construction of energy facilities shall be granted upon an assessment of the environmental impact in accord-ance with the Law on Environmental Impact Assessment. The construction and operation of power plants (including RE systems) with a capacity of up to 1.5 MW designed for self-supply and the construction of the required transmission and distribution lines – provided that they do not have any negative impact on living conditions and environment – are not subject to license. Licenses for utilization of cross-border power lines, for construction of CHPPs and for conducting activities within the boundary of the main network are issued by the ERA.The term of a license for energy generation and transmission is 5–25 years, a license for the construction of energy facilities is valid for up to 5 years and other licenses for up to 10 years. The licenses can be extended for up to 25 years.
20 SEE MORE DETAILS ON RE REGULATION IN CHAPTER “POLICY FRAMEWORK FOR RENEW-
ABLE ENERGIES”.
21 THE ENVIRONMENT PROTECTION LAW TOOK EFFECT ON 20 MARCH 1995.
22 THE LAW ON ENVIRONMENTAL IMPACT ASSESSMENT TOOK EFFECT ON 22 JANUARY 1998.
23 THE LAW ON LAND TOOK EFFECT ON 7 JUNE 2002.
24 THE LAW ON CONSTRUCTION TOOK EFFECT ON 5 FEBRUARY 2008.
25 THE LAW ON WATER TOOK EFFECT ON 22 APRIL 2004.
26 THE RE FEED-IN TARIFF IS SHOWN IN TABLE 8.

Renewable Energies in Central Asia
MONGOLIA
COUNTRY INTRODUCTION 113
SP) and ALGAS (Asian Least Cost Greenhouse Gas Abate-ment Strategies) project. The goals of the USCSP project are to enhance the country’s capabilities to inventory the net emis-sions of its GHGs, assess its proneness to climatic change and evaluate the options to mitigate and adapt to climatic change. The ALGAS Project is meant to improve the understanding and estimates of GHG emission sources, to assess more effec-tively the options for reducing sources and enhancing factors of GHG on the base of common and verifiable methodologies and to identify and implement cost-effective opportunities for limiting and sinking GHG emissions and for mitigating po-tential adverse impacts of climate change.
Applicants for licenses have to provide the following docu-ments: state registration of legal entity, technical and econom-ic feasibility, energy resources assessment, quantitative and qualitative indicators of energy, specifications of equipment, scope of service and energy balance, environmental impact assessment, action plan for environment protection, sources of financing and financial capability and institutional capa-bility.27
Clean Development Mechanism (CDM)Currently, four projects have been registered for CDM with the DNA.28 The Taishir HPP and Durgun HPP projects are being financed by a Japanese Carbon Fund. Furthermore, two climate change related projects have been implemented in Mongolia, namely the U. S. Country Studies Program (USC-
27 MORE INFORMATION AVAILABLE AT SUOZZI & REID, NEW YORK STATE COMMISSION
ON PROPERTY TAX RELIEF, 2008
28 PERSONAL COMMUNICATION WITH MNE
MONGOLIA SUSTAINABLE ENERGY SECTOR DEVELOPMENT STRATEGY PLANIn order to ensure sustainable development of the energy sector, the Mongolia Sustainable Energy Sector Development Strategy Plan for 2002–2010 has been approved by Government Resolution #140 in July 2002. The plan includes:
-petus for the country’s economic and social development in order to mitigate and gradually eradicate the sector’s burden for the state budget
-tion of the private sector
-tion of the sector to the market relations
order to ensure that the users in rural areas and low-income clients benefit from the restructuring of the sector
cheap energy resources as hydro power and other RE sources will be expanded
heating needs of poor citizens In order to ensure accessibility of public services to the rural population, to develop small and medium size enterprises and to meet household needs of citizens, RE resources will be used on a large scale.
INTEGRATED ENERGY SYSTEM PROGRAMThe national Integrated Energy System of Mongolia Program was approved in May 2002 by resolution #23 of the State Great Hural and amended in January 2007 by resolution #10 of the State Great Hural. The program is dealing with the near-, mid- and long-term strategy for the power sector. The program will be implemented in the following stages:
enhancing the reliability of the existing regional electricity supply, by constructing new generating sources, transmission lines and by promoting RE sources. This includes:
and the establish the Integrated Energy System by further constructing new generating sources and transmission lines. This includes:
and WES via high-voltage electricity transmission line. This includes:
Integrated Energy System
share of RE The program will be financed with state or regional budgets, domestic or international investments, international soft loan and grant aids, private investment and other sources.

Renewable Energies in Central Asia
MONGOLIA
COUNTRY INTRODUCTION 114
5 POTENTIAL FOR RENEWABLE ENERGIES AND PRESENT USE
Mongolia is rich in RE resources. Solar, wind and hydro pow-er can be used for power generation. Due to the absence of a centralized supply system and due to the low demand and lack of other energy sources, RE is the optimal and (in most ar-eas) the only option for rural electricity supply. Despite these facts, the RE potential has remained largely unexploited. Low tariffs for conventional energy systems and abundant coal resources have constrained the development of RE systems. Earlier attempts to disseminate RE have experienced minimal success due to a lack of investments and of know-how. Recent initiatives of the Government towards the development of RE systems, however, are more promising as the legal framework for RE has improved.
RE so far plays an important role in two distinct areas: stand-alone electricity supply for nomadic households and off-grid electricity supply for rural centers. RE (hydro, solar and wind) currently represents about 3 % of country’s total elec-tricity generating capacity. The massive grid-extension and the new feed-in tariff might offer RE a new field for application.
Based on the last available information, the potentials for the individual energy sources are described in the subse-quent sections.
5.1 BIOENERGIESDue to the climatic conditions, the use of biomass in Mon-golia is strongly limited to use of wood and dung for cooking and heating. Dung is still the main energy resource for rural areas and especially for nomadic households. Utilization of bi-omass for energy generation, however, is limited to areas with timber resources. The two primary categories of forested land are northern coniferous forests and southern Saxaul forests. Commercial and domestic exploitation of forest resources is primarily in timber and firewood. Timber comes exclusively from the northern forests, while both northern and southern forests serve local needs for firewood, livestock forage and other timber products.
Statistics on standing volumes and forest depletion are to be read with caution as data are often confusing. Official statis-tics underestimate the total industrial output and fail to take the consumption of firewood or other household-use wood into account. The last national forest inventory was conduct-ed almost 30 years ago with local inventories. According to the most realiable information available, the average standing volume of northern closed forest is estimated to 103 m3 per hectare for a total standing volume of over 1,300 million m3 (see also table in annex 0). In a study conducted in 2002, the World Bank estimated that Mongolia lost about 1.6 million hectares of forest from the 1950s to the 1980s and 660,000 hectares from 1990 to 2000. The major causes of forest loss have been unsustainable forest harvesting (both permitted and illegal) for timber and firewood, wildfires, mining, insect and disease infestations, uncontrolled grazing and long-term climatic fluctuations. Decisions are made in an ad-hoc man-ner and resources are allocated to the strongest lobby.
Weather and waste composition in Mongolia are not suitable to develop biogas from wastes or to install bio fuel plants. Concerning municipal solid waste (whereof approxi-mately 900,000 m³ come from households in Ulaanbaatar), an additional problem is that it is dumped at waste dumping sites on the outskirts of the cities unsorted and is likely to partly consist of toxic and hazardous (including radioactive) wastes29.
5.2 SOLAR ENERGYMongolia enjoys a favorable solar energy regime ranging from a low insulation of 4.5 kW/m2 per day and less than 2,600 sunshine hours in the northern part of the country to a maxi-mum of 5.5–6.0 kW/m2 per day with a sunshine duration of 2,900–3,000 hours in the southern part of the country. The high insulation regime covers some 70 % of the territory. In-termediate insulation of 4.5–5.5 kW/m2 per day with an an-nual sunshine duration of 2,600–2,900 hours covers 18 % of the territory of Mongolia. It is estimated that the southern part of the country receives a daily average insulation between 4.3 and 4.7 kW/m2. Total annual radiation intensity equals 2.2 * 1012 MWh in Mongolia. The Gobi region with its higher solar energy resources would be suitable for large-scale solar energy applications. SHS can be used almost all over the country. Data on technical and economic potentials, however, are not available and the existing information cannot be con-sidered as sufficiently accurate or complete for solar energy system design purposes.
Current use has mainly focused on decentralized individual SHS-electricity systems. According to statistical surveys, 103,000 nomadic households light their homes with Solar PV modules (20–200 W) and/or small wind genera-tors (50–300 W). The biggest PV system with a capacity of 200 kW is in operation in Noyon Soum, Umnugovi Aimag. A number of PV systems (20–100 kW) and PV/wind hybrid sys-tems (30 kW PV) are in operation all over the country. Public services in non-grid Soum centers such as telecommunication offices, TV repeater stations, border control units and hos-pitals use solar PV systems. Vacuum-tube solar water heat-ers with 120–160 l tanks were recently introduced and more 29 ADB, 2004
TECHNOLOGYINSTALLED CAPACITY
(MW)
ECONOMIC POTENTIAL
(MW)
TECHNICAL POTENTIAL
(MW)
PHYSICAL POTENTIALS
(MW)
Solar PVa 2.50+n. a. n. a.
2.20 * 1012 (MWh/year)Solar WHa 0.01
Small Hydroa 23.00n. a. 1,000.00 6,200.00
Mini Hydroa 2.00
Micro Hydro 2.50 n. a. n. a. n. a.
Geothermal – n. a. n. a. n. a.
Biogas – n. a. n. a. n. a.
Windb 1.30+ n. a. 4,300,000 n. a.
Source: a – ADB, as of 2004 b – NREL, as of 2000
TABLE 9
Technical Potentials for RE (MW)
Renewable Energies in Central Asia
MONGOLIA
115
than 100 installations are being used in bathhouses, hospitals and tourist camps30. The International Energy Agency (IEA) is currently conducting a study on outstanding large-scale PV power systems in the Gobi region of Mongolia31. The current utilization of solar energy in Mongolia is shown in the map in annex 0.
5.3 WIND POWERIn 2000, a wind energy resource atlas of Mongolia was been developed with the assistance of the National Renewable Ener-gy Laboratory (NREL) of the Department of Energy (DOE), USA32. According to this atlas, more than 160,000 km2 of the land area in Mongolia are estimated to excellent wind poten-tial for utility-scale applications. The amount of windy land is about 10 % of the total land area of the country. This amount of windy land, using conservative assumptions that result in about 7 megawatts (MW) of capacity per km2, could supply over 1,100,000 MW of installed capacity and potentially de-liver over 2.5 trillion kWh per year. All of the Aimags have at least 6,000 MW of wind potential. There are 13 Aimags in Mongolia with at least 20,000 MW of wind potential and 9 Aimags with more than 50,000 MW of wind potential. Um-nugovi alone is estimated to have over 300,000 MW potential. If additional areas with moderate or good wind resource po-tential are considered, the estimated total windy land area in-creases to more than 620,000 km2 or almost 40 % of the total land area of Mongolia. This amount of windy land could sup-port over 4,300,000 MW of installed capacity and potentially deliver over 8 trillion kWh per year. There are 15 Aimags with at least 50,000 MW, 12 Aimags with at least 100,000 MW, and 9 Aimags with at least 200,000 MW of wind potential. These data show that wind could play an important role in the development of both rural areas (individual wind generators) and small urban centers (Soum or even Aimag). Utility scale wind resources at 30 m height are shown in the annex.
The current installed capacity sums up to 1,450 kW. A 100 kW wind turbine, which is currently the biggest, was in-stalled in Erdenetsgaan Soum, Sukhbaatar Aimag. A number of wind power systems (70–150 kW) and wind-solar hybrid systems (120 kW wind) are in operation all over the country. Nomadic households use small wind turbines with a capacity of 50–400 W. A 50 MW on-grid wind park near Ulaanbaatar is underway and a PPA was installed. The license for the con-struction of the wind park is issued to NewCom LLC. The German KfW Bank financed the Renewable Energy II project and is making a study on the wind park in the Gobi region of Mongolia. Wind speed measurement has started in order to ac-cess the possibility of constructing a wind park in Gobi-Altai Aimag, which can work parallel to Taishir HPP. Furthermore, the Energy Research and Development Center33 estimated in a study that large-scale wind turbine generators with a capac-ity of 100–150 kW could be placed in 52 provincial centers in the southern part of Mongolia.34 The most promising sites are meant to get priority for establishing the technical and eco-nomic feasibility of operating 100–150 kW wind turbine gen-erators parallel to existing diesel generators. A wind resource map of Mongolia and a map on the current utilization of wind energy are presented in appendices 0 and 0.
5.4 GEOTHERMAL ENERGYFrom the geo-tectonic point of view, Mongolia is part of a consolidated plate and therefore not very active. An exception is an East to West stretch in the northern part of the country where the horizontal movement of two plates temporarily re-sults in earth quakes. Along this area, a number of hot springs occur. Mongolia has about 42 small hot springs in Khangai, Khentii, Khuvsgul, the Mongolian Altai mountains, the Dor-nod-Darigangiin steppe and in the Orhon-Selenge region.
An overall estimation of the technical, physical and economic geothermal energy potential is not available. A geophysical survey on the crust structure, however, affirmed that accumulative thermal sources (magma lumps) are located near the surface under the Khangai and Khentii mountain-ous region. Heat flow in Mongolia was studied from 32 heat flow stations, which do not cover the South Mongolia and the Mongolian Altai province. The average heat flow in different tectonic regions has been estimated as follows37: Mongolian Altai mountainous region: 54 ± 24 MW/m2, Khangai moun-tainous region: 52 ± 6 MW/m2, Khuvsgul lake region: 80 ± 10 MW/m2, East Mongolian steppes: 44 ± 6 MW/m2.
Some of the hot springs are used as traditional health resorts and for small-scale greenhouse or space heating. Based on the available information, the commercial exploitation of geothermal resources in Mongolia for power generation is still considered as marginal. Further investigations will be re-quired to verify the extent of geothermal resources and their potential of utilization for small-scale power generation pos-sibly with binary cycle power plants.
Outlines of the main geothermal structures of Mon-golia and a heat flow map of Mongolia are shown in appen-dices 0 and 0.
5.5 HYDRO POWER The hydro power resources of Mongolia have not been fully investigated yet. A number of promising hydro power sites, however, have been identified to date in Mongolia. There are about 3,800 small rivers with a total length of 65,000 km in Mongolia. The average annual flow is 3.46*1010 m3 and the physical hydroenergy potential is currently estimated at 6,200 MW. More than 1 GW of technical potential of hydro power has been identified. According to a study of NREC35, about 70 % of all hydroenergy resources are concentrated in the Mongolian Altai ranges, in the Tagna and Khan Khukhii ranges, in the mountainous areas of Khuvsgul, Khangai, Khentii and at the Khalkh Gol River.36
30 PERSONAL COMMUNICATION WITH ENGEN CO.,LTD.
31 KOSUKE KUROKAWA (2007): ENERGY FROM THE DESERT – PRACTICAL PROPOSALS
FOR VERY LARGE-SCALE PHOTOVOLTAIC SYSTEMS, EARTH SCAN UK & USA
32 USAID, NREL AND NREC, AS OF 2000
33 THE ENERGY RESEARCH AND DEVELOPMENT CENTER WAS ABOLISHED IN MARCH
2009 AS PART OF GOVERNMENT RESTRUCTURING.
34 NATIONAL RENEWABLE ENERGY PROGRAMME, AS OF JUNE 2005
35 NATIONAL RENEWABLE ENERGY CENTER WAS ABOLISHED IN MARCH 2009
AS PART OF GOVERNMENT RESTRUCTURING.
36 HYDRO POWER POTENTIALS AND PLANNED AND INSTALLED CAPACITIES IN
MONGOLIA CAN BE FOUND IN THE ANNEX.
COUNTRY INTRODUCTION

Renewable Energies in Central Asia
MONGOLIA
116
In recent years, there was an increasing interest in construct-ing large-scale HPPs in order to reduce the imported electric-ity from Russia. MME’s current policy for hydro power is to support grid-connected HPPs to cover the peak load of CES. A cascade HPP on the Selenge River is also being discussed. Currently, there are 13 small and mini HPPs with a total capacity of 27.5 MW in operation. The small hydro plants are run-of-river designs that provide electricity to neighbor-ing rural areas except during the winter. The construction of the Taishir HPP with a capacity of 11 MW was completed in 2008. The Govi-Altai Aimag center is connected to the HPP with a 47 km transmission line of 35 kV and the Zavkhan The Aimag Centre is connected with a 135 km transmission line of 110 kV. The project was financed with 20 million USD from a Quwait fund, 13 million USD from an Abu-Dhabi Fund and 2.7 million USD from the GoM. The construction of Durgun HPP with capacity of 12 MW was completed in 2008. The HPP will supply the Uvs, Khovd and Bayan-Ulgii Aimags with electricity. The project was financed by 26.5 mil-lion USD from soft-loans of the Shanghai Group of China.
Consideration is being given to further develop small hydro plants in order to reduce diesel imports. A number of hydro power stations with capacities ranging from 100 kW up to 220 MW (Orkhon HPP 100 MW, Egiin Gol HPP 220 MW, Chargait HPP 24 MW etc.) have been studied for feasibility during the last few years for both grid – supportive for voltage control – and off-grid supply. One complicating
factor is that many rivers freeze over during the winter and cannot provide year-round electricity. In order to prioritize and to better identify the economic potentials, there is a need for developing a hydro power master plan.
6 MARKET RISK ANALYSIS AND BARRIERS FOR MARKET ENTRY
Large amounts of foreign investment have flown into Mongo-lia’s economy, about 60 billion USD in 1991–2006, 75 % of that into the traditional fossil energy sector. There are some projects in the field of RE financed by foreign and interna-tional foundations.
6.1 COST OF RENEWABLE ENERGY APPLICATIONSThe costs of RE applications are shown in table 10. Depending on technology, application and site, the costs are generally not competitive (except HPP) with grid/retail electricity or com-mercial heating and energy production. Its role in grid-con-nected electricity supply is currently negligible, but through the new feed-in law the role of RE is expected to increase.
TECHNOLOGY CHARACTERISTICS ENERGY COSTS COST TRENDS AND POTENTIAL FOR COST REDUCTION
Power generation
Benchmark Conventional:CHPP
7 CHPP – 828 MWa60–90 MNT/kWhb
growing
Large hydro – – –
Small hydro Durgun HPP – 12 MW(Dam)Taishir HPP – 11MW (Dam)
Durgun – 23 MNT/kWhTaishir – 0.05–0.07 USD/kWh
n. a.
Wind – – –
Biomass power – – –
Geothermal power – - -
Solar PV (module) - - -
Rooftop solar PV - - -
Solar Thermal Power (CSP)
- - -
TABLE 6
Status of Renewable Technologies – Characteristics and Cost
Hot water/Heating
Benchmark Conventional:CHPP
7 CHPP – 2,011 MWthd265–400 MNT/m2
6,144-18,241 MNT/GCalegrowing
Biomass heat – – –
Solar hot water/heating Size: 120–160 lType: vacuum tube100 piecesf
n. a. n. a.
Geothermal heat n. a. n. a. n. a.
Biofuels – – –
37 OUTLINES OF THE MAIN GEOTHERMAL STRUCTURES OF MONGOLIA AND A HEAT FLOW
MAP OF MONGOLIA CAN BE FOUND IN ANNEX.
COUNTRY INTRODUCTION

Renewable Energies in Central Asia
MONGOLIA
COUNTRY INTRODUCTION 117
TECHNOLOGY CHARACTERISTICS ENERGY COSTS COST TRENDS AND POTENTIAL FOR COST REDUCTION
Rural (off-grid) energy
Benchmark Conventional: Diesel generators
46 MWg 540 MNT/kWhi growing
Mini-hydro Bogdiin HPP – 2,000 kW 50 MNT/kWhj –
Micro-hydro 10 HPP – 100–2,500 kW n. a. n. a.
Pico-hydro Borburgas – 300 W(cross flow)
– n. a.
Biogas digester – – –
Biomass gasifier – - -
Small wind turbine Size : 10–100 kW(Total 1,200 kW)k
0.22 USD/kWhf -
Household wind turbine 250 kWk n. a. n. a.
Small PV 970 kWk 0.39 USD/kWhl -
Solar home system 4,200 kWk n. a. n. a.
Sources: a – ERA, 2007; b – ERA website, www.era.energy.mn/eng/modules.php?ss=4&id=60; c – Personal communication with the project units of Durgun and Taishir HPP; d – ADB, 2002; e – ERA website, www.era.energy.mn/eng/modules.php?ss=4&id=61; f – according to feasibility study by NREC; g – Personal communication with Engen Co., LTD, h – Estimation by NREC, i – Rough estimates, INTEGRATION Environment & Energy, Making Access to Reliable Electricity
Affordable in Rural Areas – estimation based on available information
6.2 CURRENT BUSINESS AND INVESTMENT ACTIVITIESThe RE market is still strongly Governmental and interna-tional donor-driven, whereas RE business activities remain limited. Several projects have been completed. An overview of GoM and international donor-financed projects is provided in the tables attached as Appendices 0, 0 and, 0. The new feed-in law is, however, expected to promote private sector participa-tion.
Besides of the Government programs mentioned in chapter 3, the World Bank currently manages the Renewable Energy and Rural Electricity Access Project, which has be-come effective on 4 May 2007. The project aims at increas-ing access to energy for the country’s rural population. The project consists of 3 components, i. e. herder electricity access, Soum electricity access and national capacity building. Partial funding comes from the International Development Agency, GEF, the Government of Netherlands and the GoM. The total cost of the project amounts to 13 million USD. Furthermore, KfW bank financed the Renewable Energy II project which has completed the rehabilitation of Bogdyn HPP (2 MW) in Zavkhan Aimag and the distribution network in Uliastai. A feasibility study for a grid-connected wind park in the Gobi region of Mongolia is still ongoing and with Dutch funding, the GTZ is building up mini-hydro power schemes in Zha-vakan Aimag.
6.3 GENERAL SITUATIONMongolia made good reform progress during 2006 and 2007 and, as a result, received three transition score upgrades on large-scale privatization, competition policy and banking re-form from EBRD’s transition progress review38. The liquida-tion of several large state-owned enterprises has encouraged privatization, while the competition authority has established a good track record for defending competition rules. The banking sector is now fully privatized and has grown substan-tially over the past years, with domestic credit to the private sector increasing by over 40 % in 2006 and 20 % in 2007.
One of the main macro-economic concerns is with respect to the rising inflation. Following continued rapid growth in broad money and due to increasing fuel prices, pub-lic remuneration and utility prices during the third and fourth quarter of 2007, inflation rose during the second half of 2007. End-year inflation rate reached 15.1 %.
CorruptionCorruption is still a serious issue in Mongolia at both the “subordinate” or administrative and “grand” or elite levels. According to the Corruption Perceptions Index of the Trans-parency International Organization, Mongolia ranks 102 with 3.0 points in 2008, 99 with 3.0 points in 2007, and in 99 with 2.8 points in 200639. Opportunities for increased cor-ruption emerged during the transition when land and compa-nies where privatized. Areas that have been particular affected are procurement and customs, but a variety of citizen- and business-to-government transactions are also concerned. An inadequate civil service system, the lack of transparency and limited access to information in government functions, lim-
38 EBRD, 2008; PLEASE FIND A COPY OF MONGOLIA’S TRANSITION PROGRESS REVIEW
IN ANNEX.
39 TRANSPARENCY INTERNATIONAL, 2009

Renewable Energies in Central Asia
MONGOLIA
COUNTRY INTRODUCTION 118
ited political will and leadership to implement laws, compli-cated by conflictive and overlapping laws and weak govern-mental control institutions are the main factors to encourage corruption40.
Despite the fact that few of the conditions to prevent corruption from getting worse are fulfilled, the situation has not extended to a degree that is evident in many other coun-tries with contexts and histories similar to that of Mongolia. Furthermore, there are a number of initiating and rudimen-tary efforts underway to actively reduce corruption. Besides the government’s commitment to apply to international anti-corruption regimes and protocols41, an Independent Author-ity Program as well as a National Program against Corruption have been established in July 2006.
Availability of local Know-howMongolia has started to obtain the necessary local experience to design and install small hydro, PV and wind projects. There are four institutions in Mongolia instructing experts in the en-ergy sector42:
The Power Engineering School of the Mongolian Univer-sity of Science and Technology is a major institution for research and instructing experts in the power sector. It recently started educating engineers in RE systems.
The Construction College trains technicians, electricians and electrical engineers.
The Engineering School of Mongolian State University of Agriculture prepares experts in agricultural electrification.
The Technical College in Darkhan-Uul Aimag is training electrical engineers.
There are only few skilled employees who are able to resume both management and planning functions and to make finan-cial analyses. Especially in rural areas, there is very limited technical know-how with respect to the operation and main-tenance of RE systems. Skills, competence and economic abil-ity of skilled employees, technicians and institutions are often insufficient with respect to project implementation43.
Local AcceptanceIn general, the local acceptance of RE systems is best in rural areas where no reliable electricity supply is available. Among them, nomadic households are highly attracted to wind and SHS as single option for their power supply. However, aware-ness and knowledge of rural people with regard to the poten-tials and limitations of the RE systems is low, often resulting in unrealistic expectations. At the same time, there is very limited technical know-how available with respect to the operation and maintenance of the RE systems, resulting in inadequate maintenance and frequent system breakdowns.
6.4 BUSINESS DEVELOPMENT The business framework in Mongolia is liberalized to a certain degree and Mongolia is interested to attract foreign invest-ment. According to the Word Banks Doing Business Survey 2009, doing business in Mongolia (ranking 58) is easier than in its neighboring countries, China (83), Russia (120) and easier
than in other Central Asian countries such as Tajikistan (159), Kyrgyz Republic (68), Kazakhstan (70), Uzbekistan (138) and Afghanistan (162). Registering property, protecting investors and fulfilling contracts is easier, but cross-border transactions, closing business and dealing with construction permits is the most difficult part of doing business in Mongolia44.
Foreign investment enjoys legal protection guaranteed by the Constitution and other legislation, which complies with those laws and as guaranteed by the international agreements to which Mongolia is a party45. The GoM guarantees physi-cal property and ensures protection for intellectual property. Mongolia became a member of the World Intellectual Prop-erty Organization (WIPO) in 1979. Since 1991, Mongolia also has joined eleven International Conventions including the Paris Convention on the Protection of Industrial Prop-erty and the Madrid Agreement on International Registration of Trademarks and Agreement for Patent Cooperation. For-eigners are allowed to found companies and be their owner46. The registration of a business is considered to be easy. Foreign investors can get help for their registration process from the Foreign Investment and Trade Agency, where one-stop service is available. The Government authority has to issue the certifi-cate of registration within 3 working days after receiving the requested documents or issue a refusal including the reasons for the refusal. Foreign investors with an initial investment of 80,000 USD or more receive a certificate of foreign inves-tor. Foreign investors with an initial investment of 50 million USD or more may conclude an investment agreement with the Government. Investment agreements guarantee a stable legal environment for a period of up to 10 years for 50–100 million USD investments, up to 15 years for 100–300 million USD investments and up to 30 years for investments offer 300 mil-lion USD. Foreign investors may receive tax exemptions for
40 CASALS & ASSOCIATES, INC., 2005
41 MONGOLIA HAS SIGNED E. G. THE ANTI-CORRUPTION PLAN OF THE ASIAN DEVELOP-
MENT BANK/ORGANIZATION OF ECONOMIC COOPERATION AND DEVELOPMENT (ADB/
OECD) AND THE UNITED NATIONS CONVENTION AGAINST CORRUPTION (UNCAC)
42 THE CONTACT DATA FOR THESE INSTITUTIONS CAN BE FOUND IN CHAPTER “RENEW-
ABLE ENERGY BUSINESS INFORMATION AND CONTACTS”.
43 SEE SOME MORE DETAILS IN ADB, 2006.
44 DOING BUSINESS 2009 PROVIDES A QUANTITATIVE MEASURE OF REGULATIONS FOR
DOING BUSINESS AS THEY APPLY TO DOMESTIC SMALL AND MEDIUM-SIZE ENTER-
PRISES; SEE WORLD BANK, 2009
45 ACCORDING TO FOREIGN INVESTMENT LAW OF MONGOLIA
46 ACCORDING TO COMPANY LAW OF MONGOLIA
TABLE 7
Ease of Doing Business in Mongolia
Ease of Doing Business 58
Starting a business 59
Dealing with construction permits 103
Employing workers 71
Registering property 20
Getting credit 68
Protecting investors 24
Paying taxes 79
Trading across borders 156
Enforcing contracts 38
Closing a Business 108
Source: World Bank, Doing Business 2009

Renewable Energies in Central Asia
MONGOLIA
COUNTRY INTRODUCTION 119
up to 10 years. Business entities with foreign investments and branches of a foreign legal entity may acquire the right to use land by way of lease and subject to the conditions and proce-dures set out in the legislation on Mongolian land.
6.5 TAXATIONTaxation in Mongolia is regulated by the Constitution of Mongolia, the Tax Code of Mongolia and several specific laws, regulations and instructions. The authorized agency responsi-ble for the supervision of timely payment of taxes is the Gen-eral Department of National Taxation of Mongolia.
Business entities with foreign investments and branch-es of a foreign legal entity are liable for tax under Mongolian tax laws. Tax incentives and/or exemptions for a business en-tity with foreign investment, branches of a foreign legal entity and implementing entities of an investment agreement will be subject to Income Tax Law of Business entities, Real Estate Tax Law, Customs Tariff Law, Value Added Tax Law, Excise Tax Law and Land Law of Mongolia. Income Tax for busi-ness entities is 10 % for up to 3 billion MNT yearly profit and 25 % for profit that exceeds 3 billion MNT. Real Estate Tax is 0.6 %. Allocation to the Social Insurance is 29 %, with 19 % being paid by the employer and 10 % by the employee. Land Use Fee for road and transmission lines outside of urban cent-ers is 1,500–7,500 MNT/km. Land Use Fee in urban centers is
0.1–1 % of the land rates set by the Government47 and 0.01–0.03 % in other areas. Land Use Fee in Ulaanbaatar is 44–440 MNT/m2. Water Use Fee for household use is 1–30 MNT/m3, 10–20 MNT/m3 for production use for surface water and 30–50 MNT/m3 for ground water and 20–100 MNT/m3 for mining industry for surface water and 50–150 MNT/m3 for ground water48.
6.6 IMPORT AND EXPORT Customs Tax for imported goods is 5 % of the contract amount plus transportation costs. According to the Tax Gen-eral Law of Mongolia, Value Added Tax is 10 % and is applied to all taxable goods and services produced inland, including imported goods. VAT is 0 % for exported production and services.
Transportation is an expensive service in Mongolia. Usually, there are three main types of transportation: vehi-cle (trucks), air and train. Local transportation by vehicle is around 250 MNT/ton/km. Local air transport cost is in 2,500–3,800 MNT/kg depending on the distance. Trans-portation cost for a 40 ton container is 5,000 USD between Hamburg, Germany, and TianJin, China, by sea, 2,400 USD between TianJin, China, and Zamiin Uud by train, 600 USD between Zamiin-Uud and Ulaanbaatar by train (400 USD for a 20 ton container).49
7 RENEWABLE ENERGY BUSINESS INFORMATION AND CONTACTS
Below, a brief overview of government agencies, acadeMIEs and business contacts relevant to work in the RE sector is provided including contact people and details as well as a brief description of the organizations.
ORGANIZATION/CONTACT PERSON ADDRESS/PHONE NUMBER / E-MAIL CONTACT
DESCRIPTION OF PRODUCTS, SERVICES AND ROLE
Mongolian National Chamber of Commerce and Industry
S. Demberel, Chairman & CEO
Sambuu Street 11 Ulaanbaatar 211238, Mongolia
Telephone: +976-11-327176, 312501, 323974
Fax: +976-11-324620
E-mail: [email protected], [email protected]
Web: www.mongolchamber.mn
Established in 1960. Since the adoption of the Law of the Chamber of Commerce and Industry in 1995, the Chamber’s activities have been expanding both domestically and internationally. The Chamber is the main business representative body of the Mongolian business community engaging most of the companies, enterprises and trade organizations and protecting their common interests.
Foreign Investment and Foreign Trade Agency
Baasankhuu Ganzorig
Chairman, WAIPA Steering Committee Member
Tel: + 976-11-326040, 320871, 321438, 320793,
Fax: + 976-11-324076
E-mail: [email protected]
Post: FIFTASambuu Street 11Ulaanbaatar 211238, Mongolia
Office: Suites 209, 801-805, 1202Government Building 11Sambuu Street 11Ulaanbaatar, Mongolia
Web: www.investmongolia.com www.exportmongolia.com
Foreign Investment and Foreign Trade Agency of Mongolia (FIFTA) is the Government agency responsible for the promotion and facilitation of foreign direct investment and foreign trade in the country. The FIFTA’s vision is to promote and facilitate foreign investment and foreign trade towards meeting the national goals of industrial development and export growth, to promote Mongolia as a destination for new investment and business and to be the leading agency in Mongolia.
TRADE ORGANIZATIONSE
47 ACCORDING TO LAW ON LAND USE FEE
48 ACCORDING TO LAW ON WATER AND SPRING RESOURCES USE FEE
49 PERSONAL COMMUNICATION WITH INTERNATIONAL FREIGHT FORWARDING CENTER OF
MONGOLIAN RAILWAY

Renewable Energies in Central Asia
MONGOLIA
COUNTRY INTRODUCTION 120
ORGANIZATION/CONTACT PERSON ADDRESS/PHONE NUMBER / E-MAIL CONTACT
DESCRIPTION OF PRODUCTS, SERVICES AND ROLE
Golomt Bank
Commercial Street 6 UB-36, Mongolia Telephone: +976-11-310639, 323844 Fax: +976-11-326865 Web: www.golomtbank.com
Golomt Bank of Mongolia declared an after tax profit of 7.96 billion MNT (6.88 million USD) for the first half of 2008. Total assets reach 724 billion MNT, (625 million USD).
Trade and Development Bank of Mongolia (TDB)
Juulchnii Street 7Baga Toiruu 12Chingeltei DistrictUlaanbaatar, Mongolia
Telephone: +976-11-312362, 331133Fax: +976-11-327028, 331155Web: www.tdbm.mn
In June 2008, TDB’s total asset reached 661.5 billion MNT and own capital reached 79 billion MNT, representing 17.2 % and 18.7 % market shares respectively. The bank has had earnings track record with 11.8 billion MNT in 2006, 16.4 billion in 2007 and 8 billion in June 2008.
Anod Bank
Zaluuchuud Avenue 1st Khoroo Ulaanbaatar, Mongolia
Telephone: (976-11)-464114 Fax:(976-11)-464109Telex: 79361 ANODBMN E-mail: [email protected]: www.anodbank.com
As of December 2006, Anod Bank’s assets reached 202,6 billion MNT. Anod Bank now operates through its 22 branches located in the capital and eight provinces serving over 60,000 customers.
Khaan Bank
Seoul Street 25PO. Box 192Ulaanbaatar 44, Mongolia
Telephone: 976-11-332-333Fax: 976-7011-7023 Web: www.khanbank.com
In 2007, Khaan Bank’s after-tax earnings were 19.4 billion MNT. This equated a return on assets of 3.9 % and a return on equity of 45.9 %. The bank’s branch system has 466 offices.
FINANCING INSTITUTIONS
ORGANIZATION/CONTACT PERSON ADDRESS/PHONE NUMBER / E-MAIL CONTACT
DESCRIPTION OF PRODUCTS, SERVICES AND ROLE
Ministry of Mineral Resources and Energy
Mr. Ts. Tserenpurev, State Secretary
Government Building IIUnited Nation Street 5/2210646
Telephone: +976-11-261511E-mail: [email protected] Web: www.mme.energy.mn
Defining, regulating, monitoring and planning of energy sector development policy, organization and implementation of Government programs and projects in the energy sector.
Ministry of Nature and Environment
Mr. T. Gantulga, State Secretary
Government Building III Baga Toiruu 44Sukhbaatar District
Telephone: +976-11-265615E-mail: [email protected]
National designated Authority for CDM; policy defining, planning and monitoring in the environmental sector of Mongolia
Ministry of Finance
Mr. D. Battur, State Secretary
United Nations Street 5/1210646
Telephone: +976-11-260247E-mail: [email protected]
Monitoring, planning and defining policy in the financial sector of the country
State Specialized Inspection Agency
Mr. Ts. Shiirevdamba, Director
Government Building XII Barilgachdiin Talbai 13 211238
Telephone: +976-11-263790
Professional technical inspection, monitoring and control
Energy Regulatory Authority
Mr. R. Ganjuur, Chairman
University Street 2a Sukhbaatar District14201Telephone: +976-11-319312E-mail: [email protected]
Main regulatory institution in the energy sector
Energy Authority
Mr. Batbayar, Head of Renewable Energy Department
Renewable Energy Department Energy AuthorityPeace AvenueUlaanbaatar 36, Mongolia
[email protected] Telephone: +976-11-342375
RE resources assessment, developing norms and standards for RE equipment, application and maintenance, RE research and development, technical monitoring and evaluation of RE projects
GOVERNMENT AGENCIES
Renewable Energies in Central Asia
MONGOLIA
COUNTRY INTRODUCTION 121
ORGANIZATION/CONTACT PERSON ADDRESS/PHONE NUMBER / E-MAIL CONTACT
DESCRIPTION OF PRODUCTS, SERVICES AND ROLE
State University of Mongolia
Mr. Ts. Gantsog, Rector
University Street 1Baga Toiruu 1Sukhbaatar District
Telephone: +976-11-327911,320160, 324385, Fax: +976-11-320668, 320159 Web: www.num.edu.mn E-mail: [email protected]
Research center of RE, training of specialists in the field of RE
State University for Science Technology of Mongolia (SUST)
Mr. B. Damdinsuren, Rector
Main building of SUST Sukhbaatar DuuregUlaanbaatar, Mongolia
Telephone: +976-11-324709E-mail: [email protected] Web: www.must.edu.mn
SUST is made up of seventeen professional schools and colleges, 3 research institutes and 36 experimental and technology centers whose faculties offer educational opportunities to students ranging from first-year undergraduates through doctoral-level candidates in engineering, technology and others. 120 professors and a staff of over 1.000 are engaged in student training, educational and research activities, university administration and management.
Power Engineering School is the major institution for research and training of specialists in energy field.
Ulaanbaatar University of Mongolia
Dr. S. Baigalsaihan, Rector
Telephone: +976-11-458327,456360, 453554, 458336 Fax: +976-11-458327 E-mail: [email protected]
Specialist preparation in field of RE and Master of Science studies in RE
Agricultural University of Mongolia
Mr. B. Byambaa, Rector
Telephone: +976-11-341770, 341630, 341592 Fax: +976-11-341770 E-mail: [email protected] Web: www.msua.edu.mn
Research and specialist preparation in field of RE and agricultural electrification
Construction College
Mr. B. Chimiddorj, N. Nyamjav
Ulaanbaatar 44P. O. Box: 276Peace avenue 35Ulaanbaatar Bayangol District, Mongolia
Telephone: +976-11-322797, 70122723Fax: +976-11-322797E-mail: [email protected]
Professional training in construction and electrical engineering
Technical College in Darkhan-Uul Aimag
Mr. R. Lkhagvasuren
Telephone: +976-1-372-23760, +976-99379687Fax: +976-11-327234
Professional training in electrical engineering
ACADEMIES
ORGANIZATION/CONTACT PERSON ADDRESS/PHONE NUMBER / E-MAIL CONTACT
DESCRIPTION OF PRODUCTS, SERVICES AND ROLE
National Renewable Energy Centre
Mr. N. Enebish
National Renewable Energy CenterDund Gol 2Gurvaljin Bridge Bayangol District
Telephone: +976-11-70181810, +976-11-342375 Fax: +976-11-686298 E-mail: [email protected]
NREC was established in March 2009 by the resolution #58 of GoM. NREC consists of administration, research and business development, production and technology divisions.
RE resources assessment, dissemination of RE technologies, RE project implementation, feasibility studies, blueprints and budget plans, developing standards, production of PV modules and RE equipment
MonMar” Co. Ltd.
Mr. Ch. Batbayar
Renewable Energy Centre Building IIChingis Khan AvenueKhan Uul District
Telephone: +976-11-342692E-mail: [email protected]
Production of mini wind charges (50 Wp), trade of wind and solar PV systems for small users
Sobby Co. Ltd.
Mr. B. Batchuluun, Director
United Nations Street 5/1210646
Telephone: +976-11-260247E-mail: [email protected]
Monitoring, planning and defining policy in the financial sector of the country
Narnii Zai Service Co. Ltd.
Mr. D. Agchbayar
Khuch Sport HorooTsergiin Khothon 2-r HorooBayanzurkh District
Telephone: +976-11-451787E-mail: [email protected]
Trade of PV systems for households and small users
Bayan Construction Co. Ltd.
Mr. D. Byuantogtokh, Director
New Mega Power Centre3-r HorooChingeltei DistrictUlaanbaatar, Mongolia
Telephone: +976-11-319927,319927, 91914968Fax: +976-11-318257
Construction and trade company. In 2006–2007, the company installed PV and wind hybrid systems for four Soum centers (150 kWp installed capacity) by order of GoM. In 2007–2008, the company delivered 40,600 units of 50Wp SHS for herders by order of Government of Mongolia.
COMPANIES (ELECTRICITY, RENEWABLE ENERGY, CONSULTANTS ETC.)

Renewable Energies in Central Asia
MONGOLIA
COUNTRY INTRODUCTION 122
ORGANIZATION/CONTACT PERSON ADDRESS/PHONE NUMBER / E-MAIL CONTACT
DESCRIPTION OF PRODUCTS, SERVICES AND ROLE
Uureg Trade Co. Ltd.
Mr. O. Bayar, Director
Telephone: +976-11-687883, 99112727, 99112368Fax: +976-11-688130
Entertainment business, construction and trade company. In 2006–2007, the company installed PV and wind hybrid systems for a Soum center (150 kWp installed capacity) by order of GoM.
ABE Solar Co. Ltd.
Mr. B. Baatarkhuu
Telephone: +976-11-327297, 91912224
Trade of SHS for small users and households. In 2006–2007, the company installed two wind energy systems (80 kWp installed capacity) for Soum centers by order of the GoM.
Mongol Alt Co. Ltd.
Mr. J. Munkhtur
Telephone: +976-1-372-33263, 99114122, 99376169, 99081267
Mining company specializing in gold mining. In 2007, the company got a contract to build wind energy system (150kW installed capacity) for Soum center by order of GoM.
New Power Co. Ltd.
Mr. Baymbatsogt, Director
Telephone: +976-11-634256, 99050662, 99094921Fax: +976-11-635246
Construction company. In 2007, the company got a contract to build PV system (150 kWp installed capacity) for Soum center by order of GoM.
Khurd Co. Ltd.
Mr. B. Enkhjargal
Telephone: +976-11-320697, 99118215, 88118215, 91912597Fax: +976-11-325130
Civil construction company specializing in electrical and heating installations. In 2007, the company got a contract to build PV system (150 kWp installed capacity) for Soum center by order of GoM.
Prestige Engineering Co. Ltd.
Mr. J. Dalai, Director
#501 Sukhbaatar Square 3Ulaanbaatar, Mongolia
Telephone: +976-11-313392E-mail: [email protected]
Trade and engineering company specializing in water supply business. In 2007, the company installed 80 kW wind system for Soum center by order of GoM. In 2007, the company got a Government order for feasibility study preparation of Hydro Power Plant.
Bodi Group Co. Ltd.
Mr. Munkhnyam, Manager
Bodi TowerSukhbaatar SquareUlaanbaatar 210620AMongolia
Telephone: +976-11-313261, 313007, 313285Fax: +976-11-326535www.bodi.mn
Trade and engineering group of companies with facility for small scale PV module assembling
MCS Engineering Co. Ltd.
MCS PlazaP. O.Box 1272Seoul Street 4 Ulaanbaatar 13, Mongolia
Telephone: 976-11-346363,346464 Fax: 976-11-326030E-mail: [email protected] www.international.mcs.mn
Engineering and consulting company specializing in energy sector including RE (hydro, geothermal, PV technology)
Mon-Energy Co. Ltd.
Mr. L. Erdenedalai, Director
Energy research and Development CenterChingis Avenue UlaanbaatarKhan-Uul District, Mongolia
Telephone: +976-11-632319E-mail: [email protected]
Consulting company specializing in the energy sector
Newcom Co. Ltd.
Mr. P. Gankhuayg, General manager
Naiman Zovkhis Building Seoul Street 6/3210628
Telephone: +976-11-313183E-mail: [email protected]
Investment company holding shares for engineering, energy, communication and airway companies. In 2007, the company signed the country’s first PPA contract to construct wind farm in Mongolia. The company plans to introduce grid connected wind farm (50 MW) by 2010.
Renewable Energies in Central Asia
MONGOLIA
123
8 BIBLIOGRAPHY
Asian Development Bank – ADB (2002): Capacity Build-ing in Energy Planning, TA 3299-MON Final Report, Ulaanbaatar
Asian Development Bank – ADB (2004): Promotion of Renewable Energy, Energy Efficiency and Greenhouse Gas Abatement (PREGA), Ulaanbaatar
Batsukh, N., Alei, M., Dorjderem, B. and Borchuluun, U. (1999): Geothermal Energy Sub-Program, National Pro-gram of Mongolia on Mineral Resources, Ulaanbaatar
Casals & Associates, Inc. (2005): Mongolia Corruption Assessment (with funding from the U.S. Agency for International Development and The Asia Foundation), www.usaid.gov/mn/library/documents/Mongolia CorruptionAssessmentFinalReport.pdf
Central Intelligence Agency (2008): CIA World Fact Book (www.cia.gov/library/publications/the-world-factbook/geos/mg.html)
Central Region Electricity Transmission Grid Inc. (2008): information brochure, Ulaanbaatar
Energy Regulatory Authority – ERA (2007): Energy Statistics 2008, Ulaanbaatar
Energy Regulatory Authority (without year): (www.era.energy.mn/eng/)
European Bank for Reconstruction and Development – EBRD (2008): Mongolia – Country Fact Sheet (www.ebrd.com/pubs/factsh/country/mongolia.pdf)
European Bank for Reconstruction and Development (2008): Structural and Institutional Change Indicators 2007 (www.ebrd.com/country/sector/econo/stats/index.htm)
Franklin/Somers (2008): Methan to Markets – Coal Mine Methane Global Overview 2008, chapter 20: Mongolia (www.methanetomarkets.org/resources/coalmines/over-view.htm)
German Technical Cooperation – GTZ/INTEGRATION Environment & Energy – INT (2004): Energiesektor der Mongolei, Ist-Situation und Perspektiven im Hinblick auf TZ Ansätze, Projektbericht, Ul2004
German Technical Cooperation – GTZ/INTEGRATION Environment & Energy – INT (2005): Project Progress Report, Ulaanbaatar
INTEGRATION Environment & Energy (2004): Ener-giesektor der Mongolei, Ist-Situation und Perspektiven im Hinblick auf TZ Ansätze, study on behalf of GTZ
INTEGRATION Environment & Energy (2006): Making Access to Reliable Electricity Affordable in Rural Areas of Mongolia (study on behalf of GTZ), Ulaanbaatar
International Atomic Energy Agency – IAEA (1995): Uranium 1995: Resources, Production and Demand
Kosuke Kurokawa (2007): Energy from the Desert – Practical Proposals for Very Large-scale Photovoltaic Systems, Earth Scan UK & USA
Methane to Markets Org (2004): Mongolia – Fact Sheet (www.methanetomarkets.org/resources/coalmines/docs/overview_ch20.pdf)
Ministry of Nature and the Environment of Mongo-lia/Netherland’s Climate Change Studies Assistance Programme – MNE/NAPCC (2006): Climate Change and Sustainable Livelihood of Rural People in Mongolia, Ulaanbaatar (www.nlcap.net/fileadmin/NCAP/Countries/Mongolia/032135.0508xx.MON.CON-01.Outputs-until-061202.v1.pdf)
National Statistical Office – NSO (2005): Statistical Yearbook of Mongolia 2004, Ulaanbaatar
National Statistical Office – NSO (2006): Statistical Yearbook of Mongolia 2005, Ulaanbaatar
National Statistical Office – NSO (2007): Statistical Yearbook of Mongolia 2006, Ulaanbaatar
National Statistical Office – NSO (2008): Statistical Yearbook of Mongolia 2007, Ulaanbaatar
National Statistical Office – NSO (2009): Statistical Yearbook of Mongolia 2008, Ulaanbaatar
Organization for Economic Cooperation and Develop-ment – OECD/Nuclear Energy Agency – NEA/Interna-tional Atomic Energy Agency – IAEA (1996): Uranium 1995: Resources, Production and Demand, Paris
Petrovis LLC. (1997): (www.petrovis.mn) and archived version of the Petrovis LLC website (http://web.archive.org/web/*/www.petrovis.mn)
State Great Hural (1993): Foreign Investment Law of Mongolia, Ulaanbaatar
State Great Hural (1995): Environment Protection Law, Ulaanbaatar
State Great Hural (1998): Law on Environmental Impact Assessment, Ulaanbaatar
State Great Hural (2001): 100,000 Solar Ger Program, Ulaanbaatar
State Great Hural (2002): Integrated Energy System Program, Ulaanbaatar
State Great Hural (2002): Law on Land, Ulaanbaatar State Great Hural (2002): Mongolia Sustainable Energy Sector Development Strategy Plan for 2002–2010, Ulaanbaatar
State Great Hural (2004): Law on Water, Ulaanbaatar State Great Hural (2005): Liquefied Flammable Gas Program, Ulaanbaatar
State Great Hural (2005): National Renewable Energy Program of Mongolia, Ulaanbaatar
State Great Hural (2006): State Budget Law of Mongolia 2006, Ulaanbaatar
State Great Hural (2006): State Development Fund Law of Mongolia, Ulaanbaatar
State Great Hural (2007): Renewable Energy Law of Mongolia, Ulaanbaatar
State Great Hural (2007): State Budget Law of Mongolia 2007, Ulaanbaatar
State Great Hural (2008): Company Law, Ulaanbaatar State Great Hural (2008): Law on Construction, Ulaanbaatar
Suozzi & Reid, New York State Commission on Property Tax Relief (2008): A Preliminary Report of Findings and Recommendations (www.era.energy.mn/eng/modules.php?ss=4&id=5)
REFERENCES

Renewable Energies in Central Asia
MONGOLIA
124
Transparency International (2009): Corruption Percep-tions Index 2008 (www.transparency.org/news_room/in_focus/2008/cpi2008/cpi_2008_table)
United Nation Statistics Division (2008): Indicators on Income and Economic Activity (http://unstats.un.org)
United States Agency for International Development – USAID (2005): Mongolia Corruption Assessment (www.usaid.gov/mn/library/documents/MongoliaCorruptio-nAssessmentFinalReport.pdf)
United States Agency for International Development – USAID/National Renewable Energy Laboratory – NREL/National Renewable Energy Centre of Mongolia – NREC (2000): Atlas of Wind Energy Resources in Mongolia, Ulaanbaatar
World Bank – WB (2004): Mongolia – Forestry Sector Review (www.gateway.mn/downloads/environment/ Forestry_sector_review.pdf)
World Bank – WB (2009): Doing Business 2009 (www.doingbusiness.org/economyrankings/)
World Bank – WB (2009): World Development Indicators database, April 2009 (http://web.worldbank.org/WBSITE/EXTERNAL/DATASTATISTICS/
Websites Energy Regulatory Authority – ERA: www.era.energy.mn/eng
Government of Mongolia / status of Implementation of National Programs: www.open-government.mn
REFERENCES

Renewable Energies in Central Asia
MONGOLIA
125ANNEX
9 ANNEX
9.1 ANNEX – CHAPTER 2
CHP PLANTS
INSTALLED CAPACITY (MWE)
AVAILABLE CAPACITY (MWE)
BOILER CAPACITY (MWTH)
DISTRICT HEATING (MWTH)*
INDUSTRIAL STEAM (MWTH)*
YEAR OF COMMISSIONIN(G)
CHPP-2 21.5 17.6 80.0 43.0 58.0 1961–1969
CHPP-3 148.0 105.1 1,448.0 562.0 105.0 1968–1982
CHPP-4 540.0 432.0 2,450.0 918.0 29.0 1983–1991
Darkhan CHPP 48.0 38.6 477.0 210.0 49.0 1966, 1986
Erdenet CHPP 28.8 21.0 318.0 140.0 24.0 1987–1989
Subtotal of CES 786.3 614.3 4,773.0 1,873.0 265.0 –
Choibalsan CHPP (EES) 36.0 29.5 397.0 130.0 22.0 1969, 1979
Dalanzadgad CHPP 6.0 5.0 38.0 8.0 – 2000
Subtotal of CHPPs 828.3 648.9 5,208.0 2,011.0 287.0 –
OTHER GENERATING FACILITIES INSTALLED CAPACITY (MW)
YEAR OF COMMIS-SIONING
Diesel generators in rural centers 40.00 –
Small hydro Durgun HPP 12.00 2008
Taishir HPP 11.00 2008
Mini hydro Bogdiin HPP 2.00 1997
Micro hydro 10 micro HPPs 2.50 1961–2008
Wind Small wind turbines in rural centers 1.20 1998–2008
Household wind turbines 0.25 –
Solar Small PV in rural centers 1.00 1998–2008
Household PV 4.20 –
Import Available capacity from Russian grid 160.00 –
GENERATION CAPACITY FOR ELECTRICITY AND HEAT BY GENERATION FACILITIES
Source: data compiled by the author based on ADB, 2002) * available in 1999 and personal inquiries at NREC and MFE
YEAR 2001 2002 2003 2004 2004 2006 2007 2008
Total resources 5,337.0 5,692.5 5,823.6 7,091,8 7,860,4 8,465,1 9,555,3 10,453.7
Stock at the beginning of the year
186.0 148.0 157.2 226,5 342,9 390,8 317,3 381.3
Produced 5,141.0 5,544.4 5,666.1 6,865,0 7,517,1 8,074,1 9,237,6 10,071.9
Import 10.0 0.1 0.3 0,3 0,4 0,2 0,6 0,5
Total consumption 5,189.0 5,535.3 5,161.7 5,188.5 5,472.6 5,691.2 5,906.1 5,843.2
Consumed by thermal power plants
4,324.0 4,723.2 4,380.2 4,478.6 4,619.6 4,595.2 4,935.1 4,849.9
Distributed to economic sectors and households
865.0 812.1 781.5 709,9 853.0 1.096.0 971.0 993.3
Export – – 435.4 1,560.4 2,116.2 2,456.6 3,268.1 4,169.3
Stock at the end of the year 148.0 157.2 226.5 342.9 271.6 317.3 381.3 441.2
Source: NSO, 2005 & 2009
COAL BALANCE SHEET OF MONGOLIA (1,000 TONS)

Renewable Energies in Central Asia
MONGOLIA
126ANNEX
MAP OF THE MONGOLIAN ENERGY SYSTEM
Source: Energy Research and Development Center of Mongolia, Mongolia, without year
TABLE 8
Power Transmission and Distribution Lines in Mongolia
LENGTH OF LINES (KM)
VOLTAGE LEVEL 500 KV 220 KV 110 KV 35 KV 15 KV 6–10 KV 0.22–0.4 KV
CES – 1,044 2,982 5,095 747 8,033 4,863
WES – – 472 337 – 370 387
EES – – 187 423 276 327 397
Total 0 1,044 3,641 5,855 1,023 8,730 5,646
Source: ERA, as of 2007
TABLE 9
Power Transmission and Distribution Sub-stations in Mongolia
LENGTH OF LINES (KM)
VOLTAGE LEVEL 500 KV 220 KV 110 KV 35 KV 15 KV 0.22–0.4 KV
CES – 6 54 165 9 2,776
WES – – 45 6 - 166
EES – – 2 2 5 154
Total 0 6 61 173 14 3,096
Source: ERA, as of 2007

Renewable Energies in Central Asia
MONGOLIA
ANNEX 127
TYPE OF CONSUMERTARIFF, MNT/KWH
(VAT EXCL.)
CENTRAL ENERGY SYSTEM
Central Energy System
Flat tariff 68.00
TOU tariff
Day (06:00–17:00) 68.00
Evening (17:00–22:00) 114.40
Night (22:00–6:00) 39.00
Trolleybus company 49.20
Flour/bread factories (4 companies)
Flat tariff 53.20
TOU tariff
Day (06:00–17:00) 53.20
Evening (17:00–22:00) 104.20
Night (22:00–6:00) 31.80
Residential consumers
UB apartment dwellers
< 150 kW/month 60.00
151–250 kW/month 64.00
> 251 kW/month 68.00
UB Ger residents
< 150 kW/month 58.00
151–250 kW/month 62.00
> 251 kW/month 66.00
Aimags and Soums residential consumers
< 80 kW/month 60.00
81–180 kW/month 64.00
> 181 kW/month 68.00
EASTERN ENERGY SYSTEM
Entity and industrial consumers 68.00
TOU tariff
Day (06:00–17:00) 68.00
Evening (17:00–22:00) 114.40
Night (22:00–6:00) 39.00
Residential consumers 68.00
TOU tariff
Day (06:00–21:00) 68.00
Night (21:00–6:00) 34.00
WESTERN ENERGY SYSTEM
Entity and industrial consumers 90.00
Residential consumers 60.00
ERA ELECTRICITY TARIFFS IN CES, EES AND WES 2008
Source: ERA website, as of 2009

Renewable Energies in Central Asia
MONGOLIA
ANNEX 128
TARIFF CLASSES UNIT TARIFF (VAT EXCL.)
ULAANBAATAR
Entity and industrial consumers
Entity and industrial consumers MNT/m3 282
Hot water for entities MNT/month 3,184
Hot water for technological needs MNT/Gcal 8,291
Metered heat MNT/Gcal 18,241
Residential
Apartments MNT/m3 265
Hot water (during the heating season) MNT/month 1,000
Hot water (during the non-heating season) MNT/Gcal 1,500
Metered heat MNT/Gcal 6,144
DARKHAN, ERDENET, BAGANUUR AND EASTERN ENERGY SYSTEM
Apartments MNT/m3 265
Hot water (during the heating season) MNT/month 1,000
Hot water (during the non-heating season) MNT/Gcal 1,500
Metered heat MNT/Gcal 6,144
WESTERN ENERGY SYSTEM
Entity and industrial consumers MNT/m3 417
Residential consumers MNT/Gcal 19,940
ERA HEAT TARIFFS 2008
Source: ERA website, as of 2009
NAME OF PROJECT ORDERED AND IMPLEMENTED BY RESULTS
Sophisticated utilization of the solar and wind energy in the state economy, construction of trial equipments and plants (1989–1990)
MFE,REC
The solar collector, biogas digester and the movable type of wind generator were invented and tested.
Wind energy (1991–1993) MoI, REC
Wind energy measurement in Manlai Soum, Umnugovi province
Solar and wind energy (1994–1996)Ministry of Fuel and Energy,
NRECThe alternate forms to provide the herdsmen families with electricity, using RE were processed and tested in real conditions.
Assessment of solar and wind energy resources in Mongolia and technology of its utilization (1997–1999)
MFE,REC
Assessment of solar and wind energy resources in Mongolia was determined and map of resource was made. The further development plan of RE utilization in Mongolia was processed. Drawing of solar house was processed.
Small-scale electricity generating solar/wind hybrid system (1999–2000)
MFE,REC
Selection of small wind generator that can be used in Mongolian condition was made. On-site experiment of supplying rural small users with solar and wind energy
Study on possibilities to build wind farm with capacity of 25–30 MW (2002–2003)
MoI, REC
Feasibility study on wind farm with capacity of 46 MW; Wind measurement in target area
PROJECTS FINANCED BY THE GOVERNMENT OF MONGOLIA
NAME OF PROJECT ORDERED AND IMPLEMENTED BY RESULTS
Applied research and development for rural use of RE MON 86/005 (1986–1990)
UNDPREC
Wind generator factory; Renewable Energy laboratory
Research of portable type photovoltaic power generation system for demonstration (1992–1997)
NEDOREC
On-site experiment and test of 3 types of 200 PV systems for herdsmen families in all areas of Mongolia
Study on utilization of solar and wind energy in Mongolian rural areas (1993)
DANIDO Study and advice on electrification of Bag center and local centers using RE
PV manufacturing plant (1998)ADB, NF
PTA PV manufacturing plant with annual production of 0,5 MWt PV panel
Rural electrification from RE sources in Mongolia (1998–2000)
TACISREC
Assessment of solar and wind energy resources in 5 Soum centers in Gobi region; on-site experiment and test of electricity supply of hospital, school and dormitory in 3 Soum centers using solar and wind energy
Master plan study for rural power supply by Renewable Energies in Mongolia (1998–2000)
JICAREC
Master plan study of RE development in the period of 2005, 2010, 2015; 5 kW solar and wind pilot plant in 3 Soum centers
Wind energy resource assessment of Mongolia (1998–2000)
USAID, NRELREC
Wind measurement in Gobi region; Atlas of wind energy resource in Mongolia
RENEWABLE ENERGY PROJECTS IMPLEMENTED AND SUPPORTED BY INTERNATIONAL DONORS

Renewable Energies in Central Asia
MONGOLIA
ANNEX 129
Utilization of Renewable Energy in rural area of Mongolia (1999-2007)
BMZ/GTZREC
On-site experiment on utilization of Renewable Energies in Zavkhan province
Demonstration research project on dispersed PV power generation systems in Mongolia (2002–2004)
NEDOMoI
PV power plant with capacity of 200 kW was built in Noyon Soum, Umnugovi province
Rehabilitation of HPP on Bogd River, Zavkhan province (2003–2004)
BMZ/KfW Repair work of headrace channel of HPP on Bogd River
Nomadic electrification (2003) JICA Distribution of 11,500 PV systems with capacity of 62 W
Erdenebulgan (2003) DANIDO Construction of HPP with capacity of 200 kW
Development of RE utilization in local centers and rural areas (2003)
ADB Research project
Project of HPP on Eg River (1998) ADB On-site study of HPP and techno-economical feasibility study; Drafts and blueprints
Taishir HPP (2000)KFFEA
Drafts and blueprints of HPP on Zavkhan River with capacity of 12 MW were made; Tender for construction
Study on HPP on Orkhon River (2002)JICAFEA
Techno-economical feasibility study on HPP on Orkhon River with capacity of 100 MW
Solar power systems for Soum centre hospitals and schools (1998–2000)
BavariaInstallation of solar power system for school and hospitals and 100 herdsmen families in Zavkhan and Khuvsgul provinces
Taishir HPP (2001–2008)Kuwait Fund
Abu-Dhabi FundGoM
Construction of Taishir HPP
NAME OF PROJECT IMPLEMENTED AND SUPPORTED BY RESULTS
Energy conservation and monitoring, 1750 TA MON
ADBStudy and evaluation on energy systems;Study on possibilities of energy saving and improving efficiency
Energy conservation project, MON 1492ADBFEA
Installation of flow meters in main pump stations in Ulaanbaatar and installation of thermal energy meters in main consumers; Construction of 6 km pipeline, installation of 39 valves and renewal of 2 pumps in TEPP-2;Pilot project on energy saving in residential buildings;Installation of meters and transformers on main electricity transmission lines
Improvements to energy supply in Darkhan and Choibalsan, Mongolia
TACISErchim Khemnelt Co. LTD.
Study on larger consumers in Darkhan, seminars;Feasibility study on rehabilitation of heating systems in Darkhan;Feasibility study and program on rehabilitation of heating systems in Choibalsan
Ulaanbaatar heat rehabilitation project ADB
Renovation of heating system in Ulaanbaatar as automatic regulated system; Replacement of pumps on distribution network of TEPP with automatic regulated pumps; Rehabilitation of heating center; Installation of heat energy meters on consumers;Improvement of capacities of sub-distribution network;Installation of meter on hot tap water supply system;Pilot project on heating centers
Energy efficiency strategy for the district heating systems in Ulaanbaatar
WBStudy on loss in heating system; Processing of concepts for improving efficiency
Study on rehabilitation of electricity distribution network in Ulaanbaatar
WB Processing of loss evaluation technique for bigger consumers and distribution systems, training for operating equipments of collecting system data
Study on rehabilitation of electricity distribution system in Ulaanbaatar, Dornod and 6 provincial centers
WBRenewal of distribution transformers, transmission lines and installation of meters in suburbs of Ulaanbaatar, renovation of income collecting system; Renovation of 1 substation in Dornod, study on system loss reduction in 7 provincial centers
Implementation of energy conservation programs and rational use of energy in Mongolian industry
TACISPilot project in industries such as APU, Mongol Nekhmel, Pharmaceutical factory, Eermel and Makh Impex
ENERGY AND HEAT EFFICIENCY PROJECTS IMPLEMENTED AND SUPPORTED BY INTERNATIONAL DONORS

Renewable Energies in Central Asia
MONGOLIA
130
9.2 ANNEX – CHAPTER 4
Map of Installed and Planned Hydro Power Plants in Mongolia
Source: GTZ/INTEGRATION, as of 2007
Utilization of Solar Potentials
Source: GTZ/INTEGRATION, as of 2007
Wind Resource Map of Mongolia
Source: USAID/NREL/NREC, as of 2000
ANNEX

Utilization of Wind Potentials
Source: GTZ/INTEGRATION, as of 2007
Renewable Energies in Central Asia
MONGOLIA
131ANNEX
Heat Flow Map of Mongolia
Source: Dorofeeva, Sintsov, Bat-Erdene, 1986–1987, and Dorjderem, 1992–1994
Outlines of the Main Geothermal Structures of Mongolia
Source: Dorjderem, as of 1998
SYSTEM SUBSYSTEM BLOCKAGE HEAT FLOW (Kcal cm2)
GEOTHERMAL GRADIENT (°C/km)
CHEMICAL COMPOSITION
MINERALS (g/l)
Fold platform zone
KhangaiTarvagatai-UlastaiBaidrag-TaishirOrkhon-Taats
opensemi open
1.8–2.4 45–80SO
4 HCO
3 /Na CO
3
HCO3 CO
3 /Na SO
4
<0.5
KhentiiKhoid KhentiiOnon-Ulz
semi-openclosed
1.0–1.2 35–50HCO
3 CO
3 /Na SO
4
SO4 HCO
3 /Na
<1.0
KhuvsgulNuurMurun
semi-closedclosed
0.8–1.2 25–40 SO4 HCO
3 /Na <1.0
Bulnai Bulnai open 0.7–1.0 20–25 SO4 HCO
3 /Na CO
3<0.5
AltaiAltaiIkh Bogd
semi-closedclosed
1 20–30 SO4 HCO
3 /Na 1–5
Transitional zone Transitional
Monol-DaurBayankhongorBulganSantZaamar
closed 1 20–35 SO4Cl/Na 3–10
Subsided zone
Dornod-DarigangaDornodDariganga
CISO4 /NaCa 5–25 (150)
GobiSainshandGobi
1 20–35 CISO4 /Na 20–80 (300)
Ikh Nuur Nuur CISO4 /Na 15–66 (120)
Orkhon-Selenge Orkhon-Selenge CISO4 /NaMg 10–20

Estimate of Standing Volume of Mongolian Forests in 2000 (1.000 m3)
SPECIES ESTIMATED STANDING VOLUME
Larch (Larix sibirica) 1,030.0
Pine (Pinus silvestris) 92.0
Cedar (Pinus cembra) 164.0
Birch (Betula) 86.0
Other (fir, spruce, poplar etc.) 7.0
Total 1,379.0
Source: Dorofeeva, Sintsov, Bat-Erdene, 1986–1987, and Dorjderem, 1992–1994
Renewable Energies in Central Asia
MONGOLIA
132ANNEX
9.3 ANNEX – CHAPTER 5
EBRD Transition Indicators 2007 / Transition progress
Source: EBRD Office of the Chief Economist , as of 2007
The transition indicators range from 1 to 4+, with representing little or no change from a rigid centrally planned economy and 4+ representing zhe standards of an industrialised market economy.
TRANSITION INDICATORS, 2007
0.0 0.5 1.0 1,5 2.0 2.5 3.0 3.5 4.0 4.5
Source: EBRD Office of the General Council, country law assessments, without year
Quality of law `on the book´
Effectiveness of the law
Measuring effectiveness of the law using specific case studies as proxies for the relevant sector

Renewable Energies in Central Asia 133
COUNTRY CHAPTER:
REPUBLIC OF TAJIKISTAN Authors and Coordination ofCountry ChapterDr. Ing. Klaus JordeEntec Consulting & Engineering AGSt. Gallen, Switzerlandwww.entec.ch
Axel Biegert (Dipl. Economist & Pol.) INTEGRATION UMWelt & Energie GmbHGraefenberg, Germany www.integration.org
Editor Deutsche Gesellschaft für Technische Zusammenarbeit (GTZ) GmbHDepartment Water, Energy, TransportDag-Hammarskjöld-Weg 1-565760 Eschborn, Germanywww.gtz.de
On behalf of Federal Ministry for Economic Cooperation and Development (BMZ)
Editorial staffDiana KraftTel: +49 (0)6196 79 4101Fax: +49 (0)6196 79 80 4101Email: [email protected]

Renewable Energies in Central Asia 134CONTENTS
ACRONYMS, ABBREVIATIONS AND MEASUREMENTS 3
1 SUMMARY 5
2 COUNTRY INTRODUCTION 5 2.1 Geography and Climatic Conditions 6 2.2 Political and Economic Development 7
3 ENERGY MARKET OF TAJIKISTAN 9 3.1 Important Players of the Tajik Energy Market 9 3.2 Primary Energy Consumption, Transmission and Prices 10
4 POLICY FRAMEWORK FOR RENEWABLE ENERGIES 13 4.1 National Strategies and Programs to support Renewable Energies 14 4.2 Regulations, Incentives and Legislative Framework Conditions 15
5 POTENTIAL FOR RENEWABLE ENERGIES AND PRESENT USE 17 5.1 Bioenergies 17 5.2 Solar Energy 18 5.3 Wind Power 19 5.4 Geothermal Energy 20 5.5 Hydro Power 22
6 MARKET RISK ANALYSIS AND BARRIERS FOR MARKET ENTRY 24 6.1 General Situation 24 6.2 Intellectual Property Rights 23 6.3 Business Development 25 6.4 Taxation 24
7 RENEWABLE ENERGY BUSINESS INFORMATION AND CONTACTS 27
8 BIBLIOGRAPHY 29
9 ANNEX 30
CONTENTS
TAJIKISTAN

Renewable Energies in Central Asia
TAJIKISTAN
135
ACRONYMS AND ABBREVIATIONS REPUBLIC OF TAJIKISTAN
ADB Asian Development Bank
AKFED Aga Khan Foundation for Economic Development
AS Academy of Science
BT Barki Tojik, Tajikistan’s national power company
CAPS Central Asian Power Systems
CDM Clean Development Mechanism
CIS Commonwealth of Independent States
FDI Foreign Direct Investment
FEC Fuel and Energy Complex
GAA German Agro Action
GBAO Gorno-Badakhshan Autonomous Oblast (Tajikistan)
GDP Gross Domestic Product
GoT Government of Tajikistan
HVDC High Voltage Direct Current
HPP Hydro Power Plant
IDB Islamic Development Bank
IFC International Finance Corporation
IPP Independent Power Producer
MHPPs Mini/Micro Hydro Power Plants
MoEI Ministry of Energy and Industry
MSc Master of Science (Degree)
PE Pamir Energy
RT Republic of Tajikistan
SECO Swiss State Secretariat for Economic Affairs
SHPPs Smaller Hydro Power Plants
SME Small and Medium Enterprise
TALCO Tajik Aluminium Company
TDS total dissolved solid
UNDP United Nations Development Program
USD US Dollar (Exchange rate 1 USD = 3.45 Somoni (345 Diram)
USSR Union of Soviet Socialist Republics
WB World Bank
MEASUREMENTS
°C degree Celsius
GWh gigawatt hour (1GWh = 1,000,000 kWh)
kJ kilojoule (1kJ = 1,000 joules)
km kilometer
km2 square meter
ktoe kilotons of oil equivalent (1 ktoe = 11.63 GWh)
kV kilovolt
kWh kilowatt hour
m meter
m/s meter per second
m3 cubic meter
mm millimeter
MW megawatt (1 MW = 1,000 kW)
TDS total dissolved solid
TWh terawatt hour (1 TWh = 1,000,000,000 kWh)
W watt
ACRONYMS, ABBREVIATIONS AND MEASUREMENTS

Renewable Energies in Central Asia
TAJIKISTAN
136
1 SUMMARY
Tajikistan has an enormous hydro power potential which is presently only used at a small fraction. 94 % of the electricity is generated in large Hydro Power Plants. The Government fo-cuses on the development of new and refurbishing/upgrading of existing large Hydro Power Plants (HPPs) and negotiates directly with foreign investors. But there are also plenty of opportunities for small hydro power development including isolated grids and to support decentralized power generation.
Electricity prices for consumers are extremely low as a result of the extremely low prime costs for large hydro power in Tajikistan. As a result, alternative ways of generating elec-tricity have not been developed so far.
Sharp fuel shortage exists in rural mountainous areas where firewood is scarce and power from the grid is not avail-able. In those areas, however, the poverty level is significant and the population is unable to pay for high-cost power gen-erating devices. There is a significant potential for small hydro power development and also for solar energy. Potentials for wind and geothermal energy are small. In remote areas with-out grid connection, those may, however, be the only option.
The Government of Tajikistan invites foreign direct investment especially in the energy sector. Enterprises can be 100 % foreign owned or jointly owned with Tajik partners. Nevertheless, the general conditions for small foreign invest-ments in Tajikistan are difficult. Although the process of ob-taining a business license has become much easier, there are still critical issues. The license obtaining and license renewal process is lengthy and complicated. The issuance of permits and licenses is altogether not clearly regulated.
Frequent inspections by government officials related to permission and license issues often result in unofficial payments. There are no official power purchase tariffs, and a general regulatory framework for private investments in the Renewable Energy (RE) sector is not existent.
SUMMARY

Renewable Energies in Central Asia
TAJIKISTAN
COUNTRY INTRODUCTION 137
2 COUNTRY INTRODUCTION
Tajikistan is the smallest nation in Central Asia by area. After gaining its independence in 1991, it was afflicted by a civil war. The majority of the 400,000 ethnic Russians mostly em-ployed in the industry fled the county. By 1997, the war had cooled down and a central government began to take form resulting in peaceful elections in 1999. Since then, the newly established political stability and foreign aid have allowed the country‘s economy to grow. Tajikistan has on of the lowest per capita Gross Domestic Products (GDP) of the former So-viet republics and the economic situation remains fragile due to uneven implementation of structural reforms, corruption, weak governance, widespread unemployment, seasonal power shortages and the external debt burden.
The majority (72 %) of the population lives in rural areas and the agricultural production is mostly based on ir-rigation farming. The rivers of Tajikistan provide 55 % of the flow to the Aral Sea.
Tajikistan is the poorest country in Central Asia yet has enormous hydro power potential, which remains to be developed. The national transmission system of Tajikistan is an integral part of the Central Asian Power Systems (CAPS). Based on its hydro power potential, Tajikistan could provide enormous amounts of electricity to Central Asian countries as well as to Pakistan, India and China. Currently, the Tajik power system is connected to energy systems of Uzbekistan and Kyrgyzstan by 220 and 500 kV transmission lines. A new transmission line from Afghanistan is under construction and several more lines connecting Tajikistan with potential customer countries have been identified as being critical for the export of electricity. The most significant obstacle for the development and export of hydro power generated electricity is the lack of available funding.
2.1 GEOGRAPHY AND CLIMATIC CONDITIONSTajikistan is a landlocked country in the South East of Cen-tral Asia. It extends over 700 km from West to East and 350 km from North to South. Characterized by a complex border-line, it is located approximately at he same latitude as southern Italy.
Tajikistan is a mountainous country with half of its territory above 3,000 m and mountains covering about 93 % of its area. One third of the country is occupied by foothills and prai-ries. Lowland areas are situated in river valleys. Tajikistan is situated in an active seismic zone characterized by frequent earthquakes.
The climate in Tajikistan is continental, with consid-erable seasonal and daily variations of temperature and air hu-midity. The rugged relief with large amplitudes of high moun-tains accounts for the diversity of climates and temperatures. The average annual amount of precipitation in Tajikistan is 760 mm with a highly uneven distribution. In the hot deserts of Southern Tajikistan and cold high mountain deserts of the eastern Pamirs, precipitation varies from 7 to 160 mm/year and in some areas of the southern slope of the Gissar Range the amount of precipitation can rise to 2,000 mm.
2.2 POLITICAL AND ECONOMIC ENVIRONMENTSince the end of the civil war in 1997, peace and stability have been a crucial challenge for increasing international support. This has allowed a remarkable economic development in the recent years, with annual growth rates of 8–10 %. The Eco-nomic Development Program of Tajikistan envisages an aver-age annual real GDP growth of 13 % until 2015, increasing the scale of the economy by 4.4.
The drawback of this development is an increasingly self-centered government with considerable and augmenting elements of authoritarian arbitrariness, endemic corruption, exploitation of profitable economic assets by a minority of the society and a general neglect of the peoples’ basic development needs in the overall policy. More than 40 % of the people lived below the poverty line of 2 USD/day in 2001. Poverty also contributes to large-scale labor migration aggravating the cur-rent shortage of qualified labor resources.
The economy of Tajikistan is based on the production of hydro power, cotton and aluminium. A lack of investment prevents further development of the country’s hydro power capacity. Tajikistan currently depends on natural gas imports from Uzbekistan and oil imports from Russia, Turkmenistan and Kazakhstan.
In the former USSR, Tajikistan was the third largest cotton producer with one million tons per year and 11 % of the total production. In the past years, cotton production has not exceeded 60 % of the former amount. Around 80 % of the total export revenues come from aluminium and cotton, mak-ing Tajikistan highly dependent on price fluctuations in the world primary market. The cotton sector is heavily indebted and continues to make losses
FIGURE 1
Map of Tajikistan
P A M I R
A F G H A N I S T A NP A K I S T A N
K Y R G Y Z S T A N
Murghob
Panjakent
Kulyab
Tursunzade
Khujand
Daryoi
Pany
Daryoi Pan
y
Darya
R.Va
ksh
R.
Khorugh
Gharm
DUSHANBETursunzade
Amu Darya
U Z B E K I S T A N
A L A Y MO U N T A I N
SUra Tyube

Renewable Energies in Central Asia
TAJIKISTAN
COUNTRY INTRODUCTION 138
LAND AREA: 143,100 km2
POPULATION: 6.4 million (28 % urban, 72 % rural)
DENSITY: 44.9 inhabitants/km²
BIGGEST CITIES AND INHABITANTS:
Dushanbe (0.68 million), Khujand (0.15 million)
LANGUAGE: Tajik
CLIMATE: The climate in Tajikistan is continental with considerable seasonal and daily variations of temperature and air humidity. The average annual number of sunshine hours varies from 2,097 to 3,166 hours. The average annual amount of the solar radiation varies from 151.1 to 176.1 kcal/cm² and reaches 182.9 to 223.9 kcal/cm² on a clear day.
TEMPERATURES: The average annual air temperature in the foothills and valleys varies from +6° to +17 °C and is close to 0 °C in the high mountains of the Pamirs. The absolute minimum was registered in the Bulunkul in the Eastern Pamirs (–63 °C) and the absolute maximum of +48 °C in the Shaartuz in the southern Khatlon Region. In southern valleys, the average temperature in the hottest month of July is +31 °C. The rugged relief with large amplitudes of high mountains accounts for the diversity of the climates and temperatures.
ALTITUDE: 330 m to 7,495 m, about half of the country‘s territory is located above 3,000 m
RIVERS: Syr Darya, Piani River, Zerayshan River, Kafirnigan
ECOSYSTEM AREAS: Forests (1 %), shrubland, savannah, grassland (48 %), cropland and crop/natural vegetation mosaic (24 %), urban and built-up areas (0.3 %), sparse or barren vegetation, snow and ice (25 %), wetland and water bodies (2 %)
GDP – PER CAPITA (PPP): 514 USD (as of 2007)
INFLATION RATE: 11.8 % (as of 2008)
AGRICULTURE – PRODUCTS: Cotton, grain, fruit, grapes, vegetables, cattle, sheep, goats
INDUSTRIES: Aluminium, zinc, lead, chemicals and fertilizers, cement, vegetable oil, metal-cutting machine tools, refrigerators and freezers
ELECTRICITY – PRODUCTION: 17.27 billion kWh (as of 2007)
ELECTRICITY – CONSUMPTION: 17.34 billion kWh (as of 2007)
ELECTRICITY – TARIFFS: 0.5 US Cent/kWh (among the world‘s lowest rate)
NATIONAL ELECTRICITY CAPACITY IN OPERATION:
4,400 MW
NATURAL RESOURCES: The world‘s largest reserves of barite, lead, tungsten and uranium; the second largest of chromite, silver and zinc; the third largest of manganese, significant deposits of copper, gold and iron ore
ELECTRIFICATION RATE: n. a.
OIL – PRODUCTION: 0.28 thousand barrels/day (as of 2007)
OIL – IMPORT: 33.72 thousand barrels/day (as of 2007)
OIL – CONSUMPTION: 34 thousand barrels/day (as of 2007)
OIL – PROVEN RESERVES: 0.012 billion barrels
NATURAL GAS – PRODUCTION: 1 billion cubic feet/year
NATURAL GAS – PROVEN RESERVES:
200 billion cubic feet
EXPORTS: 1.4 billion USD (as of 2008)
EXPORTS – COMMODITIES: Aluminium, electricity, cotton, fruit, vegetable oil, textiles
EXPORTS – PARTNERS: Netherlands (38.9 %), Turkey (32.5 %), Russia (6.6 %), Uzbekistan (5.9 %), Iran (5.1 %) (as of 2007)
IMPORTS: 3.2 billion USD (as of 2008)
IMPORTS – COMMODITIES: Electricity, petroleum products, aluminium oxide, machinery and equipment, food
IMPORTS – PARTNERS: Russia (32.1 %), Kazakhstan (13.1 %), China (10.8 %), Uzbekistan (8.4 %)
EXCHANGE RATE: 1 € = 4.97149 TJS Tajik Somoni (as of 2009)
Source: CIA World Fact Book, as of 2009; IEA, as of 2006

Renewable Energies in Central Asia
TAJIKISTAN
COUNTRY INTRODUCTION 139
3.1 IMPORTANT PLAYERS OF THE TAJIK ENERGY MARKET
Policy and Regulatory LevelThe Fuel and Energy Department in the Office of the Presi-dent has overall responsibility for the energy sector. The Min-istry of Energy and Industry, re-established in December 2006, is responsible for implementation of the Government’s energy policy. The Agency on Anti-Monopoly Policy and En-trepreneurship acts according to the provisions of the Law on Natural Monopolies and regulates the tariffs of electricity. It reports directly to the Office of the President.
Operational LevelThe major electrical utility is the joint-stock holding company of Barki Tojik (BT). BT is a 100 % state-owned electrical en-ergy utility that controls electricity generation, transmission and distribution within the Republic except in the Gorno-Badakhshan Autonomous Oblast (GBAO). Moreover, BT is engaged in substantial trade relationships with neighboring states. BT also owns the Tajik State and Scientific Research Institute named Hydro Energy Project, which is a general de-sign organization for hydro power projects. Major investments into the sector are handled by a Project Implementation Unit for a Power Rehabilitation Project that is under the control of the President’s office.
Private Companies In GBAO, the private company of Pamir Energy (PE) was es-tablished with the support of the Aga Khan Foundation for Economic Development (AKFED) and the International Fi-nance Corporation (IFC). PE took over the GBAO electric network from Barki Tojik on 1 December 2002 by a 25-year concession agreement. This is the first public-private part-nership project in the energy sector implemented in Central Asia.
3.2 PRIMARY ENERGY CONSUMPTION, TRANSMISSION AND PRICES
In 2005, the total primary energy consumption in Tajikistan was 3,458 ktoe as estimated by the International Energy Agency. Figures 2 and 3 show the resources used and con-sumer groups.
3 ENERGY MARKET IN THE REPUBLIC OF UZBEKISTAN
Tajikistan possesses rich hydro power resources (4 % of the world’s resources) and coal, whereas it has only poor natural gas and oil deposits. These resources are not sufficiently devel-oped and the country suffers from an annual energy deficit of 3.0 to 3.5 GWh, resulting in reduced electrical power avail-ability and regular blackouts from October to April. Whereas the electricity sector alone currently accounts for about 5 % of the GDP, electricity is the most important input for the two most exported commodities – aluminium and cotton. In addition, this sector has the confirmed potential to contribute to export-led growth by electricity exports to countries within Central Asia and outside.
To secure the overall situation and the provision of fuel and energy in particular, the Government of Tajikistan (GoT) is making a two-track approach on the development of the energy sector.
The first track focuses on the domestic energy sector, making a sector-wide approach by covering the electricity, gas and heating components. In order to achieve the approach’s main goal, i. e. the recovery of the domestic energy sector, the GoT is intending to take a series of policy and invest-ment measures. The second track of the development strat-egy is oriented towards export markets. This strategy wants to activate the sector’s significant potential to contribute to the country’s economic growth through electricity exports. At present, there are electricity surpluses in the summer, which are already being exported to Afghanistan, Kazakhstan, Uz-bekistan and Russia. It is intended to intensify these exports and secure more long-term contracts for existing surpluses.
In order to support these strategies, a number of policy measures are being considered by the GoT to further the im-plementation of the energy sector. These include:
The increase of the energy supply, particularly during the winter months, by rehabilitating and upgrading some of the existing large HPPs
The revision of the energy pricing policy and tariff in-creases to achieve cost recovery
The reduction of transmission and distribution losses under a program sponsored by the World Bank (WB) and the Swiss State Secretariat for Economic Affairs (SECO)
The improvement of revenue collection from consumers The management of the demand side at the Tajik Alumini-um Company (TALCO) including efficiency enhancement
It is also intended to separate the transmission and distribu-tion of electricity from generation by creating new entities re-sponsible for each of the components.
Tajikistan aims to provide a stable supply of energy carriers and to achieve maximal energy independence of the republican Fuel and Energy Complex (FEC). FEC is a com-bination of interrelated economic stakeholders including gov-ernmental and non-governmental organizations, which are engaged in coal, oil, gas, heat and electricity supply as well as consumption systems and territorial subsystems. Source: International Energy Agency – IEA, as of 2005
FIGURE 2
Share of Total Primary Energy Supply
Hydro 42 %
Coal 1 %
Gas 14 %
Oil 43 %

Renewable Energies in Central Asia
TAJIKISTAN
COUNTRY INTRODUCTION 140
38,6 % of the total primary energy supply is domestic pro-duced and 61,4 % is imported. More detailed information on the share of domestic production, import and export can be found in the annex. Hydro power is a major resource in the Tajik power system whereas other RE resources play no role.
Electricity SectorHydroelectric power plants generate over 94 % or approxi-mately 17,000 GWh of BT electricity production, with the remainder produced by the Dushanbe Thermal Station during the winter period (November–March). During wintertime, BT meets 85 % of the total electricity demand of the country. The remainder is to be met by imports from Uzbekistan, but power shortages or scheduled cuts regularly occur. A signifi-cant portion of Tajikistan’s power sector infrastructure is in poor condition, which has contributed to increased commer-cial and technical losses of nearly 15,7 % of the generating capacity.
The large HPPs produce less energy during the winter than during the summer. Combined with a higher energy demand in winter, this fact leads to power shortages with electricity only available for 1–3 hours in the morning and 1–3 hours in the evening.
TALKO is the largest consumer in Tajikistan and consumes about 50 % of the total electricity consumption.
Natural Resources The Republic of Tajikistan has abundant fuel and energy re-sources. Hydroenergy resources are estimated to 527 TWh equaling 53 % of the total Central Asian region. More spe-cific investigations of 511 rivers resulted in 300 TWh of hydro power potential. This quantity would be sufficient to provide electricity to all Central Asian countries. Increased exploita-tion of oil and gas resources are hindered by high expenses resulting from difficult mining and geological conditions and deposits deeper than 5–7 km. At present, potential reserves of coal are assessed at 4–5 billion tons (only 25 thousand tons were extracted in 2001). Stocks of coal fuel have been found in practically all districts of the Republic but most of the depos-its are located in regions with difficult access. Other hydro-carbon deposits in Tajikistan are oil (117 million tons), gas (857 billion m3) and condensate (26 million tons). Despite of these domestic resources, oil and gas have to be imported.
The extreme shortage of organic fuel, the difficulty of its delivery to the mountain areas of Tajikistan and the ab-sence of electric power in remote settlements forces the inhab-itants of mountain areas to use wood as fuel. Forests of the first category and fruit trees are cut down for fuel. This results in a reduction of the area and density of large forests, the un-covering of hillsides and an increased risk of mud flows and soil erosion. The deforestation supports desertification and reduces the potential of land and biomass to absorb carbon dioxide from the atmosphere. It also leads to water supply and health problems. For the inhabitants of the mountain regions, deprived of other means of subsistence, the environment has become a serious challenge for survival. Ploughing up of slopes, cutting down of the forests and the uncontrollable use of pastoral land result in the degradation of the landscape in the catchment of the Amu Darya river basin.
Transmission and Distribution SystemTajikistan’s power grid consists of three separate systems: the northern, the southern, and the Gorno-Badakshan electrical systems. While the northern system has a shortage of electric-ity and requires imports from Uzbekistan, the southern part has a surplus and exports electricity during the summer. There is an ongoing project of the construction of a 500 kV trans-mission line between the South and the North of the coun-try to be completed in 2009. Basically all towns and villages are connected to the power grid. Many components of the transmission and distribution system and the switchgear are generally in bad condition. Most of the equipment is very old and needs to be replaced. Network losses combined with high commercial losses result in total losses of up to 17 %.
The rural population of Tajikistan experiences more difficulties to access electric power than the urban population. This is caused by the unsatisfactory conditions of the system of electricity supply in Tajikistan, such as instability of volt-age and faults of supply of electric power, weak capacity of the distribution and communication systems, a low payment level and high losses.
Source: International Energy Agency – IEA, as of 2005
FIGURE 3
Major Consumer Groups for Primary Energy
Commercial and public services 1 %
Agriculture/Forestry 12 %
Residental 8 %
Transport sector 35 %
Non specified 19 %
Losses 9 %
Industry sector 16 %
Source: International Energy Agency – IEA, as of 2005
TABLE 1
Total Electricity Consumption in GWh
GAS 401
HYDRO 16,685
TOTAL PRODUCTION 17,086
IMPORTS 4,508
EXPORTS 4,257
DOMESTIC SUPPLY 17,337
ELECTRICITY USED BY PLANTAND FOR PUMPED STORAGE
169
DISTRIBUTION LOSSES 2,489
TOTAL FINAL CONSUMPTION 14,679

Renewable Energies in Central Asia
TAJIKISTAN
COUNTRY INTRODUCTION 141
Import and Export of EnergyTajikistan imports electricity during autumn and winter from Turkmenistan (1,000 GWh), Uzbekistan (600 GWh) and Kyrgyzstan (400 GWh), but actually succeeded only to im-port 1,050 GWh in total (as of 2006/2007).
Electricity export from Tajikistan is limited to repay for supplied electricity during the winter seasons by neighbor-ing countries. The project CASA 1000, however, is to boost the export of electricity from Tajikistan and Kyrgyzstan to South Asia, especially Afghanistan and Pakistan. The High Voltage Direct Current (HVDC) transmission lines from Tajikistan via Afghanistan to Pakistan are under construction.
PricesThe Agency on Anti-Monopoly Policy and Entrepreneurship acts according to the provisions of the Law on Natural Mo-nopolies and regulates the tariffs of electricity. Tariffs vary greatly but local residents pay approximately 1.5 US Cents/kWh. It is not clear what prices would have to be paid to an Independent Power Producer (IPP) as there are presently no IPPs from whom BT is buying electricity.
Growth Predictions for the Energy SectorHydro power is a foundation of the energy sector in Tajikistan and its development could multiply the energy production of the overall Central and South Asia Region. Tajikistan has a power deficit of 3,000–3,500 GWh/year and in the winter, power consumption must be rationed. Nevertheless, during the summer, Tajikistan has a stable abundance of hydro power that exceeds both internal and external demand given restric-tions on economic exchange between former Soviet republics.
In 2007, Tajikistan has managed to attract several oil and gas exploration companies including Russian GazProm, which started exploration activities for oil and gas deposits in Tajikistan.
Besides domestic consumption, there is a growing demand for electricity from South Asian countries such as Afghanistan, Pakistan, China and India.
4 POLICY FRAMEWORK FOR RENEWABLE ENERGIES
4.1 NATIONAL STRATEGIES AND PROGRAMS TO SUPPORT RENEWABLE ENERGIES
The Government of Tajikistan and the National Parliament have created legal, normative-technical, industrial and finan-cial regulations for a successful implementation of a hydro power development program. They include:
Law on Foreign investments in the Republic of Tajikistan adopted in 1992 with additions in 1996 and 1997. A new Law on Investments was adopted in 2007.
Order of the Presidium of the Supreme Body of the Repub-lic of Tajikistan No. 1,350 on Redemption of Tax Payment for Small Hydro Power Plants, Objects of Non-conven-
tional Power Sources for small Enterprises on Mining and Coal Conversion adopted in 1992
Order No. 267 on Development of Small Power Engineer-ing in Tajikistan adopted in 1997
Concept of Development of Branches of the Fuel and Energy Complex of Tajikistan for the Period of 2003–2015 adopted in 2002
Law on Power Engineering adopted in 2004 Complex Program on Wide Use of Alternative Energy Sources such as Energy of Small Rivers, Sun, Wind, Biomass, Geothermal Energy for the Period of 2007–2015 adopted in 2007
The primary energy law, the Law on Power Engineering, de-fines key terms and indicates the fundamental state policy ob-jectives in the sector including security and reliability of sup-ply, environmental protection and efficiency and investment gains through moving to a market-based system. The Law on Power Engineering authorizes the GoT to develop Tajikistan’s energy policy. The Ministry for Power Engineering is responsi-ble for the implementation of that policy including licensing.
The Tajik electric power industry is attractive for big investors. This is due to the fact that prime costs of electric hydro power energy in Tajikistan are among the worlds low-est. To attract foreign capital, the Government adopted spe-cial terms for major investors. A large part of the hydro power potential, however, remains unexploited, primarily because of an uncertain private investment environment and a protract-ed structural reform process. Nevertheless, over the last cou-ple of years, GoT has managed to attract foreign investment from Russia, Iran and China to the electricity sector. Secured investments channeled in the construction of two important hydroelectric plants – Sangtuda 1 HPP (Russia) and Sangtuda 2 HPP (Iran) – and the construction of South-North transmis-sion lines (China). After bringing into operation the two HPPs, the electricity deficiency of the country will be almost solved.
In 1997, the Government of Tajikistan issued an or-der for Development of Small Power Engineering, which ap-proved the establishment of an association to support small and non-traditional energy. The term usually refers to small powerplants with less than 25 MW, often operating in isolat-ed mode. The project was initiated by the Russian Association of Non-traditional Energy and Barki Tojik.
In 2007, the Complex Program on Wide Use of Alter-native Energy was initiated by the Government of Tajikistan. The Academy of Science was assigned to establish a special Center and Design Office for Research and Development for technological solutions for the generation of alternative ener-gies. The overall program is divided in the following phases:
Phase 1 (timeframe: 2007–2009; state financing: 87,000 USD) Research in the area of compiling cadastre for alternative energy sources; review of effectiveness taking into account geo-climatic conditions; development of new devices, mate-rials and technologies for energy generation. It is also envis-aged to establish a data bank of alternative energy sources and international cooperations on alternative energy.

Renewable Energies in Central Asia
TAJIKISTAN
COUNTRY INTRODUCTION 142
Phase 2 (timeframe: 2010–2012; state financing: 290,000 USD) Continue research; production of samples of high efficiency devices for energy generation; establishment of an indus-trial base for production lines; focus on capacity building of human and technical potential.
Phase 3 (timeframe: 2013–2015; state financing 1,450,000 USD) Continue research; industrial production of high efficiency devices for alternative energy generation
The program is financed from the state budget by 25.4 %. The rest of the financing is to be acquired from international partners and the private sector. The program is supervised by the Academy of Science. Main program coordinator is the Umarov Physical-Technical Institute under the Academy of Science of Tajikistan. After a delay in 2007, the program started in 2008 with an allocation of 22,000 USD. An open tender was announced to relevant institutions to participate in the research program. Three proposals have been submitted to the Academy of Science:
1. Creation of photo elements – Khujand University2. Production of bio-gas – Agrarian University of Dushanbe3. Creation of a cadastre for alternative energy sources –
Umarov Physical-Technical Institute
Energy Saving ProgramIn 2008, the Norwegian Society for the Conservation of Na-ture launched a Peace Core Project on simple energy saving measures in households in Tajikistan. The project’s goal is to transfer Nepalese know-how to Tajikistan by implement-ing efficient stoves. The project has gradually been extended with practical objectives on energy saving and alternative en-ergy sources since 2005. Since Tajikistan has severe energy shortages mostly in rural regions, sustainable and productive development represents a great challenge. The country has scarce forest areas, and local people spend most part of the day collecting firewood. The project has focused on energy saving and efficiency in educational buildings, window insula-tion improvement, solar water heating, efficient greenhouses, lighting, cooking and household heating. The project is co-financed by the Norwegian Ministry of Foreign Affairs.
Education Project of TempusThe education project on RE called Tempus is assisted by the Tajik Technical University to establish a good quality research laboratory in partnership with international universities such as the Technological University of Hamburg (Germany) and Universities from Greece, Sweden and Kazakhstan. The project support and partnerships have allowed setting up an MSc program in RE at the Tajik Technical University that is going to accept first students in October 2008.
Energy for Rural CommunitiesApart from the above-mentioned future exploitation of the hydro power potential, a special emphasis lies on energy car-riers used in small remote villages with a population of up to 100 persons. An average family in such settlements consists
of 5 persons. One family uses 10–15 kg of dry wood per day for the preparation of food, hot water and heating as well as 0,3–0,5 l of petroleum for lighting. In order to increase living standards of inhabitants in the mountain regions, it is neces-sary to increase the quantity of available energy and at the same time change the structure of energy consumption and methods of obtaining energy and reduce the quantity of the by-products negatively influencing inhabitancy and health of the people. It is estimated that for a reliable power supply of an average family the following set of devices is necessary:
Electric power of 500 W for illumination and appliances Solar kitchen, high efficiency wood furnace Biogas installation (with volume of digesters of around 10 m3)
Solar water heater with capacity of 300–500 W The cumulated capacity of consumed energy will reach up to 4 kWh per family per day. The cost of the necessary equipment to provide this RE will be 2000 –4000 USD.
The State Complex Program on Wide Use of Alternative En-ergy outlines the following technological directions for the development of alternative energies:
PV panels Mini and small hydroelectro stations Sun collectors for water heating and greenhouses Construction of dryers for fruit processing Wind energy generators Biogas and geothermal energy Construction and installation of hydro ram-pumps for irrigation and drinking water in rural villages
4.2 REGULATIONS, INCENTIVES AND LEGISLATIVE FRAMEWORK CONDITIONS
The development of alternative energy is allowed in accord-ance with several Laws (e.g. Energy Efficiency Law), but many issues such as special tariffs for RE, ownership matters, licens-ing, financial incentives and others aspects are not sufficiently covered by the current legislation. Within the Complex Pro-gram, the Government of Tajikistan has acknowledged that there is a need to develop a separate Law on Alternative Ener-gy Sources, which will provide a sufficient legal and normative base for the development of the alternative energy sector.
SHORT BUSINESS INFOWhile Tajikistan generally acknowledges the need for de-veloping RE, there is only a very general legal commitment and no regulatory framework to attract private investors into the Renewable Energy market.
Clean Development Mechanism (CDM)In Tajikistan, Clean Development Mechanism (CDM) projects have not been pursued yet because the country has only recently ratified the Kyoto Protocol in 2009. Neverthe-less, the National Action Plan of Tajikistan on the abatement of consequences of climate change specifies the necessity and expediency of an acceptance of the Kyoto Protocol.

Renewable Energies in Central Asia
TAJIKISTAN
COUNTRY INTRODUCTION 143
5 POTENTIAL FOR RENEWABLE ENERGIES AND PRESENT USE
Tajikistan has an abundant potential of hydro power resourc-es and possesses fairly developed studies on how to utilize some of this potential, especially at the large capacity sites, at relatively low prime costs. Compared to that, all other RE appear very minor. The use of solar energy, however, has good prospects, especially in the Tajik Pamir, where irradiation is nearly 2,000 kW/m2 annually. Wind energy has not yet been investigated, but there are promising areas in this mountain-ous country. Geothermal resources are small and poorly stud-ied in Tajikistan. Concerning bioenergy, there are some small-scale community projects, implemented under the guidance of the Academy of Science and international organizations.
5.1 BIOENERGIESSince forest coverage is very small, Tajikistan primarily pos-sesses bioenergy potential from agricultural wastes. It is es-timated that Tajikistan has the potential to produce around 2 billion kWh/year of electricity from biomass sources (Kabu-tov, as of 2007). An overview of available biomass resources can be found in the appendix.
Solid BiomassTajikistan has a range of solid biomass sources such as wood, sawdust, grass cuttings, domestic refuse, charcoal, agricultur-al waste, dried manure and cotton stalks. The last two are the most important raw biomass in a suitable form. These biofu-els are frequently burned for domestic purposes directly in a stove or furnace to provide heat, and it is estimated that three quarters of the population depend on this type of heat source. A major source of solid biomass are the cotton stalks left over after harvesting the cotton fiber. In 2008, Tajik farmers have planted 253,000 hectares of cotton. There are few enterprises in the Sughd region of Tajikistan that accept solid biomass in a convenient form (such as sawdust, coal chips, grass, agricul-tural wastes) and pelletize the biomass in a pellet mill. The resulting fuel pellets are easier to burn in a pellet stove.
Liquid (Bioethanol or Biodiesel)Tajikistan does not focus on the production of liquid biofu-els. Only a small private processing factory located near the Dushanbe city produces 60,000 liters of ethanol per month. The selling of the produced biofuel is officially allowed by the authorities. The ethanol fuel is produced by fermentation of sugars derived from corn.
BiogasThe most promising option of biomass utilization is the genera-tion of biogas produced by anaerobic fermentation of manure. In Tajikistan, there are 35 complexes and farms with more than 400 dairy cattle where the manure could be used for biogas generation. In 2008, the production of biogas started in several districts of Tajikistan as part of the Community Ag-riculture and Watershed Managemen in the Zarafshan Valley Project implemented by Welthungerhilfe/German Agro Ac-tion (GAA) with financial support of the World Bank and the Government of Tajikistan. According to experts, wide intro-duction of biogas technology using the waste products of ani-mal industries or agricultural and household waste products could reduce methane emissions by 5–8 thousand tons/year.
5.2 SOLAR ENERGY
Solar Photovoltaic Tajikistan has a good potential for the use of solar energy with up to 280–330 days of sunshine per year and annual sun-shine hours between 2,100 and 3,000 depending on the loca-tion. The intensity of the direct solar radiation ranges from 0.9 kW/m2 to 1.18 kW/m2. On a clear day, the daily isolation reaches 7.5 to 8 kW/m2.
Solar radiation is higher in the mountain territories, especially in the East Pamir where the population has no op-portunity to utilize hydro power. Nevertheless, the shortest sunshine duration is observed in the mountain areas where the weather over the year is often overcast and which have a closed relief (Dehavaz: 2,097 hours; Fedchenko Glacier: 2,116 hours). The greatest sunshine duration (more than 3,000 hours per year) is observed in the South of the republic (Pianj: 3,029 hours) and on the East Pamir (Lake Karakul: 3,166 hours) where overcast is minimal and the terrain is wide open.
While photovoltaic (PV) electricity cannot yet com-pete with electricity from large HPs, there are good prospects for the use of solar lanterns, independent radio-transmitters, meteorological stations etc. Tourism and international organi-zations are also interested in use of PV devices for independent electricity supply. For an introduction of PV technology in Tajikistan, the necessary raw materials as well as the industrial (ELTO factory) and scientific (Physico-Technical Institute of AS RT) facilities are present. The republic also has its own experience in designing such devices but there is a lack of pro-fessional skills of experts and missing availability of modern technologies.
Solar Thermal EnergyThermal use of solar energy is more common in Tajikistan than the use of PV. Local manufacturing of such devices is possi-ble due to local materials (aluminium). Local manufacturers are available with ELTO factory and IE Tajikspecavtomatika. Solar devices for providing hot water and heat are commonly applied in apartment houses, hotels, rest houses, shower-baths in rural summer residences and hothouse facilities.
Source: EBRD/Renewable Development Initiative, as of 2009
TABLE 2
Annual Solar Radiation
RADIAL ANNUAL SOLAR RADIATION INCIDENTS
ON HORIZONTAL SUR-FACE (KWH/YEAR)
ON NORMAL SURFACE TO SUNLIGHT BEAMS (KWH/YEAR)
Dushanbe (west) 1,675 1,646
Gorbunov (pamir) 1,953 1,859

Renewable Energies in Central Asia
TAJIKISTAN
COUNTRY INTRODUCTION 144
Research and DevelopmentResearch and development of non-conventional RE sources are carried out in the Physical/Technical Institute of the Academy of Sciences (AS) of the Republic of Tajikistan (RT). Financing, however, is very limited as well as access to new technologies. In the Physical/Technical Institute of AS of RT, experiments on PV cells are carried out on the basis of silicon and arsenide of gallium connections. Experience in designing and manufacturing of solar water-heating devices is also avail-able, solar kitchens are developed, constructed and installed in mountain villages.
5.3 WIND POWERThe potential of wind power in Tajikistan has not been inves-tigated, yet. There is no systematic network of meteorological stations, and measurements of the wind speed at a level of 30 meters and above are not available. Available measurements (see appendix N.) were presumably taken at elevations around 10 m above ground.
The strongest wind is observed in open high-moun-tainous areas (glaciers, mountain passes) and in those areas where topographical factors result in strengthening of the wind speed (Khujand, Faizabad). Average annual wind speed in these areas reaches 4–5 m/s. According to experts, wind energy installations could compete with other energy sources only in some areas of the Republic. In Tajikistan, the most suitable territories for use of a wind power on the basis of wind power stations are the Faizabad mountain region, Fergana val-ley, Murgab hollow and some mountain passes as Haburobad, Shahristan and Anzob.
5.4 GEOTHERMAL ENERGYGeothermal resources are small and poorly studied in Tajikistan. Data about using thermal waters are generally absent, though it is planned to use the thermal water in the vicinity of Khodja-Obi-Garm. Geothermal resources are con-centrated in the convective hydrothermal systems of the Tien Shan foothills. Evaluation of the resources of one thermal water field was carried out at Khodja-Obi-Garm. The result states a temperature of 90 °C, a TDS of 0.5 g/l and a total flow rate of 280 l/s. The total thermal water resources in Tajikistan have not been estimated and resources for electricity produc-tion have not been identified. But Kabutov estimates that Tajikistan could produce 45 billion kWh annually using geo-thermal energy sources (as of 2007). It is not clear how this potential was assessed.
5.5 HYDRO POWERThe potential of hydro power in Tajikistan is approximately 500 TWh/year with more than 300 TWh/year identified as technically viable. From this, only 5–7 % have been devel-oped so far. The construction and operation of more HPPs – especially large ones – is a clear objective of Tajik policy. The Tajik electric power industry is attractive for investors due to the fact that the prime costs of electricity generated by hy-dro power in Tajikistan are among the worlds lowest (around
0.4 cents/kWh). In order to attract foreign capital to the econ-omy of Tajikistan, the Government adopted special terms for the major investors. A big part of the hydro power potential, however, remains unexploited, primarily because of an uncer-tain private investment environment and a protracted struc-tural reform process.
On a regional base, Tajikistan is working with part-ners to optimize the mutual use of water energy resources of border-rivers flowing towards the Aral Sea and continues the work on building a common electricity market.
Small Hydro PowerIn the former Soviet Union and the Central Asian Region, the definition of small Hydro Power Plant is anything with a capacity below 10 MW. Small Hydro Power Plants (SHPPs) are referred to Mini or Micro Hydro Power Plants (MHPPs), referring to less than 1 MW or 100 kW, respectively.
While the GoT’s strongest focus lies on the develop-ment of large HPPs, there are also activities directed to small HPP development. Extending transmission facilities and transferring energy from large HPPs to small settlements scattered in mountain territories would not be profitable. For such remote locations located near small rivers and streams it is more profitable to use small HPPs with capacities from 10kW up to a few MW. Such small HPPs can be constructed with the use of local manpower. Local specialists conducted an extensive research that covered 530 big and small rivers of Tajikistan with a total length of 14,316 km. The rivers with a length of 10–25 km are attributed as small rivers. The results shown in the following table are based on HPPs with capaci-ties between 10 and 1,000 kW.
The development of only 10 % of the small rivers’ energy po-tential in moderate and high-mountain zones will allow the power supply of approximately 70 % of the settlements and agricultural entities. In the Rasht area of Tajikistan alone there is an opportunity for constructing more than 100 small HPPs.
Source: Power Resources of Tajik SSR, Bowels of Earth, Leningrad1
TABLE 3
Potential Capacity of Rivers
POTENTIAL CAPACITY OF RIVERS[MWH/YEAR]
QUANTITY OF RIVERS
CAPACITY[GWH/YEAR]
%
More than 500100-50050-10025-505-10< 5
72844135137190
20.06.03.02.10.6260.439
62.118.79.26.72.01.3
Total 541 32.2 100.0
1 THESE NUMBERS APPEAR INCORRECT. 32 GWH/YEAR WOULD BE EQUIVALENT TO
6.4 MW INSTALLED CAPACITY. THAT IS TOO LOW. THE FOLLOWING LISTS OF SMALL
HPPS PLANNED OR UNDER CONSTRUCTION IS ALREADY MORE THAN THAT. IT IS
ASSUMED THAT THE NUMBERS SHOULD BE TWH/YEAR INSTEAD OF GWH/YEAR.

Renewable Energies in Central Asia
TAJIKISTAN
COUNTRY INTRODUCTION 145
There is a large list of programs for the construction of small hydro stations in Tajikistan. One of them, developed by the Asian Development Bank (ADB) and started in 2007, has put into operation two plants in the Rasht Valley:
The Dushokhzamin plant in the Nurobod district The Kalandak plant in the Rasht district The construction of two more plants is ongoing.
The Islamic Development Bank (IDB) funded the construc-tion of eight small power plants in rural areas of Tajikistan. The loan of 9.3 Mio USD provided by the IDB will support the construction of five small hydro power stations in the ru-ral area of Tajikistan:
The 2,750 kW Marzich station (Ayni district in Sughd) The 667 kW Sangikor station in the Rasht district (North East of Tajikistan)
The 600 kW Fathobod station in Tojikobod (North East of Tajikistan);
The 850 kW Pitavkul station in Jirgatol (North East of Tajikistan)
The 100 kW Shahboloi station in Nourobod (eastern Tajikistan)
The United Nations Development Program (UNDP) and Ger-man Agro Action have also funded the construction of several small hydro power stations in Tajikistan. The Government of Tajikistan represented by the Barqi Tojik company provided 2.4 Mio USD to be spent on the construction of three other small Hydro Power Plants:
The 360 kW Khorma station in Baljuvon (Khatlon) The 500 kW Toj station in Shahrinav (central Tajikistan) The 700 kW Shirkent station in Tursunzoda (central Tajikistan)
A number of bilateral donors (Switzerland, Germany and Japan) supported the construction of MHPs in Tajikistan. About 26 small Hydro Power Plants are supposed to be put into operation in Tajikistan from 2007–2012.
SHORT BUSINESS INFOThe Tajik Embassy in Germany has published a list of 14 mini HPPs provided by the GoT. International investors are invited to tender for these HPPs.
The Ministry of Energy and Industries (MoEI) reported that there were 55 feasibility studies for the construction of small power plants in the country to be done. 18 of them have al-ready been approved by energy specialists.
6 MARKET RISK ANALYSIS AND BARRIERS FOR MARKET ENTRY
6.1 GENERAL SITUATIONThere are investment opportunities in the field of power gen-eration (big and small hydro, PV, geothermal, wind) as well as for heating (solar, biomass, geothermal). The development of RE has been traditionally limited by the high upfront costs and their weak competitive position in centralized energy systems. Decreasing capital investment costs and system de-centralization may make these technologies more competitive in the future, particularly in mountain regions with isolated communities where access to traditional energy supply is lim-ited.
Foreign individuals and companies can start a busi-ness in Tajikistan with or without Tajik partners. Thus, an enterprise with foreign investment may either be with 100 % of foreign capital or as a joint venture with a local partner.
According to the Law on Investments, the investments can be implemented in any form:
Traditional, i. e. direct investment defined as capital invest-ment with a goal of considerable or complete control over the activity of the investment object
Portfolio investment, where an investor is holding a certain percentage of the total amount of the issued shares of a national enterprise
Vested interests, i. e. the right to use land and other natural resources as well as other vested interests
The right to conclude any treaties providing for other forms of foreign investment
CorruptionThe Worldwide Corruption Perceptions Index published by Transparency International ranks Tajikistan at 51 out of 180 countries.
Availability of Local Know-howTajikistan maintains a skilled industrial labor force that is widely recognized by established foreign investors. Being well educated, the average monthly salary of the local workforce remains at competitive levels.
Local Acceptance of Foreign ActivitiesThe GoT’s policy strongly favors Foreign Direct Investment (FDI) realizing that it plays a vital role in the development of the country’s economy. In this regard, the GoT puts emphasis on foreign investment as a means to develop new industrial activities as well as to modernize existing ones. Unfortunately, the country‘s weak institutions and poor governance do not provide an favorable environment for domestic and foreign private investment or efficient public service delivery. A weak public administration and the undeveloped financial sector hamper the nurturing of an investment climate needed for private sector development and for attracting foreign direct investments.

Renewable Energies in Central Asia
TAJIKISTAN
COUNTRY INTRODUCTION 146
Recognizing these constraints for private sector develop-ment – particularly on the development of small and medium enterprises – and the need to address these issues as part of its poverty reduction strategy, the Government has expressed the intention to develop a comprehensive strategy for private sector development. To sustain medium- and long-term eco-nomic growth, Tajikistan needs to attract foreign investment. In order to do so, significant improvements are required, not only the continued modernization of the legal and regulatory framework, but also the institutional capacity to implement the reforms.
6.2 INTELLECTUAL PROPERTY RIGHTSIn 1994, Tajikistan joined the World Intellectual Property Organization in the field of industrial property protection. Since then, the departments of copyright at the Ministry of Culture and Information and the National Center for Patents and Information have been charged with the administration of intellectual property rights within the country.
6.3 BUSINESS DEVELOPMENTIn 2006, the International Finance Corporation completed its second Small and Medium Enterprises (SME) survey in Tajikistan. The following is a summary of the market risk analysis for Tajikistan.
RegistrationRegistering a new business in Tajikistan has become easier, particularly for small businesses. The registration procedure was reformed in 2003, and now individual entrepreneurs can register a business in less than a week at limited costs. The average registration time of legal entities is over a month. It is a complex and time-consuming process and involves more than five governmental agencies. As a result, unofficial pay-ments are a common solution and expenditures can be quite significant.
Licensing for Business ActivitiesAccording the new Licensing Law, obtaining a license has become easier. The duration of licenses remains a critical is-sue. Although the legislation establishes a minimum duration of three years, the de facto average duration of a license in Tajikistan is less than one year. The process of a license re-newal is even more complicated and more prone to corruption than an initial issuance.
Permits for Business ActivitiesMore than half of SMEs need to obtain permits prior to launching business activities. The permit system in Tajikistan is the result of two complementary forces: technical regula-tions of the Soviet era and new market oriented regulations. The permit issuance process is not properly regulated. In addi-tion, some permits also contradict the requirements of a mar-ket economy (i. e. the permit to use energy). The valid time of a permit is another critical issue. Some existing businesses need to receive permits almost as frequently as do start-ups.
Access to FinanceTajikistan’s financial sector is still in a developing stage. The relationship between financial intermediaries and SMEs is still extremely limited: only one out of six businesses has a bank account. This partly reflects the limited trust in the financial sector, but also points out a lack of effort on the supply side to develop products and services to attract new customers.
InspectionsOnce established, a Tajik business is likely to face Government interference in the form of inspections at least once a month. Only one out of five inspections results in an official sanction. On the one hand this testifies a limited use of risk manage-ment principles in selecting inspection targets and highlights inefficiency. On the other hand, it points out a high likelihood of unofficial payments to resolve inspection-related issues. Af-ter the start-up of a new Inspection Law in 2007, the overall inspection situation has considerably improved.
6.4 TAXATIONSME taxation, although not particularly heavy in terms of tax rates, represents a serious obstacle for the sector’s develop-ment due to complicated tax administration procedures. Tax administration is cumbersome, requiring multiple reports and payments over the year. Tax compliance is mostly pursued through repeated tax audits.
According to the Tax Code of the Republic of Tajikistan (Article 343, paragraph 2), all investors and en-terprises are granted exemption from Value Added Tax and Customs Duties on materials and equipment required for the construction of hydro power stations.
In addition, in accordance with (Article 343, para-graph 3), individuals and legal entities that are not the citizens of the Republic of Tajikistan yet working at the construction of the hydro power stations receive exemption from Value Added Tax, Road Users’ Tax and Social Tax.
In the appendix there is a table listing financial incen-tives and tax benefits for investors in the energy sector that is promoted by the GoT.
Export/Import:Complicated foreign trade procedures as well as high trans-portation costs represent two critical constraints for import/export activities, resulting in lower competitiveness of exports as well as in price increases for imports. Standardization and certification requirements represent a major barrier to inter-national trade for the Tajik economy. Goods imported into Tajikistan need to be tested and meet separate local quality requirements as set by the national agency responsible for standardization and certification.

Renewable Energies in Central Asia
TAJIKISTAN
COUNTRY INTRODUCTION 147
7 RENEWABLE ENERGY BUSINESS INFORMATION AND CONTACTS
Asian Development Bank (ADB)Ruslan Sadykov, Project Implementation Officer107, Nozim Khikmat Str., 734001, Dushanbe, TajikistanPhone: (992 37) 2210558E-Mail: [email protected] small hydro power
Academy of Sciences of TajikistanAkhmedov Khakim Munavarovich, Chief scientific secretary, Academician AS RT33, Rudaki Ave., 734025, Dushanbe, TajikistanPhone: (992 37) 2215017E-Mail: [email protected] in research related to alternative energy develop-ment
Commercial Company Fon-Dario, Abdulloeva SadafmoSettlement Komsomol, DushanbePhone: (992 37) 2247795, (992 91) 9442242, (992 907)704501E-Mail: [email protected] of biofuel
Tajik Branch of Open Society InstituteTolib Tokhiri, Program Coordinator37/1 Bokhtar Str., Business Center “Vefa”, 4th floor, 734002, Dushanbe, TajikistanPhone: (992 47) 4410728E-Mail: [email protected] in biogas
Tajik Technical UniversityAlphia Akhrorova, Head of Department, Project Director for Renewable Energies10 Akademik Rajabova Str., Building 1, Energy DepartmentPhone: (992 37) 2213984Fax: (992 37) 2217135E-Mail: [email protected], research, project implementation
United Nations Development Program (UNDP)Brian Donaldson, Early Recovery Advisor39 Ayni Street, 734024, Dushanbe, TajikistanPhone: (992 47) 4410641E-Mail: [email protected] dialog, project implementation
Machine Factory IE VostokredmetChkalovsk City, Sughd OblastPhone: (992 34) 2265319Manufacturing capacities for equipment for small HPPs
RENEWABLE ENERGY: RELEVANT INSTITUTIONS
Ministry of Energy and Industry (MoEI) of the Republic of Tajikistan734012, RT, Dushanbe, 22 Rudaki Ave. Phone: (992 37) 2216997Fax: (992 37) 2218281E-Mail: [email protected]
Open Joint Stock Holding Company “Barki Tojik”, (BT)State electricity company734026, RT, Dushanbe, 64, Ismoili Somoni Str. Phone: (992 37) 2358668Fax: (992 37) 2358692E-Mail: [email protected]
Academy of Sciences of TajikistanAkhmedov Khakim Munavarovich, Chief scientific secretary, Academician AS RT33, Rudaki Ave., 734025, Dushanbe, TajikistanPhone: (992 37) 2215017E-Mail: [email protected]
Umarov Physicotechnical InstituteAcademy of Sciences of the Republic of Tajikistan299/1 Aini. Str., Dushanbe, 743063, Republic of Tajikistan
Holding Company Nourfazo for Construction of Power Plants under the Government of RT734011, RT, Dushanbe, 39 a, Kakharov Str. Phone: (992 37) 2217112, 2215225
Design and Exploration Institute TAJIKGIDROENERGOPROEKT734011, RT, Dushanbe, 39, Kakharov Str. Phone: (992 37) 2217340, 2213507Hydro plants, transmission lines, switching substations
Agency for Land, Geodesy and Cartography under the Government of the Republic of Tajikistan734033, RT, Dushanbe, 4/1Abaya Str.Phone: (992 37) 2217321, 2212848, 2314602 Fax: (992 37) 2311487
Agency for Standardization, Metrology, Certification and Trade Inspection under the Government of the Republic of Tajikistan. 734018, RT, Dushanbe, 42/2 N. Karabaeva Str. Phone: (992 37) 2336467, 2346365Fax: (992 37) 2341933E-Mail: [email protected]
Ministry of Agriculture and Nature Protection of the Republic of Tajikistan 734025, RT, Dushanbe, 44 Rudaki Ave. Phone: (992 37) 2211596, 2211094Fax: (992 37) 2215794

Renewable Energies in Central Asia
TAJIKISTAN
148
8 BIBLIOGRAPHY
ADB (2005): Country Strategy and Program Update for Tajikistan (2006–2008)
Barki Tojik (2006): Energy Loss Reduction Report Barki Tojik (2008): Operating Results Report for January–April 2008
Dushanbe (2005): Individual Restructuring Plan of OJSHC Barki Tajik for Period 2005-2015, commission report
Economist Intelligence Unit (2008): Country Report European Bank for Reconstruction and Development – EBRD/ Renewable Development Initiative (2009): Coun-try Profile. Tajikistan (http://ebrdrenewables.com/sites/re-new/countries/tajikistan/profile.aspx)
International Energy Agency – IEA, (2005): Beyond the OECD – Tajikistan (www.iea.org/country/n_country.asp?COUNTRY_CODE=TJ)
International Finance Corporation (2006): Business Environment in Tajikistan
International Monetary Fund (2007): Report for the 2006 Article IV Consultation
Kabutov, K. (2007): Tajikistan – Priority Directions and Status of Research in the Field of Renewable Energy Sourc-es (in Russian), published in Geliotekhnika, 2007, No. 4, pp. 91–96
N. N. (2004): Tajikistan Energy Utility Reform Review – a Strategic Approach to the Sector Development
N. N. (2006): Water Sector Development strategy of Tajikistan
N. N. (without year): World Hydro-Electrical Engineering Atlas – Hydro Power & Dams
Promotion of Renewable Energy, Energy Efficiency and Greenhouse Gas Abatement – PREGA (2006): Country Report Tajikistan
Renewable Development Initiative (without year): Country Report Tajikistan (www.ebrdrenewables.com/sites/renew/countries/Tajikistan/default.aspx)
World Bank (2006): Strategic Framework for the Energy Sector in CAREC Countries
World Bank (2007): Private Sector Development Strategy Paper
Websites Goskomstat, Statistical Committee of Tajikistan (www.stat.tj) Ministry of Energy of Tajikistan (www.minenergo.tj) Environment and Security (ENVSEC) Initiative (www.envsec.org)
REFERENCES

Renewable Energies in Central Asia
TAJIKISTAN
149ANNEX
9 ANNEX
Source: Environment and Security (ENVSEC) Initiative (www.envsec.org), without year
FIGURE 4
Energy Sector Overview

Renewable Energies in Central Asia
TAJIKISTAN
150
LIST OF GOVERNMENT INITIATIVES
GUARANTEES AND BENEFITS BENEFICIARIES CONTENT OF GUARANTEES AND BENEFITS LEGISLATIVE DOCUMENTS
Exemption from customs duty and VAT All enterprises Import of production technological equipment and its components (forming unified set that is without these components the work of the production technological equipment is impossible), to form or replen-ish the chartered capital of the enterprise or technical re-equipment of the current production under the condition that this property is used exactly for production of goods and rendering services in accordance with the constituent documents and do not belong to category of excise goods and also personal property imported to the Republic of Tajikistan by foreign employees of enterprises with foreign investments for personal use
Customs Code of the Republic of Tajikistan (Article 345, § 4) Tax Code of the Republic of Tajikistan (Article 211, § 4, part 4)
Exemption from VAT and customs duty All enterprises Import of goods for implementation of the targeted projects approved by the Government of the Republic of Tajikistan at the expense (within the limits) of grants and/or credits/oans provided to legal entities and individuals, foreign states, governments of the foreign states or international organizations
Tax Code of the Republic of Tajikistan (Article 211, clause 4, subparagraph 6)Customs Code of the Republic of Tajikistan (Article 345, § 6)
Exemption from VAT and customs duty All enterprisesSupply of goods, execution of work and rendering of services as a humanitarian aid
Tax Code of the Republic of Tajikistan (Article 211, § 2, subparagraph 7)Customs Code of the Republic of Tajikistan (Article 345, § 3)
Operations taxable at zero rate All enterprises
Export of goods except for raw cotton, ginned cotton and raw alumi-num are taxable by VAT at zero rate
Tax Code of the Republic of Tajikistan (Article 214, § 1)
Exemption from income tax All enterprises New enterprises created for production of goods at the year of their state registration and starting from the year following the year of the initial registration if their founders’ deposit investments into the chartered fund of these enterprises taking into account the minimal investments established by the legislation for the period of:- 2 years if the investments are equivalent to 500,000 USD;- 3 years if the investments are equivalent more than 500,000 to 2
million USD;- 4 years if the investments are equivalent to more than 2–5 million
USD;- 5 years if the investments exceed 5 million USD
Tax Code of the Republic of Tajikistan (Article 145, § 6)
Exemption from VAT from the road users, profit tax from the legal entities, minimal income tax from enterprises, land tax, ve-hicle users’ tax, real estate tax, social tax from those people that are working at the construction of hydro-power stations and that are not the citizens of the Republic of Tajikistan
Building owners and general contractor of the construction
For the period of the hydro power station’s construction on the terri-tory of the Republic of Tajikistan
Tax Code of the Republic of Tajikistan (Article 343, § 1)
Exemption from VAT and customs duties All enterprises Import of goods for the construction of the hydro power stations that are highly important objects of the Republic of Tajikistan
Tax Code of the Republic of Tajikistan (Article 343, § 2)
Exemption from VAT and road users’ tax, social tax
Suppliers, subcon-tractors and staff for the construction of hydro power stations
Individuals and legal entities who are working at the construction of the hydro-power stations, persons that are not the citizens of the Republic of Tajikistan
Tax Code of the Republic of Tajikistan (Article 343, § 3)
Exemption from customs duty and VAT All enterprises Import of goods necessary for personal use of the newly created enterprises operating the full cycle of cotton processing up to the finished product (from cotton yarn to cotton ready-made garments)
Tax Code of the Republic of Tajikistan (Article 344, § 1)
Exemption from VAT All enterprises Export of goods produced by newly created enterprises operating the full cycle of cotton processing up to the finished product
Tax Code of the Republic of Tajikistan (Article 344, § 2)
Exemption from income tax of legal enti-ties, minimal income tax, real estate tax and land tax
All enterprises Newly created enterprises operating the full cycle of cotton process-ing up to the finished product
Tax Code of the Republic of Tajikistan (Article 344, § 3)
Source: Tax Code and Custom Codes of the Republic of Tajikistan, without year
ANNEX

Renewable Energies in Central Asia
TAJIKISTAN
151ANNEX
TABLE 4
GDP Development in Tajikistan*
YEARS NATIONAL GDP IN MIO TAJIK SOMONI
NATIONAL GDP IN MIO USD
GDP GROWTH IN % PER CAPITA
TAJIK USD
2000 1,806.00 820.00 8.30 289.00 131.00
2001 2,512.00 1,069.00 10.20 396.00 168.00
2002 3,344.00 1,115.00 10.90 527.00 175.00
2003 4,757.00 1,612.00 10.20 732.00 248.00
2004 6,157.00 2,032.00 10.60 927.00 306.00
2005 7,201.00 2,250.00 6.70 1,040.00 325.00
2006 9,272.00 2,711.00 7.00 1,319.00 386.00
2007 12,779.00 3,693.00 7.80 1,780.00 514.00
COAL CRUDE OIL PETROLEUM PRODUCTS
GAS HYDRO ELECTRICITY TOTAL
Domestic production 43 22 0 24 1,435 0 1,524
Imports 3 0 1,468 459 0 388 2,318
Exports 0 -5 -12 0 0 -366 -383
TPES 46 17 1,456 483 1,435 22 3,458
TABLE 5
Primary Energy Consumption in ktoe*
TABLE 6
Electricity Consumer Groups*
CONSUMER GROUP 2005 2006 2007
ÒÀLKO (Aluminium plant) 6,282.00 7,108.00 7,228.00
Industry excluding ÒÀLKO 905.00 1,005.00 795.00
Pumping irritation 1,546.00 1,677.0 1,648.00
Agriculture excluding pumping irrigation
572.00 563.00 31.00
Government 426.00 410.00 478.00
Residential customers 3,941.00 3,352.00 3,044.00
Other 438.00 423.00 1,179.00
Total billed sales 14,110.00 4,538.00 14,405.00
TABLE 7
HPPs Operated by “Barki Tajik” Electric Utility Company*
NAME OF HPP TOTAL CAPACITY MWt
Nurek 2,700
Baipaza 600
Sarband 240
Sharshara 29.95
Centralnaya 15.1
Kairakkum 126
Varzob 1 7.44
Varzob 2 14.4
Varzob 3 3.52
TABLE 8
Thermoelectric Plants Operated by “Barki Tajik” Electric Utility Company*
NAME OF TPS TOTAL CAPACITY MWt
Dushanbe 230
Yavan 180
TABLE 9
HPP Operated by “Pamir Energy” Electric Utility Company*
NAME OF HPP TOTAL CAPACITY MWt
Pamir 1 28
Lenin 0.936
Horog 8.7
Kalai Humb 0.208
Vanj 1.2
Teharv 0.36
Shyjand 0.832
Savnob 0.08
Sponj 0.16
Namadgyt 2.5
Aksu 0.64
TABLE 10
Electricity Production in Tajikistan (in GWh)*
GENERATION 2005 2006 2007
Hydro generation 16,839.0 16,528.0 16,960.6
Thermal generation 119.0 228.0 379.7
Total generation 16,958.0 16,756.0 17,340.3
Total stations own use 45.0 56.0 68.5
Total stations output 16,913.4 16,700.3 17,271.8
Total export 798.2 948.5 696.3
Total import 1,042.0 1,556.8 1,057.1
Manufacture needs - - 18.7
Total delivered to domenstic market
17,157.4 17,308.6 17,340.8
* Sources Tables 4 –16: data compiled by the authors from different sources

Renewable Energies in Central Asia
TAJIKISTAN
152ANNEX
TABLE 11
Consumption of Electricity in Tajikistan by Customer Groups (in GWh)*
BILLED SALES BY CONSUMERS CATEGORIES
2005 2006 2007
ÒÀLKO (Aluminium plant) 6,282.0 7,108.0 7,222.8
Industry excluding ÒÀLKO 905.0 1,005.0 795.6
Pumping irritation 1,546.0 1,677.0 1,648.7
Agriculture excluding pumping irritation
572.0 563.0 31.4
Goverment 426.0 410.0 478.2
Residential customers 3,941.0 3,352.0 3,044.6
Other 438.0 423.0 1,179.4
Total billed sales 14,109 14,539.2 14,400.7
TABLE 12
Electricity Losses in Tajikistan*
LOSSES UNIT 2005 2006 2007
Technical losses GWh 1,552.0 2,728.0 2,940.1
% 9 % 15.8 % 17.0 %
Commercial losses GWh 1,496.0 40.9 0
% 9 % 0.2 % 0 %
Total technical and unbilled losses
GWh
%
3,048.0
18 %
2,769.0
16.0 %
2,940.1
17.0 %
TABLE 13
National Tariffs in Tajikistan (approved 2 May 2008)*
ELECTRICITY ENERGY DIRAM PER KWh
Industrial and non industrial users 10.95
Tajik Aluminium company 5.15 (1,5 US Cent)
State buget organizations, communal sector and electric transport
4.35
Pumped irrigation 2.91
Residential customers (VAT included) 4.8
HEAT ENERGY SOMONI PER 1 Gcal
For state budget organizations 19.5
For wholesale consumers that supply heat energy to population
2.55
For all other users 75.0
RENEWABLE ENERGY TARIFFS
As per order “Development of Small Energy” Barki Tojik was tasked to purchase excess electricity from private small scale providers are per an average national tariff
TABLE 14
Major Electricity Sector Projects in Tajikistan*
FUNDING AGENCY PROJECT TITLE AMOUNT (USD MILLION)
PROJECTS UNDER IMPLEMENTATION
Asian Development Bank Power rehabilitation Project I phase Power rehabilitation Project II phase
34.0 50.0
Small Hydro Power Plants Emergency Baipaza 11.6 5.3
Islamic Development Bank Rehabilitation of two substations, Construction of small HPS in rural areas
13.0 9.3
Kuwait F und for Arabic Economic Development World Bank
Rehabilitation of Dushanbe City Distribution network Pamir Private Power Projekt
13.0
10.0
Energy Loss Reduction Project 18.0
Goverment of Switzerland Power Rehabilitation Project Pamir Private Power Project
8.1 5.0
International Financial Corporation (IFC) and Aga Khan Foundation (AKFED)
Energy Loss Reduction Project Pamir Private Power
8.0 26.0
Government of Russia Completion of the Sangtuda 1 Hydro Power Plant
570.0
Government of Iran Construction of Sangtuda 2 Hydro Power Plant 180.0
Government of China “South-North” & “Lolazo” transmission Lines 340.0
Government of India Rehabilitation of Varzob-1 HPP 13.0
Government of Tajikistan via “Barki Tojik” company Small Hydro Power Plants 5.0
United Nations Development Program Small Hydro Power Plants 0.4
PROJECTS UNDER NEGOTIATIONS
* Sources Tables 4 –16: data compiled by the authors from different sources

Renewable Energies in Central Asia
TAJIKISTAN
153ANNEX
TABLE 16
Average Wind Speeds in Tajikistan*
STATION HEIGHT ASL (m) SPEED OF WIND (m/s)
DISTRICTS AN CITITES
Dushanbe 788 1.1
Asht 698 1.4
Khujand 425 4.6
Isfara 863 1.8
Yra-tube 1,004 1.6
Penjekent 1,014 2.0
Garm 1,316 2.5
Komsomolobad 1,258 1.4
Obi garm 1,900 1.4
Tavildara 1,616 1.7
Shahrinay 852 2.3
Faizabad 1,215 4.1
Orshenikinzabad 866 2.3
Pahktaabad 641 2.8
Khovaling 1,468 4.3
Yavan 663 2.3
Dangara 660 1.3
Kuliab 359 1.5
Sharabad 1,900 3.0
Kurgan tube 427 1.2
Kolhozabad 473 0.8
Shaartuz 378 1.8
Parhar 447 1.6
Vaksh 445 2.1
Djilikul 349 2.1
SERPERATE VILLAGES
Dehays 2,564 3.7
Madrushkent 2,254 2.9
STATION HEIGHT ASL (m) SPEED OF WIND (m/s)
Sangistion 1,502 2,7
Khoja obi garm 1,900 1,4
Gushari 1,361 1,2
Bustonabad 1,964 4,7
Sanglok 2,239 3,0
Kangurt 948 1,4
Isanbai 563 1,9
Liayr 2,254 1,9
Aivadj 318 3,6
Nijnii Pianj 329 1,8
Maihura 1,921 1,4
Liayash 1,998 1,8
Chormahzak 1,726 3,9
Kharamkul 2,826 0,9
Iskanderkul 2,204 1,6
Shahristan 3,143 4,7
Anzob 3,373 4,6
PAMIR REGION
Kalai humb 1,288 1,3
Murgab 3,576 2,3
Rushan 1,981 2,1
Ishkashim 2,524 2,0
Khorog 2,075 2,3
Khumgari 1,736 2,7
Jashayangos 3,410 2,3
Bulunkul 3,744 1,5
Lake Karakul 3,930 3,0
Galcier Fendchenko 4,169 6,0
Khaburabad 3,347 4,8
* Sources Tables 4 –16: data compiled by the authors from different sources

Renewable Energies in Central Asia
TAJIKISTAN
154
FGURE 5
Tajikistan Wind Map
Source: 3Tier (www.3tier.com), as of 2009
ANNEX

Renewable Energies in Central Asia 155
COUNTRY CHAPTER:
REPUBLIC OF TURKMENISTAN
Authors and Coordination of Country Chapter Kurban Balliyev (Eng. Water Management & Dipl.)
Dr. Ing. Klaus JordeEntec Consulting & Engineering AGSt. Gallen, Switzerlandwww.entec.ch
Axel Biegert (Dipl. Economist & Pol.) INTEGRATION UMWelt & Energie GmbHGraefenberg, Germany www.integration.org
Editor Deutsche Gesellschaft für Technische Zusammenarbeit (GTZ) GmbHDepartment Water, Energy, TransportDag-Hammarskjöld-Weg 1-565760 Eschborn, Germanywww.gtz.de
On behalf of Federal Ministry for Economic Cooperation and Development (BMZ)
Editorial staffDiana KraftTel: +49 (0)6196 79 4101Fax: +49 (0)6196 79 80 4101Email: [email protected]

156CONTENTS
ACRONYMS, ABBREVIATIONS AND MEASUREMENTS 157
1 SUMMARY 159
2 COUNTRY INTRODUCTION 1602.1 Geography and Climatic Conditions 1602.2 Political and Economic Development 160
3 ENERGY MARKET IN TURKMENISTAN 1613.1 Important Players of the Turkmen Energy Market 1613.2 Primary Energy Consumption, Transmission and Prices 161
4 POLICY FRAMEWORK FOR RENEWABLE ENERGIES 1644.1 National Strategies and Programs to support Renewable Energies 1644.2 Regulations, Incentives and Legislative Framework Conditions 164
5 POTENTIAL FOR RENEWABLE ENERGIES AND PRESENT USE 1655.1 Bioenergies 1655.2 Solar Energy 1655.3 Wind Power 1655.4 Geothermal Energy 1655.5 Hydro Power 165
6 MARKET RISKS AND BARRIERS FOR MARKET ENTRY 1666.1 General Situation 1666.2 Business Development 1666.3 Intellectual Property Rights 1666.4 Taxation 1666.5 Import/Export 167
7 RENEWABLE ENERGY BUSINESS INFORMATION AND CONTACTS 167
8 BIBLIOGRAPHY 169
9 ANNEX 170
Renewable Energies in Central Asia
TURKMENISTAN
CONTENTS TURKMENISTAN

157
ACRONYMS AND ABBREVIATIONS TURKMENISTAN
ADB Asian Development Bank
BISNIS Business Information Service for the Newly Independent States
CAR Central Asian Region
CCA Common Country Assessment
CDM Clean Development Mechanism
CHP Combined Heat and Power Plant
CIS Commonwealth of Independent States
GDP Gross Domestic Product
GEF Global Environmental Facility
DNA Designated National Authority
DDP Distribution Demonstration Project
EBRD European Bank for Reconstruction and Development
EIA Energy Information Administration
EPC JSC Electric Power Plants (GenCo)
FSU Former Soviet Union
GDP Gross Domestic Product
GHG Greenhouse Gas Emissions
HPP Hydro Power Plant
HV High Voltage
HVL High Voltage Lines
HVN High Voltage Network
IBRD International Bank for Reconstruction and Development
ICWC Interstate Commission for Water Coordination
IDA International Development Association
IGES Institute for Global Environmental Strategies
JSC Joint Stock Company
KNG JSC KyrgyzNefteGas (Oil and Gas)
KPC Kyrgyz Petroleum Company
MB&C Metering, Billing and Collection
MDG Millennium Development Goals
NEAP National Environmental Action Plan
NEG National Electric Grid
O&M Operation and Maintenance
PCCAR Power Council of Central Asia Republics
PREGA Promotion of Renewable Energy, Energy Efficiency and Greenhouse Gas Abatement
RE Renewable Energy
SJSC State Joint Stock Company
UDC Unified Dispatch Center
UAE United Arab Emirates
UNDP United Nations Development Program
UNDAF United Nations Development Assistance Framework
UNFCCC United Nations Framework Convention on Climate Change
UPSCAR United Power System of Central Asia Republics
USD United States Dollars
TFC Total Final Consumption
TPP Thermal Power Plant
VAT Value Added Tax
WB World Bank
ACRONYMS, ABBREVIATIONS AND MEASUREMENTS Renewable Energies in Central Asia
TURKMENISTAN

158
MEASUREMENTS
kV kilovolt (1kv = 1,000 V)
MW megawatt (1MW = 1,000 kW)
GWh gigawatt hour (1 GWh = 1,000,000 kWh)
TWh terawatt hour (1 TWh = 1,000,000,000 kWh)
kJ kilojoule (1 kJ = 1,000 Joule)
ktoe kilotons of oil equivalent (1ktoe = 11,630,000 kWh)
km2 square kilometer
GW gigawatt
km kilometer
mm millimeter
m3 cubic meter
C degree Celsius
m meter
m/s meters per second
Renewable Energies in Central Asia
TURKMENISTAN
ACRONYMS, ABBREVIATIONS AND MEASUREMENTS

Renewable Energies in Central Asia
TURKMENISTAN
159
1 SUMMARY
Turkmenistan has a tremendous wind power potential and a high solar potential as well, but these are overshadowed by the well-known wealth of oil and gas. The reserves of natural gas mean that the country can meet the domestic electricity demand with currently existing facilities and without the need for new development.
Currently, large sections of the population do not pay for their use of electricity due to state subsidies. These condi-tions are not favorable for Renewable Energy (RE) projects entering the market. There are programs in place aimed at reducing the environmental impact of oil and gas extraction and refinery and energy saving/water conservation measures by the public. This, rather than renewable development, has been Turkmenistan’s primary response to greenhouse gas emissions.
The poor environment for RE development is particu-larly unfortunate as the wind potential is high on more than 40 % of Turkmenistan’s territory, with a mid-term estimate of up to 10,000 MW potentially developable. This is only a frac-tion of the available wind resources, which have the potential to even rival the republic’s natural gas reserves. Besides that, Turkmenistan also has a high solar energy potential almost everywhere in the Republic.
The Turkmen Government is supporting the devel-opment of innovative technologies including RE. It would, however, require more pushing from the Government or con-sumers to really initiate the development and application of RE in the country.
SUMMARY

Renewable Energies in Central Asia
TURKMENISTAN
COUNTRY INTRODUCTION 160
2 COUNTRY INTRODUCTION
2.1 GEOGRAPHY AND CLIMATIC CONDITIONSTurkmenistan is located in the South of Central Asia and is bordered by Afghanistan to the South East, by Iran to the South and South West, Uzbekistan to the East and North East, Kazakhstan to the North and North West and the Caspian Sea to the West. The country covers a total of 488,100 km2.
The central part of the country is dominated by the Turan Depression and the Karakum Desert, which cover al-most 80 % of the country. Turkmenistan is a mostly flat coun-try. The only significant elevations are along the border to Iran and Afghanistan. Rivers include the Amu Darya, the Murghab and the Tejen. Surface waters are very sparsely distributed and water resources are limited in most parts of the country. The Karakum Canal brings water from the Amu Darya River to the Kope Dag Mountains and allows the irrigation of 1 mil-lion hectares of land, thus providing the basis for agricultural production but also causing environmental problems due to leaking canals and the shrinking of the Aral Sea1.
The climate is mostly arid subtropical desert with little rain-fall. The Karakum Desert is one of the driest deserts in the world; some places have an average annual precipitation of only 12 mm. Winters are mild and dry, with most precipita-tion falling between January and May. Summer temperatures can reach up to 48 °C.
The Republic is divided into five provinces and one capital city district. Other large cities are Turkmenabat, Mary, Turkmenbashy (Krasnovodsk), Dashoguz and Balkanabat. Most of Turkmenistan‘s citizens are ethnic Turkmens, size-able minorities include Uzbeks and Russians.
Turkmenistan is part of two main seismic zones of the world. The Ashgabat earthquake of 1948 killed over 110,000 people (2/3 of the city‘s population)2.
2.2 POLITICAL AND ECONOMIC DEVELOPMENT The territory of Turkmenistan has a history of several cen-turies as arMIEs from numerous empires decamped there on their way to more prosperous territories. In 1884, Russia gained control over the territory, which later became part of the Soviet Union. In 1991, Turkmenistan declared its inde-pendence. Until recently, it was a single-party system that was considered to meet not even the most basic standards of de-mocracy. Turkmenistan was ruled by President for Life Sapar-murat Niyazov who wielded virtually absolute power until his sudden death in 2006. Gurbanguly Berdimuhamedow was elected the new president on 11 February 20073.
Prior to independence, Turkmenistan’s economy was entirely geared to providing raw materials for the other So-viet Republics, most prominently natural gas but also crude oil and cotton. In turn, it was dependent on importing staple foods to a large extent.
After gaining independence, natural gas supplies had to be discontinued step by step with extreme consequences on the country’s economy. Since the export of natural gas was the main income source, the country suffered from negative Gross Domestic Product (GDP) growth and hyperinflation for six consecutive years. In 1999, a turn-around point in the eco-nomic development was reached, and there has been a consid-erable economic growth ever since. GDP per capita has only recently re-achieved the level it held before independence.
Taking the enormous natural gas deposits, Turkmeni-stan can be considered as a “gas republic”. But Turkmenistan is heavily dependent on export routes established during the Soviet area, namely the Russian Gazprom pipelines, which weaken Turkmenistan’s bargaining position in price negotia-tions. This seeming disadvantage, however, may turn out to be good for the country’s long-term development. The Gov-ernment realized that the only way out of this dependency situation is by diversifying the industrial production and to substitute imported staple foods and consumer goods. In-stead of relying on Russian pipelines, the option of refining and processing crude oil is increasingly realized as well as the option to generate electrical power by using natural gas and then exporting electricity. The agricultural sector, which still employs 50 % of the entire working population, has also prof-ited. Today, over 80 % of staple foods are produced within the country4.
FIGURE 1
Map of Turkmenistan
1 SEE LAKENET, AS OF 2009
2 PUBLICATIONS INTERNATIONAL, AS OF 2006, AND KING ET. AL., AS OF 1996
3 FREEDOM HOUSE, AS OF 2009
4 SCHMID & LANGBEIN, AS OF 2004
CaspianSea
Kizyl-ArvatKazandzhik
DzangaBalkanabat
Tedzhen
Bayram-Ali
Mary
Turkmenabat
Kum-Dag
Cheleken
Krasnovosk
Dashoguz
Amu-Darya
Kerki
Amu Darya
ASHGABAT
Tedzhen R.
Zaliv Kara-Bogaz-Gol U Z B E K I S T A N
A F G H A N I S T A N
I R A N

Renewable Energies in Central Asia
TURKMENISTAN
COUNTRY INTRODUCTION 161
3 ENERGY MARKET IN TURKMENISTAN
3.1 IMPORTANT PLAYERS OF THE TURKMEN ENERGY MARKET
Turkmenistan’s energy market is dominated and controlled by the State. The participation of foreign players remains in-significant. In addition, the following main actors play an im-portant role in the local energy market:
The Ministry of Energy and Industry regulates and man-ages electric power.
Turkmenenergo is the State Energy Corporation, which owns most power plants in the country and manages and monitors the power grid.
The state-owned energy-engineering corporation is called Kuvvat and belongs to the Ministry of Energy and Indus-try. It provides electric power generation and transport. Kuvvat comprises all necessary subdivisions for design, construction, repair and operation of energy projects.
Türkmengas is the national gas company of Turkmenistan and controls gas extraction in the country. It is operating under the Ministry of Oil and Gas. Türkmennebit, also known as Turkmenoil or Turkmenneft, is the national oil company of Turkmenistan. The company is extracting most of Turkmenistan‘s oil.
3.2 PRIMARY ENERGY CONSUMPTION, TRANSMISSION AND PRICES
In 2006, the total primary energy production in the Re-public of Turkmenistan was 61,611 ktoe (716,535 GWh), consisting of 84 % natural gas and 16 % crude oil. Of this amount, 44,431 ktoe (516,732 GWh) were exported. The Total Final Consumption of energy (TFC) was 10,370 ktoe (120,603 GWh) in 20065. The figure below shows in which forms energy resources were consumed:
LAND AREA: 448,100 km²
POPULATION: 4.9 million (as of 2009)
DENSITY: 10.9 inhabitants/km²
BIGGEST CITIES AND POPULATION:
Ashgabat (1.0 million), Turkmenabad (0.2 million), Mary (0.12 million)
LANGUAGE: Turkmen 72 %, Russian 12 %, Uzbek 9 %, other 7 %
CLIMATE: Subtropical desert, hot summers (up to 48 °C), mild winters
ALTITUDE: –81 m (Vpadina Akchanaya) to 3,139 m (Gora Ayribaba))
RIVERS: Large river system of Amudarya and smaller systems of Murgab and Tejen rivers in the South
ECOSYSTEM AREAS: Arid (80 %), rest: river valleys, oasis and mountainous ecosystems; forest coverage less than 1 %
GDP – PER CAPITA (PPP): 6,500 USD (as of 2008)
INFLATION RATE: 13 % (as of 2008)
AGRICULTURAL PRODUCTS Cotton, grain, livestock
INDUSTRIES: Natural gas, oil, petroleum products, textiles, food processing
ELECTRICITY – PRODUCTION: 13,650 GWh (as of 2006)
ELECTRICITY – CONSUMPTION: Consumers 7,940 GWh, energy sector 2,460 GWh (as of 2006)
ELECTRICITY – TARIFFS: 0–0.3 US Cent/kWh
NATIONAL ELECTRICITY CAPACITY IN OPERATION:
3.3 GW (as of 2007)
ELECTRIFICATION RATE: 99.6 %
NATURAL RESOURCES: Natural gas, petroleum, sulphur, salt
OIL – PRODUCTION: 189,400 barrels/day (as of 2008)
OIL – EXPORT: 84,770 barrels/day (as of 2007)
OIL – CONSUMPTION: 112,000 barrels/day (as of 2006)
OIL – PROVEN RESERVES: 0.6 billion barrels (as of 2009)
NATURAL GAS – PRODUCTION: 70.5 billion m3/year (as of 2008)
NATURAL GAS – PROVEN RESERVES:
2,662 trillion m3 (as of 2009)
EXPORTS: 11.92 billion USD (as of 200)
EXPORTS: Gas, crude oil, petrochemicals, electricity, textiles, cotton fiber
EXPORTS – PARTNERS: Ukraine 51.7 %, Poland 10 %, Hungary 8.1 % (as of 2008)
EXPORTS – PARTNERS: 5.65 billion USD (as of 2008)
IMPORTS – COMMODITIES: Machinery and equipment, foodstuffs, chemicals
IMPORTS – PARTNERS: China 16.9 %, Russia 15.9 %, Turkey 14 %, UAE 10.3 %, Ukraine 7.9 %, Germany 5.6 %, Iran 5.1 % (as of 2008)
EXCHANGE RATE: 1 € = 7,780 Turkmen Manat (as of 2009)
Source: CIA, as of 2009, and IEA, as of 2006
5 IEA, AS OF 2006

Renewable Energies in Central Asia
TURKMENISTAN
COUNTRY INTRODUCTION 162
Transmission and Distribution SystemThe transmission and distribution of electric power is real-ized by electrical networks with a voltage of 0.4–500 kV. The total length of the electrical grid is over 54,000 km. Despite efforts in refurbishment, Turkmenistan’s distribution system still suffers from tremendous power loss due to ageing and inadequate maintenance.
Due to the potential of power export, international assistance funding in the early 2000s was offered from several sources to improve the efficiency of the power distribution grid in order to reduce the transmission costs of the exported pow-er. The primary beneficiaries of the power exports, Iran and Turkey, were at the forefront of the refurbishment funding. A 270 km power transmission line connecting Turkmenistan to northern Iran was completed in August 2002, allowing for Turkmen exports to Iran and Armenia as Armenia‘s and Iran‘s electricity grids are connected. Another 220 kilovolt trans-mission line to north-eastern Iran was completed in August 2004, and there are other grid expansion projects under way.
Turkmenistan withdrew form the Central Asian Pow-er Grid in 2003. There are, however, reports that it has recon-nected again, supplying Tajikistan with electricity during the winter months (which is only possible by transiting the grid of Uzbekistan).
PricesDuring the economically difficult years after gaining in-dependence, the politics of Turkmenistan were focusing on maintaining stability in the country. To lower the popula-tion’s burden, staple foods were subsidized and free-of-charge electricity, natural gas and water supplies introduced in 1993. According to the decree of the Peoples‘ Council of 14 August 2003, electricity, natural gas, water and salt will be subsidized for citizens up to 2030.
SHORT BUSINESS INFOThe electricity tariff for non-private consumers was increased by 10 % at the end of 2008 and stands currently at around 0.3 US Cent/kWh.
Electricity SectorElectricity is mainly produced in eight power plants with a total installed capacity of 3.3 GW, 99 % of which is from thermal power plants (see appendix 1). Turkmenistan has sufficient generating potential to power its own cities, unlike much of Central Asia. In 2006, Turkmenistan‘s power sec-tor generated 13,650 GWh while Turkmen consumers used 7,940 GWh and the energy sector itself 2,460 GWh, giving the country 3,247 GWh of surplus electricity. But owing to the country‘s inefficient power infrastructure from the Soviet era which needs to be repaired, power line losses wasted a sig-nificant portion of the electricity generated in 2006, resulting in exports of only 1,340 GWh6. The surplus increased in re-cent years as the transmission network has been partly mod-ernized and the sector‘s efficiency has been improved. Figure 3 below shows the domestic electricity consumption by sector.
SHORT BUSINESS INFOTurkmenistan has sufficient generating potential to power its own cities, resulting also in a surplus of electricity. But due to the country‘s inefficient power infrastructure, power line losses used to waste a significant portion of the generated electricity. Since 2006, the energy sector’s efficiency has been improving.
The energy and electricity market is largely operated by the Government. Abundant natural gas reserves have steered the Turkmen electricity sector towards using it as the primary generating fuel. Save for minute quantities of hydroelectric generation, natural gas turbine plants produce all of the coun-try’s electricity. Its ease of acquisition has driven large-scale increases in the overall generating capacity. As a result, Turk-menistan is a large net exporter of electricity.
A key feature of Turkmenistan’s energy sector is the low energy tariffs, which were introduced after gaining inde-pendence. The population receives natural gas and electricity free-of-charge, and other users who have to pay for energy consumption still enjoy the world’s lowest energy prices. Inef-ficient and wasteful use of energy is the result of that policy which severely undermines the competitiveness of RE tech-nologies.
6 IEA, AS OF 2006
FIGURE 2
Composition of Total Final Consumption
Source: IEA, as of 2006
Gas 56,1 %
Heat 2 %
Electricity 7 %
Petroleum Products 36 %
FIGURE 3
Electricity Consumption by Sector
Source: IEA, as of 2006
Industry 36 %
Other non specified 8,7 %
Residental 21 %
Transport 2,6 %
Agriculture/Forestry 31,8 %

Renewable Energies in Central Asia
TURKMENISTAN
COUNTRY INTRODUCTION 163
SHORT BUSINESS INFOThe population receives natural gas and electricity free-of-charge, and paying users still enjoy the world’s lowest energy prices. Inefficient and wasteful use of energy is the result of this policy, which still severely undermines the competitiveness of RE technologies.
Natural Resources
Oil and GasTurkmenistan is estimated to possess the world‘s fifth-largest natural gas reserves. Schmid & Langbein mention proven re-serves of up to 4,400 billion m3 of natural gas and additional possible reserves of 4,500 billion m3.7 Turkmenistan’s Gov-ernment has published even higher estimates of natural gas reserves with 25,000 billion m3 onshore and 5,000 billion m3 offshore reserves8. SHORT BUSINESS INFO:Turkmenistan is estimated to possess the world‘s fifth-largest natural gas reserves. That is the main reason why Turkmenistan’s demand for RE sources is practically inex-istent up to now.
The Turkmenistan Natural Gas Company (Türkmengaz), be-ing under the governance of the Ministry of Oil and Gas, con-trols gas extraction in the country. Domestic consumers have been receiving natural gas for free since 1993. Not surpris-ingly, Turkmenistan has had the fastest consumption growth in the region, averaging 16.1 % annually from 2000 to 2006, as compared with 6.3 %per year for the rest of Central Asia9.
While the Turkmen natural gas sector remains under control of the Government, the oil sector is open for foreign investors. Foreign companies, however, are only involved in about 5 % of the total oil production. Most of Turkmenistan‘s oil is still extracted by the State Company Türkmennebit from fields near the Caspian Sea. Following an initial euphoria, for-eign companies have started to pull out of the Turkmen mar-ket due to strong governmental control and structural difficul-ties. Proven oil reserves are estimated at 0.6 billion barrels10.
Oil production reached a peak of more than 15 mil-lion tons in 1974, as compared to 5.4 million tons in 1991. Today, some 10 million tons of oil are produced annually by Turkmennebit and five foreign oil companies operating under production sharing agreements. A large part of the oil pro-duced in Turkmenistan is refined in the Turkmenbashy and Seidi refineries.
Import and Export of EnergyTurkmenistan is fully self-sufficient in energy resources due to its large hydrocarbon reserves. Energy imports into the coun-try are negligible. SHORT BUSINESS INFO:Turkmenistan is fully self-sufficient in energy resources due to its large hydrocarbon reserves.
In 2006, more than 70 % of Turkmenistan’s primary energy production was exported, mainly in the form of natural gas. Major export countries are Ukraine and Iran. The natural gas export, however, is constrained by Turkmenistan’s continental location. The country is largely dependent on the pipelines of the Russian monopolist Gazprom. The construction of new pipelines is a politically sensitive issue and very expensive. Turkmenistan is, therefore, promoting alternative energy ex-ports, e. g. in the form of electricity.
Export of Turkmen electric power currently makes up over 10 % of the total production. Power export has annually increased by over 15 % in 2005–2007. The bulk of the elec-tricity exports go to Afghanistan, Iran, Turkey and Tajikistan. Once the ongoing grid extension projects are completed, Turkmenistan will be able to export nearly 2,400 GWh per year to Iran alone. The Iranian electricity company of Tavanir pays 2 US Cent/kWh for this power.
Growth Predictions for the Energy SectorThe Government of Turkmenistan has ambitious plans to in-crease the capacity of the power sector by building new ther-mal power plants and modernizing existing plants11. Foreign investors are invited to help realize these plants. SHORT BUSINESS INFO:The Government of Turkmenistan has ambitious plans to increase the capacity of the power sector by building new thermal power plants and modernizing existing plants. Foreign investors are invited to contribute to the realiza-tion of these plants.
A number of new gas turbine plants are under construction with the goal of increasing the installed capacity to 4,300 MW and the total production to 25,500 GWh by 2010, a substan-tial increase of current capabilities. It is planned that the total generation capacity shall further increase by 1,250 GWh per year.
While these investment projects aim to substantially increase the production capacity, domestic consumption is not projected to increase at anywhere near the same rate. As a result, when these projects are completed by 2010 and 2011, up to 40 % of electricity production will be exported for ex-ternal consumption.
7 SCHMID & LANGBEIN, AS OF 2004
8 TURKMENISTAN OIL, AS OF 2007
9 EIA, AS OF 2009
10 EIA, AS OF 2009
11 ACCORDING TO THE PROGRAM OF THE TURKMENISTAN MINISTRY OF POWER ENGI-
NEERING & INDUSTRY UP TO 2020, APPROVED BY THE TURKMENISTAN PRESIDENT
DECREE NO.8068 OF 22 AUGUST 2006

Renewable Energies in Central Asia
TURKMENISTAN
COUNTRY INTRODUCTION 164
4 POLICY FRAMEWORK FOR RENEWABLE ENERGIES
4.1 NATIONAL STRATEGIES AND PROGRAMS TO SUPPORT RENEWABLE ENERGIES TO SUPPORT RENEWABLE ENERGIES
After gaining independence, the Government of Turkmeni-stan was concerned with environmental issues and established a Ministry of Environmental Protection12. There exists, how-ever, no specific policy or program for the promotion of RE solutions so far. But the Government seems to have realized that the heavily subsidized provision of electricity and gas has resulted in a wasteful handling of valuable energy resources. This situation is reflected in the Law of Turkmenistan on En-ergy Saving, which is at the stage of preparation. This law de-claratively covers all the aspects of energy saving in both the energy production and consumption sector. The law defines the framework for governing the energy saving policies at na-tional level. High priority is also given to measures for reduc-ing Greenhouse Gas (GHG) emissions in the energy produc-tion and consumption. The implementation of such measures is intended to be entailed by the law. Ultimately, RE will also get more attention through the law. The following priority measures have been determined13:
Increase of fuel efficiency at power plants by means of modernization of combustion systems
Increase of natural gas share in the energy balance Increase of renewable sources in the energy balance Increase of energy efficiency in municipal services and in industry as well as modernization of heating systems
Implementation of measures on energy saving in the residential sector and industry
SHORT BUSINESS INFOThere exists no specific policy or program for the promo-tion of RE solutions so far. However, a Law on Energy Sav-ing in energy production and consumption is under devel-opment, which also pays attention to reduction measures for GHG emissions and partly also to RE solutions.
Other programs addressing aspects of climate change, conser-vation of nature and environmental protection are:
The national Basic Directions of Social and Economic Development of Turkmenistan for the Period until 2010 Program
The national Strategy of Economic, Political and Cultural Development of Turkmenistan for the Period until 2020
The National Environmental Action Plan (NEAP)
4.2 REGULATIONS, INCENTIVES AND LEGISLATIVE FRAMEWORK CONDITIONS
In October 2007, Turkmenistan enacted a revised Foreign In-vestment Law aimed at encouraging foreign investment. The law envisages quick issuing of multi-entry visa to foreign in-vestors and also waives a number of taxes and other fees for
foreign investment projects. Critics, however, say that the law would not mean much and that doing business in Turkmeni-stan still depends on personal agreements with the authorities. Furthermore, the types of enterprises a foreigner can operate with have not been specified14.
The petroleum sector is regulated through the Petro-leum Law of Turkmenistan of 1996. The law allows the is-suance of operation licenses for registered foreign persons or companies15.
In September 2008, a revised Law on Hydrocarbon Resources was approved. The revised law spells out fiscal and customs policies, defines benefits to be enjoyed by national and foreign investors and companies and reinforces their ecologic accountability for exploration of hydrocarbon resources. The law allows foreign investors to buy property in Turkmenistan. Under the law passed in 1992, foreign investors were only al-lowed to set up joint ventures with state-owned companies.
As already hinted at under section 4.1, RE may get more attention through the Law of Turkmenistan on Energy Saving which is at the stage of preparation at present. Due to the ab-sence of a specific program for the promotion of RE, there are neither any regulations regarding licensing nor other legal and regulatory issues related to RE in place. The Ministry of Econo-my and Finance is responsible for general licensing issues.
The rural electrification ratio of Turkmenistan is 99.6 %16. Thus, there is no specific legislation required for ru-ral electrification of the country. There are only a few remote islands in the Caspian Sea, which are not yet electrified. RE solutions would be the ideal option for the electrification of these places. SHORT BUSINESS INFOThere is no specific legislation required for rural elec-trification in Turkmenistan. There are only a few remote un-electrified islands in the Caspian Sea for which RE solutions would be the ideal electrification option.
Clean Development Mechanism (CDM)Turkmenistan ratified the fundamental UN conventions in the fields of environmental protection and conservation of nature, including the UN Framework Convention on Climate Change (UNFCCC) in 1995 and the Kyoto Protocol in 1998.
Like other Central Asian nations, Turkmenistan has a potential for large-scale Clean Development Mechanism (CDM) projects. This is specially the case in the field of natu-ral gas and oil exploration and transport as well as in the ther-mal power sector. However, if the CDM Executive Board does not simplify the baseline methodology acceptance procedure, it is unrealistic to expect that this potential will be realized.
Turkmenistan has established a Designated National Authorities (DNA) for the assessment of CDM projects at the Office of Climate Change within Ministry of Nature Protec-tion. Until October 2009, however, no CDM project has been registered17.
12 SEE ALSO THE MINISTRY’S WEBSITE AT WWW.NATUREPROTECTION.GOV.TM
13 SEE ALSO EBRD, AS OF 2009
14 SEE ALSO PRESS ARTICLE KOMMERSANT, AS OF 2007
15 PRESIDENT OF TURKMENISTAN, AS OF 1996
16 WORLD BANK, AS OF 2008
17 IGES, AS OF 2009

Renewable Energies in Central Asia
TURKMENISTAN
COUNTRY INTRODUCTION 165
5 POTENTIAL FOR RENEWABLE ENERGIES AND PRESENT USE
Apart from the Russian Federation, Turkmenistan has the largest proven gas reserves of any of the former Soviet repub-lics. That is the main reason why demand for RE sources was practically inexistent, yet. Nevertheless, Turkmenistan is in-terested in developing its abundant RE potential (wind and solar) and would like to explore the use of carbon financing for the implementation of projects in this area.
5.1 BIOENERGIES Turkmenistan has a very low potential for bioenergies (solid biomass, liquid, biogas) as alternative energy sources. Waste from livestock is used exclusively as fertilizer, and no infra-structure for utilizing waste fuels exists. Other forms of bio-mass, such as forest waste, are also minimal since forest cov-ers less than one percent of the country and the Government forbids deforestation18.
5.2 SOLAR ENERGYThe southern and southeastern part of Turkmenistan yields tremendous solar power opportunities. Three separate areas in three different regions receive comparably high amounts of sunlight: Gasan-Kuli, Ashkabat and Chardzhou. These regions receive the most usable sunlight of any Commonwealth of In-dependent States (CIS) territory19. There are nearly 300 clear days per year in the country where the average solar radiation amounts up to 2,000 kW/m2/year (see also appendix 2).
Despite having a high solar energy resource potential, Turkmenistan does not utilize solar power technologies. There are just a few experimentation centers where solar energy is used for food drying and water desalination purposes.
SHORT BUSINESS INFOThree separate areas in three different regions – Gasan-Kuli, Ashkabat, and Chardzhou – receive the most usable sunlight of any Commonwealth of Independent States (CIS) territory.
5.3 WIND POWERTurkmenistan has a very large wind power potential, which is estimated to equal the country’s fossil fuel potential. The long Caspian coastline and the large central desert area pro-vide strong and reliable winds, both in the 4–5 m/s category and in the 5–6 m/s category. Some areas near the coastal town of Turkmenbashi have reliable speeds even higher than 6 m/s. The theoretical wind energy potential is estimated at 500,000 MW of which 10,000 MW are technically feasible to be developed in the mid-term20.
The most promising areas for wind energy develop-ment are located in the Kara Bogaz Gol Bay coastal zone: the Krasnovodsk (Turkmenbashi) plateau, a strip of the Caspian Sea coast near the boundary to Iran, the region of the Kara Kum desert and headwaters of the Murghab river on the Kara Bil Hills near the Afghanistan border. A wind energy map is shown in appendix 3.
SHORT BUSINESS INFOThe most promising areas for wind energy development are located in the Kara Bogaz Gol Bay coastal zone.
5.4 GEOTHERMAL ENERGYTurkmenistan has a moderate potential of geothermal energy. If not for the exploratory ventures for oil and gas reserves, the geothermal water temperature would have not been explored in any way. Nevertheless, a modest potential for geothermal power, particularly in the Darvaza Region, the Caspian Coast Region, and the Kopet-Dag Foothills was uncovered. Tem-peratures ranging from 70–100 °C have been located, and if developed, could yield approximately 6,600 thermal MW of heat21. The geothermal potential remains untapped as of to-day.
5.5 HYDRO POWERThe Turkmen hydro power industry’s year of birth is consid-ered to be 1913, when the construction of Indigush Hydroe-lectric Power Plant was completed on the Murghab River with an installed capacity of 1.2 MW. Despite its age, the power plant is still operational and remains the only Hydro Power Plant (HPP) in the country.
The hydro power potential is estimated to be rather small in Turkmenistan. Amu Darya is the biggest river flow-ing through Turkmenistan. But due to the flatness of the country, it may be difficult to develop its potential. Other riv-ers (Tejen and Atrek) are not attractive due to unpromising water resources.
The most remarkable small hydro power potentials are concentrated in the southern part of the Republic on the Mur-gab and Tejen rivers and Karakum Canal.
18 WORLD ENERGY COUNCIL, AS OF 2007
19 WORLD ENERGY COUNCIL, AS OF 2007
20 WORLD ENERGY COUNCIL, 2007
21 WORLD ENERGY COUNCIL, 2007
Baku 30,400 tons 42.8 million m3
Ganja 5,100 tons 7.2 million m3
Sumqayit 4,900 tons 6.9 million m3
Mingachevir 1,600 tons 2.3 million m3
Shirvan 1,200 tons 1.7 million m3
Nakhchivan 1,200 tons 1.7 million m3
TABLE 4
Annual Solar Irradiation
Source: EBRD, as of 2009

Renewable Energies in Central Asia
TURKMENISTAN
COUNTRY INTRODUCTION 166
6 MARKET RISKS AND BARRIERS FOR MARKET ENTRY
A continuing Soviet-style economy and widespread corruption diminish equality of opportunity, although some changes are taking place. The new constitution establishes the right to have private property, but it remains unclear how this can be imple-mented.
Freedom of speech and freedom of the press are severely restricted by the Government, which controls all broadcast and print media. The Government also places significant restric-tions on academic freedom, and the Ruhnama22 is still used throughout the school system. Reforms in 2007 undid some of the damage Niyazov had inflicted on education, but the con-certed effort needed to really change the situation has not yet been made. The constitution guarantees peaceful assembly and association, but these rights are severely restricted in practice. While not technically illegal, non-governmental organizations are tightly controlled, and Turkmenistan has no civil society sector to speak of.
Turkmenistan’s regulations do not exclude foreigners from doing business in the country. Without personal relations to government officials, however, it can be hard and cumber-some.
6.1 GENERAL SITUATION
CorruptionCorruption is widespread and officials are often obliged to bribe their way into their positions. Turkmenistan was ranked 166 out of 180 countries surveyed in Transparency Interna-tional’s 2008 Corruption Perceptions Index23.
Turkmenistan is a smuggling corridor for drugs from neighboring Afghanistan, with reports from the Niyazov era suggesting the involvement of high-level officials in the nar-cotics trade as well as a growing problem of drug addiction within Turkmenistan.
The judicial system is subservient to the President, who appoints and removes judges without legislative review. The authorities frequently deny rights of due process, includ-ing public trials and access to defense attorneys. The new constitution bars judges and prosecutors from membership in political parties.
Availability of Local Know-howThere are only three domestic organizations known to be in-volved in RE technology development24, most notably the Sun Scientific Production Association affiliated with the Supreme Council for Science and Technology under the President of Turkmenistan. The organization carries out research on the use of RE sources and is responsible for virtually all experi-mental projects implemented in the country so far. Projects include wind power, solar drying technology for farms, in-tegrated wind and solar power complexes both for generat-ing electricity and pumping water, the development of solar “photaic” bioreactors for breeding microscopic algae and solar furnaces for high-temperature studies.
Further know-how is located at the state ministries and state-owned companies.
Local AcceptanceThere is no information available regarding the acceptance of RE technologies in Turkmenistan. It is reported, however, that people living in the tiny 0.4 % of the country which are not electrified yet would very much welcome RE solutions as a source of electricity and for other purposes.
6.2 BUSINESS DEVELOPMENTThe Government controls most of the economy and restricts foreign participation in some sectors. The Government chooses its investment partners selectively, and personal contact with high political officials is the best guarantee for approval. Other investors – foreign and domestic alike – face significant dis-crimination. The bureaucracy is non-transparent and politi-cized, and bureaucratic procedures are confusing and cumber-some. Inconsistent rule of law and high levels of corruption are strong disincentives to investment. Foreign exchange accounts require the Government’s approval as do all payments and transfers. Capital transactions face restrictions and Central Bank approval in some cases. All land is owned by the state.
The overall freedom to conduct a business is very lim-ited by Turkmenistan‘s regulatory environment. The system is non-transparent, enforcement is inconsistent and businesses have difficulties in getting copies of laws and regulations. Per-sonal relations with Government officials often help to deter-mine how and when regulations are applied.
SHORT BUSINESS INFOThe overall freedom to conduct a business is very limited by Turkmenistan‘s regulatory environment.
6.3 INTELLECTUAL PROPERTY RIGHTSThe legal system does not deal with contracts and property rights effectively. Laws are poorly developed and judicial em-ployees and judges are poorly trained and open to bribery. Laws designed to protect intellectual property rights are im-plemented arbitrarily or not at all. Pirated copies of copyright-ed and trademarked materials like videos, cassette tapes and literature are widely available.
6.4 TAXATIONTurkmenistan has low tax rates. In the past year, overall tax revenues as a percentage of GDP equaled 20.2 percent. The top Income Tax rate is 10 %, and the top Corporate Tax rate is 25 %25. Foreign companies, their branches or representa-tive offices and foreign individuals doing business in Turk-menistan must pay a Value Added Tax (VAT) of 20 %. Tax administration is weak and widespread exemptions for state enterprises reduce the Government’s revenue.
22 RUHNAMA IS A BOOK WRITTEN BY SAPARMURAT NIYAZOV, LATE PRESIDENT FOR LIFE
OF TURKMENISTAN, COMBINING SPIRITUAL/MORAL GUIDANCE, AUTOBIOGRAPHY AND REVI-
SIONIST HISTORY, MUCH OF IT OF DUBIOUS OR DISPUTED FACTUALITY AND ACCURACY.
23 SEE TI, AS OF 2008
24 SEE CONTACT INFORMATION IN CHAPTER

167
6.5 IMPORT/EXPORTTurkmenistan‘s weighted average tariff rate was 2.9 % in 2002. Import and export bans and restrictions, some prohibi-tive duty rates for agricultural and food products, high import taxes and fees, services market access restrictions, cumber-some import and export registration requirements, subsidies and customs procedures that are bureaucratic, slow and sub-ject to corruption add to the cost of trade.
NAME OF ORGANIZATION ADDRESS AND CONTACT CONTACT PERSON
Ministry of Nature Protection of Turkmenistan
Ashgabat, Kemine Str., 102 +(99 312) 35 43 17/39 31 84
Ministry of Power Engineering and Industry of Turkmenistan
Ashgabat, 2022 Str., 55 +(99 312) 37 92 59/37 93 77
Ministry of Economy and Finances Ashgabat, N. Pomma Str., 4 +(99 312) 51 05 03/51 05 63
Ministry of Oil and Gas Industry and Mineral Resources
Ashgabat, Archabil Ave., 23 +(99 312) 40 30 48/40 31 37
State Power Corporation – Turkmenenergo
Ashgabat, 2022 Str., 55 +(99 312) 37 93 51/ 37 93 77
State Concern of Oil – Turkmennebit
745100 Balkanabat Sity, 148 Kvartal +(99 300222) 49 584
State Concern of Gas – Turkmengas
Ashgabat, Mollanepes Str., 1 +(99 312) 40 32 01/ 40 32 60
State Commodity and Raw Materials Exchange
Ashgabat, Mahtumkuli Ave., 111 +(99 312) 35 43 21
State Tax Inspection Ashgabat, Pushkin Str., 11 +(99 312) 35 43 55
State Custom House Ashgabat, S. Muradova Str.,7 +(99 312) 27 33 36/27 32 25
High Council for Science and Technique under the President of Turkmenistan
Ashgabat, Bitarap Turkmenistan,15 +(99 312) 35 38 42
National Institute of Deserts, Flora and Fauna
Ashgabat, Bitarap Turkmenistan,15 +(99 312) 39 54 27/39 20 39
National Institute of State Statistics and Information of Turkmenmilli-hasabat
Ashgabat, Mahtumkuli Ave., 72 +(99 312) 39 42 65/39 47 08
Institute of Oil and Gas Ashgabat, Archabil Ave., 23 +(99 312) 40 30 48
Turkmen State University Ashgabat, Turkmenbashy Ave., 33 +(99 312) 35 44 55
Turkmen Polytechnic Institute Ashgabat, 1916 Str., 136 +(99 312) 41 18 02
Turkmen State Institute of Energy Mary, Bayram Han Str., 62 +(99 522) 6 04 12/3 12 52, 3 90 18
Renewable Energies in Central Asia
TURKMENISTAN
COUNTRY INTRODUCTION
7 RENEWABLE ENERGY BUSINESS INFORMATION AND CONTACTS
The following organizations may to some extent provide in-formation regarding the investments in the energy sector of Turkmenistan.
25 BISNIS, AS OF 1998

Renewable Energies in Central Asia
TURKMENISTAN
168
In Turkmenistan, there are three organizations engaged in the field of RE. Their projects are mainly dependent on donor support.
Sun Scientific Production Association General Director: Dr. M. A. Rakhmanov60, Bekrova Str.AshgabatTurkmenistan Phone: +(993 12) 370348E-Mail: [email protected]
Governmental organization involved in scientific research and development of pilot projects in the field of Renewable Energy technology
Tebigy Kuwwat /Natural EnergyChairman: Dr. Pr. N. P.KorpeyevInstitute of Deserts15, Bitarap Turkmenistan Str.Ashgabat 744000Turkmenistan Phone/Fax: +(993 12) 398584E-Mail: [email protected]@mail.ru
Non-governmental organization involved in RE develop-ment, CDM and projects in the field of environmental protection
Economic Entity – ADVISGeneral Director: A. GladishyevPO Box 157Ashgabat-11, 744011Turkmenistan Phone: +(993 12) 432092Fax: +(993 12 350481E-Mail: [email protected]
Private sector company involved in projects on automation, communication, computer, network technologies, contract deliveries of equipment & materials, construction projects
COUNTRY INTRODUCTION

Renewable Energies in Central Asia
TURKMENISTAN
169
8 BIBLIOGRAPHY
AllBusiness (2004): Turkmenistan – The Power Sector, APS Review Downstream Trends (www.allbusiness.com/mining/oil-gas-extraction-crude- petroleum-natural/220274-1.html)
Central Intelligence Agency – CIA (2009): The World Fact Book – Uzbekistan
Business Information Service for the Newly Independ-ent States – BISNIS (1998): Turkmenistan’s Tax System (http://permanent.access.gpo.gov/lps3997/9806turk.htm)
European Bank for Reconstruction and Development – EBRD (2009): Renewable Development Imitative. Turk-menistan, Country Profile 2009 (http://ebrdrenewables.com/sites/renew/countries/turkmenistan/profile.aspx)
Energy Information Administrations – EIA, U.S. Dept. of Energy (2009): International Energy Outlook 2009 (www.eia.doe.gov)
Freedom House (2009): Freedom in the World, Country Report on Turkmenistan
Heritage Foundation (2009): Index of Economic Freedom – Uzbekistan
International Energy Agency – IEA (2006): Electricity/Heat in Uzbekistan in 2006
Institute for Global Environmental Strategies – IGES (2009): CDM Project Database (www.iges.or.jp/en/cdm/report_cdm.html)
International Crisis Group (2006): Uzbekistan – In for the Long Haul
Kakharo, Jahangir (2008): Uzbekistan Power Generation Sector Overview, U.S. & Foreign Commercial Service and U.S. Department Of State
King S. A., Khalturin, V. I., Tucker E. (1996): Seismic Hazard and Building Vulnerability in Post-Soviet Central Asian Republics
Kommersant (2007): Turkmenistan Passes New Foreign Investment Law (www.kommersant.com/p814971/eco-nomic_legislation)
LakeNet (2009): Lake Profile Aral Sea (www.worldlakes.org/lakedetails.asp?lakeid=9219)
President of Turkmenistan (1996): Petroleum Law of Turkmenistan (http://turkmeniya.tripod.com/ turkmenistanlaws/id6.html)
Publications International (2009): 12 of the Most Destructive Earthquakes
Schmid, H., Langbein, J. (2004): Turkmenistan – Nation Building and Economic Development since Independence
Toderich, K., Massino, I., Shoab, I., et al. (2008): Uti-lization of Agriculture Residues and Livestock Waste in Uzbekistan, IDEAS
Transparency International (2008): Corruption Percep-tions Index (www.transparency.de/Corruption-Percep-tions-Index-2.1234.0.html)
Turkmen Government (2009): Turkmenistan, The Golden Age (www.turkmenistan.gov.tm)
Turkmenistan Oil (2007): Investor‘s Guide to Oil and Gas of Turkmenistan (http://turkmenistanoil.tripod.com)
World Bank (2008): The Welfare Impact of Rural Electrifi-cation: A Reassessment of the Costs and Benefits – an IEG Impact Evaluation
World Energy Council (2007): Electricity in Central Asia, Market and Investment Opportunity Report
3TIER Inc. (2009): Renewable Energy + Information Services (www.3tier.com/en/)
Ministry of Environmental Protection (without year): Various publications (www.natureprotection.gov.tm)
REFERENCES

Renewable Energies in Central Asia
TURKMENISTAN
170ANNEX
9 ANNEX
Source: data compiled by the author from different sources, as of 2007
GENERATION FACILITY INSTALLED CAPACITY (MW) COMMISSIONING DATE
Mary TPP 1,685.0 1973
Turkmenbashy TPP 540.0 1965
Abadan TPP 321.0 1962
Ashkhabad TPP 254.2 2006
Dashoguz TPP 254.2 2007
Balkanabat TPP 126.0 1979
Seidi TPP 160.0 1992
Gindukush HPP 1.2 1913
Total 3,341.6
TABLE 5
Installed Capacity in Operational Power Plants
Source: NASA/EBRD, as of 2009
FIGURE 4
Turkmenistan Solar Global Horizontal Irradiance
Source: 3TIER Inc., as of 2009
FIGURE 5
Wind Map of Turkmenistan

Renewable Energies in Central Asia 171
COUNTRY CHAPTER:
REPUBLIC OF UZBEKISTANAuthors and Coordination of Country ChapterDr. Ing. Klaus JordeEntec Consulting & Engineering AGSt. Gallen, Switzerlandwww.entec.ch
Axel Biegert (Dipl. Economist & Pol.) INTEGRATION UMWelt & Energie GmbHGraefenberg, Germany www.integration.org
Editor Deutsche Gesellschaft für Technische Zusammenarbeit (GTZ) GmbHDepartment Water, Energy, TransportDag-Hammarskjöld-Weg 1-565760 Eschborn, Germanywww.gtz.de
On behalf of Federal Ministry for Economic Cooperation and Development (BMZ)
Editorial staffDiana KraftTel: +49 (0)6196 79 4101Fax: +49 (0)6196 79 80 4101Email: [email protected]

Renewable Energies in Central Asia 172CONTENTS
ACRONYMS, ABBREVIATIONS AND MEASUREMENTS 173
1 SUMMARY 175
2 COUNTRY INTRODUCTION 176 2.1 Geography and Climatic Conditions 176 2.2 Political and Economic Environment 176
3 ENERGY MARKET IN THE REPUBLIC OF UZBEKISTAN 178 3.1 Important Players of the Uzbek Energy Market 178 3.2 Primary Energy Consumption, Transmission and Prices 178
4 POLICY FRAMEWORK FOR RENEWABLE ENERGIES 180 4.1 National Strategies and Programs to support Renewable Energies 180 4.2 Regulations, Incentives and Legislative Framework Conditions 181
5 POTENTIAL FOR RENEWABLE ENERGIES AND PRESENT USE 182 5.1 Bioenergies 182 5.2 Solar Energy 182 5.3 Wind Power 183 5.4 Geothermal Energy 183 5.5 Hydro Power 183
6 MARKET RISK ANALYSIS AND BARRIERS FOR MARKET ENTRY 184 6.1 General Situation 184 6.2 Business Development 184 6.3 Intellectual Property Rights 185 6.4 Taxation 185
7 RENEWABLE ENERGY BUSINESS INFORMATION AND CONTACTS 185
8 BIBLIOGRAPHY 188
9 ANNEX 189
CONTENTS
UZBEKISTAN

Renewable Energies in Central Asia
UZBEKISTAN
173
ACRONYMS AND ABBREVIATIONS REPUBLIC OF TAJIKISTAN
ADB Asian Development Bank
CAR Central Asian Region
CAPS Central Asian Power System
CCA Common Country Assessment
CDM Clean Development Mechanism
CHP Combined Heat and Power Plant
CIS Commonwealth of Independent States
CO² Carbon Dioxide
GDP Gross Domestic Product
GEF Global Environmental Facility
DDP Distribution Demonstration Project
EBRD European Bank for Reconstruction and Development
EPC JSC Electric Power Plants (GenCo)
FSU Former Soviet Union
GHG Greenhouse Gas Emissions
HDR Hot Dry Rock
HPP Hydro Power Plant
HV High Voltage
HVL High Voltage Lines
HVN High Voltage Network
IBRD International Bank for Reconstruction and Development
ICWC Interstate Commission for Water Coordination
IDA International Development Association
JSC Joint Stock Company
KNG JSC KyrgyzNefteGas (Oil and Gas)
KPC Kyrgyz Petroleum Company
MB&C Metering, Billing and Collection
MDG Millennium Development Goals
NEG National Electric Grid
O&M Operation and Maintenance
PCCAR Power Council of Central Asia Republics
PPP Purchasing Power Parity
PREGA Promotion of Renewable Energy, Energy Efficiency and Greenhouse Gas Abatement
SJSC State Joint Stock Company
TPP Thermal Power Plants
UDC Unified Dispatch Center
UNDP United Nations Development Program
UNDAF United Nations Development Assistance Framework
UNFCCC UN Framework Convention on Climate Change
UPSCAR United Power System of Central Asia Republics
USD US Dollar
VAT Value Added Tax
WB World Bank
WPI Wind Power Installations
ACRONYMS, ABBREVIATIONS AND MEASUREMENTS

Renewable Energies in Central Asia
UZBEKISTAN
ACRONYMS, ABBREVIATIONS AND MEASUREMENTS 174
MEASUREMENTS
°C degree Celsius
GW gigawatt
GWh gigawatt hour (1 GWh = 1,000,000 kWh)
kJ kilojoule (1 kJ = 1,000 Joules)
km² square meter
ktoe kilotons of oil equivalent (1ktoe = 11,630,000 kWh)
kV kilovolt (1kV = 1,000 V)
kWh kilowatt hour
m meter
m³ cubic meter
mm millimeter
MW megawatt (1 MW = 1,000 kW)
t.c.f. trillion cubic feet
TWh terawatt hour (1 TWh = 1,000,000,000 kWh)

175
1 SUMMARY
The Republic of Uzbekistan is one of the few countries, which are fully self-sufficient in energy resources. Substantial reserves of conventional energy sources ensure the country’s current energy independence and also allow for energy exports. Due to this rich endowment with energy, the development of Re-newable Energy (RE) does not enjoy high priority on the Gov-ernment’s agenda with the exception of hydro power. Still, a growing interest in the development of RE sources can be observed. There are plans to further develop the power indus-try by building small-scale Hydro Power Plants as well as to develop the vast solar power potential of the country. Below, please find an overview of the technically feasible potentials of RE in Uzbekistan1:
Besides small hydro power, which is already developed by approximately 30 %, the other potentials remain virtually untapped and open a large field for a possible development of new RE solutions. Climatic conditions of Uzbekistan are especially favorable for utilizing solar energy.
The reasons for the marginal utilization of RE sources is seen in the relatively high start-up costs, the low gas and electricity prices and the neglect of existing regulations to promote RE, which have not yet been translated into a favo-rable feed-in tariff for RE installations. One of the greatest challenges Uzbekistan faces in restructuring the power sec-tor is the problem of cross-subsidies and direct governmental subsidies.
The difficult business environment does not encour-age investments in RE projects. Extensive state controls over the economy continue to hinder the functioning of markets and the development of the private sector. Corruption perme-ates the society and grows more rampant over time. The eco-nomic policies have discouraged foreign investment, which is the lowest per capita in the Commonwealth of Independent States (CIS).
SUMMARY
1 LARGE HYDRO POWER IS NOT SHOWN IN THE TABLE AS ITS POTENTIAL IS ALREADY
80 % DEVELOPED.
Renewable Energies in Central Asia
UZBEKISTAN
SOURCE TECHNICALLY FEASIBLE POTENTIAL
Solar energy 2,000,000 GWh
Bioethanol form cotton stalks 2,000 GWh
Small Hydro Power 8,000 GWh
Thermal water 2,000 GWh
Wind energy 800 GWh
Biogas 55 GWh
Total energy consumption 423,762 GWh
Source: Data compiled by the author from different sources, data as of 2006
TABLE 1
Renewable Energy Resources in Uzbekistan

Renewable Energies in Central Asia
UZBEKISTAN
COUNTRY INTRODUCTION 176
2 COUNTRY INTRODUCTION
2.1 GEOGRAPHY AND CLIMATIC CONDITIONSThe Republic of Uzbekistan is located in the very heart of Central Asia, between the rivers Amu Darya and Syr Darya. It shares borders with Kazakhstan to the North and to the NorthEast, to the East and to the South East with Kyrgyzstan, to the West and to the South West with Turkmenistan and to the South with Afghanistan. The physical environment of Uzbekistan is diverse, ranging from the flat desert topography comprising almost 80 % of the country‘s territory to moun-tain peaks in the East reaching 4,500 m above sea level. The country has an area of 447,000 km2 with a population of 27.6 million inhabitants, of which 63 % live in rural areas and 37 % in cities2. According to official statistics, Uzbeks form the majority of the population with 80 %. Other sources es-timate that the majority are in fact Tajiks constituting 50 % followed by Uzbeks with 31 %3. Other ethnic groups include Russians, Kazakhs, Karakalpaks, Tatars and Turkmens.Uzbekistan is divided into 14 administrative units compris-ing 12 regions, the Republic of Karakalpakstan and Tashkent city, which is not a part of the Tashkent region.
The climate of Uzbekistan is mainly continental with average summer temperatures of 28 °C in the North and 32 °C in the South of the country and moderate winter temperatures of –6 °C in the North to +2 °C in the South respectively. Oc-casionally, summer peak temperatures can reach 50 °C, but, due to low moisture, such temperature is tolerant. About 250 days of the year are sunny days. The total annual precipitation varies from 80 to 200 mm in the plain, from 300 to 400 mm in foothills and to 600 to 900 mm in the mountains.
The two most important feeder rivers of the Aral Sea flow partly through Uzbekistan, namely the Amu Darya river and the Syr Daria river.
2.2 POLITICAL AND ECONOMIC ENVIRONMENTUzbekistan was incorporated into the Russian Empire in the 19th century and later became a constituent republic of the Soviet Union. It has been an independent republic since De-cember 1991.
Since gaining independence, the Government of Uzbekistan has been implementing its energy policy as part of its social-economic policy, focusing it on maintaining Uzbekistan’s energy security and using energy resources to achieve further social aims.
Oil and natural gas are very important for the indus-try of Uzbekistan as they have a 97 % share of the country’s energy balance. Uzbekistan has the second largest oil reserves in Central Asia after Kazakhstan and the third largest reserves of natural gas after Turkmenistan and Kazakhstan. There are also considerable brown coal deposits at the head of the An-gren Valley, in the South East of Tashkent.
There are eighteen large hydroelectric stations on the Syr Darya, Chirchiq and Naryn rivers, which largely depend on Kyrgyzstan and Tajikistan for their power.
Currently, Uzbekistan is the largest electricity pro-ducer among the Central Asian republics and a net exporter of electricity. About 50 % of the power generating capacity of the United Central Asia Power System is located in Uz-bekistan. This power grid also incorporates the power systems of Tajikistan, Kyrgyzstan and southern Kazakhstan. The Gov-ernment gives high priority to the energy sector. Strategic ob-jectives include:
Achievement of fuel independence by increasing petroleum and natural gas condensate output
Creation of a reliable raw material base for the energy sec-tor, including the use of RE resources
Maximization of the public’s access to natural and lique-fied gas, electricity and modern fuels
Promotion of the financial stability of investments and at-traction of more investments in the energy sector
Development of the energy sector’s legal framework and improvement of its financial-taxation system, taking into account the peculiarities of price formation and interaction of the energy sector with closely allied sectors
Use of energy resources in a more efficient way Promotion of competition in the energy sector by con-sistently establishing entities and constantly building a genuine market economy infrastructure
Uzbekistan‘s economy relies mainly on commodity produc-tion and natural gas. It is the sixth largest exporter of cotton in the world, has the fourth largest reserves of gold and signifi-cant reserves of uranium, copper and other non-ferrous and rare earth metals. Uzbekistan has an abundance of natural gas, used both for domestic consumption and export. Ineffi-ciency in energy use is generally high because the low control-led prices do not stimulate consumers to save energy.
Manufacture of agricultural production in Uzbekistan essentially depends on irrigation. Today’s irrigated agricultur-al ground occupies 4.2 million hectares and provides more than 95 % of all agricultural production. 54 large-scale wa-ter reservoirs with a total volume of 20,840.95 million m³,
1 CIA, AS OF 2009
2 FOR A VARIETY OF REASONS THE DESIGNERS OF THE SOVIET NATIONAL DELIMITA-
TION IN CENTRAL ASIA DISCRIMINATED AGAINST THE TAJIKS. THEY WERE ASSUMED
TO HAVE DEPRIVED THE NEWLY FORMED REPUBLIC OF TAJIKISTAN OF THE TWO MOST
IMPORTANT CENTERS OF TAJIK URBAN CULTURE, I. E. BUKHARA AND SAMARKAND, AS
WELL AS OF THE REGIONS OF FERGANA, SURHANDARYA AND KHWRAZM WHICH WERE
AWARDED TO UZBEKISTAN. THE MAJORITY OF TAJIKS LIVING IN UZBEKISTAN WERE
FORCED TO BE REGISTERED AS UZBEKS (LIBRARY OF CONGRESS COUNTRY STUDIES,
AS OF 1996).
FIGURE 1
Map of Uzbekistan
Qarshi
Navoly
Samarqand
Jizzax
Urganch
Nukus
AndijonNamangan
Fargona
CaspianSea
Amu Darya
K A Z A K H S T A N
T A J I K I S T A NT U R M K M E N I S T A N
I R A N
K Y R G Y Z S T A N
A F G H A N I S T A N
Aral Sea
Buxoro
TASHKENT

Renewable Energies in Central Asia
UZBEKISTAN
COUNTRY INTRODUCTION 177
60 supply channels with total length of 24.300 km and a ca-pacity of 900 m³/sec and 35 big electrical stations operate for irrigating the land.
Uzbekistan is Central Asia‘s most populous country. Its 27.6 million people (as of 2009) provide nearly half of the region‘s total population. With an average age of 24 years, the country has a huge labor potential. Despite a generally good education system and a large number of highly educated spe-cialists, about 45 % of the population live on less than 1.25 USD per day. Uzbekistan ranks 170 of 209 countries by Gross Domestic Product (GDP) per capita in PPP equivalents total-
4 CIA, AS OF 2009
5 AMNESTY INTERNATIONAL, AS OF 2009
ing 2,600 USD per capita/year (as of 2008). Real GDP growth remained at high levels from 7 to 9 % in recent years4.
Facing a multitude of economic challenges after gain-ing independence, the Government adopted an evolutionary reform strategy with emphasis on state control, reduction of imports and self-sufficiency in energy. Despite the declared objective of transition to a market economy, Uzbekistan con-tinues to maintain rigid economic control, which often re-pels foreign investors. Uzbekistan‘s domestic policy of human rights and individual freedoms are often criticized by interna-tional organizations5.
LAND AREA: 447,400 km²
POPULATION: 27.6 million (as of 2009)
DENSITY: 61.4 inhabitants/km²
BIGGEST CITIES AND INHABITANTS:
Tashkent (2.18 million), Samarkand (0.6 million), Namangan (0.42 million)
LANGUAGE: Uzbek (language for inter-ethnic communication is Russian)
CLIMATE: Mostly mid-latitude desert, long, hot summers (28 to 32 °C), mild winters (–6 to +2 °C); semiarid grassland in the East
TEMPERATURES: The average annual air temperature in the foothills and valleys varies from +6° to +17 °C and is close to 0 °C in the high mountains of the Pamirs. The absolute minimum was registered in the Bulunkul in the Eastern Pamirs (–63 °C) and the absolute maximum of +48 °C in the Shaartuz in the southern Khatlon Region. In southern valleys, the average temperature in the hottest month of July is +31 °C. The rugged relief with large amplitudes of high mountains accounts for the diversity of the climates and temperatures.
ALTITUDE: 30 m (Aral Sea) to 4,643 m (Khazret Sultan)
RIVERS: Two large river systems (Amudarya and Syrdarya) and 600 small rivers
ECOSYSTEM AREAS: Shrubland, savannah, grassland (47 %), cropland and crop/natural vegetation mosaic (27 %), urban and built-up areas (0.5 %), sparse or barren vegetation, snow and ice (18 %), wetland and water bodies (7.5 %), no forests
GDP – PER CAPITA (PPP): 2,600 USD (as of 2008)
INFLATION RATE: 14 % (as of 2008)
AGRICULTURE – PRODUCTS: Cotton, ambary, jute, tobacco, wheat, rice, sheep
INDUSTRIES: Cotton cleaning, machine building, textile, gas, precious metals, electronics, instrument manufacturing, aviation, oil processing, car manufacturing, agricultural processing
ELECTRICITY – PRODUCTION: 46.33 billion kWh (as of 2007)
ELECTRICITY – CONSUMPTION: 41.94 billion kWh (as of 2007)
ELECTRICITY – TARIFFS: 3.5 US Cent/kWh
NATIONAL ELECTRICITY CAPACITY IN OPERATION:
12.6 GW (as of 2007)
NATURAL RESOURCES: Natural gas, petroleum, coal, gold, uranium, silver, copper, lead and zinc, tungsten, molybdenum
OIL – PRODUCTION: 83,820 barrels/day (as of 2008)
OIL – EXPORT: 6,104 barrels/day (as of 2007)
OIL – CONSUMPTION: 148,000 barrels/day (as of 2008)
OIL – PROVEN RESERVES: 0.6 billion barrels
NATURAL GAS – PRODUCTION: 2,303 billion cubic feet/year (65.2 billion m3/y) (as of 2007)
NATURAL GAS – PROVEN RESERVES:
65,014 billion cubic feet (1,841 billion m3)
EXPORTS: 0.37 billion USD (as of 2008)
EXPORTS – COMMODITIES: Exports – commodities: Cotton, gold, energy products, mineral fertilizers, ferrous and non-ferrous metals, textiles, food products, machinery, cars
EXPORTS – PARTNERS: Russia (25.3 %), Turkey (9.7 %), Kazakhstan (7.6 %), Bangladesh (6.5 %), China (6.1 %), Ukraine (6 %), Japan (5.3 %), US (4.9 %), Tajikistan (4.1 %) (as of 2008)
IMPORTS: 7.07 billion USD (as of 2008)
IMPORTS – COMMODITIES: Machinery and equipment, food, chemicals, ferrous and non-ferrous metals
IMPORTS – PARTNERS: Russia (27.6 %), China (16.3 %), South Korea (11.5 %), Germany (6.1 %), Kazakhstan (5.4 %), Turkey (4.5 %), US (4 %) (2008)
EXCHANGE RATE: 1 € = 2,250 Uzbekistan Som (2009)
Source: CIA World Fact Book, as of 2009, and International Energy Agency, as of 2006

Renewable Energies in Central Asia
UZBEKISTAN
COUNTRY INTRODUCTION 178
3 ENERGY MARKET IN THE REPUBLIC OF UZBEKISTAN
3.1 IMPORTANT PLAYERS OF THE UZBEK ENERGY MARKET
The governmental company of Uzbekneftegas holds almost the entire hydrocarbon production in Uzbekistan, 99.6 % of gas, 100 % of oil, and 99.7 % of condensate (as of 2006). The company was established in 1992 in form of a national corpo-ration. Since 1998, the Company has been operating as the National Holding Company of Uzbekneftegas. This major industrial facility controls the entire national oil and gas busi-ness. Its subsidiaries conduct geological exploration, oil and gas production, hydrocarbon processing, transportation and export through its own pipeline systems.
As mentioned above, the dominant player in the elec-tricity sector is Uzbekenergo.
3.2 PRIMARY ENERGY CONSUMPTION, TRANSMISSION AND PRICES
Uzbekistan is one of the few countries fully self-sufficient in energy resources. Substantial reserves of conventional energy sources ensure the country’s current energy independence at the same time allowing for exports of energy carriers.
In 2006, the total primary energy supply in the Re-public of Uzbekistan was 48,454 ktoe (563,520 GWh) ex-cluding exports of primary energy which totaled 11,579 ktoe (134,663 GWh). The total final consumption was 36,437 ktoe (423,762 GWh).
The need for sustainable economic growth and grow-ing international competition is the reason for the definition of new requirements concerning the development of the coun-try’s fuel and energy complex. The attraction of investments and new technologies into the oil, gas and electric power sec-tors is the primary goal of the sector development for the me-dium-term outlook.
Uzbekistan is a partner country of the EU INOGATE energy program, which has four key topics: enhancing energy security, convergence of member state energy markets on the basis of EU-internal energy market principles, supporting sustainable energy development and attracting investment for energy projects of common and regional interest.
Source: IEA, as of 2006
FIGURE 2
Total Primary Energy Supply
Coal and Peet 2 %
Crude Oil 11 %
Hydro 1 %
Gas 86 %
FIGURE 3
Total Final Consumption
Heat 7 %
Coal and Peat 1 %
Electricity 10 %
Gas 72 %
Petroleum Products 10 %
Crude Oil 0,2 %
Transmission and Distribution SystemThe Uzbek power system is located in the central part of the United Central Asian Power System (CAPS), which includes the power systems of Kazakhstan, Kyrgyzstan and Tajikistan (the Turkmen system that has previously worked with the CAPS is now working with the Iranian Power System). As noted above, Uzbekistan accounts for over 50 % of the elec-tricity generated within the system. The power system is con-nected to the infrastructure of the neighboring countries, mostly by 500 kV and 220 kV lines.
The transmission and distribution of electric power to the consumers in Uzbekistan is realized by electrical networks with voltage of 0.4–500 kV. The total length of the electri-cal grid is over 236,000 km. Appendix 2 shows Uzbekistan’s main 220–500 kV electricity grids with possible extensions until 2010.
Electrical power supply to rural areas is not reliable and of low quality. There are often power blackouts lasting for several hours. The capacity of existing distribution networks in the 0,4–10,0 kV range including rural transformers are not suitable for the current electricity demand and need to be up-graded and modernized.
Reconstruction and further development of the power transmission networks is one of the most important directives of the energy sector improvement plans. Its implementation would reduce Uzbekistan’s dependence on energy systems of neighboring countries and increase the efficiency, reliability and flexibility of the electric energy transmission networks.
Uzbekistan also operates a powerful distribution sys-tem for natural gas not only within the Republic, but also to foreign customers. The total length of the gas mains is 13,000 km (see appendix 1).
Electricity SectorThe electricity sector in Uzbekistan is dominated by the State Joint Stock Company (SJSC) of Uzbekenergo established in 2001. The company comprises 39 power generation plants and a number of power distribution companies. The company is the monopolist on the market with a total installed capacity of over 12.0 GW producing 97 % of total electrical energy in Uzbekistan. The total national electricity capacity in opera-tion is 12.6 GW (as of 2007), of which 88.5 % is provided by Thermal Power Plants (THH) and 11.5% by Hydro Power Plants (HPP).

Renewable Energies in Central Asia
UZBEKISTAN
COUNTRY INTRODUCTION 179
Electricity production totaled 49,299 GWh in 2006 and elec-tricity consumption 40,661 GWh. The figure below shows the consumption by sector.
Uzbekistans’s maintenance of its power systems has deteriorated over the past years. Much of the equipment in generation, transmission and distribution systems is outdated and extremely inefficient. At present it needs serious renova-tion and upgrading to meet the growing demand of the econ-omy. The facilities require rehabilitation by introducing more efficient and environment friendly equipment, so that they can operate at their designed capacities. There are currently no manufacturing facilities in the country for the production of equipment used in power generation and transmission.
Renovation of the energy sector is a priority for the Government of Uzbekistan. The growing demand for electric-ity and the wear and tear of the existing power generating fa-cilities has motivated the Government to develop a long-term program for the reconstruction and development of the sec-tor during 2001–2010. In December 2001, the Government of Uzbekistan approved a Generating Capacity Development and Rehabilitation Program for the Energy Sector envisaging an increase in the installed capacity of national power stations by 15 % by 2010. In 2008–2010, Uzbekistan plans to imple-ment 4 projects worth more than 300 million USD. This pro-gram is likely to be extended beyond 2010 and presents good opportunities for international contractors and suppliers of energy equipment and services.
Source: Uzbekenergo, as of 2006
FIGURE 4
Fuel Consumption in Thermal Power Plants
4,4 %
Underground Gas 0,3 %
Mazut 8,6 %
Gas 86,7 %
Source: IEA, as of 2006
FIGURE 5
Electricity Consumption by Sector
Commercial and publicservices 7,8 %
Agriculture/Forestry 32,5 %
Transport 3,3 %
Residental 18,1 %
Industry 38,3 %
The need for renovation is also expressed in Uzbekenergo’s three priority directions for the further development of the electricity sector:
1. Technical re-equipment and modernization of power facilities: Modernization of power plants, introduction of advanced technologies, reduction of fuel consumption for electric power generation, implementation of measures for main-tenance and replacement of process equipment, renovation of turbines, boilers, fuel supply systems and other works at thermal power plants
2. Reconstruction and further development of the electrical network: Provision of flexible power transmission schemes, reduc-tion of power losses, optimization of arrangements between main and distributive power networks
3. Construction of new generating capacities: Replacement of worn-out generating capacities to meet the projected growth of power consumption, implementation of modern technologies to counteract adverse environmen-tal impacts of power facilities
Natural Resources
Oil and GasUzbekistan is one of the ten largest producers of natural gas in the world. In 2007, production totaled 65.2 billion m3 and the proven reserves in 12 major deposits amounted to as much as 1,900 billion m3 and were located mainly in the western Qizilkum Desert. Natural gas is the main source of electricity production in Uzbekistan (86.7 %). At the beginning of 2002, Uzbekistan‘s proven oil reserves were estimated at 594 million barrels. Oil production in 2007 amounted to 99,260 barrels per day, mostly from the wells in the Fergana Valley. Since 1991, Uzbekistan has more than doubled its oil production to become essentially self-sufficient in petroleum and, since 1996, a net exporter of petroleum as well.
Coal Uzbekistan’s coal reserves were estimated at 1,900 million tons (1,853 million tons of brown coal and 47 million tons of black coal). About 3.2 million tons of coal were produced in 2000 of which 85 % were used for electricity production. OJSC Uzbekugol (SJSC Uzbekenergo), OJSC Shargunkumir and OJSC Apartak are the largest players in the coal mining sector.
Uzbekistan has not yet introduced environmentally friendly coal burning technologies.
Import and Export of EnergyElectricity exports are mainly directed at the neighboring countries (Tajikistan and Kyrgyzstan during the winter pe-riod and Afghanistan throughout the year). Uzbekistan is therefore extending its electricity network in the direction of these countries. In contrast to the Kyrgyz Republic and Tajikistan, however, the potential to export electrical energy is not significant in Uzbekistan. Currently, imports and exports of electricity are more or less balanced (11,400 GWh in each

Renewable Energies in Central Asia
UZBEKISTAN
COUNTRY INTRODUCTION 180
direction). Extending the grid of the United Central Asian Power System will particularly benefit the Kyrgyz Republic and Tajikistan. Uzbekistan can possibly benefit in its role as a prospective transit country and as potential power trader.
Natural gas of Uzbekistan is exported to neighboring countries – Kazakhstan, Kyrgyzstan and Tajikistan and to the Russian Federation. Exports totaled 15 billion m3 in 2008.
Oil imports are increasing as Uzbekistan’s oil produc-tion has been shrinking during the past three years. For 2008, it was estimated that the Republic import 35,810 barrels per day and export 6,104 barrels per day.
Uzbekistan has the potential to export thermal power to its neighboring countries during the winter months.
PricesSince Uzbekenergo has virtually a monopoly in the produc-tion, transmission and sale of power, the Government of Uz-bekistan regulates all tariffs for energy. Price and tariff regu-latory functions are distributed among several state bodies. One of them is the Department of Price Settlement under the Ministry of Finance of the Republic of Uzbekistan dealing with economic regulation. The Department is, in fact, setting the tariffs for all forms of energy. Another one is UzEnergo-Nadzor, which is responsible for technical regulation in the electricity sector. The Ministry of Finance has price setting functions regarding electricity and energy products. These functions are further distributed to two subdivisions with one of them dealing with all prices and tariffs for electric-ity and energy products for industry residential consumers and the other dealing with prices for coal and oil products for retail customers. Uzbekenergo elaborates the draft electricity tariffs and submits them to the Ministry of Finance for ap-proval. Draft tariffs developed by Uzbekenergo for electricity and heat take into account the forecasted annual costs in the power sector and the profits needed to assure the development of the sector. Depending on changes in the cost of power pro-duction, the tariffs can be revised and adjusted. All electric-ity end-users are differentiated by categories of tariff groups, depending on their activities, but irrespectively of the form of ownership.
The average price for power in Uzbekistan in 2007 was about 3.5 US Cents/kWh – lower than in many other coun-tries of the CIS. Nevertheless, this represents a significant in-crease compared to the average weighted tariff as of July 2003 with 1.26 US Cents/ kWh.
As the Energy Charter Secretariat notes, one of the greatest challenges Uzbekistan faces in restructuring the pow-er sector is the problem of cross-subsidies and direct govern-mental subsidies. Both subsidies and cross-subsidies lead to negative consequences such as inefficiency, insolvency etc. The officially stated purpose of cross-subsidies is to keep the prices of electricity and other energy products low for consumers and businesses that cannot afford to pay the real price or enjoy spe-cial supply rights. As a result, the consumers and businesses that do not have such privileges pay a higher price for electric-ity, which results in higher cost of their products and often renders them uncompetitive. Eventually, such businesses fail or just stop paying the bills. As a consequence, Uzbekenergo
6 KAKHAROV, AS OF 2008
has to face the problem that its revenue does not cover the cost of fuel and other expenses. As there are no bankruptcy procedures and enforcements, this leads to a situation where everyone owes to everyone else, with the only distinction be-ing that some owe more than the others. In an environment like this, businesses cannot be properly run, as managerial de-cisions cannot be made on economic grounds6.
Growth Predictions for the Energy SectorThe total volume of the maximal possible production of fuel-energy resources is projected to increase from 79,7 million tons of conventional fuel (t.c.f.) in 2004 to 87,6 million t.c.f. in 2010 and to 88,9 million t.c.f. in 2020 (equaling a 11,5 % increase for the period 2004–2020). This projection is based on a favorable scenario of energy base development.
The increase of production volumes of this prediction broken down in different energy sources reads as follows: oil and condensate from 7.2 million t.c.f. to 8,0 million t.c.f., gas from 58,4 billion m³ to 60,0 billion m³, coal from 2,7 million of tons to 9–11,0 million tons and hydroenergy and Renewable Energy sources from 0,9 million t.c.f. to 3,26 mil-lion t.c.f.
In the prediction period of 2015–2030, however, even under assumption of rapid development of new deposits of oil and gas, Uzbekistan will only be able to cover its energy needs by 88–95 % from domestic sources. From 2010, the republic will have to import energy in the range of 0,4 million t.c.f. to 11,1 million t.c.f.
Some energy experts in Uzbekistan doubt the above projections and say that the country may fall short of the pro-jected production growth due to the high capital requirements and a lack of interest by large investors.
4 POLICY FRAMEWORK FOR RENEWABLE ENERGIES
4.1 NATIONAL STRATEGIES AND PROGRAMS TO SUPPORT RENEWABLE ENERGIES
Uzbekistan has extensive oil and gas resources, which result in low tariffs and a limited attention paid by the Government to develop RE resources with the exception of hydro power. There are plans in place to further develop the power industry by building natural gas TPPs and HPPs. Hydro power ac-counts for 11.5 % of the total generating capacity and enjoys priority for further development.
RE technologies are competing against fossil fuel tech-nologies with little though increasing governmental support. Worth mentioning efforts are the Government’s program for the construction of small-scale Hydro Power Plants and its activities to develop the country’s vast solar power potential (see chapter 5).
An important barrier to the realization of grid- connected RE projects is the extremely low feed-in tariff of 1.2 US Cents/kWh.

Renewable Energies in Central Asia
UZBEKISTAN
COUNTRY INTRODUCTION 181
4.2 REGULATIONS, INCENTIVES AND LEGISLATIVE FRAMEWORK CONDITIONS
The Law of the Republic of Uzbekistan on the Rational Use of Energy (as of 1997) serves as the cornerstone for the develop-ment and functioning of the entire energy sector including RE. It sets the general legal framework for conserving the na-tion‘s energy resources and for making efficient use of its exist-ing production potential of fuel and energy.
The provisions of the law apply to legal and physical persons associated with the extraction, production, refining, storage, transport, distribution and consumption of fuel and energy.
The scope of the law was designed to achieve the fol-lowing aims:
To provide for the efficient and environmentally safe use of energy in producing and consuming energy
To foster the development and adoption of energy saving and lower cost technologies for extracting petroleum, natural gas, coal and other types of fuel and for producing petroleum products
To ensure the trustworthiness and uniformity of measure-ments used in accounting for the quantity and quality of energy produced and consumed
To exercise governmental control and oversight for the efficient production and consumption of energy, energy quality and over the technical maintenance of energy equipment as well as energy supply and consumption systems
The law was the first to lay down in summary outline form the main directions of the Government’s policy encourag-ing the sound use of energy. The English translation of the law can be downloaded from the Internet7.
Article 11 of the law requires the Government to promote the implementation of projects that are aimed at the practi-cal application of technologies employing secondary energy resources and waste as well as solar, wind and hydroenergy.
Article 20 obliges distribution companies “to take the energy from non-utility developers in their grids at a transac-tion rate charged in accordance with established procedures”. The article further sets forth that “prices of heat and electric-ity should serve to expedite as much as agreed upon with the Government of the Republic of Uzbekistan the pay-back of investments into those facilities”.
The law also makes provisions for granting subsidies from the Intersectoral Energy Conservation Fund to projects aiming at reducing energy consumption and to use secondary energy and RE resources.
Despite this positive legal framework, the process of creating an environment conducive to the development of RE in Uzbekistan is being held back because basic documents stipulated in the law have been waiting for many years to be enacted, namely documents regulating procedures, conditions and size of subsidies, conditions for gaining access to energy grids and procedures for fixing RE prices.
Another legal document aiming directly at the regulation of the use of RE sources is Resolution No. 476 on the Develop-ment of Small hydro power in the Republic of Uzbekistan. The Resolution was approved by Cabinet of Ministers of the Republic of Uzbekistan on 28 December 1995. What is im-portant about the resolution is that it is the first document to make provisions for the regulation of certain issues associated with independent power producers using RE technologies.
The resolution, however, applies only to Hydro Power Plants belonging to the Ministry of Agriculture and Water Resources of the Republic of Uzbekistan and does not apply to other RE technologies. But the Resolution could serve as the basis for drafting a more comprehensive normative act.
Other matters associated with independent power producers are also governed by the Civil Code of the Repub-lic of Uzbekistan, the Law of the Republic of Uzbekistan on the Contractual-Legal Basis for Business Activities and by the rules and regulations for the use of electricity. The laws serve as the basis for business agreements, which establish spe-cific obligations and responsibilities of the business partners, amounts and costs of electricity to be provided, billing and payment procedures and other conditions for business rela-tions.
Clean Development Mechanism (CDM)The reduction of greenhouse emissions under the Clean De-velopment Mechanism (CDM) projects in developing coun-tries like Kyrgyzstan could be used by developed countries to fulfill their obligations to the Kyoto Protocol. The developed countries are allowed to purchase a part of other countries’ reduced greenhouse emissions as expenses on such reduction in the developed countries are much higher than in develop-ing ones.
Thus the CDM Projects are aimed to attract invest-ments, to stimulate the transfer of new technologies to the developing countries and at the same time to solve the en-vironmental problem – particularly the climate change. The implementation of projects opens new opportunities for or-ganizations within the country – independent of their form of property and institutional subordination – to modernize manufactures that reduce greenhouses emissions.
As a signatory to both the UN Framework Convention on Climate Change (UNFCCC) and the Kyoto Protocol, Uz-bekistan has supported the Road to Copenhagen Initiative and is actively involved in the UN negotiations on a new interna-tional climate change deal. The portfolio of CDM projects in Uzbekistan includes 79 project proposals at present. Of these, 59 have already received approval by the Ministerial Council on the CDM and are at various stages of preparation.
7 LEXADIN, AS OF 2009

Renewable Energies in Central Asia
UZBEKISTAN
COUNTRY INTRODUCTION 182
5 POTENTIAL FOR RENEWABLE ENERGIES AND PRESENT USE
Uzbekistan possesses large potential resources of RE. With 250 sunny days per year, the republic has a particularly large potential of solar energy which, if utilized with state-of-the-art technology, could provide three times more energy than currently provided through fossil energy carriers. In many remote rural areas, decentralized generation through RE sources, mainly through small Hydro Power Plants, would of-fer a competitive and environmentally friendly option for ad-dressing electricity shortages. While the potential to use wind energy is limited to some areas of the country, the potential of biofuel production from agricultural waste is considered as significant, particularly from waste from the vast cotton plantations throughout the country.
Despite their huge potential, RE solutions still have difficulties to compete with the abundantly available fossil fuels due to market distortions through energy subsidies and a lack of powerful lobby organizations. Despite such rather unfavorable conditions, there are signs that RE solutions have attracted more interest in the recent past. A widely felt wake up call was certainly the high commodity prices for fossil fuels in 2008. The Government is now more seriously promoting the development of the potentials of small hydro power and solar energy.
5.1 BIOENERGIES
Solid BiomassUzbekistan has no significant forest coverage. In the existing small forest territories, commercial deforestation is forbidden. Thus, fuel wood is not a prospective option for energy produc-tion.
Livestock and poultry farming wastes are preferably used for fertilizers. Therefore, the prospects of direct energy conversion of livestock wastes are problematic. There is, how-ever, a potential for indirect energy conversion of livestock wastes through biogas production (see chapter 5.1.3).
Liquid Biofuels (Bioethanol or Biodiesel)Uzbekistan has a high potential for biomass energy generation as the fourth largest producer of cotton in the world. 15 % of world production of cotton is manufactured annually in the republic. There is a strong interest in the thermo-chemical conversion of cotton stalks to produce energy. The biomass potential is more than 3 million tons of cotton stalks per year, which can be used as raw material base to produce glucose and reducing sugars or bioethanol. The gross potential is estimated at 27 billion kWh/year (27,000 GWh) and its technical po-tential at 2 billion kWh/year (2,000 GWh).
There is also an increasing interest in the cultivation and processing of sorghum, a traditional crop in Uzbekistan, which is suitable to be grown under harsh climatic conditions and poor soil fertility. The crop is said to have a large potential for the production of bioethanol, however, implementation remains in the research stage .
BiogasThere is a considerable potential to implement biogas tech-nologies in Uzbekistan. The main sources of raw materials in the country are manure from livestock breeding and poultry farming, municipal sewage and residues of crops. The most feasible source is manure from the livestock breeding indus-try comprising about 9,500 large- and medium-scale farms in Uzbekistan. Biogas technologies, however, are not yet widely adopted in the country. The Government of Uzbekistan and UNDP had launched the joint Assisting the Development in Biogas Technology in Uzbekistan Project in 2005. The an-nual technical potential for biogas production form livestock breeding and poultry farming, municipal sewage and other organic wastes is estimated at 8.9 million m3 equivalent to ap-proximately 55.2 GWh per year (at an average 6,2 kW/m3).
A pilot demonstration biogas plant was set up at a cat-tle farm in the Tashkent region as well as a Training Cen-tre of Biogas Technologies. The production of biogas is also relevant with regards to project in the field of Clean Devel-opment Mechanism. If the full technical potential would be developed, 46,000 thousand tons of CO2 emissions could be saved.
A demonstration biogas plant was placed into op-eration at the stock breeding farm Milk-Agro in Zangiota, Tashkent. The plant produces of 300 m3 of biogas and 10 tons of liquid fertilizer per day9.
5.2 SOLAR ENERGY The climatic conditions of Uzbekistan are especially favorable for utilizing solar energy. The gross potential of solar energy is 51 billion toe (593 million GWh). The technically feasible potential is 177 million toe (2 million GWh), which is sev-eral times higher than the country’s annual energy consump-tion10. Unfortunately, this powerful energy source remains largely untapped. The problem for Uzbekistan, as with many alternative energy sources, is the relatively high start-up costs. The marginal utilization of solar energy in Uzbekistan is also caused by low gas and electricity prices and the neglect of the existing regulations to promote RE, which were not yet trans-lated into a favorable feed-in tariff for solar installations.
8 TODERICH, K. ET AL., AS OF 2008
9 TODERICH, K. ET AL., AS OF 2008
10 ABDULLAEV, D.A. AND ISAEV, R.I., AS OF 2005
Source: estimation of Dukenbaev, 1996
TABLE 7
Potential for Small Hydro Power Projects
REGIONAL ANNUAL SOLAR RADIATION INCIDENTS
ON HORIZONTAL SURFACE KWH/YEAR
ON NORMAL SURFACE TO SUNLIGHT BEAMSKWH/YEAR
Taskent 1,687 1,943
Samarkand 1,776 1,909
Termez 1,786 1,957

Renewable Energies in Central Asia
UZBEKISTAN
COUNTRY INTRODUCTION 183
Solar Thermal EnergyAt present, solar energy is mainly used for hot water supply. Several manufactures in Uzbekistan, namely Uzgeliokurilish, Encom and Photon, produce flat solar water heaters. The total area of installed solar collectors in the country is estimated at 40,000 m2. The installed capacity consists of 12 MW of solar hot water supply plants with one high temperature solar plant (large solar furnace) with a 1 MW thermal capacity.
5.3 WIND POWERUzbekistan is characterized by weak winds. Average annual wind velocities are less than 3m/s. There are, however, small territories with average annual velocities 5m/s and more. These territories are the Aral Sea coast, Plato Ustyurt, some areas of steppe zone of Kyzylkums, a zone of winds near Bekabad al-ternately in eastern and western direction and a number of ar-eas of mountain and foothill valleys such as Pskem, Ahanga-ran, Boysun etc.11
The wind energy potential of Uzbekistan is fair with a potential generating capacity of around 100 MW. Although this is small compared to the generating capacity of existing power plants, environmental concerns and needs of remote locations may drive the development of this potential. To develop the whole technical potential of wind power in Uz-bekistan, more than 70,000 wind power installations (WPI) in the capacity range of 60 to 250 kW would be required.
The most promising sites would be the Aral Sea re-gion, Karakalpakiya and the central region of the country. A more in-depth study of the eastern coast of the Aral Sea would be worth performing.
5.4 GEOTHERMAL ENERGYGeothermal resources of Uzbekistan consist of thermal waters with temperatures in the range of 60–120 °C and Hot Dry Rock (HDR)12 energy with temperatures up to 300 °C. The gross potential of explored reserves of thermal waters is esti-mated at 2,000 GWh/year. The technically feasible potential has not been established yet. Main thermal water areas are:
Amu Darya Basin, geothermal gradient 38 °C/km, reser-voir depth 12,950 m, temperature 122 °C
Surkhan Darya Basin where an aquifer produces 830 l/s of thermal water, temperature 65 °C
Taskent Basin where the Lower Cretaceous reservoirs contain thermal water, depth 2,000–2,500 m, temperature 75–80 °C, TDS 1 g/l, total flow rate 500 l/s
Fergana Valley where aquifers in Neogene sediments produce thermal water, temperature 70–90 °C, flow rates ranging from 30–500 l/s
The total thermal water resources are estimated as 135 MW (free flow operation) or 1,150 MW (pumping operation).
Despite the good degree of examination of geother-mal reservoirs, the use of thermal water is still in the initial stage. The mastering of geothermal resources is foreseen by the National Energy Program. Presently, however, there is no generating capacity in the country.The gross potential of hot dry rock (HDR) geothermal energy is estimated much higher than that of hydrothermal waters. However, no systematic studies were conducted on the use of such petro-thermal energy as of today.
5.5 HYDRO POWERIn 2007, total installed electrical capacity in Uzbekistan was 12.6 GW. Total electricity production in 2006 came to 49,299 GWh, of which 87 % was from fossil fuels and 13 % from hydro power (6,333 GWh)13. The technically feasible potential of hydro power sources is estimated at 27,400 GWh and the economically feasible potential at 11,000 GWh per year14.
Uzbekistan maintains a significant hydroelectric generation capacity with 18 facilities in operation and another 20 facilities in various stages of planning and construction that will constitute another 1,100 MW of capacity and an-other annual hydro power generation of 2,900 GWh. Appen-dix 3 provides an overview over the ongoing projects.
The main problems interfering with the development of hydroenergy potentials include:
The necessity of core hydro power equipment acquisition abroad (water turbines, hydro generators, controllers)
The absence of a legislative base in the field of hydro power engineering regulating interrelations such as access rights to power resources with various patterns of ownership including the rights and guarantees of investors
The difficult access to electric networks of the SJSC Uzbekenergo by independent producers of electric power on HPP
The status and power of regional and local authorities on use of water and energy sources
Legislatively fixed specific privileges and guarantees
The challenge in the development of hydro power resources of Uzbekistan – and other countries of Central Asia region including Kazakhstan, Kyrgyzstan, Tajikistan, Turkmeni-stan and bordering Afghanistan – is the absence of interstate agreements on (i) the use of water and power sources, (ii) transboundary water flows both large and average, (iii) small water flows on the territories of these countries which are of strategic interest for each country in solving problems of wa-ter supply and irrigation and (iv) power supply and export of power resources.
Large Hydro PowerUzbekistan is covered by two large river systems – Amu Darya and Syr Darya. Most of the large HPPs are located at the Syr Darya river and its branches. At present, 30 HPPs with a total capacity of 1,684 MW per year generate up to 6,400 GWh
11 EBRD/RENEWABLE ENERGY INITIATIVE, AS OF 2009
12 HDR ENERGY IS HARVESTED FROM THE PRESSURIZED CIRCULATION OF WATER
THROUGH MAN-MADE (ENGINEERED) RESERVOIRS CREATED IN HOT CRYSTALLINE
BASEMENT ROCK WHICH HAS BEEN HEATED BY CONDUCTION FROM THE EARTH’S
MANTLE AND BY THE DECAY OF RADIOACTIVE ELEMENTS IN THE CRUST.
14 IEA, AS OF 2006
15 ACCORDING TO ERBD (AS OF 2002), THIS POTENTIAL DOES NOT INCLUDE THE
POTENTIAL FOR SMALL HYDRO POWER.
Renewable Energies in Central Asia
UZBEKISTAN
COUNTRY INTRODUCTION 184
of energy. The biggest HPPs are located in the upper part of Chirchik River – namely Charvak, Khodjikent and Gazal-kent – and have water storage basins, which allow running the plants in capacity control mode.
The potential for large-scale Hydro Power Plants is already developed by 80 %. This is due to the fact that only 30 % of the existing water energy resources are large rivers.
Small Hydro PowerThere is still a largely untapped hydro power potential of 600 small rivers, irrigation canals and water reservoirs. This total potential for small hydro power is estimated at 1,760 MW with a possible annual energy production of 8,000 GWh. Only 3.2 % of this potential has been developed so far.
As mentioned earlier, the Government of Uzbekistan approved a resolution on the Development of small hydro power in the Republic of Uzbekistan in 1995. The resolution makes provisions for the regulation of issues associated with independent power producers using RE technologies.
The quantitative objective of this resolution is to de-velop 15 plants with a total capacity of 423 MW and generate 1.36 billion kWh of electricity per year by 2010. No informa-tion was available regarding the implementation status of this project.
6 MARKET RISK ANALYSIS AND BARRIERS FOR MARKET ENTRY
Since its independence, the Uzbek Government has continu-ally stated its commitment to a gradual transition to a free market economy. It has been extremely reserved, however, in doing so. The Government succeeded in narrowing the gap between the black market and the official exchange rate, but its restrictive trade regime has hindered efforts. Moreover, a substantial structural reform is needed in order to improve the investment climate for foreign investors.
Extensive state controls over the economy continue to hinder the functioning of markets and the development of the private sector. Privatization, particularly large-scale, has been limited, with annual privatization revenues averaging just 0.5 % of the GDP over the past 10 years.
6.1 GENERAL SITUATION
CorruptionUzbekistan’s gradualist reform strategy in the years after achieving independence has involved the postponing of sig-nificant macroeconomic and structural reforms. State-ruled bureaucracy has remained a dominant influence on the economy. Corruption permeates the society and grows more rampant over time: Uzbekistan‘s 2005 Corruption Perception Index was 137 out of 159, whereas in 2007, Uzbekistan was at
the very bottom of the ranking, 175 out of 17915. A February 2006 report on the country by the International Crisis Group suggests that revenues earned from key exports, especially cot-ton, gold, corn and increasingly gas, are distributed among a very small circle of the ruling elite with little or no benefit for the population at large.16
Availability of Local Know-howUzbekistan has a huge labor potential. It possesses 40 % of the labor forces in Central Asia. Uzbekistan has a 99.3 % literacy rate among adults older than 15, which is attributable to the free and universal education system introduced by the Soviet Union . The peculiarity of the republic’s labor potential is its high educational level. There is a large number of scientists, engineers, doctors, teachers and professionals in the fields of energy, geology, mining, nuclear physics, agricultural chemis-try and cotton-growing.
The high educational levels are also reflected in the powerful industrial enterprises operating in Uzbekistan, pre-senting actually all fields of industry from heavy to light in-dustry and industrial processing of agricultural products as well as high-technology productions.
As shown in chapter 8, there are plenty of companies and organization active in the field of RE. Therefore, the re-quired human resources for the implementation of national RE projects are available within the country.
Local Acceptancein 1996, the Government of Uzbekistan founded the Tech-nology Transfer Agency, which has the task to promote and disseminate technologies in the country. A special focus is on RE solutions. The agency has already gained experience with various RE solutions and reports high levels of accept-ance particularly in remote areas beyond the reach of national distribution networks.
6.2 BUSINESS DEVELOPMENTOfficially, foreign and domestic investments face equal treat-ment under the law. Numerous sectors, however, are either reserved for the state or subject to limited ownership restric-tions. In practice, investors face barriers as cumbersome pro-cedures, the threat of expropriation, inconsistent and arbitrary regulation, corruption and political unrest and violence. Resi-dents and non-residents may hold foreign exchange accounts, these are, however, subject to some restrictions. Payments and transfers face quantitative limits. Some capital transactions including credit operations and real estate transactions are subject to controls.17
According to the Economist Intelligence Unit, the Government is hostile to allowing the development of an in-dependent private sector, over which it would have no control. Thus, the national bourgeoisie in general and the middle class in particular are economically and politically marginalized.Accordingly, state interventions in business operations are widespread. The economic policies have discouraged foreign investment, which is the lowest per capita in the CIS.
15 TRANSPARENCY INTERNATIONAL, 2005–2007
16 INTERNATIONAL CRISIS GROUP, AS OF 2006
17 CIA, AS OF 2009

Renewable Energies in Central Asia
UZBEKISTAN
COUNTRY INTRODUCTION 185
6.3 INTELLECTUAL PROPERTY RIGHTSThe Government influences Uzbekistan‘s judiciary. Judicial procedures fall short of international standards, corruption is extensive and expropriation is possible. There is no general system for the registration of liens or chattel property. Pirated audiotapes, compact discs, videotapes and other optical media are sold without restrictions .
6.4 TAXATIONThe top Income Tax rate is 25 % and the top Corporate Tax rate is 10 % (17 % for commercial banks). Other taxes include a Value Added Tax (VAT) and a Property Tax. In the past year, the overall tax revenue as a percentage of GDP was 21 %.18
The Government of Uzbekistan restricts foreign im-ports in many ways including high import duties. Excise taxes are applied in a highly discriminatory manner to pro-tect locally produced goods. Official tariffs are combined with unofficial, discriminatory charges resulting in total charges amounting to as much as 100 to 150 % of the actual value of the product, making imported products virtually unafford-able. Import substitution is an officially declared policy and the Government proudly reports reductions in the volume of consumer goods imported. A number of CIS countries are of-ficially exempt from Uzbekistan import duties.
Some taxation aspects related to the development of RE are included in the Tax Code of Republic of Uzbekistan of 2007.
The tax for using water resources is regulated in para-graph 10. Article 261 defines privileged calculation of the tax for water resources used for the operation of hydraulic tur-bines of Hydro Power Plants: The taxable base decreases by the volume of water used.
The taxation of land is regulated in paragraph 12. Ar-ticle 282 defines land areas not subject to taxation including land areas occupied with water reservoirs (the rivers, lakes, water basins etc.) and hydro-technical and other water-eco-nomic constructions.
7 RENEWABLE ENERGY BUSINESS INFORMATION AND CONTACTS
In Uzbekistan the following ministries, departments, com-panies, and organizations are interested in cooperation on development and use of RE sources:
State Joint Stock Company of Uzbekenergo6, Khoremskaya Str. Tashkent 100000 UzbekistanPhone: (99871) 2339889 Fax: (99871) 2332700 E-Mail: [email protected], reconstruction, construction of large, medium and small hydroelectric power stations; develop-ment, designing, construction of solar power stations with thermodynamic and photoelectric transformation of solar radiation are future directions pursued
Ministry of Agriculture and Water Resources Republic of Uzbekistan4, Navoi Str. Tashkent 100004 Uzbekistan Phone: (99871) 2421353; 2420042Fax: (99871) 2423292; 2440920E-Mail: [email protected], exploitation of average small hydroelectric stations, building water basins and irrigational channels, small run-of-river schemes, electric power supply of water-elevating, soil-reclamation large, average, small pumping stations with use of solar power stations, small hydroelectric power stations, wind electric installations, improvement of power and water supply in rural areas
Specialized Association of Uzsuvenergoof the Ministry of Agriculture and Water Resources Republic of Uzbekistan1, Shayhantahur Str. Tashkent 100128UzbekistanPhone: (99871) 2414552; 2413711Fax: (99871) 2394768 E-Mail: [email protected] Building, exploitation of average small hydroelectric stations on water basins, irrigational channels, small rivers Joint Stock Company of O’Ztransgas 31a Yusuf Khos Khojib Str.Tashkent 100031UzbekistanPhone: (99871) 2398965 Fax: (99871) 2394768 E-mail: [email protected], building and exploitation of solar thermal boilers, development and use of solar photoelectric and wind electric installations
18 HERITAGE FOUNDATION, AS OF 2009

Renewable Energies in Central Asia
UZBEKISTAN
186
State Joint Stock Company of O’Zbekgidroenergoqurilish 22, Navoi Str.Tashkent 100011UzbekistanPhone: (99871) 2413295Fax: (99871) 2336496E-Mail: [email protected] of Hydro Power Plants
Producing Association of Toshissiqquvat1, Furqat Str.Tashkent 100027UzbekistanPhone: (99871) 2270834Fax: (99871) 2270864E-Mail: [email protected] and exploitation of systems of heat supply in Tashkent city, development, building and exploitation of combined solar heating boilers
RENEWABLE ENERGY: RELEVANT INSTITUTIONS
Joint Stock Company of HydroprojectBobur Str. TashkentUzbekistanPhone: (99871) 2531465Fax: (99871) 2546709 E-Mail: [email protected] of unique large, middle and small Hydro Power Plants in Central Asia and other countries
Uzbekchimmash OJSC8, Mendeleev Str. Chirchik 111708UzbekistanPhone: (99837071) 6-57-96, 5-34-26Fax: (99837071) 64473, 65893 E-Mail: [email protected] of high quality oilfield equipment, equipment for thermal power station and water supply, manufacturing of the equipment for Hydro Power Plants is also possible
Foton JSC13, Movaraunnahr Str. Tashkent 100047UzbekistanPhone: (99871) 2334230; 2337556 Fax: (99871) 2361454; 2360933 E-Mail: [email protected] stations with capacity of 100 and 500 W, future develop-ment of PV stations with capacities from 500 to 5,000 W
ENCOM SCIENTIFIC – PRODUCING ENTERPRISE40, Navoi Str. Tashkent, 100011UzbekistanPhone: ( 99871) 2205832; 2922728;
Fax: (99871) 2922728 E-Mail: [email protected] with heating capacities from 125 to 6,000 kW for heat supply, block module boiler rooms for autonomous heat supply in apartments, offices, hospitals etc., solar collector production for heat supply of apartments, offices, hotels etc.
Qurilishgelioservis Ltd.2, Bg. Mavlyanov Str. Tashkent 100084UzbekistanPhone: (99871) 2354160Fax: (99871) 2354160 E-Mail: [email protected], production, installation and operation control of solar water heating systems
Toshkent – Zenner JV CJSC122, Gavkhar Str.Toshkent 100081UzbekistanPhone: (99871) 2798860Fax: (99871) 2205190 E-Mail: [email protected] of solar water heating systems
MIR – SOLAR LTD176, Akhsikat Str.Tashkent 100076UzbekistanPhone: (99871) 2913346 Fax: (99871) 2915721 E-Mail: [email protected] of manufacturing technologies of solar instal-lations, portable combined PV stations with water-cooling intended for the reception of electrical energy and heating of water
Technology Transfer Agency 13, Movarounnahr Str.Tashkent 100047UzbekistanPhone: (99871) 2361071 Fax: (99871) 2394917 E-Mail: [email protected] in technology transfer for industrial production, international scientific and technical cooperation in the field of commercialization of research and design results
Institute of Power Engineering and Automation of the Academy of Science of the Republic of Uzbekistan 29, F. Khodjaev Str.Tashkent100125 UzbekistanPhone: (99871) 2620522Fax: (99871) 2620919E-Mail: [email protected] and applied development in the field of hydro, solar, wind and geothermal energies
COUNTRY INTRODUCTION

Renewable Energies in Central Asia
UZBEKISTAN
187
Physical–Technical Institute of the Academy of Sciences of the Republic of Uzbekistan.2B, Mavlyanov Str.Tashkent 100084UzbekistanPhone: (99871) 2331271Fax: (99871) 2354291E-Mail: [email protected] and applied development of different aspects of solar energy such as thermodynamic converters, PV and solar thermal devices and systems
Institute of Electronics of the Academy of Science of the Republic Uzbekistan.33 F, Khodjaev Str.Tashkent 100125UzbekistanPhone: (99871) 2627940Fax: (99871) 2628767E-Mail: [email protected] Research and applied development of technologies, production of solar PV cells
Tashkent State Technical University2, Universitet Str.Tashkent 100095UzbekistanPhone: (99871) 2464600Fax: (99871) 2271032E-Mail: [email protected] and applied development of hydro power and solar energy such as PV and solar thermal systems, education of students in the sphere of energy
COUNTRY INTRODUCTION

Renewable Energies in Central Asia
UZBEKISTAN
188
8 BIBLIOGRAPHY
Amnesty International (2009): Amnesty Report. Usbekistan (www.amnesty.de/jahresbericht/2009/ usbekistan?destination=node %2F3037)
Abdullaev, D.A. and Isaev, R.I. (2005): Resources of Solar Radiation and Wind Energies in Uzbekistan and System of Their Combined Utilization, ISESCO
Central Intelligence Agency – CIA (2009): The World Fact Book – Uzbekistan
European Bank for Reconstruction and Development – EBRD (2002): Overview of Electricity Supply, Uzbekistan, Renewable Energy Country Profile
European Bank for Reconstruction and Development – EBRD/ Renewable Energy Initiative (2009): Country Profile. Uzbekistan (http://ebrdrenewables.com/sites/ renew/countries/uzbekistan/profile.aspx)
Heritage Foundation (2009): Index of Economic Free-dom – Uzbekistan
International Energy Agency – IEA (2006): Electricity/Heat in Uzbekistan in 2006
International Crisis Group (2006): Uzbekistan: In for the Long Haul
Kakharo, J. (2008): Uzbekistan Power Generation Sector Overview, U.S. & Foreign Commercial Service and U.S. Department of State
Lexadin (2009): Legislation Uzbekistan (www.lexadin.nl/wlg/legis/nofr/oeur/lxweuzb.htm, updated in November 2009)
Toderich, K., Massino, I., Shoab, I., et al. (2008): Utilization of Agriculture Residues and Livestock Waste in Uzbekistan, IDEAS
Transparency International (2005–2007): Corruption Perceptions Index
Uzbekenergo (2006): Uzbekenergo. State Joint Stock Company (www.uzbekenergo.uz/eng/technical_and_ economic_indices)
REFERENCES
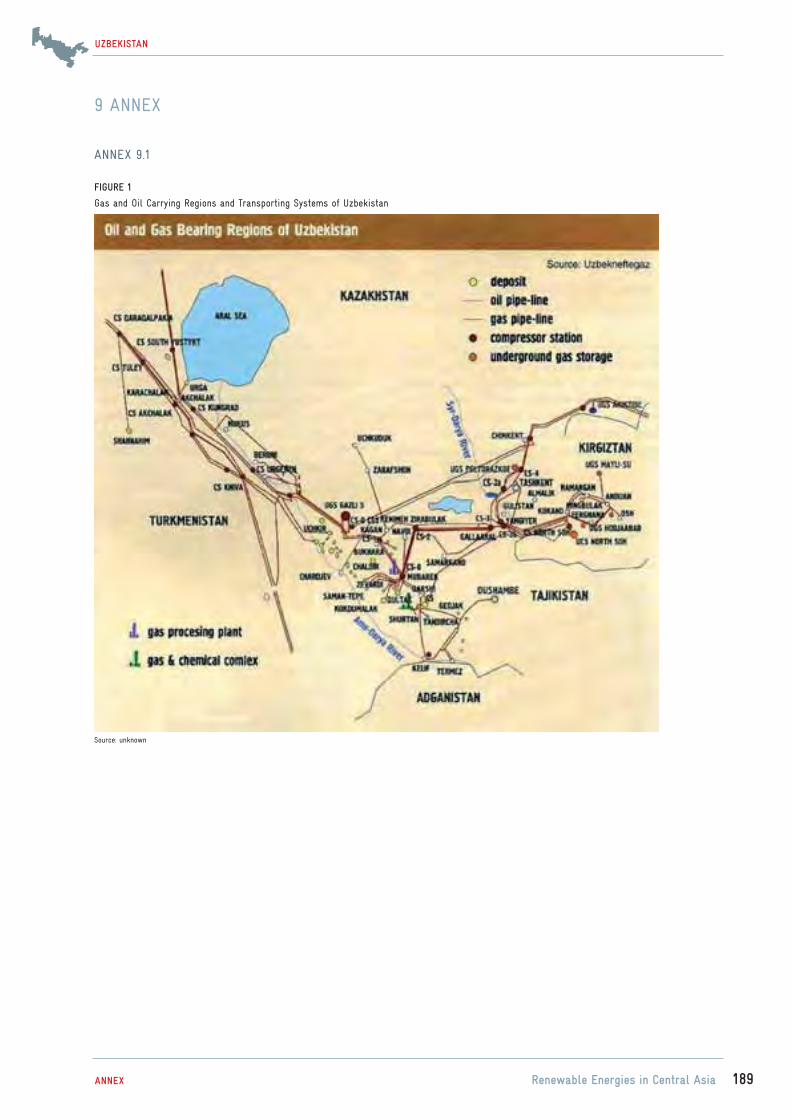
Renewable Energies in Central Asia
UZBEKISTAN
189
9 ANNEX
ANNEX 9.1
ANNEX
Source: unknown
FIGURE 1
Gas and Oil Carrying Regions and Transporting Systems of Uzbekistan

Renewable Energies in Central Asia
UZBEKISTAN
190
ANNEX 9.2
ANNEX
Source: unknown
FIGURE 2
Map of Uzbekistan’s Exisitng and Planned Main Electricity Grids

Renewable Energies in Central Asia
UZBEKISTAN
191
ANNEX 9.3
ANNEX
Source: unknown
PROJECT TITLE CAPACITY (MW) PRODUCTION/YEAR (BILLION KWH)
Pskem 400 0.9200
Mullalaskaya 270 0.5060
Tupolang water storage basin 175 0.5140
Gossaral water stprage basom 45 0.0809
Akhangaran water storage basin 21 0.0360
Andijan water storage basin 50 0.1000
Shaarikhan – 0 30 0.1100
Shaarikhan – 1 15 0.0500
South Fergana channel – 2 7.9000 0.0420
Karkidon water storage basin 10 0.0260
Gavasay water storage basin 9.5 0.0320
Sokh water storage basin 14 0.0700
Uygin – 1 20.3000 0.0700
Uygin – 1 38.6000 0.1400
Bagishamal – 2 17.7000 0.0740
Shaudar 6 0.0270
Gulba 6 0.0288
Pioner 8 0.0350
Lower Bozsu – 5 4.5 0.0230
Lower Bozsu – 5A 4.5 0.0230
TABLE 1:20
Ongoing HPP Projects of Uzbekistan’s Programm of Hydro Power Development
Related Documents