REGIONAL PROFILE ZONE 3 – ATLANTA REGIONAL COMMISSION TABLE OF CONTENTS ZONE POPULATION ........................................................................................................ 2 RACIAL/ETHNIC COMPOSITION ..................................................................................... 2 MEDIAN ANNUAL INCOME ............................................................................................. 3 EDUCATIONAL ACHIEVEMENT ...................................................................................... 4 GEORGIA COMPETITIVENESS INITIATIVE REPORT .................................................... 10 RESOURCES .................................................................................................................. 11 This document is available electronically at: http://www.usg.edu/educational_access/complete_college_georgia/summit

Welcome message from author
This document is posted to help you gain knowledge. Please leave a comment to let me know what you think about it! Share it to your friends and learn new things together.
Transcript

REGIONAL PROFILE
ZONE 3 – ATLANTA REGIONAL COMMISSION
TABLE OF CONTENTS
ZONE POPULATION ........................................................................................................ 2 RACIAL/ETHNIC COMPOSITION ..................................................................................... 2 MEDIAN ANNUAL INCOME ............................................................................................. 3 EDUCATIONAL ACHIEVEMENT ...................................................................................... 4 GEORGIA COMPETITIVENESS INITIATIVE REPORT .................................................... 10 RESOURCES .................................................................................................................. 11
This document is available electronically at:
http://www.usg.edu/educational_access/complete_college_georgia/summit

2
ZONE POPULATION 2011 Population 4,069,211 2025 Projected Population 5,807,337
Sources: U.S. Census, American Community Survey 2011 ACS Demographic and Housing Estimates, 5-year estimate Georgia Department of Labor, Area Labor Profile Report 2012
RACIAL/ETHNIC COMPOSITION
Source: U.S. Census, American Community Survey 2011 ACS Demographic and Housing Estimates, 5-year estimate
3
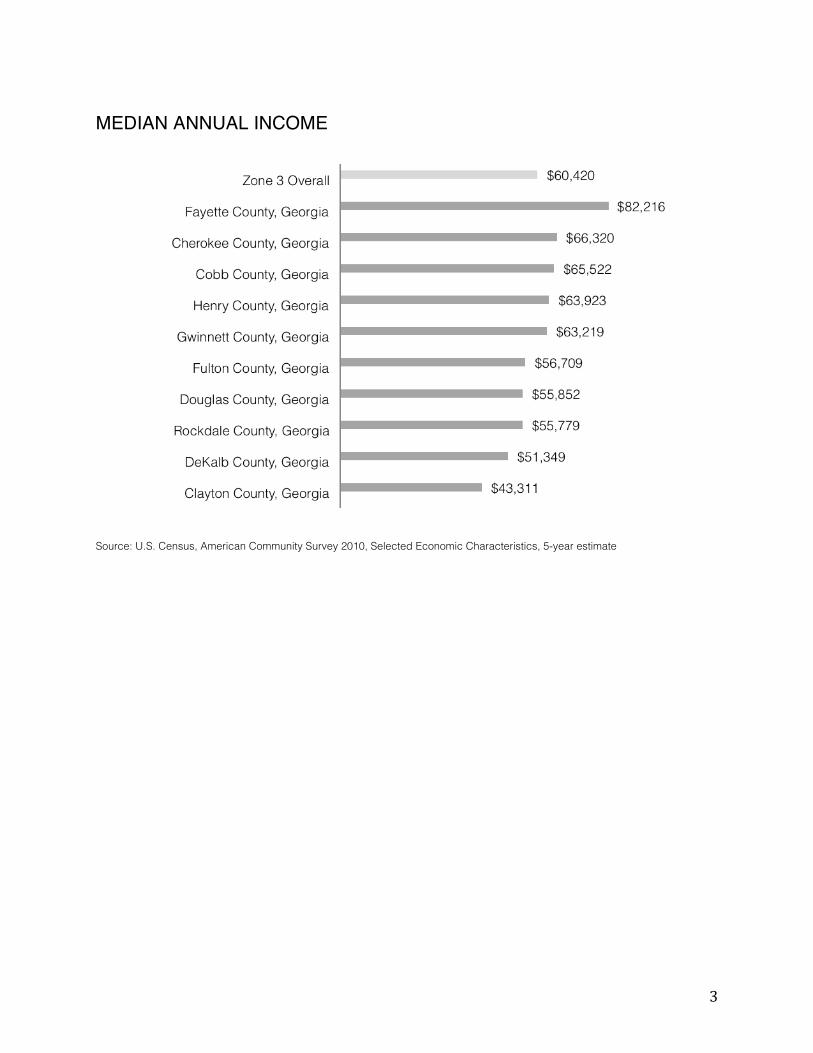
MEDIAN ANNUAL INCOME
Source: U.S. Census, American Community Survey 2010, Selected Economic Characteristics, 5-year estimate

4
EDUCATIONAL ACHIEVEMENT HIGH SCHOOL GRADUATION RATES SYSTEM NAME 2011 GRADUATION RATE (%) Decatur City 88.40 Buford City 82.32 Fayette 78.23 Cherokee 74.82 Cobb 73.35 Henry 72.35 Douglas 70.98 Fulton 70.05 Gwinnett 67.56 Rockdale 66.20 DeKalb 58.65 Marietta City 56.01 Atlanta Public Schools 51.96 Clayton 51.48
Source: Georgia Department of Education, 2011, 4-year Graduation Rates by District http://www.doe.k12.ga.us/External-Affairs-and-Policy/communications/Documents/2011%20State%20and%20System%20Cohort%20Graduation%20Rate.xls AGE AND EDUCATIONAL ATTAINMENT All Ages 18-24 25-34 35-44 45-64 65+ Elementary 4.7% 3.9% 5.7% 3.8% 3.3% 9.5% Some High School 8.0% 15.8% 7.3% 5.5% 5.8% 11.7% High School Grad/GED 24.3% 30.4% 21.4% 21.4% 23.4% 31.3% Some College 22.1% 35.0% 20.3% 20.0% 21.0% 18.7% College Grad 2 Yr 6.4% 3.4% 6.2% 7.6% 7.6% 3.7% College Grad 4 Yr 22.9% 10.5% 27.7% 27.6% 24.3% 14.8% Post Grad Studies 11.6% 0.9% 11.4% 14.2% 14.6% 10.3%
Source: Georgia Department of Labor, Area Labor Profile Report 2012
http://explorer.dol.state.ga.us/mis/Profiles/rc/03%20-%20Atlanta%20Regional%20Commission.pdf

5
HIGHER EDUCATION INSTITUTION GRADUATION RATES USG Four Year Colleges- 2006-2012 cohort (6 years)* USG Two Year Colleges 2009-2012 (3 years)* University of Georgia 81% Waycross College 17% Georgia Institute of Technology 79% Bainbridge College 15% Georgia College & State University 57% Abraham Baldwin Agricultural College 14% North Georgia College & State University 53% South Georgia College 12% Georgia State University 51% Armstrong Atlantic State University 11% Georgia Southern University 50% Atlanta Metropolitan State College 11% Valdosta State University 41% Darton State College 11% Kennesaw State University 41% Georgia Highlands College 10% Albany State University 39% Middle Georgia College 10% Southern Polytechnic State University 37% College of Coastal Georgia 9% University of West Georgia 37% Gainesville State College 9% Columbus State University 33% Gordon State College 9% Savannah State University 32% Valdosta State University 8% Armstrong Atlantic State University 31% North Georgia College & State University 8% Fort Valley State University 29% Georgia Perimeter College 8% Georgia Southwestern State University 29% Clayton State University 7% Clayton State University 28% Dalton State College 6% Augusta State University 26% East Georgia State College 6% Macon State College 20% Macon State College 4% Dalton State College 15% *Rounded to the nearest percent
Source: University System of Georgia Data Warehouse
TCSG Graduation Rates 2009-2012 (3 years) Southwest Georgia Technical College 35% Augusta Technical College 21% Albany Technical College 34% Oconee Fall Line Technical College 20% Ogeechee Technical College 32% Athens Technical College 18% Middle Georgia Technical College 30% Wiregrass Georgia Technical College 18% Moultrie Technical College 29% Georgia Piedmont Technical College 18% North Georgia Technical College 29% Gwinnett Technical College 15% Lanier Technical College 28% Central Georgia Technical College 14% Southeastern Technical College 23% Columbus Technical College 14% South Georgia Technical College 23% Savannah Technical College 14% Atlanta Technical College 23% Southern Crescent Technical College 12% Okefenokee Technical College 22% West Georgia Technical College 9% Altamaha Technical College 22% Chattahoochee Technical College 8% Georgia Northwestern Technical College 21%
Source: Technical College System of Georgia Knowledge Management System Report # DC262
NOTE: These graduation rates are lower than actual student success rates as they do not account for inter and intra system student transfer.
6
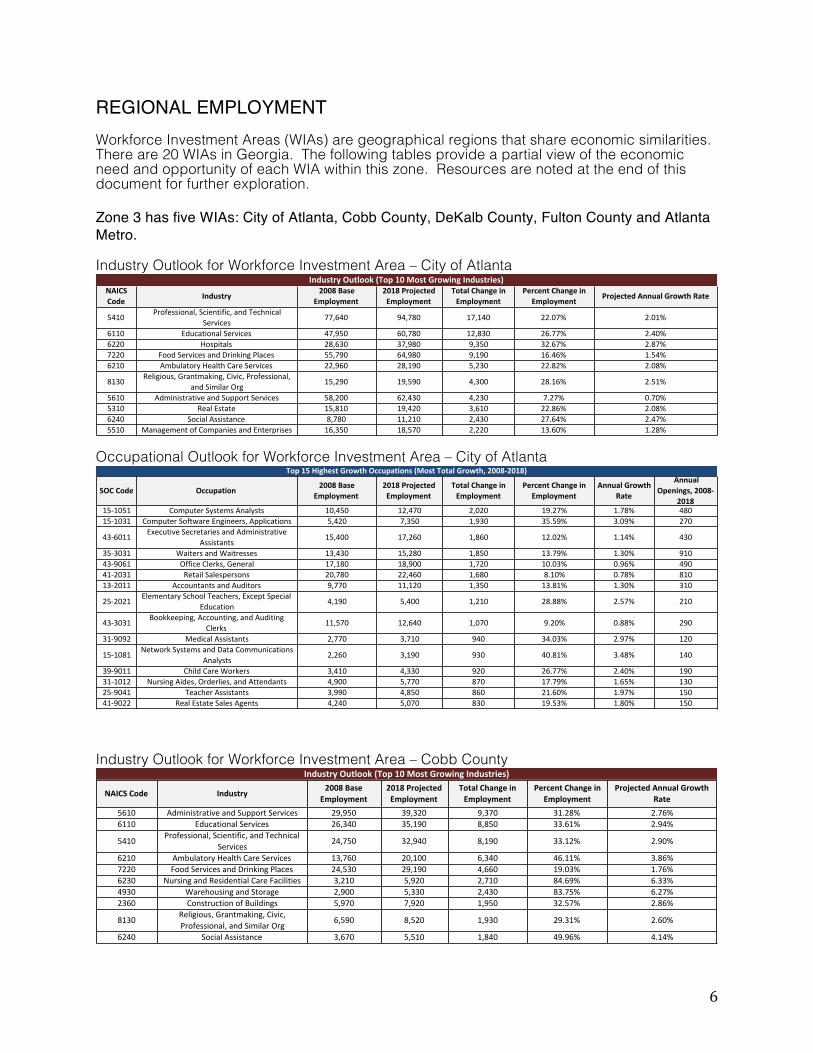
REGIONAL EMPLOYMENT Workforce Investment Areas (WIAs) are geographical regions that share economic similarities. There are 20 WIAs in Georgia. The following tables provide a partial view of the economic need and opportunity of each WIA within this zone. Resources are noted at the end of this document for further exploration. Zone 3 has five WIAs: City of Atlanta, Cobb County, DeKalb County, Fulton County and Atlanta Metro. Industry Outlook for Workforce Investment Area – City of Atlanta
NAICS&Code Industry& 2008&Base&
Employment2018&Projected&Employment
Total&Change&in&Employment
Percent&Change&in&Employment
5410 Professional,0Scientific,0and0Technical0Services 77,640 94,780 17,140 22.07%
6110 Educational0Services 47,950 60,780 12,830 26.77%6220 Hospitals 28,630 37,980 9,350 32.67%7220 Food0Services0and0Drinking0Places 55,790 64,980 9,190 16.46%6210 Ambulatory0Health0Care0Services 22,960 28,190 5,230 22.82%
8130 Religious,0Grantmaking,0Civic,0Professional,0and0Similar0Org 15,290 19,590 4,300 28.16%
5610 Administrative0and0Support0Services 58,200 62,430 4,230 7.27%5310 Real0Estate 15,810 19,420 3,610 22.86%6240 Social0Assistance 8,780 11,210 2,430 27.64%5510 Management0of0Companies0and0Enterprises 16,350 18,570 2,220 13.60%
2.08%2.47%1.28%
2.40%2.87%1.54%2.08%
2.51%
0.70%
Industry&Outlook&(Top&10&Most&Growing&Industries)
Projected&Annual&Growth&Rate
2.01%
Occupational Outlook for Workforce Investment Area – City of Atlanta
SOC$Code Occupation$ 2008$Base$Employment
2018$Projected$Employment
Total$Change$in$Employment$
Percent$Change$in$Employment
Annual$Growth$Rate
Annual$Openings,$2008D
201815#1051 Computer-Systems-Analysts 10,450 12,470 2,020 19.27% 1.78% 48015#1031 Computer-Software-Engineers,-Applications 5,420 7,350 1,930 35.59% 3.09% 270
43#6011 Executive-Secretaries-and-Administrative-Assistants 15,400 17,260 1,860 12.02% 1.14% 430
35#3031 Waiters-and-Waitresses 13,430 15,280 1,850 13.79% 1.30% 91043#9061 Office-Clerks,-General 17,180 18,900 1,720 10.03% 0.96% 49041#2031 Retail-Salespersons 20,780 22,460 1,680 8.10% 0.78% 81013#2011 Accountants-and-Auditors 9,770 11,120 1,350 13.81% 1.30% 310
25#2021 Elementary-School-Teachers,-Except-Special-Education 4,190 5,400 1,210 28.88% 2.57% 210
43#3031 Bookkeeping,-Accounting,-and-Auditing-Clerks 11,570 12,640 1,070 9.20% 0.88% 290
31#9092 Medical-Assistants 2,770 3,710 940 34.03% 2.97% 120
15#1081 Network-Systems-and-Data-Communications-Analysts 2,260 3,190 930 40.81% 3.48% 140
39#9011 Child-Care-Workers 3,410 4,330 920 26.77% 2.40% 19031#1012 Nursing-Aides,-Orderlies,-and-Attendants 4,900 5,770 870 17.79% 1.65% 13025#9041 Teacher-Assistants 3,990 4,850 860 21.60% 1.97% 15041#9022 Real-Estate-Sales-Agents 4,240 5,070 830 19.53% 1.80% 150
Top$15$Highest$Growth$Occupations$(Most$Total$Growth,$2008D2018)
Industry Outlook for Workforce Investment Area – Cobb County
NAICS&Code Industry& 2008&Base&Employment
2018&Projected&Employment
Total&Change&in&Employment
Percent&Change&in&Employment
5610 Administrative0and0Support0Services 29,950 39,320 9,370 31.28%6110 Educational0Services 26,340 35,190 8,850 33.61%
5410 Professional,0Scientific,0and0Technical0Services 24,750 32,940 8,190 33.12%
6210 Ambulatory0Health0Care0Services 13,760 20,100 6,340 46.11%7220 Food0Services0and0Drinking0Places 24,530 29,190 4,660 19.03%6230 Nursing0and0Residential0Care0Facilities 3,210 5,920 2,710 84.69%4930 Warehousing0and0Storage 2,900 5,330 2,430 83.75%2360 Construction0of0Buildings 5,970 7,920 1,950 32.57%
8130 Religious,0Grantmaking,0Civic,0Professional,0and0Similar0Org 6,590 8,520 1,930 29.31%
6240 Social0Assistance 3,670 5,510 1,840 49.96%
2.86%
2.60%
4.14%
2.94%
2.90%
3.86%1.76%6.33%6.27%
Industry&Outlook&(Top&10&Most&Growing&Industries)Projected&Annual&Growth&
Rate2.76%

7
Occupational Outlook for Workforce Investment Area – Cobb County
SOC$Code Occupation$ 2008$Base$Employment
2018$Projected$Employment
Total$Change$in$Employment$
Percent$Change$in$Employment
Annual$Growth$Rate
Annual$Openings,$2008D2018
43#4051 Customer/Service/Representatives 9,180 11,860 2,680 29.28% 2.60% 53013#1111 Management/Analysts 6,240 8,640 2,400 38.59% 3.32% 35043#9061 Office/Clerks,/General 7,120 8,630 1,510 21.18% 1.94% 280
25#2021 Elementary/School/Teachers,/Except/Special/Education 3,410 4,690 1,280 37.61% 3.24% 210
41#2031 Retail/Salespersons 12,600 13,840 1,240 9.88% 0.95% 510
43#6011 Executive/Secretaries/and/Administrative/Assistants 5,620 6,860 1,240 22.01% 2.01% 210
53#7062 Laborers/and/Freight,/Stock,/and/Material/Movers,/Hand 6,540 7,680 1,140 17.41% 1.62% 320
39#9011 Child/Care/Workers 2,920 3,970 1,050 36.08% 3.13% 18015#1051 Computer/Systems/Analysts 3,220 4,220 1,000 30.87% 2.73% 190
41#4012Sales/Representatives,/Wholesale/and/Manufacturing,/Except/Technical/and/
Scientific/Products5,950 6,940 990 16.62% 1.55% 230
43#3031 Bookkeeping,/Accounting,/and/Auditing/Clerks 5,240 6,200 960 18.18% 1.68% 180
25#9041 Teacher/Assistants 2,800 3,670 870 31.10% 2.74% 14047#2061 Construction/Laborers 4,720 5,550 830 17.65% 1.64% 12043#3011 Bill/and/Account/Collectors 2,410 3,230 820 34.28% 2.99% 12013#2011 Accountants/and/Auditors 3,700 4,510 810 21.98% 2.01% 140
Top$15$Highest$Growth$Occupations$(Most$Total$Growth,$2008D2018)
Industry Outlook for Workforce Investment Area – DeKalb County
NAICS&Code Industry& 2008&Base&
Employment2018&Projected&Employment
Total&Change&in&Employment
Percent&Change&in&Employment
6110 Educational.Services 33,730 40,940 7,210 21.36%6240 Social.Assistance 6,240 9,020 2,780 44.51%6230 Nursing.and.Residential.Care.Facilities 4,010 6,680 2,670 66.44%6220 Hospitals 12,820 14,660 1,840 14.39%
8130 Religious,.Grantmaking,.Civic,.Professional,.and.Similar.Org 8,780 10,580 1,800 20.54%
5610 Administrative.and.Support.Services 22,710 23,730 1,020 4.46%6210 Ambulatory.Health.Care.Services 11,610 12,310 700 6.01%4840 Truck.Transportation 5,810 6,360 550 9.48%5410 Professional,.Scientific,.and.Technical.Services 19,950 20,490 540 2.70%9993 Local,.Excluding.Education.and.Hospitals 10,600 11,070 470 4.37%
0.91%0.27%0.43%
3.75%5.23%1.35%
1.89%
0.44%0.59%
Industry&Outlook&(Top&10&Most&Growing&Industries)Projected&Annual&Growth&Rate
1.95%
Occupational Outlook for Workforce Investment Area – DeKalb County
SOC$Code Occupation$ 2008$Base$Employment
2018$Projected$Employment
Total$Change$in$Employment$
Percent$Change$in$Employment
Annual$Growth$Rate
Annual$Openings,$2008D2018
29#1111 Registered-Nurses 5,630 6,780 1,150 20.54% 1.89% 21031#1012 Nursing-Aides,-Orderlies,-and-Attendants 2,860 3,870 1,010 35.27% 3.07% 13039#9011 Child-Care-Workers 2,940 3,920 980 33.33% 2.92% 18043#4051 Customer-Service-Representatives 8,040 8,940 900 11.22% 1.07% 31013#1111 Management-Analysts 5,100 5,700 600 11.78% 1.12% 15031#1011 Home-Health-Aides 880 1,410 530 59.28% 4.76% 6021#1093 Social-and-Human-Service-Assistants 1,270 1,750 480 37.59% 3.24% 7025#9041 Teacher-Assistants 2,590 3,050 460 17.81% 1.65% 9025#2011 Preschool-Teachers,-Except-Special-Education 1,340 1,760 420 31.10% 2.74% 60
29#2061Licensed-Practical-and-Licensed-Vocational-
Nurses1,750 2,160 410 23.80% 2.16% 90
53#3032 Truck-Drivers,-Heavy-and-Tractor#Trailer 5,170 5,560 390 7.42% 0.72% 13039#9021 Personal-and-Home-Care-Aides 1,090 1,460 370 33.64% 2.94% 6043#9061 Office-Clerks,-General 7,000 7,300 300 4.40% 0.43% 160
43#6011Executive-Secretaries-and-Administrative-
Assistants5,250 5,550 300 5.65% 0.55% 110
15#1031 Computer-Software-Engineers,-Applications 1,220 1,510 290 24.06% 2.18% 50
Top$15$Highest$Growth$Occupations$(Most$Total$Growth,$2008D2018)

8
Industry Outlook for Workforce Investment Area – Fulton County
NAICS&Code Industry& 2008&Base&Employment
2018&Projected&Employment
Total&Change&in&Employment
Percent&Change&in&Employment
5410 Professional,0Scientific,0and0Technical0Services 77,640 94,780 17,140 22.07%
6110 Educational0Services 47,950 60,780 12,830 26.77%6220 Hospitals 28,630 37,980 9,350 32.67%7220 Food0Services0and0Drinking0Places 55,790 64,980 9,190 16.46%6210 Ambulatory0Health0Care0Services 22,960 28,190 5,230 22.82%
8130 Religious,0Grantmaking,0Civic,0Professional,0and0Similar0Org 15,290 19,590 4,300 28.16%
5610 Administrative0and0Support0Services 58,200 62,430 4,230 7.27%5310 Real0Estate 15,810 19,420 3,610 22.86%6240 Social0Assistance 8,780 11,210 2,430 27.64%5510 Management0of0Companies0and0Enterprises 16,350 18,570 2,220 13.60%
2.08%2.47%1.28%
2.40%2.87%1.54%2.08%
2.51%
0.70%
Industry&Outlook&(Top&10&Most&Growing&Industries)
Projected&Annual&Growth&Rate
2.01%
Occupational Outlook for Workforce Investment Area – Fulton County
SOC$Code Occupation$ 2008$Base$Employment
2018$Projected$Employment
Total$Change$in$Employment$
Percent$Change$in$Employment
Annual$Growth$Rate
Annual$Openings,$2008D2018
15#1051 Computer-Systems-Analysts 10,450 12,470 2,020 19.27% 1.78% 48015#1031 Computer-Software-Engineers,-Applications 5,420 7,350 1,930 35.59% 3.09% 270
43#6011 Executive-Secretaries-and-Administrative-Assistants 15,400 17,260 1,860 12.02% 1.14% 430
35#3031 Waiters-and-Waitresses 13,430 15,280 1,850 13.79% 1.30% 91043#9061 Office-Clerks,-General 17,180 18,900 1,720 10.03% 0.96% 49041#2031 Retail-Salespersons 20,780 22,460 1,680 8.10% 0.78% 81013#2011 Accountants-and-Auditors 9,770 11,120 1,350 13.81% 1.30% 310
25#2021 Elementary-School-Teachers,-Except-Special-Education 4,190 5,400 1,210 28.88% 2.57% 210
43#3031 Bookkeeping,-Accounting,-and-Auditing-Clerks 11,570 12,640 1,070 9.20% 0.88% 290
31#9092 Medical-Assistants 2,770 3,710 940 34.03% 2.97% 120
15#1081 Network-Systems-and-Data-Communications-Analysts 2,260 3,190 930 40.81% 3.48% 140
39#9011 Child-Care-Workers 3,410 4,330 920 26.77% 2.40% 19031#1012 Nursing-Aides,-Orderlies,-and-Attendants 4,900 5,770 870 17.79% 1.65% 13025#9041 Teacher-Assistants 3,990 4,850 860 21.60% 1.97% 15041#9022 Real-Estate-Sales-Agents 4,240 5,070 830 19.53% 1.80% 150
Top$15$Highest$Growth$Occupations$(Most$Total$Growth,$2008D2018)
Industry Outlook for Workforce Investment Area – Metro Atlanta
NAICS&Code Industry& 2008&Base&Employment
2018&Projected&Employment
Total&Change&in&Employment
Percent&Change&in&Employment
6110 Educational.Services 61,090 83,210 22,120 36.21%7220 Food.Services.and.Drinking.Places 55,790 74,430 18,640 33.42%6210 Ambulatory.Health.Care.Services 21,750 38,230 16,480 75.80%
5410 Professional,.Scientific,.and.Technical.Services 34,130 50,540 16,410 48.09%
5610 Administrative.and.Support.Services 43,880 57,840 13,960 31.83%4840 Truck.Transportation 10,220 16,660 6,440 62.96%4520 General.Merchandise.Stores 18,010 24,240 6,230 34.59%8120 Personal.and.Laundry.Services 5,600 11,030 5,430 96.91%6240 Social.Assistance 9,170 14,480 5,310 57.91%
6230 Nursing.and.Residential.Care.Facilities 5,690 10,850 5,160 90.79%
7.01%4.67%
6.67%
2.93%5.80%
4.00%
2.80%5.00%3.02%
Industry&Outlook&(Top&10&Most&Growing&Industries)
Projected&Annual&Growth&Rate
3.14%

9
Occupational Outlook for Workforce Investment Area – Metro Atlanta
SOC$Code Occupation$ 2008$Base$Employment
2018$Projected$Employment
Total$Change$in$Employment$
Percent$Change$in$Employment
Annual$Growth$Rate
Annual$Openings,$2008D2018
41#2031 Retail-Salespersons 29,390 38,430 9,040 30.76% 2.72% 1,800
35#3021Combined-Food-Preparation-and-
Serving-Workers,-Including-Fast-Food18,100 25,700 7,600 41.99% 3.57% 1,100
43#4051 Customer-Service-Representatives 18,530 25,420 6,890 37.19% 3.21% 1,21053#3032 Truck-Drivers,-Heavy-and-Tractor#Trailer 10,970 15,890 4,920 44.87% 3.78% 69013#1111 Management-Analysts 8,810 13,030 4,220 47.92% 3.99% 57035#3031 Waiters-and-Waitresses 11,540 15,310 3,770 32.72% 2.87% 1,01029#1111 Registered-Nurses 6,900 10,640 3,740 54.37% 4.44% 49043#9061 Office-Clerks,-General 12,600 16,150 3,550 28.21% 2.52% 590
25#2021Elementary-School-Teachers,-Except-
Special-Education8,380 11,840 3,460 41.26% 3.51% 530
41#2011 Cashiers 17,090 20,020 2,930 17.17% 1.60% 1,100
53#7062Laborers-and-Freight,-Stock,-and-
Material-Movers,-Hand14,910 17,790 2,880 19.28% 1.78% 770
39#9011 Child-Care-Workers 6,380 9,140 2,760 43.34% 3.67% 460
39#5012Hairdressers,-Hairstylists,-and-
Cosmetologists2,960 5,640 2,680 90.70% 6.67% 310
43#3031Bookkeeping,-Accounting,-and-Auditing-
Clerks10,030 12,670 2,640 26.28% 2.36% 420
43#6011Executive-Secretaries-and-Administrative-Assistants
9,190 11,720 2,530 27.47% 2.46% 400
Top$15$Highest$Growth$Occupations$(Most$Total$Growth,$2008D2018)
Compiled by Hanover Research Group Source: Georgia Department of Labor, Labor Market Explorer, Industrial Outlooks http://explorer.dol.state.ga.us/gsipub/index.asp?docid=386 Source: Georgia Department of Labor, Labor Market Explorer, Occupational Outlooks http://explorer.dol.state.ga.us/gsipub/index.asp?docid=389

10
From Georgia Competitiveness Initiative Report January 2012 http://www.georgiacompetitiveness.org/uploads/GCI_Report.pdf

11
RESOURCES Georgia Department of Local Area Profile for Atlanta Region 3 http://explorer.dol.state.ga.us/mis/Profiles/rc/03%20-%20Atlanta%20Regional%20Commission.pdf Occupational Outlook Displays long-term and short-term projected occupational trends for the entire state of Georgia as well as for the Workforce Investment Areas. http://explorer.dol.state.ga.us/gsipub/index.asp?docid=389 Occupational Trend Resources http://www.dol.state.ga.us/wp/occupational_career_trends.htm Industry Outlook Displays long-term and short-term projected industry trends for the entire state of Georgia as well as for the Workforce Investment Areas. http://explorer.dol.state.ga.us/gsipub/index.asp?docid=386 Local Area Profiles by County, Workforce Investment Areas, Metropolitan Statistical Areas, and Regional Commission http://explorer.dol.state.ga.us/mis/profiles.htm Industry Cluster Analysis “With this tool, county-level industry cluster data are accessible in a user-friendly format via the Internet. This tool allows users to combine individual counties to define custom regions. Users can also use this tool to quickly compare their region with others. The industry cluster tool focuses on 17 clusters across the United States in order to provide a framework that is easy to analyze and understand. This tool can assist users in identifying the basic competitive strengths in their regional economy. The data enable a practitioner to extend and deepen the analysis of a region.” http://www.statsamerica.org/innovation/anydata/index.asp Innovation Index and Map “The ability of a regional economy to innovate drives healthy growth, but innovation is a complex concept. How can you measure innovation in order to improve it? This index provides leaders and practitioners with the first tool for comparing regional innovation performance with that of the United States, a state, or other regions. Like the cluster tool, the primary advantage of the innovation index is its flexibility. Users can design their own region and easily make comparisons across regions.” http://www.statsamerica.org/innovation/innovation_index/region-select.html http://www.statsamerica.org/innovation/index_map/ Occupational Cluster Analysis “Occupation cluster analysis is a relatively new approach in regional development. In contrast to industry clusters that focus on what businesses produce, occupation clusters focus on the knowledge, skills and abilities of the individuals who work for those businesses. Like the industrial cluster tool, this tool enables users to explore their regional economy from a different perspective. Like the other tools, its main advantage is flexibility: users can define custom regions and make comparisons easily.” http://www.statsamerica.org/innovation/anydata/index.asp?T1 Source of Descriptions:
12
A Practitioner’s Guide to Economic Development Tools for Regional Competitiveness in a Knowledge-Based Economy http://www.statsamerica.org/innovation/guide/practitioners_guide.pdf Complete College America, State Profile: Georgia http://www.completecollege.org/docs/Georgia.pdf Georgia Competitiveness Initiative Report January 2012 http://www.georgiacompetitiveness.org/uploads/GCI_Report.pdf Georgia Regional Economic Analysis Project This website features data and regional economic tools of analysis covering the 159 Georgia counties and Georgia's 15 metropolitan statistical areas (MSAs). The site contains the following:
− Comparative Trends Analysis − Comparative Economic Indicators − Major Components of Income − Shift-Share Analysis − Industry Structure and Performance − Income Structure and Growth − Leading, Slipping, Gaining and Lagging (LSGL) Analysis of Employment Industry Growth − Data Tables − Bureau of Economic Analysis Regional Fact Sheets
http://georgia.reaproject.org/
Related Documents