Regional Patterns: Winners and Losers Bernard M. Markstein Director of Forecasting October, 2006

Regional Patterns: Winners and Losers Bernard M. Markstein Director of Forecasting October, 2006.
Jan 17, 2016
Welcome message from author
This document is posted to help you gain knowledge. Please leave a comment to let me know what you think about it! Share it to your friends and learn new things together.
Transcript

Regional Patterns:Winners and Losers
Bernard M. MarksteinDirector of Forecasting
October, 2006

History and
Forecast
Starts Growth Q4 05/Q4 04 (%)
10.0 to 0
0 to -10.0
Less Than -10.0
More than 10.0
US: 4.8%

Starts Growth Q4 06/Q4 05 (%)
10.0 to 0
0 to -10.0
Less Than -10.0
More than 10.0
US: -20.1%
Starts Growth Q4 07/Q4 06 (%)
10.0 to 0
0 to -10.0
Less Than -10.0
More than 10.0
US: -0.6%
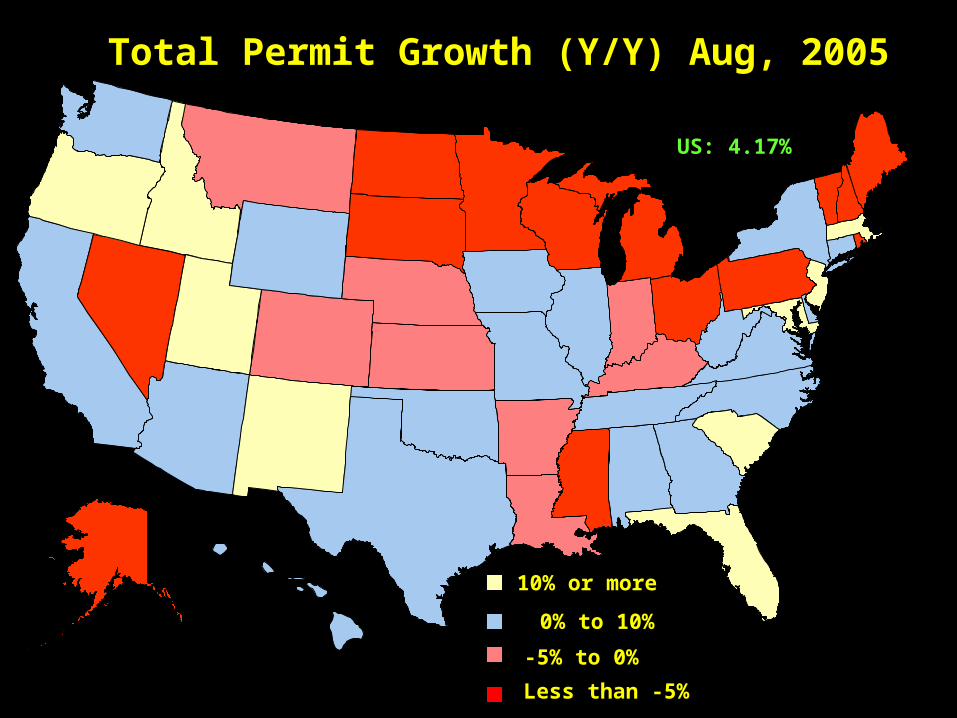
Total Permit Growth (Y/Y) Aug, 2005
0% to 10%
-5% to 0%
Less than -5%
10% or more
US: 4.17%
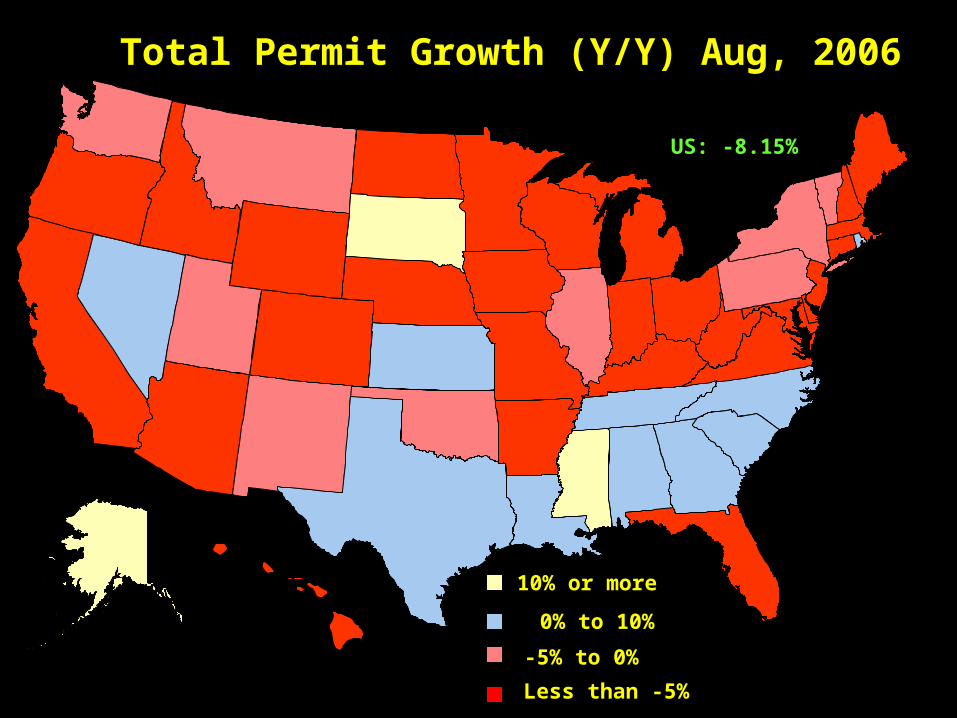
Total Permit Growth (Y/Y) Aug, 2006
0% to 10%
-5% to 0%
Less than -5%
10% or more
US: -8.15%

Starts per Capita 2004
6.7 to 10.0
5.0 to 6.7
Less than 5.0
10.0 or more
US: 6.6

Starts per Capita 2005
6.7 to 10.0
5.0 to 6.7
Less than 5.0
10.0 or more
US: 7.0
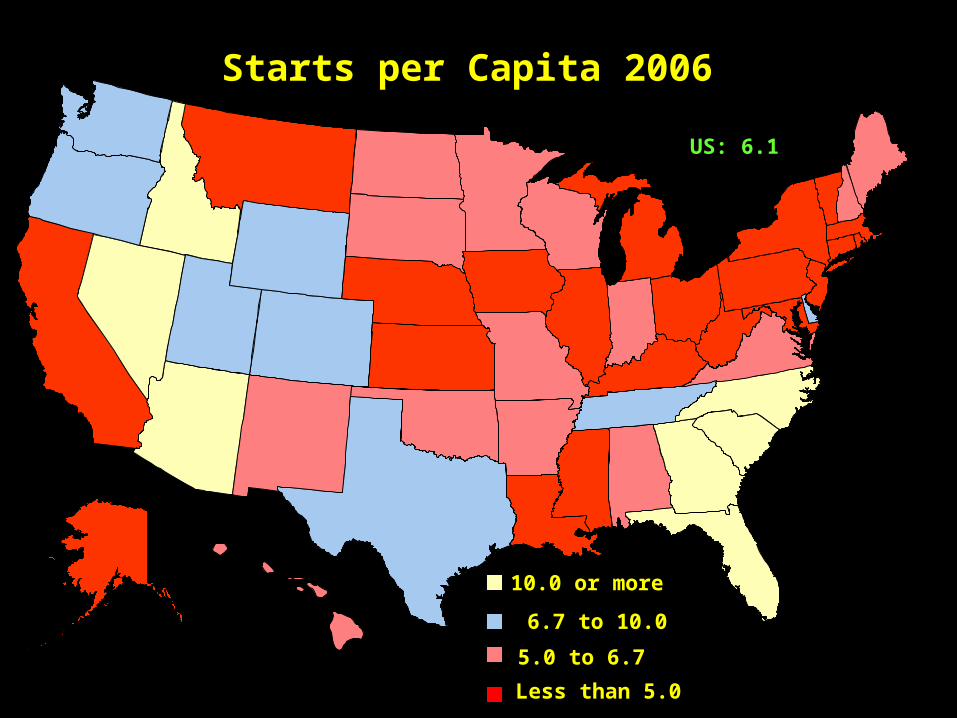
Starts per Capita 2006
6.7 to 10.0
5.0 to 6.7
Less than 5.0
10.0 or more
US: 6.1

Starts per Capita 2007
6.7 to 10.0
5.0 to 6.7
Less than 5.0
10.0 or more
US: 5.4

Forces driving regional housing
demand
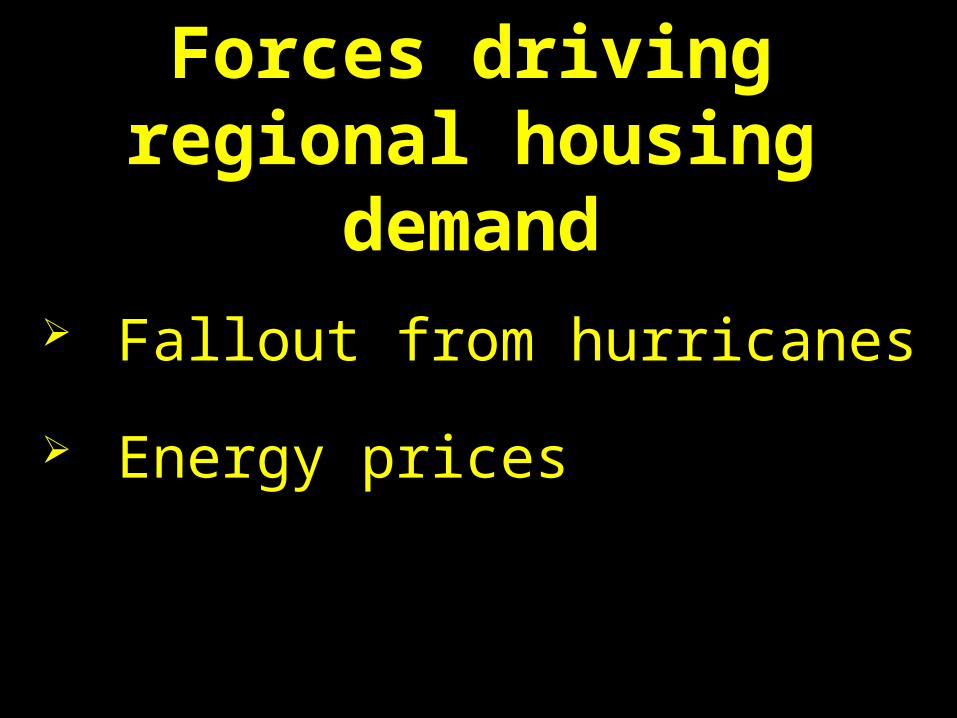
Forces driving regional housing demand
Fallout from hurricanes
Energy prices

Forces driving regional housing demand
Population growth and
household formation
Related Documents