Commonwealth of Massachusetts Executive Office of Labor and Workforce Development Joanne F. Goldstein MassLMI Labor Market Information Regional LMI Profile Massachusetts Department of Development Workforce Annual Profile for Berkshire County Workforce Area May 2010

Welcome message from author
This document is posted to help you gain knowledge. Please leave a comment to let me know what you think about it! Share it to your friends and learn new things together.
Transcript

Commonwealth of Massachusetts
Executive Office of Labor and Workforce Development Joanne F. Goldstein
MassLMILabor Market Information
Regional LMI Profile
Massachusetts Department of
DevelopmentWorkforce
Annual Profile for Berkshire County Workforce Area
May 2010
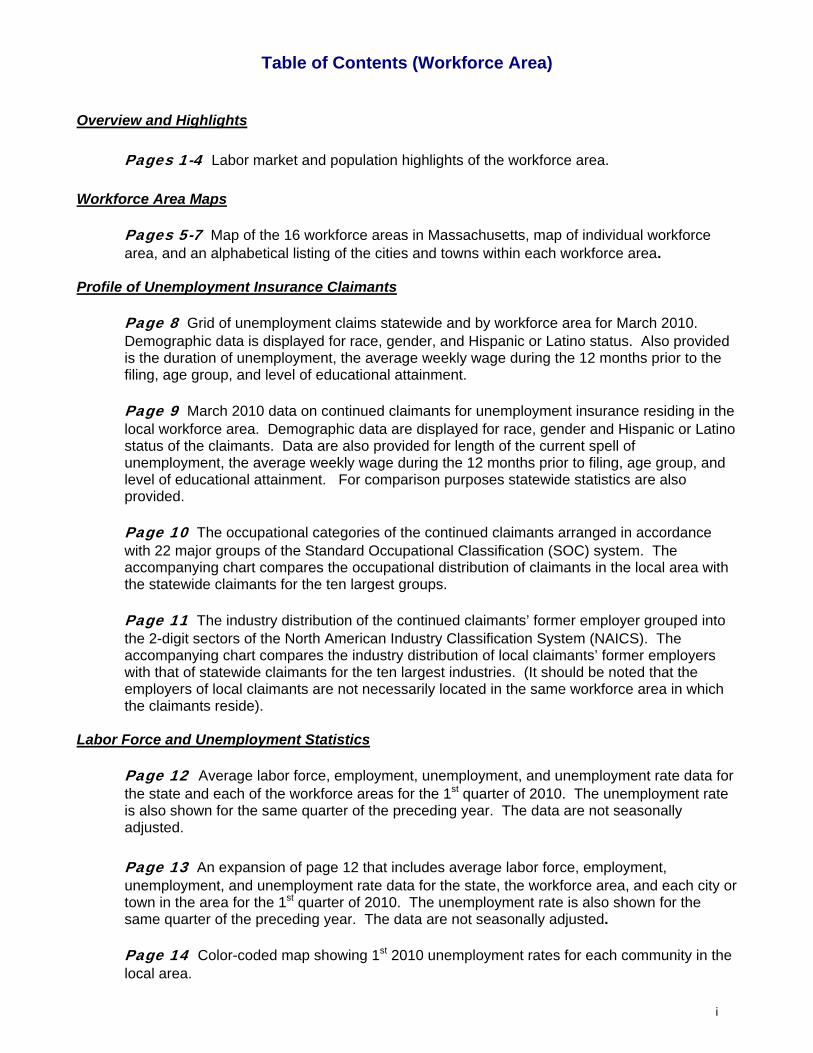
Table of Contents (Workforce Area) Overview and Highlights
Pages 1-4 Labor market and population highlights of the workforce area. Workforce Area Maps
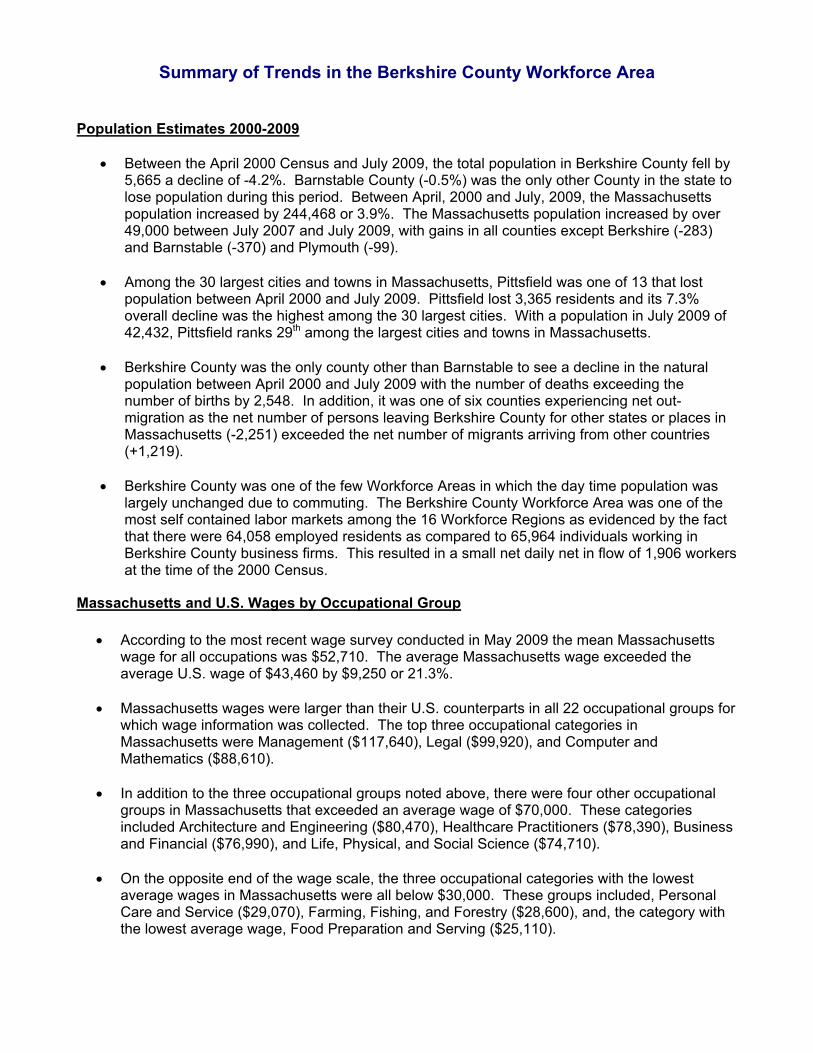
Pages 5-7 Map of the 16 workforce areas in Massachusetts, map of individual workforce area, and an alphabetical listing of the cities and towns within each workforce area.
Profile of Unemployment Insurance Claimants
Page 8 Grid of unemployment claims statewide and by workforce area for March 2010. Demographic data is displayed for race, gender, and Hispanic or Latino status. Also provided is the duration of unemployment, the average weekly wage during the 12 months prior to the filing, age group, and level of educational attainment.
Page 9 March 2010 data on continued claimants for unemployment insurance residing in the local workforce area. Demographic data are displayed for race, gender and Hispanic or Latino status of the claimants. Data are also provided for length of the current spell of unemployment, the average weekly wage during the 12 months prior to filing, age group, and level of educational attainment. For comparison purposes statewide statistics are also provided.
Page 10 The occupational categories of the continued claimants arranged in accordance with 22 major groups of the Standard Occupational Classification (SOC) system. The accompanying chart compares the occupational distribution of claimants in the local area with the statewide claimants for the ten largest groups.
Page 11 The industry distribution of the continued claimants’ former employer grouped into the 2-digit sectors of the North American Industry Classification System (NAICS). The accompanying chart compares the industry distribution of local claimants’ former employers with that of statewide claimants for the ten largest industries. (It should be noted that the employers of local claimants are not necessarily located in the same workforce area in which the claimants reside).
Labor Force and Unemployment Statistics
Page 12 Average labor force, employment, unemployment, and unemployment rate data for the state and each of the workforce areas for the 1st quarter of 2010. The unemployment rate is also shown for the same quarter of the preceding year. The data are not seasonally adjusted. Page 13 An expansion of page 12 that includes average labor force, employment, unemployment, and unemployment rate data for the state, the workforce area, and each city or town in the area for the 1st quarter of 2010. The unemployment rate is also shown for the same quarter of the preceding year. The data are not seasonally adjusted.
Page 14 Color-coded map showing 1st 2010 unemployment rates for each community in the local area.
i

Area Size Class Table
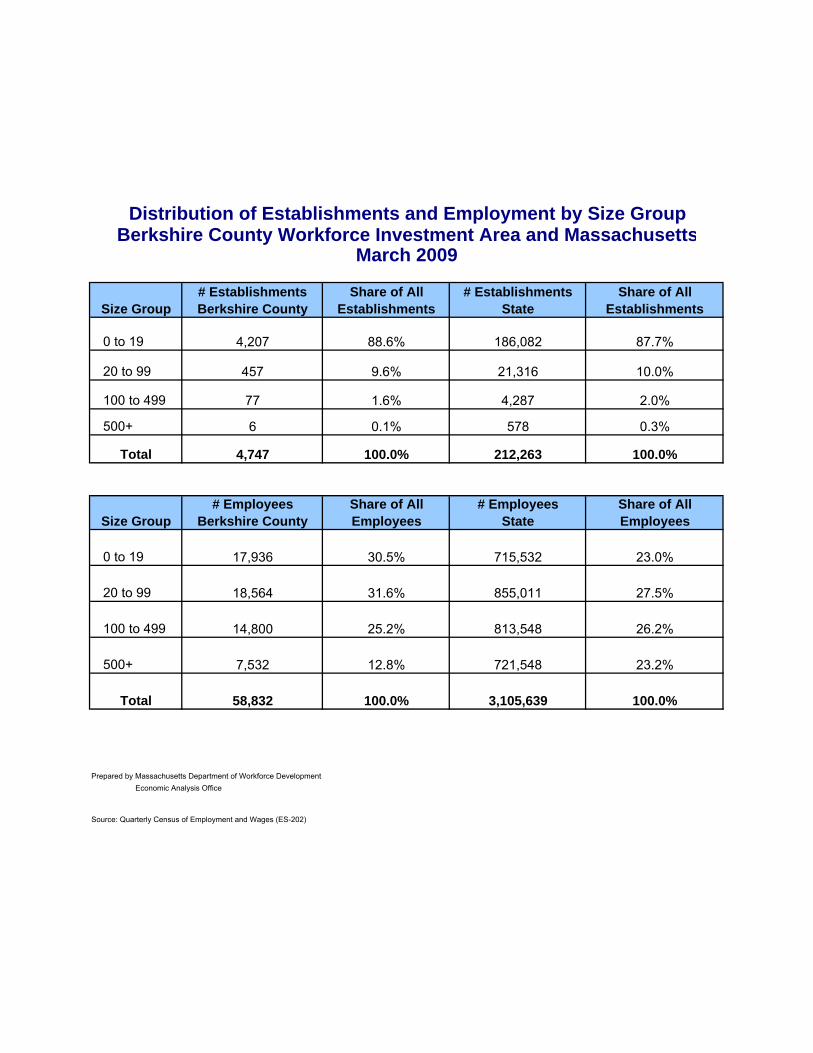
Page 15 Data on the distribution of establishments and employment in March 2009, by size class, for the workforce area and the state.
Industry Employment and Wage Statistics
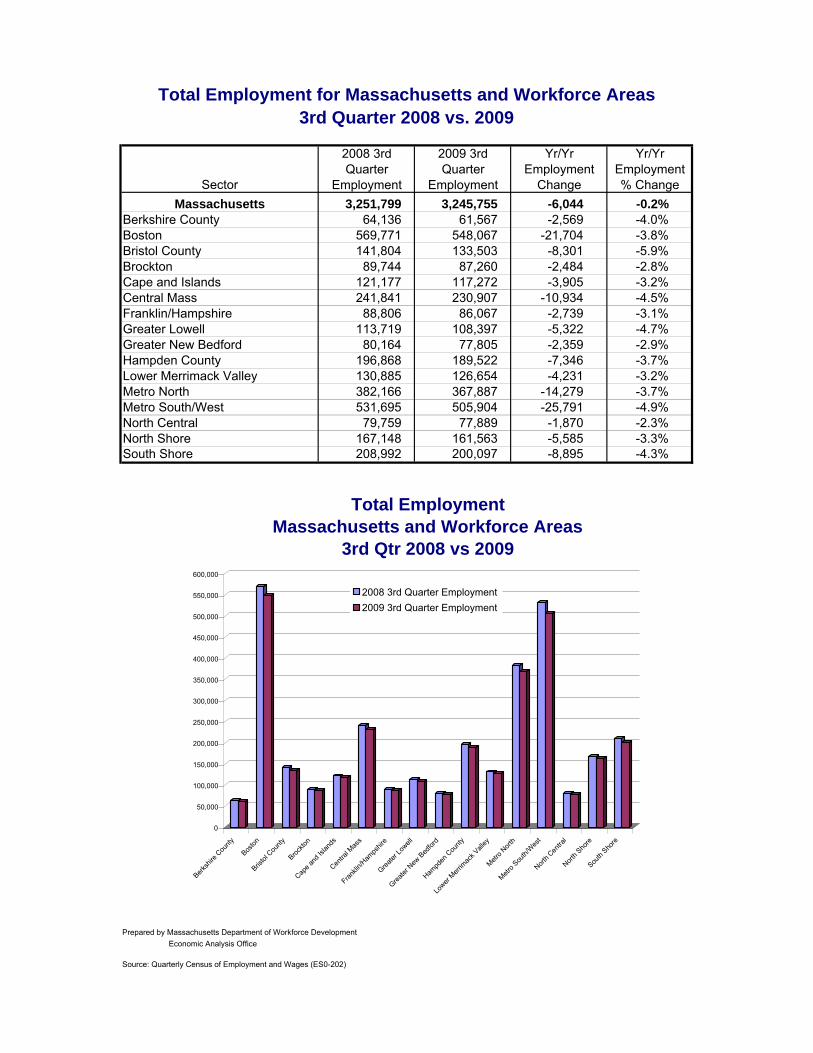
Page 16 Total employment data for the state and each of the workforce areas for the 3rd quarter of 2009 and the prior year quarter, with numerical and percent changes and bar charts. The data represent jobs in U.I.-covered establishments located in the local area.
Page 17 Total employment by major industry for the workforce area for the 3rd quarter of 2009 and the prior year quarter, with numerical and percent changes and bar charts. The data represent jobs in U.I.-covered establishments located in the local area.
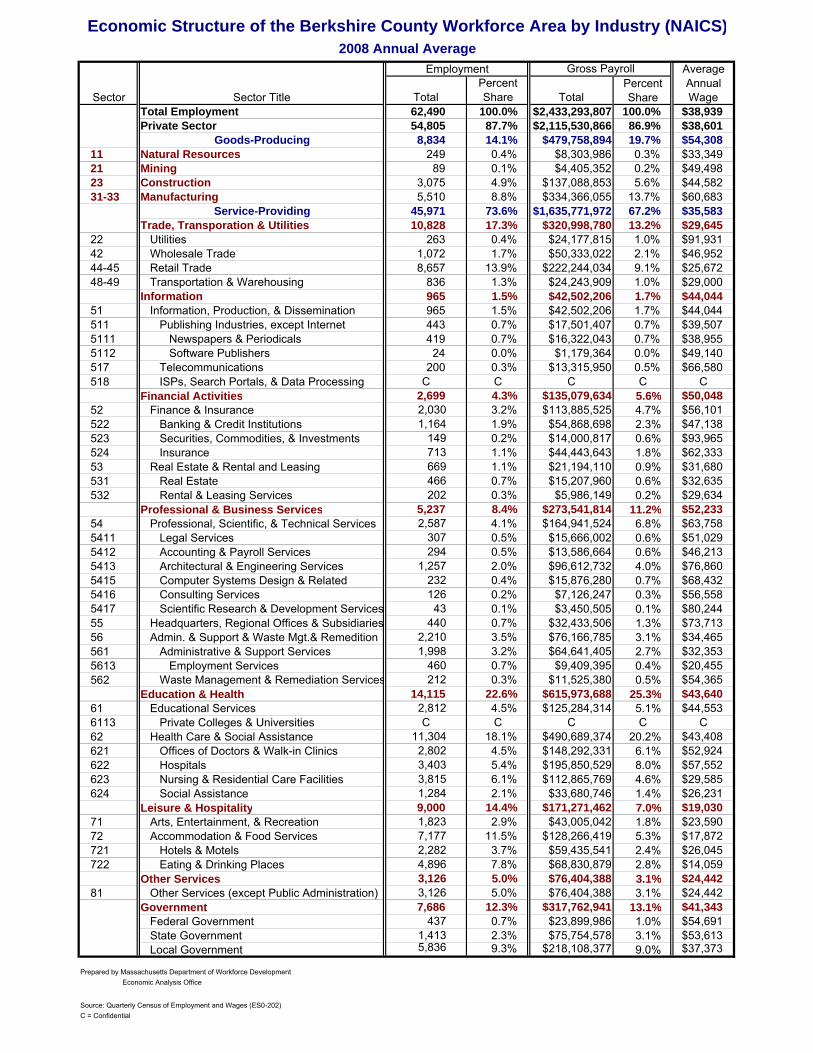
Page 18 Annual average employment, gross payroll, and average annual wage for the workforce area by detailed industry for 2008. The data represent average annual employment and wages in U.I.-covered establishments located in the local area, and is by two-digit NAICS code and selected three-digit and four-digit NAICS code.
Location Quotient Tables
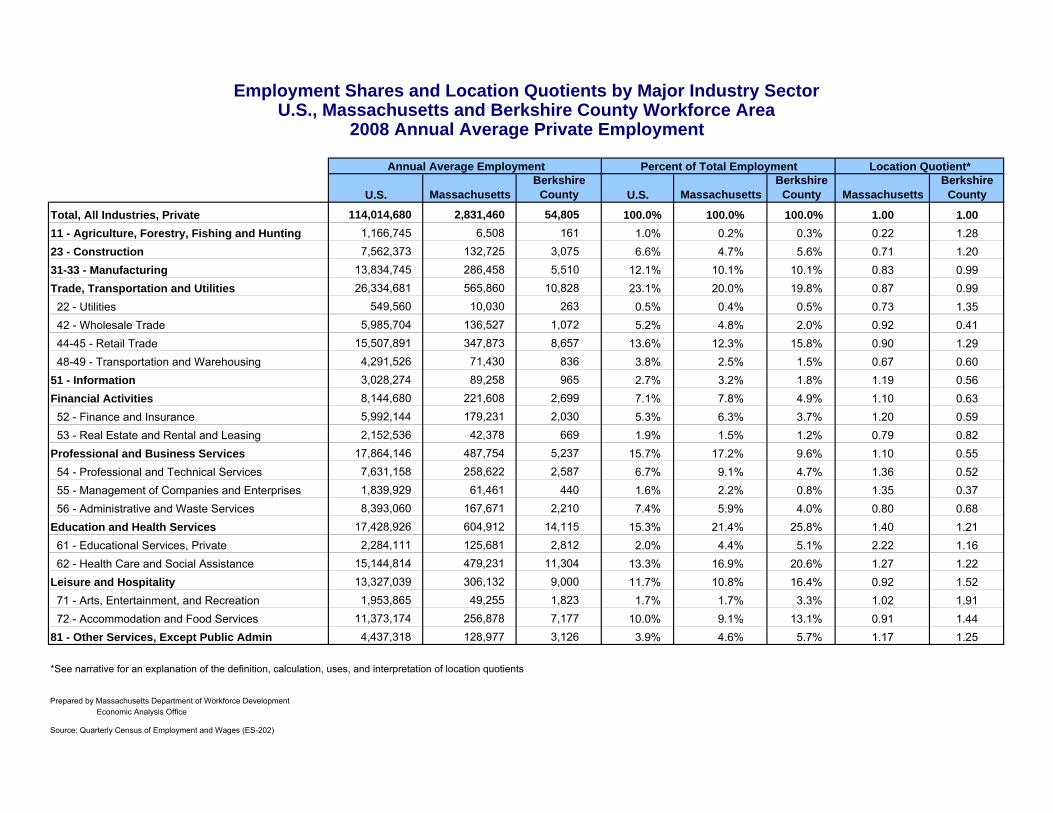
Pages 19-21 Tables showing the concentration of annual average employment in 2008, by industry sector, for the workforce area relative to the state and for the state relative to the nation, with a narrative explanation of the definition, computation, uses, and interpretation of location quotients.
Industry and Occupational Projections, 2006 to 2016 Page 22 Chart showing total 2016 projected job openings, including the percent of job openings due to new job growth and openings due to replacement demand. Page 23 Chart showing the 20 fastest growing industries, 2006-2016. Page 24 Chart showing industries generating the most new jobs through 2016. Page 25 Chart showing the 20 fastest growing occupations, 2006-2016. Page 26 Chart of the occupations projected to generate the most new jobs through 2016. Occupational Wage Data
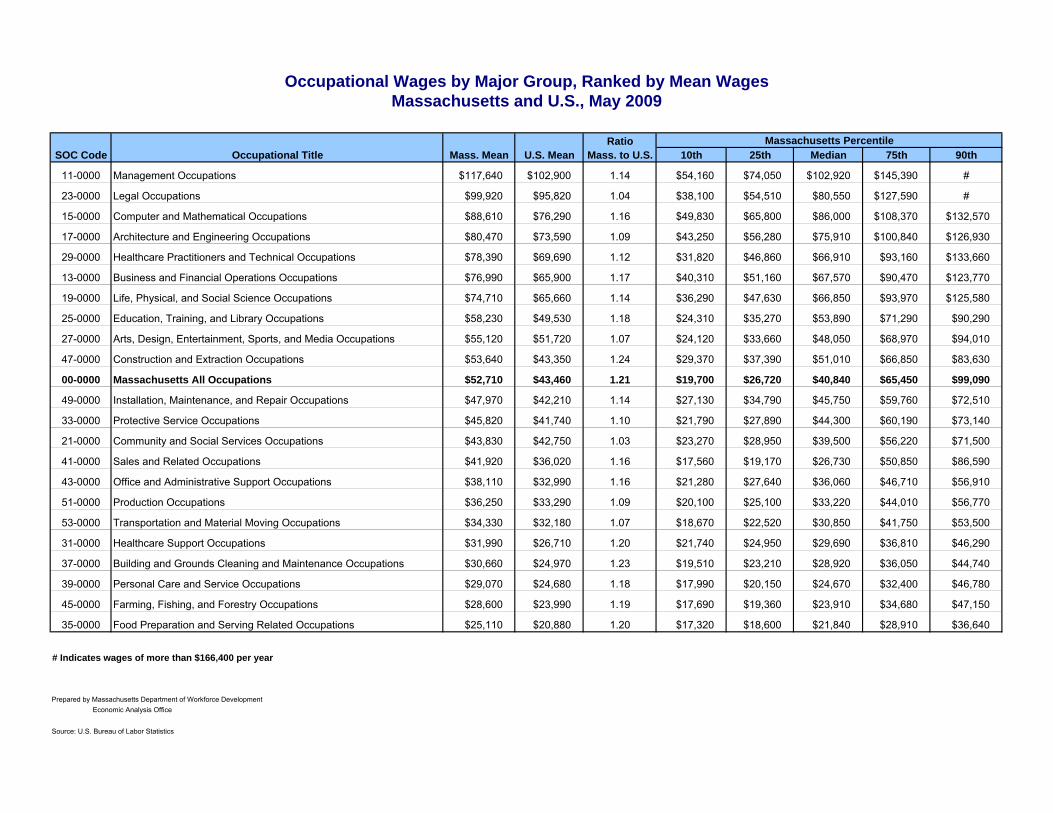
Page 27 Table comparing May 2009 wage data by the 22 major groups of the Standard Occupational Classification (SOC) system for Massachusetts and the nation.
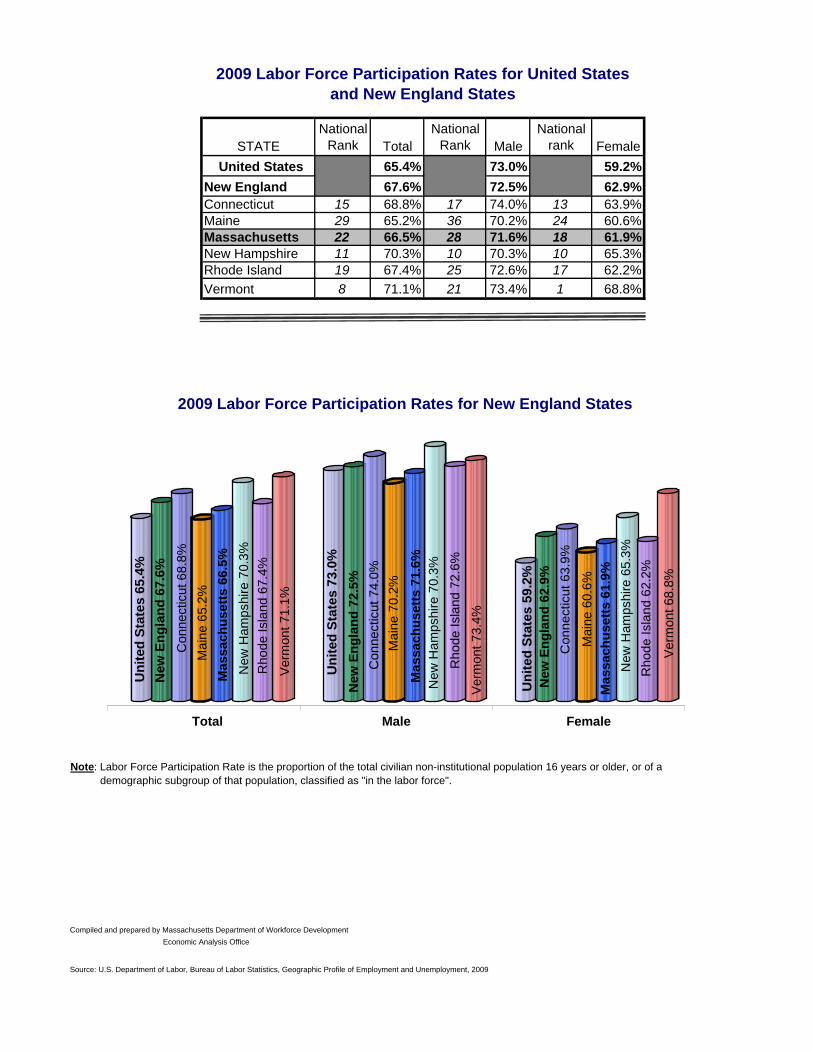
Labor Force Participation Rates Page 28 Total, male and female labor force participation rate trends for Massachusetts and U.S. from 1975 to 2008. Data are presented in table format and line chart format. Page 29 Total, male and female 2008 labor force participation rates for New England states, including national rank. Data are presented in table format and column chart format.
ii

2000-2009 Census Population Data
Page 30 Population estimates by year for Massachusetts from April 1, 2000 to July 1, 2009, and its 16 workforce areas from April 1, 2000 to July 1, 2009, with net and percent changes. Page 31 Population estimates by year for workforce area by city and town from April 1, 2000 to July 1, 2009, with net and percent changes. Page 32 Population estimates by year for Massachusetts and its 14 counties from April 1, 2000 to July 1, 2009, with net and percent changes.
Page 33 Components of population changes (births, deaths, net international migration, and net internal migration) for Massachusetts and its 14 counties from April 1, 2000 to July 1, 2009.
Journey to Work Data from the 2000 Census
Page 34 Commuting pattern data from the 2000 U.S. Census, showing where the area residents work. Totals and percent distributions show the commuting patterns to each Massachusetts workforce area and to neighboring states.
Page 35 Commuting pattern data from the 2000 U.S. Census, showing where the area workers reside (the flip side of page 34). Totals and percent distributions show the commuting patterns from each Massachusetts workforce area and from neighboring states. (Journey to work data for each city and town in Massachusetts are available electronically on request).
Daytime Population Data from the 2000 Census Page 36 Population data for the state, workforce area and all cities and towns within the area. The tables include total resident population, estimated daytime population, population changes due to commuting, and the employment/residence ratio. Page 37 Narrative explanation of terms, concepts and definitions of the data contained in the table.
iii

Summary of Trends in the Berkshire County Workforce Area
Profile of Unemployment Insurance Claimants
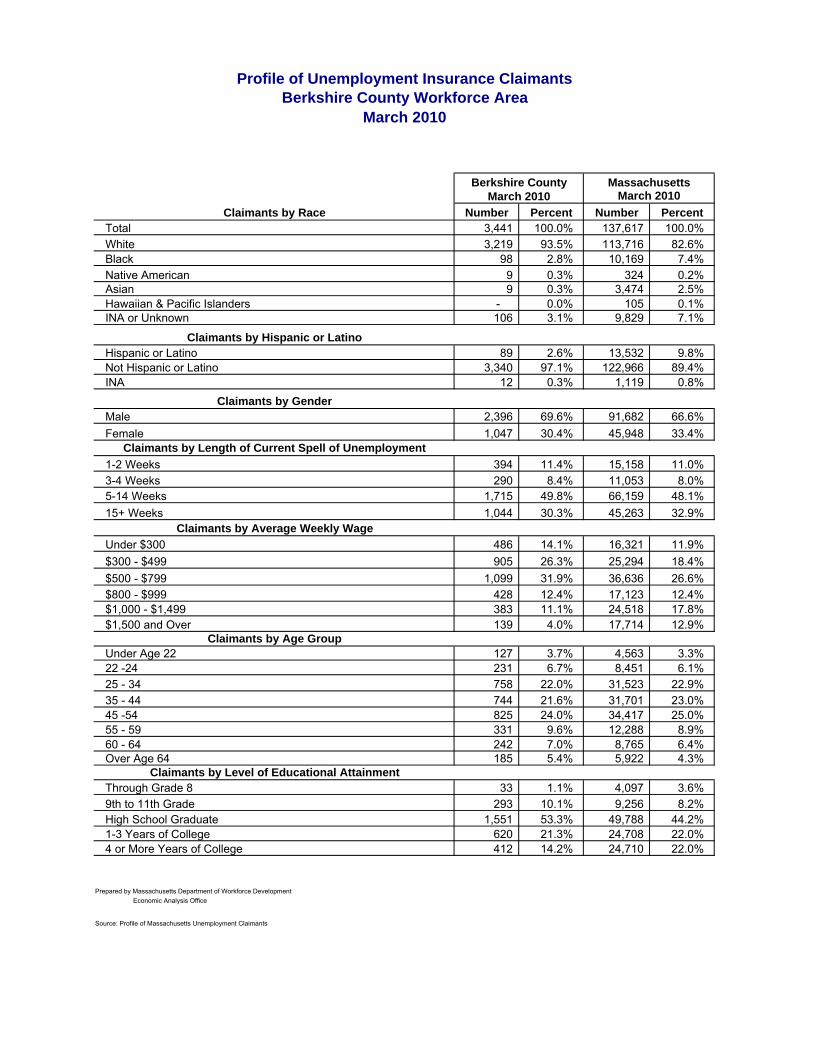
A total of 3,441 individuals were collecting regular Unemployment Insurance in the Berkshire County Workforce Area during March 2010, with 30.3% collecting for at least 15 weeks. The percentage collecting 15+ weeks was slightly below the statewide percentage of 32.9%.
Among the UI claimants in Berkshire County, 40.4% earned less than $500/week on their
previous job compared to 30.2% for Massachusetts as a whole. By contrast, only 15.2% of Berkshire County claimants had weekly wages in excess of $1000/week as opposed to 30.7% across the entire Commonwealth. Both of these comparisons reinforce the notion that previous wages for UI claimants in Berkshire County were substantially below their statewide counterparts.
With regard to age, 46.0% of Berkshire County claimants in March 2010 were 45 years or
older which was above the statewide share of 44.6%. The proportion of Berkshire County claimants that were high school dropouts (10.1%) was
slightly below the statewide share of 10.6%. At the same time, the percentage of Berkshire UI claimants that possessed at least a Bachelor’s Degree (12.7%) was considerably lower than their statewide counterparts (19.6%).
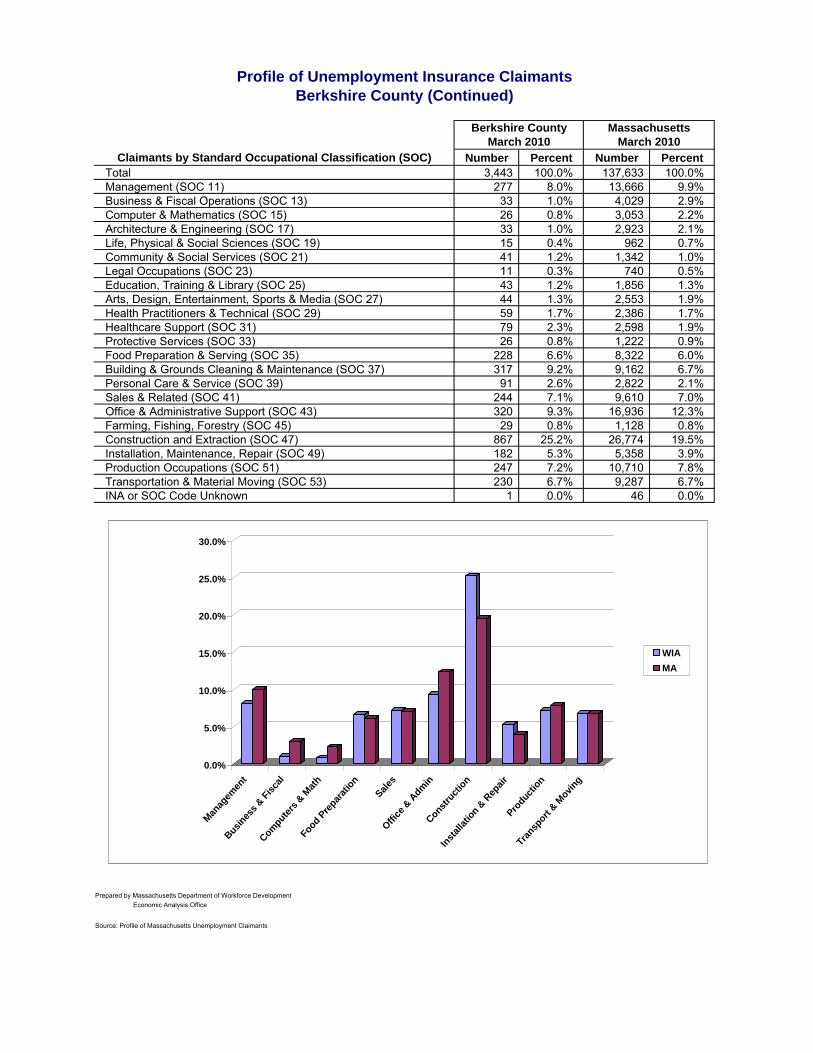
The largest occupational category, Construction (25.2%), accounted for one quarter of
Berkshire claimants. In addition, Office and Administrative Support (9.3%), Building and Grounds Cleaning and Maintenance (9.2%), Management (8.0%), and Production (7.2%) were also significant contributors to the Berkshire County UI claimant population.
From an industry perspective, Construction was the largest source of UI claims, representing
27.7% of the total claimant population, followed by Administrative Support and Waste Management Services (12.0%). In addition, Retail Trade (10.7%), Accommodation and Food Services (9.3%), and Manufacturing (8.6%), were large contributors to the UI claimant population. Collectively these five industry categories comprised 68.3% of the total Berkshire County claimant population.
Labor Force and Unemployment
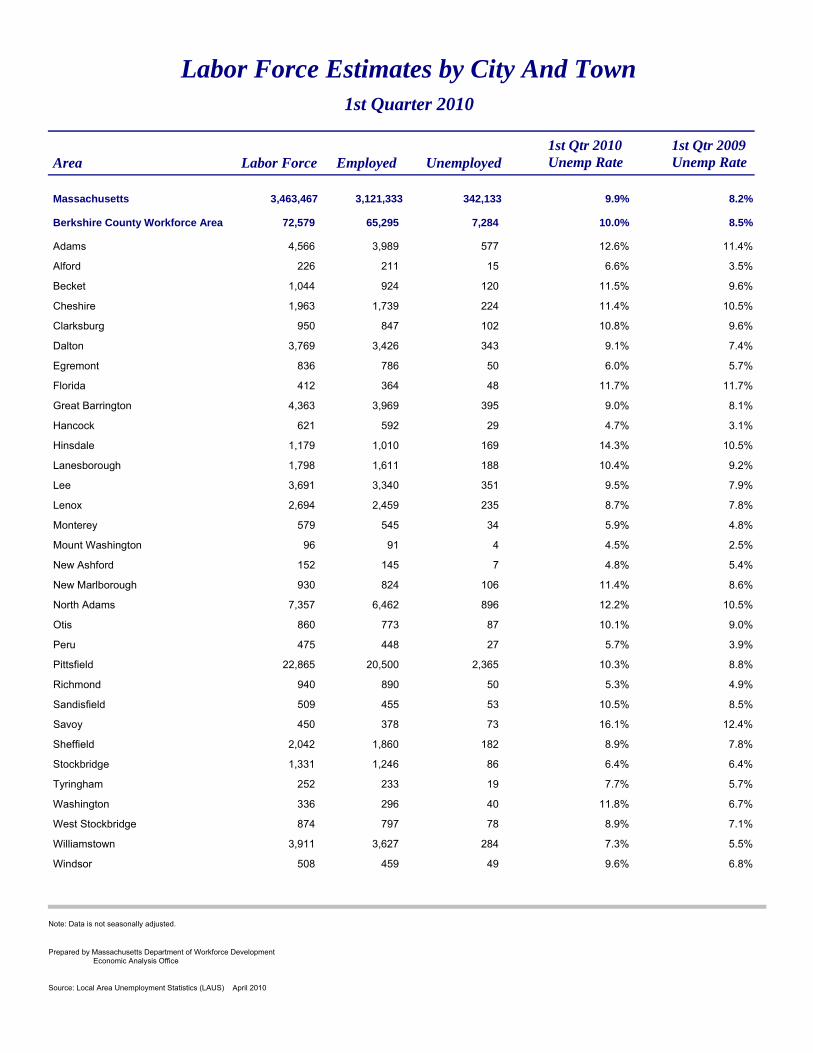
Every Workforce Area in the state experienced substantial increases in unemployment during
the past year. Between the first quarters of 2009 and 2010, the seasonally unadjusted unemployment rate in Berkshire County increased from 8.5% to 10.0%. A total of 7,284 Berkshire County residents were unemployed in first quarter 2010, an increase of 1,140 (18.5%) over the year. During this same period, the seasonally unadjusted unemployment rate in Massachusetts increased from 8.2% to 9.9%, representing 342,133 unemployed residents statewide, an increase of 62,477 (22.3%) over the year.
The number of employed persons in Berkshire County decreased by -660 (-1.0%) to a 2010
first quarter level of 65,295. Between the first quarters of 2009 and 2010, the number of employed persons in Massachusetts decreased by -4,457 (-0.1%).
During the period under review, the Berkshire County labor force increased by 479 (0.7%),
while the Massachusetts labor force increased by 58,020 (1.7%) to 3,463,462.
vgreen
Text Box
1

Summary of Trends in the Berkshire County Workforce Area
Employment by Firm Size
Small employers dominate the Berkshire County Workforce Area. Among the 4,747
establishments reporting employment in March 2009, 88.6% had fewer than 20 employees. These firms, however, accounted for just 30.5% (17,936) of the jobs located in Berkshire County.
In contrast to the small business employers, 83 establishments (1.7%) reported having at least
100 employees. These firms, however, were responsible for 38.0% (22,332) of all jobs located in Berkshire County. The share of employment among large employers in the region was well below the statewide share of 49.4%.
Industry Employment and Wage Trends
Between the third quarters of 2008 and 2009, the number of jobs in the Berkshire County Workforce Area decreased by -2,569 or -4.0%. In contrast, during this same period, the Massachusetts economy declined by -6,044 jobs, or -0.2%.
The largest sector, Health Care and Social Assistance, which comprised more than 1 in 6 jobs
(18.1%), was virtually unchanged over the year. Employment stood at 11,338 for the third quarter of 2009. Another major source of employment in Berkshire County was Government (12.3%), which added 215 jobs during the period under review to a total of 7,241, an increase of 3.1%. The entire increase occurred in State Government (224), while Federal and Local Government showed slight declines.
The second and third largest sectors in Berkshire County, Leisure and Hospitality (14.4%) and
Retail Trade (13.9%), both experienced declines. Between the third quarters of 2008 and 2009, the number of jobs in Leisure and Hospitality decreased by -353 (-3.4%), with virtually the entire decline coming in Accommodation and Food Services (-344). With regard to Retail Trade, -275 jobs were lost, representing a decrease of -3.1%.
There were more significant job losses in Berkshire County in a diverse array of industries,
ranging from Professional and Business Services and Trade, Transportation and Utilities to Construction and Manufacturing. During the period under review, Professional and Business Services lost -452 jobs (-8.3%), while Trade, Transportation and Utilities dropped -562 (-5.1%). In the Goods-Producing sector, Manufacturing declined by -707 (-12.9%) and Construction lost -489 jobs (-14.8%).
The 2008 annual average wage in Berkshire County of $38,939 was well below the statewide
figure of $56,759 by $17,920. Among the key sectors whose annual average wages exceeded the overall average in Berkshire County were Manufacturing ($60,683), Professional and Business Services ($52,233), Financial Activities ($50,048), Construction ($44,582), Educational Services ($44,553), and Health Care and Social Assistance ($43,408).
Two of the three largest sectors, Leisure and Hospitality ($19,030) and Retail Trade ($25,672),
had wages that were considerably lower than the Berkshire County annual average wage of $38,939.
vgreen
Text Box
2

Summary of Trends in the Berkshire County Workforce Area
Massachusetts Industry and Occupational Projections 2006-2016
The Massachusetts economy is expected to generate 216,650 net new jobs between 2006 and 2016, an increase of 6.3%. An additional 768,330 job openings will result from the need to replace workers who retire, change industries or change occupations. In total, nearly one million jobs will need to be filled by 2016.
The two fastest growing industry sectors, Professional, Technical, and Business Services
(+18.1%) and Health and Educational Services (+16.8%) will also add the most jobs, expanding by 85,400 and 102,020 jobs respectively, and together will represent more than 86 percent of all net new jobs. Health Care alone will account for 64,630 jobs during the projection period. The third fastest growth is expected in Leisure and Hospitality (+9.2%), which is projected to add 27,160 jobs.
On a more detailed basis, eight industries are expected to increase by more than 10,000 jobs.
These include Private Hospitals (+23,530), Management and Technical Consulting (+19,100), Computer Systems Design (+17,600), Food Services and Drinking Places (+16,450), Individual and Family Services (+12,870), Residential Care Facilities (+11,320), Offices of Health Practitioners (+10,510), and Colleges and Universities (+10,300). Collectively, these eight industries account for nearly 121,680 or 56.2% of the 216,650 projected net new jobs.
Among the 30 fastest growing occupations, 13 are in either Health Care or Information
Technology. In terms of education and training, 23 of these fast growing occupations require at least an Associate’s Degree. The top five fastest growing occupations include Network Systems Analysts (+50%), Personal and Home Care Aides (+36%), Computer Applications Engineers (+35%), Home Health Aides (+34%), and Veterinary Technologists and Technicians (+33%).
Twenty occupations will account for more than half the net new jobs created through 2016.
Many are large occupations concentrated in industries such as Retail Trade and Hospitality. The five occupations generating the most new jobs are expected to include Registered Nurses (+16,110), Customer Service Representatives (+8,390), Computer Software Applications Engineers (+8,260), Combined Food Preparation and Serving Workers (+7,760), and Home Health Aides (+5,820).
While the focus is often on new job growth, it is important to remember that most job openings
will be the result of replacement demand and not growth. In fact, 78% of the nearly one million projected net new job openings statewide will occur because of replacement associated with retirement, labor force withdrawal, and occupational changes. For example, total projected net new openings for Registered Nurses are expected to be 29,050, with 12,940 replacement jobs and 16,110 new jobs. Replacement needs tend to be greatest in occupations with high proportions of workers nearing retirement (teachers, machinists) or occupations with large concentrations of young and part-time workers (waiters and waitresses, retail salespersons).
Education and training will play an increasingly prominent role for both current and future job
seekers. More than half (60%) of all new jobs related to growth will require an Associate’s Degree or higher. While a Bachelor’s Degree may be preferable, it is important to recognize that some form of post-secondary education will be essential for those seeking a rewarding career path with good pay and upward mobility.
vgreen
Text Box
3
Summary of Trends in the Berkshire County Workforce Area
Population Estimates 2000-2009
Between the April 2000 Census and July 2009, the total population in Berkshire County fell by 5,665 a decline of -4.2%. Barnstable County (-0.5%) was the only other County in the state to lose population during this period. Between April, 2000 and July, 2009, the Massachusetts population increased by 244,468 or 3.9%. The Massachusetts population increased by over 49,000 between July 2007 and July 2009, with gains in all counties except Berkshire (-283) and Barnstable (-370) and Plymouth (-99).
Among the 30 largest cities and towns in Massachusetts, Pittsfield was one of 13 that lost
population between April 2000 and July 2009. Pittsfield lost 3,365 residents and its 7.3% overall decline was the highest among the 30 largest cities. With a population in July 2009 of 42,432, Pittsfield ranks 29th among the largest cities and towns in Massachusetts.
Berkshire County was the only county other than Barnstable to see a decline in the natural
population between April 2000 and July 2009 with the number of deaths exceeding the number of births by 2,548. In addition, it was one of six counties experiencing net out-migration as the net number of persons leaving Berkshire County for other states or places in Massachusetts (-2,251) exceeded the net number of migrants arriving from other countries (+1,219).
Berkshire County was one of the few Workforce Areas in which the day time population was
largely unchanged due to commuting. The Berkshire County Workforce Area was one of the most self contained labor markets among the 16 Workforce Regions as evidenced by the fact that there were 64,058 employed residents as compared to 65,964 individuals working in Berkshire County business firms. This resulted in a small net daily net in flow of 1,906 workers at the time of the 2000 Census.
Massachusetts and U.S. Wages by Occupational Group According to the most recent wage survey conducted in May 2009 the mean Massachusetts
wage for all occupations was $52,710. The average Massachusetts wage exceeded the average U.S. wage of $43,460 by $9,250 or 21.3%.
Massachusetts wages were larger than their U.S. counterparts in all 22 occupational groups for
which wage information was collected. The top three occupational categories in Massachusetts were Management ($117,640), Legal ($99,920), and Computer and Mathematics ($88,610).
In addition to the three occupational groups noted above, there were four other occupational
groups in Massachusetts that exceeded an average wage of $70,000. These categories included Architecture and Engineering ($80,470), Healthcare Practitioners ($78,390), Business and Financial ($76,990), and Life, Physical, and Social Science ($74,710).
On the opposite end of the wage scale, the three occupational categories with the lowest
average wages in Massachusetts were all below $30,000. These groups included, Personal Care and Service ($29,070), Farming, Fishing, and Forestry ($28,600), and, the category with the lowest average wage, Food Preparation and Serving ($25,110).
vgreen
Text Box
4
Massachusetts 16 Workforce Areas
BerkshireCounty
Franklin/Hampshire
Hampden County
North Central
Central Massachusetts
BristolCounty
Metro South/West
Greater New Bedford Cape and Islands
GreaterLowell
Lower Merrimack
Valley
North Shore
MetroNorth
Boston
Massachusetts Department of Workforce DevelopmentEconomic Analysis Office
Brockton
SouthShore
vgreen
Text Box
5
Vgreen
Sticky Note
Completed set by Vgreen
Vgreen
Typewritten Text
Vgreen
Typewritten Text
Prepared by Massachusetts Department of Workforce Development Economic Analysis Office
Vgreen
Typewritten Text

OTIS
LEE
BECKET
SAVOY
PERU
SHEFFIELD SANDISFIELD
PITTSFIELD
WINDSOR
HANCOCK
ADAMS
LENOX
WILLIAMSTOWNFLORIDA
WASHINGTON
DALTON
CHESHIRE
MONTEREY
NEW MARLBOROUGH
GREAT BARRINGTON
HINSDALE
LANESBOROUGH
RICHMOND
EGREMONT
STOCKBRIDGE
TYRINGHAMALFORD
NORTH ADAMS
MOUNT WASHINGTON
CLARKSBURG
NEW ASHFORD
WEST STOCKBRIDGE
Great Barrington, MA LMA
North Adams, MA-VT Micro NECTA
Pittsfield, MA Metropolitan NECTA
The Berkshire County Workforce Area comprises 32 cities and towns in the following 3 NECTAs/LMAs
vgreen
Text Box
6
Vgreen
Typewritten Text
Vgreen
Typewritten Text
Vgreen
Typewritten Text
Prepared by Massachusetts Department of Workforce Development Economic Analysis Office
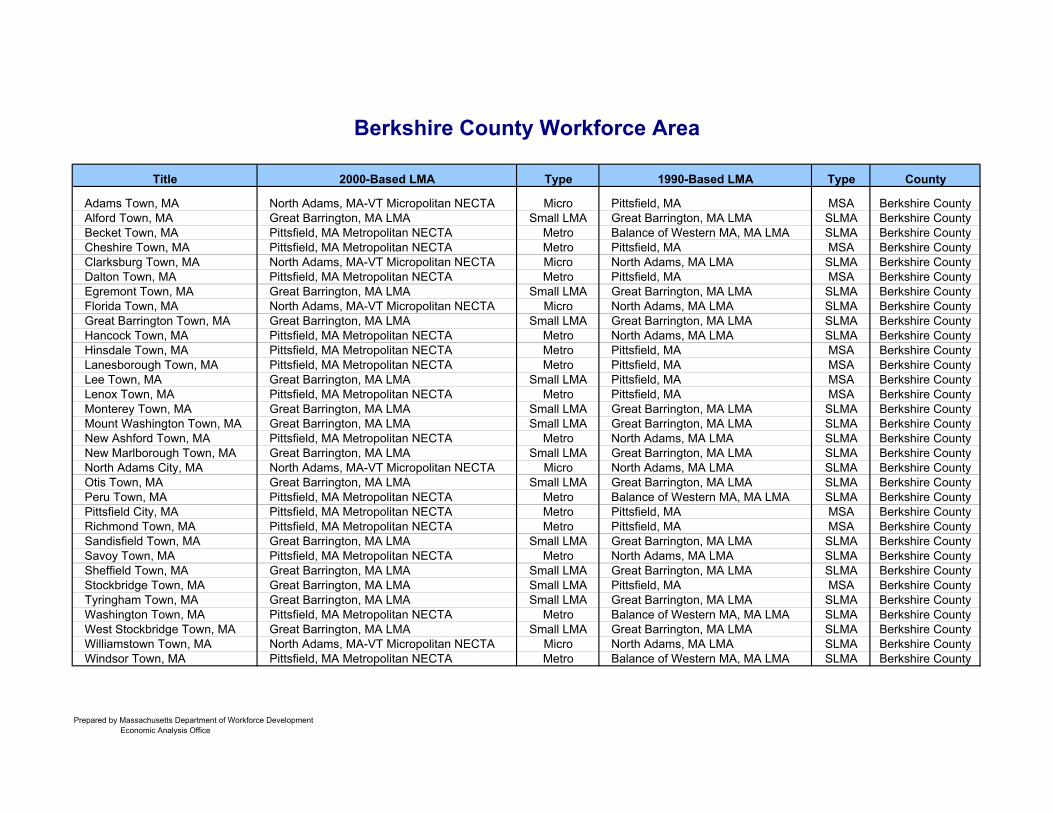
Title 2000-Based LMA Type 1990-Based LMA Type County
Adams Town, MA North Adams, MA-VT Micropolitan NECTA Micro Pittsfield, MA MSA Berkshire CountyAlford Town, MA Great Barrington, MA LMA Small LMA Great Barrington, MA LMA SLMA Berkshire CountyBecket Town, MA Pittsfield, MA Metropolitan NECTA Metro Balance of Western MA, MA LMA SLMA Berkshire CountyCheshire Town, MA Pittsfield, MA Metropolitan NECTA Metro Pittsfield, MA MSA Berkshire CountyClarksburg Town, MA North Adams, MA-VT Micropolitan NECTA Micro North Adams, MA LMA SLMA Berkshire CountyDalton Town, MA Pittsfield, MA Metropolitan NECTA Metro Pittsfield, MA MSA Berkshire CountyEgremont Town, MA Great Barrington, MA LMA Small LMA Great Barrington, MA LMA SLMA Berkshire CountyFlorida Town, MA North Adams, MA-VT Micropolitan NECTA Micro North Adams, MA LMA SLMA Berkshire CountyGreat Barrington Town, MA Great Barrington, MA LMA Small LMA Great Barrington, MA LMA SLMA Berkshire CountyHancock Town, MA Pittsfield, MA Metropolitan NECTA Metro North Adams, MA LMA SLMA Berkshire CountyHinsdale Town, MA Pittsfield, MA Metropolitan NECTA Metro Pittsfield, MA MSA Berkshire CountyLanesborough Town, MA Pittsfield, MA Metropolitan NECTA Metro Pittsfield, MA MSA Berkshire CountyLee Town, MA Great Barrington, MA LMA Small LMA Pittsfield, MA MSA Berkshire CountyLenox Town, MA Pittsfield, MA Metropolitan NECTA Metro Pittsfield, MA MSA Berkshire CountyMonterey Town, MA Great Barrington, MA LMA Small LMA Great Barrington, MA LMA SLMA Berkshire CountyMount Washington Town, MA Great Barrington, MA LMA Small LMA Great Barrington, MA LMA SLMA Berkshire CountyNew Ashford Town, MA Pittsfield, MA Metropolitan NECTA Metro North Adams, MA LMA SLMA Berkshire CountyNew Marlborough Town, MA Great Barrington, MA LMA Small LMA Great Barrington, MA LMA SLMA Berkshire CountyNorth Adams City, MA North Adams, MA-VT Micropolitan NECTA Micro North Adams, MA LMA SLMA Berkshire CountyOtis Town, MA Great Barrington, MA LMA Small LMA Great Barrington, MA LMA SLMA Berkshire CountyPeru Town, MA Pittsfield, MA Metropolitan NECTA Metro Balance of Western MA, MA LMA SLMA Berkshire CountyPittsfield City, MA Pittsfield, MA Metropolitan NECTA Metro Pittsfield, MA MSA Berkshire CountyRichmond Town, MA Pittsfield, MA Metropolitan NECTA Metro Pittsfield, MA MSA Berkshire CountySandisfield Town, MA Great Barrington, MA LMA Small LMA Great Barrington, MA LMA SLMA Berkshire CountySavoy Town, MA Pittsfield, MA Metropolitan NECTA Metro North Adams, MA LMA SLMA Berkshire CountySheffield Town, MA Great Barrington, MA LMA Small LMA Great Barrington, MA LMA SLMA Berkshire CountyStockbridge Town, MA Great Barrington, MA LMA Small LMA Pittsfield, MA MSA Berkshire CountyTyringham Town, MA Great Barrington, MA LMA Small LMA Great Barrington, MA LMA SLMA Berkshire CountyWashington Town, MA Pittsfield, MA Metropolitan NECTA Metro Balance of Western MA, MA LMA SLMA Berkshire CountyWest Stockbridge Town, MA Great Barrington, MA LMA Small LMA Great Barrington, MA LMA SLMA Berkshire CountyWilliamstown Town, MA North Adams, MA-VT Micropolitan NECTA Micro North Adams, MA LMA SLMA Berkshire CountyWindsor Town, MA Pittsfield, MA Metropolitan NECTA Metro Balance of Western MA, MA LMA SLMA Berkshire County
Berkshire County Workforce Area
Prepared by Massachusetts Department of Workforce Development Economic Analysis Office
vgreen
Text Box
7

White Black Asian Other INA Yes No INA Male Female 1-2 3-4 5-14 15+Massachusetts 137,617 82.6% 7.4% 2.5% 0.3% 7.1% 9.8% 89.4% 0.8% 66.6% 33.4% 11.0% 8.0% 48.1% 32.9%Berkshire County 3,441 93.5% 2.8% 0.3% 0.3% 3.1% 2.6% 97.1% 0.3% 69.6% 30.4% 11.4% 8.4% 49.8% 30.3%Boston 10,390 50.6% 30.0% 6.1% 0.4% 12.8% 17.3% 81.6% 1.1% 59.4% 40.6% 13.1% 8.9% 42.3% 35.7%Bristol County 14,485 88.0% 4.3% 1.3% 0.2% 6.1% 7.4% 92.0% 0.5% 72.3% 27.7% 10.6% 7.9% 51.7% 29.8%Brockton 5,466 74.1% 16.7% 1.2% 0.3% 7.7% 5.8% 93.7% 0.5% 65.8% 34.2% 11.2% 7.7% 48.0% 33.1%Cape and Islands 8,347 88.4% 4.5% 0.5% 0.7% 6.0% 4.0% 95.3% 0.7% 59.0% 41.0% 5.2% 5.4% 52.4% 37.0%Central Mass 12,541 88.5% 4.5% 1.6% 0.3% 5.1% 8.3% 91.1% 0.5% 67.9% 32.1% 12.0% 8.3% 46.4% 33.2%Franklin/Hampshire 3,328 92.8% 1.4% 0.7% 0.3% 4.9% 2.6% 97.0% 0.5% 68.8% 31.2% 10.1% 7.1% 50.7% 32.1%Greater Lowell 5,345 83.4% 2.8% 8.3% 0.3% 5.2% 7.8% 91.5% 0.7% 67.0% 33.0% 12.5% 7.9% 48.8% 30.8%Greater New Bedford 6,023 84.5% 6.7% 0.4% 0.2% 8.1% 8.0% 91.4% 1.0% 73.0% 27.0% 10.3% 8.0% 54.3% 27.4%Hampden County 11,219 79.7% 9.7% 0.8% 0.3% 9.5% 17.6% 81.7% 0.4% 67.2% 32.8% 10.3% 7.6% 48.9% 33.2%Lower Merrimack Valley 10,723 84.9% 3.6% 1.2% 0.4% 10.0% 20.1% 78.9% 0.7% 71.0% 29.0% 13.1% 8.5% 46.1% 32.4%Metro North 11,895 79.7% 7.7% 4.4% 0.4% 7.9% 12.0% 87.4% 0.6% 63.7% 36.3% 11.9% 8.8% 44.7% 34.5%Metro South/West 10,111 86.2% 3.6% 3.2% 0.2% 6.8% 6.4% 92.9% 0.7% 65.1% 34.9% 10.8% 7.8% 46.8% 34.6%North Central Mass 5,917 90.3% 2.5% 1.1% 0.2% 5.9% 9.9% 85.9% 0.7% 69.5% 30.5% 11.5% 8.8% 47.9% 31.7%North Shore 7,936 86.3% 6.0% 2.2% 0.2% 5.2% 11.0% 88.4% 0.5% 63.9% 36.1% 10.2% 8.4% 47.7% 33.7%South Shore 10,450 85.2% 4.8% 5.0% 0.3% 4.7% 2.2% 97.3% 4.1% 65.3% 34.7% 10.8% 8.1% 48.5% 32.6%
<$300 $1,500+ Under 25 25-44 45-54 55-64 65+Massachusetts 11.9% 18.4% 26.6% 12.4% 17.8% 12.9% 9.5% 45.9% 25.0% 15.3% 4.3% 11.9% 44.2% 22.0% 22.0%Berkshire County 14.1% 26.3% 31.9% 12.4% 11.1% 4.0% 10.4% 43.6% 24.0% 16.6% 5.4% 11.2% 53.3% 21.3% 14.2%Boston 14.0% 19.1% 26.7% 11.8% 16.1% 12.3% 10.2% 55.1% 20.9% 11.3% 2.5% 13.3% 36.2% 20.7% 29.8%Bristol County 11.5% 18.9% 26.9% 12.4% 19.4% 10.8% 9.8% 47.4% 25.7% 13.5% 3.5% 19.9% 48.4% 19.6% 12.1%Brockton 12.2% 19.0% 28.0% 12.0% 18.1% 10.7% 10.8% 47.1% 24.7% 13.1% 4.4% 12.1% 49.7% 23.3% 14.9%Cape and Islands 14.3% 23.4% 30.6% 12.6% 12.9% 6.3% 9.2% 40.1% 23.6% 18.1% 8.9% 6.6% 39.8% 28.2% 25.4%Central Mass 11.9% 18.1% 27.0% 13.1% 18.1% 11.6% 10.0% 46.1% 24.8% 15.3% 3.8% 9.5% 48.5% 22.6% 19.4%Franklin/Hampshire 11.3% 21.5% 31.0% 12.0% 17.4% 6.8% 10.8% 42.4% 26.4% 17.0% 3.4% 7.8% 50.4% 21.9% 19.9%Greater Lowell 9.7% 16.7% 27.2% 13.2% 18.9% 14.3% 10.2% 46.5% 25.4% 14.6% 3.2% 11.0% 48.3% 21.2% 19.6%Greater New Bedford 15.0% 20.4% 25.6% 11.3% 17.5% 10.2% 11.2% 45.5% 24.8% 15.0% 3.6% 27.5% 45.0% 18.5% 9.0%Hampden County 16.6% 22.9% 28.8% 11.9% 14.1% 5.8% 12.3% 47.5% 22.7% 13.9% 3.6% 17.1% 48.4% 22.9% 11.6%Lower Merrimack Valley 10.3% 15.9% 23.5% 12.3% 19.7% 18.2% 8.5% 46.2% 27.1% 15.0% 3.2% 15.4% 43.4% 20.6% 20.6%Metro North 9.7% 15.4% 25.6% 13.3% 19.8% 16.1% 7.3% 49.2% 24.2% 14.9% 4.5% 9.8% 39.4% 20.3% 30.5%Metro South/West 7.1% 12.7% 22.8% 12.0% 19.4% 26.0% 6.0% 39.7% 29.1% 19.3% 5.9% 5.9% 31.9% 19.5% 42.7%North Central Mass 10.6% 18.7% 27.4% 13.2% 18.2% 11.8% 10.1% 43.6% 26.6% 15.9% 3.7% 10.4% 51.6% 22.5% 15.4%North Shore 12.3% 0.0% 26.1% 12.4% 18.4% 12.6% 9.2% 43.9% 25.0% 17.1% 4.7% 8.5% 45.9% 22.8% 22.8%South Shore 10.7% 15.5% 24.6% 12.7% 20.2% 16.4% 8.5% 43.7% 25.9% 16.8% 5.2% 5.9% 44.4% 24.8% 24.9%
Source: Profile of Massachusetts Unemployment Claimants
Weeks of Unemployment
Average Weekly Wage
Hispanic or LatinoTotal Claimants
Race
$300-$499
$500-$799
$800-$999
$1,000-$1,499
Profile of Unemployment Insurance Claimants, Massachusetts and Workforce AreasMarch 2010
H.S. Graduate
Gender
Age Group 1-3 Yrs. College
Education Attainment*4 or More College
Through Grade 11
Prepared by Massachusetts Department of Workforce Development Economic Analysis Office
*Data based on a sample of all claimants signing for the Survey Week.
vgreen
Text Box
8
Claimants by Race Number Percent Number Percent Total 3,441 100.0% 137,617 100.0% White 3,219 93.5% 113,716 82.6% Black 98 2.8% 10,169 7.4% Native American 9 0.3% 324 0.2% Asian 9 0.3% 3,474 2.5% Hawaiian & Pacific Islanders - 0.0% 105 0.1% INA or Unknown 106 3.1% 9,829 7.1%
Claimants by Hispanic or Latino Hispanic or Latino 89 2.6% 13,532 9.8% Not Hispanic or Latino 3,340 97.1% 122,966 89.4% INA 12 0.3% 1,119 0.8%
Claimants by Gender Male 2,396 69.6% 91,682 66.6% Female 1,047 30.4% 45,948 33.4%
Claimants by Length of Current Spell of Unemployment 1-2 Weeks 394 11.4% 15,158 11.0% 3-4 Weeks 290 8.4% 11,053 8.0% 5-14 Weeks 1,715 49.8% 66,159 48.1% 15+ Weeks 1,044 30.3% 45,263 32.9%
Claimants by Average Weekly Wage Under $300 486 14.1% 16,321 11.9% $300 - $499 905 26.3% 25,294 18.4% $500 - $799 1,099 31.9% 36,636 26.6% $800 - $999 428 12.4% 17,123 12.4% $1,000 - $1,499 383 11.1% 24,518 17.8% $1,500 and Over 139 4.0% 17,714 12.9%
Claimants by Age Group Under Age 22 127 3.7% 4,563 3.3% 22 -24 231 6.7% 8,451 6.1% 25 - 34 758 22.0% 31,523 22.9% 35 - 44 744 21.6% 31,701 23.0% 45 -54 825 24.0% 34,417 25.0% 55 - 59 331 9.6% 12,288 8.9% 60 - 64 242 7.0% 8,765 6.4% Over Age 64 185 5.4% 5,922 4.3%
Claimants by Level of Educational Attainment Through Grade 8 33 1.1% 4,097 3.6% 9th to 11th Grade 293 10.1% 9,256 8.2% High School Graduate 1,551 53.3% 49,788 44.2% 1-3 Years of College 620 21.3% 24,708 22.0% 4 or More Years of College 412 14.2% 24,710 22.0%
Source: Profile of Massachusetts Unemployment Claimants
MassachusettsBerkshire County
Profile of Unemployment Insurance ClaimantsBerkshire County Workforce Area
March 2010
March 2010 March 2010
Prepared by Massachusetts Department of Workforce Development Economic Analysis Office
vgreen
Text Box
9
Claimants by Standard Occupational Classification (SOC) Number Percent Number Percent Total 3,443 100.0% 137,633 100.0% Management (SOC 11) 277 8.0% 13,666 9.9% Business & Fiscal Operations (SOC 13) 33 1.0% 4,029 2.9% Computer & Mathematics (SOC 15) 26 0.8% 3,053 2.2% Architecture & Engineering (SOC 17) 33 1.0% 2,923 2.1% Life, Physical & Social Sciences (SOC 19) 15 0.4% 962 0.7% Community & Social Services (SOC 21) 41 1.2% 1,342 1.0% Legal Occupations (SOC 23) 11 0.3% 740 0.5% Education, Training & Library (SOC 25) 43 1.2% 1,856 1.3% Arts, Design, Entertainment, Sports & Media (SOC 27) 44 1.3% 2,553 1.9% Health Practitioners & Technical (SOC 29) 59 1.7% 2,386 1.7% Healthcare Support (SOC 31) 79 2.3% 2,598 1.9% Protective Services (SOC 33) 26 0.8% 1,222 0.9% Food Preparation & Serving (SOC 35) 228 6.6% 8,322 6.0% Building & Grounds Cleaning & Maintenance (SOC 37) 317 9.2% 9,162 6.7% Personal Care & Service (SOC 39) 91 2.6% 2,822 2.1% Sales & Related (SOC 41) 244 7.1% 9,610 7.0% Office & Administrative Support (SOC 43) 320 9.3% 16,936 12.3% Farming, Fishing, Forestry (SOC 45) 29 0.8% 1,128 0.8% Construction and Extraction (SOC 47) 867 25.2% 26,774 19.5% Installation, Maintenance, Repair (SOC 49) 182 5.3% 5,358 3.9% Production Occupations (SOC 51) 247 7.2% 10,710 7.8% Transportation & Material Moving (SOC 53) 230 6.7% 9,287 6.7% INA or SOC Code Unknown 1 0.0% 46 0.0%
Source: Profile of Massachusetts Unemployment Claimants
Economic Analysis Office
Berkshire County Massachusetts
Berkshire County (Continued)Profile of Unemployment Insurance Claimants
Prepared by Massachusetts Department of Workforce Development
March 2010 March 2010
0.0%
5.0%
10.0%
15.0%
20.0%
25.0%
30.0%
Manag
emen
t
Busines
s & Fisc
al
Computers &
Math
Food Pre
paratio
n
Sales
Office &
Admin
Constructi
on
Installa
tion &
Rep
airPro
ductio
n
Tran
sport
& Movin
g
WIAMA
vgreen
Text Box
10

Claimants by NAICS Industry Classification Number Percent Number Percent Total (does not include partially-unemployed claimants) 3,113 100.0% 124,314 100.0% Agriculture, Forestry, Fishing, Hunting (NAICS 11) 13 0.4% 1,057 0.9% Mining (NAICS 21) 15 0.5% 380 0.3% Utilities (NAICS 22) 4 0.1% 131 0.1% Construction (NAICS 23) 863 27.7% 27,727 22.3% Manufacturing (NAICS 31-33) 267 8.6% 10,402 8.4% Wholesale Trade (NAICS 42) 78 2.5% 5,376 4.3% Retail Trade (NAICS 44-45) 332 10.7% 10,864 8.7% Transportation and Warehousing (NAICS 48-49) 52 1.7% 3,303 2.7% Information (NAICS 51) 29 0.9% 2,933 2.4% Finance and Insurance (NAICS 52) 31 1.0% 3,862 3.1% Real Estate and Rental Leasing (NAICS 53) 49 1.6% 1,875 1.5% Professional, Scientific and Technical Services (NAICS 54) 71 2.3% 7,515 6.0% Management of Companies and Enterprises (NAICS 55) 3 0.1% 414 0.3% Admin. & Support & Waste Mgt. & Redemption Serv. (NAICS 56) 374 12.0% 16,526 13.3% Educational Services (NAICS 61) 35 1.1% 1,514 1.2% Health Care and Social Assistance (NAICS 62) 216 6.9% 7,617 6.1% Arts, Entertainment and Recreation (NAICS 71) 140 4.5% 3,671 3.0% Accommodation and Food Services (NAICS 72) 289 9.3% 9,204 7.4% Other Services (Except Public Administration) (NAICS 81) 123 4.0% 4,555 3.7% Public Administration (NAICS 92) 37 1.2% 1,893 1.5% INA (No NAICS Code) 92 3.0% 3,495 2.8%
Source: Profile of Massachusetts Unemployment Claimants
Berkshire County Massachusetts
Berkshire County (Continued)
Prepared by Massachusetts Department of Workforce Development Economic Analysis Office
Profile of Unemployment Insurance Claimants
March 2010 March 2010
0.0%
5.0%
10.0%
15.0%
20.0%
25.0%
30.0%
Constructi
on
Manufac
turing
Wholesale
Trade
Retail T
rade
Informati
on
Finance
& Insu
rance
Prof, Scie
ntific &
Tech
Admin & Was
te Mgt
Health
Care
Accommodati
on & Food
WIAMA
vgreen
Text Box
11

Area UnemployedLabor Force1st Qtr 2010 Unemp Rate
1st Qtr 2009 Unemp RateEmployed
Labor Force Estimates by Workforce Area1st Quarter 2010
Massachusetts 3,463,467 3,121,333 342,133 9.9% 8.2%
Berkshire County 7,28472,579 10.0% 8.5%65,295
Boston 27,090311,630 8.7% 7.3%284,539
Bristol County 25,909200,664 12.9% 11.3%174,755
Brockton 13,645126,168 10.8% 8.9%112,523
Cape and Islands 17,552133,533 13.1% 11.2%115,982
Central Mass 29,939291,669 10.3% 8.4%261,730
Franklin/Hampshire 11,422134,887 8.5% 6.8%123,465
Greater Lowell 15,209148,254 10.3% 8.6%133,045
Greater New Bedford 15,173108,518 14.0% 11.9%93,346
Hampden County 27,207226,427 12.0% 9.7%199,221
Lower Merrimack Valley 19,001166,450 11.4% 9.6%147,449
Metro North 33,322422,611 7.9% 6.5%389,289
Metro South/West 35,606488,527 7.3% 6.1%452,920
North Central 14,521127,711 11.4% 9.4%113,190
North Shore 21,033217,838 9.7% 8.1%196,804
South Shore 28,219285,995 9.9% 7.9%257,776
Note: Data is not seasonally adjusted. Prepared by Massachusetts Department of Workforce Development Economic Analysis Office
Source: Local Area Unemployment Statistics (LAUS) April 2010
vgreen
Text Box
12
Area UnemployedLabor Force1st Qtr 2010 Unemp Rate
1st Qtr 2009 Unemp RateEmployed
Labor Force Estimates by City And Town1st Quarter 2010
Berkshire County Workforce Area 8.5%10.0%7,28465,29572,579
Massachusetts 3,463,467 3,121,333 342,133 9.9% 8.2%
Adams 5774,566 12.6% 11.4%3,989
Alford 15226 6.6% 3.5%211
Becket 1201,044 11.5% 9.6%924
Cheshire 2241,963 11.4% 10.5%1,739
Clarksburg 102950 10.8% 9.6%847
Dalton 3433,769 9.1% 7.4%3,426
Egremont 50836 6.0% 5.7%786
Florida 48412 11.7% 11.7%364
Great Barrington 3954,363 9.0% 8.1%3,969
Hancock 29621 4.7% 3.1%592
Hinsdale 1691,179 14.3% 10.5%1,010
Lanesborough 1881,798 10.4% 9.2%1,611
Lee 3513,691 9.5% 7.9%3,340
Lenox 2352,694 8.7% 7.8%2,459
Monterey 34579 5.9% 4.8%545
Mount Washington 496 4.5% 2.5%91
New Ashford 7152 4.8% 5.4%145
New Marlborough 106930 11.4% 8.6%824
North Adams 8967,357 12.2% 10.5%6,462
Otis 87860 10.1% 9.0%773
Peru 27475 5.7% 3.9%448
Pittsfield 2,36522,865 10.3% 8.8%20,500
Richmond 50940 5.3% 4.9%890
Sandisfield 53509 10.5% 8.5%455
Savoy 73450 16.1% 12.4%378
Sheffield 1822,042 8.9% 7.8%1,860
Stockbridge 861,331 6.4% 6.4%1,246
Tyringham 19252 7.7% 5.7%233
Washington 40336 11.8% 6.7%296
West Stockbridge 78874 8.9% 7.1%797
Williamstown 2843,911 7.3% 5.5%3,627
Windsor 49508 9.6% 6.8%459
Note: Data is not seasonally adjusted. Prepared by Massachusetts Department of Workforce Development Economic Analysis Office
Source: Local Area Unemployment Statistics (LAUS) April 2010
vgreen
Text Box
13
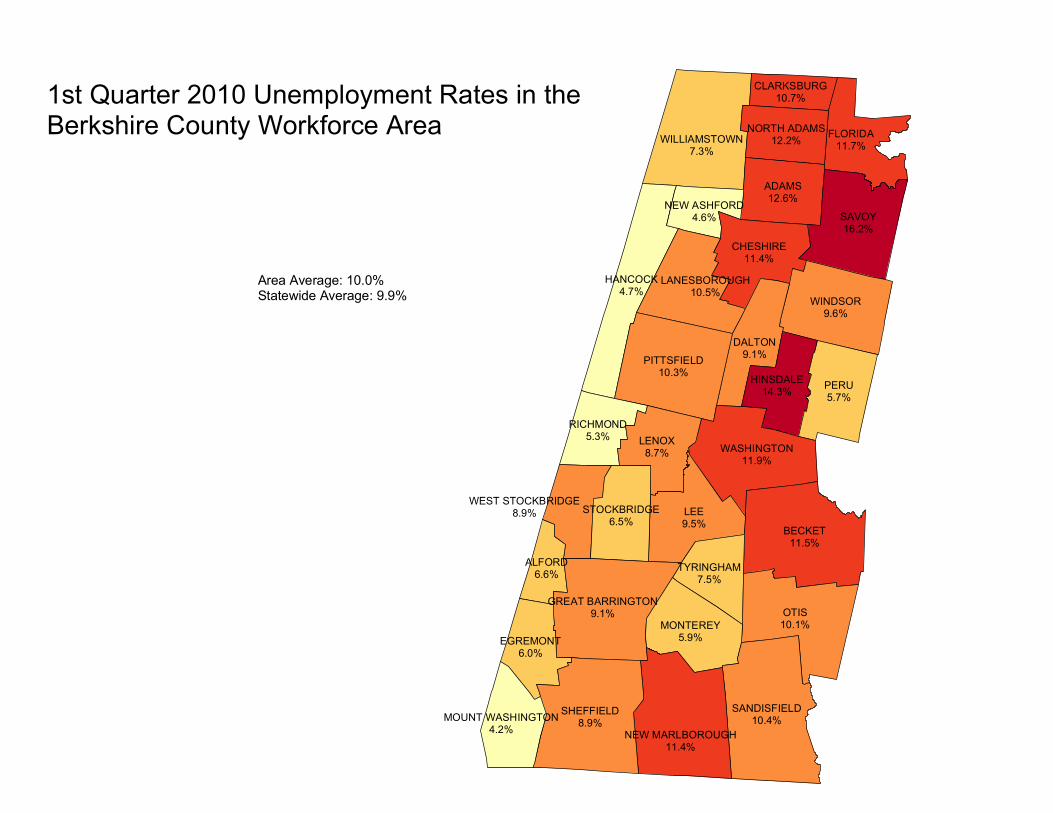
1st Quarter 2010 Unemployment Rates in the Berkshire County Workforce Area
Area Average: 10.0%Statewide Average: 9.9%
OTIS10.1%
BECKET11.5%
LEE9.5%
SAVOY16.2%
PERU5.7%
SHEFFIELD8.9%
SANDISFIELD10.4%
PITTSFIELD10.3%
WINDSOR9.6%
ADAMS12.6%
LENOX8.7%
WILLIAMSTOWN7.3%
FLORIDA11.7%
WASHINGTON11.9%
DALTON9.1%
CHESHIRE11.4%
MONTEREY5.9%
HINSDALE14.3%
CLARKSBURG10.7%
HANCOCK4.7%
NEW MARLBOROUGH11.4%
GREAT BARRINGTON9.1%
LANESBOROUGH10.5%
RICHMOND5.3%
EGREMONT6.0%
STOCKBRIDGE6.5%
TYRINGHAM7.5%
ALFORD6.6%
NORTH ADAMS12.2%
MOUNT WASHINGTON4.2%
NEW ASHFORD4.6%
WEST STOCKBRIDGE8.9%
vgreen
Text Box
14
Vgreen
Typewritten Text
Prepared by Massachusetts Department of Workforce Development Economic Analysis Office
Vgreen
Typewritten Text
0 to 19 4,207 88.6% 186,082 87.7%
20 to 99 457 9.6% 21,316 10.0%
100 to 499 77 1.6% 4,287 2.0%
500+ 6 0.1% 578 0.3%
Total 4,747 100.0% 212,263 100.0%
0 to 19 17,936 30.5% 715,532 23.0%
20 to 99 18,564 31.6% 855,011 27.5%
100 to 499 14,800 25.2% 813,548 26.2%
500+ 7,532 12.8% 721,548 23.2%
Total 58,832 100.0% 3,105,639 100.0%
Distribution of Establishments and Employment by Size GroupBerkshire County Workforce Investment Area and Massachusetts
March 2009
Size Group# Establishments Berkshire County
Share of All Employees
Share of All Establishments
# Establishments State
Share of All Establishments
Economic Analysis Office
Source: Quarterly Census of Employment and Wages (ES-202)
Share of All Employees
# Employees State
Prepared by Massachusetts Department of Workforce Development
Size Group# Employees
Berkshire County
vgreen
Text Box
15
Sector
2008 3rd Quarter
Employment
2009 3rd Quarter
Employment
Yr/Yr Employment
Change
Yr/Yr Employment % Change
Massachusetts 3,251,799 3,245,755 -6,044 -0.2%Berkshire County 64,136 61,567 -2,569 -4.0%Boston 569,771 548,067 -21,704 -3.8%Bristol County 141,804 133,503 -8,301 -5.9%Brockton 89,744 87,260 -2,484 -2.8%Cape and Islands 121,177 117,272 -3,905 -3.2%Central Mass 241,841 230,907 -10,934 -4.5%Franklin/Hampshire 88,806 86,067 -2,739 -3.1%Greater Lowell 113,719 108,397 -5,322 -4.7%Greater New Bedford 80,164 77,805 -2,359 -2.9%Hampden County 196,868 189,522 -7,346 -3.7%Lower Merrimack Valley 130,885 126,654 -4,231 -3.2%Metro North 382,166 367,887 -14,279 -3.7%Metro South/West 531,695 505,904 -25,791 -4.9%North Central 79,759 77,889 -1,870 -2.3%North Shore 167,148 161,563 -5,585 -3.3%South Shore 208,992 200,097 -8,895 -4.3%
Economic Analysis Office
Source: Quarterly Census of Employment and Wages (ES0-202)
Total Employment for Massachusetts and Workforce Areas3rd Quarter 2008 vs. 2009
Prepared by Massachusetts Department of Workforce Development
0
50,000
100,000
150,000
200,000
250,000
300,000
350,000
400,000
450,000
500,000
550,000
600,000
Berksh
ire C
ounty
Boston
Bristol
Cou
nty
Brockto
n
Cape a
nd Is
lands
Centra
l Mas
s
Frankli
n/Ham
pshir
e
Greater
Lowell
Greater
New
Bedfor
d
Hampd
en C
ounty
Lower
Merrim
ack V
alley
Metro N
orth
Metro S
outh/
Wes
t
North C
entra
l
North S
hore
South
Shore
Total EmploymentMassachusetts and Workforce Areas
3rd Qtr 2008 vs 2009
2008 3rd Quarter Employment2009 3rd Quarter Employment
vgreen
Text Box
16

Sector Sector Title
2008 3rd Quarter
Employment
2009 3rd Quarter
Employment
Yr/Yr Employment
Change
Yr/Yr Employment %
ChangeTotal Employment 64,136 61,567 -2,569 -4.0%Private Sector 57,110 54,326 -2,784 -4.9%
Goods-Producing 9,034 7,884 -1,150 -12.7%11 Natural Resources 262 307 45 17.2%21 Mining 88 116 28 31.8%23 Construction 3,307 2,818 -489 -14.8%31-33 Manufacturing 5,466 4,759 -707 -12.9%
DUR - Durable Goods Manufacturing 2,058 1,732 -326 -15.8%NONDUR - Non-Durable Goods Manufacturing 3,408 3,027 -381 -11.2%
Service-Providing 48,076 46,442 -1,634 -3.4%Trade, Transporation & Utilities 11,050 10,488 -562 -5.1%
22 Utilities 271 268 -3 -1.1%42 Wholesale Trade 1,156 954 -202 -17.5%44-45 Retail Trade 8,818 8,543 -275 -3.1%48-49 Transportation & Warehousing 805 724 -81 -10.1%
Information 955 892 -63 -6.6%51 Information, Production, & Dissemination 955 892 -63 -6.6%
Financial Activities 2,741 2,740 -1 0.0%52 Finance & Insurance 2,043 2,056 13 0.6%53 Real Estate & Rental and Leasing 698 684 -14 -2.0%
Professional & Business Services 5,452 5,000 -452 -8.3%54 Professional, Scientific, & Technical Services 2,589 2,578 -11 -0.4%55 Headquarters, Regional Offices & Subsidiaries 398 218 -180 -45.2%56 Admin. & Support & Waste Mgt.& Remedition Services 2,465 2,204 -261 -10.6%
Education & Health 14,263 14,072 -191 -1.3%61 Educational Services 2,922 2,735 -187 -6.4%62 Health Care & Social Assistance 11,341 11,338 -3 0.0%
Leisure & Hospitality 10,292 9,939 -353 -3.4%71 Arts, Entertainment, & Recreation 2,161 2,152 -9 -0.4%72 Accommodation & Food Services 8,131 7,787 -344 -4.2%
Other Services 3,323 3,311 -12 -0.4%81 Other Services (except Public Administration) 3,323 3,311 -12 -0.4%
Government 7,026 7,241 215 3.1%Federal Government 438 433 -5 -1.1%State Government 1,441 1,665 224 15.5%Local Government 5,147 5,143 -4 -0.1%
Source: Quarterly Census of Employment and Wages (ES0-202)C = Confidential -- Note: Large change in Employment and Wages sometimes due to code change. (*Significant code change)
Prepared by Massachusetts Department of Workforce Development Economic Analysis Office
Berkshire County Workforce Area Employment by Industry (NAICS)3rd Quarter 2008 vs. 2009
0
2,000
4,000
6,000
8,000
10,000
12,000
Construction
Manufacturing
WholesaleRetail
Transportation
Information
Finance & Ins
Prof, Sci & Tech
Admin & Support
Educ. Serv (priv.)
Health & Social
Accom.& Food
Berkshire Workforce Area Employment
Emp 20083rd Qtr
Emp 20093rd Qtr
vgreen
Text Box
17
TotalPercent Share Total
Percent Share
Total Employment 62,490 100.0% $2,433,293,807 100.0% $38,939Private Sector 54,805 87.7% $2,115,530,866 86.9% $38,601
Goods-Producing 8,834 14.1% $479,758,894 19.7% $54,30811 Natural Resources 249 0.4% $8,303,986 0.3% $33,34921 Mining 89 0.1% $4,405,352 0.2% $49,49823 Construction 3,075 4.9% $137,088,853 5.6% $44,58231-33 Manufacturing 5,510 8.8% $334,366,055 13.7% $60,683
Service-Providing 45,971 73.6% $1,635,771,972 67.2% $35,583Trade, Transporation & Utilities 10,828 17.3% $320,998,780 13.2% $29,645
22 Utilities 263 0.4% $24,177,815 1.0% $91,93142 Wholesale Trade 1,072 1.7% $50,333,022 2.1% $46,95244-45 Retail Trade 8,657 13.9% $222,244,034 9.1% $25,67248-49 Transportation & Warehousing 836 1.3% $24,243,909 1.0% $29,000
Information 965 1.5% $42,502,206 1.7% $44,04451 Information, Production, & Dissemination 965 1.5% $42,502,206 1.7% $44,044511 Publishing Industries, except Internet 443 0.7% $17,501,407 0.7% $39,5075111 Newspapers & Periodicals 419 0.7% $16,322,043 0.7% $38,9555112 Software Publishers 24 0.0% $1,179,364 0.0% $49,140517 Telecommunications 200 0.3% $13,315,950 0.5% $66,580518 ISPs, Search Portals, & Data Processing C C C C C
Financial Activities 2,699 4.3% $135,079,634 5.6% $50,04852 Finance & Insurance 2,030 3.2% $113,885,525 4.7% $56,101522 Banking & Credit Institutions 1,164 1.9% $54,868,698 2.3% $47,138523 Securities, Commodities, & Investments 149 0.2% $14,000,817 0.6% $93,965524 Insurance 713 1.1% $44,443,643 1.8% $62,33353 Real Estate & Rental and Leasing 669 1.1% $21,194,110 0.9% $31,680531 Real Estate 466 0.7% $15,207,960 0.6% $32,635532 Rental & Leasing Services 202 0.3% $5,986,149 0.2% $29,634
Professional & Business Services 5,237 8.4% $273,541,814 11.2% $52,23354 Professional, Scientific, & Technical Services 2,587 4.1% $164,941,524 6.8% $63,7585411 Legal Services 307 0.5% $15,666,002 0.6% $51,0295412 Accounting & Payroll Services 294 0.5% $13,586,664 0.6% $46,2135413 Architectural & Engineering Services 1,257 2.0% $96,612,732 4.0% $76,8605415 Computer Systems Design & Related 232 0.4% $15,876,280 0.7% $68,4325416 Consulting Services 126 0.2% $7,126,247 0.3% $56,5585417 Scientific Research & Development Services 43 0.1% $3,450,505 0.1% $80,24455 Headquarters, Regional Offices & Subsidiaries 440 0.7% $32,433,506 1.3% $73,71356 Admin. & Support & Waste Mgt.& Remedition 2,210 3.5% $76,166,785 3.1% $34,465561 Administrative & Support Services 1,998 3.2% $64,641,405 2.7% $32,3535613 Employment Services 460 0.7% $9,409,395 0.4% $20,455562 Waste Management & Remediation Services 212 0.3% $11,525,380 0.5% $54,365
Education & Health 14,115 22.6% $615,973,688 25.3% $43,64061 Educational Services 2,812 4.5% $125,284,314 5.1% $44,5536113 Private Colleges & Universities C C C C C62 Health Care & Social Assistance 11,304 18.1% $490,689,374 20.2% $43,408621 Offices of Doctors & Walk-in Clinics 2,802 4.5% $148,292,331 6.1% $52,924622 Hospitals 3,403 5.4% $195,850,529 8.0% $57,552623 Nursing & Residential Care Facilities 3,815 6.1% $112,865,769 4.6% $29,585624 Social Assistance 1,284 2.1% $33,680,746 1.4% $26,231
Leisure & Hospitality 9,000 14.4% $171,271,462 7.0% $19,03071 Arts, Entertainment, & Recreation 1,823 2.9% $43,005,042 1.8% $23,59072 Accommodation & Food Services 7,177 11.5% $128,266,419 5.3% $17,872721 Hotels & Motels 2,282 3.7% $59,435,541 2.4% $26,045722 Eating & Drinking Places 4,896 7.8% $68,830,879 2.8% $14,059
Other Services 3,126 5.0% $76,404,388 3.1% $24,44281 Other Services (except Public Administration) 3,126 5.0% $76,404,388 3.1% $24,442
Government 7,686 12.3% $317,762,941 13.1% $41,343Federal Government 437 0.7% $23,899,986 1.0% $54,691State Government 1,413 2.3% $75,754,578 3.1% $53,613Local Government 5,836 9.3% $218,108,377 9.0% $37,373
Prepared by Massachusetts Department of Workforce Development Economic Analysis Office
Source: Quarterly Census of Employment and Wages (ES0-202)C = Confidential
2008 Annual AverageEmployment Gross Payroll
Economic Structure of the Berkshire County Workforce Area by Industry (NAICS)
Average Annual WageSector Sector Title
vgreen
Text Box
18
U.S. MassachusettsBerkshire
County U.S. MassachusettsBerkshire
County MassachusettsBerkshire
County
Total, All Industries, Private 114,014,680 2,831,460 54,805 100.0% 100.0% 100.0% 1.00 1.0011 - Agriculture, Forestry, Fishing and Hunting 1,166,745 6,508 161 1.0% 0.2% 0.3% 0.22 1.2823 - Construction 7,562,373 132,725 3,075 6.6% 4.7% 5.6% 0.71 1.2031-33 - Manufacturing 13,834,745 286,458 5,510 12.1% 10.1% 10.1% 0.83 0.99Trade, Transportation and Utilities 26,334,681 565,860 10,828 23.1% 20.0% 19.8% 0.87 0.99 22 - Utilities 549,560 10,030 263 0.5% 0.4% 0.5% 0.73 1.35 42 - Wholesale Trade 5,985,704 136,527 1,072 5.2% 4.8% 2.0% 0.92 0.41 44-45 - Retail Trade 15,507,891 347,873 8,657 13.6% 12.3% 15.8% 0.90 1.29 48-49 - Transportation and Warehousing 4,291,526 71,430 836 3.8% 2.5% 1.5% 0.67 0.6051 - Information 3,028,274 89,258 965 2.7% 3.2% 1.8% 1.19 0.56Financial Activities 8,144,680 221,608 2,699 7.1% 7.8% 4.9% 1.10 0.63 52 - Finance and Insurance 5,992,144 179,231 2,030 5.3% 6.3% 3.7% 1.20 0.59 53 - Real Estate and Rental and Leasing 2,152,536 42,378 669 1.9% 1.5% 1.2% 0.79 0.82Professional and Business Services 17,864,146 487,754 5,237 15.7% 17.2% 9.6% 1.10 0.55 54 - Professional and Technical Services 7,631,158 258,622 2,587 6.7% 9.1% 4.7% 1.36 0.52 55 - Management of Companies and Enterprises 1,839,929 61,461 440 1.6% 2.2% 0.8% 1.35 0.37 56 - Administrative and Waste Services 8,393,060 167,671 2,210 7.4% 5.9% 4.0% 0.80 0.68Education and Health Services 17,428,926 604,912 14,115 15.3% 21.4% 25.8% 1.40 1.21 61 - Educational Services, Private 2,284,111 125,681 2,812 2.0% 4.4% 5.1% 2.22 1.16 62 - Health Care and Social Assistance 15,144,814 479,231 11,304 13.3% 16.9% 20.6% 1.27 1.22Leisure and Hospitality 13,327,039 306,132 9,000 11.7% 10.8% 16.4% 0.92 1.52 71 - Arts, Entertainment, and Recreation 1,953,865 49,255 1,823 1.7% 1.7% 3.3% 1.02 1.91 72 - Accommodation and Food Services 11,373,174 256,878 7,177 10.0% 9.1% 13.1% 0.91 1.4481 - Other Services, Except Public Admin 4,437,318 128,977 3,126 3.9% 4.6% 5.7% 1.17 1.25
*See narrative for an explanation of the definition, calculation, uses, and interpretation of location quotients
Prepared by Massachusetts Department of Workforce Development Economic Analysis Office
Source: Quarterly Census of Employment and Wages (ES-202)
Location Quotient*
Employment Shares and Location Quotients by Major Industry Sector
Percent of Total EmploymentAnnual Average Employment
U.S., Massachusetts and Berkshire County Workforce Area2008 Annual Average Private Employment
vgreen
Text Box
19

Guide to Interpretation of Location Quotients
General Concept The location quotient (LQ) is a commonly used measure intended to help analysts compare a region’s level of industry concentration relative to a larger geographic unit such as the state or the nation as a whole. The larger geographic area is referred to as the “base” area or the “reference” area. Location quotients are typically developed for a state, with the U.S. as the base area, or a sub-state area (such as a labor market area or a Workforce Area), with the state as the base area. Location quotients are relatively simple to calculate and yet offer a quick and often valuable insight into a region’s employment dynamics. Calculation of Location Quotients The location quotient is the calculated ratio of an industry’s share of total local area employment divided by the same industry’s share of total base area employment. For example, to calculate a location quotient for Educational Services (NAICS Sector 61) employment in Boston, one would need the following data:
• Educational Services employment for Boston • Total employment for Boston • Educational Services employment for the base area (usually the state) • Total employment for the state
The formula is as follows: Educational Services employment in Boston Total employment in Boston L:.Q.= =================================== Educational Services employment in MA Total Employment in MA Interpretation of Location Quotients A location quotient of greater than one means that the local area has a relatively higher concentration of employment in a given industry than the base area. A location quotient equal to one means that the local area has the same proportion of employment in a given industry as the base area. Location quotients of less than one mean that the area has a smaller proportion of employment in the industry than the base area. This measure can be computed at any industry level the analyst deems important. Location quotients at the aggregated two digit NAICS Sector level may mask significant activity in more detailed industries in the local area. Location quotients should also be viewed in conjunction with other factors, such as the absolute level of employment in the industry. A very high location quotient in an industry that only employs a small number of workers is probably not that significant to local planners. It is generally accepted practice to interpret location quotients of >1.25 as “high” and <.75 as “low.”
vgreen
Text Box
20

One should keep in mind that the location quotient is only an indicator of relative employment concentration in a given area, as compared to the larger (base) area. A high L.Q. does not necessarily mean that there will be growth in that industry. It only means that, on a relative basis, the industry is significant to the local economy. Employment growth is dependent on such factors as the current phase of the business cycle, current nature of technology, business practices, consumer tastes and preferences, demographic trends, etc. While location quotients can provide useful insights into industries where a local comparative advantage exists, they cannot, in and of themselves, provide specific policy guidance. They can help policy makers formulate further questions as to the nature of an areas comparative advantage and how to take advantage of the situation. Some possible questions are:
1) Is the industry dominated by a few large firms or are there many smaller firms? 2) What are the reasons why employers are attracted to the area and what can be done to
encourage growth (or discourage an exodus) of employers?
3) Are there any current or forecasted trends that may make the location of employers in the region more or less desirable
The analysis of location quotients, and other local data, is only the first step. The formulation and implementation of appropriate policy responses is the real challenge for local planners in the employment and training system.
vgreen
Text Box
21

Total Job Openings through 2016
2006 2016
Growth
Replacements
Employed in Same Occupation3,454,400
3,671,100
6%
21%
73%
By 2016 the Massachusetts economy is expected to expand by approximately 6.3 percent or 216,650 new jobs. An additional 768,330 jobs should arise from the need to replace workers who retire, change careers, or advance up the career ladder. In total, nearly 1 million jobs should result.
Source: Massachusetts Employment Projections 2006-2016
Prepared by Massachusetts Department of Workforce DevelopmentEconomic Analysis Office
vgreen
Text Box
22

Fastest Growing Industries, 2006-201656%
47%
45%
43%
37%
32%
31%
26%
24%
22%
22%
22%
20%
19%
18%
17%
16%
16%
14%
14%
Management, Scientific, and Technical Consulting Services
Individual and Family Services
Pharmaceutical and Medicine Manufacturing
Home Health Care Services
Computer Systems Design and Related Services
Residential Care Facilities
Software Publishers
Other Educational Services*
Scientific Research and Development Services
Warehousing and Storage
Waste Management and Remediation Services
Child Day Care Services
Other Professional, Scientific, and Technical Services**
Internet and Other Information Services
Outpatient, Laboratory, and Other Ambulatory Care Services
Architectural, Engineering, and Related Services
Office Administrative Services
Amusement, Gambling, and Recreation Industries
Accounting, Tax Prep., Bookkeeping, and Payroll Services
Hospitals, Private*exam preparation & tutoring & educational consultants**veterinarians, market research, & public polling
Source: Massachusetts Employment Projections 2006-2016
Prepared by Massachusetts Department of Workforce DevelopmentEconomic Analysis Office
vgreen
Text Box
23

Industries Generating the Most New Jobs through 201623,530
19,100
17,600
16,450
12,870
11,320
10,510
10,300
9,370
9,000
7,260
7,080
6,900
6,500
5,420
5,300
4,970
4,800
4,330
3,900
Hospitals, Private
Management, Scientific, and Technical Consulting Services
Computer Systems Design and Related Services
Food Services and Drinking Places
Individual and Family Services
Residential Care Facilities
Offices of Health Care Practitioners
Colleges and Universities, Including Junior Colleges
Scientific Research and Development Services
Home Health Care Services
Employment Services
Services to Buildings and Dwellings
Architectural, Engineering, and Related Services
Software Publishers
Amusement, Gambling, and Recreation Industries
Nursing Care Facilities
Outpatient, Laboratory, & Other Ambulatory Care Services
Child Day Care Services
Other Educational Services*
Wholesale Trade*exam preparation & tutoring & educational consultants
Source: Massachusetts Employment Projections 2006-2016
Prepared by Massachusetts Department of Workforce DevelopmentEconomic Analysis Office
vgreen
Text Box
24

Fastest Growing Occupations 2006-201650%
36%
35%
34%
33%
31%
31%
29%
28%
27%
27%
26%
25%
25%
25%
24%
24%
24%
24%
24%
Network Systems and Data Communications Analysts
Personal and Home Care Aides
Computer Software Engineers, Applications
Home Health Aides
Veterinary Technologists and Technicians
Biochemists and Biophysicists
Veterinarians
Pharmacy Technicians
Skin Care Specialists
Social and Human Service Assistants
Physical Therapist Assistants
Multi-Media Artists and Animators
Microbiologists
Biological Technicians
Health Educators
Mental Health and Substance Abuse Social Workers
Computer Software Engineers, Systems Software
Computer Systems Analysts
Medical Assistants
Medical Scientists, Except Epidemiologists
Source: Massachusetts Employment Projections 2006-2016
Prepared by Massachusetts Department of Workforce DevelopmentEconomic Analysis Office
vgreen
Text Box
25

Occupations Generating Nearly Half of All New Jobs by 201616,110
8,390
8,260
7,760
5,820
5,590
5,330
5,290
5,160
4,950
4,330
4,330
4,010
3,980
3,880
3,800
3,670
3,560
3,540
3,470
Registered Nurses
Customer Service Representatives
Computer Software Engineers, Applications
Combined Food Preparation and Serving Workers, Including Fast Food
Home Health Aides
Nursing Aides, Orderlies, and Attendants
Janitors and Cleaners, Except Maids and Housekeeping Cleaners
Retail Salespersons
Computer Software Engineers, Systems Software
Management Analysts
Social and Human Service Assistants
Accountants and Auditors
Personal and Home Care Aides
Waiters and Waitresses
Executive Secretaries and Administrative Assistants
Network Systems and Data Communications Analysts
Elementary School Teachers, Except Special Education
Computer Systems Analysts
Office Clerks, General
Child Care Workers
Source: Massachusetts Employment Projections 2006-2016
Prepared by Massachusetts Department of Workforce DevelopmentEconomic Analysis Office
vgreen
Text Box
26
10th 25th Median 75th 90th
11-0000 Management Occupations $117,640 $102,900 1.14 $54,160 $74,050 $102,920 $145,390 #
23-0000 Legal Occupations $99,920 $95,820 1.04 $38,100 $54,510 $80,550 $127,590 #
15-0000 Computer and Mathematical Occupations $88,610 $76,290 1.16 $49,830 $65,800 $86,000 $108,370 $132,570
17-0000 Architecture and Engineering Occupations $80,470 $73,590 1.09 $43,250 $56,280 $75,910 $100,840 $126,930
29-0000 Healthcare Practitioners and Technical Occupations $78,390 $69,690 1.12 $31,820 $46,860 $66,910 $93,160 $133,660
13-0000 Business and Financial Operations Occupations $76,990 $65,900 1.17 $40,310 $51,160 $67,570 $90,470 $123,770
19-0000 Life, Physical, and Social Science Occupations $74,710 $65,660 1.14 $36,290 $47,630 $66,850 $93,970 $125,580
25-0000 Education, Training, and Library Occupations $58,230 $49,530 1.18 $24,310 $35,270 $53,890 $71,290 $90,290
27-0000 Arts, Design, Entertainment, Sports, and Media Occupations $55,120 $51,720 1.07 $24,120 $33,660 $48,050 $68,970 $94,010
47-0000 Construction and Extraction Occupations $53,640 $43,350 1.24 $29,370 $37,390 $51,010 $66,850 $83,630
00-0000 Massachusetts All Occupations $52,710 $43,460 1.21 $19,700 $26,720 $40,840 $65,450 $99,090
49-0000 Installation, Maintenance, and Repair Occupations $47,970 $42,210 1.14 $27,130 $34,790 $45,750 $59,760 $72,510
33-0000 Protective Service Occupations $45,820 $41,740 1.10 $21,790 $27,890 $44,300 $60,190 $73,140
21-0000 Community and Social Services Occupations $43,830 $42,750 1.03 $23,270 $28,950 $39,500 $56,220 $71,500
41-0000 Sales and Related Occupations $41,920 $36,020 1.16 $17,560 $19,170 $26,730 $50,850 $86,590
43-0000 Office and Administrative Support Occupations $38,110 $32,990 1.16 $21,280 $27,640 $36,060 $46,710 $56,910
51-0000 Production Occupations $36,250 $33,290 1.09 $20,100 $25,100 $33,220 $44,010 $56,770
53-0000 Transportation and Material Moving Occupations $34,330 $32,180 1.07 $18,670 $22,520 $30,850 $41,750 $53,500
31-0000 Healthcare Support Occupations $31,990 $26,710 1.20 $21,740 $24,950 $29,690 $36,810 $46,290
37-0000 Building and Grounds Cleaning and Maintenance Occupations $30,660 $24,970 1.23 $19,510 $23,210 $28,920 $36,050 $44,740
39-0000 Personal Care and Service Occupations $29,070 $24,680 1.18 $17,990 $20,150 $24,670 $32,400 $46,780
45-0000 Farming, Fishing, and Forestry Occupations $28,600 $23,990 1.19 $17,690 $19,360 $23,910 $34,680 $47,150
35-0000 Food Preparation and Serving Related Occupations $25,110 $20,880 1.20 $17,320 $18,600 $21,840 $28,910 $36,640
Economic Analysis Office
Source: U.S. Bureau of Labor Statistics
Occupational Wages by Major Group, Ranked by Mean WagesMassachusetts and U.S., May 2009
SOC Code Occupational Title Mass. Mean U.S. MeanRatio
Mass. to U.S.Massachusetts Percentile
# Indicates wages of more than $166,400 per year
Prepared by Massachusetts Department of Workforce Development
vgreen
Text Box
27

Total Male Female Total Male Female1975 61.2% 77.9% 46.3% 64.7% 80.4% 51.0%1976 61.6% 77.5% 47.3% 64.7% 79.9% 51.1%1977 62.3% 77.7% 48.4% 64.7% 79.3% 51.8%1978 63.2% 77.9% 50.0% 65.5% 79.5% 53.1%1979 63.7% 77.8% 50.9% 66.2% 79.3% 54.5%1980 63.8% 77.4% 51.5% 65.6% 78.4% 54.1%1981 63.9% 77.0% 52.1% 66.7% 78.5% 56.1%1982 64.0% 76.6% 52.6% 67.4% 79.3% 56.7%1983 64.0% 76.4% 52.9% 66.5% 78.4% 55.9%1984 64.4% 76.4% 53.6% 67.5% 79.0% 57.4%1985 64.8% 76.3% 54.5% 67.3% 77.5% 58.3%1986 65.3% 76.3% 55.3% 67.0% 76.6% 58.6%1987 65.6% 76.2% 56.0% 67.3% 77.0% 55.8%1988 65.9% 76.2% 56.6% 68.4% 78.1% 60.0%1989 66.5% 76.4% 57.4% 68.9% 77.7% 61.0%1990 66.5% 76.4% 57.5% 68.5% 77.4% 60.7%1991 66.2% 75.8% 57.4% 67.8% 76.5% 59.9%1992 66.4% 75.8% 57.8% 67.5% 76.2% 60.0%1993 66.3% 75.4% 57.9% 68.0% 76.4% 60.3%1994 66.6% 75.1% 58.8% 67.9% 75.7% 60.7%1995 66.6% 75.0% 58.9% 67.6% 75.0% 60.8%1996 66.8% 74.9% 59.3% 67.5% 74.0% 61.5%1997 67.1% 75.0% 59.8% 69.0% 75.5% 62.9%1998 67.1% 74.9% 59.8% 68.9% 74.8% 63.4%1999 67.1% 74.7% 60.0% 68.7% 74.8% 63.0%2000 67.1% 74.8% 59.9% 67.4% 73.8% 61.4%2001 66.8% 74.4% 59.8% 68.0% 74.9% 61.6%2002 66.6% 74.1% 59.6% 69.1% 76.6% 62.3%2003 66.2% 73.5% 59.5% 67.9% 74.8% 61.7%2004 66.0% 73.3% 59.2% 67.5% 73.7% 61.9%2005 66.0% 73.3% 59.3% 66.8% 72.7% 61.4%
2006 P/ 66.2% 73.5% 59.4% 67.0% 73.5% 61.0%
2007 P/ 66.0% 73.2% 59.3% 66.9% 74.5% 59.9%
2008 P/ 66.0% 73.0% 59.5% 66.6% 72.3% 61.4%2009 P/
65.4% 72.0% 59.2% 66.5% 71.6% 61.9%
Economic Analysis OfficeCompiled and prepared by Massachusetts Department of Workforce Development
Massachusetts Labor Force Participation Rate
Labor Force Participation Rates 1975-2009 for United States and Massachusetts
National Labor Force Participation Rate
45.0%
50.0%
55.0%
60.0%
65.0%
70.0%
75.0%
80.0%
85.0%
1975
1976
1977
1978
1979
1980
1981
1982
1983
1984
1985
1986
1987
1988
1989
1990
1991
1992
1993
1994
1995
1996
1997
1998
1999
2000
2001
2002
2003
2004
2005
2006
P/
2007
P/
2008
P/
2009
P/
MA Men
MA Total
US Total
MA Women
US Women
US Men
National recessions
Labor Force Participation Rate:The proportion of the total civilian non-institutional population 16 years or older, or of a demographic subgroup of that population, classified as "in the labor force".
US Business Cycle Contractions:• November 1973 to March 1975 (16 months)• January 1980 to July 1980 (6 months)• July 1981 to November 1982 (16 Months)• July 1990 to March 1991 (8 months)• March 2001 to November 2001(8 months)• December 2007 to CurrentSource: National Bureau of Economic Research Business Cycle Dating Committee
Source: MA 1975 to 2009 U.S. Department of Labor, Bureau of Labor Statistics,Geographic Profile of Employment and Unemployment.Compiled and Prepared by Mass Dept of Workforce Development,Division of Career Services, Economic Analysis OfficeP=Preliminary data
Note: The NBER does not define a recession in terms of two consecutive quarters of decline in real GDP. Rather, a recession is a significant decline in economic activity spread across the economy, lasting more than a few months, normally visible in real GDP, real income, employment, industrial production, and wholesale-retail sales.
Labor force participation rates 1975-2009 for United States and Massachusetts
vgreen
Text Box
28
STATENational
Rank TotalNational
Rank MaleNational
rank Female
United States 65.4% 73.0% 59.2%New England 67.6% 72.5% 62.9%Connecticut 15 68.8% 17 74.0% 13 63.9%Maine 29 65.2% 36 70.2% 24 60.6%Massachusetts 22 66.5% 28 71.6% 18 61.9%New Hampshire 11 70.3% 10 70.3% 10 65.3%Rhode Island 19 67.4% 25 72.6% 17 62.2%
Vermont 8 71.1% 21 73.4% 1 68.8%
2009 Labor Force Participation Rates for United States and New England States
Compiled and prepared by Massachusetts Department of Workforce Development
Economic Analysis Office
Source: U.S. Department of Labor, Bureau of Labor Statistics, Geographic Profile of Employment and Unemployment, 2009
Uni
ted
Stat
es 6
5.4%
New
Eng
land
67.
6%C
onne
ctic
ut 6
8.8%
Mas
sach
uset
ts 6
6.5%
Mai
ne 6
5.2%
New
Ham
pshi
re 7
0.3%
Rho
de I
slan
d 67
.4%
Ver
mon
t 71
.1%
Uni
ted
Stat
es 7
3.0%
New
Eng
land
72.
5%C
onne
ctic
ut 7
4.0%
Mas
sach
uset
ts 7
1.6%
Mai
ne 7
0.2%
New
Ham
pshi
re 7
0.3%
Rho
de I
slan
d 72
.6%
Ver
mon
t 73
.4%
Uni
ted
Stat
es 5
9.2%
New
Eng
land
62.
9%C
onne
ctic
ut 6
3.9%
Mas
sach
uset
ts 6
1.9%
Mai
ne 6
0.6%
New
Ham
pshi
re 6
5.3%
Rho
de I
slan
d 62
.2%
Ver
mon
t 68
.8%
Total Male Female
2009 Labor Force Participation Rates for New England States
Note: Labor Force Participation Rate is the proportion of the total civilian non-institutional population 16 years or older, or of a demographic subgroup of that population, classified as "in the labor force".
vgreen
Text Box
29

July 1, 2009 July 1, 2008 July 1, 2007 July 1, 2006 July 1, 2005 July 1, 2004 July 1, 2003 July 1, 2002 July 1, 2001 July 1, 2000Estimates
Base CensusNet
Change Percent Change
United States 307,006,550 304,374,846 301,579,895 298,593,212 295,753,151 293,045,739 290,326,418 287,803,914 285,081,556 282,171,957 281,424,602 281,421,906 25,581,948 9.1%Massachusetts 6,593,587 6,543,595 6,499,275 6,466,399 6,453,031 6,451,279 6,451,637 6,440,978 6,411,730 6,363,015 6,349,119 6,349,097 244,468 3.9%
Berkshire County 129,288 129,571 130,219 130,494 131,268 132,052 132,672 133,101 133,723 134,787 134,953 134,953 -5,665 -4.2%Boston 645,169 636,748 622,748 612,192 609,690 607,367 607,871 607,931 602,380 590,433 589,143 589,141 56,026 9.5%Bristol County 363,332 361,945 360,829 360,271 360,533 361,084 360,995 359,491 356,413 354,090 353,164 353,153 10,168 2.9%Brockton 237,254 236,233 235,227 234,218 234,116 234,522 234,774 234,297 233,127 231,530 230,990 230,970 6,264 2.7%Cape and Islands 248,447 248,565 248,933 249,641 251,002 252,784 253,830 252,349 249,871 247,891 246,741 198,916 1,706 0.7%Central Mass 573,897 571,010 567,890 565,206 561,372 557,883 554,436 549,282 543,247 536,306 534,461 534,433 39,436 7.4%Franklin/Hampshire 244,151 243,852 243,344 242,730 242,306 242,145 241,853 240,775 239,603 239,313 239,138 239,140 5,013 2.1%Greater Lowell 276,367 271,637 269,617 267,962 268,143 269,149 270,127 270,828 271,379 270,442 269,923 270,083 6,444 2.4%Greater New Bedford 210,082 209,590 208,975 208,730 209,533 209,497 209,778 208,067 206,341 205,914 205,342 205,354 4,740 2.3%Hampden County 471,081 469,204 467,756 466,944 465,871 464,622 463,442 460,848 457,723 456,573 456,226 456,228 14,855 3.3%Lower Merrimack Valley 329,019 326,470 324,091 322,640 322,265 322,619 323,332 323,188 322,455 319,471 318,558 318,556 10,461 3.3%Metro North 762,574 753,870 748,343 742,757 739,949 741,038 743,799 746,916 748,905 744,023 743,199 743,219 19,375 2.6%Metro South/West 912,164 903,364 896,150 891,251 889,403 890,449 890,120 891,503 890,399 884,750 882,935 882,953 29,229 3.3%North Central 254,799 252,901 251,980 250,450 248,932 247,813 246,650 245,119 243,015 239,866 238,964 238,787 15,835 6.6%North Shore 413,563 410,895 408,975 408,534 407,991 408,282 408,971 409,908 408,327 405,908 404,863 404,863 8,700 2.1%South Shore 522,400 517,740 514,198 512,379 510,657 509,973 508,987 507,375 504,822 501,718 500,519 500,527 21,881 4.4%
Annual Estimates of the Population for Massachusetts by Workforce Area April 1, 2000 to July 1, 2009
Economic Analysis Office
Source: Population Division, U.S. Census Bureau, Release Date: March, 2010
Population Estimates
Estimates Base Population April 1,
2000 to July 1, 2009
Note: The April 1, 2000 estimates base reflects changes to the Census 2000 population resulting from legal boundary updates, other geographic program changes, and Count Question Resolution actions. All geographic boundaries for the 2009 population estimates series are defined as of January 1, 2009. An "(X)" in the Census 2000 field indicates a locality that was formed or incorporated after Census 2000. Additional information on these localities can be found in the Geographic Change Notes (see "Geographic Changes" under the Geographic Topics section of the Estimates page).
Prepared by Massachusetts Department of Workforce Development
April 1, 2000
Geographic Area
vgreen
Text Box
30

July 1, 2009 July 1, 2008 July 1, 2007 July 1, 2006 July 1, 2005 July 1, 2004 July 1, 2003 July 1, 2002 July 1, 2001 July 1, 2000Estimates
Base Census Net Change Percent Change
United States 307,006,550 304,374,846 301,579,895 298,593,212 295,753,151 293,045,739 290,326,418 287,803,914 285,081,556 282,171,957 281,424,602 281,421,906 25,581,948 9.1%Massachusetts 6,593,587 6,543,595 6,499,275 6,466,399 6,453,031 6,451,279 6,451,637 6,440,978 6,411,730 6,363,015 6,349,119 6,349,097 244,468 3.9%
Berkshire County 129,288 129,571 130,219 130,494 131,268 132,052 132,672 133,101 133,723 134,787 134,953 134,953 -5,665 -4.2%.Adams Town 8,247 8,296 8,341 8,368 8,506 8,513 8,575 8,634 8,702 8,795 8,809 8,809 -562 -6.4%.Alford Town 390 389 392 392 394 389 391 392 394 398 399 399 -9 -2.3%
.Becket Town 1,802 1,801 1,803 1,787 1,777 1,767 1,759 1,747 1,745 1,751 1,756 1,755 46 2.6%
.Cheshire Town 3,304 3,314 3,322 3,323 3,335 3,338 3,349 3,366 3,385 3,402 3,401 3,401 -97 -2.9%
.Clarksburg Town 1,615 1,618 1,624 1,628 1,641 1,648 1,661 1,666 1,669 1,681 1,682 1,686 -67 -4.0%
.Dalton Town 6,553 6,579 6,607 6,622 6,647 6,697 6,741 6,776 6,802 6,880 6,892 6,892 -339 -4.9%
.Egremont Town 1,343 1,351 1,346 1,348 1,350 1,347 1,343 1,342 1,342 1,346 1,345 1,345 -2 -0.1%
.Florida Town 675 677 677 669 660 656 660 664 669 675 676 676 -1 -0.1%
.Great Barrington Town 7,358 7,385 7,408 7,375 7,408 7,405 7,427 7,441 7,466 7,508 7,515 7,527 -157 -2.1%
.Hancock Town 1,264 1,109 1,075 1,077 1,070 1,057 992 820 720 718 716 721 548 76.5%
.Hinsdale Town 1,909 1,917 1,933 1,943 1,933 1,934 1,905 1,872 1,871 1,876 1,877 1,872 32 1.7%
.Lanesborough Town 2,853 2,866 2,891 2,901 2,929 2,946 2,955 2,962 2,973 2,993 2,991 2,990 -138 -4.6%
.Lee Town 5,740 5,752 5,777 5,785 5,815 5,833 5,862 5,876 5,921 5,980 5,993 5,985 -253 -4.2%
.Lenox Town 5,084 5,094 5,117 5,121 5,122 5,126 5,155 5,144 5,137 5,093 5,077 5,077 7 0.1%
.Monterey Town 957 955 955 949 949 946 943 939 936 937 936 934 21 2.2%
.Mount Washington Town 135 136 137 136 133 132 130 130 129 130 130 130 5 3.8%
.New Ashford Town 248 247 247 245 244 243 244 246 248 248 247 247 1 0.4%
.New Marlborough Town 1,508 1,508 1,515 1,513 1,508 1,500 1,486 1,489 1,498 1,496 1,494 1,494 14 0.9%
.North Adams City 13,816 13,850 13,874 14,029 14,122 14,226 14,333 14,441 14,553 14,650 14,691 14,681 -875 -6.0%
.Otis Town 1,396 1,395 1,387 1,370 1,373 1,367 1,360 1,357 1,353 1,363 1,364 1,365 32 2.3%
.Peru Town 830 830 831 831 824 812 806 802 808 817 816 821 14 1.7%
.Pittsfield City 42,432 42,624 42,973 43,117 43,529 44,077 44,406 44,812 45,183 45,699 45,797 45,793 -3,365 -7.3%
.Richmond Town 1,571 1,572 1,584 1,587 1,605 1,618 1,611 1,604 1,601 1,605 1,604 1,604 -33 -2.1%
.Sandisfield Town 849 842 836 819 816 812 816 818 819 824 824 824 25 3.0%
.Savoy Town 707 706 704 696 700 704 705 701 701 706 705 705 2 0.3%
.Sheffield Town 3,297 3,309 3,320 3,321 3,324 3,327 3,334 3,316 3,318 3,335 3,335 3,335 -38 -1.1%
.Stockbridge Town 2,196 2,202 2,230 2,227 2,196 2,222 2,230 2,243 2,255 2,274 2,272 2,276 -76 -3.3%
.Tyringham Town 340 341 337 340 345 349 353 356 351 348 346 350 -6 -1.7%
.Washington Town 541 542 546 541 539 538 537 537 538 543 544 544 -3 -0.6%
.West Stockbridge Town 1,432 1,438 1,447 1,445 1,439 1,443 1,442 1,437 1,432 1,425 1,426 1,416 6 0.4%
.Williamstown Town 8,028 8,055 8,109 8,116 8,167 8,209 8,291 8,303 8,331 8,417 8,418 8,424 -390 -4.6%
.Windsor Town 868 871 874 873 868 871 870 868 873 874 875 875 -7 -0.8%
Prepared by Massachusetts Department of Workforce Development
Economic Analysis Office
Source: Population Division, U.S. Census Bureau, Release Date: March, 2010
Note: The April 1, 2000 estimates base reflects changes to the Census 2000 population resulting from legal boundary updates, other geographic program changes, and Count Question Resolution actions. All geographic boundaries for the 2009 population estimates series are defined as of January 1, 2009. An "(X)" in the Census 2000 field indicates a locality that was formed or incorporated after Census 2000. Additional information on these localities can be found in the Geographic Change Notes (see "Geographic Changes" under the Geographic Topics section of the Estimates page).
Annual Estimates of the Population for Cities and Towns in the Berkshire County Workforce Area April 1, 2000 to July 1, 2009
Geographic Area
April 1, 2000
Estimates Base Population April 1,
2000 to July 1, 2009Population Estimates
vgreen
Text Box
31
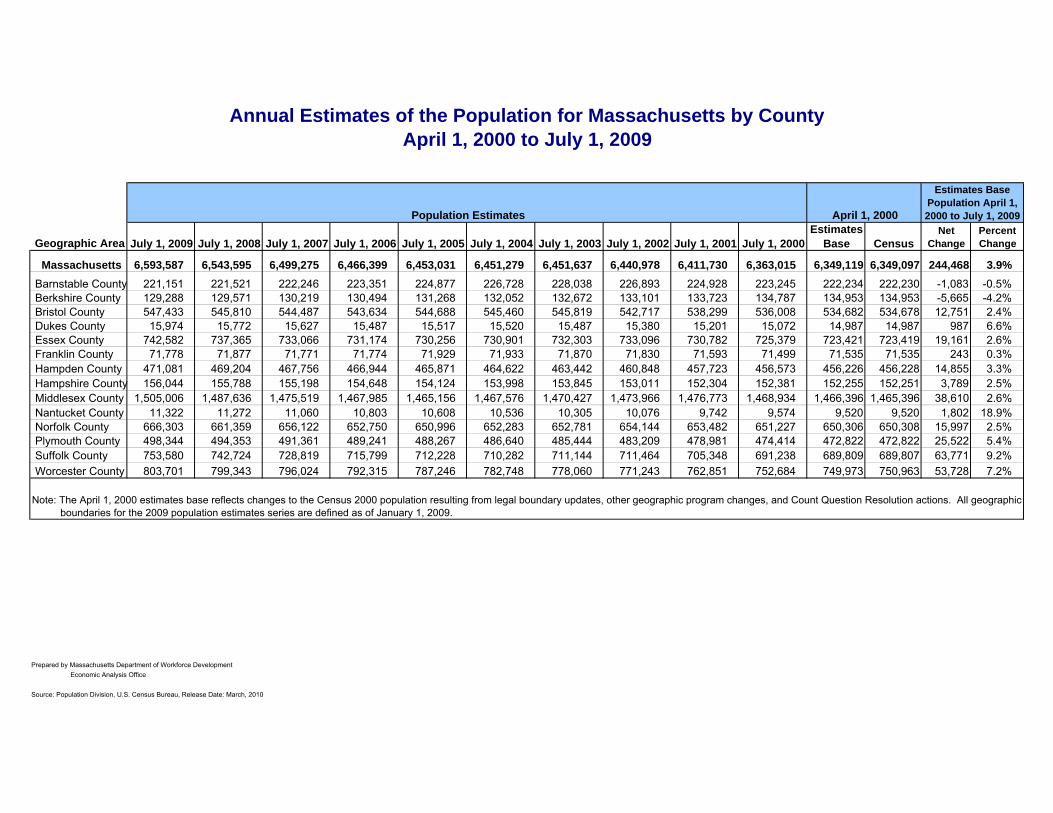
July 1, 2009 July 1, 2008 July 1, 2007 July 1, 2006 July 1, 2005 July 1, 2004 July 1, 2003 July 1, 2002 July 1, 2001 July 1, 2000Estimates
Base CensusNet
Change Percent Change
Massachusetts 6,593,587 6,543,595 6,499,275 6,466,399 6,453,031 6,451,279 6,451,637 6,440,978 6,411,730 6,363,015 6,349,119 6,349,097 244,468 3.9%.Barnstable County 221,151 221,521 222,246 223,351 224,877 226,728 228,038 226,893 224,928 223,245 222,234 222,230 -1,083 -0.5%.Berkshire County 129,288 129,571 130,219 130,494 131,268 132,052 132,672 133,101 133,723 134,787 134,953 134,953 -5,665 -4.2%.Bristol County 547,433 545,810 544,487 543,634 544,688 545,460 545,819 542,717 538,299 536,008 534,682 534,678 12,751 2.4%.Dukes County 15,974 15,772 15,627 15,487 15,517 15,520 15,487 15,380 15,201 15,072 14,987 14,987 987 6.6%.Essex County 742,582 737,365 733,066 731,174 730,256 730,901 732,303 733,096 730,782 725,379 723,421 723,419 19,161 2.6%.Franklin County 71,778 71,877 71,771 71,774 71,929 71,933 71,870 71,830 71,593 71,499 71,535 71,535 243 0.3%.Hampden County 471,081 469,204 467,756 466,944 465,871 464,622 463,442 460,848 457,723 456,573 456,226 456,228 14,855 3.3%.Hampshire County 156,044 155,788 155,198 154,648 154,124 153,998 153,845 153,011 152,304 152,381 152,255 152,251 3,789 2.5%.Middlesex County 1,505,006 1,487,636 1,475,519 1,467,985 1,465,156 1,467,576 1,470,427 1,473,966 1,476,773 1,468,934 1,466,396 1,465,396 38,610 2.6%.Nantucket County 11,322 11,272 11,060 10,803 10,608 10,536 10,305 10,076 9,742 9,574 9,520 9,520 1,802 18.9%.Norfolk County 666,303 661,359 656,122 652,750 650,996 652,283 652,781 654,144 653,482 651,227 650,306 650,308 15,997 2.5%.Plymouth County 498,344 494,353 491,361 489,241 488,267 486,640 485,444 483,209 478,981 474,414 472,822 472,822 25,522 5.4%.Suffolk County 753,580 742,724 728,819 715,799 712,228 710,282 711,144 711,464 705,348 691,238 689,809 689,807 63,771 9.2%.Worcester County 803,701 799,343 796,024 792,315 787,246 782,748 778,060 771,243 762,851 752,684 749,973 750,963 53,728 7.2%
Estimates Base Population April 1, 2000 to July 1, 2009
Annual Estimates of the Population for Massachusetts by County April 1, 2000 to July 1, 2009
Geographic Area
Population Estimates April 1, 2000
Note: The April 1, 2000 estimates base reflects changes to the Census 2000 population resulting from legal boundary updates, other geographic program changes, and Count Question Resolution actions. All geographic boundaries for the 2009 population estimates series are defined as of January 1, 2009.
Prepared by Massachusetts Department of Workforce Development Economic Analysis Office
Source: Population Division, U.S. Census Bureau, Release Date: March, 2010
vgreen
Text Box
32
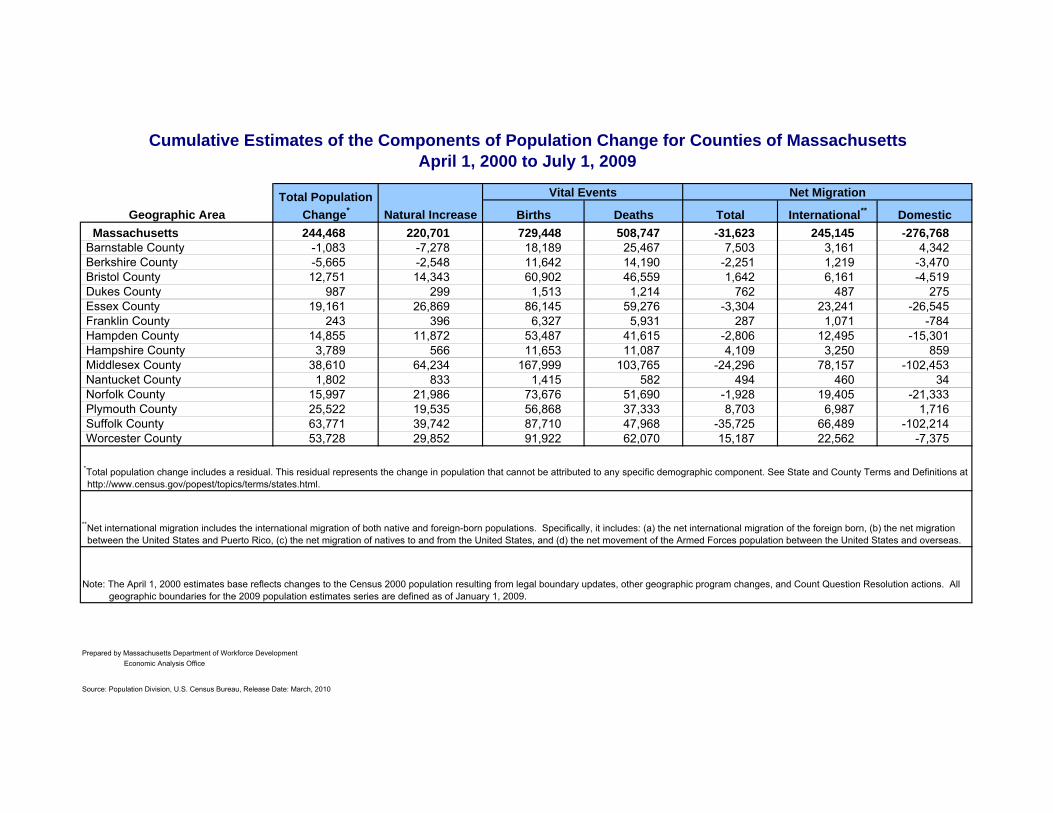
Births Deaths Total International** DomesticMassachusetts 244,468 220,701 729,448 508,747 -31,623 245,145 -276,768
.Barnstable County -1,083 -7,278 18,189 25,467 7,503 3,161 4,342
.Berkshire County -5,665 -2,548 11,642 14,190 -2,251 1,219 -3,470
.Bristol County 12,751 14,343 60,902 46,559 1,642 6,161 -4,519
.Dukes County 987 299 1,513 1,214 762 487 275
.Essex County 19,161 26,869 86,145 59,276 -3,304 23,241 -26,545
.Franklin County 243 396 6,327 5,931 287 1,071 -784
.Hampden County 14,855 11,872 53,487 41,615 -2,806 12,495 -15,301
.Hampshire County 3,789 566 11,653 11,087 4,109 3,250 859
.Middlesex County 38,610 64,234 167,999 103,765 -24,296 78,157 -102,453
.Nantucket County 1,802 833 1,415 582 494 460 34
.Norfolk County 15,997 21,986 73,676 51,690 -1,928 19,405 -21,333
.Plymouth County 25,522 19,535 56,868 37,333 8,703 6,987 1,716
.Suffolk County 63,771 39,742 87,710 47,968 -35,725 66,489 -102,214
.Worcester County 53,728 29,852 91,922 62,070 15,187 22,562 -7,375
*Total population change includes a residual. This residual represents the change in population that cannot be attributed to any specific demographic component. See State and County Terms and Definitions at http://www.census.gov/popest/topics/terms/states.html.
**Net international migration includes the international migration of both native and foreign-born populations. Specifically, it includes: (a) the net international migration of the foreign born, (b) the net migration between the United States and Puerto Rico, (c) the net migration of natives to and from the United States, and (d) the net movement of the Armed Forces population between the United States and overseas.
Cumulative Estimates of the Components of Population Change for Counties of Massachusetts April 1, 2000 to July 1, 2009
Geographic AreaTotal Population
Change* Natural Increase
Vital Events Net Migration
Note: The April 1, 2000 estimates base reflects changes to the Census 2000 population resulting from legal boundary updates, other geographic program changes, and Count Question Resolution actions. All geographic boundaries for the 2009 population estimates series are defined as of January 1, 2009.
Prepared by Massachusetts Department of Workforce Development Economic Analysis Office
Source: Population Division, U.S. Census Bureau, Release Date: March, 2010
vgreen
Text Box
33
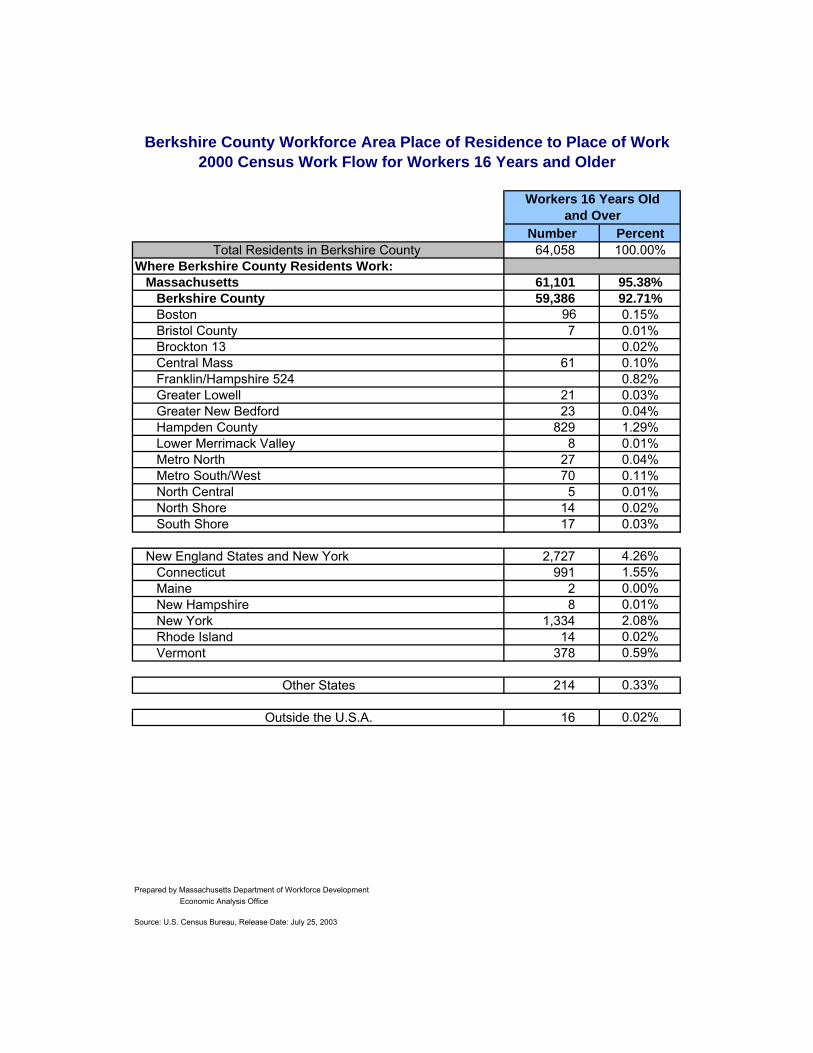
Number Percent Total Residents in Berkshire County 64,058 100.00%
Where Berkshire County Residents Work:Massachusetts 61,101 95.38%
Berkshire County 59,386 92.71%Boston 96 0.15%Bristol County 7 0.01%Brockton 13 0.02%Central Mass 61 0.10%Franklin/Hampshire 524 0.82%Greater Lowell 21 0.03%Greater New Bedford 23 0.04%Hampden County 829 1.29%Lower Merrimack Valley 8 0.01%Metro North 27 0.04%Metro South/West 70 0.11%North Central 5 0.01%North Shore 14 0.02%South Shore 17 0.03%
New England States and New York 2,727 4.26%Connecticut 991 1.55%Maine 2 0.00%New Hampshire 8 0.01%New York 1,334 2.08%Rhode Island 14 0.02%Vermont 378 0.59%
Other States 214 0.33%
Outside the U.S.A. 16 0.02%
Prepared by Massachusetts Department of Workforce Development Economic Analysis Office
Source: U.S. Census Bureau, Release Date: July 25, 2003
Berkshire County Workforce Area Place of Residence to Place of Work2000 Census Work Flow for Workers 16 Years and Older
Workers 16 Years Old and Over
vgreen
Text Box
34

Number Percent Total Working in Berkshire County Workforce Area 65,964 100.00%
Where Berkshire County Workers Reside:Berkshire County 59,386 90.03%
Outside Berkshire County 6,578 9.97%Boston 21 0.03%Brockton 9 0.01%Cape and Islands 50 0.08%Central Mass 58 0.09%Franklin/Hampshire 1,007 1.53%Greater Lowell 33 0.05%Hampden County 909 1.38%Lower Merrimack Valley 23 0.03%Metro North 71 0.11%Metro South/West 63 0.10%North Central 41 0.06%North Shore 16 0.02%South Shore 25 0.04%
New England States and New York 4,133 6.27%Connecticut 344 0.52%New England States and New York 6 0.01%New Hampshire 14 0.02%New York 2,557 3.88%Rhode Island 37 0.06%Vermont 1,175 1.78%
Other States 119 0.18%
Economic Analysis Office
Source: U.S. Census Bureau, Release Date: July 25, 2003
Workers 16 Years Old and Over
Berkshire County Workforce Area Place of Work by Place of Residence2000 Census Work Flow for Workers 16 Years and Older
Prepared by Massachusetts Department of Workforce Development
vgreen
Text Box
35
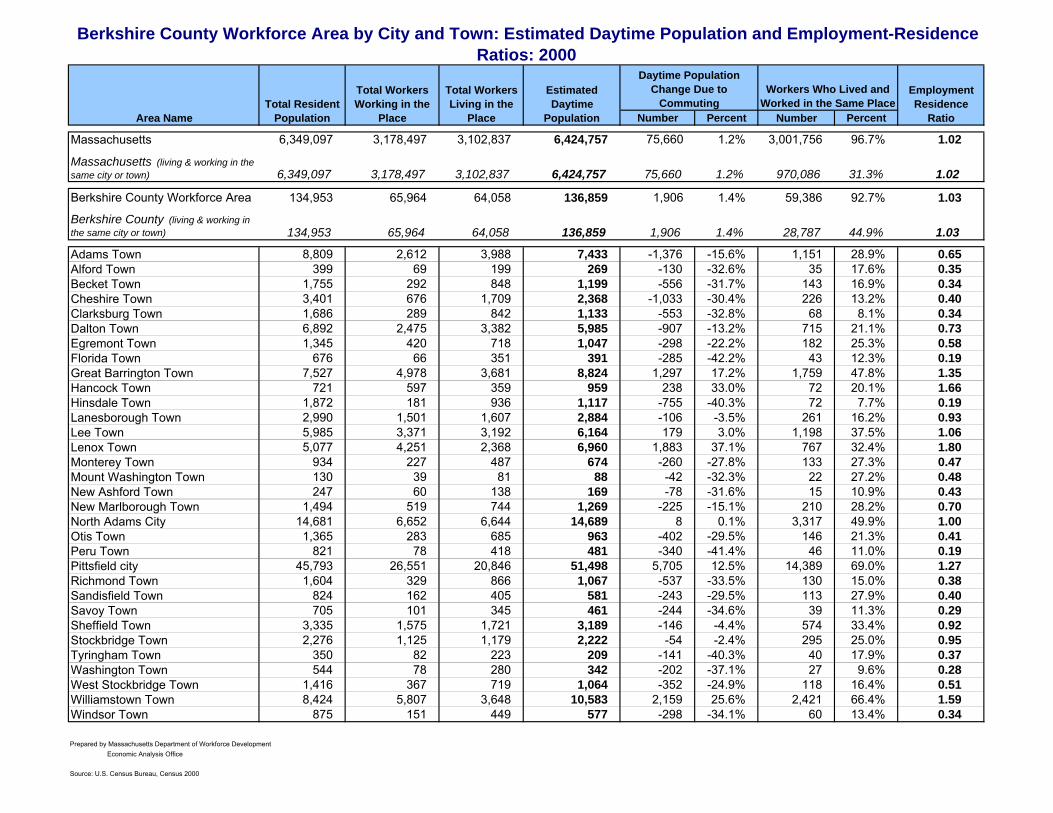
Number Percent Number Percent
Massachusetts 6,349,097 3,178,497 3,102,837 6,424,757 75,660 1.2% 3,001,756 96.7% 1.02
Massachusetts (living & working in the same city or town) 6,349,097 3,178,497 3,102,837 6,424,757 75,660 1.2% 970,086 31.3% 1.02
Berkshire County Workforce Area 134,953 65,964 64,058 136,859 1,906 1.4% 59,386 92.7% 1.03
Berkshire County (living & working in the same city or town) 134,953 65,964 64,058 136,859 1,906 1.4% 28,787 44.9% 1.03
Adams Town 8,809 2,612 3,988 7,433 -1,376 -15.6% 1,151 28.9% 0.65Alford Town 399 69 199 269 -130 -32.6% 35 17.6% 0.35Becket Town 1,755 292 848 1,199 -556 -31.7% 143 16.9% 0.34Cheshire Town 3,401 676 1,709 2,368 -1,033 -30.4% 226 13.2% 0.40Clarksburg Town 1,686 289 842 1,133 -553 -32.8% 68 8.1% 0.34Dalton Town 6,892 2,475 3,382 5,985 -907 -13.2% 715 21.1% 0.73Egremont Town 1,345 420 718 1,047 -298 -22.2% 182 25.3% 0.58Florida Town 676 66 351 391 -285 -42.2% 43 12.3% 0.19Great Barrington Town 7,527 4,978 3,681 8,824 1,297 17.2% 1,759 47.8% 1.35Hancock Town 721 597 359 959 238 33.0% 72 20.1% 1.66Hinsdale Town 1,872 181 936 1,117 -755 -40.3% 72 7.7% 0.19Lanesborough Town 2,990 1,501 1,607 2,884 -106 -3.5% 261 16.2% 0.93Lee Town 5,985 3,371 3,192 6,164 179 3.0% 1,198 37.5% 1.06Lenox Town 5,077 4,251 2,368 6,960 1,883 37.1% 767 32.4% 1.80Monterey Town 934 227 487 674 -260 -27.8% 133 27.3% 0.47Mount Washington Town 130 39 81 88 -42 -32.3% 22 27.2% 0.48New Ashford Town 247 60 138 169 -78 -31.6% 15 10.9% 0.43New Marlborough Town 1,494 519 744 1,269 -225 -15.1% 210 28.2% 0.70North Adams City 14,681 6,652 6,644 14,689 8 0.1% 3,317 49.9% 1.00Otis Town 1,365 283 685 963 -402 -29.5% 146 21.3% 0.41Peru Town 821 78 418 481 -340 -41.4% 46 11.0% 0.19Pittsfield city 45,793 26,551 20,846 51,498 5,705 12.5% 14,389 69.0% 1.27Richmond Town 1,604 329 866 1,067 -537 -33.5% 130 15.0% 0.38Sandisfield Town 824 162 405 581 -243 -29.5% 113 27.9% 0.40Savoy Town 705 101 345 461 -244 -34.6% 39 11.3% 0.29Sheffield Town 3,335 1,575 1,721 3,189 -146 -4.4% 574 33.4% 0.92Stockbridge Town 2,276 1,125 1,179 2,222 -54 -2.4% 295 25.0% 0.95Tyringham Town 350 82 223 209 -141 -40.3% 40 17.9% 0.37Washington Town 544 78 280 342 -202 -37.1% 27 9.6% 0.28West Stockbridge Town 1,416 367 719 1,064 -352 -24.9% 118 16.4% 0.51Williamstown Town 8,424 5,807 3,648 10,583 2,159 25.6% 2,421 66.4% 1.59Windsor Town 875 151 449 577 -298 -34.1% 60 13.4% 0.34
Berkshire County Workforce Area by City and Town: Estimated Daytime Population and Employment-Residence Ratios: 2000
Area NameTotal Resident
Population
Total Workers Working in the
Place
Total Workers Living in the
Place
Estimated Daytime
Population
Daytime Population Change Due to
CommutingWorkers Who Lived and
Worked in the Same PlaceEmployment Residence
Ratio
Prepared by Massachusetts Department of Workforce Development Economic Analysis Office
Source: U.S. Census Bureau, Census 2000
vgreen
Text Box
36

Estimated daytime population – this is the estimate arrived at by adjusting the total resident population by the number of incommuters and outcommuters to the place, using data from Census 2000. It does not adjust for people entering or leaving the place for purposes other than commuting, nor does the commuting adjustment take the time of day of the work trips into account. The estimate is calculated by adding the total resident population and the total workers working in the place, and then subtracting from that result the total workers living in the place. This method yields the same result as would be obtained by adding the incommuters and subtracting the outcommuters from the total resident population.Daytime population change due to commuting: number – this is the numeric increase or decrease in the population of the place as a result of work-related commuting. It is the net change in the population due to work travel and is computed by subtracting the total resident population from the estimated daytime population. Positive numbers indicate more commuters entering the place than leaving it. Negative numbers occur when more workers leave the place to go to work than enter it to come to work.
Daytime population change due to commuting: percent – this is the percentage increase or decrease in the population of the place as a result of work-related commuting. It is calculated by dividing the numeric change due to commuting by the total resident population, and multiplying the result by 100. Positive figures denote the percentage increase experienced by the population, while negative numbers show the percentage decrease in the population as a result of commuting.
Technical Notes for estimated daytime population and employment-residence ratios.Workers – people 16 years and over who were employed and at work during the reference week. The estimate of workers includes part-time and full-time civilian personnel and people in the Armed Forces.Total resident population – the total number of persons living in the place, as shown in Census 2000 100-percent data such as Summary File 1.Total workers working in the place – this is the number of workers who reported working in the place, regardless of their place of residence. In other words, it is the totalthat worked there no matter where they lived. Residence locations are not considered, only workplace locations are reflected in this number.
Prepared by Massachusetts Department of Workforce Development Economic Analysis Office
Source: U.S. Census Bureau, Census 2000
Workers who lived and worked in the same place: number – this value shows how many workers who lived in a particular place also worked in that same place. It is derived from place of residence location information and responses to the question on workplace location during the week prior to filling out the census questionnaire.Workers who lived and worked in the same place: percent – this measure is sometimes used as an indicator of worker retention, but it does not reflect variation in areasize or other attributes very well. It is computed by dividing the number of workers who lived and worked in the same place by the total workers living there and multiplying the result by 100.
Employment-residence (E-R) ratio – this is a measure of the total number of workers working in a place, relative to the total number of workers living in the place. It is often used as a rough indication of the jobs-workers balance in a place, although it does not take into account whether the resident workers possess the skills needed for the jobs that are available. E-R ratios greater than 1.00 occur when there are more workers working in the place than living there. These places can be considered as net importers of labor. For example, an E-R ratio of 1.19 means that there are 19 percent more workers working in the place than living in the place. Values less than 1.00 indicate places that send more workers to other areas than they receive, i.e., they are net exporters of labor.
Total workers living in the place – this is sometimes referred to as the number of resident workers. It is the number of people living in the place who are workers. It includes workers who live there regardless of where they worked, or in other words, no matter where their workplace was located. Place of work location is not considered, only residence location is reflected in this number.
vgreen
Text Box
37

Commonwealth of Massachusetts
Executive Office of Labor and Workforce Development
Joanne F. Goldstein 05/10
Related Documents