Regional Investment Plan Baltic Sea August 2020 · Draft version prior to public consultation Ten-Year Network Development Plan 2020

Welcome message from author
This document is posted to help you gain knowledge. Please leave a comment to let me know what you think about it! Share it to your friends and learn new things together.
Transcript
Regional Investment PlanBaltic SeaAugust 2020 · Draft version prior to public consultation
Ten-Year Network Development Plan 2020

Regional Investment Plan 2020 – Baltic Sea
ENTSO-E | Rue de Spa, 8 | 1000 Brussels | [email protected] | www.entsoe.eu | @entso_e Page 2 of 71
Table of Contents
1. EXECUTIVE SUMMARY.............................................................................................. 3
1.1 Key messages of the region ........................................................................................................................................................ 3 1.2 Future capacity needs ........................................................................................................................................................... 5
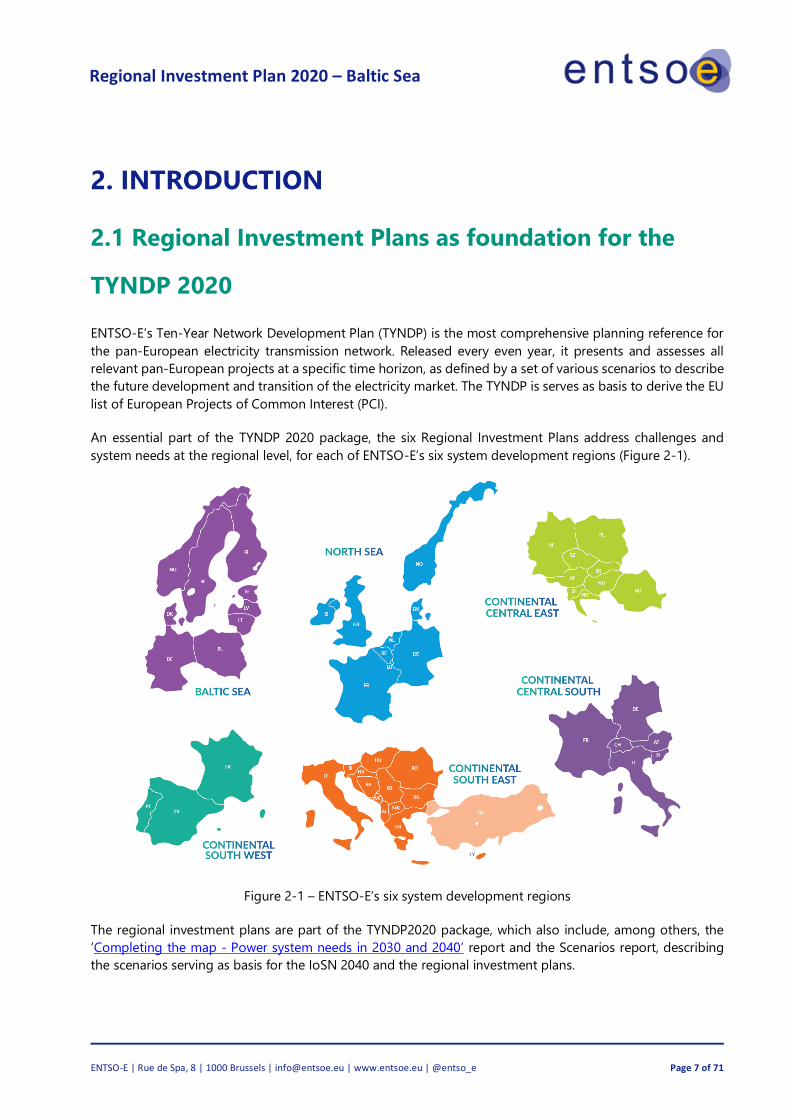
2 .INTRODUCTION .................................................................................................... 7
2.1 Regional Investment Plans as foundation for the TYNDP 2020 ............................................................................... 7 2.2 Legal requirements ................................................................................................................................................................. 8 2.3 Scope and structure of the Regional Investment Plans ................................................................................................ 8 2.4 General methodology ........................................................................................................................................................ 10 2.5 Introduction to the region ................................................................................................................................................. 10 2.6 Evolution since the RegIP 2017 ...................................................................................................................................... 11
3. REGIONAL CONTEXT .......................................................................................... 13
3.1 Present situation ................................................................................................................................................................... 13 3.1.1 The transmission grid in the Baltic Sea region .................................................................................................. 13 3.1.2 Power generation, consumption and exchange in the Baltic Sea region...................................................... 15 3.1.3 Grid constraints in the Baltic Sea region ............................................................................................................ 19
3.2 Description of the scenarios ..................................................................................................................................................... 20 3.2.1 Selective description of electricity results .................................................................................................................. 22 3.2.2 Key findings of the scenarios for the Baltic Sea region. .................................................................................. 26 3.2.3 Technical challenges of the power system ......................................................................................................... 29
4 . REGIONAL RESULTS ......................................................................................... 32
4.1 Future capacity needs ......................................................................................................................................................... 32 4.2 Market results of IoSN 2040............................................................................................................................................ 36
5. Additional Regional Studies and MAF study ............................................................ 43
5.1 Baltic synchronisation ............................................................................................................................................................... 43 5.2 ENTSO-E Mid Term Adequacy Forecast (MAF) 2019 .................................................................................................... 46 5.3 Challenges and opportunities for the Nordic power system...................................................................................... 48 5.4 Nordic Grid Development Plan 2019 ............................................................................................................................ 49
Appendices ....................................................................................................................... 51
Appendix 1. Links to the National Development Plans ........................................................................................................... 51 Appendix 2. Projects .............................................................................................................................................................. 52
Pan-European projects ............................................................................................................................................................... 52 Regional projects ........................................................................................................................................................................ 53
Appendix 3. Abbreviations ................................................................................................................................................... 66 Appendix 4. Glossary ....................................................................................................................................................................... 67

Regional Investment Plan 2020 – Baltic Sea
ENTSO-E | Rue de Spa, 8 | 1000 Brussels | [email protected] | www.entsoe.eu | @entso_e Page 3 of 71
1. EXECUTIVE SUMMARY
1.1 Key messages of the region
The electricity system in the Baltic Sea region is undergoing an unprecedented change as the electricity
generation structure is rapidly decarbonising and is simultaneously becoming more variable according to the
weather conditions.
Construction of renewable energy in the region has been accelerated by rapid technology development and
national subsidy mechanisms. In particular, the increase in wind power production has reduced the price of
electricity. The energy surplus created on the market has lowered the price of electricity, and the profitability
of traditional generation has also weakened significantly, which has resulted in the closure of adjustable
production capacity. This development has reduced carbon dioxide emissions, but it has also increased the
risk of brownouts or blackouts in the parts of the region as it has been identified in the MAF 2019 study issued
by ENTSO-E previous year. At the same time, society’s dependency on electricity is increasing. As a result, the
power systems of the future might be expected to provide even greater reliability in order to safeguard the
vital functioning of society.
Large quantities of new renewable energy
generation are still being planned across the
region, and these must be integrated
successfully while also maintaining security of
supply and facilitating an efficient and secure
European energy market. The integration of
renewables will further replace production
from thermal power plants and the grid
needs to facilitate the flows to cover the
deficit at the load centres due to closure of
power plants and the growing flows between
synchronous areas. In order to solve the
challenges regarding balancing the load and
power generation in all parts of the region
further grid development is favourable and
necessary. As the future generation-mix is
expected to be much more weather-
dependent, this increases the need of
strengthening the grid.
The main driver for the energy system in the region is the green energy transition along with climate goals
and decarbonization-goals. From a grid development perspective, the drivers within the Baltic Sea region are
as follows.
Driver 1: Need for flexibility → Further integration between synchronous areas
Figure 1-2 – Key drivers of the Baltic Sea region

Regional Investment Plan 2020 – Baltic Sea
ENTSO-E | Rue de Spa, 8 | 1000 Brussels | [email protected] | www.entsoe.eu | @entso_e Page 4 of 71
The transformation of the European power system leads to a less flexible generation-mix. The Nordic system
continues to be a flexible system, due to the hydro-dominated generation-mix. In addition, the Nordic system
is likely to increase the annual energy surplus, even though some nuclear power plants are decommissioned.
Both the flexibility-need and the expected price-differences between the systems, seem to be a driver for
further integration between different synchronous systems. In continental low wind-situations energy might
be exported from the Nordic system, in continental high wind-situations power might be imported and stored
in the hydro-dominated Nordic system.
Driver 2: Integration of renewables → Increased North-South flows
Based on the political goals of reduced CO2 emissions, and based on the cost development of wind and solar
generation units, further integration of renewables is expected within the Nordic countries. In Germany large
amounts of solar is already seen today and is expected to further increase. In Germany, Denmark and Sweden
large amounts of onshore wind is already integrated. Next to come seems to be offshore wind, with huge
potential in the Baltic Sea region. New interconnectors to the continent/Baltic States in combination with
substantial amounts of new renewable generation capacity is increasing the need to strengthen the
transmission capacities in the North-South direction in Germany, Sweden, Norway, Finland and Denmark. In
addition, nuclear and/or thermal plants are expected to be decommissioned in southern Germany, Sweden,
Denmark and Finland, which further increase the capacity-need in the North-South direction.
Driver 3: Electrification / New consumption → reinforcements of the grid
Based on European climate goals, the European energy system is supposed to be much more efficient. This
means more efficient use of energy both within industry, transport and households, as well as solutions
lowering the energy consumption. As a result of this the total energy demand for Europe is expected to
decrease. At the same time electrification of all kind of consumption plays the major role of this
transformation towards a much more efficient and decarbonised system. In addition, new type of
consumption like data-storage increases the electricity-consumption. For the coming decades the energy-
consumption is expected to decrease while the electricity-consumption is expected to increase. Due to this
increased electricity-consumption and due to the electrification huge reinforcements of the grid might be
necessary.
Driver 4: Baltic integration → Improved security of supply for the Baltic system
For historical reasons, the Baltic States are currently operated in synchronous mode with the Russian and
Belarussian electricity systems (the IPS/UPS system). During the last years, the integration of Baltic countries
with European energy markets has made great progress with the commissioning of the NordBalt and LitPol
link. Baltic countries are now connected to Finland, Sweden and Poland via HVDC connections.
The three Baltic TSOs are now preparing to de-synchronise from IPS/UPS, and instead to synchronise with the
Continental European Network (CEN) through current interconnection between Lithuania and Poland. In
addition, a new subsea HVDC (Harmony Link) is planned between Lithuania and Poland to improve the level
of security of supply. Synchronisation of Baltic countries with the CEN will ensure energy security by
connection to a grid that is operated following joint European rules.
Driver 5: Nuclear and thermal decommissioning → Challenges the security of supply
All nuclear power plants in Germany, a substantial proportion of the thermal/nuclear power plants in Sweden,
and a substantial proportion of the thermal power plants in Germany, Denmark and Finland are expected to
be decommissioned by 2030. Furthermore, decommissioning of thermal power plants, especially in Poland,
Regional Investment Plan 2020 – Baltic Sea
ENTSO-E | Rue de Spa, 8 | 1000 Brussels | [email protected] | www.entsoe.eu | @entso_e Page 5 of 71
is needed to achieve the EU’s climate targets. Decommissioning of both nuclear and thermal power plants
would lead to an increased system-risk, challenging the security of supply. Nuclear and thermal power has
many important features in today’s system, and a phase-out will require new generation capacity, grid
development, and further development of system services.
Driver 6: Smart sector integration and flexible loads → Optimises the decarbonisation
Sector integration and demand response and flexible loads are core instruments to cut emissions in a cost-
effective way. Smart Sector Integration (SSI) seeks the optimal solution for the whole energy system and
supports a fast and cost-optimised path to zero emissions by 2050. Electricity would be used either directly
in other sectors (e.g. transportation and heating in buildings and industry) or to produce green hydrogen.
Hydrogen may in turn be used directly in transportation, heating, and even power generation (e.g. in hours
of scarcity) or to produce methane, fuels or ammonia etc. The benefits of SSI arise from the variable character
and the falling costs of wind and solar power. In addition to cut emissions in a more cost-effective way, SSI
as well provide flexibility between different energy systems. This again increases the security of supply-level
in the power system. Flexible loads and demand response will help to optimize the dimensioning and
operation of the power system. Flexibility markets may be used in the future to solve bottlenecks in the
system.
1.2 Future capacity needs
The drivers for grid development described above are the basis for further grid developments. The grid
development needs in the short term can be studied by analysing the current measurements, trends and
plans of generation as well as consumption changes. The grid infrastructure is a long-term investment with a
lifetime of tens of years; building a new line, for example, can take a decade or more, particularly when
factoring in all the necessary planning and permitting. Therefore, it is important to be able to consider the
benefits of the new infrastructure in the long term. It is not meaningful to try to forecast the future as ‘one
truth’, because small changes, such as in policies or fuel prices, can have a major impact on the resulting view
of the future.
Additionally, to the main drivers described above in the list below are given the key messages which explains
the future capacity needs and the positive effect of transmission grid expansion towards 2050:
• The green energy transition along with climate goals and decarbonization will lead to fundamental
change of generation and energy demand, which triggers changed power flows across the region.
The dominant power flow direction will go from North to South.
• Rapid expansion of both onshore and offshore renewables in the region and decommissioning of
nuclear generation in Germany until end of 2022 and potentially in Sweden by 2040 triggers related
offshore and onshore infrastructure needs.

Regional Investment Plan 2020 – Baltic Sea
ENTSO-E | Rue de Spa, 8 | 1000 Brussels | [email protected] | www.entsoe.eu | @entso_e Page 6 of 71
• Flexibility is challenged; however, Sector Integration and demand response will be a part of the
solutions in combination with hydro resources. (Electrification and load increase is expected to keep
in line with the development in industrial and transport.)
• The above requires new interconnectors, some of them are already in preparation or under
construction (NO-DE, SE-FI e.t.c.) and will also help IEM, SoS, RES integration. The continued strong
collaboration between the actors in the region is needed and the actors are responsible for the timely
implementation of the interconnectors.
• Baltic countries will be synchronized with Continental Europe by 2025, but security of supply will need
to be further enhanced. The med-term system adequacy issue (SoS) in Baltic States, is mainly related
to flexibility needs after desynchronization from IP/UPS and synchronization with the CEN.
All the scenarios being studied in the Identification of System Needs (IoSN) include a large increase in
renewable generation and a decrease in CO2 emissions, but without additional grid development the price
spread between market areas in the region would increase rapidly and some of the climate benefits would
not be realised. The benefits of increased capacities in the scenarios are clearly visible in the Chapter 4 where
the market results of IoSN have been described. Increasing the capacities at the borders, would have a
significant impact on both the electrical system and on society. In summary, the main benefits of satisfying
the identified capacity needs, if the scenarios end up realising the summarised results, are shown below:
✓ Up to 50 € per MWh reduction in marginal costs;
✓ From 46 to 80 TWh less curtailed energy;
✓ A 10 MT reduction in CO2 emissions.
Regional Investment Plan 2020 – Baltic Sea
ENTSO-E | Rue de Spa, 8 | 1000 Brussels | [email protected] | www.entsoe.eu | @entso_e Page 7 of 71
2. INTRODUCTION
2.1 Regional Investment Plans as foundation for the
TYNDP 2020
ENTSO-E’s Ten-Year Network Development Plan (TYNDP) is the most comprehensive planning reference for
the pan-European electricity transmission network. Released every even year, it presents and assesses all
relevant pan-European projects at a specific time horizon, as defined by a set of various scenarios to describe
the future development and transition of the electricity market. The TYNDP is serves as basis to derive the EU
list of European Projects of Common Interest (PCI).
An essential part of the TYNDP 2020 package, the six Regional Investment Plans address challenges and
system needs at the regional level, for each of ENTSO-E’s six system development regions (Figure 2-1).
Figure 2-1 – ENTSO-E’s six system development regions
The regional investment plans are part of the TYNDP2020 package, which also include, among others, the
‘Completing the map - Power system needs in 2030 and 2040’ report and the Scenarios report, describing
the scenarios serving as basis for the IoSN 2040 and the regional investment plans.

Regional Investment Plan 2020 – Baltic Sea
ENTSO-E | Rue de Spa, 8 | 1000 Brussels | [email protected] | www.entsoe.eu | @entso_e Page 8 of 71
Figure 2-2 – Overview of TYNDP 2020 process and outputs
2.2 Legal requirements
Regulation (EU) 2019/943 Article 34 (recast of Regulation (EC) 714/2009) states that TSOs shall establish
regional cooperation within ENTSO-E and shall publish regional investment plans every two years. TSOs may
take investment decisions based on regional investment plans. Article 48 further states that ENTSO-E shall
publish a non-binding community-wide Ten-Year Network Development Plan, which shall be built on national
investment plans and take into account regional investment plans and the reasonable needs of all system
users and shall identify investment gaps.
In addition, the TYNDP package complies with Regulation (EU) Nº 347/2013, which defines new European
governance and organisational structures that shall promote transmission grid development.
2.3 Scope and structure of the Regional Investment
Plans
The Regional Investment Plans are based on pan-European market study results combined with European
and/or regional network studies. They present the current situation of the region as well as the expected
future regional challenges, considering a 2040 time-horizon. To illustrate circumstances that are especially
relevant to each region, available regional sensitivities and other available studies are included in the Plans.
The operational functioning of the regional system and associated future challenges may also be addressed.

Regional Investment Plan 2020 – Baltic Sea
ENTSO-E | Rue de Spa, 8 | 1000 Brussels | [email protected] | www.entsoe.eu | @entso_e Page 9 of 71
As one of the solutions to the future challenges, the TYNDP project has performed market and network studies
for the long-term 2040 time horizon National Trend scenario to identify investment needs, that is, cross-
border capacity increases and related necessary reinforcements of the internal grid that can help to mitigate
these challenges.
In addition, the Regional Investment Plans list the regional projects from the TYNDP 2020 project collection.
In the summer of 2020, each of these projects will be assessed and presented in the final TYNDP 2020 package.
The approach followed by the regional investment plans is summarised in Figure 2-3.
Figure 2-3 – Mitigating future challenges – TYNDP methodology
The current document comprises six chapters with detailed information at the regional level:
•Chapter 1 presents the key messages about the region.
•Chapter 2 sets out in detail the general and legal basis of the TYNDP and regional investment plans and
provides a short summary of the general methodology used by all ENTSO-E regions.
•Chapter 3 covers a general description of the present situation of the region. The future challenges of the
region are also presented when describing the evolution of generation and demand profiles in the 2040
horizon but considering a grid as expected by the 2025 horizon. This chapter also includes links to the
respective national development plans (NDPs) of the countries of the region.
•Chapter 4 includes an overview of the regional needs in terms of capacity increases and the main results
from the market perspective.
•Chapter 5 is dedicated to additional analyses conducted inside the regional group or by external parties
outside the core TYNDP process.
• The Appendix includes the list of links to the National Development Plans, projects proposed by promoters
in the region at the Pan-European level as well as important regional projects that are not part of the European
TYNDP process. In the Appendix the abbreviations and terminology used in the whole report is included as
well as additional content and detailed results.
The actual Regional Investment Plan does not include the CBA-based assessment of projects. These analyses
will be developed in a second step and presented in the final TYNDP 2020 package.
Description of the present situation
and scenarios
Future regional
challenges
Regional capacity
in-creases
Market and
Network results
Regional Project
list
Regional Investment Plan 2020 – Baltic Sea
ENTSO-E | Rue de Spa, 8 | 1000 Brussels | [email protected] | www.entsoe.eu | @entso_e Page 10 of 71
2.4 General methodology
The Regional Investment Plans build on the results of studies, called ‘Identification of System Needs’ (IoSN),
which are conducted by a European team of market and network experts originating from the six regional
groups of ENTSO-E’s System Development Committee. The results of these studies have been discussed and,
in some cases, extended with additional regional studies by the regional groups to cover all relevant aspects
in the regions.
The aim of the Identification of System Needs is to identify investment needs in the long-term time horizon
(2040) —triggered by market integration, RES integration, security of supply and interconnection targets —
in a coordinated pan-European manner that also builds on the expertise of the grid planners of all TSOs.
A more detailed description of this methodology is available in the TYNDP 2020 ‘Completing the map – Power
system needs in 2030 and 2040’ report.
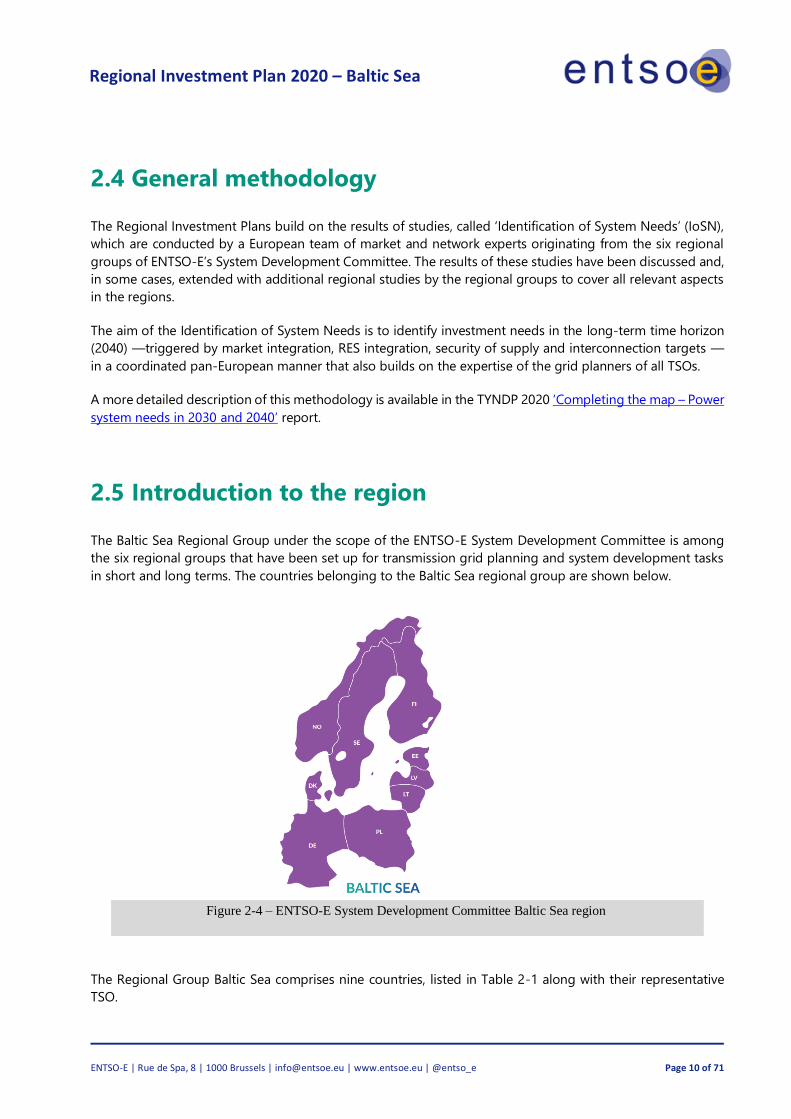
2.5 Introduction to the region
The Baltic Sea Regional Group under the scope of the ENTSO-E System Development Committee is among
the six regional groups that have been set up for transmission grid planning and system development tasks
in short and long terms. The countries belonging to the Baltic Sea regional group are shown below.
Figure 2-4 – ENTSO-E System Development Committee Baltic Sea region
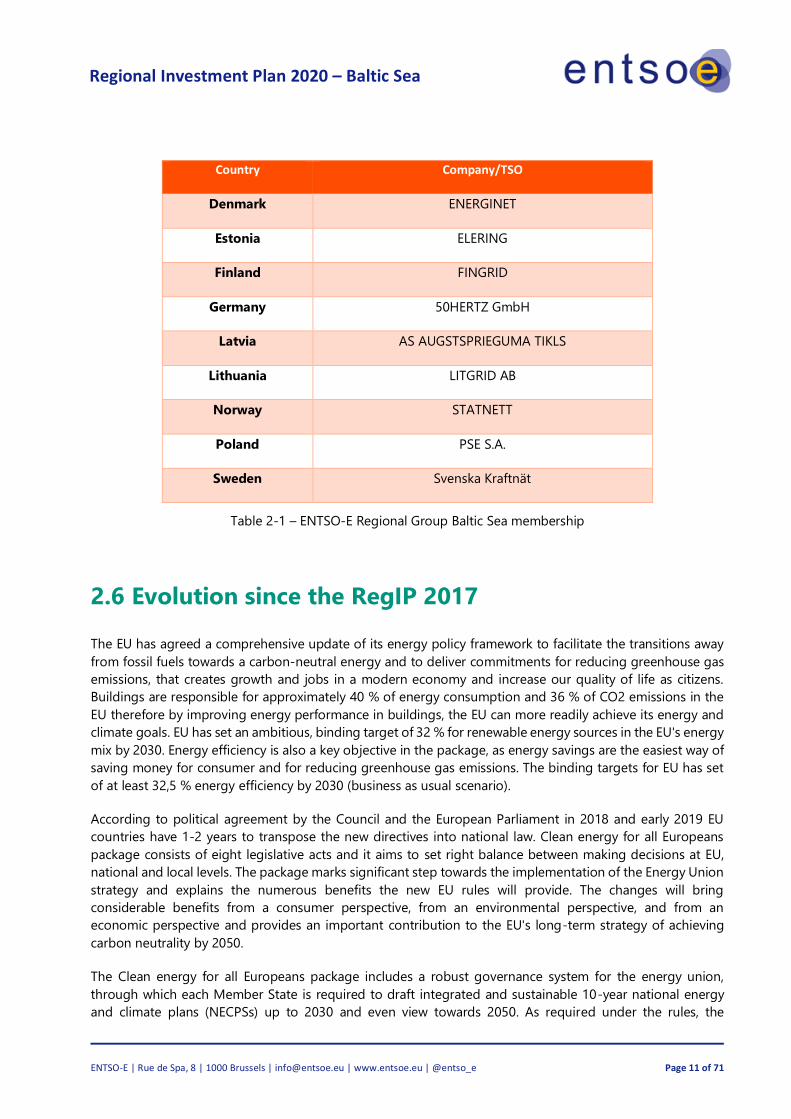
The Regional Group Baltic Sea comprises nine countries, listed in Table 2-1 along with their representative
TSO.
Regional Investment Plan 2020 – Baltic Sea
ENTSO-E | Rue de Spa, 8 | 1000 Brussels | [email protected] | www.entsoe.eu | @entso_e Page 11 of 71
Country Company/TSO
Denmark ENERGINET
Estonia ELERING
Finland FINGRID
Germany 50HERTZ GmbH
Latvia AS AUGSTSPRIEGUMA TIKLS
Lithuania LITGRID AB
Norway STATNETT
Poland PSE S.A.
Sweden Svenska Kraftnät
Table 2-1 – ENTSO-E Regional Group Baltic Sea membership
2.6 Evolution since the RegIP 2017
The EU has agreed a comprehensive update of its energy policy framework to facilitate the transitions away
from fossil fuels towards a carbon-neutral energy and to deliver commitments for reducing greenhouse gas
emissions, that creates growth and jobs in a modern economy and increase our quality of life as citizens.
Buildings are responsible for approximately 40 % of energy consumption and 36 % of CO2 emissions in the
EU therefore by improving energy performance in buildings, the EU can more readily achieve its energy and
climate goals. EU has set an ambitious, binding target of 32 % for renewable energy sources in the EU's energy
mix by 2030. Energy efficiency is also a key objective in the package, as energy savings are the easiest way of
saving money for consumer and for reducing greenhouse gas emissions. The binding targets for EU has set
of at least 32,5 % energy efficiency by 2030 (business as usual scenario).
According to political agreement by the Council and the European Parliament in 2018 and early 2019 EU
countries have 1-2 years to transpose the new directives into national law. Clean energy for all Europeans
package consists of eight legislative acts and it aims to set right balance between making decisions at EU,
national and local levels. The package marks significant step towards the implementation of the Energy Union
strategy and explains the numerous benefits the new EU rules will provide. The changes will bring
considerable benefits from a consumer perspective, from an environmental perspective, and from an
economic perspective and provides an important contribution to the EU's long-term strategy of achieving
carbon neutrality by 2050.
The Clean energy for all Europeans package includes a robust governance system for the energy union,
through which each Member State is required to draft integrated and sustainable 10-year national energy
and climate plans (NECPSs) up to 2030 and even view towards 2050. As required under the rules, the
Regional Investment Plan 2020 – Baltic Sea
ENTSO-E | Rue de Spa, 8 | 1000 Brussels | [email protected] | www.entsoe.eu | @entso_e Page 12 of 71
Commission published an analysis of each draft plan with recommendations to be taken into account during
2019.
A further part of the package seeks to establish a modern design for the EU electricity market, adapted to the
new realities of the market – more flexible, more market oriented and better placed to integrate a greater
share of renewable. In addition to the legal acts in the Clean energy for all Europeans package, the
Commission has started a number of non-legislative initiatives aimed at facilitating the clean energy transition
and ensuring that it is fair transition.
The link to the publication of full Clean Energy for all Europeans package is here.
Regional Investment Plan 2020 – Baltic Sea
ENTSO-E | Rue de Spa, 8 | 1000 Brussels | [email protected] | www.entsoe.eu | @entso_e Page 13 of 71
3. REGIONAL CONTEXT
In the following Chapter the Baltic Sea regional context has been described with a focus on present situation
in transmission grid, power generation, consumption and power flow exchange as well as defined most
significant grid constraints among Baltic Sea region countries.
3.1 Present situation
3.1.1 The transmission grid in the Baltic Sea region
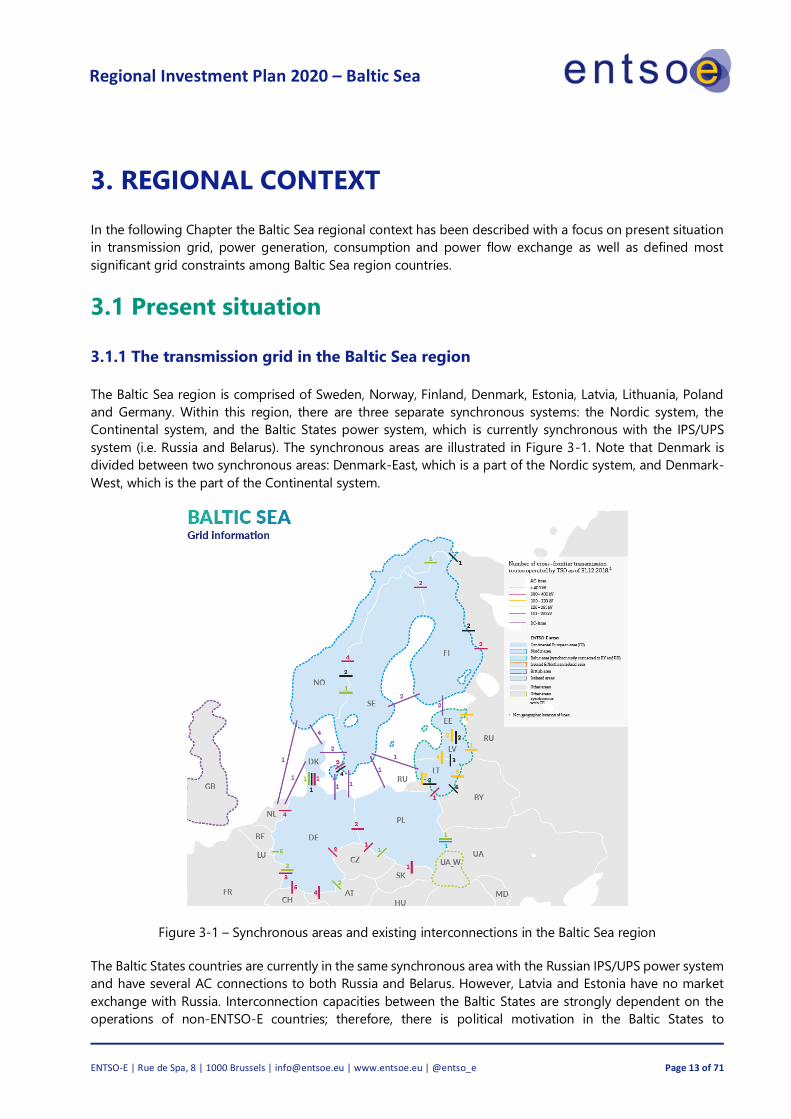
The Baltic Sea region is comprised of Sweden, Norway, Finland, Denmark, Estonia, Latvia, Lithuania, Poland
and Germany. Within this region, there are three separate synchronous systems: the Nordic system, the
Continental system, and the Baltic States power system, which is currently synchronous with the IPS/UPS
system (i.e. Russia and Belarus). The synchronous areas are illustrated in Figure 3-1. Note that Denmark is
divided between two synchronous areas: Denmark-East, which is a part of the Nordic system, and Denmark-
West, which is the part of the Continental system.
Figure 3-1 – Synchronous areas and existing interconnections in the Baltic Sea region
The Baltic States countries are currently in the same synchronous area with the Russian IPS/UPS power system
and have several AC connections to both Russia and Belarus. However, Latvia and Estonia have no market
exchange with Russia. Interconnection capacities between the Baltic States are strongly dependent on the
operations of non-ENTSO-E countries; therefore, there is political motivation in the Baltic States to
Regional Investment Plan 2020 – Baltic Sea
ENTSO-E | Rue de Spa, 8 | 1000 Brussels | [email protected] | www.entsoe.eu | @entso_e Page 14 of 71
desynchronise from the IPS/UPS system and synchronise with the European system. The synchronization
project started on 28th June 2018 when the President of the Commission Jean-Claude Juncker together with
the Heads of State or Government of Lithuania, Latvia, Estonia and Poland agreed on the Political Roadmap
on the synchronisation of the Baltic States' electricity networks with the Continental European Network via
Poland by the target date of 2025. In line with the Political Roadmap on the synchronisation of the Baltic
States' electricity networks with the Continental European Network via Poland, the BEMIP High Level Group
(senior-official level) on the synchronisation project on 14th September 2018 agreed on the technical and
economic feasibility of the synchronisation option consisting of the existing double-circuit AC line between
Poland and Lithuania (LitPol Link), complemented by the construction of an offshore HVDC link together with
other optimization measures, including synchronous condensers.
Transmission capacity plays a key role in addressing the future power system challenges. Adequate
transmission capacity allows for a cost-effective utilisation of power, ensures access to adequate generation
capacity, enables the smooth exchanging of system services, and is key to a well-integrated market. A cost-
effective transition towards a green power system depends strongly on the strength of the transmission
networks.
Many new HVDC interconnectors since 2010
Almost seven new interconnectors have been commissioned since 2010, which have increased the total
capacity by approximately 4,450 MW. These new interconnectors are Skagerrak 4 (Norway-Denmark), Fenno-
Skan 2 (Sweden-Finland), Estlink 2 (Estonia-Finland), Nordbalt (Sweden-Lithuania), LitPol link (Lithuania-
Poland), Cobra (Denmark-The Netherlands) and the Kriegers Flak CGS (Denmark-Germany) project which
commissioning is being postponed to the end of September 2020. Four new HVDC connections are planned
to be commissioned in the region during the next five years. Preparatory works for construction of Harmony
link - HVDC link between Poland and Lithuania have been started in 2019 as a result of the Baltic
synchronization project.
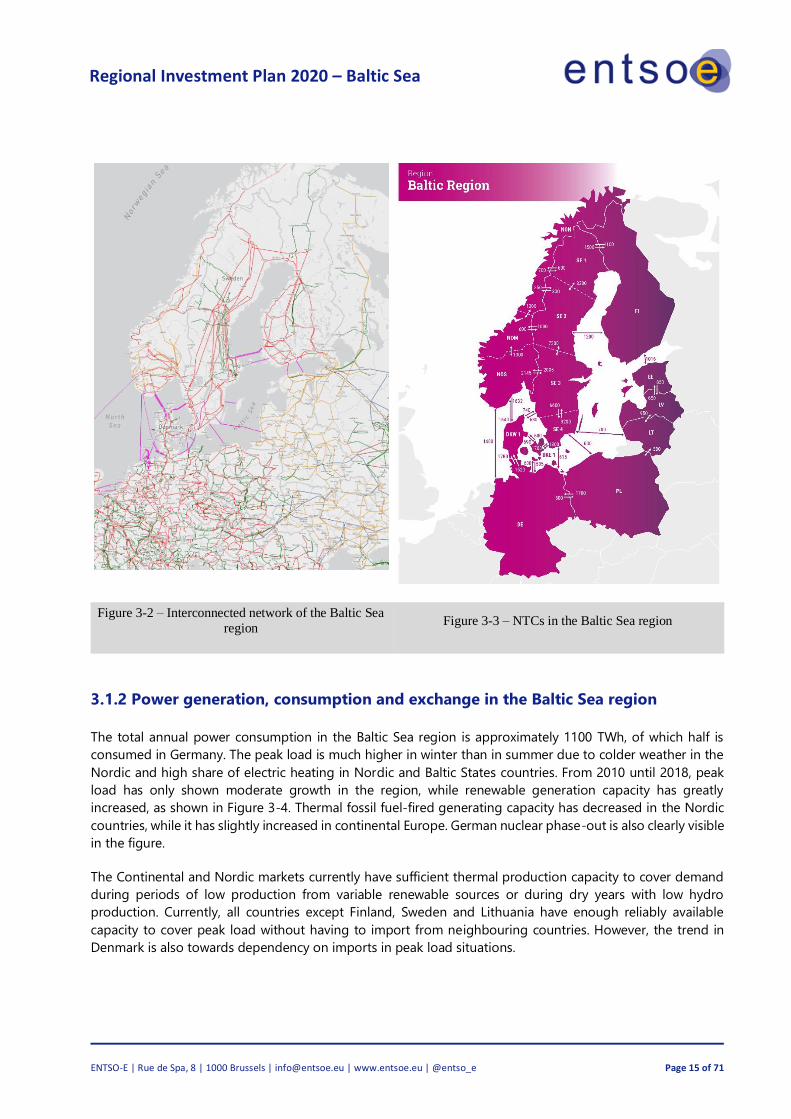
The Interconnected HVAC network in the Baltic Sea region is illustrated in Figure 3-2 and is also found at
https://www.entsoe.eu/map/. The Nordic and continental systems utilise 400 kV AC as the main transmission
voltage level and 220/130/110 kV AC as sub-transmission voltage levels. In the Baltic States power system,
the main transmission voltage level is 330 kV. The map in Figure 3-3 shows the diverse level of Net Transfer
Capacities (NTC) in the Baltic Sea region. The NTC is the maximum total exchange capacity in the market
between two adjacent price areas.
Regional Investment Plan 2020 – Baltic Sea
ENTSO-E | Rue de Spa, 8 | 1000 Brussels | [email protected] | www.entsoe.eu | @entso_e Page 15 of 71
Figure 3-2 – Interconnected network of the Baltic Sea
region Figure 3-3 – NTCs in the Baltic Sea region
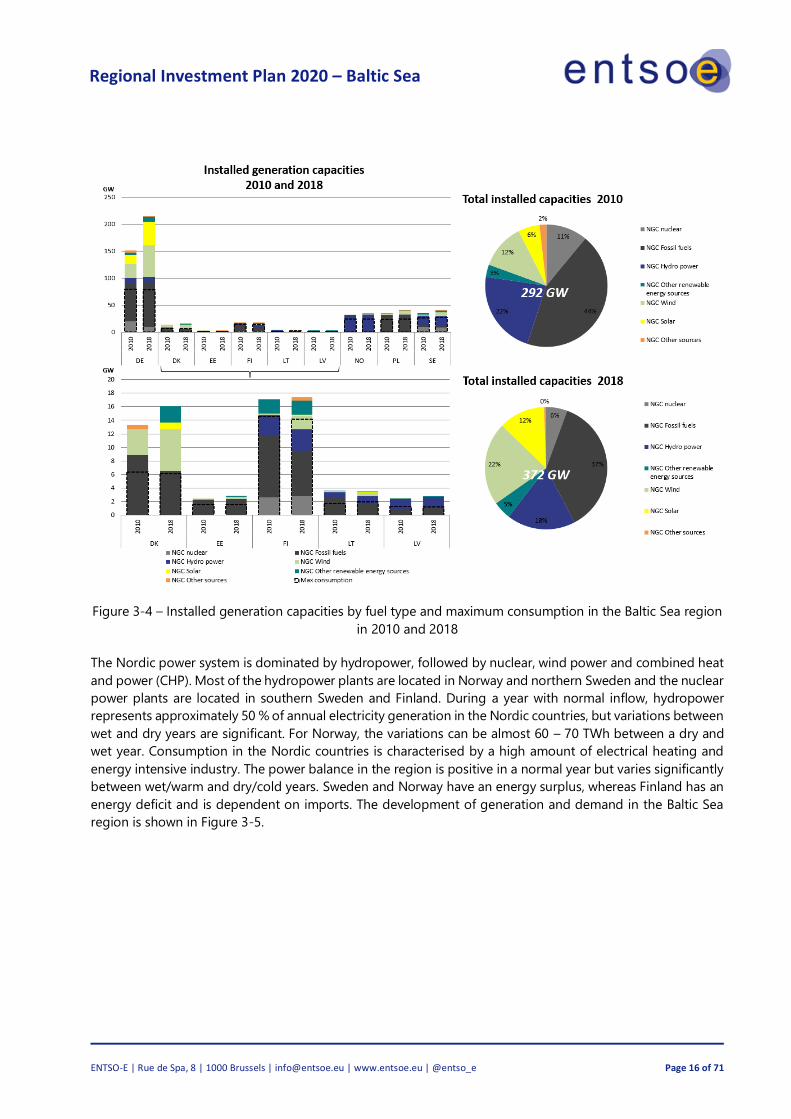
3.1.2 Power generation, consumption and exchange in the Baltic Sea region
The total annual power consumption in the Baltic Sea region is approximately 1100 TWh, of which half is
consumed in Germany. The peak load is much higher in winter than in summer due to colder weather in the
Nordic and high share of electric heating in Nordic and Baltic States countries. From 2010 until 2018, peak
load has only shown moderate growth in the region, while renewable generation capacity has greatly
increased, as shown in Figure 3-4. Thermal fossil fuel-fired generating capacity has decreased in the Nordic
countries, while it has slightly increased in continental Europe. German nuclear phase-out is also clearly visible
in the figure.
The Continental and Nordic markets currently have sufficient thermal production capacity to cover demand
during periods of low production from variable renewable sources or during dry years with low hydro
production. Currently, all countries except Finland, Sweden and Lithuania have enough reliably available
capacity to cover peak load without having to import from neighbouring countries. However, the trend in
Denmark is also towards dependency on imports in peak load situations.
Regional Investment Plan 2020 – Baltic Sea
ENTSO-E | Rue de Spa, 8 | 1000 Brussels | [email protected] | www.entsoe.eu | @entso_e Page 16 of 71
Figure 3-4 – Installed generation capacities by fuel type and maximum consumption in the Baltic Sea region
in 2010 and 2018
The Nordic power system is dominated by hydropower, followed by nuclear, wind power and combined heat
and power (CHP). Most of the hydropower plants are located in Norway and northern Sweden and the nuclear
power plants are located in southern Sweden and Finland. During a year with normal inflow, hydropower
represents approximately 50 % of annual electricity generation in the Nordic countries, but variations between
wet and dry years are significant. For Norway, the variations can be almost 60 – 70 TWh between a dry and
wet year. Consumption in the Nordic countries is characterised by a high amount of electrical heating and
energy intensive industry. The power balance in the region is positive in a normal year but varies significantly
between wet/warm and dry/cold years. Sweden and Norway have an energy surplus, whereas Finland has an
energy deficit and is dependent on imports. The development of generation and demand in the Baltic Sea
region is shown in Figure 3-5.

Regional Investment Plan 2020 – Baltic Sea
ENTSO-E | Rue de Spa, 8 | 1000 Brussels | [email protected] | www.entsoe.eu | @entso_e Page 17 of 71
Figure 3-5 – Annual generation by fuel type and annual consumption in the Baltic Sea region in 2010 and
2018
Power production in the continental part of the Baltic Sea region and the Baltic States area is dominated by
thermal power except in the Danish power system, which is dominated by wind and other renewable energy
sources (RES) already being above 60 % share of consumption. Consumption in the area is less temperature-
dependent compared with Nordic countries. Denmark, Poland, Estonia and Latvia have a neutral annual power
balance during an average year, whereas Germany has a yearly surplus. Lithuania, on the other hand, is
currently operating with a large energy deficit. The massive increase in RES generation in Germany has
replaced nuclear production but has only slightly decreased fossil fuel-based generation while significantly
increasing exports.
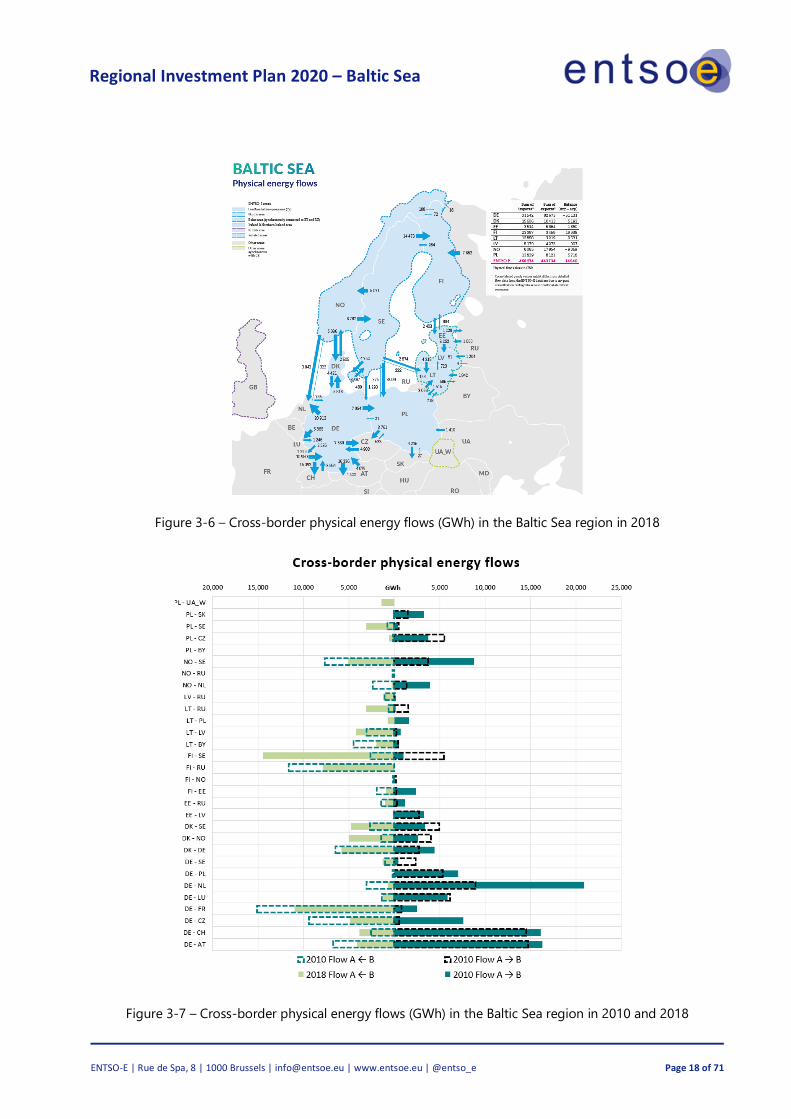
The cross-border flows in 2018 are shown in Figure 3-6 and the development in cross-border exchanges from
2010 to 2018 is presented in Figure 3-7. The largest exchanges are from Norway, Sweden and Germany to
neighbouring countries, while the largest increase in power flow from 2010 to 2018 is seen from Sweden to
Finland and from Germany to the Netherlands. In the Nordic countries, the flow pattern varies a lot from year
to year as a result of variations in hydrological inflow (both 2010 and 2018 were dry years, but 2010 was drier).
In wet years, exports from Sweden and Norway are typically much larger than during dry years. In addition,
Finnish imports from Russia have decreased as a result of a new market design in Russia, which significantly
increases the price of exports during peak hours. In practice, this has limited Finnish imports to nights and
weekends.
Regional Investment Plan 2020 – Baltic Sea
ENTSO-E | Rue de Spa, 8 | 1000 Brussels | [email protected] | www.entsoe.eu | @entso_e Page 18 of 71
Figure 3-6 – Cross-border physical energy flows (GWh) in the Baltic Sea region in 2018
Figure 3-7 – Cross-border physical energy flows (GWh) in the Baltic Sea region in 2010 and 2018
Regional Investment Plan 2020 – Baltic Sea
ENTSO-E | Rue de Spa, 8 | 1000 Brussels | [email protected] | www.entsoe.eu | @entso_e Page 19 of 71
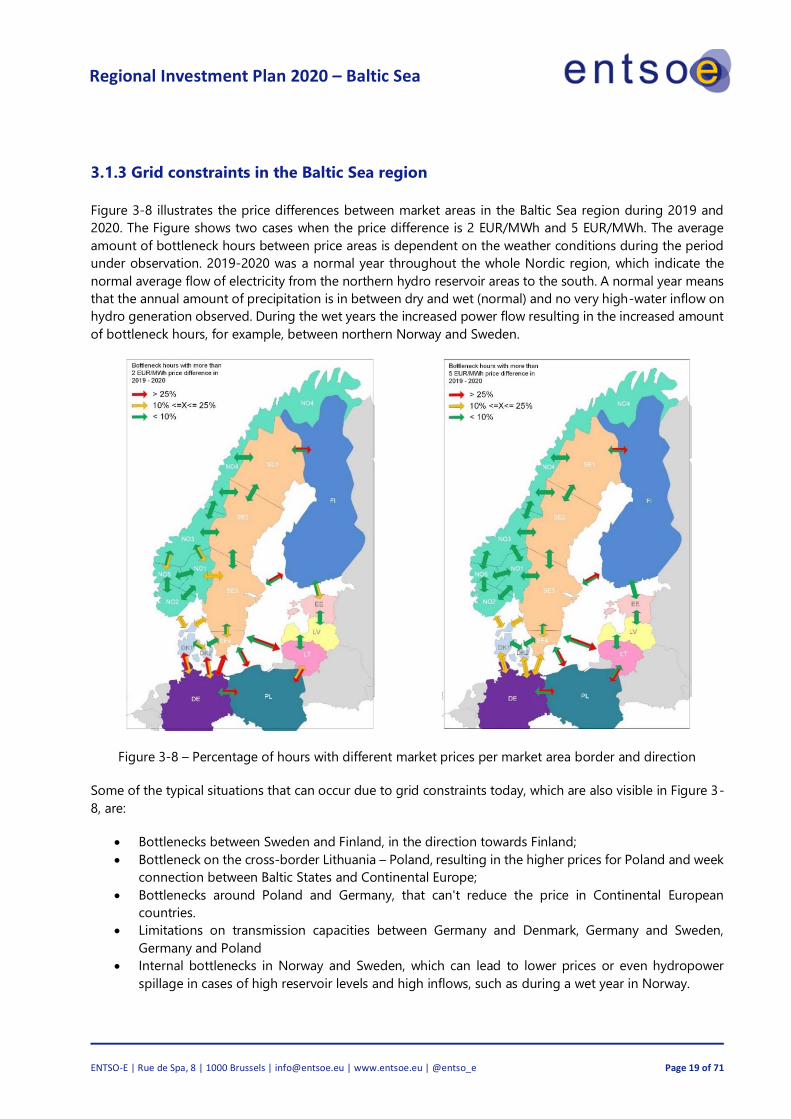
3.1.3 Grid constraints in the Baltic Sea region
Figure 3-8 illustrates the price differences between market areas in the Baltic Sea region during 2019 and
2020. The Figure shows two cases when the price difference is 2 EUR/MWh and 5 EUR/MWh. The average
amount of bottleneck hours between price areas is dependent on the weather conditions during the period
under observation. 2019-2020 was a normal year throughout the whole Nordic region, which indicate the
normal average flow of electricity from the northern hydro reservoir areas to the south. A normal year means
that the annual amount of precipitation is in between dry and wet (normal) and no very high-water inflow on
hydro generation observed. During the wet years the increased power flow resulting in the increased amount
of bottleneck hours, for example, between northern Norway and Sweden.
Figure 3-8 – Percentage of hours with different market prices per market area border and direction
Some of the typical situations that can occur due to grid constraints today, which are also visible in Figure 3-
8, are:
• Bottlenecks between Sweden and Finland, in the direction towards Finland;
• Bottleneck on the cross-border Lithuania – Poland, resulting in the higher prices for Poland and week
connection between Baltic States and Continental Europe;
• Bottlenecks around Poland and Germany, that can't reduce the price in Continental European
countries.
• Limitations on transmission capacities between Germany and Denmark, Germany and Sweden,
Germany and Poland
• Internal bottlenecks in Norway and Sweden, which can lead to lower prices or even hydropower
spillage in cases of high reservoir levels and high inflows, such as during a wet year in Norway.

Regional Investment Plan 2020 – Baltic Sea
ENTSO-E | Rue de Spa, 8 | 1000 Brussels | [email protected] | www.entsoe.eu | @entso_e Page 20 of 71
3.2 Description of the scenarios
The scenarios in which the studies in this report have been performed are presented in this chapter. First, the
expected changes in the generation portfolio of the region are explained, followed by a description of the
pan-European TYNDP scenarios as well as the regional scenarios. The regional scenarios are created and used
in the studies to highlight the regional specifics.
The TYNDP2020 Scenario edition published in June 2020 represents the first step to quantify the long-term
challenges of the energy transition on the European electricity and gas infrastructure.
The joint work of ENTSO-E and ENTSOG, stakeholders and over 80 TSOs covering more than 35 countries
provided a basis to allow assessment for the European Commission’s Projects of Common Interest (PCI) list
for energy, as ENTSO-E and ENTSOG progress to develop their respective TYNDPs.
We strongly recommend the reader familiarises themselves with the content included in the Scenario Report
and visualisation platform, as these will provide full transparency on the development and outcomes of the
scenarios mentioned in this report.
Scenario Storylines
The joint scenario building process presents three storylines for TYNDP 2020:
• National Trends (NT), the central policy scenario, based on the Member States National Energy and
Climate Plans (NECPs) as well as on EU climate targets. NT is further compliant with the EU’s 2030
Climate and Energy Framework (32 % renewables, 32.5 % energy efficiency) and EC 2050 Long-Term
Strategy with an agreed climate target of 80 – 95 % CO2-reduction compared to 1990 levels.
• Global Ambition (GA), a full energy scenario in line with the 1,5°C target of the Paris Agreement,
envisions a future characterised by economic development in centralised generation. Hence,
significant cost reductions in emerging technologies such as offshore wind and Power-to-X are led
by economies of scale.
• Distributed Energy (DE), a full energy scenario as well compliant with the 1,5°C target of the Paris
Agreement, presents a decentralised approach to the energy transition. On this ground, prosumers
actively participate in a society driven by small scale decentralised solutions and circular approaches.
Both Distributed Energy and Global Ambition reach carbon neutrality by 2050.

Regional Investment Plan 2020 – Baltic Sea
ENTSO-E | Rue de Spa, 8 | 1000 Brussels | [email protected] | www.entsoe.eu | @entso_e Page 21 of 71
Bottom-Up: This approach of the scenario building process collects supply and demand data from gas and
electricity TSOs.
Top-Down: The “Top-Down Carbon Budget” scenario building process is an approach that uses the “bottom-
up” model information gathered from the Gas and Electricity TSOs. The methodologies are developed in line
with a Carbon Budget approach.
Full energy scenario: a full energy scenario employs a holistic view of the European energy system, thus
capturing all fuel and sectors as well as a full picture of primary energy demand.
Figure 3-9 – Key parameters for the scenario storylines.

Regional Investment Plan 2020 – Baltic Sea
ENTSO-E | Rue de Spa, 8 | 1000 Brussels | [email protected] | www.entsoe.eu | @entso_e Page 22 of 71
Figure 1-10 – Key drivers of scenario storylines
3.2.1 Selective description of electricity results
To comply with the 1.5° C targets of the Paris Agreement, carbon neutrality must be achieved by 2040
in the electricity sector and by 2050 in all sectors.
Distributed Energy and Global Ambition (also referred to as “COP21 Scenarios”) scenarios are meant to assess
sensible pathways to reach the target set by the Paris Agreement for the COP 21: 1.5° C or at least well below
2° C by the end of the century. For the purpose of the TYNDP scenarios, this target has been translated by
ENTSO-E and ENTSOG into a carbon budget to stay below +1.5° C at the end of the century with a 66.7 %
probability.
Figure 3-11 – GHG Emissions in ENTSOs’ Scenarios
To optimise conversions, the direct use of electricity is an important option resulting in progressive
electrification throughout all scenarios.
Regional Investment Plan 2020 – Baltic Sea
ENTSO-E | Rue de Spa, 8 | 1000 Brussels | [email protected] | www.entsoe.eu | @entso_e Page 23 of 71
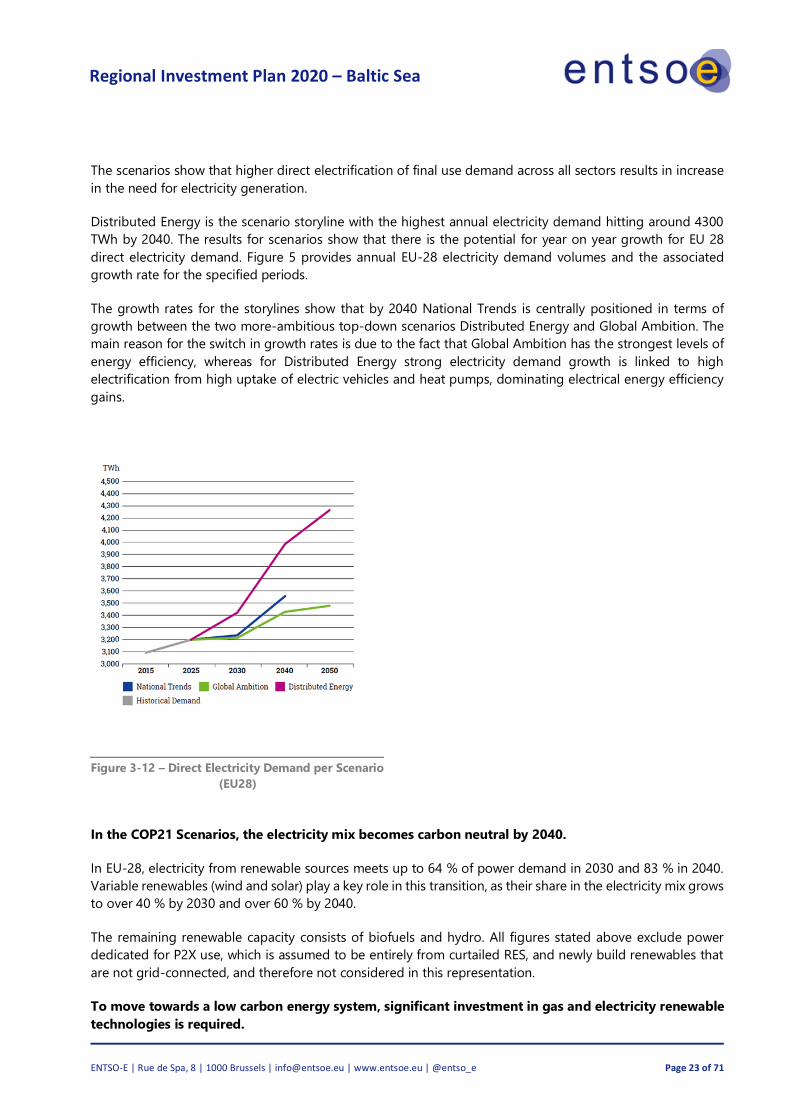
The scenarios show that higher direct electrification of final use demand across all sectors results in increase
in the need for electricity generation.
Distributed Energy is the scenario storyline with the highest annual electricity demand hitting around 4300
TWh by 2040. The results for scenarios show that there is the potential for year on year growth for EU 28
direct electricity demand. Figure 5 provides annual EU-28 electricity demand volumes and the associated
growth rate for the specified periods.
The growth rates for the storylines show that by 2040 National Trends is centrally positioned in terms of
growth between the two more-ambitious top-down scenarios Distributed Energy and Global Ambition. The
main reason for the switch in growth rates is due to the fact that Global Ambition has the strongest levels of
energy efficiency, whereas for Distributed Energy strong electricity demand growth is linked to high
electrification from high uptake of electric vehicles and heat pumps, dominating electrical energy efficiency
gains.
In the COP21 Scenarios, the electricity mix becomes carbon neutral by 2040.
In EU-28, electricity from renewable sources meets up to 64 % of power demand in 2030 and 83 % in 2040.
Variable renewables (wind and solar) play a key role in this transition, as their share in the electricity mix grows
to over 40 % by 2030 and over 60 % by 2040.
The remaining renewable capacity consists of biofuels and hydro. All figures stated above exclude power
dedicated for P2X use, which is assumed to be entirely from curtailed RES, and newly build renewables that
are not grid-connected, and therefore not considered in this representation.
To move towards a low carbon energy system, significant investment in gas and electricity renewable
technologies is required.
Figure 3-12 – Direct Electricity Demand per Scenario
(EU28)
Regional Investment Plan 2020 – Baltic Sea
ENTSO-E | Rue de Spa, 8 | 1000 Brussels | [email protected] | www.entsoe.eu | @entso_e Page 24 of 71
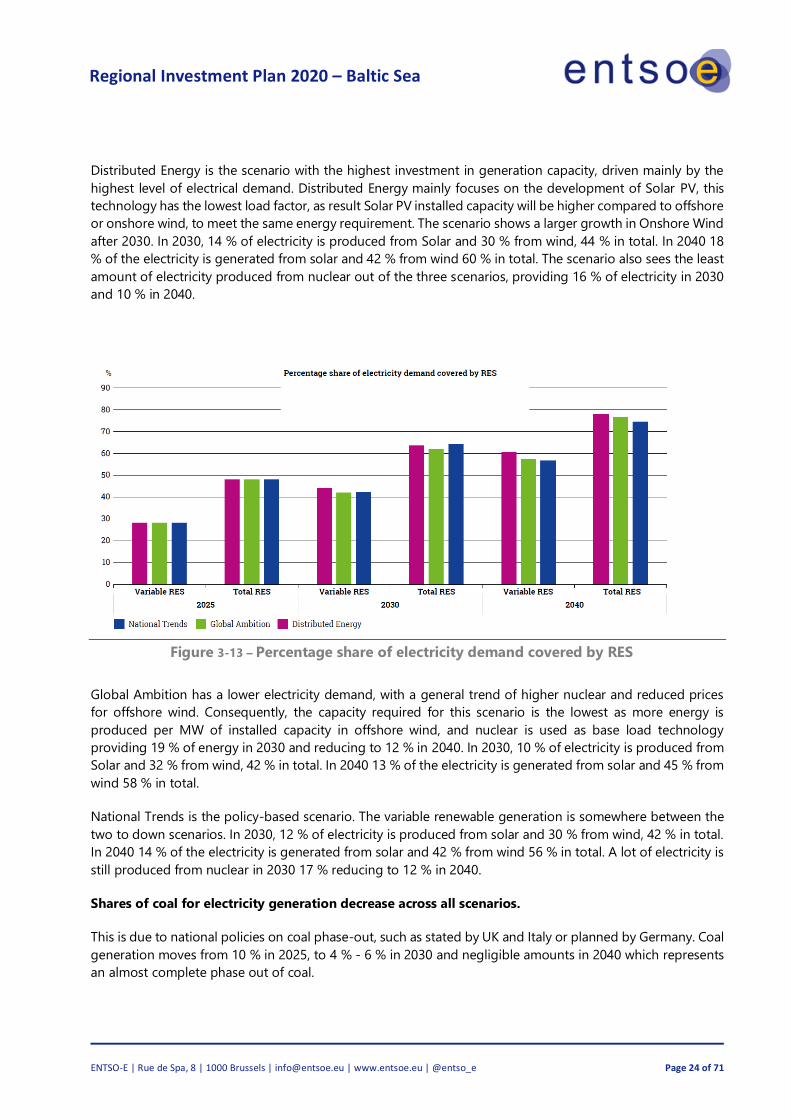
Distributed Energy is the scenario with the highest investment in generation capacity, driven mainly by the
highest level of electrical demand. Distributed Energy mainly focuses on the development of Solar PV, this
technology has the lowest load factor, as result Solar PV installed capacity will be higher compared to offshore
or onshore wind, to meet the same energy requirement. The scenario shows a larger growth in Onshore Wind
after 2030. In 2030, 14 % of electricity is produced from Solar and 30 % from wind, 44 % in total. In 2040 18
% of the electricity is generated from solar and 42 % from wind 60 % in total. The scenario also sees the least
amount of electricity produced from nuclear out of the three scenarios, providing 16 % of electricity in 2030
and 10 % in 2040.
Figure 3-13 – Percentage share of electricity demand covered by RES
Global Ambition has a lower electricity demand, with a general trend of higher nuclear and reduced prices
for offshore wind. Consequently, the capacity required for this scenario is the lowest as more energy is
produced per MW of installed capacity in offshore wind, and nuclear is used as base load technology
providing 19 % of energy in 2030 and reducing to 12 % in 2040. In 2030, 10 % of electricity is produced from
Solar and 32 % from wind, 42 % in total. In 2040 13 % of the electricity is generated from solar and 45 % from
wind 58 % in total.
National Trends is the policy-based scenario. The variable renewable generation is somewhere between the
two to down scenarios. In 2030, 12 % of electricity is produced from solar and 30 % from wind, 42 % in total.
In 2040 14 % of the electricity is generated from solar and 42 % from wind 56 % in total. A lot of electricity is
still produced from nuclear in 2030 17 % reducing to 12 % in 2040.
Shares of coal for electricity generation decrease across all scenarios.
This is due to national policies on coal phase-out, such as stated by UK and Italy or planned by Germany. Coal
generation moves from 10 % in 2025, to 4 % - 6 % in 2030 and negligible amounts in 2040 which represents
an almost complete phase out of coal.
Regional Investment Plan 2020 – Baltic Sea
ENTSO-E | Rue de Spa, 8 | 1000 Brussels | [email protected] | www.entsoe.eu | @entso_e Page 25 of 71
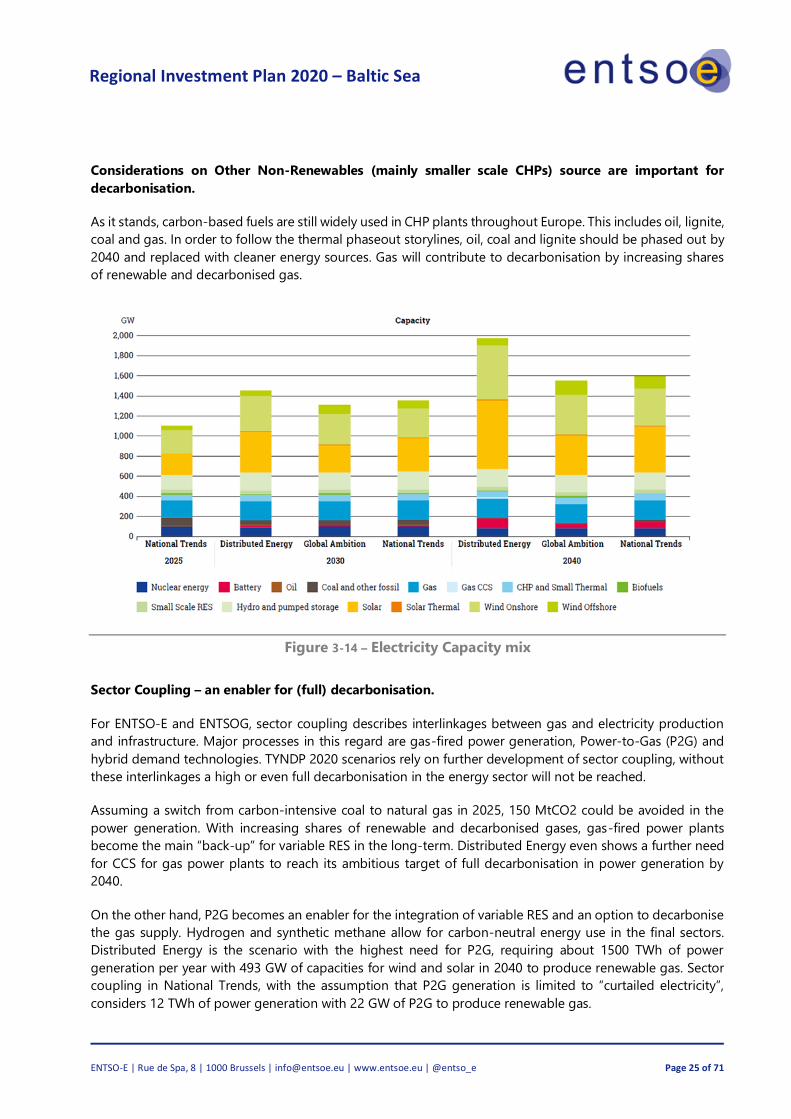
Considerations on Other Non-Renewables (mainly smaller scale CHPs) source are important for
decarbonisation.
As it stands, carbon-based fuels are still widely used in CHP plants throughout Europe. This includes oil, lignite,
coal and gas. In order to follow the thermal phaseout storylines, oil, coal and lignite should be phased out by
2040 and replaced with cleaner energy sources. Gas will contribute to decarbonisation by increasing shares
of renewable and decarbonised gas.
Figure 3-14 – Electricity Capacity mix
Sector Coupling – an enabler for (full) decarbonisation.
For ENTSO-E and ENTSOG, sector coupling describes interlinkages between gas and electricity production
and infrastructure. Major processes in this regard are gas-fired power generation, Power-to-Gas (P2G) and
hybrid demand technologies. TYNDP 2020 scenarios rely on further development of sector coupling, without
these interlinkages a high or even full decarbonisation in the energy sector will not be reached.
Assuming a switch from carbon-intensive coal to natural gas in 2025, 150 MtCO2 could be avoided in the
power generation. With increasing shares of renewable and decarbonised gases, gas-fired power plants
become the main “back-up” for variable RES in the long-term. Distributed Energy even shows a further need
for CCS for gas power plants to reach its ambitious target of full decarbonisation in power generation by
2040.
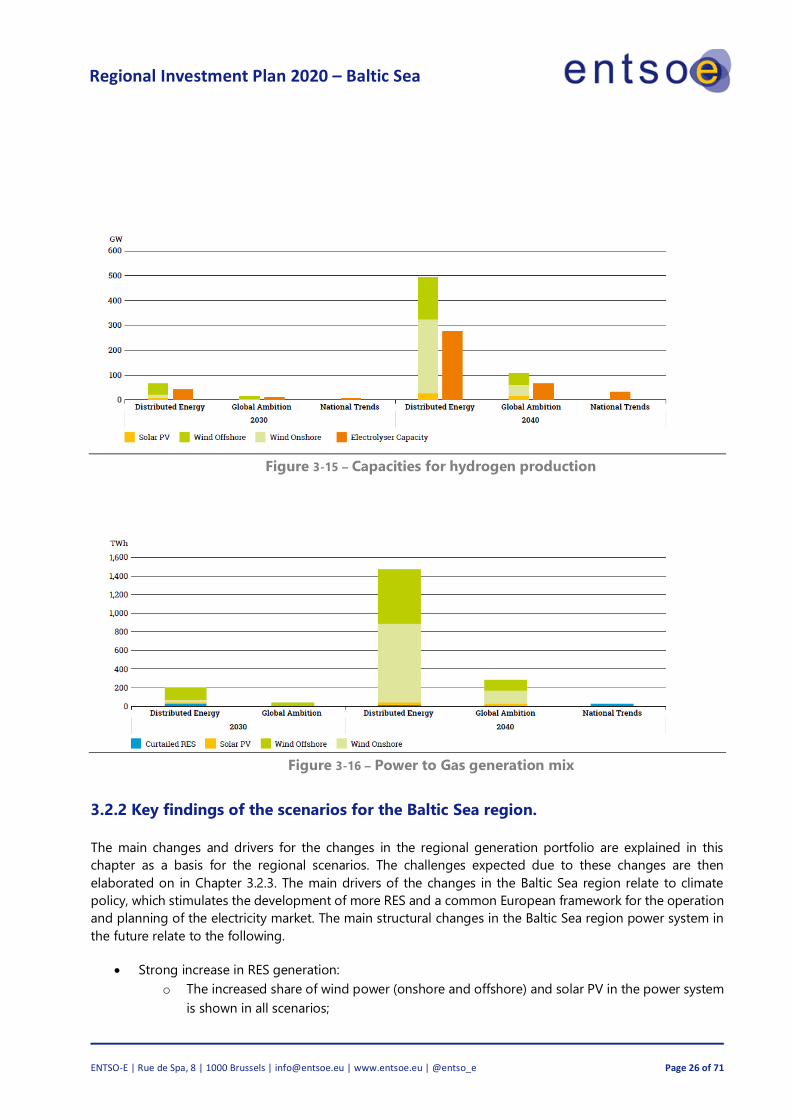
On the other hand, P2G becomes an enabler for the integration of variable RES and an option to decarbonise
the gas supply. Hydrogen and synthetic methane allow for carbon-neutral energy use in the final sectors.
Distributed Energy is the scenario with the highest need for P2G, requiring about 1500 TWh of power
generation per year with 493 GW of capacities for wind and solar in 2040 to produce renewable gas. Sector
coupling in National Trends, with the assumption that P2G generation is limited to “curtailed electricity”,
considers 12 TWh of power generation with 22 GW of P2G to produce renewable gas.
Regional Investment Plan 2020 – Baltic Sea
ENTSO-E | Rue de Spa, 8 | 1000 Brussels | [email protected] | www.entsoe.eu | @entso_e Page 26 of 71
Figure 3-15 – Capacities for hydrogen production
Figure 3-16 – Power to Gas generation mix
3.2.2 Key findings of the scenarios for the Baltic Sea region.
The main changes and drivers for the changes in the regional generation portfolio are explained in this
chapter as a basis for the regional scenarios. The challenges expected due to these changes are then
elaborated on in Chapter 3.2.3. The main drivers of the changes in the Baltic Sea region relate to climate
policy, which stimulates the development of more RES and a common European framework for the operation
and planning of the electricity market. The main structural changes in the Baltic Sea region power system in
the future relate to the following.
• Strong increase in RES generation:
o The increased share of wind power (onshore and offshore) and solar PV in the power system
is shown in all scenarios;

Regional Investment Plan 2020 – Baltic Sea
ENTSO-E | Rue de Spa, 8 | 1000 Brussels | [email protected] | www.entsoe.eu | @entso_e Page 27 of 71
o Additional wind power generation mainly located in the northern and middle part of the
region, which is located farther away from the load centres with large amounts planned for
construction in the middle and southern part of the region
o PV capacity to be mainly increased in the middle and southern part of the region.
• Reduction of thermal power capacity:
o Decommissioning of old lignite, hard coal and oil-fired power plants;
o Full decommissioning of all nuclear power plants in Germany by the end of 2023;
o Decommissioning of four nuclear units in Sweden, with a total capacity of 2,900 MW being
decommissioned in the period 2015 -2020. The remaining six units is expected to reach the
end of their technical lifetime around 2040.
• New large generating units
o New nuclear capacity is being built in Finland, with one unit of 1,600 MW, which is planned
to be commissioned in 2020 and another plant of 1,200 MW, which is planned for
commissioning in 2028.
o Large wind power generation units are planned in the whole BS region.
• Slight increase of storage technologies (hydro-pump storages, battery) in all scenarios to integrate
the flexible RES power generation.
• Remarkable increase of capacities for hydrogen production, mainly in the scenarios DE 2030/2040
and GA 2040.
• Visible increase of capacities for Power to gas generation, also mainly in the scenarios DE.
Growing share of variable renewable generation
The historical development of renewable generation is based on subsidies. Lower development costs,
gradually improved solar cell efficiency and increasingly larger wind turbines with a higher number of full-
load hours will reduce the overall costs per MWh for both solar and wind power. Today, solar power and wind
power, if located favourably, can be profitable without the need for subsidies. This results in changes in
geographical distribution, as it is more profitable to develop solar and wind power in the locations with the
best conditions and the lowest costs. For example, there is much interest in greater development in the Nordic
and Baltic regions, which have some of the best wind resources in Europe. Development can proceed very
rapidly, with some market participants already planning to build new wind turbines without subsidies.
Nuclear phase-out continues in Sweden, while Finland builds new capacity
Nuclear power in Sweden and Finland plays a key role in the Nordic power system. Annually, it represents 25
% of the overall power generation in the Nordic countries. Nuclear power delivers a stable and predictable
baseload near consumption centres and their contribution during dry years is important. Moreover, the power
plants contribute stability to the Nordic grid, and many of the power plants are also strategically located in
areas where they can fully support the capacity of the power grid.
Regional Investment Plan 2020 – Baltic Sea
ENTSO-E | Rue de Spa, 8 | 1000 Brussels | [email protected] | www.entsoe.eu | @entso_e Page 28 of 71
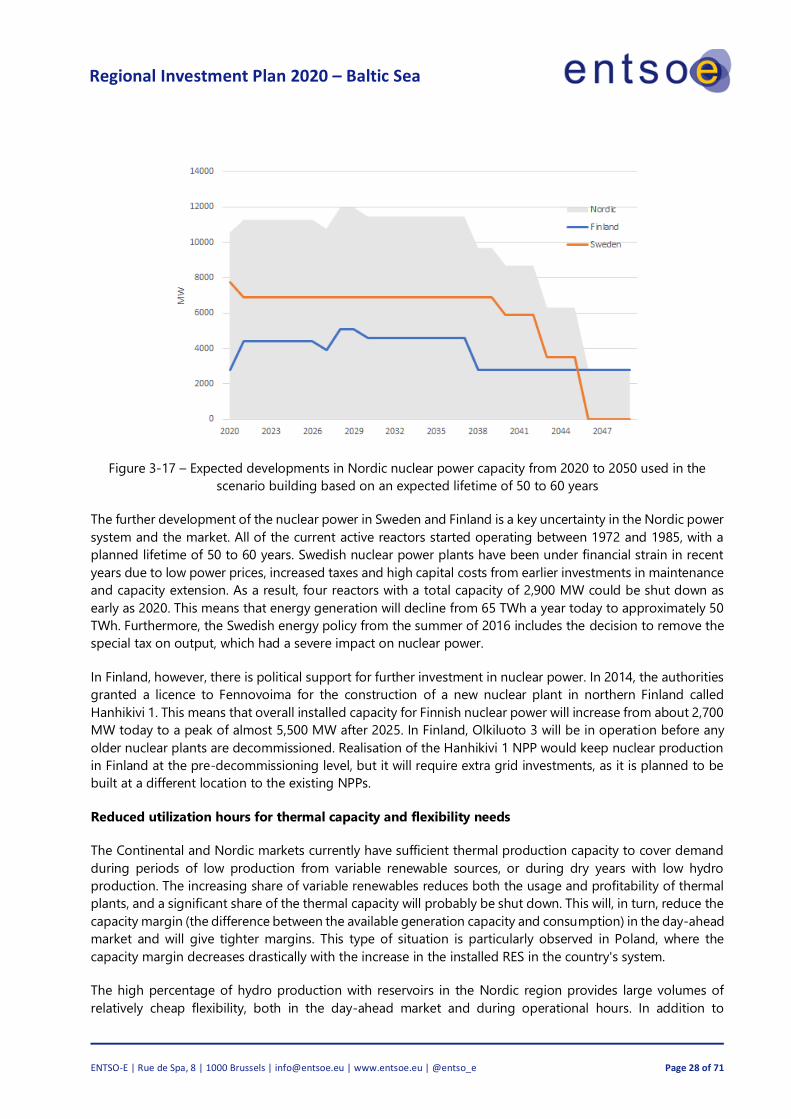
Figure 3-17 – Expected developments in Nordic nuclear power capacity from 2020 to 2050 used in the
scenario building based on an expected lifetime of 50 to 60 years
The further development of the nuclear power in Sweden and Finland is a key uncertainty in the Nordic power
system and the market. All of the current active reactors started operating between 1972 and 1985, with a
planned lifetime of 50 to 60 years. Swedish nuclear power plants have been under financial strain in recent
years due to low power prices, increased taxes and high capital costs from earlier investments in maintenance
and capacity extension. As a result, four reactors with a total capacity of 2,900 MW could be shut down as
early as 2020. This means that energy generation will decline from 65 TWh a year today to approximately 50
TWh. Furthermore, the Swedish energy policy from the summer of 2016 includes the decision to remove the
special tax on output, which had a severe impact on nuclear power.
In Finland, however, there is political support for further investment in nuclear power. In 2014, the authorities
granted a licence to Fennovoima for the construction of a new nuclear plant in northern Finland called
Hanhikivi 1. This means that overall installed capacity for Finnish nuclear power will increase from about 2,700
MW today to a peak of almost 5,500 MW after 2025. In Finland, Olkiluoto 3 will be in operation before any
older nuclear plants are decommissioned. Realisation of the Hanhikivi 1 NPP would keep nuclear production
in Finland at the pre-decommissioning level, but it will require extra grid investments, as it is planned to be
built at a different location to the existing NPPs.
Reduced utilization hours for thermal capacity and flexibility needs
The Continental and Nordic markets currently have sufficient thermal production capacity to cover demand
during periods of low production from variable renewable sources, or during dry years with low hydro
production. The increasing share of variable renewables reduces both the usage and profitability of thermal
plants, and a significant share of the thermal capacity will probably be shut down. This will, in turn, reduce the
capacity margin (the difference between the available generation capacity and consumption) in the day-ahead
market and will give tighter margins. This type of situation is particularly observed in Poland, where the
capacity margin decreases drastically with the increase in the installed RES in the country's system.
The high percentage of hydro production with reservoirs in the Nordic region provides large volumes of
relatively cheap flexibility, both in the day-ahead market and during operational hours. In addition to
Regional Investment Plan 2020 – Baltic Sea
ENTSO-E | Rue de Spa, 8 | 1000 Brussels | [email protected] | www.entsoe.eu | @entso_e Page 29 of 71
hydropower, flexible coal and gas power plants also provide both long-and short-term flexibility, though at a
higher cost than hydropower. Until now, the flexibility from hydro plants with reservoirs has been enough to
cover most of the flexibility needed in Norway and Sweden, as well as a significant proportion of the flexibility
demand in Denmark, Finland and the Baltic countries. This has resulted in a relatively low-price volatility in
the day-ahead market and in the balancing of costs. A higher market share of variable renewables will be the
main driver of increased demand for flexibility because the flexibility provided by existing hydro plants is
limited and thermal capacity is declining.
3.2.3 Technical challenges of the power system
There are two significant changes in the Baltic Sea region that challenges the power system operation and
technical setup.
The major influence comes from the increasing share of RES in the generation portfolio, especially converter
coupled generation modules – so called power park modules by definition of EU grid code RfG (Requirements
for Generators). 'Power Park Module' (PPM) means a unit or ensemble of units generating electricity, which is
either non-synchronously connected to the network or connected through power electronics, and that also
has a single connection point to a transmission system, distribution system including closed distribution
system or HVDC system (Article 2(17) of the Network Code on Requirements for Grid Connection of
Generators (NC RfG))1.
Due to converter coupling to the system and variable character of RES based generation the power park
modules behave in some important aspects differently than conventional synchronous generators that
actually have been dominating since the beginning of power systems were created until nowadays. But the
share of it is significantly decreasing and in some point of time in the future power park module type of
generation might have an exponential increase and the rest of the system shall be ready for that.
The second big technical challenge is influencing mainly Baltic States and it is related to the Baltics power
system synchronisation with the Continental Europe synchronous area. More specific technical solution and
plan is described in separate Synchronisation project Chapter 5.1. Regarding technical challenge to Baltics
synchronisation project brings several new technical and system characteristic changes. Baltics separately is
rather small power system with peak load roughly around 5 GW. Baltic power system used to operate as part
of Russian power system IPS/UPS and the share of the responsibilities are divided differently as it is common
in EU. So, one big challenge is directly related to the way of operating the system and it needs to be changed.
In Russian system the frequency is controlled centrally, in EU the responsibility is shared proportionally among
the members connected to the same synchronous area.
Due to technical solution of the future synchronous interconnection between Lithuania and Poland there is a
small but still considerable probability that Baltics will disconnect from Continental synchronous system and
transfer to island operation due to exceptional contingency of tripping the only double circuit high voltage
400 kV overhead lines connecting Baltics with rest of the Europe. This situation can be technically handled,
but it is a big technical challenge including additional investments to the technology enabling sufficient
system inertia and limiting RoCoF (Rate of Change of Frequency) on acceptable level and allowing superfast
activation of countermeasures to restore the system balance and frequency stability.
1 Source (footnote): https://www.emissions-euets.com/internal-electricity-market-glossary/830-power-park-module-
ppm

Regional Investment Plan 2020 – Baltic Sea
ENTSO-E | Rue de Spa, 8 | 1000 Brussels | [email protected] | www.entsoe.eu | @entso_e Page 30 of 71
Technical challenges brought forward by increases in RES generation, which are identified by TSO experts
include:
• Frequency stability issues, due to reduced inertia, increased deviation range and ramp rate of
generation and larger contingencies;
• Voltage stability issues, due to longer transmission paths and reduced voltage control near load
centres; and
• Angular stability issues, due to reduced minimum short-circuit current levels.
New interconnections are part of the solutions for providing flexibility, while other solutions such as energy
and electricity storage and demand response can also be part of the solution to balance energy levels. From
a dynamic stability perspective, the flexibility needed to keep the power system running when penetration of
synchronous machines is reduced can be provided by RES generation units, using flexible AC transmission
(FACTS) devices, controlling HVDC links and using solutions such as dynamic line rating and special system
protection schemes. Decreases in inertia, short-circuit power and voltage regulation near load centres are a
few of the main issues that must be solved as the generation portfolio is becoming increasingly CO2 free.
Decreased inertia
One of the major challenges identified is the decrease in inertia when synchronous generation is decreasing,
and converter-connected generation is increasing within the system. Inertia is the kinetic energy stored in the
rotating masses of machines, and the inertia of a power system resists the change in frequency after a step
change in generation or load. Figure 3-19 shows the impact of change in inertia to a frequency response of
the system after loss of generation.
Figure 3-19 – On the left, the effect of the amount of kinetic energy (inertia) on the behaviour of frequency
after a loss of production with (solid line) and without (dotted line) the Frequency Containment Reserve (FCR).2
On the right, the estimated kinetic energy in 2025 as a function of total load in the synchronous area with
wind and solar production and HVDC import including all the climate years (1962–2012) of the market
simulation scenario. The red line shows the required amount of kinetic energy3
2 https://www.entsoe.eu/Documents/Publications/SOC/Nordic/Nordic_report_Future_System_Inertia.pdf 3https://www.svk.se/contentassets/9e28b79d9c4541bf82f21938bf8c7389/stet0043_nordisk_rapport_hele_mdato1.pdf
Regional Investment Plan 2020 – Baltic Sea
ENTSO-E | Rue de Spa, 8 | 1000 Brussels | [email protected] | www.entsoe.eu | @entso_e Page 31 of 71
Too little inertia can lead to frequency instability where sudden change in generation and load balance can
lead to unacceptable frequency deviation and could further lead to cascading tripping in the system elements,
leading to blackouts in the worst-case scenario. The low inertia situation is only expected in the Nordic
synchronous system in the medium term, and in case of island operation, also in the Baltic system. The amount
of inertia in future Nordic synchronous power systems has been analysed by the Nordic TSOs and is illustrated
in Figure 3-19. More detailed information about the inertia issue is given in the ENTSO-E publication entitled
‘Nordic Report Future System Inertia’.4
One of the possibilities to compensate for the decrease in system inertia is to provide a temporary, fast-
response active power injection from the wind production units decoupled from the grid with converter
technology. The temporary boost of active power support following a sudden decrease in frequency could
be achieved by utilising the kinetic energy stored in the wind turbine rotors and generators. The reaction time
and control is not instantaneous but with today’s advanced power electronics it should be fast enough to
support the system and to avoid sudden frequency drops. The problem with this control could be a slight
decrease in power output after utilising the stored kinetic energy of the rotating turbines, as the wind turbine
blades are not rotating with the optimal speed necessary for achieving maximum production at certain wind
speeds. The maximum output will usually be restored several tens of seconds after the synthetic inertia has
been used. In case of further RES increases, synthetic system inertia as a basic function for rotating RES units
decoupled through power electronics could be considered.
Decreased voltage regulation near load centres
Large amount of the planned wind power production is located far away from load centres where the
conventional units are, and have been, located. A large extension of reactive power compensation devices is
expected due to the longer distance of transmission of power required and the decreased dynamic voltage
support from the conventional units. For example, in the Nordic countries, wind power from the northern
areas need to be transmitted to load centres near the large cities in the southern areas. Similarly, in Germany,
the wind power from northern areas needs to be transmitted to load centres in the southern part of the
country.
Decreased minimum short circuit power
Directly connected synchronous generators provide short circuit current and voltage support regulation
during faults that are necessary for the normal operation of certain types of converter technologies to avoid
commutation failures. Insufficient short circuit power support might lead to a tripping of the line commutated
converters (LCC), which are technology-based converters. Furthermore, when the penetration level of
converter-connected power generators is very high, the form of the fault current is determined by the controls
of the converters and not by the short circuit output of rotating machines, which can cause issues with the
protection devices that are designed to work in a system based on synchronous machines. When designing
future power systems, those technical issues should be studied in more detail, and sufficient countermeasures
need to be taken into account based on the results.
4 https://www.entsoe.eu/Documents/Publications/SOC/Nordic/Nordic_report_Future_System_Inertia.pdf

Regional Investment Plan 2020 – Baltic Sea
ENTSO-E | Rue de Spa, 8 | 1000 Brussels | [email protected] | www.entsoe.eu | @entso_e Page 32 of 71
4. REGIONAL RESULTS
This chapter shows and explains the results of the regional studies and is divided into two sections. The
subchapter 4.1 provides future capacity needs identified during the Identification of System Needs (IoSN)
process and the subchapter 4.2 provides the detailed outcomes of market results from IoSN study.
4.1 Future capacity needs
The energy system of the Baltic Sea region is undergoing a transformation. Over recent years, onshore wind
capacity has been developed at an increasing rate. More recently, in parts of the region, offshore wind
generation is being developed in significant quantities. This development of renewable generation, alongside
the existing hydro generation, provides the region with increased amounts of ‘clean’ energy. In addition,
thermal generation may be phased out to a large extent. Finally, the nuclear generation is undergoing a major
restructuring, being decommissioned in Germany, while in Sweden some nuclear units has been
decommissioned due to economic reasons the remaining capacity is expected to be available until around
2040 when the technical lifetime is reached. All the above generation changes are assumed to increase in the
future. In addition, electricity consumption is undergoing a transformation, both regarding electrification in
industry and transportation as well as consumers becoming a part of the production system themselves
(prosumers).
To be able to analyse future capacity needs, different scenarios have been developed. The potential changes
in both generation and consumption are described in the first phase of the TYNDP 2020process, building new
scenarios for 2030 and 2040 and assessing system needs for the long-term horizon of 2040. As part of this
work, cross-border capacity increases, having a positive impact on the system, have been identified for the
National Trend scenario and one climate year. A European overview of these increases is presented in the
European System Needs report (IoSN), developed by ENTSO-E in parallel with the Regional Investment Plans
(RegIPs). In Figure 4-1 projects already being a part of the TYNDP 2020 reference grid are shown. Projects
being categorised "Under construction" and "In permitting" are part of the Reference Grid 2025, hence
assumed built by 2025. In figure 4-2 the identified capacity-increases between 2030 and 2040 for the Baltic
Sea region are shown. The figure is based on the pan-European System Needs analyses 2040 and assumes
that the Reference Grid 2025 is already realised. Moreover, this figure also shows the effect for those
boundaries where another IoSN grid solution would have similar benefits that are not part of the IoSN SEW-
based Needs solution. This so called "upper bound" capacity do not represent an alternative grid solution,
but a different combination of increases boundaries capacity, which would lead to only slightly more
expensive benefits. Not all "upper bound" capacity increases can be added to the IoSN SEW-based Needs
solution at the same time, but that adding one or two provides benefits similar to that of the IoSN SEW-based
Needs solution alone. The two figures show that based on the TYNDP 2020 projects, the project promoters
and TSOs are partly covering the gap between today's grid and the future needs. However, still a lot of projects
need to be realised in order to meet the future needs. The future needs of the interconnected European power
systems to cope with such a long-term generation mix development that should be solved by the identified
cross-border capacity increases are:

Regional Investment Plan 2020 – Baltic Sea
ENTSO-E | Rue de Spa, 8 | 1000 Brussels | [email protected] | www.entsoe.eu | @entso_e Page 33 of 71
1. Insufficient integration of renewables into the power systems, as high amounts of curtailed energy
occurred in a couple of power systems;
2. Insufficient market integration – high system costs in particular market areas and high price
differences between the market areas;
3. High CO2 emissions;
4. Insufficient cross-border capacities.
The ‘future capacity needs’, which has been identified as being a part of the IoSN process, which is mainly
due to the change of the overall situation in the power systems in future scenarios (such as load-flow pattern
changes, therefore the transmission system elements limiting the cross-border capacity in 2020 time horizon
changed in 2040, due to the generation mix change - installed capacities and location in the power systems)
as well as the strengthening of the grid infrastructure.
The identified future capacity needs on the cross-border profiles in the BS region could potentially be covered
fully or partly by the future transmission projects included in the TYNDP 2020 process or will remain necessary
for future grid development. On top of that, expectations on increased offshore wind might lead to a new
type of hybrid projects combining connecting offshore-wind and interconnections between the countries.
This is to be further investigated.
Figure 4-1 – TYNDP 2020 project-list (projects being
categorised "Under construction" and the majority of
projects "In permitting" are part of the Reference Grid
2025)
Figure 4-2 – Identified capacity-increase between 2025 and
2040
Regional Investment Plan 2020 – Baltic Sea
ENTSO-E | Rue de Spa, 8 | 1000 Brussels | [email protected] | www.entsoe.eu | @entso_e Page 34 of 71
As part of this work, cross-border capacity increases were identified, which will have a positive impact on the
system. A European overview of these increases is presented in the European System Need report developed
by ENTSO-E in parallel with the RegIPs. The system needs for the 2040 horizon are being evaluated with
respect to (1) market-integration/socio-economic welfare, (2) integration of renewables, (3) reduction of
greenhouse gas emissions and (4) security of supply. For the Baltic Sea region the 2040 needs are mainly
being described through:
- Synchronization of the Baltic system towards the Continental system. This in order to improve
the security of supply. In relation to this also further internal integration within the Baltics, mainly
due to concerns with security of supply.
- If realisation of offshore wind park, a need to transport the energy to the onshore system.
- Stronger integration Germany-Poland to increase market-integration and to distribution of
spillage energy from German RES;
- Further integration Sweden-Finland to increase market integration and to serve the negative
Finnish energy balance;
- Further integration Norway-Finland to increase market integration and to serve the negative
Finnish energy balance;
- Further integration between Sweden/Denmark and Germany due to price differences and better
optimisation of RES generation (hydro/wind)
The IoSN-results are very much depending on the scenario-assumptions. For some of the results the trends
are not fully aligned with the scenario-assumptions made two years ago. This is most likely due to the IoSN
analysis for only one climate year. E.g. the Norway-Finland capacity-increase is based on rather high onshore
wind development in northern part of Norway. The trend is a far more restrictive policy regarding onshore
wind, which would lead to a need for a lower capacity than estimated in the IoSN analyses. Also the internal
cost are not fully taken into account, both for Norway-Finland and Sweden-Finland. For these corridors further
investigations need to be done. The huge spillage of renewable energy in Germany identifies the need to
export to Poland in the IoSN analysis, where under the conditions of the scenarios used, energy from fossil
sources is significantly reduced, affecting decreasing capacity margin in Poland. In addition, the IoSN analysis
also identifies the need for a new DKe-PL connection in 2030, while in 2040 this need was not confirmed. This
situation is most likely caused by the delay in the development of Polish offshore in 2030, compared to 2040.
Further investigation of this corridor needs to be done. The potential to increase transmission capacity on the
LT-PL connection is related to the possibility of unblocking these capacities on the existing LitPol Link
connection. This is related to increasing the resilience and robustness of the Baltic States grid after
synchronization with continental Europe through this connection and step by step release of transmission
capacity for trade. A further increase of capacity on the border DE-PL is only possible if a connection is built,
and both the Polish and German internal grids are strengthened accordingly. The identification of a need to
further increase the capacity beyond the 3rd interconnection is a theoretical approach to give an indication
about the future needs for system development based on the currently used assumptions. At this stage there
is no existing agreement or planned project concerning these investments yet.
The needs for the region, discovered in the Pan-European System Needs analyses 2040, are partly covered by
projects already waiting to be assessed in the TYNDP 2020. The Table 4-1 below shows cross-border capacities
including increases identified during the TYNDP 2020 process. The first columns show the 2020 capacities.
The next columns show the capacities relevant for the CBA, which will be carried out on the time horizons of
2025, 2030 and 2040. These columns show the capacities of the reference grid for CBA and the capacities if
all projects per border are added together.
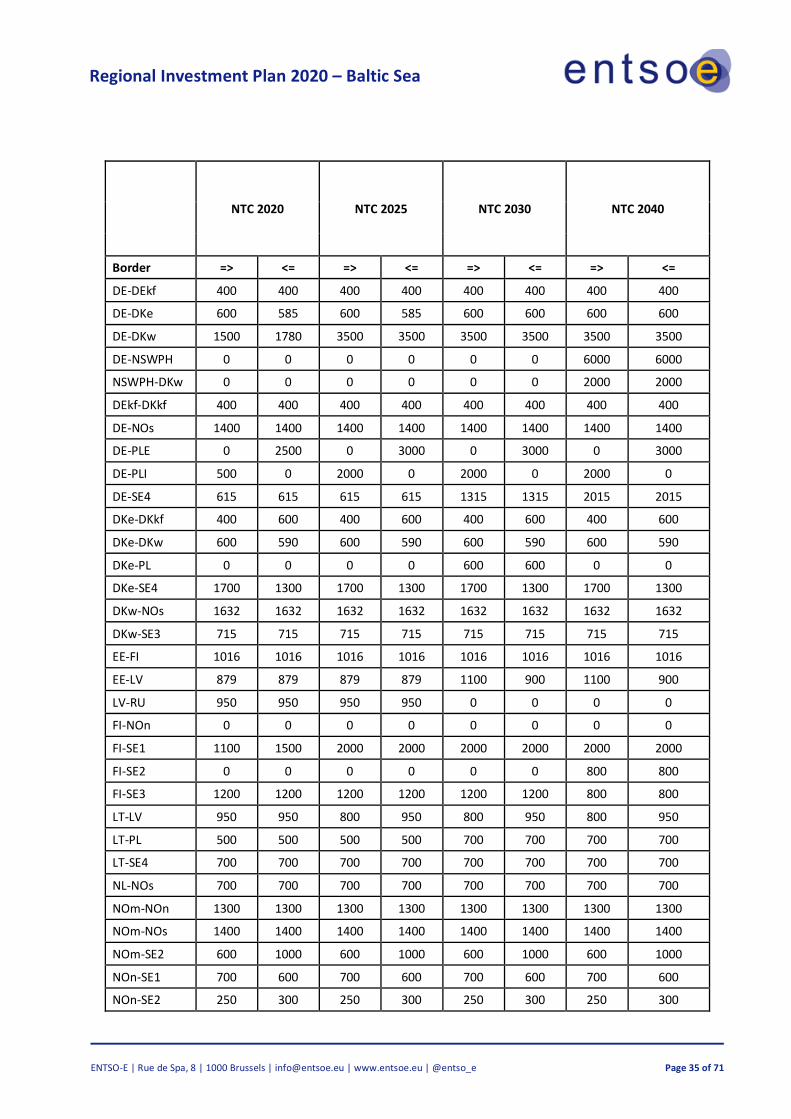
Regional Investment Plan 2020 – Baltic Sea
ENTSO-E | Rue de Spa, 8 | 1000 Brussels | [email protected] | www.entsoe.eu | @entso_e Page 35 of 71
NTC 2020 NTC 2025 NTC 2030 NTC 2040
Border => <= => <= => <= => <=
DE-DEkf 400 400 400 400 400 400 400 400
DE-DKe 600 585 600 585 600 600 600 600
DE-DKw 1500 1780 3500 3500 3500 3500 3500 3500
DE-NSWPH 0 0 0 0 0 0 6000 6000
NSWPH-DKw 0 0 0 0 0 0 2000 2000
DEkf-DKkf 400 400 400 400 400 400 400 400
DE-NOs 1400 1400 1400 1400 1400 1400 1400 1400
DE-PLE 0 2500 0 3000 0 3000 0 3000
DE-PLI 500 0 2000 0 2000 0 2000 0
DE-SE4 615 615 615 615 1315 1315 2015 2015
DKe-DKkf 400 600 400 600 400 600 400 600
DKe-DKw 600 590 600 590 600 590 600 590
DKe-PL 0 0 0 0 600 600 0 0
DKe-SE4 1700 1300 1700 1300 1700 1300 1700 1300
DKw-NOs 1632 1632 1632 1632 1632 1632 1632 1632
DKw-SE3 715 715 715 715 715 715 715 715
EE-FI 1016 1016 1016 1016 1016 1016 1016 1016
EE-LV 879 879 879 879 1100 900 1100 900
LV-RU 950 950 950 950 0 0 0 0
FI-NOn 0 0 0 0 0 0 0 0
FI-SE1 1100 1500 2000 2000 2000 2000 2000 2000
FI-SE2 0 0 0 0 0 0 800 800
FI-SE3 1200 1200 1200 1200 1200 1200 800 800
LT-LV 950 950 800 950 800 950 800 950
LT-PL 500 500 500 500 700 700 700 700
LT-SE4 700 700 700 700 700 700 700 700
NL-NOs 700 700 700 700 700 700 700 700
NOm-NOn 1300 1300 1300 1300 1300 1300 1300 1300
NOm-NOs 1400 1400 1400 1400 1400 1400 1400 1400
NOm-SE2 600 1000 600 1000 600 1000 600 1000
NOn-SE1 700 600 700 600 700 600 700 600
NOn-SE2 250 300 250 300 250 300 250 300
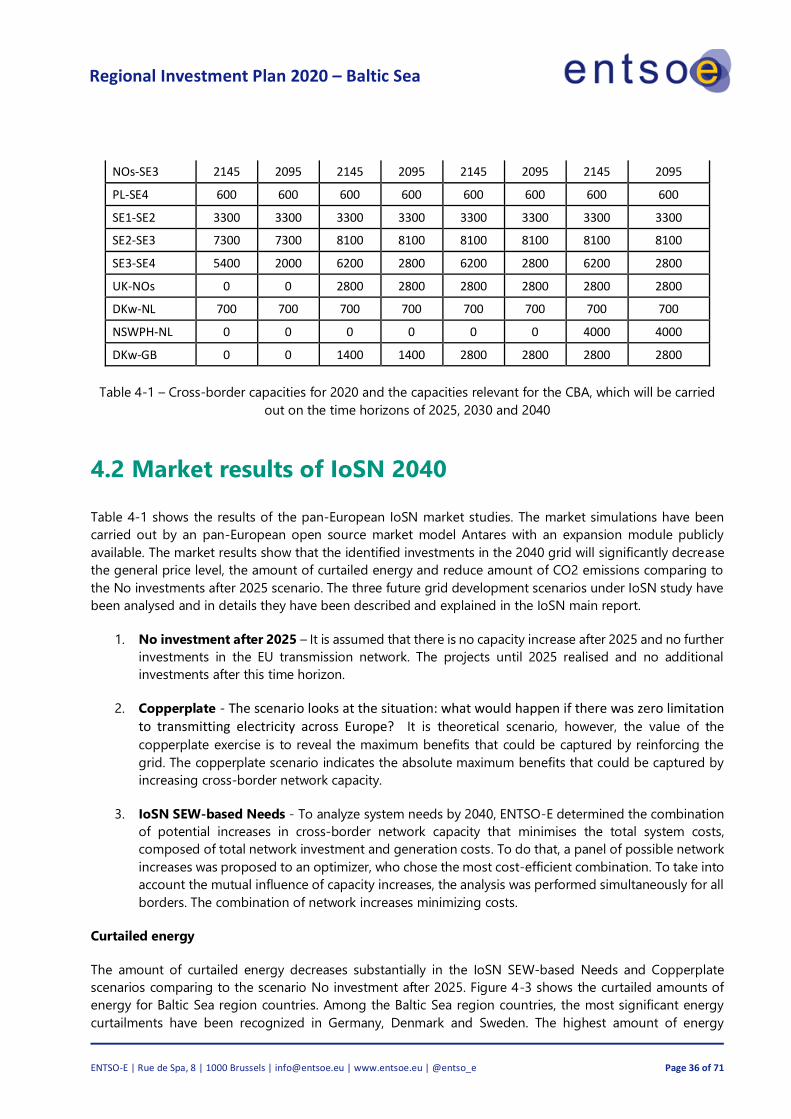
Regional Investment Plan 2020 – Baltic Sea
ENTSO-E | Rue de Spa, 8 | 1000 Brussels | [email protected] | www.entsoe.eu | @entso_e Page 36 of 71
NOs-SE3 2145 2095 2145 2095 2145 2095 2145 2095
PL-SE4 600 600 600 600 600 600 600 600
SE1-SE2 3300 3300 3300 3300 3300 3300 3300 3300
SE2-SE3 7300 7300 8100 8100 8100 8100 8100 8100
SE3-SE4 5400 2000 6200 2800 6200 2800 6200 2800
UK-NOs 0 0 2800 2800 2800 2800 2800 2800
DKw-NL 700 700 700 700 700 700 700 700
NSWPH-NL 0 0 0 0 0 0 4000 4000
DKw-GB 0 0 1400 1400 2800 2800 2800 2800
Table 4-1 – Cross-border capacities for 2020 and the capacities relevant for the CBA, which will be carried
out on the time horizons of 2025, 2030 and 2040
4.2 Market results of IoSN 2040
Table 4-1 shows the results of the pan-European IoSN market studies. The market simulations have been
carried out by an pan-European open source market model Antares with an expansion module publicly
available. The market results show that the identified investments in the 2040 grid will significantly decrease
the general price level, the amount of curtailed energy and reduce amount of CO2 emissions comparing to
the No investments after 2025 scenario. The three future grid development scenarios under IoSN study have
been analysed and in details they have been described and explained in the IoSN main report.
1. No investment after 2025 – It is assumed that there is no capacity increase after 2025 and no further
investments in the EU transmission network. The projects until 2025 realised and no additional
investments after this time horizon.
2. Copperplate - The scenario looks at the situation: what would happen if there was zero limitation to transmitting electricity across Europe? It is theoretical scenario, however, the value of the
copperplate exercise is to reveal the maximum benefits that could be captured by reinforcing the
grid. The copperplate scenario indicates the absolute maximum benefits that could be captured by
increasing cross-border network capacity.
3. IoSN SEW-based Needs - To analyze system needs by 2040, ENTSO-E determined the combination
of potential increases in cross-border network capacity that minimises the total system costs,
composed of total network investment and generation costs. To do that, a panel of possible network
increases was proposed to an optimizer, who chose the most cost-efficient combination. To take into
account the mutual influence of capacity increases, the analysis was performed simultaneously for all
borders. The combination of network increases minimizing costs.
Curtailed energy
The amount of curtailed energy decreases substantially in the IoSN SEW-based Needs and Copperplate
scenarios comparing to the scenario No investment after 2025. Figure 4-3 shows the curtailed amounts of
energy for Baltic Sea region countries. Among the Baltic Sea region countries, the most significant energy
curtailments have been recognized in Germany, Denmark and Sweden. The highest amount of energy
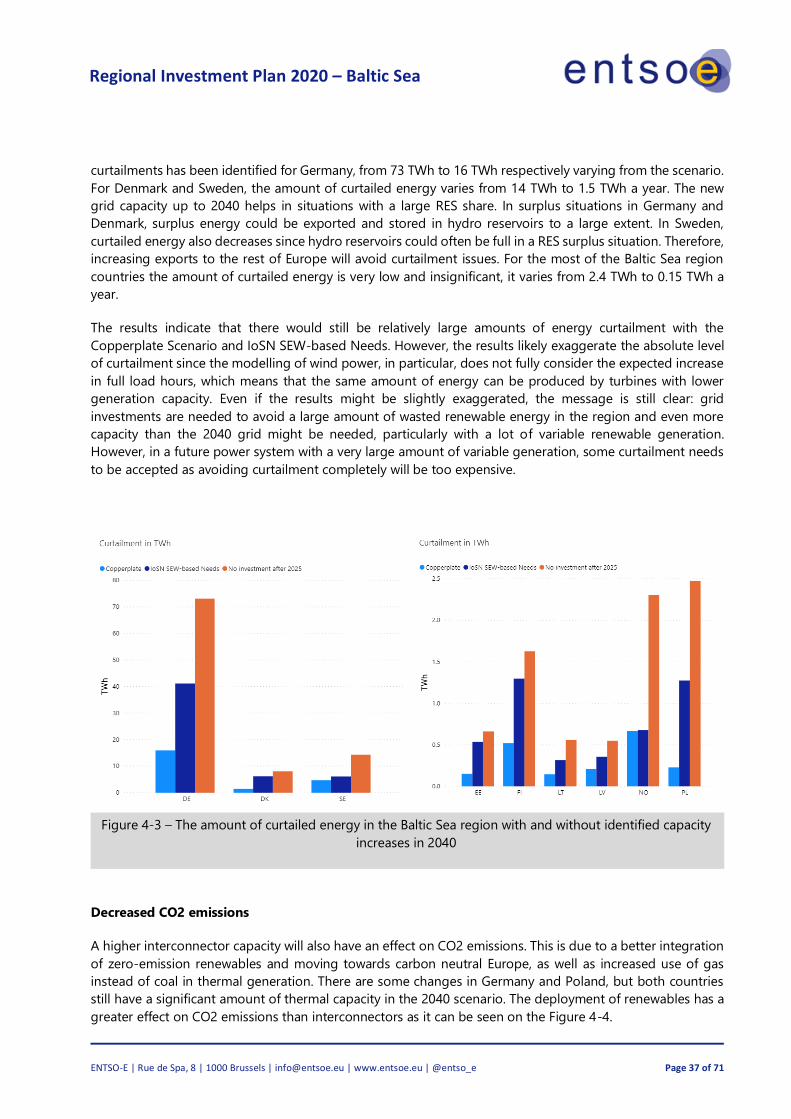
Regional Investment Plan 2020 – Baltic Sea
ENTSO-E | Rue de Spa, 8 | 1000 Brussels | [email protected] | www.entsoe.eu | @entso_e Page 37 of 71
curtailments has been identified for Germany, from 73 TWh to 16 TWh respectively varying from the scenario.
For Denmark and Sweden, the amount of curtailed energy varies from 14 TWh to 1.5 TWh a year. The new
grid capacity up to 2040 helps in situations with a large RES share. In surplus situations in Germany and
Denmark, surplus energy could be exported and stored in hydro reservoirs to a large extent. In Sweden,
curtailed energy also decreases since hydro reservoirs could often be full in a RES surplus situation. Therefore,
increasing exports to the rest of Europe will avoid curtailment issues. For the most of the Baltic Sea region
countries the amount of curtailed energy is very low and insignificant, it varies from 2.4 TWh to 0.15 TWh a
year.
The results indicate that there would still be relatively large amounts of energy curtailment with the
Copperplate Scenario and IoSN SEW-based Needs. However, the results likely exaggerate the absolute level
of curtailment since the modelling of wind power, in particular, does not fully consider the expected increase
in full load hours, which means that the same amount of energy can be produced by turbines with lower
generation capacity. Even if the results might be slightly exaggerated, the message is still clear: grid
investments are needed to avoid a large amount of wasted renewable energy in the region and even more
capacity than the 2040 grid might be needed, particularly with a lot of variable renewable generation.
However, in a future power system with a very large amount of variable generation, some curtailment needs
to be accepted as avoiding curtailment completely will be too expensive.
Figure 4-3 – The amount of curtailed energy in the Baltic Sea region with and without identified capacity
increases in 2040
Decreased CO2 emissions
A higher interconnector capacity will also have an effect on CO2 emissions. This is due to a better integration
of zero-emission renewables and moving towards carbon neutral Europe, as well as increased use of gas
instead of coal in thermal generation. There are some changes in Germany and Poland, but both countries
still have a significant amount of thermal capacity in the 2040 scenario. The deployment of renewables has a
greater effect on CO2 emissions than interconnectors as it can be seen on the Figure 4-4.
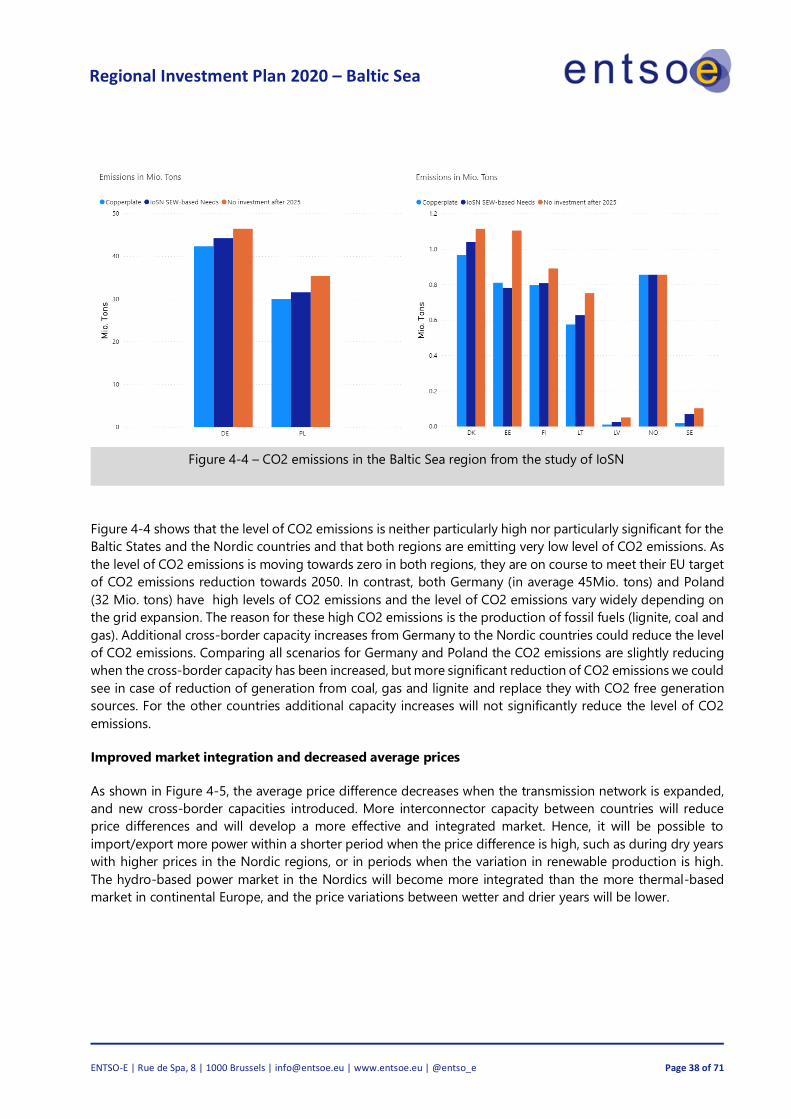
Regional Investment Plan 2020 – Baltic Sea
ENTSO-E | Rue de Spa, 8 | 1000 Brussels | [email protected] | www.entsoe.eu | @entso_e Page 38 of 71
Figure 4-4 – CO2 emissions in the Baltic Sea region from the study of IoSN
Figure 4-4 shows that the level of CO2 emissions is neither particularly high nor particularly significant for the
Baltic States and the Nordic countries and that both regions are emitting very low level of CO2 emissions. As
the level of CO2 emissions is moving towards zero in both regions, they are on course to meet their EU target
of CO2 emissions reduction towards 2050. In contrast, both Germany (in average 45Mio. tons) and Poland
(32 Mio. tons) have high levels of CO2 emissions and the level of CO2 emissions vary widely depending on
the grid expansion. The reason for these high CO2 emissions is the production of fossil fuels (lignite, coal and
gas). Additional cross-border capacity increases from Germany to the Nordic countries could reduce the level
of CO2 emissions. Comparing all scenarios for Germany and Poland the CO2 emissions are slightly reducing
when the cross-border capacity has been increased, but more significant reduction of CO2 emissions we could
see in case of reduction of generation from coal, gas and lignite and replace they with CO2 free generation
sources. For the other countries additional capacity increases will not significantly reduce the level of CO2
emissions.
Improved market integration and decreased average prices
As shown in Figure 4-5, the average price difference decreases when the transmission network is expanded,
and new cross-border capacities introduced. More interconnector capacity between countries will reduce
price differences and will develop a more effective and integrated market. Hence, it will be possible to
import/export more power within a shorter period when the price difference is high, such as during dry years
with higher prices in the Nordic regions, or in periods when the variation in renewable production is high.
The hydro-based power market in the Nordics will become more integrated than the more thermal-based
market in continental Europe, and the price variations between wetter and drier years will be lower.
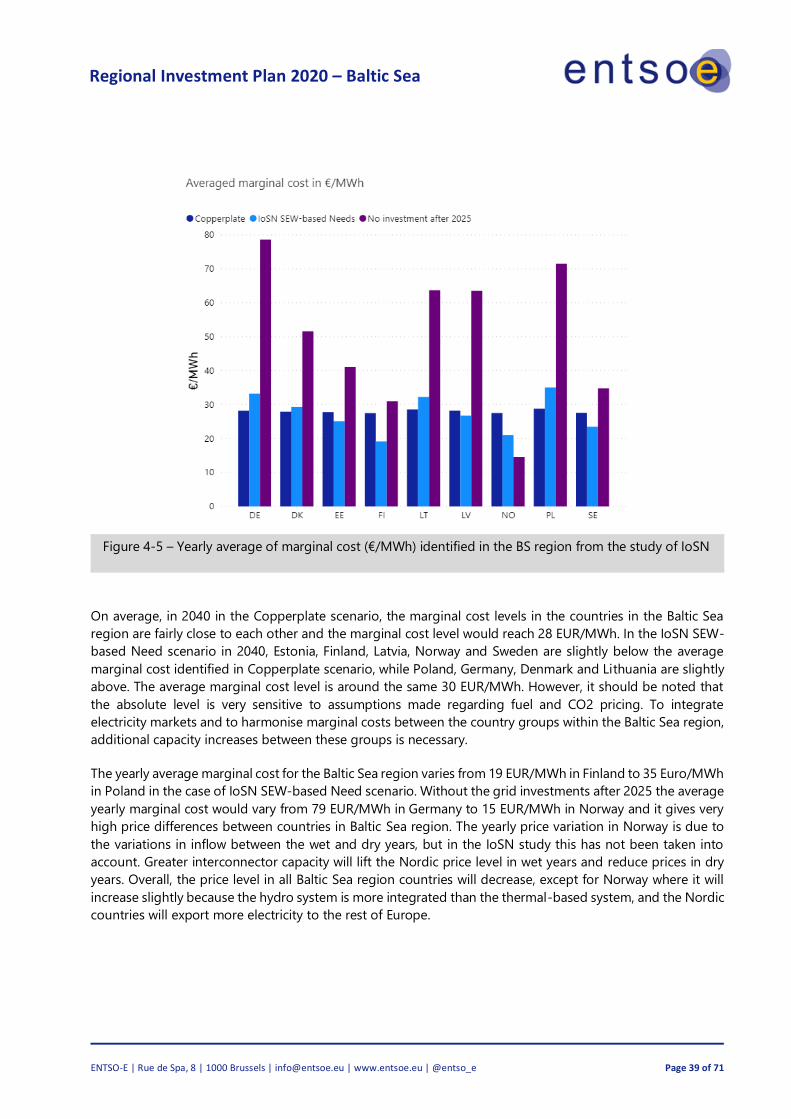
Regional Investment Plan 2020 – Baltic Sea
ENTSO-E | Rue de Spa, 8 | 1000 Brussels | [email protected] | www.entsoe.eu | @entso_e Page 39 of 71
Figure 4-5 – Yearly average of marginal cost (€/MWh) identified in the BS region from the study of IoSN
On average, in 2040 in the Copperplate scenario, the marginal cost levels in the countries in the Baltic Sea
region are fairly close to each other and the marginal cost level would reach 28 EUR/MWh. In the IoSN SEW-
based Need scenario in 2040, Estonia, Finland, Latvia, Norway and Sweden are slightly below the average
marginal cost identified in Copperplate scenario, while Poland, Germany, Denmark and Lithuania are slightly
above. The average marginal cost level is around the same 30 EUR/MWh. However, it should be noted that
the absolute level is very sensitive to assumptions made regarding fuel and CO2 pricing. To integrate
electricity markets and to harmonise marginal costs between the country groups within the Baltic Sea region,
additional capacity increases between these groups is necessary.
The yearly average marginal cost for the Baltic Sea region varies from 19 EUR/MWh in Finland to 35 Euro/MWh
in Poland in the case of IoSN SEW-based Need scenario. Without the grid investments after 2025 the average
yearly marginal cost would vary from 79 EUR/MWh in Germany to 15 EUR/MWh in Norway and it gives very
high price differences between countries in Baltic Sea region. The yearly price variation in Norway is due to
the variations in inflow between the wet and dry years, but in the IoSN study this has not been taken into
account. Greater interconnector capacity will lift the Nordic price level in wet years and reduce prices in dry
years. Overall, the price level in all Baltic Sea region countries will decrease, except for Norway where it will
increase slightly because the hydro system is more integrated than the thermal-based system, and the Nordic
countries will export more electricity to the rest of Europe.

Regional Investment Plan 2020 – Baltic Sea
ENTSO-E | Rue de Spa, 8 | 1000 Brussels | [email protected] | www.entsoe.eu | @entso_e Page 40 of 71
Surplus in the western part of the region and deficit in the eastern part
The net annual country balance in different kind of investment scenarios shows that main electricity producers
in the Baltic Sea region are Germany, Denmark, Estonia and Sweden because the export amount exceeds
import amount and the energy is being transmitted to the Poland, Finland and Latvia, Lithuania (Figure 4-6
and Figure 4-7). The exception is the scenario No investment after 2025 where the main producers are
Denmark, Estonia and Sweden but due to limitations and grid constraints Germany is moved to importer side
where are Finland, Poland, Latvia and Lithuania (Figure 4-8). The IoSN-analyses is based on a very wet year
(2007). For a country like Norway, energy-balances are far from representing a typical year and due to this,
the values for Norway are not a part of the figures in this sub-chapter. In the IoSN study the assumptions
were a little bit different as previously and the change between climate years didn't play so important role as
it should be. Sweden will maintain a net annual surplus despite a significant reduction in nuclear capacity by
2040. Depending on the scenario in general, the annual country balance will hover around zero for Lithuania,
Estonia and Latvia. The annual balance for these countries is very close to zero because they have relatively
small power systems compared with Germany, Norway, Poland, Finland and Sweden. A large amount of
imported electricity is expected for Finland and Poland in all scenarios. In Poland, domestic coal-fired
generation will be partially replaced by imports. In Finland, the balance is close to 2015 levels, as increases
from new wind and nuclear generation will be offset by a growth in demand as well as the decommissioning
of existing nuclear and CHP generation by 2040.
Figure 4-6 – Net annual country balance (export and import in wet climate year) in Copperplate scenario (2040)
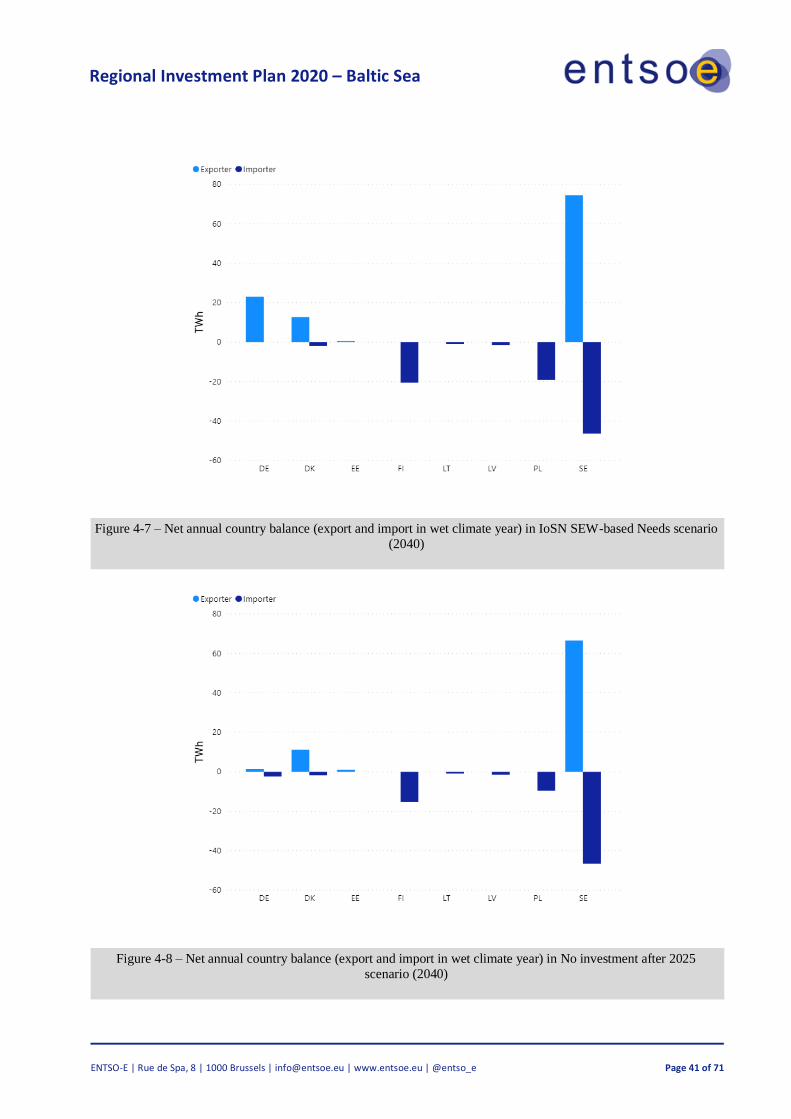
Regional Investment Plan 2020 – Baltic Sea
ENTSO-E | Rue de Spa, 8 | 1000 Brussels | [email protected] | www.entsoe.eu | @entso_e Page 41 of 71
Figure 4-7 – Net annual country balance (export and import in wet climate year) in IoSN SEW-based Needs scenario
(2040)
Figure 4-8 – Net annual country balance (export and import in wet climate year) in No investment after 2025
scenario (2040)
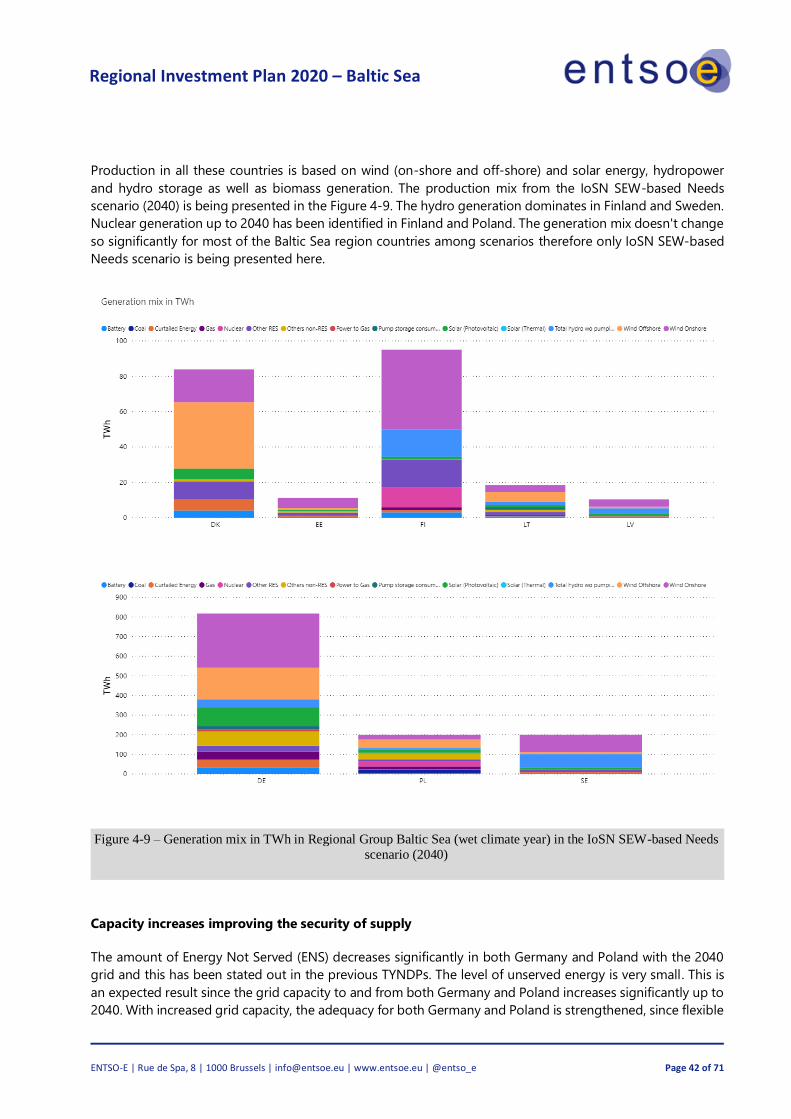
Regional Investment Plan 2020 – Baltic Sea
ENTSO-E | Rue de Spa, 8 | 1000 Brussels | [email protected] | www.entsoe.eu | @entso_e Page 42 of 71
Production in all these countries is based on wind (on-shore and off-shore) and solar energy, hydropower
and hydro storage as well as biomass generation. The production mix from the IoSN SEW-based Needs
scenario (2040) is being presented in the Figure 4-9. The hydro generation dominates in Finland and Sweden.
Nuclear generation up to 2040 has been identified in Finland and Poland. The generation mix doesn't change
so significantly for most of the Baltic Sea region countries among scenarios therefore only IoSN SEW-based
Needs scenario is being presented here.
Figure 4-9 – Generation mix in TWh in Regional Group Baltic Sea (wet climate year) in the IoSN SEW-based Needs
scenario (2040)
Capacity increases improving the security of supply
The amount of Energy Not Served (ENS) decreases significantly in both Germany and Poland with the 2040
grid and this has been stated out in the previous TYNDPs. The level of unserved energy is very small. This is
an expected result since the grid capacity to and from both Germany and Poland increases significantly up to
2040. With increased grid capacity, the adequacy for both Germany and Poland is strengthened, since flexible
Regional Investment Plan 2020 – Baltic Sea
ENTSO-E | Rue de Spa, 8 | 1000 Brussels | [email protected] | www.entsoe.eu | @entso_e Page 43 of 71
hydropower from the Nordic and Baltic countries could be used to reduce grid pressures in Central Europe.
In all other countries, the ENS is already very small and this is due to the large amount of flexible hydropower
capacity as well as an already large degree of interconnection between countries compared to other regions.
Some amounts of ENS could be expected in Norway, which is unlikely to be due to the abundance of flexible
hydropower.
By the way the current IoSN study did not focus on analyzing Energy Not Served (ENS), meaning the amount
of final demand that cannot be supplied within a region due to a deficiency of generation or interconnector
capacity. Studying ENS requires complex and time-consuming analysis with multiple climate years to obtain
reliable values. Based on these small numbers, unserved energy is not considered to be a very important
indicator of the need for more interconnector capacity. In addition, the new European Resource Adequacy
Assessment (ERAA) substituting the former Mid Term Adequacy Forecast (MAF 2019) will address this topic
in detail. The first ERAA release will be published in 2021 and will analyze up to the 2030 horizon.
5. ADDITIONAL REGIONAL STUDIES AND MAF
STUDY
This chapter gives an overview, important background and the main outcomes about the most interesting
studies performed outside the ENTSO-E RGBS cooperation.
5.1 Baltic synchronisation
For historical reasons, the Baltic States currently operate in synchronous mode with the Russian and
Belarussian electricity systems (IPS/UPS), forming the so-called BRELL-ring (Belarus-Russia-Estonia-Latvia-
Lithuania). The energy policy of the Baltic States is integrated with the energy strategy of the EU and must
comply with major objectives such as sustainable development, electricity market competitiveness and
security of supply. Additional to the objectives mentioned above, the Baltic States have to continue
developing competitive and fully integrated electricity markets, along with a sufficiently developed energy
infrastructure to connect the distributed RES (wind, biomass and biogas, solar etc.), possible high capacity
power plants and meet a Barcelona criterion (10-15%) on interconnectors of capacity for cross-sections up to
2030 and towards 2050. Baltic States must ensure Clean energy for all Europeans package implementation
and fulfil all directives linked to EU energy sector.
Subsequently, the Baltic States have politically endorsed the synchronisation of the Baltic States’ power
systems with CEN as a common strategic goal. In 2014 the three Baltic TSOs proposed a roadmap for de-
synchronisation from the IPS/UPS and synchronisation with the CEN. Following a request by the EC, an initial
assessment carried out by ENTSO-E in 2015 concluded that synchronisation with CEN would be technically
feasible. However, it was not thought to be economically profitable (based only on traditional cost/benefit
evaluations and without considering geopolitical aspects, among them SoS in a high-level strategic
perspective). In 2015 the EC and the involved Member States of the Baltic Sea Region concluded a
Memorandum of Understanding on the reinforced Baltic Energy Market Interconnection Plan (BEMIP) and at
the end of 2015, the EC – with the assistance of the Joint Research Centre (JRC) and in cooperation with
ENTSO-E and the involved TSOs – launched a study on the ‘Integration of the Baltic States into the EU
electricity system: The study was completed in 2017 and concludes that among the examined synchronisation
Regional Investment Plan 2020 – Baltic Sea
ENTSO-E | Rue de Spa, 8 | 1000 Brussels | [email protected] | www.entsoe.eu | @entso_e Page 44 of 71
options, the CEN option clearly emerges as the most technically feasible and most cost-effective. Also in 2017
– as a further step towards synchronisation of the power systems of Baltic countries into the interconnected
networks of CE – three Baltic TSOs in cooperation with Tractebel has performed the multi-disciplinary study
of isolated operation of the Baltic power system. In this study, the technical, economic, legal and
organisational aspects of isolated operation of power systems of Baltic countries were investigated in
preparation for a real-life isolated test operation of power systems of Baltic countries. It was scheduled to
take place in 2019. In the scheduled time frame the real-life isolated test operation for Baltic States was
cancelled due to fact that Russian TSO very close to the same time frame did real-life isolated test operation
for Kaliningrad area. According to this action and to ensure a security in power system the Baltic States real-
life isolated operation test has been postponed to unknown time schedule when all preparatory works will be
done, and permits received.
In 2017-2018 Baltic States TSOs and PSE together with Institute of Power Engineering in Gdansk has
performed Dynamic Study of Extension of the Synchronous Area Continental Europe for the Baltic States
Transmission Systems, identifying several Baltic States synchronization with CEN scenarios. After that Baltic
States TSOs together with ENTSO-E and PSE has performed the Study assessing the frequency stability of
synchronously interconnected Baltic States and Continental European electricity network. Three
interconnection scenarios (identified from previous Dynamic study - through existing AC line, AC + additional
AC line and AC + additional DC line) including evaluation of working in synchronous and isolated modes were
analysed. The measures were identified, such as inertia and must run units, necessary market limitations
identified. According to ENTSO-E TYNDP the socio-economic loses of market limitations, CAPEX and OPEX
for inertia and must run units calculated.
In 2018 the Baltic States TSOs together with PSE and Institute of Power Engineering in Gdansk did a study for
identification of Necessary Measures and their Associated Costs for Securing the Safe Operation of the Baltic
States Transmission System after synchronization with the Continental Europe Synchronous Area. Together
they assessed AC + additional DC (via the existing double circuit 400 kV overhead AC line and a new
submarine HVDC link, Harmony link, 700 MW) socio-economic scenario optimised and calculated using
advanced measures as EPC, FFR, DSR and other.
In the second part of 2018 BEMIP High-level group and EC politically approved Baltic States synchronization
with power system of Continental Europe. The project received the "green light" and ENTSO-E was nominated
to start all processual activities for synchronisation process. Baltic TSOs – Litgrid, AST and Elering, submitted
application to Polish TSO – PSE, with request of expansion of Continental Europe Synchronous zone with
Baltic power systems, whereas PSE submitted application with Baltic TSOs request to Regional Group
Continental Europe plenary group. Continental Europe defines the rights and obligations for Baltic States
TSOs and Poland in implementing the necessary measures that will make it possible to connect the Baltic
power systems for synchronous operation with the CEN. The catalogue of measures (CoM) defines indicators
and measures which will ensure the operation of the power transmission systems of each Baltic State - related
to frequency management, activity planning and accountability and reliable operation of the transmission
system.
Very important year from project development point of view was 2018, when based on technical studies,
prepared by Baltic TSOs together with Polish TSO, the synchronization scenario has been selected (AC +
additional DC line – Harmony link, 700 MW), as well as identified list of measures, to be done before
synchronization, taking into account possible Baltic States synchronization with EU. Following this, on 28th of
June 2018 the EC President J.-C. Juncker together with the Heads of State or Government of Lithuania, Latvia,
Estonia and Poland agreed on the Political Roadmap for synchronising the Baltic States electricity grid with
the continental European network by the target date of 2025. The Roadmap which previously was signed and
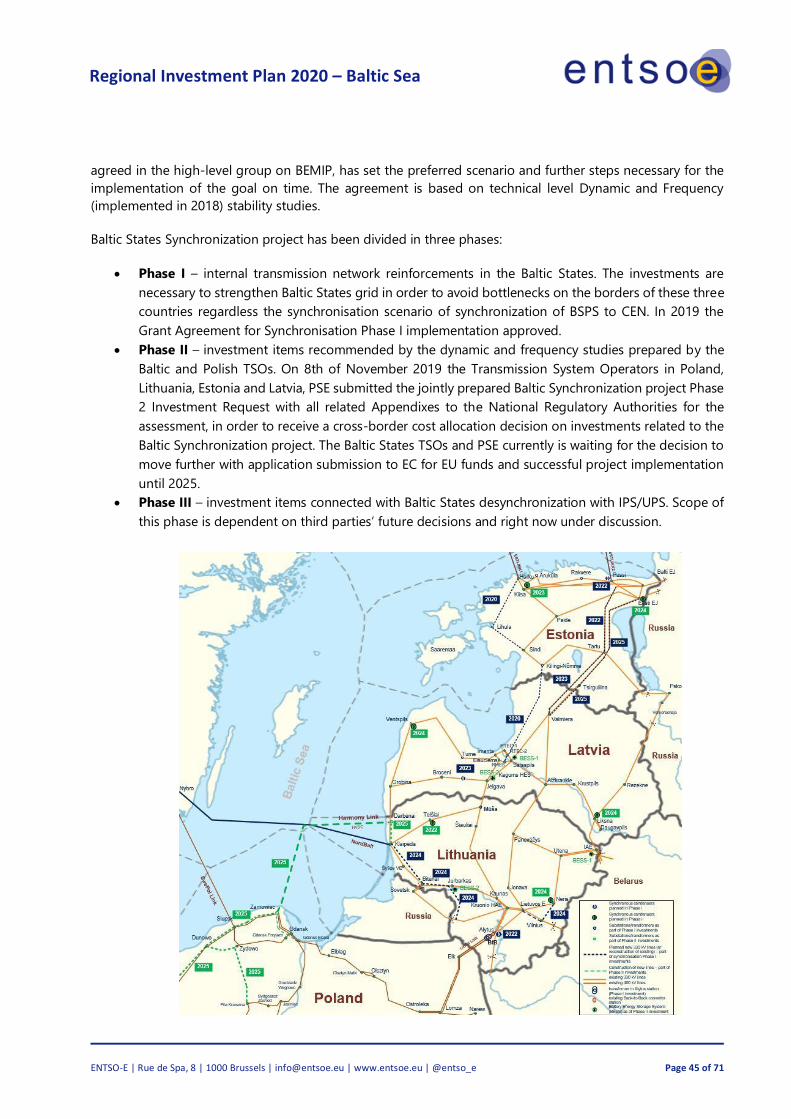
Regional Investment Plan 2020 – Baltic Sea
ENTSO-E | Rue de Spa, 8 | 1000 Brussels | [email protected] | www.entsoe.eu | @entso_e Page 45 of 71
agreed in the high-level group on BEMIP, has set the preferred scenario and further steps necessary for the
implementation of the goal on time. The agreement is based on technical level Dynamic and Frequency
(implemented in 2018) stability studies.
Baltic States Synchronization project has been divided in three phases:
• Phase I – internal transmission network reinforcements in the Baltic States. The investments are
necessary to strengthen Baltic States grid in order to avoid bottlenecks on the borders of these three
countries regardless the synchronisation scenario of synchronization of BSPS to CEN. In 2019 the
Grant Agreement for Synchronisation Phase I implementation approved.
• Phase II – investment items recommended by the dynamic and frequency studies prepared by the
Baltic and Polish TSOs. On 8th of November 2019 the Transmission System Operators in Poland,
Lithuania, Estonia and Latvia, PSE submitted the jointly prepared Baltic Synchronization project Phase
2 Investment Request with all related Appendixes to the National Regulatory Authorities for the
assessment, in order to receive a cross-border cost allocation decision on investments related to the
Baltic Synchronization project. The Baltic States TSOs and PSE currently is waiting for the decision to
move further with application submission to EC for EU funds and successful project implementation
until 2025.
• Phase III – investment items connected with Baltic States desynchronization with IPS/UPS. Scope of
this phase is dependent on third parties’ future decisions and right now under discussion.

Regional Investment Plan 2020 – Baltic Sea
ENTSO-E | Rue de Spa, 8 | 1000 Brussels | [email protected] | www.entsoe.eu | @entso_e Page 46 of 71
Figure 5-1 – Topology of the investments for Baltic States and Poland included in the Phase I and Phase II
of Baltic Synchronisation project
The list of Projects of Common Interest has been developed on the basis of the European Parliament and
Council Regulation (EU) No.347/2013 from 17 of April 2013 on guidelines for trans-European energy
infrastructure and repealing Decision No 1364/2006/EC and amending Regulation (EC) No 713/2009, (EC) No
714/2009 and (EC) 715/2009. Baltic synchronisation cluster is included in the third PCI list with No. 4.8 under
the corridor, which includes the Baltic Sea Region projects from the Nordic countries, the Baltic States, Poland
and Germany. The synchronisation Project 4.8 is named Integration and synchronisation of the Baltic States’
electricity system with the European networks. Currently, the draft version of fourth (4th) PCI list is being
prepared by EC. Each of the synchronisation project Phase II planned investment item (except LV and LT BESS)
is included as a candidate for fourth PCI list, under the same 4.8 cluster. The inclusion of investment items
related to synchronisation to the list of updated PCI’s enhances the importance of synchronisation project for
the whole Baltic Sea region and for Europe as well.
Currently, one of the most serious challenge standing in the way of the synchronisation project development
is the unclear solutions regarding the operation and status of the Kaliningrad electrical enclave (part of the
Russian power system). This issue will require a lot of political willpower and might influence the technical
outcomes and schedule of the synchronisation process. Due to this Baltic States TSOs has keep in mind and
planned some unexpected investments which could appear during project implementation and can be
allocated under Phase III of Baltic Synchronization project.
5.2 ENTSO-E Mid Term Adequacy Forecast (MAF) 2019
The MAF is a pan-European monitoring assessment of power system resource adequacy spanning a
timeframe from one to ten years ahead. It is based upon a state-of-the-art probabilistic analysis, aiming to
provide stakeholders with comprehensive support to take qualified decisions. Over the past decade, the
ENTSO-E has been improving its methodologies and will continue to ensure that further progress is made.
MAF contributes to the harmonisation of resource adequacy methodologies across Europe by being a
reference study for European TSOs and a target approach for the TYNDP and Seasonal Outlook studies. The
MAF aims to provide stakeholders with the data necessary to make informed, quality decisions and promote
the development of the European power system in a reliable, sustainable and connected way.
The MAF 2019 focus on the target year 2021 and the second target year, i.e., 2025, was chosen as a pivotal
year for evaluating adequacy due to significant reductions in coal and nuclear capacity expected between
2021 and 2025. In the MAF 2019 the comparison to the previous years' MAF 2018 has been shown. The full
version of MAF 2019 report and all details are available on the ENTSO-E web page.
Figure below shows the estimated levels of resource adequacy for the target year 2021. It plots the Loss of
Load Expectation (LOLE (left-hand side)) and the 95th percentile of the Loss of Load Duration (LLD) that
occurred among all simulated Monte Carlo years (right-hand side). The market-modelling results for the year
2021 do not indicate significant adequacy issues in most countries. As was the case in previous adequacy
assessments, islands are vulnerable to loss of load. In RGBS the highest LOLE (h) in 2021 is expected in Sweden,
Lithuania, Poland and Latvia. The problems with LOLE in RGBS has been identified due to a data issue in
Lithuania where 400 MW of hydro turbine capacity should be reserved for FRR. These additional resources
were compensated by the removal of all thermal generation in the model and that leaded to high capacity
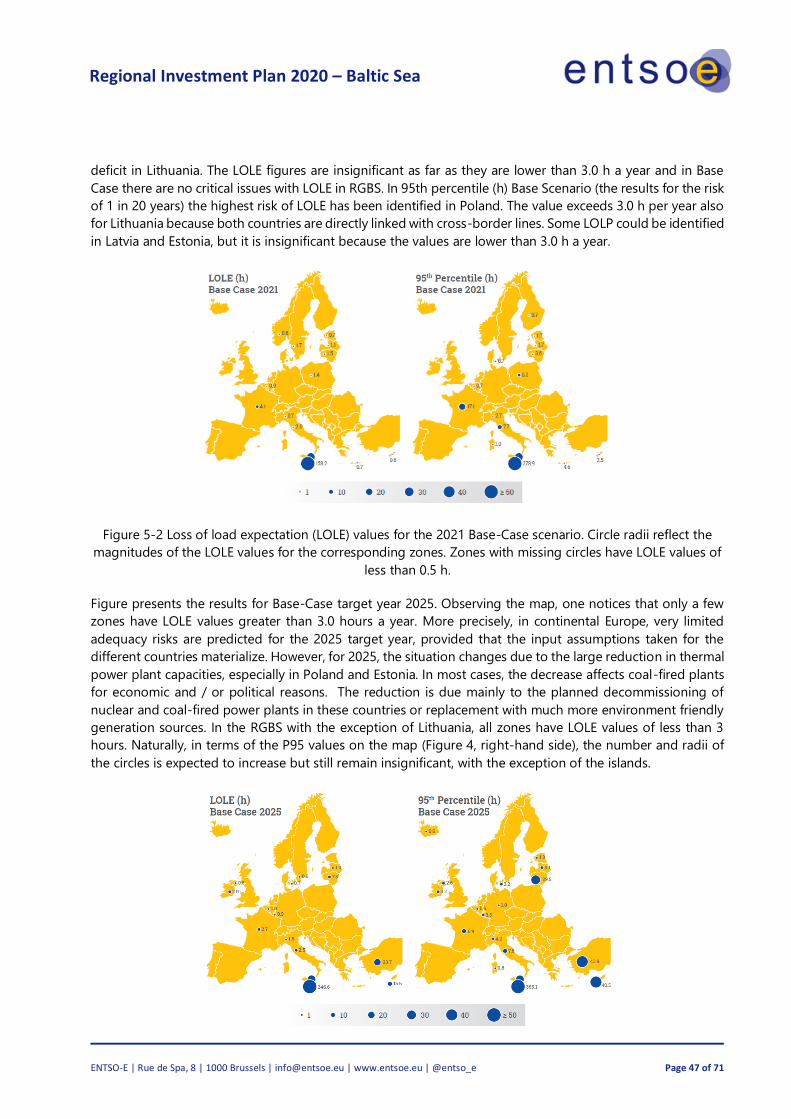
Regional Investment Plan 2020 – Baltic Sea
ENTSO-E | Rue de Spa, 8 | 1000 Brussels | [email protected] | www.entsoe.eu | @entso_e Page 47 of 71
deficit in Lithuania. The LOLE figures are insignificant as far as they are lower than 3.0 h a year and in Base
Case there are no critical issues with LOLE in RGBS. In 95th percentile (h) Base Scenario (the results for the risk
of 1 in 20 years) the highest risk of LOLE has been identified in Poland. The value exceeds 3.0 h per year also
for Lithuania because both countries are directly linked with cross-border lines. Some LOLP could be identified
in Latvia and Estonia, but it is insignificant because the values are lower than 3.0 h a year.
Figure 5-2 Loss of load expectation (LOLE) values for the 2021 Base-Case scenario. Circle radii reflect the
magnitudes of the LOLE values for the corresponding zones. Zones with missing circles have LOLE values of
less than 0.5 h.
Figure presents the results for Base-Case target year 2025. Observing the map, one notices that only a few
zones have LOLE values greater than 3.0 hours a year. More precisely, in continental Europe, very limited
adequacy risks are predicted for the 2025 target year, provided that the input assumptions taken for the
different countries materialize. However, for 2025, the situation changes due to the large reduction in thermal
power plant capacities, especially in Poland and Estonia. In most cases, the decrease affects coal-fired plants
for economic and / or political reasons. The reduction is due mainly to the planned decommissioning of
nuclear and coal-fired power plants in these countries or replacement with much more environment friendly
generation sources. In the RGBS with the exception of Lithuania, all zones have LOLE values of less than 3
hours. Naturally, in terms of the P95 values on the map (Figure 4, right-hand side), the number and radii of
the circles is expected to increase but still remain insignificant, with the exception of the islands.
Regional Investment Plan 2020 – Baltic Sea
ENTSO-E | Rue de Spa, 8 | 1000 Brussels | [email protected] | www.entsoe.eu | @entso_e Page 48 of 71
Figure 5-3 – Loss of load expectation (LOLE) values for the 2025 Base-Case scenario. Circle radii reflect the
magnitudes of the LOLE values for the corresponding zones. Zones with missing circles have LOLE values of
less than 0.5 h. *In these maps, outliers were removed before averaging the results of all tools for the zones
consisting of Cyprus, Sicily, Lithuania and Turkey. Input data for Iceland have not been updated since MAF
2018, thus outcomes remain the same.
Plotting the results of the two investigated scenarios, 2021 and 2025, side-by-side allows a better exploration
of the evolution of adequacy, as anticipated by the MAF models. In the RGBS for a few zones, it is observed
that changes between 2021 and 2025 have impacts on ensuring adequacy. This is the case for Lithuania where
LOLE values show increases of over 6 hours. For the rest of RGBS countries the increase of LOLE is not so
critical. It is observed the reduction of LOLE for Poland in 2025 and it is due to new generation developments
and transmission network strengthening.
5.3 Challenges and opportunities for the Nordic power
system
The Nordic TSO are working together with their stakeholders to address the common challenges identified
in the 2016 report "Challenges and opportunities for the Nordic Power System". This report identified
challenges within the five areas of system flexibility, transmission and generation adequacy, frequency quality
and inertia. The key solutions needed to meet the challenges in the Nordic power system in the period leading
up to 2025 were identified in the 2018 report "The way forward - Solutions report". The Nordic TSOs have
updated the Solutions report and it was published in spring 2020.
The expected changes in the Nordic power system identified in 2016 have progressed in a much faster pace
than expected. At the same time, the Nordic TSOs and their stakeholders have been successful in progressing
with several important solutions previously identified. For example, the Regional Security Coordinator (RSC)
office has been established and today it provides the first versions of four out of the five core services
identified in the previous report. The work related to the Nordic Balancing Model (NBM), which will renew the
Nordic balancing process, continues. In close cooperation with stakeholders, through the stakeholder
reference group, the Nordic TSOs have drafted a roadmap that considers the complexity of shifting from a
one hour imbalance settlement to 15 minutes imbalance settlement, implementing a single price settlement
model and establishing several other balancing tools for the future. The Nordic TSOs and their stakeholders
have also accelerated work related to coping with low inertia situations since the system has changed more
rapidly than expected. It was determined that the most cost-efficient way to cope with the low inertia
situations is to establish a new reserve, Fast Frequency Reserve (FFR). The Nordic TSOs have started publishing
the real-time value of the inertia in the Nordic power system to enable market participants to evaluate the
need and future market of the FFR. The Solution Reports will continue to be updated every other year to
ensure the challenges are still the same and that the prioritized solutions continue to be the right ones.
The report can be found here: Solutions Report 2020
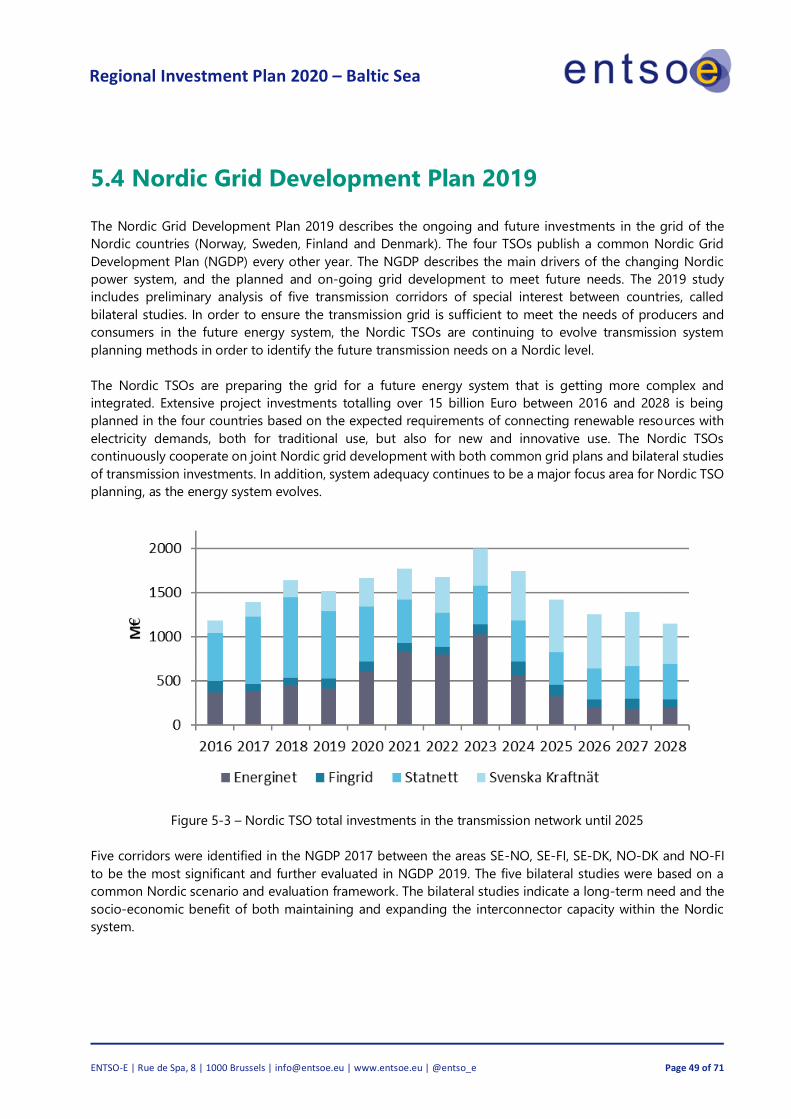
Regional Investment Plan 2020 – Baltic Sea
ENTSO-E | Rue de Spa, 8 | 1000 Brussels | [email protected] | www.entsoe.eu | @entso_e Page 49 of 71
5.4 Nordic Grid Development Plan 2019
The Nordic Grid Development Plan 2019 describes the ongoing and future investments in the grid of the
Nordic countries (Norway, Sweden, Finland and Denmark). The four TSOs publish a common Nordic Grid
Development Plan (NGDP) every other year. The NGDP describes the main drivers of the changing Nordic
power system, and the planned and on-going grid development to meet future needs. The 2019 study
includes preliminary analysis of five transmission corridors of special interest between countries, called
bilateral studies. In order to ensure the transmission grid is sufficient to meet the needs of producers and
consumers in the future energy system, the Nordic TSOs are continuing to evolve transmission system
planning methods in order to identify the future transmission needs on a Nordic level.
The Nordic TSOs are preparing the grid for a future energy system that is getting more complex and
integrated. Extensive project investments totalling over 15 billion Euro between 2016 and 2028 is being
planned in the four countries based on the expected requirements of connecting renewable resources with
electricity demands, both for traditional use, but also for new and innovative use. The Nordic TSOs
continuously cooperate on joint Nordic grid development with both common grid plans and bilateral studies
of transmission investments. In addition, system adequacy continues to be a major focus area for Nordic TSO
planning, as the energy system evolves.
Figure 5-3 – Nordic TSO total investments in the transmission network until 2025
Five corridors were identified in the NGDP 2017 between the areas SE-NO, SE-FI, SE-DK, NO-DK and NO-FI
to be the most significant and further evaluated in NGDP 2019. The five bilateral studies were based on a
common Nordic scenario and evaluation framework. The bilateral studies indicate a long-term need and the
socio-economic benefit of both maintaining and expanding the interconnector capacity within the Nordic
system.

Regional Investment Plan 2020 – Baltic Sea
ENTSO-E | Rue de Spa, 8 | 1000 Brussels | [email protected] | www.entsoe.eu | @entso_e Page 50 of 71
Figure 5-4 – Nordic corridors that were analysed in the 2019 Nordic Grid Development Plan
The most important messages of the Nordic plan summarised below:
• Many transmission projects are being built and commissioned. The main drivers are the integration
of an increasing number of renewables, security of supply and market integration with entailed socio-
economic welfare gains.
• There is an historically high level of investment in the Nordic region (Figure 5-3). The Nordic TSOs
expect to invest more than 15 billion Euro from 2016 to 2028.
• Variability of electricity production and consumption drives up the benefit of interconnectors in the
bilateral analysis.
• The Nordic power system is getting more complex and interconnected due to the growth in
renewable resources.
The full study can be found here: Nordic Grid Development Plan
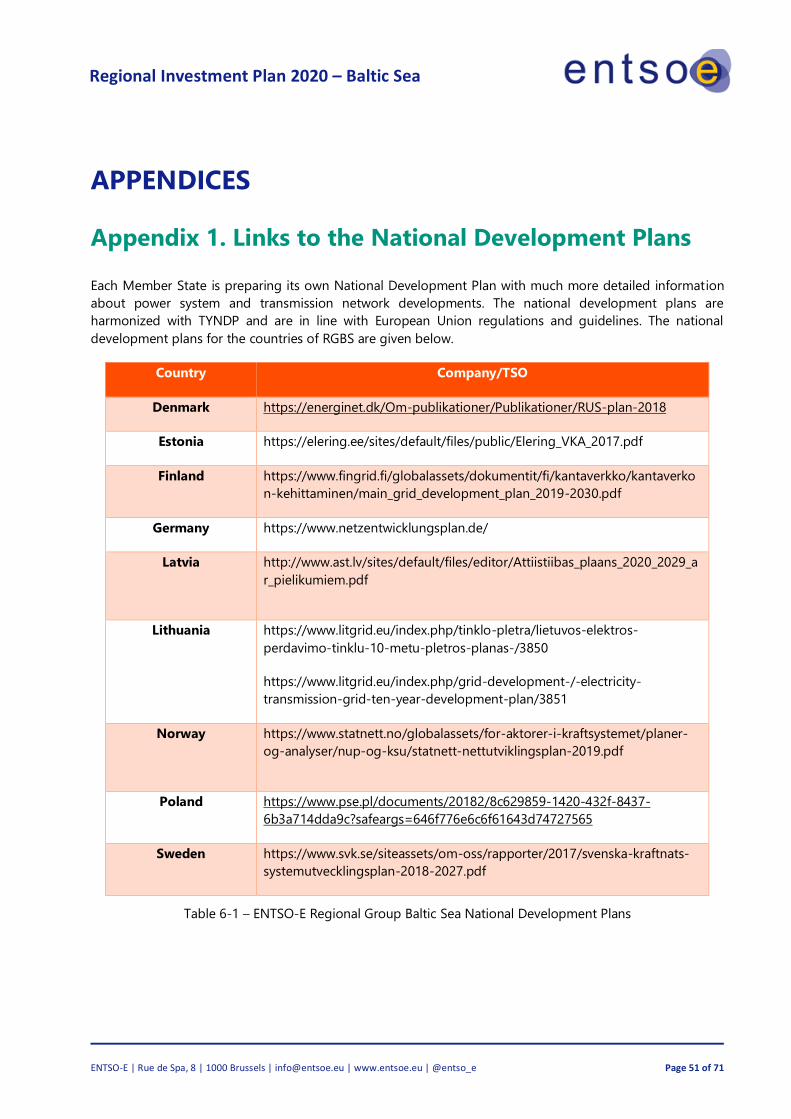
Regional Investment Plan 2020 – Baltic Sea
ENTSO-E | Rue de Spa, 8 | 1000 Brussels | [email protected] | www.entsoe.eu | @entso_e Page 51 of 71
APPENDICES
Appendix 1. Links to the National Development Plans
Each Member State is preparing its own National Development Plan with much more detailed information
about power system and transmission network developments. The national development plans are
harmonized with TYNDP and are in line with European Union regulations and guidelines. The national
development plans for the countries of RGBS are given below.
Country Company/TSO
Denmark https://energinet.dk/Om-publikationer/Publikationer/RUS-plan-2018
Estonia https://elering.ee/sites/default/files/public/Elering_VKA_2017.pdf
Finland https://www.fingrid.fi/globalassets/dokumentit/fi/kantaverkko/kantaverko
n-kehittaminen/main_grid_development_plan_2019-2030.pdf
Germany https://www.netzentwicklungsplan.de/
Latvia
http://www.ast.lv/sites/default/files/editor/Attiistiibas_plaans_2020_2029_a
r_pielikumiem.pdf
Lithuania https://www.litgrid.eu/index.php/tinklo-pletra/lietuvos-elektros-
perdavimo-tinklu-10-metu-pletros-planas-/3850
https://www.litgrid.eu/index.php/grid-development-/-electricity-
transmission-grid-ten-year-development-plan/3851
Norway
https://www.statnett.no/globalassets/for-aktorer-i-kraftsystemet/planer-
og-analyser/nup-og-ksu/statnett-nettutviklingsplan-2019.pdf
Poland https://www.pse.pl/documents/20182/8c629859-1420-432f-8437-
6b3a714dda9c?safeargs=646f776e6c6f61643d74727565
Sweden https://www.svk.se/siteassets/om-oss/rapporter/2017/svenska-kraftnats-
systemutvecklingsplan-2018-2027.pdf
Table 6-1 – ENTSO-E Regional Group Baltic Sea National Development Plans
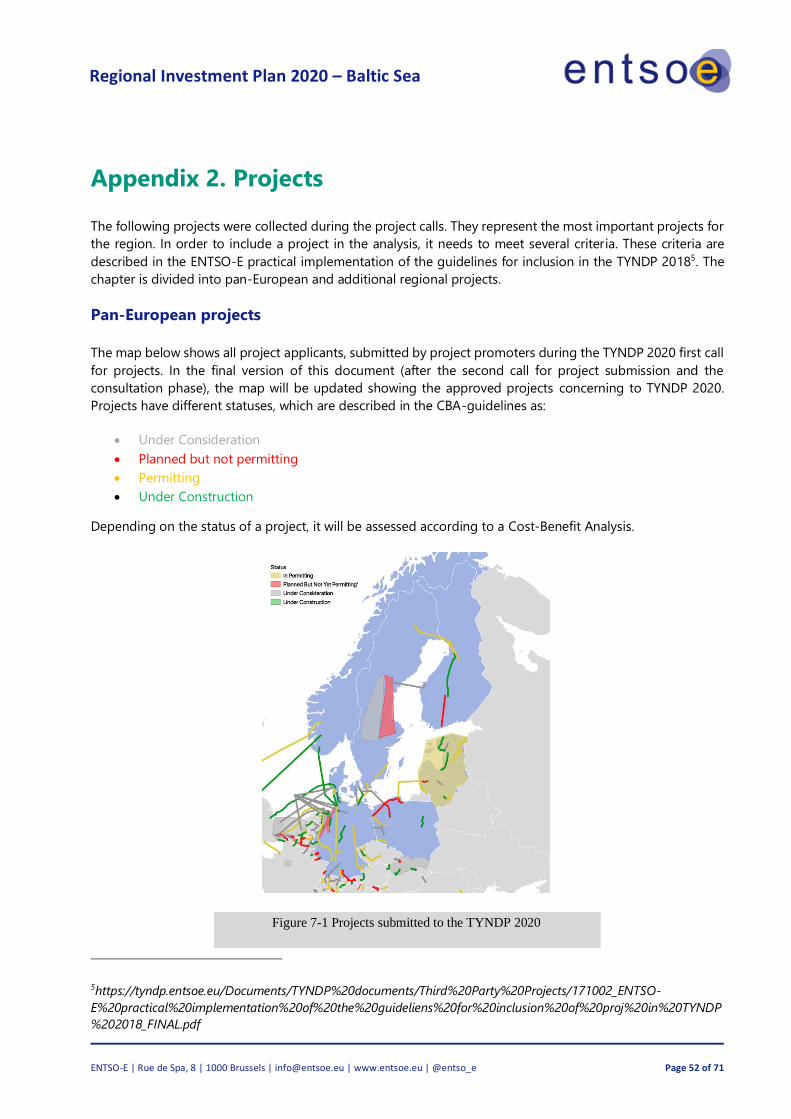
Regional Investment Plan 2020 – Baltic Sea
ENTSO-E | Rue de Spa, 8 | 1000 Brussels | [email protected] | www.entsoe.eu | @entso_e Page 52 of 71
Appendix 2. Projects
The following projects were collected during the project calls. They represent the most important projects for
the region. In order to include a project in the analysis, it needs to meet several criteria. These criteria are
described in the ENTSO-E practical implementation of the guidelines for inclusion in the TYNDP 20185. The
chapter is divided into pan-European and additional regional projects.
Pan-European projects
The map below shows all project applicants, submitted by project promoters during the TYNDP 2020 first call
for projects. In the final version of this document (after the second call for project submission and the
consultation phase), the map will be updated showing the approved projects concerning to TYNDP 2020.
Projects have different statuses, which are described in the CBA-guidelines as:
• Under Consideration
• Planned but not permitting
• Permitting
• Under Construction
Depending on the status of a project, it will be assessed according to a Cost-Benefit Analysis.
Figure 7-1 Projects submitted to the TYNDP 2020
5https://tyndp.entsoe.eu/Documents/TYNDP%20documents/Third%20Party%20Projects/171002_ENTSO-
E%20practical%20implementation%20of%20the%20guideliens%20for%20inclusion%20of%20proj%20in%20TYNDP
%202018_FINAL.pdf

Regional Investment Plan 2020 – Baltic Sea
ENTSO-E | Rue de Spa, 8 | 1000 Brussels | [email protected] | www.entsoe.eu | @entso_e Page 53 of 71
Regional projects
In this chapter, the Baltic Sea projects of ‘regional’ and ‘national’ significance are listed, as they need the
substantial and inherent support of the pan-European projects in order to be included into the future
transmission systems. All these projects include appropriate descriptions, the main driver, why they are
designed to be realised in the future scenarios, together with the expected commissioning dates and
evolution drivers in case they were introduced in the past RegIPs.
There are no criteria for the regional significance projects included in this list. They are included based purely
on the project promoter’s decision as to whether the project is relevant to.
The table below lists the projects of regional and national significance in the Baltic Sea region.

Regional Investment Plan 2020 – Baltic Sea
ENTSO-E | Rue de Spa, 8 | 1000 Brussels | [email protected] | www.entsoe.eu | @entso_e Page 54 of 71
Country
Project
Name
Investment Expected
Commiss
-ioning
year
Description
Main
Drivers
Status in
RepIP 2017
Status in
RepIP 2020 From To
Finland Huittinen-
Forssa 400 kV +
110 kV
Huittinen (FI) Forssa (FI) 2025
New 400 kV + 110 kV AC OHL
(one circuit each
voltage level) of 69
km between
substations Huittinen
and Forssa.
Security of
supply
Not
included
Finland Länsisal
mi-
Viikinmäk
i 400 kV
cable and
grid
reinforcem
ents in the
capital
area
Länsisalmi (FI) Viikinmäki
(FI) 2021-2035 New 400 kV cable between Länsisalmi
and Viikinmäki substations
and other grid
reinforcements in the capital
area of Finland
Security of
supply
Not
included
Finland
Fennovoima
NPP
connection
Valkeus (FI)
Lumijärvi (FI)
2028
This project involves a new double-
circuit 400 kV OHL line between
Valkeus (FI) and Lumimetsä (FI). The
new line is required for connecting the
new Fennovoimas nuclear power plant
planned to be built in Pyhäjoki. The
power plant has a planned generation
capacity of 1,200 MW. The decision to
build the connection and schedule
depends on the progress of the
Hanhikivi NPP project.
Connection
of new NPP
Not included
Norway
Voltage
upgrades
through north
and central
Norway
Will increase the capacity in the north-south direction.
Detailed information given in
Statnett’s Grid Development Plan
2017 and 2019.
Increase of
capacity
and RES
integrati
on
Not included
Not included

Regional Investment Plan 2020 – Baltic Sea
ENTSO-E | Rue de Spa, 8 | 1000 Brussels | [email protected] | www.entsoe.eu | @entso_e Page 55 of 71
Norway
Ofoten–
Balsfjord–
Skillemoen-
Skaidi
2016-2022
A new 420-kV line (ca. 450 km) will increase the
capacity in the north of Norway, mainly to serve
increased petroleum-related consumption, as well as
increase the security of supply. In addition, the project
will prepare for some new wind power production. A
line further east (Skaidi Varangerbotn)
Security of supply
and
increase
of
capacity
Not included
is under consideration; however, no decision has yet been taken.
Norway
Western
corridor
→2021/22
Voltage upgrades in the southwestern
part of Norway. The project will
increase the north-south capacity as
well as facilitate higher utilisation of
the planned interconnectors. Detailed
information given in Statnett’s Grid
Development Plan 2017 and 2019.
Increase of
capacity and
utilisation of
interconnectors
Not included
Sweden
Southwest
Link
2020
Will increase the internal Nordic capacity in
a north-south direction between areas SE3
and SE4. This will make it possible to
handle an increased amount of renewable
production
in the north part of the Nordic area as
well as increase trade on Nord-Balt and
the planned Hansa Power Bridge with
less risk for limitations. The project has
been delayed several times due to
difficulties with the implementation
phase.
Market integration,
Securit
y of
supply
Not included
Sweden
Ekhyddan –
Nybro -Hemsjö
2025
This is currently a PCI project included in the 3rd PCI list. The
project consists of a new 400 kV AC single circuit OHL of 70
km between
Ekhyddan and Nybro and a new 400 kV
AC single circuit OHL of 85 km between
Nybro and Hemsjö.
The reinforcements are necessary to fully
and securely utilise the NordBalt
interconnection that is connected in
Nybro.
Security of
supply,
Market
integrat
ion
Not included
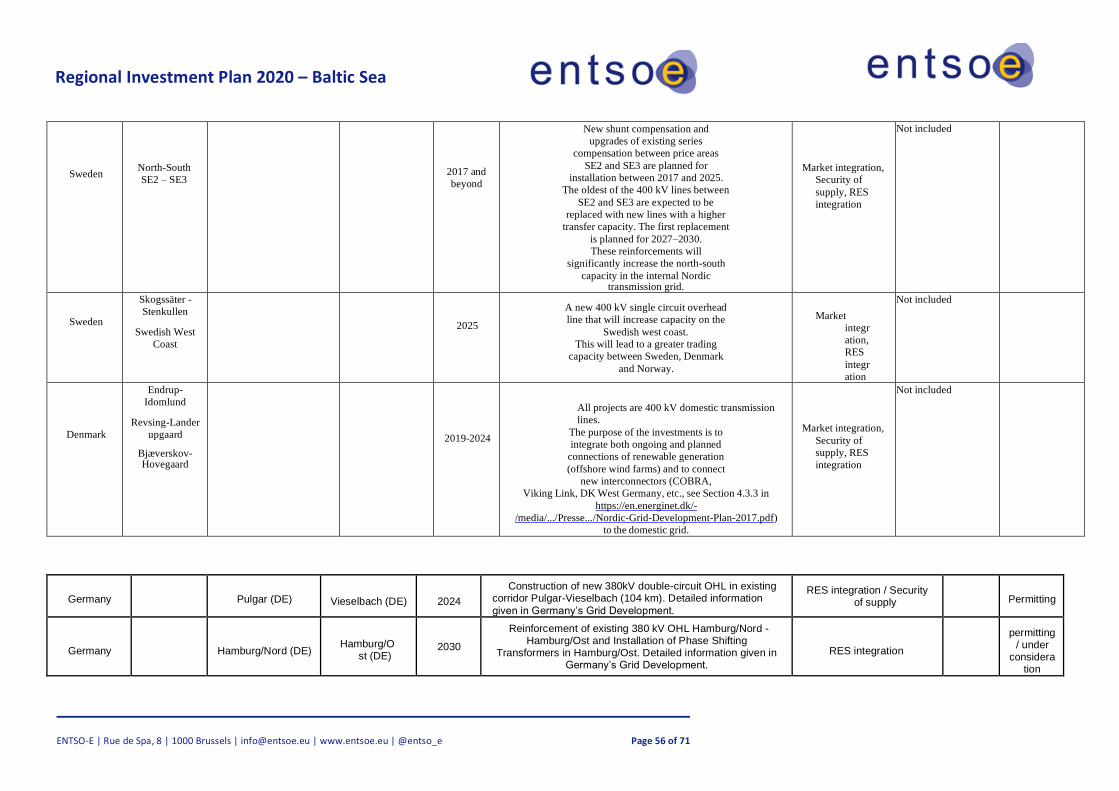
Regional Investment Plan 2020 – Baltic Sea
ENTSO-E | Rue de Spa, 8 | 1000 Brussels | [email protected] | www.entsoe.eu | @entso_e Page 56 of 71
Sweden
North-South
SE2 – SE3
2017 and
beyond
New shunt compensation and
upgrades of existing series
compensation between price areas
SE2 and SE3 are planned for
installation between 2017 and 2025.
The oldest of the 400 kV lines between
SE2 and SE3 are expected to be
replaced with new lines with a higher
transfer capacity. The first replacement
is planned for 2027–2030.
These reinforcements will
significantly increase the north-south
capacity in the internal Nordic transmission grid.
Market integration,
Security of
supply, RES
integration
Not included
Sweden
Skogssäter -
Stenkullen
Swedish West
Coast
2025
A new 400 kV single circuit overhead
line that will increase capacity on the
Swedish west coast.
This will lead to a greater trading
capacity between Sweden, Denmark
and Norway.
Market
integr
ation,
RES
integr
ation
Not included
Denmark
Endrup-
Idomlund
Revsing-Lander
upgaard
Bjæverskov- Hovegaard
2019-2024
All projects are 400 kV domestic transmission
lines.
The purpose of the investments is to
integrate both ongoing and planned
connections of renewable generation
(offshore wind farms) and to connect
new interconnectors (COBRA,
Viking Link, DK West Germany, etc., see Section 4.3.3 in
https://en.energinet.dk/-
/media/.../Presse.../Nordic-Grid-Development-Plan-2017.pdf)
to the domestic grid.
Market integration,
Security of
supply, RES
integration
Not included
Germany Pulgar (DE) Vieselbach (DE) 2024
Construction of new 380kV double-circuit OHL in existing corridor Pulgar-Vieselbach (104 km). Detailed information
given in Germany’s Grid Development.
RES integration / Security of supply Permitting
Germany Hamburg/Nord (DE) Hamburg/O
st (DE) 2030
Reinforcement of existing 380 kV OHL Hamburg/Nord - Hamburg/Ost and Installation of Phase Shifting
Transformers in Hamburg/Ost. Detailed information given in Germany’s Grid Development.
RES integration
permitting / under
consideration
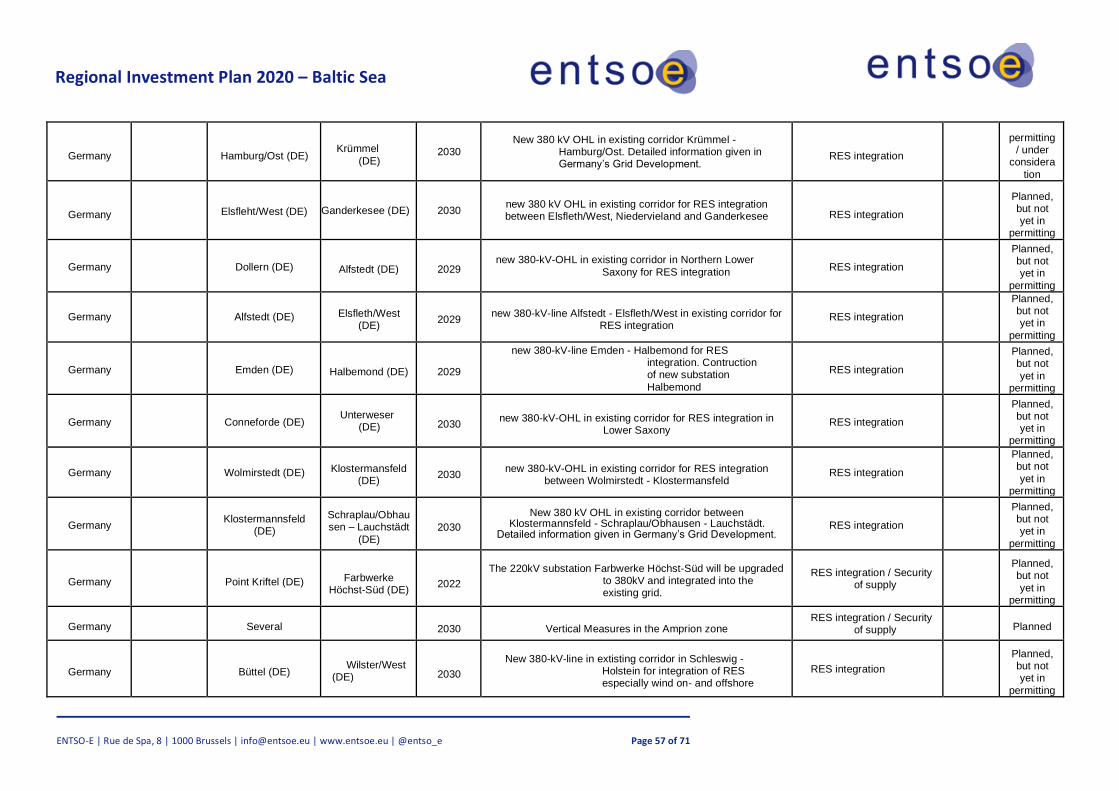
Regional Investment Plan 2020 – Baltic Sea
ENTSO-E | Rue de Spa, 8 | 1000 Brussels | [email protected] | www.entsoe.eu | @entso_e Page 57 of 71
Germany Hamburg/Ost (DE) Krümmel
(DE) 2030
New 380 kV OHL in existing corridor Krümmel - Hamburg/Ost. Detailed information given in Germany’s Grid Development.
RES integration
permitting / under
considera
tion
Germany Elsfleht/West (DE) Ganderkesee (DE) 2030 new 380 kV OHL in existing corridor for RES integration between Elsfleth/West, Niedervieland and Ganderkesee RES integration
Planned, but not yet in
permitting
Germany Dollern (DE) Alfstedt (DE) 2029 new 380-kV-OHL in existing corridor in Northern Lower
Saxony for RES integration RES integration
Planned, but not yet in
permitting
Germany Alfstedt (DE) Elsfleth/West (DE)
2029 new 380-kV-line Alfstedt - Elsfleth/West in existing corridor for
RES integration RES integration
Planned, but not yet in
permitting
Germany Emden (DE) Halbemond (DE) 2029
new 380-kV-line Emden - Halbemond for RES integration. Contruction of new substation
Halbemond
RES integration
Planned, but not
yet in permitting
Germany Conneforde (DE) Unterweser
(DE) 2030 new 380-kV-OHL in existing corridor for RES integration in
Lower Saxony RES integration
Planned, but not yet in
permitting
Germany Wolmirstedt (DE) Klostermansfeld (DE)
2030 new 380-kV-OHL in existing corridor for RES integration
between Wolmirstedt - Klostermansfeld RES integration
Planned, but not
yet in permitting
Germany Klostermannsfeld
(DE)
Schraplau/Obhausen – Lauchstädt
(DE) 2030
New 380 kV OHL in existing corridor between Klostermannsfeld - Schraplau/Obhausen - Lauchstädt.
Detailed information given in Germany’s Grid Development. RES integration
Planned, but not yet in
permitting
Germany Point Kriftel (DE) Farbwerke Höchst-Süd (DE)
2022
The 220kV substation Farbwerke Höchst-Süd will be upgraded to 380kV and integrated into the existing grid.
RES integration / Security of supply
Planned, but not
yet in permitting
Germany Several 2030 Vertical Measures in the Amprion zone RES integration / Security
of supply Planned
Germany Büttel (DE) Wilster/West
(DE) 2030
New 380-kV-line in extisting corridor in Schleswig - Holstein for integration of RES especially wind on- and offshore
RES integration
Planned, but not yet in
permitting

Regional Investment Plan 2020 – Baltic Sea
ENTSO-E | Rue de Spa, 8 | 1000 Brussels | [email protected] | www.entsoe.eu | @entso_e Page 58 of 71
Germany Brunsbüttel (DE) Büttel (DE) 2030 New 380-kV-line Brunsbüttel - Büttel in existing corridor for
RES integration RES integration
Planned, but not yet in
permitting
Germany Wilster/West (DE) Stade/West (DE) 2030 New 380-kV-line Wilster/West - Stade/West in existing
corridor for RES integration RES integration
Planned,
but not yet in
permitting
Germany junction Mehrum (DE) Mehrum (DE) 2021
New 380-kV-line junction Mehrum (line Wahle - Grohnde) - Mehrum including a 380/220-kV-transformer in Mehrum
RES integration under
constructi
on
Germany Borken (DE) Mecklar (DE) 2023 new 380-kV-line Borken - Mecklar in existing corridor for RES
integration RES integration
Planned,
but not yet in
permitting
Germany Borken (DE) Gießen (DE) 2030 new 380-kV-line Borken - Gießen in existing corridor for RES
integration RES integration
Planned, but not
yet in permitting
Germany Borken (DE) Twistetal (DE) 2023 new 380-kV-line Borken - Twistetal in existing corridor for
RES integration RES integration
Planned,
but not yet in
permitting
Germany Wahle (DE) Klein Ilsede (DE) 2021 new 380-kV-line Wahle - Klein Ilsede in existing corridor for
RES integration RES integration
under considera
tion
Germany Birkenfeld (DE) Ötisheim (DE) 2021 A new 380kV OHL Birkenfeld-Ötisheim (Mast 115A) Security of supply
Permitting
/ Under constructi
on
Germany Bürstadt (DE) BASF (DE) 2021 New line and extension of existing line to 400 kV double
circuit OHL Bürstadt - BASF including extension of existing substations.
RES integration / Security of supply
Planned, but not
yet in permitting
Germany Neuenhagen (DE) Vierraden (DE) 2022
Project of new 380kV double-circuit OHL Neuenhagen-Vierraden-Bertikow with 125km length as prerequisite for the
planned upgrading of the existing 220kV double-circuit interconnection Krajnik (PL) – Vierraden (DE Hertz
Transmission).. Detailed information given in Germany’s Grid Development.
RES integration / Security of supply
In Permitting
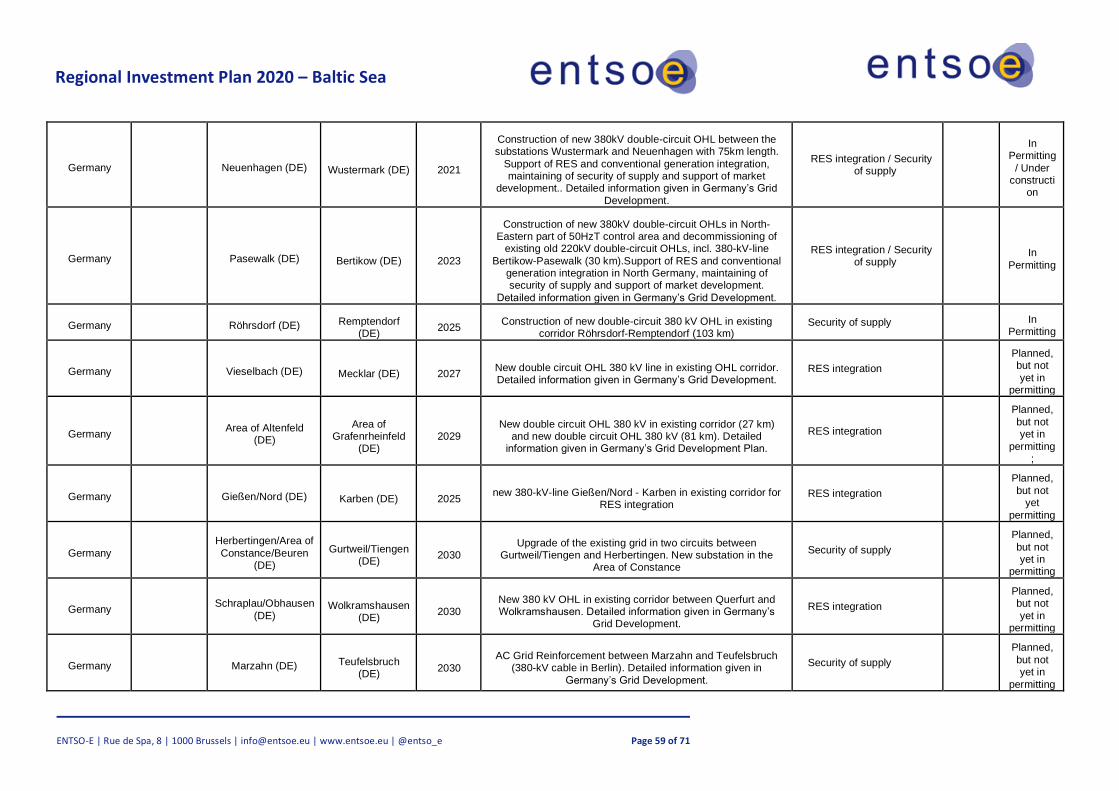
Regional Investment Plan 2020 – Baltic Sea
ENTSO-E | Rue de Spa, 8 | 1000 Brussels | [email protected] | www.entsoe.eu | @entso_e Page 59 of 71
Germany Neuenhagen (DE) Wustermark (DE) 2021
Construction of new 380kV double-circuit OHL between the substations Wustermark and Neuenhagen with 75km length.
Support of RES and conventional generation integration, maintaining of security of supply and support of market
development.. Detailed information given in Germany’s Grid
Development.
RES integration / Security of supply
In Permitting
/ Under constructi
on
Germany Pasewalk (DE) Bertikow (DE) 2023
Construction of new 380kV double-circuit OHLs in North-Eastern part of 50HzT control area and decommissioning of
existing old 220kV double-circuit OHLs, incl. 380-kV-line
Bertikow-Pasewalk (30 km).Support of RES and conventional generation integration in North Germany, maintaining of security of supply and support of market development.
Detailed information given in Germany’s Grid Development.
RES integration / Security of supply
In
Permitting
Germany Röhrsdorf (DE) Remptendorf (DE)
2025 Construction of new double-circuit 380 kV OHL in existing
corridor Röhrsdorf-Remptendorf (103 km) Security of supply
In Permitting
Germany Vieselbach (DE) Mecklar (DE) 2027 New double circuit OHL 380 kV line in existing OHL corridor. Detailed information given in Germany’s Grid Development.
RES integration
Planned, but not
yet in permitting
Germany Area of Altenfeld (DE)
Area of Grafenrheinfeld
(DE) 2029
New double circuit OHL 380 kV in existing corridor (27 km) and new double circuit OHL 380 kV (81 km). Detailed
information given in Germany’s Grid Development Plan.
RES integration
Planned,
but not yet in
permitting;
Germany Gießen/Nord (DE) Karben (DE) 2025 new 380-kV-line Gießen/Nord - Karben in existing corridor for
RES integration RES integration
Planned,
but not yet
permitting
Germany Herbertingen/Area of
Constance/Beuren (DE)
Gurtweil/Tiengen (DE)
2030 Upgrade of the existing grid in two circuits between
Gurtweil/Tiengen and Herbertingen. New substation in the Area of Constance
Security of supply
Planned,
but not yet in
permitting
Germany Schraplau/Obhausen
(DE) Wolkramshausen
(DE) 2030
New 380 kV OHL in existing corridor between Querfurt and Wolkramshausen. Detailed information given in Germany’s
Grid Development.
RES integration
Planned, but not
yet in permitting
Germany Marzahn (DE) Teufelsbruch (DE)
2030
AC Grid Reinforcement between Marzahn and Teufelsbruch (380-kV cable in Berlin). Detailed information given in
Germany’s Grid Development.
Security of supply
Planned,
but not yet in
permitting
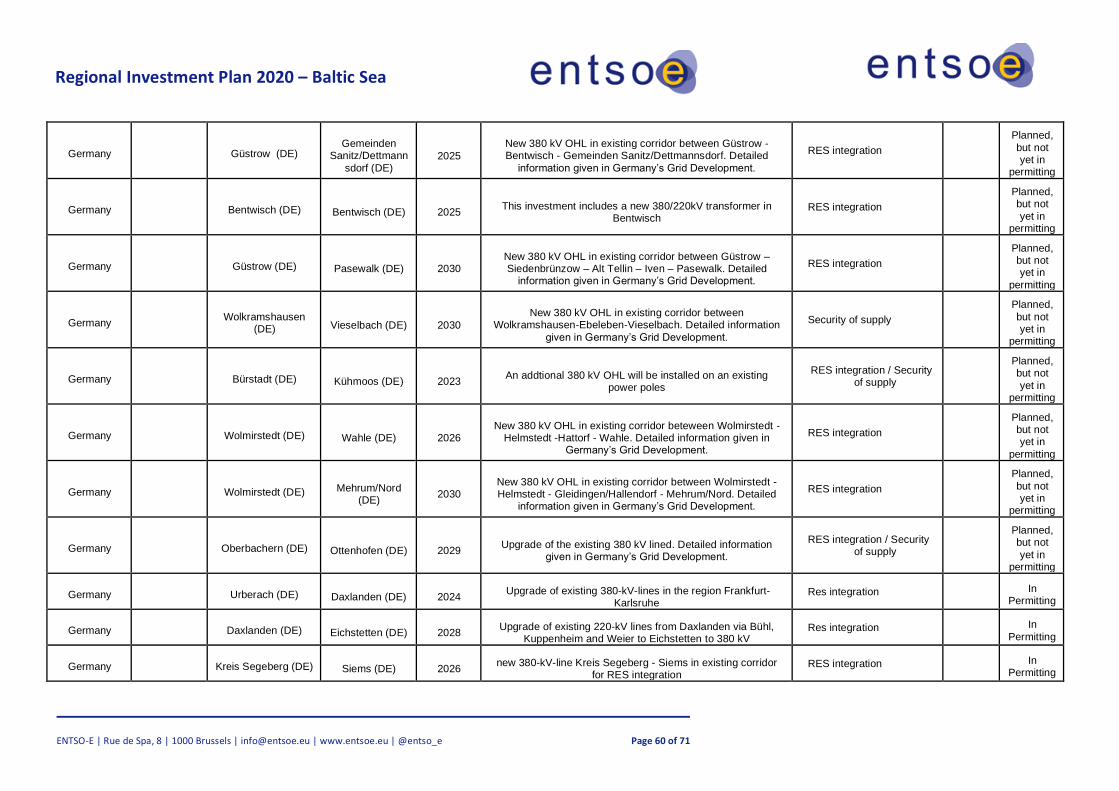
Regional Investment Plan 2020 – Baltic Sea
ENTSO-E | Rue de Spa, 8 | 1000 Brussels | [email protected] | www.entsoe.eu | @entso_e Page 60 of 71
Germany Güstrow (DE) Gemeinden
Sanitz/Dettmann
sdorf (DE) 2025
New 380 kV OHL in existing corridor between Güstrow - Bentwisch - Gemeinden Sanitz/Dettmannsdorf. Detailed
information given in Germany’s Grid Development.
RES integration
Planned,
but not yet in
permitting
Germany Bentwisch (DE) Bentwisch (DE) 2025 This investment includes a new 380/220kV transformer in
Bentwisch RES integration
Planned, but not
yet in permitting
Germany Güstrow (DE) Pasewalk (DE) 2030 New 380 kV OHL in existing corridor between Güstrow –Siedenbrünzow – Alt Tellin – Iven – Pasewalk. Detailed
information given in Germany’s Grid Development.
RES integration
Planned, but not yet in
permitting
Germany Wolkramshausen (DE) Vieselbach (DE) 2030
New 380 kV OHL in existing corridor between Wolkramshausen-Ebeleben-Vieselbach. Detailed information
given in Germany’s Grid Development.
Security of supply
Planned,
but not yet in
permitting
Germany Bürstadt (DE) Kühmoos (DE) 2023 An addtional 380 kV OHL will be installed on an existing
power poles
RES integration / Security of supply
Planned, but not
yet in permitting
Germany Wolmirstedt (DE) Wahle (DE) 2026 New 380 kV OHL in existing corridor beteween Wolmirstedt -
Helmstedt -Hattorf - Wahle. Detailed information given in Germany’s Grid Development.
RES integration
Planned, but not yet in
permitting
Germany Wolmirstedt (DE) Mehrum/Nord (DE)
2030 New 380 kV OHL in existing corridor between Wolmirstedt - Helmstedt - Gleidingen/Hallendorf - Mehrum/Nord. Detailed
information given in Germany’s Grid Development.
RES integration
Planned,
but not yet in
permitting
Germany Oberbachern (DE) Ottenhofen (DE) 2029 Upgrade of the existing 380 kV lined. Detailed information
given in Germany’s Grid Development.
RES integration / Security of supply
Planned, but not
yet in permitting
Germany Urberach (DE) Daxlanden (DE) 2024 Upgrade of existing 380-kV-lines in the region Frankfurt-
Karlsruhe Res integration
In Permitting
Germany Daxlanden (DE) Eichstetten (DE) 2028 Upgrade of existing 220-kV lines from Daxlanden via Bühl,
Kuppenheim and Weier to Eichstetten to 380 kV Res integration
In
Permitting
Germany Kreis Segeberg (DE) Siems (DE) 2026 new 380-kV-line Kreis Segeberg - Siems in existing corridor
for RES integration RES integration
In Permitting
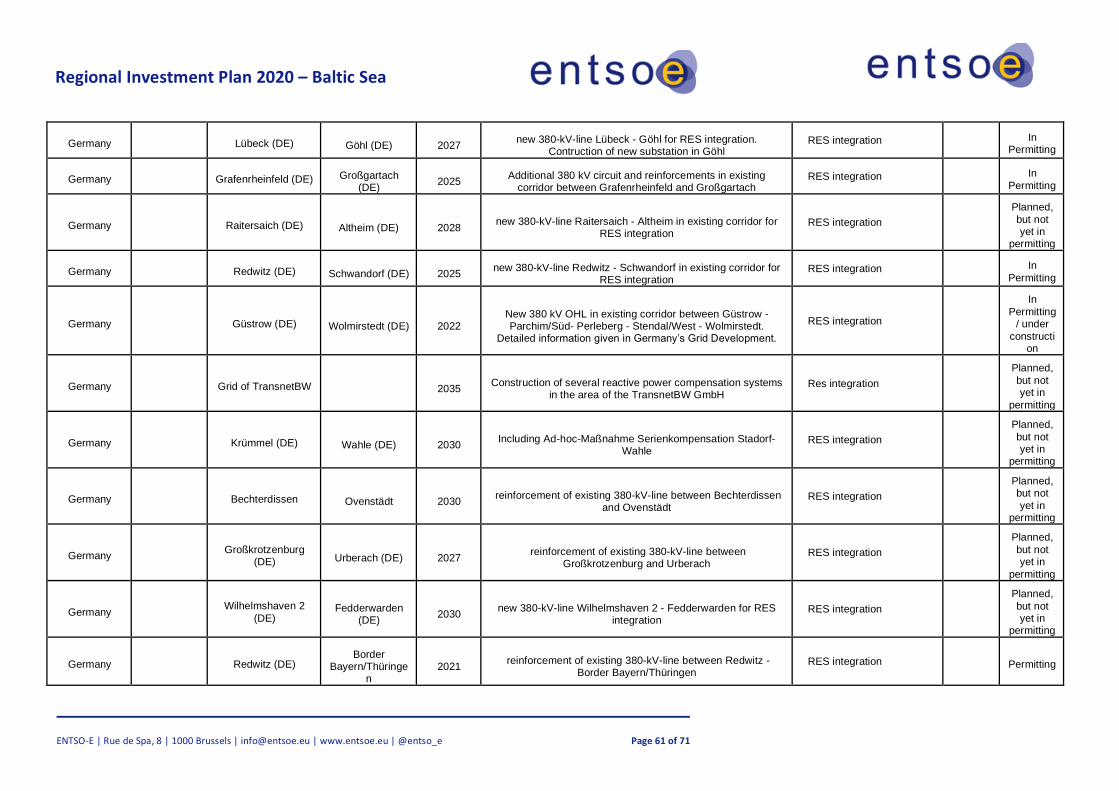
Regional Investment Plan 2020 – Baltic Sea
ENTSO-E | Rue de Spa, 8 | 1000 Brussels | [email protected] | www.entsoe.eu | @entso_e Page 61 of 71
Germany Lübeck (DE) Göhl (DE) 2027 new 380-kV-line Lübeck - Göhl for RES integration.
Contruction of new substation in Göhl RES integration
In Permitting
Germany Grafenrheinfeld (DE) Großgartach (DE)
2025 Additional 380 kV circuit and reinforcements in existing
corridor between Grafenrheinfeld and Großgartach RES integration
In
Permitting
Germany Raitersaich (DE) Altheim (DE) 2028 new 380-kV-line Raitersaich - Altheim in existing corridor for
RES integration RES integration
Planned,
but not yet in
permitting
Germany Redwitz (DE) Schwandorf (DE) 2025 new 380-kV-line Redwitz - Schwandorf in existing corridor for
RES integration RES integration
In
Permitting
Germany Güstrow (DE) Wolmirstedt (DE) 2022 New 380 kV OHL in existing corridor between Güstrow - Parchim/Süd- Perleberg - Stendal/West - Wolmirstedt.
Detailed information given in Germany’s Grid Development.
RES integration
In
Permitting / under
construction
Germany Grid of TransnetBW 2035 Construction of several reactive power compensation systems
in the area of the TransnetBW GmbH Res integration
Planned,
but not yet in
permitting
Germany Krümmel (DE) Wahle (DE) 2030 Including Ad-hoc-Maßnahme Serienkompensation Stadorf-
Wahle RES integration
Planned,
but not yet in
permitting
Germany Bechterdissen Ovenstädt 2030 reinforcement of existing 380-kV-line between Bechterdissen
and Ovenstädt RES integration
Planned, but not
yet in permitting
Germany Großkrotzenburg (DE) Urberach (DE) 2027
reinforcement of existing 380-kV-line between Großkrotzenburg and Urberach
RES integration
Planned,
but not yet in
permitting
Germany Wilhelmshaven 2
(DE) Fedderwarden
(DE) 2030
new 380-kV-line Wilhelmshaven 2 - Fedderwarden for RES integration
RES integration
Planned,
but not yet in
permitting
Germany Redwitz (DE) Border
Bayern/Thüringen
2021 reinforcement of existing 380-kV-line between Redwitz -
Border Bayern/Thüringen RES integration Permitting
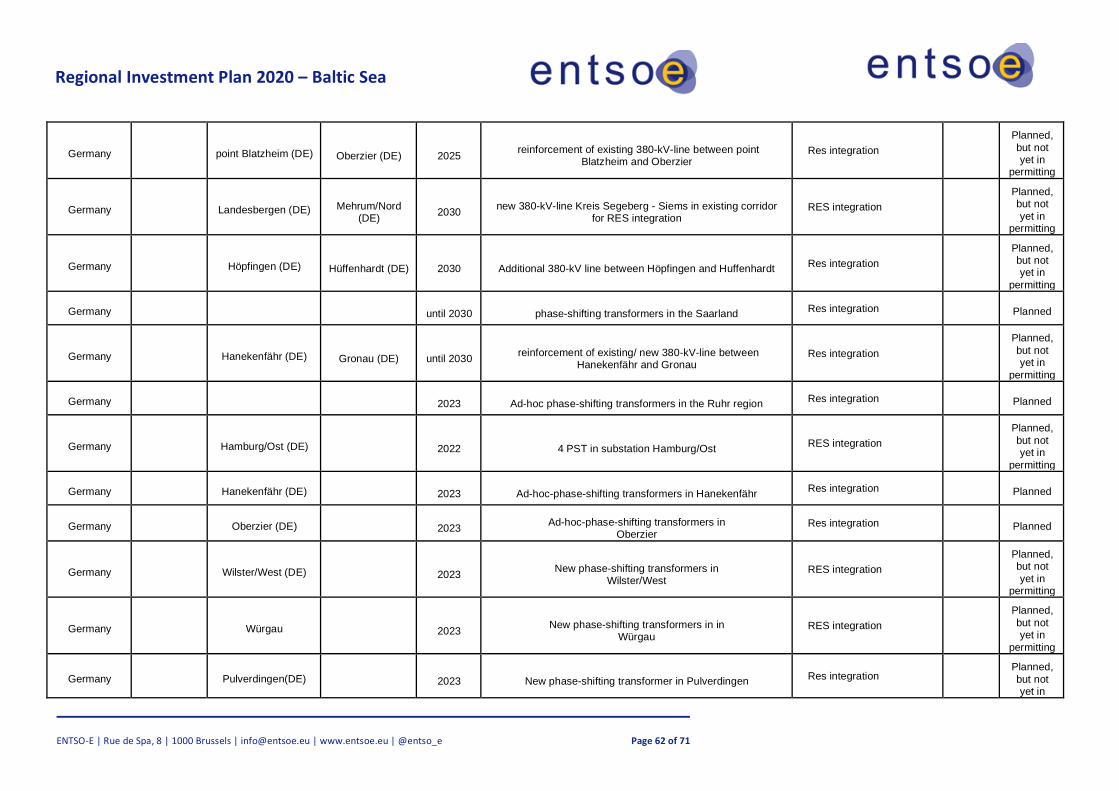
Regional Investment Plan 2020 – Baltic Sea
ENTSO-E | Rue de Spa, 8 | 1000 Brussels | [email protected] | www.entsoe.eu | @entso_e Page 62 of 71
Germany point Blatzheim (DE) Oberzier (DE) 2025 reinforcement of existing 380-kV-line between point
Blatzheim and Oberzier Res integration
Planned,
but not yet in
permitting
Germany Landesbergen (DE) Mehrum/Nord (DE)
2030 new 380-kV-line Kreis Segeberg - Siems in existing corridor
for RES integration RES integration
Planned, but not
yet in permitting
Germany Höpfingen (DE) Hüffenhardt (DE) 2030 Additional 380-kV line between Höpfingen and Huffenhardt Res integration
Planned, but not yet in
permitting
Germany until 2030 phase-shifting transformers in the Saarland Res integration Planned
Germany Hanekenfähr (DE) Gronau (DE) until 2030 reinforcement of existing/ new 380-kV-line between
Hanekenfähr and Gronau Res integration
Planned,
but not yet in
permitting
Germany 2023 Ad-hoc phase-shifting transformers in the Ruhr region Res integration Planned
Germany Hamburg/Ost (DE) 2022 4 PST in substation Hamburg/Ost RES integration
Planned,
but not yet in
permitting
Germany Hanekenfähr (DE) 2023 Ad-hoc-phase-shifting transformers in Hanekenfähr Res integration Planned
Germany Oberzier (DE) 2023 Ad-hoc-phase-shifting transformers in
Oberzier Res integration Planned
Germany Wilster/West (DE) 2023 New phase-shifting transformers in
Wilster/West RES integration
Planned, but not
yet in permitting
Germany Würgau 2023 New phase-shifting transformers in in
Würgau RES integration
Planned,
but not yet in
permitting
Germany Pulverdingen(DE) 2023 New phase-shifting transformer in Pulverdingen Res integration
Planned,
but not yet in
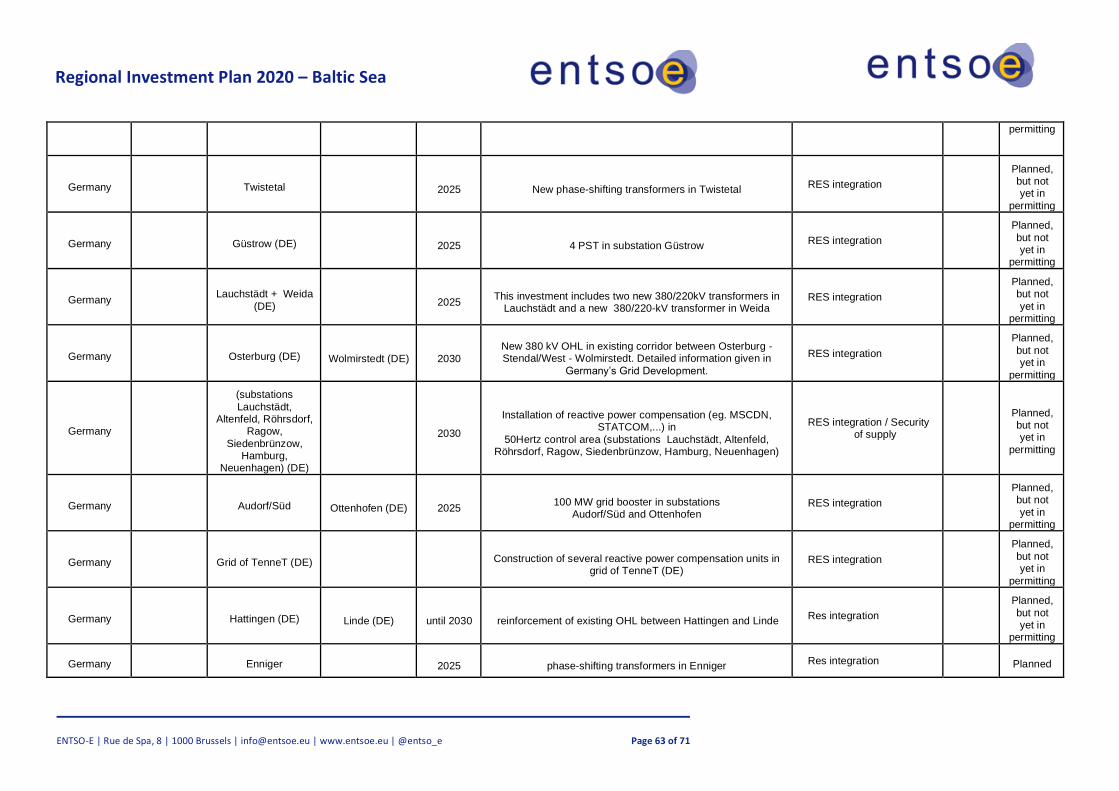
Regional Investment Plan 2020 – Baltic Sea
ENTSO-E | Rue de Spa, 8 | 1000 Brussels | [email protected] | www.entsoe.eu | @entso_e Page 63 of 71
permitting
Germany Twistetal 2025 New phase-shifting transformers in Twistetal RES integration
Planned, but not yet in
permitting
Germany Güstrow (DE) 2025 4 PST in substation Güstrow RES integration
Planned,
but not yet in
permitting
Germany Lauchstädt + Weida
(DE) 2025 This investment includes two new 380/220kV transformers in
Lauchstädt and a new 380/220-kV transformer in Weida RES integration
Planned, but not
yet in permitting
Germany Osterburg (DE) Wolmirstedt (DE) 2030
New 380 kV OHL in existing corridor between Osterburg - Stendal/West - Wolmirstedt. Detailed information given in
Germany’s Grid Development.
RES integration
Planned,
but not yet in
permitting
Germany
(substations
Lauchstädt, Altenfeld, Röhrsdorf,
Ragow,
Siedenbrünzow, Hamburg,
Neuenhagen) (DE)
2030
Installation of reactive power compensation (eg. MSCDN, STATCOM,...) in
50Hertz control area (substations Lauchstädt, Altenfeld, Röhrsdorf, Ragow, Siedenbrünzow, Hamburg, Neuenhagen)
RES integration / Security of supply
Planned, but not yet in
permitting
Germany Audorf/Süd Ottenhofen (DE) 2025 100 MW grid booster in substations
Audorf/Süd and Ottenhofen RES integration
Planned, but not
yet in permitting
Germany Grid of TenneT (DE) Construction of several reactive power compensation units in
grid of TenneT (DE) RES integration
Planned,
but not yet in
permitting
Germany Hattingen (DE) Linde (DE) until 2030 reinforcement of existing OHL between Hattingen and Linde Res integration
Planned,
but not yet in
permitting
Germany Enniger 2025 phase-shifting transformers in Enniger Res integration Planned

Regional Investment Plan 2020 – Baltic Sea
ENTSO-E | Rue de Spa, 8 | 1000 Brussels | [email protected] | www.entsoe.eu | @entso_e Page 64 of 71
Germany several reactive power compensation systems in the area of
the Amprion GmbH Res integration Planned
Germany Kühmoos Upgrade of substation Kühmoos in Southern Germany Res integration
Planned, but not
yet in permitting
Germany Kupferzell 500MW grid booster in substation Kupferzell Res integration
Planned,
but not yet in
permitting
Germany Siedenbrünzow (DE) Osterburg (DE) 2025 Siedenbrünzow – Güstrow – Putlitz – Perleberg –
Osterburg RES integration
Planned,
but not yet in
permitting
Germany Graustein (DE) Bärwalde (DE) 2025 reinforcement of existing 380 kV OHLGraustein - Bräwälde RES integration
Planned, but not
yet in permitting
Germany Ragow (DE) Streumen (DE) 2025 reinforcement of existing 380-kV-line Ragow - Streumen RES integration
Planned,
but not yet in
permitting
Germany grid reinforcements in the region Büscherhof Res integration Planned
Germany grid reinforcements in the region Aachen Res integration Planned
Germany grid reinforcements in western Rhein region Res integration Planned
Germany Conneforde (DE) Samtgemeinde Sottrum (DE)
2030 new 380-kV-line Conneforde - Sottrum in existing corridor for
RES integration RES integration
Planned, but not
yet in permitting
Germany Großgartach (DE) Endersbach (DE) 2030
Grid reinforcements in existing corridor between Großgartach and Endersbach. Extension of substation Wendlingen is
included
Security of supply
Planned,
but not yet in
permitting
Germany Pulverdingen(DE) 2030 Upgrade of substation Pulverdingen in Southern Germany Security of supply
under
consideration
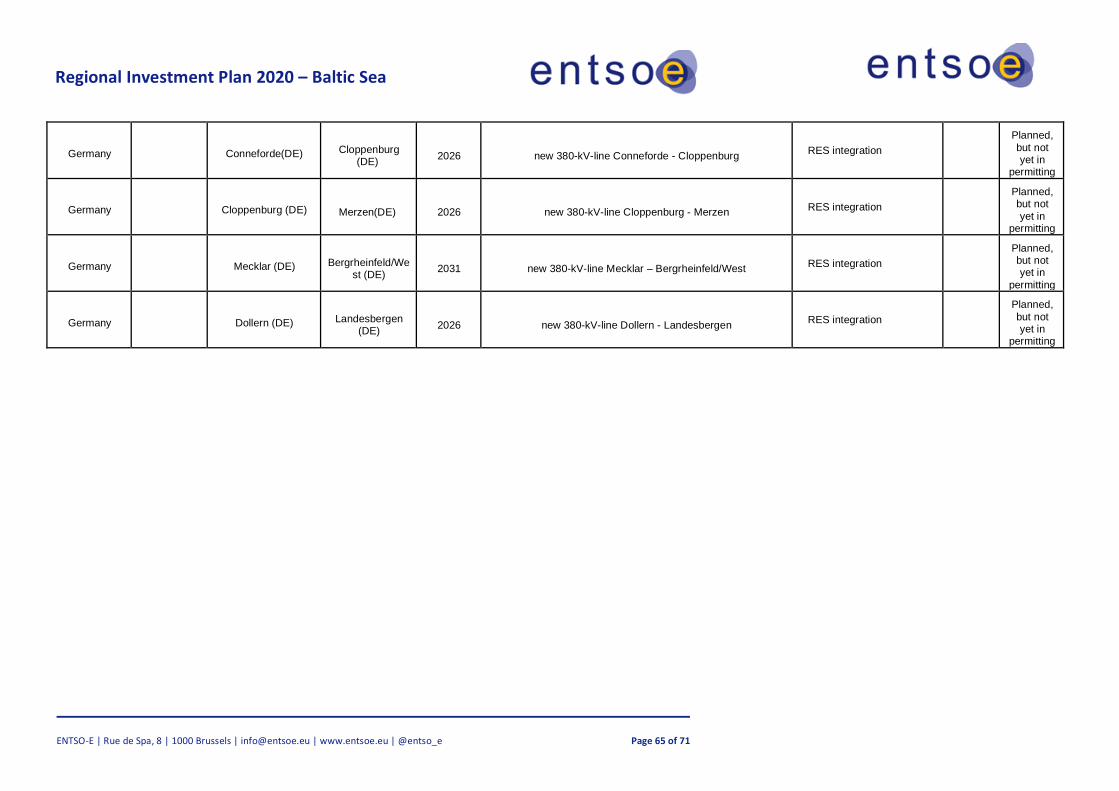
Regional Investment Plan 2020 – Baltic Sea
ENTSO-E | Rue de Spa, 8 | 1000 Brussels | [email protected] | www.entsoe.eu | @entso_e Page 65 of 71
Germany Conneforde(DE) Cloppenburg (DE)
2026 new 380-kV-line Conneforde - Cloppenburg RES integration
Planned,
but not yet in
permitting
Germany Cloppenburg (DE) Merzen(DE) 2026 new 380-kV-line Cloppenburg - Merzen RES integration
Planned, but not
yet in permitting
Germany Mecklar (DE) Bergrheinfeld/West (DE)
2031 new 380-kV-line Mecklar – Bergrheinfeld/West RES integration
Planned, but not yet in
permitting
Germany Dollern (DE) Landesbergen (DE)
2026 new 380-kV-line Dollern - Landesbergen RES integration
Planned,
but not yet in
permitting
Appendix 3. Abbreviations
The following list shows abbreviations used in the Regional Investment Plans 2019.
• AC – Alternating Current
• ACER – Agency for the Cooperation of Energy Regulators
• CCS – Carbon Capture and Storage
• CBA – Cost-Benefit-Analysis
• CHP – Combined Heat and Power Generation
• DC – Direct Current
• EH2050 – e-Highway2050
• EIP – Energy Infrastructure Package
• ENTSO-E – European Network of Transmission System Operators for Electricity
• ENTSOG – European Network of Transmission System Operators for Gas
• EU – European Union
• GTC – Grid Transfer Capability
• HV – High Voltage
• HVAC – High Voltage AC
• HVDC – High Voltage DC
• IEA – International Energy Agency
• IEM Internal Energy Market
• KPI – Key Performance Indicator
• LCC – Line Commutated Converter
• LOLE – Loss of Load Expectation
• MAF – Mid-term Adequacy Forecast
• MS – Member State
• MWh – Megawatt hour
• NGC – Net Generation Capacity
• NRA – National Regulatory Authority
• NREAP – National Renewable Energy Action Plan
• NTC – Net Transfer Capacity
• OHL – Overhead Line
• PCI – Projects of Common Interest
• PINT – Put IN one at a Time
• PST – Phase Shifting Transformer
• RegIP – Regional Investment Plan
• RES – Renewable Energy Sources
• RG BS – Regional Group Baltic Sea
• RG CCE – Regional Group Continental Central East
• RG CCS – Regional Group Continental Central South
• RG CSE – Regional Group Continental South East
• RG CSW –Regional Group Continental South West
• RG NS –Regional Group North Sea
• SEW – Socio-Economic Welfare
• SOAF – Scenario Outlook & Adequacy Forecast
• SoS – Security of Supply

Regional Investment Plan 2020 – Baltic Sea
ENTSO-E | Rue de Spa, 8 | 1000 Brussels | [email protected] | www.entsoe.eu | @entso_e Page 67 of 71
• SSI – Smart Sector Integration
• TEN-E – Trans-European Energy Networks
• TOOT – Take Out One at a Time
• TSO – Transmission System Operator
• TWh – Terawatt hour
• TYNDP – Ten-Year Network Development Plan
• VOLL – Value of Lost Load
• VSC – Voltage Source Converter
Appendix 4. Glossary
The following list describes a number of terms used in this Regional Investment Plan.
Term Acronym Definition
Agency for the
Cooperation of Energy
Regulators
ACER EU Agency established in 2011 by the Third Energy Package legislation
as an independent body to foster the integration and completion of the
European Internal Energy Market both for electricity and natural gas.
Baltic Energy Market
Interconnection Plan
in electricity
BEMIP
Electricity
One of the four priority corridors for electricity identified by the TEN-E
Regulation. Interconnections between Member States in the Baltic region
and the strengthening of internal grid infrastructure, to end the energy
isolation of the Baltic States and to foster market integration; this includes
working towards the integration of renewable energy in the region.
Bottom-Up This approach of the scenario building process collects supply and
demand data from Gas and Electricity TSOs.
Carbon budget This is the amount of carbon dioxide the world can emit while still having
a likely chance of limiting average global temperature rise to 1,5 °C
above pre-industrial levels, an internationally agreed-upon target.
Carbon Capture and
Storage
CCS Process of sequestrating CO2 and storing it in such a way that it will not
enter the atmosphere.
Carbon Capture and
Usage
CCU The captured CO2, instead of being stored in geological formations, is
used to create other products, such as plastic.
Combined Heat and
Power
CHP Combined heat and power generation.
Congestion revenue /
rent
The revenue derived by interconnector owners from the sale of the
interconnector capacity through auctions. In general, the value of the
congestion rent is equal to the price differential between the two
connected markets, multiplied by the capacity of the interconnector.
Regional Investment Plan 2020 – Baltic Sea
ENTSO-E | Rue de Spa, 8 | 1000 Brussels | [email protected] | www.entsoe.eu | @entso_e Page 68 of 71
Congestion Means a situation in which an interconnection linking national
transmission networks cannot accommodate all physical flows resulting
from international trade requested by market participants, because of a
lack of capacity of the interconnectors and/or the national transmission
systems concerned.
COP21 21st Conference of the Parties to the United Nations Framework
Convention on Climate Change, organised in 2015, where participating
states reached the Paris Agreement.
Cost-benefit analysis CBA Analysis carried out to define to what extent a project is worthwhile from
a social perspective.
Cluster Several investment items matching the CBA clustering rules. Essentially,
a project clusters all investment items that have to be realised in total to
achieve a desired effect.
Corridors The CBA clustering rules proved to be challenging for complex grid
reinforcement strategies: the largest investment needs may require some 30 investments items, scheduled over more than five years but addressing
the same concern. In this case, for the sake of transparency, they are
formally presented in a series – a corridor – of smaller projects, each
matching the clustering rules.
Curtailed electricity Curtailment is a reduction in the output of a generator from otherwise
available resources (e. g. wind or sunlight), typically on an unintentional
basis. Curtailments can result when operators or utilities control wind and
solar generators to reduce output to minimize congestion of transmission
or otherwise manage the system or achieve the optimum mix of resources.
Demand side response DSR Consumers have an active role in softening peaks in energy demand by
changing their energy consumption according to the energy price and
availability.
e-Highway2050 EH2050 Study funded by the European Commission aimed at building a modular
development plan for the European transmission network from 2020 to
2050, led by a consortium including ENTSO-E and 15 TSOs from 2012
to 2015 (to e-Highway2050 website).
Electricity corridors Four priority corridors for electricity identify by the TEN-E Regulation:
North Seas offshore grid (NSOG); North-south electricity
interconnections in western Europe (NSI West Electricity); North-south electricity interconnections in central eastern and south eastern Europe
(NSI East Electricity); Baltic Energy Market Interconnection Plan in
electricity (BEMIP Electricity).
Energy not served ENS Expected amount of energy not being served to consumers by the system
during the period considered due to system capacity shortages or
unexpected severe power outages.
Grid transfer capacity GTC Represents the aggregated capacity of the physical infrastructure
connecting nodes in reality; it is not only set by the transmission
capacities of cross-border lines but also by the ratings of so-called

Regional Investment Plan 2020 – Baltic Sea
ENTSO-E | Rue de Spa, 8 | 1000 Brussels | [email protected] | www.entsoe.eu | @entso_e Page 69 of 71
“critical” domestic components. The GTC value is thus generally not
equal to the sum of the capacities of the physical lines that are represented
by this branch; it is represented by a typical value across the year.
Internal Energy
Market
IEM To harmonise and liberalise the EU’s internal energy market, measures
have been adopted since 1996 to address market access, transparency and
regulation, consumer protection, supporting interconnection, and
adequate levels of supply. These measures aim to build a more
competitive, customer-centred, flexible and non-discriminatory EU
electricity market with market-based supply prices.
Investment (in the
TYNDP)
Individual equipment or facility, such as a transmission line, a cable or a
substation.
Mid-term adequacy
forecast
MAF ENTSO-E’s yearly pan-European monitoring assessment of power
system resource adequacy spanning a timeframe from one to ten years
ahead.
Marginal costs Current market simulations, in the framework of TYNDP studies, compute the final ‘price’ of electricity taking into account only
generation costs (including fuel costs and CO2 prices) per technology. In
the real electricity market not only the offers from generators units are
considered but taxes and other services such as ancillary services take
part as well (reserves, regulation up and down…) which introduce
changes in the final electricity price.
Net transfer capacity NTC The maximum total exchange programme between two adjacent control
areas compatible with security standards applicable in all control areas of
the synchronous area and taking into account the technical uncertainties
on future network conditions.
N-1 criterion The rule according to which elements remaining in operation within a
TSO’s responsibility area after a contingency from the contingency list
must be capable of accommodating the new operational situation without
violating operational security limits.
National Energy and
Climate Plan
NECP National Energy and Climate Plans are the new framework within which
EU Member States have to plan, in an integrated manner, their climate and energy objectives, targets, policies and measures for the European
Commission. Countries will have to develop NECPs on a ten-year rolling
basis, with an update halfway through the implementation period. The
NECPs covering the first period from 2021 to 2030 will have to ensure
that the Union’s 2030 targets for greenhouse gas emission reductions,
renewable energy, energy efficiency and electricity interconnection are
met.
North Seas offshore
grid
NSOG One of the four priority corridors for electricity identified by the TEN-E
Regulation. Integrated offshore electricity grid development and related
interconnectors in the North Sea, Irish Sea, English Channel, Baltic Sea
and neighbouring waters to transport electricity from renewable offshore

Regional Investment Plan 2020 – Baltic Sea
ENTSO-E | Rue de Spa, 8 | 1000 Brussels | [email protected] | www.entsoe.eu | @entso_e Page 70 of 71
energy sources to centres of consumption and storage and to increase
cross-border electricity exchange.
North-south electricity
interconnections in
central eastern and
south eastern Europe
NSI East
Electricity
One of the four priority corridors for electricity identified by the TEN-E
Regulation. Interconnections and internal lines in north-south and east-
west directions to complete the EU internal energy market and integrate
renewable energy sources.
North-south electricity
interconnections in
western Europe
NSI West
Electricity
One of the four priority corridors for electricity identified by the TEN-E
Regulation. Interconnections between EU countries in this region and
with the Mediterranean area including the Iberian peninsula, in particular
to integrate electricity from renewable energy sources and reinforce
internal grid infrastructures to promote market integration in the region.
Power to gas P2G Technology that uses electricity to produce hydrogen (Power to
Hydrogen – P2H2) by splitting water into oxygen and hydrogen (electrolysis). The hydrogen produced can then be combined with CO2
to obtain synthetic methane (Power to Methane – P2CH4).
Project (in the
TYNDP) Either a single investment or a set of investments, clustered together to
form a project, in order to achieve a common goal.
Project candidate Investment(s) considered for inclusion in the TYNDP.
Project of common
interest
PCI A project which meets the general and at least one of the specific criteria
defined in Art. 4 of the TEN-E Regulation and which has been granted
the label of PCI project according to the provisions of the TEN-E
Regulation.
Put IN one at the Time PINT Methodology that considers each new network investment/project (line,
substation, PST or other transmission network device) on the given
network structure one by one and evaluates the load flows over the lines
with and without the examined network reinforcement.
Reference grid
The existing network plus all mature TYNDP developments, allowing the
application of the TOOT approach.
Reference capacity
Cross-border capacity of the reference grid used for applying the
TOOT/PINT methodology in the assessment according to the CBA.
Scenario A set of assumptions for modelling purposes related to a specific future
situation in which certain conditions regarding electricity and gas demand
and supply, infrastructures, fuel prices and global context occur.
Take Out One at the
Time
TOOT Methodology that consists of excluding investment items (line,
substation, PST or other transmission network device) or complete
projects from the forecasted network structure on a one-by-one basis and
Regional Investment Plan 2020 – Baltic Sea
ENTSO-E | Rue de Spa, 8 | 1000 Brussels | [email protected] | www.entsoe.eu | @entso_e Page 71 of 71
to evaluate the load flows over the lines with and without the examined
network reinforcement.
Ten-Year Network
Development Plan
TYNDP The Union-wide report carried out by ENTSO-E every other year as
(TYNDP) part of its regulatory obligation as defined under Article 8, para
10 of Regulation (EC) 714 / 2009.
Top-Down The “Top-Down Carbon Budget” scenario building process is an
approach that uses the “bottom-up” model information gathered from the
gas and electricity TSOs. The methodologies are developed in line with
the Carbon Budget approach.
Transmission
capacity/Total
Transfer Capacity
TTC The maximum transmission of active power in accordance with the
system security criteria which is permitted in transmission cross-sections
between the subsystems/areas or individual installations.
Trans-European
Networks for Energy
TEN-E Policy focused on linking the energy infrastructure of EU countries. It identifies nine priority corridors (including 4 for electricity) and three
priority thematic areas.
Vision Plausible future states selected as possible wide-ranging alternatives.
ENTSO-ERue de Spa 8 . 1000 Brussels . Belgium
Related Documents