61eoJournal 20.4 393-407 © 199o (April) by Kluwer Academic Publishers 393 Regional Investment Effectiveness and Development Levels in China Yichun Xie, Lecturer in Geography, Anhui Normal University, Wuhu, Anhui Province, People's Republic of China (Visiting Professor, Department of Geography, The University of Akron, Akron, OH 44325, USA); Dutt, Ashok K., Prof. Dr., University of Akron, Department of Geography, Akron, OH 44325, USA ABSTRACT: For centuries, it has been taken for granted that social and economic devel- opment in China has an east-west spread, or from the coast to the interior. Even though a tremendous effort was made by the socialist government for thirty years (1949-1978) on rectifying 'this unhealthy imbalance', most people hold the belief that the spatial patterns of China's development remain the same as they were forty years ago. This deep-rooted concept plays an important role in shaping China's present economic development strategies. Thus, an evaluation of the impact of the government's regional balance effort remains critical. Understanding the changes and patterns of China's regional development is central to form- Mating appropriate policies for future planning. In this paper an overview of regional devel- opment is presented from the perspective of history. Regression between the total fixed capital investment and the combined industrial and agricultural output is analyzed, and an effort is made to find out the spatial distribution of regional investment effectiveness. A factor analysis based on twenty socio-economic variables revealed that apart from the tradi- tional E-W regional disparity, the modem socialist dispersal policy has also affected the regional development in China. Though the historical economic factors unbalanced the devel- opment from E to W, the economic practice advocated by Socialist China has reversed the tendency to some extent. A cluster analysis of 21 provinces, five autonomous administrative regions, and three municipalities identified new spatial patterns, and the result strengthened the finding that the effort of regional balance in the period of 1949-1978 is still at work. A regional preference policy is one of imperative development strategies in a country that possesses a huge territory and is in a primary stage of economic modernization. However, where development should be emphasized is a moot choice. When the choice is con- sistent with agents pertaining to regional development, optimum results will come. Since 1979, China has launched a series of economic reforms in order to save her collapsing economy and modernize her society. The practice of regional prefer- ence has been an important part of China's policies (Dutt and Costa 1980). The State Council of China established four specialized economic regions in 1980 and opened up 14 port cities for foreign trade in April, 1984. Further, in September, 1985, the Government put forward a regional economic plan for the country called the "Three Economic Zones" (Fig 1). The Eastern Zone, or Coastal Zone, is supposed to be an optimum region for current development; the Western Zone is an underdeveloped region at present and a potential place for future growth; and the Intermediate Zone is planned as a region ranking between E and W both in economic significance and in development preference. Conse- quently, the delta of the Pearl River, the delta of the Yangtze river and the "Golden Triangular Region" of South Fujian province have been put on the list for special policies. In succession, the peninsulas of Shan- dong and East Liaoning have been added. Since then, the whole Eastern Zone has been opened up. Further- more, in February, 1988, a sonorous slogan - that the inputs and outputs (raw materials and products) of the production process should depend on foreign markets

Welcome message from author
This document is posted to help you gain knowledge. Please leave a comment to let me know what you think about it! Share it to your friends and learn new things together.
Transcript
61eoJournal 20.4 3 9 3 - 4 0 7 © 199o (April) by Kluwer Academic Publishers
393
Regional Investment Effectiveness and Development Levels in China Yichun Xie, Lecturer in Geography, Anhui Normal University, Wuhu, Anhui Province, People's Republic of China (Visiting Professor, Department of Geography, The University of Akron, Akron, OH 44325, USA);
Dutt, Ashok K., Prof. Dr., University of Akron, Department of Geography, Akron, OH 44325, USA
ABSTRACT: For centuries, it has been taken for granted that social and economic devel- opment in China has an east-west spread, or from the coast to the interior. Even though a tremendous effort was made by the socialist government for thirty years (1949-1978) on rectifying 'this unhealthy imbalance', most people hold the belief that the spatial patterns of China's development remain the same as they were forty years ago. This deep-rooted concept plays an important role in shaping China's present economic development strategies. Thus, an evaluation of the impact of the government's regional balance effort remains critical. Understanding the changes and patterns of China's regional development is central to form- Mating appropriate policies for future planning. In this paper an overview of regional devel- opment is presented from the perspective of history. Regression between the total fixed capital investment and the combined industrial and agricultural output is analyzed, and an effort is made to find out the spatial distribution of regional investment effectiveness. A factor analysis based on twenty socio-economic variables revealed that apart from the tradi- tional E-W regional disparity, the modem socialist dispersal policy has also affected the regional development in China. Though the historical economic factors unbalanced the devel- opment from E to W, the economic practice advocated by Socialist China has reversed the tendency to some extent. A cluster analysis of 21 provinces, five autonomous administrative regions, and three municipalities identified new spatial patterns, and the result strengthened the finding that the effort of regional balance in the period of 1949-1978 is still at work.
A regional p re fe rence pol icy is one of impera t ive deve lopmen t s t rategies in a country that possesses a huge te r r i to ry and is in a p r imary stage of economic modern iza t ion . Howeve r , where deve lopmen t should be emphas ized is a moo t choice. W h e n the choice is con- sistent with agents per ta in ing to regional deve lopment , op t imum results will come.
Since 1979, China has launched a series of economic reforms in o rde r to save her col lapsing economy and modern ize her society. The pract ice of regional prefer - ence has been an impor t an t par t of China ' s policies (Dut t and Costa 1980). The State Counci l of China es tabl ished four special ized economic regions in 1980 and opened up 14 por t cities for foreign t rade in Apr i l , 1984. Fur the r , in Sep tember , 1985, the G o v e r n m e n t pu t forward a regional economic p lan for the country called
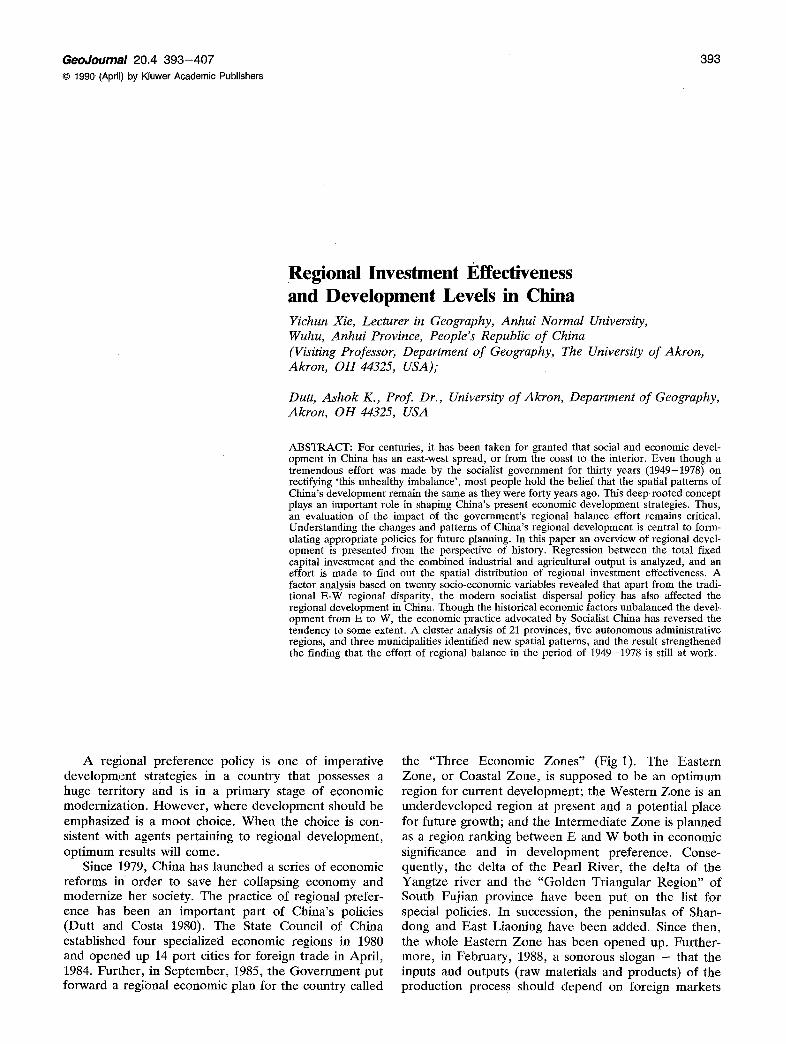
the "Three Economic Z o n e s " (Fig 1). The Eas te rn Zone , or Coastal Z o n e , is supposed to be an op t imum region for cur rent deve lopment ; the Wes te rn Z o n e is an unde rdeve loped region at p resen t and a po ten t ia l p lace for future growth; and the In te rmed ia te Z o n e is p l anned as a region ranking be tween E and W both in economic significance and in deve lopmen t preference . Conse- quent ly, the del ta of the Pear l River , the del ta of the Yangtze r iver and the " G o l d e n Tr iangular Region" of South Fu j i an province have been pu t on the list for special policies. In succession, the peninsulas of Shan- dong and Eas t Liaoning have been added. Since then, the whole Eas te rn Z o n e has been o p e n e d up. Fur ther - more , in Feb rua ry , 1988, a sonorous slogan - that the inputs and outputs (raw mater ia ls and products) of the p roduc t ion process should depend on foreign marke t s
394 GeoJournal 20.4/1990
7~ 8'o 9~ 1~o
ECONOMIC ZONES OF CHINA
::i i!iiiiii . . . . . . . . . . . . . . . . . . . i.i • Xinjiang Uygur Autonomous Region
..,e-~.. . . . . . . -"" '""r"" i - !"->i ' :< '"
~ i i 2 i . £ . i i ~ i a i i i l i ~ i ~ i ~ "'" "" '" '" '""i" i 'i 'i 'i 'i 'i( 'i 'i ' . ~.~o "':'7~" "":" ~ f - - : . . ? . :: -
, ¢ ' . ' . " . ' . " .' " /be~ I " . ' . ~ . ~ " . ". ". ". ". ". ". ". ". ". ~ - , 5 < " . " . " - ~ S h a ' a n :
'i
Eastern Zone : Yunnan :: ' . i -F i - i 'F i ' . ' .
~ , o ~ Intermediate Zone ~
Western Zone o %0 lOO
110 50 ~
40 ~
1. Beijing (Peking) 2. Tianjin 3. Shanghai
3. 30-
Pg
~ " ~ Taiwan -
lOOO 20- I I I I K
600 I I I M
120
Fig 1 Three economic zones of China divided by the Chinese government in September, 1985
and a large volume of import and export would take place - the economic developmental strategy in China's coastal belt, has been officially decreed. As a result of this policy, along with the general tendency of seeking economic wellbeing, a large proportion of investment has gone into the Eastern Zone. The Eastern Zone alone accounts for about 50% of the total national fixed capital investment in 1982-1986.1) While the absolute values of outputs in many economic sectors and places of the Eastern Zone increased substantially, some serious problems have occurred at the same time. The invest- ment volume and construction scale has surpassed the sustaining capacity of China's economic strength and caused severe shortage of some raw materials coupled with high inflation of market prices. More profoundly, it is not known whether or not this zone has achieved greater economic benefits when compared with its investment inputs, or with the economic achievements in other areas of China. That is, it is not clear whether or not this division of three economic zones exposes real regional disparities of social and economic development in China.
Regional disparity in socio-economic development has two connotations. One is the difference in regional development efficiencies. The other is the difference in regional socio-economic conditions, i.e., regional devel- opment levels. First, development is a kind of output and depends on impetuses. In socialist China, invest- ment is a main driving force for social and economic
improvement. Thus, investment effectiveness decides development efficiency. Secondly, development level is a term for describing increment in economic sectors and improvement in social fields. It is a measurement of synthetic advancement of a society and its economy. Therefore, it can be depicted by numerical social and economic indices. Thirdly, in a country with a centrally- planned economy like China, investment emphasis is not certain to comply with investment effectiveness due to the influence of the socialist economic philosophy. In other words, development level is not consistent with development efficiency. Thus, a comprehensive approach to the study of investment effectiveness and development level should be adopted in order to be acquainted with regional disparities in China.
Moreover, the formation of regional disparities in socio-economic development is a historical process. The spatial differences in China's socio-economic develop- ment can be traced back to early ages. The disparities were originally attributed to physical environment (geo- graphical factors) and human economic activities. With the advancement of human knowledge and techniques, man-made influences have become strong and, gradu- ally, prevailing. Particularly, in modern times, human control has been intensified greatly and raised to a new high level. Therefore, modern changes in socio-econom- ic backgrounds make a major contribution to present regional disparities in social and economic development.
GeoJournal 20.4/1990 395
Tab 1 Variables used in the investigation 1)
1) The variables were choosen and calculated by the authors. The measuring unit of the economic variables is the Chinese Yuan (According to the present official announcement of the People's Bank of China, 3.74 Chinese Yuan equals 1 American Dollar). The data used for the calculation come from the publications of the Statistical Bureau of China.
In this paper, first, the history of regional develop- ment in China will be recalled. Then, attempts will be made to identify regional investment effectiveness based on regression residuals analysis. Afterwards, the rela- tionships between investment effectiveness and other social and economic indices will be investigated with the help of factor analysis. Finally, the patterns of regional disparities will be formulated according to cluster analy- sis of the associations of all social and economic vari- ables.
The data used in the paper come from the Statistical Bureau of China and cover the most recent f ive-year period (1982-1986) of available statistics (The Statis- tical Bureau of China 1983, 1984, 1985, 1986, 1987a, 1987b, 1987c). Twenty variables are selected and their brief explanations are listed in Tab 1. Their five-year mean values for 21 provinces, 5 autonomous regions and 3 municipalities are calculated for further quantitative analyses and listed in Appendix 1.2)
Historical Review of Regional Development in China
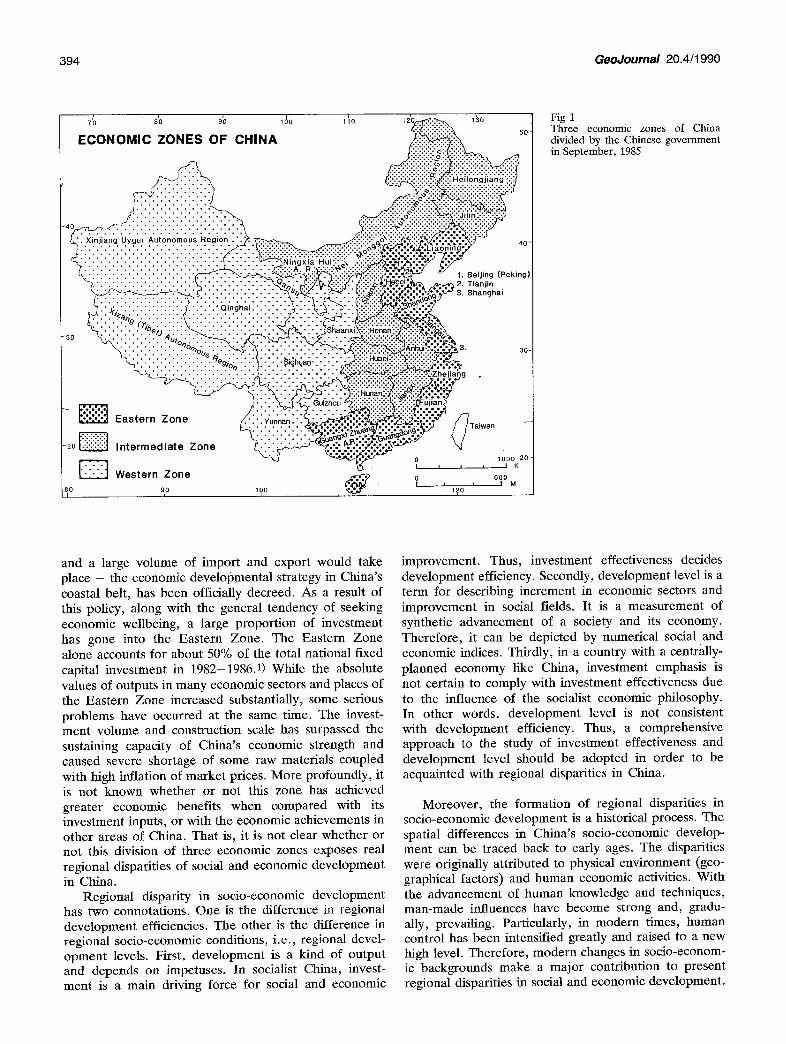
China is noted for her long history of civilization. The formation of her production allocation has under- gone many changes. It has been generally believed that in historical time, the socio-economic development had moved from west to east and, then, dispersed N and S. That is, China's economic activities originated in the valley of the Yellow River then dispersed in two main directions: one to the valleys of the Huaihe river, the Yangtze river, and the Pearl River sequentially, and the other, by stages, to the valleys of the Liaohe river and the Songhua river (Fig 2) (Song 1985).
Modern industrial development in China occurred around the beginning of this century with the economic penetration of western imperialist countries. Before the establishment of the People's Republic of China in 1949, fairly sizable industrial bases had been developed in NE China (the so-called Manchuria), in North China (Tian-
396 GeoJournal 20.4/1990
HISTORIC DISPI=RSION OF' ECONOMIC DEVELOPMENT
'"-> 5, , .... <-" ~ . J
~' ) ") /.~_~.k.~. • ~ , t
r .) ~; ~ , k
) ~ . . . . . "t ._ i . ~ , i "
,J F'"
. ¢~ .J
f~S
d
-,
I l l v ~ t I f - ~
(
? , , , ,o% 6 0 0
I I I M
Fig 2 Historic dispersion of social and eco- nomic development in China
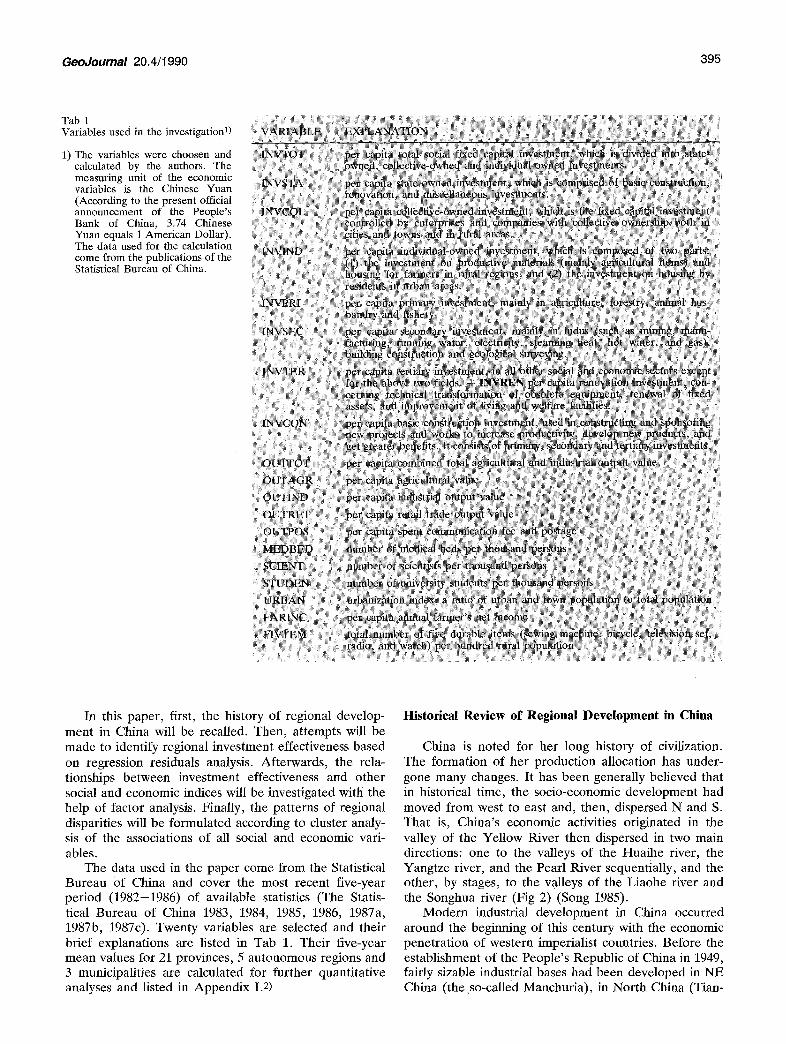
jing area), Jiangsu Province (including Shanghai) and in the Wuhan area (Fig 3) (Eckstein 1968).
However, great changes have taken place in the pro- duction allocation since 1949. Several pronounced goals such as a high rate of economic growth, self-reliance and regional balance have been sought with great effort by
'the communist government. In the economic rehabilita- tion period (1949-1952), besides the recovery of the
industries in NE China and coastal regions, a portion of light-industrial enterprises were moved from coastal areas to NW China, N China and the hinter land of E China (such as Anhui province). Additionally, some new industrial bases were established inland.
In the first five-year plan period (1953-1957), three measures were taken (Dutt and Costa 1980 pp. 3-4): first, full use, renovation and enlargement of old indu-
Fig 3 Main industrial bases in China during the period of 1840-1949
~-MAIN INDUSTRIAL BASES BEFORE 1949 ~ ~.\ , J ~ ' , . /3
/ - f ~"~, c ~--.. .X
J r "..~ r- 17 i-._~i'J--" - \ .... j.) MANOHURIA ~ r'~J +
~ 77 ~" TIANJIN "
L\ SHANGHAI "~ \~ . WUHAN I ~ ~:~
~ , °?%
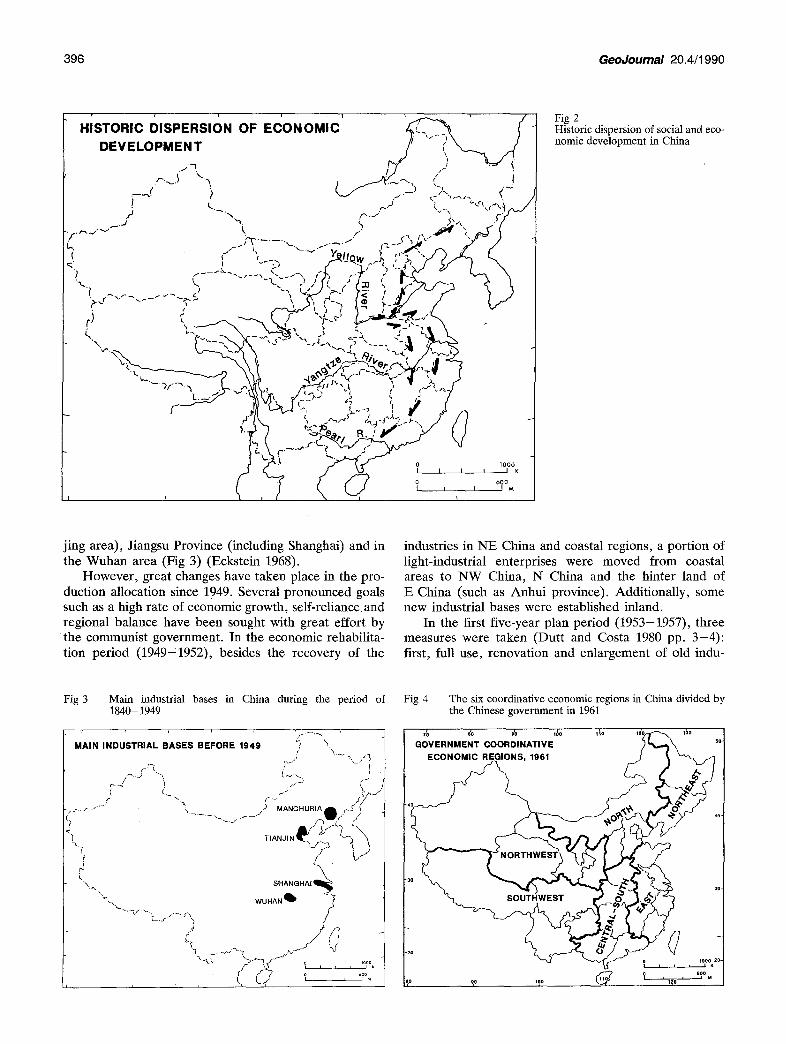
Fig 4 The six coordinative economic regions in China divided by the Chinese government in 1961
GOVERNMENT COORDINATIVE ~ ~ ~ ,o. ECONOMIC REGIONS, 1961 / ~ ~
? i , SOD M
GeoJournal 20.4/1990 397
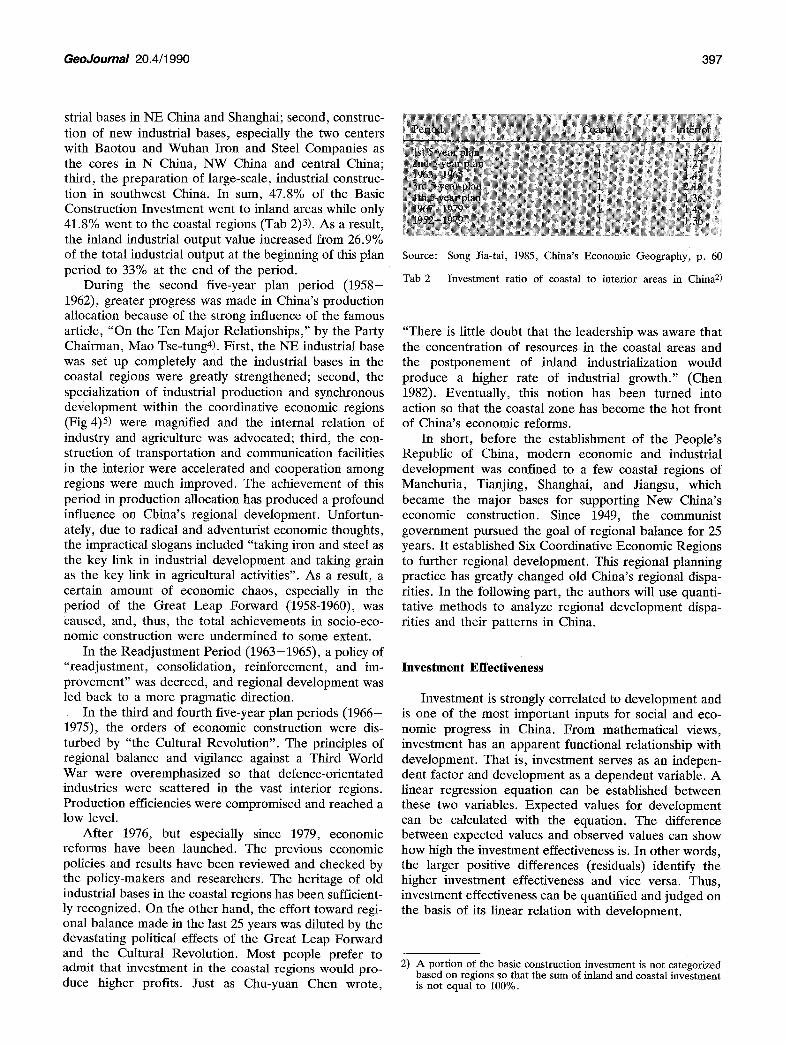
strial bases in NE China and Shanghai; second, construc- tion of new industrial bases, especially the two centers with Baotou and Wuhan Iron and Steel Companies as the cores in N China, NW China and central China; third, the preparation of large-scale, industrial construc- tion in southwest China. In sum, 47.8% of the Basic Construction Investment went to inland areas while only 41.8% went to the coastal regions (Tab 2)3). As a result, the inland industrial output value increased from 26.9% of the total industrial output at the beginning of this plan period to 33% at the end of the period.
During the second five-year plan period (1958- 1962), greater progress was made in China's production allocation because of the strong influence of the famous article, "On the Ten Major Relationships," by the Party Chairman, Mao Tse-tung4). First, the NE industrial base was set up completely and the industrial bases in the coastal regions were greatly strengthened; second, the specialization of industrial production and synchronous development within the coordinative economic regions (Fig 4)5) were magnified and the internal relation of industry and agriculture was advocated; third, the con- struction of transportation and communication facilities in the interior were accelerated and cooperation among regions were much improved. The achievement of this period in production allocation has produced a profound influence on China's regional development. Unfortun- ately, due to radical and adventurist economic thoughts, the impractical slogans included "taking iron and steel as the key link in industrial development and taking grain as the key link in agricultural activities". As a result, a certain amount of economic chaos, especially in the period of the Great Leap Forward (1958-1960), was caused, and, thus, the total achievements in socio-eco- nomic construction were undermined to some extent.
In the Readjustment Period (1963-1965), a policy of "readjustment, consolidation, reinforcement, and im- provement" was decreed, and regional development was led back to a more pragmatic direction.
In the third and fourth five-year plan periods (1966- 1975), the orders of economic construction were dis- turbed by "the Cultural Revolution". The principles of regional balance and vigilance against a Third World War were overemphasized so that defence-orientated industries were scattered in the vast interior regions. Production efficiencies were compromised and reached a low level.
After 1976, but especially since 1979, economic reforms have been launched. The previous economic policies and results have been reviewed and checked by the policy-makers and researchers. The heritage of old industrial bases in the coastal regions has been sufficient- ly recognized. On the other hand, the effort toward regi- onal balance made in the last 25 years was diluted by the devastating political effects of the Great Leap Forward and the Cultural Revolution. Most people prefer to admit that investment in the coastal regions would pro- duce higher profits. Just as Chu-yuan Chen wrote,
Source: Song Jia-tai, 1985, China's Economic Geographyl p. 60
Tab 2 Investment ratio of coastal to interior areas in China 2)
"There is little doubt that the leadership was aware that the concentration of resources in the coastal areas and the postponement of inland industrialization would produce a higher rate of industrial growth." (Chen 1982). Eventually, this notion has been turned into action so that the coastal zone has become the hot front of China's economic reforms.
In short, before the establishment of the People's Republic of China, modern economic and industrial development was confined to a few coastal regions of Manchuria, Tianjing, Shanghai, and Jiangsu, which became the major bases for supporting New China's economic construction. Since 1949, the communist government pursued the goal of regional balance for 25 years. It established Six Coordinative Economic Regions to further regional development. This regional planning practice has greatly changed old China's regional dispa- rities. In the following part, the authors will use quanti- tative methods to analyze regional development dispa- rities and their patterns in China.
Investment Effectiveness
Investment is strongly correlated to development and is one of the most important inputs for social and eco- nomic progress in China. From mathematical views, investment has an apparent functional relationship with development. That is, investment serves as an indepen- dent factor and development as a dependent variable. A linear regression equation can be established between these two variables. Expected values for development can be calculated with the equation. The difference between expected values and observed values can show how high the investment effectiveness is. In other words, the larger positive differences (residuals) identify the higher investment effectiveness and vice versa. Thus, investment effectiveness can be quantified and judged on the basis of its linear relation with development.
2) A portion of the basic construction investment is not categorized based on regions so that the sum of inland and coastal investment is not equal to 100%.
398 GeoJournal 20.4/1990
RELATIONSHIP BETWEEN TOTAL PER CAPITA AGRICULTURAL AND INDUSTRIAL OUTPUT AND TOTAL PER CAPITA INVESTMENT 7000_
6000
5000
~ 4 0 0 0 _
Z u
3000
0
2000
1000
e22
o24
25o e21 o20
8o o26 10
I12e-1 ~ o6• o179°1 o23 eolg:t 16 7
13.5 ~215- .18 14
el9
27"
28 °
! / I ! I --i-'-- I I I I I I I 100 200 300 400 500 600 700 800
INVESTMENT IN YUAN
29 °
I I I 900
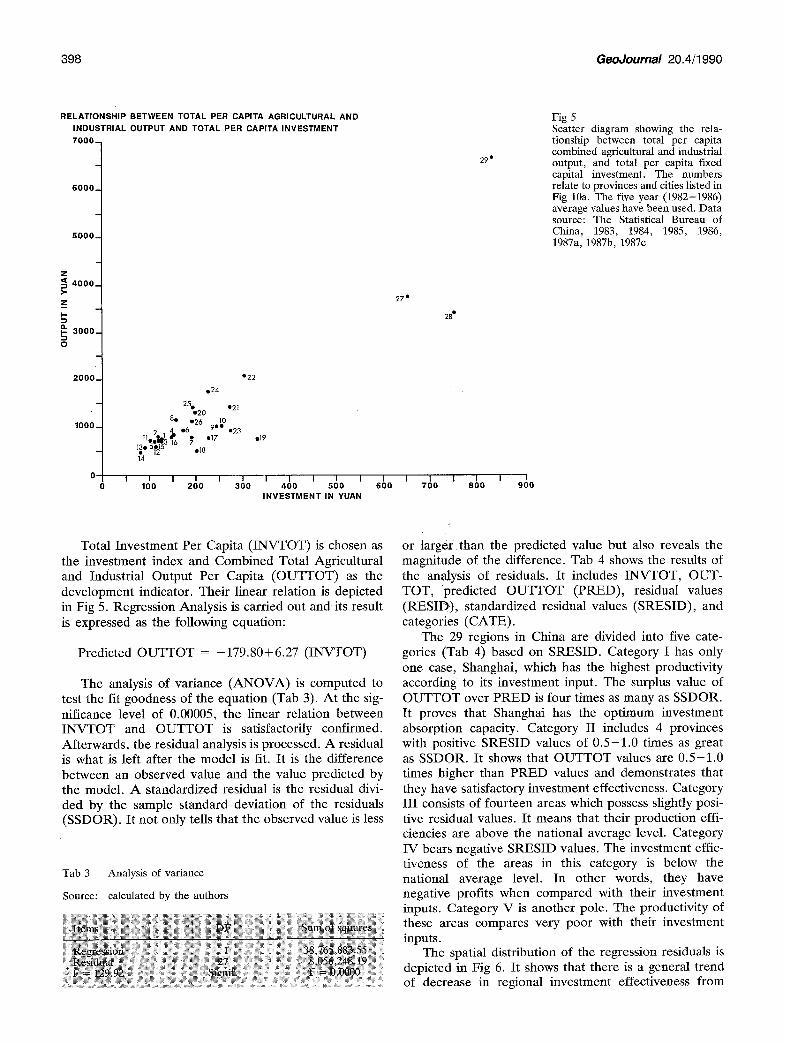
Fig 5 Scatter diagram showing the rela- tionship between total per capita combined agricultural and industrial output, and total per capita fixed capital investment. The numbers relate to provinces and cities listed in Fig 10a. The five year (1982-1986) average values have been used. Data source: The Statistical Bureau of China, 1983, 1984, 1985, 1986, 1987a, 1987b, 1987c
Total Investment Per Capita ( INVTOT) is chosen as the investment index and Combined Total Agricultural and Industrial Output Per Capita (OUTTOT) as the development indicator. Their linear relation is depicted in Fig 5. Regression Analysis is carried out and its result is expressed as the following equation:
Predicted O U T T O T = - 179.80+ 6.27 ( INVTOT)
The analysis of variance (ANOVA) is computed to test the fit goodness of the equation (Tab 3). At the sig- nificance level of 0.00005, the linear relation between I N V T O T and O U T T O T is satisfactorily confirmed. Afterwards, the residual analysis is processed. A residual is what is left after the model is fit. It is the difference between an observed value and the value predicted by the model. A standardized residual is the residual divi- ded by the sample standard deviation of the residuals (SSDOR). It not only tells that the observed value is less
Tab 3 Analysis of variance
Source: calculated by the authors
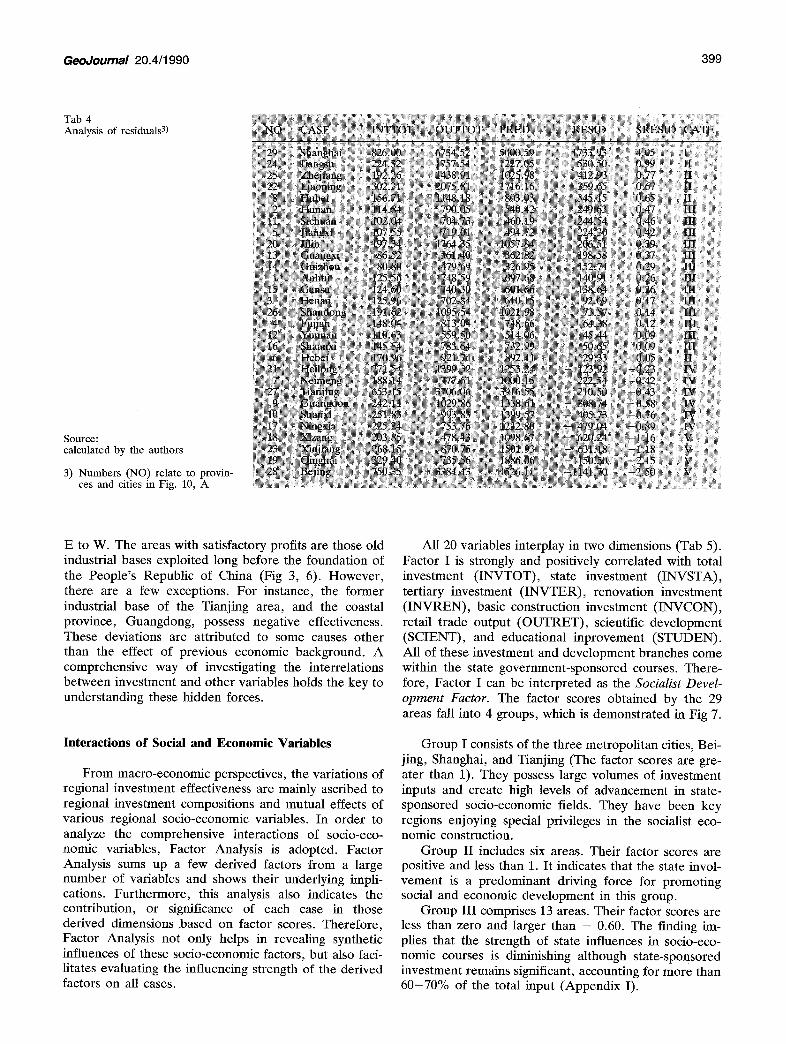
or larger than the predicted value but also reveals the magnitude of the difference. Tab 4 shows the results of the analysis of residuals. It includes INVTOT, OUT- TOT, predicted O U T T O T (PRED), residual values (RESID), standardized residual values (SRESID), and categories (CATE).
The 29 regions in China are divided into five cate- gories (Tab 4) based on SRESID. Category I has only one case, Shanghai, which has the highest productivity according to its investment input. The surplus value of O U T T O T over PRED is four times as many as SSDOR. It proves that Shanghai has the optimum investment absorption capacity. Category II includes 4 provinces with positive SRESID values of 0 .5 -1 .0 times as great as SSDOR. It shows that O U T T O T values are 0 .5-1 .0 times higher than PRED values and demonstrates that they have satisfactory investment effectiveness. Category I I I consists of fourteen areas which possess slightly posi- tive residual values. It means that their production effi- ciencies are above the national average level. Category IV bears negative SRESID values. The investment effic- tiveness of the areas in this category is below the national average level. In other words, they have negative profits when compared with their investment inputs. Category V is another pole. The productivity of these areas compares very poor with their investment inputs.
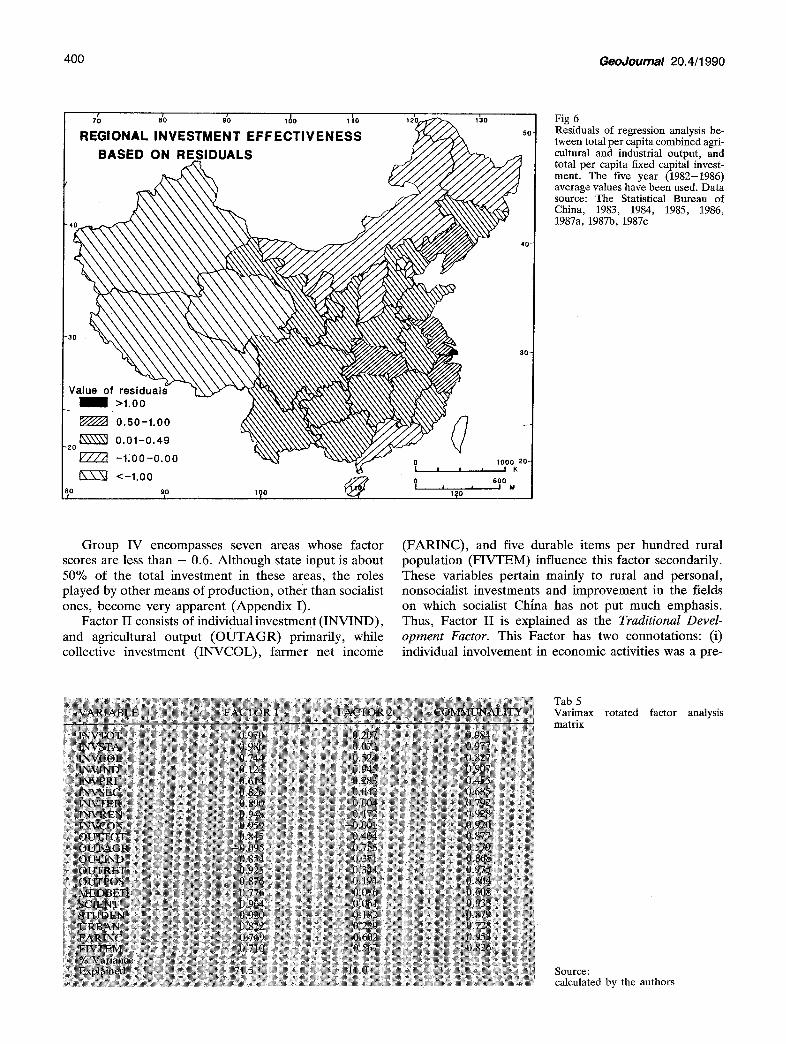
The spatial distribution of the regression residuals is depicted in Fig 6. It shows that there is a general trend of decrease in regional investment effectiveness from
GeoJournal 20.4/1990 399
Tab 4 Analysis of residuals 3)
Source- calculated by the authors
3) Numbers (NO) relate to provin- ces and cities in Fig. 10, A
E to W. The areas with satisfactory profits are those old industrial bases exploited long before the foundation of the People's Republic of China (Fig 3, 6). However, there are a few exceptions. For instance, the former industrial base of the Tianjing area, and the coastal province, Guangdong, possess negative effectiveness. These deviations are attributed to some causes other than the effect of previous economic background. A comprehensive way of investigating the interrelations between investment and other variables holds the key to understanding these hidden forces.
Interactions of Social and Economic Variables
From macro-economic perspectives, the variations of regional investment effectiveness are mainly ascribed to regional investment compositions and mutual effects of various regional socio-economic variables. In order to analyze the comprehensive interactions of socio-eco- nomic variables, Factor Analysis is adopted. Factor Analysis sums up a few derived factors from a large number of variables and shows their underlying impli- cations. Furthermore, this analysis also indicates the contribution, or significance of each case in those derived dimensions .based on factor scores. Therefore, Factor Analysis not only helps in revealing synthetic influences of these socio-economic factors, but also faci- litates evaluating the influencing strength of the derived factors on all cases.
All 20 variables interplay in two dimensions (Tab 5). Factor I is strongly and positively correlated with total investment (INVTOT), state investment (INVSTA), tertiary investment (INVTER), renovation investment (INVREN), basic construction investment (INVCON), retail trade output (OUTRET), scientific development (SCIENT), and educational inprovement (STUDEN). All of these investment and development branches come within the state government-sponsored courses. There- fore, Factor I can be interpreted as the Socialist Devel- opment Factor. The factor scores obtained by the 29 areas fall into 4 groups, which is demonstrated in Fig 7.
Group I consists of the three metropolitan cities, Bei- jing, Shanghai, and Tianjing (The factor scores are gre- ater than 1). They possess large volumes of investment inputs and create high levels of advancement in state- sponsored socio-economic fields. They have been key regions enjoying special privileges in the socialist eco- nomic construction.
Group II includes six areas. Their factor scores are positive and less than 1. It indicates that the state invol- vement is a predominant driving force for promoting social and economic development in this group.
Group III comprises 13 areas. Their factor scores are less than zero and larger than - 0.60. The finding im- plies that the strength of state influences in socio-eco- nomic courses is diminishing although state-sponsored investment remains significant, accounting for more than 60-70% of the total input (Appendix I).
400 GeoJournal 2 0 . 4 / 1 9 9 0
~ 8'0 ~'0 , ~ o 1 ; o
R E G I O N A L I N V E S T M E N T E F F E C T I V E N E S S
B A S E D O N R E S I D U A L S
Value of residuals >1.00
! ~ 0 , 5 0 - 1 . 0 0
0 , 0 1 - 0 . 4 9 - 2 0
-1~00-0,00
~ - ~ <-1.00 80 90
11o 50"
40 ~
30"
0 I 0 0 0 2 0 - I I ! ! , IK
0 600 I I ! I M
120
Fig 6 Residuals of regression analysis be- tween total per capita combined agri- cultural and industrial output, and total per capita fixed capital invest- ment. The five year (1982-1986) average values have been used. Data source: The Statistical Bureau of China, 1983, 1984, 1985, 1986, 1987a, 1987b, 1987c
Group IV encompasses seven areas whose factor scores are less than - 0.6. Although state input is about 50% of the total investment in these areas, the roles played by other means of production, other than socialist ones, become very apparent (Appendix I).
Factor II consists of individual investment (INVIND), and agricultural output (OUTAGR) primarily, while collective investment (INVCOL), farmer net income
(FARINC), and five durable items per hundred rural population (FIVTEM) influence this factor secondarily. These variables pertain mainly to rural and personal, nonsocialist investments and improvement in the fields on which socialist China has not put much emphasis. Thus, Factor II is explained as the Traditional Devel- opment Factor. This Factor has two connotations: (i) individual involvement in economic activities was a pre-
Tab 5 Varimax matrix
rotated factor analysis
Source: calculated by the authors
GeoJournal 20 .4 /1990 401
dominant production mode in China before 1949, and its revival at present is closely related to the former devel- opment level, therefore, this factor reveals previous regional economic background; (ii) in the first thirty years of socialist China, the overwhelming state-spon- sored and planned economy was oriented toward indu- strialization, and many aspects of the rural economic sector were left untapped. The recent revival of indi- vidual economy is an effort to fill these gaps. Thus, Factor II also indicates diversifies of regional economy.
Based on the factor scores in Factor II, the 29 areas are divided into four types (Fig 8).
Type I includes four areas with factor scores greater than 1.0. The Individual Owned Investment (INVIND) and Collective Owned Investment (INVCOL) values in these areas are much higher than the mean national values (Appendix I). The Per Capita Agricultural Out- put (OUTAGR), Net Farmer Income (FARINC) and Possession of Five Durable Items (FIVTEM) values are also greater than the national averages. They enjoy the advantages of good economic background and greater flexibilitas in their social and economic development.
Type II has factor scores ranging from 0 to 1 and consists of nine provinces. This type possesses a higher INVIND value than the average national value. The supplementary functions of individual involvement in regional economic development are significantly recog- nized.
Type III is composed of six areas which bear negative factor scores changing within 0.00 to - 0.500. These areas generally have a small volume of individual inputs and poor agriculture.
Type IV is characterized by obviously negative factor scores. In most areas of this type, the values of INV- COL, INVIND, OUTAGR, FARINC, and FIVTEM are far below the national levels.
The regional distributions of the factor scores in both dimensions are quite different. The effect of the Tradi- tional Development Factor shows a decreasing trend from the coast toward the inland although there are some
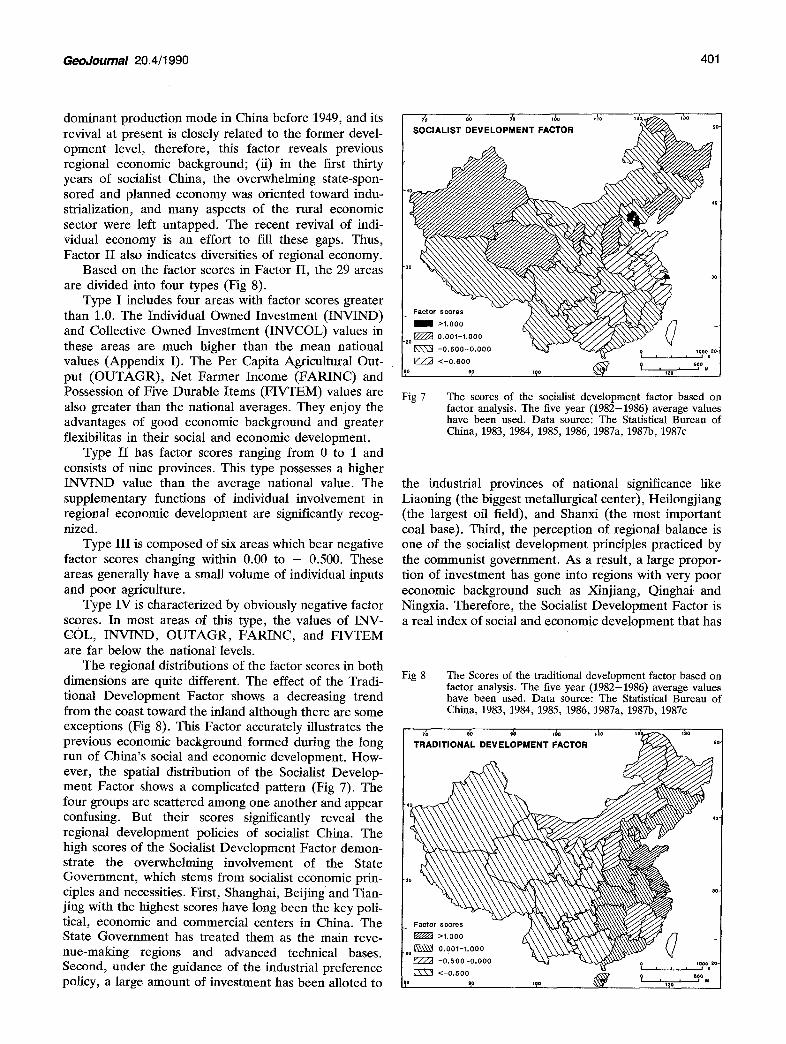
| SOCIALIST DEVELOPMENT FACTOR ' ~ - / ~ 50"
[ o ?:°:o ioS:oo ::o o ~ o ~ ' - ~ ' - ° ° ° L ,o ~ . o °
Fig 7 The scores of the socialist development factor based on factor analysis. The five year (1982-1986) average values have been used. Data source: The Statistical Bureau of China, 1983, 1984, 1985, 1986, 1987a, 1987b, 1987c
the industrial provinces of national significance like Liaoning (the biggest metallurgical center), Heilongjiang (the largest oil field), and Shanxi (the most important coal base). Third, the perception of regional balance is one of the socialist development principles practiced by the communist government. As a result, a large propor- tion of investment has gone into regions with very poor economic background such as Xinjiang, Qinghai. and Ningxia. Therefore, the Socialist Development Factor is a real index of social and economic development that has
Fig 8 The Scores of the traditional development factor based on factor analysis. The five year (1982-1986) average values have been used. Data source: The Statistical Bureau of China, 1983, 1984, 1985, 1986, 1987a, 1987b, 1987c
exceptions (Fig 8). This Factor accurately illustrates the [ ,~ ,., ,~ ,u ,~0 ,,~.~-~ ,~, previous economic background formed during the long [ TRAD,T,ONAL DEVELOPMENT FACTOR ~ - run of China's social and economic development. How- ever, the spatial distribution of the Socialist Develop- ment Factor shows a complicated pattern (Fig 7). The four groups are scattered among one another and appear ,o confusing. But their scores significantly reveal the ,o regional development policies of socialist China. The high scores of the Socialist Development Factor demon- strate the overwhelming involvement of the State Government, which stems from socialist economic prin- 30 ~o ciples and necessities. First, Shanghai, Beijing and Tian- jing with the highest scores have long been the key poli- tical, economic and commercial centers in China. The ~act . . . . . . . .
State Government has treated them as the main reve- ~ 0~00i~1.0o0 ~ \ ~ \ \ ~ ~ ( / -" nue-making regions and advanced technical bases. ,0 ~ .
/ eT~ -o.soo-o.ooo ~-k~- ~ . . . . . . . Second, under the guidance of the industrial preference m rv~-n <-0.soo .~ . . . . ,0~ ~ / policy, a large amount of investment has been alloted to ,o~, . . . . u . ~ ,° ~ ',0 , , . J
402 GeoJournal 20.4/1990
Source: calculated by the authors
happened under the aegis of the communist government in modern China.
Furthermore, the comparison with and combination of the Socialist Development Factor and the Traditional Development Factor can help in understanding the regi- onal development effectiveness in several ways.
1. The regions which possess positive scores in the Socialist Development Factor generally have negative scores in the Traditional Development Factor. The reverse is also true, most regions with positive scores in Factor II gain negative scores in Factor I. Moreover, the positive scores in Factor I, or negative scores in Factor II are associated with poor investment effectiveness, and vice versa (Fig 6, 7, 8). This finding demonstrates that the communist government has placed emphasis on strengthening industrial growth and encouraged devel- opment in marginal regions, in spite of the fact that investment in the regions with good previous economic background would be more efficient.
2. The combination of high positive scores in both factors has given birth to highly advanced regions in China. Shanghai is ranked the first in the two factors. As
4) Please refer to footnotes ~1 5) Numbers (NO) relate to provinces and cities listed in Fig 10 A
a result, it becomes the region with optimum investment and development efficiencies. Liaoning is second in both factors and, so, is endowed with satisfactory investment efficiency and development level. This phenomenon shows that the combination of a previous good economic background with a large amount of modern input brings about fast socio-economic development. Shanghai ahd Liaoning have high level improvements in social areas and great productivity in economic sectors. They boast a large number of state-owned enterprises and newly developed collective and individual economic activities. They have advanced heavy industries, light industries, and relevant agriculture, and are the most important comprehensive industrial and economic regions in China.
Beijing is an exceptional case. Although it has the highest score in Factor I and a slightly positive score in Factor II, Beijing is ranked within the bad investment effectiveness category. This abnormal phenomenon results from its particular political position of being the national capital city. It has made great efforts toward improving its social conditions, such as communication, science, higher education, environment protection, ser- vice and recreation. A large proportion of input has gone into these fields rather than the industrial produc- tion sector. Due to different statistical methods in China,
GeoJournal 20.4/1990 403
output values in these service fields are not counted so that its investment efficiency is somewhat distorted.
3. The combination of high positive scores in Factor I with extreme negative scores in Factor I I usually desig- nates areas such as, Qinghai, Xinjiang, and Ningxia, as bad investment effectiveness. These areas are located in northwest or west China. Their social improvement and economic achievement have generally lagged behind due to insufficient and weak economic foundations. Heavy dependance on the state economy and severe lack of economic diversity become serious constraints in foster- ing healthy development.
Until now, we have analyzed economic background, investment effectiveness, investment composition, and diversity of production modes at the provincial level. These characteristics constitute the main aspects that describe regional disparities in China. Now we are able to summarize regional disparity patterns of socio-eco- nomic development in China.
Regional Disparity Patterns and Regional Development Levels
The discerning of regional disparity patterns can be done by Cluster Analysis, which facilitates computing distances and similarities among all cases. Distance
measures are small and similarity measures are large for cases that are similar. As a result, cases that share simi- lar characteristics are grouped, or, clustered together. By studying such clusters, one can determine the fea- tures that the cases share. Applied to our studies, Clu- ster Analysis enables us to see different patterns of regi- onal disparity and different levels of regional develop- ment in China.
The results of the Cluster Analysis are expressed in Fig 9, and Fig 10a. The coefficient of less than 5 be- tween clusters is chosen as the distance limit (Tab 6). Based on this limit, nine kinds of regional combinations are formed.
I. The most advanced and optimum investment cate- gory This category has one case, Shanghai, which has been an important commercial center since early in the Tang Dynasty. After the Opium War, it was opened up as a treaty port city, and became the largest port of imperialist economic penetration and the biggest indu- strial, commercial, and communication harbor in Old China. Since 1949, it has been listed as one of the key reconstruction regions by the communist government. Great progress continues to be made in economy, science, culture, transportation, and communication. So, Shanghai remains the largest multi-functional center in China.
404 GeoJournal 20.4/1990
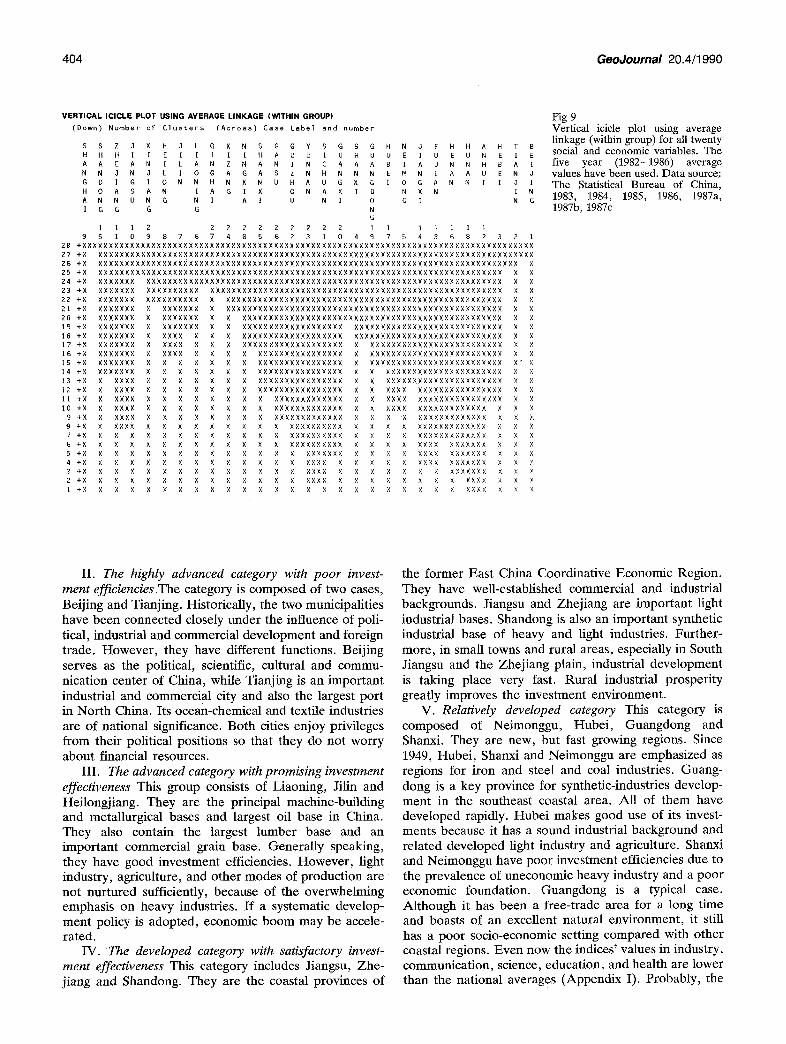
VERTICAL ICICLE PLOT USING AVERAGE LINKAGE ( ~ T H I N GROUP) Fig 9 (Down) N u m b e r o f C l u ~ t e r s ( A c r o s s ) C a s e L ~ b e l a n d n u m b e r Vertical icicle plot using average
s s z 0 x H a L 0 x N S G G Y S G S G H N J F H H A H T B " ~-nn~age, :.t,twtmm - -'group) foralltwenty H H H I I E I I I I 1 N k U U I U H U U E 1 U E U N E I E soeiM ~ d economic variables. The A A E A N t L k N Z N A N I N C A k k B I A J N N H S A I five year (1982--1986) average n N 0 N 0 e I O G k G k S Z N H N N N E M N I k A U E N a values have been used. Data source: G D I G X O N N H N X N U H A U G X G I O G A N N ~ I J I The Statistical Bureau of China, H 0 A S A N I A G I X 0 N A X I D N X N I N I=o0m°% ~=o~"°", ~=oom°~, ~=ou~"°c, ~=o.m°'a, A N N U N G N I A I U N I O G I N G
1987c I G G G G N 19~Vb, G
1 1 1 2 2 2 2 2 2 2 2 2 2 1 1 1 1 1 1 1 9 5 1 0 9 8 7 G 7 4 8 5 6 2 3 1 0 4 9 7 5 4 3 6 8 2 3 2 1
28 +xXXX•XX•X•X•X•XXxX•X•X•x••••X•XXXXXXXX•XXxX•••XXXX•XX••XX•X•XXX•X•••XXXX×X•X••XXXXXX• 27 +X XXXX•X•••XX•XX•XXXXXXXXX•X••X•X•X•XXXXX••XX••X•X•XXX•X•XX•X•XXX•X••••XX•XXXXX•••XX 26 +X XXXXXXXXXXXXXXXXXXXXXXXXXXXXXXXXXXXXXXXXXXXXXXXXXXXXXXXXXXXXXXXXXXXXXXXXXXXXXXX X 25 +X XXXXXXXXXXXXXXXXXXXXXXXXXXXXXXXXXXXXXXXXXXXXXXXXXXXXXXXXXXXXXXXXXXXXXXXXXXXX X X 24 +X XXXXXXX XXXXXXXXXXXXXXXXXXXXXXXXXXXXXXXXXXXXXXXXXXXXXXXXXXXXX×XXXXXXXXXXXXX X X 23 +X XXXXXXX XXXXXXXXXX XXXXXXXXXXXXXXXXXXXXXXXXXXXXXXXXXXXXXXXXXXXXXX×XXXXXXXX X X 22 +X XXXXXXX XXXXXXXXXX X XXXXXXXXXXXXXXXXXXXXXXXXXXXXXXXXXXXXXXXXXXXXXXXXXXXX X X 21 +X XXXXXXX X XXXXXXX X XXXXXXXXXXXXXXXXXXXXXXXXXXXXXXXXXXXXXXXXXXXXXXXXXXXX X X 20 +X XXXXXXX X XXXXXXX X X XXXXXXXXXXXXXXXXXXXXXXXXXXXXXXXXXXXXXXXXXXXXXXXXX X X 19 +X XXXXXXX X XXXXXXX X X XXXXXXXXXXXXXXXXXXX XXXXX×XXXXXXXXXXXXXXXXXXXXXX X X lS +X XXXXXXX X XXXX X X X XXXXXXXXXXXXXXXXXXX XXXXXXXXXXXXXXXXXXXXXXXXXXXX X X 17 +X XXXXXXX X XXXX X X X XXXXXXXXXXXXXXXXXXX X XXXXXXXXXXXXXXXXXXXXXXXXX × X 16 +X XXXXXXX X XXXX X X X X XXXXXXXXXXXXXXXX X XXXXXXXXXXXXXXXXXXXXXXXXX X X 15 +X XXXXXXX X X X X X X X XXXXXXXXXXXXXXXX X XXXXXXXXXXXXXXXXXXXXXXXXX X" X 14 +X XXXXXXX X X X X X X X XXXXXXXXXXXXXXXX X X XXXXXXXXXXXXXXXXXXXXXX X X 13 +X X XXXX X X X X X X X XXXXXXXXXXXXXXXX X X XXXXXXXXXXXXXXXXXXXXXX X x 12 +X X XXXX X X X X X X X XXXXXXXXXXXXXXXX X X XXXX XXXXXXXXXXXXXXXX X X 11 +X X XXXX X X X X X X X X XXXXXXXXX×XXX X X XXXX XXXXXXXXXXXXXXXX X X 1O +X X XXXX X X X X X X X X XXXXXXXXXXXXX X X XXXX XXXXXXXXXXXXX X X X
9 +X X XXXX X X X X X X X X XXXXXXXXXXXXX X X X X XXXXXXXXXXXXX X X X 8 +X X XXXX X X X X X X X X X XXXXXXXXXX X X X X XXXXXXXXXXXXX X X X 7 +X X X X X X X X X X X X X XXXXXXXXXX X X X X XXXXXXXXXXXXX X X X G +X X X X X X X X X X X X X XXXXXXXXXX X X X X XXXX XXXXXXX X X X 5 +X X X X X X X X X X X X X X XXXXXXX X X X X XXXX XXXXXXX X X X 4 +X X X X X X X X X X X X X X XXXX X X X X X XXXX XXXXXXX X X X 3 + X X X X X X X X X X X X X X X X X X X X X X X X X X X X X X X X X X ~ 2 + X X X X X X X X X X X X X X X X X X X X X X X X X X X X X X X X × I + X X X X X X X X X X X X X X X X X X X X X X X X X X X X X × X
I I . The highly advanced category with poor invest- t he f o r m e r E a s t C h i n a C o o r d i n a t i v e E c o n o m i c R e g i o n . merit efficiencies T h e c a t e g o r y is c o m p o s e d of two cases, T h e y h a v e we l l - e s t ab l i shed c o m m e r c i a l and indus t r ia l Be i j i ng and T ian j ing . His to r ica l ly , t he two munic ipa l i t i e s b a c k g r o u n d s . J i angsu and Z h e j i a n g a re i m p o r t a n t l ight h a v e b e e n c o n n e c t e d c lose ly u n d e r t he i n f luence o f pol l - indus t r ia l bases . S h a n d o n g is also an i m p o r t a n t syn the t ic t ical , indus t r i a l and c o m m e r c i a l d e v e l o p m e n t and fo r e ign indus t r ia l base of h e a v y and l ight indus t r ies . F u r t h e r - t r ade . H o w e v e r , t h e y h a v e d i f f e ren t func t ions . B e i j i n g m o r e , in smal l t owns and rura l a reas , espec ia l ly in Sou th se rves as t he pol i t ica l , scient if ic , cu l tu ra l and c o m m u - J i angsu and t h e Z h e j i a n g p la in , indus t r i a l d e v e l o p m e n t n i ca t ion c e n t e r of Ch ina , wh i l e T i a n j i n g is an i m p o r t a n t is t ak ing p lace v e r y fast . R u r a l indus t r ia l p ro spe r i t y indus t r i a l and c o m m e r c i a l city and also the l a rges t p o r t g rea t ly i m p r o v e s t he i n v e s t m e n t e n v i r o n m e n t . in N o r t h Ch ina . I ts o c e a n - c h e m i c a l and tex t i le indus t r ies V. Relatively developed category This c a t e g o r y is a re o f na t i ona l s ignif icance. B o t h ci t ies e n j o y p r iv i l eges c o m p o s e d of N e i m o n g g u , H u b e i , G u a n g d o n g and f r o m the i r pol i t ica l pos i t ions so tha t t h e y do n o t w o r r y Shanxi . T h e y a re new, bu t fast g r o w i n g reg ions . S ince a b o u t f inanc ia l r e sources . 1949, H u b e i , Shanxi and N e i m o n g g u a re e m p h a s i z e d as
I I I . The advanced category with promising investment r eg ions for i ron and s tee l and coal indus t r ies . G u a n g - effectiveness This g r o u p consis ts o f L i a o n i n g , J i l in and d o n g is a k e y p r o v i n c e fo r syn the t i c - indus t r i e s d e v e l o p - H e i l o n g j i a n g . T h e y a re t h e p r inc ipa l m a c h i n e - b u i l d i n g m e n t in t h e sou theas t coas ta l area . A l l o f t h e m h a v e and me ta l l u rg i ca l bases and larges t oi l base in China . d e v e l o p e d rapid ly . H u b e i m a k e s g o o d use o f its inves t - T h e y also c o n t a i n t h e la rges t l u m b e r base and an m e n t s b e c a u s e it has a sound indus t r i a l b a c k g r o u n d and i m p o r t a n t c o m m e r c i a l g ra in base . G e n e r a l l y speak ing , r e l a t e d d e v e l o p e d l ight i ndus t ry and agr icu l tu re . Shanxi t h e y h a v e g o o d i n v e s t m e n t ef f ic iencies . H o w e v e r , l ight and N e i m o n g g u h a v e p o o r i n v e s t m e n t ef f ic iencies due to indus t ry , ag r i cu l tu re , and o t h e r m o d e s of p r o d u c t i o n a re t h e p r e v a l e n c e of u n e c o n o m i c h e a v y indus t ry and a p o o r n o t n u r t u r e d suff ic ient ly , b e c a u s e o f t h e o v e r w h e l m i n g e c o n o m i c f o u n d a t i o n . G u a n g d o n g is a typ ica l case. e m p h a s i s on h e a v y indus t r ies . I f a sys temat ic d e v e l o p - A l t h o u g h it has b e e n a f r e e - t r a d e a r e a fo r a l ong t i m e m e n t po l icy is a d o p t e d , e c o n o m i c b o o m m a y b e acce le - and boas t s of an exce l l en t na tu r a l e n v i r o n m e n t , i t still r a t ed , has a p o o r s o c i o - e c o n o m i c se t t ing c o m p a r e d wi th o t h e r
IV . The developed category with satisfactory invest- coas ta l reg ions . E v e n n o w t h e ind ices ' va lues in indus t ry , ment effectiveness This c a t e g o r y inc ludes J iangsu , Z h e - c o m m u n i c a t i o n , sc ience , e d u c a t i o n , and h e a l t h a r e l ower j i a n g and S h a n d o n g . T h e y a re t h e coas ta l p r o v i n c e s o f t h a n the na t i ona l ave rages ( A p p e n d i x I). P r o b a b l y , t he
GeoJournal 20.4/1990 405
A DENDROGRAM USING AVERAGE
LINKAGE (WITHIN GROUP)
C A S E
ID Label
i ANHUI
2 HUNAN
3 HENAN
4 FUJIAN
5 JIANGXI
6 HEBEI
7 NEIMONG
8 HUBEI
9 GUANGDONG
I0 SHANXI
ii SICHUAN
12 YUNNAN
13 GUANGXI
14 GUIZHOU
15 GANSU
16 SHAANXI
17 NINGXIA
18 XIZANG
19 QINGHAI
20 JILIN
21 HEILONG
22 LIAONING
23 XINJIANG
24 JIANGSU
25 ZHEJIANG
26 SHANDONG
27 TIANJIN
28 BEIJING
29 SHANGHAI
-+
-+
- + - +
-+I
-+I - - - +
- + - + - +
- + I + - +
---+II . . . . . + I
-+ I -+ + - +
-+ II
-+-+ II
- + + - + I + - +
---++-+II
. . . . . + I +-+
. . . . . . . . . +II
. . . . . . . . . . . + + - +
..... + II
..... +---+ II
. . . . . + + - - - + + . . . . . . . +
......... + I I
-+-+ I + ............. +
-+ + ........... + I I
- - -+ I + . . . . . . . . . . . +
....................... + I I
..................................... + I
. . . . . . . . . . . . . . . . . . . . . . . . . . . . . . . . . . 7 . . . . . . . . . . . . . . +
0 5 i0 15 20 25 + . . . . . . . . . + . . . . . . . . . + . . . . . . . . . + . . . . . . . . . + . . . . . . . . . +
Resealed Distance Cluster Combine
Fig 10a
Fig 10b
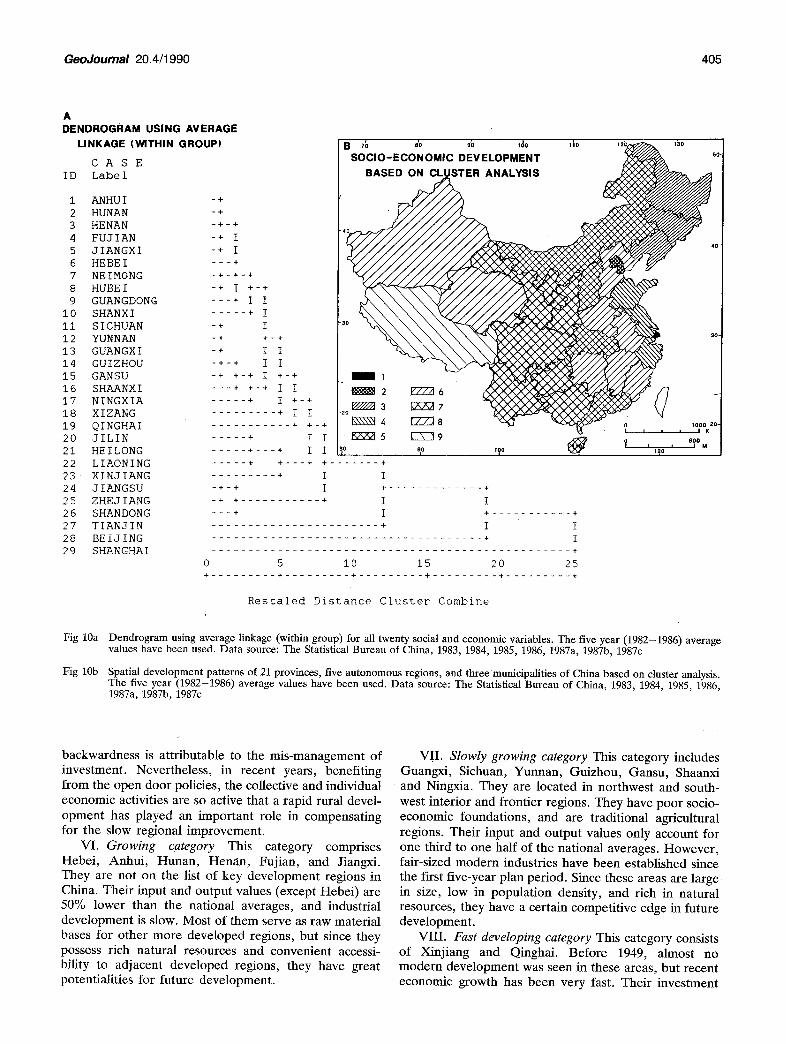
Dendrogram using average linkage (within group) for all twenty social and economic variables. The five year (1982-1986) average values have been used. Data source: The Statistical Bureau of China, 1983, 1984, 1985, 1986, 1987a, 1987b, 1987c
Spatial development patterns of 21 provinces, five autonomous regions, and three municipalities of China based on cluster analysis. The five year (1982-1986) average values have been used. Data source: The Statistical Bureau of China, 1983, 1984, 1985, 1986, 1987a, 1987b, 1987c
backwardness is attributable to the mis-management of investment. Nevertheless, in recent years, benefiting from the open door policies, the collective and individual economic activities are so active that a rapid rural devel- opment has played an important role in compensating for the slow regional improvement.
VI. Growing category This category comprises Hebei, Anhui, Hunan, Henan, Fujian, and Jiangxi. They are not on the list of key development regions in China. Their input and output values (except Hebei) are 50% lower than the national averages, and industrial development is slow. Most of them serve as raw material bases for other more developed regions, but since they possess rich natural resources and convenient accessi- bility to adjacent developed regions, they have great potentialities for future development.
VII. Slowly growing category This category includes Guangxi, Sichuan, Yunnan, Guizhou, Gansu, Shaanxi and Ningxia. They are located in northwest and south- west interior and frontier regions. They have poor socio- economic foundations, and are traditional agricultural regions. Their input and output values only account for one third to one half of the national averages. However, fair-sized modem industries have been established since the first five-year plan period. Since these areas are large in size, low in population density, and rich in natural resources, they have a certain competitive edge in future development.
VIII. Fast developing category This category consists of Xinjiang and Qinghai. Before 1949, almost no modern development was seen in these areas, but recent economic growth has been very fast. Their investment
406 GeoJournal 20.4/1990
input is ranked high in the nation, but due to histori- cal and physical constraints, the efficiencies are very minimal.
IX. Developing category This category only has one case, Xizang. Agriculture and animal husbandry are the mainstays of the local economy. Industrial development is still in a beginning stage.
These nine cluster categories are shown in Fig 10b. Based on the comparison of the maps of Cluster Ana- lysis (Fig 10b) and Factor Analysis (Fig 7, 8), a few new findings can be shown. First, the division line of Type IV and other types of Factor II is exactly the line which separates Category VII , VI I I , IX from other categories of Cluster Analysis. This coincidence proves that the Traditional Deve lopment Factor still makes contribu- tions to the regional disparity of modern China's socio- economic development . Second, Type IV of Factor I I breaks into 3 categories in Cluster Analysis. The forma- tion of Category V I I I closely relates to Factor II. I t indi- cates that the Socialist Deve lopment Factor has played a part in reshaping the regional disparity in China. Third, in the remaining part of China (the E half China), the spatial distributions of Factor Analysis and Cluster Analysis are not matched significantly. Al though the effect of Factor II remains apparent in some provinces such as Zhejiang, Jiangsu and Shandong, the general decreasing trend of Factor I I f rom east toward west has been disturbed. It seems that the Socialist Deve lopment Factor has imposed a stronger influence than the Tradi- tional development Factor if the practice of Six Coordi- native Economic Regions in China is recalled at this time.
sets the basic distribution pat tern of China's regional development , while the later modifies it. Especially in the E half of China, Socialist Deve lopment Factor almost changes the descending trend of regional devel- opment level f rom E toward W. Therefore, the traditi- onal economic division of China into the coastal belt and the interior land is oversimplified and no longer appro- priate for regional planning.
Apar t f rom exposing previous regional economic background, the Traditional Deve lopment Factor reve- als the diversity of regional economic activities, which is intimately associated with investment effectiveness. Thus, proper coordination of industry and agriculture, heavy industry and light industry, and state-sponsored programs, collective-evolved, and individual-evolved economic activities should be encouraged. That is, diver- sifies in economic sectors, in productive modes, in admi- nistrative levels, and in regional allocations should be advocated simultaneously.
Investment effectiveness does not necessarily coin- cide with development level. This finding refutes the old principle that highly developed regions would have good investment efficiencies. This general principle is no longer followed in China because the socialist centralized economy exerts a strong unnatural influence on the direction, speed, decision and planning of economic development. Thus, in seeking rapid development , one should try to ensure a subjective selection of key exploi- tative regions consistent with the objective characteris- tics of their economy. A one-sided approach in the for- mation of regional development policies must be avoided.
Conclusions
The modern regional disparity in China's socio-eco- nomic development is attributed to a synthesis of Tradi- tional and Socialist Deve lopment Factors. The former
Acknowledgements
Margeret Geib, Cartographer , Depar tment of Geo- graphy, The University o f Akron , is thanked for prepa- ration of the maps.
Notes
f) A portion of the total national fixed capital investment is not categorized according to regions so that the investment sum of the three zones is not equal to 100%.
2) The data of Taiwan Province are not included in the paper. 3) A portion of the basic construction investment is not categorized
based on regions so that the sum of inland and coastal invest- ment is not equal to 100%.
4) Mao's original speech was made in April 1956. The main topic is concerned with the Party paying special attention to the proper management of the relationships between industry and agricul- ture, between heavy industry and light industry, between indu- stry in the coastal regions and industry in the interior, between economic construction and defence construction, between the state, the traits of production and the producers, between the central authorities and the local authorities, and between the Han nationality and the minority nationalities.
5) China was divided into seven coordinative economic regions in 1958: Northeast China, North China, Northwest China, East China, Central China, South China, and Southwest China. In 1961, Central China and South China were merged into one region called Central-south China. So six great economic coor- dinative regions were finally formed. Northeast China includes three provinces: Liaoning, Jilin, and Heilongjiang. North China two municipalities (Beijing and Tianjing), two provinces (Hebei and Shanxi) and one autonomous region (Neimonggu). East China one municipality (Shanghai) and seven provinces (Jiang- su, Zhejiang, Anhui, Fujian, Jiangxi, Shandong and Taiwan). Central-south China four provinces (Henan, Hubei, Hunan, and Guangdong) and one autonomous region (Guangxi). South- west China three provinces (Sichuan, Guizhou, and Yunnan) and one autonomous region (Xizang). Northwest China three provinces (Shaanxi, Gansu, and Qinghai) and two autonomous regions (Ningxia and Xinjiang).
GeoJournal 20.4/1990 407
References
Chai, Xiaolin; Xie, Zhengjiang: The People's Bank of China Has Adopted Urgent Measures of Controlling Currency. Economic Daily of China. Beijing (August 18, 1988)
Chen, Kuan et al.: New Estimates of Fixed Investment and Capital Stock for Chinese State Industry. The Chinese Quarterly 114, 243-266 (1988)
Cheng, Chu-yuan: China's Economic Development - Growth and Structural Change. Westview Press, Boulder, Colorado 1982.
Dutt, Ashok K.; Costa, Frank J.: An Evaluation of National Eco- nomic Planning in the People's Republic of China. Geoforum 11, 1-15 (1980)
Eckstein, Alexander; Galenson, Waiter: Economic Trends in Communist China. Aldine Publishing Company Chicago 1968.
Howe, Christopher: China's Economy - A Basic Guide. Paul Elek, London 1978.
Klenner, Wolfgang: The Chinese Economy: Transaction Books, New Brunswick 1985.
Song, Jia-tai: China's Economic Geography. The Publishing House of the Central Broadcasting and Television University of China, Beijing 1985.
The Statistical Bureau of China: Statistical Yearbook of China. The Statistical Publishing House of China, Beijing 1983-1987a.
The Statistical Bureau of China: China's Fixed Capitals Investment (1950-1985). The Statistical Publishing House of China, Bei- jing 1987b.
The Statistical Bureau of China: Social Statistics of China (1987). The Statistical Publishing House of China, Beijing 1987c.
Wu, Yuan-li: The Spatial Economy of Communist China. Praeger, New York 1967.
Xinhua News Agency: Keep Reform as the Key to All Tasks and Promote Stable Economic Development (an edited report about the conversation of the Chinese Premier, Li, Peng). Economic Daily of China (July 17, 1988)
Xinhua News Agency: Temporary Regulations of Currency Mana- gement (Draft) Has Been Approved in the Eighteenth Com- mission of the State Council. Economic Daily of China (August 17, 1988)
publication ailable in roform. versi ty Microfilms In ternat ional reproduces this
publ icat ion In microform: microfiche and 16mm or
35ram film. For information about this publication or any of the more t han 13,000 titles
we offer, complete and mail the coupon to: Universi ty Microfilms Internat ional , 300 N. Zeeb Road, Ann Arbor, MI 48106. Call us toll-free for an immediate response: 800-521-3044. Or call collect in Michigan, Alaska and Hawaii: 313-761-4700.
[ ] Please send information about these titles:
Name
Company/Institution
Address
' City
State Zip_
Phone{ )
Uni ..vgr . Micr6films
International
ZMBAS NIMBA5 NIMBAS, The Netherlands Institute for Bradford
MBA Studies has established a partnership with the University of Bradford Manage- ment Centre, one of Europe's leading business schools.
W h y study for the Bradford MBA in The Nether lands? As a small nation, with an open economy and an exceptional knowledge of foreign cultures and languages, the Netherlands has acquired through centu- ries of experience a great reputation and expertise in international business and trade. Ag.ainst the background of Euro p e 1992 the Netherlands business envi- ronment ~s the most dynamic location in which to study for your MBA degree.
NIMBAS-Bradford MBA: Key Facts • The NIMBAS-Bradford MBA has an excellent international reputation ~ The NIMBAS-Bradford MBA combines theory and practice, creating more
efficient and effective internationally-oriented managers The NIMBAS-Bradford MBA is designed for managers who already possess a mfiversity degree (or equivalent) and a minimum of two years work experience
• The NIMBAS-Bradford MBA is a 13 months Full-Time Programme, taught in English.
For fu r the r in fo rmat ion , please contact: Postgraduate Secretary, NIMBAS, P.O. Box 2040, 3500 GA Utrecht, The Netherlands. Fax: ...31 3409 1237.
Related Documents