NO. 13 MEETING OF THE Thursday, July 12, 2012 9:00 a.m. – 5:00 p.m. SCAG Office 818 W. 7 th Street, 12 th Floor Board Room Los Angeles, CA 90017 (213) 236-1800 If members of the public wish to review the attachments or have any questions on any of the agenda items, please contact Ma’Ayn Johnson at (213) 236-1975 or via email [email protected] SCAG, in accordance with the Americans with Disabilities Act (ADA), will accommodate persons who require a modification of accommodation in order to participate in this meeting. SCAG is also committed to helping people with limited proficiency in the English language access the agency’s essential public information and services. You can request such assistance by calling (213) 236-1993. We require at least 72 hours (three days) notice to provide reasonable accommodations. We prefer more notice if possible. We will make every effort to arrange for assistance as soon as possible. R EGIONAL H OUSING N EEDS A SSESSMENT A PPEALS B OARD

Welcome message from author
This document is posted to help you gain knowledge. Please leave a comment to let me know what you think about it! Share it to your friends and learn new things together.
Transcript
NO. 13 MEETING OF THE Thursday, July 12, 2012 9:00 a.m. – 5:00 p.m.
SCAG Office 818 W. 7th Street, 12th Floor Board Room Los Angeles, CA 90017 (213) 236-1800 If members of the public wish to review the attachments or have any questions on any of the agenda items, please contact Ma’Ayn Johnson at (213) 236-1975 or via email [email protected] SCAG, in accordance with the Americans with Disabilities Act (ADA), will accommodate persons who require a modification of accommodation in order to participate in this meeting. SCAG is also committed to helping people with limited proficiency in the English language access the agency’s essential public information and services. You can request such assistance by calling (213) 236-1993. We require at least 72 hours (three days) notice to provide reasonable accommodations. We prefer more notice if possible. We will make every effort to arrange for assistance as soon as possible.
RREEGGIIOONNAALL HHOOUUSSIINNGG NNEEEEDDSS
AASSSSEESSSSMMEENNTT AAPPPPEEAALLSS BBOOAARRDD
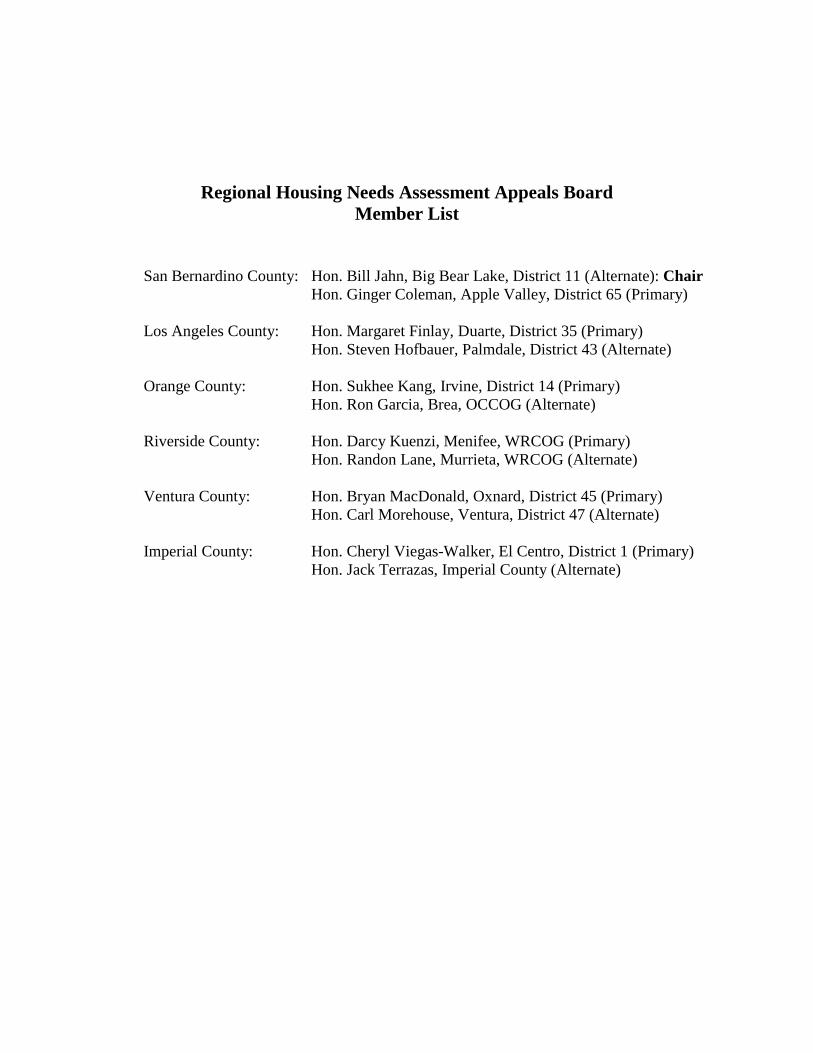
Regional Housing Needs Assessment Appeals Board Member List
San Bernardino County: Hon. Bill Jahn, Big Bear Lake, District 11 (Alternate): Chair Hon. Ginger Coleman, Apple Valley, District 65 (Primary) Los Angeles County: Hon. Margaret Finlay, Duarte, District 35 (Primary)
Hon. Steven Hofbauer, Palmdale, District 43 (Alternate) Orange County: Hon. Sukhee Kang, Irvine, District 14 (Primary)
Hon. Ron Garcia, Brea, OCCOG (Alternate) Riverside County: Hon. Darcy Kuenzi, Menifee, WRCOG (Primary)
Hon. Randon Lane, Murrieta, WRCOG (Alternate) Ventura County: Hon. Bryan MacDonald, Oxnard, District 45 (Primary)
Hon. Carl Morehouse, Ventura, District 47 (Alternate) Imperial County: Hon. Cheryl Viegas-Walker, El Centro, District 1 (Primary)
Hon. Jack Terrazas, Imperial County (Alternate)

AMENDED R E G I O N A L H O U S I N G N E E D S A S S E S S M E N T
APPEALS BOARD A G E N D A
JULY 12, 2012
i
The Regional Housing Needs Assessment Appeals Board can consider and act upon any of the items listed on the agenda regardless of whether they are listed as information or action items.
CALL TO ORDER & PLEDGE OF ALLEGIANCE (Hon. Bill Jahn, Chair)
PUBLIC COMMENT PERIOD – Members of the public desiring to speak on items on the agenda, or items not on the agenda, but within the purview of the Regional Housing Needs Assessment Appeals Board, must fill out and present a speaker’s card to the Assistant prior to speaking. Comments will be limited to three (3) minutes. The Chair may limit the total time for all comments.
REVIEW AND PRIORITIZE AGENDA ITEMS
CONSENT CALENDAR Time Page No.
Approval Item 1. Minutes of the April 19 and April 24, 2012 Meetings Attachment 1 2. RHNA Subcommittee Topic Outlook Attachment 14 3. Revised Schedule of July 12 and July 13, 2012 Public
Hearing on RHNA Appeals Attachment 16
ACTION ITEMS
4.
Public Hearings to Consider Appeals Submitted by Jurisdictions Related to the Draft RHNA Allocation (Huasha Liu, Director, Land Use & Environmental Planning and Joann Africa, Chief Counsel) Recommended Action: Review the appeals submitted by seven (7) jurisdictions regarding their respective Draft RHNA Allocations; review corresponding staff recommendations as reflected in the staff reports; and make a determination to grant, partially grant, or deny each appeal. 9:00 a.m. – 12:15 p.m. 4.1 Appeal from the City of Calabasas 4.2 Appeal from the City of Long Beach 4.3 Appeal from the City of Norwalk 12:45 p.m. – 5:00 p.m. 4.4 Appeal from the City of San Dimas 4.5 Appeal from the City of Sierra Madre 4.6 Appeal from the City of Pico Rivera 4.7 Appeal from the City of Dana Point
Attachment
Attachment Attachment Attachment Attachment Attachment Attachment Attachment
10 min.
60 min. 60 min. 60 min. 60 min. 60 min. 60 min. 60 min.
17 20 73 87 98 117 159 352
AMENDED R E G I O N A L H O U S I N G N E E D S A S S E S S M E N T
APPEALS BOARD A G E N D A
JULY 12, 2012
ii
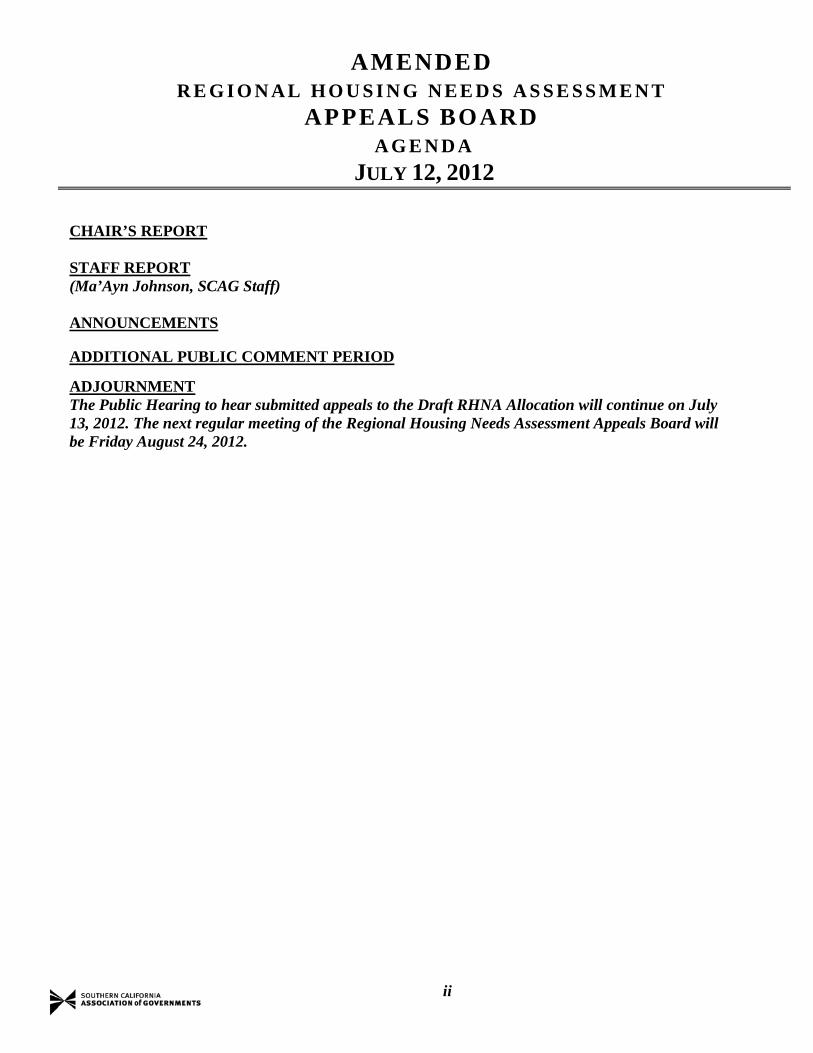
CHAIR’S REPORT STAFF REPORT (Ma’Ayn Johnson, SCAG Staff) ANNOUNCEMENTS
ADDITIONAL PUBLIC COMMENT PERIOD
ADJOURNMENT The Public Hearing to hear submitted appeals to the Draft RHNA Allocation will continue on July 13, 2012. The next regular meeting of the Regional Housing Needs Assessment Appeals Board will be Friday August 24, 2012.
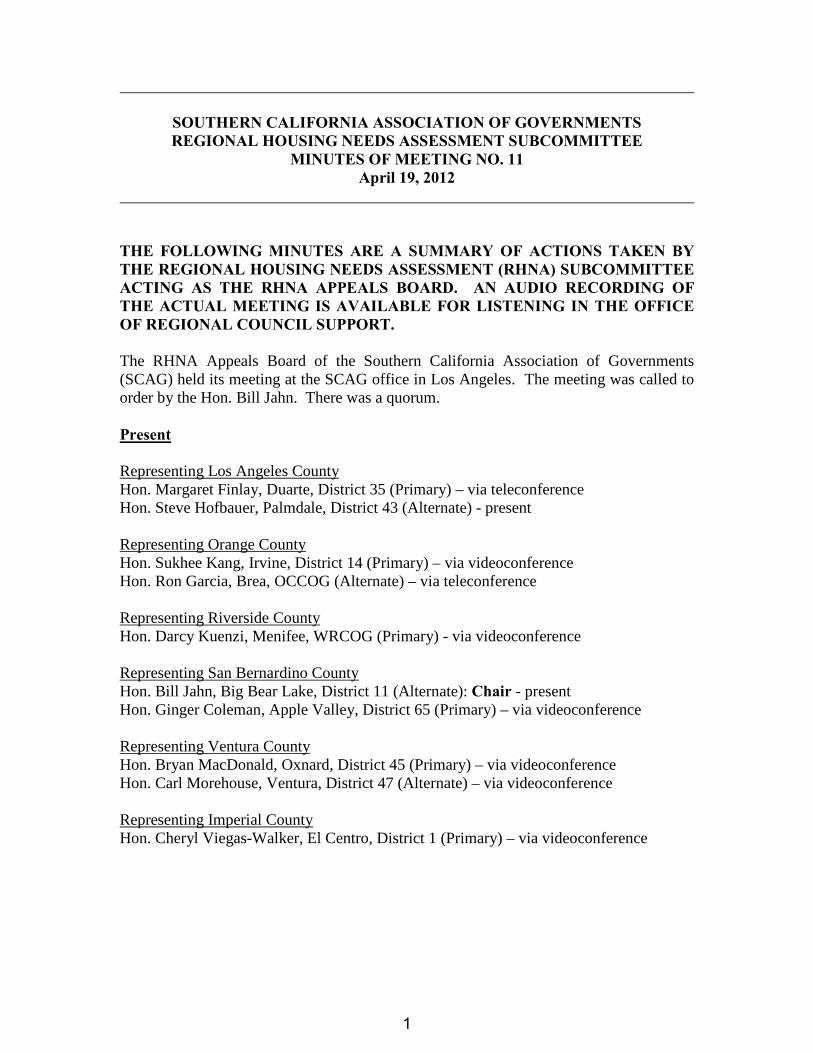
SOUTHERN CALIFORNIA ASSOCIATION OF GOVERNMENTS REGIONAL HOUSING NEEDS ASSESSMENT SUBCOMMITTEE
MINUTES OF MEETING NO. 11 April 19, 2012
THE FOLLOWING MINUTES ARE A SUMMARY OF ACTIONS TAKEN BY THE REGIONAL HOUSING NEEDS ASSESSMENT (RHNA) SUBCOMMITTEE ACTING AS THE RHNA APPEALS BOARD. AN AUDIO RECORDING OF THE ACTUAL MEETING IS AVAILABLE FOR LISTENING IN THE OFFICE OF REGIONAL COUNCIL SUPPORT. The RHNA Appeals Board of the Southern California Association of Governments (SCAG) held its meeting at the SCAG office in Los Angeles. The meeting was called to order by the Hon. Bill Jahn. There was a quorum. Present Representing Los Angeles County Hon. Margaret Finlay, Duarte, District 35 (Primary) – via teleconference Hon. Steve Hofbauer, Palmdale, District 43 (Alternate) - present Representing Orange County Hon. Sukhee Kang, Irvine, District 14 (Primary) – via videoconference Hon. Ron Garcia, Brea, OCCOG (Alternate) – via teleconference Representing Riverside County Hon. Darcy Kuenzi, Menifee, WRCOG (Primary) - via videoconference Representing San Bernardino County Hon. Bill Jahn, Big Bear Lake, District 11 (Alternate): Chair - present Hon. Ginger Coleman, Apple Valley, District 65 (Primary) – via videoconference Representing Ventura County Hon. Bryan MacDonald, Oxnard, District 45 (Primary) – via videoconference Hon. Carl Morehouse, Ventura, District 47 (Alternate) – via videoconference Representing Imperial County Hon. Cheryl Viegas-Walker, El Centro, District 1 (Primary) – via videoconference
1
2
CALL TO ORDER AND PLEDGE OF ALLEGIANCE The Hon. Bill Jahn, Chair, called the meeting to order at 12:03 p.m. Hon. Steve Hofbauer led the pledge of allegiance. REVIEW AND PRIORITIZE AGENDA ITEMS CONSENT CALENDAR Approval Items
1. Minutes of December 9, 2011 Meeting 2. RHNA Subcommittee Topic Outlook
A motion was made (Finlay) to approve the Consent Calendar. The motion was seconded (Garcia) and unanimously approved. PUBLIC COMMENT Robert Clark, City Manager, City of Ojai, stated that ten (10) jurisdictions who submitted revision requests submitted letters requesting additional time to work with SCAG to review and further develop the RHNA numbers with respect to the reductions requested by the 10 jurisdictions. These reductions could be accommodated by using part of the “cushion” of 3,661 units. Damon Wing from the Office of Ventura County Supervisor Linda Parks read a letter from Supervisor Parks. The letter stated that the Ventura County General Plan established smart growth planning principles in 1969 through a public input process. The County’s General Plan sought to protect farmland and direct growth into the incorporated cities. Additionally, the Draft RHNA Allocation seeks to utilize unincorporated parts of Ventura County while reducing the Allocation to 9 of the 10 cities in the County, which is contrary to local planning. Chair Jahn stated that the RHNA Subcommittee proceeds according to a specified schedule established and approved by the Community, Economic and Human Development Committee (CEHD) and the Regional Council and does not have the discretion to continue efforts outside the designated schedule without Regional Council approval. Huasha Liu stated that questions have been received asking if the current cushion of 3,661 units can be used in the revision appeals process. Ms. Liu stated that, under the housing law, the cushion can only be applied as part of a successful revision request, not as part of a successful appeal or trade and transfer. If there are successful appeals, the difference will be reallocated proportionally back to all the jurisdictions in the SCAG region.
2
3
ACTION ITEMS 3. Revision Requests Submitted by Jurisdictions Related to the Draft RHNA Allocation Huasha Liu, SCAG Staff, provided a brief summary of the RHNA process to date. Ms. Liu stated that the RHNA process has been a two and half-year process, which local input has been sought regarding regional growth including population, household and employment. Additionally, SCAG received projected household numbers from local jurisdictions. The projected household numbers received from the jurisdictions were the basis for SCAG to develop the RHNA Allocations. Ms. Liu stated that staff had reviewed each of the fourteen (14) submitted revision requests and made recommendations to the RHNA Appeals Board. Ms. Liu also briefly explained the proposed procedure for the RHNA Appeals Board to review the respective revision requests as part of today’s meeting. 3.1 Revision Request by the City of Calabasas Tom Bartlett, City Planner, City of Calabasas, stated that he is requesting a revision due to the following local planning factors: the existing or projected jobs-housing balance; distribution of household growth assumed for purposes of comparable Regional Transportation Plans; and market demand for housing. The City requests a reduction of 76 units from its Draft RHNA Allocation of 330 units. Mr. Bartlett stated that the household growth forecast was inconsistent with the population forecast. Additionally, the recession has lasted longer than the anticipated slowing job growth. Huasha Liu stated that the growth information was received from the City of Calabasas and SCAG staff processed accordingly. Additionally, RHNA is a planning process, which involves a city’s zoning activity and not a building quota. Having reviewed the City’s revision request and staff’s recommendation, the RHNA Appeals Board completed its discussion. A motion was made (Coleman) to accept staff’s recommendation to deny the revision request by the City of Calabasas. The motion was seconded (Kuenzi) and approved by the RHNA Appeals Board by a 5 to 1 vote (with Imperial County voting in opposition to the motion). 3.2 Revision Request by the City of La Puente John Di Mario, Development Services Director, City of La Puente, stated a revision request is sought based on several local planning factors. These include availability of land suitable for urban development; distribution of household growth assumed for purposes of comparable Regional Transportation Plans; and market demand for housing. The City of La Puente requests a reduction of 161 units from its Draft RHNA Allocation of 967 units. Additionally, Mr. Di Mario noted that while Census tracts 4070.01, 4070.02 and 4082.02 were included in the growth forecast process, these tracts are outside the City. Although these tracts were at first approved by the City officials in the RHNA process, they are actually outside the City and merit exclusion. It was determined that SCAG staff would need additional time to review the information about the above-mentioned Census tracts
3
4
with the City. Chair Jahn requested that discussion of the matter by the Appeals Board would continue later in the meeting after the information had been reviewed by staff. Later in the meeting, discussion and consideration of the requested revision by the City of La Puente continued. John Di Mario stated, after discussion and calculations with SCAG staff, it was determined that a reduction of 149 units is now sought to balance the inadvertent inclusion of the Census tracts not within the jurisdiction. Huasha Liu stated that calculations were revised for two Census tracts while the other in question will remain within the City’s total. Therefore, SCAG staff recommends a reduction of 149 units. This would modify the Draft Allocation from 967 units to 818 units. Having reviewed the City’s revision request and staff’s recommendation, the RHNA Appeals Board completed its discussion. A motion was made (Kuenzi) to accept the staff’s recommendation to reduce the City of La Puente’s Draft Allocation by 149 units, which reduces the City’s total Draft Allocation from 967 units to 818 units. The motion was seconded (Kang) and approved by the RHNA Appeals Board by a 6 to 0 vote. 3.3 Revision Request by the City of Long Beach Jill Griffiths, Planning Officer, City of Long Beach, stated a revision is sought due to several local planning factors: an existing or projected jobs-housing balance; availability of land suitable for urban development for conversion to residential use; distribution of household growth assumed for purposes of comparable Regional Transportation Plans; market demand for housing; and housing needs generated by the presence of a university campus. The City of Long Beach requests a reduction of 1,088 units from its Draft RHNA Allocation of 7,048 units. Having reviewed the City’s revision request and staff’s recommendation, the RHNA Appeals Board completed its discussion. A motion was made (Kuenzi) to deny the requested revision. The motion was seconded (Coleman) and approved by the RHNA Appeals Board by a 6 to 0 vote. 3.4 Revision Request by the City of Pico Rivera Julia Gonzalez, Deputy Director of Public Works, City of Pico Rivera, requested a reduction in its Draft RHNA Allocation based on several local planning factors. These include: existing or projected jobs-housing balance; sewer or water infrastructure constraints for additional development; and availability of land suitable for urban development or for conversion to residential use and distribution of household growth. Due to these factors the City requests a reduction of an unspecified amount to its Draft RHNA Allocation of 850 units. Having reviewed the City’s revision request and staff’s recommendation, the RHNA Appeals Board completed its discussion. A motion was made (Coleman) to accept the staff recommendation to deny the requested revision. The motion was seconded (MacDonald) and approved by the Appeals Board by a 6 to 0 vote.
4
5
3.5 Revision Request by the City of San Dimas Larry Stevens, Assistant City Manager, City of San Dimas, stated a revision is sought due to the following planning factors: availability of land suitable for urban development or for conversion to residential use; lands protected from urban development under existing federal or state programs; and distribution of household growth and market demand for housing and loss of units contained in assisted housing developments. The City of San Dimas requests a reduction of an unspecified number of units of the 463 units allocated. Having reviewed the City’s revision request and staff’s recommendation, the RHNA Appeals Board completed its discussion. A motion was made (Kuenzi) to deny the requested revision. The motion was seconded (Hofbauer) and approved by the Appeals Board by a 6 to 0 vote. 3.6 Revision Request by the City of Santa Monica Ms. Elizabeth Bar-El, Senior Planner, City of Santa Monica, stated a revision is sought based on the distribution of household growth assumed for purposes of comparable Regional Transportation Plans. The City requests a reduction of 1,174 units from its Draft RHNA Allocation of 1,674 units. Several housing construction projects were started in 2012, which demonstrates continued efforts to provide housing balance. Hon. Steve Hofbauer asked if the additional units under construction placed the city beyond its 4th cycle RHNA Allocation and by how many units. Ms. Bar-El stated the City met its 4th cycle RHNA Allocation in 2011 and estimates at least half the units receiving permits in 2012 exceed the 4th cycle RHNA Allocation. Huasha Liu stated SCAG staff is not aware of the City exceeding its 4th cycle RHNA requirements. Even if this is the case, the state housing law does not allow jurisdictions taking any credit towards the 5th cycle of RHNA for any built units from the previous cycle. Hon. Bryan MacDonald stated the information presented by the City lacks some specifics and he is therefore hesitant to approve a revision request. Having reviewed the City’s revision request and staff’s recommendation, the RHNA Appeals Board completed its discussion. A motion was made (MacDonald) to deny the requested revision. The motion was seconded (Kuenzi) and approved by the Appeals Board by a 5 to 1 vote (with Imperial County voting in opposition to the motion). 3.7 Revision Request by the City of Sierra Madre MaryAnn MacGillivray, Councilmember, City of Sierra Madre, stated the City seeks a reduction of its Draft RHNA Allocation of 55 units. This reduction is sought based on the following planning factors: existing or projected jobs-housing balance; sewer or water infrastructure constrains for additional development; availability of land suitable for urban development; lands protected from urban development under existing programs; distribution of household growth; loss of units contained in assisted housing developments and high housing cost burdens; housing needs of farmworkers; and housing needs generated by the presence of a university campus.
5

6
The City’s particular circumstance based on location, size and the uniqueness of Sierra Madre warrants consideration for a revision. Furthermore, they are the only city in San Gabriel Valley whose water supply is based entirely on ground water sources and therefore, requests a RHNA Allocation revision to zero units. Having reviewed the City’s revision request and staff’s recommendation, the RHNA Appeals Board completed its discussion. A motion was made (MacDonald) to deny the requested revision. The motion was seconded (Kuenzi) and approved by the Appeals Board by a 6 to 0 vote. 3.8 Revision Request by the City of Placentia John Douglas, representative for the City of Placentia, stated the City seeks a reduction of 131 units from its Draft RHNA Allocation of 492 units. This would result in a revised total of 361 units. The primary issue for the City involves the pro-rated interpolation made by SCAG staff when the change was made from the 10.75 year period to the 7.75 year period. The use of a straight line reduction of the 10.75 to the 7.75 year period resulted in a skewed Draft Allocation number as the growth forecast was substantially larger for the 2010 to 2015 period as opposed to the later years. Hon. Bryan MacDonald stated there is concern about altering methodology for different jurisdictions and it is important to remain consistent in the process. After discussion by the Appeals Board a motion was made by Hon. Sukhee Kang to approve the City’s request to decrease its Allocation by 131 units. There was no second submitted for the motion and the motion was not considered for lack of a second. Having reviewed the City’s revision request and staff’s recommendation, the RHNA Appeals Board completed its discussion. A motion was made (Hofbauer) to accept staff’s recommendation to deny the City’s revision request. The motion was seconded (Coleman) and approved by the RHNA Appeals Board by a 4 to 2 vote (with Imperial and Orange Counties voting in opposition to the motion). 3.9 Revision Request by the City of Calimesa The City of Calimesa requests a revision of its Draft RHNA Allocation based on local planning factors including sewer or water infrastructure constraints for additional development and market demand for housing. The City requests a reduction of 1,171 units from its total Allocation of 2,341 units. It was noted for the record that there were no representatives from the City of Calimesa present at the SCAG Los Angeles office or any of the SCAG Regional Offices. The request was presented to SCAG staff for response. Huasha Liu referred to the staff report, which outlines details in response to the revision request. Chair Jahn then presented the matter to the RHNA Appeals Board for discussion.
6

7
Having reviewed the City’s revision request and staff’s recommendation, the RHNA Appeals Board completed its discussion. A motion was made (MacDonald) to deny the requested revision. The motion was seconded (Kuenzi) and approved by the Appeals Board by a 6 to 0 vote. 3.10 Revision Request by the City of Norco The City of Norco requests a revision of its Draft RHNA Allocation based on the lack of availability of land suitable for urban development and high housing cost burdens. Because of these constraints, the City of Norco requests a reduction of an unspecified number of units from its Draft RHNA Allocation of 818 units. It was noted for the record that there were no representatives from the City of Norco present at the SCAG Los Angeles office or any of the SCAG Regional Offices. The request was presented to SCAG staff for response. Huasha Liu referred to the staff report, which recommends denial of the requested revision with detailed rationale. Having reviewed the City’s revision request and staff’s recommendation, the RHNA Appeals Board completed its discussion. A motion was made (Coleman) to deny the requested revision. The motion was seconded (Kang) and approved by the Appeals Board by a 6 to 0 vote. 3.11 Revision Request by the City of Fillmore Hon. Gayle Washburn, Mayor, City of Fillmore, presented the revision request from SCAG’S regional office in Ventura. She stated that the City is seeking a reduction of 100 Very-Low Income units and 100 Low Income units from its Draft RHNA Allocation of 694 units. This revision is sought based on the following planning factors: existing or projected jobs-housing balance; availability of land suitable for urban development or for conversion to residential use; county policies to preserve prime agricultural land; and market demand for housing. Huasha Liu, SCAG Staff, stated that the City’s 5th Cycle RHNA Allocation is 30 percent lower than its 4th Cycle RHNA Allocation. Staff recommended denying the City’s revision request to reduce its Draft RHNA Allocation. Having reviewed the City’s revision request and staff’s recommendation, the RHNA Appeals Board completed its discussion. A motion was made (Coleman) to accept the staff recommendation and deny the requested revision. The motion was seconded (Kuenzi) and approved by the Appeals Board by a 6 to 0 vote. 3.12 Revision Request by the City of Ojai Robert Clark, City Manager, City of Ojai, stated that a revision is sought due to the following: existing or projected jobs-housing balance; availability of land suitable for urban development or for conversion to residential use; and distribution of household growth assumed for purposes of comparable Regional Transportation Plans. Because of
7

8
these constraints, the City of Ojai requests a reduction of 240 units from its Draft RHNA Allocation of 371 units. Huasha Liu, SCAG Staff, stated that the city’s 5th cycle RHNA Allocation is 14 percent lower than its 4th cycle Allocation. Staff recommended denying the City’s revision request to reduce its Draft RHNA Allocation. Having reviewed the City’s revision request and staff’s recommendation, the RHNA Appeals Board completed its discussion. A motion was made by Hon. Darcy Kuenzi to approve a partial reduction of 120 units for the City of Ojai. There was no second submitted for the motion and the motion was not considered for lack of a second. A motion was made (Coleman) to accept the staff recommendation and deny the requested revision. The motion was seconded (Kang) and approved by the Appeals Board by a 6 to 0 vote. 3.13 Revision Request by the City of Oxnard Chris Williamson, Principal Planner, City of Oxnard, presented the revision request from SCAG’s Regional Office in Ventura. Mr. Williamson stated that a revision is sought due to several factors including sewer and water infrastructure constraints for additional development, county policies to preserve prime agricultural land, market demand for housing, and county-city agreements to direct growth toward incorporated areas of the county. Mr. Williamson stated a revision is requested to reduce the City of Oxnard’s Draft RHNA Allocation by 2,801 units from its current Allocation of 7,301 units. Mr. Williamson noted a 2008 Decapolis population report indicating growth in the jurisdiction to reach 71,602 for the year 2040. There is concern growth is frontloaded in the first 10 years of Oxnard’s General Plan and conflicts with planning for their new water plan and facility. Chair Jahn asked if the City of Oxnard is under a building moratorium. Mr. Williamson stated the city is not under a building moratorium. Huasha Liu, SCAG staff, stated that consideration for a revision request is based on the revision request’s merit for a particular jurisdiction and not related to any action related to a neighboring jurisdiction. Additionally, the 2008 Decapolis Report was based on 2000 Census data and was associated with the 2008 Regional Transportation Plan (RTP). Current RHNA Allocations are based on the 2010 Census, and the 2012 RTP/Sustainable Communities Strategy (SCS). Having reviewed the City’s revision request and staff’s recommendation, the RHNA Appeals Board completed its discussion. A motion was made (Kuenzi) to deny the requested revision. The motion was seconded (Coleman) and approved by the Appeals Board by a 5 to 1 vote (with Los Angeles County voting in opposition to the motion). 3.14 Revision Request by Ventura County Chris Stephens, Director, Resource Management Agency, County of Ventura, stated that a revision is sought due to the following factors: existing or projected jobs-housing balance; sewer or water infrastructure constraints for additional development; availability
8
9
of land suitable for urban development; county policies to preserve prime agricultural land; distribution of household growth assumed for purposes of comparable Regional Transportation Plans; market demand for housing; county-city agreements to direct growth toward incorporated areas of the county; high housing cost burdens; housing needs of farmworkers; and housing needs generated by the presence of a university campus. Because of these constraints, the County of Ventura requests a reduction of 536 units from its Draft RHNA Allocation of 1, 410 units. Mr. Stephens stated that he felt the County of Ventura should not grow at a rate greater than the cities within the County. The County’s reductions average 38% and if that percentage was applied to the County’s RHNA numbers, it would represent a total Allocation of 1,115 units. This would have the unincorporated areas grow at the same rate as the cities. A motion was made (Hofbauer) to reduce the County of Ventura’s Allocation to 1,115 units and seconded (Kuenzi). The motion was approved by the RHNA Appeals Board by a 4 to 2 vote (with Orange and Riverside Counties voting in opposition to the motion). CHAIR’S REPORT None. STAFF REPORT Huasha Liu stated that SCAG staff has been asked to revisit the RHNA Trade and Transfer Guidelines. At its February meeting, the Regional Council approved the Trade and Transfer Guidelines. However, a need to revisit the guidelines has arisen, particularly with respect to the subject in the Guidelines that jurisdictions must be contiguous. SCAG staff is making minor amendments to the Trade and Transfer Guidelines and requests a meeting of the RHNA Subcommittee sometime during the week of April 23, 2012. As further background information, Joann Africa, SCAG Staff, stated that the current Trade and Transfer Guidelines indicate that local jurisdictions deciding to trade Draft RHNA Allocation units must be geographically contiguous. Ms. Africa stated that it would be useful to bring this item back to the RHNA Subcommittee and subsequently to the CEHD. Timeliness is important as some jurisdictions may be considering utilizing the trade and transfer process instead of pursuing an appeal. It is beneficial to the process and stakeholders to seek an amendment so it can be timely brought to the Regional Council meeting on May 3, 2012. This amendment would provide a resolution prior to the appeals deadline of May 29, 2012. The RHNA Appeals Board directed staff to schedule a meeting for April 24, 2012 to consider this matter. ANNOUNCEMENTS None
9
10
ADDITIONAL PUBLIC COMMENT None ADJOURNMENT The Regional Housing Needs Assessment Subcommittee Appeals Board meeting adjourned at 4:22 p.m. The next meeting of the RHNA Subcommittee will be April 24, 2012.
Huasha Liu Director, Land Use and
Environmental Planning
10

SOUTHERN CALIFORNIA ASSOCIATION OF GOVERNMENTS REGIONAL HOUSING NEEDS ASSESSMENT SUBCOMMITTEE
MINUTES OF MEETING NO. 12 April 24, 2012
THE FOLLOWING MINUTES ARE A SUMMARY OF ACTIONS TAKEN BY THE REGIONAL HOUSING NEEDS ASSESSMENT SUBCOMMITTEE. AN AUDIO RECORDING OF THE ACTUAL MEETING IS AVAILABLE FOR LISTENING IN THE OFFICE OF REGIONAL COUNCIL SUPPORT. The Regional Housing Needs Assessment Subcommittee of the Southern California Association of Governments (SCAG) held its meeting at the SCAG office in Los Angeles. The meeting was called to order by the Hon. Bill Jahn. There was a quorum. Present Representing Los Angeles County Hon. Margaret Finlay, Duarte, District 35 (Primary) – present Representing Orange County Hon. Sukhee Kang, Irvine, District 14 (Primary) – via videoconference Hon. Ron Garcia, Brea, OCCOG (Alternate) – via teleconference Representing Riverside County Hon. Darcy Kuenzi, Menifee, WRCOG (Primary) - via videoconference Representing San Bernardino County Hon. Bill Jahn, Big Bear Lake, District 11 (Alternate): Chair – via videoconference Hon. Ginger Coleman, Apple Valley, District 65 (Primary) – via videoconference Representing Ventura County Hon. Carl Morehouse, Ventura, District 47 (Alternate) – via videoconference Representing Imperial County Hon. Cheryl Viegas-Walker, El Centro, District 1 (Primary) – via videoconference CALL TO ORDER AND PLEDGE OF ALLEGIANCE The Hon. Bill Jahn, Chair, called the meeting to order at 9:05 a.m. PUBLIC COMMENT None
11

2
ACTION ITEMS 1. Proposed Amendment to SCAG’s Guidelines Related to the RHNA Trade & Transfer
Process Joann Africa, SCAG Chief Counsel, provided a summary of the proposed amendment. She stated that in February 2012 the RHNA Subcommittee, the Community, Economic & Human Development Committee, and the Regional Council reviewed and approved the RHNA Procedures for Revision Requests, Appeals and Trade & Transfer. At that time, staff noted that an amendment may be forthcoming as questions were received regarding the Trade & Transfer Guidelines and the particular guidance related to the jurisdictions that are geographically contiguous. An amendment to the trade and transfer process is being proposed in order to provide greater latitude to jurisdictions. According to law, as long as the trading jurisdictions agree to a redistribution of their Draft Allocations and it equals the original Allocation total by income categories, the Council of Governments will accept the trade and transfer. A need to address this issue has arisen as some jurisdictions may be considering a trade and transfer rather than pursuing an appeal. The modification is consistent with the primary recommendation but adds flexibility for trades between jurisdictions not within the same county. Hon. Margaret Finlay asked what advantage a jurisdiction receives by accepting a greater number of units. Huasha Liu, SCAG Staff, stated that a jurisdiction may seek a greater number of units as an opportunity to pursue greater economic growth as part of local development or redevelopment efforts. A motion was made (Finlay) to approve staff recommendation and submit the proposed revisions to the Community, Economic & Human Development Committee. The motion was seconded (Morehouse) and approved by the Subcommittee by a 6 to 0 vote. CHAIR’S REPORT None STAFF REPORT None
12
3
ADJOURNMENT Hon. Margaret Finlay adjourned the meeting at 9:14 a.m. The next meeting of the RHNA Subcommittee is scheduled for June 18, 2012.
____________________________
Huasha Liu Director, Land Use and
Environmental Planning
13

RHNA Schedule (February 2011 to September 2012)
MJ: 07/11/12
RHNA Subcommittee Topic Outlook
Meeting Proposed Date Subject Action 1 February 23,
2011 Overview of RHNA Process; review RHNA Task Force recommendations; RHNA work plan and schedule; subregional delegation guidelines; evaluate issues between the DOF and Census projections; notification to HCD and Caltrans of RTP/SCS adoption date; discussion on Integrated Growth Forecast foundation
Approve charter; approve RHNA work plan and schedule; recommend to CEHD to notify HCD and Caltrans of RTP/SCS adoption date
2 March 22, 2011 Subcommittee Charter; subregional delegation
Approve the RHNA Subcommittee Charter
3 April 19, 2011 Changes to housing element requirements; AB 2158 factor discussion; Draft RHNA Methodology framework, Subregional delegation agreement
4 May 27, 2011 Regional determination update; Social equity adjustment discussion; Subregional delegation agreement,
Provide direction on subregional delegation
5 June 24, 2011 Update on RHNA consultation with HCD; social equity adjustment; replacement needs survey; AB 2158 factor survey
Recommend a social equity adjustment to CEHD
6 August 12, 2011 Replacement need survey results; AB 2158 factor survey results; continued discussion on Methodology: overcrowding; at-risk affordable units; high housing cost burdens; farmworker housing
7 August 26, 2011 Continued discussion on proposed RHNA Methodology
Recommend proposed Methodology to CEHD
8 September 16, 2011
RHNA annexation policy
9 October 11, 2011 Proposed RHNA Methodology excess vacancy credit application
11 November 4, 2011
RHNA Annexation Policy Recommend approval of annexation policy
12 December 9, 2011
Discuss Draft RHNA Allocation Plan; RHNA revisions and appeals process guidelines; proposed guidelines on RHNA transfers relating to annexation and incorporation
Recommend Draft RHNA Allocation Plan; recommend RHNA revisions and appeals process guidelines; recommend proposed guidelines on RHNA transfers relating to annexation and incorporation
13 April 19, 2012 Review submitted revision requests Determine revision requests 14 July 12, 2012 Hearing on appeals Determine appeals 15 July 13, 2012 Hearing on appeals Determine appeals 16 July 2012 (TBD) Review and ratify the decisions on appeals Issue written decisions regarding appeals 17
August 24, 2012 Final meeting Recommend to CEHD proposed Final RHNA Allocation Plan
14

RHNA Schedule (February 2011 to September 2012)
MJ: 07/11/12
CEHD and Regional Council
Proposed Date Meeting Action March 3, 2011 CEHD Approve Subcommittee charter;
approve RHNA schedule and work plan
April 7, 2011 CEHD Approve Subcommittee charter April 7, 2011 Regional Council Approve RHNA schedule June 2, 2011 CEHD and Regional Council Approve subregional delegation
agreement June 2, 2011 Regional Council Approve Subcommittee charter September 1, 2011
CEHD Recommend release of proposed RHNA Methodology
September 1, 2011
Regional Council Release proposed RHNA Methodology
November 3, 2011
CEHD Recommend Final RHNA Methodology
November 3, 2011
Regional Council Approve Final RHNA Methodology
January 5, 2012
CEHD Recommend Regional Council distribution of Draft RHNA Allocation Plan; recommend approval of revisions and appeals guidelines; recommend proposed guidelines on RHNA transfers relating to annexation and incorporation
February 2 2012
Regional Council Approve distribution of Draft RHNA Allocation Plan; approve RHNA revisions and appeals guidelines; approve guidelines on RHNA transfers relating to annexation and incorporation
September 6, 2012
CEHD Approve proposed Final RHNA Allocation
October 4, 2012
Regional Council Public hearing to adopt Final RHNA Allocation
15
Agenda Item 3
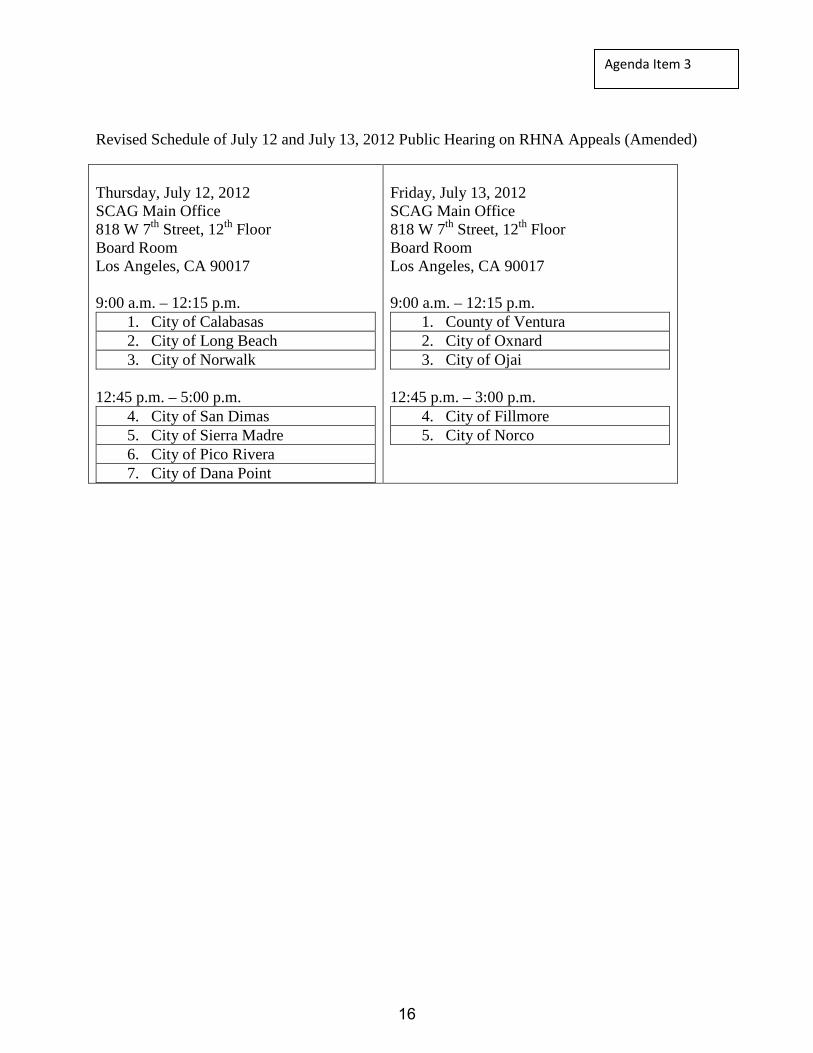
Revised Schedule of July 12 and July 13, 2012 Public Hearing on RHNA Appeals (Amended)
Thursday, July 12, 2012 SCAG Main Office 818 W 7th Street, 12th Floor Board Room Los Angeles, CA 90017 9:00 a.m. – 12:15 p.m.
1. City of Calabasas 2. City of Long Beach 3. City of Norwalk
12:45 p.m. – 5:00 p.m.
4. City of San Dimas 5. City of Sierra Madre 6. City of Pico Rivera 7. City of Dana Point
Friday, July 13, 2012 SCAG Main Office 818 W 7th Street, 12th Floor Board Room Los Angeles, CA 90017 9:00 a.m. – 12:15 p.m.
1. County of Ventura 2. City of Oxnard 3. City of Ojai
12:45 p.m. – 3:00 p.m.
4. City of Fillmore 5. City of Norco
16

Agenda Item 4
DATE: July 12, 2012
TO: Regional Housing Needs Assessment (RHNA) Appeals Board
FROM: Huasha Liu, Director, Land Use and Environmental Planning, 213-236-1838, [email protected] Joann Africa, Chief Counsel, 213-236-1928, [email protected]
SUBJECT: Public Hearings to Consider Appeals Submitted by Jurisdictions Related to the Draft RHNA Allocation
EXECUTIVE DIRECTOR’S APPROVAL:
RECOMMENDED ACTION: Hold the required public hearings to review the appeals submitted by twelve (12) jurisdictions regarding their respective Draft RHNA Allocations; review corresponding staff recommendations as reflected in the staff reports; and make a determination to grant, partially grant, or deny each appeal. EXECUTIVE SUMMARY: As part of the process to develop the RHNA Allocation Plan, jurisdictions may submit an appeal to their respective Draft RHNA Allocation, which was approved for distribution by the Regional Council on February 2, 2012. The appeals of the twelve (12) jurisdictions will be considered by the RHNA Appeals Board as part of the public hearings to take place on July 12 and 13, 2012. Each of the jurisdictions was properly notified of these public hearings. SCAG staff has reviewed each appeal and its supporting documentation, and is providing recommendations to the RHNA Appeals Board for action. STRATEGIC PLAN: This item supports SCAG’s Strategic Plan; Goal 1: Improve Regional Decision Making by Providing Leadership and Consensus Building on Key Plans and Policies; Objective a: Create and facilitate a collaborative and cooperative environment to produce forward thinking regional plans. BACKGROUND: SCAG’s Regional Council has delegated to the RHNA Subcommittee the responsibility of reviewing and making the final decisions regarding RHNA-related revision requests and appeals. This is set forth in the RHNA Subcommittee Charter approved by the Regional Council on June 2, 2011. Specifically, the Charter provides that the RHNA Subcommittee will be responsible to “review and make the final decisions regarding revisions requests and appeals submitted by a local jurisdiction related to the jurisdiction’s Draft RHNA Allocation. In this capacity, the RHNA Subcommittee shall be known as the “RHNA Appeals Board.” These decisions of the RHNA Appeals Board are final, and shall not be reviewed by the CEHD Committee or by the Regional Council. The Draft 5th RHNA Allocation Plan was approved for distribution by the SCAG Regional Council on February 2, 2012. The Draft Allocation Plan is a result of the two-year Integrated Growth Forecast process
17

Agenda Item 4
and the application of the RHNA Allocation Methodology, adopted by the Regional Council on November 3, 2011. Between 2009 and 2011, SCAG staff surveyed each of the region’s jurisdictions on their population, household, and employment projections as part of a collaborative process to develop the Integrated Growth Forecast. Jurisdictions were asked to provide input on this data as the basis to develop the 2012-2035 Regional Transportation Plan (RTP)/Sustainable Communities Strategy (SCS) and RHNA projections. During this time, SCAG staff engaged in extensive communication and data sharing with each jurisdiction in the SCAG region, including in-person meetings, to ensure the highest participation in gathering local input. Since January 2011, the RHNA Subcommittee held regular monthly meetings to discuss the RHNA process and policies, and to provide recommended actions to the CEHD. All jurisdictions and interested parties were notified of upcoming meetings to encourage active participation in the process. Recommendations from the RHNA Subcommittee requiring further action were reviewed by the CEHD and the Regional Council, as needed. In January 2011, SCAG distributed an informal planning factor (“AB 2158”) survey to all jurisdictions intended to request for additional information and input from jurisdictions to develop the SCS. The survey requested input regarding opportunities and constraints for development in their respective cities/counties, such as lack of water infrastructure, protected open space, and market demand for housing. Responses were due in March 2011. As a required component of the RHNA process, a formal AB 2158 planning factor survey was distributed in June 2011 to all jurisdictions, which included the same factors described in the prior informal survey. During this time, SCAG held five informal “Open House” sessions to answer questions about the survey and the RHNA process. SCAG used responses from both surveys in its development of the RHNA Allocation Methodology. As discussed, the RHNA Allocation Methodology was developed according to the procedures outlined in state housing law and through extensive outreach with jurisdictions. The RHNA Subcommittee, over the course of two meetings on August 12 and 26, 2011, recommended the release of the proposed RHNA Allocation Methodology to the Community, Economic and Human Development (CEHD) Committee. The CEHD Committee reviewed, discussed and further recommended the proposed methodology to the Regional Council, which approved the proposed methodology for distribution on September 1, 2011. During the course of a 60-day public comment period, SCAG met with interested jurisdictions and stakeholders to present the process, answer questions, and collect input. SCAG also held public hearings on October 11 and 19, 2011 to receive verbal and written comments on the proposed methodology. The Regional Council adopted the RHNA Methodology on November 3, 2011. On April 4, 2012, the Regional Council unanimously approved SCAG’s 2012-2035 RTP/SCS, including its jurisdictional-level Integrated Growth Forecast. On April 19, 2012, the RHNA Appeals Board held a meeting to review the submitted revision requests to the Draft RHNA Allocation. Fourteen jurisdictions submitted revision requests to their respective Draft
RHNA Allocation. Per State housing law, jurisdictions must base their request
18

Agenda Item 4
on at least one of the AB 2158 planning factors. A total of 7,378 units were requested for reduction. Twelve of the revision requests were denied by the Appeals Board and two, La Puente and the County of Ventura, were granted partial reductions of 149 and 295, respectively. The 444 successfully reduced units were deducted from the Draft RHNA Plan. Jurisdictions that were not satisfied with their revision request result had option to file an appeal on their Draft RHNA Allocation based on the AB 2158 planning factors. In addition, appeals could be filed based upon SCAG’s failure to determine the jurisdiction’s share of the regional housing need in accordance with the adopted RHNA Allocation Methodology, or a significant and unforeseen change in circumstance. For jurisdictions that did not file a revision request, a filed appeal can only be based on the application of the adopted RHNA Allocation Methodology or change of circumstance. The deadline to receive appeals was on May 29, 2012. The RHNA Appeals Board will be reviewing twelve submitted appeals, which represent a total of 4,247 contested housing units. As previously noted, the responsibility of the RHNA Appeals Board is to review each of the appeals and make a determination to grant, partially grant, or deny the appeal from the jurisdiction. SCAG staff has reviewed the appeals and supporting documentation, and has made the recommendation to deny each of the appeals received based on various factors. At the Public Hearings, each appeal will be allotted approximately one hour. The appealing party (i.e., the local jurisdiction) will have 20 minutes to present its position before the RHNA Appeals Board. The presentation may include supporting visuals, but must be completed within the allotted time. Once the jurisdiction completes its presentation, the RHNA Appeals Board will discuss the appeal, its consistency with the law, and its documentation. The RHNA Appeals may also request a brief report from SCAG staff. Members of the RHNA Appeals Board may ask questions of the jurisdiction or SCAG staff. Subsequently, the RHNA Appeals Board will make a final determination to approve, partially approve, or deny the appeal. Unlike the revision request process, successfully appealed units will be proportionally redistributed to all jurisdictions in the SCAG region. In accordance with state housing law, SCAG must maintain the regional total resulting from the revision request process of 412,277 housing units. In August 2012, upon completion of the Trade and Transfer process, if applicable, the RHNA Subcommittee will review the proposed final RHNA Allocation Plan and make its recommendation to CEHD, which will in turn review and make further recommendations to the Regional Council. While the RHNA Appeals Board makes the final decision on the revision requests and appeals, the RHNA Subcommittee will make a recommendation to CEHD on the proposed Final RHNA Allocation Plan, including Trade and Transfers, if applicable. It is scheduled for the Regional Council to adopt the Final RHNA Allocation Plan on October 4, 2012. According to the Housing Law, housing elements must be adopted by jurisdictions by October 2013. FISCAL IMPACT: Work associated with this item is included in the current FY 12-13 General Fund Budget (13-800.0160.03: RHNA). ATTACHMENT:
1. Staff Reports to Submitted Appeals and Corresponding Appeals Submitted by Jurisdictions
19

4.1 Appeal from the City of Calabasas
20
Agenda Item 4.1
DATE: July 12, 2012
TO: Regional Housing Needs Assessment (RHNA) Appeals Board
FROM: Ma’Ayn Johnson, Senior Regional Planner, (213) 236-1975, [email protected] Frank Wen, Manager, Research and Analysis, (213) 236-1854, [email protected]
SUBJECT: Appeal from the City of Calabasas
EXECUTIVE DIRECTOR’S APPROVAL:
RECOMMENDED ACTION (Please Select One):
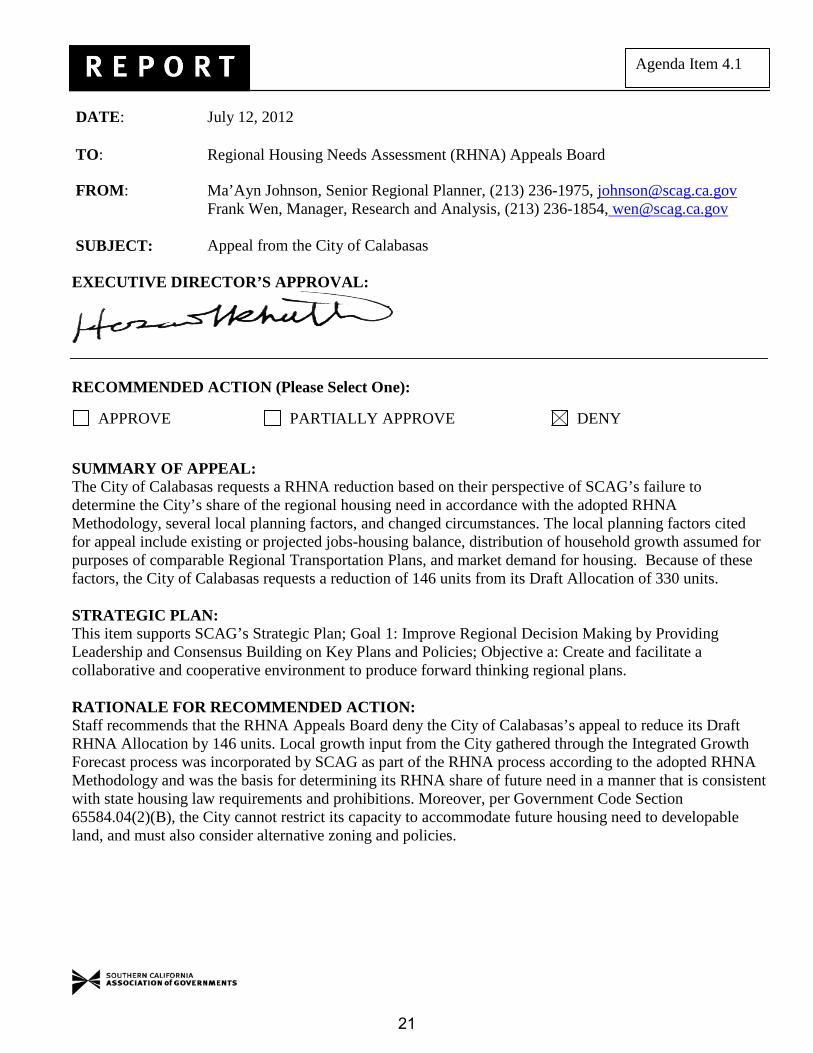
APPROVE PARTIALLY APPROVE DENY
SUMMARY OF APPEAL: The City of Calabasas requests a RHNA reduction based on their perspective of SCAG’s failure to determine the City’s share of the regional housing need in accordance with the adopted RHNA Methodology, several local planning factors, and changed circumstances. The local planning factors cited for appeal include existing or projected jobs-housing balance, distribution of household growth assumed for purposes of comparable Regional Transportation Plans, and market demand for housing. Because of these factors, the City of Calabasas requests a reduction of 146 units from its Draft Allocation of 330 units. STRATEGIC PLAN: This item supports SCAG’s Strategic Plan; Goal 1: Improve Regional Decision Making by Providing Leadership and Consensus Building on Key Plans and Policies; Objective a: Create and facilitate a collaborative and cooperative environment to produce forward thinking regional plans. RATIONALE FOR RECOMMENDED ACTION: Staff recommends that the RHNA Appeals Board deny the City of Calabasas’s appeal to reduce its Draft RHNA Allocation by 146 units. Local growth input from the City gathered through the Integrated Growth Forecast process was incorporated by SCAG as part of the RHNA process according to the adopted RHNA Methodology and was the basis for determining its RHNA share of future need in a manner that is consistent with state housing law requirements and prohibitions. Moreover, per Government Code Section 65584.04(2)(B), the City cannot restrict its capacity to accommodate future housing need to developable land, and must also consider alternative zoning and policies.
21

Agenda Item 4.1
BACKGROUND: The following is a chronology of the events related to Calabasas’ Draft RHNA Allocation to date: 1. On July 29, 2009, an initial letter was sent from SCAG to Ms. Maureen Tamuri, Community
Development Director, City of Calabasas, indicating the Draft household forecast as follows:
2008 Households 8,333 2020 Households 9,225 (892 increment from 2008) 2035 Households 10,192 (1,859 increment from 2008)
2. On October 28, 2009, an email was sent from Ms. Talyn Mirzakhanian, Planner, City of Calabasas, to
SCAG indicating the City’s recommended revision to the Draft household projection with reductions of 371 and 1,138 households in 2020 and 2035, respectively.
3. On June 30, 2010, a letter was sent from SCAG to Mr. Anthony Coroalles, City Manager, Calabasas,
indicating that the city input was received from Calabasas and was incorporated into the Draft household forecast as follows:
2008 Households 8,333 2020 Households 8,854 (521 increment from 2008, a reduction of 371) 2035 Households 9,054 (721 increment from 2008, a reduction of 1,138)
4. On May 13, 2011, an email was sent from SCAG to Ms. Maureen Tamuri, Community Development
Director, City of Calabasas, indicating that the growth forecast numbers were adjusted based on recently released data from the decennial census and the California Employment Development Department. The associated table that was sent indicates that the City of Calabasas’ Draft household forecast was adjusted as follows:
2008 Households 8,526 2020 Households 9,060 (534 increment from 2008, an increase of 13) 2035 Households 9,260 (734 increment from 2008, an increase of 13)
In addition, SCAG also provided the City this additional household information in detail: 2010 Census (as of 4/1/2010) 8,543 2011 DOF (as of 1/1/2011) 8,547 2021 RHNA Projection Period (1/1/2014 - 10/1/2021) 9,077
5. On May 23, 2011, Mr. Tom Bartlett, City Planner, City of Calabasas, sent a letter to SCAG indicating
that the City should receive credit for 79 units constructed between 2008 and 2010. This 79 reduction of units is in addition to the initial reduction requested on October 28, 2009.
6. On July 7, 2011, City of Calabasas submitted the AB 2158 Survey and the Demolition Survey to
SCAG.
22
Agenda Item 4.1
7. On July 11, 2011, Ma’Ayn Johnson, SCAG Staff, and Mr. Tom Bartlett, City Planner, City of Calabasas, met at the RHNA Open House.
8. On August 22, 2011, Ms. Talyn Mirzakhanian, Planner, City of Calabasas, sent an email to SCAG
summarizing the meeting that occurred on July 11 and voiced the City’s concern that the forecasted growth is still too high for the 5th RHNA cycle.
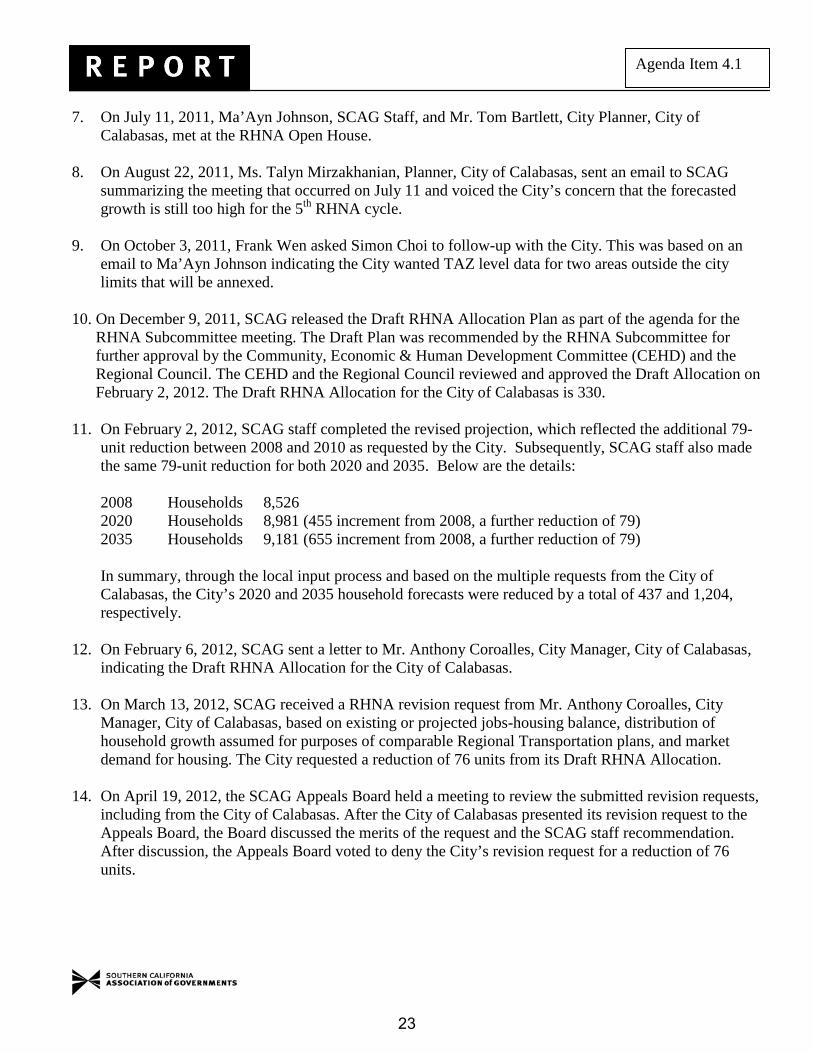
9. On October 3, 2011, Frank Wen asked Simon Choi to follow-up with the City. This was based on an
email to Ma’Ayn Johnson indicating the City wanted TAZ level data for two areas outside the city limits that will be annexed.
10. On December 9, 2011, SCAG released the Draft RHNA Allocation Plan as part of the agenda for the
RHNA Subcommittee meeting. The Draft Plan was recommended by the RHNA Subcommittee for further approval by the Community, Economic & Human Development Committee (CEHD) and the Regional Council. The CEHD and the Regional Council reviewed and approved the Draft Allocation on February 2, 2012. The Draft RHNA Allocation for the City of Calabasas is 330.
11. On February 2, 2012, SCAG staff completed the revised projection, which reflected the additional 79-
unit reduction between 2008 and 2010 as requested by the City. Subsequently, SCAG staff also made the same 79-unit reduction for both 2020 and 2035. Below are the details: 2008 Households 8,526 2020 Households 8,981 (455 increment from 2008, a further reduction of 79) 2035 Households 9,181 (655 increment from 2008, a further reduction of 79) In summary, through the local input process and based on the multiple requests from the City of Calabasas, the City’s 2020 and 2035 household forecasts were reduced by a total of 437 and 1,204, respectively.
12. On February 6, 2012, SCAG sent a letter to Mr. Anthony Coroalles, City Manager, City of Calabasas,
indicating the Draft RHNA Allocation for the City of Calabasas.
13. On March 13, 2012, SCAG received a RHNA revision request from Mr. Anthony Coroalles, City Manager, City of Calabasas, based on existing or projected jobs-housing balance, distribution of household growth assumed for purposes of comparable Regional Transportation plans, and market demand for housing. The City requested a reduction of 76 units from its Draft RHNA Allocation.
14. On April 19, 2012, the SCAG Appeals Board held a meeting to review the submitted revision requests,
including from the City of Calabasas. After the City of Calabasas presented its revision request to the Appeals Board, the Board discussed the merits of the request and the SCAG staff recommendation. After discussion, the Appeals Board voted to deny the City’s revision request for a reduction of 76 units.
23
Agenda Item 4.1
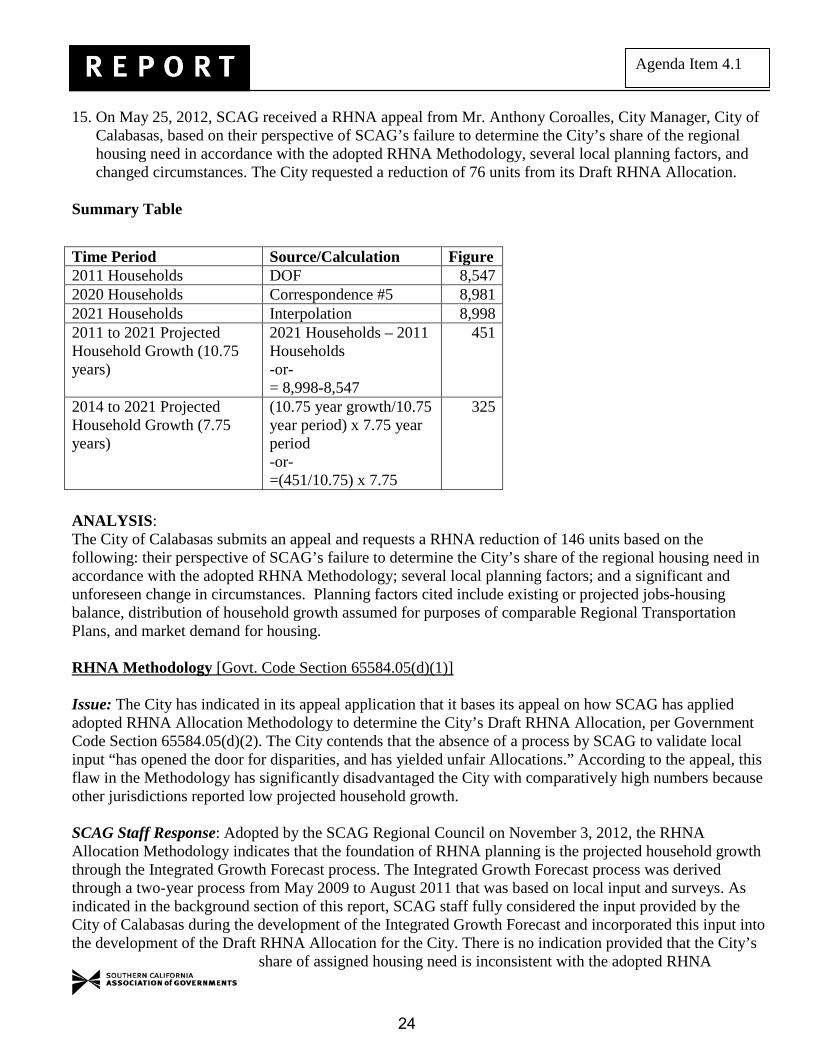
15. On May 25, 2012, SCAG received a RHNA appeal from Mr. Anthony Coroalles, City Manager, City of Calabasas, based on their perspective of SCAG’s failure to determine the City’s share of the regional housing need in accordance with the adopted RHNA Methodology, several local planning factors, and changed circumstances. The City requested a reduction of 76 units from its Draft RHNA Allocation.
Summary Table
ANALYSIS: The City of Calabasas submits an appeal and requests a RHNA reduction of 146 units based on the following: their perspective of SCAG’s failure to determine the City’s share of the regional housing need in accordance with the adopted RHNA Methodology; several local planning factors; and a significant and unforeseen change in circumstances. Planning factors cited include existing or projected jobs-housing balance, distribution of household growth assumed for purposes of comparable Regional Transportation Plans, and market demand for housing. RHNA Methodology [Govt. Code Section 65584.05(d)(1)] Issue: The City has indicated in its appeal application that it bases its appeal on how SCAG has applied adopted RHNA Allocation Methodology to determine the City’s Draft RHNA Allocation, per Government Code Section 65584.05(d)(2). The City contends that the absence of a process by SCAG to validate local input “has opened the door for disparities, and has yielded unfair Allocations.” According to the appeal, this flaw in the Methodology has significantly disadvantaged the City with comparatively high numbers because other jurisdictions reported low projected household growth. SCAG Staff Response: Adopted by the SCAG Regional Council on November 3, 2012, the RHNA Allocation Methodology indicates that the foundation of RHNA planning is the projected household growth through the Integrated Growth Forecast process. The Integrated Growth Forecast process was derived through a two-year process from May 2009 to August 2011 that was based on local input and surveys. As indicated in the background section of this report, SCAG staff fully considered the input provided by the City of Calabasas during the development of the Integrated Growth Forecast and incorporated this input into the development of the Draft RHNA Allocation for the City. There is no indication provided that the City’s
share of assigned housing need is inconsistent with the adopted RHNA
Time Period Source/Calculation Figure 2011 Households DOF 8,547 2020 Households Correspondence #5 8,981 2021 Households Interpolation 8,998 2011 to 2021 Projected Household Growth (10.75 years)
2021 Households – 2011 Households -or- = 8,998-8,547
451
2014 to 2021 Projected Household Growth (7.75 years)
(10.75 year growth/10.75 year period) x 7.75 year period -or- =(451/10.75) x 7.75
325
24
Agenda Item 4.1
Allocation Methodology or that SCAG failed to determine the City’s Draft Allocation in accordance with the adopted Methodology. Thus SCAG staff does not recommend a reduction based on this basis of appeal. Local Planning Factors (1) Existing and projected jobs and housing balance [Govt. Code Section 65584.04(d)(1)]
Issue: As part of its appeals packet, the City of Calabasas attributes the SCAG calculation of its projected household growth to significant planned employment growth. The City states that in the local planning factors survey it submitted during the development of the RHNA Allocation Methodology, City staff erroneously provided SCAG with future employment projections directly from the City’s 2030 General Plan “without having revised data to account for the effects of the current recession.” According to the City, the City has experienced a large number of job losses and high office vacancy rates. SCAG Staff Response: Per SCAG’s adopted Allocation Methodology for this 5th cycle RHNA, the household growth projections for the City of Calabasas were calculated using local input for the Integrated Growth Forecasting process. The City responded to the local planning factors survey in 2011, however upon SCAG’s review, it did not warrant an adjustment to the submitted data from the Integrated Growth Forecasting local input process. Employment data collected from the City, both from the local input process and the planning factors survey, was not directly used by SCAG to calculate household growth projections. The general presumption is that when providing local input on household growth, planning factors such as job-housing balance are included as part of the local input provided by the City. Moreover, the adopted regional Allocation Methodology took into account each member jurisdiction’s existing and projected job-housing relationship. These relationships were appropriately maintained throughout the forecasting/planning horizons as part of the Integrated Growth Forecast development. For these reasons, SCAG staff does not recommend a housing need reduction based upon the jobs-housing balance planning factor. (2) Distribution of household growth assumed for purposes of comparable Regional Transportation
Plans [Govt. Code Section 65584.04(d)(3)]
Issue: The City of Calabasas contends that its growth trend assumptions are erroneously skewed and states that SCAG projects an accelerated growth rate during the RHNA planning period and a slower growth rate beyond the 2014-2021 planning period. According to the City, its 2030 General Plan projects the opposite trend. Because there are few developable sites and existing developments are relatively new, the City requests to reduce the assumed rates of growth to be consistent with the City’s General Plan. SCAG Staff Response: As mentioned in the above response, per SCAG’s adopted RHNA Allocation Methodology, the household growth projections were calculated using local input received from the City of Calabasas during the Integrated Growth Forecast process. Local input was provided for target dates of 2020 and 2035. SCAG also reviewed additional input, as provided by the City in May 2011, to develop the City’s Draft RHNA Allocation. Furthermore, pursuant to state housing law, SCAG is not permitted to limit its consideration of suitable housing sites or land suitable for urban development to a jurisdiction’s existing zoning and land use policies and restrictions. Government Code Section 65584.04(d)(2)(B) requires that SCAG consider the potential for increased residential development under alternative zoning and other land use policies. Housing law
requires that jurisdictions consider other opportunities for development. This
25
Agenda Item 4.1
includes the availability of underutilized land, opportunities for infill development and increased residential densities, or alternative zoning and density. Alternative development opportunities should be explored further and could possibly provide the land needed to zone for the City’s allocated growth. For these reasons, SCAG staff does not recommend a housing need reduction based upon this planning factor. (3) Market demand for housing [Govt. Code Section 65584.04(d)(4)]
Issue: The City of Calabasas indicates that its Draft RHNA Allocation should be reduced based on the lack of market demand for housing in the City due to local economic impacts. The City’s appeal states that data provided to SCAG on the Integrated Growth Forecast was prepared in 2006 before the onset of the recession, and that the impacts of the recession have hit the City harder than in other jurisdictions. SCAG Staff Response: As noted previously in this staff report, per SCAG’s adopted RHNA Allocation Methodology, the household growth projections were calculated using recent local input received in May 2011 for the Integrated Growth Forecast process. The general reasonable presumption is that when providing local input on household growth, planning factors such as the market demand for housing are included in the provided local input, particularly in recently provided data. Unused land use capacity from prior RHNA cycles may be re-used to address 5th cycle RHNA site inventory requirements as long as a jurisdiction such as the City of Calabasas has an HCD approved housing element. Only jurisdictions with uncertified housing elements are required to carry over and combine the deficit in their last RHNA cycle (4th cycle) site inventory with their 5th cycle RHNA Allocation’s site inventory responsibility. Gaps between the RHNA Allocation, i.e., the number of housing units to be zoned, and the number of housing units actually built are never carried over whether a jurisdiction has a certified or uncertified housing element. In short, the RHNA Allocation is not a building quota. Consistent with the RHNA Methodology, an HCD vacancy credit was also applied before finalizing the City’s Draft RHNA Allocation. Thus SCAG staff does not recommend a housing need reduction based upon this planning factor. Changed Circumstances [Govt. Code Section 65584.05(d)(1)] Issue: The City of Calabasas indicated in its appeal application that its Draft RHNA Allocation should be reduced based on changed circumstances. No statement or information is provided in the application. SCAG Staff Response: No statement or information was provided in the City’s appeal application to indicate that the City has experienced a significant and unforeseen change in circumstances since the Draft RHNA Allocation was approved for distribution on February 2, 2012. For this reason, SCAG staff does not recommend a reduction based upon this basis of appeal. FISCAL IMPACT: Work associated with this item is included in the current FY 12-13 General Fund Budget (13-800.0160.03: RHNA). ATTACHMENTS:
1. Appeal Application from the City of Calabasas 2. Supporting Documentation Provided by the City to Support Its Appeal
26

SOUT!iERN CALIFORNIA
ASSOCIATION of GOVERNMENTS
Fifth Regional Housing Needs Assessment {RHNA) Cycle Appeal Request All appeal requests must be received by SCAG May 29, 2012, 5 p.m. Late submissions will not be accepted.
May 21, 2012 Date:-------------
Los Angeles County:-------------
c Thomas Bartlett, AICP ontact: ------------
APPEAL AUTHORIZED BY:
Name: Anthony Coroalles
RECEIVED City of Calaba s
Jurisdiction: -------+--fnh'lr¥---41--A
Las Virgenes M Subregion:------~¥~---
PLEASE CHECK BELOW:
D Mayor 0 Chief Administrative Officer [{]City Manager
ochairof County Board of Supervisors
Other: _____ _
BASES FOR APPEAL*
0 RHNA Methodology
0 AB 2158 Factors (See Government Code Section 65584.04(d))
0 Existing or projected jobs-housing balance
D Sewer or water infrastructure constraints for additional development
D Availability of land suitable for urban development or for conversion to residential use
D Lands protected from urban development under existing federal or state programs
D County policies to preserve prime agricultural land
0 Distribution of household growth assumed for purposes of comparable Regional Transportation
Plans
0 Market demand for housing
D County-city agreements to direct growth toward incorporated areas of County
D Loss of units contained in assisted housing developments
D High housing cost burdens
D Housing needs of farmworkers
D Housing needs generated by the presence of a university campus within a jurisdiction
0 Changed Circumstances
Brief Description of Appeal Request and Desired Outcome:
Reduce our RHNA allocation by a minimum of 146 units. Please see our attached letter from the City Manager for a detailed explanation of the bases for our revision request.
list of Supporting Documentation, by Title and Number of Pages:
1. Letter from the City Manager, 3 pages
2. Revision Request Packet from March 12, 2012, 32 pages
3.
*Per Government Code Section 65584.05(d), appeals to the draft RHNA Allocation Plan can only be made by jurisdictions that have previously filed a revision request and do not accept the revision request findings made by SCAG, except for appeals based on RHNA methodology and changed circumstances.
FOR STAFF USE ONLY: Date. ________ _ Hearing Date:--------- Planner: _______ _
27

. . -~ , ..
28

CITY of CALABASAS
May 21,2012
Southern California Association of Governments Attention: Mr. Hasan lkhrata, Director 818 West Seventh Street, 121h Floor Los Angeles, CA 90017-3435
Subject: City of Calabasas Appeal 5th Cycle RHNA Allocation
Dear Mr. lkharta,
Attachment 1
Respectfully, the City of Calabasas appeals our draft RHNA allocation of 330 total units. We are requesting SCAG to revisit three areas pertinent to our position:
1) Invalidated local agency data shows that Calabasas has received a disproportionate RHNA allocation, and an adjustment is merited on the basis of fairness;
2) SCAG's growth trend assumption should be aligned with the Calabasas 2030 General Plan to avoid an allocation which assumes an unachievable pace of growth for the 5th cycle;
3) Our disproportionately high local economic impacts are requested to be factored into the City's jobs growth projection.
Consideration of the above will support our request for a reduction in the draft RHNA for Calabasas from 330 to 184 units. Please consider the following in support of our position:
1). Disproportionate RHNA Allocation. Integral to determining each jurisdiction's projected household growth is the information provided to SCAG by each jurisdiction. Unfortunately, the absence of a SCAG process to validate local input process has opened the door for disparities, and has yielded unfair allocations. This flaw in the 5th cycle RHNA process and methodology has significantly disadvantaged the City of Calabasas.
Please consider the following table which shows that the draft RHNA per capita for Calabasas is 250% to 7000% higher than the draft RHNA per capita for neighboring cities.
Calabasas 330 23,058 1.43
Malibu 2 12,645 0.02
Agoura Hills 115 20,330 0.57
Westlake Village 45 8,270 0.54
Thousand Oaks 192 126,683 0.15
100 Civic Center Way
Calabasas, CA 91302
(818) 224-1600
Fax (818) 225-7324
29

30
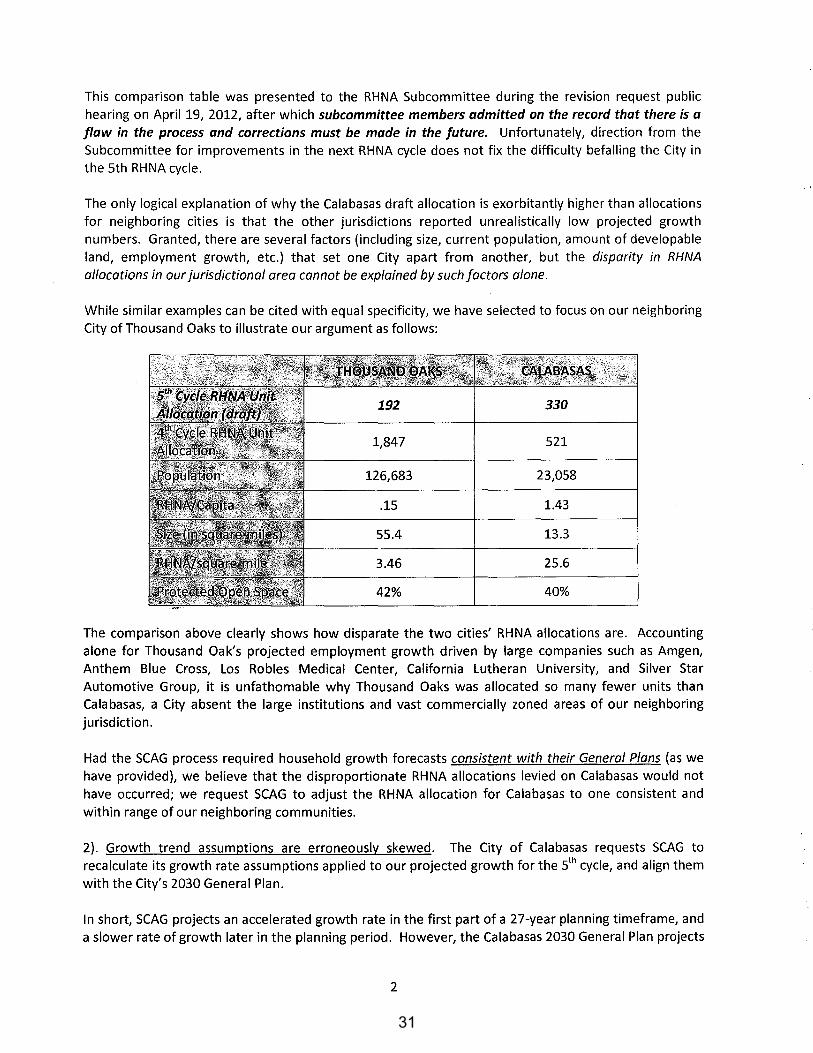
This comparison table was presented to the RHNA Subcommittee during the revision request public hearing on April 19, 2012, after which subcommittee members admitted on the record that there is a flaw in the process and corrections must be made in the future. Unfortunately, direction from the Subcommittee for improvements in the next RHNA cycle does not fix the difficulty befalling the City in the 5th RHNA cycle.
The only logical explanation of why the Calabasas draft allocation is exorbitantly higher than allocations for neighboring cities is that the other jurisdictions reported unrealistically low projected growth numbers. Granted, there are several factors (including size, current population, amount of developable land, employment growth, etc.) that set one City apart from another, but the disparity in RHNA allocations in our jurisdictional area cannot be explained by such factors alone.
While similar examples can be cited with equal specificity, we have selected to focus on our neighboring City of Thousand Oaks to illustrate our argument as follows:
192 330
1,847 521
126,683 23,058
.15 1.43
55.4 13.3
3.46 25.6
42% 40%
The comparison above clearly shows how disparate the two cities' RHNA allocations are. Accounting alone for Thousand Oak's projected employment growth driven by large companies such as Amgen, Anthem Blue Cross, Los Robles Medical Center, California Lutheran University, and Silver Star Automotive Group, it is unfathomable why Thousand Oaks was allocated so many fewer units than Calabasas, a City absent the large institutions and vast commercially zoned areas of our neighboring jurisdiction.
Had the SCAG process required household growth forecasts consistent with their General Plans (as we have provided), we believe that the disproportionate RHNA allocations levied on Calabasas would not have occurred; we request SCAG to adjust the RHNA allocation for Calabasas to one consistent and within range of our neighboring communities.
2). Growth trend assumptions are erroneously skewed. The City of Calabasas requests SCAG to recalculate its growth rate assumptions applied to our projected growth for the sth cycle, and align them with the City's 2030 General Plan.
In short, SCAG projects an accelerated growth rate in the first part of a 27-year planning timeframe, and a slower rate of growth later in the planning period. However, the Calabasas 2030 General Plan projects
2
31
32
the opposite - a slower rate of growth during the earlier part of the 27-year time frame. The City's General Plan growth rate is supported by the following facts:
1) Remaining developable land sites are scarce, with few remaining sites; 2) Existing developments are relatively new and in good condition; as a result,
redevelopment of mixed-use zoned sites were assumed in the later part of the general plan timeframe when the structures had matured to a point of functional obsolescence.
We are requesting SCAG to reduce the assumed rates of growth for the sth cycle of RHNA (2014- 2021) to that envisioned by the City of Calabasas' 2030 General Plan.
3). Adjustments requested for disproportionately large local economic impacts. In response to SCAG's 2011 Local Planning Factors Survey, City of Calabasas planning staff provided future employment projections directly from our 2030 General Plan. Because this data was based on an economic forecast prepared in 2006 before the onset of the recession, we submitted supplemental data as part of our Revision Request (see data in attached Revision Request packet) in support of our request that an additional adjustment be considered for Calabasas in light of local impacts far more severe than in other jurisdictions. This request is in addition to SCAG's blanket adjustment to all jurisdictions that accounted for the impacts of the economic recession. Our request is based on disproportionately increased retail, industrial and especially high commercial vacancy rates specific to the Calabasas area, which drastically modify the General Plan's 2006 employment baseline used for projections.
Our revised projections also account for the reality that that new job growth cannot even begin until after these lost jobs are replaced. SCAG's RHNA allocation to the City has erroneously counted job replacement as housing demand, and on that basis alone we believe that a commensurate adjustment for this oversight is mandated.
Summary For the reasons stated herein, and as supported by the supplemental materials provided, we respectfully ask SCAG to reduce our Draft RHNA allocation by 146 units. This adjustment would place us in range with growth projections of local cities, be commensurate with the pace projected in our 2030 General Plan, and account for our unique local economic recession impacts.
The City of Calabasas takes its housing responsibilities seriously, and our request should not in any way be construed as an attempt to avoid this burden. Please note that our HCD-certified Housing Element provided adequate site opportunities for 521 RHNA units (4th RHNA cycle), and that 157 of these units (30%), of which 75 are deed-restricted as affordable, have been constructed during this cycle.
We commend SCAG staff for their tremendous efforts in the 5th Cycle RHNA process. To have received only fourteen revision requests out of 197 local jurisdictions is a clear indication of success. We trust that our appeal will likewise merit fair review and consideration, and thank you in advance.
Sincered;;/" //v;:; Anthony Coroalles City Manager
3
33

34

AS SOC: tATJOtl of 50VEa•MEifT5
Attachment 2
Fifth Regional Housing Needs Assessment (RHNA) Cycle Kev1s1on Keguest All revision requests must be received by SCAG March 15, ZOlZ, 5 p.m. Late submissions will not be accepted.
March 12, 2012 Date: __________________________ __
Los Angeles County: ________________________ __
Thomas Bartlett, AICP Contact: ________________________ __
REVISION REQUEST AUTHORtZED BY:
Name: Anthony Coroalles ---------------------
City of Calabasas Jurisdiction: ----------------------
Las Virgenes Malibu COG Subregion: ·
ho e/ "I (818) 224-1712
P n Emar : [email protected]
PLEASE CHECK BELOW:
0 Mayor Ochief Administrative Officer 0 City Manager
QChairof County Board of Supervisors
Other:---------
BASES FOR REVISION REQUEST
0 AB 2158 Factors (See Government Code Section 65584.04{d))
0 Existing or projected jobs-housing balance
0 Sewer or water infrastructure constraints for additional development
. 0 Availability of land suitable for urban development or for conversion to residential use
0 lands protected from urban development under existing federal or state programs
0 County policies to preserve prime agricultural land
0 Distribution of household growth assumed for purposes of comparable Regional Transportation
Plans
0 Market demand for housing
0 County-city agreements to direct growth toward incorporated areas of County
0 loss of units contained in assisted housing developments
0 High housing cost burdens
0 Housing needs of farmworkers
0 Housing needs generated by the presence of a university campus within a jurisdiction
Brief Description of Revision Request and Desired Outcome:
Revise our Draft RHNA anocation by calculating an allocation number using a projected household growth of 347 for the time period of 2011-2021. This would bring the City's projected household growth for the 2014-2021 RHNA period to 250 instead of 382. The approved methodology would then be applied to that more appropriate and accurate projected household growth number, which should yield a significantly lower allocation for the City. Please see the attached letter from the City Manager for a detailed explanation of the bases for our revision request.
list of Supporting Documentation, by Title and Number of Pages:
1. Letter from City Manager, 3 Pages
2. SCAG's Pretminary Projected Household Allocation Table, 1 Page
3. 2010 Census Summary File Showing Calabasas Average Household Size, 1 Page
4. San Fernando Valley Economic Report; Valley Exconomic Alliance b CSUN, 2 Pages 5. Retail Research Market Update; Marcus & Millichap, 8 Pages 6. NAI Capital 2010 Market Report, 12 Pages FOR STAFF USE ONlY: Date ________________ __ Hearing Date:------------- Planner:--'--------------
35

36

CITY of CALABASAS
March 12, 2012
Southern California Association of Governments Attention: Mr. Hasan lkhrata, Director 818 West Seventh Street, 12th Floor Los Angeles, CA 90017-3435
Dear Hasan:
The City of Calabasas hereby requests a revision of our Draft RHNA allocation, which is 330 total units for the 5th RHNA cycle. This request is based on three basic points, each of which is explained in detail below: 1) SCAG inaccurately calculated the household growth projection for Calabasas; 2) the growth trend assumptions underlying the projected household allocation are erroneously skewed by favoring a faster rate of growth in the near term followed later by slower growth; and 3) the allocation fails to account for the serious impacts of the economic recession.
1. Future household forecast was incorrectly calculated. SCAG's Preliminary Projected Household Allocation Table shows .a ·projected population growth of 938 persons for Calabasas between 2011 and 2021, and a projected household growth of 530 new/additional households for the same period. The average household size in Calabasas is 2.7 (2010 Census); thus, the correct household growth number corresponding to a population growth of 938 people is 347 (938/2.7 = 347), not 530 as indicated in the abovereferenced table. This correction alone will significantly improve the allocation for Calabasas, and better reflect what the City has anticipated in adopted long-range plans.
2. Growth trend assumptions are erroneously skewed. Notwithstanding the requested correction of a simple mathematical error covered in #1 above, the forecasting trend portrayed in the Preliminary Projected Household Allocation Table is also flawed because it does not correspond with the projected trend in our 2030 General Plan. SCAG projects an accelerated growth rate in the first part of a 27-year planning timeframe, and a slower rate of growth later in the planning period, However, the Calabasas 2030 General Plan projects the opposite- a slower rate of growth during the earlier part of the 27-year time frame, as developable land is scarce and most existing developments are relatively new and in good condition, followed by accelerated growth in the latter part of the time frame resulting from redevelopment of mixed-use zoned sites after the properties have matured to a point of functional obsolescence. Thus, we believe the applied (assumed) rates of growth for the 5th cycle of RHNA (2014- 2021) should be reduced.
3. Economic impacts of the Great Recession. If for any reason SCAG might have purposefully increased projected household growth numbers beyond those which would be calculated directly from projected population growth, we can only presume that such an approach would have been related to significant planned employment growth. In the Local Planning
· Factors Survey conducted by SCAG early in 2011, City of Calabasas planning staff 100 Civic Center Way
Calabasas, "CA 91302
(818) 224-1600
Fax (818) 225-7324
37

38
erroneously provided SCAG with future employment projections directly from our 2030 General Plan without having revised the data to account for the effects of the current economic recession. The projections in our 2030 General Plan are based on an economic forecast prepared in 2006, before the onset of the recession; consequently, the forecast did not anticipate the extended duration of the economic recession. -More importantly, and more to the point, it failed to account for the massive loss of jobs between 2006 and the present time.
Calabasas serves as a headquarters for several financial industry-related companies, an industry that has suffered serious and dramatic job losses during the economic decline. The greatest example of this is Bank of America (formerly Countrywide), which occupied office buildings throughout the City but vacated many locations as the recession persisted. The effect of this has been an unexpectedly high office vacancy rate, not accounted for in projections provided in the 2030 General Plan. According to the San Fernando Valley Economic Report & Outlook, prepared by The Valley Economic Alliance and California State University Northridge, the office vacancy rate in Calabasas was an unprecedented 22% in 2010 -- one of the highest vacancy rates in the San Fernando Valley. Similarly, industrial and retail vacancies have also reached unusually high levels in Calabasas. The San Fernando Valley Economic Report & Outlook indicates that Calabasas had an industrial vacancy rate of 5.7% in 2010 (fourth highest in the San Fernando Valley). Also, several commercial real estate reports indicate that the retail commercial vacancy rates in the San Fernando Valley has ranged from 5.1% to 6.9% over the past couple of years, more than double the 2007 retail vacancy rate of 2% (ref. Retail Research Market Update by Marcus & Millichap; and NAt Capital 2010 Market Report). The retail market in Calabasas has been no exception- protracted vacancies per~ist in the City's Old Town shopping district, the Commons of Calabasas shopping center, and various shopping centers on th·e west side of town.
The bottom line is that unusually high retail and industrial vacancy rates, coupled with the exorbitantly high office vacancy rate are clear indicators of the large number of jobs lost in Calabasas over the past few years. This drastically affects the employment baseline used for projections in the General Plan because the General Plan had anticipated adding to the existing employment level, but failed to account for replacement of lost jobs. The forecasted new job growth cannot even begin to accumulate until after the lost jobs are replaced. And the reason this is so critical for the RHNA allocation is that job replacement does not precipitate new housing demand.· SCAG needs to factor local job losses into a RHNA adjustment.
Therefore, and to sum up, for the reasons stated herein we respectfully ask SCAG to revise our Draft RHNA allocation by calculating a number using a projected household growth of 347 for the time period of 2011-2021. This would bring the City's projected household growth for the 2014-2021 RHNA period to 250 instead of 382. The approved methodology would then be applied to that more appropriate and accurate projected household growth number, which should yield a significantly lower allocation for the City. An adjustment would be more than fair because it not only applies the 2010 Census' average household size for Calabasas, but it would also account (partially) for the economic impact of the current recession.
39

40

Finally, as you consider our request, please bear in mind that Calabasas not only has a HCD-certified Housing Element which provided adequate site opportunities for 521 RHNA units_ {4th RHNA cycle), but also that 157 of these units {30%) have actually been constructed during the current cycle, and 75 of those units are deed-restricted as affordable: Thank you in advance for seriously considering our request. I look forward to hearing back from you soon.
Sincerely,
~~~ //~~r-'-----------Anthony Coroalles City Manager
Enclosures:
1. SCAG's Preliminary Projected Household Allocation Table 2. 2010 Census Summary File Showing Calabasas Average Household Size 3. Two pages from the San Fernando Valley Economic Report & Outlook, prepared by The Valley
Economic Alliance and California State University Northridge. The full report is available at the following link: http://www.csun.edu/sfverc/2010EconomicSummitReport.pdf
4. Retail Research Market Update; Marcus & Millichap 5. NAI Capital 2010 Market Report
41

42

Preliminary Projected Household Allocation Revised Using Locallnput and Latest Data from 2010 Census, California Employment Development Department (EDD), and California Department of Finance (DOF)
May 2011
COUNTY SUBREGION CITY 2008(July I)
Existin~ Population Forecast 2010fAprillJ 2020/Julyll
Growth Delta 2035 (,holy ))I 21110-2020 2020-2035
Adjusted Population Forecast 2008 {.luly I) 2010 (Cenllllli) 2011 (DOF E-5) 2020 (July I)
Los Angeles 23,283 23.359 76 963 20,321 20,330 20,393 20,406 L~~ ~:::~:~~ ~~~:~~~ ~;~~ ~~~~ura Hills 23.270
'"'''' ' .. .,J,j!J>f>a,.,. ~1\824.. . ·•' .•24.7)J.l . · . . ,9{!],,, . ""'' •.• ~6() .. ~ y..·,,,s2:0.~1.)," F "·'"'~3,0.5.&, ·.•·~'>·O.•·W~•• ,., ,o._,,2.4,(125 ... ·' Los Angeles Ltls Angeles Lo:o.; Angeles Los Angele:-
Lus Virgenes Malihu COG I Hidden Hills Lus Virgenes Malibu COG Malibu
2,008 13,668 8.836
2.009 2,015 6 10 1.846 1,856 1,870 1.862 13,875 1.1.117 1,243 1,813 12,624 12.645 12.61!3 13,888
Las Virgenes Malibu COG Westlake Village Las Virgenes Malihu COG Unincnrpnrmed
8.885 9,177 292 423 8,270 8,270 8,294 8.562 23,232 24,012 28,689 4,6n 847 17,995 18,075 18,137 22,752
COUNTY SUBREGION CITY
Los Angele~< :Las Virgenes Malibu COG Agnura Hills t:liit··~g~ll;;"· ~ii~~··•-llhU'<L"Nt.f"' €ultthnons ,,·, Los Angeles Las Virgenes Malihu COG Hidden Hills Los Angeles Las Virgenes Malibu COG Malihu Los Angeles Las Virgenes Malibu COG Wesllake Village Lus An~eles Lus Yirgenes Malibu COG Uninc.:omorated
COUNTY SUBREGION CITY
Existing Household Forecast Growth Delta 2008 (.luly IJ 2010(Aprill} 2020 Uuly I) 2035 f.luly I) 2010-2020 2020-2035
7,459 . ·>~·,o.Jll··
583 5,355 3.306 7,748
7,46() .. 8,'<31Y
583 5.359 3,307 7,765
7,583 ·IMM·
608 5,794 3.362 9,545
Existing Employment Ji'orecast 2008 2010 2020
8,001 123 418 ,·,9<6~-t ,, 5t?· . "'20@
635 25 27 6.278 435 484 3.426 55 64 9.666 1,780 121
Growth Delta 20351 2010-2020 2020-2035
Adjusted Household li'orecast 2008 {July I) 2010 (Censm;J 2011 (001<'1~·5) 2020 (July I)
7,321 7,327 7,329 7,450 ... ·'" ""·'.'8',\'!26;· · -~Mi4·3·· &.647- .' "}:>J6tl '
589 593 596 618 5.256 5,267 5.268 5,702 3.262 3,262 3,262 3,317 6,226 6,254 6,258 8,034
Adjusted Employment ~·orecast 2008 2010 2011 !Jon. I) 2020
Los Angeles
Los AngeJe..,. Los Angele.o.; Los Angeles Los Angeles
Las Virgenes Malibu COG
Las Virgenes Malihu COG Las Virgenes Malihu COG Lus Virgenes Malibu COG Las Virgenes Malibu COG
~="-t"~""'"'~'"''"''"'""';;.~,, . .,~ ... .,,.:~;, ... ,,, "··-~:~'("" •?~:~«CC· ·x·.>,•,;~~. c'·""'·""!=•·<·P''""' Hidden Hills 25 25 25 26 0 I 25 Malibu 8.886 8,640 9,606 10,106 966 500 8,886 Westlake Village· 9,293 9,101 9,854 10.247 753 393 9,293 Unincomorated 14,095 14,060 14,198 14,198 138 0 14,095
11,073
··l~"''
24 8,425 8,874
13,710
11.134 12,107 .>1<4,~<118·' .. -·. .,, ' 'l~i446·.
24 24 8,482 8.919
13,718
9.391 9,627
13,848
"SCAG's Ex1stmg. Growth Fn11.:cus1 wns dcvdupcll hnscd upon u hnnom·up pit'ICCSS und locul mput rc.cci\•cd up unttl Decem her nf 2010. Th1s tahlc shows the ndjus or locul input on this revised lhrccust. (i~urcs li1r pnpulntitm. households, und cmploymcm were rchnl'Ciincd nccnrding tn 1he ht\L'St duLU rrom the 2010 Census an
fnr< .. 'Cnsts. Populntinn and huuschuld csttnullcs for Junuury I. 2011 nrc hascd un CA nor E 5 rclcuscd on April 29. ::!011, wh1le popnhnion and houschnld l'nrccnsts for S
ltllocnl JUrisdictmns Ill May. SCAG has rc~-clvcd udditmnal tnput li·nm cities und coun11cs on th~: Growth Forccust. Any nccc.•;sllry rcvtsltms wtll be addressed during lhc RTP/SCS development procc.~li
2021 (Sept .. '\11)
20.487 ,·24.022
U63 14.039 8,597
22,823
2021 fS~pt. 311)
7.486 9\0'1"1
620 5,743 3,323 8,045
2021 iSopl, 31l)
Growth Delta 2035 (July 1)1 2011-2021
21.369 94 ,,:~_ ~-.r.l.2fL'S · N:i:·'~t•:(.·f"~~··
1,872 -7 15.701 1.356 8.985 .103
23,599 4,686
Growth Delta 2035 (July I) 2011-2021
7,868 157 9,269 ''•!:····~~
645 24 6.186 475 .1,381 61 8,155 1,787
Growth Delta 20351 2011-2021
12,168 12.664 1,033 '1~ "• 1:0:,~24"""·'"' ""'''l'(t:lli1!>·· •
24 25 9,445 9.89i 9,670 10.020
13,848 13.848
0 963 751 130
43

44
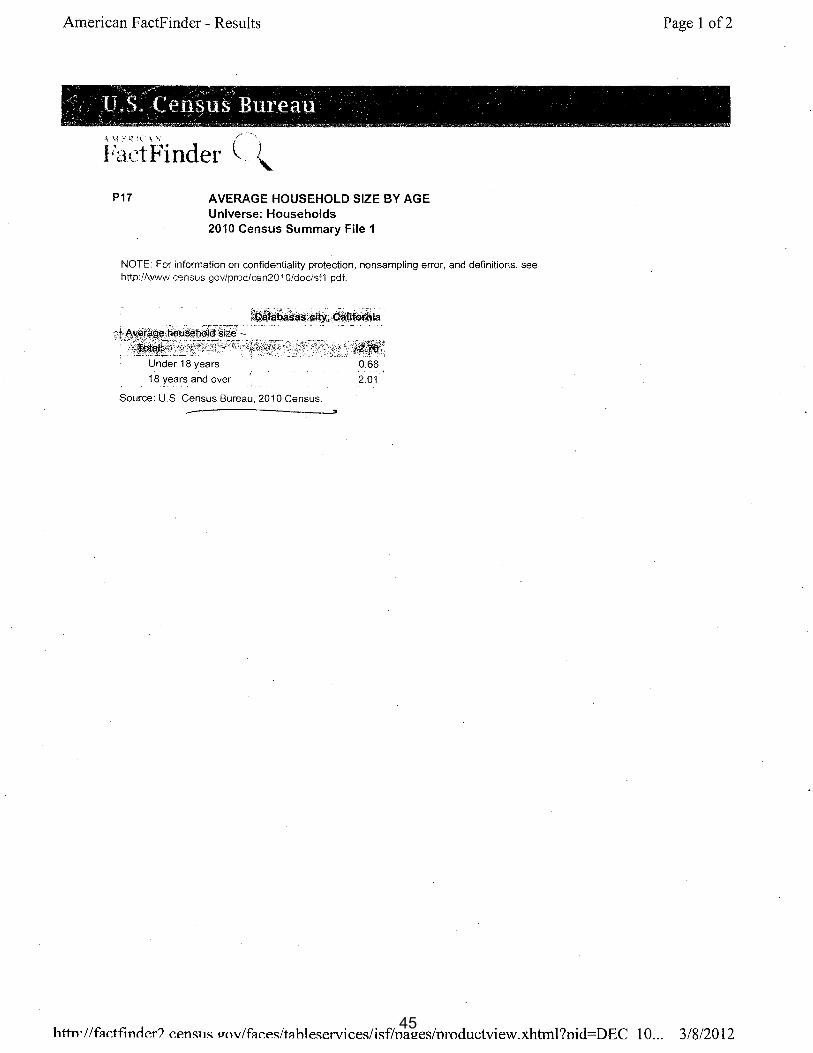
American FactFinder- Results Page 1 of2
~-·, IJ.,s:--cerisli~~ Bu1·eau - · -~,- -~"-~'-v'-"::•- .. -,,~·~ ~-"-·q-..,·•-••"-"'~-~--,_,.,;:o--,.·-=-~-"'~'">'•-"""'1""-: •"R""'-"'~~-.,..-=.,=•.<"'•:.r.--,~~-,,..,---. -= .•~~''"'-\"''-:-,- .-,.,..,.-~,..,~ <--~-::o·,.,-..o"="--,:~.c cr~~ ---·~·~ --~----~·..,.,"~""'-
;1,_ \! ;.: ~ i{ ~ ... ,, /-
FactFinder l .. (_
P17 AVERAGE HOUSEHOLD SIZE BY AGE Universe: Households 2010 Census Summary File 1
NOTE: For information on confidentiality protection, nonsampling error, and definitions, see http://www census gov/prodlcen20·1 O/doc/sf1 pdf.
~~~lia:sii$.«ity;.·tfa!itQti\i~
~·t:~i1~~~f;?F~~J~~~::yMZ1i~~:'?~~~'~i'i:5;:!~Ei¥'-~~1 Under 18 years 0.68
.. <
18 years and over 2.01
Source: U.S. Census Bureau, 2010 Census.
httn· I /f::~c.tfinclP.r? c.P.mms P"ov/f::~c.P.s/tahleserv1ces/1sf/na!!es/nroductview.xhtml?nid=DEC 1 0... 3/8/2012 45

46

Real Estate Conditions-Office and Industrial
Office leasing has followed the deterioration of the general economy. Over the past year, Valley office lease rates have declined an average of 12.3%. Vacancy rates are close to SO% in parts of the Valley and average 18.5%.
Office leasing lags changes in general economic conditions. Average asking lease price for office space in the Valley peaked in early 2008 at $2.62 per square foot. As general real estate markets declined. office leasing followed and has dropped to $2.22 per square foot. The decline in lease rates in shown Changes in San Fernando Valley Lease Rates. Lease rate changes were. as was the case with housing prices. not uniform throughout the Valley. The largestdecline was in Granada Hills at 18 percent and Canoga Park showed an impressive gain of 7.3 percent. However, both of these markets are relatively small.
The largest office space market in the Valley is Woodland Hills. followed closely by Burbank and Glendale. The entertainment mdustry has weathered the economic downturn better than most industries and this is reflected by the minimal drop of 0.9 percent in lease rates in Burbank and a 0.4 percent increase in the Glendale market. Both Woodland Hills and Calabasas are known for being in the financial industry, an industry that has not weathered well the
Presented by fhe Valley EconornJc Alliance & CaiJfornia State University. Northridge
i
Changes in San ferna_ndo Valley :Office tease Rates.- 2009-2Q10 ,
Burbank Studio City
Glenda!~
North Hollywood
Sherman Oaks
Enttno W_estHi\ls
Woodland Hills Calabasas
Universal City SFV
Van Nuys
Granada Hills
Northridge
Mission Hitls Chatsworth
Tarzana Canoga Pari•
Panorama City
-20.0% -15.0% -10.0% -5.0% 0.0% S.U% 10.0"/a
Cost per Square FofJt
L Souu:e: CB Rithard Ellis
·---------
I
I --- -------·------·-------'
Office Vacancy Rates: San Fernando Valley · " ':
P<~norama City
Ch<~tswarth
Mission Hills
Woodland Hills
Norlh Hollywood
Burbanlt
N~rthridge
Universal City
StudioCily =:J L
_____ 0_.0_% ___ 10-.0-%--2-0-.0%--~30-.0-%---40-.0-%--5-0.0'/, 600% Source: CB Richard EUis Cost per Square Foot _
• 47

Percent Change in Los Angeles Sub-Minltets Office lease Rates: 2009 • 2010
Wl!.stlfJsAngeles
los Angeles Downtown
Los Angeles County
Hollywood/Wilshire Corridor
San Fernando Valley
Ventura
South "Bay
San Gabruil Valley
·20.0% ·18.0% -16.0% ·14.0% -12.0% ·10.0% ·8.0% -6.0% -4.0"1., ·2.0% 0.0%
Cost per Square Foot Source: CB Richard Ettls
San Fernando Valley Office lease Rates - 1st Quarter, 2010
Burbank
Studio City
Glendale
North Hollywood
Shtrm~nOaks
Entlno
West Hills
Woodland Hills
Calabasas
Universal City
SFV
V;anNuys
GranadaHIUs
Northridge
Mission HUts
Chatsworth
Tarzana
Canoga Park
Panorama City
$0.00
Source:CBRkhardEIIis
~0-50 $1.00 ~1.50 $2.00 ~2.50 $3.00
Cost per Square Foot
$3.50
los Angeles Sub-Markets Office lease Rates- 1st Quarter, 2010
Los A!fgetes Downtown
lasAilgelesCounty
HoUywoad/Wilsbire Cortfdoi:.
5anfernandoValley
Ventura
soUth Bay
S;~n GabrieiV~Itey
$0.00 $0.50 $1.0Q $1.50 $2.00 $2.50 $3.00 . $3.5~ $4.00
Source:CBRichardEIIis Cost per Square Foot
•
economic decline. Lease rates in Woodland Hills declined by 8. 7 percent and in Calabasas the decline was 6.6 percent.
Office vacancy rates are high throughout the Valley. The central portion of the Valley has been heavily impacted by housing foreclosures and the general economic downturn. This also shows in a high office vacancy rate of 55.9 percent in Panorama City. While this is a small office leasing market in the Valley, the vacancy rate reflects general economic conditions in the area: Areas with above average vacancy rates tend to be in involved in the financial markets. This includes Chatsworth, Calabasas, and Woodland Hills. The high vacancy rate is likely to put continuing downward pressure on lease rates.
The decline in offi.ce lease rates is comparable to those in surrounding areas. Lease rates iri the Valley have declined at about the rate in West Los Angeles and by significantly less than in the San Gabrial Valley. Whilethere are isolated small markets that have shown slight increases in asking lease rates. when we look at the larger markets, all are down.
The increase in vacancy rates·has lagged the general economic downturn by six to twelve months. While the market looks to have stabilized, we are not likely to see a significant improvement until sometime in early 2011.
Average asking lease rates vary widely throughout the Valley. The highest office lease rates are in areas know to be in the entertainment industry, Burbank Glendale, and Studio City. The lowest average asking lease rates are in smaller markets. The Valley continues to be a good buy when compared with surrounding areas. The Valley is significantly less expensive than West Los Angeles or Downtown Los Angeles and is about the same as Ventura.
.Industrial space leasing carries good and bad news, The good news is that our industrial space continues to have high occupancy. The bad news is that our industr1al space continues .to have high occupancy. In the face of some downward pressure on lease rates, Valley industrial space continues to have high occupancy. The vacancy rate runs at
2010 sa·n Fernando Valley Economic Summit
48
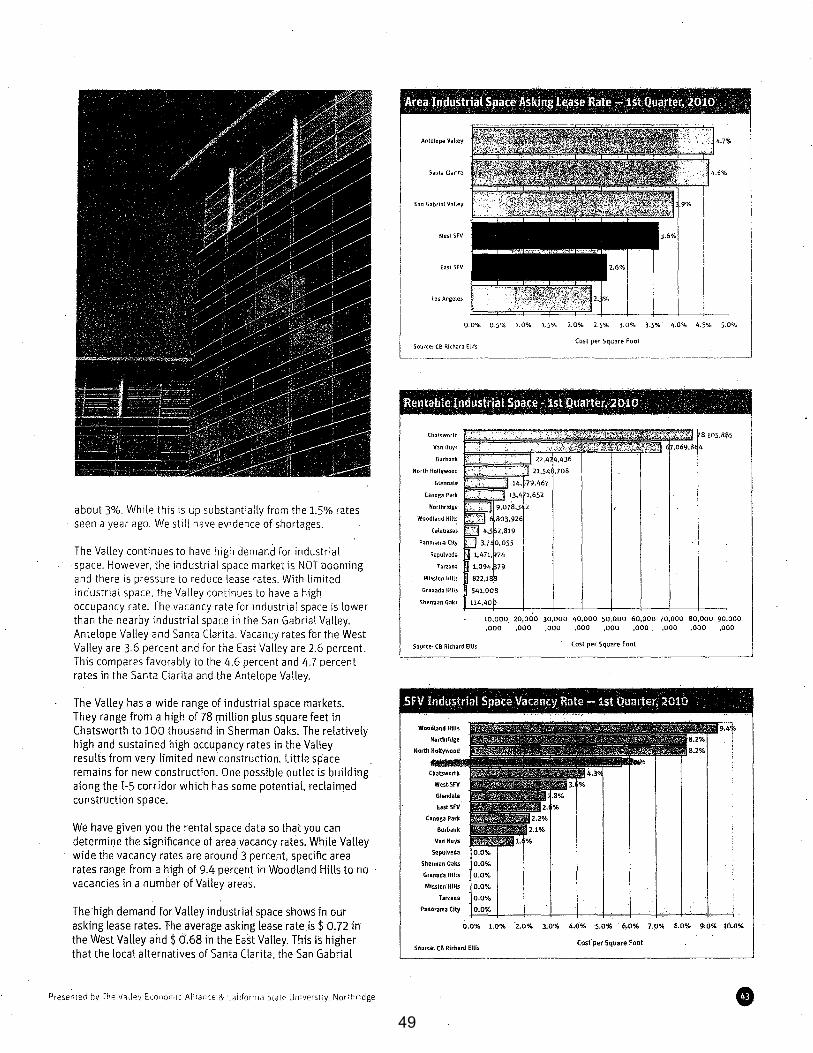
about 3%. While this is up substantially from the 1.5% rates seen a year ago. We still have evidence of shortages.
The Valley continues to have high demand for industrial space. However, the industrial space market is NOT booming and there is pressure to reduce lease rates. With limited industrial space. the Valley continues to have a high occupancy rate. The vacancy rate for industrial space is lower than the nearby industrial space in the San Gabrial Valley, Antelope Valley and Santa Clarita. Vacancy rates for the West Valley are 3.6 percent and for the East Valley are 2.6 percent. This compares favorably to the 4.6 percent and 4.7 percent rates in the Santa Clarita and the Antelope Valley.
The Valley has a wide range of industrial space markets. They range from a high of 78 million plus square feet in Chatsworth to 100 thousand in Sherman Oaks. The relatively high and sustained high o.ccupancy rates in the Valley results from very limited new construction. Little space remains for new construction. One possible outlet is building along the I-5 corridor which has some potential, reclaimed construction space.
We have given you the rental space data so that you can determif)e the significance of area vacancy rates. While Valley wide the vacancy rates are around 3 percent, specific area rates range from a high of 9.4 percent in Woodland Hills to no vacancies in a number of Valley areas.
The-high demand for Valley industrial space shows in our asking lease rates. The average asking lease rate is$ 0.72 in the West Valley and $ 0.68 in the East Valley. This is higher that the loca·l alternatives of Santa Clarita. the San Gabrial
Antelope Valley
SantaCI<~rlta
I 5an Gabrlal Volley- I
I
los Angele!>
I I I I 0.0% 0 5% 1.0% 1.5% 2.0% 2 5% 3 0% 3 5% 4 0% 4 5% 50% I
L:! Cost per Square Foot I
rce CB R.lthard Ellis
-- -----------------··-- ---- _____ I
. . 'Rentable Industrjill Spa~e- 1,st Quartet, 20-10 . . . . . · ' . .
Chatsworth 885
Van !tuys
Burbank
North Hollywood
Glendale
Canoga Park
Northridge
Woodland Hills
Calabasas
Panonm<~ City
Sepulveda
Tarzana
Mission Hills
Granada Hills
Sherman Oaks
10,000_ 20,000 30,000 40,000 50,000 60.000 70,000 80,000 90.000 .ooo ,000 ,000 ,000 ,000 ,000 ,000 ,000 ,000
Source: CB Richard Ellis Cost per Square Foot
5FV Industrial Space Vacancy Rate- 1st Quarter, 2010
Woodland Hflls
Cano~a Park
Burbank
Sepulveda 0.0%
Sherman Oaks O.Oo/o
Granada Hills 0.0%
Missian·Hms 0.0%
Tarzana 0.0%
Panorama City -1-0:.;..0.;_o/.c:_• +---+--+---1-~+--"-+-~+,---+'-'---4'---'-\
0.0% 1.0% ·2.0% 3.0% 4.0% ·S.O% 6_,0% 7~0%
Source: CB Richard Ellfs Cost per Square Foot
L------~--------------------------------------------~
• 49

Area Industrial s·p~ce Vac~ncy Rate - 1st Quarter 2o:io - _
WestSFV
East SFV
Santa Clarita
San Gabrial Valley
los Angeles
Antelope Valley
$- $0.10 $0.20 $0.30 $0.40 $0.50 $0.60 $0.70 $0.80
Source: CB Richard Ellis Cost per Square Foot
Industrial Sp~ce Asfd~g Lease Rate- 1st Quarter,· 2010 , .::-•.'·
:$· $0.20 $0.40 $0.60 $0.80 $LOO $1.20 $1.40 $1.60 $1.80 $2.00
Sou.rce: ce "Richard Etus Cast per square Foot
•
Valley and the Antelope Valley. Our industrial space lease rates continue to be relatively high, despite the economic downturn. Although, the Valley has industrial space lease market has. not avoided the economiC downturn. Industrial sppte lease rates peaked in early 2008 and have been on a ~teady decline since then. Calabasas stands as an outlier in the industrial space market with an average asking priCe almost double that of the next highest market. As the economy continues on its slow recovery, the industrial leasing market should start to show signs of improv,ement in early 2011. •
The industrial lease market points to onepotential difficulty in the Vall.ey.'s econom.icrecavery.LF our ricovery Q:llj:v.es.tn a greater manuf;:~cturing and in.dustria\ q,tiven base, We lack the· space or room to build that sp.ace to move wfth that trend. We all like to live near to where we work and the Valley aod the Greater Los Angeles area may find it difficult to provide the reqlii.red space. .
The data for this section has been graciously providedby C8 Richard Ellis ..
2010 San Fernando Valley Economic Summit
50
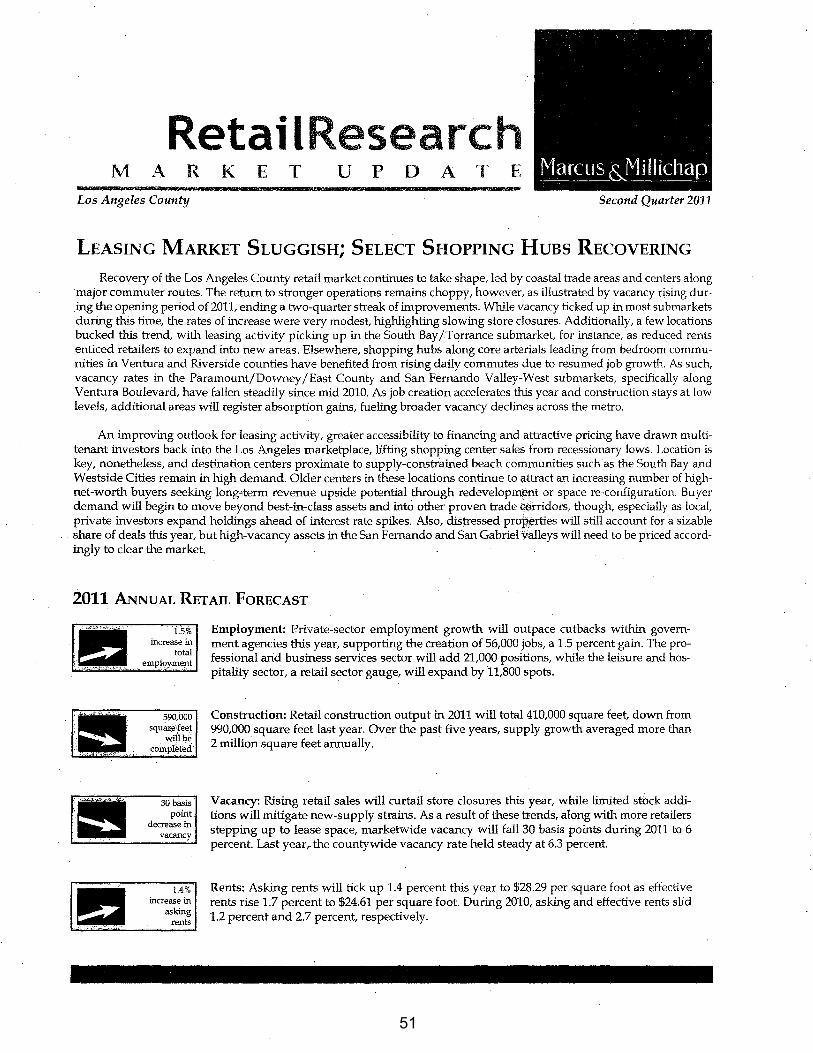
Retail esearch M A R K E T u p D A T E
Los Angeles County Second Quarter 2011
LEASING MARKET SLUGGISH; SELECT SHOPPING HUBS RECOVERING
Recovery of the Los Angeles County retail market continues to take shape, led by coastal trade areas and centers along major commuter routes. The return to stronger operations remains choppy, however, as illustrated by vacancy rising during the opening period of 2011, ending a two-quarter streak of improvements. While vacancy ticked up in most submarkets during this time, the rates of increase were very modest, highlighting slowing store closures. Additionally, a few locations bucked this trend, with leasing activity picking up in the South Bay /Torrance submarket, for instance, as reduced rents enticed retailers to expand into new areas. Elsewhere, shopping hubs along core arterials leading from bedroom communities in Ventura and Riverside counties have benefited from rising daily commutes due to resumed job growth. As such, vacancy rates in the Paramount/Downey /East County and San Fernando Valley-West submarkets, specifically along Ventura Boulevard, have fallen steadily since mid 2010. As job creation accelerates this year and construction stays at low levels, additional areas will register absorption gains, fueling broader vacancy declines across the metro.
An improving outlook for leasing activity, greater accessibility to financing and attractive pricing have drawn multitenant investors back into the Los Angeles marketplace, lifting shopping center sales from recessionary lows. Location is key, nonetheless, and destination centers proximate to supply-constrained beach communities such as the South Bay and Westside Cities remain in high demand. Older centers in these locations continue to attract an increasing number of highnet-worth buyers seeking long-term revenue upside potential through redevelopm¢nt or space re-configuration. Buyer demand will begin to move beyond best-in-class assets and into other proven trade <;orridors, though, especially as local, private investors expand holdings ahead of interest rate spikes. Also, distressed proi?~rties will still account for a sizable share of deals this year, but high-vacancy assets in the San Fernando and San Gabriel valleys will need to be priced accordingly to clear the market.
2011 ANNUAL RETAIL FoRECAST
i.S% increase in
total employment
590,000 square·feet
will be completed
30basis point
decrease in vacancy
1.4% increase in
asking rents
Employment: Private-sector employment growth will outpace cutbacks within government agencies this year, supporting the creation of 56,000 jobs, a 1.5 percent gain. The professional and business services sector will add 21,000 positions, while the leisure and hospitality sector, a retail sector gauge, will expand by 11,800 spots.
Construction: Retail construction output in 2011 will total410,000 square feet, down from 990,000 square feet last year. Over the past five years, supply growth averaged more than 2 million square feet annually.
Vacancy: Rising retail sales will curtail store closures this year, while limited stock additions will mitigate new-supply strains. As a result of these trends, along with more retailers stepping up to lease space, marketwide vacancy will fall 30 basis points during 2011 to 6 percent. Last year r the countywide vacancy rate held steady at 6.3 percent.
Rents: Asking rents will tick up 1.4 percent this year to $28.29 per square foot as effective rents rise 1.7 percent to $24.61 per square foot. During 2010, asking and effective rents slid 1.2 percent and 2.7 percent, respectively.
51
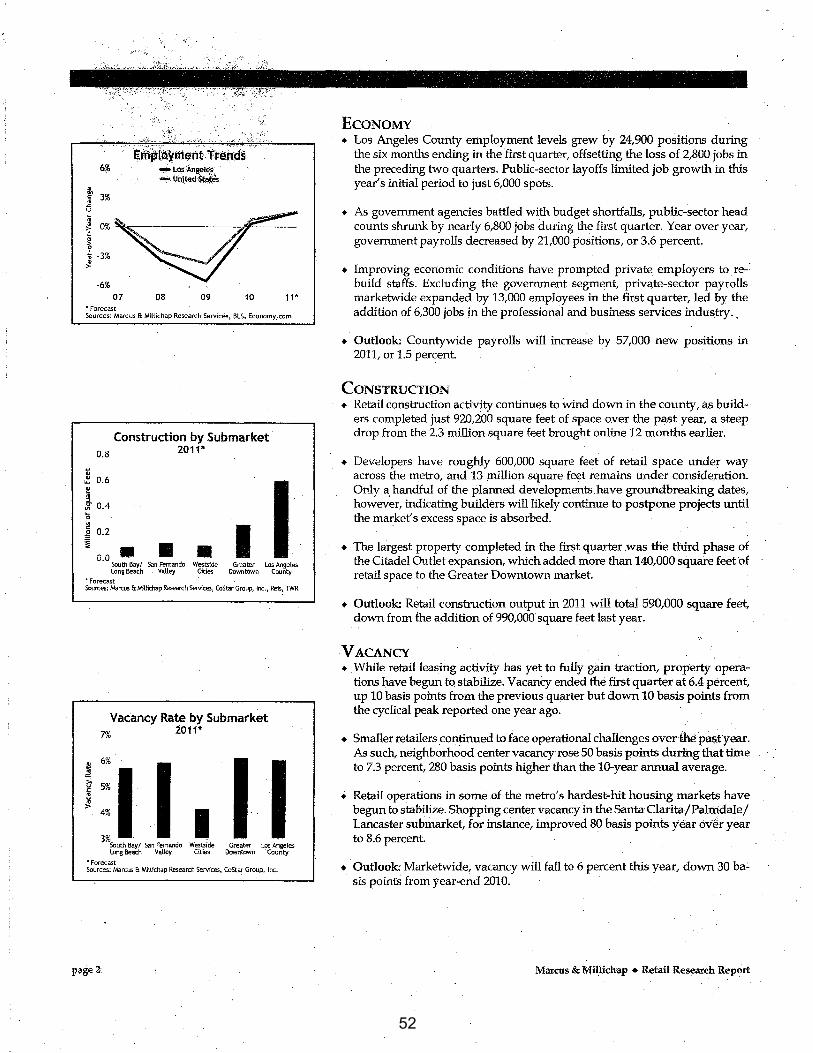
6% ...,. Los·,Angeles' ~· uriited s~t~
~ ~ 3% .c: u
iO%~.. .4?? ~ -3% . ~ .
-6% • . 07 08 09 10
• Forecast 11*
Sources: Marcus 6: Millichap Research Services, BLS, Economy .. com
0.8
~ 0.6 ~ .. " .5f 0.4 '0
0.0
Construction by Submarket 2011*
• • • I Soutfl Bay/ San Fernando Westside long Beach Valley Cities
Greater Los Angeles Downtown County
*Forecast Sources: Narcus &. Nlillichap !?£search Services, CoStar Group, Inc., ~is, TWR
Vacancy Rate by Submarket 7% 1011*
1:] I. II South Bay/ San Fernando Westside Greater Los Angeles long Beach Valley Cities Downtown ·County
"Forecast Sources: f./arcus &. Millichap Research Services, CoSta~ Group, Inc.
page2
EcoNoMY • Los Angeles County employment levels grew by 24,900 positions during
the six months ending in the first quarter, offsetting the loss of 2,800 jobs in the preceding two quarters. Public-sector layoffs limited job growth in this year's initial period to just 6,000 spots.
+ As government agencies battled with budget shortfalls, public-sector head counts shrunk by nearly 6,800 jobs during the first quarter. Year over year, government payrolls decreased by 21,000 positions, or 3.6 percent.
+ Improving economic conditions have prompted private employers to rebuild staffs. Excluding the government segment, private-sector payrolls marketwide expanded by 13,000 employees in the first quarter, led by the addition of 6,300 jobs in the professional and business services industry ..
+ Outlook: Countywide payrolls will increase by 57,000 new positions in 2011, or 1.5 percent ·
CoNSTRUCTION • Retail construction activity continues to wind down in the county, as build
ers completed just 920,200 square feet of space over the past year, a steep . drop from the 2.3 million square feet brought online 12 months earlier.
+ Developers have roughly 600,000 square feet of retail space under way across the metro, and 13 million square feet remains under consideration. Only a_ handful of the planned developments.have groundbreaking dates, however, indicating builders will likely continue to postpone projects until the market's excess space is absorbed.
• The largest property completed in the first quarter was the third phase of the Citadel Outlet expansion, which added more than 140,000 square feet of retail space to the Greater Downtown market. ·
+ Outlook: Retail construction output in 2011 will total 590,000 square feet, down from the addition of 990,000 square feet last year.
VACANCY + . While retail leasing activity has yet to fully gain traction, property opera
tions have begun to stabilize. Vacancy ended the first quarter at 6.4 percent, up 10 basis points from the previous quarter but down 10 basis points from the cyclical peak reported one year ago.
• Smaller retailers con!fuued to face operational challenges over the pastyear. As such, neighborhood center vacancy rose 50 basis points during that time to 7.3 percent, 280 basis points higher than the 10-year annual average.
+ Retail operations in some of the metro's hardest-hit housing markets have begun to stabilize. Shopping center vacancy in the Santa Clarita/Palmdale/ Lancaster submarket, for instance, improved 80 basis points year over year to 8.6 percent. ·
+ Outlook: Marketwide, vacancy will fall to 6 percent this year, down 30 ba~ sis pointS from year-end 2010.
Marcus & Millichap • Retail Research Report
52

RENTS • The era of widespread rent reductions has run its course, as retail opera
tors in the county bumped up asking rents 0.1 percent in the first quarter to $27.93 per square foot, easing the year-over-year decline to just 0.5 percent.
• At $24.21 per square foot, marketwide effective rents are down 0.7 percent from one year ago but up 0.1 percent from the final quarter of 2010.
• Concessions have held firm at 13.3 percent of asking rents for three consecutive quarters but were down modestly on a year-over-year basis as of the first quarter. Leasing incentives remain well above the pre-recession average of 8.2 percent of asking rents.
• Outlook: Asking rents will tick up 1.4 percent in 2011 to $28.29 per square foot as effective rents rise 1.7 percent to $24.61 per square foot.
SINGLE-TENANT SALES TRENDs** • Following a 31 percent slowdown one year earlier, single-tenant sales veloc
ity stabilized during the most recent 12-month period. Acquisitions of both supermarket/ grocery assets and drugstore properties increased, while the number of deals involving dining establishments and convenience store/ gas stations declined steeply.
• The median price of properties sold over the past year was $242 per square foot, down 10 percent from the prior 12-month stretch. Drugstores traded with a median price of $275 per square foot, though, up 15 percent annually.
• Singlectenant cap rates averaged in the high-6 percent to low-7 percent range during the last 12 months, down roughly 50 basis points from yearago levels.
• Outlook: Properties secured by the highest-rated tenants will draw multiple offers when listed, particularly proven drugstore and fast-food establishments. Demand will likely outpace available supply, however, potentially weighing on trading for the single-tenant property type altogether ..
MuLTI-TENANT SALES TRENDs** • Arl improving economic outlook and low interest rates have begun to thaw
buyers' aversion to risk, helping drive up multi-tenant trading activity 30 percent year over year.
• The median price among multi-tenant deals made in the pas.t 12 months rose 7 percent to.$201 per square foot, largely attributable to investors expanding holdings in more land-constrained trade areas.
• Cap rates for the·county's multi-tenant properties varied widely over the last year but generally averaged between 7 percent and 8 percent.
• Outlook: Multi-tenant investors with continued apprehension to assume risk will seek to acquire properties with minimal near-term lease expirations in centers with a strong tenant profile and intrinsic features preferred by national chains, including sufficient parking and ease of access.
Marcus & Millichap • Retail Research Report
Asking Rents by Submarket $40 . 20i 1*
~ 0 0 "-~ $35 .. " Jf t $30 a. u
" " "' "" $25 " :;;: ~ I I I I $20
South Bay/ San Fernando Westside Greater Los Angeles Long Beach Valley Cities Downtown County
• Forecast Sources: Marcus & Miltichap Research Services, CoStar Group, Inc., Reis
Single-Tenant Sales Trends
u $350
0
.:: ~ $300 .. "
I Jf
I iii $250 Q.
I I 1l 1: "-
$.200 " .! ., .. ,. $150
07 08 09 10 11* • Trailing 12-f.Aonth Period Sources: Marcus &. M11lichap Research Services, CoStar Group, Inc., RCA
Multi-Tenant Sales Trends
'0 $300 0 "-~
$250 .. ::1
I Jf iii
I 0. $200
I 1l ·c::
0..
" $150 "' ;; .. ,. $100
07 08 09 10 11* • Trailing 12-t\lonth Period Sources: Marcus&. Millichap Research Services, CoStar Group, Inc., RCA
"Data reflect a ful/12-month period, calculated on a trailmg 12-mcmth basis by quarter.
page3
53
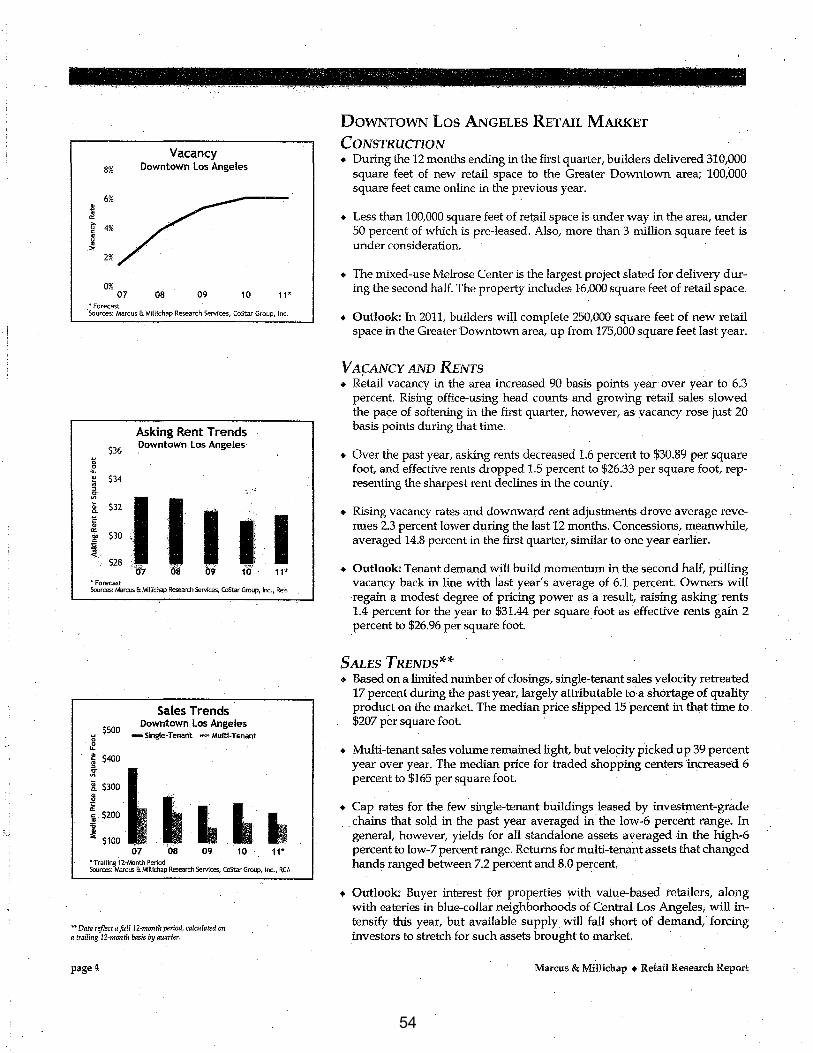
,'.)
8%
6% 2! ~
"' >. 4% u c ~
~ >
2%
0% 07
• Forecast
Vacancy Downtown Los Angeles
08 09 10 11*
·Sources: Marcus&. Millichap Research Services, CoStar Group, Inc.
$36
• Forecast
Asking Rent Trends Downtown Los Angeles
Sources: Marcus li MiUichap Research Services, CoStar Group, Inc., Reis
$500 ~ ~ f $400 !!!
il $300
Sales Trends Downtown Los Angeles
-Single-Tenant -Multi-Tenant
.lf ~ i:~~ .·· I L I. •
07 08 09 10 11* *Trailing 12·M:mth Period Sources: Marcus&. f./dllichap Research Services, CoStar Group, Inc., RCA
•• Data refoct a full i2-munth period, calatlated un a trailing 12-munth basis by quarter.
page4
DoWNTOWN Los ANGELEs RET AIL MARKET
CONSTRUCTION • During the 12 months ending in the first quarter, builders delivered 310,000
square feet of new retail space to the Greater Downtown area; 100,000 square feet came online in the previous year.
• Less than 100,000 square feet of ret;ail space is under way in the area, under 50 percent of which is pre-leased. Also, more than 3 million square feet is under consideration.
• The mixed-use Melrose Center is the largest project slated for delivery during the second half. The property includes 16,000 square feet of retail space.
• Outlook: In 2011, builders will complete 250,000 square feet of new retail space in the Greater Downtown area, up from 175,000 square feet last year.
VACANCY AND RENTS • Retail vacancy in the area increased 90 basis points year· over year to 6.3
percent. Rising office-using head counts and growing retail sales slowed the pa~e of softening in the first quarter, however, as vacancy rose just 20 basis points during that time.
• Over the past year, asking rents decreased 1.6 percent to $30.89 per square foot, and effective rents dropped 1.5 percent to $26.33 per square foot, rep~ resenting the sharpest rent declines in the county.
• Rising vacancy rates and downward rent adjustments drove average revenues 2.3 percent lower d11ring the last 12 months. Concessions, meanwhile, averaged 14.8 percent in the first quarter, similar to one year eariier.
• Outlook: Tenant demand will build momentum in the second half, pulling vacancy back in line with last year's average of 6.1 percent. Owners will regain a modest degree of pricing power as a result, raising asking rents 1.4 percent for the year to $31.44 per square foot as ·effective rents gain 2 percent to $26.96 per square foot. ·
SALES TRENDs** • Based on a limited number of closings, single-tenant sales velocity retreated
17 percent during the past year, largely attributable to a shortage of quality product on the market. The median price slipped 15 percent in that time to $207 per square foot.
• Multi-tenant sales volume remained light, but velocity picked up 39 percent year over year. The median price for traded shopping centers increased 6 percent to $165 per square foot.
• Cap rates for the few single-tenant buildings leased by investment-grade chains that sold in the past year averaged in the low-6 percent range. In general, however, yields for all standalone assets averaged .in the high-6 percent to low-7 percent range. Returns for multi-tenant assets that changed hands ranged between 7.2 percent and 8.0 percent.
• Outlook: Buyer interest for properties with value-based retailers, along with eateries in blue-collar neighborhoods of Central Los Angeles, will intensify this year, but available supply will fall short of demand, forcing investors to stretch for such assets brought to market.
Marcus & Millichap • Retail Research Report
54
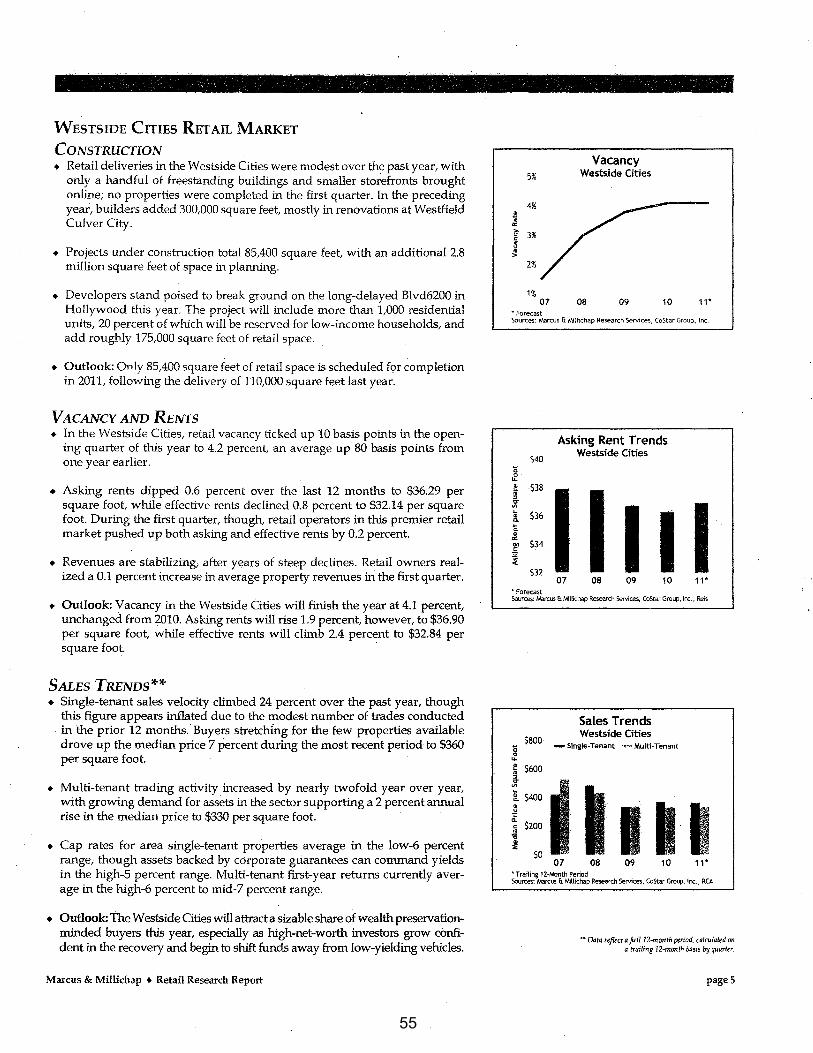
WESTSIDE CITIES RET AIL MARKET
CONSTRUCTION • Retail deliveries in the Westside Cities were modest over the past year, with
only a handful of freestanding buildings and smaller storefronts brought online; no properties were completed in the first quarter. In the preceding year, builders added 300,000 square feet mostly in renovations at Westfield Culver City.
• Projects under construction total 85,400 square feet, with an additional 2.8 million square feet of space in planning.
• Developers stand poised to break ground on the long-delayed Blvd6200 in Hollywood this year. The project will include more than 1,000 residential units, 20 percent of which will be reserved for low-income households, and add roughly 175,000 square feet of retail space.
• Outlook: Only 85,400 square feet of retail space is scheduled f9r completion in 2011, following the delivery of 110,000 square feet last year.
VACANCY AND RENTS • In the Westside Cities, retail vacancy ticked up 10 basis points in the open
ing quarter of this year to 4.2 percent, an average up 80 basis points from one year earlier.
• Asking rents dipped 0.6 percent over the last 12 months to $36.29 per square foot, while effective rents declined 0.8 percent to $32.14 per square foot. During the first quarter, though, retail operators in this premier retail market pushed up both asking and effective rents by 0.2 percent.
• Revenues are stabilizing, after years of steep declines. Retail owners realized a 0.1 percent increase in average property revenues in the first quarter.
• Outlook: Vacancy in the Westside Cities will finish the year at 4.1 pen:ent, unchanged from 2010. Asking rents will rise 1.9 percent, however, to $36.90 per square foot, while effective rents will climb 2.4 percent to $32.84 per ~re~ .
SALES TRENDS** • Single-tenant sales velocity climbed 24 percent over the past year, though
this figure appears inflated due to the modest number of trades conducted · in the prior 12 months. Buyers stretching for the few properties available drove up the median price 7 percent during the most recent period to $360 per square foot.
• Multi-tenant trading activity increased by nearly twofold year over year, with growing demand for assets in the sector supporting a 2 percent annual rise in the median price to $330 per square foot. ·
• Cap rates for area single-tenant properties average in the low-6 percent range; though assets backed by corporate guarantees can command yields in the high-S percent range. Multi-tenant first-year returns currently average in the high-6 percent to mid-7 percent range.
• Outlook: The Westside Cities will attract a sizable share of wealth preservationminded buyers this year, especially as high-net-worth investors grow confident in the recovery and begin to shift funds away from low-yielding vehicles.
Marcus & Millichap • Retail Research Report
5%
4% s .. "' C; 3% c
~ >
2%
1% 07
"Forecast
Vacancy Wests.ide Cities
08 09 10 11*
Sources: Marcus &. Mntichap Researcll Services, CoStar Group, Inc.
Asking Rent Trends
$40 Westside Cities
'0 0· "-
~ $38 :>
.5f
I I t $36
I Q.
~
" ,:! $34 "" c:
:!2 ~
$32 07 08 09 10 11*
*Forecast Sources: 1\o\arcus &. Millichap Research Services, CoStar Group, Inc., Reis
Sales Trends
$800 Westside Cities
'0 -Single~ Tenant _,. Multi·Tenant 0 ... !! $600 .. :>
.5f
~ I g_ $400 ~
I I I " 1:: "-
$200 " .. '6 ~ ::
$0 07 08 09 10 11*
-Trailing 12·Nonth Period Sources: !Varcus & M.illichap Research Services, CoStar Group, Inc., RCA
-Data refod a ful/12-month pen'od, calculated on a truiling 12-month bas1s byquurter.
page 5
55
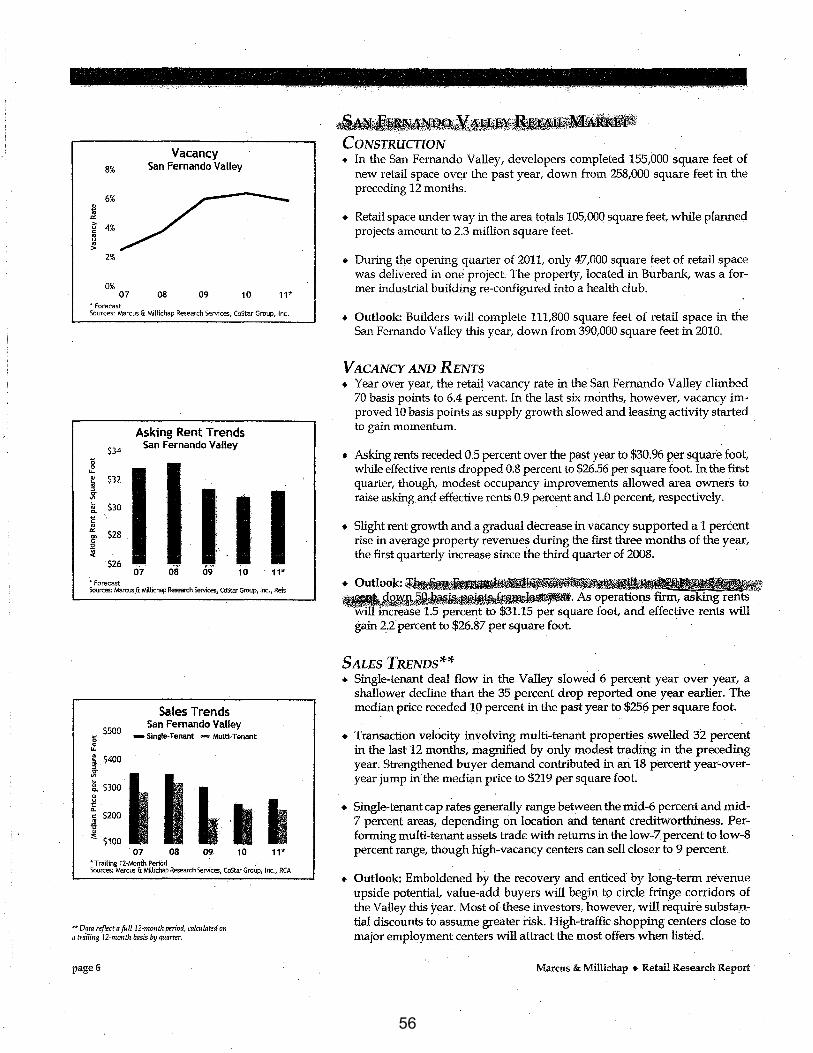
Vacancy 8% San Fernando Valley
6% 2 .. a:: ~ 4% "' .. u .. >
2%
0% 07 08 09 10 11*
"'Forecast Sources: Marcus &. MiUichap Research Services, CoStar Group, Inc.
Asking Rent Trends
$34 San Fernando Valley
1> 0 "-
~ $32 ::1
I I .5f
I :;; $30 c..
"' & $28 "' c
32 ~ '
$26 o7 os o9' 10 11. *Forecast Sources: Narcus &. Millichap Research Services, COStar Group, lnc., Reis
$500 1> ~ ~ $400 .. -" .5f ! $300
~ ~ $200 '6
~ $100
Sales Trends San Fernando Valley
-Single-Tenant -Multi-Tenant
07 08 09, 10 • Trailing 12-Month Period .
11*
Sources: Marcus & Millichap Research Services, CoStar Group, Inc., RCA
,.,. Data reflect a foiL 12-nzonth period, calrulated on a trailing 12-month basis by quarter.
page6
.. ~;.~lM~G.,,u,-,.,r;Jl,ill<TOC,\i~,c&;.:f§ili~'D,u''i1i•'""'~J>\l\:~~~~~~~~~~~~..~;:SftitP.'"f~,~~~~tsf~~U~
CONSTRUCTION • In the San Fernando Valley, developers completed 155,000 square feet of
new retail space over the past year, down from 258,000 square feet in the preceding 12 months.
+ Retail space under way in the area totals 105,000 square feet, while planned projects amount to 2.3 million square feet
• During the opening quarter of 2011, only 47,000 square feet of retail space was delivered in one project. The property, located in Burbank, was a former industrial building re-configured into a health club.
• Outlook: Builders will complete 111,800 square feet of retail space in the San Fernando Valley this year, down from 390,000 square feet in 2010.
VACANCY AND RENTS • Year over year, the retail vacancy rate in the San Fernando Valley climbed
70 basis points to 6.4 percent. In the last six months, however, vacancy improved 10 basis points as supply growth slowed and leasing activity started to gain momentum. ·
• Asking rents receded 0.5 percent over the past year to $30.96 per square foot, while effective rents dropped 0.8 percent to $26.56 per square foot. In the first quarter, though, modest occupancy improvements allowed area owners to raise asking and effective rents 0.9 percent and 1.0 percent, respectively.
• Slight rent growth and a gradual decrease in vacancy supported a 1 percent rise in average property revenues during the first three months of the year, the first quarterly increase since the third quarter of 2008. '
• Outlook:~~-;-~~-~ .• ·~.·.'·_ -.···· ·· .· .2r;lf ~~~~l\!f. As operatior:tS firm, asking rents
will increase 1.5 percent to $31.15 per square foot, and effective rents will gain 2.2percent to $26.87 per square foot. -
SALES TRENDS** • Single-tenant deal flow in the Valley slowed 6 percent year over year, a
shallower decline than the 35 percent drop reported one year earlier. The median price receded 10 percent in the past year to $256 per square foot.
• Transaction velocity involving multi-tenant properties swelled 32. percent in .the last 12 months, magnified by only modest trading in the preceding. year. Strengthened buyer demand contributed in an 18 percent year-overyear jump in'the medi<,m price to $219 per square foot.
• Single-tenant cap rates generally range between the mid-6 percent a.nd mid-7 percent areas, depending on location and tenant creditworthiness. Performing multi-tenant assets trade with returns in the low-7 percent to low-8 percent range, though high-vacancy centers can sell closer to 9 percent.
• Outlook: Emboldened by the recovery and enticed by long-term revenue upside potential, value-add buyers will begin to circle fringe corridors of the Valley this year. Most of these investors, however, will require substantial discounts to assume greater risk. High-traffic shopping centers close to major employment centers will attract the most offers when listed.
Marcus & Millichap • Retail Research Report
56
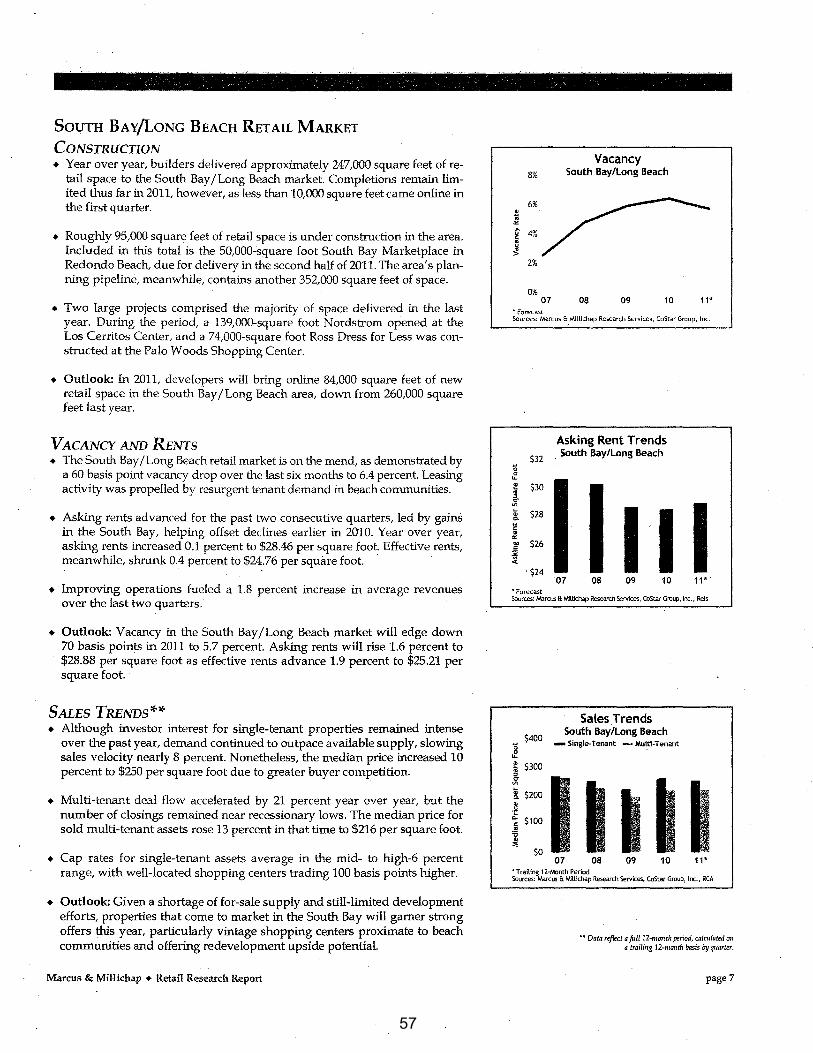
SouTH BAY/LONG BEACH RETAIL MARKET
CoNSTRUCTION + Year over year, builders delivered approximately 247,000 square feet of re
tail space to the South Bay /Long Beach market. Completions remain limited thus far in 2011, however, as less than 10,000 square feet came online in the first quarter.
• Roughly 95/000 square feet of retail space is under construction in the area. Included in this total is the 50,000..:square foot South Bay Marketplace in Redondo Beach, due for delivery in the second half of 2011. The area's planning pipeline, meanwhile, contains another 352,000 square feet of space.
• Two larg-e projects comprised the majority of space delivered in the last year. During the period, a 139,000-square foot Nordstrom opened at the Los Cerritos Center, and a 74,000-square foot Ross Dress for Less was constructed at the Palo Woods Shopping Center.
• Outlook: In 2011, developers will bring online 84,000 square feet of new retail space in the South Bay /Long Beach area, down from 260,000 square feet last year.
VACANCY AND RENTS • The South Bay /Long Beach retail market is on the mend, as demonstrated by
a 60 basis point vacancy drop over the last six months to 6.4 percent. Leasing activity was propelled by resurgent tenant demand in beach communities.
• Asking rents advanced for the past two consecutive quarters, led by gains in the South Bay, helping offset declines earlier in 2010. Year over year,
. asking rents increased 0.1 percent to $28.46 per square foot Effective rents, meanwhile, shrunk 0.4 percent to $24.76 per square foot.
• Improving operations fueled a 1.8 percent increase in average revenues over the last two quarters.
• Outlook: Vacancy in the South Bay/Long Beach market will edge down 70 basis points in 2011 to 5.7 percent. Asking rents will rise 1.6 percent to $28.88 per square foot as effective rents advance 1.9 percent to $25.21 per square foot.
SALES TRENDS** • Although investor interest for single-tenant properties remained intense
over the past year, demand continued to outpace available supply, slowing sales velocity nearly 8 percent. Nonetheless, the median price increased 10 percent to $250 per square foot due to greater buyer competition.
• Multi-tenant deal flow accelerated by 21 percent year over year, but the number of closings remained near recessionary lows. The median price for sold multi-tenant assets rose 13 percent in that time to $216 per square foot.
• Cap rates for single-tenant assets average in the mid- to high-6 percent range, with well-located shopping centers trading 100 basis points higher.
• Outlook: Given a shortage of for-sale supply and still-limited development efforts, properties that come to market in the South Bay will gamer strong offers this year, particularly vintage shopping centers proximate to beach communities and offering redevelopment upside potential.
Marcus & Millichap • Retail Research Report
8%
6% $ " "' ~ 4% ~ ~
~ >
2%
0% 07
·Forecast
Vacancy South Bay/Long Beach
08 09 10 11*
Sources: Marcus & Millichap Research Services, CoStar Group, Inc.
Asking Rent Trends 532
. South Bay/Long Beach
'0 0
"" ~ $30
~
I I I :g_ $28
'$24 07 08 09 10 11*
~Forecast Sources: Marcus & Miltichap Research Services, CoStar Group, Inc., Reis
Sales Trends
$400 South Bay/Long Beach
'0 -Single-Tenant· -. Mul_ti-Tenant 0
"" ~ $300 .. "
I ~
I ~ ~ 8. $200
I ~ 1: a.. $100 ~ ~
'6 " ::;
$0 07 08 09 10 11*
•Trailing 12-IVonth Period Sources: 1\o\arcus &. Millichap Research Services, CoStar Group, tnc., RCA
•• Data uflect a full12-monlh period, calculoted on a trailing 12-month basis l1y quarter.
page7
57

Marcus &,Millichap NATIONAL RETAIL GROUP
Visit www.NationalRetailGroup.com or call:
Bill Rose National Director National Retail Group Tel: (858) 373-3100 [email protected]
Prepared and edited by Michael L. Brown
Research Analyst Research Services
For information on national retail trends, contact
JohnChang . Vice President, Research Services
Tel: (602) 687-6700 ext. 6803 [email protected]
Los An~les Office: Step}Jij!n Stein
Regioriijl )\ilimager sstein@#usmilJWhap.com
915 Wjlshire eotilevard, _Suite 1700 Los. Angeles, CalifoJ:-nia 90017
Tel: (213) 943-1800 Fax: (213) 943-1951
West Los Angeles Office: Anthony Solomon
Regional Manager · [email protected]
12100 W. Olympic Boulevard, Suite 350 Los Angeles, California 90064
Tel: (310) 909-5500 Fax: (310) 909-5410
Long Beach Office: John Rodiles
Regional Manager [email protected]
Orie World Trade Center, Suite 2100 Long Beach, California 90831
Tel: (562) 257-1200 Fax: (562) 257-1210
Encilfo Office: Adain ChrislOfferson
. . . Re!iionailtmager achristofferilon®mii'i:<iusmillicl\'ap.com
· FiiSt Finandru Plaza 16830 Ventura Bofuevard, Suite 100
Encino, California 91436 Tel: (818) 212-2700 Fax:.(818) 212-2710
Price:$150
© Marcus & Millichap 2011· www.Marcusl.Vlillichap:com
CAPITAL MARKETS BY WILLIAM E. HUGHES, SENIOR V!CE PRESIDENT, MARCUS & MILL!CHAP CAPITAL CORPORATION
• The yield on the 10-year U.S. Treasury remained in the mid-3 percent range throughout the first quarter, where it will stay over the rest of 2011. A change in the ratings outlook for the nation hardly disturbed the credit markets, but ongoing U.S. budget battles, unrest in the Middle East and lingering uncertainty concerning sovereign European debt could affect interest rates.
• Active lenders include life companies; commercial banks and other financial companies. CMBS staged a comeback in the first quarter, with $8.7 billion of new issuance, and will easily exceed last year's total of $12 billion. Conduits continue to broaden their lending criteria as property operations stabilize.
• Loan-to-value ratios generally range from 60 percent to 75 percent, depending on asset age and quality, location, tenant mix, and tenant credit rating. Multi-tenant assets with strong anchors and a stable mix of national in-line tenants remain preferred. Debt-service ratios range from 1.25x to 1.40x. Financing for lower-quality but not distressed assets will stay limited until economic factors stabilize further and investor demand increases.
• Lending rates remain low for performing assets in primary markets. All-in rates for five-year retail loans typically start in the low- to mid-5 percent range, while seven- and 10-yearloans price between 5.5 percent and 6.0 percent.·
SUBMARKET VACANCY RANKING Vacancy
· Rank Submarket Rate 1 San Cabrit'li Valley-West 1.8%
2 Culver City /Inglewood/El Segundo 3.5%
3 s@:ti)c"M:bruca:/Wes~i0:~/b'6w.n:(own s:~% 4 Burb<;1nk/Gle1,1dale/Pasadena 5.4%
5 SouthBay/Toriarice 5.7%
6
Q 9
10
11
12
Paramount/ Downey/ East County
San Fernando Valley-East
San Fernando Valley-West
• Lob.g:ilea~/Ce.ft.ftoS/c<if:sol,1·
6.2%
~ Central Los Arigeles 7JJ!, sari 0a.~~wt:Vail~y"E~'$t '7:8'% Santa Garita VaJ.ley /Palmdale/Lancaster 8. 9%
Y-0-Y Basis Point Change
~0 10
f80•'' 30
-90
-190
100
50
tzo· 20
~6' -130
Effective Y.O-Y Rents (ps~ %Change
$24o22 .1;3%
$31.51 2;1%
$32:98 4,~%,. $26.02 1.4%
$261.3 -~1.8%
$70.72 -1.6%
.·$27:it ,. ,f5!){;.
$26.44 -1.4%
'$2;3:1)7 ftQ% $21.63 1.7%
· $zo;7<ti ;]:)2% $19.69 -().7%
71~e· in{ormatiurt cotrlained in thrs ~~ was ubtai1red from f:OitTCI!S d«med to be relinblt:. £very <!!fort tlkls mmfe to obtai11 acn/Tttte and complete information; liotQr:VI!1', no repn:se.,rtnticm. tuarmuty ar guarantee, 1!-rpr!!SS or implied, may A! made as to the accumcy or rr:firlbility oft~ information amtai11ed herein. Safes dnta mclmks tmnsach.ons T.llllm~d at $500,000 tmJ greciter rm{e$$ othmuiSt! noted. Souro:s: Marcus & Millidrnp &:searclr S!!rvires, Brrrl!ifll of lAbor Stntistics, CoStnr. Group, Inc., Ecouom!l.com, Real Cnpilal Analytics, Rt:rs, l~'R;Oodge- Pipeline, US Cmsus Bureau.
58
HAl Capital California Lutheran ------
\," E R S r ·1 y Commer~i2l Real Esta'-': Services /'J·~r::J·Nide.
59

bear Reader,
We are-pleased to present the Year~End 201 0 Market Report for the Los Angeles Basin: As usyal we strive to present the complete picture. We will discuss the problems e!}countered in 2010 and the outlook for 2011. We sincerely hope you find this report and data contained within useful. We provide this report in the hope that it will help our customers make informed decisions. More detailed data can be obtained from our brokers on specific markets and property types.
201 0 was another difficult year for commercial real estate. The lingering effects of the "Great Recession" remained for most of the year. The economy began to strengthen in the latter half of the year, but the recovery was not as robust
· as one would like. The slow recovery continues to pressure commercial real estate markets in the Los Angeles Basin. Lease rates remain low while vacancy rates remain high. This combination essentially eliminated new construction.
Although 2010 was not a banner year, it is likely that 2011 will be better, economically speaking. An improving job market and confidence that ·the recovery will persist has convinced the all-important American consumer to increase spending. Banks are slowly recapital~zing and starting to lend again. World trade is rising and this is reflected locally by increased activity at the Port of Long·Beach. In general, all the economic signs are pointing to a recovery in 2011.
With that said, we must point out that not all conditions are ideal. Europe continues to struggle with sovereign debt problems, as are· several U.S. states and municipal~ies. Political instability in the Middle East may give the markets more· jitters. High oil and food prices could lead to inflation. The recovery is soft relative to previous recoveries, and could slow down, if not halt altogether, if these problems worsen. ·
As the economy recovers, so too will commercial real estate markets. However; we must ·caution the reader that a lag exists between a general eeonomic recovery and a recovery in commercial real estate. Businesses do notjmmediately increase capacity as the economy improves. Instead, they monitor the situation. They wait until they are sure that economic activity has increased to justify any expansion plans. Although it varies over time; this lag can linger.
Qv$rall, we expect.conimercial real estate to slowly itnprove in the latter half of the. year, Of course, improvement _will . not be universal. The strongest submarkets will improve first. In fact, some markets may see gains during the first half of the year; . On the other hand, the weakest markets may remain subdued throughout the year. .·
As always;· we hope the information contained in this report is Useful to you.
Michael Zugsmith Cbaiin:lan
R~bert Scullin C{lief t=xeeutive Officer
60

Economic Overview Finally, some good news! After suffering through one of its worst recessions, California's economy is slowly improving. California's GOP increased every quarter in 2010. We expect further increases in 2011 .
The rate of growth is not likely to be what we are used to. In the past growth rates of 3- 3.5 percent were considered the norm. As the chart below shows we forecast growth rates below 3 percent. Although these growth rates are soft, we should not be discouraged. Recessions caused by financial crisis are typically worse. They tend to last longer and are followed by a weaker recovery.
Limited credit will contribute to the slow recovery, as banks rebuild their balance sheets. The Great Recession was particularly troublesome for banks. A record number failed despite the FED's massive injection of capital into the financial· markets.
Many businesses and consumers are still over leveraged, a result of the dramatic fall in asset prices, particularly real estate prices. This will contribute to the recovery's weakness as consumers and businesses postpone risk taking until their balance sheets are restored.
Source: CERF (red indicates forecasted numbers)
In addition to suffering from a financial crisis, California has sub-. stantial budgetary issues that may weigh negatively on the econ
omy. To fund a $25 billion budget gap Governor Brown has proposed approximately $12.5 billion in spending cuts and $12.5 billion in taxes. The taxes are not new. Instead the Governor proposes extending taxes that are due to expire.
On the whole, the Governor's budget plan is a step in the right direction. State spending needs to be cut. California has been spending more than it receives for years. Our credit cards are rnaxed out. We may squabble as to where the cuts should be made but there appears to be a general consensus that spending cuts are needed.
The fly in the anointment is voters. Will voters extend previous tax hikes? According to a recent report by the Public Policy Institute
of California 53 percent of likely voters favor extending the taxes. Although this bodes well we must remember that there are five months between now and the special election. Anything could happen.
If voters reject the Governor's plan, expect more spending cuts. K-12 education will likely be cut significantly, and the State's payroll will decline. In general, the level of government services will decrease.
Job markets throughout California remain weak. While the State's unemployment rate is below the peak it stubbornly remains above 11 percent, well above the national average. A lack of confidence amongst businesses and onerous regulations are the main culprits.
The State's persistent budget problems, new environmental regulation, and high business taxes have created a .climate of uncertainty for the business community. Instead of expanding or moving to California many businesses are leaving or expanding elsewhere. They are taking advantage of business friendly climates in other states; notably Texas and other heartland states.
Source: CERF (red indicates forecasted numbers)
Although job losses in the Los Angeles Basin persist, the rate of loss. has slowed considerably. No longer is the Basin losing 6 - 7 percent of its jobs. In the third quarter of 201 0 the rate of losses slowed to 1 - 2 percent. Additional job losses are never wanted, but the rate has steadily improved over the last four quarters, and we expect continued slow improvement. Orange County is the lone bright spot. It added jobs in the third quarter!
California's retail sales remain sluggish. The gains made in the first two quarters of 201 0 were not sustained, as retail sales turned negative in the third quarter when compared to the same qu~er of the previous year. The gains in the first two quarters are attnbutable to Federal tax credits for home buyers. Consumers took advantage of these tax credits and bought new homes. In doing so they also bought new home furnishings that led to the increases in retail sales. Unfortunately, as the tax credits expired so did the impact on retail sales.
This was a recurring problem during the Great Recession. Government incentives to increase car, home and retail sales were only temporary. Once the incentives expired so did their impact.
61
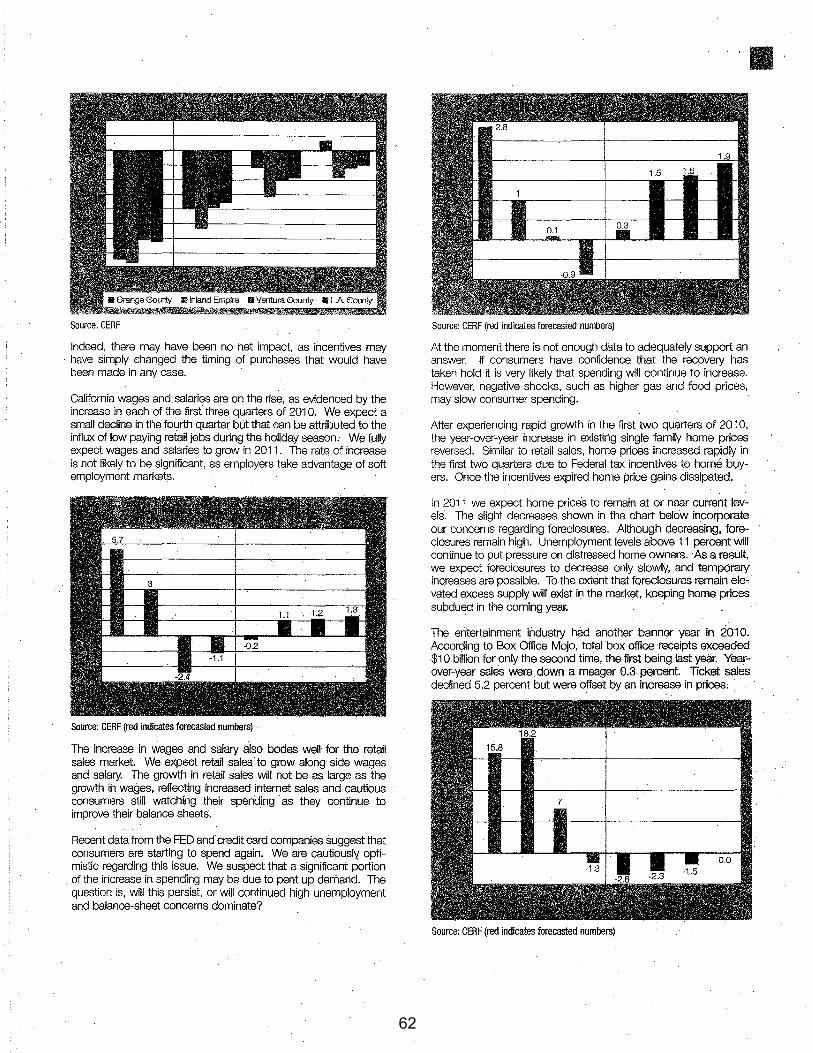
Source: CERF
Indeed, there may have been no net impact, as incentives may · have simply changed the timing of purchases that would have
been made in any case.
California wages and.salaries are on the rise, as evidenced by the increase in each of the first three quarters of 201 0. We expect a small decline in the. fourth quarter but that can be attributed to the influx of low paying retail jobs during the holiday season. Wf? f:UIIy expect wages and salaries to grow in 2011 . The rate of increase is not likely to be significant, as employers take advantage of soft employment markets.
Source: CERi= (red indicates forecasted numbers) .
The increase in wages and salary also bodes well for the retail sales market. We expect retail sales.· to grow along side wages and salary. The growth in retail sales will not be as large as the growth in wages, reflecting increased internet sales and cautious consumers still watching their spending ·as they continue to improve their balance sheets. ·
Recent data from the FED and· credit card companies suggest that consumers are starting to spend again. We are cautiouslY. optimistic regarding this issue. We suspect that a significant portion of the increase in spending may be due to pent up demand. The question is, will this persist, or will continued high unemployment and balance-sheet concerns dominate?
Source: CERF (red indicates forecasted numbers)
At the moment there is not enough data to adequately support an answer. ·If consumers have . confidence that the recovery has taken hold it is very likely that spending will continue to increase. However, negative shocks, such as higher gas and food prices, may slow consumer spending.
After experiencing rapid growth in the first two quarters of 201 0, the year-over-year increase in existing single family home prices reversed. Similar to retail sales, home prices increased rapidly in the first two quarters due to Federal tax incentives to home buyers. Once the incentives expired home price gains dissipated.
In 2011 we expect home prices to remain at or near current levels. The slight decreases shown in the chart belOw incorporate our concerns regarding foreclosures. Although decreasing, foreclosures remain high. Unemployment levels above 11 percent will continue to put pressure on distressed home owners. As a result, we expect foreclosures to decrease only slowty, and temporary increases are possible. To the extent that foreclosures remain ele~ vated excess supply will exist in the market, keeping home prices subdu~ in the coming year.
The entertainment industry had another banner year in 2010. According to Box Office Mojo, total box office receipts exceeded $1 0 billion for only the second tinie, the first being last year. Yearover-year sales were. down a meager 0.3 p~rcent. Ticket sales declined 5.2 percent but were offset by an increase in prices;
Source: CERF (red indicates forecasted numbers)
62

Source: CERF
In addition to box office receipts, production permits increased significantly in 2010. According to Film LA, on-location filming in the Los Angeles area increased nearly 15 percent in 201 0. The significance of increased filming lies in the jobs it attracts. Jobs associated with iihning are typically better paying ~han jobs related to movie theaters. The down side is that the jobs are temporary in nature.
The strength of the entertainment industry bodes well for Los Angeles County. Hollywood and related industries are a significant source of jobs in the County. Growth in Hollywood will help alleviate declines in other industries.
In general, the Los Angeles Basin economy is beginning to improve. Although still quite weak, the job market is improving. Home prices are at or near their cyclical lows. Wages and salaries are increasing as are retail sales. 2011 is not likely to.be a great year but it st;lould be an improvement over 2010.
Source: Box Offiae Mojo
The Year End Review Office Market Given the lack of a robust recovery it is no surprise that demand for Los Angeles Basin office space declined in 2010. Bankruptcies, downsizing, consolidation and companies leaving California continue to impact the office market. The weak recovery has not been sufficient to overcome these issues. The risks of expansion have increased while the rewards has fallen.
II
The end result is increasing vacancy rates. For the Los Angeles Basin as a whole, office vacancy rates exceed 16.6 percent. At 19.6 percent, the Inland Empire has the highest office vacancy rate even though the Inland Empire was the only market to experience a decline in vacancy rates. At 1 5 percent Los Angeles County has the lowest office vacancy rate.
Source: CoStar
As office market vacancy rates increased, rental rates declined. Average monthly rental rates for office space in the Los Angeles Basin are about $2.21 per square foot. This represents a decline of $0.12 from last year.
On a positive note the decline in rental rates abated in 2010. Although renti:d rates declined, they did not fall. as much as they
63

~-··
did in 2009. This suggests that the office market is begfnning to bottom out. Landlords are beginning to hold the line on deteriorating rental rates. We interpret this as an indicator of better things to come.
That is not to say that the office market will rebound significantly in 201 i . There is still a tremendous amount of vacant space that needs to be absorbed. However, the improving economy and strengthening lease rates suggest that 201 i will be better than 2010.
Source: CoStar
Source: CoStar
Source: CoStar
High vacancy rates, low lease rates, and a lack of capital have essentially eliminated new office construction projects. Low rental rates increase the risk of new projects, and it becomes increasingly difficult to financially justify new projects when lease rates are falling. Even in those submarkets where new construction is warranted, developers are finding it difficult to get the necessary credit.
Both vacancy rates and lease rates are expected to stabilize.
Source: CoStar
Source: CoStar
Source: CoStar
64

Both metrics had smaller declines in 2010 than they did in 2009. We expect both to bottom out in 2011 and slowly improve as the year progresses.
Net absorption in the fourth quarter was 640,413 square feet for the Basin as whole, and all four markets experienced positive nei absorption during the quarter. This is certainly a positive sign. It will take some time for the effects of the positive net absorption to
Source: Costar
Source: Costar
work itself through the market but overall this bodes well for the coming year.
More importantly, this trend is expected to continue in 2011 . It will take time to soak up all the excess vacancy therefore we do not expect to see improvements right away. Nonetheless, 2011 is off to a better start than was 2010.
Source: Costar
Source: Costar
II
65

- - - --- - - - - ~ --- - - - - - - - - - - - -
_ · Los Angeles Basin Office MarKet • Fourth Quarter 2010
Vacancy Rate Average Asking Rental Rate'
Difference
$2.21 $2.33 $(0.12)
Source: CoStar
' Per SF per month, NNN. Total is weighted by available space. Data is for all Glass fl., Band C buildings 20,000 SF orlarger. Excludes owner-occupied.
66
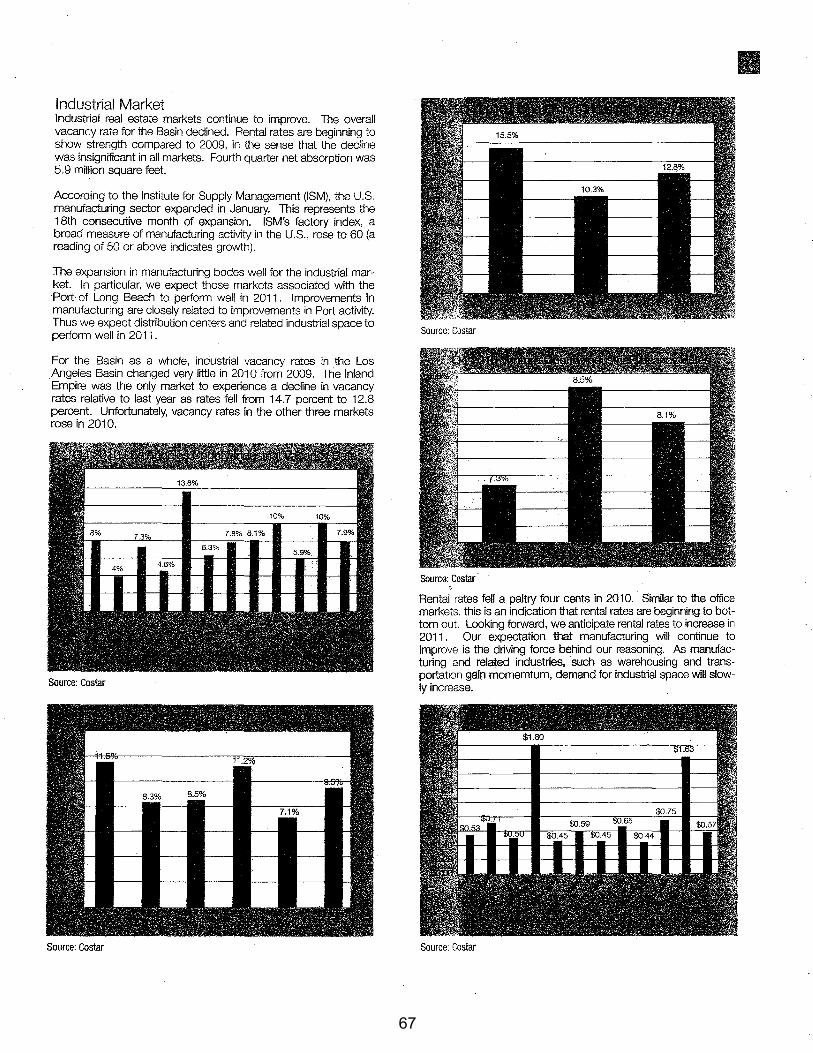
Industrial Market Industrial real estate markets continue to improve. The overall vacancy rate for the Basin declined. Rental rates are beginning to show strength compared to 2009, in the sense that the decline was insignificant in all markets. Fourth quarter net absorption was 5. 9 million square feet.
According to the Institute for Supply Management (ISM). the U.S. manufacturing sector expanded in January. This represents the 18th consecutive month of expansion. ISM's factory index, a broad measure of manufacturing activity in the U.S .. rose to 60 (a reading of 50 or above indicates growth).
The expansion in manufacturing bodes well for the industrial market. In particular, we expect those markets associated with the Port· of Long Beach to perform well in 2011. Improvements in manufacturing are closely related to improvements in Port activity. Thus we expect distribution centers and related industrial space to perform well in 2011.
For the Basin as a whole, industrial vacancy rates in the Los Angeles Basin changed very little in 2010 from 2009. The Inland Empire was the only market to experience a decline in vacancy rates relative to last year as rates fell from 14.7 percent to 12.8 percent. Unfortunately, vacancy rates in the other three markets rose in 201 0.
Source: Costar
Source: Costar
Source: Costar
Source: Costar ·
" Rental rates fell a paltry four cents in 2010. Similar to the office markets, this is an indication that rental rates are beginning to bottom out. Looking forward, we anticipate rental rates to increase in 2011 . Our expectation that manufacturing will continue to improve is the driving force behind our reasoning. As manufacturing and related industries, such as warehousing and transportation gain momemtum, demand for industrial space will slowly increase.
Source: Costar
67
Source: Costar
Source: Costar
Source: Costar
"To climb steep hills requires a slow pace at first"
-Shakespeare
l~et absorption in the fourth quarter was a blistering 5.9 million square feet. Most of this occurred in the Inland Empire where 4.2 million square feet was absorbed. Los Angeles County essentially accounted for the rest.
Again, this is a good sign as we heac:f into 2011. It will take time for the net absorption to be felt but the industrial market appears to be headed in the right direction.
Source: Costar
Source: Costar
Source: Costar
68

II
Source: Costar
Source: CoStar
·Per SF per montr. "!i";i'; ~ua1 s .,8,g'ter; ~' 'J·;ailable space. Data is for all Crass:. .. 3 3:·;; ~ G;,i!dr·gs ~S.JOG SF or larger. Excludes owner-occupied.
69

Retail Market It appears that Southern California retail markets are improving. Vacancy rates appear to have bottomed out in each of the four markets. In fact, for the Basin as a whole retail vacancy rates are unchanged from a. year ago. Our only concern is the continued decline in rental rates. Landlords are not able to hold the line in this market.
Improvements in consumer spending will likely offer some relief to the retail market. However! these gains will be soft, as.consumers remain concerned about high unemployment and shift purchases away from brick and mortar business to the internet. Internet sales continue to grow much faster than sales at traditional brick and mortar establishments.
Vacancy rates remain elevated in the Los Angeles Basin. Not a single market has a vacancy rate below 5 percent. Los Angeles County is close at 5.8 percent. Vacancy rates in the Inland Empire . remain above 1 0 percent.
Source: Costar
Source: Costar
Source: Costar
Source: Costar
Source: Costar
On average, retail lease rates fell $0.20 per square foot per month · in 201 0. This represents a decline of 9.8 percent. Orange County and the Inland Empire experienced the greatest decline iri rates. Rental rates in each market fell by at least $0.25 per square foot per month.
70

Source: Costar
Source: Costar
Source: Costar
For the Basin as a whole, net absorption was 1 .1 million square feet in the fourth quarter. The majority of this increase occurred in Los Angeles County where 838,266 square feet of retail space was absorbed. Ventura County experienced negative net absorption in the fourth quarter. Problems at the Simi Valley Town Center will likely continue to negatively impact Ventura's retail market.
Source: Costar
Source: Costar
Source: Costar
71

............
Source: Costar
· Source: CoStar
Per SF per rnorrr. ~JNN. Total is weighted by available space. Data is for 'lll Glass~ .. 8 and C buildings 20,000 SF or larger. Excludes owner-occupied.
Final Thoughts
201 0 was a challenging year for everyone involved in Los Angeles Basin commercial real estate markets. Vacancy rates rose a bit, while lease rates fell slightly. However, net absorption in the fourth quarter in all markets suggests that 2011 will be a better year. The economy is improving, not as rapidly as we would likl'); but it is improving. It will take time for the effects. of the recovery to be felt in real estate markets, but better days are OIJ the horizon.
72

4.2 Appeal from the City of Long Beach
73
Agenda Item 4.2
DATE: July 12, 2012
TO: Regional Housing Needs Assessment (RHNA) Appeals Board
FROM: Ma’Ayn Johnson, Senior Regional Planner, (213) 236-1975, [email protected] Frank Wen, Manager, Research and Analysis, (213) 236-1854, [email protected]
SUBJECT: Appeal from the City of Long Beach
EXECUTIVE DIRECTOR’S APPROVAL:
RECOMMENDED ACTION (Please Select One):
APPROVE PARTIALLY APPROVE DENY
SUMMARY OF APPEAL: The City of Long Beach requests a RHNA reduction based on several local planning factors and changed circumstances. The local planning factors cited for appeal include existing or projected jobs-housing balance, availability of land suitable for urban development or for conversion to residential use, distribution of household growth assumed for purposes of comparable Regional Transportation Plans, and market demand for housing. Because of these factors, the City of Long Beach requests a reduction of 627 units from its Draft Allocation of 7,048 units. STRATEGIC PLAN: This item supports SCAG’s Strategic Plan; Goal 1: Improve Regional Decision Making by Providing Leadership and Consensus Building on Key Plans and Policies; Objective a: Create and facilitate a collaborative and cooperative environment to produce forward thinking regional plans. RATIONALE FOR RECOMMENDED ACTION: Staff recommends that the RHNA Appeals Board deny the City of Long Beach’s appeal to reduce its Draft Allocation by 627 units. Per Government Code Section 65584.04 (d)(2)(B), the consideration of the availability of land suitable for urban development must include other types of land use opportunities other than vacant land. Per Government Code Section 65584.04(f), SCAG cannot consider current zoning or General Plans to justify a reduction in projected housing need. Additionally, the City’s jobs-housing balance condition is expected to improve through the RHNA projection period and although its share of subregional housing need is projected to slightly increase during the planning period, it is consistent with the increase in City’s share of subregional employment. Finally, there is no evidence provided by the City to indicate that its previous population growth trend constitutes a significant and unforeseen change of circumstances that would warrant a reduction to its assigned housing need.
74
Agenda Item 4.2
BACKGROUND: The following is a chronology of the events related to Long Beach’s Draft RHNA Allocation to date:
1. On July 29, 2009, an initial letter was sent from SCAG to Mr. Dennis J. Thys, Director of Community Development, City of Long Beach, indicating the Draft household forecast as follows:
2008 Households 166,364 2020 Households 178,502 (12,138 increment from 2008) 2035Households 191,865 (25,501 increment from 2008)
2. In response to SCAG’s July 2009 mail out, Mr. Ira Brown, Planner, City of Long Beach, provided
census tract level input on SCAG’s population growth figures for the City in hard copy format for years 2010 and 2030.
3. On January 27, 2010, Mr. Elif Karsi, SCAG Staff, requested additional information from Mr. Ira Brown, City Planner, City of Long Beach, via email. Specifically, SCAG requested an electronic copy of Long Beach’s prior input, and inquired if the City could provide input on household and employment data, in addition to their population data. Also, SCAG staff requested information from the City for years 2020 and 2035 for all variables. No further input was provided by the City.
4. After November 12, 2009 SCAG staff adjusted its household forecast for the City of Long Beach as
follows:
2008 Households 166,363 (a decrease of 1 household) 2020 Households 178,499 (12,136 increment from 2008, a decrease of 2 households) 2035Households 191,863 (25,500 increment from 2008, a decrease of 1 households)
5. On May 13, 2011, an email was sent from SCAG to Ms. Jill Griffiths, Advance Planning Officer,
City of Long Beach, and Ms. Patricia Garrow, Senior Planner of Development Services, City of Long Beach, indicating that the growth forecast numbers were adjusted based on recently released data from the decennial Census and the California Employment Development Department. The associated table that was sent included information for all local jurisdictions in the Gateway Cities COG and indicated that the City of Long Beach’s Draft household forecast was adjusted as follows:
2008 Households 163,455 2020 Households 175,556 (12,101 increment from 2008, a decrease of 2,943 households due to
Census adjustment) 2035 Households 188,920 (25,465 increment from 2008, a decrease of 2,943 households due to
Census adjustment)
In addition, SCAG also provided other household information:
2010 Census (4/1/2010) 163,531 2011 DOF (1/1/2011) 175,556 2021 RHNA Projection Period (1/1/2014 - 10/1/2021) 13,160
75

Agenda Item 4.2
6. On May 19, 2011, Ms. Jill Griffiths, Advance Planning Officer, City of Long Beach, provided comments on SCAG’s Draft RHNA Consultation Packet prior to its submission to the State Department of Housing and Community Development (HCD) and the State Department of Finance (DOF).
7. On May 19, 2011, Frank Wen, SCAG staff, followed up with Ms. Jill Griffith, Planning Officer, City of Long Beach, in regard to her input and its incorporation into RHNA Consultation Packet.
8. On June 17, 2011, SCAG’s AB 2158 Survey and Housing Unit Demolition Survey were sent to the
City of Long Beach for their input.
9. On July 25, 2011, Ms. Patricia Garrow, Senior Planner of Development Services, City of Long Beach, emailed Ma’Ayn Johnson, SCAG staff, with questions regarding the source data for some of the RHNA related information provided to local jurisdictions, and also informed SCAG that city staff would be attending the RHNA Subcommittee Meetings to stay informed of the process. On July 29, 2011, Javier Minjares, SCAG staff, responded to Ms. Garrow’s questions via email.
10. On August 8, 2011, City of Long Beach submitted the AB 2158 Survey and the Demolition Survey to SCAG.
11. On December 9, 2011, SCAG released the Draft RHNA Allocation Plan as part of the agenda for the
RHNA Subcommittee meeting. The Draft Plan was recommended by the RHNA Subcommittee for further approval by the Community, Economic & Human Development Committee (CEHD) and the Regional Council. The CEHD and the Regional Council reviewed and approved the Draft Allocation on February 2, 2012. The Draft RHNA Allocation for the City of Long Beach is 7,048.
12. On February 6, 2012, SCAG sent a letter to Mr. Patrick West, City Manager, City of Long Beach,
indicating the Draft RHNA Allocation for the City of Long Beach.
13. On March 15, 2012, SCAG received a RHNA revision request from Ms. Amy J. Bodek, Executive Director, Long Beach Redevelopment Agency, and Robert Zur Schmiede, Deputy Director, Long Beach Redevelopment Agency, based on existing or projected jobs-housing balance, availability of land suitable for urban development or for conversion to residential use, distribution of household growth assumed for purposes of comparable Regional Transportation plans, market demand for housing, and housing needs generation by the presence of a university campus within a jurisdiction. The City requested a reduction of 1,088 units from its Draft RHNA Allocation.
14. On April 19, 2012, the SCAG Appeals Board held a meeting to review the submitted revision
requests, including from the City of Long Beach. After the City of Long Beach presented its revision request to the Appeals Board, the Board discussed the merits of the request and the SCAG staff recommendation. After discussion, the Appeals Board voted to deny the City’s revision request for a reduction of 1,088 units.
15. On May 29, 2012, SCAG received a RHNA appeal from Ms. Amy J. Bodek, Director of Planning, City of Long Beach, based on several planning factors and changed circumstances. The City requested a reduction of 627 units from its Draft RHNA Allocation.
76

Agenda Item 4.2
Summary Table
ANALYSIS: The City of Long Beach submits and appeal and requests a RHNA reduction of 627 units based on several local planning factors and changed circumstances. Planning factors cited include existing or projected jobs-housing balance, availability of land suitable for urban development or for conversion to residential use, distribution of household growth assumed for purposes of comparable Regional Transportation Plans, and market demand for housing. Local Planning Factors (1) Existing and projected jobs and housing balance [Govt. Code Section 65584.04(d)(1)]
Issue: The City of Long Beach argues in its appeal that its historical jobs-housing balance has been housing rich and factors such as its high poverty rate and low homeownership rate, point to a need for less additional housing in the City in the future. SCAG Staff Response: An analysis of the City’s adjusted household and employment growth demonstrates that the City’s existing jobs-household relationship is appropriately maintained and the projection shows a moderate improvement through the 5th RHNA planning period. Adjusted Integrated Growth Forecast* 2011 2021
Employment (Jobs) 160,848 176,949 Households 163,540 176,700 *: The adjusted Integrated Growth Forecast is based on a jurisdiction’s local input, 2010 Census data, 2011 Economic Development Department data, and interpolation analysis. In 2011, the City’s job to household ratio was 0.98 while its projected ratio in 2021 increases to 1.00. In fact, in 2021, it is projected that the jurisdiction will have slightly higher number of jobs than households. For this reason, SCAG does not recommend a reduction in the City’s Draft RHNA Allocation based on this
planning factor.
City of Long Beach Source/Calculation Figure 2011 Households DOF 163,540 2020 Households Correspondence #4 175,556 2021 Households Interpolation 176,700 2011 to 2021 Projected Household Growth (10.75 years)
2021 Households – 2011 Households -or- = 176,700 – 163,540
13,160
2014 to 2021 Projected Household Growth (7.75 years)
(10.75 year growth/10.75 year period) x 7.75 year period -or- =(13,160/10.75) x 7.75
9,487
77
Agenda Item 4.2
With regard to the City’s higher poverty rate and lower homeownership rate in comparison to the statewide figure, one of the goals of the Regional Housing Needs Assessment is to increase the housing supply and mix of housing types, tenure, and affordability in all jurisdictions in an equitable manner. To prevent disproportionate Allocation of certain income groups where they already exist, the adopted RHNA Allocation Methodology applied a 110% social equity adjustment to the 2010 Census income categories in comparison to the county distribution. The social equity adjustment ensures that jurisdictions with a high concentration of income groups, such as low income, will receive a RHNA Allocation closer to the county distribution. (2) Availability of lands suitable for urban development or for conversion to residential use [Govt. Code
Section 65584.04(d)(2)(B)]
Issue: The City’s appeal states that the City is built out and that there are no vacant single-family lots. According to the City, all available parcels for residential development are multiple-family or mixed-use and no additional sites are available beyond those identified in the adopted 4th cycle (2008 –2014) housing element. Furthermore, the City contends that it receives 55% of the Gateway Cities subregional household growth while only receiving 32% of subregional employment growth over the projection period. SCAG Staff Response: Per Government Code Section 65584.04(d)(2)(B), SCAG is not permitted to limit its consideration of suitable housing sites or land suitable for urban development to a jurisdiction’s existing zoning and land use policies and restrictions. State law requires that the consideration of the availability of land suitable for urban development must include other types of land use opportunities other than vacant land. The City can consider other opportunities for development. This includes the availability of underutilized land, opportunities for infill development and increased residential densities, or alternative zoning and density. Alternative development opportunities should be explored further and could possibly provide the land needed to zone for the City’s projected growth. SCAG is prohibited from considering the reductions made to the City of Long Beach General Plan as a justification for a reduction to its Draft RHNA Allocation. Additionally, it should be noted that between 2011 and 2021, the City of Long Beach is expected to increase the number of households by 8% while the average subregional household growth rate is anticipated at a 5% rate. However, this growth is consistent with the City’s expected employment growth of 10%, also higher than the subregional rate of 7%. Thus, SCAG staff does not conclude that the City is receiving a household growth that is out of proportion with its subregion. For these reasons, SCAG staff does not recommend a housing need reduction based upon this planning factor. (3) Distribution of household growth assumed for purposes of comparable Regional Transportation
Plans [Govt. Code Section 65584.04(d)(3)]
Issue: In its appeal, the City of Long Beach argues that its light rail service “is not a potential catalyst for new development not already assumed in the City’s zoning and development standards” and the City does not have any major expansion plans for the foreseeable future. SCAG Staff Response: Similar to the aforementioned requirement that a jurisdiction must consider a variety of land use opportunities, such as infill development, to determine suitable land, per Government Code Section 65584.04(f), SCAG cannot consider a jurisdiction’s General Plan designations or development
standards as a justification to reduce its share of regional housing need.
78

Agenda Item 4.2
Moreover, current transportation focused development, or lack thereof, does not preclude addressing future household need, and additional transportation opportunities may possibly occur. For these reasons, SCAG staff does not recommend a housing need reduction based upon this planning factor. (4) Market demand for housing [Govt. Code Section 65584.04(d)(4)]
Issue: The City also contends that it is a built-out city and that no additional sites beyond parcels for multiple-family or mixed-use are available. Additionally when combining unmet housing Allocation from its 4th cycle with the proposed 5th RHNA Allocation, the City cannot generate new residential development during the 5th cycle planning period. SCAG Staff Response: Consistent with SCAG’s prior response and state housing law, a jurisdiction must consider a variety of land use opportunities, such as infill development, to determine suitable land. Additionally, SCAG cannot consider a jurisdiction’s General Plan designations or development standards as a justification to reduce its share of regional housing need. For these reasons, SCAG staff does not recommend a housing need reduction based upon this planning factor. In addition, it appears that the City of Long Beach may misinterpret that the 3rd, 4th and 5th RHNA cycle Allocation requirements will be combined in its next HCD site inventory review. Unused land use capacity from prior RHNA cycles may be re-used to address 5th cycle RHNA site inventory requirements as long as a jurisdiction such as the City of Long Beach has an HCD approved housing element. Only jurisdictions with uncertified housing elements are required to carry over and combine the deficit in their last RHNA cycle (4th cycle) site inventory with their 5th cycle RHNA Allocation’s site inventory responsibility. Gaps between the RHNA Allocation, i.e., the number of housing units to be zoned, and the number of housing units actually built are never carried over whether a jurisdiction has a certified or uncertified housing element. In short, the RHNA Allocation is not a building quota. Changed Circumstances [Govt. Code Section 65584.05(d)(1)] Issue: In its appeal, the City argues that a lack of population growth between 2000 and 2010 indicates that previously estimated housing needs for Long Beach will not be borne out. SCAG Staff Response: To develop population and household growth projections that were used as a basis for the 5th cycle RHNA Allocation, SCAG integrated 2010 Census data. Government Code Section 65584.05(d)(1) allows for jurisdictions to appeal the Draft RHNA Allocation based on a “significant and unforeseen change in circumstances [that] has occurred in the local jurisdiction.” As mentioned in the background section of this report, the projected household growth adjusted with 2010 Census data was provided to the City on May 13, 2011 and does not constitute an unforeseen change in circumstances. Thus, SCAG staff does not recommend a reduction in the City’s Draft RHNA Allocation based on this factor.
79

Agenda Item 4.2
FISCAL IMPACT: Work associated with this item is included in the current FY 12-13 General Fund Budget (13-800.0160.03: RHNA). ATTACHMENTS:
1. Appeal Application from the City of Long Beach 2. Supporting Documentation Provided by the City to Support Its Appeal
80
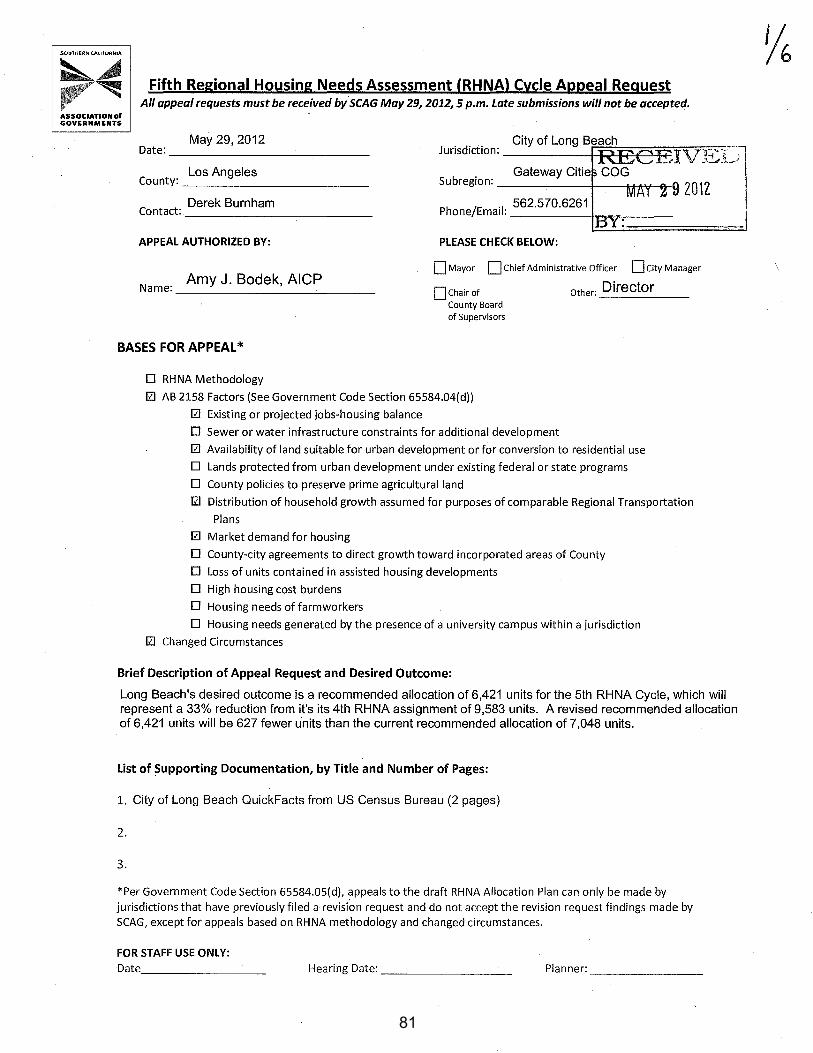
SOUTHERN CALifORNIA
A550CIATION of GOVERNMENTS
Fifth Regional Housing Needs Assessment (RHNA) Cycle Appeal Request All appeal requests must be received by SCAG May 29, 2012, 5 p.m. Late submissions will not be accepted.
May 29,2012 Date: __________________________ __
Los Angeles County: ________________________ __
Derek Burnham Contact: -------------------------
APPEAL AUTHORIZED BY:
Name: _A_m_y_J_._B_o_d_e_k_, _A_IC_P __ _
PLEASE CHECK BELOW:
D Mayor 0 Chief Administrative Officer D City Manager
ochairof County Board of Supervisors
Other: Director
BASES FOR APPEAL*
0 RHNA Methodology
IZI AB 2158 Factors (See Government Code Section 65584.04(d))
IZI Existing or projected jobs-housing balance
D Sewer or water infrastructure constraints for additional development
IZI Availability of land suitable for urban development or for conversion to residential use
D Lands protected from urban development under existing federal or state programs
D County policies to preserve prime agricultural land
IZI Distribution of household growth assumed for purposes of comparable Regional Transportation
Plans
IZI Market demand for housing
D County-city agreements to direct growth toward incorporated areas of County
D Loss of units contained in assisted housing developments
D High housing cost burdens
D Housing needs of farm workers
D Housing needs generated by the presence of a university campus within a jurisdiction
IZI Changed Circumstances
Brief Description of Appeal Request and Desired Outcome:
Long Beach's desired outcome is a recommended allocation of 6,421 units for the 5th RHNA Cycle, which will represent a 33% reduction from it's its 4th RHNA assignment of 9,583 units. A revised recommended allocation of 6,421 units will be 627 fewer units than the current recommended allocation of 7,048 units.
List of Supporting Documentation, by Title and Number of Pages:
1. City of Long Beach OuickFacts from US Census Bureau (2 pages)
2.
3.
*Per Government Code Section 65584.05(d), appeals to the draft RHNA Allocation Plan can only be made by jurisdictions that have previously filed a revision request and do not accept the revision request findings made by SCAG, except for appeals based on RHNA methodology and changed circumstances.
FOR STAFF USE ONLY: Date ____________ _ Hearing Date: ________ _ Planner: ________ __
81
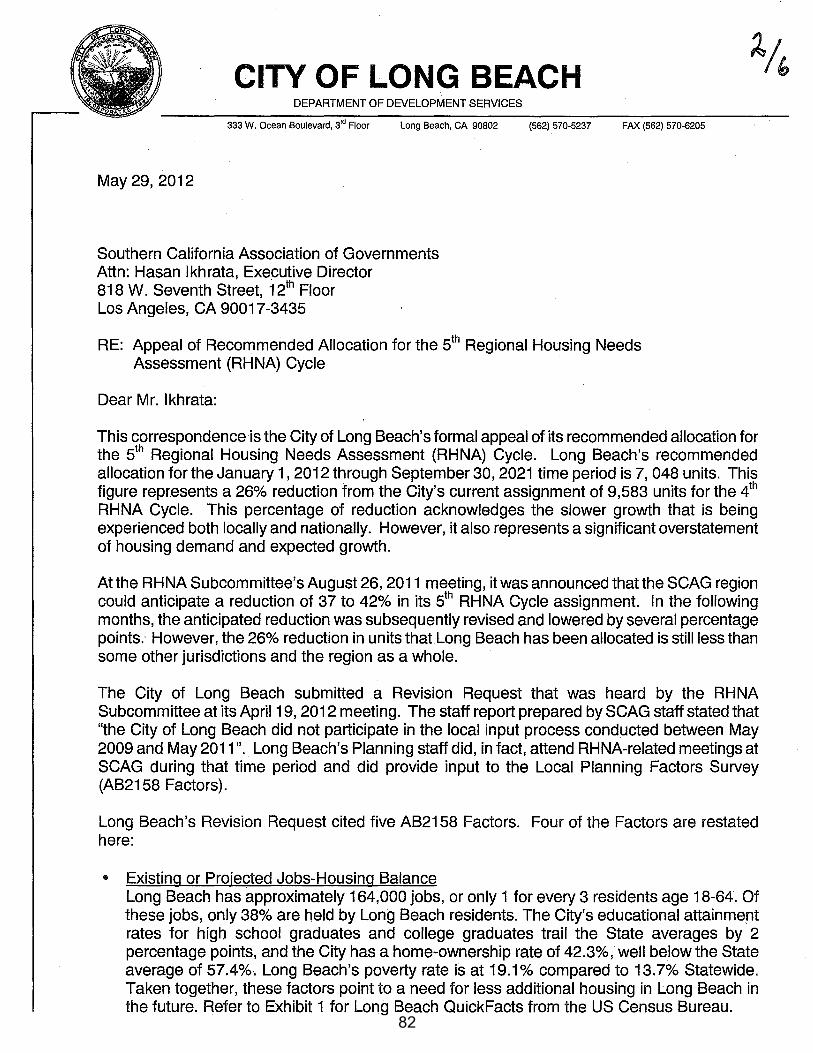
CITY OF LONG BEACH DEPARTMENT OF DEVELOPMENT SERVICES
333 W. Ocean Boulevard, 3'd Floor Long Beach, CA 90802
May 29,2012
Southern California Association of Governments Attn: Hasan lkhrata, Executive Director 818 W. Seventh Street, 12th Floor Los Angeles, CA 90017-3435
(562) 570-5237 FAX (562) 570-6205
RE: Appeal of Recommended Allocation for the 5th Regional Housing Needs Assessment (RHNA) Cycle
Dear Mr. lkhrata:
This correspondence is the City of Long Beach's formal appeal of its recommended allocation for the 5th Regional Housing Needs Assessment (RHNA) Cycle. Long Beach's recommended allocation for the January 1, 2012 through September 30, 2021 time period is 7, 048 units. This figure represents a 26% reduction from the City's current assignment of 9,583 units for the 4th RHNA Cycle. This percentage of reduction acknowledges the slower growth that is being experienced both locally and nationally. However, it also represents a significant overstatement of housing demand and expected growth.
At the RHNA Subcommittee's August 26, 2011 meeting, it was announced that the SCAG region could anticipate a reduction of 37 to 42% in its 5th RHNA Cycle assignment. In the following months, the anticipated reduction was subsequently revised and lowered by several percentage points.- However, the 26% reduction in units that Long Beach has been allocated is still less than some other jurisdictions and the region as a whole.
The City of Long Beach submitted a Revision Request that was heard by the RHNA Subcommittee at its April19, 2012 meeting. The staff report prepared by SCAG staff stated that "the City of Long Beach did not participate in the local input process conducted between May 2009 and May 2011 ". Long Beach's Planning staff did, in fact, attend RHNA-related meetings at SCAG during that time period and did provide input to the Local Planning Factors Survey (AB2158 Factors).
Long Beach's Revision Request cited five AB2158 Factors. Four of the Factors are restated here:
• Existing or Projected Jobs-Housing Balance . .
Long Beach has approximately 164,000 jobs, or only 1 for every 3 residents age 18-64. Of these jobs, only 38% are held by Long Beach residents. The City's educational attainment rates for high school graduates and college graduates trail the State averages by 2 percentage points, and the City has a home-ownership rate of 42.3%, well below the State average of 57.4%. Long Beach's poverty rate is at 19.1% compared to 13.7% Statewide. Taken together, these factors point to a need for less additional housing in Long Beach in the future. Refer to Exhibit 1 for Long Beach QuickFacts from the US Census Bureau.
82

Mr. Hasan lkhrata May 29,2012 Page 2
• Availability of Land Suitable for Urban Development or for Conversion to Residential Use The City of Long Beach has been a regional leader in preparing for future growth. The City's adopted 2008-2014 Housing Element, which was certified by HCD in June 2009, ensures that there is availability for residential sites at adequate densities and appropriate development standards to accommodate the allocated units. In the 2011 Housing Element annual report presented to the City's Planning Commission on March 1 , 2012, a total of 1,112 units of all types had been developed, representing 11.6% of the City's current 9,583 unit RHNA allocation.
Since the adoption of the 2008-2014 Housing Element, the City has also adopted the Downtown Plan, which encourages "development of vibrant urban neighborhoods". This Plan went into effect in February 2012. The City is in the process of developing a similar plan for a portion of Long Beach Boulevard in conjunction with SCAG's Compass Blueprint project. Additionally, the City is seeking fundi!lg to update its Southeast Area Development and Improvement Plan (SEADIP). All of these efforts show a commitment to sensible and sustainable growth, all in the context of SB375, to provide new housing opportunities where new development will generate the least amount of Greenhouse Gases (GHG) possible.
It is unreasonable to expect the City to take any more than its fair share of RHNA allocations. The RHNA allocation is based on projections that Long Beach will accommodate 43% of the population growth and 55% of the housing growth, and only 32% of the employment growth within the Gateway Cities COG, when the City is already housing rich. A proportional allocation of 33% reduction, similar to the subregional (Gateway Cities COG) adjustment for the 5th RHNA Cycle is more than appropriate. Long Beach should not be required to produce any more than its fair share of the subregional RHNA allocation.
No additional sites are available for housing development beyond those that were identified in the adopted 2008-2014 Housing Element. Given the flat population growth of the City between 2000 and 2010, and the limited availability of sites within the City boundary, it is unreasonable to expect growth of this magnitude.
• Distribution of Household Growth Assumed for Purposes of comparable Regional Transportation Plans The RTP assumes that 9,487, or 55% of the household growth rate of the Gateway Cities will occur in Long Beach. No other City in the subregion is assumed to accommodate more than 7%. Therefore, the RHNA allocation is not consistent with the RTP/SCS estimates (Step 2 of the 5th Cycle RHNA Allocation Methodology, November 2011 ), and clearly puts an undue burden on the City of Long Beach to accommodate such a high percentage of housing growth for the subregion.
There is no justification for an over-allocation of housing needs to one of the jurisdictions within the subregion. Long Beach, while larger than other cities in the subregion, is largely built out, and has a mature transit service and roadway network. The Metro Blueline has been in operation for more than 20 years and is not a potential catalyst for new development not already assumed in the City's zoning and development standards. Likewise, Long Beach Transit serves the City well, but has no major expansion plans for the foreseeable future. No major expansion of the roadway network, including new roads or expansion of
83

Mr. Hasan lkhrata May 29, 2012 Page3
existing rights-of-way, is expected in the next decade. Therefore, Long Beach should have, at most, a fair share allotment of RHNA.
• Market Demand for Housing Long Beach has a higher percentage of multiple family dwelling units, 50.6% vs. 30.7% Statewide, and expects to accommodate the majority of any additional housing in multiple family buildings. As a built-out city, there are virtually no vacant single-family lots in Long Beach for future single-family development. All available parcels for residential development are either multiple-family or mixed use, as was stated in the adopted 2008-2014 Housing Element. No additional sites have been developed, or are available. The City has not allowed non-residential development to subsume any of these sites, and has continued to ease regulations to encourage new development, such as the parking requirement reduction in the recently adopted Downtown Plan. Even with these provisions, the unmet housing allocation from the 4th RHNA Cycle, when combined with the proposed 5th Cycle RHNA allocation, far exceeds the City's ability to generate new residential development during the combined period from 2008 to 2021.
Changed Circumstances During the 2000-201 0 US Census period, the population of Long Beach grew by a total of only 0.2%. U.S. Census Bureau facts for Long Beach are attached for reference. Given this lack of growth, the previously estimated housing needs for Long Beach will not be borne out.
As recently as last month, SCAG staff expressed to a member of our Planning staff that Long Beach is "a model jurisdiction in the region for affordable housing". The CitX does have a reputation for doing its "fair share" in the area of affordable housing. For the 5t RHNA Cycle, Long Beach is requesting that its recommended allocation be reduced from 7,048 units to 6,421 uriits. This would be 627 fewer units than the 7,048 unit allocation and would represent 33% less than the City's 4th RHNA Cycle assignment. Thank you for your consideration.
Sincerely,
DA /25:C_"_ DEREK BURNHAM PLANNING ADMINISTRATOR
Attached: City of Long Beach QuickFacts from US Census Bureau (2 pages)
cc: Ma'Ayn Johnson, SCAG
84
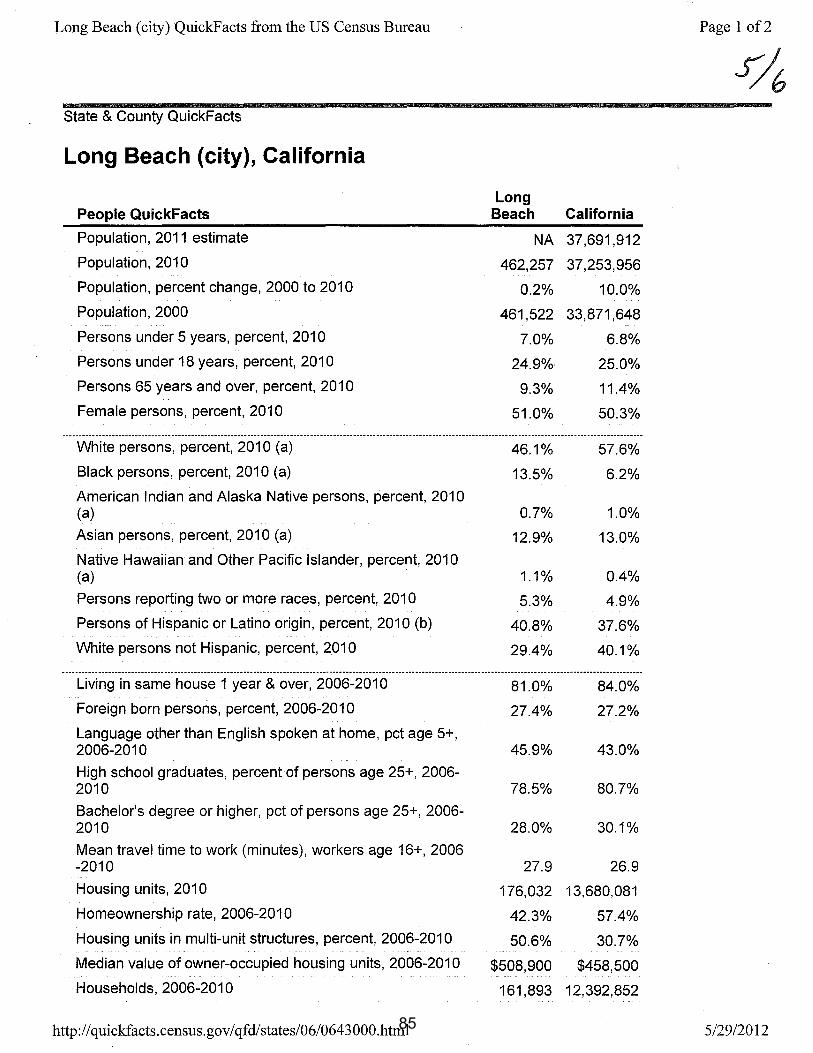
Long Beach (city) QuickFacts from the US Census Bureau
State & County QuickFacts
Long Beach (city), California
People QuickFacts
Population, 2011 estimate
Population, 2010
Population, percent change, 2000 to 2010
Population, 2000
Persons under 5 years, percent, 2010
Persons under 18 years, percent, 2010
Persons 65 years and over, percent, 2010
Female persons, percent, 2010
White persons, percent, 2010 (a)
Black persons, percent, 2010 (a)
American Indian and Alaska Native persons, percent, 2010 (a)
Asian persons, percent, 2010 (a)
Native Hawaiian and Other Pacific Islander, percent, 2010 (a)
Persons reporting two or more races, percent, 2010
Persons of Hispanic or Latino origin, percent, 2010 (b)
White persons not Hispanic, percent, 2010
Living in same house 1 year & over, 2006-2010
Foreign born persons, percent, 2006-2010
Language other than English spoken at home, pet age 5+, 2006-2010
High school graduates, percent of persons age 25+, 2006-2010
Bachelor's degree or higher, pet of persons age 25+, 2006-2010
Mean travel time to work (minutes), workers age 16+, 2006 -2010
Housing units, 2010
Homeownership rate, 2006-2010
Housing units in multi-unit structures, percent, 2006-2010
Median value of owner-occupied housing units, 2006-2010
Households, 2006-2010
http:// quickfacts.census.gov I qfdl states/06/064 3 000 .html
Long Beach
NA
462,257
0.2%
461,522
7.0%
24.9%
9.3%
51.0%
46.1%
13.5%
0.7%
12.9%
1.1%
5.3%
40.8%
29.4%
81.0%
27.4%
45.9%
78.5%
28.0%
27.9
176,032
42.3%
50.6%
$508,900
161,893
Page 1 of2
California
37,691,912
37,253,956
10.0%
33,871,648
6.8%
25.0%
11.4%
50.3%
57.6%
6.2%
1.0%
13.0%
0.4%
4.9%
37.6%
40.1%
84.0%
27.2%
43.0%
80.7%
30.1%
26.9
13,680,081
57.4%
30.7%
$458,500
12,392,852
5/29/2012 85
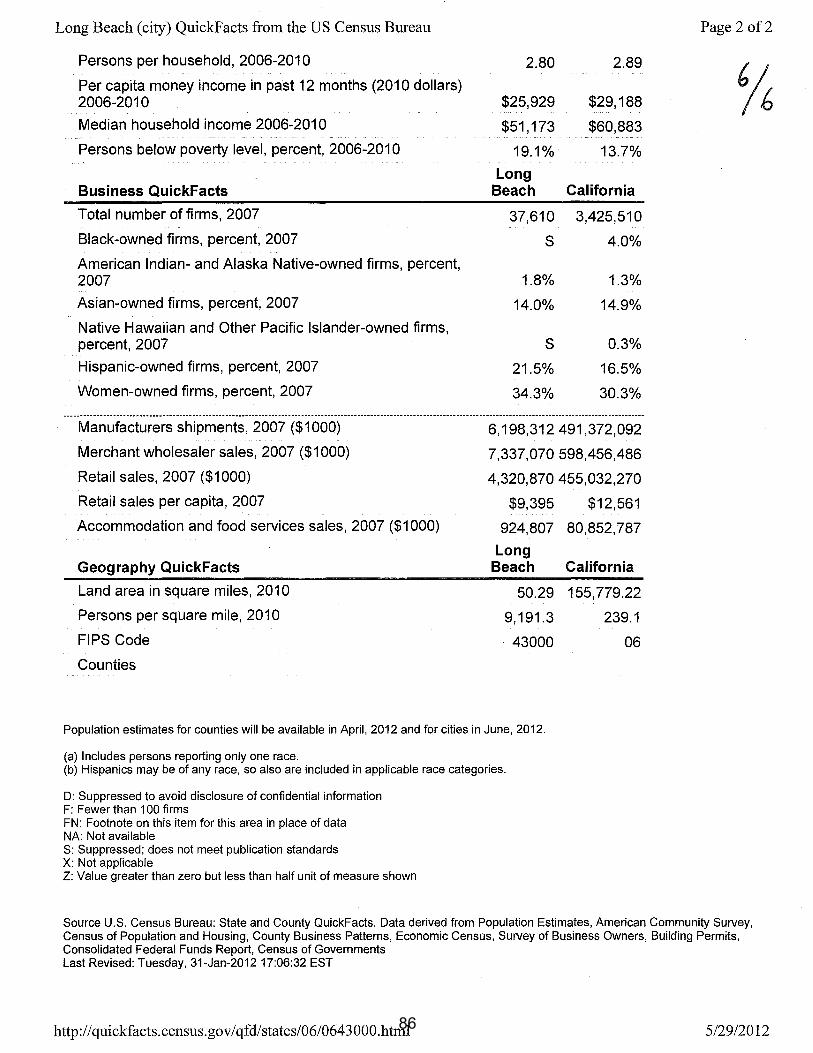
Long Beach (city) QuickFacts from the US Census Bureau
Persons per household, 2006-2010
Per capita money income in past 12 months (2010 dollars) 2006-2010
Median household income 2006-2010
Persons below poverty level, percent, 2006-2010
Business QuickFacts
Total number of firms, 2007
Black-owned firms, percent, 2007
American Indian- and Alaska Native-owned firms, percent, 2007
Asian-owned firms, percent, 2007
Native Hawaiian and Other Pacific Islander-owned firms, percent, 2007
Hispanic-owned firms, percent, 2007
Women-owned firms, percent, 2007
Manufacturers shipments, 2007 ($1 000)
Merchant wholesaler sales, 2007 ($1 000)
Retail sales, 2007 ($1000)
Retail sales per capita, 2007
Accommodation and food services sales, 2007 ($1 000)
Geography QuickFacts
Land area in square miles, 2010
Persons per square mile, 2010
FIPS Code
Counties
2.80 2.89
$25,929 $29,188
$51,173 $60,883
19.1% 13.7%
Long Beach California
37,610 3,425,510
s 4.0%
1.8% 1.3%
14.0% 14.9%
s 0.3%
21.5% 16.5%
34.3% 30.3%
6,198,312 491,372,092
7,337,070 598,456,486
4,320,870 455,032,270
$9,395 $12,561
924,807 80,852,787
Long Beach California
50.29 155,779.22
9,191.3
43000
239.1
06
Population estimates for counties will be available in April, 2012 and for cities in June, 2012.
(a) Includes persons reporting only one race. (b) Hispanics may be of any race, so also are included in applicable race categories.
D: Suppressed to avoid disclosure of confidential information F: Fewer than 100 firms FN: Footnote on this item for this area in place of data NA: Not available S: Suppressed; does not meet publication standards X: Not applicable Z: Value greater than zero but less than half unit of measure shown
Page 2 of2
~
Source U.S. Census Bureau: State and County QuickFacts. Data derived from Population Estimates, American Community Survey, Census of Population and Housing, County Business Patterns, Economic Census, Survey of Business Owners, Building Permits, Consolidated Federal Funds Report, Census of Governments Last Revised: Tuesday, 31-Jan-2012 17:06:32 EST
http:/ I quickfacts. census.gov I qfd/ states/06/064 3 000 .html 5/29/2012 86

4.3 Appeal from the City of Norwalk
87

Agenda Item 4.3
DATE: July 12, 2012
TO: Regional Housing Needs Assessment (RHNA) Appeals Board
FROM: Ma’Ayn Johnson, Senior Regional Planner, (213) 236-1975, [email protected] Frank Wen, Manager, Research and Analysis, (213) 236-1854, [email protected]
SUBJECT: Appeal from the City of Norwalk
EXECUTIVE DIRECTOR’S APPROVAL:
RECOMMENDED ACTION (Please Select One):
APPROVE PARTIALLY APPROVE DENY
SUMMARY OF APPEAL: The City of Norwalk requests a RHNA reduction based on changed circumstances. Because of these factors, the City of Norwalk requests a reduction of 101 units from its Draft Allocation of 201 units. STRATEGIC PLAN: This item supports SCAG’s Strategic Plan; Goal 1: Improve Regional Decision Making by Providing Leadership and Consensus Building on Key Plans and Policies; Objective a: Create and facilitate a collaborative and cooperative environment to produce forward thinking regional plans. RATIONALE FOR RECOMMENDED ACTION: Staff recommends that the RHNA Appeals Board deny the City of Norwalk’s appeal to reduce its Draft Allocation by 101 units. A lack of local, state or federal funding to provide affordable housing, in this case resulting from the dissolution of the City’s Redevelopment Agency, does not preclude a jurisdiction from planning to ensure that there are adequate sites and zoning available to accommodate its share of the projected regional housing need. In addition, Government Code Section 65583(b)(2) recognizes that the total housing needs identified may exceed available resources and the community's ability to satisfy housing need.
88
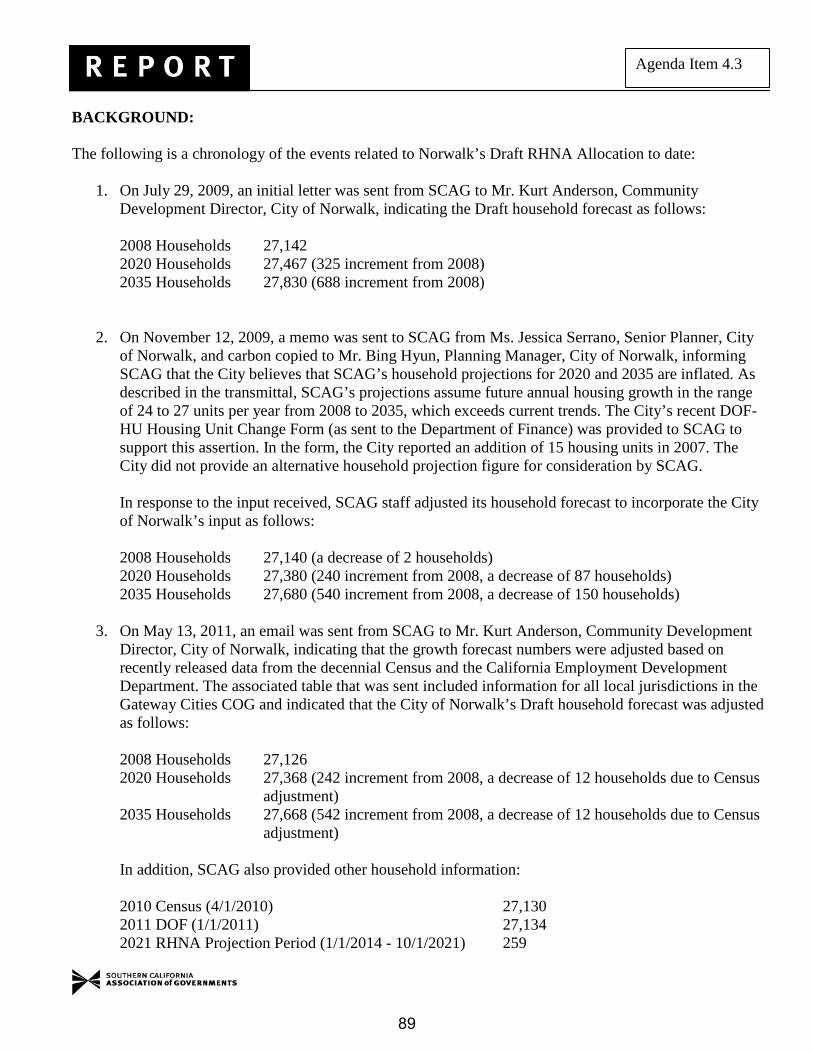
Agenda Item 4.3
BACKGROUND: The following is a chronology of the events related to Norwalk’s Draft RHNA Allocation to date:
1. On July 29, 2009, an initial letter was sent from SCAG to Mr. Kurt Anderson, Community Development Director, City of Norwalk, indicating the Draft household forecast as follows:
2008 Households 27,142 2020 Households 27,467 (325 increment from 2008) 2035 Households 27,830 (688 increment from 2008)
2. On November 12, 2009, a memo was sent to SCAG from Ms. Jessica Serrano, Senior Planner, City of Norwalk, and carbon copied to Mr. Bing Hyun, Planning Manager, City of Norwalk, informing SCAG that the City believes that SCAG’s household projections for 2020 and 2035 are inflated. As described in the transmittal, SCAG’s projections assume future annual housing growth in the range of 24 to 27 units per year from 2008 to 2035, which exceeds current trends. The City’s recent DOF-HU Housing Unit Change Form (as sent to the Department of Finance) was provided to SCAG to support this assertion. In the form, the City reported an addition of 15 housing units in 2007. The City did not provide an alternative household projection figure for consideration by SCAG.
In response to the input received, SCAG staff adjusted its household forecast to incorporate the City of Norwalk’s input as follows:
2008 Households 27,140 (a decrease of 2 households) 2020 Households 27,380 (240 increment from 2008, a decrease of 87 households) 2035 Households 27,680 (540 increment from 2008, a decrease of 150 households)
3. On May 13, 2011, an email was sent from SCAG to Mr. Kurt Anderson, Community Development
Director, City of Norwalk, indicating that the growth forecast numbers were adjusted based on recently released data from the decennial Census and the California Employment Development Department. The associated table that was sent included information for all local jurisdictions in the Gateway Cities COG and indicated that the City of Norwalk’s Draft household forecast was adjusted as follows:
2008 Households 27,126 2020 Households 27,368 (242 increment from 2008, a decrease of 12 households due to Census
adjustment) 2035 Households 27,668 (542 increment from 2008, a decrease of 12 households due to Census
adjustment)
In addition, SCAG also provided other household information:
2010 Census (4/1/2010) 27,130 2011 DOF (1/1/2011) 27,134 2021 RHNA Projection Period (1/1/2014 - 10/1/2021) 259
89

Agenda Item 4.3
4. On June 17, 2011, SCAG’s AB 2158 Survey and Housing Unit Demolition Survey were sent to the City of Norwalk for their input. The City did not return the surveys to SCAG.
5. On December 9, 2011, SCAG released the Draft RHNA Allocation Plan as part of the agenda for the RHNA Subcommittee meeting. The Draft Plan was recommended by the RHNA Subcommittee for further approval by the Community, Economic & Human Development Committee (CEHD) and the Regional Council. The CEHD and the Regional Council reviewed and approved the Draft Allocation on February 2, 2012. The Draft RHNA Allocation for the City of Norwalk is 201.
6. On February 6, 2012, SCAG sent a letter to Mr. Michael J. Egan, City Manager, City of Norwalk,
indicating the Draft RHNA Allocation for the City of Norwalk.
7. On April 18, 2012, Ms. Jessica Serrano, Senior Planner, City of Norwalk, initiated a phone call with Ma’Ayn Johnson, SCAG staff. Ms. Serrano asked Ma’Ayn Johnson about the basis for appeals since the City missed the revision request deadline. Ma’Ayn Johnson provided information on the basis for appeals and that the application would be posted online the week of April 23, 2012.
8. On May 25, 2012, SCAG received a RHNA appeal from Mr. Michael J. Egan, City Manager, City of Norwalk, based on changed circumstances. The City requested a reduction of 101 units from its Draft RHNA Allocation. Summary Table
ANALYSIS: The City of Norwalk submits an appeal and requests a RHNA reduction of 101 units based upon changed circumstances. Changed Circumstances [Govt. Code Section 65584.05(d)(1)] Issue: The City indicates that it was forced to dissolve its Redevelopment Agency as of February 1, 2012 and has experienced significant reductions in CDBG [Community Development Block Grant] and HOME [Home Investment Partnership Program] funds. As a result, the City argues that it does not have viable
means to execute planned projects to provide affordable housing.
City of Norwalk Source/Calculation Figure 2011 Households DOF 27,134 2020 Households Correspondence #4 27,368 2021 Households Interpolation 27,393 2011 to 2021 Projected Household Growth (10.75 years)
2021 Households – 2011 Households -or- = 27,393 – 27,134
259
2014 to 2021 Projected Household Growth (7.75 years)
(10.75 year growth/10.75 year period) x 7.75 year period -or- =(259/10.75) x 7.75
187
90

Agenda Item 4.3
SCAG Staff Response: The Regional Housing Needs Assessment is a determination of future housing need rather than a building quota. A lack of funding for building housing, particularly for affordable units, does not preclude jurisdictions from planning to ensure that there are adequate sites and zoning available to accommodate the projected need. Thus, SCAG staff cannot consider the lack of funding to build affordable housing as a justification to reduce the City’s projected housing need. Moreover, state law recognizes that the total housing needs may exceed available resources and the community’s ability to satisfy this need, and allows a jurisdiction to address this matter during the housing element process. FISCAL IMPACT: Work associated with this item is included in the current FY 12-13 General Fund Budget (13-800.0160.03: RHNA). ATTACHMENTS:
1. Appeal Application from the City of Norwalk 2. Supporting Documentation Provided by the City to Support Its Appeal
91
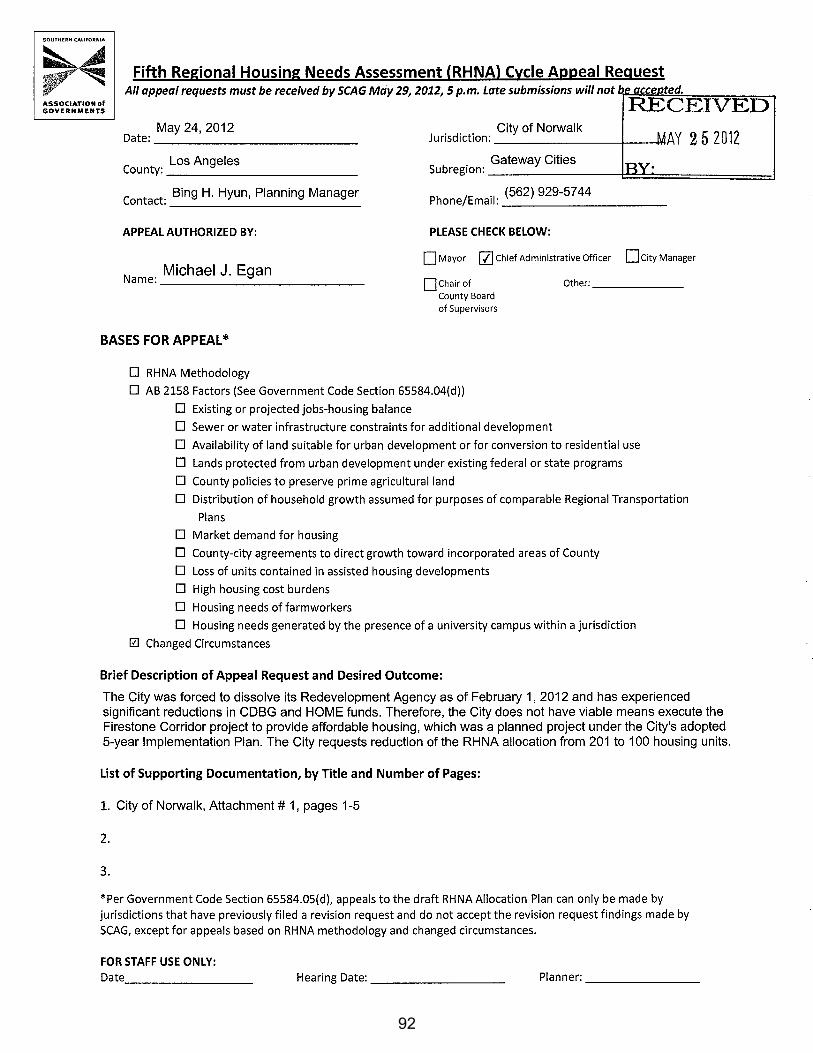
May 24,2012 Date:-------------
c Los Angeles oun~: ____________ _
C Bing H. Hyun, Planning Manager
ontact: -------------
APPEAL AUTHORIZED BY:
N Michael J. Egan arne: ____________ _
Gateway Cities Subregion: ---------f:~~=======:d
h /E .1
(562) 929-5744 P one ma1: -----------
PLEASE CHECK BELOW:
D Mayor [{]Chief Administrative Officer D City Manager
ochair of County Board of Supervisors
Other: _____ _
BASES FOR APPEAL*
0 RHNA Methodology
0 AB 2158 Factors (See Government Code Section 65584.04(d))
0 Existing or projected jobs-housing balance
0 Sewer or water infrastructure constraints for additional development
0 Availability of land suitable for urban development or for conversion to residential use
0 Lands protected from urban development under existing federal or state programs
0 Coun~ policies to preserve prime agricultural land
0 Distribution of household growth assumed for purposes of comparable Regional Transportation
Plans
0 Market demand for housing
0 County-city agreements to direct growth toward incorporated areas of Coun~
0 Loss of units contained in assisted housing developments
0 High housing cost burdens
0 Housing needs of farmworkers
0 Housing needs generated by the presence of a universi~ campus within a jurisdiction
0 Changed Circumstances
Brief Description of Appeal Request and Desired Outcome:
The City was forced to dissolve its Redevelopment Agency as of February 1, 2012 and has experienced significant reductions in CDBG and HOME funds. Therefore, the City does not have viable means execute the Firestone Corridor project to provide affordable housing, which was a planned project under the City's adopted 5-year Implementation Plan. The City requests reduction of the RHNA allocation from 201 to 100 housing units.
List of Supporting Documentation, by Title and Number of Pages:
1. City of Norwalk, Attachment # 1, pages 1-5
2.
3.
*Per Government Code Section 65584.05(d), appeals to the draft RHNA Allocation Plan can only be made by jurisdictions that have previously filed a revision request and do not accept the revision request findings made by SCAG, except for appeals based on RHNA methodology and changed circumstances.
FOR STAFF USE ONLY: Date _______ _ Hearing Date:--------- Planner: _______ _
92
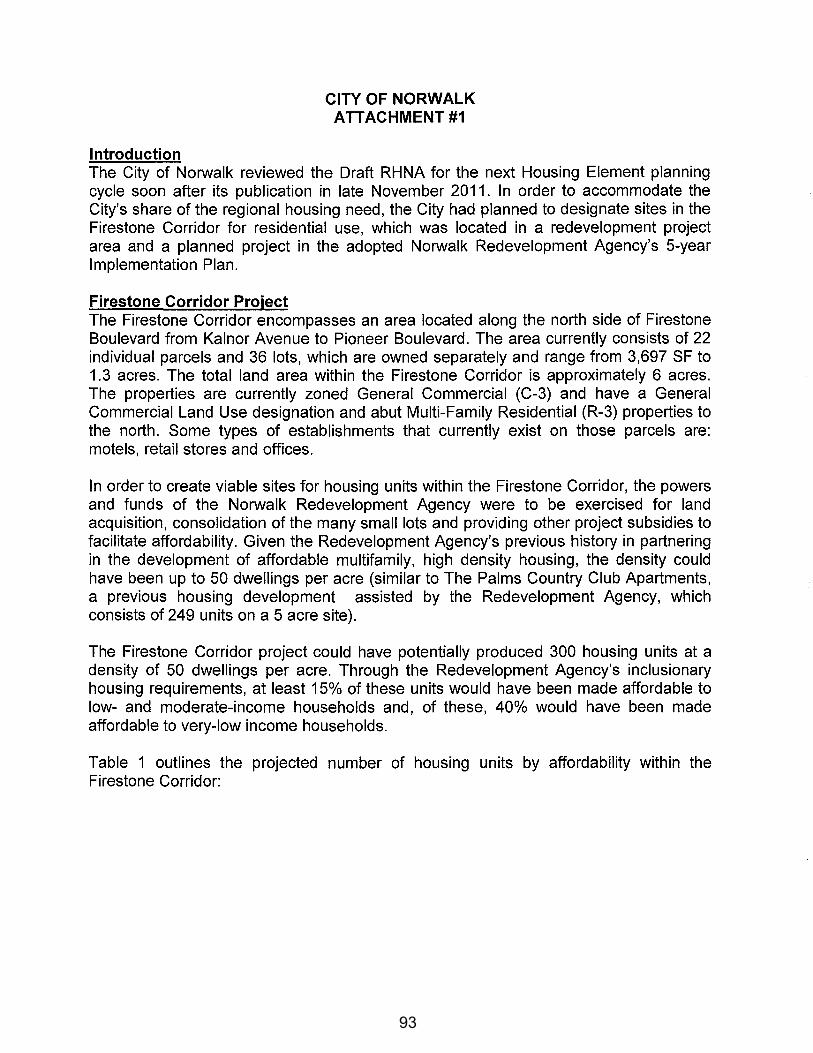
Introduction
CITY OF NORWALK ATTACHMENT #1
The City of Norwalk reviewed the Draft RHNA for the next Housing Element planning cycle soon after its publication in late November 2011. In order to accommodate the City's share of the regional housing need, the City had planned to designate sites in the Firestone Corridor for residential use, which was located in a redevelopment project area and a planned project in the adopted Norwalk Redevelopment Agency's 5-year Implementation Plan.
Firestone Corridor Project The Firestone Corridor encompasses an area located along the north side of Firestone Boulevard from Kalnor Avenue to Pioneer Boulevard. The area currently consists of 22 individual parcels and 36 lots, which are owned separately and range from 3,697 SF to 1.3 acres. The total land area within the Firestone Corridor is approximately 6 acres. The properties are currently zoned General Commercial (C-3) and have a General Commercial Land Use designation and abut Multi-Family Residential (R-3) properties to the north. Some types of establishments that currently exist on those parcels are: motels, retail stores and offices.
In order to create viable sites for housing units within the Firestone Corridor, the powers and funds of the Norwalk Redevelopment Agency were to be exercised for land acquisition, consolidation of the many small lots and providing other project subsidies to facilitate affordability. Given the Redevelopment Agency's previous history in partnering in the development of affordable multifamily, high density housing, the density could have been up to 50 dwellings per acre (similar to The Palms Country Club Apartments, a previous housing development assisted by the Redevelopment Agency, which consists of 249 units on a 5 acre site).
The Firestone Corridor project could have potentially produced 300 housing units at a density of 50 dwellings per acre. Through the Redevelopment Agency's inclusionary housing requirements, at least 15% of these units would have been made affordable to low- and moderate-income households and, of these, 40% would have been made affordable to very-low income households.
Table 1 outlines the projected number of housing units by affordability within the Firestone Corridor:
93
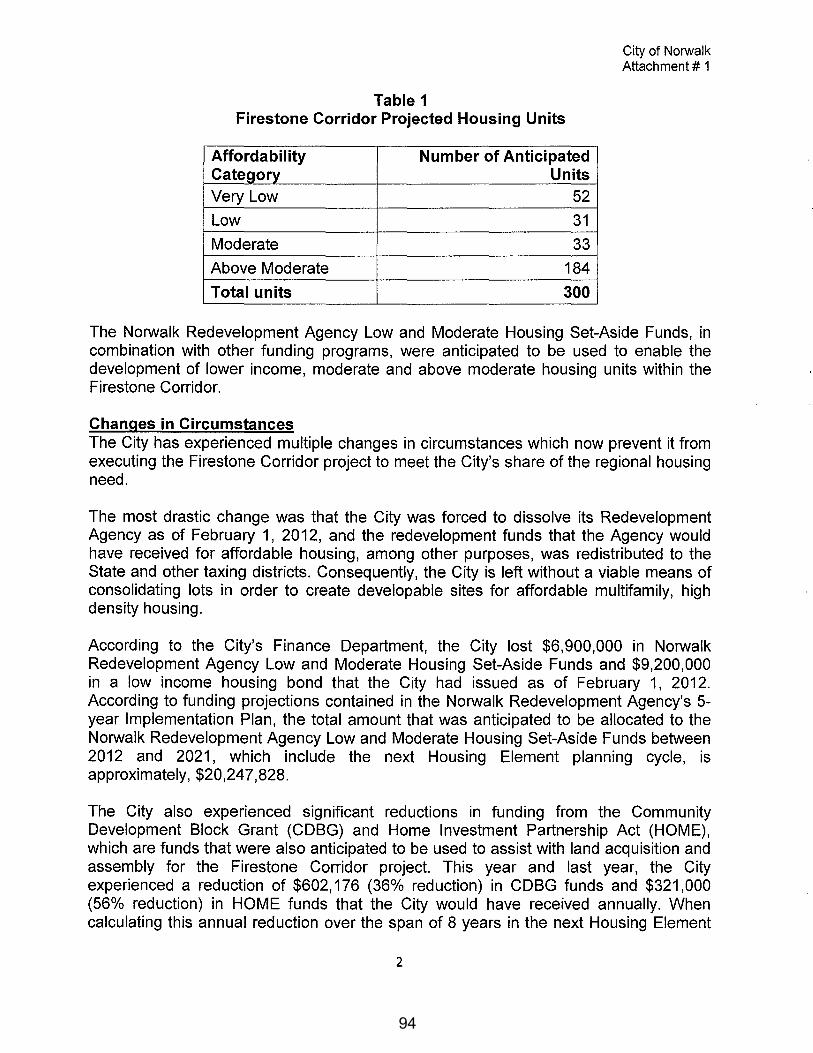
Table 1 Firestone Corridor Projected Housing Units
Affordability Number of Anticipated Category Units Very Low 52
Low 31
Moderate 33
Above Moderate 184
Total units 300
City of Norwalk Attachment# 1
The Norwalk Redevelopment Agency Low and Moderate Housing Set-Aside Funds, in combination with other funding programs, were anticipated to be used to enable the development of lower income, moderate and above moderate housing units within the Firestone Corridor.
Changes in Circumstances The City has experienced multiple changes in circumstances which now prevent it from executing the Firestone Corridor project to meet the City's share of the regional housing need.
The most drastic change was that the City was forced to dissolve its Redevelopment Agency as of February 1, 2012, and the redevelopment funds that the Agency would have received for affordable housing, among other purposes, was redistributed to the State and other taxing districts. Consequently, the City is left without a viable means of consolidating lots in order to create developable sites for affordable multifamily, high density housing.
According to the City's Finance Department, the City lost $6,900,000 in Norwalk Redevelopment Agency Low and Moderate Housing Set-Aside Funds and $9,200,000 in a low income housing bond that the City had issued as of February 1, 2012. According to funding projections contained in the Norwalk Redevelopment Agency's 5-year Implementation Plan, the total amount that was anticipated to be allocated to the Norwalk Redevelopment Agency Low and Moderate Housing Set-Aside Funds between 2012 and 2021, which include the next Housing Element planning cycle, is approximately, $20,247,828.
The City also experienced significant reductions in funding from the Community Development Block Grant (CDBG) and Home Investment Partnership Act (HOME), which are funds that were also anticipated to be used to assist with land acquisition and assembly for the Firestone Corridor project. This year and last year, the City experienced a reduction of $602,176 (36% reduction) in CDBG funds and $321,000 (56% reduction) in HOME funds that the City would have received annually. When calculating this annual reduction over the span of 8 years in the next Housing Element
2
94
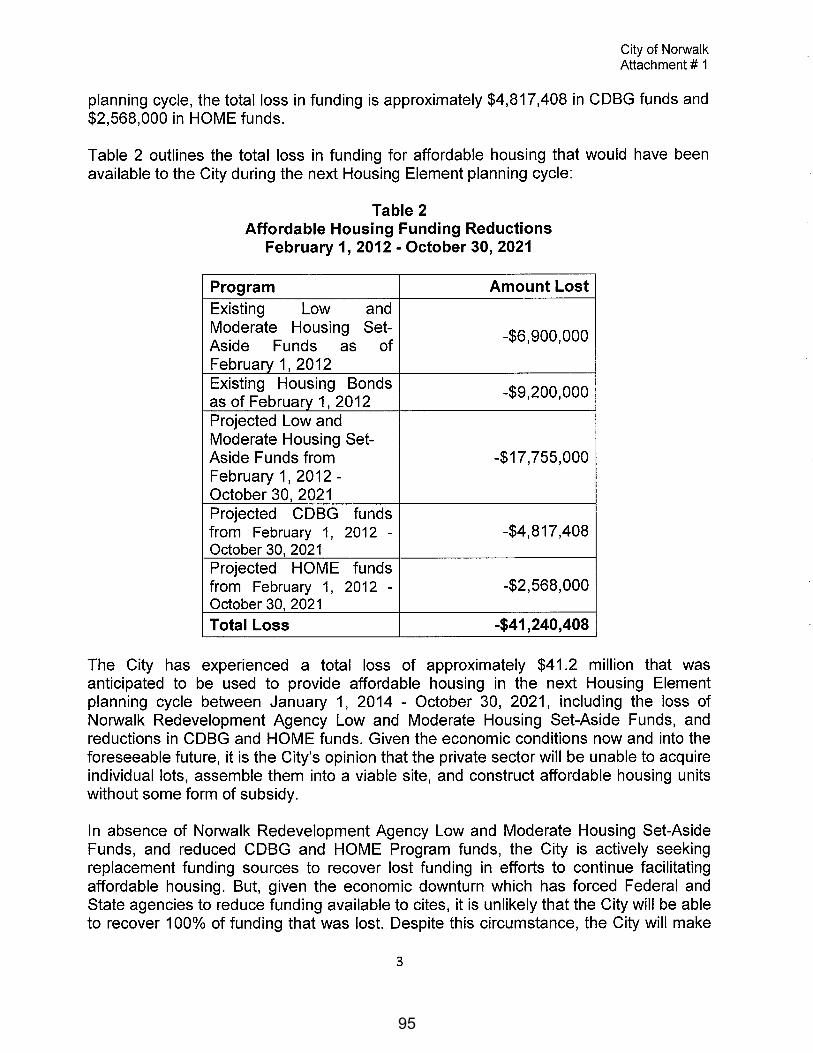
City of Norwalk Attachment# 1
planning cycle, the total loss in funding is approximately $4,817,408 in CDBG funds and $2,568,000 in HOME funds.
Table 2 outlines the total loss in funding for affordable housing that would have been available to the City during the next Housing Element planning cycle:
Table 2 Affordable Housing Funding Reductions
February 1, 2012 - October 30, 2021
Program Amount Lost Existing Low and Moderate Housing Set- -$6,900,000 Aside Funds as of February 1, 2012 Existing Housing Bonds -$9,200,000 as of February 1, 2012 Projected Low and Moderate Housing Set-Aside Funds from -$17,755,000 February 1, 2012 -October 30, 2021 Projected CDBG funds from February 1, 2012 - -$4,817,408 October 30, 2021 Projected HOME funds from February 1, 2012 - -$2' 568' 000 October 30, 2021 Total Loss -$41,240,408
The City has experienced a total loss of approximately $41.2 million that was anticipated to be used to provide affordable housing in the next Housing Element planning cycle between January 1, 2014 - October 30, 2021, including the loss of Norwalk Redevelopment Agency Low and Moderate Housing Set-Aside Funds, and reductions in CDBG and HOME funds. Given the economic conditions now and into the foreseeable future, it is the City's opinion that the private sector will be unable to acquire individual lots, assemble them into a viable site, and construct affordable housing units without some form of subsidy.
In absence of Norwalk Redevelopment Agency Low and Moderate Housing Set-Aside Funds, and reduced CDBG and HOME Program funds, the City is actively seeking replacement funding sources to recover lost funding in efforts to continue facilitating affordable housing. But, given the economic downturn which has forced Federal and State agencies to reduce funding available to cites, it is unlikely that the City will be able to recover 100% of funding that was lost. Despite this circumstance, the City will make
3
95

City of Norwalk Attachment# 1
attempts to seek replacement funding assistance for affordable housing from the following programs:
• California Housing Finance Agency (CHFA) Multiple Rental Housing Program; • Section 202; • Low Income Housing Tax Credit (LIHTC); • Multi-Family Housing Program (MHP); • Downtown Rebound; • Los Angeles County Mortgage Revenue Bond; • California Community Reinvestment Corporation (CCRC); • Federal Home Loan Bank Affordable Housing Program; • Low Income Housing Fund (UHF); and • Private Lenders.
Conclusion For the circumstances listed above, the City is respectfully appealing the RHNA allocation and requesting a revision from 201 housing units (Table 3) to 100 housing units (Table 4). Designating sites to accommodate the revised RHNA of 100 total housing units will still be a major challenge. However, it may provide an opportunity to identify sufficient sites outside the Firestone Corridor that can be developed with affordable housing.
4
96

Table 3 City of Norwalk
Share of Regional Housing Needs January 1, 2014- October 30, 2021
Income Number Percent Group
Very Low
Low
Moderate
Above Moderate
Total:
Source: Southern California Regional Governments, Draft
Allocation Plan
Table 4 City of Norwalk
52 25.9%
31 15.4%
33 16.4%
85 42.3%
201 100.0%
Association of Housing Needs
Share of Regional Housing Needs January 1, 2014- October 30, 2021 REVISED
Income Group Very Low
Low
Moderate
Above Moderate
Total:
Source: Southern Governments, Draft Allocation Plan
Number Percent
California Regional
5
26 26.0%
15 15.0%
16 16.0%
43 43.0%
100 100.0%
Association of Housing Needs
City of Norwalk Attachment# 1
97

4.4 Appeal from the City of Pico Rivera
98

Agenda Item 4.4
DATE: July 12, 2012
TO: Regional Housing Needs Assessment (RHNA) Appeals Board
FROM: Ma’Ayn Johnson, Senior Regional Planner, (213) 236-1975, [email protected] Frank Wen, Manager, Research and Analysis, (213) 236-1854, [email protected]
SUBJECT: Appeal from the City of Pico Rivera
EXECUTIVE DIRECTOR’S APPROVAL:
RECOMMENDED ACTION (Please Select One):
APPROVE PARTIALLY APPROVE DENY
SUMMARY OF APPEAL: The City of Pico Rivera requests a RHNA reduction based on several local planning factors. The local planning factors cited for appeal include: sewer or water infrastructure constraints for additional development; availability of land suitable for urban development or for conversion to residential use; market demand for housing; and high housing cost burdens. Because of these constraints, the City of Pico Rivera requests an unspecified reduction to its Draft RHNA Allocation of 850 units and to redistribute the need for very low income and low income households from its Draft RHNA Allocation. STRATEGIC PLAN: This item supports SCAG’s Strategic Plan; Goal 1: Improve Regional Decision Making by Providing Leadership and Consensus Building on Key Plans and Policies; Objective a: Create and facilitate a collaborative and cooperative environment to produce forward thinking regional plans. RATIONALE FOR RECOMMENDED ACTION: Staff recommends that the RHNA Appeals Board deny the City of Pico Rivera’s appeal to reduce its Draft Allocation. Per Government Code Section 65584.04(d)(2)(A), the jurisdiction must prove a lack of sewer capacity beyond its control, however, the City has not provided evidence of such. Moreover, per Government Code Section 65584.04(d)(2)(B), SCAG cannot restrict consideration of suitable sites to a jurisdiction’s current zoning and land use policies, and per Section 65584.04(f), SCAG cannot consider a jurisdiction’s General Plan as a justification to reduce its share of regional housing need. Finally, a redistribution of select income categories would be inconsistent with the adopted RHNA Methodology and its application under Government Code Section 65584.04 and 65584.05. The City also did not specify or provide a justification for a specific change in its assignment of housing need.
99

Agenda Item 4.4
BACKGROUND: The following is a chronology of the events related to Pico Rivera’s Draft RHNA Allocation to date: 1. On July 29, 2009, an initial letter was sent from SCAG to Mr. Jeff Brauckmann, Community
Development Director, City of Pico Rivera, indicating the Draft household forecast as follows: 2008 Households 16,610 2020 Households 17,680 (1,070 increment from 2008) 2035 Households 18,746 (2,136 increment from 2008)
2. On December 2, 2009, the City’s input was received from Ms. Julia Gonzalez, Deputy Director of Planning, City of Pico Rivera, to SCAG. The City indicated as part of their input that it agreed with the population projections but disagreed with the household and employment totals.
3. On May 13, 2011, an email was sent from SCAG to Mr. Jeff Brauckmann, Community Development Director, City of Pico Rivera, indicating that the growth forecast numbers were adjusted based on recently released data from the decennial Census and the California Employment Development Department. The associated table that was sent indicates that the City’s Draft household forecast was adjusted as follows:
2008 Households 16,675 2020 Households 17,625 (950 increment from 2008, a reduction of 120) 2035 Households 18,691 (2,016 increment from 2008, a reduction of 120)
In addition, SCAG also provided the City this additional household information in detail: 2010 Census (4/1/2010) 16,566 2011 DOF (1/1/2011) 16,566 2021 RHNA Projection Period (1/1/2014 - 10/1/2021) 17,717
4. On June 17, 2011, SCAG’s AB 2158 Survey and Housing Unit Demolition Survey were sent to the City
of Pico Rivera for their input. The City did not return the surveys to SCAG.
5. On December 9, 2011, SCAG released the Draft RHNA Allocation Plan as part of the agenda for the RHNA Subcommittee agenda. The Draft Plan was recommended by the RHNA Subcommittee for further approval by the Community, Economic & Human Development Committee (CEHD) and the Regional Council. The CEHD and the Regional Council reviewed and approved the Draft Allocation on February 2, 2012. The Draft RHNA Allocation for the City of Pico Rivera is 850.
6. On February 2, 2012, Ms. Julia Gonzalez, Deputy Director of Planning, City of Pico Rivera, requested a copy of the May 13, 2011 email and the associated data sent to the local jurisdictions. Javier Minjares, SCAG staff, sent a copy of the material to Ms. Gonzalez on the same day.
7. On February 6, 2012, SCAG sent a letter to Dr. Ronald Bates, City Manager, City of Pico Rivera,
indicating the Draft RHNA Allocation for the City of Pico Rivera.
100

Agenda Item 4.4
8. On March 15, 2012, SCAG received a RHNA revision request from Ms. Debbie Lopez, Assistant City Manager, City of Pico Rivera, based on existing or projected job-housing balance, sewer or water infrastructure constraints for additional development, availability of land suitable for urban development or for conversion to residential use, distribution of household growth assumed for purposes of comparable Regional Transportation plans, market demand for housing, and high housing cost burdens. The City requested a reduction of an unspecified number of units from its Draft RHNA Allocation.
9. On April 19, 2012, the SCAG Appeals Board held a meeting to review the submitted revision requests,
including from the City of Pico Rivera. After the City of Pico Rivera presented its revision request to the Appeals Board, the Board discussed the merits of the request and the SCAG staff recommendation. After discussion, the Appeals Board voted to deny the City’s revision request for a reduction of an unspecified number of units.
10. On May 25, 2012, SCAG received a RHNA appeal from Mr. Ben Martinez, Planning Director, City of
Pico Rivera, based on several local planning factors. The City requested a reduction of an unspecified number of units from its Draft RHNA Allocation and to redistribute the need for very low income and low income households from its Draft RHNA Allocation.
Summary Table
Time Period Source/Calculation Figure 2011 Households DOF 16,566 2020 Households 5/13/11 Adjustment 17,625 2021 Households Interpolation 17,717 2011 to 2021 Projected Household Growth (10.75 years)
2021 Households – 2011 Households -or- = 17,717-16,566
1,151
2014 to 2021 Projected Household Growth (7.75 years)
(10.75 year growth/10.75 year period) x 7.75 year period -or- =(1,151/10.75) x 7.75
830
101

Agenda Item 4.4
ANALYSIS: The City of Pico Rivera submits an appeal and requests a RHNA reduction of an unspecified amount based on several local planning factors. Planning factors cited include sewer or water infrastructure constraints for additional development, availability of land suitable for urban development or for conversion to residential use, market demand for housing, and high housing cost burdens. Local Planning Factors (1) Sewer or water infrastructure constrains for additional development [Govt. Code Section
65584.04(d)(2)(A)] Issue: The City of Pico Rivera provides information on its sewer system capacity and results from an evaluation of the system. The City states that based on the evaluation results, it will remediate hydraulically deficient sewer lines with the construction of a larger replacement line with adequate design capacity. However the City writes that funding is limited for sewer upgrades. SCAG Staff Response: No evidence has been provided by the City to indicate, per Government Code Section 65584.04(d)(2)(A), that there is a lack of water or sewer capacity for the jurisdiction based on external factors beyond its control. Specifically, Government Code Section 65584(d)(2)(A) is intended to consider constraints to additional housing based on a “lack of capacity for sewer or water service due to federal or state laws, regulations or regulatory actions, or supply and distribution decisions made by a sewer or water service provider other than the local jurisdiction that preclude the jurisdiction from providing necessary infrastructure for additional development during the planning period.” Based upon staff’s review, the City of Pico Rivera’s 2010 Sewer/Water Infrastructure Management Plan does not support the City’s argument that it is precluded from providing the necessary sewer or water infrastructure to accommodate future housing development. For these reasons, SCAG staff does not recommend a reduction to the City’s Draft RHNA Allocation based on this planning factor. (2) Availability of land suitable for urban development or for conversion to residential use [Govt. Code
Section 65584.04(d)(2)(B)] Issue: In its appeal, the City of Pico Rivera writes that it is built out and vacant land is scarce. In addition, to meet its 4th RHNA cycle Allocation of 855 units the City converted industrial and commercial land uses, which were already limited in the City. The City writes that it needs a tax base. SCAG Staff Response: Per Government Code Section 65584.04(d)(2)(B), SCAG is not permitted to limit its consideration of suitable housing sites or land suitable for urban development to a jurisdiction’s existing zoning and/or land use policies and restrictions. Although the City has indicated that its current housing element is limited in its capacity to accommodate future housing need, Government Section 65584.04(d)(2)(B) requires that the consideration of the availability of land suitable for urban development must include other types of land use opportunities other than vacant land. This includes the availability of underutilized land, opportunities for infill development and increased residential densities, or alternative zoning and density. Alternative development opportunities should be explored further and could possibly provide the land needed to zone for the City’s projected growth and allocated need. For this reason, SCAG staff does not recommend a housing need reduction based on this planning factor.
102
Agenda Item 4.4
(3) Market demand for housing [Govt. Code Section 65584.04(d)(4)]
Issue: The City argues that it has not received any applications to meet the housing demand of its 4th RHNA Allocation of 855 units. According to the City, only 44 units have been built in the last RHNA planning period. The City’s population has decreased according to the 2010 Census and therefore the City expects a continued lower growth rate in the next RHNA cycle. In addition, the City is experiencing a high foreclosure rate and expects to have a larger inventory of housing. SCAG Staff Response: The purpose of the RHNA process is to identify future housing need for all income categories for each jurisdiction during a projection period. Jurisdictions are required to demonstrate in their respective housing elements a sites and zoning analysis to accommodate future housing need and are not penalized if these units do not get built. While permits issued document prior construction activity, it does not necessarily predict future development associated with projected growth. SCAG’s adopted RHNA Allocation Methodology also took into account all indicators of market demand, including trends of building permits, household growth, employment growth and population growth, and incorporated the latest economic statistics and updated data from the 2010 Census. With regard to a high foreclosure rate, some jurisdictions are experiencing an abnormal amount of vacancies significantly above normal market conditions. As part of the adopted RHNA Allocation Methodology, SCAG applied a RHNA future need vacancy credit to each jurisdiction with vacant units exceeding the California Department of Housing and Community Development (HCD) approved healthy market vacancy rate levels for owner and renter housing. According to the 2010 Census data, the City’s existing vacancies do not exceed its healthy market vacancy levels. Therefore, the City of Pico Rivera did not receive a vacancy credit as part of its Draft Allocation. For these reasons, SCAG staff does not recommend a reduction from the City’s Draft RHNA Allocation based on this planning factor. (4) High housing cost burdens [Govt. Code Section 65584.04(d)(7)]
Issue: The City lists high housing cost burdens as an additional basis for its revision request. SCAG Staff Response: No further description or documentation was provided by the City to support this claim. Therefore, there is no information for which staff can analyze this planning factor as a basis for Pico Rivera’s appeal. However, it should be noted that SCAG’s adopted regional Allocation Methodology did take into account high housing cost burdens, including the recent depressed housing market and high inventory of distressed properties from foreclosures. These issues led to a persistent high level of vacancy rates in the foreseeable future. HCD evaluated this as part of SCAG’s regional housing need determination by allowing the application of an excess vacant unit credit where it was appropriate when a healthy market level of vacancies was exceeded to reduce the projected future housing need. Other Considerations (Lack of funding, limited street capacity) Issue: As a result of the elimination of redevelopment agencies, the City contends that it lacks funds to encourage the development of low income housing or to participate in private development agreements. Additionally, according to the Traffic and Circulation Element of the City’s General Plan, the City has limitations on its road capacity and speed. Small increases in flow will cause breakdowns in traffic movement by affecting their respective levels of service, which would cause a higher level of risk during
103
Agenda Item 4.4
disasters and restricted City access. Finally, the City requests a redistribution of housing need for its very-low and low income categories. SCAG Staff Response: The Regional Housing Needs Assessment is a determination of future housing need based on anticipated growth and is not a building quota. A lack of local, state or federal funding for constructing or subsidizing affordable housing units does not preclude jurisdictions from planning to ensure that there are adequate sites and zoning available to accommodate its projected fair share of future housing need by income category. Thus, SCAG staff cannot consider the lack of funding to build affordable housing as a justification to reduce the City’s projected housing need. With regard to road limitations, while the streets in question may currently lack capacity for more efficient levels of service, identifying suitable sites for future housing need does not preclude the City from updating its circulation element to accommodate more efficient levels of service. Additionally, Government Code Section 65584.04(f) prohibits SCAG from considering a standard of a City, such as a General Plan, that indirectly limits the number of building permits issued by the City as a justification for a reduction of its share of regional housing need. Therefore, SCAG cannot consider the street volume capacity from the City’s General Plan as a justification to reduce the City’s future housing need. With regard to the redistribution of the very-low and low income housing need, the local distribution was determined using 2010 Census data and then a fair share adjustment of 110% towards the county income category distribution was applied to avoid an over concentration of future housing need compared to the county distribution, per adopted RHNA Allocation Methodology. Changes to a jurisdiction’s Draft RHNA Allocation would apply to the total assignment rather than by income category. A redistribution of select income categories would be inconsistent with RHNA Methodology and its application under Government Code Section 65584.04 and 65584.05. FISCAL IMPACT: Work associated with this item is included in the current FY 12-13 General Fund Budget (13-800.0160.03: RHNA). ATTACHMENTS:
1. Appeal Application from the City of Pico Rivera 2. Supporting Documentation Provided by the City to Support Its Appeal
104

Benjamin A. Martinez Director
City of Pico Rivera COMMUNITY AN D ECONOMIC DEVELOPMENT DEPARTMENT 6615 Passons Boulevard · Pico Rivera, California 90660
(562) 801-4332 Fax (562) 949-0280 Web: www.pico-rivera.org ·e-mail: [email protected]
May 29,2012
Southern California Association of Governments Attn: Hasan lkhrata, Executive Director 818 W. Seventh Street, 121
h Floor Los Angeles, CA 90017-3435
RE: 5th Regional Housing Needs Assessment (RHNA) Revision Request
Dear Mr. Ikhrata:
City Council Bob J. Archuleta
Mayor
Gustavo V. Camacho Mayor Pro Tem
David W. Armenta Councilmember
Gregory Salcido Council member
Brent A. Tercero Councilmember
Thank you for your time and for allowing the City to present a case for a lower RHNA distribution. The City believes the allocation and income distribution is not attainable and therefore should be decreased. However, the City of Pico Rivera would like to sit down with your staff to discuss the RHNA allocation and come to a consensus on the appropriate numbers based on the fo llowing:
I. The City is built out and vacant land is scarce. In the 2006-2014 RHNA Cycle, the City has not received any applications nor inquiries to meet such a high housing demand of 855 units for a city that is eight square miles. The City does not own property large enough nor has sufficient funds to meet RHNA demands.
2. The City lacks the funds to encourage development or participate in private development agreements. Inclusive, the changes in redevelopment law further limit the City's capacity to encourage low-income housing.
3. The City is experiencing a high foreclosure rate. One in every 323 units have received a foreclosure fi ling according to Realty Trac. Hence, the City expects to have larger inventory of housing.
4. The City's population has decreased from the 2000-2010 Census by 486. Therefore, the City expects a continued lower growth rate in the future RHNA cycle.
5. Only 44 units have been built in the 2006-2014 RHNA Cycle, even though 855 units were allocated.
6. The City is surrounded by two rivers; Rio Hondo and San Gabriel River. The major City thoroughfare of Rosemead Boulevard has a poor Volume Capacity of D and E. D represents a high density. Speed and freedom to maneuver are severely restricted, and the driver experiences poor level and convenience. E represents operation conditions at or near the capacity level. All speeds are reduced to a low, but relatively unifonn value. Small increases in flow will cause breakdowns in traffic movement. This poses an unexpected risk should a disaster and access outside of the City is limited.
105

RHNA REVISION REQUEST May 29,2012 Page 2
7. In order to meet the current RHNA number of 855, the City had to convert industrial and commercial land uses, which are already limited in the City. The City needs a tax base.
8. The City estimates $7.5 million in sewer upgrades in the next five years. Funding is limited and the City has experienced recent layoffs.
We appreciate your time and continued support. Should you have any questions please call me at (562) 801 -4332.
Sincerely,
Benjamin A. Martinez Community and Economic Development Director
106

ASSOCIATIO .. Of GOVlRRMl.TS
Fifth Regional Housing Needs Assessment (RHNA) Cycle Appeal Request All appeal requests must be received by SCAG May 29, 2011, 5 p.m. Late submissions will not be accepted.
5/29/12 Date: __________________________ _
C Los Angeles
ounty: --------------------------
c Julia Gonzalez ontact: -------------------------
APPEAL AUTHORIZED BY:
Name: Ben Martinez
City of Pico Rivera Jurisdiction: -----------------------
Subregion: -----------------------
Ph / E .I (562) 801 -4332 one ma•: ____________________ ___
PLEASE CHECK BELOW:
0 Mayor 0 Chief Administrative Officer 0 City Manager
ochairof County Board of Supervisors
other: Planning Dia
BASES FOR APPEAL*
0 RHNA Methodology
0 AB 2158 Factors (See Government Code Section 65584.04(d))
0 Existing or projected jobs-housing balance
0 Sewer or water infrastructure constra ints for additional development
0 Availability of land suitable for urban development or for conversion to residential use
0 Lands protected from urban development under existing federal or state programs
0 County policies to preserve prime agricultural land
0 Distribution of household growth assumed for purposes of comparable Regional Transportation
Plans
0 Market demand for housing
0 County-city agreements to direct growth toward incorporated areas of County
0 Loss of units contained in assisted housing developments
0 High housing cost burdens
0 Housing needs of farmworkers
0 Housing needs generated by the presence of a university campus within a jurisdiction
0 Changed Circumstances
Brief Description of Appeal Request and Desired Outcome:
Request to decrease of overall RHNA allocation and redistribute the need for very-low income and low-income category.
List of Supporting Documentation, by Title and Number of Pages:
1. Realty Trac Foreclosure rate
2. 2010 Sewer/Infrastructure Management Plan
3. General Plan Existing Roadway Segment Volume Capacity
*Per Government Code Section 65584.0S(d), appeals to the draft RHNA Allocation Plan can only be made by
jurisdictions that have previously filed a revision request and do not accept the revision request findings made by SCAG, except for appeals based on RHNA methodology and changed circumstances.
FOR STAFF USE ONLY: Date _____________ __ _ Hearing Date: ----------------- Planner:--- -----
107
108

I
I
I I
I
I
I
City of Pico Rivera Sewer System Management Plan ChapterS
rate, velocity, depth of flow, and capacity for each sewer line. The model is also used to identify capacity deficiencies and to size improvements.
Closed Circuit Television Inspection Los Angeles County Department of Public Works eompleted the Closed Circuit Television Inspection (CCTV) inspection for 280,343 linear feet of the City's sewer system. These inspections were reviewed and analyzed to determine where structural deficiencies occur within the City's wastewater system.
Sewer System Capacity Evaluation Criteria To minimize the potential for sanitary sewer overflows (SSOs), the system is sized to convey the peak wet weather flow (PWWF). The PWWF is defined to be equal to the peak dry weather flow (PDWF); plus a contingency for groundwater/seawater infiltration and rainfall dependent inflow, or Infiltration and Inflow (1&1).
Hydraulic equations, friction factors and percent capacity are used to define the design capacity of the sewer lines. Determination of design capacity is as follows. For all pipes, design capacity was based on the pipe flowing at a depth equal to 75 percent of its diameter at the peak wet weather flow. Reserve capacity was provided for variations in estimated flows and peaking, total infiltration and inflow allowance, and for redevelopment. Sewer lines were considered to be over-capacity if they cannot convey the peak wet weather flow using 75 percent of actual capacity (d/D greater than 0.75) based on the hydraulic criteria. The remaining 25 percent is allowed for infiltration and inflow, reserve capacity contingency and variations in flows.
Sewer System Capacity Evaluation Results Based on the output from the collection system model for existing and future loading conditions, hydraulic deficiencies are identified within the existing system. The sewer lines with flows that exceed the design capacity (diD greater than 0. 75) were identified. Once these hydraulically deficient lines were identified, the replacement pipe diameter required to remediate the hydraulic deficiency using the existing slope was determined.
Two options were considered for remediation of the hydraulic deficiencies; to construct a parallel line to relieve flow from the hydraulically deficient line, and to construct a larger replacement line with adequate design capacity. Generally, the disadvantage of using a parallel line is that it increases overall operations and maintenance costs by adding new lines to the system that require cleaning and maintenance, and in some cases, existing utilities may not provide an adequate corridor for construction. For these reasons, the City has chosen to remediate hydraulically deficient sewer lines with construction of a larger replacement line with adequate design capacity.
Capital Improvement Program (CIP) The City's Capital Improvement Program (CIP) is intended to perform all needed se-wer related projects to assure the appropriate operation of the existing sewer system. To do so, the City will upgrade all hydraulically deficient sewer lines in ~ddition to replacement or rehabilitation of structurally damaged lines. A total of 14,086 linear feet of sewer pipe with flows that exceeded the design capacity (diD ratio~ 0. 75) were identified and recommended for replacement in order to remediate the hydraulic deficiency using the existing slope. Priority was given to sewer pipe segments that were found to be both
_.6411 32 INCORPORATED
109

I I I I I I
City of Pico Rivera Sewer System Management Plan ChapterS
hydraulically and structurally deficient through hydraulic modeling and CCTV review. The total estimated capital improvement cost for these projects is $7,522,301.
Prioritized CIP Schedule The City's Capital Improvement Program (CIP) was developed based on mprovement priorities. Due to the nature of the improvements, most of these projects are to be constructed over a 5 year span with the City budgeting 1.5 million dollars for each year. These projects will begin in the 2010-2011 fiscal year and will continue through the 2014-2015 fiscal year. Table 3 shows the 5-year Capital Improvement Program as recommended by the 2009 Sewer Master Plan.
Table 5 5-Year Capital Improvement Program
Replacement of Replacement of
Year Strudurally Hydraulically Total Total Damaged Deficient Sewer per 2009 Cost
Sewer lines Lines
First Year: 2009-2010 $1,500,000 $0 $1 ,500,000 $1 ,500,000
Second Year: 201 0-2011 $382,625 $1 ,045,947 $1,428,571 $1 ,500,000
Third Year: 2011 -2012 $700,000 $660,544 $1,360,544 $1,500,000
Fourth Year: 2012-2013 $241,312 $1,054,444 $1 ,295,756 $1 ,500,000
Fifth Year: 2013-2014 $0 $1,252,401 $1 ,252,401 $1 ,522,301
Total $2,823,937 $4,013,335 $6,837,273 $7,522,301
33 INCORPORATED 110
Pico Rivera Local Foreclosure Trends and Foreclosure Information I RealtvTrac Page 1 of8
Foreclosure Sale Auctions Search & Buy Homes inCA & AZ. 4000+ Homes Awaiting Cash Buyers! !!,auctl!!2l!Q.on!!.£2ma:Jnawtsf
Bank Owned Properties Earn 16-20%. Cash Flowing Day One. Avg Price $30k. Buy One or Many. £"""'!!l""W:nf.llldliilillmcl~
Rent to Own Homes Search Rent to Own Listings For $1. Find A Home You Can Afford, Today! ».:w•!J!.!rwQm~l:2Q:!!ll.li211!L&q
~I FREE !BJAL I Subsqlbo I~
· ~ • MV Reatty!rac • Stats & TreQ(js • Foreclosure Center · ~ • Community
Looking to buy? Find a local agent Pico Rivera, CA Search Homes
advanced
Foreclosure Home ~ ~ ~ California • Los Angeles County • Pico Rivera, CA
Pico Rivera, CA Real Estate Trends 365 Foredosure Homes 1 $240,300 Average Foreclosure Sales Price
Pico Rivera, CA
I Foreclosure Trends ~ ~
M arket V rew ~ ~
SalE"~ Tr(!'nds
'· 0 '· 1 • _ .._ _ . / _ -/ .• ~ --I ··=----- ..._ __ ..J t.....__1
rl'
Search Trends
"'l / lA;/"")(\1')
111

Pico Rivera Local Foreclosure Trends and Foreclosure Information I RealtyTrac
February 2012 Foreclosure Rate Heat Map
Foreclosure Actions to Housing Units
1 in 323 Housing Units 1 in 323 Housing Units I
Low
Foreclosure Activity Counts - Pico Rivera, CA
.., 0 20 40 60
httn://www.realtvtrac.com/trendcenter/ca/oico+rivera-trend.html
Foreclosure Rate Heat Map What are new foreclosures as a percentage of the housing marllet? More info
1 in every 323 housing units received a foreclosure filing in February 2012
Get Embed Code
Compare Areas
New Foreclosures What areas have the highest amount of new foreclosure activity? More info
Total New Foreclosure Activity Reaister for FREE
Get Embed Code
Page 2 of8
3/15/2012 112

4,000
Feet
Figure 4-4 Existing Roadway Segment Volume to Capacity
Legend - LOSA-C
- LOS D-E
- LOS F
C.:.i City Boundary
Sphere of Influence
Source: ESA, 2011
113
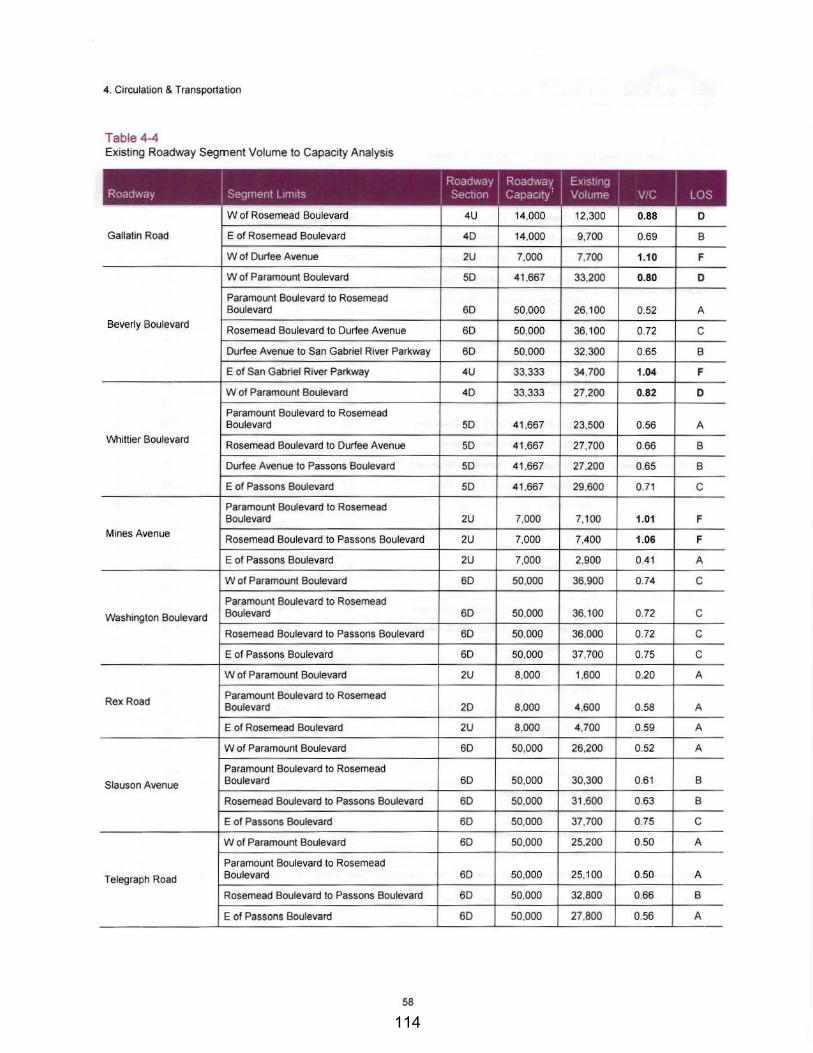
4. Circulation & Transporta1ion
Table 4-4 Existing Roadway Segment Volume to Capacity Analysis
' Roadway I Roadwax I Ex1st1ng
I Roadway I Segment L1m1ts Section Capac1ty Volume 1
ViC LOS
W of Rosemead Boulevard 4U 14,000 12.300 0.88 0
Gallatin Road E of Rosemead Boulevard 40 14,000 9,700 069 B
W of Durfee Avenue 2U 7,000 7,700 1.1 0 F
W of Paramount Boulevard 50 41.667 33,200 0.80 0
Paramount Boulevard to Rosemead Boulevard 60 50.000 26,100 0.52 A
Beverly Boulevard Rosemead Boulevard to Durfee Avenue 60 50,000 36,100 0.72 c Durfee Avenue to San Gabriel River Parkway 60 50,000 32,300 0.65 B
E of San Gabriel River Parkway 4U 33,333 34,700 1.04 F
W of Paramount Boulevard 40 33,333 27.200 0.82 0
Paramount Boulevard to Rosemead Boulevard 50 41 ,667 23.500 0.56 A
Whittier Boulevard Rosemead Boulevard to Durfee Avenue 50 41,667 27.700 0.66 B
Durfee Avenue to Passons Boulevard 50 41 ,667 27.200 0.65 B
E of Passons Boulevard 50 41 ,667 29.600 0.71 c Paramount Boulevard to Rosemead Boulevard 2U 7,000 7,100 1.01 F
Mines Avenue Rosemead Boulevard to Passons Boulevard 2U 7,000 7,400 1.06 F
E of Passons Boulevard 2U 7,000 2,900 0.41 A
W of Paramount Boulevard 60 50,000 36,900 0.74 c Paramount Boulevard to Rosemead
Washington Boulevard Boulevard 60 50.000 36,100 0.72 c Rosemead Boulevard to Passons Boulevard 60 50,000 36,000 0.72 c E of Passons Boulevard 60 50,000 37,700 0.75 c W of Paramount Boulevard 2U 8,000 1.600 0.20 A
Rex Road Paramount Boulevard to Rosemead Boulevard 20 8,000 4,600 0.58 A
E of Rosemead Boulevard 2U 8.000 4,700 059 A
W of Paramount Boulevard 60 50,000 26,200 0.52 A
Paramount Boulevard to Rosemead
Slauson Avenue Boulevard 60 50,000 30,300 0.61 B
Rosemead Boulevard to Passons Boulevard 60 50,000 31,600 0.63 B
E of Passons Boulevard 60 50,000 37,700 0.75 c W of Paramount Boulevard 60 50,000 25,200 0.50 A
Paramount Boulevard to Rosemead
Telegraph Road Boulevard 60 50,000 25.100 0.50 A
Rosemead Boulevard to Passons Boulevard 60 50,000 32,800 0.66 B
E of Passons Boulevard 60 50,000 27.800 0.56 A
58
114
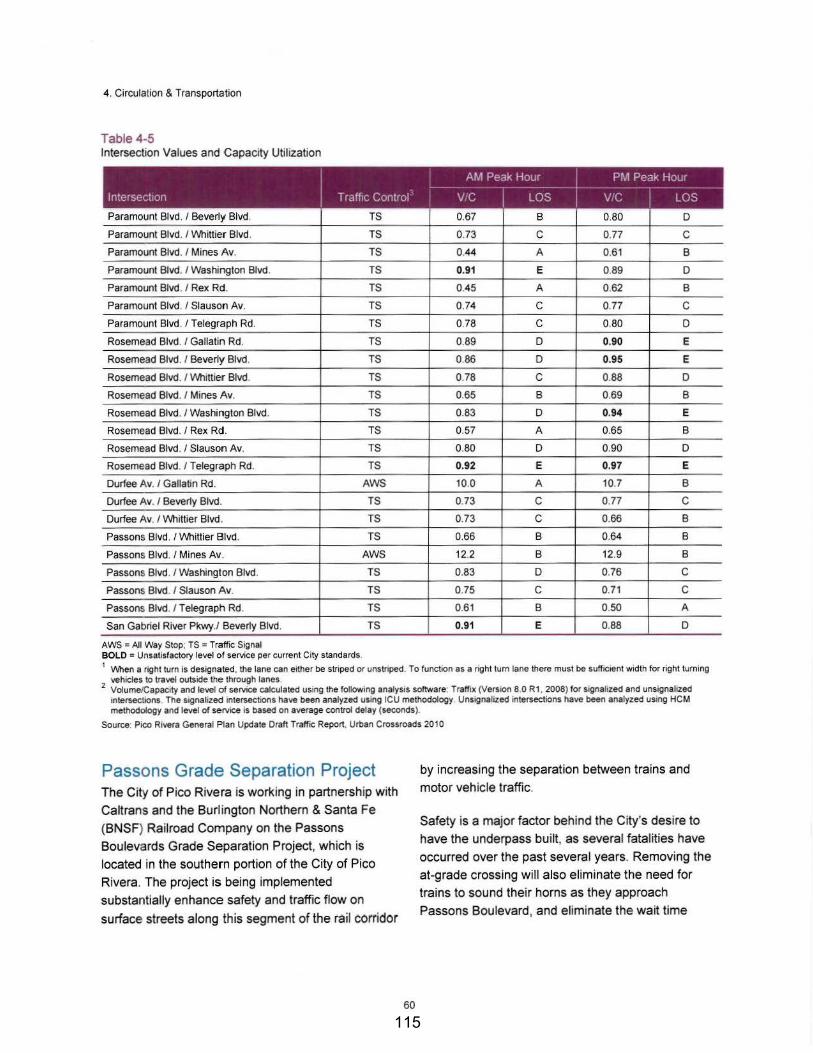
4. Circulation & Transportation
Table 4-5 Intersection Values and Capacity Utilization
I ~ ~- AM Pe~k~ [_ PM _Peak Hour
Intersection Traff1c Control 1
ViC I LOS I ViC I LOS
Paramount Blvd. / Beverly Blvd. TS 0.67 B 0.80 D
Paramount Blvd. / Whittier Blvd. TS 0.73 c 0.77 c Paramount Blvd. I Mines Av. TS 0.44 A 0.61 B
Paramount Blvd. I Washington Blvd. TS 0.91 E 0.89 D
Paramount Blvd. I Rex Rd. TS 0.45 A 0.62 B
Paramount Blvd. I Slauson Av. TS 0.74 c 0.77 c Paramount Blvd./ Telegraph Rd. TS 0.78 c 0.80 D
Rosemead Blvd. I Gallatin Rd. TS 0.89 D 0.90 E
Rosemead Blvd. / Beverly Blvd. TS 0.86 D 0.95 E
Rosemead Blvd./ Whittier Blvd. TS 0.78 c 0.88 D
Rosemead Blvd. I Mines Av. TS 0.65 B 0.69 B
Rosemead Blvd./ Washington Blvd. TS 0.83 D 0.94 E
Rosemead Blvd. I Rex Rd. TS 0.57 A 0.65 B
Rosemead Blvd. I Slauson Av. TS 0.80 D 0.90 D
Rosemead Blvd. I Telegraph Rd. TS 0.92 E 0.97 E
Durfee Av. I Gallatin Rd. AWS 10.0 A 10.7 B
Durfee Av. I Beverly Blvd. TS 0.73 c 0.77 c Durfee Av. I Whittier Blvd. TS 0.73 c 0.66 B
Passons Blvd. I Whittier Blvd. TS 0.66 B 0.64 B
Passons Blvd. / Mines Av. AWS 12.2 B 12.9 B
Passons Blvd. I Washington Blvd. TS 0.83 D 0.76 c Passons Blvd. I Slauson Av. TS 0.75 c 0.71 c Passons Blvd. I Telegraph Rd. TS 0.61 B 0.50 A
San Gabriel River Pkwy./ Beverly Blvd. TS 0.91 E 0.88 D
AWS = All Way Stop; TS = Traffic Signal BOLD = Unsatisfactory level of service per current City standards. 1 When a right turn is designated, the lane can either be striped or unstriped. To function as a right turn lane there must be sufficient width for right turning
vehicles to travel outside the through lanes. 2 Volume/Capacity and level of service calculated using the following analysis software: Traffix (VersiOn 8.0 R1 . 2008) for signalized and unsignalized
intersections. The signalized intersections have been analyzed using ICU methodology. Uns.gnalized intersections have been analyzed using HCM methodology and level of service is based on average control delay (seconds).
Source: Pico Rivera General Plan Update Draft Traffic Report, Urban Crossroads 2010
Passons Grade Separation Project The City of Pico Rivera is working in partnership with
Caltrans and the Burlington Northern & Santa Fe
(BNSF} Railroad Company on the Passons
Boulevards Grade Separation Project, which is
located in the southern portion of the City of Pico
Rivera. The project is being implemented
substantially enhance safety and traffic flow on
surface streets along this segment of the rail corridor
60
by increasing the separation between trains and
motor vehicle traffic.
Safety is a major factor behind the City's desire to
have the underpass built, as several fatalities have
occurred over the past several years. Removing the
at-grade crossing will also eliminate the need for
trains to sound their horns as they approach
Passons Boulevard, and eliminate the wait time
115
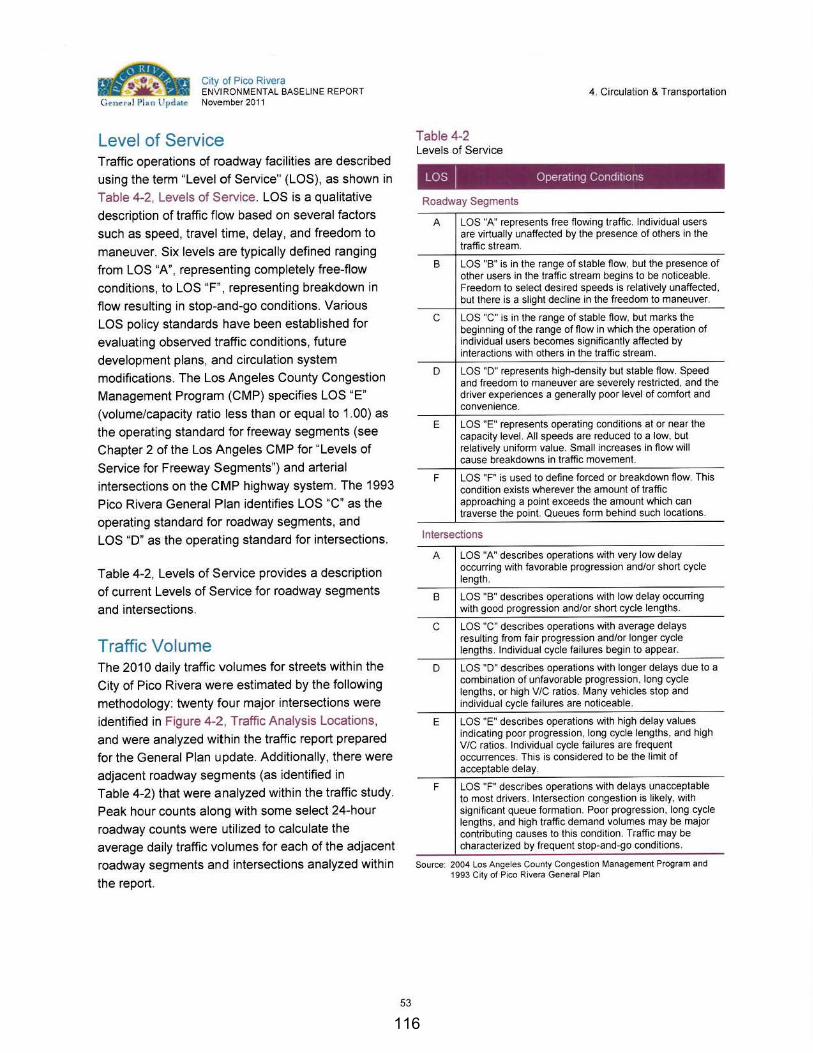
~ G~nera l Plan llpclat~
City of Pico Rivera ENVIRONMENTAL BASELINE REPORT November 2011
Level of Service Traffic operations of roadway facilities are described
using the term "Level of Service" (LOS), as shown in
Table 4-2, Levels of Service. LOS is a qualitative
description of traffic flow based on several factors
such as speed, travel time, delay, and freedom to
maneuver. Six levels are typically defined ranging
from LOS "A", representing completely free-flow
conditions, to LOS "F" , representing breakdown in
flow resulting in stop-and-go conditions. Various
LOS policy standards have been established for
evaluating observed traffic conditions. future
development plans, and circulation system
modifications. The Los Angeles County Congestion Management Program (CMP) specifies LOS "E"
(volume/capacity ratio less than or equal to 1.00) as
the operating standard for freeway segments (see
Chapter 2 of the Los Angeles CMP for "Levels of
Service for Freeway Segments") and arterial
intersections on the CMP highway system. The 1993
Pico Rivera General Plan identifies LOS "C" as the
operating standard for roadway segments, and
LOS "D" as the operating standard for intersections.
Table 4-2, Levels of Service provides a description
of current Levels of Service for roadway segments
and intersections.
Traffic Volume The 2010 daily traffic volumes for streets within the
City of Pico Rivera were estimated by the following
methodology: twenty four major intersections were
identified in Figure 4-2, Traffic Analysis Locations,
and were analyzed within the traffic report prepared
for the General Plan update. Addit ionally, there were
adjacent roadway segments (as identified in
Table 4-2) that were analyzed within the traffic study.
Peak hour counts along with some select 24-hour
roadway counts were utilized to calculate the
average daily traffic volumes for each of the adjacent
roadway segments and intersections analyzed within
the report.
53
Table 4-2 Levels of Service
4. Circulation & Transportation
LOS J Operating Cond1t1ons
Roadway Segments
A LOS "A" represents free flowing traffic. Individual users are virtually unaffected by the presence of others in the traffic stream.
B LOS "B" is in the range of stable flow, but the presence of other users in the traffic stream begins to be noticeable. Freedom to select desired speeds is relatively unaffected, but there is a slight decline in the freedom to maneuver.
C LOS "C'' is in the range of stable flow, but marks the beginning of the range of flow in which the operation of individual users becomes significantly affected by interactions with others in the traffic stream.
D LOS "D" represents high-density but stable flow. Speed and freedom to maneuver are severely restricted, and the driver experiences a generally poor level of comfort and convenience.
E LOS "E" represents operating conditions at or near the capacity level. All speeds are reduced to a low, but relatively uniform value. Small increases in flow will cause breakdowns in traffic movement.
F LOS "F" is used to define forced or breakdown flow. This condition exists wherever the amount of traffic approaching a point exceeds the amount which can traverse the point. Queues form behind such locations.
Intersections
A LOS "A" describes operations with very low delay occurring with favorable progression and/or short cycle length.
B LOS "B" describes operations with low delay occurring with good progression and/or short cycle lengths.
C LOS "C" describes operations with average delays resulting from fair progression and/or longer cycle lengths. Individual cycle failures begin to appear.
D LOS "D" describes operations with longer delays due to a combination of unfavorable progression, long cycle lengths. or high VIC ratios. Many vehicles stop and individual cycle failures are noticeable.
E LOS "E" describes operations with high delay values indicating poor progression. long cycle lengths. and high VIC ratios. Individual cycle failures are frequent occurrences. This is considered to be the limit of acceptable delay.
F LOS "F" describes operations with delays unacceptable to most drivers. Intersection congestion is likely, with significant queue formation. Poor progression. long cycle lengths, and high traffic demand volumes may be major contributing causes to this condition. Traffic may be characterized by frequent stop-and-go conditions.
Source: 2004 Los Angeles County Congestion Management Program and 1993 City of Pico Rivera General Plan
116

4.5 Appeal from the City of Sierra Madre
117
Agenda Item 4.5
DATE: July 12, 2012
TO: Regional Housing Needs Assessment (RHNA) Appeals Board
FROM: Ma’Ayn Johnson, Senior Regional Planner, (213) 236-1975, [email protected] Frank Wen, Manager, Research and Analysis, (213) 236-1854, [email protected]
SUBJECT: Appeal from the City of Sierra Madre
EXECUTIVE DIRECTOR’S APPROVAL:
RECOMMENDED ACTION (Please Select One):
APPROVE PARTIALLY APPROVE DENY
SUMMARY OF APPEAL: The City of Sierra Madre requests a RHNA reduction based on several factors. They include: their perspective of SCAG’s failure to determine the City’s share of the regional housing need in accordance with the adopted RHNA Allocation Methodology; and planning factors such as existing or projected jobs-housing balance, sewer or water infrastructure constraints for additional development, availability of land suitable for urban development or for conversion to residential use, lands protected from urban development under existing federal or state programs, distribution of household growth assumed for purposes of comparable Regional Transportation Plans, market demand for housing, loss of units contained in assisted housing developments, high housing cost burdens, housing needs of farmworkers, and housing needs generated by the presence of a university campus within a jurisdiction. Because of these constraints, the City of Sierra Madre requests a reduction of an unspecified number of units from its Draft Allocation of 55 units. STRATEGIC PLAN: This item supports SCAG’s Strategic Plan; Goal 1: Improve Regional Decision Making by Providing Leadership and Consensus Building on Key Plans and Policies; Objective a: Create and facilitate a collaborative and cooperative environment to produce forward thinking regional plans. RATIONALE FOR RECOMMENDED ACTION: Staff recommends that the RHNA Appeals Board deny the City of Sierra Madre’s appeal to reduce Draft Allocation. The City has not provided sufficient evidence that its water provider cannot provide adequate water supply during the planning period, pursuant to Section 65584.04 (d)(2)(A). Other factors the City has based its appeal upon do not warrant a reduction to its Draft RHNA Allocation since these factors have already been considered in the development of the City’s Draft RHNA Allocation. Local growth input from the City gathered through the Integrated Growth Forecast process was incorporated into the RHNA process according to the adopted RHNA Methodology and was the basis for determining its RHNA share of future need in a manner that is consistent with state housing law requirements and prohibitions.
118
Agenda Item 4.5
BACKGROUND: The following is a chronology of the events related to Sierra Madre’s Draft RHNA Allocation to date: 1. On July 29, 2009, an initial letter was sent from SCAG to Mr. Don Williams, Planning Director, City of
Sierra Madre, indicating the Draft household forecast as follows: 2008 Households 4,832 2020 Households 4,972 (140 increment from 2008) 2035 Households 5,039 (207 increment from 2008)
2. On November 13, 2009, the City’s input was received from Mr. Danny Castor, Director of Development Services, City of Sierra Madre, to SCAG as follows: 2008 Households 4,832 2020 Households 4,904 (72 increment from 2008, a decrease of 68 from SCAG forecast) 2035 Households 5,039 (207 increment from 2008, no change from SCAG forecast)
3. On May 13, 2011, an email was sent from SCAG to Mr. Danny Castro, Director of Development Services, City of Sierra Madre, indicating that the growth forecast numbers were adjusted based on recently released data from the decennial Census and the California Employment Development Department. The associated table that was sent indicates that the City’ Draft household forecast was adjusted as follows:
2008 Households 4,837 2020 Households 4,908 (71 increment from 2008, an increase of 1) 2035 Households 5,043 (206 increment from 2008, an increase of 1)
In addition, SCAG also provided the City this additional household information in detail: 2010 Census (4/1/2010) 4,837 2011 DOF (1/1/2011) 4,837 2021 RHNA Projection Period (1/1/2014 - 10/1/2021) 4,920
4. On June 17, 2011, SCAG’s AB 2158 Survey and Housing Unit Demolition Survey were sent to the City of Sierra Madre for their input. The City did not return the surveys to SCAG.
5. On December 9, 2011, SCAG released the Draft RHNA Allocation Plan as part of the agenda for the RHNA Subcommittee meeting. The Draft Plan was recommended by the RHNA Subcommittee for further approval by the Community, Economic & Human Development Committee (CEHD) and the Regional Council. The CEHD and the Regional Council reviewed and approved the Draft Allocation on February 2, 2012. The Draft RHNA Allocation for the City of Sierra Madre is 55.
6. On December 13, 2011, Ms. Leticia Cardoso, Senior Planner, City of Sierra Madre, sent an email to
Ma’Ayn Johnson, SCAG staff, requesting the City’s Draft RHNA Allocation. Ma’Ayn Johnson sent Ms. Cardoso a copy of the Draft RHNA Allocation for the City of Sierra Madre the same day.
119
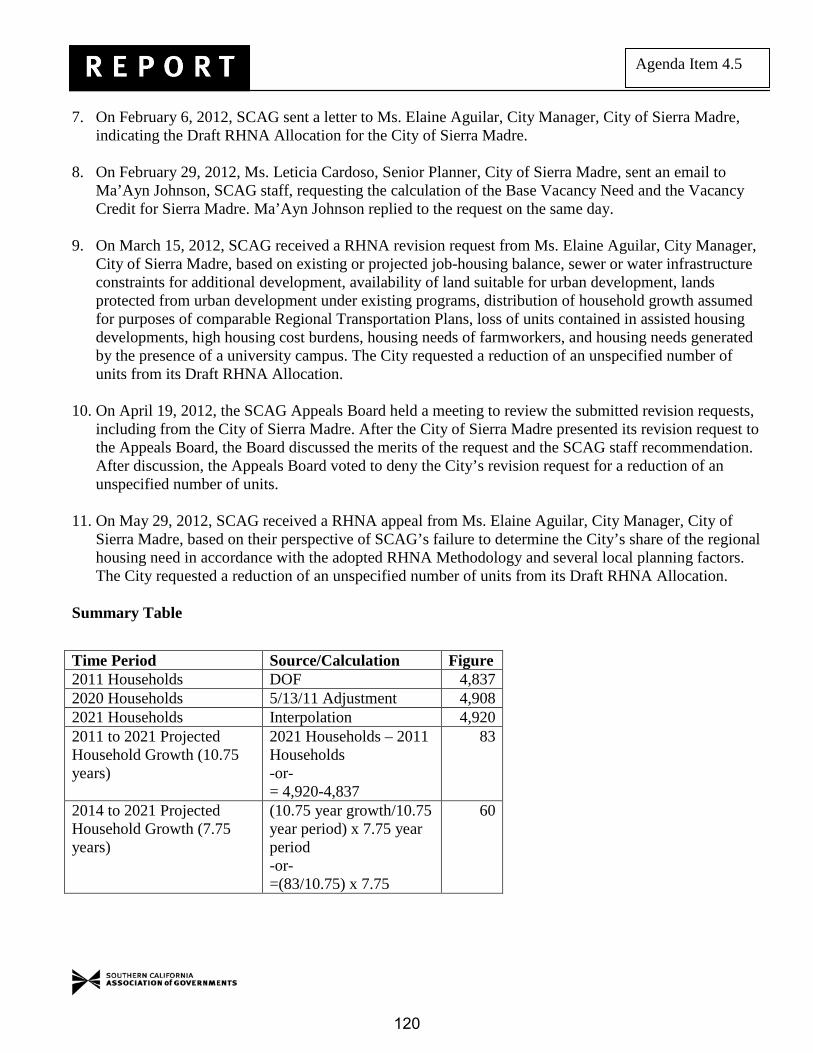
Agenda Item 4.5
7. On February 6, 2012, SCAG sent a letter to Ms. Elaine Aguilar, City Manager, City of Sierra Madre, indicating the Draft RHNA Allocation for the City of Sierra Madre.
8. On February 29, 2012, Ms. Leticia Cardoso, Senior Planner, City of Sierra Madre, sent an email to
Ma’Ayn Johnson, SCAG staff, requesting the calculation of the Base Vacancy Need and the Vacancy Credit for Sierra Madre. Ma’Ayn Johnson replied to the request on the same day.
9. On March 15, 2012, SCAG received a RHNA revision request from Ms. Elaine Aguilar, City Manager,
City of Sierra Madre, based on existing or projected job-housing balance, sewer or water infrastructure constraints for additional development, availability of land suitable for urban development, lands protected from urban development under existing programs, distribution of household growth assumed for purposes of comparable Regional Transportation Plans, loss of units contained in assisted housing developments, high housing cost burdens, housing needs of farmworkers, and housing needs generated by the presence of a university campus. The City requested a reduction of an unspecified number of units from its Draft RHNA Allocation.
10. On April 19, 2012, the SCAG Appeals Board held a meeting to review the submitted revision requests,
including from the City of Sierra Madre. After the City of Sierra Madre presented its revision request to the Appeals Board, the Board discussed the merits of the request and the SCAG staff recommendation. After discussion, the Appeals Board voted to deny the City’s revision request for a reduction of an unspecified number of units.
11. On May 29, 2012, SCAG received a RHNA appeal from Ms. Elaine Aguilar, City Manager, City of
Sierra Madre, based on their perspective of SCAG’s failure to determine the City’s share of the regional housing need in accordance with the adopted RHNA Methodology and several local planning factors. The City requested a reduction of an unspecified number of units from its Draft RHNA Allocation.
Summary Table
Time Period Source/Calculation Figure 2011 Households DOF 4,837 2020 Households 5/13/11 Adjustment 4,908 2021 Households Interpolation 4,920 2011 to 2021 Projected Household Growth (10.75 years)
2021 Households – 2011 Households -or- = 4,920-4,837
83
2014 to 2021 Projected Household Growth (7.75 years)
(10.75 year growth/10.75 year period) x 7.75 year period -or- =(83/10.75) x 7.75
60
120

Agenda Item 4.5
ANALYSIS: The City of Sierra Madre submits an appeal and requests reduction in an unspecified amount of units based upon the following: their perspective of SCAG’s failure to determine the City’s share of the regional housing need in accordance with the adopted RHNA Allocation Methodology; and a variety of local planning factors. Local planning factors cited include existing or projected jobs-housing balance, sewer or water infrastructure constraints for additional development, availability of land suitable for urban development, lands protected from urban development under existing programs, distribution of household growth assumed for purposes of comparable Regional Transportation Plans, loss of units contained in assisted housing developments, high housing cost burdens, housing needs of farmworkers, and housing needs generated by the presence of a university campus. RHNA Methodology [Govt. Code Section 65584.05(d)(1)] Issue: The City has indicated in its appeal application that it bases its appeal on how SCAG has applied adopted RHNA Allocation Methodology to determine the City’s Draft RHNA Allocation, per Government Code Section 65584.05(d)(2). However, no statement or information from the City has been provided to support this appeal basis. SCAG Staff Response: No statement or information was provided by the City to support this appeal basis. Thus, SCAG staff does not support a reduction of the City’s Draft RHNA Allocation based on RHNA Methodology. Local Planning Factors (1) Existing and projected jobs and housing balance [Govt. Code Section 65584.04(d)(1)]
Issue: The City argues that it has a significant job-housing imbalance and that while the current City ratio is 0.63 jobs per housing unit, according to the City the optimal ratio is around 1.50 jobs per housing unit. According to its appeal, additional housing units would exacerbate the City’s current jobs-housing relationship which it contends already favors the recommended number of housing units. SCAG Staff Response: Per SCAG’s adopted Allocation Methodology for this 5th cycle RHNA, SCAG has concluded that the existing and projected jobs-housing relationships are stable and appropriately maintained for SCAG local jurisdictions throughout the forecasting and planning horizon. The general presumption is that when providing local input on household growth, planning factors such as jobs-housing balance are included as part of the local input provided. Moreover, the adopted regional Allocation Methodology took into account each member jurisdiction’s existing and projected jobs-housing relationship. These relationships were appropriately maintained for the City of Sierra Madre throughout the forecasting/planning horizons as part of the Integrated Growth Forecast development. For these reasons, SCAG staff does not recommend a housing need reduction based upon the jobs-housing balance planning factor.
121
Agenda Item 4.5
(2) Sewer or water infrastructure constraints for additional development [Govt. Code Section 65584.04(d)(2)(A)]
Issue: As part of its appeal, the City submitted documentation in regards to its water supply constraints. The City argues that it has a limited supply of water resources, as indicated in a letter from its main water provider, Raymond Basin Management Board, and that this supply is declining. SCAG Staff Response: State Housing Law requires that an external water provider must render a decision on water supply or distribution for this planning factor to apply. Specifically, Government Code Section 65584.04 (d)(A)(2) provides as a planning factor the following:
“Lack of capacity for sewer or water service due to federal or state laws, regulations or regulatory actions, or supply and distribution decisions made by a sewer or water service provider other than the local jurisdiction that preclude the jurisdiction from providing necessary infrastructure for additional development during the planning period.”
While the letter indicates that there is a declining supply of water, there is no evidence that the City’s main water provider has made a decision that would preclude the City from providing water supply to accommodate future growth. Thus, SCAG staff does not recommend a housing need reduction based upon this factor. (3) Availability of lands suitable for urban development or for conversion to residential use [Govt. Code
Section 65584.04(d)(2)(B)]
Issue: In its submitted AB 2158 local planning factors survey as part of its appeal application, the City of Sierra Madre explains that it is a “built-out” community, and that its 610 acres of vacant land is unsuitable for high-density residential housing due to hillside and other topography issues. The City also argues it is important to maintain its commercially-zoned areas, as designated in its General Plan, to continue its economic viability and, additionally, there are no remaining vacant lots in these areas. SCAG Staff Response: With regard to the City’s argument that it is built-out, Government Code Section 65584.04(d)(2)(B) asserts that SCAG is not permitted to limit its consideration of suitable housing sites or land suitable for urban development to a jurisdiction’s existing zoning and land use policies and restrictions, and provides that other types of opportunities must be examined. While the City may not have significant amounts of vacant land, it does not necessarily imply that the City cannot consider other opportunities for development. This includes the availability of underutilized land, opportunities for infill development and increased residential densities, or alternative zoning and density. For this reason, SCAG staff does not recommend a housing need reduction based upon this planning factor. (4) Lands protected from urban development under existing federal or state programs [Govt. Code
Section 65584.04(d)(2)(C)]
Issue: The City writes in its AB 2158 local planning factors survey submitted with its appeal documentation that the Sierra Madre Mountain Conservancy holds a conservation easement over 1,403 acres within the City boundary and that these easements prohibit development of housing on these properties.
122

Agenda Item 4.5
SCAG Staff Response: As part of the development of the household projections through the Integrated Growth Forecast process, SCAG staff surveyed all jurisdictions for their input on the projected household growth. The local input served as the basis for household projections so that local planning constraints, such as protected open space, could be identified prior to the AB 2158 local planning factors survey and prior to calculating the Draft RHNA Allocation. The City provided input to SCAG on its household growth projection. Additionally, the open space and easement in question have already been taken into account in the input the City provided to SCAG. Our understanding is that the easement has been in place for a while. Thus, SCAG staff does not recommend a further reduction based on this factor. (5) Distribution of household growth assumed for purposes of comparable Regional Transportation
Plans [Govt. Code Section 65584.04(d)(3)]
Issue: As part of its appeal, the City explains that because it is not within walking distance of an existing or planned transit station, development of higher density transit-oriented housing is not viable. SCAG Staff Response: High density transit-oriented housing is one tool for identifying suitable sites, but other types of zoning or policies should be considered by a jurisdiction to accommodate its projected growth. Similar to the staff response on the availability of land suitable for urban development, a jurisdiction should explore alternative development opportunities such as infill development and underutilized land. Moreover, current transportation focused development, or lack thereof, does not preclude addressing future household need, and additional transportation opportunities may possibly occur. For these reasons, SCAG staff does not recommend a housing need reduction based upon this planning factor. (6) Market demand for housing [Govt. Code Section 65584.04(d)(4)]
Issue: The City states that its housing prices of $390 per square foot are significantly higher than the County average, and that the cost of developing affordable housing would not be economically feasible without significant subsidies that are unavailable on the local level. SCAG Staff Response: The purpose of the Regional Housing Needs Assessment process is to identify future household need for all income categories for each jurisdiction for a projection period. Jurisdictions are required to demonstrate in their respective housing elements a sites and zoning analysis to accommodate this need. Jurisdictions will not be penalized if these units do not get built. While there are limited resources available for the implementation and building of housing units, particularly for affordable units, it does not preclude jurisdictions from ensuring that there are adequate sites and zoning available to accommodate the projected need for all income levels. Thus, SCAG cannot consider the costs of implementation of housing to justify a reduction in projected housing need. (7) Loss of units contained in assisted housing developments [Govt. Code Section 65584.04(d)(6)]
Issue: In its appeal application, the City has identified the loss of units contained in assisted housing developments as a basis for an appeal. However, in its AB 2158 local planning factors survey provided in its appeal application, the City indicated that there is no need to address the loss of low income housing units in its RHNA Allocation. The City explained that there is only one assisted housing development in the City, which is subject to a covenant to maintain low-income units until the year 2061.
123

Agenda Item 4.5
SCAG Staff Response: SCAG accepts the jurisdiction’s AB 2158 local planning factors survey response stating that there is no additional need resulting from the loss of low income units that would need to be addressed in its Draft RHNA Allocation. For this reason, SCAG staff does not recommend a housing need reduction based upon this planning factor. (8) High housing cost burdens [Govt. Code Section 65584.04(d)(7)]
Issue: In its AB 2158 local planning factors survey provided as part of its appeal application, the City states that its residents are not characterized as experiencing high housing cost burdens, although they have indicated that high housing cost burdens are a basis for its appeal SCAG Staff Response: SCAG staff accepts the jurisdiction’s AB 2158 local planning factors survey response in that the City does not have high housing cost burdens that would need to be addressed in its Draft RHNA Allocation. For this reason, SCAG staff does not recommend a housing need reduction based upon this planning factor. (9) Housing needs of farmworkers [Govt. Code Section 65584.04(d)(8)]
Issue: In its appeal application, the City has identified farmworker housing need as a basis for an appeal. However, in its AB 2158 local planning factors survey provided as part of its appeal application, the City indicated that no farmworker housing is needed in the City. SCAG Staff Response: SCAG staff accepts the jurisdiction’s AB 2158 local planning factors survey response in that the City does not have farmworker housing need that would need to be addressed in its Draft RHNA Allocation. For this reason, SCAG staff does not recommend a housing need reduction based upon this planning factor. (10) Housing needs generated by the presence of a university campus within a jurisdiction [Govt. Code
Section 65584.04(d)(9)]
Issue: In its appeal application, the City has identified student housing need generated by a university as a basis for an appeal. However, in its AB 2158 local planning factors survey provided as part of its appeal application, the City indicated that it does not have any universities within City boundaries and that the demand for student housing from other jurisdictions is insignificant. SCAG Staff Response: SCAG staff accepts the jurisdiction’s AB 2158 local planning factors survey response in that the City does not have housing need generated by a university that would need to be addressed in its Draft RHNA Allocation. For this reason, SCAG staff does not recommend a housing need reduction based upon this planning factor.
124
Agenda Item 4.5
FISCAL IMPACT: Work associated with this item is included in the current FY 12-13 General Fund Budget (13-800.0160.03: RHNA). ATTACHMENTS:
1. Appeal Application from the City of Sierra Madre 2. Supporting Documentation Provided by the City to Support Its Appeal
125
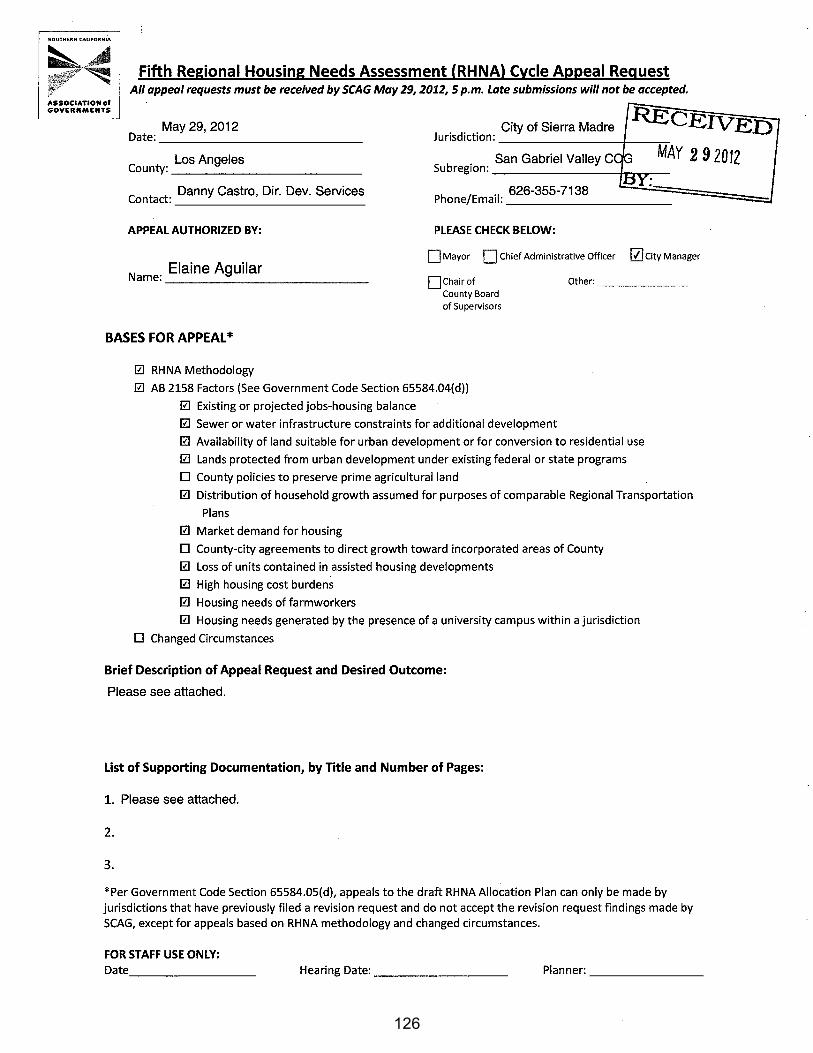
SOUTHERN CALIFORNIA
ASSOCIATION of GOVERNMENTS
Fifth Regional Housing Needs Assessment (RHNA) Cycle Appeal Request All appeal requests must be received by SCAG May 29, 2012, 5 p.m. Late submissions will not be accepted.
May 29, 2012 Date:-------------
Los Angeles Coun~: ____________ _
C Danny Castro, Dir. Dev. Services ontact: ____________ _
APPEAL AUTHORIZED BY:
N Elaine Aguilar arne: ____________ _
City of Sierra Madre Jurisdiction:--------+-----;-;-
San Gabriel Valley C MAY 2 9 2012 Subregion: ----------Pr~.----
ph /E .I 626-355-7138 --======d one ma1: __________ _
PLEASE CHECK BELOW:
0 Mayor D Chief Administrative Officer [l] City Manager
ochairof County Board of Supervisors
Other: _____ _
BASES FOR APPEAL*
0 RHNA Methodology
0 AB 2158 Factors (See Government Code Section 65584.04(d))
0 Existing or projected jobs-housing balance
0 Sewer or water infrastructure constraints for additional development
0 Availabili~ of land suitable for urban development or for conversion to residential use
0 Lands protected from urban development under existing federal or state programs
D Coun~ policies to preserve prime agricultural land
0 Distribution of household growth assumed for purposes of comparable Regional Transportation
Plans
0 Market demand for housing
D Coun~-city agreements to direct growth toward incorporated areas of Coun~
0 Loss of units contained in assisted housing developments
0 High housing cost burdens
0 Housing needs of farm workers
0 Housing needs generated by the presence of a universi~ campus within a jurisdiction
D Changed Circumstances
Brief Description of Appeal Request and Desired Outcome:
Please see attached.
List of Supporting Documentation, by Title and Number of Pages:
1. Please see attached.
2.
3.
*Per Government Code Section 65584.0S(d), appeals to the draft RHNA Allocation Plan can only be made by jurisdictions that have previously filed a revision request and do not accept the revision request findings made by SCAG, except for appeals based on RHNA methodology and changed circumstances.
FOR STAFF USE ONLY: Date. _______ _ Hearing Date:--------- Planner: _______ _
126

Attachment to Fifth Regional Housing Needs Assessment (RHNA) Cycle Appeal Request - City of Sierra Madre
The City of Sierra Madre hereby respectfully submits an appeal of its 2013-2021 RHNA allocation of 55 units, based on water supply constraints for additional development, as provided in more detail below, and in addition to the reasons stated in the City's prior submittal to SCAG of the AB 2158 Factors. The basis for the appeal is further confirmed by a letter recently received by the City of Sierra Madre from Anthony C. Zampiello, Executive Officer at Raymond Basin Management Board, verifying that water levels in the Santa Anita Subarea of the Raymond Basin have been declining due to a deficit between average annual inflow and outflow of water.
The City of Sierra Madre submitted a Revision Request of its 55 RHNA allocation to zero, and presented its case before the RHNA Subcommittee at the hearing on April 19, 2012, at which the Request was denied. A member of the RHNA Subcommittee expressed that if the City is still issuing building permits and there is no current building moratorium, it is hard to justify a RHNA reduction based on water supply constraints. While it is true the City continues to issue building permits and it has not established a building moratorium, the City's current zoning laws and General Plan policies have been established to maintain low density development in part to conserve the City's water supply. The City acknowledges that SCAG cannot consider local zoning or land use restrictions in determining available land. However, the fact remains that additional housing development at higher densities, which would increase the demand for water, would only worsen and accelerate the rate of the City's declining water supply as described in more detail below.
The City of Sierra Madre is located within the Raymond Groundwater Basin in the northwest portion of the San Gabriel Valley. The City has two sources from which it pumps, treats and distributes water-four wells drawing from the Eastern Unit of the Raymond Groundwater Basin, and two natural spring tunnels located in the City's foothills. Water pumped by the City is held in five reservoir sites and distributed to residential, commercial, industrial, and landscape irrigation connectors within the City.
Groundwater pumped from the Santa Anita Subarea (Eastern Unit) of the Raymond Groundwater Basin (via the aforementioned wells) is the primary water supply for the City. As stated in the City's 2010 Urban Water Management Plan (UWMP), through adjudication the City has the right to draw 1,764 acre feet of water per year from the aquifer. However, as confirmed in the 2010 UWMP, water from this source is not a reliable source of water in dry years or multiple dry years due to fluctuations in water level and the overall trend towards a decrease in water levels in the Eastern Unit. In fact, as shown on the Water Level Changes 1985/86 to 2004/05 map provided by the Metropolitan Water District of Southern California, there is a long-term decline in the water levels of the Raymond Groundwater Basin. More specifically, the decline of Sierra Madre Wells No. 3, 4, 5 and 6 are graphically represented in the exhibit prepared by Geoscience, enclosed herein for reference, titled "Hydrograph Wells in the Vicinity of the City of Sierra Madre" (East Raymond Basin).
May 29, 2012
127
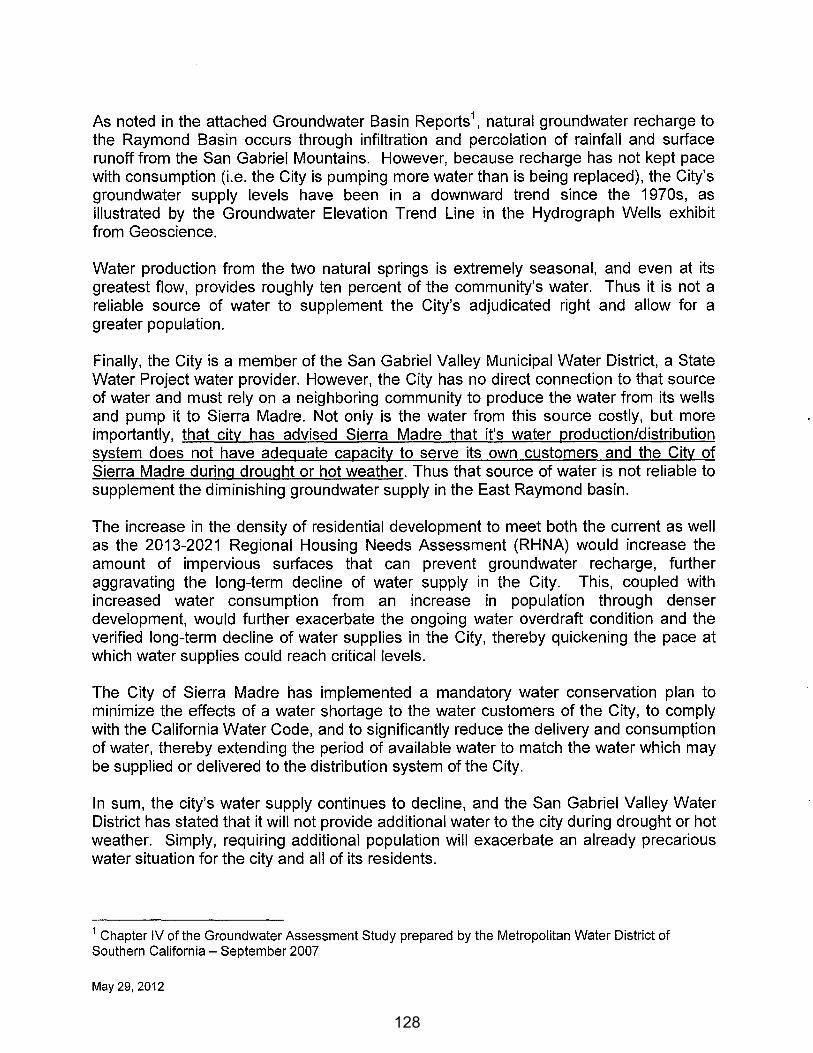
As noted in the attached Groundwater Basin Reports 1, natural groundwater recharge to the Raymond Basin occurs through infiltration and percolation of rainfall and surface runoff from the San Gabriel Mountains. However, because recharge has not kept pace with consumption (i.e. the City is pumping more water than is being replaced), the City's groundwater supply levels have been in a downward trend since the 1970s, as illustrated by the Groundwater Elevation Trend Line in the Hydrograph Wells exhibit from Geoscience.
Water production from the two natural springs is extremely seasonal, and even at its greatest flow, provides roughly ten percent of the community's water. Thus it is not a reliable source of water to supplement the City's adjudicated right and allow for a greater population.
Finally, the City is a member of the San Gabriel Valley Municipal Water District, a State Water Project water provider. However, the City has no direct connection to that source of water and must rely on a neighboring community to produce the water from its wells and pump it to Sierra Madre. Not only is the water from this source costly, but more importantly, that city has advised Sierra Madre that it's water production/distribution system does not have adequate capacity to serve its own customers and the City of Sierra Madre during drought or hot weather. Thus that source of water is not reliable to supplement the diminishing groundwater supply in the East Raymond basin.
The increase in the density of residential development to meet both the current as well as the 2013-2021 Regional Housing Needs Assessment (RHNA) would increase the amount of impervious surfaces that can prevent groundwater recharge, further aggravating the long-term decline of water supply in the City. This, coupled with increased water consumption from an increase in population through denser development, would further exacerbate the ongoing water overdraft condition and the verified long-term decline of water supplies in the City, thereby quickening the pace at which water supplies could reach critical levels.
The City of Sierra Madre has implemented a mandatory water conservation plan to minimize the effects of a water shortage to the water customers of the City, to comply with the California Water Code, and to significantly reduce the delivery and consumption of water, thereby extending the period of available water to match the water which may be supplied or delivered to the distribution system of the City.
In sum, the city's water supply continues to decline, and the San Gabriel Valley Water District has stated that it will not provide additional water to the city during drought or hot weather. Simply, requiring additional population will exacerbate an already precarious water situation for the city and all of its residents.
1 Chapter IV of the Groundwater Assessment Study prepared by the Metropolitan Water District of Southern California - September 2007
May 29, 2012
128

List of Supporting Documentation, by Title and Number of Pages:
1. AB 2158 Factors- City of Sierra Madre (5 pp.) 2. Plate ES-4: Water Level Changes 1985/86 to 2004/05- Metropolitan Water
District of So. Ca. (1 p.) 3. Figure 1: Hydrographic Wells in the Vicinity of the City of Sierra Madre (E.
Raymond Basin)- GeoScience (1 p.) 4. Chapter IV of the Groundwater Assessment Study- Metropolitan Water District
of So. Ca.- 09/2007 (15 pp.) 5. Letter dated March 7, 2012 from Anthony C. Zampiello, Executive Officer of the
Raymond Basin Management Board (7 pp.)
May 29, 2012
129

AB 2158 Factors - City of Sierra Madre
1) Existing and projected jobs and housing relationship, i.e. the jobs and housing balance of a jurisdiction.
Sierra Madre has a significant jobs/housing imbalance. Additional housing units would exacerbate that
imbalance.
SCAG's Draft Integrated Growth Forecast determined an estimated 3,271 jobs were in the city in 2010.
The 2010 Census counted 5,113 housing units in the city. Sierra Madre therefore has a .63 jobs per
housing unit even though planning professionals believe the optimal ratio is roughly 1.50 jobs per
housing unit.1 Stated differently, Sierra Madre has nearly 2.4 times the recommended number of
housing units.
Some might argue that the city should be allocated additional units because SCAG projects the city will
gain 107 jobs by 2020 and another 61 by 2035. But even if these projections are accurate and no
additional housing units were created in 25 years (both questionable assumptions), by 2035, the jobs to
housing ratio would increase only slightly, to only .67 jobs per housing unit. In other words, even with
these questionable assumptions, the jobs/housing imbalance would remain at well over 2.2 times the
recommended ratio.
2) Lack of capacity for sewer or waste water service due to external factors beyond the jurisdiction's control that preclude the jurisdiction from providing necessary infrastructure for additional development.
Approximately ten percent of Sierra Madre's residences and commercial establishments are on septic
systems. In theory, sewers could be built to those areas in the city where sewers do not currently exist.
However, in some instances, due to topographical concerns, the construction or extensions of sewers
would be cost prohibitive, rendering the development of multi-family housing infeasible.
Problems encountered in the operation of the City's sewer system include an aged system at risk of
lateral or main failure, and root infestation into sewer mains.
3) Availability of land suitable for urban development or for conversion to residential use, the availability of underutilized land, and opportunities for infi/1 development and increased density.
SCAG cannot solely consider local zoning ordinances or land use restrictions in determining suitable available land.
1 See Jerry Weitz, Jobs-Housing Balance, APA Planning Advisory Service Report No. 516, p.4, available at:
http://www.planning.org/pas/reports/subscribers/pdf/PAS516.pdf. The report cites two different studies. One study recommends a housing balance be between 1.4 and 1.6; the other recommends a balance between 1.3 and 1.7.
1
130

Sierra Madre is a predominately urbanized, built-out community characterized by low density single
family residential and commercial uses. The residential uses in Sierra Madre occupy 93 percent of the
land area and commercial & light manufacturing occupy 4 percent of the land area, with the balance
designated for other uses, such as institutional and municipal uses. Little land in this 3.03-square-mile
City remains for new development.
Of the mere 610 acres of vacant land in the City, all but one is located within the Hillside Management
Zone, a zone that allows development taking into consideration the significant constraints of the San
Gabriel Mountains. For numerous reasons, the land within the Hillside Management Zone is unsuitable
for high-density residential housing.
First, approximately one-half of the undeveloped hillsides are subject to conservation easements held in
trust by the Sierra Madre Mountain Conservancy. Legally, such property cannot be developed.
Second, approximately 40 acres of land in the Hillside Management Zone are subject to flood control
easements.
Third, these hillside areas are in the City's Very High Fire Hazard Zone. Within the last 2 to 3 years, the
City recommended evacuation from existing hillside communities on numerous occasions due to wildfire
concerns. The steep slopes, the high brush areas, and the abutting Angeles National Forest create a
significant fire danger (exemplified by the recent Station Fire, just miles from the city boundary).
Building multifamily units in this area would greatly increase the potential damage caused by wildfires.
Fourth, the area has been characterized by numerous landslide related dangers throughout the City's
history. The urban/wildland interface areas above the city are most prone to major flooding. In the
years immediately following a brush fire in the foothills, these areas can be an extreme hazard to
persons and property during rainfall events. Flood in these special risk areas can occur rapidly
depending on the time transpired since a fire event, the frequency of rainfall events, the duration of
rainfall events and the intensity of the precipitation. Moreover, the Sunnyside, Floral, Sierra Madre Dam,
and Sturtevant facilities do not have capacity to contain the amount of debris that their watersheds
could produce. Therefore, residential areas below these facilities are potentially subject to post-fire
debris flow damage. Adding high-density housing close to hillsides would exacerbate the potential
danger of landslides.
Fifth, because of the steep slopes, significant grading would be required to allow for any buildable pads.
The weight of multifamily housing would require significant and costly engineering improvements that
would not be necessary for single family residences. Further, in some instances, construction of the
necessary winding roads and infrastructure (sewer, electricity, etc.) would add significant cost.
Collectively, these topography-related costs often would make the construction of multifamily housing
economically infeasible. Moreover, as noted above, the hillside areas above the city are prone to major
flooding and mudslides, especially in the years immediately following a brush fire in the foothills,
2
131
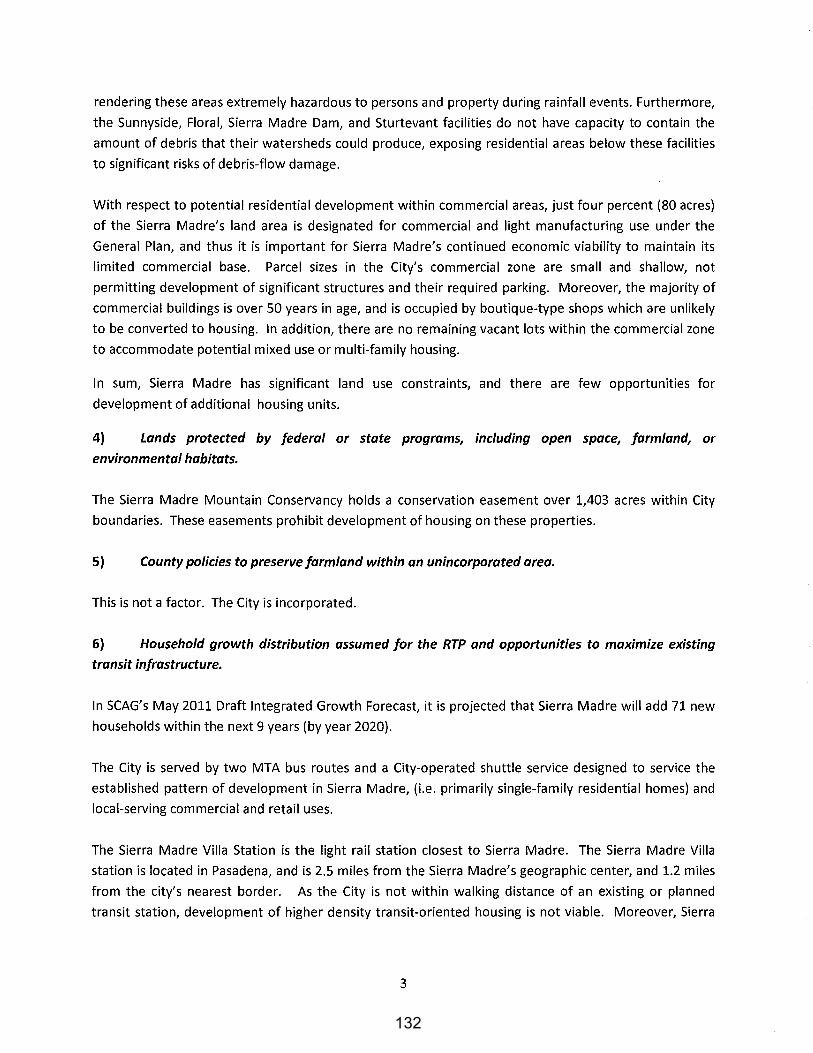
rendering these areas extremely hazardous to persons and property during rainfall events. Furthermore,
the Sunnyside, Floral, Sierra Madre Dam, and Sturtevant facilities do not have capacity to contain the
amount of debris that their watersheds could produce, exposing residential areas below these facilities
to significant risks of debris-flow damage.
With respect to potential residential development within commercial areas, just four percent (80 acres)
of the Sierra Madre's land area is designated for commercial and light manufacturing use under the
General Plan, and thus it is important for Sierra Madre's continued economic viability to maintain its
limited commercial base. Parcel sizes in the City's commercial zone are small and shallow, not
permitting development of significant structures and their required parking. Moreover, the majority of
commercial buildings is over 50 years in age, and is occupied by boutique-type shops which are unlikely
to be converted to housing. In addition, there are no remaining vacant lots within the commercial zone
to accommodate potential mixed use or multi-family housing.
In sum, Sierra Madre has significant land use constraints, and there are few opportunities for
development of additional housing units.
4} Lands protected by federal or state programs, including open space, farmland, or
environmental habitats.
The Sierra Madre Mountain Conservancy holds a conservation easement over 1,403 acres within City
boundaries. These easements prohibit development of housing on these properties.
5} County policies to preserve farmland within an unincorporated area.
This is not a factor. The City is incorporated.
6} Household growth distribution assumed for the RTP and opportunities to maximize existing transit infrastructure.
In SCAG's May 2011 Draft Integrated Growth Forecast, it is projected that Sierra Madre will add 71 new
households within the next 9 years (by year 2020).
The City is served by two MTA bus routes and a City-operated shuttle service designed to service the
established pattern of development in Sierra Madre, (i.e. primarily single-family residential homes) and
local-serving commercial and retail uses.
The Sierra Madre Villa Station is the light rail station closest to Sierra Madre. The Sierra Madre Villa
station is located in Pasadena, and is 2.5 miles from the Sierra Madre's geographic center, and 1.2 miles
from the city's nearest border. As the City is not within walking distance of an existing or planned
transit station, development of higher density transit-oriented housing is not viable. Moreover, Sierra
3
132

Madre is not located along a pass-through route that would make it an appropriate location for transit
oriented development.
The City's main two main arteries are Baldwin Avenue and Sierra Madre Boulevard, and each road is a
single lane. There are no traffic signals in the City. Due to the City's distance from highways and major
arterials, there is limited demand for new commercial development.
7) The loss of low-income housing units in assisted housing development due to contract
expirations or termination of use restrictions.
The City has not experienced or is not projected to experience any loss of low-income housing units.
Sierra Madre's only assisted housing development, the Esperanza Senior Housing Project constructed in
2006, is subject to a recorded covenant that requires that its 46 units be maintained as low-income units
for 55 years.
8) The market demand for housing.
Sierra Madre housing prices of $390 a square foot are significantly higher than the County average. To
allow for projects that include a component of affordable housing to be economically feasible, the
housing would require significant subsidies not available at the local level, combined with densities that
cannot be accommodated given the constraints described under Factor No. 3 above.
9) Agreements between a county and cities in a county to direct growth towards unincorporated
areas.
This is not a factor as there are no such agreements between the City and County.
10) High-housing cost burdens.
As documented by the 2000 Census, housing overpayment (>30% income on housing costs) was
measured at 27% among the City's renters, compared to 46% Countywide. Among the City's
homeowners, housing overpayment was 22%, compared to the Countywide average of 35%. Thus,
Sierra Madre residents are not characterized as experiencing high housing cost burdens.
11) Farmworker housing needs.
No farmworker housing is needed in the City. No farmland exists in the city, nor does the Zoning Map
designates any, nor are there nearby farms necessitating the city to provide such housing.
12) Student housing needs generated by a university within any member jurisdiction.
The nearest major universities are Azusa Pacific University in Azusa, the Claremont Colleges in
Claremont and California State Polytechnic University, located 14 miles, 24 miles and 23 miles,
4
133

respectively, from downtown Sierra Madre. However, due to their distance from the City, it is not
expected that a significant number of their students would seek to fulfill their housing needs in the City.
Consequently, this should not be considered a factor in allocating very low- to low-income housing to
Sierra Madre.
5
134

.... ~
, . ::-,:;r;;::~ .
'•.,,:
·~
P.~~~~· .. :~
. i~ ~. "\;;!:~:) < . ..__, . '~-'llrt~·.
: • .s'~:'i~&twiile.r·
JJ;..
•i'i\N
, ... .,.
·.Y
Legend
Groundwater Basin
Water Levels
CJ Long-term Decline
. · Arrested Decline and Recovery
r;:~!:l Stable with Flat Water Levels
c:::::J Stable with Vv\de Swings
l!lliiRising
0 Insufficient Data
[~=-~J: County
w~~r
'll•<o 'I folo lr."t' """1~'1'"''~ J.y ~'" M•~·~•.t:l.al• It'"'" I ~>UIU "' ~ ..... ~koo•< 'ol<l ""'" ''' I!• ""~ '"'' "" "''"'"'"' '' L'l"~·"'-" ~:.~~'!~~.7 .• ~:.~~::.: ........ l • ..u.l~""' '" ......... ,,, ''"'
1\h"""' I;,.., ~"'" '""',.;".-.1 \11~< !''""""""" ~r.,.,<ol ltl I I!! 1\IA~i 1111 C\' 1.!'11'.'•11• IIU< "'-'i'" "1';"~~1<,J loy Ill< 1\[~', IIlio '' 1.1~1"0\11
1!"""'""'1"\~••nel''~''l"""""'cll"'"""~ .. , O:.~:~rul."l"C"'' I•• l'~~.~~~",.. >c-..1~ 11ili"l$ ld~l'"' ,.,,.,,,.,I"'"'"'" ",.!"1 111 o' 1.\~ Ill!< <'I
~~.~.-~ • .ulllolnilr.onci•J ~ ...... u. w ..... l··~ r· .......... ,;,,.,, < .,., \',) ,\ 1. I·.,:,''"'"" ~.:..,•«l "-' ~""""'" t.ol ''"' I• •,,•,11 <
~~~ .... MWD ·:~. ··:. ~ ~~·: Motropollt<Jn W.1tor D/stTlct of Soutl!orn COJ/Ifo .• ,.!?,~~" ·~"'f.;~'J..r,'i"'' GIS sorvlcos
Plate ES-4
Water Level Changes 1935/36 to 2004/
ES-P·
135
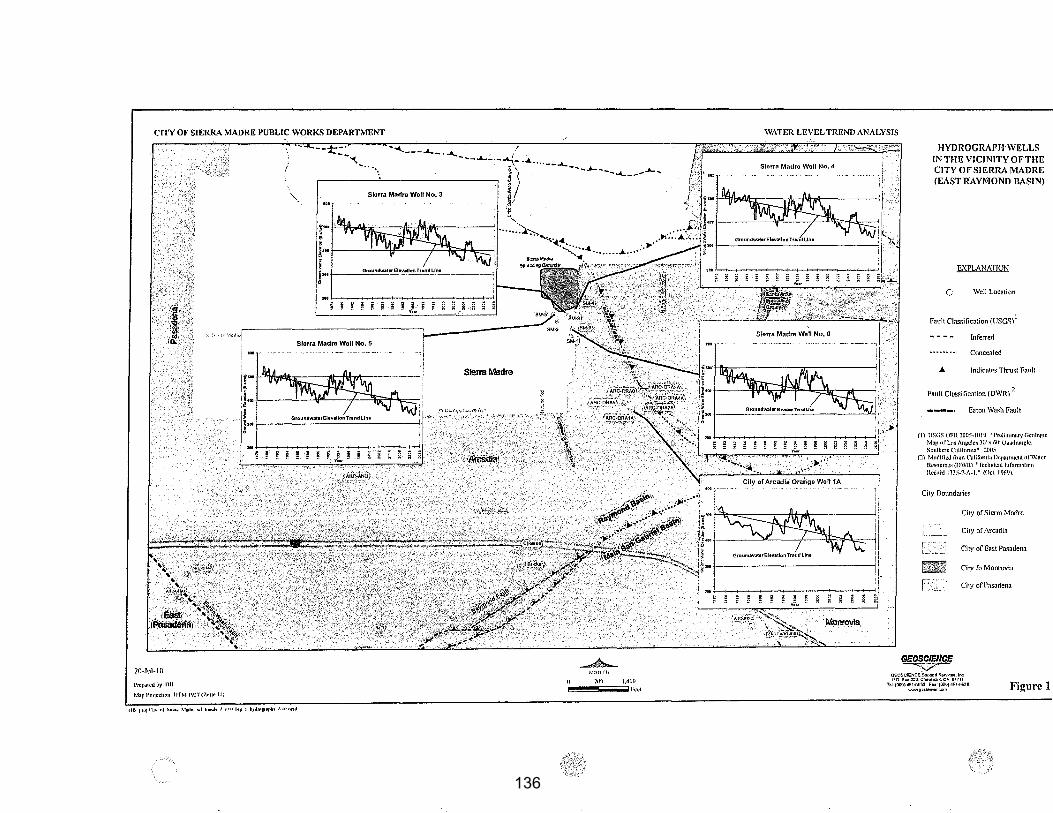
CITY OF SIERRA MADRE PUBLIC WORKS DEPARTMENT
, ___ ....__ ........ ___ ...._;:,._....z_ ........ __ ...._ ___ ,.._ ___ ....... ___ ...... _ . . '
i) ~~ '~ .... "'.
SIGITS Madre
20-Jul-10
............__ NOR Til
7tiiJ 1,4tm
I'!!!!!!!!!!!!!!IOO;;;;;;;;;;;;;jFccl l'n:Jloii"Cllhy IJII
M.'lpl'n•tcctwu lfTM l'J~7{Znuc Ill
1/IS run).l'•l~ nl ~oc1r,1 M•tln: 10ol1n . ..W• IIUtl Ht: I htJn•CIIillt, l·lll•R•tl
WATER LEVEL TREND ANALYSIS
HYDROGRAPI-1'\VELLS IN THE VICINITY OF THE CITY OF SIERRA MADRE (EAST RAYMOND BASIN)
11XPLANATION
(. Well Location
Fault Classification {USGS) 1
Inferred
Concealed
.A Tnclicntes Thrust Faull
Fault Classification {OWR} 2
Eaton Wash Fault
(I) 1/SGS ()FR :!0!15-IUIIJ "l'rolimmuty CkulnJ!tc Mnp ul' Lo~ Anb!ch:.~ 10' '( tin' Qunclrun~,:lc, SnuthL-rnl'alilhnnu". :mus
(:!) Mmhfh!d li"mn ('ollifilnlin Dc)lartnlCIIl uf\V,Jtcr ltcsnurcc.~ (T)\VRl "Tcchniculltilhrnmlsml llciilrtl1135-7-A-1." (Oct. IIJ/iCJ)
City Boundmics
City of Sicl'm Madre
:. City of Arcadia
City or East Pasaden.1
City fo Monrovia
c· City of Pasadena
GEOSCIENCE -y--GEOSCIENCF. Su1>perl S.,.-.oo, Inc PO 0"":/;:'II.CborohrU~.CII U1711
TM {000}~51-ll!JSO F•x· (OO!l)<l!it.r,;;~n WNW(Ig,!WMI'r:orn Figure 1
136

Chapter IV- Groundwater Basin Reports San Gabriel Valley Basins- Raymond Basin
The Raymond Basin is located in the nmihwestem pmiion of the San Gabriel Valley in Los Angeles County. The Raymond Basin includes the communities of Sierra Madre, Arcadia, Pasadena, La Cafiada Flintridge and unincorporated areas of Los Angeles County, and includes 16 separate water purveyors. The Raymond Basin underlies the service areas of the Metropolitan member agencies of Foothill Municipal Water District (Foothill MWD), Upper San Gabriel Valley Municipal Water District (Upper District), City of Pasadena and City of San Marino. The City of Sie1Ta Madre is a member agency of San Gabriel Valley Municipal Water District, a State Water Project Contractor. A map of the basin is provided in Figure 8-1.
Figure 8-1 Map of the Raymond Basin
• Key Wens Water Body
A lnjection-ASR Wells ..t. MWO Facilirt
- Recharge &.-sins 1:1:] Basin
-Freeways . ; MVVD Membe~ A~ncy Bou~dart (color varies)
- b~ND P1peline
FINAL IV-8-1
' y,~lt;.-~ T .
September 2007
137

Chapt~r IV- Grpqn~I,Nqt~r Basjn Reports S.an .~al?-rigl \[aJiey ;,Basins
BASIN CHARACTERIZATION
The following section provides a physical description of the Raymond Basin including its geographic location and hydrogeologic character.
Basin Producing ~~mes and Storage Capacity
The Ray111ond Basin is bounded by the San Gabriel Mountains to the notth, the San Rafael Hills to the w~st (lnd the Raymond fault to the south and southeast. The Raymond Basin is divided into three subareas because of differences in elevation and groundwater flow directions (Monk Hill in the northwest, Pasadena in the central portion, and Santa Anita in the eastern pottion).
Hydrogeologic data are provided in Table 8-1. The Raymond Basin is generally classified as an unconfip~d to semi-:s:onfinedaq~ifer sy~t~m. Th~base ofthS! v-yate,r bearing zpn~~js cqnsidered bedrock vyith el¢vati6ns ranging frorp..appro~imately ~00 f~~t be}9~'~e!'l·1eye,rtg 2,qno feet above mean sy.alyveL1;?,bi]J11 tobetlfgc~nn~g~s f[9Il145(),toi7MJe"~tbei~~ gr'9.~4ci si1i{~~~.(bgs) in the Monk HiltansL~'~il!~~lt~,§ubareas;~!'}.:w~r.~ thJ!p
0Jl2!):o 'teet;~g§·m•li}eF"'~g~hC! ~A~a,rya/central
pmtionof the·E,ayriJQRd B~iiti,_ The fot~lJfor(lge 2~'Pa{;ity .ofth~J{~Yi,llont:l ~.asi11,is ·estimated to be approxinn~tel.Y :M3.7 h1illion, ~F(Q:~9sciepc;e,-~Q9flJ._ Afiip~J1t~9J\y£t~f,.irT~t6fage in Z003 was approximcifely 8Q()tooo AF, with an urn1sed storage space<6:t:~Bo\it 57o,6QO :(Geoscience, 2004).
' ~ '· ;' ''! . ~ . ' .. ·' ·. ~ . -~. \ "' 'f, .. '
.. , Tabie8•1 fstJ~'niaty of ~ydr9geoll}~i~ P~r~iite~~rs ofRii~6~~ BJfs~.n
Natural Safe Yield
Total ~torage 1.3 7 rrtillioh AF
Unused Storage Space 570,000 AF
Portion ofUnused Storage Space Available for
At least 250,000 AF
September 2007 IV-8-2 FINAL
138
Chapter IV- Groundwater Basin Reports Raymond B,asin
Safe Yield/Long-Term Balance of Recharge and Discharge
Natural groundwater recharge to the Raymond Basin occurs through infiltration and percolation of rainfall and surface mnofffrom the San Gabriel Mountains. Groundwater discharge occurs through pumping and subsurface outflow into the Main San Gabriel Basin across the Raymond fault. Natural recharge from precipitation and mnoffis the largest inflow to the basin. Figure 8-2 provides the historical precipitation data from 1985 to 2004 based upon the average of several precipitation stations within the basin (RBMB, 2005). Average precipitation in the basin during this 20-year period was approximately 22.8 inches.
60
-50 U) (!)
.s::. t,) 40 t: -t: 0 30
; ctl +' :e. 20 t,)
E 0.. 10
0
Figure 8-2 Historical Precipitation in Raymond Basin
Average = 22.8 inches
...... ...... _,. _,. _,. _,. ..... ..... _,. ..... _,. ..... N (0 co co co co (0 co co co co (0 co 0 co OJ co co co (0 co co (0 co (0 co 0 co co 0 _,. N ..._ -- -- -- --co co co co co
VJ ~ 01 0) --.1 OJ co 0 ..._ -- -- ..._ -- ..._ -- --(0 co co (0 co <0 0 0 (0 0 _,. N VJ 4>- 01 0) --.1 OJ (0 0
Fiscal Year
N N N N 0 0 0 0 0 0 0 0 _,. N VJ ~ -- -- ..._ 0 0 0 0 N VJ 4>- 01
The Raymond Basin safe yield, which is based upon native recharge and returns from use alone, was defined as 30,622 AFY in 1955. The distribution of the safe yield by subarea is provided in Table 8-1. As described below, this natural safe yield can be increased by groundwater recharge operations.
Figure 8-3 shows the estimated amount of groundwater in storage between 1985 and 2002 based upon estimates made by Geoscience (2004). In this time period groundwater in storage decreased from about 913,000 AF at the end of 1985 to 816,000 AF at the end of2002. Despite a moderate recovery between 1992 and 1998, the net decrease in storage was about 100,000 AF, or about 12 percent. Data are not available beyond 2002. However, based upon \Yater levels discussed below, the storage would be expected to continue to decline through 2005. The basin producers are aware of the decline and are currently in the process of addressing the issue.
FINAL IV-8-3 September 2007
139

Chapter IV- Groundwater Basin Reports San Gabriel Valley Basins
Figure 8-3 Historical Groundwater in Storage Estimates for the Raymond Basin
1,500,000 .------------------------------,
u:-s Full Basin= 1.37 million AF (!)
tn Loss of- 12% between 1985 and 2002 ~ 1,000,000 -1---------------------------·--1 ..... en !:
I.. (!) ..... ra :l: 500,000
"'0 !: :s 0 I.. (!)
0 ....>. ....>.
<0 <0 <0 <0 (X) ()) (X) (X) 01 Ol -.....! (X)
Source: Geosciece, 2004
....>.
<0 <0 (X) <0 <0 0
GROUNDWATER MANAGEMENT
....>.
<0 <0 --"
....>. ....>. -->. --" ....>. ....>. --" 1\) 1\) <0 <0 <0 <0 <0 <0 <0 <0 0 0 <0 <0 <0 <0 <0 <0 <0 <0 0 0 N w .j:>. 01 (j) -.....! (X) <0 0
Calendar Year Ending
The following section describes how the Raymond Basin is cunently managed.
Basin Governance
1\) 0 0 1\)
The Raymond Basin is adjudicated. The Raymond Basin was adjudicated in 1944 by the Los Angeles County Superior Court. The Raymond Basin Management Board (RBMB) administers and enforces the provisions of the Judgment (Pasadena v. City of Alhambra), which established water rights and responsibility for management of the quantity of the basin's groundwater. RBMB coordinates local involvement in efforts to preserve and restore the quality of groundwater in the basin. RBMB also assists and encourages regulatory agencies to enforce water quality regulations affecting the basin, collects production, water quality, and other relevant data from producers and prepares an annual report of pumping and diversions. Table 8-2 provides a list of management agencies in the Raymond Basin.
The Judgment limits the amount of groundwater that a party may extract from the basin each year. Each party's extraction is restricted to a specific hydrologic unit (Western Unit: Pasadena and Monk Hill Subareas; Eastern Unit; Santa Anita Subarea), and its Decreed Rights. Exceptions are that a party may extract ten percent of any unused Decreed Right in any year (not cumulative), and the RBMB may allow more to be canied over in an emergency or another reasonable cause. Parties may also enter into a Long Term Storage Account to add or extract groundwater during the year subject to the RBMB adopted Groundwater Storage Policies.
September 2007 IV-8-4 FINAL
140
Chapter IV - Groundwater Basin Reports Raymond Basin
Impmted water is provided by Foothill Municipal Water District to several parties in-lieu of pumping to meet demand.
The Judgment provisions also allow pmties to increase their annual extractions by perfmming groundwater recharge operations. A more detailed discussion of groundwater recharge is described below.
Table 8-2 Summary of Management Agencies iii the Raymond Basin
Los Angeles County Department of Public Works
City of Pasadena
City of Siena Madre
NASA/Jet Propulsion Laboratory(JPL) :oo:ra111atton and implementation of EPA
in Monk Hill
Interactions with Adjoining Basins
The Raymond Basin is hydraulically connected to the Main San Gabriel Basin to the south and east along the Raymond fault. Approximately one percent of the total water in storage in the Raymond Basin is lost across the Raymond fault (Geoscience, 2004). Parties who store water in the Raymond Basin are assessed this 1 percent loss. No other formal agreements govern this flow.
WATER SUPPLY FACILITIES AND OPERATIONS
The following provides a sU:minary of the facilities within the Raymond Basin.
Active PrQduction W ¢Us
There are about 45 acfive groundwater extraction wells {RBM.B, 2005) in tl;le Raymond Basin with an estimated total weil cilf~Q_ify of apptpximately 97 ;600 AFY bas~<! upon maximurn month extractions d}U'll:!g fisca.J year 2004i05 ol"fm)duction capacity data avail~ble from individual producers. Average extraptions have been approximately 33,000 AFY for municipal use between fiscal years 1985/86 arid 2004/05. Historical production data by subbasin are provided in Figure 8-4.
Twelve wells within the basin have had detections of perchlorate(> 4 ug/L). These wells are located downstream of the Jet Propulsion Laboratory (JPL) Superfund site within the
FINAL IV-8-5 September 2007
141
Chapter IV- Groundwater Basin Reports San Gabriel Valley Basins
Anaya Seco (Geoscience, 2004). Most of these wells are inactive or are blended with other wells to decrease the concentration of perchlorate.
Other Production
All production in the Raymond Basin is designated for municipal use.
Table 8-3 Summary of Production \Veils in the Raymond Basin
Monk Hill 11 2 17,500 8,065
Pasadena 25 72,500 18,588 Not available
Santa Anita 9 7,600 6,315
Total 45 97,600 32,969
Source: Number of wells based upon RBMB, 2005 1. Estimated based upon maximum monthly production in 2004/05 or known capacities 2. Does not include City of Pasadena wells
Figure 8-4 Historical Groundwater Production in the Raymond Basin
45,000
40,000
- 35,000 >-~ 30,000
§ 25,000 +::: g 20,000 "C ~ 15,000
D.. 10,000
5,000
0
September 2007
,----------1 D Santa Anita
+-----------1 1111 Pasadena lflMonk Hill
~ ~ ~
<0 <0 <0 co <0 <0 <0 w ..._ ..._ ..._ <0 <0 <0 0 N -1:>-
~
<0 <0 01 ..._ <0 (j)
Fiscal Year
IV-8-6
~ ~ N <0 <0 0 <0 <0 0 -....j <0 ~ ..._ ..._ ..._ <0 0 0 co 0 N
N 0 0 w ..._ 0 .j:>..
FINAL
142
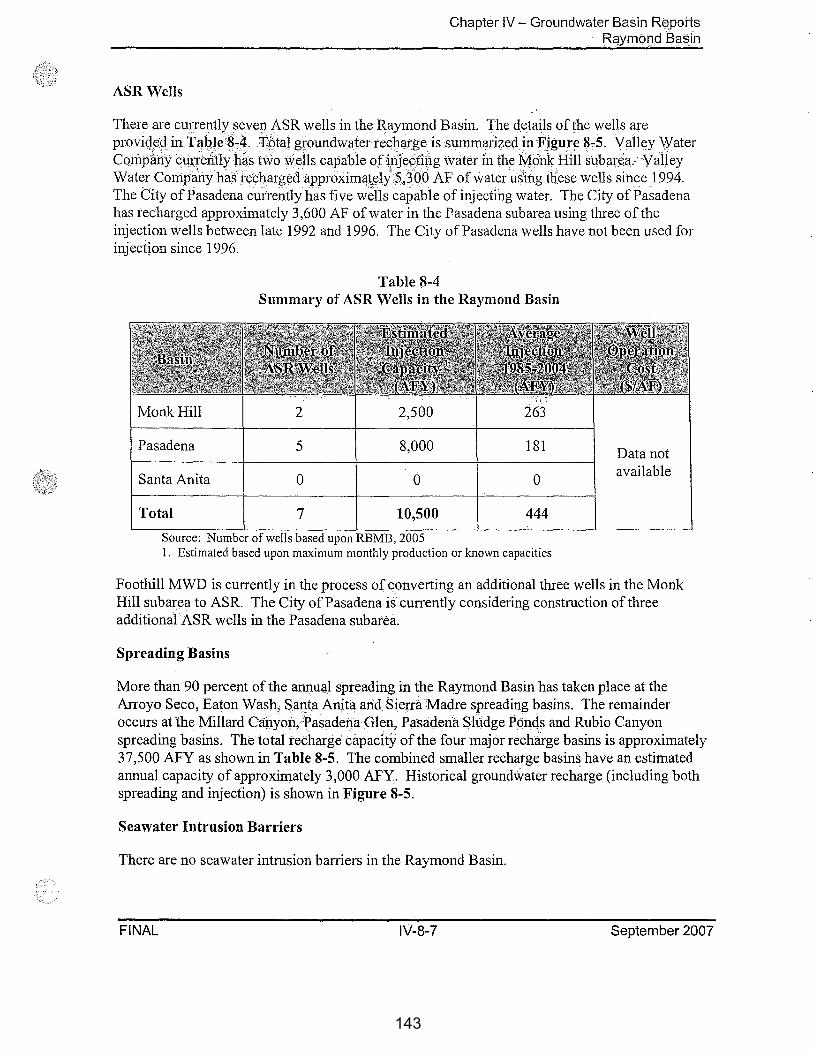
Chapter IV~ Groundwater Basin R$pbrts Raymb!]d Basin
ASR Wells
There are cunently seve!l ASR wells in the Raymond Basin. The details of the wells are provig~din T~bk:8~4. T9ta1groundwater rech<rr;ge isBummarizedinFigure 8,.5. Vall~y Water Conip~riy ctt;-:retrfly has two wells capable ofi,nje¢#fig water in the :M;o"hk Hill ~ubprea.' Valley Water Coinpa11y has i'echarg~d approximate1y'5,3QO AF of water us'rng these wells since 1994. The City of Pasadena cmTently h.as five w~lls capable of injecting water. The City of Pasadena has recharged approximately 3,600 AF of water in the Pasadena subarea using three of the injection wells between late 1992 and 1996. The City of Pasadena wells have not been used for injection since 1996.
Table 8-4 Summary of ASR Wells in the Raymond Basin
Monk Hill 2 2,500 263
Pasadena 5 8,000 181 Data not
Santa Anita 0 0 0 available
Total 7 10,500 444
Source: Number of wells based upon RBMB, 2005 1. Estimated based upon maximum monthly production or known capacities
Foothill MWD is currently in the process of convertifig an additional three wells in the Monk Hill subarea to ASR. The City of Pasadena is cunently considering construction of three additional ASR wells in the Pasadena subarea.
Spreading Basins
More than 90 percent of the annual spreading in the Raymond Basin has taken place at the Arroyo Seco, Eaton Wash, Santa Anita and Siena Madre spreading basins. The remainder occurs at the Millard Cahyon,'Pasctdetia Glen, Pasadena Shidge Ponds and Rubio Canyon spreadifig basifis. The total recharge capacity of the four major recharge basins is approximately 37,500 AFY as shown in Table 8-5. The combined smaller recharge basins have an estimated annual capacity of approximately 3,000 AFY. Historical groundwater recharge (including both spreading and injection) is shown in Figure 8-5.
Seawater Intrusion Barriers
There are no seawater intrusion barriers in the Raymond Basin.
FINAL IV-8-7 September 2007
143
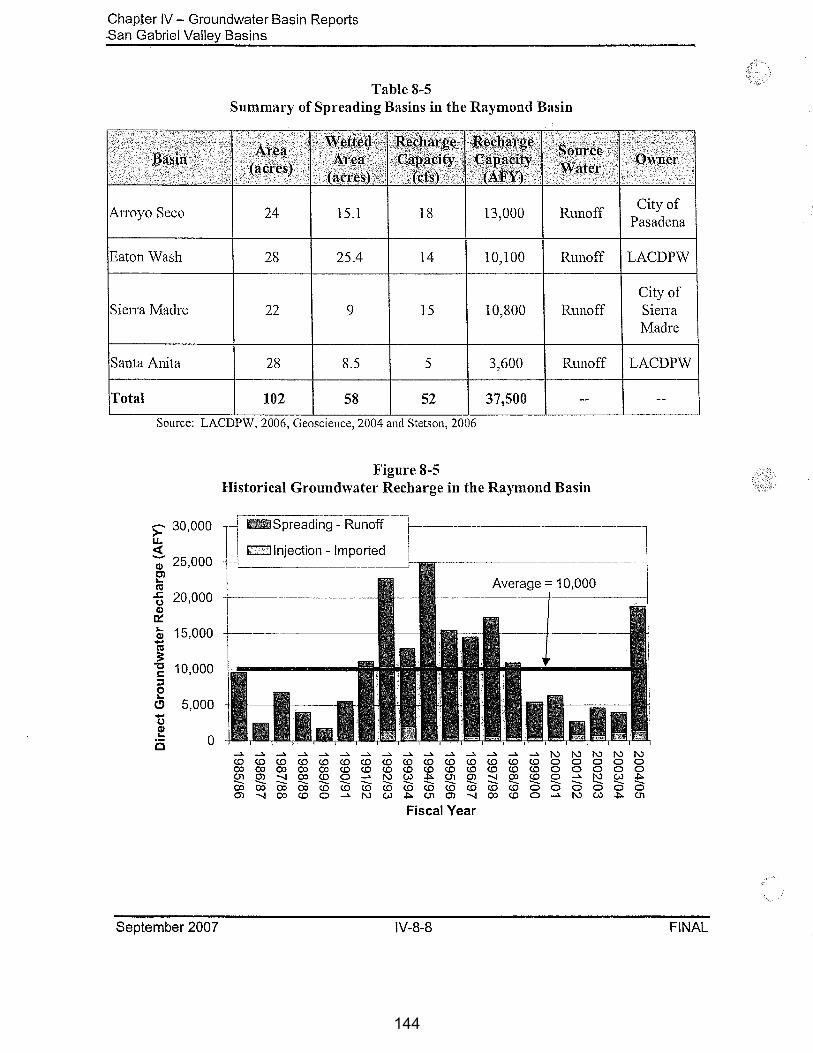
Chapter IV- Groundwater Basin Reports San Gabriel Valley Basins
Table 8-5 Summary of Spreading Basins in the Raymond Basin
Anaya Seco 24 15.1 18 13,000 Runoff
Eaton Wash 28 25.4 14 10,100 Runoff
Siena Madre 22 9 15 10,800 Runoff
Santa Anita 28 8.5 5 3,600 Runoff
Total 102 58 52 37,500
Source: LACDPW, 2006, Geoscience, 2004 and Stetson, 2006
Figure 8-5 Historical Groundwater Recharge in the Raymond Basin
s:- 30,000 u. <( --; 25,000 E' ~
-8 20,000 Ill
0::: 1-Ill .... ~
3: "C s:: :::s 0 1-(!) .... (J Ill 1-c
15,000
10,000
5,000
0
September 2007
IIBii!Spreading- Runoff
I k "I Injection - Imported ' !
-" -" -" -" -" -" -" <0 <0 <0 <0 <0 <0 <0 <0 co co co co co <0 <0 <0 01 (j) -..J co <0 0 -" N -- -- -- -- -- -- -- --co co co co <0 <0 c.o c.o (j) -..J co <0 0 -" N (...)
Average = 10,000
-" -" -" -" _.. ...>. N N N <0 c.o c.o c.o c.o c.o c.o 0 0 0 c.o c.o c.o c.o c.o <0 c.o 0 0 0 (...) ~ 01 (j) -..J co c.o 0 -" N -- -- -- -- -- -- -- -- --<0 c.o c.o <0 <0 c.o 0 0 0 0 .j:>. 01 (j) -..J co c.o 0 ...>. N (...)
Fiscal Year
IV-8-8
City of Pasadena
LACDPW
City of Siena Madre
LACDPW
N N 0 0 0 0 (...) .j:>. -- --0 0 .j:>. (J1
FINAL
144
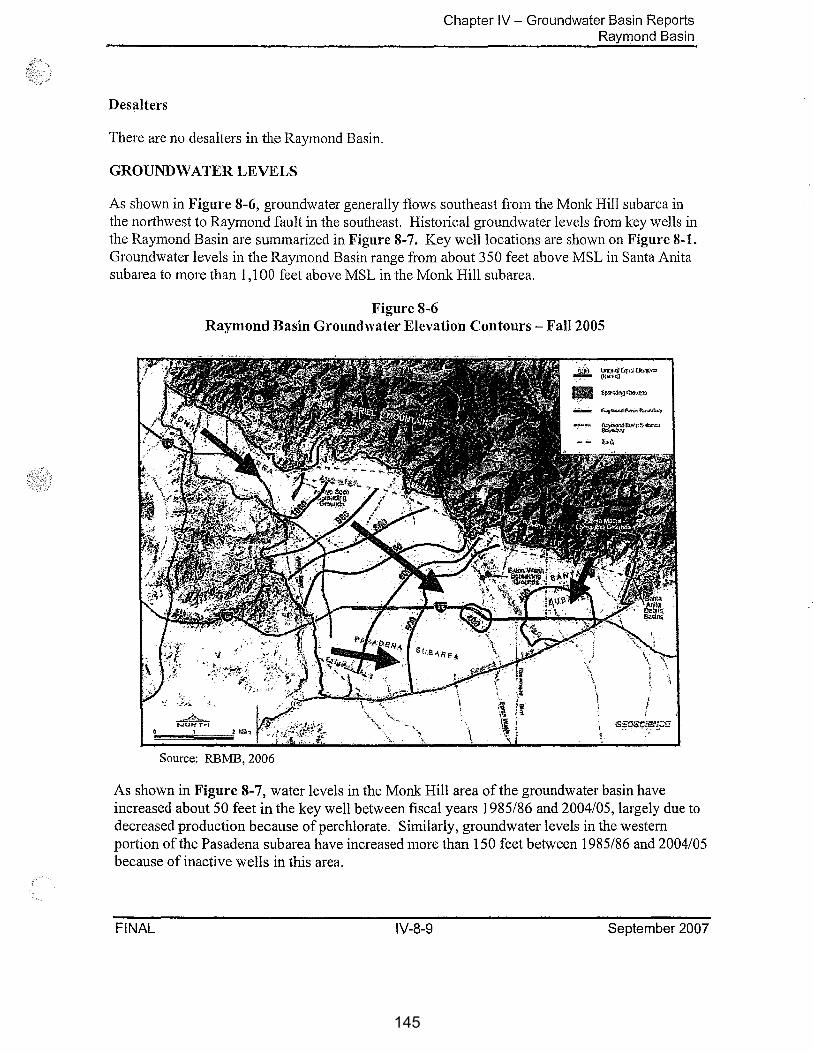
Desalters
There are no desalters in the Raymond Basin.
GROUND\VATER LEVELS
Chapter IV- Groundwater Basin Reports Raymond Basin
As shown in Figure 8-6, groundwater generally flows southeast from the Monk Hill subarea in the northwest to Raymond fault in the southeast. Historical groundwater levels from key wells in the Raymond Basin are summarized in Figure 8-7. Key well locations are shown on Figure 8-1. Groundwater levels in the Raymond Basin range from about 350 feet above MSL in Santa Anita subarea to more than 1,1 00 feet above MSL in the Monk Hill subarea.
Figure 8-6 Raymond Basin Groundwater Elevation Contours -Fall 2005
~ NOF:.'T""f
.1
Source: RBMB, 2006
(
G¥QSr;J!Jf:£CO:
As shown in Figure 8-7, water levels in the Monk Hill area of the groundwater basin have increased about 50 feet in the key well between fiscal years 1985/86 and 2004/05, largely due to decreased production because of perchlorate. Similarly, groundwater levels in the western portion of the Pasadena subarea have increased more than 150 feet between 1985/86 and 2004/05 because of inactive wells in this area.
FINAL IV-8-9 September 2007
145

Chapter IV- Groundwater Basin Reports San Gabriel Valley Basins
As shown in Figure 8-7, groundwater levels in the southeastem pmtion of the Pasadena subarea and the Santa Anita subarea have decreased substantially in the past 10 years. Water levels have decreased as much as 14 feet per year in these p01tions of the basin. Some \vclls in the Santa Anita subbasin have lost production because of low \Vater levels. Thee data are consistent with the decline in storage estimates discussed previously.
Figure 8-7 Historical Water Levels in the Raymond Basin
...>. ..... ..... ->. ->. ->. ->. ->. ...>. ...>. ->. ...>. "' "' "' N N (0 (0 <.o (0 <.o <.o (0 <.o <.o <.o <.o <.o <.o <.o (0 0 0 0 0 0 ();) ();) ();) ();) ();) <.o (0 <.o <.o <.o <.o <.o <.o <.o <.o 0 0 0 0 0 01 (j) -...j ();) <.o 0 ...>. "' (JJ ~ 01 (j) -...j ();) <.o 0 -" N (JJ ~
Fiscal Year
GROUNDWATER QUALITY
Groundwater quality in the Raymond Basin is generally good to fair in most areas. Groundwater concentrations of total dissolved solids (TDS) typically range from 350 to 700 mg/L in the central and southern portions of the Pasadena subarea and in the Monk Hill subarea (Geoscience, 2004). Along the mountains in Sierra Madre in the Santa Anita subbasin, concentrations ofTDS are generally below 300 mg/L. Further south in the Santa Anita subbasin, TDS concentrations are above 300 mg/L (Geoscience, 2004).
Groundwater Quality Monitoring
Groundwater quality samples are collected from active production wells within the Raymond Basin in accordance with California DHS requirements as specified in Title 22 of the California Code of Regulations. No basin-wide monitoring program has been established.
September 2007 IV-8-10 FINAL
146

Groundwater Contaminants
Chapter IV- Groundwater Basin Reports RayiJlbnd f?asin
As summarized in Table 8-6, the primmy co11tC:J.minants of concem in the Raymond Basin include: nitrate, per~hlorate, and VOCs (specifiGally chlorinated solvents PCE and TCE). The wells impacted by these constituents are provided in Figure 8-8.
Table 8-6 Summary of Constituents of Concern in the Raymond Basin
TDS Secondary MCL = 500
Nitrate (as N) MCL=10
VOCs (TCE and PCE) TCEMCL=5 PCE MCL = 5
Perchlorate
Notification level= 6
mg/L
mg/L
Jlg/L
Source: Geoscience, 2004
Less than 300 to 730
ND to 16
ND to 9 for TCE ND to 17 for PCE
ND to 26
Concentrations 350 to 730 mg/L ih the central and southem pmtions of the Pasadena subarea and in the Monk Hill subarea. Along the mountains in the ~,anta Anita subarea, cop.ceiitratiohs are
less. . . . . are highest in the
shallow areas below fmmer agricultural areCJ.S in M9nk Hill and in the southeastern portion of the Pasadena unit. Twelve well§ have had concentrations above the MCL of10 PCE a1;1d TCE have been detected above the MCL in 7 wells in Monk Hill, southeastem Pasadena and in Santa Anita. Treatment for PCE and TCE is online in Monk Hill. Seven wells along the are currently offline or limited in production because of perchlorate. Treatment for
is online in Monk Hill.
Various wells throughout the basin have been impacted by nitrate, a result of historical agricultural practices and septic tank effluent. Most of the higher concentrations of nitrate are found in the shallower portions of the Raymond Basin. Nitrate concentrations are highest in the shallow areas below former agricultural areas in Monk Hill and in the southeastem portion of the Pasadena unit. Twelve wells have had nitrate (as N) concentrations above the MCL of 10 mg/L (Geoscience, 2004).
In the 1940s and 1950s, liquid wastes from materials used at JPL were disposed of into seepage pits, a practice common at that time. While these disposal practices were discontinued by the early 1960s, some chemicals, such as perchlorate and volatile organic compounds, have been found in groundwater beneath JPL and in areas adjacent to JPL, to the east and southeast. In
FINAL IV-8-11 September 2007
147

Chapter IV- Groundwater Basin Reports San Gabriel Valley Basins
1992, the JPL site was characterized as a Superfund site. Cleanup ofVOCs and perchlorate have been ongoing. PCE and TCE have been detected above the MCL for TCE and PCE in seven wells in Monk Hill, southeastem Pasadena and in Santa Anita. Treatment for PCE and TCE is online in Monk Hill. Seven wells within the Monk Hill and Pasadena subareas along the Anoyo Seco are cunently inactive because of perchlorate.
Figure 8-8 Locations of Water Quality Issues in the Raymond Basin
Legend
* Nitrate above 1 0 mg/L
• Perchlorate allove 6 ppb
Q TCE-PCE above 5 ppb
Source: Geoscience, 2006
Blending Needs
0 0.5 1 4 ••c•K:J-.. ===--•Miles
2 3
Some wells in the Monk Hill subarea must be blended with imported water from Metropolitan to meet the nitrate MCL. The historical injection program has decreased the nitrate concentrations in the groundwater produced, allowing for less blending.
Groundwater Treatment
The City of Pasadena, Lincoln Avenue Water Company and Valley Water Company have installed wellhead treatment for VOC and perchlorate removal in Monk Hill (RBMB, 2005). In July 2004, Lincoln A venue Water Company completed construction of a 2,000 gpm treatment plant for VOCs and perchlorate. About 1,940 AF has been treated to date (RBMB, 2005). JPL
September 2007 IV-8-12 FINAL
148

Chapter IV- Groundwater Basin Re,ports Raymopd Basin
and the City of Pasadena are cunently planning to constmct another 10 MGD capacity treatment facility to treat the City ofPasadena's wells in the Arroyo Seco area. The cunent groundwater treatment facilities are listed in Table 8-'7.
Table 8..:7 Summary of Groundwl;).ter Treatment in the Raymond Basin
2
2
4 (proposed)
GAC
Liquid phase GAC
VOCs, Perchlorate
VOCs
VOCs, Perchlorate
Source:JPL, 2006 and RBMB, 2005
ND
ND
ND
CURRENTGROUNDWATERSTORAGEPROGRAMS
Data not available
Data not available
$517
Data not available
6,000
In 2003, the RBMB approved a 9,000 AF conjunctive use program between Foothill MWD and Metropolitan. Under this program, up to 9,000 AF of imported water from Metropolitan would be stored by Foothill MWD agencies in the Monk Hill subarea via injection or in-lieu methods. Upon Metropolitan's call in the future, up to 3,000 AFY could be extracted. To date, approximately 2,940 AF has been stored under this program.
Metropolitan, Foothill MWD and the City of Pasadena are cunently considering a similar conjunctive use program of up to 66,000 AF in the Pasadena subarea. In January 2006, the RBMB adopted a resolution of support for this program.
BASIN MANAGEMENT CONSIDERATIONS
Basin management considerations include the following:
• The Raymond Basin is adjudicated and annual production is restricted to the adjudicated rights. In addition, since 1992 use oflong-term storage space in the basin is subject to approval by the RBMB.
• Perchlorate, VOC and nitrate contamination could limit the ability to store and extract water.
FINAL IV-8-13 September 2007
149

Chapter IV- Groundwater Basin Reports San Gabriel Valley Basins
• Treated imported water from Metropolitan is available for storage from Metropolitan's Upper Feeder (a blend of Colorado River and State Water Project sources from Metropolitan's Weymouth plant). The Regional Board has established specific water quality objectives for the Raymond Basin for TDS, chloride, sulfate and boron. Imported water via the Upper Feeder does not always meet these water quality objectives. Therefore, direct recharge via spreading and/or injection could be limited.
• There has been a significant loss in storage in the Raymond Basin since 1985. The RBMB is currently investigating options to address this issue.
September 2007 IV-8-14 FINAL
150

References:
Chapter IV- Groundwater Basin Reports Raymond Basin
Geoscience Suppmi Services, Inc (Geoscience)., 2004. Baseline Ground Water Assessment of the Raymond Basin- Final Report. February 2, 2004. Prepared for the Raymond Basin Management Board.
Geoscience Support Services, Inc. (Geoscience), 2005. Technical Memorandum Raymond Basin Ground Water Flow Model Predictive Simulations. September 23, 2005. Prepared for the Raymond Basin Management Board.
Geoscience Suppmi Services, Inc. (Geoscience), 2006. GIS files.
Raymond Basin Management Board.(RBMB) 1989-2006. Annual Repmis.
Stetson Engineers (Stetson), 2006. Electronic transmission of Groundwater Study Questionnaire.
JPL, 2006. Technical Memorandum Altematives Evaluation for the City of Pasadena Treatment Plant National Aeronautics and Space Administration, Jet Propulsion Laboratory, Pasadena, Califomia Accessed at: http://iplwater.nasa.gov/NMOWeb/AdminRecord/docs nonadmin/Final-Altematives-Me morandum.pdf on September 8, 2006
FINAL IV-8-15 September 2007
151

~~~~9f,~Lfl~rno2§.·· ·~1~ 9:1 ;Ar9r~~
·~·;~~·h!~i1!Jngtoil· Uorary anOJ:\ft,Gane · ... ,,. ·:·;'·< ·. ,. ,ry
l$i~6-~t9~ Irrigation D@fi?J.
La)9~.af3a lrrlgcJ;tlon District· · ·
"!-' • ..,, __
LaMflof.es Wafer coXn8~9f ·· ·· · ··
~lt~~~~G~h§ f@~.~rf~0a cemetery ASsOql~tipn
City of Pa~p.dena
RU:ti!~ G~ii~:m l~.r1Cl and W?Jerc~\ssociatigr'i
$aJ,l q~,Qri~l CO\.fntY W*erolsf~i<?t ·
Qityt;if ~fer(a Madre
Mo~y§tQpe Y\fater Qompany
. V~fig~l Water Company
· ~JhAMY ·c, ~~rnpiello ExecUtiVe Officer RayTflond Basi~ Management Board
TZ:klg
725 North Azusa Avenue o Azusa, CA 91702 • 626.815.1300 • Fax 626.815.1303 http://www.raymondbasin.org
152

Map Projection. UfMZone !J,NAD27 ~ira! Meridian: ·117 degrees
(I) Faults (black) from: CaEfomiaDivision of Mines and Geology (CDMG) "Geologic Map of California- Los Angeles Sheet". Scale 1:250,000. (1969).
(2) Faults (dark purple) from California Department of Water Resour= (CDWR) "Technical filformation Record 1335-7-A-1." (Oct 1969).
GIS_proj\rnymond_basin\rbrnb __ task_b_exec_sum_2-04.apr
153

Y¥0NO BASIN MANAGEl\1ENT BOAliD
Msp Projection: UTMZ<iire l!, NAD27 Cen!Il!l Meridian: -117 degrees
(l) Faults (black) from: California Division of Mines and Geology (l'DMG) "Geologic Map of California- Los Angeles Sheet''. Scale I :250,000. (1969).
(2) Faults (dark purple) from California Department of Water Resources (CDWR) "Technical Information Record 1335-7-A-1." (Ocl 1969).
154
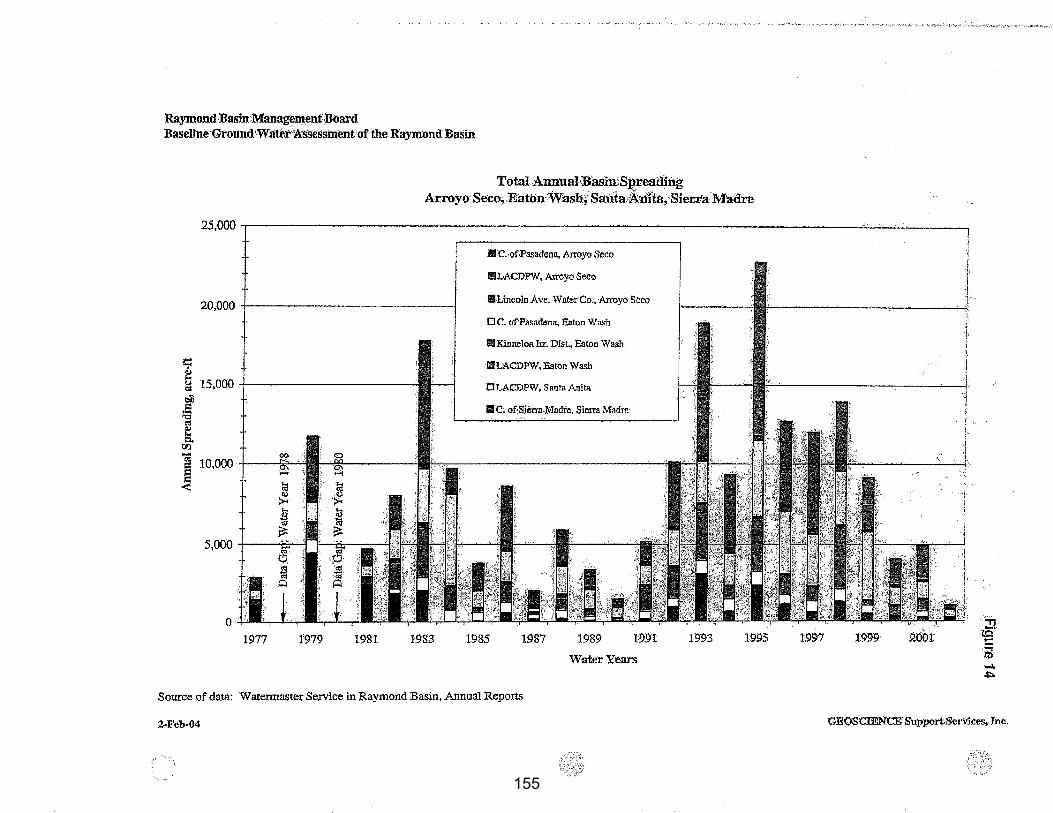
Raymond Basin'Management•Board BaseiJne·Ground·Wnter'l!\'sSessment of:the Raymond Basin
Totai.Annuai·Bssin;Spreadi:ng Arroyo Seco, Eaton Wash, Santa;1\:iiili!t,,Sie!Ta Madre
~~ - -
20,000 +--------------1
it::
~ 15,000 -r-----------_; bil ;§ ~ a
tl)
] 10,000 I !lit 'I
5,000 I 0: ·. "f
0
1977 1979 1981 1983
llll·c. of·Pasadenn, Arroyo Seco
I!ILACDPW, Arroyo Seco
II Lincoln Ave. Water Co .• Arroyo Seco
0 C. ofPasademt; Eaton Wa~h
11!1 Kinnelon lrr. Dlst., Eaton Wash
II!ILACDPW, Eaton Wa~h
OLACDPW, Sa.n!aA.nita
II C; of:Sicrra:Madre, Sierre:Madre
1985 1987 1989 1!191
Water Yea:rs
Source of data: Watennaster Service in Raymond Basin, Annual Reports
2-Feb-04
1993 1995 1997 l99'9 !2001
. ., t,Q'. 'C
iii -.;:.. GEOSCIENCE Support.Seriices,.Ine.
155
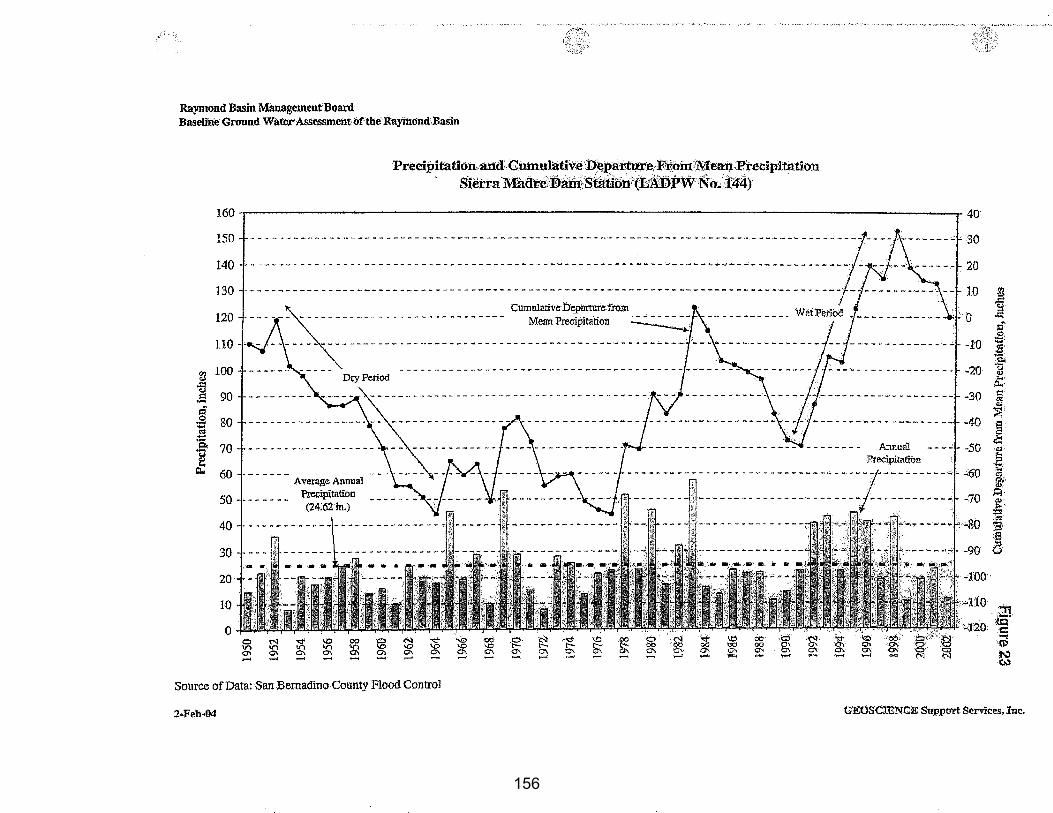
Raymond Basin Management'Board Baselin"e Ground Wat:e..r'AsSessmentofthe'Raymond,B.aSin
·Preeipitation.anl:lCumulatfve:Depa:rtutecF~Q'ill11Vfe~>Precipitation
S1erra··1ffitdteiBafu~:sfutitin{ff:1RDPW'No~ t4'4)·
160 .---------------------------------------~--------------------------------------~40
ISO
140
130
120
110
g) 100 -5
90 .s a 0 80 :;:: "' ~ 70 ..... - - - " - " - ... - - - - - - " - - -·o J: 60 ' Average Annual
Precipitation 50 l--· ---__ ~2-4~6~ in.)
40-·------
30
20
10
0
Source of Data: San Bernadino County Flood Control
2-Feb-04
-10
$fJ '5' .= :::;~
£: ~· ~~ .., t;,: ·'d re !E' E! ~ ·o.l·
E ""'' Cl· g,;.
"' t;J.
f! :;:: . .;:: ~· ;!;:[
8
.~· c: ....
··ttl
t:;
GEOSCXENCE Support S(!rvices, Inc.
156
Map Projection: UTM Zone 1 I, NAD27 Central Meridian: -117 degr~
(I) Faults (black) from; California Division of Mines and Geology (CDMG) "Geologic Map of California-Los Angeles Sheet", Scale 1:250,000. (1969).
(2) Faults (dark purple) from Califomia Department of Water Resource.~ (CDWR) "TechniCal Tnfonn:itionRccord 1335-7-A-1." (Oct 1969).
157
Map Projection. OTM Zone ll, NAD27 Central Meridian: ·117 degrees
. --···-------·~-~~----:---~------------~-~~---
(l) Faults (black) from: California Division ofM~ and Geology (CDMG) "Geoiogic Map of California· Los Angeles Sheet". Se-ale 1:250,000. (1969).
(2) Faults (dark purple) from California Department of Water Resources (CDWR) "Technical Information Record 1335-7-A-1." (Oct.1969).
. ~
. t_~ ----- ·- ' .. ,
158

4.6 Appeal from the City of San Dimas
159

Agenda Item 4.6
DATE: July 12, 2012
TO: Regional Housing Needs Assessment (RHNA) Appeals Board
FROM: Ma’Ayn Johnson, Senior Regional Planner, (213) 236-1975, [email protected] Frank Wen, Manager, Research and Analysis, (213) 236-1854, [email protected]
SUBJECT: Appeal from the City of San Dimas
EXECUTIVE DIRECTOR’S APPROVAL:
RECOMMENDED ACTION (Please Select One):
APPROVE PARTIALLY APPROVE DENY
SUMMARY OF APPEAL: The City of San Dimas requests a RHNA reduction based on their perspective of SCAG’s failure to determine the City’s share of the regional housing need in accordance with application of the adopted RHNA Methodology, the local planning factor regarding the distribution of household growth assumed for purposes of comparable Regional Transportation Plans, and changed circumstances. Because of these bases of appeal, the City of San Dimas requests a reduction of 172 units from its Draft Allocation of 463 units. STRATEGIC PLAN: This item supports SCAG’s Strategic Plan; Goal 1: Improve Regional Decision Making by Providing Leadership and Consensus Building on Key Plans and Policies; Objective a: Create and facilitate a collaborative and cooperative environment to produce forward thinking regional plans. RATIONALE FOR RECOMMENDED ACTION: Staff recommends that the RHNA Appeals Board deny the City of San Dimas’ appeal to reduce Draft Allocation by 172 units. The reasons provided by the City in its appeal are not pertinent to the application of RHNA Allocation Methodology. In addition, the City’s Draft RHNA Allocation was calculated using projected household growth from the City’s local input and included updates from the 2010 Census and 2011 Department of Finance data. Finally, per Government Code Section 65584.04(d)(3), the current RHNA Allocation cannot be compared to the prior RHNA Allocation since the Integrated Growth Forecast used in the corresponding 2008 Regional Transportation Plan is not comparable to the Integrated Forecast used in the 2012 Regional Transportation Plan.
160

Agenda Item 4.6
BACKGROUND: The following is a chronology of the events related to San Dimas’ Draft RHNA Allocation to date: 1. On July 29, 2009, an initial letter was sent from SCAG to Mr. Dan Coleman, Director of Development
Services, City of San Dimas, indicating the Draft household forecast as follows: 2008 Households 12,265 2020 Households 14,395 (2,130 increment from 2008) 2035 Households 17,807 (5,542 increment from 2008)
2. On January 27, 2010, the City’s input was received from Ms. Ann Garcia, Community Development staff, City of San Dimas, to SCAG as follows: 2008 Households 12,265 2020 Households 12,887 (622 increment from 2008, a decrease of 1,508 from SCAG’s forecast) 2035 Households 13,093 (828 increment from 2008, a decrease of 4,714 from SCAG’s forecast)
3. On May 13, 2011, an email was sent from SCAG to Mr. Dan Coleman, Director of Development Services, City of San Dimas, indicating that the growth forecast numbers were adjusted based on recently released data from the decennial Census and the California Employment Development Department. The associated table that was sent indicates that the City’s Draft household forecast was adjusted as follows:
2008 Households 12,043 2020 Households 12,647 (604 increment from 2008) 2035 Households 12,853 (810 increment from 2008)
In addition, SCAG also provided the City this additional household information in detail: 2010 Census (4/1/2010) 12,030 2011 DOF (1/1/2011) 12,031 2021 RHNA Projection Period (1/1/2014 - 10/1/2021) 12,665
4. On June 17, 2011, SCAG’s AB 2158 Survey and Housing Unit Demolition Survey were sent to the City of San Dimas for their input. The City did not return the surveys to SCAG.
5. On December 9, 2011, SCAG released the Draft RHNA Allocation Plan as part of the agenda for the RHNA Subcommittee meeting. The Draft Plan was recommended by the RHNA Subcommittee for further approval by the Community, Economic & Human Development Committee (CEHD) and the Regional Council. The CEHD and the Regional Council reviewed and approved the Draft Allocation on February 2, 2012. The Draft RHNA Allocation for the City of San Dimas is 463.
6. On January 18, 2012, Ms. Ann Garcia, Community Development staff, City of San Dimas, sent an email to Ma’Ayn Johnson regarding the RHNA Methodology. Specifically she was interested in how the previous growth forecast was factored into the RHNA Allocation. Ma’Ayn Johnson replied to Ms.
Garcia the same day and explained that 5th RHNA cycle growth was
161

Agenda Item 4.6
derived from recent local input and that the previous cycle was not a direct influence on the development of the 5th cycle.
7. On February 6, 2012, SCAG sent a letter to Mr. Blaine M. Michaelis, City Manager, City of San
Dimas, indicating the Draft RHNA Allocation for the City of San Dimas.
8. On March 15, 2012, SCAG received a RHNA revision request from Mr. Larry Stevens, Assistant City Manager, City of San Dimas, based on availability of land suitable for urban development or for conversion to residential use, lands protected from urban development under existing federal or state programs, distribution of household growth assumed for purposes of comparable Regional Transportation plans, market demand for housing, and loss of units contained in assisted housing developments. The City requested a reduction of an unspecified number of units from its Draft RHNA Allocation.
9. On April 19, 2012, the SCAG Appeals Board held a meeting to review the submitted revision requests,
including from the City of San Dimas. After the City of San Dimas presented its revision request to the Appeals Board, the Board discussed the merits of the request and the SCAG staff recommendation. After discussion, the Appeals Board voted to deny the City’s revision request for a reduction of an unspecified number of units.
10. On May 29, 2012, SCAG received a RHNA appeal from Mr. Larry Stevens, Assistant City Manager,
City of San Dimas, based on their perspective of SCAG’s failure to determine the City’s share of the regional housing need in accordance with the adopted RHNA Methodology, the planning factor regarding the distribution of household growth assumed for purposes of comparable Regional Transportation Plans, and changed circumstances The City requested a reduction of 172 units from its Draft RHNA Allocation.
Summary Table
Time Period Source/Calculation Figure 2011 Households DOF 12,031 2020 Households 5/13/11 Adjustment 12,647 2021 Households Interpolation 12,665 2011 to 2021 Projected Household Growth (10.75 years)
2021 Households – 2011 Households -or- = 12,665-12,031
634
2014 to 2021 Projected Household Growth (7.75 years)
(10.75 year growth/10.75 year period) x 7.75 year period -or- =(634/10.75) x 7.75
457
162
Agenda Item 4.6
ANALYSIS: The City of San Dimas submits an appeal and requests a RHNA reduction of 172 units based on the following: their perspective of SCAG’s failure to determine the City’s share of the regional housing need in accordance with the adopted RHNA Methodology; the planning factor regarding the distribution of household growth assumed for purposes of comparable Regional Transportation Plans; and changed circumstances. RHNA Methodology [Govt. Code Section 65584.05(d)(1)] Issue: In its appeal, the City of San Dimas argues that state law requires regional planning agencies to maintain a growth forecast within 3% of the Department of Finance (DOF) growth forecast. However there is a significant gap in population, households, and employment estimates between the 2010 Census, DOF, and SCAG’s 2012 Regional Transportation Plan (RTP). According to the City’s appeal, the SCAG 2012 RTP estimates are 10% higher in population for the City in comparison to the DOF projections. SCAG Staff Response: While not specifically cited, the City’s argument is most likely a reference to Government Code Section 65584.01, which covers the regional housing need determination process by the California Department of Housing and Community Development (HCD) in consultation with a council of government such as SCAG. The process referenced in Government Code Section 65584.01 is a determination of projected population growth on a regional level rather than on a jurisdictional level. According to this provision in the State RHNA law, if SCAG’s regional population forecast is greater than 3% of the DOF regional population forecast, HCD and SCAG must meet to discuss Methodology and seek agreement on the regional population projection. The regional determination process by HCD in consultation with SCAG occurred between June and August 2011 and culminated in SCAG’s receipt of a regional housing need determination by HCD as set forth in HCD’s letter dated August 17, 2011. Under state housing law, specifically Government Code Sections 65584.04(a) and 65584.05(a), projected housing need on a jurisdictional level is determined after this process using an adopted RHNA Allocation Methodology. No evidence has been provided by the City to indicate that SCAG failed to determine the City’s Draft RHNA Allocation in accordance with SCAG’s adopted RHNA Allocation Methodology. Thus, SCAG staff does not recommend a reduction for the City based on RHNA Allocation Methodology. Local Planning Factors Although the City indicates in its application that it is filing an appeal based on only one local planning factor, “Distribution of household growth assumed for purposes of comparable Regional Transportation Plan”, it provides the statement “We also continue to stand by our detailed information we reported during the Revision Request process with regard to 5 of the AB 2158 planning factors: [listed].” For this reason, SCAG staff will also address the other planning factors provided by the City as the basis for its revision request filed on March 15, 2012, which is attached to this report. (1) Availability of lands suitable for urban development or for conversion to residential use [Govt. Code
Section 65584.04(d)(2)(B)]
Issue: In its revision request the City explains that while “there is some vacant land remaining in the City, a large portion of the land is constrained by existing geographically unstable areas that are within the City’s boundary, steep slopes that prohibit development and utility connections…..” This particular area
encompasses approximately 500 acres and is located in the northern San
163

Agenda Item 4.6
Dimas Foothills. These physical constraints to development, the City argues, limit the City’s ability to provide housing opportunities identified by SCAG. SCAG Staff Response: Government Code Section 65584.04(d) (2) (B), requires that the consideration of the availability of land suitable for urban development must include other types of land use opportunities other than vacant land. SCAG is not permitted to limit its consideration of suitable housing sites or land suitable for urban development to a jurisdiction’s existing zoning and land use policies and restrictions. While the City may not have significant amounts of vacant land, it does not necessarily imply that the City cannot consider other opportunities for development to accommodate the growth. This includes the availability of underutilized land, opportunities for infill development and increased residential densities, or alternative zoning and density. Local growth input from the city gathered through the Integrated Growth Forecast process was incorporated into the RHNA process according to the adopted RHNA Methodology and was the basis for determining its RHNA share of future need in a manner that is consistent with state housing law requirements and prohibitions. For this reason, SCAG staff does not recommend a housing need reduction based upon this planning factor. (2) Lands protected from urban development under existing federal or state programs [Govt. Code
Section 65584.04(d)(2)(C)] Issue: The City writes in its revision request that the aforementioned northern San Dimas Foothills area is home to endangered and threatened wildlife as outlined by the California Department of Fish and Game. According to the City, it is unable to meet its projected housing need due to the land use limitations in this area of the City. SCAG Staff Response: As part of the development of the household projections through the Integrated Growth Forecasting process, SCAG staff surveyed all jurisdictions for their local input on projected household growth. The local input served as a starting point for household projections so that local planning constraints, such as protected open space, could be identified before the AB 2158 local planning factors survey and before the Draft RHNA Allocation distribution to jurisdictions. The City of San Dimas provided its input to SCAG on its household growth projection, which SCAG used for the development of the Draft RHNA Allocation. The open space in question has already been considered in the Draft RHNA Allocation. Thus, SCAG staff does not recommend a further reduction on this factor since it has already been identified by the City and, by extension, SCAG, in the development of the City’s Draft RHNA Allocation. (3) Distribution of household growth assumed for purposes of comparable Regional Transportation
Plans [Govt. Code Section 65584.04(d)(3)]
Issue: In its appeal, the City states that the current Allocation is disproportional to the RHNA Allocation that SCAG developed in 2006 [sic]. Moreover, in its revision request the City explains that it is currently conducting an inventory of greenhouse gas emissions to help develop a Climate Action Plan (CAP) in collaboration with the San Gabriel Valley Council of Governments. As part of the CAP development, the City conducted a review of its transportation emissions utilizing SCAG’s 2003 Travel Demand Model (TDM). According to the City, there are significant discrepancies of the model input data in both household and employment numbers. Because of this discrepancy, its Draft RHNA Allocation should be reduced. For example, the household estimation for the City is approximately 2,000 higher in the 2003 TDM than in the 2010 Census.
164

Agenda Item 4.6
SCAG Staff Response: While the City argues that the current Allocation is disproportional to the last RHNA cycle, the pertinent local planning factor identified is not applicable because the comparable Regional Transportation Plan (RTP) for the current RHNA cycle is different from the prior RHNA cycle. The previous RHNA Allocation used the 2007 Integrated Growth Forecast, which was used to also develop the 2008 RTP. The comparable RTP for the 2012 RHNA is the 2012 RTP and for that reason, this planning factor does not apply. With regard to the City’s revision request, the City notes there is a discrepancy between the 2003 SCAG TDM and its 5th RHNA cycle (2012 RHNA) Draft housing need. Similar to the citation of comparable Regional Transportation Plans, the 2003 SCAG TDM model is comparable to the 2001 RTP and the 2012 RHNA cycle is comparable to the 2012 RTP. Moreover, as part of the determination of household growth projection for the 2012 RHNA, SCAG used the 2010 Census data to ensure consistency between the 2012 RTP and the 2012 RHNA. Thus, for these reasons, SCAG staff does not recommend a housing need reduction based upon this planning factor. (4) Market demand for housing [Govt. Code Section 65584.04(d)(4)] Issue: The City of San Dimas contends that the lack of market demand for housing warrants a reduction in its assigned housing need. It argues that it has issued only 34 building permits between 2008 and 2011, which indicates slow building activity. Furthermore, it states that the market demand for housing is considered as a function of population and employment growth in the regional growth forecast and local input. The City cites that its population growth rate is only expected to increase 1%, while its employment rate will increase approximately 6%. SCAG Staff Response: The purpose of the Regional Housing Needs Assessment process is to identify future household need for all income categories for each jurisdiction for a projection period. Jurisdictions are required to demonstrate in their respective housing elements a sites and zoning analysis to accommodate the housing need. Jurisdictions are not penalized if these units do not get built. While permits issued document prior residential construction activity, it does not necessarily predict future development. As part of the development of the household projections through Integrated Growth Forecast process, SCAG staff surveyed all jurisdictions for their input on projected household growth. The City of San Dimas provided its input on population, household, and employment projections, which SCAG used as the basis to determine the projected housing need, and is thus consistent with the local input provided. The adjusted growth forecast, which was based on local input, projects a 5.3% annual household growth rate between 2011 and 2021. In comparison, the City’s population and employment are expected to grow at 4.7% and 8.2%, respectively. This data suggests that the population growth rate is similar to household growth rate and the employment growth rate is notably higher than the household growth rate. Considering this fact, SCAG staff does not recommend that this local planning factor serve as a justification for a reduction to the City’s assigned housing need. (5) Loss of units contained in assisted housing developments [Govt. Code Section 65584.04(d)(6)] Issue: In its revision request application, the City has identified 105 units at two assisted housing developments within the City that are at risk of conversion to market rate. The City contends that without the assistance of the Redevelopment Agency to preserve these properties, the City will have a potential loss
of affordable housing.
165
Agenda Item 4.6
SCAG Staff Response: The conversion of low income units into non-low-income units was not explicitly addressed in the development of the RHNA Allocation Methodology. As part of SCAG’s adopted Allocation Methodology for this 5th cycle RHNA, SCAG provided statistics to local jurisdictions on the potential loss of units in assisted housing developments. The loss of such units affects the proportion of affordable housing needed within a community and the region as a whole, and may signal a need to plan for additional affordable housing. However, rather than assign explicit need based on this factor, SCAG’s assessment concluded that this factor would be best addressed through a jurisdiction’s existing housing need statement included in its housing element update. This would provide local jurisdictions the discretion to adequately address the potential loss of low income units. SCAG does not recommend a reduction or an increase in the City’s assigned housing need based on this factor. Furthermore, while there are limited local, state and federal resources available for the implementation and building of housing units, particularly for affordable units, it does not preclude jurisdictions from ensuring that there are adequate sites and zoning available to accommodate the projected future housing need. Thus, SCAG staff cannot consider the costs of implementation of housing to justify a reduction in projected housing need. Changed Circumstances [Govt. Code Section 65584.05(d)(1)] Issue: In its appeal, the City contends that new DOF and 2010 Census numbers are evidence that the population, household, and employment forecasts for the City were grossly over-estimated by SCAG. To support its argument, the appeal cites a recent USC Pitkin-Myers study that examines DOF projections from 2007 against the more recent Census and DOF figures. The City writes that the new predictions differ significantly from California’s official population projections that were originally used during the RHNA cycle. Also cited are articles from the Los Angeles Times and DOF, which all indicate that future population estimates are lower than predicted. SCAG Staff Response: The recent DOF data and studies provided by the City do not refute the future housing need Allocation determined by SCAG, which was based on updated 2010 Census and 2011 DOF population and household estimates. The largest component of future housing need is projected household growth and is determined from the adopted RHNA Allocation Methodology by linear interpolation of households from a base year (2011) to a target projection period in the future, which ends on October 1, 2021. Each jurisdiction was requested to provide its local input on future household projections for target years 2020 and 2035, from which SCAG calculated a household growth increment. After the release of the 2010 Census, SCAG adjusted the base year household number by applying the differences between the DOF estimate and Census information, and readjusted projected households at target years accordingly. Similar to the incorporation of Census data, SCAG used the 2011 DOF household figure to readjust household increment between the base year and future target years. After a linear interpolation adjustment to determine households for the October 2021 target date to match the determined RHNA projection period, SCAG then calculated household growth from 2014 using linear interpolation. This adopted Methodology was used to calculate each jurisdiction’s projected household growth used as the basis and starting point for RHNA determination.
As mentioned in the Background section, the City of San Dimas provided its local input on the number of households for the 2020 and 2035 target years, which was used to determine household growth. This household growth was appropriately maintained and applied to the adjusted base years using the 2010
166

Agenda Item 4.6
Census and the latest estimate from DOF (2011). For this reason, SCAG staff does not recommend a reduction to the City’s housing need. Per SCAG’s adopted RHNA Allocation Methodology, the application of income categories is based on the 2010 Census data for income category breakdown by county median income, and then adjusted using a 110% social equity adjustment factor. The income category distribution is developed independently of household growth projections and thus cannot be adjusted by changing total projected household growth. FISCAL IMPACT: Work associated with this item is included in the current FY 12-13 General Fund Budget (13-800.0160.03: RHNA). ATTACHMENTS:
1. Appeal Application from the City of San Dimas 2. Supporting Documentation Provided by the City to Support Its Appeal 3. Revision request from San Dimas, submitted March 15, 2012
167

U.OC;IAnOtl fJf eovc•••••'•
Fifth Regional Housing Needs Assessment (RHNA) Cycle Appeal Request All op~ol r~qu~sts must b~ r~uiv~d by SCAG Moy 29, 2012, 5 p.m. Lot~ submissions will not be occ~pted.
May 29, 2012 Date: ____________ _
C Los Angeles
ounty: ------------
c Larry Stevens/Ann Garaa ontact: ------------
APPEAL AUTHORIZED BY:
City of San Dimas Jurisdiction:-----------
b . San Gabriel Valley
Su reg1on: -----------
Phone/Email: 9091392-6282 •s.aresa~l ••n·dl .. . ~· too• 1et • .,.n.~i •• , a .... =•·"· PLEASE CHECK BELOW:
0 Mayor D Chief Admonlstrattve Officer 0 Coty MaMie<
Nomo~ensF BASESF::A:
O tllalrof Other: Asst.City M County Board of SUJM!rviSOrs
IZI RHNA Methodology 121 AB 2158 Factors (See Government Code Section 65584.04(d))
0 Existing or projected jobs-housing balance 0 Sewer or water infrastructure constraints for additional development 0 Availability of land suitable for urban development or for conversion to residentia l use 0 Lands protected from urban development under existing federal or state programs 0 County pohcJes to preserve prime agricultural land IZI Distribution of household growth assumed for purposes of comparable Regional Transportation
Plans 0 Market demand for housing 0 County-city agreements to direct growth toward incorporated areas of County 0 Loss of units contained in assisted housing developments 0 High housing cost burdens 0 Housing needs of fclrmworkers 0 Housing needs generated by the presence of a university campus with1n a jurisdiction
0 Changed Circumstances
Brief Description of Appeal Request and Desired Outcome:
The City believes that there is a need for a reduction based on new information that was not available previously. During this 5th cycle allocation, we are asking for our allocation to be reduced to 291 from 463. This is due to the new DOF, Census and recent studies that show that the population, household, and employment numbers show a decrease In growth from the previous estimates.
List of Supporting Documentation, by Title and Number of Pages:
1. Appeal Letter ( 2 pages) 5. DOF article ( 1 page)
2. City Spreadsheets ( 3 pages) 6. LA nmes article ( 2 pages)
3. City Charts (3 pages) 7. USC Pitkin & Myers Report- April2012 (49 pages)
• Per Government Code Section 65584.0S(d), appeals to the draft RHNA Allocation Plan can only be made by jurisdictions that have previously filed a revision request and do not accept the revision request findings made by SCAG, except for appeals based on RHNA methodology and changed circumstances.
FOR STAFF USE ONLY: Date, _______ _ Hearing Date: - -------- Planner:-------
168
City of San Dimas
Appeals Letter
{2 pages)
Outcome Request
169

Appeals Request Fifth Cycle Regional Housing Needs Assessment
Submitted by: City of San Dimas Contact: Larry Stevens, Assistant City Manager- Community Development May 28,2012
Requested Outcome: RHNA Allocation Reduced to 291
To the RHNA Appeals Board:
As you may be aware, over the past several years the City of San Dimas has taken great interest in SCAG's preparation of the region's growth forecast and its relationship to the Regional Housing Needs Assessment (RHNA). The City appreciates SCAG's efforts in working with local jurisdictions and giving us the opportunity to comment on the Draft RHNA numbers and methodology. The City applied to the SCAG Board during the Revision Request process and was denied a revision. After reviewing new estimates and forecasting numbers that have become available through DOF we are filing an Appeal for reconciliation of our a llocation.
Upon reviewing SCAG's Draft RHNA allocation, the City believes that there is a need for a reduction. The need is based on new information from DOF and reports that were not available previously. To understand the differences we compared regionally SCAGs numbers with DOF's. We also continue to stand by our detailed information we reported during the Revision Request process with regards to 5 of the AB2158 planning factors: 2b, 2c, 3, 4, 6, and the fact that the current allocation is disproportional to the RHNA allocation that SCAG developed in 2006. While the City's request may seem to be insignificant when considering the magnitude of the RHNA allocation region wide, it is imperative for a small City such as San Dimas to ensure that its projected need is as accurate as possible as it has a direct relationship to the City's efforts in development.
State law requires regional planning agencies to maintain a growth forecast within 3% of the DOF growth forecast. There is a significant gap in population, households and employment estimates between the Census Bureau, CA DOF and the numbers used in SCAG's RTP 2012. According to their numbers, the SCAG RTP 2012 estimates are 10% higher in population for the City of San Dimas (City Spreadsheets). The DOF and the Census are both showing a negative growth averaging from 3 to 5% in all three planning categories: population, households and employments.
170

There are a few reputable planning sources that are all saying the same thing - slow growth patterns are expected to continue into the future.
• The Census 2010, DOF and the USC Pitkin-Myers numbers comparison show approximately 5% difference between the estimates. The new predictions differ significantly from California's official population projections that were originally used during the RHNA cycle. The previous numbers show that the state's population by 2020 would reach 44 million, a level, USC's researchers now say will not be attained until 2028. (USC Report-April 2012_Page iii)
• "Bill Schooling, chief of demographics research for the state department of finance, praised the USC report and said his staff, too, is working on a new set of population figures, which he says will be lower than its previous estimates" (LA Times article - April 25, 2012).
• "The slower population growth pattern experienced in the last decade is expected to continue into the future. Between 2010 and 2035, the annual population growth rate will be only 0.9 percent, which is lower than the growth rate for the past 20 years. The region will grow mainly through natural increase" (SCAG RTP 2012 Growth Forecast-page 13).
• "The most recent DOF forecast was issued in 2007 and projected the state population at 59.5 million in 2050. Last week DOF released a new projection that estimates a population of 51 million in 2050." This is 15% less in population. (DOF article-May 11 , 2012)
We are asking for reconciliation because of the significant difference in population projections between SCAG and DOF during the RHNA process. We are asking for our City's allocation number to be decreased by 37% to 291 (City Spreadsheets). This request is due to in part as reconciliation from the 2006 RHNA Forecast that was assigned to the City of San Dimas and a negative growth rate of 5% estimated from DOF and the Census. With the new DOF and Census 2010 numbers, it is evident that the numbers was grossly over-estimated (City Charts) . The forecast showed the City was expected to grow approximately 43% in population, 44% in households, and 1 0% in employment, from 2008 to 2020, when in actuality, the Census showed that in 2010, the population was a negative 22% of what was estimated.
During this 51h cycle allocation, we are asking for our allocation to be reduced by 37% to
291 from 463. This is due to the new DOF, Census and recent studies that show that the population, household, and employment numbers show a decrease in growth (City Spreadsheets).
171

City of San Dimas
Spreadsheets
(3 pages)
(Shows all SCAG planning documents and estimates for Population, Households, and
Employment for the City.)
172
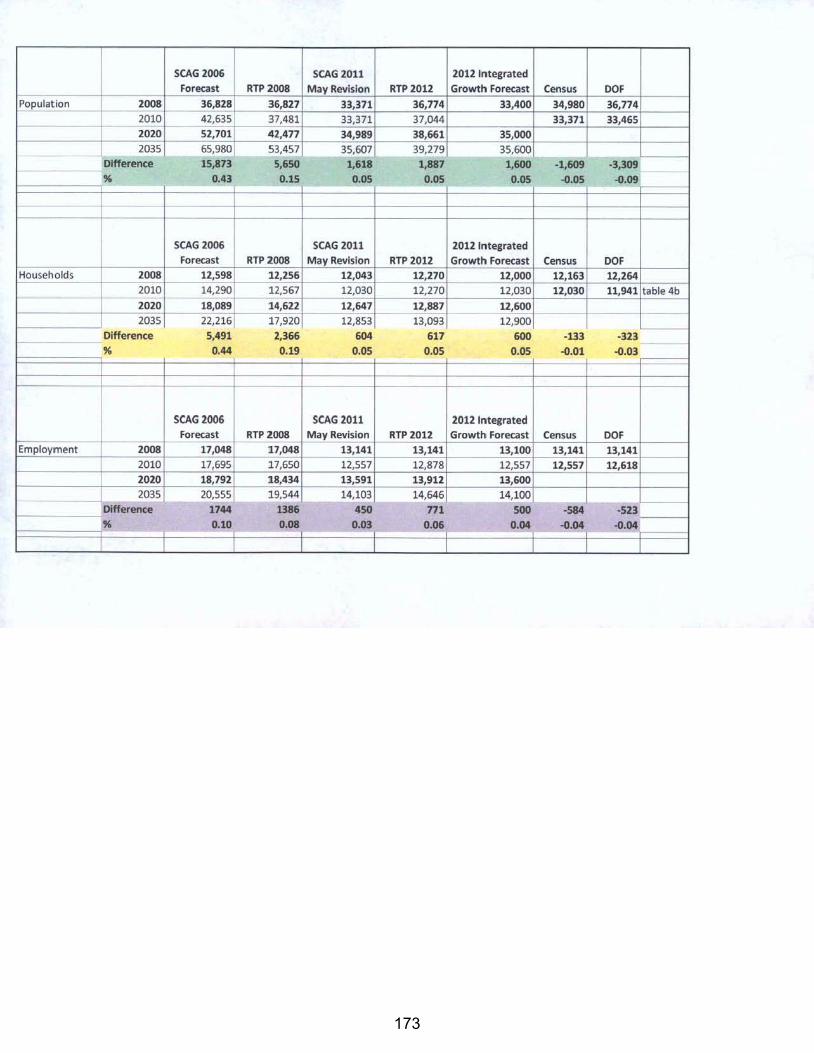
SCAG2006 SCAG2011 2012 Integrated Forecast RTP 2008 May Revision RTP2012 Growtl'l Forecast Census DOF
Population 2003 36,828 36,827 33,371 36,774 33,400 34,980 36,774 2010 42,635 37,481 33,371 37,044 33,371 33,465 20201 52,701 42,477 34,989 38,661 35,000 2035 65,980 53,457 35,607 39,279 35,600
'--Difference 15,873 5,650
- - 1,618 1,887 1,600 -1,609 -3,309
" 0.43 0.15 0.05 0.05 0.05 -0.05 -0.09
SCAG 2006 SCAG 2011 2012 Integrated Forecast RTP 2008 May Revision RTP 2012 Growtl'l Forecast Census DOF
Households 2008 12,598 12,256 12,043 12,270 12,000 12,163 12,264 2010 14,290 12,567 12,030 12,270 12,030 12,030 11,941 table 4b 2020 18,089 14,622 12,647 12,887 12,600 2035 22,216 17,920 12,853 13,093 12,900
Difference 5,491 2,366 604 617 600 -133 -323 - -
" - 0.44 0.19 -- 0.05 -~-
0.05 ~~-
0.05 -0.01 -0.03
SCAG2006 SCAG 201i 2012 Integrated Forecast RTP ZOOS May Revision RTP 2012 Growth Forecast Census DOF
Employment 2008 17,048 ll7,048 13,141 13,141 13,100 13,141 13,141 2010 17,695 17,650 12,557 12,878 12,557 12,557 12,618 2020 18,792 18,434 13,591 13,912 13,600
1-2035 20,555 19,544 14,103 14,646 14,100 --
Difference 1744 1386 450 771 500 -584 -523
" r o.1o,. O.OST" 0.03l 0.06T 0.04 -0.04~ -0.04 _l
173
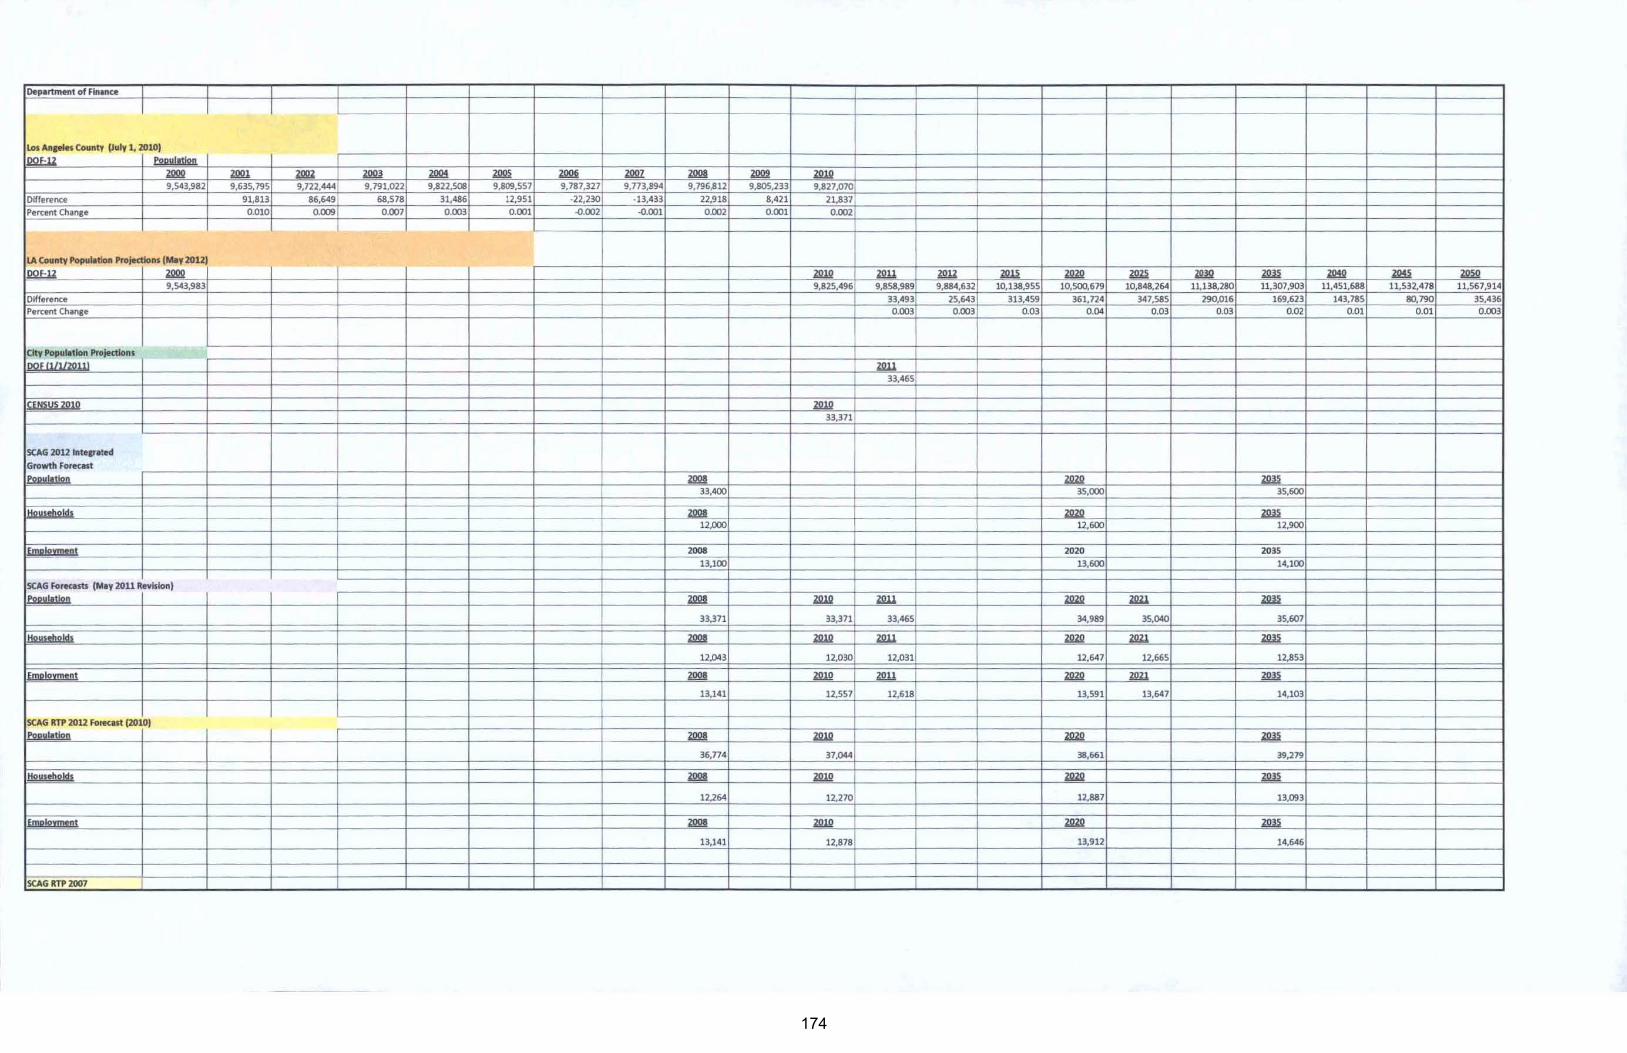
Oepa~ent ofRn•nce I I
I _I I
Los An&Ms County (July 1, 2010)
.Q2f:U esuullasls!o lll!l2 Zll!ll ~ lim Z!!2! ~ Z2!!§ ZlM!Z 4Q!!.§ Z!!22 1!U2 9,543,982 9,635,795 9,722,444 9,791,022 9,822,S08 9,809,557 9,787,327 9,773,894 9,796,812 9,805,2.33 9,827,070 I
Difference 91,813 86,649 68,578 31,486 12,951 -22,230 -13,433 22,918 8,421 21,837
Percent Change 0.010 0.009 0.007 0.003 0.001 .0.002 .0.001 0.002 0.001 0.002
_ ,_
LA County Population Pro!Ktlons (MIIy 2012)
J2Q.f:1l ~ 1!U2 .ml. m1 mi .m2 .zm m2 zm ~ ~ lli:2 9,543,983 9,825,496 9,858.989 9,884,632 10,138.955 10,500,679 10,848,264 11,138,280 11,307,903 11,451,688 11,532.478 11,567,914
Diffe re nce 33,493 25,643 313.459 361,724 347.585 290,016 169,623 143,785 80,790 35,436 Pen:ent Ch1nge 0.003 0.003 0.03 0.04 O.D3 0.03 0.02 0.01 0.01 0.003
City Populltlon Profedlons
12!2E IJ.ll/2011) m1 33,465
t£~!,!~;z!lll! 1!U2 33,371
SCAG 2012 lnte~rated
Growth FotKISt
ei!R!!IISI2D 4Q!!.§ .m2 lW 33,400 35,000 35,600
tllllll~bl!llll 4Q!!.§ .m2 lW u.ooo 12,600 12,900
2008 2020 2035 13,100 13,600 14,100
SCAG Forecasts (May 20.11 Revision)
I!I!RIIIIlii!D ~ 1!U2 m! .m2 l!!.U lW
33,371 33,371 33,465 34,989 35,040 35,607
til! IIi~ I! !!II zg 1!U2 m! .m2 ill! lW
12,043 12,030 12,031 12,647 12,665 12,853
£mRI!!:t.mr:os Z2!!l m2 m1 mil m1 1m 13.141 12,557 12,618 13,591 13,647 14,103
SCAG RTP 2012 Forec:art(2010) ""1: ·=--..::.
Z2!!l m2 mil 12» 36,774 37,044 38,661 39,279
tllllli~l!l!ll ZS!2I m2 lm ~
12.264 12,270 12,887 13,093
mll Zl!1l! Z2ZJ! lW
13,141 12,878 13,912 14,646
-SCAG RTP 2007
174
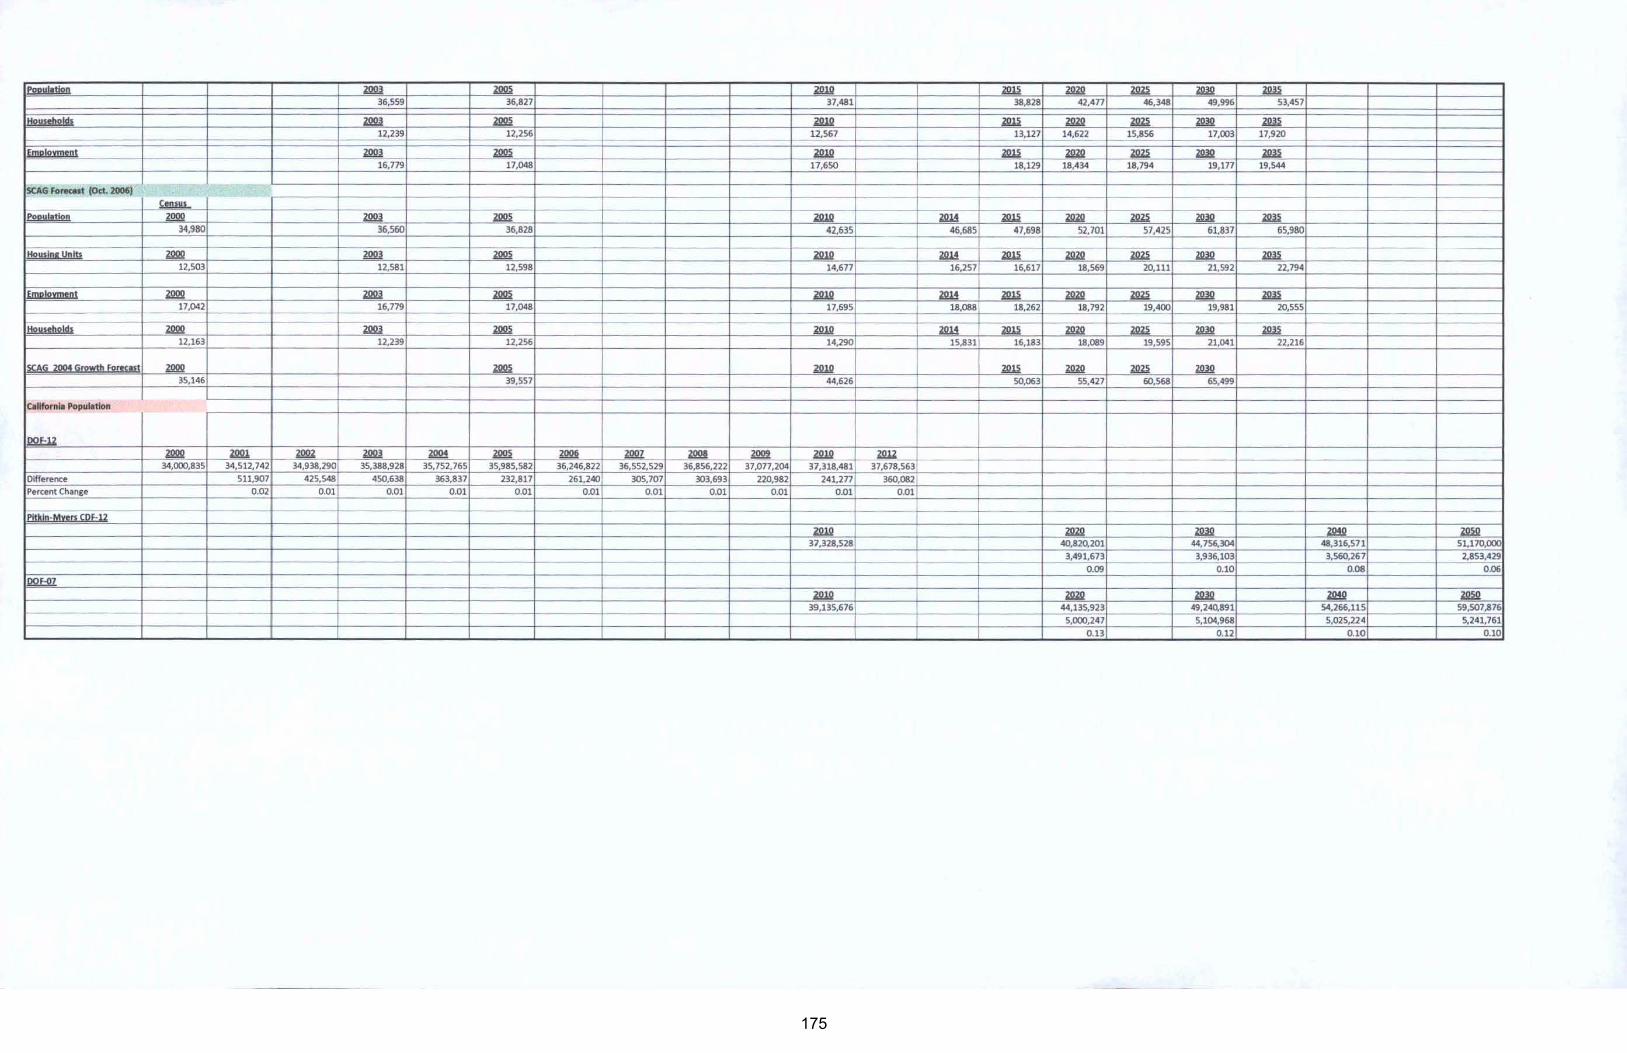
Es!RIIIIli2o mi ~ mR Z2ll m2 lm Zl!E zm 3 6,559 36,827 37.481 38,828 42,477 46,348 49,996 53.457
lil!YHbs!llll mi ~ ~ ~ ms! lm m2 zm 12,239 12,256 U,567 13,127 14,622 15,856 17,003 17,920
~!DRI2m11DS ~ ~ ~ 1m ms! lm lm ~ 16,779 17,048 17,650 18,129 18.434 18,794 19,177 19,544
SCAG Fo-.t (Oct. 2006)
~ ~ - - ·
£21!11111!2!! ~ mi .ill.!! zw ~ ~ lm ~ 1m 34,980 36,560 36,828 42,635 46,685 47,698 52,701 51,425 61,837 65,980
- - --- ---I:!!!IIIIDI !.!DI11 ~ ~ ~ 12111 ill! Z2ll ~ lm m2 1m
12,503 12,581 12,598 14,677 16,257 16,617 18,569 20,111 21,592 22,794
~!DIII2m11DS ~ Zlm ~ ~ zw ~ .ws! lm ~ ~
·-f-- 17,042 16,779 17,048 17,695 18,088 18,262 18,792 19,400 19,981 20,555 --·-c- --li!!Yicb21!11
- 1- 121!2- - · ~ ~ .ill.!! ill! ~ .m2 6m m.2 ~
12,163 12,239 12,256 14,290 15,831 16,183 18,089 19,595 21,041 22,216
~!i Z2!H !immb f2reast 12!!11 ~ 12111 ~ ZQZg lm .w!l 35,146 39,557 44,626 50,063 55,427 60,568 65,499
callfornll Populltlon
~ Z!!!1!l --_ l2Ql ~ ~- ~ ~ Zl!!!§ ~ ~ l2!!2 m2 lm 1---- - '----
34,000,835 34,512,742 34,938,290 35,388,928 35,752,765 35,98 5,582 36,246,822 36,552,529 36,856,222 37,077,204 37,318,481 37,678,563 - --·-
Oiffe~nce 511,907 425.~ 450,638 363,837 232,817 261,240 305,707 303,693 220,982 241,277 360,082 Percent Change 0.02 0.01 0,01 O.ol 0.01 0.01 0.01 0.01 O.Ql 0.01 0.0 1
-- - r- -- --·----- ---- - ·- ---- ·- -· ·----e!S~Io-M~IIl ~2E:U
m2 ~ .w!l ~ ~ 37,328,528 40,820,201 44,756,304 48,316,571 51,170,000
r----·-t--3,491,673 3,936,103 3,560,267 2.853,4 29
0.09 0.10 0.08 0.06
~ ~ ~ ~ ~ lli!!
- - --·- 39,135,676 44,135,923 49,240,891 54,266,US 59,507,876
5,000,247 5,104,968 5,025,224 5,241,761
0.13 0.12 0.10 0.10
175

City of San Dimas
Population & Household Charts
{3 pages)
{Shows all SCAG planning documents and how they are not consistent with the
Census and DOF Estimates.)
176

70,000
65,000
60,000 -
55,000
50,000
45,000
40,000
i :.: 35,000 .f
_,.,..------....;,.
30,000
25,000
20,000
15,000
10,000
5,000
0 2008
~/
City of San Dimas
Population Forecast
/_ /
L/ / / /
_,...-- /
...----:::::
2010 2020 2035
--
- SCAG 2006 Forecast
- RTP2008
- SCAG 2011 May Revision
-RTP2012
- 20121ntegrated Growth Forecast
- census
- DOF
177

23,000
22,500
22,000
21,500
21,000
20,500
20,000
19,500
19,000
18,500
18,000
~ 17,500
5 17,000 ... 16,500
16,000
15,500
15,000
14,500
14,000
13,500
13,000
12,500
12,000
11,500
/ ./
/
2008
/
City of San Dimas Households Forecast
/ /
/ 7
/ /
/ /
/ / / /
/ / / 7
/ / / /
/ v /
/ /
7 ..---::
2010 2020 2035
Year
- SCAG 2006 Forecast
- RTP2008
- SCAG 2011 May Revision
-RTP2012
- 20121ntegrated Growth Forecast
- census
DOF
178
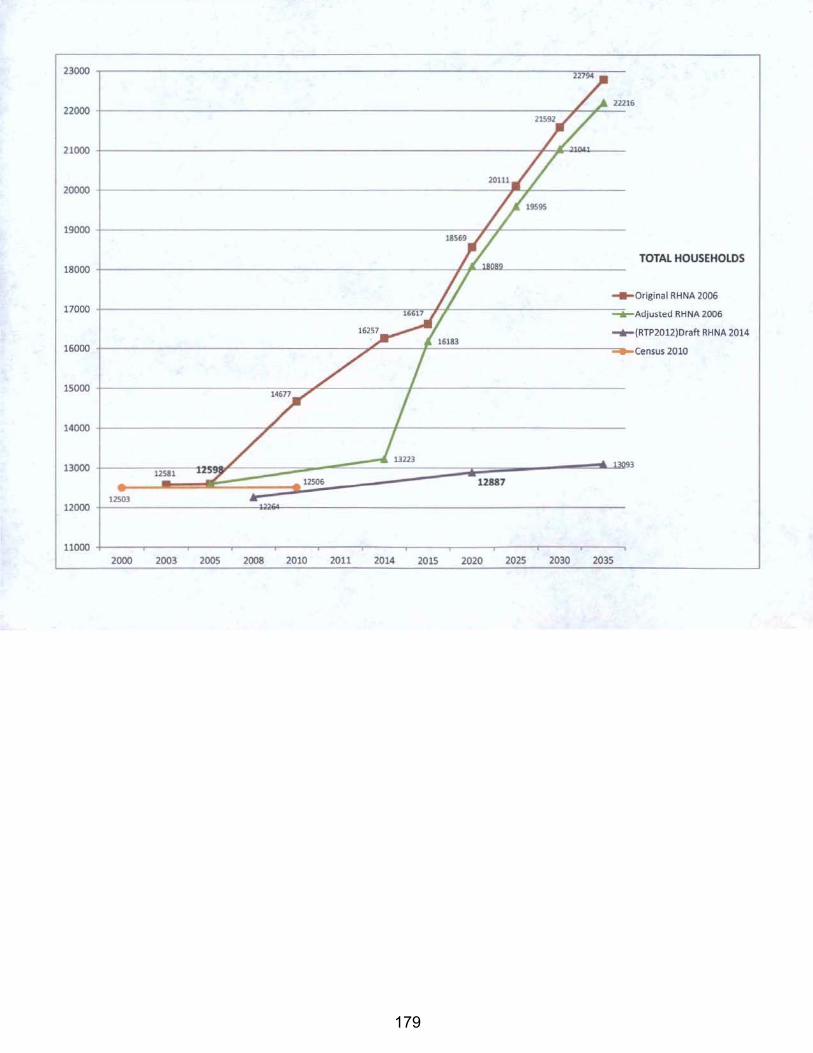
22000
20000
19000
17000 +-----------------------------------------
16000
14000
22216
TOTAL HOUSEHOLDS
---Original RHNA 2006
-.-Adjusted RHNA 2006
...,_(RTP2012)0raft RHNA 2014
------------------~census 2010
12000 +---------------------~~----------------------------------------------
E 2000 200_3 ____ 2_00_5 2008 2010 2011 2014 2015 2020 2025 2030 2035
179

DOF Article
{1 page)
California DOF revises 2050 Population Projection ..
180

FRIDAY, MAY tt, 2012
California DOF revises 2050 population projection down by 8.5 million. Huge Implications for Water, Transportation, and Budget Planning
California DOF makes the state's official population projections. The DOF forecasts have been notoriously aggressive in the past. Until this week, the most recent DOF forecast was issued in 2007 and projected the state population at 59.5 million in 2050. This week, DOF released new projections that estimate a population of 51 million in 2050.
I am pleasantly surprised by the extent of the downward revision, and very pleased to see that the State's official growth projection is now much more realistic and fits well with our own modeling. My research associate has just returned from a meeting about these projections for San Joaquin Valley counties, and came away really impressed with the improvements the DOF demographers are making to their models. Kudos to them, it will really help the state improve planning and decision making.
For example, it is critical to things like estimating future water demand, a topic near and dear to many of the readers of this blog. This 15% cut in future population projection is a big deal. That's 15% less water demand - regardless of what you assume about efficiency improvements- and 15% fewer ratepayer/ taxpayers to tap for future debt payments- whether those are revenue bonds issued to pay for conveyance or a a general obligation water bond.
Way back in 2008, the very first thing I criticized in the PPIC/ Davis analysis of the peripheral canal, was the population forecast used to estimate future urban water demand. Their model used the absurdly high figure of 65 million, when DOF's own high forecast was 59·5 million, and most private forecasters and extrapolation of U.S. Census 2040 estimates were coming in around 54-55 million in 2008. That was before the Great Recession, and I think the new DOF estimate of 51
million is pretty realistic now.
To their credit, the PPIC team has made some adjustments and they are thinking more constructively about the implications of slower growth and conservation, and I suspect some modeling of this will be evident in their new book on water economics.
181

LA Times Article
(2 pages)
California's population growth to slow in coming decades
182

latimes.com/news/local/ la-me-callfornla-growth-20120425,0,4502546.story
latimes.com
California's population growth to slow in coming decades The state will benefit from the slower but still-healthy growth rate of about 1% annually, a USC report says. The decline
will mainly stem from a sharp drop in immigration to California.
By Rebecca Trounson, Los Angeles Times
April 25, 2012
California's population will grow more slowly in the next few decades than it has in the past - and that is good for the
state's still-struggling economy, according to a new USC report.
The study projects that the state's population, now 37.3 million, will continue to increase at a healthy clip - about 1%
annually - for years to come. But at least through 2050, we are unlikely to see the boom rates of recent decades,
especially the 1980s.
''This is more manageable growth and that's good news for California," said Dowell Myers, a USC demography and urban
planning professor who co-wrote the report with colleague John Pitkin. "We're returning to a more normal rate of
growth."
The cooling pace means the state, city and county governments and other entities will have more time to prepare for a
bigger population than they did in years past, allowing for more effective planning, Myers and other experts said. That
could ensure that new roads and parks, for example, are put in areas where they are most needed and where growth is
likely to be sustained, they said.
The researchers said the slowdown will mainly stem from a sharp drop in immigration to California, part of a nationwide
trend detailed in other recent studies.
Although the slower pace of growth may be a net positive for California, it will require revisions to an array of public and
private plans, including for schools, water projects, transportation, hospitals, highways and other infrastructure.
"Those of us who've been here for a while think of California as a place that's grow, grow, grow- and go, go, go - but
this shows that we're not that anymore," Hans Johnson, a demographer with the Public Policy Institute of California, said
of the USC study released Tuesday. "We're now more typical of the rest of the nation."
Johnson noted that the brakes on California's growth were evident in the 2010 census, after which, for the first time, the
state failed to gain a new seat in Congress.
The report, the third in a series of projections by USC's Population Dynamics Research Group, predicts that California's
population will grow at less than 10% per decade for the next several decades.
In the 1980s, the state's population surged nearly 26%, adding about 6 million residents. The Increases were fueled
primarily by the booming aerospace industry and economic problems elsewhere in the country, which made the Golden
State a powerful magnet for job seekers.
183

In the 1990s, the state's growth rate fell to 14% but remained strong. It slowed further, to 10%, in the decade just
ended, the USC report shows. Myers said the continuing falloff from 2000 to 2010 may have been partly due to the
recession that began in 2008. Growth was slow even in 2005, when the economy was still strong.
The new predictions differ significantly from California's official population projections. Those show that the state's
population by 2020 would reach 44 million, a level USC's researchers now say will not be attained until 2028.
Bill Schooling, chief of demographics research for the state department of finance, praised the USC report and said his
staff, too, is working on a new set of population figures, which he says will be lower than its previous estimates.
Schooling's office is racing to produce the new estimates ahead of its regularly scheduled report because demographic
changes are so profound that state agencies urgently need fresh data to update their planning.
The USC analysis also predicts that as California's growth slows, its population will change in various ways. The state in
coming decades is expected to have more senior citirens, fewer children and more young adults. The state's immigrant
population will be more settled, with a larger share that has lived in the U.S. at least 20 years.
Each change has implications, the experts said.
The average age of the state's population, as in the nation, is rising, partly driven by the aging of the huge baby boom
generation, whose oldest members were born in 1946 and are of retirement age. The USC researchers say the number
of Californians of retirement age compared with people of prime working age {25- to 64-year-olds) will rise to 36 seniors
per 100 working-age adults in 2030. It stood at 22 to 100 in 2010.
As the boomers age, they will require more state services and that will create budget challenges, Johnson noted. Also
significant is the loss of their workforce skills to the state, he said. Baby boomers are California's most highly educated
gen1,1ration, he !>aid, with a greater share having graduated from college than younger or older age groups.
A smaller population of children in years to come means savings for the state, mainly in education costs. It could lead to
higher per capita spending for the education of those who remain, Johnson said.
The rising share of young adults age 25 to 34 in the next 20 years is good news for the state, which experienced negative
growth for that age group from 1990 to 2010, Myers said. Young adults are crucial for the state's economic growth. They
are most likely to become new workers, rent their first apartment, buy a home, have children and be first-time voters,
he said.
California's increasingly settled immigrant population means that its members are more likely than before to have
learned English, have children born in the U.S. and remain in the state, Johnson said.
"It's important for us as a state to make sure immigrants and their families are integrated into our society and are
successful, so it's really important to look to their education," he said. "The biggest challenge California faces long term
is to ensure that enough of our residents go to college, and to make sure they graduate."
Copyright © 2012, Los Angeles Times
184

USC - California Demographic Futures
Pitkin-Myers Report
{49 pages)
185

California Demographic Futures
Third In a Series of ProJecttons
GENERATIONAL PROJECTIONS OFTHE
CALIFORNIA PoPULATION BY NATIVITY AND
YEAR OF IMMIGRANT ARRIVAL
PopDynamics Research Group
usc Price Sol Price School of Public Policy
Jou~ Prna~ DowEr.L MYERS
APRIL 20 12
186

Suggested citation
John Pitkin and Dowell Myers. 2012. Generational Projections of the California Population by Nativity and Year of 1 mmigrant Arrival. Produced by the Population Dynamics Research Group, Sol Price School of Public Policy, University of Southern California. Text and supporting materials are published at: http://www.usc.edu/schools/pricc/research/popdynam ics
A short descriptive title is: Pirkin-Myers 2012 California Generational Projections.
About the Series on California Demographic Futures
The first projection report in the series on California Demographic Futures was issued in 2001, followed by a second in 2005. Additional generational projections that follow this general model have been prepared for the United States and major subareas of California. This specialized program of research is conducted through the USC Population Dynamics Research Group. A number of reports and special studies have also been carried out in preparation for the 2012 series of projections and are available on the project website: http://www.usc.edu/scbools/prjce/futures
About the Authors
John Pitlcin, demographer, is a senior research associate in the Population Dynamics Research Group of the USC Price School of Public Policy. He also is President of Analysis and Forecasting, lnc., located in Cambridge, Mass. He is the principal designer of the population projection models.
Dowell Myers, a demographer and policy planner, is a professor in the USC Price School of Public Policy where he is director of the Population Dynamics Research Group. He is author of the books Analysis with Local Ctnsu.s Data and also Immigrants and Boomers: Forging a N~w Social Contract for tht' Futurt' of Amerira.
Acknowledgments
The research underlying this report on the California population projections was conducted over two years, with sponsorship by the H aynes Foundation, the MacArthur Foundation, First 5 LA, and the USC Price School of Public Policy. The authors gratefully acknowledge this support. Outstanding research assistance was provided by Michelle Decker, with contributions also from Chris Contreras, Anna Jacobsen and Ying Mao.
187
Contents
Executive Summary
1 Introduction
2 Population Growth and Racial-Ethnic Change
3 A Changing Age Structure
4 The Immigrant Population
5 Changing Origins of the Population: Fewer Immigrants and More Homegrown
6 Changes in California's W orking Age Population
7 A Composite Portrait: Putting the Pieces Together
8 Methodology and Qyestions and Answers About the Generational Population Projections
Endnotes
References
111
1
5
9
13
19
23
29
35
42
43
188
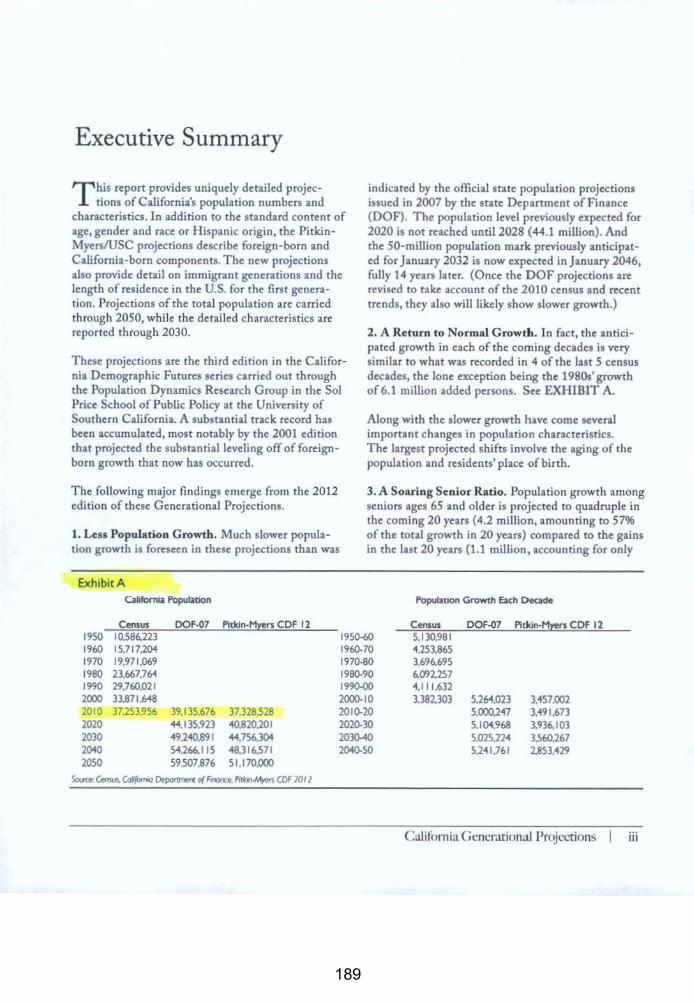
Executive Summary
T his report provides uniquely detailed projections of California's population numbers and
characteristics. In addition to the standard content of age, gender and race or Hispanic origin, the PitkinMyers/USC projections describe foreign-born and California-born components. The new projections also provide detail on immigrant generations and the length of residence in the U.S. for the first generation. Projections of the total population are carried through 2050, while the detailed characteristics are reported through 2030.
These projections are the third edition in the California Demographic Futures series carried out through the Population Dynamics Research Group in the Sol Price School of Public Policy at the University of Southern California. A substantial track record has been accumulated, most notably by the 2001 edition that projected the substantial leveling off of foreignborn growth that now has occurred.
The following major findings emerge from the 2012 edition of these Generational Projections.
1. Less Population Growth. Much slower population growth is foreseen in these projections than was
Exh1b1tA caroomia Population
Census DOF-07 Pitkin-~en CDF 12
indicated by the official state population projections issued in 2007 by the state Department of Finance (DOF). The population level previously expected for 2020 is not reached unti12028 (44.1 million). And the 50-million population mark previously anticipated for January 2032 is now expected in January 2046, fully 14 years later. (Once the DOF projections are revised to take account of the 2010 census and recent trends, they also will likely show slower growth.)
2. A Return to Normal Growth. ln fact, the anticipated growth in each of the coming decades is very similar to what was recorded in 4 of the Last 5 census decades, the lone exception being the 1980s' growth of 6.1 million added persons. See EXHIBIT A.
Along with the slower growth have come several important changes in population characteristics. The largest projected shifts involve the aging of the population and residents' place of birth.
3. A Soaring Senior Ratio. Population growth among seniors ages 65 and older is projected to quadruple in the coming 20 years (4.2 million, amounting to 57% of the total growth in 20 years) compared to the gains in the last 20 years (1.1 million, accounting for only
PopulatiOn Growth Each Decade
Census DOF..Q7 Pltkin·Mrers CDF 12 1950 10,586.223 1950-60 5.130.981 1960 15,717,204 1970 19,971.069 1980 23.667.76'1 1990 29,760,021 2000 33.871.648 2010 J'.253.956 391"35.676 7.328318 2020 44,135.923 <40.820.20 I 2030 49.240.891 44,756.304 2040 5'1.266.115 48.316.571 2050 59.507.876 51.170.000
~cCensi4Cdt{olrrio ~ o(F11l0<1Ce. p,~ CDF 1012
1960-70 197()..80 1980..90 1990-00 2000-10 2010..20 2020..30 203()..40 2040-50
4,253,865 3,696,695 6.(112..257 <4,111,632 3.382.303 5.26'1.023
5,000,247 5,104.968 5,025121 5,241,761
3.457.002 3,191,673 3,936.103 3.560.267 2.853,129
Calit(,mia Generational Projections I iii
189

15% of total growth). Driven by aging of the large baby boom generation, the ratio of seniors ages 65 and older to prime work• ng ages {25 to 64), is projected to soar to 36.0 seniors per 100 working age in 2030, compared to 21.6 in 2010, a two-thirds increase in just 20 years. The impact of the increase is amplified because it follows four decades of no change in the senior ratio.
4. Faltering Growth in Children. An opposite trend is occurring among children. Whereas children under age 18 were rapidly increasing in number between 1990 and 2010 ( + 1.6 million), in the coming 20 years (2010 to 2030) the growth of children virtually halts ( -31 thousand). Given the continued growth of the rest of the population, the share made up by children is projected to slowly decline, from 24.9% in 2010 to 20.7% in 2030.
5. Foreign-Born Share Holding Constant. The generational projections contain rich detail on nativity or place of birth not found in other population projections. The total foreign -born share of the state population has leveled off at 27% after decades of increase. Projected foreign-born shares of the total population are 27.0% in 2020 and 27.0% in 2030. (The foreign-born share stood at 8.6% in 1970, 15.1% in 1980,21.7% in 1990,26.2% in 2000, and 27.2% in 2010).
6. Longer Immigrant Settlement. The growing number of foreign-born residents in the California population includes cumulative increases in the share of long-settled immigrants. As the number of foreign born who are newcomers is declining, rhe share of the foreign-born who arc long settled (entered the U.S. 20 or more years earlier) is increasing. It is projected to rise to 62.2% of all foreign-born in 2030, compared to 45.7% in 2010 and 22.0% in 1990. Conversely, the share of foreign-born that arrived in the U.S. less than 10 years earlier is projected to fall from 27.8% in 2010 to 21.3% in 2030 compared to 50.4% in 1990.
7. Growing Majority California-Born. The 2012 edition of California Demographic Futures goes beyond previous editions to describe new detail on the number of residents who are native Californians, as opposed to residents born in other states or abroad.
iv USC PopD)namics Research Group
These homegrown sons and daughters form a rapidly growing majority of California's population. The native Californian (or homegrown) share of the state population became a majority of the population in the last decade, reaching 53.9% in 2010, and will continue to slowly rise. The homegrown share is far hlgher among children and young adults than older adults. ln 2010, over 90% of children under 10 already were homegrown, native Californians, but major increases in homegrown status are now expected among adults ages 25 to 34 (62.1% in 2030 compared to 50.6% in 2010) and for adults ages 35 to 44 (57.2% in 2030 compared to 38.5% in 2010).
8. Changing Sources of Future Wo•lc.force. Growth in California's working age population is projected to change dramatically in the coming 20 years compared to the preceding 20 years. Whereas the main working age population (ages 25 to 64) increased 4.2 million from 1990 to 2010, it is expected to grow moderately Jess (3.3 million) from 2010 to 2030. Virtually all the projected growth is comprised of native-born who are the children of immigrants {98%). Thls contrasts to the earlier growth period, when immigrants themselves accounted for 80% of the growth. In fact, in the coming period, 112% of the 3.3 million working age increase is projected to be from California-born residents (a 3.7 million increase that exceeds losses in other groups).
9. A New Recognition ofT raining Ages. Youths and young adults are technically able to be working, but those who are ages 18 to 24 more often are enrolled in extended education or training programs, or they may be serving in part-time or apprentice positions that are preparing them to join the main workforce. They are the workforce of the future. The California born already dominated growth in this age group in the last 20 years and are projected to continue to do so in the coming period as well. Latinos predominate among the homegrown population in training ages, but all racial groups contribute. Those raised in California are, of course, educated at the expense of California taxpayers and likely to remain in the state to the benefit of California businesses and other employers. And they will become future taxpay-ers themselves, as well as possible home buyers to strengthen the housing market.
190

1 Introduction
C alifornia is at the cusp of n major generational transition. The Large generation born during
the national Baby Boom in the 1940s and 1950s is beginning to leave their prime worlting ages. At the same time, a rising generation born in the California baby boom of the 1990s, many the children ofimmigrants who arrived in the 1980s and 1990s, wiiJ soon be adults and entering the workforce. The impending changes pose the state with both great opportuni-ties and urgent challenges that need to be addressed. Population projections that link the past, present and future can help people better grasp the transition that is underway.
The projections introduced in this report are termed •generational" not only because of these age changes but also because they include immigrant generations. They categorize people by their place of birth, whether in California, elsewhere in the U.S., or another country, and also whether people are secondgeneration children of foreign-born mothers. This is not information ordinarily found in population projections but it is vital for California, given that its foreign-born population and their children are so prominent. In addition, these projections include the usual age, s~. and race characteristics provided by official state and national agencies (see sidebar).
This set of projections is the third in a series with a long history of development. Previous generational projections in the California Demographic Futures series were issued for California in 2001 (Myers
and Pitkin 2001) and 2005 (Myers, Pitkin and Park 2005), both of which were posted on our website and reported in the media in California. An earlier model (Pitkin and Simmons 1996) was developed for the nation as a whole. The new projections simulate processes of demographic change forward from 2000 and are then calibrated to the 2()10 Census counts before launching into the future. They are the lat-est in a series of projections under development for well over a decade. A notable record of success has been established. The 2001 projections foresaw the leveling off of the foreign-born share of California's population before the results of the 2000 census were released and successfully projected the share later observed in 2010. In addition, a 2009 study from the research group was the first to recognize that a new homegrown majority had formed in California (Myers, Pitkin and Ramirez 2009). And, in advance of the 2010 census release, a "predictive simulation" used demographic analysis to reasonably estimate the population total for California (Pitkin and Myers 2010).
A very brief description of the method is offered here, with fuller details found in section 8, and in other sections where appropriate. The projections are made by the cohort-component method, which ages the base 2010 population forward year by year into the future, changing it according to age and sex-appropriate rates of mortality and migration to and from California, and projects births by applying fertility rates to the projected population of women
California Generational Prc~j<x.:tions I
191

rotections
Conventional population projections Nve .••
+ Generation
• Foreign-born
. Native-born second generation
• Natlve.bom third generation
+ Foreign-Born Year of Arrival in U.S.
+ Native-Born State of Birth
• C3tifomia
• Other state
of child-bearing ages. Since many of these rates vary across race and origin (nativity) groups, different sets or schedules of rates are used for the different race and origin groups. For example, fertility rates are higher for foreign than native-born women, and native Californians are less likely to migrate to other states than those who were born in other states. All of these rates are calibrated according to the changes actually observed between the censuses of 2000 and 2010. They are then projected forward according to known or expected trends in migration, fertility, and mortaHty. More information on the method of projection can also be found in "Methodology and Qyestions and Answers About the Generational Population Projections" in section 8 of this report.
Utility of the New Projections
The added detail provided by the new projections for California provides major benefits for public understanding and policy ma!Ong. All projections yield an assessment of the future total number of residents, but without the added detaiJ provided here about characteristics of California's residents, the public and policy makers alike can only speculate about
2 USC PopDynamics Re:.e.trch Group
substantia] social changes, projecting them into the future based on short-cut empirical methods, at best, or guesses or emotions, at worst.
Under the limitations of the conventional content, for example, we might know that the number of Latinos or Hispanics 1 are increasing and will soon be the majority of the state's population. But users would not know whether those added Latinos are likely to have been born in another country (and be immigrants), or whether they are likely to have been born in the United States (and be native-born). Further, users would not know how many of these new Latinos are actually California-born and whether their mothers are likely to be immigrants or native-born themselves.
All of this information is available for historical dates, up to 2011, but onJy available in projections for California in the California Demographic Futures series. W ithout explicit projections, many observers assume that all growth will come from migration by outsiders, rather than from births in California. The birth data are readily available, and births have even been projected, but the contribution to the total changes in popuJation is not known unJess this information is organized into projections.
Without projections, the public or leaders in business and government do not have a firm grasp of who will make up the workforce of the future. In the new projections, population in the working ages is categorized not only by race and Hispanic-origin but also by generation and place of birth. Based on these projections, it is now possible for the public to discuss the implications of having a future workforce the great majority of whom will be California born and raised.
It is a matter of simple logic that a new worker who will be age 25 in 2030 and California-born is age 7 in 2012 and likely in the second grade. The new worker will be educated in California schools that are paid for by California taxpayers, all for the benefit of California employers. But these same new workers of the future will aJso be new taxpayers themselves, and they might also be new home buyers who contribute to the real estate economy as well.
What is not known and a matter of demographic accounting, is how many will there be, how many will be native sons and daughters of California, and how many will come to the state from other states
192

or nations. The projections offered here help ro make the future more concrete. AJthough questions such as these about the future population can never be answered with certainty, projections that account for rhe migration, immigration, and mortality, as well as births, provide a rational source of answers and narrow the range of uncertainty about rhe stare's true demographic situation.
Projections Build on Analysis of Recent Demographic History
Projections require more than simple extrapolation of past trends. They require a detailed accounting of movements in more than 1000 subgroups, but this needs to be based on careful analysis of recent history. There is a great deal of momentum built into the current population structure, and people do grow older one year at a time, but uncertainty prevails about the amount of migration, fertility, and mortality that could reshape the population in future years. AJl of these factors have been reflected in the new projections.
As an overview, it is useful to think of California's demographic structure as being shaped by three major demographic waves.
The first wave was the well-known post-World War 11 Baby Boom, which lasted from 1946 to 1964. The number of births in California more than doubled between 1945 and 1963, giving rise to the large nativeborn Baby Boom generation. Its numbers were funher increased by migrants who moved to California from other states starting in the 1950s and continuing in later decades.
A second wave, less well known but equally important, was the migration-driven boom of the 1980-1990 decade, when California's population grew at an average annual rate of 2.5%, rwo and a half times the rate of increase in the 2000-2010 decade. Several components contribute to this overall growth, including net immigration, natural increase (i.e., the excess of births over deaths), and net domestic migration.2 Large influxes of migrants came both from other states and abroad. These new residents were mostly adults who had or sought jobs, needed and bought houses, and started families. The flows of migrants from other states ended and turned around during the deep economic recession in the early 1990s, while immigrants from other countries continued to come, although in declining numbers.3
ln a third wave, which was a direct and immediate result of the 1980-1990 wave of mignation, the state experienced a surge of binhs, a ~California baby boom,• which peaked in 1990-1991 at 610 thousand, more than 50% above the number in 1980. This boom did not last however. By 1997 the number of births had fallen to 524 thousand and has remained near that level in later years. During the 1990-2000 decade the number of births more than made up for 2.8 million migrants lost on net to other states.
Each of these large demographic waves and other past demographic events send predictable ripples forward in time, and it is their predictability that gives the projections a credibility that requires attention. Which is not to say that future demographic events, giving birth, dying, and migrating, can be foreseen with complete certainty either for individuals or groups of people. The pattern prevailing for the past century is that death rates change more slowly and therefore predictably than rates of fertility, and rates of migration, domestic and international, are more variable than both.
Going forward in time, the population in the n~ar future is more predictable with greater certainty than in the more distant future: with more time, there is more scope for demographic rates to change and for the effects of unanticipated changes to cumulate and multiply. For this reason, the report emphasizes the projections of detailed characteristics for the period 2010 to 2030 while more basic results are reported for later years.
Questions of Future Trajectories
Sections 2 to 4 of the report address common important questions about California's population.
The 2010 census delivered a major surprise to California, because its count came in well below the projections prepared by the State of California in 2007. Looking forward, a major question is how much growth to expect for the current decade and those beyond. (Section 2) Rapid changes in the racial and H ispanic composition of the population have proceeded in California at least since 1970. Given that migration patterns have shifted and birth rates have decreased, should these changes now be expected to continue at the same rate in the coming decades? (Section 2)
Califc>mia nenerationaJ Prc~jccrions 3
193

How rapidly will the aging of the giant baby boom generation shift the prevailing balance between the state's working age population and the population of seniors with entitlement benefits, most of whom wilJ be retired from the work force? (Section 3) How much will the number of children continue to grow in the future. given these changes for adults and recent dec1ines in the number of births? (Section 3) What is the future of California' large foreignborn population? Will it continue to grow through rapid immigration, and how should it be expected to change? (Section 4)
Sections 5 and 6 report the continued growth of the new homegrown, CaHfornia-born majority in the state's population, an important finding of these projections (Section 5), and projected changes in the working and "training" age populations, with major implications for the state's work force and economy (Section 6). Section 7 presents a concise, accessible overview of California's demographic structure and the ongoing generational transition, its roots in the past, the current situation, and where it is headed in the foreseeable future.
The final section of the report (Section 8) describes the projection methodology and answers common questions about the basis for the California Demographic Futures generational projections.
4 USC PopDynamics Research Group
194
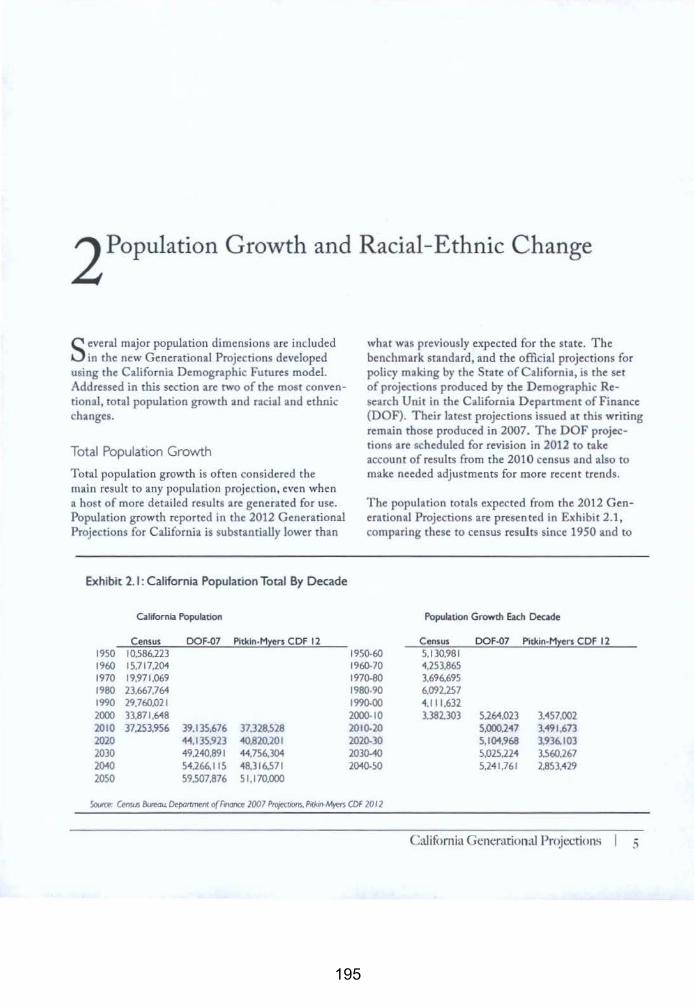
2Population Growth and Racial-Ethnic Change
Several major population dimensions arc included in the new Generational Projections developed
using the California Demographic Futures model. Addressed in this section are two of the most conventional, total population growth and racial and ethnic changes.
Total Population Growth
Total population growth is often considered the main result to any population projection, even when a host of more detailed results are generated for use. Population growth reported in the 2012 Generational Projections for California is substantially lower than
Exhibit 2. 1: California Population Total By Decade
ulifomia Populadon
Census DOF-07 Pltkln·M~ers CDF 12 1950 10.586.223 1960 15,717,201 1970 19,971.069 1980 23.667.764 1990 29.760,021 2000 33.871.648 2010 37,253,956 39.135,676 37,328.528 2020 11.135.923 10.820.201 2030 19.210.891 11,756.301 2010 51.266.115 18,316.571 2050 59.507,876 51,170,000
what was previously expected for the state. The benchmark standard, and the official projections for policy making by the State of California, is the set of projections produced by the Demographic Research Unit in the California Department of Finance (DOF). Their latest projections issued at this writing remain those produced in 2007. The DOF projections are scheduled for revision in 2012 to take account of results from the 2010 census and also to make needed adjustments for more recent trends.
The population totals expected from the 2012 Generational Projections are presented in Exhibit 2.1, comparing these to census results since 1950 and to
1950-60 1960-70 1970-80 1980-90 1990-00 2000-10 2010-20 2020-30 2030-10 2010-50
Population Growth Each Deade
Census 5,130,981 4.253,865 3.696.695 6.09l257 1,11 1.632 3.38l303
DOF-07
5,264,023 5.000.217 5.101,968 5.025.221 5.211,761
Pitkin-Myers CDF 12
3,157,002 3,191.6n 3.936.103 3.560.267 2.853.129
Souttf: Cemus &nau ~fll o{Fmrtt:e 2007 Pro:,eciJOtlS. P~ CDF 201 '1
Califomja Generarional Projections I
195
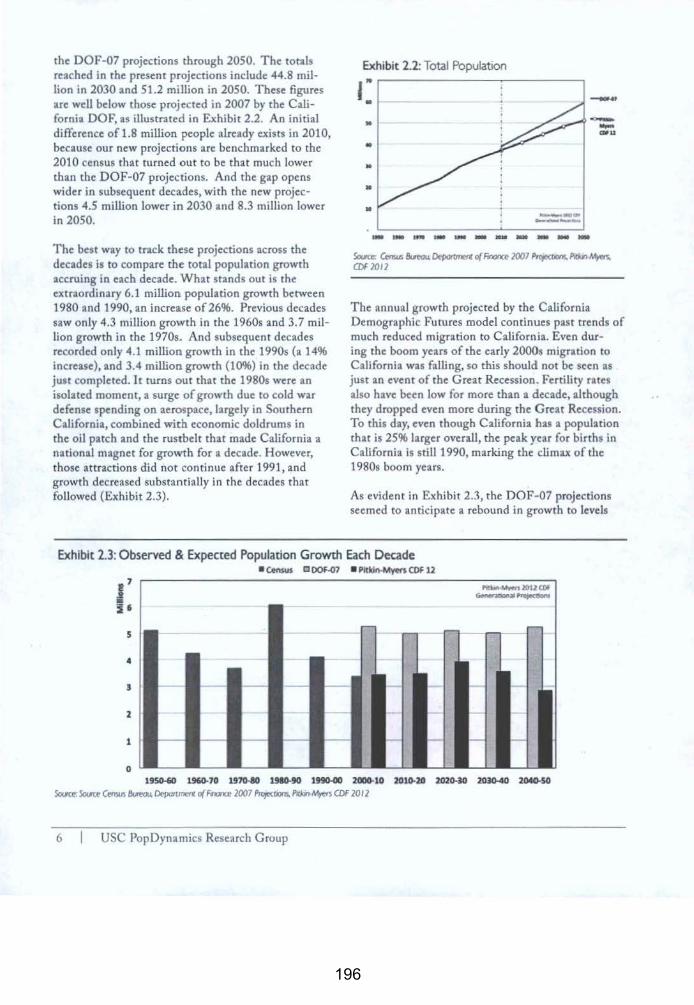
the DOF-07 projections through 2050. The totals reached in the present projections include 44.8 million in 2030 and 51.2 million in 2050. These figures arc well below those projected in 2007 by the California DOF, as illustrated in Exhibit 2.2. An initial difference of 1.8 million people already exists in 2010, because our new projections arc benchmarkcd to the 2010 census that turned out to be that much lower than the DOF-07 projections. And the gap opens wider in subsequent decades, with the new projections 4.5 million lower in 2030 and 8.3 million lower in 2050.
The best way to track these projections across the decades is to compare the total population growth accruing in each decade. What stands out is the extraordinary 6.1 million population growth between 1980 and 1990, an increa.se of 26%. Previous decades saw only 4.3 million growth in the 1960s and 3. 7 million growth in the 1970s. And subsequent decades recorded only 4.1 million growth in the 1990s (a 14% increase), and 3.4 million growth (10%) in the decade just completed. I t turns out that the 1980s were an isolated moment, a surge of growth due to cold war defense spending on aerospace, largely in Southern California, combined with economic doldrums in the oiJ patch and the rustbelt that made California a national magnet for growth for a decade. However, those attractions did not continue after 1991, and growth decreased substantially in the decades that followed (Exhibit 2.3).
Exhibit 2.2: Total Population
r • • • .. .. .. _,.. .. ..... ..............
--....
... .. . ,.,..'* ___ .........
The annual growth projected by the California Demographic Futures model cominues past trends of much reduced migration to California. Even dur-ing the boom years of the early 2000s migration to
California was falling, so this should not be seen as just an event of the Great Recession. Fertility rates also have been low for more than a decade, although they dropped even more during the G reat Recession. To this day, even though California has a population that is 25% larger overall, the peak year for births in California is still 1990, marking the climax of the 1980s boom years.
As evident in Exhibit 2.3, the DOF-07 projections seemed to anticipate a rebound in growth to levels
Exhibit 2.3: Observed & Expected Population Growth Each Decade • CAn:sus a 00f~7 • Pltlci~~ CDF 12
s
4
s
1
1
0 1950-60 1960-70 1970-aG 1980-90 1990-00 100CHO 101Q.l0 1020o30 10l0-40 2CMCJ..50
Swct- Scvct Ctnsus ¬4 t:leporonenl o( Frora 2007 P~ ~~ CDF 2012
6 USC PopDynamics Research Group
196
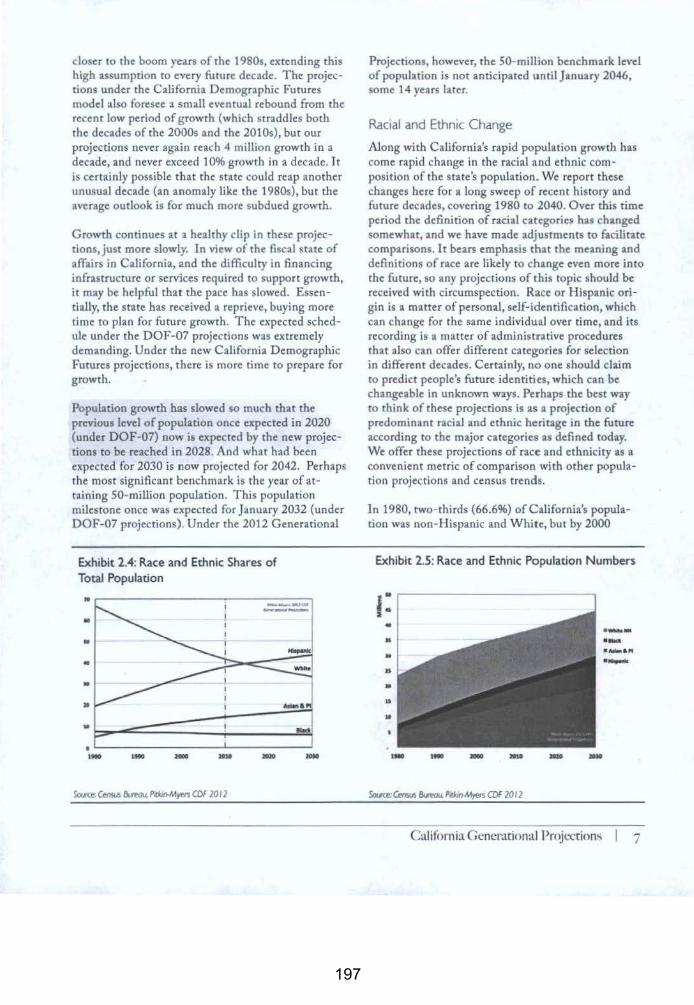
closer to the boom years of the 1980s, extending this high assumption ro every future decade. The projections under the California Demographic Futures model also foresee a small eventual rebound from the recent low period of growth (which straddles both the decades of the 2000s and the 2010s), but our projections never agajn reach 4 million growth in a decade, and never exceed 10% growth in a decade. It is certainly possible that the state could reap another unusual decade (an anomaly like the 1980s), but the average outlook is for much more subdued growth.
Growth continues at a healthy clip in these projections, just more slowly. In view of the fiscal state of affairs in California, and the difficulty in financing infrastructure or services required to support growth, it may be helpful that the pace has slowed. Essentially, the state has received a reprieve, buying more time to plan for future growth. The expected schedule under the DOF-07 projections was extremely demanding. Under the new California Demographic Futures projections, there is more time ro prepare for growth.
Population growth has slowed so much that the previous level of population once expected in 2020 (under DOF-07) now is expected by the new projections to be reached in 2028. And what had been expected for 2030 is now projected for 2042. Perhaps the most significant benchmark is the year of attaining 50-million population. This population milestone once was expected for January 2032 (under OOF -07 projections). Under the 2012 Generational
Exhibit 2.4: Race and Ethnic Shares of Total Population
. ~----------------~----------~ ·- - - -
Projections, however, the 50-miJJjon benchmark level of population is not anticipated until January 2046, some 14 years later.
Raoal and Ethnic Change
Along with California's rapid population growth has come rapid change in the racial and ethnic composition of the state's population. We report these changes here for a long sweep of recent history and future decades, covering 1980 to 2040. Over this time period the definition of racial categories has changed somewhat, and we have made adjustments to facilitate comparisons. It bears emphasis that the meaning and definitions of race are likely to change even more into the future, so any projections of this topic should be received with circumspection. Race or Hispanic origin is a matter of personal, self-identification, which can change for the same individual over time, and its recording is a matter of administrative procedures that also can offer different categories for selection in different decades. Certainly, no one should claim to predict people's future identities, which can be changeable in unknown ways. Perhaps the best way to think of these projections is as a projection of predominant racial and ethnic heritage in the future according to the major categories as defined today. We offer these projections of race and ethnicity as a convenient metric of comparison with other population projections and census trends.
In 1980, two-thirds (66.6%) of California's population was non- Hispanic and White, but by 2000
Exhibit 2.5: Race and Ethnic Population Numbers
,: • ·--• ·-• ........ " ·-• • 11 ..
Souce:Census 8cno<4 p~ CDf 2012
Califomi:1 Gcncr:uional Projl'Ction-: 7
197
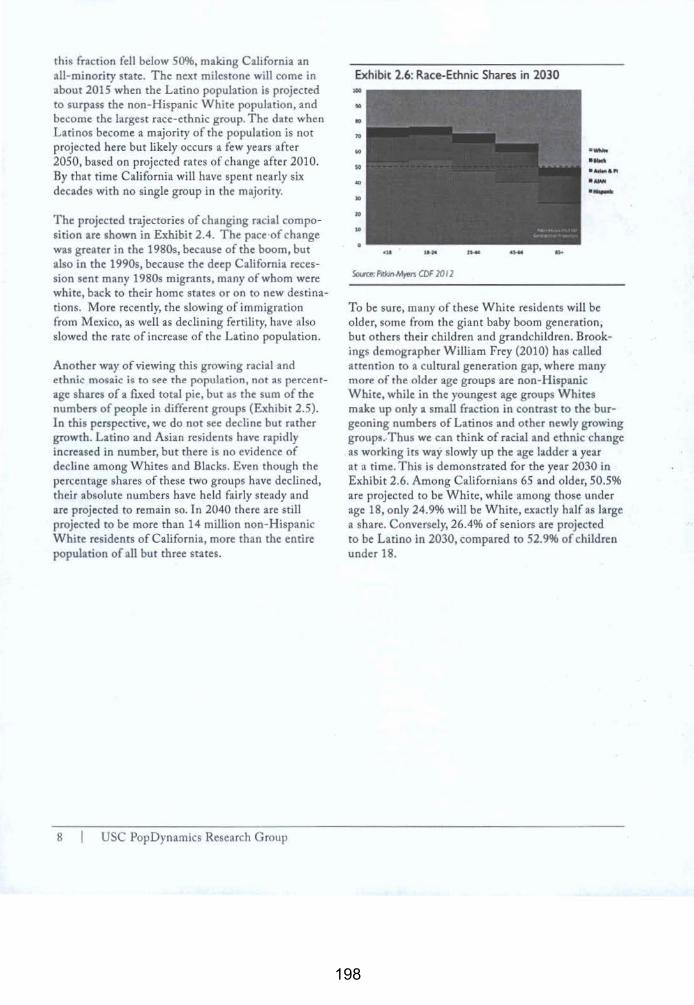
this fraction fell below 50%, making California an all-minority state. The next milestone will come in about 2015 when the Latino population is projected to surpass the non-Hispanic White population, and become the largest race-ethnic group. The date when Latinos become a majority of the population is not projected here but likely occurs a few years after 2050, based on projected rates of change after 2010. By that time California will have spent nearly six decades with no single group in the majority.
The projected trajectories of changing racial composition are shown in Exhibit 2.4. The pace·of change was greater in the 1980s, because of the boom, but also in the 1990s, because the deep California recession sent many 1980s migrants, many of whom were white, back to their home states or on to new destinations. More recently, the slowing of immigration from Mexico, as well as declining fertility, have nlso slowed the rate of increase of the Latino population.
Another way of viewing this growing racial and ethnic mosaic is to see the population, not as percentage shares of a fixed total pie, but as the sum of the numbers of people in different groups (Exhibit 2.5). In this perspective, we do not see decline but rather growth. Latino and Asian residents have rapidly increased in number, but there is no evidence of decline among Whites and Blacks. Even though the percentage shares of these two groups have declined, their absolute numbers have held fairly steady and are projected to remain so. In 2040 there are still projected to be more than 14 million non-Hispanic White residents of California, more than the entire population of all but three states.
8 USC PopDynamics Rese~rch Gmup
Exhibit 2.6: Race-Ethnic Shares in 2030
~ PtcmM~ COf 2012
··-.......... ·-·-
To be sure, many of these White residents will be older, some from the giant baby boom generation, but others their children and grandchildren. Brookings demographer William Frey (2010) has called attention to a cultural generation gap, where many more of the older age groups arc non-H ispanic White, while in the youngest age groups Whites make up only a small fraction in contrast to the burgeoning numbers of Latinos and other newly growing groups. Thus we can think of racial and ethnic change as working its way slowly up the age ladder a year at a time. This is demonstrated for the year 2030 in Exhibit 2.6. Among Californians 65 and older, 50.5% are projected to be White, while among those under age 18, only 24.9% will be White, exactly half as large a share. Conversely, 26.4% of seniors are projected to be Latino in 2030, compared to 52.9% of children under 18.
198

3 A Changing Age Structure
A ge is the central dimension of demography, because change happens a year at a time, and all of
the population members advance in predictable ways. The probabilities of a great many behaviors and events vary systematically across the different ages, making age a uniquely useful and widely used predictor. The age structure, or distribution of the population across age groups, differs from decade to decade because of aging and because of the legacy of past events. In thjs sec6on we summarize the changes in age structure that have occurred since 1990 and that are projected to occur through 2030. That is a capstone year for aging in California, because it marks the point at which the last members of the baby boom generation have crossed age 65 and become eligible for Medicare and many pension benefits.
A tremendous amount of change will be compressed into just the coming 2 decades, and the clearest understanding of a changing California populadon can be gained through a contrast of2030 with 2010 and 1990. This contrast will be examined from djfferent perspectives, beginning with the processes that generate those differences.
The Legacy of Past Events
The giant baby boom generation, born 1946 to 1964, has rippled upward through the age structure for decades. Once born, a cohort can increase in numbers only through migration from another locale. Decrease occurs through out-migration and eventual death.
California's baby boom cohort was augmented during the boom years of the 1980s, when many people then in their 20s and 30s, the ages with highest migration probabilities, were attracted to jobs and lifestyles in the Golden State. Many of these new Californians came from other states; others from foreign countries, as to be discussed in the section on immigration. Rates of migration slow substantially after age 40, and so California's population of boomers has been relatively stable since.
Later, younger cohorts, born in the late 1960s and 1970s, are smaller, and fewer of them have moved to California because the employment attractions and housing costs have not been as welcoming in recent decades. At times, especially during the 1990s, the economy in CaJifornja was so much worse than in other parts of the nation that many young adults moved to other states. The combined effects of smaller cohort sizes and out-migration are sdll visible today in the current slightly depressed number of middle-aged residents rcla6ve to older and younger cohorts.
California experienced its own baby boom from 1984 to 1996, when many of the young adults attracted to the state had their own children. These years also coincided with the baby boom echo, the children born of the baby boomers. Annual births soared 37% between 1984 and 1990, then fell 12% by 1996 before leveling again.4 Those children are now aged 17 to 27 in 2012, with the largest cohort
Califim1ia Generational Projection-; I 9
199

turning 22 thls year. This new generation of young adults is larger than their predecessors, but they leave behind them a decline in school age children in rheir wake. Given the current declines of another 10% in births statewide during the Great Recession, the ranks of children are being further depressed, and for the future, young adults. Nonetheless, the decline is expected to be short-lived, with a small rebound in fertility anticipated after full recovery from the Great Recession. Overall, for the long-term the outlook is for relative stability with very little net change.
Age St ructu re in Each Dec ade
Here we offer a snapshot of the age distribution in each decade. As shown in Exhibit 3.1, in 1990, an exceptionally large share of California's population was ages 25 ro 34 (19.3%). This share fell to a low point in 2010 (14.4%) before a brief revival in 2020 and a projected new decline in 2030 (14.0%). A more prolonged downward shift is found among children, with the share of the population that is under age 10 falling from 15.5% in 1990 to 13.5% in 2010 and projected to 11.4% in 2030.
What has been growing is the share in middle age, as the baby boomers have progressed through the age groups. The share ages 35 to 44 peaked in 2000, the: share ages 45 to 54 peaked in 2010, and the share ages 55 to 64 will peak in 2020. These peaks reflect the aging of the cohort that was age 25 to 34 in 1990,
Elchibit 3.1:Trends in Share of Population
1990 2000
<10 I 5.5 15.4
10.17 10.5 11.9
18·24 11.2 9.9
25 34 19.3 15.4
35-44 15.6 16.2
45·54 99 12.8
55·64 7.5 77
65-74 6.3 5.6
75+ 4.2 5.0
Total 100.0 100.0
Source c-us S<.teou IPUMi Pili<Jtl Mret$ CDF 10 I 1
10 USC PopDynamics Research G roup
representing the younger half of the baby boomers. Ultimately, the cohorts passing through middle age arrive in elder years, with the baby boom cohorts beginning to arrive there after 2010. Our large cohort from 1990 makes ars arrival in 2030, at whkh time the share of the population that is 65 and older is projected to reach 18.5%, well above the 11.4% of today. This highly significant change is discussed below and in later sections as well.
Impacts o f C hang1ng Numbers at D iffe rent Ages
As a measure of direct impacts on public services and private businesses, changes in the absolute numbers of residents each period are more important than their shares of the total. People of different ages have very different needs and demands, and when an age group is growing irs influence has an expansive effect on those activities it most engages in, while in the case of shrinking numbers, the effects are opposite. An especially important impact is when the effects reverse from one period to another. Such a reversal can create wrenching changes as suppliers in the private and public sectors alike adjust to shifts in established patterns of demand by consumers and clients.
California faces such a period of wrenching change today. This can be seen by comparing the growth of the last 20 years by age group with the growth projected for the coming 20 years, as shown in Exhibit 3.2. Substantial reversals in growth patterns lie ahead
2010 2020 2030 13.5 121 114
11.5 10.5 9.5
10.6 9.6 9.1
14.4• 15.2 14.0
13.8 13:4 144
14.0 121 122
10.9 120 10.9
6.1 8.8 9.9
5.3 6.1 8.7
100.0 100.0 100.0
200

as large cohorts, led by the boomers, transition to new stages of Ufe.
Among young people under age 25, California experienced more than 2 million population growth from 1990 to 2010. However, in the coming 20 years, we project virtually zero growth in any part of this age range. (These differences include, of course, the combined effects of past births and migration.)
Among the crucial group of young adults ages 25 to 34, in the last 20 years, CaJifornia lost 367 thousand people. In contrast, in the coming two decades, the state is projected to gain 889 thousand, an important revitaUzation of the age group that suppUes new workers, supports entry-level housing demand, and starts families.
Similarly, at ages 35 to 44, growth is projected to increase from only 492 thousand in the last 20 years to 1.3 million in the coming 20 years. This can be expected to reinvigorate the labor supply and add to demand for housing.
Conversely, in late middle age, from 45 to 64, growth in the last 20 years amounted to an increase of 4.1 million, while in the coming 20 years growth is reduced to only one-quarter as much (1.0 million). This is the age range of maximum earnings and largest house purchases, but its impact as an economic driver will be much Jess robust in the future.
Finally. we arrive at the elderly ages, where 20-year growth of the young-old will expand from 424 thousand in the past 20 years to 2.1 million in the coming 20 years, and all elderly combined will increase their growth from 1.1 million to 4.0 million, a nearly fourfold growth at elderly ages.
A New Era of Aging
The portraits of change that compare aging in the last 20 years to the next 20 years could not be more different from one another. In the period just dosed we experienced growth of the middle aged and children. In the period to come, growth is projected among the senior population and for young adults, accompanied by a slowing among the middle aged and children.
Indeed, the state's future prosperity and vitality will be greatly shaped by these growing segments of young adults and seniors. W hat will they look Uke? In subsequent sections we address the immigration and second-generation trends in California, as well as the new, growing majority of homegrown, native Californians.
In sum, the magnirude of the coming generational transition can be seen from a simple numerical . calculation, one that contrasts the number of elders, ages 65 and older, with prime working age residents, assumed to be ages 25 to 64. Even though some may
Exhibit 3.2: Growth by age gro up. 1990 to 20 I 0 and 20 I 0 to 2030
1990- 2010 2010 - 2030
1.5
1.0
0.5
0.0
-{).5
·1.0
ScM:~; Census ~ IPUMS. iPd<ln M;M CDF JO 12
j 2.5
~ 2.0
1.5
1.0
0.5
0.0
-{).5
· 1.0
California Generational Proj<.:ction~ 11
201

Exhibit 3.3: Senior Ratio Soars a.s Baby Boomers Cross Age 65
45.0 Seniors (65+) per 100 Working Age (25-64}
40.0
35.0
30.0
25.0 -20.0
15.0
10.0
5.0
0.0 1970 1980 1990 2000
be working before or after these ages, this "senior ratio" captures the main relationship between the entitlement and retiree ages and the size of the age groups that are their principal supporters.~
Although the rising number of seniors is significant, of key importance for our society and economy is the ratio between their number and the working age people who will support them in different ways. As this ratio slowly rises, it will gradually tip the scales towud more emphasis on behaviors that the elderly are likely to engage in-not simply retirement but consumption of public entitlements, reduced taxpaying, and increased home selling. After four decades of remaining almost flat at the same constant level, the ratio of seniors is quire suddenly beginning to escalate (Exhibit 3.3). In California, what had been 20 or 21 seniors per 100 working-age residents is projected to climb to 28 in 2020 and then to 36 in 2030. A two-thirds increase in the ratio of seniors to working age Californians seems certain to impose enormous pressure on state and local governments and the taxpayers. A lot is riding on the shoulders of the new generation of young adults.
12 USC PopDyn amics Rcseu ch Croup
~ us I -I /~ I / / i/ / ~
I i
I I I
i Pltlcln-Myers CDf 2012
2010 2020 2030 2040
202
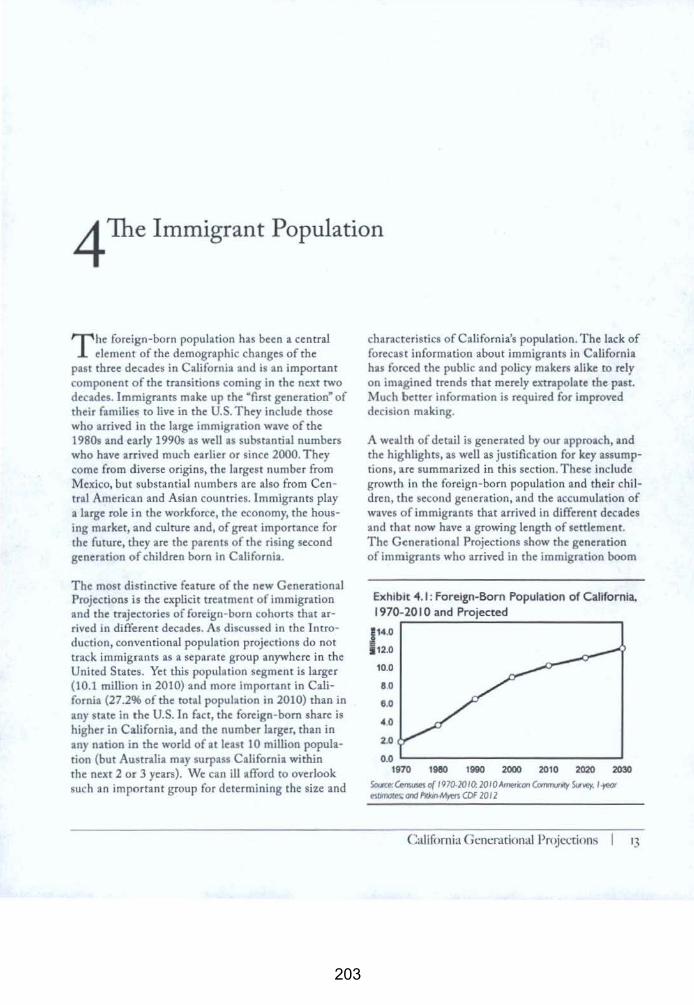
4 The Immigrant Population
T he foreign-born population has been a central element of the demographic changes of the
past three decades in California and is an important component of the transitions coming in the next two decades.lmmigunts make up the "first generation" of their families to live in the U.S. They include those who arrived in the large immigration wave of the 1980s and early 1990s as well as substantial numbers who have arrived much earlier or since 2000. They come from diverse origins, the largest number from Mexico, but substantial numbers arc also from Central American wd Asian countries.] mmigranrs play a large role in the workforce, the economy, the housing market, and culrure and, of great importance for the future, they are the parents of the rising second generation of children born in California.
The most distinctive fearure of the new Generational Projections is the explicit treatment of immigration and the trajectories of foreign-born cohorts that arrived in different decades. As discussed in the Introduction, conventional population projections do not track immigrants as a separate group anywhere in the United States. Yet this population segment is larger (10.1 million in 2010) and more important in California (27.2% of the total population in 2010) than in any state in the U.S. In fact, the foreign-born share is higher in California, and the number larger, than in any nation in the world of at least 10 million population (but Australia may surpass California within the next 2 or 3 years). We can iU afford to overlook such an important group for determining the size and
characteristics of California's population. The lack of forecast information about immigrants in California has forced the public and policy makers alike to rely on imagined trends that merely extrapolate the past. Much better information is required for improved decision making.
A wealth of detail is generated by our approach, and the highlights, as well as justification for key assumptions, are summarized in this section. These include growth in the foreign-born population and their children, the second generation, and the accumulation of waves of immigrants that arrived in different decades and thnt now have a growing length of settlement. The Generational Projections show the generation of immigrants who arrived in the immigration boom
Exhibit 4.1 : Foreign-Born Population of California. 1970-20 I 0 and Projected
114.0
12.0
10.0
80
6.0
40
2.0
0.0 1970 1980 1990 2000 2010 2020 2030
Sotlce:~nsuses o( 197().201Q 2010Americoll Commt.wll(y 51¥-ey. 11'@0' est.mo!es: and PAAln-M~ CDF 20 I 2
Califomia Generational Proj<."Crions 13
203
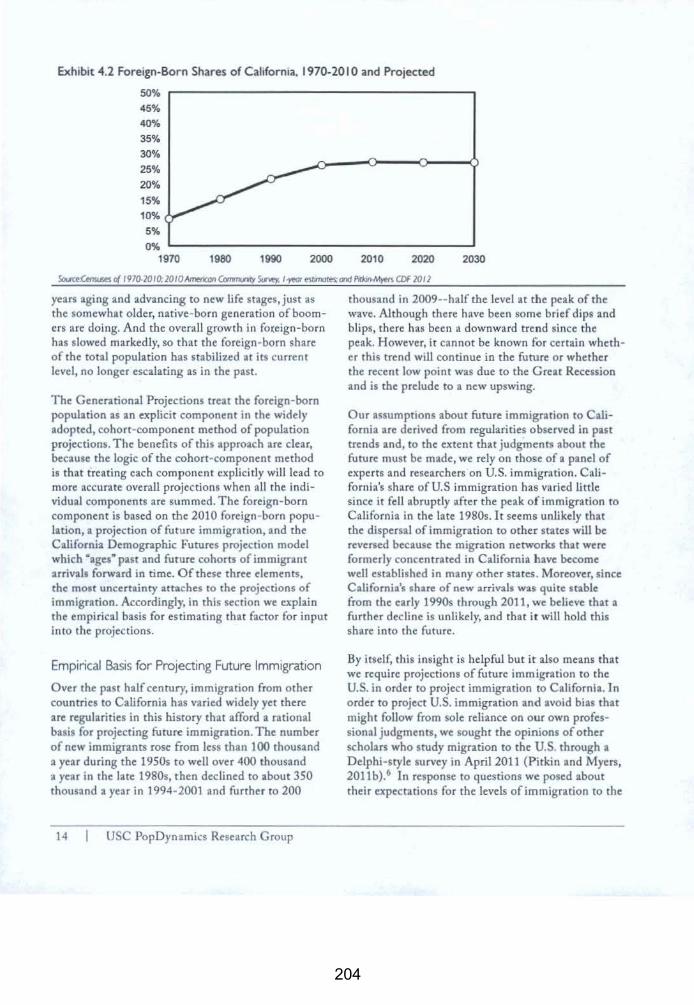
Exhibit 4.2 Foreign-Born Shares of California, 1970-20 I 0 and Projected
50%
45%
40%
35%
30%
25%
20%
15%
10%
5%
0% 1970 1980 1990 2000
years aging and advancing to new life stages, just as the somewhat older, native-born generation of boomers arc doing. And the overall growth in fo(eign-born has slowed markedly, so that the foreign -born share of the total population has stabilized at its current level, no longer escalating as in the past.
The Generational Projections treat the foreign-born population as an explicit component in the widely adopted, cohort-component method of population projections. The benefits of this approach are clear, because the logic of the cohort-component method is that treating each component explicitly will lead to more accurate overall projections when all the individual components are summed. The foreign-born component is based on the 2010 foreign -born population, a projection of future immigration, and the California Demographic Futures projection model which "ages" past and future cohorts of immigrant arrivals forward in time. Of these three elements, the most uncertainty attaches to the projections of immigration. Accordingly, in this section we explain the empirical basis for estimating that factor for input into the projections.
Empirical Basis for Projecting Future Immigration
Over the past half century, immigration from other countries to California has varied widely yet there are regularities in this history that afford a rational basis for projecting future immigration. The number of new immigrants rose from less than 100 thousand a year during the 1950s to well over 400 thousand a year in the late 1980s, then declined to about 350 thousand a year in 1994-2001 and further to 200
14 USC PopDynamics Research Group
2010 2020 2030
thousand in 2009--half the level at the peak of the wave. Although there have been some brief dips and blips, there has been a downward trend since the peak. However, it cannot be known for certain whether this trend will continue in the future or whether the recent low point was due to the Great Recession and is the prelude to a new upswing.
Our assumptions about future immigration to California are derived from regularities observed in past trends and, to the extent that judg~ents about the future must be made, we rely on those of a panel of experts and researchers on U.S. immigration. California's share of U.S immigration has varied little since it fell abruptly after the peak of immigration to California in the late 1980s.It seems unlikely that the dispersal ofimmigration to other states will be reversed because the migration networks that were formerly concentrated in California have become well established in many other states. Moreover, since California's share of new arrivals was quite stable from the early 1990s through 2011, we believe that a further decline is unlikely, and that it will hold this share into the future.
By itself, this insight is helpful but it also means that we require projections of future immigration to the U.S. in order to project immigration to California. 1 n order to project U.S. immigration and avoid bias that might follow from sole reliance on our own professional judgments, we sought the opinions of other scholars who study migration to the U.S. through a Delphi-style survey in April2011 (Pitkin and Myers, 2011 b). 6 In response to questions we posed about their expectations for the levels of immigration to the
204

U.S. in future years, on average, the members of the panel anticipated that U.S. immigration will rebound from the low levels recorded in 2009 and 2010 by 2015 and will increase further to near the peak (recorded in 2000) by 2025. The two important findings were that, one, whllc the average expert opinion expected a recovery of immigration, two, there was an expectation that future immigration will remain well below the continued increases in the Census Bureau's 2008 population projections for the nation.
Our projection for future U.S. immign.tion is derived from this average expert opinion on expected trends. Together with the assumption about California's stable share of U.S. immigration it implies that the number of new immjgrants to California will increase gradually from the recent low of 200 thousand to 262 thousand a year by 2025, or by 30%. This is substantially below the large inflows seen at the end of the 1980s. As discussed in Section 2 about population growth, that period was unusually attractive for all migration to California and is not likely to be repeated. It should be noted that our immigration assumption has validity only as a long-run average and should not be treated as an annual forecast; variations above and below chis long-run trend arc likely but cannot be projected with specificity.
The Resulting Trend in Foreign Born Population
The effects ofthls assumption can be readily seen in the resulting projection of the foreign-born population in the state (Exhibit 4.1) which indicates that the foreign-born share of California's total population will level off at approximately the 2010 share of 27.2%, u shown in Exhibit 4.2. In other words, with this amount of future immigration, the foreign-born population of California is projected to increase at approximately the same pace as the state's native-born population.
This is an important finding of the Generational Projections. While this result may seem surprising to those who assumed the upwud surge in immigration of the 1980s is continuing, in fact, the turning point came in the deep California recession of the early 1990s that deflected new immigrants to other states. Our 2001 edition of the California Demographic Futures reported that this slowdown had commenced, and that study successfully projected the continued slowdown that unfolded by time of the 2010 census.7
This new pattern of a stable foreign born share is significant because it means chat California is not being "tllken over• by immjgrants as earlier trends suggested. More significant may be the conclusion that California cannot rely on an unlimited supply of foreign-born labor, or domestic labor for that matter, to meet its workforce needs, and consequently the state will be increasingly dependent on the talents and skills of homegrown workers.
The slowdown in immigration also means that the characteristics of the immigrant population are shifting as more of them become long-settled in the state. Two of these characteristics, age and duration of residence in the U.S., are matters of accounting and can be projected with a high degree of confidence. The projections of these characteristics are described next.
Arrival Cohorts
In addition to the number of immigrants in the population of California, the California Demographic Futures model also projects the population of each generation or cohort, of immigrants who arrived in the U.S. in the same year. The projections are summarized by year of arrival in Exhibit 4.3. They show, for example, the population of the cohort that a~rived in the U.S. in 1980-1989 and was first observed at 3.1 million in the Census of 1990 (and shown in the first column of the table). 8By reading this row across the columns, one can trace the population of the 1980s arrivals first in the censuses of 2000 and 2010 and then in the generational projections to 2020,2030, and 2040. The population of this ~arrival cohort• shrinks over time, with losses initially due mainly to emigration (often back to countries of origin) and, increasingly as the cohort ages in later years, due to the impact of mortality. Earlier and later arrival cohorts can also be seen in the exhibit, showing their past and projected populations residing in California.
Duration S1nce Arrival and Age
The duration of time elapsed since arrival in the U.S. is an especially significant characteristic of the foreign-born population and can be calculated directly for each cohort any year, since their year of arrival in the U.S. is known. This is significant because growing duration is associated with settlement, integration and advancement in the U.S. (See Myers,
California Generational Proj<..'(.:tions 15
205

Exhibit 4.3: Population of California by N ativity and Foreign-Born Decade of Arrival
1990 2000 2010 2020 2030 2().1() (thousands)
Decade of anival Foreign born 204{}.2049 130
2030-2039 130 l479 2020-2029 124 2.447 2.255 2010-2019 123 2.166 2.001 1.876 2000-2009 148 2.698 2.422 2.238 2.039 1990-1999 129 3.122 2.686 2.403 2.149 1.853 1980-1989 3.112 2.893 2.406 2.122 1.812 1.444
Before 1980 3.202 2.700 2.234 1,780 1.315 851 Total fore~gn born 6.443 8.863 10.147 11.017 12.092 12.927
Native born 23.273 25,008 27.181 29,803 32.671 35.388 Total population 29.716 33.871 37.328 40.820 44,763 48.315
Source•: 1990: 1990 c~ 5% Pl.tlloc lM Mocrodal Sample.
2000. 2000 Census 5'!6 Publoc Use Mocrod.na ~.
20 liT 20 I 0 Amencan ComrruMy Survey l-ye¥ e$11mate 2020·2010:Pitlon-Mym COf 2012 Gene<lltlOI\all'rtljecuons
Notes: l'llpuia!IOfls are as or April I. 1990, and April I, 2000, and July I '" wbsequent years.
1990 )'ear of amval "" 1990 estimated as prcnted share of popWt>on IN\ ¥1'IYed "' 1987· 1990
Smlfl runber> 11 top or each tolo.rnn are~ ""'o ~ ~ ~ I of the turn:nl year and the dllc of the tetlSUS or pro,ect>on.
2007, chapter 5 or Myers and Pitkin 2011) For each arriVlll cohort, aver.age duration in the U.S. grows by approximately ten years each decade.
Exhibit 4.4 shows how immigration duration added up for the entire foreign born population in the past and how it is projected to add up in the future. In 1990, half of the foreign-born population were recent . arrivals who bad come to the U.S. in the previous 10 years, and the median time since arrival stood at 10.0 years. By 2010, the share of recent arrivals had declined by almost half, and the share comprised by cohorts in the U.S. for 20 years or more had more than doubled; as a result the median duration had risen to 19.5 years.ln the future, cohorts in the U.S. for 30 years or more are projected to steadily increase relative to the number of more arrivals, and in 2030 the median duration is projected to rise further to 27.7 years. These projected changes and the growing average U.S. "experiencen of the immigrant population reflect the aging of the large cohorts of immigrants who came to California during the boom years of the 1980s and early 1990s.
As cohorts of immigrant arrivals spend longer in the U.S., they also of course grow older. For each cohort,
16 USC PopDynamics R~s~arch Group
average age increases almost in step with duration since arrival.9 Somewhat less obviously, the aver-age age of the entire foreign-born, first-generation population has increased over rime and is projected to continue to rise in the coming decades. The large cohorts of immigrants who arrived during the 1980s and 1990s, most as youths or young adults, are aging; more recent immigrants are also mostly young, but they make up a shrinking proportion of the total population of immigrants, so the average age tends to increase over time.
Exhibit 4.4: Duration (Years) of Residence in U.S.
100 r-~----------~---.------, 90
80 70 60 50 40 30
20
10
0 1990 2000 2010 2020 2030 2040
206
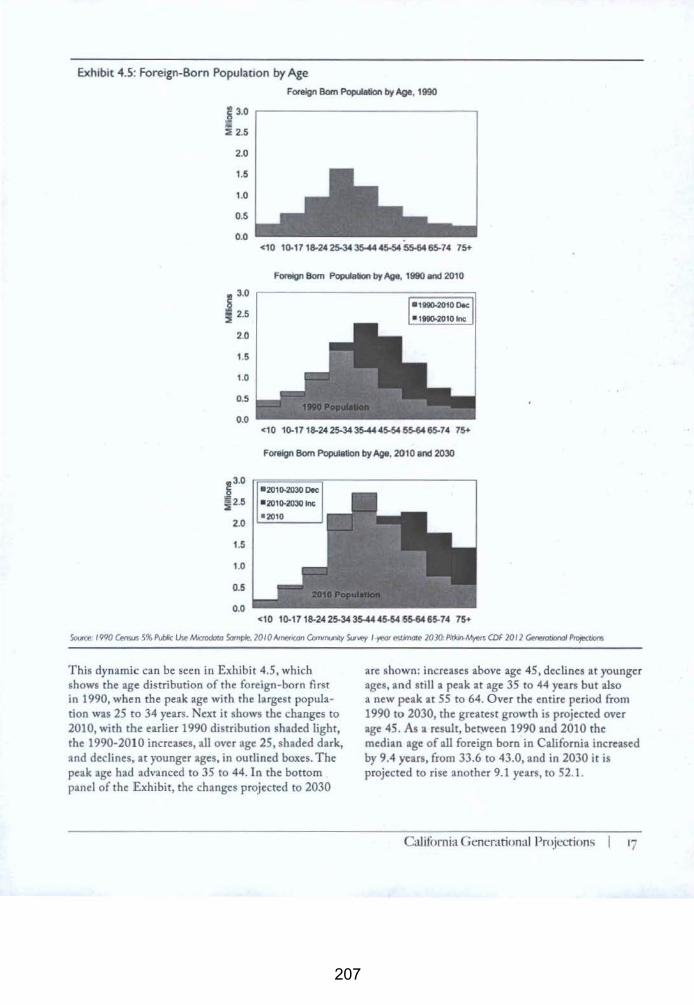
Exh1b1t 4.5: Foreign-Born Population by Age
Foreign Born Population by Age, 1990
~ 3.0 .---------Iii ::1:2.5
2.0
1.5
1.0
0.5
0.0 <10 10.1718-2.&25-34~45-545S-646~74 75+
Fcnlgn Born PopiAalion by~. 1990 lnd 2010
J 3.0 r--------;:::==::::;, 2 2.5
2.0
1.5
1.0
0.5
0.0 <10 10.1718-242~35-4-44~5.&6~~74 76+
Foreign Born Population by Age. 2010 and 2030
<10 10.1718-242~3S-4.445-6-4155-646S.7.& 75+
So<tt't'; 1990 ~nsus 5~Pubi<: Use MJaodaur SomJ*, 2010Ametocon Commurll!y SIN~ 1-yeor ('Wrnort> 7030:Pid<Jn.Myt!ls C.Of 2012 ~IJOIIOI PlojectJom
This dynamk can be seen in Exhibit 4.5, which shows the age distribution of the foreign-born first
are shown: increases above age 45, declines at younger ages, and still a peak at age 35 to 44 years but also
in 1990, when the peak age with the largest population was 25 to 34 years. Next it shows the changes to 2010, with the earlier 1990 distribution shaded light, the 1990-2010 increases, all over age 25, shaded dark, and declines, at younger ages, in outlined boxes. The peak age had advanced to 35 to 44.ln the bottom panel of the Exhibit, the changes projected to 2030
a new peak at 55 to 64. Over the entire period from 1990 to 2030, the greatest growth is projected over age 45. As a result, between 1990 and 2010 the median age of all foreign born in California increased by 9.4 years, from 33.6 to 43.0, and in 2030 it is projected to rise another 9.1 years, to 52.1.
Caliti>rnia Genemtional ProjL.octions I I~ I
207

Exhibit 4.6:Two Definitions of Second Generation for the Population of California, 1990, 20 I 0, 2030
Nativity and Nativity of Parents 1990 2010 2030 Population Share of Population Share of Population Share of (thousands} total (thousands} total (thousands} total
Base d~:finition of Second generation: children of foreign:bom mothers Second generation 3,908 13.2% 7,305 19.6% 9.9C!J 22.1% Third generation 19,365 65.2% 19,876 53.2% 22,762 50.8% Total native born 23.273 78.3% 27.181 7l8% 32,671 73.0%
Expanded definition of Second generation: children with at least one foreign-born parent Secondgeneration 5,021 16.9% 8,861 23.7% 12.113 27.1% Thrdgeneration 18.252 614% 18.320 49.1% 20.558 45.9% ToW natM: born 23.273 78.3% 27.181 72.8% 32.671 73.0%
Foreign born
Total population
6.+'13
29.716
21.7%
1000%
10,147
37.328
27.2%
100.0%
12.092
+4,763
27.0%
100.0%
Nooe: &.paneled drinotoon reported l'l tlvs tobie IS estmntd &-om base drinmon and IS ustd oNy ., thos report sec1JOtl. The base definition Is used In 1M pnentional projections and in ocher sectlons of this report.
Soc.m!:: I 990 ~ .5% Pti1lic lM Mc:rodoto Somplt. 10 I 0 Amencon CDmmin()' SiK\er I ·rear MtmOte 20JO: P•d<ln-M)'e!S CDF 20 11 GerM>roi.OilOI PrOJKI)ons
The Second Generation
As immigrants age, they not only grow more settled, but like the native-born population, many have children. These "second generation" children of the first-generation immigrants are often considered to be part of the immigrant population, and they are therefore separately identified and tracked in the Generational Proj_ections as the children of foreignborn mothers. 10 11 In the recent past and the period of projection, the second-generation population grows slightly faster than the fi rst. In 1990, including all residents with at least one foreign-born parent, a commonly used but more expansive definition than used in the projections or other sections of this report, 12 the second generation comprised 16.9% of the total population of California, less than the 21.796 that were foreign born, but nonetheless substantial. In 2010 the children born to immigrants in the 1990s and 2000s had raised this share to 23.7% of the state's total population, and by 2030, the second generation is projected to comprise 27.196 of the tor:~ I population, roughly equal to the number of first-generation foreign-born population. In that year, the first and second generations combined are projected to make up 54.1% of the resident California population. These results are shown in Exhibit 4.6, which also shows the second genera~ion population according to the base definition used elsewhere in the Generational Projections.
18 USC PopDynamics Research Group
The age distribution of the second generation population is quite different than for the first generation. Between 1990 and 2010, continued births to immigrants caused the median age of the second-generation population to fall from 21.8 years in 1990 to just 17.6 years in 2010. The median age is projected to stop falling and increase substantially, 201 0 to 28.5 years ~n 2030, due declining numbers of births to foreign-born women and the aging of the large cohort born in the 1990s and early 2000s.
In this section we have focused on the foreign-hom population, its growth through immigration, and their children, the second generation. It has grown rapidly in past decades and is projected to continue to grow at slower rate in the futu re. Immigrants are not frozen in time like Peter Pan, they are no longer all newcomers, and further predictable changes are projected. In the next section we consider the foreign-born population in context as one of three large origin groups that together comprise the California population and the relationships among them.
208
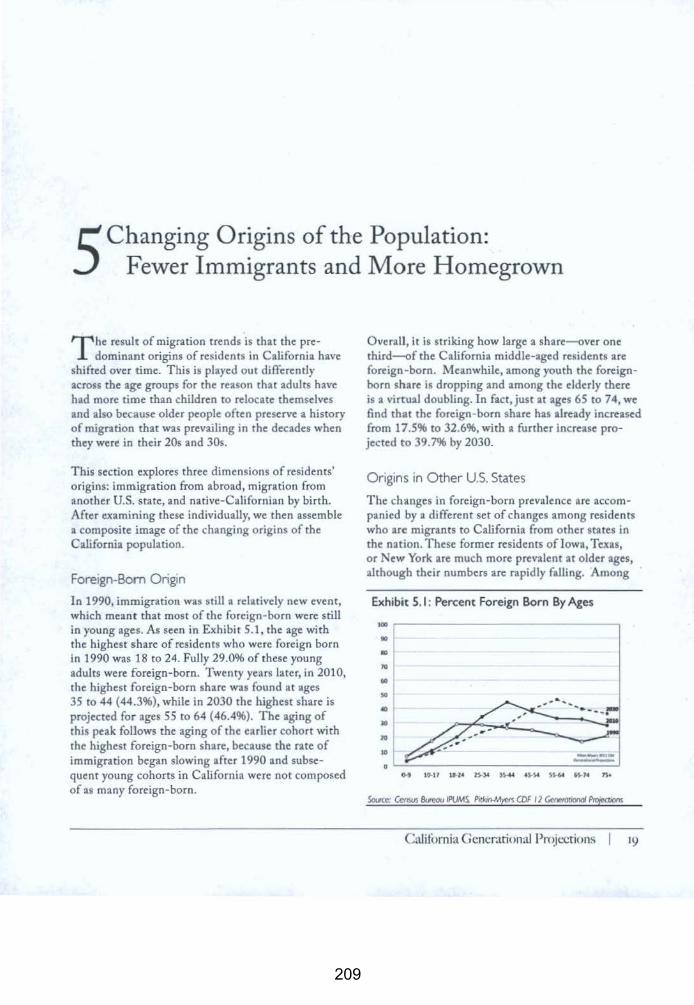
5 Changing Origins of the Population: Fewer Immigrants and More Homegrown
T he result of migration trends is that the predominant origins of residents in California have
shifted over time. This is played out differently across the age groups for the reason that aduJts have had more time than children to relocate themselves and also because older people often preserve a history of migration that was prevailing in the decades when they were in their 20s and 30s.
This section explores three dimensions of residents' origins: immigration from abroad, migration from another U.S. state, and native-Californian by birth. Mter examining these individually, we then assemble a composite image of the changing origins of the California population.
Foreign-Born Origtn
In 1990, immigration was still a relatively new event, which meant that most of the foreign-born were still in young ages. As seen in Exhibit 5.1, the age with the highest share of residents who were foreign born in 1990 was 18 to 24. Fully 29.0% of these young aduJts were foreign-born. Twenty years later, in 2010, the highest foreign-born share was found at ages 35 to 44 (44.3%), while in 2030 the highest share is projected for ages 55 to 64 (46.4%). The aging of this peak follows the aging of the earlier cohort with the highest foreign-born share, because the rate of immigration began slowing after 1990 and subsequent young cohorts in California were not composed of as many foreign-born.
Overall, it is striking how large a share-over one third-of the California middle-aged residents are foreign-born. Meanwhile, among youth the foreignborn share is dropping and among the elderly there is a virtual doubling. In fact, just at ages 65 to 74, we find that the foreign-born share has already increased from 17.5% to 32.6%, with a further increase projected to 39.7% by 2030.
Ongins in Other U.S. States
The changes in foreign-born prevalence are accompanied by a different set of changes among residents who arc migrants to California from other states in the nation. These former residents oflowa, Texas, or New York are much more prevalent at older ages, although their numbers are rapidly falling. Among
Exhibit 5. 1: Percent Foreign Born By Ages
'10
liO
:10
: t 10
10
Calit(lrnia Gcm:rational Prc~i'--crions I 19
209

Exhibit 5.2: Other U.S. Born By Age
: : ...------------l 10
~
so 00
10
10
tO
0 ~~----------------------~======~
residents ages 65 to 74 in 1990, 62.2% were born in another state, while that drops in 2010 ro 39.9% and is projected to decline to 21.5% by 2030 (Exhibit 5.2). Combined with the finding above abour growing foreign-born prevalence at older ages, we are witnessing a great reshaping of the identity and background of the state's elderly population.
The California Born
What is the most common origin at young ages is native birth in California, the creation of a homegrown generation ra.ised in this state. As seen in Exhibit 5.3, it always has been much more common for children and young adults to be born in the state where they now reside. I lowever, in 1990, half of the residents ages 18 to 24 were California natives (50.0%}, and it was progressively lower in older age groups. By 2010, this share had increased markedly, reaching 69.2% of those aged 18 to 24. This change reflected the dramatic slowdown in migration after 1990, while the older age groups were slower to be affected because many of their members were already resident in 1990.
The age contour of the homegrown share slopes downward at a relatively steady rate, with one exception that is illuminating. ]n 2010, the share at ages 35 to 44 appears to be depressed by 5 to 8 percentage points. A prior study of the homegrown identified th.is cohort as suffering losses during the economic recession of the 1990s that was much more severe in California than the rest of the nation (Myers, Pitkin and Ramire~ 2009). At that time, the unemployment rate in California was 9.6%, compared to 7.5% for the nation as a whole, a differential of 2 points,
20 USC PopDynamics Research Group
Exhibit 5.3: Homegrown By Age
Ill
,., to
50 .. Jll I
lO
10 -.. ..... ., .. ---0 M
and the unemployment burden fell heaviest on the youngest, most migration prone adults (Myers et al, 2011: Figure 3). ln addition, the extraordinary boom in California house prices created another incentive for this cohon of adults to exit, 10 years later, in the early 2000s, when the cohort was in its 30s, because they had grown frustrated by their inability to purchase homes. The combined effect was to drive out a sizable number of California's grown children who sought employment and housing in other states. In the current period, the ill effects of the Great Recession are more evenly spread, with fewer safe havens to attract outmigrants, and the crash in California housing prices has reduced that difference as well. Accordingly, we should not e>.'J>eCt to witness as great an exodus from the current cohort of young adults.
The Comb1ned Ong1n Profiles by Age and Race-Ethnicity
The three major origin groups can be combined in one exhibit for each of the age groups, as shown in Exhibit 5.4, comparing the origin profile in 2030 to the one in 2010. The information displayed is identical to that shown for those years in the preceding exhibits, but ir permits comparisons of the three origins. The foreign-born shares of each age group are shown at the top of the chart and the homegrown at the bottom.ln between, the light-shaded portion represents the shares born in other states of the U.S. That area is much larger at older ages, but between 2010 and 2030 it grows ever smaller. Over time, we also see how the foreign-born shares are anticipated ro shift toward older ages. And the homegrown shares rise ever higher at younger ages.
210
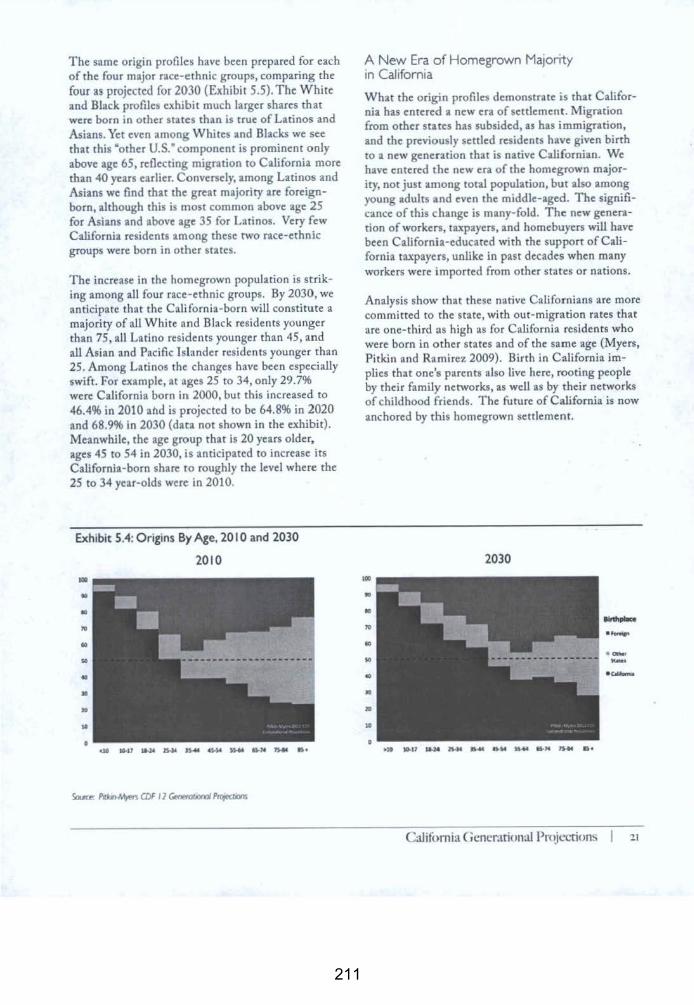
The same origin profiles have been prepared for each of the four major race-ethnic groups, comparing the four as projected for 2030 (Exhibit 5.5). The W hite and Black profiles exhibit much larger shares that were born in other states than is true of Latinos and Asians. Yet even among Whites and Blacks we see that this ~other U.S: component is prominent only above age 65, reflecting migration to California more than 40 years earlier. Conversely, among Latinos and Asians we find that the great majority are foreignborn, although this is most common above age 25 for Asians and above age 35 for Latinos. Very few California residents among these two race-ethnk groups were born in other states.
The increase in the homegrown population is striking among all four race-ethnic groups. By 2030, we anticipate that the California-born will constitute a majority of all White and Black residents younger than 75, all Latino residents younger than 45, and all Asian and Pacific Islander residents younger than 25. Among Latinos the changes have been especially swift. For example, at ages 25 to 34, only 29.7% were California born in 2000, but this increased to 46.4% in 2010 and is projected to be 64.8% in 2020 and 68.9% in 2030 (data not shown in the exhibit). Meanwhile, the age group that is 20 years older, ages 45 to 54 in 2030, is anticipated to increase its California-born share to roughly the level where rhe 25 to 34 year-olds were in 2010.
Exhibit 5.4: O rigins By Age, 20 I 0 and 2030
2010
A New Era of Homegrown Majority in Californra
What the origin profiles demonstrate is that California has entered a new era of settlement . Migration from other states has subsided, as has immigration, and the previously settled residents have given birth to a new generation that is native Californian. We have entered the new era of the homegrown majority, not just among total population, but also among young adults and even the middle-aged. The significance of this change is many-fold. The new generation of workers, taxpayers, and homebuyers will have been California-educated with the support of California taxpayers, unlike in past decades when many workers were imported from other states or nations.
Analysis show that these native Californians are more committed to the state, with out-migration rates that are one-third as high as for California residents who were born in other states and of the same age (Myers, Pitkin and Ramirez 2009). Dirth in California implies that one's parents also Live here, rooting people by rheir family networks, as well as by their networks of childhood friends. The future of California is now anchored by thls homegrown settlement.
2030
Califhmra Gcnerarional Prqjl"Ctions 21
211
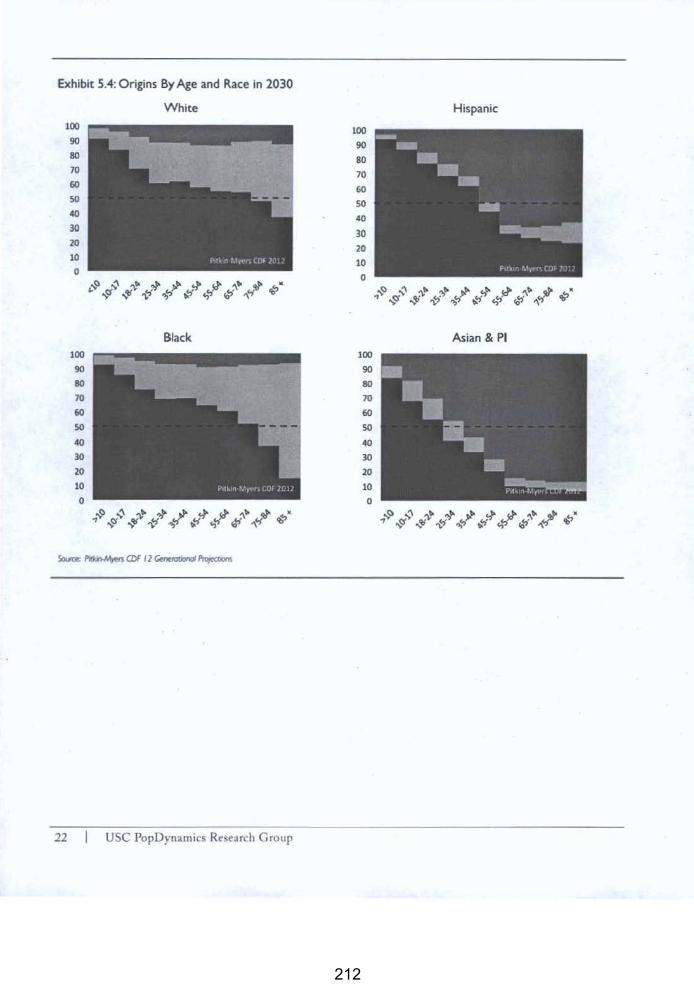
Exhibit 5.4: Origins By Age and Race in 2030
White 100
90
80
70 60
50
40
30 20
10
0
100 90
80
70 60
50
40
30
20 10
0
Black
22 USC PopDynamics Research Group
100
90 80 70 60
so 40
~0
20 10
0
100 90
80
70 60
50
40
30
20
10
0
Hispanic
Asian & PI
212
6 Changes in California's Working Age Population
0 ne of the major implications of the population projections is with reg:~rd to the future work
force of California. How much will the working age population increase and whu will be the composition of this growth? This question has great import for the economic future of California. Here we address two key age ranges: Mworking age" residents are in the prime ages of 25 to 64; ~training age• residents are ages 18 to 24 and preparing to enter the prime working age.
The number and characteristics of working age population has major significance, because this group is the source of the labor force and the provider of replacement workers for the retiring older generation. The prime working age population provides the labor force that drives the economy. This group contains the most productive workers and residents in their highest earning years. These are the principal taxpayers, the biggest consumers, and the bulk of the homebuyers. Changes in the working age population thus have broad impHcations for California's future.
Separately, we will focus also on the number and characteristics of youths and young adults, ages 18 to 24. This group is often termed working age, but as will be explained, they are more often in training or apprenticeships and entry-level positions: they are preparing to join the workforce. The quality of their preparation is subject to public policy intervention
and has great importance because these youths and young adults are at the optimum age to be trajned to become productive members of the labor force. The number and characteristics of these *training age" residents of California thus deserve special attention.
In this section, the working age population is compared between 1990 and 2010, and then with the 2030 projection. The main focus is on the growth in the number of working age residents, compar-ing the coming 20 years of growth to the last 20 years. This growth can be partitioned by its origins, whether foreign-born or native-born, with the latter divided between the children of immigrants (second generation) or those of the third and higher generation. Alternatively, growth in working age residents also can be partitioned by place of birth, dividing the native-born between those born in California or elsewhere in the U.S. Consistent with findings reported in Section 5, above, we find here that the homegrown population is by far the greatest sector of future growth in the working age population. Closer examination is then given to changes in the the race and ethnicity of these homegrown California working age residents.
Following that working age analysis, we then conduct similar investigation of the training age residents. These young recruits are truly the cutting edge of California's emerging future.
Calit(lrnia Generational Pr<~jl.!ctions 23
213
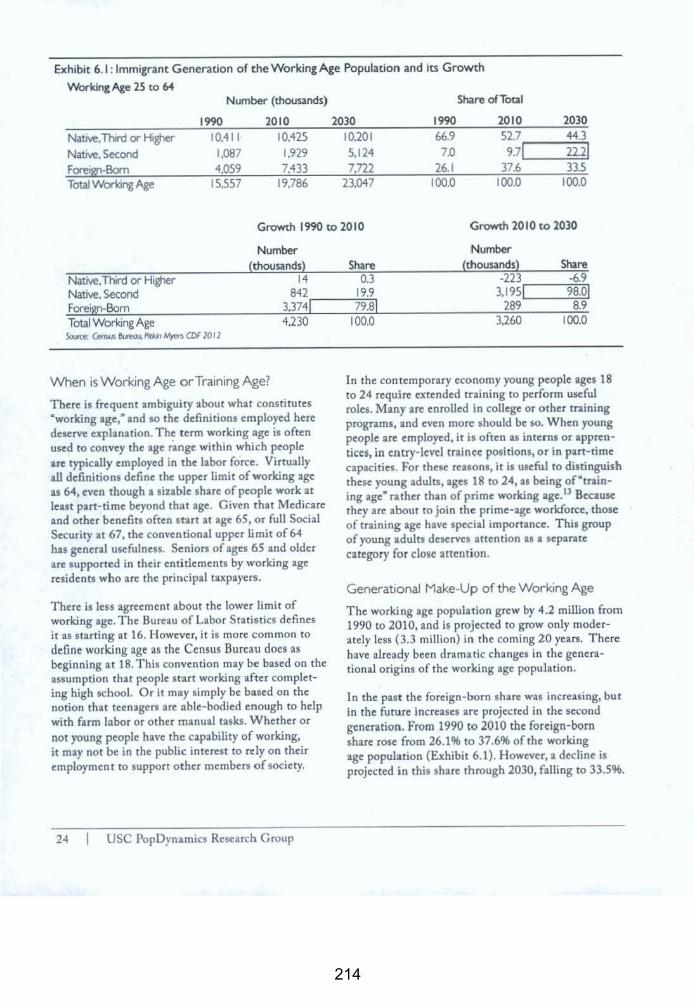
Exhibit 6.1 : Immigrant Generation of the Working Age Population and its Growth
Working Age 25 to 6-4 Number (thousands) Share ofTotal
1990 2010 2030 1990 2010 2030
NatNe.Thtrd or Higher Native, Second Foretgn·Bom
10.411 1,087 4,059
I 0.425 I 0.20 I 66.9 7.0
26.1
5 2.7,...... _ __;.44..;.;;.3;;,
9.7l._ _ ___;;;;;;;22~21 1.929 5,124 7,433 7,722 37.6 335
Total Working Age 15.557 19,786 23.047 100.0 100.0 100.0
Growth 1990 to 2010 Growth 2010 to 2030
Number Number (thousands) Share (thousands) Share
Native, Third or Htgher Native. Second Foreign-Bom
14 0.3 -223 -6.9 3,1951,.....----::9~8.~01 842 ...----=1-=-'9.9::.,
3,3741 79.81 289 8.9 Total Working Age 4,230 100.0 3,260 100.0 SOP'~ Cen1a4 &.n!ot.l PAAil M)= CDF 20 I 2
When is Working Age or Training Age?
There is frequent ambiguity about what constitutes •working age," and so the definitions employed here deserve explanation. Th~ term working age is often used to convey the age range within which people are typically employed in the labor force. Virtually all definitions define the upper limit of working age as 64, even though a sizable share of people work at least part-time beyond that age. Given that Medicare and other benefits often start at age 65, or full Social Security at 67, the conventional upper limit of 64 has general usefulness. Seniors of ages 65 and older are supported in their enti tlements by working age residents who are the principal taxpayers.
There is less agreement about the lower limit of working age. The Bureau of Labor Statistics defines it as starting at 16. However, it is more common to define work.ing age as the Census Bureau does as beginning ar 18. This convention may be based on the assumption that people start working after completing high school. Or it may simply be based on the notion that teenagers arc able-bodied enough to help with farm labor or other manual tasks. Whether or not young people have the capability of working,. it may not be in the public interest to rely on then employment to support other members of society.
24 USC PopDyna.mics Research Group
In the contemporary economy young people ages 18 to 24 require extended training to perform u~ful roles. Many are enrolled in college or other training programs, and even more should be so. W hen young people are employed, it is often as interns or apprentices, in entry-level trainee positions, or in part-rime capacities. For these reasons, it is useful to distinguish these young adults, ages 18 to 24, as being of•tnining age~ rather than of prime working age.13 Because they are about to join the prime-age workforce, those of training age have special importance. This group of young adults deserves attention as a separate category for close attention.
Generational Make-Up of the Working Age
The working age population grew by 4.2 million from 1990 to 2010, and is projected to grow only moderately less (3.3 million) in the coming 20 years. There have already been dramatic changes in the generational origins of the working age population.
In the past the foreign-born share was increasing, bu.t in the future increases are projected in the second generation. From 1990 to 2010 the foreign-born share rose from 26.1% to 37.6% of the working age population (Exhibit 6.1). However, a decline is projected in this share through 2030, falling to 33.5%.
214

Instead in the future the share that is second generation is projected to increase, rising from 9.796 in 2010 to 22.296 of the working age group in 2030.
In the past, the largest share of the working age population was native-born of third or higher generation residence in the U.S. However, this share declined from 66.9% in 1990 to barely half(52.7%) in 2010 and is projected to decline further to 44.3% in 2030.
The generations' changing shares of the working age group in different decades result from sharply different contributions to growth in different periods. In the last 20 years, the foreign-born accounted for almost 80.0% of the growth in working age residents in California (Exhibit 6.1). However, in the coming 20 years, the foreign-born share of growth is projected to be only 9% of total growth. I nstead of a gain of 3.3 million working age in the last 20 years, the next 20 years are expected to see only an increase of only 290 thousand in foreign-born of working age.
The native-hom, third or higher generation contributed very Little growth in the last 20 years and is projected to see a small loss in the working ages in the coming 20 years.
In their stead, the native-born, second generation, i.e., the children of imrrugnnts, are projected to become the new, major source of growth in working age Californians. This new generation can be expected to add 3.2 million members to the working age population and account for virtually all of the growth (98%) in the working age population between 2010 and 2030.
Place-of-Birth Origins of the Work1ng Age
Further attention is due the distinction within the working age residents who are native-born, separating those who are native Californians from those born in other parts of the U.S.
California-born residtnts art distinct ive and worthy of separate attention, as in Section 5. The Californian-born are more rooted in the state, with ourmigration that is two-thirds lower, than are native-born from other states. They are anchored by family and networks of school friends, and their entire education has been accomplished in this state (with rare exceptions). The California-born are truly a homegrown resource that will support the future economy of the state.
The California-born already were the largest component of the working age population in 2010 (.41.296)
Exhibit 6.2: California Origins of the Working Age Population and its Growth
Working Age 25 to 64
Califomia-Bom Other US Bom Foreign-Born Total Working Age
Number (thousands)
1990
5,502 5,996
4.059 15,557
2010 8,148 4,206 7,-433
19,786
2030 11,801 3,524 7.n2
23.047
1990
35.4 38.5 26.1
100.0
Share ofTotal
2010 2030
41.2 ....-----=5~1..::,2 21.31~.-----.:.1.::.:5·.::..~31 37.6 33.5
100.0 100.0
Growth 1990 to 20 I 0 Growth 20 I 0 to 2030
Califomia-Bom Other US Bom Fore'8n-Bom Total Working Age
Sot«c W>sus ¬.! PtDfKDOtiS. Prdutl ~1 COF 2011
Number Share
62.6 --42.3 79.81
100.0
Number
Cali!(wnia Generational Projections I
215
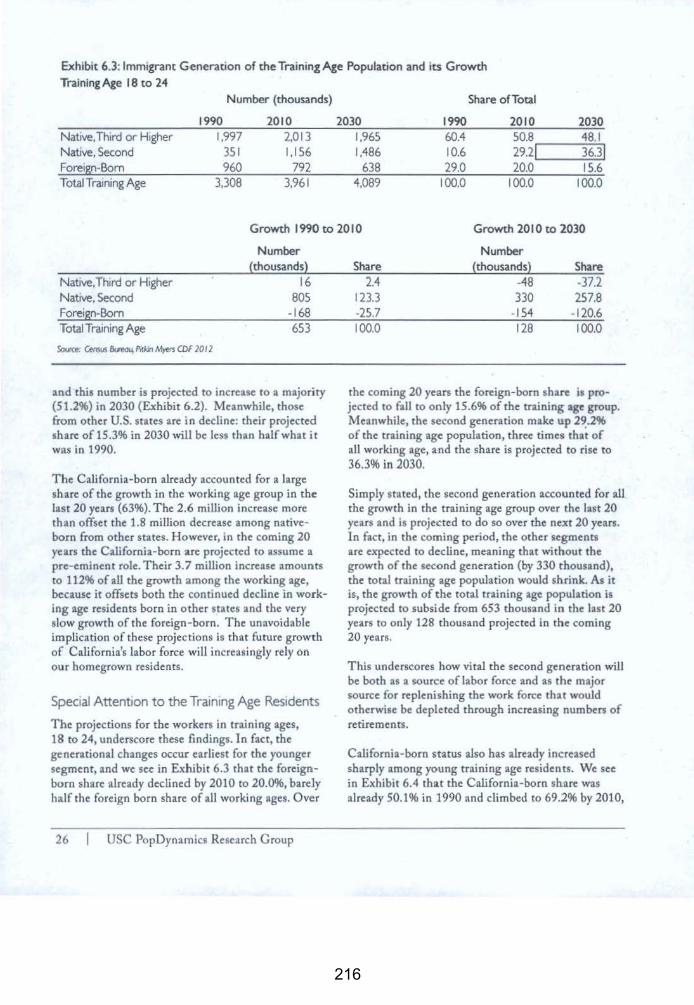
Exhibit 6.3: Immigrant G eneration of the Training Age Population and its Growth
Training Age 18 to 24
NatJve,Third or Higher Native, Second Foreign-Born Total Training Age
N umber (thousands)
1990 1,997
351 960
3,308
2010 2,013 1,156
792 3,961
2030 1,965 1,486
638 4,089
1990 60.4 10.6 29.0
100.0
Share ofTotal
2010 2030 50.8,_ __ 4:..=,8·:..:..,1 29.2 IL..-_...:3:..::.6.:::.~31 20.0 15.6
100.0 100.0
Growth 1990 to 2010 Growth 20 I 0 to 2030
Native,Th1rd or H1gher Native. Second Foreign-Born Total Training Age
Soutce. Census ~ l'rrl<in M)oets CDF 2012
Number (thousands)
16 805
-168 653
and this number is projected to increase ro a majori ty (51.296) in 2030 (Exhibit 6.2). Meanwhile, those from other U.S. states are in decline: their projected share of 15.396 in 2030 wiiJ be less than half what it was in 1990.
The California-born already accounted for a large share of the growth in the working age group in the last 20 years (6396). The 2.6 million increase more than offset the 1.8 million decrease among nativeborn from other states. However, in the coming 20 years the California-born a re projected to assume a pre-eminent role. Their 3.7 million increase amounts to 11296 of aU the growth among the working age, because it offsets both the continued decline in working age residents born in other states and the very slow growth of the foreign -born. The unavoidable implication of these projections is that future growrll of California's labor force will increasingly rely 01~ our homegrown residents.
Speoal Attention to the Tram1ng Age Res1dents
The projections for the wo rkers in training ages, 18 to 24, underscore these findings. I n fact, the generational changes occur earliest for the younger segment, and we see in Exhibit 6.3 that the foreignborn share already declined by 2010 to 20.096, barely half the foreign born share of all working ages. Over
26 USC PopDynamics Research Group
Share 2.4
123.3 -25.7 100.0
Number (thousands)
-48 330
-154 128
Share
-37.2 257.8
-1 20.6 100.0
the coming 20 years the foreign-born share is projected to fall to only 15.696 of the training age group. Meanwhile, the second generation make up 2~.296 of the training age population, three times that of all working age, and the share is projected to rise to 36.3% in 2030.
Simply stated, the second generation accounted for all the growth in the training age group over the last 20 years and is projected to do so over the ne.xt 20 years. In fact, in the coming period, the other segments are expected to decline, meaning that without the growth of the second generation (by 330 thousand), the total training age population would shrink. As it is, the growth of the total training age population is projected to subside from 653 thousand in the last 20 years to only 128 thousand projected in the coming 20 years.
This underscores how vital the second generation will be both as a source of labor force and as the major source for replenishing the work force that would otherwise be depleted through increasing numbers of retirements.
California-born status also has already increased sharply among young training age residents. We see in Exhibit 6.4 that the California-born share was already 50.196 in 1990 and climbed to 69.2% by 2010,
216

Exhibit 6.4: California Origins of the Training Age Population and its Growth TrainingAge 18 to 24
Number (thousands) Share ofTotal
California-Bam Other US Bam Foreign-Born TotaiT raining Age
1990 1,657
691 960
3,308
2010 2030 2,741 2,934
427 518 792 638
3,961 4,089
1990 2010 2030 50.1 69.2 71.7 20.9 10.81 12.71 29.0 20.0 15.6
100.0 100.0 100.0
Growth 1990 to 20 I 0 Growth 20 I 0 to 2030
Number (thousands)
Cal ifomia-Bom Other US Born Foreign-Born Total Training Age
Soclte: Censu5 &reau, Plllcn M)ers CDf 10 I 1
1,084 -264 -168 653
which is about that same share as projected in 2030. Over the last 20 years the growth in California-born dominated all growth in the training age population, with an increase of 1.1 million while there were declines among both the other U.S. and the foreign born. Looking forward 20 years, much less growth overallls expected in this age group, but the California-born are projected to dominate.
Thus we arrive at a similar conclusion for the California born and for the second generation, the two dominant growth groups, which, it should be understood, overlap in membership. Yet the growth of the California-born is greater because it draws on population members who are both third and second generation.
Racial and Hispanic Make-Up of California's Homegrown
So important is the ri~;e of the California-born population that we examine it a little more closely for both working age and training age residents. Who are these new homegrown contributors to the workforce-specifically, what is their race or ethnic identity? For this assessment we compare the racial and Hispanic composition in 2010 and 2030 (Exhibit 6.5). In general, the white share is receding among the training age and working age. By 2030, it is
Number Share (thousands) Share 166.1 192 150.0 -40.4 90 70.6 -25.7 -154 -120.6 100.0 128 100.0
projected that only 23.5% of the training age population will be White, while that will be true of 36.1% of those in working age group. In contrast the major group growing is Latino. By 2030, it is projected that 58.1% of the training age group wi II be Latino, as will be 46.0% of the working ages.
Overall, these findings indicate that California's work force and economy will be increasingly dependent on Latinos. With Latinos' large share of the training age population in particular, it will likely prove necessary to include Latinos as a central part of any plan to facilitate job training or to promote educational opportunity.
Conclus1on
Workforce changes projected for the coming 20 years look very different from those seen in the last 20 years. Where the growth has been among the foreignborn, now growth is almost all among native Californians, many but not all of whom are the children of immigrants. Many are Latino, but not all. In view of the soaring senior ratio discussed above in Section 3, the future will require contributions from productive, well-trained young workers of every sort.
Califomia G~nerational Proje<...'tions I 2.7
217
Exh1brt 6.5 Cahfom1a-Born Rae tal and Hispanic Composition, Working & T ra1ning Ages. 20 I 0 and 2030 100.0
90.0
80.0
70.0
60.0
50.0
40.0
30.0
20.0
10.0
0.0
Ages 18 to 24
Sot.m; p,~ CDF 11 Gellero(l()(l(l/ PM~s
28 USC PopDynamics Research Group
Ages 25 to 64
8 NHWhlte
•NH Black
• Asian & PI
• Am. lndlin
• Hispanie
Mldn M~ COF 2012
218
7 A Composite Portrait: Putting the Pieces Together
Previous sections of this report have focused oo specific population segments, children, working age, seniors, the foreign born, and those born in California. This section provides an overview of how the different segments fit together, a snapshot of the 2010 population "from 30,000 feet. • It then compares this snapshot with one of the situation two decades earlier, in 1990, and one projected ahead for 2030. Together, these snapshots provide a time-sequence graphic summary of California's coming generational transition.
They show how three large demographic waves, the products of past episodes of rapid growth, shape the projections of California's population for the coming decades: native-born baby boomers driving the coming increase in retirement-age seniors relative to the population in prime working age, immigr-ants who came in the surge in the 1980s and 1990s now dominating a more settled and aging foreign-born population, and the large cohort of children born in the 1990s and early 2000s forming the basis for a new and rising homegrown majority in the state.
2010
These composite snapshots of the generations take the form of"age-nativity pyramids• for California, starting with 2010 (middle graph in Exhibit 7.1). Modeled after the widely used age-sex population pyramid, the age-nativity pyramid shows five-year age segments, from the youngest at the bottom to
the oldest at the top. The central vertical line divides the population by nativity, with the foreign-born to the left and native-born on the right. Within the foreign-born, the shading denotes decade of arrival, ranging from the most recent in the lightest tone to the earliest (and now longest resident) in the darkest. Among the native-born, those born in California (shown in light green) are distinguished from natives of other states.
In this figure, the California-boom generation (born in the 1990s and early 2000s) can be clearly seen in the under age 20 segments to the right, and the immigration surge generation in the bulge to the left, peaking at ages 35 to 44. Slightly higher, the relatively large post World War II Baby Boom generation is also visible in the bulge to the right, with the peak of the California-born segment at ages 45 to 54 and those from other states five years higher.
1990
This is quite a different portrait from observed for 1990. As shown in the top panel of Exhibit 7.1, the immigration surge generation can be seen in the midst of its growth, when it was newly arrived. At that time the foreign-born population was much younger on average than in 2010. Among the nativeborn, both segments of the Baby Boom generation were twenty years younger and their numbers were substantially larger than in 2010. By the latter date, the numbers had been whittled down by periods of
California (;enerarional Projections I zy
219
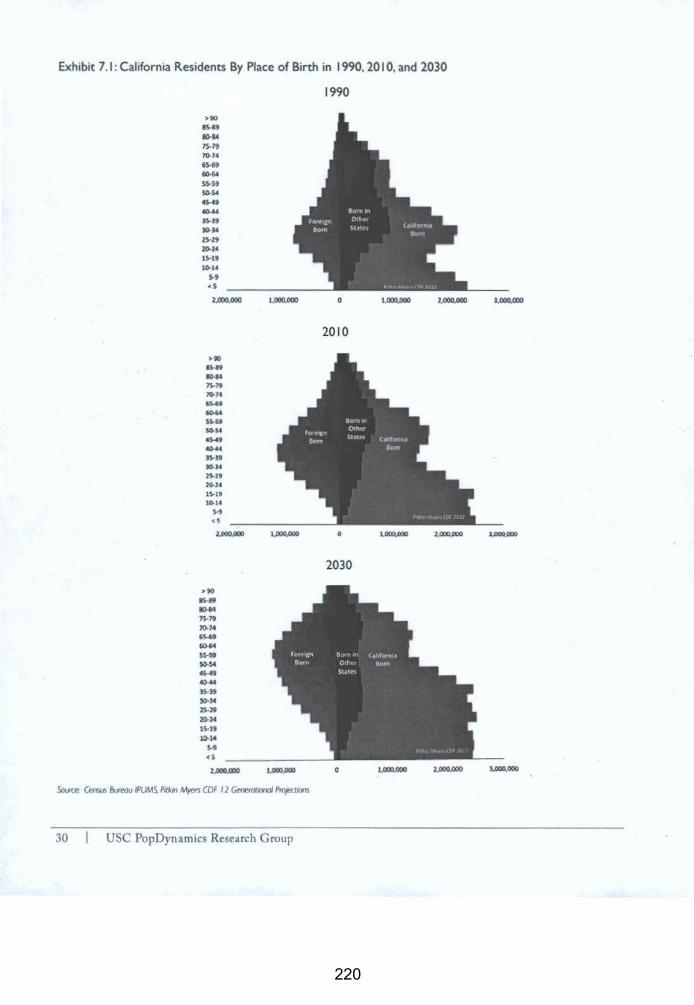
Exh1blt 7.1: California Residents By Place of Birth in 1990, 20 I 0, and 2030
1990
>to 15-19 10-11 1So19 '11).)4
6W9 -$S.$t ~~ twJ
tO-&A JS.JJ ».SO lHt l0-10 U.lt 10-14
s-t <S
2.000.000 1,000.000 0 1,000,000 2.000.000 3.000.000
20 10
>to IS49 -7Ht JO.U --swt 51>14 ..Wt --Ss-Jt ».SO 7s-ft 20.24 1S.19 lO.U
H <S
1.000.000 J.ooo.OOO 0 1.000.000 l;t1110.000 1.000,000
2030
>to --1So19 7(1.7. 6s-69 -SS·H ~s. -<1044 lS.st ».SO :IS-:19 20-14 ts-lt 10-1.
H <S
1.000.000 J.ooo.OOO 0 t.ooo.ooo t.ooo.ooo 3,0CIO,COO
Swc~· unsus 8c¥rou IPUMS. Pidan M)'M CDF I 2 Gentfooonol l'tOJ«VVf'S
30 USC PopDynamics Research Group
220
our-migration, heavy in the 1990s and more moderate bur still substantial after 2000.
Back in 1990 the beginning of the California baby boom is discernible in the youngest age segment. It is nottworthy tha.r a fourth largt generation is also visible in 1990, namely the migrants from other stares who arrived during the 1950s. These residents can be seen in the bump at age 65-69 in the component that was born in other states. By 2010 this once prominent group was no longer visible in the age-nativity pyramid because of the cumulative impact of mortality as the cohort advanced in years.
2030
We can also trace all the cohorts forward in time to 2030, when they are 20 years older. The 2030 pyramid, on the bottom in Exhibit 7.1, shows them as climbing a ladder to a later stage in life. The Baby Boom and immigration surge generations will be older, with some shrinkage among the Boomers due to mortality. The homegrown, California baby boom generation will continue to mature, and its oldest members will near 40 years of age.
Since this pyramid is based on a projection, there is unavoidably some uncertainty about its exact shape. If immigration is higher than assumed in the projections, it would expand the foreign-born segment toward the left with more new arrivals, and if lower than projected would compact the segment toward the right. Similarly, any increase in fertility would expand the native-born segments to the right (but only in the recently born age groups). And any deviations from the assumed levels of domestic migration would have corresponding repercussions for shrinking California-born segments, if greater out-migration, or growing the Other-U.S.-born segments, if greater in-migration than currently assumed. However, barring large and unexpected shifts in the occurrence of migration and fertility, the main features and general shape of the 2030 population should resemble the pyramid in this figure.
It should be pointed out that one substantial change between 2010 and 2030 would be not affected by surprises in any of these areas. The projected spread at the top of the pyramid occupied by the old-old results
from continued modest declines projected in mortality rates combined with growing cohort sizes. For almost a century even the largest changes in elderly mortality rates have occurred gradually, so any change large enough, and sudden enough, to substantially ch:tnge the projected increase in the oldest population by 2030 would be highly unusual.
The Imprint of Different Histories of Settlement
Each of the major race-ethnic groups in California bas a different history of residence in the state, and this is reflected in their unique age-nativity profiles. Pyramids projected for each in 2030 are shown in Exhibit 7.2.
Whites and Blacks, at the left, are predominantly native-born populations with relatively small foreignborn numbers evident on the left-hand side. (Note that the horizontal axes for Blacks and Asians and Pacific Islanders are stretched so that each unit represents a third as many people as in the two upper graphs, for Whites and Hispanics.) White and Black pyramids both show relatively little variation from old to young ages and both reveal the Baby Boom and California baby boom generations as bulges in the age structure. The pyramid for Whites appears slightly top heavy, indicating an older population on average, while that for Blacks is somewhat broader below the middle.
On the facing page, in the second half of Exhibit 7.2, we see projected population structures with large numbers of immigrants. The foreign-born shares are relatively and in absolute numbers much larger than for the Whites and Blacks, and especially prominent for Asians. At the bottom of these pyramids, at younger ages, larger native and California-born numbers push the pyramids rightward. Since the parents of the young people near the base of each pyramid are to be found higher in the same pyramid, this tilt from top left to lower right graphically depicts a generational transition.
For Hispanics, the younger, California-born generation, is projected to outnumber the older and predominantly foreign-born generation, but for Asians, the relative sizes of the generations are projected to be the reverse, a result of much smaller family sizes and lower fertility rates among Asians.
California Generational Projections 31
221
Exhibit 7.2: Califomia Residents by Race and Place of Birth in 2030
White
>90 85-89 80-84 75·79 70.74 65-69 60-64 55-59 5o-S4 45-49 4G-44 35-39 30.34 25-29 20.24 15-19 10.14
5·9 < 5
Forel&n Born
Pitkon-Myers COF 2012
1,500,000 1,000,000 500,000 0 500,000 1,000,000 1,500,000
Black NH
> 90 85-89 80-84 75·79 70.74 65-69 60-64 55-59 so-54 45-49 4G-44 35-39 30-34 25-29 2G-24 15-19 10.14
5-9 <5
Forelcn Born
500,000 250,000 ~ PltJ<nM}MCDF 11~~
Reflections on Common Heritage and Shared Destiny
The advantage of the age-nativity pyramid is that it affords a global overview of the California popuLation, combining all the elements discussed elsewhere in this report. The newly discovered image of planer Earth from space led to a new perspective on environmental connectedness and shared fare. How might the fresh encounter with these composite overviews lead to new perceptions about California residents?
32 USC PopDynamics Research Group
0
Bom
250,000 soo,ooo
The pyramids certainly make plain the age structure and life-cycle that aU hold in common. Each resident, no matter the birth place, is subject ro the same aging and eventual mortality.
But there is another striking and significant commonality that is visible. Despite all rhe differences among the four race-ethnic pyramids projected for 2030, what stands out is the overwhelming dominance of rhe California-born shares at young ages. Concentrated as it will be among children and young
222

Hispanic
>90 85-89 80-84 75-79 70-74 65-69 60-64 55-59 S0-54 45-49 40-44 35-39 30..34 25-29 20..24 15-19 10..14
5-9 <5
Fore len Bom
Pitkin-Myers CDF 20U
1,500,000 1,000,000 500,000 0
Asian & PI
>90 SS-89 80-&4 75-79 10-74 65-69 60-64 55-59 S0-54 415-49 40-44 35-39 10-34 25-29 20-24 l.S-19 10-14
5-9 <5
500,000
Soc.-: AWn M)oot> CDF 12 GenttatJOnOI Prqf<IJC)riS
250,000
adults, the new homegrown majority will be a generation that shares a common heritage of birth and place.
With foresight, there is now an opportunity to nurture and strengthen the bond of this basic heritage through policies. It is hard to imagine that the identities defined by race and ancestral origin will rapidly fade. However, it is equally difficult to imagine that they wiJI persist unmodified into the indefinite future. As they do fade, sooner or later, there is likely to be an opening for identities defined by birth and place to assume greater importance in people's lives.
0
500,000 1,000,000 1,500,000
250,000 500,000
Califomia Generational Projections I 33
223
8 Methodology and Qyestions and Answers About the Generational Population Projections
In this section we give a description of the methodology and assumptions used to generate the generational population projections for California. We also provide a relatively less technical description of the methods and assumptions in a Q&A format. A more detailed description of the California Demograpb.ic Futures (CDF) model (but not the assumptions used in 2012) can be found in Pitkin and Myers (2011a).
Methodology
The specific methods used here have been modified from those developed and used for previous population projections by the authors, notably of California population by nativity based on 1990 Census da.ta (Myers and Pitkin 2001) and on 2000 Census data (Myers, Pitkin, and Park 2005). The same methods are used here and applied to the 2010 Census base population and have been extended to model the state of birth of the native-born population, whether in California or another state, in addition to nativity and immigrant generation. A more detailed description of the current model is given in Pitkin and Myers (2011a).
Cohort Component Method
Population is modeled and projected using the cohort component method, which tracks the different kinds of demographic events or components that account for all population changes: births, or vfertility," deaths, or "mortality," and the numbers of immigrants and emigranrs. A distinction is made between in-migrants
from outside the U.S., "immigration," and migrants moving between California and other states, "domestic migration."
A standard method of modeling and projecting population change, used e.g. by the U.S. Bureau of the Census (e.g., 2000) and State of California Department of Finance (DOF, 2007), tracks these components for birth cohorts, those people born in the same year (and of the same age), because per capita rates of demographic events vary greatly over the human life cycle. Fertility, for example, is nil for young children and men. There are also large differences across age groups in per capita rates of mortality and migration. For example, the number of deaths in the population increases when there are greater numbers of elderly with higher rates of mortality. By tracking the population of different birth cohorts as they age over time, the cohort component method can therefore model variations over time in the total numbers of births, deaths, and migrants more accurately than alternative short-cut methods.
There are also considerable differences in death rates both between the sexes and among races. In order to measure the impacts of these differences as the composition of the population shifts over time the cohort component model therefore also splits the population by sex, race, and Hispanic origin, thereby identifying the population in each of a thousand unique cohorts defined by birth cohort (or age), sex, and race or ethnicity in each year (i.e. 100 ages times 2 sexes times 5 or more race-ethnic groups).
California Generational Proiections I 3· J ;l
224
If the future assumed component rates are specified in sufficient detail, this model can be applied to project a base population forward in time.
Nat1v1ty and Generat1ons
The cohort method we use to model the population of Californ]a extends the conventional model to identify the population furthe r by nativity, i.e., whether native- or foreign-born; for the foreign-born, by year of arrival in the U.S.; and, for rhe native-born, by nativity of mother (defining the •second~ and •rhird" generations) and by state of birth, California or other. We do this for two reasons.
First, there is evidence of substantial variations in demographic rates among nativity groups, by foreignborn duration of residence in rhe U.S., and by nativeborn state of birth.
'rhere are large differences in fertility between native-born and foreign-born women. Using viral statistics data (birth records) for California, we estimate that average lifetime fertility (the •total fertility rate") for foreign-born Larinas between 2000 and 2008 was 71% higher than the rate for native-born Latinas, and there were substantial though smaller differences by nativity for nonHispanic women. 14
MortaHty rates are lower for foreign-born than native-born populations of the same ethnicity (Sevak and Schmidt 2008). IS
Ahmed and Robinson (1994) estimate large variation in rates of emigration from the U.S. by the foreign born, 19% of the immigrants who had been in the U.S. Jess than ten years (at the start of the decade) compared with 9 % of those who had been in the U.S. ten to 19 years. (Although there are no reliable data on emigration of the native-born population, the rates are assumed to be much lower.) Rates of domestic migration vary by state of birth. For example, California residents who were born in other states were 2 to 5 times more likely as those born in California to move from California ro another stare between 1995 and 2000.
Second, a great deal of information on nativity and duration of residence in the U.S. is implicitly modeled but not retained or reported in the generally used cohort component method. Such information can therefore be made explicit and available to data users
36 USC PopDynamics Resc.1rch Group
simply by being separately ra.llied and reported. It is, in a very real sense, a by-product of the generally used cohort component method and can be utilized if the framework of the model is extended to capture it. In fact, the U.S. Census Bureau did this when it issued its first national population projections by nativ-ity, though not by immigrant generation or year of arrival, and Pass ell and Edmonston ( 1994) developed projections of the U.S. population by nativity, immigrant generation, and origin.
Temporal and Spatial Structure
The model starts from Aprill, 2010, the date of the 2010 Census and projects the population to July 1 of 2010 and subsequent years th.rough 2040 in one three month increment and then in one-year intervals with components of change determined by the assumptions described below.
The model is also run in simulation or calibration mode for 10 years starting from rhe April 1, 2000 Census 2000 base population. This is done for the purpose of calibrating the demographic rates to vital statistics data (births and deaths) for the period and to the changes in population recorded in the two censuses. The simulation results are also merged with 2010 1-Year Amerh:an Community Survey estimates to estimate base-year population characteristics of birthplace and year of arrival for the total population. Data for 2010 thus have been synthesized from multiple data sources and, although they reflect the census, they may differ slightly from the American Community Survey estimates for population subgroups.
In addition to California, the model identifies the populations of two other regions, (1) the rest of the United States, with which California exchanges domestic migrants, and (2) the rest of the world, the source of immigrants and destination of emigrants. The population of the rest of the United Srares region is modeled in order to estimate the number of potential domestic migrants to California.
Population Characteristics
The model identifies five murually exclusive race and origin groups: 1) Hispanics and non-H ispanic 2) Whites, 3) Blacks, 4) American Indians, and 5) Asian and Pacific Islanders. This categorization follows
225
the Hispanic-dominant convention, meaning that all Hispanics are tallied first, and then the remaining population is identified by race. Thus, for the sake of brevity the qualifier ~non-Hispanic• is implied even when it is nor explicitly stated. These categories are combinations of those identified in the U.S. Office of Management and Budget standards of 1977 and are the same as the race-origin categories used in the California Department of Finance's population projections and estimates prior to 2001.
The current federal standard identifies 31 race categories in addition to Hispanic and non-Hispanic origin, the 2007 DOF projections identify seven (Pacific Islander and Asian are now separately identified as well as a single non-Hispanic "multi-race8 category) and the latest (2008) Census Bureau national projections have five individual races plus multi-race by Hispanic origin.
For purposes of projections, trends in demographic rates must be grounded in consistent histotical trends that can be meaningfully traced from the past to present and into the future. There are too few observations of past births and deaths according to the new race categories identified by OMB in 1997 for this purpose. There are also unresolved questions about the consistency of the earlier data with the selfreported race data in the Census. Moreover many of the categories have populations that are too small to be reliably modeled and hence must be aggregated (as with the DOF projections). The need for population data on race that are comparable with earlier data is well recognize4 and has been filled by the National Center for Health Statistics Mbridged• race estimates that translate the 2000 Census Summary File 1 detailed ag~-sex-race-origin data to the earlier race standards using a probabilistic assignment method.
Race and Hispanic origin for the population born after 4/1/2000 is also probabitistically assigned based on the mother's race and origin, since e.g., some children of Hispanic women are not considered as Hispanic by the respondents, presumably because their father is not Hispanic, and conversely some children of non-Hispanic mothers are considered to be Hispanic. The probabilities for assigning race and origin to projected births are from the 2000 Census and based on the reported race and Hispanic origins of minor children and mothers living in the same household.
The resulting projections should not be thought of as measures of future racial self identification. That identification is fluid and will surely change due to patterns of intermarriage and evolving societaJ norms. Instead, the projections are an ascription of racial heritage and track the long-term evolution of major racial groups based on today's norms.
The model splits the population into three immigrant generations: the foreign-born, the ~first generation" or •immigrants"; the children of native-born mothers, the Msecond generation"; and children of native-born mothers, the ~third generation.~ Substantial ambiguity characterizes definition of the second generation, whether these are the children of two immigrant parents, of one immigrant and one native-born parent, or of an immigrant mother. We opt for the latter definition, primarily because there is much more complete and, presumably, accurate data on the on mothers' nativity than fathers' in birth records.16
(See also discussion of alternate definition of second generation in Section 4.)
The native-born population is also identified by state ofbjrth, whether California or other state. For the population born before 4/1/2000, state of birth is based on 2000 Census data on place of birth. For those born after that date, it is determined by the modeled or projected location of birth, California or other U.S., recorded, and retained in later years as the cohort ages.
Immigrants' period of arrival in the U.S. is identified by single years starting in 1980; those who arrived earlier are combined into a single category. For the population born before 4/1/2000, year of arrival is derived from the 2000 Census question ~when did this person come to live in the United States?" For those born after that date, it is tallied by the modeled (simulated or projected) inflows of immigrants from, abroad.17
ProJecttons Assumpttons
The following assumptions were made about future component rates and flows in the projections:
Births are projected by applying age, race, origin, and nativity-specific birth rates to the population of women of childbearing age. The rates assumed in future years are derived from the U.S. Census Bureau
CuliliJrnia Generational Prqj<.:crions 37
226

(2000) projection middle series schedules. Differences between rates for native- and foreign-born women of the same race, Hispanic origin, and state of residence are calibrated to U.S. Vital Statistics reported births for 2000-2008 and held constant in future years.
Deaths are projected by applying age, race, Hispanic origin-specific mortality rates to the projected population. The rates assumed in future years are linked to the U.S. Census Bureau (2000) projection middle series schedules. The rates for California are calibrated to deaths by age and sex reported in U.S. Vital Statistics 200Q-2009, and differences between the national and California rates are held constant in future years. The same rates are applied to the nativeand foreign-born population.
Emigration. is estimated for the foreign-born population based on per capita rates that vary by nativity, duration since entry, age, sex, race, and origin. These rates are from Ahmed and Robinson (1994).
Immigration is projected based on independent assumptions about future immigration to the U.S. and the share of U.S. immigrants that will come to California.
U.S. immigration is based on the results of our Delphi-style survey of immigration experts regarding total immigration flows anticipated in 2015 and 2025, 1.04 million and 1.15 million, respectively (Pitltin and Myers 201lb). T he number of immigrants in each year through 2025 is interpolated between the estimated 2009 immigration of 790,000 and these two estimates. Thereafter it is held constant.
California's share of U.S. immigration is held constant at the shares estimated in the 2000-2010 calibration of the model, 17.4%.
Domestic migration rates between California and the rest of the U.S. are held constant at the levels estimated in the 2000-2010 calibration of the model, matching the average rates of the decade. The domestie migration rate schedules to and from California, by age, sex, race, Hispanic origin, nativity, and state of birth, are averages of the periods 1975-1980, 1985-1990, and 1995-2000 as calculated from the Censuses of 1980, 1990, and 2000 live-year mobility data.
38 USC PopDynamics Research Group
Questions and Answers About the California Demographic Futures (CDF) Generational Population Projecttons
1. How do the Pitkin-Myers/USC population projections compare with those issued by the California Department of Finance through its Demographic Research Unit?
Population projections issued in 2007 by the Demographic Research Unit of the California Department of Finance (DOF) remain the official forecasts for the state as of March 2012 although they wiU be updated later this year to account for tbe 2010 census results. The DOF projections indicate that the state's population will grow to 54.2 million 59.5 million by 2050. This compares with. our projection of 51.2 million (8.3 million or 14% lower). OveraU, the growth projected between 2010 and 2050 is 29% lower in our new projections than the 2007 DOF projections.
Projections to 2050 are inherently less certain than those for 2030 or other ncar-term dates. The year 2030 provides a good focus for comparing projections, because demographic changes arc already substantial by that date, and also because the 20-ycar time horizon may be useful for a greater number of policy and planning applications. For 2030, the DOF projects a population of 49.2 million as compared with our projection of 44.8 milHon, which is 4.5 million (9 %) lower. Over the two decades 2010-2030 we project population growth at an average rate of 3.7 million per decade as compared with an average increase of 5.0 million per decade projected by the DOF.
Although the two projections are both made using a cohort component method and break the state's population out by age, sex, and race, their content differs in important ways. Our new projections are more current than those released by the DOF in 2007 and provide more population characteristics, including place of birth (California, other U.S. state, or abroad), mother's nativity or immigrant generation of those born in the U.S., and year of arrival in the U.S. of tbe foreign born population. The DOF provides greater geographic detail, with projections for every county in the state, and is expected to issue an updated set of projections later this year.
227
2. Why are the Pitkin-Myers/USC generational population projections lower than those issued by the DOF?
One source of difference between the two projections is that the base population for the DOF projections issued in 2007 is benchmarked to the 2000 Census count while the base population for our projection is benchmarked to the 2010 Census. This is approximately 1.8 million lower than the DOF projection for 2010. (Adjusted for estimated population growth between April 1 Census and the DOF projection for July 1, 2010.)
The second important difference appears to be that our projection incorporates lower future levels of immigration than the DOF. Although the DOF projection does not report separate components of population change, including migration, it does report that migration rates were developed for the decade of the 1990s. These rates are substantially above both the migration rates we estimate for that decade as well as those observed for the decade of the 2000s. According to the DOF, California received .7 million net migrants foreign and domestic combined, during the 1990s (State of California, Department of Finance 2005), while we estimate that domestic outmigration during that decade slightly exceeded net immigration, resulting in a small net outflow of under .1 million migrants. During the 2000-2010 decade we estimate that California gained a net of .3 million migrants, foreign and domestic combined.
Third, since births are projected based on per capita fertility rates, and the majority of immigrants to the state are of child-bearing age or younger, the higher levels of immigration expected under the DOF projections early in the projection period lead to larger numbers of births in later years, thereby compounding the effects of different levels of immigration.
3. How does the population growth projected by Pitkin and Myers compare with growth in earlier decades, i.e., 1990s and 2000s?
We project the population of California will increase by an average of 372 thousand per year between 2010 and 2030. These increases are marginally greater than seen in the 2000-2010 decade and even in the 1990-2000 decade, once the census figures are ad-
jus ted for the effect of increased population coverage in the 2000 Census. 18 In only two past decades did California experience substantially higher population growth. This occurred during the 1980s, when the population increased by over 6 million between censuses, and during the 1950s, when the increase was over 5 million. With these two exceptions, the CDF projections of growth in the state's population are in line with the increases recorded in five of the seven censuses since 1950.
4. How is immigration projected?
Immigration to California from abroad has varied widely in past decades, rising from less than 100 thousand a year during the 1950s to welJ over 400 thousand a year in the late 1980s and since declining to about 350 thousand a year in 1994-2001 and further to 200 thousand in 2009. (These are estimates of gross immigration; net immigration is lower due to emigration, or return migration.) Because of the recent steep decline in immigration, there is currently greater than usual uncertainty about its future course.
To address this uncertainty in selecting the migration input component of our projections, in April 2011 we conducted a Delphi-style survey of ten researchers in the field of immigration on their expectations for the number of immigrants to the U.S. Collective expert opinion was sought as an independent guide for the projections. According to this panel, the mean expected 2015 level of gross immigration to the U.S. in 2015 is 89 %of the 2000 peak. This represents a substantial increase from 2009, which was at 73% of the 2000 level. By 2025 the mean expected level of U.S. immigration reaches 97% of2000.
We then estimated California's share of total immigration to the U.S. This reached a high of39% in 1988 and 1989. Since then this share has declined steadily. Our projections assume that it will stabilize near its current level of 17% of U.S. immigration.
Together, these assumptions imply that gross immigration to California will increase from a low of 199 thousand in 2009 to an annual average of 232 thousand in 2015 and 262 thousand in 2025, in all a 30% increase but still well below the level of the late 1980s.
Calif(>rnia Generational P~jcctions I 39
228

5.What do the Generational Projections assume about domestic migration between California and other states?
For more than two decades California has been losing migrants on net to other states. Outmovers outnumbered inmovers by an average of281 thousand a year in the 1990-2000 decade and an estimated 161 thousand a year between 2000 and 2010. Our projections incorporate an assumption that per capita rates of moving to and from California will be maintained at their 2000-2010 levels. However, when these rates are applied to the changing composition of the California population, they yield ever smaller numbers of outmigrants, falling to fewer than 10 thousand outmigrants a year by 2030. This projected shift is caused by declining numbers of the non California U.S.-born population in California, a segment with much higher rates of out-moving than the California- born and foreign-born populations. In addition, this decl~ne is compounded by the aging of this population because rates of migration are lower at older ages than earlier in life.
6. How are births and deaths projected?
Births and deaths are projected using per capita rates of fertility and mortality that allow for variations by sex, age, and race as well as nativity. These rates are first bench marked to actual births and deaths recorded by the California vital statistics system in 2000-2009 and then projected to change in the future in proportion to the corresponding {middle series) rates used by the U.S. Cen.sus Bureau {2008) in its most recent projections of the U.S. population.
Due to the aging of the population, these per capita rates lead to a 34 % increase in the annual number of deaths between 2010 and 2030 and 64% by 2040. The number of births, however, remains relatively stable in a range between 522 and 545 thousand a year during the entire period of projection. This reflects the relative lack of population increase in age groups of women most likely to have births
7. Are the Pitkin-Myers/USC generational projections bench marked to 2010 Census counts?
Yes. However important data were not collected in the most recent census. Data on nativity and migration not in the 2010 Census are derived from two other principal sources, the 2000 Census and the 2010 American Community Survey (ACS).
40 USC PopDynamics Research Group
The generational projections are calibrated starting with population counts from the 2000 Census, with detail by age, sex, race, nativity, including whether or not born in California, year of arrival in the U.S., for the foreign born, and detail on immigrant generation (mother's nativity, from the Current Population Survey) of the native born population. The CDF model simulates annual population changes forward from 2000 to Apri11,2010, with components of change calibrated to vital records counts of births and deaths and estimates of immigration and domestic migration from the annual2001-2010 ACS; the immigration and domestic migration components are further calibrated to match 2010 Census counts.
The resulting simulated population for Aprill, 2010, with full detail by age, sex, race, nativity, year of arrival, state of birth, and immigrant generation, is then scaled to match the 2010 Census (SF1) population by age, sex, and race. This population is then projected 3 months forward to July 1, 2010, using the CDF model, and is then benchmarked (controlled) to estimates from the 2010 ACS (PUMS) of nativity, place of birth, and year of arrival cross-classified by sex and race. 19
8. How many race categories ue identified in the PitiUn-Myers/USC projections?
Like DOF, we treat I lispanidLatino as if it were a race, and subtract Latinos from the other race categories. A particular challenge for projections is the presence of multiracial populations because they were not recorded in earlier decades and they are likely to be changing into the future. For projection purposes it is useful to reassign non-Hispanic multiracial populations to five major race categories. These same categories are used in the bridged-race population estimates put out by the National Center for Health Statistics for use in calculating birth and death rates. Since bridged- race estimates for the 2010 Census had not been released as of March 2012, we used approximate estimates based on available 2010 Census SF1 tables. In the present context the five race categories may be thought of as projections of predominant radal heritage, not future identity.
229

Endnotes L The turns Htspamc and Latino are used interchangeably in this report. The federal data system categorizes data most often by the term Hisparuc, wlule publlc discussions in California more often uses Latino. This report uses both tcnns.
2. The to-year increases and estimates ofimmigration are calculated from offidal Census counts, which nuy not account for all the residents ~ctually present. If we rake account of increases in population coverage between censuses, that alters the apparent growth and immigration and could imply that inanscs during the 1980-1990 decade were somewhat higher than shown lltld thOle in the following decade somewhat lower.
3. We noted the trend toward reduced immigration 2l early u 2001 and projected it to continue. See Myers and Pitkin 2001.
4. The historical annual series of California btrths is maintained by the Demographic Research Unit of the California Department of Finance. Retrieved from http://www.dof.ca.gov/researchl demographic/reportslprojcc:tionelblrths/
5. Sometimes people as young as 16 or 18 arc a55umed to be working age, but that is more appro~riatc in cases of farm labor or other manual occupations. People younger than 25 in our modern post-iodusuial economy arc more often engaged in education, apprenticeships and part-time work. Those :tgcs 18 to 24 should. be comidercd of training age and not expected to bear the burden of supporting the elderly.
6. Pitkin and Mycrs,2011, "Surveyof~rt Opinion on Future Level of Immigration to the U.S. in 2015 and 2025 Summary of Rault8" A Dcmognphic Futures report of the USC Population Dynamics Rc:searc:h Group, May 2011 uri http:llwww.usc.edu/ schoolslpricclfutureslpd[/2011_pitkin-Mycrs_Delphi .pdf. Sec slso Section 8 ...... .
7. Myers and Pitkin (2001)
8. The smaller numbers at the top of each column show the numbers of foreign born who artivtd in the fil'$t three (or SIX)
months of the current >"'ar.
9. The majority ofimmign.nts arrive as young adults or children, but some are older or even elderly. Pu ome passes, the survh~ng members of the cohort on average arc younger than those who die, and as a result the average age of the survivors Is slightly reduced below what would be Clllculatcd by aummlng their average age at time of arrival and the subsequent amount of elapsed time.
10. Even though they arc nattve-born, the children live in immigrant families. The youngest grow up to resemble the characterisncs of naovc-bom wtth native parents, )"'t they always retain this close bond with the immigrant generntion.
11. The Generational Proj«tions identify the second generation as U.S.-born children wtth foreign-born mothers, since tbc vital statistics fertility rates used in the CDF modd are tracked by women's naDVIty.
42 USC PopDynamics Research Group
12. The model estimates (for 2010) and projections {to 2030 and 2040) arc used as the baSts for estimating the more expansive second generation population defined as the populo non with at least one foreign-born parent. The csumates shown here are based on the obscn.-ed ratios of the second generation popuhttons according to the tWO dclininoM in the Current Population Survey (200()-2002 average); these ratios arc calculated and applied sepantely for each race and borth cohon group. For 2010, the resulting estimate is 21'16 (1.56 million) higher tb.n the modeled-defined second generation population o£8.86 million.The second generation population for 1990 is cstim2tcd as fnactions of the total native-born popuhtion in the various birth cohorts jointly defined by race and ~·For older cohorts, these shares arc taken from the 1970 Census (I ntcgrated Public Use Microdata Sample data), whicl1 rcrorded parents' nativity, and for younger cohom, the shares a.rc from the Current Population Survey (200()-2002 average).
13. This classification does not ignore the fact that adults older than 24 also may be engaged in job training or that those younger than 25 may already be working full-rime in demanding jobs. Rather the age gtoupings arc intended to capture the bulk of those engaged In the different sets of activities.
14. Johnson (2007) finds some variation for earlier )"'ar8 but his results for 2005 arc very similar to these.
15. Due to the limitations of data for calibrating mortality 1"11tcs, the CDF model docs not reJl.ect differences tn mortality 1"11tcs by nativity as tt docs for other components.
16. According to the 2004 CurTent Population Survey, fewer U.S. adults age 18 or older arc classified as second gcne1"11tion under the smct twO-parent rule ( 14.6'16) than under the looser, oneparent definition (20.8'16). The mother• based defirurion yields :an intermediate prcvalcnce of second generation status (17.6'16).
17. The census data on tmmtpnt arrivslt provide a morc inclusive count than arrivals recorded by the Office oflmmiption Statistics. The lat1cr source only Includes legally admitted residents, omomng the unauthorized arrivalJ and also omitting temporary residents whose '~sa status is for purposes of education, temporary employment, or the llkt:.
18. Net coverage of the population increased by approximarcly 2 'l6 in the 2000 Census relative ro the 1990 CeMus. We estimate char the relative increase in coverage in California was slighdy greftter and accounted for over 700 thounnd of the 4.1 million in~se in total population r«ordcd between the 1990 and 2000 Censuses.
19. Although it would be possible to obtain esttmatcs of birthplace and =act year of entry by exact age from the 2010 ACS mlcrodata, the sampUng variability is much greater than the correspondmg (cohort) estimate from the 2000 CciUIIs 5'16 nucrodata (PUMS). We therefore beUeve that the modeled updates of the age by birthplaa: by year of arrival dismbudom arc more reliable tban the corresponding direct detailed cstimaru &om 2010 ACS. Observed dllfcrena:s between the simulation results and the Census mll)' be explained by changes in CO\"Cr:tgc between the 2000 and 2010 Censuses.
230

References Ahmed, 8a5bir and J Gregory Robin50n. 1994. "Estimotes of emigration of the foreign-born population 1980-J990."Technicol paper. Woshington, DC :U.S. Bureau of the Census.
Frey, WiUiam. 2010. "W1U Arizona Be Amenca'a Furun:?" Brookings lnstirution, Washington, D.C. www.brookings.edu/ opinion&~ 2010/0428_arizona_&cy.aspx
john50n, Hans.2007. "Birth Rates in Callfornia."California Counr5 9:2. San Francisco, CA: Public Policy lnstirutc of California.
Myel'$, Dowell. 2007. lmmit;rants anti BODmm: Ftnging a Ntw S«ial CMfrllrt for tht Frnure o/ llwurira New York: Russell S~ Foundation.
Myers, Dowdl and John Pitkin. 2001. "Demographic Furures for California." Population Dynamics Group, School of Policy, Plonning and Development, Univertity of Southern Californio, University of Southern California.
Myers, Dowell and John Pitkin. 2011. "Assimilation Tomorrow: I low America's Immigrants Will integrate by 2030,"Center for American Progress, Washington, D.C.
Myers, Dowdl,Jobn Pitkin and Juhc Park. 2005. "California Demographic Fururcs: Projections to 2030, by Immigrant Generations, Nativity, and Time of Arrival in U.S., Full Report," Population Dynamics R~ Group, Un1vcr11ty of Southern California, Univcniry of Southern California.
Myers, Dowell, John Pitkin, and Rlcardo !Umuc-z. 2009. "The New llomcgrown Majority in California: Rccogni7.ing the New Reality of Growing Commitment to the Golden Stare, • Special Repon, Population Dynamics R=ocarch Group, Universiry of Southern California.
Myers, Dowell, Ray Calnan, Anno Jacobsen, and Josh Wheeler. 201 1. "Cal1fornia Roller Coaster: Income and Housing in Boom and Bust,l990-20IO; Special Rcpor" Population Dynamics ReseArch Group, University of Southern Califomia.
Pasad,Jef&cy S. and Bury Edmonston. 1994. "Jmm1gration and Race: Recent Trends in Immigration to the United States." ln Edmonston and ~sscl (eds.),lmmigrallon and Ethnic!ty: The Integration of America's Newest Amrtls. Wuhington, DC: The Urban lnsururc Press. NOTE: book title il it.licized after (eds.)
Pitkin,John and Patrick Simmons.1996. "The Foreign-Born Population to 2010: A Prospective Anai)l$i8 by Country ofBinh, Age, and Duration in the U.S.; Journal of !lousing Resellrch.7.
Pitkin,John and Dowell Myers. 2010. "A Predictive Estimate of the 2010 Census Count for California," 2010 Census Year California Profile sertes, Popuhtion Dynamics Research Group, University of Southern California.
Pitkin ,John and Dowtll Myers. 201la. "Projections of the Population of California by Nativity and Year of Entry to the U.S., in Addition to Age, Sex, Race and Hispanic Origin." Pape! Presented ar the Annual Meeting of the Population Association of An1crica.
Pitkin, John and Dowdl Myers. 201lb. 'Survey of Expert Opinion on Furun: Level oflmmigration to the U.S. in 201S and 202S: Summary of Results," Research Mcmonndum, Population Dynamics Research Group, University of Southern California.
Pitkin, john and Dowell Myers. 20 llc. "Projections of the U.S. Population, 2010-2040, by Immigrant Generation and ForeignBorn Duration in the U.S., • Special Report, Population Dynamics Research Group, University of Soutl1cm Californill.
Scvalt. Purvi, and Lucie Schmidt. 2008. "Immigrant·Narivc Feniliry and Mortality Differentials in the United Srates."WP 2008-181. Ann Arbor: Miclugan Rctiremcnr RCSCArcll Center.
Srate of California, Department of Finance (DO F). 2007. Pupulatian Projtctiansfor California anti Its CDuntltJ 2()()()-2050, OJ llgt, Gtntitr anti Rau/Ethnirity. Sacramento, California.
U.S. Bureau of the Census. 2000. Population Projections of the United States by Age, Sex, Race, Hispanic Orlgin,llnd Notivity: 1999 to 2100. Washington, DC.
U.S. Burc;~u of the Census. 2008. 2008 National Population Projections by Age, Sex, Race, and Hispanic Origm:July 1, 2000-2050. Wuhingron, DC.
Califi>mia (icnerarional Proj<.:ctions 43
231
P opDyna mics for more information ... Research Group
usc Price
Copies of all project reports arc downloadable from the website of the Population D)namics Research Group, Sol Price School of Public Policy
http://www.usc.edu/schools/prjce/research/popdynamjcs
Sol Price School Questions on cechnical details should be directed ro of Public Policy Research Director. [email protected]
232

~ Fifth Regional Housing Needs Assessment (RHNA) Cycle Revision Request
All revision requests must be received by SCAG March 15, 2012, 5 p.m. Late submissions will not be accepted. ASSOCIATION GOVliiNMlNT
-- rTRE:::;r.~ .-;:c=;-. E:;:::_. .,~----
March 14, 2012 Date:-------------
Los Angeles County: ___________ _
C Ann Garcia or Larry Stevens ontact: ___________ ___
REVISION REQUEST AUTHORIZED BY:
City of San Dimas Jurisdiction: --------+---l.li~A~ 1 5 2012
San Gabriel Valley . _ , . Subregion: ----------!:~=========d
Ph I .I 909-394-6282
one Ema1: ----------agarcia®ci . san-di mas. ca. us
PLEASE CHECK BELOW:
0 Mayor O chief Administrative Officer Deity Manager
0 Chair of Other:· X county Board -A""'s"""s'""~""'s,..ta"'n""t,......,..,Cr::-.~ty Manager of Supervisors
0 AB 2158 Factors (See Government Code Section 65584.04{d))
0 Existing or projected jobs-housing balance
0 Sewer or water infrastructure constraints for additional development
0 Availability of land suitable for urban development or for conversion to residential use
0 Lands protected from urban development under existing federal or state programs
0 County policies to preserve prime agricultural land
0 Distribution of household growth assumed for purposes of comparable Regional Transportation
Plans
0 Market demand for housing
0 County-city agreements to direct growth toward incorporated areas of County
0 Loss of units contained in assisted housing developments
0 High housing cost burdens
0 Housing needs of farmworkers
0 Housing needs generated by the presence of a university campus within a jurisdiction
Brief Description of Revision Request and Desired Outcome:
Upon reviewing SCAG's Draft RHNA allocation , the City believes that there is a need for a reduction in our allocation. This need is based upon 5 factors: AB2158- Factors 2b, 2c, 3,4, 6 , and the fact that the current allocation is disproportional to the RHNA allocation that SCAG developed. It is imperative to ensure that our projected need is as accurate as possible as it has a direct relationship to the City's efforts in development. We also believe the trend in household growth , employment growth and building activity are overstated. The City hopes that the Appeals Board will consider our request for review and reduce our allocation to show proportionality that reflects our historical, current and future needs.
List of Supporting Documentation, by Title and Number of Pages:
1. Revision Request Letter (4 pages) 2. Calif. Dept. of Fish & Game Map (1 page)
3 Biological Resources Assessment SEA- East San Gabriel Valley (36 pages) & San Dimas Canyon (48 pages)
4. Fehr & Peers Memo (3 pages)
6 . HUD Affordable properties (1 page ) 8 . Growt h Area Map (1 page)
FOR STAFF USE ONLY:
5. City of San Dimas Permit Activity Report (13 pages)
7. RDA Map (1 page ) 9 . Employment Area Map (1 page)
Date _______ _ Hearing Date:--------- Planner: -------
233

234
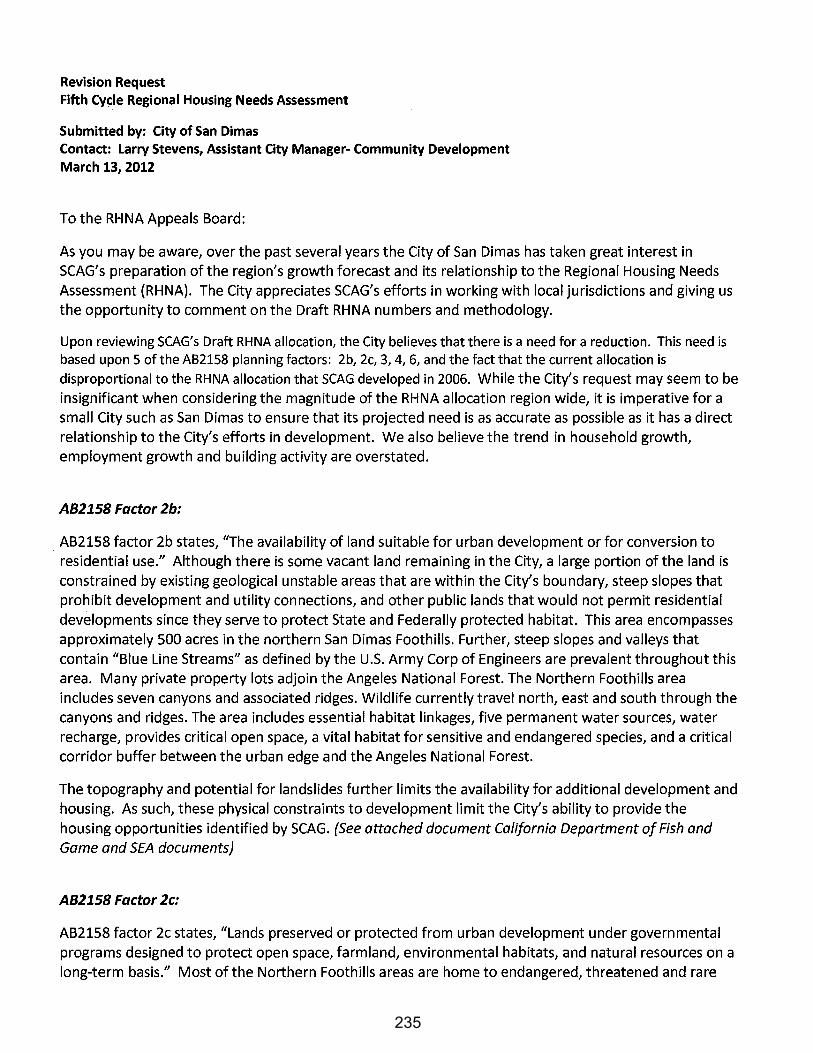
Revision Request Fifth Cycle Regional Housing Needs Assessment
Submitted by: City of San Dimas Contact: Larry Stevens, Assistant City Manager- Community Development March 13, 2012
To the RHNA Appeals Board:
As you may be aware, over the past several years the City of San Dimas has taken great interest in SCAG's preparation of the region's growth forecast and its relationship to the Regional Housing Needs Assessment (RHNA). The City appreciates SCAG's efforts in working with local jurisdictions and giving us the opportunity to comment on the Draft RHNA numbers and methodology.
Upon reviewing SCAG's Draft RHNA allocation, the City believes that there is a need for a reduction. This need is based upon 5 of the AB2158 planning factors: 2b, 2c, 3, 4, 6, and the fact that the current allocation is disproportional to the RHNA allocation that SCAG developed in 2006. While the City's request may seem to be insignificant when considering the magnitude of the RHNA allocation region wide, it is imperative for a small City such as San Dimas to ensure that its projected need is as accurate as possible as it has a direct relationship to the City's efforts in development. We also believe the trend in household growth, employment growth and building activity are overstated.
AB2158 Factor 2b:
. AB2158 factor 2b states, "The availability of land suitable for urban development or for conversion to residential use." Although there is some vacant land remaining in the City, a large portion of the land is constrained by existing geological unstable areas that are within the City's boundary, steep slopes that prohibit development and utility connections, and other public lands that would not permit residential developments since they serve to protect State and Federally protected habitat. This area encompasses approximately 500 acres in the northern San Dimas Foothills. Further, steep slopes and valleys that contain "Blue Line Streams" as defined by the U.S. Army Corp of Engineers are prevalent throughout this area. Many private property lots adjoin the Angeles National Forest. The Northern Foothills area includes seven canyons and associated ridges. Wildlife currently travel north, east and south through the canyons and ridges. The area includes essential habitat linkages, five permanent water sources, water recharge, provides critical open space, a vital habitat for sensitive and endangered species, and a critical corridor buffer between the urban edge and the Angeles National Forest.
The topography and potential for landslides further limits the availability for additional development and housing. As such, these physical constraints to development limit the City's ability to provide the housing opportunities identified by SCAG. (See attached document California Department of Fish and Game and SEA documents)
AB2158 Factor 2c:
AB2158 factor 2c states, "Lands preserved or protected from urban development under governmental programs designed to protect open space, farmland, environmental habitats, and natural resources on a long-term basis." Most of the Northern Foothills areas are home to endangered, threatened and rare
235
plant and animal species as outlined by the California Department of Fish and Game. These areas are also part of the SEA (Significant Ecological Area). These properties are t he last significant undeveloped hillside parcels remaining in private hands. They include major sensitive species habitat for endangered plants and wi ldl ife as well as critical watershed open space and view shed resources for the City. The City's ability to provide the housing opportunit ies identified by SCAG cannot be accomplished due to t hese limitations which are consistent w ith AB2158 factor 2c. (See attached Biological Resources Assessment Significant Ecological Area documents- San Dimas Canyon/San Antonio Wash and East San Gabriel Valley)
A82158 Factor 3:
AB2158 factor 3 states, "The distribution of household growth assumed for purposes of a comparable period of regional transportation plans and opportunities to maximize the use of public transportation and existing transportation infrastructure." The City is working w ith the San Gabriel Valley Council of Governments (SGVCOG) on developing an Energy Efficiency Chapter of a Climate Action Plan (EECAP). Part of th is endeavor is inventorying our GHG emissions for municipal and community operations. The consultant hired, Fehr & Peers, conducted a review our transportation emissions utilizing the SCAG Trave l Model Data. They found t here were signif icant discrepancies of the model input data in both household and employment numbers. We feel due to these discrepancies another review should be done in order to be consistent and clear. Also due to these inconsistencies we fee l our allocation numbers should be significantly lower. (See attached Memo from Fehr & Peers)
AB2158 Factor 4:
AB2158 factor 4 states, "The market demand for housing." The housing statut e calls for all jurisdictions to receive a housing allocation. The market demand for housing is considered as a function of population and employment growth in the regional growth forecast and local input.
The California housing market has been very slow in recovering from high unemployment and a tough economic environment. The building activity in the City is very slow. After reviewing our permit records, we show activity from January 1, 2008 to December 31, 2011, with only 34 permits pulled for new bui lding development in total. (See attached document- City of San Dimas Permit Activity Report)
Year #New Built
2008 24 2009 3
2010 0
2011 7
In addition, during the RHNA planning period, our population growth rate is only expected to increase approximately 1% and our employment growth rate to increase approximat ely 6%. Our allocation numbers should reflect these figures and be revised to a much lower amount.
236

AB2158 Factor 6:
AB2158 factor 6 states, "The Joss of units contained in assisted housing developments, as defined in paragraph {8} of subdivision (a) of Section 65583 that changed to non-low-income use through mortgage prepayment, subsidy contract expirations, or termination of use restrictions." Currently the City has two locations that are at risk of conversion to market rate. One location, Villa San Dimas provides Section 8 housing for families. There are forty (40} units that range from two to four bedrooms. This property has a contract that requires them to renew annually with HUD if they decide to continue with the program. The second location that is at risk for conversion is Voorhis Village. This property has sixty-five (65} units of which twenty-one are Section 8 units for families. They have a HUD 236 loan and their loan is expected to expire in May 2012. This brings uncertainty and risk for conversion of the units to market rate and without the assistance of the Redevelopment Agency to preserve this property it becomes an at-risk property with potential loss of affordable housing. {See attached Jist of HUD properties and RDA Map)
Proportionality between the 2007 RHNA and the 2013 RHNA
In the 2007 RHNA, SCAG allocated a total construction need of 707,219 units region wide, which equates to approximately 83,202 units per year during the 8.5 year planning period. The current 2013 RHNA allocates a total construction need of 438,030 units region wide, which equates to approximately 51,533 units per year during the 8.5 year planning period. Obviously, there is a significant difference. In fact, there is a 38% reduction, in the number of units needed per year when comparing the two planning periods.
Although the methodology in computing the need in 2007 may differ from that of today, the yearly average assigned to the City of San Dimas is disproportionate. Specifically, the previous 2006-2014 allocation of 625 units renders an average of 74 units per each year ofthe planning period, while the current 2013-2021 allocation of 463 units renders an average of 55 units per each year of the planning period. This equates to a 25% reduction in units per year. Yet, in actuality, the adjusted growth household numbers are forecasted to increase only approximately 1% from 2008 to 2020. This is significantly less that the forecasted 32% growth assumed during the 2007 planning period.
Based upon the methodology noted and an assumption that the City should have proportionally the same fair share in the region as SCAG assigned in 2007, and considering that the 2013 RHNA is directly proportional to the 2007 RHNA in regards to number of units needed during each year of the respective planning periods, the City believes that its RHNA allocation should be considerably less.
Proportionality between the 2008 Low to Mod and the 2013 Low to Mod Allocations
In compliance with State law, the City of San Dimas adopted an updated Housing Element in August 2008. The City's current 2008 Housing Element "needs analysis" was based upon the RHNA that was provided by SCAG in 2006. The growth projections show that from 2008 to 2020 there would be a growth in Households of 32%; a growth in population of 11%; and a growth in employment at 10%. The City's share of the regional housing need as allocated by SCAG for the January 1, 2006 through June 30, 2014 planning period was appealed and revised to show the following:
237

I nco me Category Number of Housing Units %of Total
Very Low 162 26%
Low 101 16% Moderate 107 17% Above Moderate 255 41% Total 625 100%
The Fifth Cycle of the RHNA allocation for January 1, 2011 to September 30, 2021, was developed by using a revised growth projection for 2008, 2020, and 2035. The growth projections after adjustment reflected in actuality, a growth in Household units of 1%; a growth in population of 4.8%; and a growth in employment at 6%. We feel that the total number of households and the categories did not reflect this adjustment.
Income Category Number of Housing Units %of Total
Very Low 121 26% Low 72 16%
Moderate 77 17%
Above Moderate 193 41% Total 463 100%
The City is requesting a revision to our allocations by taking a closer look at the City's growth trends (past and future). The City hopes that the Appeals Board will consider our request for review and reduce our allocation to show proportionality that reflects our historical, current and future needs.
We understand at this time, there are no penalties for a city not to reach its RHNA target. However, based upon the continuing housing crisis in the State and proposed legislation, we would expect that in the future, there may be legislation that would penalize a City for non-compliance. Also, due to eliminating the Redevelopment Agency in the City, a majority of properties where we were expecting to meet our numbers by utilizing Redevelopment funds, will make it more difficult or impossible to move forward and meet our allocation. In lieu of this potentiality, we are requesting these revisions to our allocations. {See attached Growth Map, Employment Map and RDA map)
In summary, the City believes that it is very important for SCAG to take into consideration the issues raised within this letter before the RHNA is finalized. The City appreciates the opportunity to work with SCAG in addressing the draft RHNA allocations.
238

239
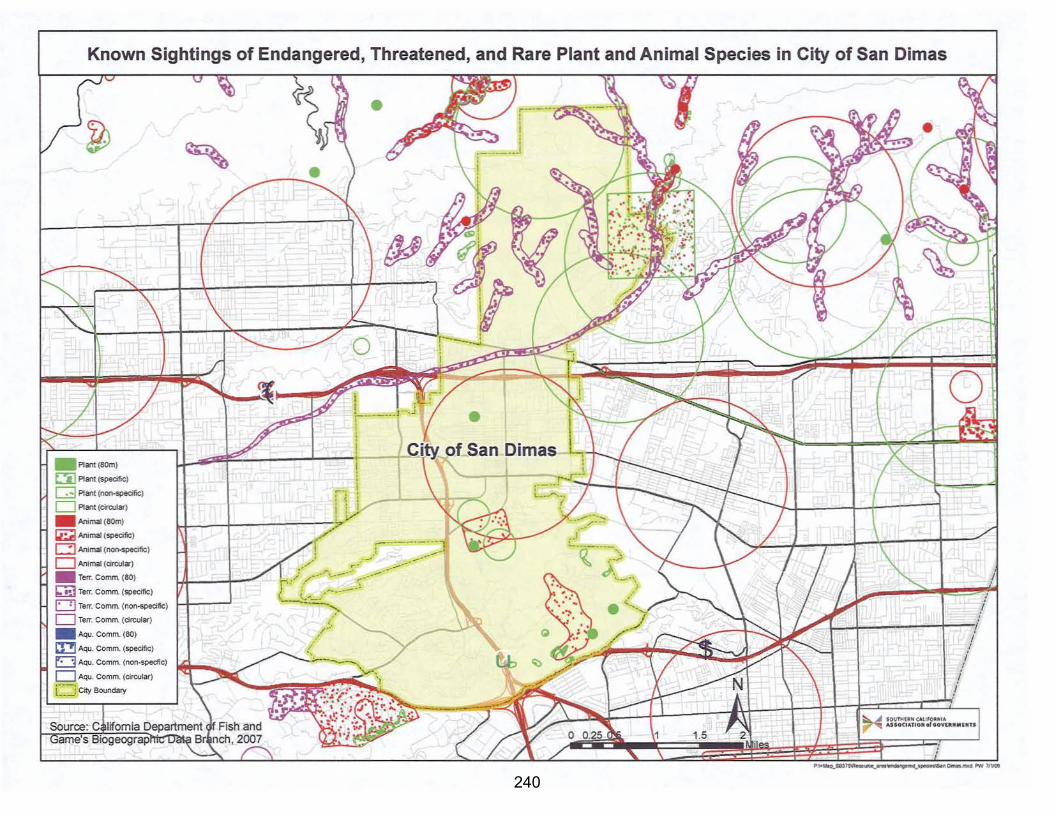
Known Sightings of Endangered, Threatened, and Rare Plant and Animal Species in City of San Dimas
__ Plant (80m)
Ci] Plant (spedlic)
Q Plant (non-spedlic)
D Plant (ei'culao'>
- Animal (80m) ~Animal (specific)
c:::J Animal (non-spedlic)
D Animal (circula-)
- Terr. Comm. (80)
!;:@ Terr. Comm. (specific)
0 Terr. Comm. (non-specific)
D Terr. C·omm. (circular)
- Aqu. Comm. (80)
l.l::!l Aqu. Comm. (specific)
E] Aqu. Comm. (non-spedic)
D Aqu. Comm. (circular)
[=--: City Boundary
~
240

241
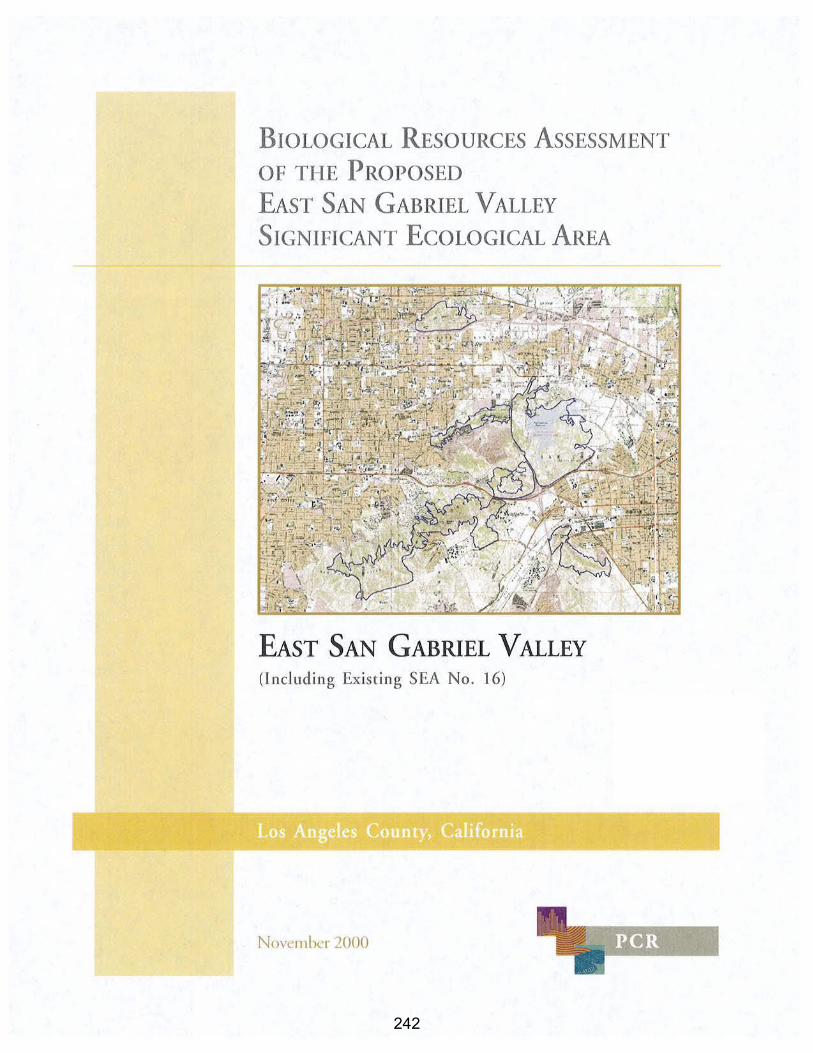
BIOLOGICAL RESOURCES ASSESSMENT
OF THE PROPOSED
EAST SAN GABRIEL VALLEY
SIGNIFICANT EcoLOGICAL AREA
EAST SAN GABRIEL VALLEY (I ncludin g Existin g SEA No. 16)
Los Angeles County, California
November 2000
242
BIOLOGICAL RESOURCES ASSESSMENT
OF THE PROPOSED
EAST SAN GABRIEL vALLEY
SIGNIFICANT EcoLOGICAL AREA
EAST SAN GABRIEL vALLEY (Including Existing SEA No. 16)
Prepared For:
Los Angeles County Department of Regional Plannmg 320 West Temple Street, Room 1383 Los Angele~. Cal1forrua 90012 Contact · George Malone, Section Head General Plan Development Section
Prepared By
PCR Services Corporation Frank Hovore H Associates FORMA Systems Contact· Steven G Nelson. Director of Biolog1cal Serv1ces PCR Services Corporatton One Venture. Suite 150 lrv111e, California 92618 Tel : 949 753.700 I
Los Angeles County, California
Nowmh~..·r .WOO
243
TABLE OF CONTENTS
Page
EXECUTIVE SUMMARY ................................................. iv
1. LOCATION ......................................................... 1
1.1 GENERAL . . . . . . . . . . . . . . . . . . . . . . . . . . . . . . . . . . . . . . . . . . . . . . . . . . . . . . 1
1.2 BOUNDARY DESCRIPTION ........................................ .
2. DESCRIPTION ...................................................... 5
3. EXISTING LAND USE . . . . . . . . . . . . . . . . . . . . . . . . . . . . . . . . . . . . . . . . . . . . . . . . 5
4. LAND OWNERSHIP . . . . . . . . . . . . . . . . . . . . . . . . . . . . . . . . . . . . . . . . . . . . . . . . . . 6
5. VEGETATION ...................................................... 6
6. WILDLIFE . . . . . . . . . . . . . . . . . . . . . . . . . . . . . . . . . . . . . . . . . . . . . . . . . . . . . . . . . . 8
7. WILDLIFE MOVEMENT . . . . . . . . . . . . . . . . . . . . . . . . . . . . . . . . . . . . . . . . . . . . . . 9
8. SENSITIVE BIOLOGICAL RESOURCES . . . . . . . . . . . . . . . . . . . . . . . . . . . . . . . . 10
8.1 SENSITIVE PLANT COMMUNITIES/HABITATS . . . . . . . . . . . . . . . . . . . . . . . . . . . 10
8.2 SENSITIVE SPECIES. . . . . . . . . . . . . . . . . . . . . . . . . . . . . . . . . . . . . . . . . . . . . . 11
9. REGIONAL BIOLOGICAL VALUE . . . . . . . . . . . . . . . . . . . . . . . . . . . . . . . . . . . . . 22
10. RECOMMENDED MANAGEMENT PRACTICES ......................... 23
11. SOURCES ......................................................... 25
Biological Resources Assessment PCR Project Team
Page i
East San Gabriel Valley November 2000
244

LIST OF FIGURES
Figure Page
Regional Map . . . . . . . . . . . . . . . . . . . . . . . . . . . . . . . . . . . . . . . . . . . . . . . . . . . . . . . 2
2 Existing and Proposed Boundaries . . . . . . . . . . . . . . . . . . . . . . . . . . . . . . . . . . . . . . . 3
Biological Resources Assessment PCR Project Team
Page ii
East San Gabriel Valley November 2000
245
LIST OF TABLES
Table Page
Criteria Analysis Vll
Sensitive Species . . . . . . . . . . . . . . . . . . . . . . . . . . . . . . . . . . . . . . . . . . . . . . . . . . . . . . . . 12
Biological Resources Assessment PCR Project Team
Page iii
East San Gabriel Valley November 2000
246

EXECUTIVE SUMMARY
Location: The proposed East San Gabriel Valley SEA is located in the easternmost portion of the San Gabriel Valley. The study area represents several ridgelines and hilltops and a major drainage at the eastern end of the San Jose Hills which have been surrounded by urban development over the past four decades. Over most of its boundaries the East San Gabriel Valley SEA is bordered by the edge of developed properties. It also incorporates existing SEA number 16.
Description: The proposed East San Gabriel Valley SEA is comprised of five component parts ranging in size from approximately 320 acres to approximately 1,794 acres. Combined, these components total approximately 5,175 acres. The location and configuration of this SEA and its parts are primarily defined by the urbanization of the eastern San Gabriel Valley which occurred over the more easily developed valley floor and lower slopes of the San Jose Hills. As a consequence of this development the SEA resembles an "archipelago" encompassing portions, or islands, of undeveloped ridge lines, hilltops and drainages, between the San Gabriel Mountains to the north, and the Puente Hills to the south. The proposed SEA overlaps into several different jurisdictions. These include: approximately 722 acres within unincorporated Los Angeles County; 27 acres within the City of Covina; 423 acres within the City of Glendora; 9 acres within the City ofLa Verne; 471 acres within the City of Pomona; 2,272 acres within the City of San Dimas;988 acres within the City of Walnut; and 264 acres within the City of West Covina.
Existing Land Use: Land uses within the East San Gabriel Valley SEA vary from grazing to recreational and institutional use. A large portion of the SEA lies within established county and city park areas. The remaining lands share characteristics of natural open space with scattered clearings of unknown origin.
Land Ownership: Public, institutional and private ownerships exist within this SEA. Public ownerships include Los Angeles County (Bonelli and Walnut Creek Parks) and the City of Glendora (South Hills Park). Institutional owners include the Pacific Coast Baptist Bible College and the California State University system. The remainder ofthe land within the East San Gabriel Valley SEA is comprised of private ownerships; among the largest is Forest Lawn Memorial Park.
Vegetation: The variety of topography, soil types, slope aspects and water availability within this SEA creates a range of physical habitats which support numerous plant species. Eight major plant communities are found within the East San Gabriel Valley SEA including: oak woodland; oak
Biological Resources Assessment PCR Project Team
Pageiv
East San Gabriel Valley November 2000
247

Significant Ecological Area Update Study
riparian forest; walnut woodland; southern willow scrub; chaparral; coastal sage scrub; freshwater marsh; and non-native grassland.
Wildlife: Wildlife populations within the proposed East San Gabriel Valley SEA are expected to reflect lower diversity and abundance for the habitat types present due to edge effects of surrounding development and existing recreational uses. However, a surprisingly high diversity of birds are documented to occur within this SEA, including the federally threatened California gnatcatcher.
Wildlife Movement: The proposed East San Gabriel Valley SEA represents a regional wildlife corridor between the San Gabriel Mountains and the Puente Hills/Chino Hills complex. Unlike the commonly held concept of a corridor, this SEA contains a series of discontiguous habitat blocks and patches rather than an unbroken corridor for movement. As such, this SEA facilitates movement and exchange between larger habitat areas by allowing for terrestrial "island-hopping" between and among the individual SEA components. The manner in which this SEA allows wildlife populations in different areas to interact is less than ideal. The extent of this exchange depends upon urbanization.
Sensitive Biological Resources: The East San Gabriel Valley SEA contains habitats, or plant communities, that are generally considered unique, of relatively limited distribution, or of particular value to wildlife. These are oak woodland, oak riparian forest, walnut woodland, southern willow scrub, and coastal sage scrub. Despite the fragmented nature of this SEA and adverse edge effects from surrounding development, a number of sensitive plant and wildlife species have been observed or may occur here. These species are considered sensitive due to declining, limited, or threatened populations, resulting in most cases from habitat reductions.
Regional Biological Value: In a regional context, the value of the proposed East San Gabriel Valley SEA is founded in four of the six criteria used in this study to identify and select SEAs (see Criteria Analysis table at the end of this summary).
Recommended Management Practices: Proposed new development within the proposed East San Gabriel Valley SEA should be designed to be highly compatible with the continued ecological function of each of the component biological resources described above. Although a comprehensive evaluation of all possible future land uses within this SEA cannot be made here, a general approach is outlined below which follows the guidelines and is recommended for use on a project specific basis. In order to preserve the integrity of the SEA, the proposed comprehensive management practices described in the Los Angeles County SEA Update Study 2000 Background Report are recommended. These practices address:
Biological Resources Assessment PCR Project Team
Page v
East San Gabriel Valley
November 2000
248

Significant Ecological Area Update Study
• Core habitat
• Habitat linkages and wildlife corridors
• Fire management
• Public access and recreation
• Infrastructure
• Wetlands, riparian habitats, and streambeds
• Non-riparian/upland woodlands
In addition to the comprehensive management practices the following proposed management practices are recommended specifically for the proposed East San Gabriel Valley SEA:
• Limit development densities to one residential unit per ten acre parcel, and constrain development design, where feasible, to cluster dwelling configuration along existing roadways in order to minimize clearing associated with fuel management, and to reduce the need for grading, fencing, and other habitat disturbances.
• Maintain the habitat of core populations of listed species including the federally threatened California gnatcatcher.
• Retain rare communities with adequate buffers so as to allow for the long term viability and integrity of plant communities as a whole. Rare communities include: oak woodland, oak riparian forest, walnut woodland, willow woodland, and coastal sage scrub.
• Retain connectivity and linkage values through this SEA as an island hopping linkage between the San Gabriel Mountains and the Puente Hills. Maintain lines of sight between components at or near their existing borders. To the greatest extent possible, existing distances between the components should be maintained rather than increase through intense uses at their perimeters.
Biological Resources Assessment PCR Project Team
Page vi
East San Gabriel Valley November 2000
249

Significant Ecological Area Update Study
CRITERIA ANALYSIS
OF THE PROPOSED EAST SAN GABRIEL VALLEY SEA
Criterion Status
A) The habitat of core populations Met of endangered or threatened plant or animal species.
B) On a regional basis, biotic Met communities, vegetative associations, and habitat of plant or animal species that are either unique or are restricted in distribution.
C) Within Los Angeles County, Met biotic communities, vegetative associations, and habitat of plant or animal species that are either unique or are restricted in distribution.
D) Habitat that at some point in the Met life cycle of a species or group of species, serves as concentrated breeding, feeding, resting, or migrating grounds and is limited in availability either regionally or in Los Angeles County.
E) Biotic resources that are of Not scientific interest because they met are either an extreme in phy sica II geographical limitations, or represent unusual variation in a population or community.
Biological Resources Assessment PCR Project Team
Justification
This SEA contains habitat which supports a core population (and the only known population) of the federally threatened California gnatcatcher, in the eastern San Gabriel Valley. This population has been recently observed in coastal sage scrub at two locations in the area, Bonelli Park and Buzzard Peak. At both locations, surveys over multiple years indicate that this population has been increasing in numbers. Currently, it is believed that there are between ten and fifteen pairs of gnatcatchers in this population.
Several plant communities within this SEA are CDFG highest inventory priority communities due to their restricted distribution in the Southern California region. These communities include: walnut woodlands which are scattered throughout the components of this SEA; oak riparian woodland which is best expressed within the Walnut Creek drainage; isolated stands of willow woodland along many of the drainages in the Bonelli/Walnut Creek Parks and Buzzard Peak components; freshwater marsh and open water found primarily in association with Puddingstone Reservoir; and coastal sage scrub, which also serves as the habitat for the California gnatcatcher, found in scattered patches over hillsides within the South Hills, Bonelli/Walnut Parks, Via Verde and Buzzard Peak components.
All of the plant communities and habitats indicated above as restricted in distribution on a regional basis, are also restricted in distribution within Los Angeles County.
Any relatively large body of water with pockets of natural lakeside vegetation along its shoreline potentially meets this criteria, particularly within the context of an arid to semiarid environment, characteristic of Los Angeles County. Although subjected to boating activities and shoreline recreational use, Puddingstone Reservoir serves as an important habitat for migrating water fowl and water birds, evident in the high diversity of birds recorded at the park over the past several years.
The SEA does not contain biotic resource that are clearly an extreme in physical/geographical limitations, or represent unusual variation in a population or community and therefore does not meet this criterion.
Page vii
East San Gabriel Valley November 2000
250
Significant Ecological Area Update Study
CRITERIA At"'AL YSIS
OF THE PROPOSED EAST SAN GABRIEL VALLEY SEA (CONTINUED)
Criterion Status
F) Areas that would provide for Not the preservation of relatively met undisturbed examples of the original natural biotic communities in Los Angeles County.
Biological Resources Assessment PCR Project Team
Justification
The proposed SEA does not contain areas that would provide for the preservation of relatively undisturbed examples of the original natural biotic communities in Los Angeles County
Page viii
East San Gabriel Valley November 2000
251

SIGNIFICANT ECOLOGICAL AREA UPDATE STUDY
1. LOCATION
1.1 GENERAL
The proposed East San Gabriel Valley SEA is located in the easternmost portion of the San Gabriel Valley as shown in Figure 1, Regional Map, on page 2. For the purpose of delineating an area-wide ecological unit with interacting component habitat areas this SEA includes incorporated as well as unincorporated lands. The study area represents several ridgelines and hilltops and a major drainage at the eastern end of the San Jose Hills which have been surrounded by urban development over the past four decades. The largest component of this SEA is Frank G. Bonelli Regional County Park (Bonelli Park) and a portion of Walnut Creek Park, both of which, are unincorporated. Other component parts are South Hills Park and surrounding undeveloped land in the City of Glendora, Buzzard Peak and undeveloped hillsides to the southwest within the cities of West Covina and Walnut, undeveloped slopes to the west of Bonelli Park and Interstate 21 0 (I -21 0) in the City of San Dimas, and Elephant Hill and an adjoining ridge line in the City of Pomona.
In its entirety, the East San Gabriel Valley SEA is located within the San Dimas, Glendora and Baldwin Park United States Geological Survey (USGS) 7.5' California Quadrangles as shown in Figure 2, Existing and Proposed Boundaries on page 3. It also incorporates existing SEA number 16.
1.2 BOUNDARY DESCRIPTION
Over most of its boundaries the East San Gabriel Valley SEA is bordered by developed properties. At its most westerly point the Bonelli/W alnut Creek Parks component begins west of where South Reeder A venue crosses the Walnut Creek drainage. Traveling east from this point the proposed SEA is bordered to the north and south by existing residential developments on the ridgelines above the creek and the most intensively developed portions of the Pacific Coast Baptist Bible College in the bottom of the drainage. The SEA continues east to where it meets the I -210, at which point it is interrupted, but kept physically intact by a freeway underpass for San Dimas Avenue. On the east side of the 1-210 the boundaries follow the freeway right-of-way toward the north and south. After a short distance to the north the boundary turns due east where it continues
Biological Resources Assessment PCR Project Team
Page 1
East San Gabriel Valley November 2000
252
LOS PADRES
NATIONAL FOREST
G Santa Barbara Island
0 5 10
Source: PCR Services C~rporation, 2000
o lancaster
20 Miles
Figure 1 East San Gabriel Valley
Significant Ecological Area Regional Map
253
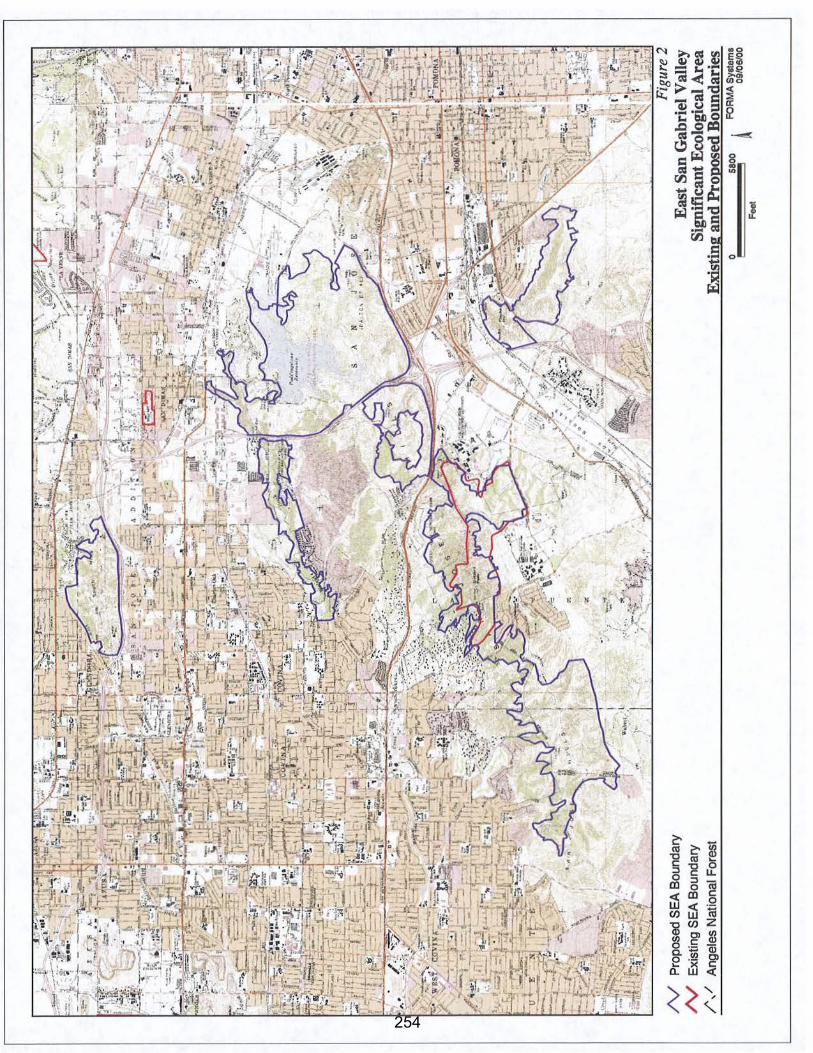
---s:
8 CIO U)
l
~.
= ..... 0 .... fll
·~ f;1il
u .. :!
~~
-<
'"
254
Significant Ecological Area Update Study
to follow the edge of development, which now includes business parks, industrial properties and Raging Waters theme park. In the area of Raging Waters the SEA includes two finger-like tributaries of Walnut Creek. The westernmost of these areas extend to the north where it terminates at Arrow Highway. The easternmost area runs in a northeasterly direction, ending at a Union Pacific Rail Road line. From the vicinity ofRaging Waters the boundary continues east along Puddingstone Drive to the Puddingstone Channel. The eastern boundary of this component generally conforms to the eastern boundary ofBonelli Park, excluding the Mountain Meadows Golf Course, southward to Via Verde. From Via Verde the boundary extends east to Fairplex Drive, and Fairplex Drive south to Interstate 10 (1-10). The southern boundary is marked by the 1-10 right-of-way. At the intersection ofl-10 and 1-210, the boundary travels north along the eastern 1-210 right-of-way to meet Walnut Creek.
The South Hills Park component has as its northern boundary Big Dalton Wash, which is a concrete-lined flood control channel, and existing residential development where the SEA does not abut the channel itself. The eastern boundary ofthis component is also marked by existing residential development. The western boundary lies along Glendora A venue. The southern boundary consists ofthe 1-210 right-of-way.
Buzzard Peak and its associated lands begin in the east along a ridgeline immediately north and above the California State Polytechnic University (Cal Poly), Pomona campus. This component follows the ridge line west to where it crosses Grand A venue and continues in a westerly direction, encompassing a series of minor ridge lines and drainages. Moving east to west, its northern boundary is marked by 1-10, developed portions of the Forest Lawn Memorial Park Covina Hills and existing residential development. Moving from east to west, its southern boundary is marked by developed and cultivated areas of the Cal Poly campus, Amar Road and existing residential development. Along their entire lengths, the northern and southern boundaries follow highly circuitous alignments at the edge of developed landscape.
A minor component of this SEA is located in the northwest quadrant of the intersection of 1-10 and 1-210. This relatively small area is comprised ofundeveloped hillsides bound on the east by the 1-210 right-of-way, the south by the 1-10 right-of-way and existing residential development on the west and north. This area also wraps around a residential enclave which takes access across the northern boundary.
The Elephant Hill component begins in the north at the toe of its slopes which generally parallels a Union Pacific Rail Road line. From here, it follows a northwest to southeast trending ridgeline. The SEA boundary in this area is marked on its eastern, southern and western edges by existing residential development.
Biological Resources Assessment PCR Project Team
Page4
East San Gabriel Valley
November 2000
255
Significant Ecological Area Update Study
2. DESCRIPTION
The proposed East San Gabriel Valley SEA is comprised of five component parts ranging in size from approximately 320 acres to approximately 1,794 acres. Combined, these components total approximately 5,175 acres. The location and configuration of this SEA and its parts are primarily defined by the urbanization of the eastern San Gabriel Valley which has occurred over the more developable valley floor and lower slopes of the San Jose Hills. As a consequence, of the SEA resembles an "archipelago" encompassing portions, or islands, of undeveloped ridge lines, hilltops and drainages between the San Gabriel Mountains to the north and the Puente Hills to the south.
Generally, the topography within this SEA consists of moderate to steep hillsides with north, south, east and west slope aspects. Ridgelines vary in width from narrow to broad with well defined drainages in between. One major drainage, Walnut Creek, and a man-made reservoir, Puddingstone Reservoir, are found within this SEA. Elevations range from a low of approximately 560 feet above Mean Sea Level (MSL) in the Walnut Creek drainage to a high of approximately 1,375 feet above MSL at Buzzard Peak.
The biological communities found in this SEA vary according to physical habitat conditions (i.e., slope exposure, soil type and depth, and the availability of water) and the area's history of grazing practices. Elevation plays almost no role in defining habitat types. Many slopes support oak and walnut woodland which often intergrade with prevalent stands of mixed chaparral. Coastal sage scrub is also found on slopes with shallower, drier soils. Drainages are typically vegetated with oak riparian woodlands and forests, with stands of western sycamore and willow woodland. More moderate slopes and broader ridgelines have been subjected to livestock grazing. In these areas, the dominant vegetation consists of open non-native grassland. Oftentimes, grassland exists as the understory ground cover for wooded areas creating oak and walnut savannahs. Small isolated areas of freshwater marsh are also found around Puddingstone Reservoir.
The proposed SEA overlaps into several different jurisdictions. These include: approximately 722 acres within unincorporated Los Angeles County; 27 acres within the City of Covina; 423 acres within the City of Glendora; 9 acres within the City of La Verne; 471 acres within the City of Pomona; 2,272 acres within the City of San Dimas; 988 acres within the City of Walnut; and 264 acres within the City of West Covina.
3. EXISTING LAND USE
Land uses within the East San Gabriel Valley SEA vary from low to high intensity recreation to grazing. The majority of the Bonelli/Walnut Creek Parks component lies within established park
Biological Resources Assessment PCR Project Team
Page 5
East San Gabriel Valley November 2000
256

Significant Ecological Area Update Study
areas. Bonelli Park is a county regional park including facilities for a wide range of recreational pursuits. These include hiking, riding and biking trails, picnic grounds, beach areas, boating facilities, equestrian centers and stables and recreational vehicle campgrounds. More intense recreational uses are restricted to areas around the reservoir and to enclaves scattered throughout the park. Most of the park, however, has been maintained in natural open space and is accessible by trails only. Similarly, Walnut Creek Park is a part of the County park system and supports hiking, riding and biking uses. In addition, a limited area of Walnut Creek is within the undeveloped grounds of the Pacific Coast Baptist Bible College.
The majority of the South Hills component of this SEA is located within South Hills Park which is maintained by the City of Glendora. With the exception of two water tanks and radio towers within its interior, this area remains relatively natural with disturbance limited to grazing. Other disturbances include several trails, unimproved roads, and an improved utility road.
The Buzzard Peak component appears to be the least disturbed component of this SEA. It does contain a number of unimproved access roads, trails and evidence of grazing. However, most of its area exists as natural open space, disturbed to a minor degree.
The Elephant Hill and Via Verde components share the characteristic of natural open space with scattered clearings of unknown origin. Fewer trails and unimproved roads exist in this component than in others making up this SEA. Presumably, this is due to their access being limited public access by private residential communities and freeways which are found at their borders.
4. LAND OWNERSHIP
Public, institutional and private holdings exist within this SEA. Public ownerships include Los Angeles County (Bonelli and Walnut Creek Parks) and the City of Glendora (South Hills Park). Institutional owners include the Pacific Coast Baptist Bible College and the California State University system. The remainder of the land within the East San Gabriel Valley SEA is comprised of private ownerships; among the largest is Forest Lawn Memorial Park. Land owned, under longterm lease, or utility easements may exist as well.
5. VEGETATION
The variety of topography, soil types, slope aspects and water availability within this SEA create a range of physical habitats which support numerous plant species. All plant species observed or recorded in previous documentation within the study area are indicated in the Comprehensive Floral & Faunal Compendium of the Los Angeles County SEA Update Study 2000 Background
Biological Resources Assessment PCR Project Team
Page6
East San Gabriel Valley November 2000
257
Significant Ecological Area Update Study
Report. Sensitive plant species occurring within the proposed SEA are discussed in the Sensitive Biological Resources section of this document. Many of these species, although often different in their growth form, prefer similar habitat characteristics and are often found in recurring assemblages to form plant communities. Eight major plant communities are found within the East San Gabriel Valley SEA. Plant communities within the proposed SEA were classified using standard methodology and terminology. Most of the communities discussed in this study correspond directly with those listed in Holland's Preliminary Descriptions of the Terrestrial Natural Communities of California (1986 and 1992 update). Other communities are named based on dominant species and/or commonly used terminology. Brief descriptions and general locations of each plant community present within the SEA are provided below, including oak woodland, oak riparian forest, walnut woodland, willow woodland, chaparral, coastal sage scrub, freshwater marsh, and non-native grassland.
Oak woodland is a plant community dominated by species of the genus Quercus. Within this SEA the dominant species is the coast live oak, which typically grows to heights of20 to 40 feet and forms either closed or open canopies. Understory vegetation varies from grassland in areas subject to grazing to shrubs where topography is steeper and/or grazing has been relaxed. This vegetation may also intergrade with shrub communities. Within this SEA, oak woodland is scattered throughout all components where it is most prevalent on northfacing slopes and in drainage bottoms.
A highly related community found in the proposed SEA includes oak riparian forest. It is also dominated by coast live oak. The primary difference between oak woodland and oak riparian forest is the greater availability of water in riparian situations which is expressed in a dense tree canopy cover and tree clusters. A greater number of hydrophytic (moister favoring) plant species are also found in the understory. Typical riparian trees such as western sycamore and willow occasionally occur as well. Oak riparian forest is most well developed within Walnut Creek. Riparian trees are also scattered in other drainages throughout the Buzzard Peak component ofthis SEA.
Often intergrading with oak dominated woodlands or developed as a distinct community is walnut woodland. This community is dominated by the California walnut which grows 10 to 30 feet high. More often than not, the California walnut grows in open stands; however, closed tree canopies are not uncommon. In similar fashion to oak woodlands its understory varies from grasses to shrubs. Thus, it forms stands ranging from savannahs to forests throughout the East San Gabriel Valley SEA. It is most common within the Bonelli/Walnut Parks, South Hills, and Buzzard Peak components.
Biological Resources Assessment PCR Project Team
Page7
East San Gabriel Valley November 2000
258
Significant Ecological Area Update Study
A well developed southern willow scrub community is found along Live Oak Creek upstream and at the point where the creek flows into Puddingstone Reservoir in the Bonelli/Walnut Parks component. Smaller patches of this community are also found scattered along drainages in the Buzzard Peak component. This community is dominated by species of willow which form nearly monotypic stands due to their dense growth. These stands generally reach 10 to 20 feet in height with little understory vegetation.
Mixed chaparral is a shrub community composed of robust species. Within this SEA these species include laurel sumac, toy on, lemonadeberry and Mexican elderberry. Along with other shrub species, chaparral forms dense vegetation covers growing five to ten feet in height. The development of chaparral is most pronounced within the South Hills, Bonelli/Walnut Parks, and Buzzard Peak components.
Communities of coastal sage scrub exhibit less robust structure within this SEA. This plant community is dominated by California sagebrush, California encelia, white sage, black sage, and California buckwheat. Coastal sage scrub also forms dense stands which grow three to four feet in height. Within this SEA, it is generally found in scattered patches which are highly integrated with mixed chaparral. These communities are primarily located in the South Hills, Bonelli/Walnut Parks, Via Verde, and Buzzard Peak components.
Non-native grassland consists of non-native annual grasses and forbs. These opportunistically growing species include brome grasses, wild oats and mustards. Characteristic of other parts of southern California, this community became established as a result of livestock grazing; in the process native vegetation is removed, sometimes by mechanical means, and replaced by more adventitious species. Non-native grassland is found throughout all components ofthis SEA.
Small areas supporting freshwater marsh are found at scattered locations along the shoreline of Puddingstone Reservoir. This community may also exist at other locations, in or adjacent to artificially created impoundments used to water livestock. Freshwater marsh requires perennially shallow water or saturated soils. Dominant plants are comprised of emergent species including cattails and bulrushes.
6. WILDLIFE
Wildlife populations within the proposed East San Gabriel Valley SEA are generally expected to reflect lower diversity and abundance of habitat types. This is due to the influences of surrounding development and location of recreational uses over relatively large areas of the SEA components. Analysis of invertebrates on any given site generally is limited by a lack of specific
Biological Resources Assessment PCR Project Team
Page 8
East San Gabriel Valley November 2000
259
Significant Ecological Area Update Study
data; however, the SEA is considered sufficient to encompass moderately healthy populations of common invertebrate species. Fair numbers of amphibians are expected to be present primarily due to the aquatic and semi-aquatic habitats provided by Puddingstone Reservoir, and riparian habitats along Live Oak Channel and Walnut Creek. Diversity and evenness among these populations, however, is likely to be degraded due to history of urbanization resulting in few species adaptable to this sort of environment.
Similar effects would be anticipated for reptiles. Reptilian species typically found in suburban and rural areas are expected in relatively high numbers. Less common, and perhaps, locally extinct would be those species that are more secretive in their habitats and/or not as prolific.
A surprisingly high diversity of birds are documented within this SEA including the largest population of California gnatcatcher, a federally threatened species, in the County. For numerous upland, raptorial, and water associated birds the East San Gabriel Valley SEA provides a mosaic of habitats. Between woodland, shrub land, grassland and wetlands, diverse populations of birds are able to meet nesting, foraging, and migratory requirements.
Mammal populations also reflect the suburban environs imparting this SEA. Small mammals are expected to be uneven in their diversity with more adaptive, introduced European species in greater numbers compared to others species. Medium sized mammal populations are expected to exhibit the same characteristics. Large mammals are largely absent on a resident basis.
All wildlife species previously recorded, as well as those expected to occur within this SEA are tabulated in the Comprehensive Floral & Faunal Compendium of the Los Angeles County SEA
Update Study 2000 Background Report. Sensitive wildlife species occurring or potentially occurring within the SEA are discussed in the Sensitive Biological Resources section of this document.
7. WILDLIFE MOVEMENT
The proposed East San Gabriel Valley SEA represents the only regional wildlife linkage between the San Gabriel Mountains and the Puente Hills/Chino Hills complex. Unlike the commonly held concept of a corridor, however, this SEA contains a series of discontiguous habitat blocks and patches rather than an unbroken corridor for movement. As such, this SEA facilitates movement and exchange between larger habitat areas by permitting terrestrial "island-hopping" between the SEA components.
Using birds as an example, movement may be initiated by an individual or group of birds in either the San Gabriel Mountains or the Puente Hills. Larger species, with the capacity to cover long
Biological Resources Assessment PCR Project Team
Page9
East San Gabriel Valley November 2000
260
Significant Ecological Area Update Study
distances, may make the passage as one segment of its journey. Smaller species, however, lacking
physical or behavioral capacity may not be able to attain this movement under normal circumstances. By utilizing various component parts of the SEA, the same species can cover this journey in several
smaller trips. The same example may also apply to winged insects and wind-borne plant pollen. Interaction between, not just through the components can occur as well.
This same function probably does not apply to other taxonomic groups. It is highly doubtful
that amphibian, reptile and most mammal populations use this corridor as effectively as birds, if at all. Mule deer, for example, do not occur within Bonelli Park but are common in the San Gabriel Mountains and the Puente Hills. However, some mammals which tolerate urban environments; such as Virginia opossum, raccoon, and striped skunk, use the corridor in the manner described. Even mountain lions periodically enter Bonelli Park and Walnut Creek Park from the outside by way of
routes related to SEA components.
The manner in which the proposed East San Gabriel Valley SEA allows wildlife populations in different areas to interact is less than ideal. However, exchange in the manner described above is dictated by the widespread urbanization of the region; it is the only remaining way regional interaction can occur and contribute to the maintenance of genetic variability and health of regional wildlife populations.
8. SENSITIVE BIOLOGICAL RESOURCES
Sensitive biological resources are habitats or individual species that have been given special recognition by federal, state, or local conservation agencies and organizations as endangered, threatened, rare, or otherwise sensitive. This is principally due to the species' declining or limited population sizes, usually resulting from habitat loss. Watch lists of such resources are maintained by the California Department ofFish and Game (CDFG), the United States Fish and Wildlife Service (USFWS), and special groups such as the California Native Plant Society (CNPS). The following sections indicate the habitats as well as plant and animal species present, or potentially present within the proposed East San Gabriel Valley SEA, that have been afforded special recognition.
8.1 SENSITIVE PLANT COMMUNITIES/HABITATS
The proposed East San Gabriel Valley SEA supports several habitat types considered sensitive by resource agencies, namely the CDFG, due to scarcity and serving as habitat for a number
of state and federally listed endangered, threatened, and rare vascular plants, bird and reptile species.
Vegetation communities include: oak riparian woodland, walnut woodland, southern willow
scrub, coastal sage scrub, and freshwater marsh which occur throughout the study area. These
Biological Resources Assessment PCR Project Team
Page 10
East San Gabriel Valley November 2000
261

Significant Ecological Area Update Study
communities, or closely related designations, are considered highest-inventory priority by the CDFG, indicating that they are experiencing a decline throughout their range. The distribution and floral composition of these communities is discussed above.
8.2 SENSITIVE SPECIES
Sensitive species include those listed, or candidates for listing by the USFWS, CDFG, and CNPS (particularly List lA, IB, and 2 as defined in the Sensitive Species Table). The Sensitive Species Table on page 12 lists those species which have been recorded within the proposed SEA as well as those reasonable expected to occur. The table includes locations of sensitive species observed, recorded in the CNDDB, or reported in previous documentation as observed within or in the immediate vicinity of the proposed SEA. Additional species, such as native oak or sycamore trees, may be protected under local ordinances but are not included in this table.
Biological Resources Assessment PCR Project Team
Page II
East San Gabriel Valley November 2000
262

Significant Ecological Area Update Study
SENSITIVE SPECIES 0CCliRRING OR POTENTIALLY OCCURRING
WITHIN THE PROPOSED EAST SAN GABRIEL VALLEY SEA
VASCULAR PLANTS
Scientific Name Common Name
ANGIOSPERMS (Dicotyledons)
Asteraceae Sunflower Family
Senecio aphanactis rayless ragwort
Boraginaceae Borage Family
Harpagonella palmeri Palmer's grappling hook
Crassulaceae Stonecrop Family
Dudleya multicaulis many-stemmed dudleya
Fabaceae Legume Family
Astragalus brauntonii Braunton's milkvetch
Legend
Agency Lists FE Federally Listed as Endangered FT Federally Listed as Threatened FSC Federal Special Concern Species FPE Federally Proposed as Endangered FPT Federally Proposed as Threatened FPD Federally Proposed for De listing
Biological Resources Assessment PCR Project Team
SE
ST
SCE
SCT
SP
SFP
SR
esc
Agency Listing Status
FSC
FSC
FE
CNPS
Listing Status
2
2
1B
1B
Preferred Habitat Location
Cismontane woodland, Puddingstone Dam coastal scrub, drying alkaline ( 1932) flats.
Sage scrub; clay soils; below Potential where habitat 2,500 ft. occurs
California plant communities including sage scrub, valley and foothill grassland; heavy clay soils or rock outcrops; below 2,000 ft ..
Bonelli Regional Co. Park ( 1987 and 1982); recorded on Way Hill (1987)
Sage scrub, chaparral, valley Potential where habitat and foothill grassland, closed occurs cone coniferous forest; limestone endemic, carbonate soils, recent burns and disturbed areas.
California Native Plant Society (CNPS) Lists State Listed as Endangered lA Presumed extinct in California. State Listed as Threatened State Candidate for Endangered State Candidate for Threatened State Protected State Fully Protected State Rare California Special Concern Species
Page 12
lB Rare, threatened, or endangered throughout their range.
2 Rare, threatened, or endangered in California, but more common in other states.
3 Plant species for which additional information is needed before rarity can be determined.
4 Species of limited distribution in California (i.e., naturally rare in the wild), but whose existence does not appear to be susceptible to threat.
East San Gabriel Valley November 2000
263

Significant Ecological Area Update Study
SENSITIVE SPECIES
OCCURRING OR POTENTIALLY OCCURRING WITHIN THE PROPOSED EAST SAN GABRIEL VALLEY SEA
{CONTINUED)
VASCULAR PLANTS
Scientific Name Common Name
Juglandaceae
Juglans californica var. californica
Walnut Family
Southern California black walnut
Scrophulariaceae Figwort Family
Fremontodendron Mexican mexicanum flannelbrush
ANGIOSPERMS {Monocotyledons)
Liliaceae
Brodiaea fil ifolia
Legend
Agency Lists
Lily Family
thread-leaved brodiaea
FE Federally Listed as Endangered
FT Federally Listed as Threatened FSC Federal Special Concern Species
FPE Federally Proposed as Endangered FPT Federally Proposed as Threatened
FPD Federally Proposed for De listing
Biological Resources Assessment PCR Project Team
SE ST SCE
SCT
SP SFP SR esc
Agency Listing Status
FE,SR
FT,SE
CNPS
Listing Status
4
lB
IB
Preferred Habitat
Sage scrub, chaparral, cismontane woodland; often in association with oaks/oak woodland; frequently found on steep hillsides with northern exposures; deep alluvial soils.
Closed-cone coniferous forest, chapar.ral, cismontane woodland, creeks or dry canyons, gabbro soils.
Sage scrub, valley/foothill grassland, cismontane woodland; vernal pools (clay soils).
Location
Base of San Gabriel foothills, Los Pinetos Springs (1999)
Potential where habitat occurs
Potential where habitat occurs
California Native Plant Society (CNPS) Lists State Listed as Endangered lA Presumed extinct in California. State Listed as Threatened State Candidate for Endangered State Candidate for
Threatened State Protected State Fully Protected State Rare California Special Concern Species
Page 13
IB Rare, threatened, or endangered throughout their range.
2 Rare, threatened, or endangered in California, but more common in other
states. 3 Plant species for which additional
information is needed before rarity can be determined.
4 Species of limited distribution in California (i.e., naturally rare in the wild), but whose
existence does not appear to be susceptible to threat.
East San Gabriel Valley November 2000
264
Significant Ecological Area Update Study
SENSITIVE SPECIES
OCCURRING OR POTENTIALLY OCCURRING
WITHIN THE PROPOSED EAST SAN GABRIEL VALLEY SEA
(CONTINUED)
VASCULAR PLANTS
Scientific Name Common Name
Calochortus catalinae Catalina mariposa
Calochortus plum me rae
Calochortus weedii va~ intermedius
Legend Agency Lists
lily
Plummer's mariposa lily
intermediate mariposa lily
FE Federally Listed as Endangered FT Federally Listed as Threatened FSC Federal Special Concern Species FPE Federally Proposed as Endangered FPT Federally Proposed as Threatened FPD Federally Proposed for De listing
Biological Resources Assessment PCR Project Team
SE
ST
SCE
SCT
SP
SFP
SR
esc
Agency CNPS
Listing Listing Status Status Preferred Habitat Location
4 Openings in chaparral, Potential where habitat valley and foothill grassland, occurs cismontane woodland; heavy soils.
FSC lB Sage scrub, valley and Live Oak Cyn., foothill grassland, yellow Claremont (1928); along pine forest; dry, rocky or Mills Ave, Claremont sandy sites, granitic or (1937) alluvial soil; to 4,800 feet.
FSC }B Chaparral, coastal scrub, Elephant Hill (1991); on valley and foothill summit of hill near grasslands. Rancho Santa Ana
Botanic Garden (1927)
California Native Plant Society (CNPS) Lists State Listed as Endangered lA Presumed extinct in California. State Listed as Threatened State Candidate for Endangered State Candidate for Threatened State Protected State Fully Protected State Rare California Special Concern Species
Page 14
lB Rare, threatened, or endangered throughout their range.
2 Rare, threatened, or endangered in California, but more common in other states.
3 Plant species for which additional information is needed before rarity can be determined.
4 Species of limited distribution in California (i.e., naturally rare in the wild), but whose existence does not appear to be susceptible to threat.
East San Gabriel Valley November 2000
265

Significant Ecological Area Update Study
SENSITIVE SPECIES
OCCURRING OR POTENTIALLY OCCURRING
WITHIN THE PROPOSED EAST SAN GABRIEL VALLEY SEA
(CONTINUED)
VERTEBRATES
Scientific Name
AMPHIBIANS
Pelobatidae
Scaphiopus hammondii
Agency Listing
Common Name Status
Spadefoot Toad Family
western spadefoot FSC, CSC,SP
Preferred Habitat
Prefers relatively open areas in lowland grasslands, chaparral, and pine-oak woodlands, areas of sandy or gravelly soil in alluvial fans, washes, and floodplains.
Location
Workman Hill in Puente Hills (1998); Puente Hills (1998)
REPTILES
Emydidae Box and Water Turtle Family
Clemmys marmora/a pal/ida
southwestern pond turtle
FSC, Ponds, marshes, rivers, streams, esc, SFP irrigation ditches.
Potential where habitat occurs
Iguanidae Iguanid Lizard Family
Phrynosoma San Diego coast coronatum blainvillei homed lizard
FSC:, CSC,SP
Whiptail Lizard Family
Valley-foothill hardwood, conifer, and riparian habitats, pine-cypress, juniper and annual grassland habitats below 6,000 feet, open country, especially sandy areas, washes, flood plains, and windblown deposits.
NW comer of Bonelli Regional Co. Park (1996)
Teiidae
Anniella pulchra pulchra
silvery legless lizard
esc Several habitats but especially in Potential where habitat
Cnemidophorus tigris multiscutatus
coastal western whiptail
Legend Agency Lists FE
FT
FSC
FPE
FPT
FPD
Federally Listed as Endangered Federally Listed as Threatened Federal Special Concern Species Federally Proposed as Endangered Federally Proposed as Threatened Federally Proposed for Delisting
Biological Resources Assessment PCR Project Team
FSC
coastal dune, valley-foothill, chaparral, occurs and coastal scrub habitats.
Arid and semi-arid desert to open Potential where habitat woodlands, where vegetation is sparse. occurs
SE
ST
SCE
SCT
SP
SFP
SR esc
Page 15
State Listed as Endangered State Listed as Threatened State Candidate for Endangered State Candidate for Threatened State Protected State Fully Protected State Rare California Special Concern Species
East San Gabriel Valley November 2000
266
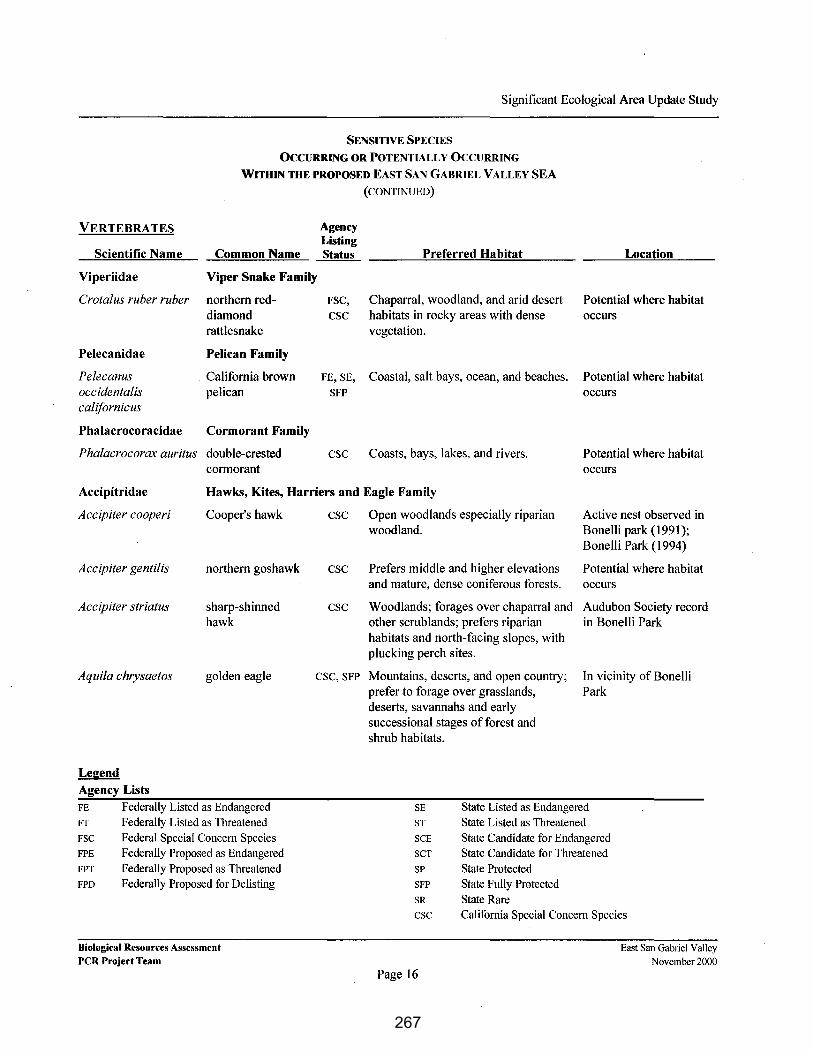
Significant Ecological Area Update Study
SENSITIVE SPECIES
OCCURRING OR POTENTIALLY OCCURRING
WITHIN THE PROPOSED EAST SAN GABRIEL VALLEY SEA
(CONTINUED)
VERTEBRATES Agency Listing
Scientific Name Common Name Status Preferred Habitat Location
Viperiidae Viper Snake Family
Crotalus ruber ruber northern red- FSC, Chaparral, woodland, and arid desert Potential where habitat diamond esc habitats in rocky areas with dense occurs rattlesnake vegetation.
Pelecanidae Pelican Family
Pelecanus California brown FE, SE, Coastal, salt bays, ocean, and beaches. Potential where habitat occident a/is pelican SFP occurs californicus
Phalacrocoracidae Cormorant Family
Phalacrocorax auritus double-crested esc Coasts, bays, lakes, and rivers. Potential where habitat cormorant occurs
Accipitridae
Accipiter cooperi
Hawks, Kites, Harriers and Eagle Family
Cooper's hawk
Accipiter gentilis northern goshawk
Accipiter striatus sharp-shinned hawk
Aquila chrysaetos golden eagle
Legend Agency Lists FE
FT
FSC
FPE
FPT
FPD
Federally Listed as Endangered Federally Listed as Threatened Federal Special Concern Species Federally Proposed as Endangered Federally Proposed as Threatened Federally Proposed for Delisting
Biological Resources Assessmeut PCR Project Team
esc Open woodlands especially riparian woodland.
esc Prefers middle and higher elevations and mature, dense coniferous forests.
esc Woodlands; forages over chaparral and other scrublands; prefers riparian habitats and north-facing slopes, with plucking perch sites.
esc, SFP Mountains, deserts, and open country; prefer to forage over grasslands, deserts, savannahs and early successional stages of forest and shrub habitats.
Active nest observed in Bonelli park (1991); Bonelli Park (1994)
Potential where habitat occurs
Audubon Society record in Bonelli Park
In vicinity of Bonelli Park
SE
ST
SCE
SCT
SP
SFP
SR esc
State Listed as Endangered State Listed as Threatened State Candidate for Endangered State Candidate for Threatened State Protected
Page 16
State Fully Protected State Rare California Special Concern Species
East San Gabriel Valley November 2000
267

Significant Ecological Area Update Study
SENSITIVE SPECIES
OCCURRING OR POTENTIALLY OCCURRING
WITHIN THE PROPOSED EAST SAN GABRIEL VALLEY SEA
(CONTINUED)
VERTEBRATES
Scientific Name
Buteo regalis
Circus cyaneus
Elanus leucurus
Haliaeetus leucocephalus
Pandion haliaetus
Falconidae
Falco columbarius
Falco mexicanus
Common Name
ferruginous hawk
northern harrier
white-tailed kite
bald eagle
osprey
Falcon Family
merlin
prairie falcon
Agency Listing Status
esc
esc
SFP
Preferred Habitat
Rivers, lakes, and coasts; open tracts of sparse shrubs and grasslands, and agricultural areas during winter.
Coastal salt marshes, freshwater marshes, grasslands, and agricultural fields; occasionally forages over open desert and brushlands.
Grasslands with scattered trees, near marshes, along highways.
FT, FPD, Lakes, reservoirs, rivers, offshore esc, SE islands, and some rangelands and
coastal wetlands in southern California.
esc Rivers, lakes, and coasts, mixed conifer.
esc Coastlines, wetlands, woodlands, agricultural fields, and grasslands.
esc Grasslands, savannahs, rangeland, agricultural fields, and desert scrub; often uses sheltered cliff ledges for cover.
Location
Documented in winter at Bonelli Park
Bonelli Park
Historically documented in Bonelli Regional Co. Park
Potential where habitat occurs
Bonelli Park (1994)
Potential where habitat occurs
Potential where habitat occurs
Laridae Gulls and Tern Family
Larus californicus California gull
Legend Agency Lists FE
FT
FSC
FPE
FPT
FPD
Federally Listed as Endangered Federally Listed as Threatened Federal Special Concern Species Federally Proposed as Endangered Federally Proposed as Threatened Federally Proposed for Delisting
Biological Resources Assessment PCR Projed Team
esc Seacoasts, lakes, farms, and urban centers.
Potential where habitat occurs
SE
ST
SCE
SCT
SP
SFP
SR
esc
Page 17
State Listed as Endangered State Listed as Threatened State Candidate for Endangered State Candidate for Threatened State Protected State Fully Protected State Rare California Special Concern Species
East San Gabriel Valley
November 2000
268

Significant Ecological Area Update Study
SENSITIVE SPECIES
OCCURRING OR POTENTIALLY OCCURRING
WITHIN THE PROPOSED EAST SAN GABRIEL VALLEY SEA
(CONTINUED)
VERTEBRATES Agency Listing
Scientific Name Common Name Status
Strigidae True Owl Family
Asia jlammeus short-eared owl esc
Asia atus long-eared owl esc
Athene cunicularia burrowing owl FSC,
esc
Apodidae Swift Family
Chaetura vauxi Vaux's swift esc
Tyrannidae Tyrant Flycatcher Family
Empidanax traillii willow flycatcher
Empidanax traillii southwestern extimus willow flycatcher
Legend
Agency Lists FE
FT
FSC
FPE
FPT
FPD
Federally Listed as Endangered Federally Listed as Threatened Federal Special Concern Species Federally Proposed as Endangered Federally Proposed as Threatened Federally Proposed for Delisting
Biological Resources Assessment PCR Project Team
SE
FE
Preferred Habitat Location
Prairies, marshes (fresh and salt) Historic records in dunes, tundra. Bonelli Park, fairly
common in winter
Riparian and live oak woodlands. Potential where habitat occurs
Dry grasslands, desert habitats, and Potential where habitat open pinyon-juniper and ponderosa occurs pine woodlands below 5,300 feet elevation. Prefers berms, ditches, and grasslands adjacent to rivers, agricultural, and scrub areas.
Redwood and douglas fir habitats. Potential where habitat occurs
Wet meadow and montane riparian Potential where habitat habitats, river valleys and large mtn. occurs meadows.
Low elevational sites: Riparian Potential where habitat woodlands that contain water and low occurs growing willow thickets. High elevational sites: Large, flat, wet meadows that contain patches of willow trees.
SE
ST
SCE
SCT
SP SFP SR esc
State Listed as Endangered State Listed as Threatened State Candidate for Endangered State Candidate for Threatened State Protected
Page 18
State Fully Protected State Rare California Special Concern Species
East San Gabriel Valley
November 2000
269

Significant Ecological Area Update Study
SENSITIVE SPECIES
OCCURRING OR POTENTIALLY OCCURRING
WITHI!"' THE PROPOSED EAST SAN GABRIEL VALLEY SEA
(CONTINUED)
VERTEBRATES Agency Listing
Scientific Name Common Name Status Preferred Habitat Location
Alaudidae Lark Family
Eremophila alpestris California horned esc Open habitats, grasslands along the Historical sightings in actia lark coast, deserts near sea level to alpine Bonelli Park
dwarf shrub habitat, uncommonly in coniferous and chaparral habitats.
Troglodytidae Wren Family
Campylorhynchus coastal cactus wren esc Coastal sage scrub, vegetation with Potential where habitat brunneicapillus couesi thickets of prickly pear or cholla occurs
cactus.
Muscicapidae Kinglets, Gnatcatchers, Thrushes, and Babbler Family
Polioptila californica californica
Laniidae
Lanius ludovicianus
Legend Agency Lists
California gnatcatcher
Shrike Family
loggerhead shrike
FE
FT
FSC
FPE
FPT
FPD
Federally Listed as Endangered Federally Listed as Threatened Federal Special Concern Species Federally Proposed as Endangered Federally Proposed as Threatened Federally Proposed for Delisting
Biological Resources Assessment PCR Project Team
FT,CSC
FSC,
esc
Coastal sage scrub vegetation below NW comer of Bonelli 2,500 feet elevation in Riverside Park, at or near County and generally below 1,000 feet Puddingstone Reservoir elevation along the coastal slope; (1996) generally avoids steep slopes and dense vegetation for nesting.
Open habitats with scattered shrubs, Bonelli Park, in trees, posts, fences, utility lines, or buckwheat scrub near other perches. reservoir
SE
ST
SCE
SCT
SP SFP
SR esc
State Listed as Endangered State Listed as Threatened State Candidate for Endangered State Candidate for Threatened State Protected
Page 19
State Fully Protected State Rare California Special Concern Species
East San Gabriel Valley November 2000
270

Significant Ecological Area Update Study
SENSITIVE SPECIES
OCCURRING OR POTENTIALLY OCCURRING
WITHIN THE PROPOSED EAST SAN GABRIEL VALLEY SEA
(CONTINUED)
VERTEBRATES
Scientific Name
Vireonidae
Vireo bellii pusillus
Agency Listing
Common Name Status
Vireo Family
least Bell's vireo FE, SE
Preferred Habitat Location
Perennial and intermittent streams Potential where habitat with low, dense riparian scrub and occurs riparian woodland habitats below 2,000 feet elevation; nests primarily in willows and forages in the riparian and occasionally in adjoining upland habitats. Associated with willow, cottonwood, and mule fat.
Emberizidae Wood Warblers, Tanagers, Buntings, and Blackbird Family
Aimophila rujiceps Southern FSC,
canescens California (ashy) esc rufous-crowned sparrow
Dendroica petechia yellow warbler esc brewsteri
Icteria virens yellow-breasted esc chat
Evening Bat Family Vespertilionidae
Antrozous pallidus pallid bat esc
Legend Agency Lists FE FT
FSC
FPE FPT FPD
Federally Listed as Endangered Federally Listed as Threatened
Federal Special Concern Species Federally Proposed as Endangered
Federally Proposed as Threatened Federally Proposed for De listing
Biological R~sourc~s Assessment PCR Project Team
Generally, steep, rocky areas within Bonelli Park (1994) coastal sage scrub and chaparral, often with scattered bunches of grass; prefers relatively recently burned areas.
Riparian woodlands, montane Potential where habitat chaparral, and mixed conifer habitats. occurs
Riparian woodlands with a thick Bonelli Park (1994) understory.
Nests in dry, rocky habitats/caves, Potential where habitat crevices in rocks, arid habitats occurs including deserts, chaparral, and scrub lands.
State Listed as Endangered State Listed as Threatened
State Candidate for Endangered State Candidate for Threatened
State Protected State Fully Protected
State Rare
SE
ST
SCE
SCT
SP SFP
SR esc California Special Concern Species
Page 20
East San Gabriel Valley
November 2000
271

Significant Ecological Area Update Study
SENSITIVE SPECIES
OCCURRING OR POTENTIALLY OCCURRING
WITHIN THE PROPOSED EAST SAN GABRIEL VALLEY SEA
(CONTINUED)
VERTEBRATES
Scientific Name
Molossidae
Eumops perotis californicus
Leporidae
Lepus californicus bennettii
Agency Listing
Common Name Status
Free-Tailed Bat Family
western mastiffbat FSC,
esc
Hares and Rabbit Family
San Diego blacktailed jackrabbit
FSC,
esc
Preferred Habitat Location
Primarily arid lowlands, especially Potential where habitat deserts. Open, semiarid to arid occurs habitats including conifer and deciduous woodlands, coastal scrub, annual and perennial grasslands, palm oases, chaparral, desert scrub, and urban.
Open brushlands and scrub habitats between sea level and 4,000 feet elevation.
Bonelli Park (1992)
Heteromyidae
Perognathus longimembris brevinasus
Pocket Mice and Kangaroo Rat Family
Los Angeles pocket FSC,
mouse esc
Muridae
Neotoma lepida intermedia
Mice, Rats, and Vole Family
San Diego desert wood rat
Legend Agency Lists FE FT
FSC
FPE FPT FPD
Federally Listed as Endangered
Federally Listed as Threatened Federal Special Concern Species Federally Proposed as Endangered
Federally Proposed as Threatened Federally Proposed for De listing
Biological Resources Assessment PCR Project Team
FSC,
esc
Coastal sage scrub, and grasslands, desert cactus, creosote bush and sagebrush habitats.
Potential where habitat occurs
Chaparral, coastal sage scrub, and pinyon-juniper woodland.
Potential where habitat occurs
SE
ST SCE
SCT SP SFP SR esc
Page 21
State Listed as Endangered State Listed as Threatened State Candidate fqr Endangered State Candidate for Threatened
State Protected State Fully Protected
State Rare California Special Concern Species
East San Gabriel Valley November 2000
272

Significant Ecological Area Update Study
9. REGIONAL BIOLOGICAL VALUE
The proposed Santa Monica Mountains SEA meets several SEA designation criteria and supports many regional biological values. Each criterion and how it is met is described below.
Criterion A: The Habitat of Core Populations of Endangered or Threatened Plant or Animal Species.
This SEA contains habitat which supports a core population (and the only known population) of the federally threatened California gnatcatcher, in the eastern San Gabriel Valley. This population has been recently observed in coastal sage scrub at two locations in the area, Bonelli Park and Buzzard Peak. At both locations surveys over multiple years indicate that this population has been increasing in numbers. Currently, it is believed that there are between ten and fifteen pairs of gnatcatchers in this population.
Criterion B: On a Regional Basis, Biotic Communities, Vegetative Associations, and Habitat of Plant or Animal Species that are either Unique or are Restricted in Distribution.
Several plant communities within this SEA are CDFG highest inventory priority communities due to their restricted distribution in the Southern California region. These communities include: oak woodland and walnut woodland which are scattered throughout the components of this SEA; oak riparian woodland which is best expressed within the Walnut Creek drainage; isolated stands of willow woodland along many of the drainages in the Bonelli/Walnut Creek Parks and Buzzard Peak components; freshwater marsh and open water found primarily in association with Puddingstone Reservoir; and coastal sage scrub, which also serves as the habitat for the California gnatcatcher, found in scattered patches over hillsides within the South Hills, Bonelli/Walnut Parks, Via Verde and Buzzard Peak components.
Criterion C: Within Los Angeles County, Biotic Communities, Vegetative Associations, and Habitat of Plant or Animal Species that are either Unique or are Restricted in Distribution.
All of the plant communities and habitats indicated above as restricted in distribution on a regional basis, are also restricted in distribution within Los Angeles County.
Biological Resources Assessment PCR Project Team
Page 22
East San Gabriel Valley November 2000
273
Significant Ecological Area Update Study
Criterion D: Habitat that at some point in the Life Cycle of a Species or Group of Species, Serves as Concentrated Breeding, Feeding, Resting, or Migrating Grounds and is Limited in Availability either Regionally or in Los Angeles County.
Any relatively large body of water with pockets of natural lakeside vegetation along its shoreline potentially meets this criteria, particularly within the context of an arid to semiarid environment, characteristic of Los Angeles County. Although subjected to boating activities and shoreline recreational use, Puddingstone Reservoir serves as an important habitat for migrating water fowl and water birds, evident in the high diversity of birds recorded at the park over the past several years.
Criterion E: Biotic Resources that are of Scientific Interest because they are either an Extreme in Physical/Geographical Limitations, or Represent Unusual Variation in a Population or Community.
The SEA does not contain biotic resource that are clearly an extreme in physical/ geographical limitations, or represent unusual variation in a population or community and therefore does not meet this criterion.
Criterion F: Areas that would Provide for the Preservation of Relatively Undisturbed Examples of the Original Natural Biotic Communities in Los Angeles County.
The proposed SEA does not contain areas that would provide for the preservation of relatively undisturbed examples of the original natural biotic communities in Los Angeles County.
In conclusion, the area described in this report is proposed to be an SEA because it contains: I) the habitat of core populations of endangered and threatened plant and animal species; 2) biotic communities, vegetative associations, and habitat of plant and animal species that are either unique or are restricted in distribution in Los Angeles County, or regionally; and 3) concentrated breeding, feeding, resting, or migrating grounds which are limited in availability in Los Angeles County.
10. RECOMMENDED MANAGEMENT PRACTICES
Proposed new development within the proposed Puente Hills SEA should be designed to be highly compatible with the continued ecological function of the component biological resources described above; retention of existing natural biotic resources should be ensured. Although a comprehensive evaluation of all possible future land uses within this SEA cannot be made here, a general approach is outlined below and is recommended for use on a project specific basis. In order
Biological Resources Assessment PCR Project Team
Page 23
East San Gabriel Valley November 2000
274
Significant Ecological Area Update Study
to preserve the integrity of the SEA, the proposed comprehensive management practices described in the Los Angeles County SEA Update Study 2000 Background Report are recommended. These practices address:
• Core habitat
• Habitat linkages and wildlife corridors
• Fire management
• Public access and recreation
• Infrastructure
• Wetlands, riparian habitats, and streambeds
• Non-riparian/upland woodlands
In addition to the comprehensive management practices the following proposed management practices are recommended specifically for the proposed East San Gabriel Valley SEA:
• Limit development densities to one residential unit per ten acre parcel, and constrain development design, where feasible, to cluster dwelling configuration along existing roadways in order to minimize clearing associated with fuel management, and to reduce the need for grading, fencing, and other habitat disturbances.
• Maintain the habitat of core populations of listed species including the federally threatened California gnatcatcher.
• Retain rare communities with adequate buffers so as to allow for the long term viability and integrity of plant communities as a whole. Rare communities include: oak woodland, oak riparian forest, walnut woodland, willow woodland, and coastal sage scrub.
• Retain connectivity and linkage values through this SEA as an island hopping linkage between the San Gabriel Mountains and the Puente Hills. Maintain lines of sight between components at or near their existing borders. To the greatest extent possible, existing distances between the components should be maintained rather than increase through intense uses at their perimeters.
Additionally, proposed development should be reviewed when required by federal, state, or local laws before implementing plans which may impact biotic resources and/or sensitive species. Potential impacts to listed species or wetland areas require permitting in accordance with applicable laws.
Biological Resources Assessment PCR Project Team
Page 24
East San Gabriel Valley November 2000
275

Significant Ecological Area Update Study
11. SOURCES
Los Angeles County, Department of Parks and Recreation. Date unknown. Bonelli Regional Park Bird List, San Dimas, California
Michael Brandman Associates. 1995. Draft Environmental Impact Report, Frank G. Bonelli Regional County Park Master Plan, State Clearinghouse No. 94061006, Los Angeles, California.
Quinn, R.P. Date unknown. The Status of Walnut Forests and Woodlands (Juglans califomica) in Southern California, Department of Biological Sciences, California State Polytechnic University, Pomona, California.
Biological Resources Assessment PCR Project Team
Page 25
East San Gabriel Valley
November 2000
276
PCR SANTA MONICA
233 Wilshrre Boulevard
Suite 130
Santa Monica, Californ ia 90401
lEI 310.451.4488 FAX 310.451.5279
E~Ail info@pcrnetco'n
PCR KoliN 12100 Wilshire Boulevard
Suite 1050
Los Angeles, California 90025
TEL 310.820.0900 lAX 310.820.1703
FMAil 1tlfocg1pcrnet.corr
PCR IRVINE
One Venture Suite 150
Irvine, Ca lifornia 926 18
TH 949.753.7001 FAX 949.753.7002
EMA• info(i'l pcrnetcom
277
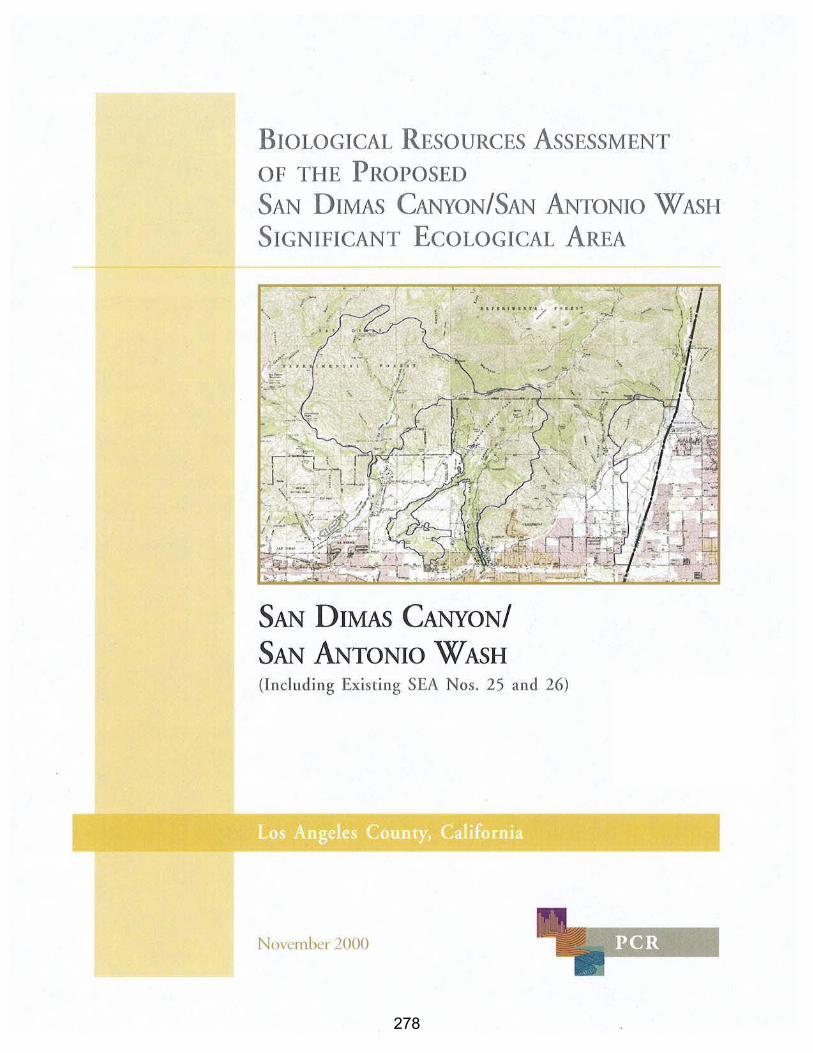
BIOLOGICAL REsouRcEs AssESSMENT
OF THE PROPOSED
SAN DIMAS CANYON/SAN ANTONIO WASH
SIGNIFICANT ECOLOGICAL AREA
i . J,, ••• • 1'k1' / , •. .• .!."
SAN DIMAS CANYON/
SAN ANTONIO WASH (Including Existing SEA Nos. 25 and 26)
Los Angeles County, California
November ?000
278
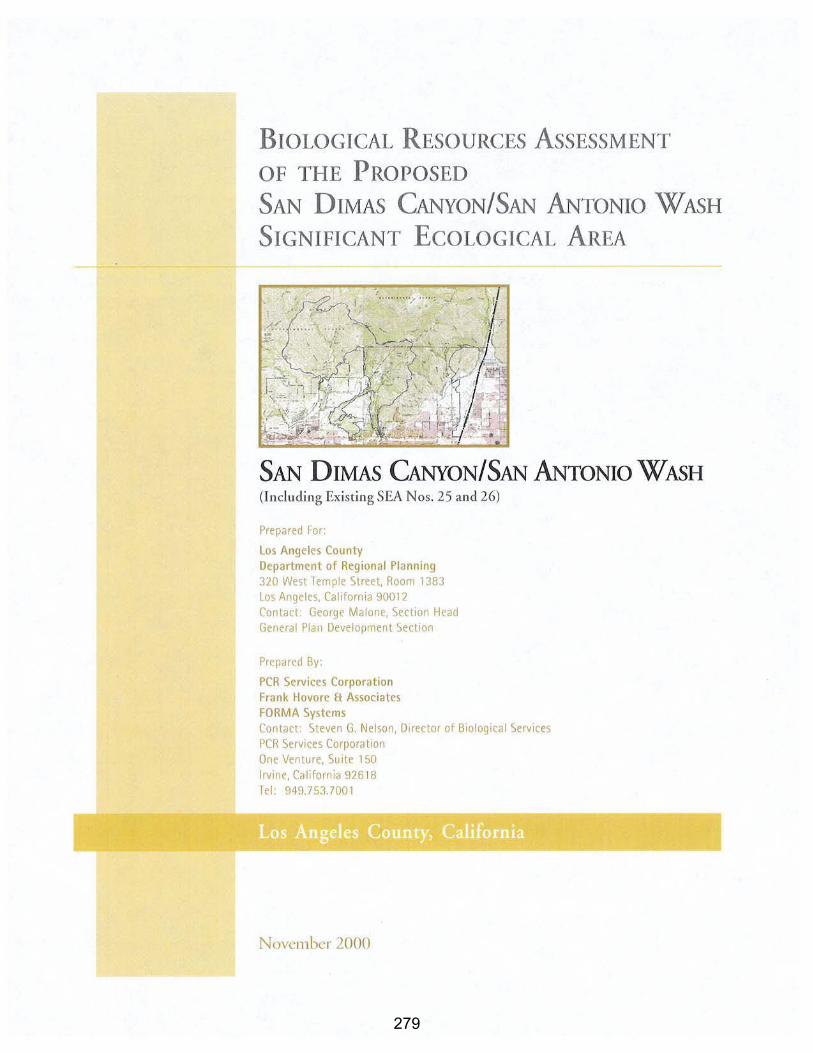
BIOLOGICAL REsouRcEs AssESSMENT
OF THE PROPOSED
SAN DIMAS CANYON/SAN ANTONIO WASH
SIGNIFICANT ECOLOGICAL AREA
SAN DIMAS CANYON/SAN ANTONIO WASH (Including Existing SEA Nos. 25 and 26)
Prepared For:
Los Angeles County Department of Reg ional Planning 320 West remple Street. Room 1383 Los Angeles. California 90012 Contact: George Malone, Section Head General Plan Development Section
Prepared By:
PCR Services Corporation Frank Hovore a Associates FORMA Systems Contdct. Steven G. Nelson, 01rect01 of B1ological Serv1ces PCR Serv1ces Corporation One Venture. Suite 150 Irvine, California 926 18 Tel: 949.753.7001
November 2000
279

TABLE OF CONTENTS
Page
EXECUTIVE SUMMARY ................................................. iv
1. LOCATION ....................................... , ................. 1
1.1 GENERAL . . . . . . . . . . . . . . . . . . . . . . . . . . . . . . . . . . . . . . . . . . . . . . . . . . . . . . 1
1.2 BOUNDARY DESCRIPTION
2. DESCRIPTION . . . . . . . . . . . . . . . . . . . . . . . . . . . . . . . . . . . . . . . . . . . . . . . . . . . . . . 4
3. EXISTING LAND USE . . . . . . . . . . . . . . . . . . . . . . . . . . . . . . . . . . . . . . . . . . . . . . . . 4
4. LAND OWNERSHIP . . . . . . . . . . . . . . . . . . . . . . . . . . . . . . . . . . . . . . . . . . . . . . . . . . 5
5. VEGETATION ...................................................... 5
6. WILDLIFE . . . . . . . . . . . . . . . . . . . . . . . . . . . . . . . . . . . . . . . . . . . . . . . . . . . . . . . . . . 7
7. WILDLIFE MOVEMENT . . . . . . . . . . . . . . . . . . . . . . . . . . . . . . . . . . . . . . . . . . . . . . 8
8. SENSITIVE BIOLOGICAL RESOURCES . . . . . . . . . . . . . . . . . . . . . . . . . . . . . . . . . 8
8.1 SENSITIVEPLANTCOMMUNITIES/HABITATS ............................ 9
8.2 SENSITIVE SPECIES . . . . . . . . . . . . . . . . . . . . . . . . . . . . . . . . . . . . . . . . . . . . . . . 9
9. REGIONAL BIOLOGICAL VALUE . . . . . . . . . . . . . . . . . . . . . . . . . . . . . . . . . . . . . 36
10. RECOMMENDED MANAGEMENT PRACTICES . . . . . . . . . . . . . . . . . . . . . . . . . 37
11. SOURCES . . . . . . . . . . . . . . . . . . . . . . . . . . . . . . . . . . . . . . . . . . . . . . . . . . . . . . . . . 38
Biological Resources Assessment PCR Project Team
Page i
San Dimas Canyon/San Antonio Wash November 2000
280

LIST OF FIGURES
Figure Page
Regional Map . . . . . . . . . . . . . . . . . . . . . . . . . . . . . . . . . . . . . . . . . . . . . . . . . . . . . . . 2
2 Existing and Proposed Boundaries . . . . . . . . . . . . . . . . . . . . . . . . . . . . . . . . . . . . . . . 3
Biological Resources Assessment PCR Project Team
Page ii
San Dimas Canyon/San Antonio Wash November 2000
281
LIST OF TABLES
Table Page
Criteria Analysis VII
Sensitive Species . . . . . . . . . . . . . . . . . . . . . . . . . . . . . . . . . . . . . . . . . . . . . . . . . . . . . . . . I 0
Biological Resources Assessment PCR Project Team
Page iii
San Dimas Canyon/San Antonio Wash November 2000
282

EXECUTIVE SUMMARY
Location: The San Dimas Canyon/San Antonio Wash Significant Ecological Area (SEA), as proposed, is located along the cismontane foothills of the eastern San Gabriel Mountains and is centered on the mouths of four major canyons which flow from the mountains and interconnecting terrain including: San Antonio, Live Oak, Marshall, and San Dimas Canyons. It incorporates existing SEA numbers 25 and 26.
Description: The proposed San Dimas Canyon/San Antonio Wash SEA is comprised of two component parts encompassing a total of 6, 785 acres. The topography of the SEA, including steepwalled canyons, narrow ridgelines, and a wide range of elevation, topography, slope aspect, and geology represent a wide array of physical habitats within this SEA. Consequently, a number of plant communities exist, including grasslands, riparian, shrublands, woodlands, and forests. The 6,785 acres proposed for the San Dimas Canyon/San Antonio Wash SEA are within several jurisdictions including: 2,961 in the Angeles National Forest; 1,568 in unincorporated Los Angeles County; 1,566 within the City of Claremont; 9 within the City of Glendora; 320 within the City of La Verne; and 361 in the City of San Dimas.
Existing Land Use: Land uses in this SEA are predominantly low intensity recreation and open space within public lands. The overwhelming majority of this SEA is within the Angeles National Forest which is oriented toward recreational use. For the most part, unimproved roads, trails, campgrounds, and scattered cabins represent the most intense uses of the forest. Private landholdings which comprise a very small portion of the SEA exist in open space as well.
Ownership: The majority of the land within the SEA is owned by the U.S. Government and is managed by the Forest Service, Angeles National Forest. A much smaller area is owned by the cities of Claremont and Glendora, each of which manages a wilderness park in the SEA. The County also operates and maintains limited areas for flood control. The remainder of the SEA (a relatively small portion) is under private ownership in parcels of varying sizes.
Vegetation: The variety of topography, soil types, slope aspects and water availability within this SEA creates a range of physical habitats which support numerous plant species. The major plant communities found within the San Dimas Canyon/San Antonio Wash SEA include: bigcone sprucecanyon oak forest, white alder riparian forest, alluvial fan scrub, oak woodland, oak riparian forest, walnut woodland, southern willow scrub, chaparral, coastal sage scrub, and non-native grassland.
Biological Resources Assessment PCR Project Team
Pageiv
San Dimas Canyon/San Antonio Wash November 2000
283
Executive Summary
Wildlife: Wildlife populations within the proposed San Dimas Canyon/San Antonio Wash SEA are diverse and abundant due to the region's physiographic diversity, its relative isolation, and its location within and adjacent to the Angeles National Forest. Bird and mammal use, diversity, and abundance within this SEA is high.
Wildlife Movement: Wildlife movement within the San Dimas Canyon/San Antonio Wash SEA occurs in two ways. The first is movement throughout the many sizeable drainages which course through the SEA to connect the forest interior with foothill areas. The second way is across the flanks of the foothills and lower mountains in an east-west direction. Particularly for riparianfavoring migratory birds, a corridor linking lower elevation riparian habitats in the San Dimas Canyon/San Antonio Wash SEA is expected to be of high use and importance.
Sensitive Biological Resources: The San Dimas Canyon/San Antonio Wash SEA contains habitats, or plant communities, that are considered unique, of relatively limited distribution, or of particular value to wildlife. These are oak woodland, walnut woodland, oak riparian woodland, southern willow scrub, coastal sage scrub, and alluvial fan scrub. A number of sensitive plant and wildlife species exist or potentially occur within the SEA. These species are considered sensitive due to declining, limited, or threatened populations, resulting in most cases from habitat reductions.
Regional Biological Value: The proposed SEA meets several designation criteria and supports many regional biological values (see Criteria Table at the end of this summary). The SEA contains the core population of the extremely rare rock monardella. Several plant communities within this SEA are restricted in distribution in the Southern California region and Los Angeles County including: oak woodland, walnut woodland, oak riparian woodland, southern willow scrub, coastal
. sage scrub, and alluvial fan scrub. The SEA supports well developed and diverse riparian woodlands, as well as year-round sources of water. These represent important stopover and overwintering sites for a wide variety of migratory birds, as well as essential habitat for resident species. This SEA also facilitates more frequent movement for wide-ranging mammals which must move over large areas to fulfill their habitat requirements. Virtually all of the native biotic communities within this SEA are relatively undisturbed.
Recommended Management Practices: Proposed new development within the proposed San Dimas Canyon/San Antonio Wash SEA should be designed to be highly compatible with the continued ecological function of each of the component biological resources described above. Although a comprehensive evaluation of all possible future land uses within this SEA cannot be made here, a general approach is outlined below which follows the guidelines and is recommended for use on a project specific basis. In order to preserve the integrity of the SEA, the proposed
Biological Resources Assessment PCR Project Team
Page v
San Dimas Canyon/San Antonio Wash November 2000
284

Executive Summary
comprehensive management practices described in the Los Angeles County SEA Update Study 2000 Background Report are recommended. These practices address:
• Core habitat
• Habitat linkages and wildlife corridors
• Fire management
• Public access and recreation
• Infrastructure
• Wetlands, riparian habitats, and streambeds
• Non-riparian/upland woodlands
In addition to the comprehensive management practices the following proposed management practices are recommended specifically for the proposed San Dimas Canyon/San Antonio Wash SEA:
• Maintain the habitat of core populations of extremely rare spectes including rock monardella.
• Retain rare communities with adequate buffers so as to allow for the long term viability and integrity of plant communities as a whole. Rare communities include: oak woodland, walnut woodland, oak riparian woodland, southern willow scrub, coastal sage scrub, and alluvial fan scrub.
Biological Resources Assessment PCR Project Team
Page vi
San Dimas Canyon/San Antonio Wash November 2000
285

Executive Summary
CRITERIA ANALYSIS
OF THE PROPOSED SAN DIMAS CANYON/SAN ANTONIO WASH SEA
Criterion Status
A) The habitat of core populations of Not endangered or threatened plant or met animal species.
B) On a regional basis, biotic Met communtttes, vegetative associations, and habitat of plant or animal species that are either unique or are restricted in distribution.
C) Within Los Angeles County, biotic Met communities, vegetative associations, and habitat of plant or animal species that are either unique or are restricted in distribution.
D) Habitat that at some point in the life Met cycle of a species or group of species, serves as concentrated breeding, feeding, resting, or migrating grounds and is limited in availability either regionally or in Los Angeles County.
E) Biotic resources that are of scientific Not interest because they are either an met extreme in physical/geographical limitations, or represent unusual variation in a population or community.
F) Areas that would provide for the Met preservation of relatively undisturbed examples of the original natural biotic communities in Los Angeles County.
Biological Resources Assessment PCR Project Team
Justification
Although the proposed SEA contains rare plant populations, it does not contain a core population of a listed species and therefore does not meet this criterion.
The proposed SEA contains habitat of the extremely rare rock monardella. In addition, several plant communities within this SEA are CDFG highest inventory priority communities due to their restricted distribution in the Southern California region, including: walnut woodland, oak riparian woodland, southern willow scrub, coastal sage scrub, and alluvial fan scrub.
All of the plant communities and habitats mentioned above as being restricted in distribution on a regional basis are also restricted in distribution within Los Angeles County.
The major canyons within this SEA support well developed and diverse riparian woodlands, as well as a source of water for most, if not all, of the year. These represent important stopover and overwintering areas for a wide variety of migratory birds, as well as essential habitat for resident species. These canyons also support seasonal and more frequent movement for wide-ranging mammals which must move over large areas to fulfill their habitat requirements.
The proposed SEA does not contain biotic resources that are clearly an extreme in physical/geographical limitations, or represent unusual variation in a population or community and therefore does not meet this criterion.
Virtually all of the native biotic communities within this SEA are relatively undisturbed over most of their extent. As such, and because urbanization throughout much of Los Angeles County's foothill regions has removed large expanses ofthese communities, those in the San Dimas Canyon/San Antonio Wash SEA are particularly important to the County's natural heritage.
Page vii
San Dimas Canyon/San Antonio Wash November 2000
286
SIGNIFICANT ECOLOGICAL AREA UPDATE STUDY
1. LOCATION
1.1 GENERAL
The San Dimas Canyon/San Antonio Wash Significant Ecological Area (SEA), as proposed, is located along the cismontane foothills of the eastern San Gabriel Mountains as shown in Figure 1, Regional Map, on page 2. Generally, the SEA is centered on the mouths of four major canyons which flow from the mountains and interconnecting terrain. From east to west these canyons include: San Antonio Canyon above the City of Claremont as one component; and Live Oak, Marshall, and San Dimas Canyons above the cities of La Verne and San Dimas as a second component. The proposed SEA is found within the Mount Baldy and Ontario U.S. Geological Survey (USGS) 7.5' California Quadrangles as shown in Figure 2, Existing and Proposed Boundaries on page 3. It incorporates existing SEA numbers 25 and 26.
1.2 BOUNDARY DESCRIPTION
Over most of its boundaries, particularly to the north, east, and west of each component, the proposed SEA is bordered by open space within the Angeles National Forest. Generally to the south, however, the borders are mostly defined by the edge of urban development within the San Gabriel Valley. The more westerly component of this SEA generally includes portions of the lower watersheds of San Dimas, Marshall, and Live Oak Canyons (San Dimas Canyon component). Beginning at Johnston Peak in the west, the western boundary follows the ridgeline separating Big Dalton Canyon and San Dimas Canyon. Just before this ridgeline is intersected by Big Dalton Canyon Road the SEA boundary turns east. From the area of Big Dalton Canyon Road the northern boundary both follows and crosses over a series of ridge lines to include the upper portions of several tributary canyons. It continues in this fashion in a southeasterly direction eventually meeting and following the Sunset Ridge Fire Road. The eastern boundary leaves the fire road and travels south along a ridgeline separating Live Oak Canyon and Palmer Canyon. It continues in a southwesterly direction to meet the Live Oak Canyon drainage. From here to the west, the SEA includes two fingers which include the Live Oak Canyon drainage downstream to Base Line Road, and Marshall Creek to Base Line Road. A small area of hillsides adjacent to Marshall Creek is also included. From this point the southern boundary travels north up Marshall Canyon to meet San Dimas Canyon Road, then southwest along Sunset Ridge to San Dimas Canyon below the San Dimas Reservoir; then northwest along a ridge to Johnston Peak.
Biological Resources Assessment PCR Project Team
Page I
San Dimas Canyon/San Antonio Wash November 2000
287
'LOS PADRES
NATIONAL FOREST
(J Santa Barbara Island
-·-· . -·-·-·-·-·-·-·-·-·-· ·-·-·-·-·-·-·-·-·-·~ L---------~m-----------4 • b
;..13
Malibu
P a c i I i c
0 5 10
Source: PCR Services Corporation. 2000
20 Miles
biO 5.u a Lancaster 0 IO
u z (/) · -wla tj .~ 0 1~ z .~ ;;; lw Q a CO -l
Figure 1 San Dimas Canyon/San Antonio Wash
Significant Ecological Area Regional Map
288

<J ' • :.,,...
·1-a?,.
•• (") . , ~ 0 .
;
:::. ~0·
$,wi.t 1: "-" ~,~
:\'
OC' ~,,._ol ('v"\ , ~ .~'
,., G<e NP> ~•·~:
;\
IJ'fi '/Niflt.p Jt;.-n..,.;,.
P.
:........::::~ 7/l~:tz': .. ~'~
' co. ... ,. ..
X p .J\fENT.~ L
~~:.
<1,. "..t.o
>
"""~~··""" ~ ""' .... h 'V .,.., 1" ..... , .. ....
.. .::o~~ ·~~~, ,, .f~~fr::-·-,·
~'"'"1:._Ll~il· 1 J \• ; .,..,
., < .--. . ~ . ---,..:; ~ \ . ~ I - ·~·':...., j[ ; ~ '';:: - '\o.l ..... -. ---.,..;.·......----·-•• '>,_,_ - - t·'
• \ i •.
-·-·y \/:~~~~i~~t~1A~~ ./' • _ _5_. •.:<. • . r~~ll.• "
.. i
I
·~~~" ...... ·;at·-.....
N Proposed SEA Boundary N Existing SEA Boundary /', / Angeles National Forest
F 0 Rl E '~S .T : ~: < • j(
.. , .. 14: ::.· <,;;Ji~~\
ii i'" ~~ ~ t ., ,
;' ') ,rf~ J
...; .: ..
.. • .. E X l' il- lt 1
.. .,o~,.
(> J
'Y-o •
~\.;~~ ('~~ ,.,. 4-..... ~'·
<; :-\._/ ·. -. ' ';"·· y ··--~·"'h . ...... ,···
-· M E IS., •• T-'i L ,
·-.:;······' ·, /~
. :: ;2~ . ('}-:' F Q R .£ S •( • (··~.;t. ..
,.,.. ';~""' .... ~·; '·.i'.;;:.:~~:~· "l ...... , , ' '.u.. ....
J.''
r>··\ --\--~ /-.. ~
·/ .. ,/ ) r·./; : {
;"""' ~ 1/ ·,, I ,.: . ., \'(., ..
..~
'v' .?-.. ~ ... (:.:;)•t:.:r - (( }
fl' - 'o~ · ~;·:f.·:~; CaC\~ 1~:"- .... 't
~ :/:-" . ) .•·' ~~r.:~-... ~ ;:p~· . ~,
\ ~ ... ·~~
)::-..-.:;4:
~ . , .... l '
~\i1.·
"\,,, 4<"•;.;~; ....
~=~ i '" .•"+ .• ! ... ,
!'"
~. , r et-...,.
- s,ot.;,.c.e e.")l-o,,
- -"'~
' i) ·-~'i:~~~ .. :;;.::;~ ''(ff. -· ~~· .• . .. . ,-/.::... : ' --~--":~~~~., ~~,:~:·~·: ..
~r .. ~; __ #L ~ ~;ll:~ ... :J ....
.•· ~r-
} G
,.o·-__ .. .,. ~~···~~~~. '· . . ... · .... · y ..... :; :. - F. ~ ,...._J ,.,,. .. t . ·~::- :,¥. ......... J; ~,
.... ;. ...... ;~ "lto¥01 ~· ....
:_:.:":'';l. r ··~ . • ,_ ' c f I .. ,·:" ~:~~ .~
¥=& ."tO w~ • "''' - ... ~.UO : .. \
v~~
... :........ ~!"-; .~ . ~-• • ·-. r·;:lpa ~.,. . .: ·....-
Figure 2 San Dimas Canyon/San Antonio Wash
Significant Ecological Area Existine and Proposed Boundaries
0
Feet
4300 ~ A
FORMA Systems 09/06/00
289

Significant Ecological Area Update Study
The eastern component principally includes the alluvial outwash area of San Antonio Canyon (San Antonio Canyon component) and a small portion of the adjacent lower hillsides to the west of the drainage. The eastern boundary is the Los Angeles/San Bernardino County line, with the southern boundary at Base Line Road. The western boundary begins at Base Line Road in the south, travels north along the edge of residential development to meet Mount Baldy Road; it continues to the west along Mount Baldy Road to near the Palmer Canyon drainage where it turns north. The boundary then follows a ridgeline in an easterly direction, and crosses San Antonio Canyon to terminate at the San Bernardino/Los Angeles County line.
2. DESCRiPTION
The proposed San Dimas Canyon/San Antonio Wash SEA is comprised of two component parts. The San Dimas Canyon component covers approximately 5,593 acres and includes portions of Live Oak, Marshall, and San Dimas Canyons. The smaller component, San Antonio Canyon, covers approximately I, 194 acres of the San An!onio Canyon alluvial outwash. In total this SEA encompasses 6,785 acres.
In general, the topography of the SEA is severe, consisting of steep-walled canyons and narrow ridge lines. Elevations range from a high of approximately 3,000 feet above mean sea level (MSL) along the ridges of San Dimas Canyon, to a low of approximately 451 feet above MSL in San Antonio Wash. Several major drainages and numerous tributaries exit the San Gabriel Mountains through this SEA.
The wide range of elevation, topography, slope aspect, and geology represent a wide array of physical habitats within this SEA. Consequently, a number of plant communities exist, including grasslands, riparian, shrub lands, woodlands, and forests. Within these major community types, there are many subcommunities which vary according to plant species dominance. Of particular note, this area contains the last remaining relatively well-developed lower montane riparian habitats in the eastern county and dammed drainages have created significant reservoirs or flood control basins in San Antonio and San Dimas. The 6,785 acres proposed for the San Dimas Canyon/San Antonio Wash SEA are within several jurisdictions including: 2,961 in the Angeles National Forest; 1,568 in unincorporated Los Angeles County; 1 ,566 within the City of Claremont; 9 within the City of Glendora; 320 within the City of La Verne; and 361 in the City of San Dimas.
3. EXISTING LAND USE
Land uses in this SEA are predominantly low intensity recreation and open space within public lands. The majority of this SEA is within the Angeles National Forest which is oriented
Biological Resources Assessment PCR Project Team
Page4
San Dimas Canyon/San Antonio Wash November 2000
290
Significant Ecological Area Update Study
toward recreational use. For the most part, unimproved roads, trails, campgrounds, and scattered cabins represent the most intense uses of the forest. Public park uses include the Claremont Hills Wilderness Park in Claremont, the Glendora Wilderness Park in Glendora, and Marshall Canyon County Park. All ofthese parks have limited use facilities. Some of the drainages, in part, have been improved for flood control and groundwater recharge. Despite periodic maintenance of these, natural conditions have persisted. Private land-holdings which comprise a very small portion of the SEA exist in open space.
4. LAND OWNERSHIP
The majority ofthe SEA is owned by the U.S. Government and is managed by the Forest Service, Angeles National Forest. A much smaller area is owned by Los Angeles County and the cities of Claremont and Glendora, each of which manages a wilderness park in the SEA. The County also operates and maintains limited areas for flood control. The remainder ofthe SEA (a relatively small portion) is under private ownership in parcels of varying sizes.
5. VEGETATION
The variety oftopography, soil types, slope aspects and water availability within the San Dimas Canyon/San Antonio Wash SEA creates a range of physical habitats which support numerous plant species. All plant species observed or recorded in previous documentation within the study area are indicated in the Comprehensive Floral & Faunal Compendium of the Los Angeles County SEA Update Study 2000 Background Report. Sensitive plant species occurring or potentially occurring within the proposed SEA are discussed in the Sensitive Biological Resources section of this document. Many of these species, although often different in their growth form, prefer similar habitat characteristics and are often found in recurring assemblages to form plant communities. Ten major plant communities are found within the San Dimas Canyon/San Antonio Wash SEA. Plant communities within the proposed SEA were classified using standard methodology and terminology. Most of the communities discussed in this study correspond directly with those listed in Holland's Preliminary Descriptions of the Terrestrial Natural Communities of California (1986 and 1992 update). Other communities are named based on dominant species within them and/or commonly used terminology. Brief descriptions and general locations of each major plant community present within the SEA are provided below, including bigcone spruce-canyon oak forest, white alder riparian forest, alluvial fan scrub, oak woodland, oak riparian forest, walnut woodland, southern willow scrub, chaparral, coastal sage scrub, and non-native grassland.
Bigcone spruce-canyon oak forest is an open to dense forest dominated by bigcone spruce 50 to 80 feet tall over a dense canopy of canyon live oak. It is found scattered throughout the San
Biological Resources Assessment PCR Project Team
Page 5
San Dimas Canyon/San Antonio Wash November 2000
291

Significant Ecological Area Update Study
Dimas Canyon component of this SEA on canyon sides at elevations generally above 2,500 feet where it occupies rocky substrates. It commonly occurs in fairly small enclaves within chaparral.
Along the lower reaches of San Dimas Canyon, white alder riparian forest is found. This community is dominated by white alder which grow 30 to 40 feet high over a shrub understory. It typically grows along streams in bedrock-constrained, steep-sided canyons, resulting in a fairly narrow riparian corridor.
Alluvial fan scrub is a shrub community characterized by harsh substrates subject to episodic flooding and scouring. It is generally restricted to broad canyon outwashes, or alluvial washes. It is found in this SEA at the San Antonio Canyon mouth, where it forms an open shrub vegetation within areas of bare, scoured ground in between.
Oak woodland is a plant community dominated by species of the genus Quercus. Within this SEA this community includes coast live oak which typically grows to heights of 20 to 40 feet and the somewhat smaller interior live oak and canyon oak, and forms either closed or open tree canopies. Understory vegetation varies from grassland in level areas to shrubs where topography is steeper. It may also intergrade with shrub communities. This community is scattered throughout the SEA and most prevalent on north-facing slopes and in drainage bottoms.
A highly related community found in the San Dimas Canyon/San Antonio Wash SEA is oak riparian forest. This community is also dominated by coast live oak (canyon oaks at higher elevations). The primary difference between oak woodland and oak riparian forest is the greater availability of water in riparian situations which is expressed in a denser tree canopy cover and higher density of trees. There are also a greater number ofhydrophytic (moister favoring) plant species in the understory. Typical riparian trees such as western sycamore and willow occasionally occur as well. Oak riparian forest is best developed within broader, more level gradient drainages of this SEA.
Walnut woodland often intergrades with oak dominated woodlands or develops as a distinct community. This community is dominated by the California walnut which grows I 0 to 30 feet high. More often than not, walnut woodland in this SEA is highly intermixed with oak woodland and chaparral and large monotypic stands are uncommon.
Southern willow scrubs are found along widely scattered reaches of several drainages throughout this SEA. This community is dominated by species of willow which form nearly monotypic stands due to their dense growth with an occasional cottonwood. These stands generally reach I 0 to 20 feet in height with little understory vegetation.
Biological Resources Assessment PCR Project Team
Page6
San Dimas Canyon/San Antonio Wash November 2000
292

Significant Ecological Area Update Study
Chaparral is a shrub community composed of robust species. Within this SEA a number of chaparral subcommunities are found according to their dominant plant species. These include chamise, buck brush, ceanothus, scrub oak, interior live oak and even mosaics of these depending on mixes of species and elevation. These and other shrub species form dense vegetation covers growing five to ten feet in height. The development of chaparral is pronounced over large hillside areas throughout both components of the proposed SEA.
A shrubland community exhibiting less robust structure found in this SEA is coastal sage scrub. This plant community is dominated by California sagebrush, California encelia, white sage, black sage, and California buckwheat. It also forms dense stands which grow three to four feet in height. Within this SEA it is generally found in scattered patches which are highly integrated with mixed chaparral. These are primarily located in the lower elevation hillsides of both SEA components.
Non-native grassland is dominated by non-native annual grasses and forbs. These opportunistically growing species include brome grasses, wild oats and mustards. Characteristic of other parts of Southern California, this community became established as a result oflivestock grazing and agriculture, as native vegetation is removed, sometimes by mechanical means, and replaced by more adventitious species. Non-native grassland is found throughout the proposed SEA.
6. WILDLIFE
Wildlife populations within the proposed San Dimas Canyon/San Antonio Wash SEA are diverse and abundant due to the region's physiographic diversity, its relative isolation, and its location within and adjacent to the Angeles National Forest. Analysis of invertebrates on any given site generally is limited by a lack of specific data; however, the size of the SEA and diversity of habitats present is considered sufficient to encompass healthy populations of a large number of invertebrate species. Fair numbers of amphibians are expected to be present primarily due to the aquatic and semi-aquatic habitats provided within the numerous drainages and several reservoirs. Reptile abundance and diversity are expected to be characteristic for the habitats present, although areas closer to urban development along the southern boundaries of this SEA are likely to be suppressed due to edge effect.
Bird use, diversity, and abundance within the San Dimas Canyon/San Antonio Wash SEA are expected to be high for several reasons. In general, this SEA provides habitat for a wide range of shrub land, woodland, forest, and riparian species that occur at varying elevations. In particular, the riparian habitats found in drainages throughout this SEA provide essential habitat for riparianobligate and riparian-favoring species. In addition, a number of migratory birds no doubt use this
Biological Resources Assessment PCR Project Team
Page 7
San Dimas Canyon/San Antonio Wash November 2000
293
Significant Ecological Area Update Study
area to move across the northern portion of the Los Angeles Basin. These include a wide spectrum of birds including songbird, waterfowl, and raptorial species.
Similarly, the mammalian fauna is expected to be very diverse and abundant. Perhaps, more influential on this taxa than the diversity of habitats is the inclusion ofthis SEA within and adjacent to the vast open space of the Angeles National Forest. Virtually all mammalian species found in the forest (with the exception of bighorn sheep) are expected to be found in this SEA. Frequent observations of black bear and mountain lion in foothill communities attest to the range of species expected.
7. WILDLIFE MOVEMENT
Wildlife movement within the San Dimas Canyon/San Antonio Wash SEA takes on two major forms. First, due to the extreme intervening topography it is logical to expect considerable movement of wildlife up and down the many sizeable drainages which course through this SEA and connect the forest interior with foothill areas. In large part, the larger the watershed of the drainages, the greater the volume of movement. Consequently, this type of movement occurs on a seasonal and more frequent basis, particularly for large mobile mammals whose full range of habitat needs are typically met over broad areas.
The second major type of movement occurs across the flanks of the foothills and lower mountains, in an east-west direction. Particularly for riparian-favoring migratory birds, a corridor linking lower elevational riparian habitats in the San Dimas Canyon/San Antonio Wash SEA is expected to be of high use and importance. In addition to providing essential habitat for resident riparian birds, this SEA contains some of the best developed riparian habitat for birds which are seasonal visitors to cismontane Los Angeles County.
8. SENSITIVE BIOLOGICAL RESOURCES
Sensitive biological resources are habitats or individual species that have been given special recognition by federal, state, or local conservation agencies and organizations as endangered, threatened, rare, or otherwise sensitive; this is principally due to the species' declining or limited population sizes, usually resulting from habitat loss. Watch lists of such resources are maintained by the California Department ofFish and Game (CDFG), the United States Fish and Wildlife Service (USFWS), and special groups such as the California Native Plant Society (CNPS). The following sections indicate the habitats as well as plant and animal species present, or potentially present within the proposed San Dimas Canyon/San Antonio Wash SEA, that have been afforded special recognition.
Biological Resources Assessment PCR Project Team
Page 8
San Dimas Canyon/San Antonio Wash November 2000
294

Significant Ecological Area Update Study
8.1 SENSITIVE PLANT COMMUNITIES/HABITATS
The proposed San Dimas Canyon/San Antonio Wash SEA supports several habitat types considered sensitive by resource agencies, namely the CDFG [California Natural Diversity Database (CNDDB), 2000], because of their scarcity and provision of habitat for a number of state and federally listed endangered, threatened, and rare vascular plants, as well as several sensitive bird and reptile species. These communities include oak riparian woodland, walnut woodland, southern willow scrub, coastal sage scrub and alluvial fan scrub which occur throughout the study area. These communities, or closely related designations, are considered highest-inventory priority communities by the CDFG, indicating that they are experiencing a decline throughout their range. The array and composition ofthese communities has been discussed earlier in this report (see Section 5, Vegetation, above).
8.2 SENSITIVE SPECIES
Sensitive species include those listed, or candidates for listing by the USFWS, CDFG, and CNPS (particularly List IA, IB, and 2 as defined in the Sensitive Species Table). The Sensitive Species Table on page 10 lists those species which have been recorded within the proposed SEA as well as those reasonably expected to occur. The table includes locations of sensitive species observed, recorded in the CNDDB, or reported in previous documentation as observed within or in the immediate vicinity of the proposed SEA. Additional species, such as native oak or sycamore trees may be protected under local ordinances but are not included in this table.
Biological Resources Assessment PCR Project Team
Page9
San Dimas Canyon/San Antonio Wash November 2000
295
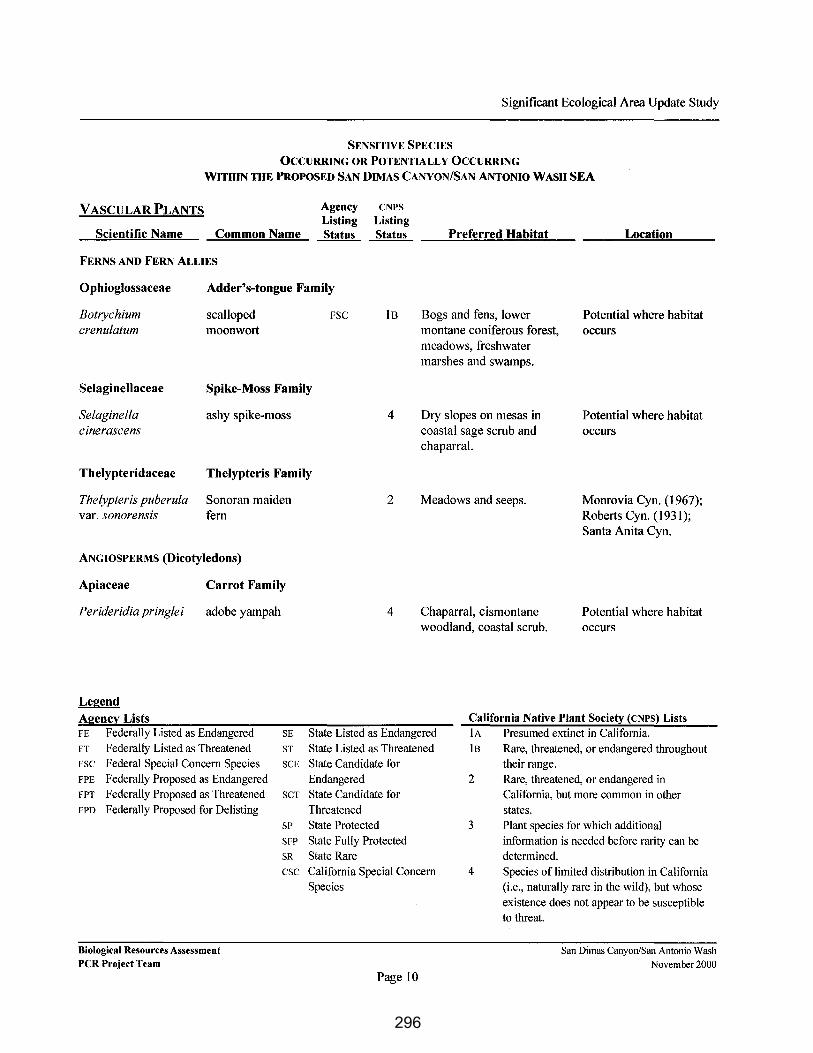
Significant Ecological Area Update Study
SENSITIVE SPECIES 0CCllRRING OR POTENTIALLY OCCURRING
WITHIN THE PROPOSED SAN DIMAS CANYON/SAN ANTONIO WASH SEA
VASCULAR PLANTS
Scientific Name Common Name
FERNS AND FERN ALLIES
Agency Listing Status
CNPS
Listing Status Preferred Habitat Location
Ophioglossaceae
Botrychium crenulatum
Adder's-tongue Family
scalloped moonwort
FSC IB Bogs and fens, lower montane coniferous forest, meadows, freshwater marshes and swamps.
Potential where habitat occurs
Selaginellaceae Spike-Moss Family
Selaginella cinerascens
ashy spike-moss 4 Dry slopes on mesas in coastal sage scrub and chaparral.
Potential where habitat occurs
Thelypteridaceae Thelypteris Family
Thelypteris puberula Sonoran maiden var. sonorensis fern
ANGIOSPERMS (Dicotyledons)
Apiaceae Carrot Family
Perideridia pringlei
Legend
Agency Lists
adobe yampah
FE Federally Listed as Endangered FT Federally Listed as Threatened FSC Federal Special Concern Species FPE Federally Proposed as Endangered FPT Federally Proposed as Threatened FPD Federally Proposed for Delisting
Biological Resources Assessment PCR Project Team
SE ST SCE
SCT
SP SFP SR esc
2 Meadows and seeps. Monrovia Cyn. (1967); Roberts Cyn. (1931 ); Santa Anita Cyn.
4 Chaparral, cismontane woodland, coastal scrub.
Potential where habitat occurs
State Listed as Endangered State Listed as Threatened State Candidate for Endangered State Candidate for Threatened State Protected State Fully Protected State Rare California Special Concern Species
Page 10
California Native Plant Society (CNPS) Lists lA Presumed extinct in California. lB Rare, threatened, or endangered throughout
their range. 2 Rare, threatened, or endangered in
California, but more common in other states.
3 Plant species for which additional information is needed before rarity can be determined.
4 Species of limited distribution in California (i.e., naturally rare in the wild), but whose existence does not appear to be susceptible to threat.
San Dimas Canyon/San Antonio Wash
November 2000
296
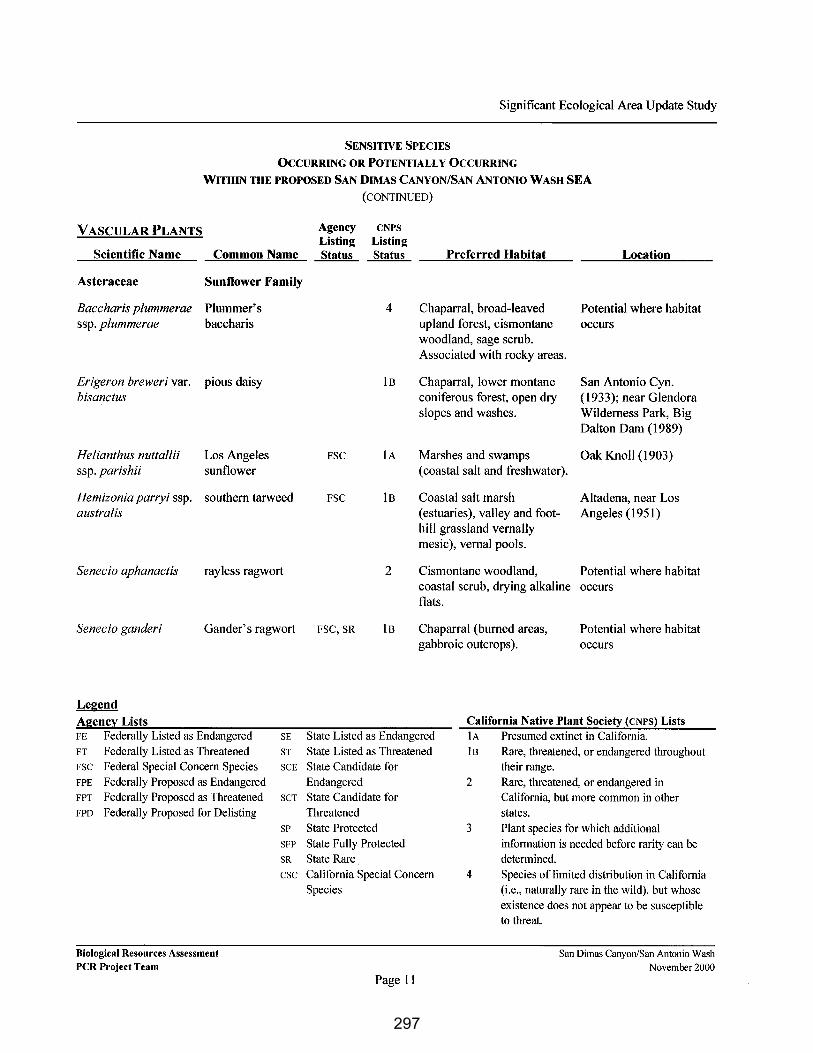
Significant Ecological Area Update Study
SENSITIVE SPECIES
OCCURRING OR POTENTIALLY OCCURRING
WITHIN THE PROPOSED SAN DIMAS CANYON/SAN ANTONIO WASH SEA
(CONTINUED)
VASCULAR PLANTS
Scientific Name Common Name
Asteraceae Sunflower Family
Baccharis plummerae Plummer's ssp. plummerae baccharis
Erigeron breweri var. pious daisy bisanctus
Helianthus nuttallii Los Angeles ssp. parishii sunflower
Hemizonia parryi ssp. southern tarweed australis
Senecio aphanactis rayless ragwort
Senecio ganderi Gander's ragwort
Legend Agency Lists FE Federally Listed as Endangered FT Federally Listed as Threatened FSC Federal Special Concern Species FPE Federally Proposed as Endangered FPT Federally Proposed as Threatened FPD Federally Proposed for Delisting
Biological Resources Assessment PCR Project Team
SE
ST
SCE
SCT
SP
SFP
SR
esc
Agency Listing Status
FSC
FSC
FSC,SR
CNPS
Listing Status
4
IB
lA
lB
2
18
Preferred Habitat Location
Chaparral, broad-leaved Potential where habitat upland forest, cismontane occurs woodland, sage scrub. Associated with rocky areas.
Chaparral, lower montane San Antonio Cyn. coniferous forest, open dry ( 1933); near Glendora slopes and washes. Wilderness Park, Big
Dalton Dam (1989)
Marshes and swamps Oak Knoll (1903) (coastal salt and freshwater).
Coastal salt marsh Altadena, near Los (estuaries), valley and foot- Angeles (1951) hill grassland vernally mesic), vernal pools.
Cismontane woodland, Potential where habitat coastal scrub, drying alkaline occurs flats.
Chaparral (burned areas, Potential where habitat gabbroic outcrops). occurs
California Native Plant Society (CNPS) Lists State Listed as Endangered lA Presumed extinct in California. State Listed as Threatened State Candidate for Endangered State Candidate for Threatened State Protected State Fully Protected State Rare California Special Concern Species
Page 11
IB Rare, threatened, or endangered throughout their range.
2 Rare, threatened, or endangered in California, but more common in other states.
3 Plant species for which additional information is needed before rarity can be determined.
4 Species of limited distribution in California (i.e., naturally rare in the wild), but whose existence does not appear to be susceptible to threat.
San Dimas Canyon/San Antonio Wash November 2000
297

Significant Ecological Area Update Study
SENSITIVE SPECIES
OCCURRING OR POTENTIALLY OCCURRING
WITHIN THE PROPOSED SAN DIMAS CANYON/SAN ANTONIO WASH SEA
VASCULAR PLANTS
Scientific Name Common Name
Berberidaeeae Barberry Family
Berberis nevinii Nevin's barberry
Brassicaceae Mustard Family
Caulanthus simulans Payson's jewelflower
Caulanthus slender-pod stenocarpus jewelflower
Lepidium virginicum Robinson's pepper var. robinsonii grass
Rorippa gambelli Gambel's water
Legend
Agency Lists
cress
FE Federally Listed as Endangered FT Federally Listed as Threatened FSC Federal Special Concern Species FPE Federally Proposed as Endangered FPT Federally Proposed as Threatened FPD Federally Proposed for Delisting
Biological Resources Assessment PCR Project Team
SE
ST SCE
SCT
SP
SFP SR
esc
(CONTINUED)
Agency CNPS
Listing Listing Status Status Preferred Habitat Location
FE,SE IB Sage scrub, chaparral, In vicinity of San cismontane woodland, Antonio wash (198X) riparian scrub; sandy or gravelly substrate.
FSC 4 Burned areas, streambeds, Potential where habitat rocky, steep slopes and other occurs disturbed sites, below 6,500 ft.
FSC, SR Generally found after burns Potential where habitat on dry, open slopes in occurs chaparral between 1,000 and 3,000 ft.
IB Chaparral, coastal scrub. Between Santa Anita Cyn. and Sierra Madre (1928); Tanbark Flats (1936)
FE,ST IB Freshwater/brackish marsh. Potential where habitat occurs
California Native Plant Society (CNPS) Lists State Listed as Endangered lA Presumed extinct in California. State Listed as Threatened State Candidate for Endangered State Candidate for Threatened State Protected State Fully Protected State Rare California Special Concern Species
Page 12
I B Rare, threatened, or endangered throughout their range.
2 Rare, threatened, or endangered in California, but more common in other states.
3 Plant species for which additional information is needed before rarity can be determined.
4 Species of limited distribution in California (i.e., naturally rare in the wild), but whose existence does not appear to be susceptible to threat.
San Dimas Canyon/San Antonio Wash November 2000
298

Significant Ecological Area Update Study
SENSITIVE SPECIES
OCCURRING OR POTENTIALLY OCCURRING
WITHIN THE PROPOSED SAN DIMAS CANYON/SAN ANTONIO WASH SEA
(CONTINUED)
VASCULAR PLANTS
Scientific Name Common Name
Crassulaceae Stonecrop Family
Dudleya cymosa ssp. crebrifolia
San Gabriel River dudleya
Dudleya densiflora San Gabriel Mountains dudleya
Dudleya multicaulis many-stemmed dudleya
Ericaceae Heath Family
Arctostaphylos peninsula peninsularis ssp. manzanita peninsular is
Legend Agency Lists FE Federally Listed as Endangered
FT Federally Listed as Threatened FSC Federal Special Concern Species
FPE Federally Proposed as Endangered FPT Federally Proposed as Threatened
FPD Federally Proposed for Delisting
Biological Resources Assessment PCR Project Team
SE
ST
SCE
SCT
SP
SFP
SR
esc
Agency Listing Status
FSC
FSC
FSC
CNPS
Listing Status
lB
IB
lB
2
Preferred Habitat
Chaparral.
Cliffs, cyn. walls in association with chaparral, coastal sage scrub. Succulent perennial.
Sage scrub, valley and foothill grassland; heavy clay soils or rock outcrops; below 2,000 ft.
Chaparral between 650 and 3,000 ft.
Location
Fish Cyn., from Gaging Station upstream to Large Falls (1986)
Mouth ofFish Cyn. at the San Gabriel River (1986); Fish Cyn., about I mi. upstream to I mi. downstream of Large Falls (1989); Roberts Cyn. (1989); San Gabriel Cyn. (1989); near San Gabriel Dam (1985)
Many CNDDB records throughout area
Potential where habitat occurs
California Native Plant Society (CNPS) Lists State Listed as Endangered lA Presumed extinct in California.
State Listed as Threatened State Candidate for Endangered State Candidate for Threatened
State Protected State Fully Protected State Rare California Special Concern Species
Page 13
lB Rare, threatened, or endangered throughout their range.
2 Rare, threatened, or endangered in California, but more common in other
states. 3 Plant species for which additional
information is needed before rarity can be determined.
4 Species of limited distribution in California (i.e., naturally rare in the wild), but whose
existence does not appear to be susceptible to threat.
San Dimas Canyon/San Antonio Wash
November 2000
299
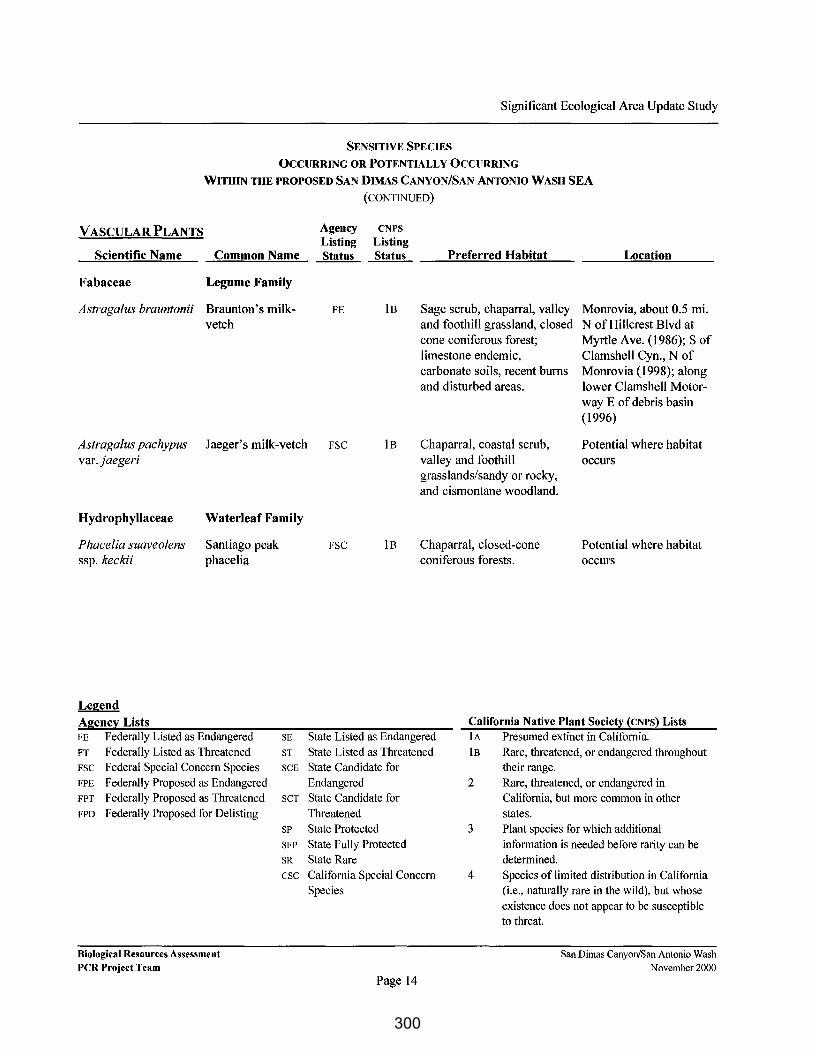
Significant Ecological Area Update Study
SENSITIVE SPECIES
OCCURRING OR POTENTIALLY OCCURRING
WITHIN THE PROPOSED SAN DIMAS CANYON/SAN ANTONIO WASH SEA
(CONTINUED)
VASCULAR PLANTS
Scientific Name Common Name
Fabaceae Legume Family
Astragalus brauntonii Braunton's milkvetch
Astragalus pachypus Jaeger's milk-vetch var.jaegeri
Hydrophyllaceae
Phacelia suaveolens ssp. keckii
Waterleaf Family
Santiago peak phacelia
Legend Agency Lists FE Federally Listed as Endangered FT Federally Listed as Threatened FSC Federal Special Concern Species FPE Federally Proposed as Endangered FPT Federally Proposed as Threatened FPD Federally Proposed for Delisting
Biological Resources Assessment PCR Project Team
SE
ST
SCE
SCT
SP
SFP
SR
esc
Agency Listing Status
FE
FSC
FSC
CNPS
Listing Status
lB
lB
lB
Preferred Habitat
Sage scrub, chaparral, valley and foothill grassland, closed cone coniferous forest; limestone endemic, carbonate soils, recent burns and disturbed areas.
Chaparral, coastal scrub, valley and foothill grasslands/sandy or rocky, and cismontane woodland.
Chaparral, closed-cone coniferous forests.
Location
Monrovia, about 0.5 mi. N of Hillcrest Blvd at Myrtle Ave. (1986); S of Clamshell Cyn., N of Monrovia (1998); along lower Clamshell Motorway E of debris basin (1996)
Potential where habitat occurs
Potential where habitat occurs
California Native Plant Society (CNPS) Lists State Listed as Endangered lA Presumed extinct in California. State Listed as Threatened State Candidate for Endangered State Candidate for Threatened State Protected State Fully Protected State Rare California Special Concern Species
Page 14
lB Rare, threatened, or endangered throughout their range.
2 Rare, threatened, or endangered in California, but more common in other states.
3 Plant species for which additional information is needed before rarity can be determined.
4 Species of limited distribution in California (i.e., naturally rare in the wild), but whose existence does not appear to be susceptible to threat.
San Dimas Canyon/San Antonio Wash
November 2000
300
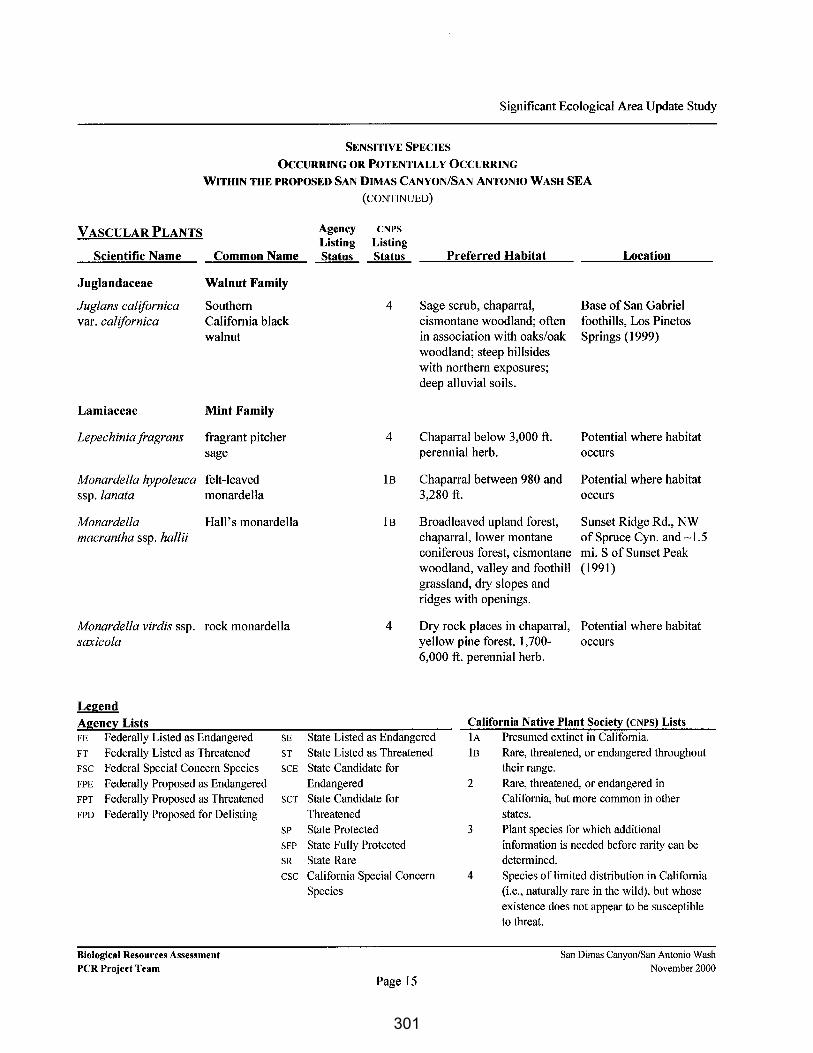
Significant Ecological Area Update Study
SENSITIVE SPECIES
OCCURRING OR POTENTIALLY OCCURRING
WITHIN THE PROPOSED SAN DIMAS CANYON/SAN ANTONIO WASH SEA
(CONTINUED)
VASCULAR PLANTS
Scientific Name Common Name
Juglandaceae
Juglans californica var. californica
Walnut Family
Southern California black walnut
Lamiaceae Mint Family
Lepechinia~ragrans fragrant pitcher sage
Monardel!a hypoleuca felt-leaved ssp.lanata monardella
Monardel!a Hall's monardella macrantha ssp. hallii
Monardella virdis ssp. rock monardella saxicola
Legend
Agency Lists FE Federally Listed as Endangered FT Federally Listed as Threatened FSC Federal Special Concern Species FPE Federally Proposed as Endangered FPT Federally Proposed as Threatened FPD Federally Proposed for Delisting
Biological Resources Assessment PCR Project Team
SE
ST SCE
SCT
SP
SFP
SR
esc
Agency Listing Status
CNPS
Listing Status
4
4
1B
1B
4
Preferred Habitat
Sage scrub, chaparral, cismontane woodland; often in association with oaks/oak woodland; steep hillsides with northern exposures; deep alluvial soils.
Chaparral below 3,000 ft. perennial herb.
Chaparral between 980 and 3,280 ft.
Broadleaved upland forest, chaparral, lower montane coniferous forest, cismontane woodland, valley and foothill grassland, dry slopes and ridges with openings.
Location
Base of San Gabriel foothills, Los Pinetos Springs (1999)
Potential where habitat occurs
Potential where habitat occurs
Sunset Ridge Rd., NW of Spruce Cyn. and~ 1.5 mi. S of Sunset Peak (1991)
Dry rock places in chaparral, Potential where habitat yellow pine forest, 1,700- occurs 6,000 ft. perennial herb.
California Native Plant Society (CNPS) Lists State Listed as Endangered lA Presumed extinct in California. State Listed as Threatened State Candidate for Endangered State Candidate for Threatened State Protected State Fully Protected State Rare California Special Concern Species
Page 15
lB Rare, threatened, or endangered throughout their range.
2 Rare, threatened, or endangered in California, but more common in other states.
3 Plant species for which additional information is needed before rarity can be determined.
4 Species of limited distribution in California (i.e., naturally rare in the wild), but whose existence does not appear to be susceptible to threat.
San Dimas Canyon/San Antonio Wash November 2000
301

Significant Ecological Area Update Study
SENSITIVE SPECIES
OCCURRING OR POTENTIALLY OCCURRING
WITHIN THE PROPOSED SAN DIMAS CANYON/SAN ANTONIO WASH SEA
(CONTINUED)
VASCULAR PLANTS Agency CNPS
Listing Listing Scientific Name Common Name Status Status Preferred Habitat Location
Scutellaria bolanderi southern skullcap IB Chaparral, cismontane Potential where habitat ssp. austromontana woodland, lower montane occurs
coniferous forest; elevation approximately 300 ft.
Malvaceae Mallow Family
Malacothamnus Davidson's bush FSC 1B Sage scrub, chaparral, Potential where habitat davidsonii mallow riparian woodland. occurs
Sidalcea neomexicana salt spring 2 Alkali playas, brackish Claremont ( 1909) checkerbloom marshes, chaparral, coastal
scrub, lower montane coniferous forest, desert scrub.
Orobanchaceae Broomrape Family
Orobanche valida ssp. valida
Legend
Agency Lists
rock creek broomrape
FE Federally Listed as Endangered
FT Federally Listed as Threatened FSC Federal Special Concern Species
FPE Federally Proposed as Endangered FPT Federally Proposed as Threatened
FPD Federally Proposed for Delisting
Biological Resources Assessment PCR Project Team
SE
ST SCE
SCT
SP
SFP
SR
esc
FSC lB Chaparral, pinyon juniper W ridge of Lookout woodland, on slopes of loose Mtn., NE of Mt. Baldy decomposed granite, station ( 1979) parasitic on various chaparral shrubs.
California Native Plant Society (CNPS) Lists State Listed as Endangered lA Presumed extinct in California.
State Listed as Threatened State Candidate for Endangered State Candidate for Threatened State Protected
&tate Fully Protected State Rare California Special Concern Species
Page 16
IB Rare, threatened, or endangered throughout their range.
2 Rare, threatened, or endangered in California, but more common in other
states. 3 Plant species for which additional
information is needed before rarity can be determined.
4 Species of limited distribution in California (i.e., naturally rare in the wild), but whose
existence does not appear to be susceptible to threat.
San Dimas Canyon/San Antonio Wash November 2000
302

Significant Ecological Area Update Study
SENSITIVE SPECIES
OCCURRING OR POTENTIALLY OCCURRING
WITHIN THE PROPOSED SAN DIMAS CANYON/SAN ANTONIO WASH SEA
(CONTINUED)
VASCULAR PLANTS Agency CNPS Listing Listing
Scientific Name Common Name Status Status Preferred Habitat Location
Polemoniaceae Phlox Family
Linanthus concinnus San Gabriel FSC IB Lower and upper montane Icehouse Cyn., San linanthus coniferous forest, dry rock Antonio Hills (1917);
slopes often in Jeffrey Mt. Markham ( 1921 ); pine/cyn. oak forest. Mt. Lowe summit
(191X)
Polygonaceae Buckwheat Family
Chorizanthe parryi Parry's spineflower var.parryi
Dodecahema slender-horned leptoceras spineflower
Primulaceae Primrose Family
Adrosace elongata ssp. acuta
Legend
Agency Lists
California androsace
FE Federally Listed as Endangered FT Federally Listed as Threatened FSC Federal Special Concern Species FPE Federally Proposed as Endangered FPT Federally Proposed as Threatened FPD Federally Proposed for De listing
Biological Resources Assessment PCR Project Team
SE
ST SCE
SCT
SP
SFP
SR
esc
FSC 3 Openings/clearings in coastal Thompson Creek Dam or desert sage scrub, chaparral (1932); Mt. Lowe or interface; dry slopes or flat (1902); Arroyo Seco ground; sandy soils. (1920)
FE,SE IB Alluvial sage scrub Rubio Wash, Altadena vegetation on sandy flood- (1920); Santa Anita deposited rivers and washes. Wash, S base of San
Gabriel Mts. (1920); W fork San Gabriel River (1921)
4 Chaparral, cismontane Potential where habitat woodland, coastal scrub. occurs
California Native Plant Society (CNPS) Lists State Listed as Endangered lA Presumed extinct in California. State Listed as Threatened State Candidate for Endangered State Candidate for Threatened State Protected State Fully Protected State Rare California Special Concern Species
Page 17
IB Rare, threatened, or endangered throughout their range.
2 Rare, threatened, or endangered in California, but more common in other states.
3 Plant species for which additional information is needed before rarity can be determined.
4 Species of limited distribution in California (i.e., naturally rare in the wild), but whose existence does not appear to be susceptible to threat.
San Dimas Canyon/San Antonio Wash November 2000
303
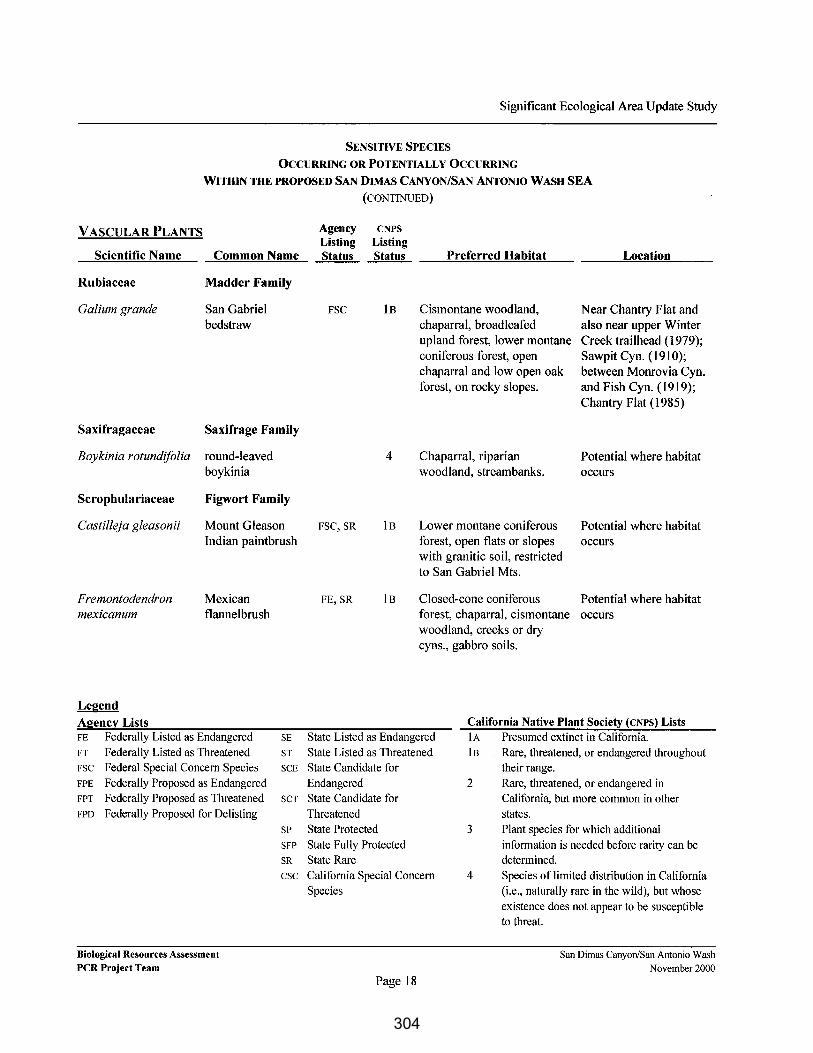
Significant Ecological Area Update Study
SENSITIVE SPECIES
OCCURRING OR POTENTIALLY OCCURRING
WITHIN THE PROPOSED SAN DIMAS CANYON/SAN ANTONIO WASH SEA
(CONTINUED)
VASCULAR PLANTS
Scientific Name Common Name
Rubiaceae Madder Family
Galium grande San Gabriel bedstraw
Saxifragaceae Saxifrage Family
Boykinia rotundifolia round-leaved boykinia
Scrophulariaceae Figwort Family
Castilleja gleasonii Mount Gleason Indian paintbrush
Fremontodendron mexicanum
Legend Agency Lists
Mexican flannel brush
FE Federally Listed as Endangered FT Federally Listed as Threatened FSC Federal Special Concern Species FPE Federally Proposed as Endangered FPT Federally Proposed as Threatened FPD Federally Proposed for De listing
Biological Resources Assessment PCR Project Team
SE
ST
SCE
SCT
SP
SFP
SR
esc
Agency Listing Status
FSC
FSC, SR
FE, SR
CNPS
Listing Status
1B
4
IB
IB
Preferred Habitat
Cismontane woodland, chaparral, broadleafed upland forest, lower montane coniferous forest, open chaparral and low open oak forest, on rocky slopes.
Chaparral, riparian woodland, streambanks.
Location
Near Chantry Flat and also near upper Winter Creek trailhead (1979); Sawpit Cyn. (1910); between Monrovia Cyn. and Fish Cyn. (1919); Chantry Flat (1985)
Potential where habitat occurs
Lower montane coniferous Potential where habitat forest, open flats or slopes occurs with granitic soil, restricted to San Gabriel Mts.
Closed-cone coniferous Potential where habitat forest, chaparral, cismontane occurs woodland, creeks or dry cyns., gabbro soils.
California Native Plant Society (CNPS) Lists State Listed as Endangered I A Presumed extinct in California. State Listed as Threatened State Candidate for Endangered State Candidate for Threatened State Protected State Fully Protected State Rare California Special Concern Species
Page 18
lB Rare, threatened, or endangered throughout their range.
2 Rare, threatened, or endangered in California, but more common in other states.
3 Plant species for which additional information is needed before rarity can be determined.
4 Species of limited distribution in California (i.e., naturally rare in the wild), but whose existence does not appear to be susceptible to threat.
San Dimas Canyon/San Antonio Wash November 2000
304
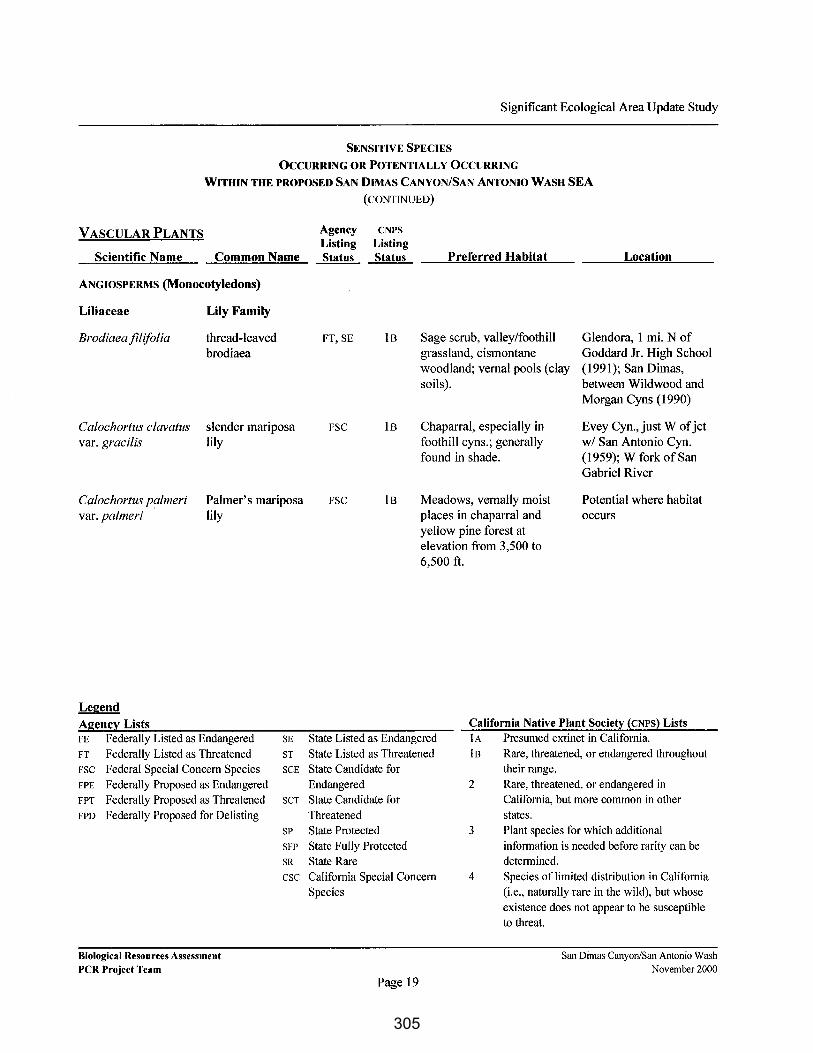
Significant Ecological Area Update Study
SENSITIVE SPECIES
OCCURRING OR POTENTIALLY OCCURRING
WITHIN THE PROPOSED SAN DIMAS CANYON/SAN ANTONIO WASH SEA
(CONTINUED)
VASCULAR PLANTS
Scientific Name Common Name
ANGIOSPERMS (Monocotyledons)
Liliaceae
Brodiaea filifolia
Lily Family
thread-leaved brodiaea
Calochortus clavatus var. gracilis
slender mariposa lily
Calochortus palmeri var. palmeri
Palmer's mariposa lily
Legend
Agency Lists FE Federally Listed as Endangered FT Federally Listed as Threatened FSC Federal Special Concern Species FPE Federally Proposed as Endangered FPT Federally Proposed as Threatened FPD Federally Proposed for Delisting
Biological Resources Assessment PCR Project Team
SE
ST SCE
SCT
SP
SFP
SR
esc
Agency Listing Status
FT,SE
FSC
FSC
CNPS
Listing Status
1B
1B
1B
Preferred Habitat
Sage scrub, valley/foothill grassland, cismontane woodland; vernal pools (clay soils).
Chaparral, especially in foothill cyns.; generally found in shade.
Meadows, vernally moist places in chaparral and yellow pine forest at elevation from 3,500 to 6,500 ft.
Location
Glendora, 1 mi. N of Goddard Jr. High School ( 1991 ); San Dimas, between Wildwood and Morgan Cyns (1990)
Evey Cyn., just W of jet w! San Antonio Cyn. (1959); W fork of San Gabriel River
Potential where habitat occurs
California Native Plant Society (CNPS) Lists State Listed as Endangered lA Presumed extinct in California. State Listed as Threatened State Candidate for Endangered State Candidate for Threatened State Protected State Fully Protected State Rare California Special Concern Species
Page 19
lB Rare, threatened, or endangered throughout their range.
2 Rare, threatened, or endangered in California, but more common in other states.
3 Plant species for which additional information is needed before rarity can be determined.
4 Species of limited distribution in California (i.e., naturally rare in the wild), but whose existence does not appear to be susceptible to threat.
San Dimas Canyon/San Antonio Wash November 2000
305
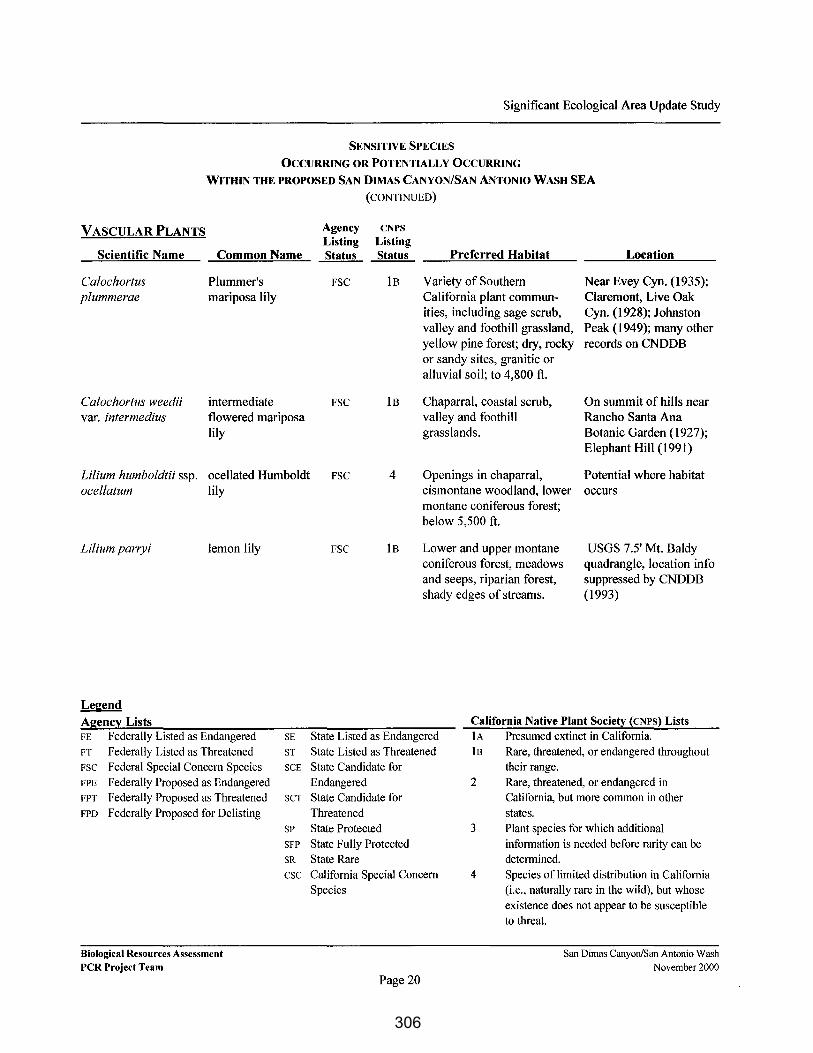
Significant Ecological Area Update Study
SENSITIVE SPECIES
OCCURRING OR POTENTIALLY OCCURRING
WITIIIN THE PROPOSED SAN DIMAS CANYON/SAN ANTONIO WASH SEA
(CONTINUED)
VASCULAR PLANTS
Scientific Name Common Name
Calochortus Plummer's plummerae mariposa lily
Calochortus weedii intermediate var. intermedius flowered mariposa
lily
Lilium humboldtii ssp. ocellated Humboldt ocellatum
Lilium parryi
Legend Agency Lists
lily
lemon lily
FE Federally Listed as Endangered FT Federally Listed as Threatened FSC Federal Special Concern Species FPE Federally Proposed as Endangered FPT Federally Proposed as Threatened FPD Federally Proposed for De listing
Biological Resources Assessment PCR Project Team
SE
ST SCE
SCT
SP
SFP
SR
esc
Agency Listing Status
FSC
FSC
FSC
FSC
CNPS Listing Status
IB
IB
4
IB
Preferred Habitat Location
Variety of Southern Near Evey Cyn. (1935); California plant commun- Claremont, Live Oak ities, including sage scrub, Cyn. (1928); Johnston valley and foothill grassland, Peak ( 1949); many other yellow pine forest; dry, rocky records on CNDDB or sandy sites, granitic or alluvial soil; to 4,800 ft.
Chaparral, coastal scrub, On summit of hills near valley and foothill Rancho Santa Ana grasslands. Botanic Garden (1927);
Elephant Hill (1991)
Openings in chaparral, Potential where habitat cismontane woodland, lower occurs montane coniferous forest; below 5,500 ft.
Lower and upper montane USGS 7.5' Mt. Baldy coniferous forest, meadows quadrangle, location info and seeps, riparian forest, suppressed by CNDDB shady edges of streams. (1993)
California Native Plant Society (CNPS) Lists State Listed as Endangered lA Presumed extinct in California. State Listed as Threatened State Candidate for Endangered State Candidate for Threatened State Protected State Fully Protected State Rare California Special Concern Species
Page 20
lB Rare, threatened, or endangered throughout their range.
2 Rare, threatened, or endangered in California, but more common in other states.
3 Plant species for which additional information is needed before rarity can be determined.
4 Species of limited distribution in California (i.e., naturally rare in the wild), but whose
existence does not appear to be susceptible to threat.
San Dimas Canyon/San Antonio Wash
November 2000
306

Significant Ecological Area Update Study
SENSITIVE SPECIES
OCCURRING OR POTENTIALLY OCCURRING
WITHIN THE PROPOSED SAN DIMAS CANYON/SAN ANTONIO WASH SEA
(CONTINUED)
VASCULAR PLANTS
Scientific Name Common Name
Poaceae Grass Family
Calamagrostis densa dense reedgrass
Muhlenbergia californica
California muhly
Legend Agency Lists FE Federally Listed as Endangered FT Federally Listed as Threatened FSC Federal Special Concern Species FPE Federally Proposed as Endangered FPT Federally Proposed as Threatened FPD Federally Proposed for De listing
Biological Resources Assessment PCR Project Team
SE
ST
SCE
SCT
SP
SFP
SR
esc
Agency Listing Status
FSC
CNPS
Listing Status
IB
IB
Preferred Habitat Location
On dry hills in chaparral Potential where habitat and coniferous forests on occurs gabbroic soils and disturbed sites between I ,300 and 4,000 ft.
Coastal sage, chaparral, lower montane coniferous forest, meadows near streams or seeps.
Red Hill, E of Upland (1916); Mt. Lowe (1899)
California Native Plant Society (CNPS) Lists State Listed as Endangered lA Presumed extinct in California. State Listed as Threatened State Candidate for Endangered State Candidate for Threatened State Protected State Fully Protected State Rare California Special Concern Species
Page 21
lB Rare, threatened, or endangered throughout their range.
2 Rare, threatened, or endangered in California, but more common in other states.
3 Plant species for which additional information is needed before rarity can be determined.
4 Species of limited distribution in California (i.e., naturally rare in the wild), but whose existence does not appear to be susceptible to threat.
San Dimas Canyon/San Antonio Wash November 2000
307
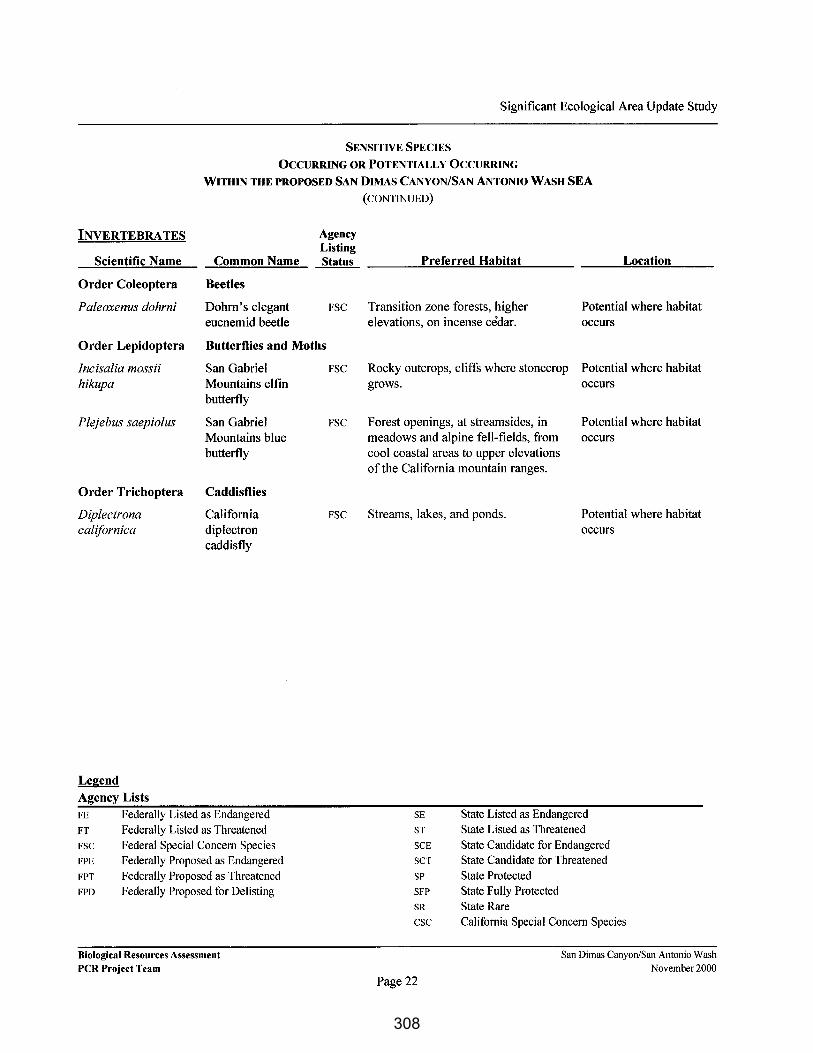
Significant Ecological Area Update Study
SENSITIVE SPECIES
OCCURRING OR POTENTIALLY OCCURRING
WITHIN THE PROPOSED SAN DIMAS CANYON/SAN ANTONIO WASH SEA
(CONTINUED)
INVERTEBRATES Agency Listing
Scientific Name Common Name Status
Order Coleoptera Beetles
Paleoxenus dohrni Dohrn's elegant FSC
eucnemid beetle
Order Lepidoptera Butterflies and Moths
Incisalia mossii hikupa
Plejebus saepiolus
Order Trichoptera
Diplectrona californica
Legend Agency Lists
San Gabriel Mountains elfin butterfly
San Gabriel Mountains blue butterfly
Caddisflies
California diplectron caddisfly
FE
FT
FSC
FPE
FPT
FPD
Federally Listed as Endangered Federally Listed as Threatened Federal Special Concern Species Federally Proposed as Endangered Federally Proposed as Threatened Federally Proposed for Delisting
Biological Resources Assessment PCR Project Team
FSC
FSC
FSC
Preferred Habitat Location
Transition zone forests, higher Potential where habitat elevations, on incense cedar. occurs
Rocky outcrops, cliffs where stonecrop Potential where habitat grows. occurs
Forest openings, at streamsides, in Potential where habitat meadows and alpine fell-fields, from occurs cool coastal areas to upper elevations of the California mountain ranges.
Streams, lakes, and ponds. Potential where habitat
SE
ST
SCE
SCT
SP SFP
SR
esc
Page 22
occurs
State Listed as Endangered State Listed as Threatened State Candidate for Endangered State Candidate for Threatened State Protected State Fully Protected State Rare California Special Concern Species
San Dimas Canyon/San Antonio Wash November 2000
308

Significant Ecological Area Update Study
SENSITIVE SPECIES OCCURRING OR POTENTIALLY OCCURRING
WITHIN THE PROPOSED SAN DIMAS CANYON/SAN ANTONIO WASH SEA (CONTINUED)
VERTEBRATES
Scientific Name
FISH
Cyprinidae
Gila orcutti
Rhinichthys oscultus ssp.3
Catostomidae
Catostomus santaanae
AMPHIBIANS
Salamandridae
Taricha torosa torosa
Legend Agency Lists
Common Name
Minnow Family
arroyo chub
Santa Ana speckled dace
Sucker Family
Santa Ana sucker
Newt Family
coast range newt
FE
FT
FSC
FPE
FPT
FPD
Federally Listed as Endangered Federally Listed as Threatened Federal Special Concern Species Federally Proposed as Endangered Federally Proposed as Threatened Federally Proposed for Delisting
Biological Resources Assessment PCR Project Team
Agency Listing Status
esc
FSC,
esc
FPT
esc
Preferred Habitat Location
Slow water sections of streams with E fork of San Gabriel mud or sand substrates. River and Cattle Cyn.
Creek (1999); N & W forks San Gabriel River, also Big Mermaids Cyn. Creek and Bear Creek (1999)
Requires permanent flowing streams Potential where habitat with summer water temperatures of 17 occurs to 20°C, shallow cobble and gravel.
Sand, rubble, boulder bottoms; cool, East fork of San Gabriel clear water; feed on algae. River and Cattle Cyn.
Moist woodlands.
SE
ST
SCE
SCT
SP
SFP
SR esc
Page 23
Creek (1999); N & W forks San Gabriel River, also Big Mermaids Cyn. Creek and Bear Creek (1999); Fish Cyn (1986)
Potential where habitat occurs
State Listed as Endangered State Listed as Threatened State Candidate for Endangered State Candidate for Threatened State Protected State Fully Protected State Rare California Special Concern Species
San Dimas Canyon/San Antonio Wash November 2000
309

Significant Ecological Area Update Study
SENSITIVE SPECIES
OCCURRING OR POTENTIALLY OCCURRING
WITHIN THE PROPOSED SAN DIMAS CANYON/SAN ANTONIO WASH SEA
(CONTINUED)
VERTEBRATES Agency Listing
Scientific Name Common Name Status Preferred Habitat Location
Plethodontidae Lungless Salamander Family
Ensatina eschscholtzii yellow-blotched croceator salamander
esc Coniferous habitats, montane hardwood habitats, and mixed chaparral.
Potential where habitat occurs
Pelobatidae Spadefoot Toad Family
Scaphiopus hammondii
Bufonidae
Bufo microscaphus californicus
Ranidae
western spadefoot
True Toads
arroyo southwestern toad
True Frog Family
Rana aurora draytonii California redlegged frog
Rana boylii foothill yellowlegged frog
Rana muscosa mountain yellowlegged frog
Legend Agency Lists FE
FT
FSC
FPE
FPT
FPD
Federally Listed as Endangered Federally Listed as Threatened Federal Special Concern Species Federally Proposed as Endangered Federally Proposed as Threatened Federally Proposed for Delisting
Biological Resources Assessment PCR Project Team
FSC,
esc, sP
FE,CSC,
SP
FT,CSC,
SP
Prefers relatively open areas in lowland Potential where habitat grasslands, chaparral, and pine-oak occurs woodlands, areas of sandy or gravelly soil in alluvial fans, washes, and floodplains.
Washes/streams, sandy banks, grown to willows, cottonwoods or sycamores; riparian habitats of semi-arid areas, small cobbly streambeds.
Humid forests, woodlands, grasslands and streamsides, especially where cattails and other plants provide good cover.
Potential where habitat occurs
Potential where habitat occurs
FSC, Stream, river of woodland, chaparral Potential where habitat esc, SP and forest. occurs
FPE, Sunny riverbanks, meadows, streams, Potential where habitat esc, SP isolated pools, lake borders. occurs
SE
ST
SCE
SCT
SP
SFP
SR
esc
Page 24
State Listed as Endangered State Listed as Threatened State Candidate for Endangered State Candidate for Threatened State Protected State Fully Protected State Rare California Special Concern Species
San Dimas Canyon/San Antonio Wash November 2000
310
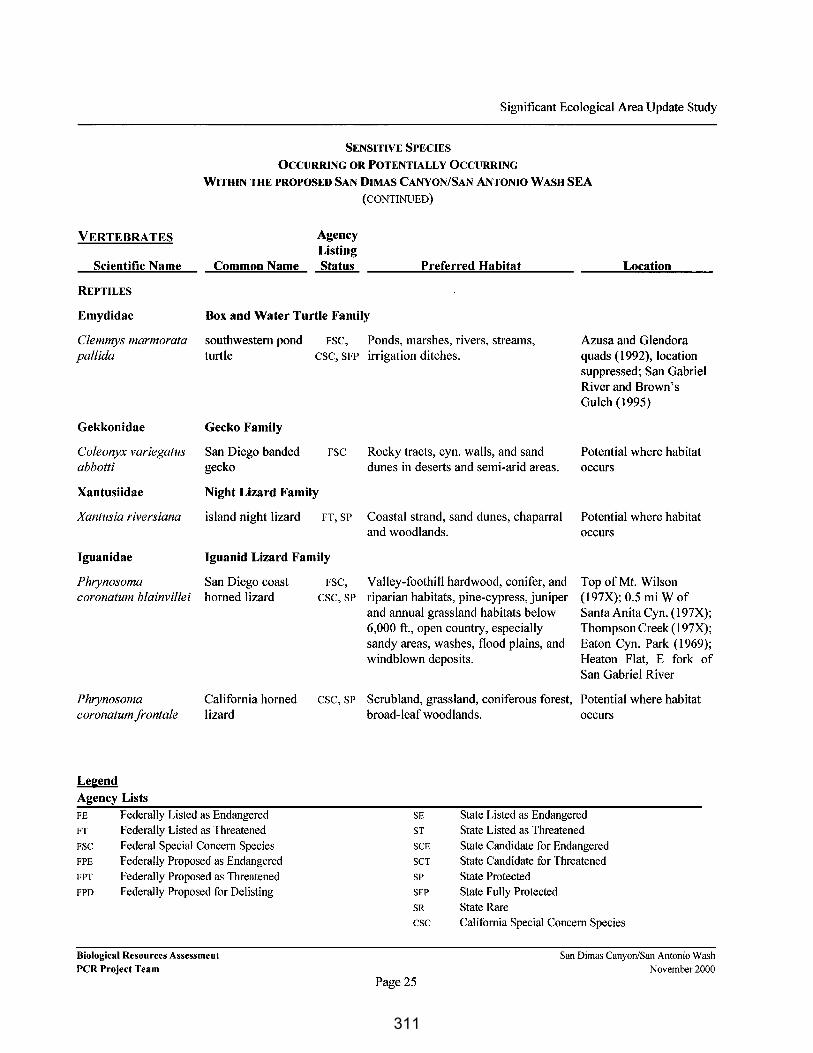
Significant Ecological Area Update Study
SENSITIVE SPECIES
OCCURRING OR POTENTIALLY 0CCllRRING
WITHIN THE PROPOSED SAN DIMAS CANYON/SAN ANTONIO WASH SEA
(CONTINUED)
VERTEBRATES Agency Listing
Scientific Name Common Name Status Preferred Habitat Location
REPTILES
Emydidae Box and Water Turtle Family
Clemmys marmorata pal/ida
Gekkonidae
Coleonyx variegatus abbotti
southwestern pond turtle
Gecko Family
San Diego banded gecko
FSC, Ponds, marshes, rivers, streams, esc, SFP irrigation ditches.
FSC Rocky tracts, cyn. walls, and sand dunes in deserts and semi-arid areas.
Azusa and Glendora quads (1992), location suppressed; San Gabriel River and Brown's Gulch (1995)
Potential where habitat occurs
Xantusiidae Night Lizard Family
Xantusia riversiana island night lizard FT, SP Coastal strand, sand dunes, chaparral Potential where habitat and woodlands. occurs
Iguanidae Iguanid Lizard Family
Phrynosoma San Diego coast coronatum blainvillei horned lizard
Phrynosoma coronatum frontale
California horned lizard
Legend Agency Lists FE
FT
FSC
FPE
FPT
FPD
Federally Listed as Endangered Federally Listed as Threatened Federal Special Concern Species Federally Proposed as Endangered Federally Proposed as Threatened Federally Proposed for Delisting
Biological Resources Assessment PCR Project Team
FSC, Valley-foothill hardwood, conifer, and Top ofMt. Wilson (197X); 0.5 mi W of Santa Anita Cyn. (197X); Thompson Creek (197X); Eaton Cyn. Park (1969); Heaton Flat, E fork of San Gabriel River
CSC, SP riparian habitats, pine-cypress, juniper and annual grassland habitats below 6,000 ft., open country, especially sandy areas, washes, flood plains, and windblown deposits.
esc, SP Scrubland, grassland, coniferous forest, Potential where habitat broad-leafwoodlands. occurs
SE
ST
SCE
SCT
SP
SFP
SR esc
Page 25
State Listed as Endangered State Listed as Threatened State Candidate for Endangered State Candidate for Threatened State Protected State Fully Protected State Rare California Special Concern Species
San Dimas Canyon/San Antonio Wash
November 2000
311

Significant Ecological Area Update Study
SENSITIVE SPECIES
OCCURRING OR POTENTIALLY OCCURRING
WITHIN THE PROPOSED SAN DIMAS CANYON/SAN ANTONIO WASH SEA
(CONTINUED)
VERTEBRATES Agency Listing
Scientific Name Common Name Status
Teiidae Whiptail Lizard Family
Cnemidophorus hyperythrus beldingi
Cnemidophorus tigris multiscutatus
Belding's orangethroated whiptail
coastal western whiptail
FSC,
CSC,SP
FSC
Anniellidae Legless Lizard Family
Anniella pulchra silvery legless esc pulchra lizard
Boidae Boa Family
Charina bottae southern rubber FSC, ST,
umbra tic a boa SP
Colubridae Colubrid Snake Family
Diadophis punctatus modestus
Lampropeltis zonata parvirubra
Legend Agency Lists
San Bernardino ring-neck snake
San Bernardino mountain kingsnake
FE
FT
FSC
FPE
FPT
FPD
Federally Listed as Endangered Federally Listed as Threatened Federal Special Concern Species Federally Proposed as Endangered Federally Proposed as Threatened Federally Proposed for Delisting
Biological Resources Assessment PCR Project Team
FSC
FSC,
esc
Preferred Habitat
Valley-foothill hardwood forests, valley-foothill/hardwood conifer, mixed conifer, and desert scrub habitats.
Arid and semi-arid desert to open woodlands, where vegetation is sparse.
Several habitats but especially in coastal dune, valley-foothill, chaparral, and coastal scrub habitats.
Grassland, broken chaparral, woodland and forest, under rock bark of dead trees.
Open, relatively rocky areas within valley-foothill, mixed chaparral, and annual grass habitats.
Moist woods, coniferous forests, woodland and chaparral.
Location
Potential where habitat occurs
Potential where habitat occurs
Potential where habitat occurs
Potential where habitat occurs
Big Dalton Cyn. and Glendora Mtn. Rd.
Glendora, San Dimas, Little Dalton Cyn., and Big Dalton Cyn.
SE
ST
SCE
SCT
SP
SFP
SR esc
State Listed as Endangered State Listed as Threatened State Candidate for Endangered State Candidate for Threatened State Protected
Page 26
State Fully Protected State Rare California Special Concern Species
San Dimas Canyon/San Antonio Wash November 2000
312

Significant Ecological Area Update Study
SENSITIVE SPECIES
OCCURRING OR POTENTIALLY OCCURRING
WITHIN THE PROPOSED SAN DIMAS CANYON/SAN ANTONIO WASH SEA
(CONTINUED)
VERTEBRATES Agency Listing
Scientific Name Common Name Status Preferred Habitat Location
Lampropeltis zonata pulchra
Salvador hexalepis virgultea
Thamnophis hammondii
BIRDS
San Diego mountain kingsnake
coast patch-nosed snake
two-striped garter snake
FSC, Moist woods, coniferous forests, esc, SP woodland and chaparral.
FSC,
esc Coastal chaparral, desert scrub, washes, sandy flats, and rocky areas. Barren creosote bush desert flats. Sagebrush semi-deserts; sea level to 7,000 ft.
FSC, Riparian and freshwater marshes with esc, SP perennial water.
Glendora, San Dimas, Little Dalton Cyn., and Big Dalton Cyn.
Potential where habitat occurs
San Gabriel River below Morris Dam (I 995)
Ardeidae Heron, Egret, and Bittern Family
Ixobrychus exilis hesperis
Phalacrocoracidae
western least bittern
Cormorant Family
Phalacrocorax auritus double-crested cormorant
esc Emergent wetlands of cattails and tules.
esc Coasts, bays, lakes, and rivers.
Potential where habitat occurs
Potential where habitat occurs
Accipitridae
Accipiter cooperi
Hawks, Kites, Harriers and Eagle Family
Cooper's hawk
Accipiter striatus sharp-shinned hawk
Legend Agency Lists FE
FT
FSC
FPE
FPT
FPD
Federally Listed as Endangered Federally Listed as Threatened Federal Special Concern Species Fedemlly Proposed as Endangered Federally Proposed as Threatened Federally Proposed for De listing
Biological Resources Assessment PCR Project Team
esc Open woodlands especially riparian Potential where habitat woodland. occurs
esc Woodlands; forages over chaparral and Potential where habitat other scrublands; prefers riparian occurs habitats and N-facing slopes, with plucking perch sites.
SE
ST
SCE
SCT
SP
SFP
SR esc
Page 27
State Listed as Endangered State Listed as Threatened State Candidate for Endangered State Candidate for Threatened State Protected State Fully Protected State Rare California Special Concern Species
San Dimas Canyon/San Antonio Wash November 2000
313
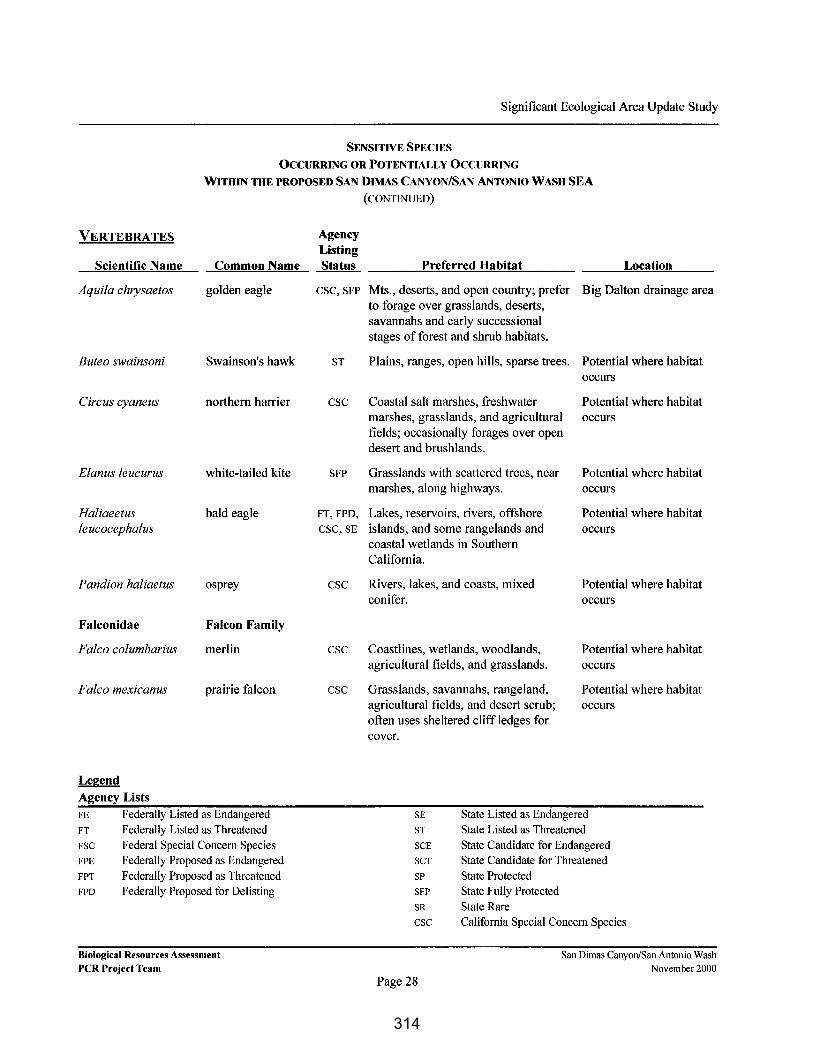
Significant Ecological Area Update Study
SENSITIVE SPECIES
OCCURRING OR POTENTIALLY OCCURRING
WITHIN THE PROPOSED SAN DIMAS CANYON/SAN ANTONIO WASH SEA
(CONTINUED)
VERTEBRATES
Scientific Name
Aquila chrysaetos
Buteo swainsoni
Circus cyaneus
Elanus leucurus
Haliaeetus leucocephalus
Pandion haliaetus
Falconidae
Falco columbarius
Falco mexicanus
Legend Agency Lists
Common Name
golden eagle
Swainson's hawk
northern harrier
white-tailed kite
bald eagle
osprey
Falcon Family
merlin
prairie falcon
FE
FT
FSC
FPE
FPT
FPD
Federally Listed as Endangered Federally Listed as Threatened Federal Special Concern Species Federally Proposed as Endangered Federally Proposed as Threatened Federally Proposed for Delisting
Biological Resources Assessment PCR Project Team
Agency Listing Status
esc, SFP
ST
esc
SFP
FT, FPD,
CSC,SE
esc
esc
esc
Preferred Habitat Location
Mts., deserts, and open country; prefer Big Dalton drainage area to forage over grasslands, deserts, savannahs and early successional stages of forest and shrub habitats.
Plains, ranges, open hills, sparse trees. Potential where habitat occurs
Coastal salt marshes, freshwater Potential where habitat marshes, grasslands, and agricultural occurs fields; occasionally forages over open desert and brushlands.
Grasslands with scattered trees, near Potential where habitat marshes, along highways. occurs
Lakes, reservoirs, rivers, offshore Potential where habitat islands, and some rangelands and occurs coastal wetlands in Southern California.
Rivers, lakes, and coasts, mixed Potential where habitat conifer. occurs
Coastlines, wetlands, woodlands, Potential where habitat agricultural fields, and grasslands. occurs
Grasslands, savannahs, rangeland, Potential where habitat agricultural fields, and desert scrub; occurs often uses sheltered cliff ledges for cover.
SE
ST
SCE
SCT
SP
SFP
SR
esc
State Listed as Endangered State Listed as Threatened State Candidate for Endangered State Candidate for Threatened State Protected
Page 28
State Fully Protected State Rare California Special Concern Species
San Dimas Canyon/San Antonio Wash November 2000
314

Significant Ecological Area Update Study
SENSITIVE SPECIES
OCCURRING OR POTENTIALLY OCCURRING
WITHIN THE PROPOSED SAN DIMAS CANYON/SAN ANTONIO WASH SEA
(CONTINUED)
VERTEBRATES
Scientific Name
Falco peregrinus anatum
Common Name
American peregrine falcon
Agency Listing Status Preferred Habitat
SE, SFP Coastal estuaries, open country, cliffs to coasts. (Formerly FE)
Location
Potential where habitat occurs
Phasianidae Quail, Pheasant, and Grouse Family
Oreortyx picta mountain quail esc Found throughout state in major Potential where habitat montane habitats. Found seasonally in occurs open, brushy stands of conifer and deciduous forest and woodland, and chaparral.
Cuculidae Cuckoos and Roadrunner Family
Coccyzus americanus ace identalis
Strigidae
Asia otus
Athene cunicularia hypugea
Strix occidentalis occidentalis
Legend Agency Lists
western yellow-billed cuckoo
True Owl Family
long-eared owl
burrowing owl
California spotted owl
FE
FT
FSC
FPE
FPT
FPD
Federally Listed as Endangered Federally Listed as Threatened Federal Special Concern Species Federally Proposed as Endangered Federally Proposed as Threatened Federally Proposed for Delisting
Biological Resources Assessment PCR Project Team
SE
esc
FSC,
esc
esc
Riverine woodlands, thickets, and Near Cattle Cyn. (1931) farms.
Riparian and live oak woodlands. Potential where habitat occurs
Dry grasslands, desert habitats, and Potential where habitat open pinyon-juniper and ponderosa occurs pine woodlands below 5,300 ft. Prefers berms, ditches, and grasslands adjacent to rivers, agricultural, and scrub areas.
Oak and oak-conifer habitats. Potential where habitat occurs
SE
ST
SCE
SCT
SP
SFP
SR esc
State Listed as Endangered State Listed as Threatened State Candidate for Endangered State Candidate for Threatened State Protected
Page 29
State Fully Protected State Rare California Special Concern Species
San Dimas Canyon/San Antonio Wash November 2000
315

Significant Ecological Area Update Study
SENSITIVE SPECIES
OCCURRING OR POTENTIALLY OCCURRING
WITHIN THE PROPOSED SAN DIMAS CANYON/SAN ANTONIO WASH SEA
(CONTINUED)
VERTEBRATES Agency Listing
Scientific Name Common Name Status Preferred Habitat Location
Apodidae
Chaetura vauxi
Cypseloides niger
Swift Family
Vaux's swift
black swift
esc Redwood and douglas fir habitats.
esc Steep, rocky, often moist cliffs and crevice or caves on sea cliffs, deep cyns.
Big Dalton Cyn. area (1993)
Sturtevant Falls, Santa Anita Cyn. (1986); Wolfskill Falls, near Mt. Baldy (1986).
Tyrannidae
Empidonax traillii
Tyrant Flycatcher Family
Empidonax traillii extimus
Alaudidae
Eremophila alpestris actia
Legend Agency Lists
willow flycatcher
southwestern willow flycatcher
Lark Family
California homed lark
FE FT
FSC
FPE
FPT FPD
Federally Listed as Endangered Federally Listed as Threatened
Federal Special Concern Species Federally Proposed as Endangered Federally Proposed as Threatened Federally Proposed for De listing
Biological Resources Assessment PCR Project Team
SE
FE
esc
Wet meadow and montane riparian Potential where habitat habitats, river valleys and large mt. occurs meadows.
Low elevational sites: Riparian Potential where habitat woodlands that contain water and low occurs growing willow thickets. High elevational sites: Large, flat, wet meadows that contain patches of willow trees.
Open habitats, grasslands along the coast, deserts near sea level to alpine dwarf shrub habitat, uncommonly in coniferous and chaparral habitats.
Potential where habitat occurs
SE
ST
SCE
SCT
SP SFP SR esc
State Listed as Endangered State Listed as Threatened
State Candidate for Endangered State Candidate for Threatened
State Protected
Page 30
State Fully Protected State Rare California Special Concern Species
San Dimas Canyon/San Antonio Wash
November 2000
316

Significant Ecological Area Update Study
SENSITIVE SPECIES OCCURRING OR POTENTIALLY OCCURRING
WITHIN THE PROPOSED SAN DIMAS CANYON/SAN ANTONIO WASH SEA (CONTINUED)
VERTEBRATES Agency Listing
Scientific Name Common Name Status Preferred Habitat Location
Hirundinidae Swallow Family
Progne subis purple martin esc Towns, farms, open or semi-open Potential where habitat country. occurs
Riparia riparia bank swallow ST Riparian and other lowland habitats Potential where habitat west of the desert. occurs
Troglodytidae Wren Family
Campylorhynchus coastal cactus wren esc Coastal sage scrub, vegetation with Potential where habitat brunneicapil!us couesi thickets of prickly pear or cholla cactus. occurs
Muscicapidae Kinglets, Gnatcatchers, Thrushes, and Babbler Family
Polioptila californica californica
Laniidae
Lanius ludovicianus
Legend Agency Lists
California gnatcatcher
Shrike Family
loggerhead shrike
FE
FT
FSC
FPE
FPT
FPD
Federally Listed as Endangered Federally Listed as Threatened Federal Special Concern Species Federally Proposed as Endangered Federally Proposed as Threatened Federally Proposed for Delisting
Biological Resources Assessment PCR Project Team
FT,CSC
FSC, esc
Coastal sage scrub vegetation below Arcadia (1928); Indian 2,500 ft. in Riverside County and Hill, Claremont (1918); generally below 1,000 ft. along coastal near Bio Field slopes; generally avoids steep slopes Station/Rancho Santa and dense vegetation for nesting. Ana Botanic Garden
(1994)
Open habitats with scattered shrubs, Potential where habitat trees, posts, fences, utility lines, or occurs other perches.
SE
ST
SCE
SCT
SP
SFP
SR
esc
Page 31
State Listed as Endangered State Listed as Threatened State Candidate for Endangered State Candidate for Threatened State Protected State Fully Protected State Rare California Special Concern Species
San Dimas Canyon/San Antonio Wash November 2000
317
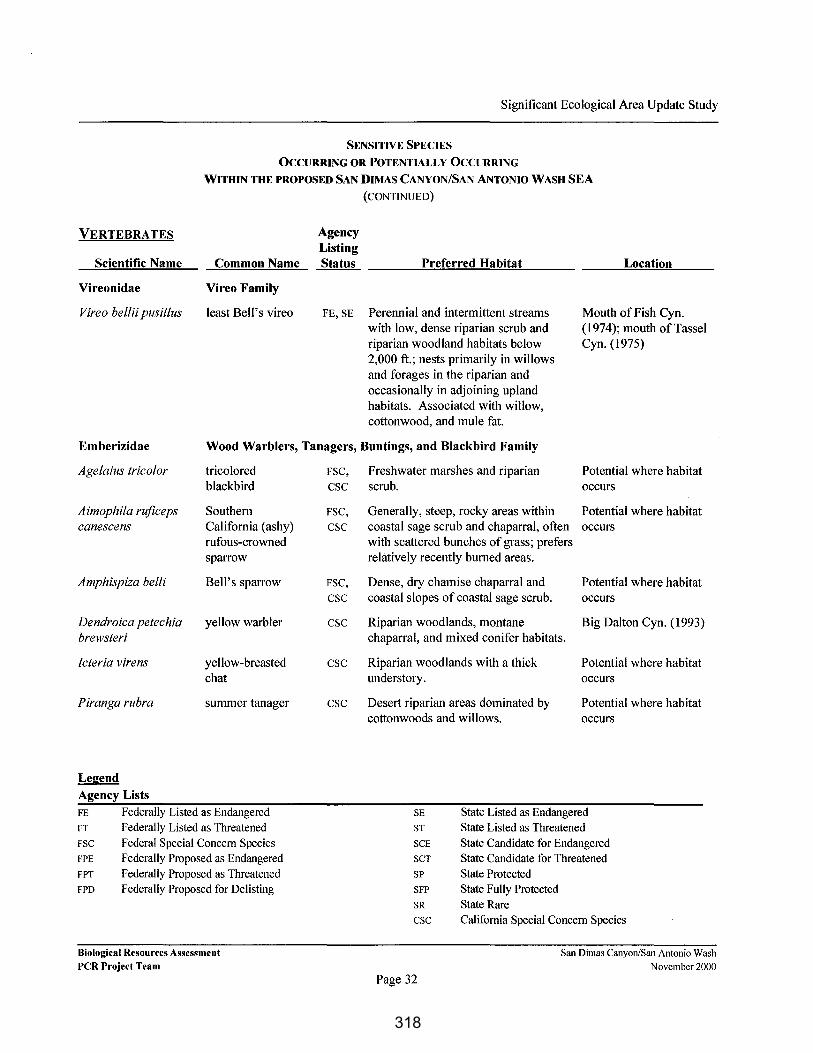
Significant Ecological Area Update Study
SENSITIVE SPECIES
OCCURRING OR POTENTIALLY OCCURRING
WITHIN THE PROPOSED SAN DIMAS CANYON/SAN ANTONIO WASH SEA
(CONTINUED)
VERTEBRATES Agency Listing
Scientific Name Common Name Status Preferred Habitat Location
Vireonidae
Vireo bellii pusi!lus
Vireo Family
least Bell's vireo FE, SE Perennial and intermittent streams with low, dense riparian scrub and riparian woodland habitats below 2,000 ft.; nests primarily in willows and forages in the riparian and occasionally in adjoining upland habitats. Associated with willow, cottonwood, and mule fat.
Mouth ofFish Cyn. (1974); mouth ofTassel Cyn. (1975)
Emberizidae Wood Warblers, Tanagers, Buntings, and Blackbird Family
Agelaius tricolor
Aimophila ruficeps canescens
Amphispiza belli
Dendroica petechia brewsteri
lcteria virens
Piranga rubra
Legend Agency Lists
tricolored blackbird
Southern California (ashy) rufous-crowned sparrow
Bell's sparrow
yellow warbler
yellow-breasted chat
summer tanager
FE
FT
FSC
FPE
FPT
FPD
Federally Listed as Endangered Federally Listed as Threatened Federal Special Concern Species Federally Proposed as Endangered Federally Proposed as Threatened Federally Proposed for Delisting
Biological Resources Assessment PCR Project Team
FSC,
esc
FSC,
esc
FSC,
esc
esc
esc
esc
Freshwater marshes and riparian Potential where habitat scrub. occurs
Generally, steep, rocky areas within Potential where habitat coastal sage scrub and chaparral, often occurs with scattered bunches of grass; prefers relatively recently burned areas.
Dense, dry chamise chaparral and Potential where habitat coastal slopes of coastal sage scrub. occurs
Riparian woodlands, montane Big Dalton Cyn. (1993) chaparral, and mixed conifer habitats.
Riparian woodlands with a thick Potential where habitat understory. occurs
Desert riparian areas dominated by Potential where habitat cottonwoods and willows. occurs
SE
ST
SCE
SCT
SP
SFP
SR esc
State Listed as Endangered State Listed as Threatened State Candidate for Endangered State Candidate for Threatened State Protected
Page 32
State Fully Protected State Rare California Special Concern Species
San Dimas Canyon/San Antonio Wash November 2000
318

Significant Ecological Area Update Study
SENSITIVE SPECIES
OCCURRING OR POTENTIALLY OCCURRING
WITHIN THE PROPOSED SAN DIMAS CANYON/SAN ANTONIO WASH SEA
(CONTINUED)
VERTEBRATES Agency Listing
Scientific Name Common Name Status Preferred Habitat Location
Vermivora virginiae Virginia's warbler esc Arid, shrubby, mixed conifer, pinyonjuniper, montane chaparral
Recent record (no date) of a pair successfully breeding near Blue Ridge
MAMMALS
Phyllostomidae Leaf-Nosed Bat Family
Macrotus californicus California leafnosed bat
Vespertilionidae
Antrozous pallidus
Corynorhinus (Plecotus) townsendii pallescens
Corynorhinus (Plecotus) townsendii townsendii
Legend Agency Lists
Evening Bat Family
pallid bat
pale big-eared bat
Townsend's bigeared bat
FE
FT
FSC
FPE
FPT
FPD
Federally Listed as Endangered Federally Listed as Threatened Federal Special Concern Species Federally Proposed as Endangered Federally Proposed as Threatened Federally Proposed for Delisting
Biological Resources Assessment PCR Project Team
FSC,
esc
esc
esc
FSC,
esc
Desert riparian, desert wash, desert Potential where habitat scrub, desert succulent shrub, alkali occurs desert scrub, and palm oasis. Roosts in tunnels, caves and possible buildings and bridges.
Nests in dry, rocky habitats/caves, crevices in rocks, arid habitats including deserts, chaparral, and scrub lands.
Caves, tunnels, or other structures for roosting, vegetation and mesic edges for feeding, extremely sensitive to roosting site disturbance, maternity roosts are in warm places.
Caves, mine tunnels, and buildings.
Potential where habitat occurs
Potential where habitat occurs
Potential where habitat occurs
SE
ST
SCE
SCT
SP
SFP
SR
esc
State Listed as Endangered State Listed as Threatened State Candidate for Endangered State Candidate for Threatened State Protected
Page 33
State Fully Protected State Rare California Special Concern Species
San Dimas Canyon/San Antonio Wash November 2000
319

Significant Ecological Area Update Study
SENSITIVE SPECIES
OCCURRING OR POTENTIALLY OCCURRING
WITHIN THE PROPOSED SAN DIMAS CANYON/SAN ANTONIO WASH SEA
(CONTINUED)
VERTEBRATES Agency Listing
Scientific Name Common Name Status
Myotis ciliolabrum small-footed bat FSC, esc
Myotis evotis long-eared bat FSC, esc
Myotis thysanodes Fringed myotis FSC
Myotis volans long-legged myotis FSC
Myotis yumanensis Yumamyotis FSC, esc
Molossidae Free-Tailed Bat Family
Eumops perotis californicus
western mastiff bat FSC, esc
Leporidae Hares and Rabbit Family
Lepus californicus bennettii
San Diego blacktailed jackrabbit
Legend
Agency Lists FE FT
FSC
FPE FPT FPD
Federally Listed as Endangered Federally Listed as Threatened Federal Special Concern Species Federally Proposed as Endangered Federally Proposed as Threatened Federally Proposed for Delisting
Biological Resources Assessment PCR Project Team
FSC, esc
Preferred Habitat Location
Primarily found in relatively arid Potential where habitat wooded and brushy uplands near water occurs from sea level to 8,900 ft.
Occurs along entire coast. Potential where habitat occurs
Grassland/oak savannah, cottonwood- Potential where habitat willow woodland, riparian scrub, oak occurs woodland, open riverbed and bank.
Most common in woodland and forest Potential where habitat habitats above 4,000 ft.; also forages in occurs chaparral, coastal scrub, shrub habitats from sea level to 11,400 ft.
Open forests and woodlands with water Potential where habitat are optimal but uses a variety ofhabitats. occurs
Primarily arid lowlands, especially Potential where habitat deserts. Open, semi-arid to arid occurs habitats including conifer and deciduous woodlands, coastal scrub, annual and perennial grasslands, palm oases, chaparral, desert scrub, and urban.
Open brushlands and scrub habitats between sea level and 4,000 ft.
Potential where habitat occurs
SE
ST
SCE
SCT
SP
SFP
SR esc
Page 34
State Listed as Endangered State Listed as Threatened State Candidate for Endangered State Candidate for Threatened State Protected State Fully Protected State Rare California Special Concern Species
San Dimas Canyon/San Antonio Wash
November 2000
320

Significant Ecological Area Update Study
SENSITIVE SPECIES
OCCURRING OR POTENTIALLY OCCURRING
WITHIN THE PROPOSED SAN DIMAS CANYON/SAN ANTONIO WASH SEA
(CONTINUED)
VERTEBRATES
Scientific Name
Agency Listing
Common Name Status Preferred Habitat Location
Heteromyidae
Chaetodipus fallax
Pocket Mice and Kangaroo Rat Family
San Diego pocket mouse
FSC,
esc Sandy herbaceous areas, usually in association with rocks or coarse gravel, sagebrush, scrub, annual grassland, chaparral and desert scrubs.
Historic records from alluvial scrub areas near lower San Antonio Creek
Dipodomys merriami San Bernardino FE, esc Alluvial fan scrub. Potential where habitat occurs parvus
Perognathus longimembris brevinasus
Merriam's kangaroo rat
Los Angeles pocket FSC,
mouse esc
Mice, Rats, and Vole Family
Coastal sage scrub, and grasslands, desert cactus, creosote bush and sagebrush habitats.
Potential where habitat occurs
Muridae
Neotoma lepida intermedia
San Diego desert FSC, Chaparral, coastal sage scrub, and Several records from different localities in San Gabriel Cyn. and Azusa
woodrat esc pinyon-juniper woodland.
Onychomys torridus ramona
Procyonidae
Bassariscus astutus octarus
Legend Agency Lists
southern grasshopper mouse
Raccoon Family
ringtail cat
FE
FT
FSC
FPE
FPT
FPD
Federally Listed as Endangered
Federally Listed as Threatened Federal Special Concern Species Federally Proposed as Endangered
Federally Proposed as Threatened Federally Proposed for Delisting
Biological Resources Assessment PCR Project Team
FSC,
esc
SFP
Grasslands, desert areas, especially scrub with friable soils.
Potential where habitat occurs
Mixture of forest and shrub lands in close association with rocky areas or riparian habitats.
Historic records from numerous cyns. including San Dimas and San Gabriel
SE
ST
SCE
SCT
SP
SFP
SR esc
Page 35
State Listed as Endangered State Listed as Threatened
State Candidate for Endangered State Candidate for Threatened State Protected State Fully Protected
State Rare California Special Concern Species
San Dimas Canyon/San Antonio Wash November 2000
321

Significant Ecological Area Update Study
9. REGIONAL BIOLOGICAL VALUE
The proposed San Dimas Canyon/San Antonio Wash SEA meets several SEA designation criteria that consider regional biological values. Each criterion and how it is met or why not is described below.
Criterion A: The Habitat of Core Populations of Endangered or Threatened Plant or Animal Species.
Although the proposed SEA contains rare plant populations, it does not contain a core population of a listed species and therefore does not meet this criterion.
Criterion B: On a Regional Basis, Biotic Communities, Vegetative Associations, and Habitat of Plant or Animal Species that are either Unique or are Restricted in Distribution.
The proposed SEA contains habitat of the extremely rare rock monardella. In addition, several plant communities within this SEA are CDFG highest inventory priority communities due to their restricted distribution in the Southern California region, including: walnut woodland, oak riparian woodland, southern willow scrub, coastal sage scrub, and alluvial fan scrub.
Criterion C: Within Los Angeles County, Biotic Communities, Vegetative Associations, and Habitat of Plant or Animal Species that are either Unique or are Restricted in Distribution.
All of the plant communities and habitats mentioned above as being restricted in distribution on a regional basis are also restricted in distribution within Los Angeles County.
Criterion D: Habitat that at some point in the Life Cycle of a Species or Group of Species, Serves as Concentrated Breeding, Feeding, Resting, or Migrating Grounds and is Limited in Availability either Regionally or in Los Angeles County.
The major canyons within this SEA support well developed and diverse riparian woodlands, as well as a source of water for most, if not all, of the year. These represent important stopover and overwintering areas for a wide variety of migratory birds, as well as essential habitat for resident species. These canyons also support
Biological Resources Assessment PCR Project Team
Page 36
San Dimas Canyon/San Antonio Wash November 2000
322
Significant Ecological Area Update Study
seasonal and more frequent movement for wide-ranging mammals which must move over large areas to fulfill their habitat requirements.
Criterion E: Biotic Resources that are of Scientific Interest because they are either an Extreme in Physical/Geographical Limitations, or Represent Unusual Variation in a Population or Community.
The proposed SEA does not contain biotic resources that are clearly an extreme in physical/geographical limitations, or represent unusual variation in a population or community and therefore does not meet this criterion.
Criterion F: Areas that would Provide for the Preservation of Relatively Undisturbed Examples of the Original Natural Biotic Communities in Los Angeles County.
Virtually all of the native biotic communities within this SEA are relatively undisturbed over most of their extent. As such, and because urbanization throughout much of Los Angeles County's foothill regions has removed large expanses of these communities, those in the San Dimas Canyon/San Antonio Wash SEA are particularly important to the County's natural heritage.
10. RECOMMENDED MANAGEMENT PRACTICES
Proposed new development within the proposed Puente Hills SEA should be designed to be highly compatible with the continued ecological function of the component biological resources described above; retention of existing natural biotic resources should be ensured. Although a comprehensive evaluation of all possible future land uses within this SEA cannot be made here, a general approach is outlined below and is recommended for use on a project specific basis. In order to preserve the integrity of the SEA, the proposed comprehensive management practices described in the Los Angeles County SEA Update Study 2000 Background Report are recommended. These practices address:
• Core habitat
• Habitat linkages and wildlife corridors
• Fire management
• Public access and recreation
Biological Resources Assessment PCR Project Team
Page 37
San Dimas Canyon/San Antonio Wash November 2000
323

Significant Ecological Area Update Study
• Infrastructure
• Wetlands, riparian habitats, and streambeds
• Non-riparian/upland woodlands
In addition to the comprehensive management practices the following proposed management practices are recommended specifically for the proposed San Dimas Canyon/San Antonio Wash SEA:
• Maintain the habitat of core populations of extremely rare species including rock monardella.
• Retain rare communities with adequate buffers so as to allow for the long term viability and integrity of plant communities as a whole. Rare communities include: oak woodland, walnut woodland, oak riparian woodland, southern willow scrub, coastal sage scrub, and alluvial fan scrub.
Additionally, proposed development should be reviewed when required by federal, state, or local laws before implementing plans which may impact biotic resources and/or sensitive species. Potential impacts to listed species or wetland areas require permitting in accordance with applicable laws.
11. SOURCES
Baskin, J.N. and T.R. Haglund, T.R. 1995. Distribution and Abundance of Native Fishes, Southwestern Pond Turtles and Two-Striped Garter Snakes Below Morris Dam and in Brown's Gulch, San Gabriel River Canyon. San Marino Environmental Associates, San Marino, California. 45 pp.
Planning Consultants Research. 1995. Biological Assessment for the Big Dalton Dam Modification Project, Santa Monica, California.
Stephenson, J.R. and G.M. Calcarone. 1999. Southern California Mountains and Foothills Assessment: Habitat and Species Conservation Issues. General Technical Report GTRPSW-172. Albany, CA: Pacific Southwest Research Station, Forest Service, U.S. Department of Agriculture; 402 pp.
Biological Resources Assessment PCR Project Team
Page 38
San Dimas Canyon/San Antonio Wash November 2000
324
PCR SANTA MONICA
233 Wilshire Boulevard Suite 130
Santa Monica, California 90401
HI 310.451.4488 fi1X 31 0.451. 52 79
~MAIL info@;pcrnet com
PCR KonN 12100 Wilshire Boulevard Suite 1050
los Ange les, California 90025
IH 310.820.0900 FAX 310.820.1703
EMAil info@ pcrnet.rorn
PCR IRVINE
One Venture Suite 150
Irvine, Ca lifornia 926 18
Tf[ 949.7 53.7001 FAX 949.753 7002
EMAil info<(lipcrnet.com
325

326

FEHR1PEERS
MEMORANDUM
Date: January 27, 2011
To: Tammy Seale, PMC
From: Chris Gray - Fehr & Peers
Subject: SCAG Travel Model Data for San Dimas /£11-0079
The purpose of this memorandum is to summarize data related to population and employment for the City of San Dimas, as currently contained in the Southern California Association of Governments (SCAG) Regional Travel Demand Model. The following information is included in this memorandum:
• Background information on the SCAG Travel Demand Model
• Background on using the SCAG Travel Demand Model
• Discussion of land use categories in the SCAG Model
• Description of Traffic Analysis Zones in the SCAG Travel Demand Model corresponding to San Dimas
• Our review of the SCAG travel demand land use data for the San Dimas zones
• Summary of Existing and Future land use data in the SCAG Model for San Dimas
• VMT Forecasts for Existing and Forecast Years for Community Emissions
Additional information regarding each of these items is provided below.
BACKGROUND INFORMATION ON THE SCAG TRAVEL DEMAND MODEL
The SCAG Travel Demand Model is used in a variety of planning and engineering studies throughout the Southern California Region. The main components of the model include:
• Land use data by Traffic Analysis Zone (TAZ)
• Roadway networks including freeways and most major roadways within the SCAG Region
• Transit networks including bus and rail lines
3850 Vine Street, Suite 140, Riverside, CA 92507 951-2744800 WNW.fehrandpeers.com
327
January 27, 2011 Page2
This information is available for 2003 and 2035. 2003 represents the Base Year or the Existing Year when development of the SCAG model initially began. 2035 represents the forecast year and is the same year as the Regional Transportation Plan (RTP) and other long-range planning documents.
The 2035 forecast of the SCAG Travel Demand Model is a standard BAU (Business As Usual) forecast accounting for the RTP planning projects. The 2035 data is derived through an extensive process using various data sources and supplemented through meetings with the local jurisdictions. The process through which 2035 data is generated can be described as follows:
• SCAG first obtains regional and countywide control totals related to population and employment from various sources including the Department of Finance and other agencies.
• SCAG allocates this growth to regions and sub-regions within Southern California. As an example, SCAG may determine that Los Angeles County is anticipated to grow by 20% in terms of population and 10% in terms of employment by 2035.
• SCAG employs their own demographic models to allocate this growth to various city and county regions. Much of this demographic analysis is focused on population age, income levels, and other related items to provide the detailed data that is required. One aspect of these models is that the population progresses through its life cycle as they are born, age, and then pass away throughout their life span.
• SCAG then coordinates with local jurisdictions, Councils of Governments, transportation agencies, and other stakeholders to ensure that their forecasts are reasonable. For some jurisdictions, locally produced demographic forecasts are used to replace or update the SCAG forecasts.
APPUCATION OF THE SCAG TRAVEL DEMAND MODEL
In this instance, we would be using the SCAG Model to develop estimates of vehicle miles traveled (VMT) for the City of San Dimas. A key input to the VMT estimates will be the land use data, particularly the citywide totals since we are estimating VMT for the City as a whole. Since we are not applying the model to forecast roadway and intersection volumes, we are less concerned about the distribution of land uses for each TAZ within the City. However, we are concerned with the distribution of land uses to those TAZ's on the boundaries of the City since it could affect the citywide total.
LAND USE CATEGORIES IN THE SCAG MODEL
The land use data for each TAZ includes the following information:
• Total number of persons
• Total number of households
• Total number of households with 1 resident, 2 residents, 3 residents, and 4+ residents
• Persons by age category (under 5 years, 5 through 17 years, 17 through 64 years, and over 65 years)
328

January 27, 2011 Page 3
• Number of heads of households by age (18 through 24 years, 25 to 44 years, 45 to 64 years, and over 65 years)
• Number of household with 0, 1, 2 or 3 workers
• K-12 school enrollment
• College enrollment
• Total number of employees
• Total number of employees by industrial and wholesale uses (construction, agricultural, warehousing, and wholesale)
• Total number of employees by retail uses
• Total number of employees by service uses (office and public employees)
Please note that the SCAG model does not provide data based on non-residential land use such as square footage by various types of uses, acreage by use, or other similar data.
TRAFFIC ANALYSIS ZONES FOR SAN DIMAS
As shown in the attached graphic, there are 8 traffic analysis zones that lie entirely or partially within the City boundaries.
OUR REVIEW OF SAN DIMAS TAZ DATA
One final element of the analysis is a review of TAZ data to determine whether the Citywide totals provided by the SCAG Travel Demand Model are consistent with historic population and employment data. Our review focused on household data since that information is more readily available from sources such as the Decennial Census. Households are the primary determinant of VMT as opposed to population, which is why we focused on households related to residential uses.
An analysis of the available population data for the City of San Dimas indicates that the population data contained within the SCAG Travel Demand Model is slightly outside the range of available sources for comparable periods. The US Census estimates that the number of households in San Dimas was 12,030 in 2010, which is lower than the data contained in the SCAG Travel Demand Model for 2003. The SCAG Model data estimated that there were over 14,000 households in the City in 2003. In addition, in the employment data comparison that we conducted between the SCAG Travel Demand Model to the currently adopted SCAG RTP (year 2008), the SCAG TDM data is higher for year 2003 than the RTP 2008 model.
In the case of the City of San Dimas, there is a significant discrepancy of model input data in both household and employment for both year 2003 and 2035, which leads to the decision to adjust the 2008 and 2035 VMT data with an adjustment factor of -29% and -37.5%, respectively. As VMT is calculated based on household and employment, the final VMT adjustment factor is a weighted factor based on the ratio of households and employees.
329

330

City of San Dimas Permit Activity Report (Short Version) Permit Sub-Type: SNEW,
User Date (DATE_B): 01/01/2008 -12/13/2011
Permit# B0612961 Applied: 07/17/2006 Issued: 01/03/2008 Final: 02/05/2009 Type:
Work: NEW 1351 SF SFR WITH 492 SF GARAGE, 150 SF PORCH AND 50 SF DECK WIT Sub-Type:
Address: 202 ASHVALE DRIVE
#Units: 1
Names: ------------GILBERT ALCALA-ARCHITECT
SMITH HOWARD
Class: 101
SOFt: 2043
CityiD: SAND Status:
Value: $105,702.90 Total Fees:
APPLICANT
OWNER
Balance Due:
951-737-9622
Permit# B0714183 Applied: 08/22/2007 Issued: 04/25/2008 Final: Type:
Work: NEW SINGLE FAMILY HOME 2525 SQ. 987 S.F. GARAGE, 280 S.F. PORCH WIT Sub-Type:
Address: 175 N ACACIA STREET City ID: SAND Status:
#Units: 1 Class: 101 Value: $249,197.20 Total Fees:
Names: SO Ft: 3309 Balance Due: ----------------------------------------------------KAMRAN NIKBAKHT
KAMRAN NIKBAKHT OWNER
APPLICANT
(949)795-6706
(949)795-6706
Permit# 80714399 Applied: 11/08/2007 Issued: 01/17/2008 Final: Type:
Work: BUILD NEW 3249 SF HOUSE, 604 SF GARAGE, 284 SF SOLID PATIO, 40 SF POR Sub-Type:
Address: 807 KLAMATH COURT City ID: SAND Status: #Units: 1
Names:
HARTMAN BALDWIN INC
HARDENBOL, IRENE L.
HARTMAN BALDWIN INC
Class: 101
SOFt 4353
Value: $240,626.90 Total Fees:
Balance Due:
CONTRACTOR 909-621-6296
OWNER
APPLICANT 909-621-6296
Permit# B0814589 Applied: 01/28/2008 Issued: 01128/2008 Final: 08/17/2009 Type:
Work: NEW 1775 SF RESIDENCE WITH 441 SF ATTACHED GARAGE AND 300 SF POR Sub-Type:
Address: 446 W SECOND STREET City ID: SAND Status:
#Units: 1 Class: 101 Value: $188,784.56 Total Fees:
Names: SO Ft: 2516 Balance Due:
HALL MEGAN AND CARRIE
HALL MEGAN AND CARRIE
OWNER
APPLICANT
Permit# 80814612 Applied: 02/13/2008 Issued: 02/15/2008 Final: Type:
Work: NEW 7067 SF CUSTOM HOME WITH 790 SF GARAGE WITH ELECT, PLUMB AN Sub-Type:
Address: 526 W GLADSTONE STREET City ID: SAND Status:
#Units: 1 Class: 101 Value: $700,453.23 Total Fees:
Names: SO Ft: 7857 Balance Due:
SIAPNO, EDUARDO B. & CHONLTHORN K.
SIAPNO, EDUARDO B. & CHONL THORN K.
Tuesday, December 13,201110:51:01 AM
OWNER
APPLICANT
COMBO
SNEW
FINALED
$2,983.10
$0.00
COMBO
SNEW
EXPIRED
$4,794.42
$0.00
COMBO
SNEW
EXPIRED
$5,211.54
$0.00
COMBO
SNEW
FINAL ED
$3,225.05
$0.00
COMBO
SNEW
ISSUED
$3,796.43
$0.00
Page 1 of 13
f
331
Permit# 80814614 Applied: 02/13/2008 Issued: 02/15/2008 Final: 05/29/2009 Type:
Work: NEW 4329 SF HOUSE WITH 820 SF GARAGE, 99 SF PORCH WITH ELECT, PLUM Sub-Type:
Address: 237 W BASELINE ROAD City ID: SAND Status:
#Units: Class: 101 Value: $442,764.91 Total Fees:
Names: SQ Ft: 5248 Balance Due: ----·--- ---~----
KUMAR ASHA OWNER
G M C GENERAL CONTRACTING AND PROPERTY DEVELOPME APPLICANT 909-205-9339
G M C GENERAL CONTRACTING AND PROPERTY DEVELOPME CONTRACTOR 909-205-9339
Permit # 80814638 Applied: 02/22/2008 Issued: 02/25/2008 Final: Type:
Work: NEW 842 SF GUEST HOUSE WITH 225 SF GARAGE AND 10 SF PORCH Sub-Type:
Address: 1775 N SAN DIMAS CANYON ROAD City ID: SAND Status: It Units: 1
Names:
STEVE EIDE
ORNELAS HOLLY
Class: 101
SQ Ft: 1077
Value:
APPLICANT
OWNER
$88,416.33 Total Fees:
Balance Due:
626·915-2303
Permit# 80814689 Applied: 03/11/2008 Issued: 05/22/2008 Final: 04/07/2009 Type:
Work: 5695 SF CUSTOM HOME WITH 796 SF GARAGE, 320 SF LATIICE PATIO, 132 SF Sub-Type:
Address: 1608 CALLE CRISTINA City ID: SAND Status:
#Units: 1 Class: 101 Value: $575,784.59 Total Fees:
Names: SQ Ft: 6941 Balance Due: --------------------MUST APHA ALEX
MUST APHA ALEX
OWNER
APPLICANT
626-859-0222
626-859-0222
Permit# 80814762 Applied: 04/08/2008 Issued: 04/10/2008 Final: 08/12/2009 Type:
Work: 2892 SF CUSTOM HOME, 588 SF GARAGE, 181 SF PORCH, 85 SF PATIO WITHE Sub-Type:
Address: 1615 N SAN DIMAS CANYON ROAD City ID: SAND Status:
# Units: 1 Class: 101 Value: $299,872.16 Total Fees:
Names: SQ Ft: 3746 Balance Due: ~" --.-~-------------
BADE CONSTRUCTION CO INC
BADE CONSTRUCTION CO INC
BADE CONSTRUCTION
CONTRACTOR 626·574-7354
APPLICANT
OWNER
626-57 4-7354
'-"\. ;ermit # 60814772 Applied: 04/11/2008 Issued: 04/15/2008 Final: Type:
···~Work: REBUILD 3100 SF HOUSE (COMPLETE GUT AND REMODEL OF EXISTINGING 1 Sub-Type:
Names: SO Ft: 4330 Balance Due:
COMBO
SNEW
FINALED
$1,708.90
$0.00
COMBO
SNEW
ISSUED
$1,753.55
$0.00 -·--~--
COMBO
SNEW
FINALED
$6,140.56
$0.00
COMBO
SNEW
FINALED
$3,589.37
$0.00
COMBO
SNEW
EXPIRED
$5,384.81
$0.00 ~& ~d~~:~~: ~45 N WALNUT AVENC~:ss: 101 C~:~~~; $329,58~~0~D Tota~~~~::: ··----~~--~-------~---·--- -·-- ----~-- --··--· --~---- --~----- ·- ------. -------~-- -------· --~----·· --~------------------------------------------ ----~~---- ---··· -------------~
CALLANDER EDMUND W OWNER 909/599-4939
FOOTHILL CONSTRUCTION CO APPLICANT 626-335-7373
FOOTHILL CONSTRUCTION CO CONTRACTOR 626-335-7373
Permit# 80814870 Applied: 05/16/2008 Issued: 07/24/2008 Final: Type:
Work: NEW 2796 SF TOWNHOUSE WITH 400 SF GARAGE AND 960 SF WORK SPACE Sub-Type:
Address: 284 S SAN DIMAS AVENUE City ID: SAND Status:
#Units: 1
Names:
GROVE STAT ION LLC
WILLIAM FOX HOMES INC
WILLIAM FOX HOMES INC
Class: 101
SQ Ft: 8872
Tuesday, December 13,201110:51:02 AM
Value: $394,387.24 Total Fees:
Balance Due:
OWNER
CONTRACTOR 909-373-8133
APPLICANT 909-373-8133
COMBO
SNEW
ISSUED
$7,225.88
$0.00
Page 2 of 13
j
[
l
I
332

CRAIG HENSLEY PLANNER
Permit# 80814874 Applied: 05/19/2008 Issued: 07/24/2008 Final: Type:
Work: 2027 SF TOWNHOUSE WITH 400 SF GARAGE AND 464 SF WORK SPACE WITH Sub-Type:
Address: 346 S SAN DIMAS AVENUE City ID: SAND Status:
# Units: 1 Class: 101 Value: $266,404.57 Total Fees:
Names: SQ Ft: 5906 Balance Due:
WILLIAM FOX HOMES INC CONTRACTOR 909-373-8133
WILLIAM FOX HOMES INC
GROVE STATION LLC
APPLICANT
OWNER
909-373-8133
Permit# 80814875 Applied: 05/19/2008 Issued: 07/24/2008 Final: Type:
Work: 2047 SF TOWNHOUSE WITH 400 SF GARAGE, 491 SF WORK SPACE WITH ELE Sub-Type:
Address: 364 S SAN DIMAS AVENUE City ID: SAND Status:
#Units: Class: 101 Value: $269,134.84 Total Fees:
Names:
WILLIAM FOX HOMES INC
WILLIAM FOX HOMES INC
GROVE STAT ION LLC
SQ Ft 5967 Balance Due:
APPLICANT 909-373-8133
CONTRACTOR 909-373-8133
OWNER
Permit# B0814876 Applied: 05/19/2008 Issued: 07/24/2008 Final: Type:
Work: 2143 SF TOWNHOUSE WITH 400 SF GARAGE AND 549 SF WORK SPACE WITH Sub-Type:
Address: 316 S SAN DIMAS AVENUE City 10: SAND Status:
#Units: 1 Class: 101 Value: $284,953.66 Total Fees:
Names: SQ Ft: 6333 Balance Due:
GROVE STATION LLC
WILLIAM FOX HOMES INC
WILLIAM FOX HOMES INC
CRAIG HENSLEY
OWNER
APPLICANT 909-373-8133
CONTRACTOR 909-373-8133
PLANNER
Permit# B0814877 Applied: 05/19/2008 Issued: 07/24/2008 Final: Type:
Work: 2138 SF TOWNHOUSE WITH 400 SF GARAGE AND 525 SF WORK SPACE WITH Sub-Type:
Address: 252 S SAN DIMAS AVENUE City ID: SAND Status:
#Units: Class: 101 Value: $281,796.67 Total Fees:
Names: SQ Ft: 6251 Balance Due:
COMBO
SNEW
ISSUED
$5,539.88
$0.00
COMBO
SNEW
ISSUED
$5,577.79
$0.00
COMBO
SNEW
ISSUED
$5,763.69
$0.00
COMBO
SNEW
ISSUED
$5,774.23
$0.00 ---- --·-----
WILLIAM FOX HOMES INC
GROVE STAT ION LLC
WILLIAM FOX HOMES INC
CONTRACTOR 909-373-8133
OWNER
APPLICANT 909-373-8133
Permit# B0814878 Applied: 05/19/2008 lssuecJ: 07/24/2008 Final: Type:
Work: 2195 SF TOWNHOUSE WITH 400 SF GARAGE AND 569 SF WORK SPACE WITH Sub-Type:
Address: 246 S SAN DIMAS AVENUE City ID: SAND Status:
#Units: 1 Class: 101 Value: $292,252.54 Total Fees:
Names: SQ Ft: 6497 Balance Due:
GROVE STATION LLC
WILLIAM FOX HOMES INC
WILLJAM FOX HOMES INC
Tuesday, December 13, 2011 10:51:02 AM
OWNER
APPLICANT 909-373-8133
CONTRACTOR 909-373-8133
COMBO
SNEW
ISSUED
$5,913.31
$0.00
Page 3 of 13
I
!
f
I
333

Permit# B0814879 Applied: 05/19/2008 Issued: 07/24/2008 Final: Type:
Work: 2095 SF TOWNHOUSE WITH 400 SF GARAGE AND 569 SF WORK SPACE WITH Sub-Type:
Address: 216 S SAN DIMAS AVENUE City 10: SAND Status:
# Unlts: Class: 101 Value: $282,493.54 Total Fees:
Names: SQ Ft: 6297 Balance Due:
GROVE STAT ION LLC
WILLIAM FOX HOMES INC
WILLIAM FOX HOMES INC
·-----·-------------~---
OWNER
APPLICANT 909-3.73-8133
CONTRACTOR 909·373-8133
Permit If 80814880 Applied: 05/19/2008 Issued: 07/24/2008 Final: Type:
Work: 1524 SF TOWNHOUSE WITH 400 SF GARAGE WITH ELECT, PLUMB, MECH AND Sub-Type:
Address: 228 S SAN DIMAS AVENUE City ID: SAND Status:
#Units: 1 Class: 101 Value: $163,491.16 Total Fees:
Names: SQ Ft: 3448 Balance Due:
COMBO
SNEW
ISSUED
$5,734.45
$0.00
COMBO
SNEW
ISSUED
$3,906.78
$0.00 --··---------·-------------··-------- ----··-----WILLIAM FOX HOMES INC
WILLIAM FOX HOMES INC
GROVE STATION LLC
CONTRACTOR 909-373-8133
APPLICANT
OWNER
909-373-8133
Permit# B0814881 Applied: 05/19/2008 Issued: 07/24/2008 Final: Type:
Work: 1541 SF TOWNHOUSE WITH 400 SF GARAGE WlTH ELECT, PLUMB, MECH AND Sub-Type:
Address: 234 S SAN DIMAS AVENUE City 10: SAND Status:
#Units: 1 Class: 101 Value: $165,150.19 Total Fees:
Names: SQ Ft: 3482 Balance Due:
GROVE STATION LLC
WILLIAM FOX HOMES INC
WILLIAM FOX HOMES INC
OWNER
APPLICANT 909-373-8133
CONTRACTOR 909·373-8133
Permit# 80814882 Applied: 05/19/2008 Issued: 07/24/2008 Final: Type:
Work: 1515 SF TOWNHOUSE WITH 400 SF GARAGE WITH ELECT, MECH, PLUMB AND Sub-Type:
Address: 264 S SAN DIMAS AVENUE City ID: SAND Status:
#Units: 1 Class: 101 Value: $162,612.85 Total Fees:
Names: SQ Ft 3430 Balance Due:
WILLIAM FOX HOMES INC
GROVE STATION LLC
WILLIAM FOX HOMES INC
CONTRACTOR 909-373-8133
OWNER
APPLICANT 909-373-8133
Permit# 80814883 Applied: 05/19/2008 Issued: 07/24/2008 Final: Type:
Work: 2063 SF TOWNHOUSE WITH 400 SF GARAGE WITH ELECT, MECH, PLUMB AND Sub-Type:
Address: 270 S SAN DIMAS AVENUE City 10: SAND Status:
If Units: 1 Class: 101 Value: $216,092.17 Total Fees:
Names: SQ Ft: 4526 Balance Due:
GROVE STATION LLC
WILLIAM FOX HOMES INC
WILLIAM FOX HOMES INC
OWNER
CONTRACTOR 909-373-8133
APPLICANT 909-373-8133
Permit# 80814884 Applied: 05/19/2008 Issued: 07/24/2008 Final: Type:
Work: 1517 SF TOWNHOUSE WITH 400 SF GARAGE WITH ELECT, MECH, P-LUMB AND Sub-Type:
Address: 354 S SAN DIMAS AVENUE City ID: SAND Status:
#Units: 1 Class: 101 Value: $162,808.03 Total Fees:
Names: SQ Ft 3434 Balance Due: ·-·-------------
WILLIAM FOX HOMES INC CONTRACTOR 909-373-8133
Tuesday, December 13, 2011 10:51:03 AM
COMBO
SNEW
ISSUED
$3,932.04
$0.00
COMBO
SNEW
ISSUED
$3,894.13
$0.00
COMBO
SNEW
ISSUED
$4,721.06
$0.00
COMBO
SNEW
ISSUED
$3,928.15
$0.00
Page 4 of 13
I
(
I
I
I
I
334

WILLIAM FOX HOMES INC
GROVE STATION LLC
APPLICANT
OWNER
909-373-8133
Permit# 80814865 Applied: 05/19/2006 Issued: 07/24/2006 Final: Type:
Work: 1523 SF TOWNHOUSE WITH 400 SF GARAGE WITH ELECT, MECH, PLUMB AND Sub-Type:
Address: 328 S SAN DIMAS AVENUE City ID: SAND Status:
#Units: 1 Class: 101 Value: $163,393.57 Total Fees:
Names: SQ Ft: 3446 Balance Due:
COMBO
SNEW
ISSUED
$3,940.77
$0.00 -------------------------------------
WILLIAM FOX HOMES INC
WILLIAM FOX HOMES INC
GROVE STATION LLC
CONTRACTOR 909-373·8133
APPLICANT
OWNER
909-373-8133
Permit# B0814886 Applied: 05/19/2008 Issued: 07/31/2008 Final: Type:
Work: 1524 SF TOWNHOUSE WITH 400 SF GARAGE WITH ELECT, MECH, PLUMB AND Sub-Type:
Address: 334 S SAN DIMAS AVENUE City ID: SAND Status:
#Units: 1 Class: 101 Value: $163,49'1.16 Total Fees:
Names: SQ Ft: 3448 Balance Due:
GROVE STATION LLC
WILLIAM FOX HOMES INC
WILLIAM FOX HOMES INC
OWNER
APPLICANT 909-373-8133
CONTRACTOR 909·373·8133
Permit# 80814972 Applied: 06/06/2008 Issued: 07/31/2008 Final: Type:
Work: NEW 5960 SF CUSTOM HOME WITH 700 SF GARAGE, 200 SF SOLID PORCH, 60 Sub-Type:
Address: 1562 CALLE CRISTINA City ID: SAND Status:
#Units: 1 Class: 101 Value: $612,877.40 Total Fees:
Names: SQ Ft: 8060 Balance Due:
KARIMI SEYED J
AGOP KHANJIAN -DESIGNER
OWNER
APPLICANT 626-577-5003
Permit# B0815043 Applied: 07/02/2008 Issued: 09/09/2008 Final: Type:
Work: 4419 SF CUSTOM HOME WITH 768 SF GARAGE, 132 SF PORCH, 162 SF BALCO Sub-Type:
Address: 125 PUDDINGSTONE DRIVE City 10: SAND Status:
#Units: 1 Class: 101 Value: $456,194.69 Total Fees:
Names: SQ Ft: 5753 Balance Due:
POM-L INC
OTIS LACY COMPANY
OTIS LACY COMPANY
OWNER
APPLICANT 909-599-6878
CONTRACTOR 909·599-6878
Permit# 80815044 Applied: 07/02/2008 Issued: 07/09/2008 Final: Type:
Work: 3911 SF CUSTOM HOME WITH 720 SF GARAGE, 182 SF BALCONIES (QTY 3) WI Sub-Type:
Address: 121 PUDDINGSTONE DRIVE City ID: SAND Status:
II Units: 1 Class: 101 Value: $401,266.09 Total Fees:
Names: SQ Ft: 4813 Balance Due:
OTIS LACY COMPANY
OTIS LACY COMPANY
POM-L INC
APPLICANT 909-599-6878
CONTRACTOR 909-599-6878
OWNER
Permit# 80615045 Applied: 07/02/2008 Issued: 09/09/2008 Final: Type:
Work: 4016 SF CUSTOM HOME WITH 823 SF GARAGE, 3 PATIOS FOR A TOTAL OF 46 Sub-Type:
Address: 129 PUDDINGSTONE DRIVE City 10: SAND Status:
#Units: 1 Class: 101 Value: $425,763.77 Total Fees:
Names: SQ Ft: 5753 Balance Due: -------------------------------··--·----·-·-------
Tuesday, December 13, 2011 10:51:03 AM
COMBO
SNEW
ISSUED
$3,940.78
$0.00
COMBO
SNEW
EXPIRED
$6,386.80
$0.00
COMBO
SNEW
EXPIRED
$5,177.94
$0.00
COMBO
SNEW
EXPIRED
$4,766.12
$0.00
COMBO
SNEW
EXPIRED
$4,907.13
$0.00
Page 5 of 13
I
I
l
f
335
POM-L INC OWNER
OTIS LACY COMPANY
OTIS LACY COMPANY
APPLICANT 909-599-6878
CONTRACTOR 909-599-6878
Permit# 80815048 Applied: 07/03/2008 Issued: 07/03/2008 Final: Type:
Work: 2381 SF HOME WITH 635 SF GARAGE, 259 SF PORCH WITH ELECT, MECH, PL Sub-Type:
Address: 182 W ALLEN AVENUE City ID: SAND Status:
#Units: 1 Class: 101 Value: $252,976.04 Total Fees:
Names: SQ Ft: 3275 Balance Due: ----------------·-----KRIST! GRABOW PLANNER
RAMIREZ, JACK & MARY H. OWNER
RAMIREZ, JACK & MARY H. APPLICANT
' b. Permit # 80815204 Applied: 09/03/2008 Issued: 09/03/2008 Final: Type:
~~Work: DEMO EXISTING 1644 SF HOUSE, BUILD NEW 2868 SF HOUSE WITH 461 SF GA Sub-Type:
~ ~ Address: 1206 STONEHENGE DRIVE City ID: SAND Status:
Q _ ~ # Units: 1 Class: 434 Value: $290,070.83 Total Fees:
~J Names: SOFt: 3377 Balance Due:
~ Q_)J MEEKER, MI~ES H. ---· OWNER
~ ALLEN SMITH -ARCHITECT APPLICANT 909-466-0152
Permit# B0915473 Applied: 01/12/2009 Issued: 06/03/2009 Final: Type:
Work: 5878 SF CUSTOM HOME WITH 827 SF ATTACHED GARAGE AND 54 SF PORCH ( Sub-Type:
Address: 619 W GHENT STREET City ID: SAND Status:
#Units: 1 Class: 101 Value: $589,577.79 Total Fees:
Names: SO Ft: 6759 Balance Due:
MARTINEZ DOMINGO & ANGELICA
MARTINEZ DOMINGO & ANGELICA
APPLICANT
OWNER
626-625-9480
626-625-9480
Permit# 80915518 Applied: 02/03/2009 Issued: 08/21/2009 Final: Type:
Work: NEW 4,764 SF CUSTOM HOME WITH 671 SF GARAGE, 283 SF PATIO, 70 SF PO Sub-Type:
Address: 1416 MANCHESTER ROAD City ID: SAND Status:
11 Units: 1 Class: 101 Value: $488,800.47 Total Fees:
Names:
ADRAGNA PAUL
ADRAGNA PAUL
SOFt: 6183
APPLICANT
OWNER
Balance Due:
626-664-3514
Permit# 80915588 Applied: 03/17/2009 Issued: 04/09/2009 Final: Type:
Work: 2853 SF CUSTOM HOME WITH 570 SF GARAGE, 68 SF PORCH AND 207 SF SOL Sub-Type:
Address: 1623 N SAN DIMAS CANYON ROAD City 10: SAND Status:
#Units: 1 Class: 101 Value: $295,620.17 Total Fees:
Names: SQ Ft: 3698 Balance Due:
STEVE EIDE
MOSALLAIE AND KASSAI
APPLICANT
OWNER
BADE CONSTRUCTION CO INC CONTRACTOR 626-574-7354
Permit# 80915788 Applied: 06/03/2009 Issued: 06/03/2009 Final: Type:
Work: 1000 SF DETACHED GARAGE WITH ELECTRICAL AND 2 HOSE BIBBS Sub-Type:
Address: 619 W GHENT STREET City 10: SAND Status:
#Units: 1 Class: 101 Value: $36,910.00 Total Fees:
Names: SO Ft: 1000 Balance Due: ----------
MARTINEZ, DOMINGO OWNER 626-625-9480
Tuesday, December 13,2011 10:51:03 AM
COMBO
SNEW
WITHDRWN
$3,356.70
$0.00
COMBO
SNEW
ISSUED
$6,499.79
$0.00
COMBO
SNEW
ISSUED
$10,878.21
$0.00
COMBO
SNEW
ISSUED
$5,276.91
$0.00
COMBO
SNEW
EXPIRED
$3,809.66
$0.00
COMBO
SNEW
ISSUED
$1,359.86
$0.00
Page 6 of 13
I
I
I
336
MARTINEZ, DOMINGO APPLICANT 626-625-9480
~/Work: 4625 SF DETACHED GARAGE WITH 1099 SF LIVING AREA, 477 SF DECK AND 2 Sub-Type: A Permit# 80916091 Applied: 10/09/2009 Issued: 01/07/2010 Final: Type:
~Address: 1539 CALLE CRISTINA City ID: SAND Status:
~ #Units: 1 Class: 101 Value: $287,825.26 Total Fees:
~ Names:·-·--- SO Ft: 6451 Balance Due:
1539 CALLE CRISTINA LLC
1539 CALLE CRISTINA LLC
APPLICANT
OWNER
Permit# 80916123 Applied: 10/27/2009 Issued: 12/17/2009 Final: Type:
Work: 3801 SF CUSTOM HOME WITH 1404 SF GARAGE, 201 SF STORAGE NEXT TOG Sub-Type:
Address: 1025 VIA ROMALES
#Units: 1 Class: 101
Names: SO Ft: 4703 -----------------------· LIANG CLARK
LIANG CLARK
CityiD: SAND Status: Value: $329,168.54 Total Fees:
Balance Due: ·----------------
APPLICANT
OWNER
COMBO
SNEW
ISSUED
$3,331.63
$0.00
COMBO
SNEW
ISSUED
$4,158.82
$0.00
\. Permit# 80916261 Applied: 12/28/2009 Issued: 02/26/2010 Final: 08/31/2010 Type: COMBO
'~,(}- Work: DEMO EXISTING HOUSE, BUILD NEW 1969 SF SINGLE STORY HOUSE WITH 11 Sub-Type: SNEW
-....,.,~ Addr~ss: 412 W FIFTH STREET City ID: SAND Status: FINALED
\)' ~~ :a~~~; -~--------1~~~; ~~~9 -------~alue: --~-~-~205.31 Ba::~:~:~::; ____ $4,4:~:~~-r... .. ~ ~ THE CHANGTON ENTERPRISE INC CONTRACTOR 626-446-2068 CELL 626-203-743
\(:7" ~ROYAL 5TH LLC OWNER
~ THE CHANGTON ENTERPRISE INC APPLICANT 626-446-2068 CELL626-203-743
Permit# B0916262 Applied: 12/28/2009 Issued: 02/26/2010 Final: 08/31/2010 Type:
Work: 400 SF DETACHED GARAGE. Temp. Power Pole. Plumbing, Electical, Mechanic Sub-Type:
Address: 412 W FIFTH STREET City ID: SAND Status:
#Units: 1
Names:
Class: 101
SOFt: 422
Value: $15,576.02 Total Fees:
Balance Due:
COMBO
SNEW
FINALED
$707.78
$0.00 ----·-·-----
WATANABE, M!OKO
THE CHANGTON ENTERPRISE INC
THE CHANGTON ENTERPRISE INC
OWNER
APPLICANT 626-446·2068
CONTRACTOR 626·446·2068
Permit# B1016268 Applied: 01/05/2010 Issued: 03/30/2010 Final: Type: COMBO
Work: REBUILD 3100 SF HOUSE (COMPLETE GUT AND REMODEL OF EXISTINGING 1 Sub-Type: SNEW
.... Address: 745 N WALNUT AVENUE City ID: SAND Status: ISSUED
~;~ ~~·~:: 1 .. ... ..... .... ~~; :~ _ . _v••• $329:5:7·o:8.~:;'~:_ .. ~'·'~::: -y.._ VANVALKENBURG OWNER
FOOTHILL CONSTRUCTION CO APPLICANT 626·335-7373
FOOTHILL CONSTRUCTION CO CONTRACTOR 626-335-7373
MARCO ESPINOZA PLANNER
\ Permit II B1016292 Applied: 01/14/2010 Issued: 12/03/2010 Final: Type: COMBO
'0 Work: DEMO AN OLDER EXISTING DWELLING, AND CONSTRUCT A NEW, ONE STOR Sub-Type: SNEW
J'. Q Address: 744 OAKWAY AVENUE City 10: SAND Status: EXPIRED
~;" ~ lf :a~:~: 1
---------- ~~~~~;~-·-----------···- V~~~~-·----~~~~,320.86~~~:~~1eF;::: _ :~:~::::~ ~~ DAVIDBLODGETT
Tuesday, December 13, 2011 10:51:03 AM
OWNER 951-453-967 4
Page 7 of 13
l
337

DAVID BLODGETT APPLICANT
Permit II 81016554 Applied: 04/30/2010 Issued: 05/05/2010 Final:
Work: REISSUE PERMIT 80814876 FOR NEW LIVE/WORK UNIT
Address: 316 S SAN DIMAS AVENUE City ID:
#Units: 1
Names:
Class: 101
SOFt: 0
Value:
APPLICANT
OWNER
951-453-9674
Type:
Sub-Type:
SAND Status:
$0.00 Total Fees:
Balance Due:
(951 )684-6602 SIGNATURE INTERIORS
GROVE STATION LLC
SIGNATURE INTERIORS CONTRACTOR (951 )684-6602
Permit# 81016555 Applied: 04/30/2010 Issued: 05/05/2010 Final:
Work: REISSUE PERMIT B0814885 FOR LIVE UNIT ONLY
Address: 328 S SAN DIMAS AVENUE City ID:
II Units: 1
Names:
Class: 101
SOFt: 0
Value:
·-----------·---------------·----OWNER
Type:
Sub-Type:
SAND Status:
$0.00 Total Fees:
Balance Due:
GROVE STATION LLC
SIGNATURE INTERIORS
SIGNATUF1E INTERIORS CONTRACTOR (951)684-6602
APPLICANT (951)684-6602
Permit # 81016556 Applied: 04/301201 0 Issued: 05/05/2010 Final:
Work: REISSUE PERMIT 80814886 FOR LIVE UNIT
Address: 334 S SAN DIMAS AVENUE City ID: #Units: 1
Names:
Class: 101
SQ Ft: 0
Value:
OWNER
APPLICANT
Type:
Sub-Type:
SAND Status:
$0.00 Total Fees:
Balance Due:
(951 )684-6602
GROVE STATION LLC
SIGNATURE INTERIORS
SIGNATURE INTERIORS CONTRACTOR (951 )684-6602
Permit# 81016557 Applied: 04/30/2010 Issued: 05/05/2010 Final:
Work: REISSUE PERMIT 80814874 FOR LIVE/WORK UNIT
Address: 346 S SAN DIMAS AVENUE City 10: #Units: 1
Names:
Class: 101
SQ Ft: 0
Value:
OWNER
Type:
Sub-Type:
SAND Status:
$0.00 Total Fees:
Balance Due:
GROVE STATION LLC
SIGNATURE INTERIORS
SIGNATURE INTERIORS
APPLICANT (951)684-6602
CONTRACTOR (951 )684-6602
Permit# 81016558 Applied: 04/30/2010 Issued: 05/05/2010 Final:
Work: REISSUE PERMIT 80814884 FOR LIVE UNIT ONLY
Address: 354 S SAN DIMAS AVENUE City ID:
#Units: 1
Names:
Class: 102
SQ Ft: 0
Value:
OWNER
APPLICANT
Type:
Sub-Type:
SAND Status:
$0.00 Total Fees:
Balance Due:
(951 )684-6602
GROVE STATION LLC
SIGNATURE INTERIORS
SIGNATURE INTERIORS CONTRACTOR (951)684-6602
Permit# 81016559 Applied: 04/30/2010 Issued: 05/05/2010 Final:
Work: REISSUE PERMIT 80614875 FOR LIVE/WORK UNIT
Address: 364 S SAN DIMAS AVENUE City ID:
#Units: 1
Names:
Class: 102
SOFt: 0 ---·--------------
Tuesday, December 13,2011 10:51:04 AM
Value:
Type:
Sub-Type:
SAND Status:
$0.00 Total Fees:
Balance Due:
COMBO
SNEW
ISSUED
$567.60
$0.00 -------
COMBO
SNEW
ISSUED
$397.68
$0.00
COMBO
SNEW
ISSUED
$397.66
$0.00
COMBO
SNEW
ISSUED
$549.43
$0.00
COMBO
SNEW
ISSUED
$396.65
$0.00
COMBO
SNEW
ISSUED
$552.55
$0.00
Page 8 of 13
338
SIGNATURE INTERIORS
SIGNATURE INTERIORS
GROVE STAT ION LLC
APPLICANT (951)684-6602
CONTRACTOR (951)684-6602
OWNER
Permit# 81016560 Applied: 04/30/2010 Issued: 05/05/2010 Final: Type:
Work: REISSUE PERMIT 80814879 FOR LIVE/WORK UNIT Sub-Type:
Address: 216 S SAN DIMAS AVENUE City ID: SAND Status:
$0.00 Total Fees: #Units: 1 Class: 102 Value:
Names: SO Ft: o
SIGNATURE INTERIORS
SIGNATURE INTERIORS
GROVE STATION LLC
Balance Due:
APPLICANT (951)684-6602
CONTRACTOR (951)684-6602
OWNER
Permit# 81016561 Applied: 04/30/2010 Issued: 05/05/2010 Final: Type:
Work: REISSUE PERMIT 80814880 FOR LIVE UNIT ONLY Sub-Type:
Address: 228 S SAN DIMAS AVENUE City ID: SAND Status:
$0.00 Total Fees: #Units: 1
Names:
GROVE STATION LLC
SIGNATURE INTERIORS
SIGNATURE INTERIORS
Class: 102
SOFt: 0
Value:
Balance Due:
OWNER
APPLICANT (951)684-6602
CONTRACTOR (951)684-6602
Permit# 81016562 Applied: 04/30/2010 Issued: 05/05/2010 Final: Type:
Work: REISSUE PERMIT 80814881 FOR LIVE UNIT ONLY Sub-Type:
Address: 234 S SAN DIMAS AVENUE City ID: SAND Status:
$0.00 Total Fees: #Units: 1
Names:
GROVE STATION LLC
SIGNATURE INTERIORS
SIGNATURE INTERIORS
Class: 102
SOFt 0
Value:
Balance Due:
OWNER
APPLICANT (951)684-6602
CONTRACTOR (951 )684-6602
Permit# 81016563 Applied: 04/30/2010 Issued: 05/05/2010 Final: Type:
Work: REISSUE PERMIT 80814878 FOR LIVE/WORK UNIT Sub-Type:
Address: 246 S SAN DIMAS AVENUE City ID: SAND Status:
$0.00 Total Fees: #Units:
Names:
GROVE STAT ION LLC
SIGNATURE INTERIORS
SIGNATURE INTERIORS
Class: 102
SOFt: 0
Value:
Balance Due:
OWNER
APPLICANT (951)684-6602
CONTRACTOR (951 )684-6602
Permit# 81016564 Applied: 04/30/2010 Issued: 05/05/2010 Final: Type:
Work: REISSUE PERMIT 80814877 FOR LIVE/WORK UNIT Sub-Type:
Address: 252 S SAN DIMAS AVENUE City ID: SAND Status:
$0.00 Total Fees: #Units: 1
Names:
SIGNATURE INTERIORS
SIGNATURE INTERIORS
GOVE STAT ION LLC
Class: 102
SOFt 0
Tuesday, December 13,201110:51:04 AM
Value:
Balance Due:
APPLICANT (951)684-6602
CONTRACTOR (951 )684-6602
OWNER
COMBO
SNEW
ISSUED
$924.15
$0.00
COMBO
SNEW
ISSUED
$636.91
$0.00
COMBO
SNEW
ISSUED
$640.37
$0.00
COMBO
SNEW
ISSUED
$954.60
$0.00
COMBO
SNEW
ISSUED
$935.52
$0.00
Page 9 of 13
339

Permit# B1016565 Applied: 04/30/2010 Issued: 05/05/2010 Final:
Work: REISSUE PERMIT B0814882 FOR LIVE UNIT
Address: 264 S SAN DIMAS AVENUE City ID: # Units: 1
Names:
Class: 102
SQ Ft: 0
Value:
Type:
Sub-Type:
SAND Status:
$0.00 Total Fees:
Balance Due:
SIGNATURE INTERIORS
SIGNATURE INTERIORS
GROVE STATION LLC
APPLICANT (951)684-6602
CONTRACTOR (951 )684-6602
OWNER
Permit# B1016566 Applied: 04/30/2010 Issued: 05/05/2010 Final:
Work: REISSUE PERMIT 80814883 FOR LIVE UNIT ONLY
Address: 270 S SAN DIMAS AVENUE City ID:
#Units:
Names:
Class: 102
SOFt: 0
Value:
Type:
Sub-Type:
SAND Status:
$0.00 Total Fees:
Balance Due: ·--------·---- ·------------------··----------
OWNER
APPLICANT (951 )684-6602
GOVE STATION LLC
SIGNATURE INTERIORS
SIGNATURE INTERIORS CONTRACTOR (951)684-6602
Permit# 81016567 Applied: 04/30/2010 Issued: 05/05/2010 Final:
Work: REISSUE PERMIT 80814870 FOR LIVE/WORK UNIT
Address: 284 S SAN DIMAS AVENUE City ID: #Units: 1
Names:
Class: 102
SQ Ft: 0
Value:
OWNER
APPLICANT
Type:
Sub-Type:
SAND Status:
$0.00 Total Fees:
Balance Due:
(951 )684-6602
GROVE STAT ION LLC
SIGNATURE INTERIORS
SIGNATURE INTERIORS CONTRACTOR (951)684-6602
Permit# B1016594 Applied: 05/11/2010
Work: 624 SF DETACHED GARAGE
Address: 509 W FIFTH STREET
#Units: 1
Names:
SCHOURUP, JEREMY
SCHOURUP, JEREMY
Class: 101
SQ Ft: 624
Issued: 07/21/2010 Final:
City ID:
Value:
OWNER
APPLICANT
Type:
Sub-Type:
SAND Status:
$23,031.84 Total Fees:
Balance Due:
626-905-3938
626-905-3938
COMBO
SNEW
ISSUED
$635.17
$0.00
COMBO
SNEW
ISSUED
$764.91
$0.00
COMBO
SNEW
ISSUED
$1,137.31
$0.00
COMBO
SNEW
ISSUED
$1,002.45
$0.00
• 9,...Permit # B1017100 Applied: 12/03/2010 Issued: 12/03/2010 Final: Type: COMBO
r.JY Worl{: DEMO EXISTING HOUSE, BUILD NEW 1,930 SF RESIDENCE WITH 410 SF SOLI Sub-Type: SNEW
\.._
1
-f/..7 Address: 744 OAKWAY AVENUE City JD: SAND Status: ISSUED
\,ft." ~Units: 1 Class: 101 Value: $188,660.70 Total Fees: $2,706.16
?I :1' :::::~ITD~;;,D. . .. SOFt. 23.~ •. ··········•· -------;~~~;----- _ ---~~~~~~e-~~-~~------ ·····------!_0:~0 ..
\).0 BLODGETT DAVID APPLICANT
Permit# B1017101 Applied: 12/03/2010 Issued: 12/03/2010 Final:
Work: NEW 576 SF DETACHED GARAGE WITH ELECTRICAL
Address: 744 OAKWAY AVENUE City ID: #Units: 1
Names:
BLODGETT DAVID
BLODGETT DAVID
Class: 101
SQ Ft: 576
Tuesday, December i 3, 2011 10:51:05 AM
Value:
OWNER
APPLICANT
Type: COMBO Sub-Type: SNEW
SAND Status: ISSUED
$21,260.16 Total Fees: $502.82 Balance Due: $0.00
Page 10 of 13
_....--\
f
340

Permit# B1017102 Applied: 12/03/2010 Issued:
Work: BUILD NEW 3,000 SF DETACHED RV GARAGE
Address: 744 OAKWAY AVENUE
#Units: 1
Names:
Class: 101
SOFt: 3000
12/03/2010 Final:
CityiD:
Value:
Type: COMBO
Sub-Type: SNEW
SAND Status: ISSUED
$110,730.00 Total Fees: $1,629.50
Balance Due: $0.00 --~----~----------
BLODGETT DAVID
BLODGETT DAVID
OWNER
APPLICANT
Permit# 81117524 Applied: 05/27/2011 Issued: 10/06/2011 Final: Type:
Work: NEW SFR (PLAN 330) 3,307 SF HABITAL AREA, 714 SF GARAGE AND 45 SF PO Sub-Type:
Address: .:lQ.O \.0 . ~~~ ('\(.. City ID: Status:
#Units:
Names:
CRESTWOOD CORPORATION
SAN DIMAS 6, LP
CRESTWOOD COMMUNITIES
Class: 101
SOFt: 4066
Value: $341,070.67 Total Fees:
Balance Due:
CONTRACTOR (626) 914-1943
OWNER
APPLICANT 626-914-1943
Permit# 81117525 Applied: 05/27/2011 Issued: 10/06/2011 Final: Type:
Work: NEW SFR (PLAN 350} i,543 HABITAL AREA, 744 SF GARAGE, 88 SF PORCH AN
Address: I (p6 A.\ ~o-f'o\ City ID:
Sub-Type:
Status:
#Units: 1 Class: 101 Value: $368,703.61 Total Fees:
Names: SO Ft: 4648
CRESTWOOD CORPORATION
CRESTWOOD COMMUNITIES
SAN DIMAS 6, LB
Balance Due:
CONTRACTOR (626) 914-1943
APPLICANT
OWNER
626-914-1943
Permit# B1117526 Applied: 05/27/2011 Issued: 10/06/2011 Final: Type:
Work: NEW SFR (PLAN 380) 3,816 SF HABITABLE AREA, 744 SF GARAGE, 88 SF POR Sub-Type:
Address: IO"'lS N. (A...'\At"~ City ID: Status: It Units: 1 Class: 101 Value: $391,086.88 Total Fees:
Names: SQ Ft: 4648 Balance Due: --- -------------·---------------------
CRESTWOOD CORPORATION
CRESTWOOD COMMUNITIES
SAN DIMAS 6,LP
CONTRACTOR (626) 914-1943
APPLICANT 626-914-1943
OWNER
Permit# 81117775 Applied: 08/09/2011 Issued: 12/02/2011 Final: Type:
Work: 1636 SF HOUSE, 82 SF PORCH WITH ELECT, PLUMB, MECH AND SEWER Sub-Type:
Address: 136 OBERG STREET
fl Units: 1
Names:
LAPLACA GAETANO
LAPLACA GAETANO
Class: 101
SOFt: 2294
CityiD·. SAND Status:
Value: $177,729.80 Total Fees:
APPLICANT
OWNER
Balance Due:
,,
Permit fl 81117788 Applied: 08/10/2.011 Issued: 11/30/2011 Final: Type:
Work: 322 SF ADDTION
Addre\s: 1645 YORK RE COURT
PADILLA, D IE & LOURDES
EAGLE CREEK CONTRACTORS
EAGLE CREEK CONTRACTORS
Tuesday, December 13, 2011 10:51:05 AM
Sub-Type:
OWNER
APPLICANT 626-246-8493
CONTRACTOR 626-246-8493
COMBO
SNEW
ISSUED
$6,733.27
$0.00
COMBO
SNEW
ISSUED
$7,190.83
$0.00
COMBO
SNEW
ISSUED
$7,442.43
$0.00
COMBO
SNEW
ISSUED
$4,353.34
$0.00
COMBO
SNEW
ISSUED
Page 11 of 13
(
(
t
(
/ j
341
Permit# 81117888 Applied: 09/29/2011 Issued: 10/06/2011 Final: Type:
Work: NEW SFR (PLAN 330) 3,307 SF HABITAL AREA, 714 SF GARAGE AND 45 SF PO Sub-Type:
Address: 230 W BASELINE ROAD City ID: SAND Status:
#Units: 1
Names:
Class: 101
SQ Ft: 4066
Value: $341,070.67 Total Fees:
Balance Due:
CRESTWOOD CORPORATION
CRESTWOOD CORPORATION
SAN DIMAS 6 LP
CONTRACTOR (626) 914·1943
APPLICANT
OWNER
(626) 914-1943
Permit # 81117869 Applied: 09!29/2011 Issued: 10/06/2011 Final: Type:
Work: NEW SFR (PLAN 330) 3,307 SF HABJTAL AREA, 714 SF GARAGE AND 45 SF PO Sub-Type:
Address: 1055 N CATARACT AVENUE City ID: SAND Status:
#Units: Class: 101 Value: $341,070.67 Total Fees:
Names: SQ Ft: 4066 Balance Due:
APPLICANT
OWNER
(626) 914-1943 CRESTWOOD CORPORATION
SAN DIMAS 6 LP
CRESTWOOD CORPORATION CONTRACTOR (626) 914-1943
Permit# 81117890 Applied: 09/29/2011 Issued: 10/06/2011 Final: Type:
Work: NEW SFR (PLAN 350) 3,543 HABITAL AREA, 744 SF GARAGE, 88 SF PORCH AN Sub-Type:
Address: 1035 N CATARACT AVENUE City ID: SAND Status:
#Units: 1 Class: 101 Value: $368,703.61 Total Fees:
Names: SQ Ft: 4648 Balance Due:
APPLICANT
OWNER
(626) 914-1943 CRESTWOOD CORPORATION
SAN DIMAS 6 LP
CRESTWOOD CORPORATION CONTRACTOR (626) 914-1943
Permit # 81117991 Applied: 11/08/2011 Issued: 12/06/2011 Final:
Work: REACTIVATE PERMIT 80815044 FOR A NEW CUSTOM HOME
Address: 121 PUDDINGSTONE DRlVE CitylD:
#Units: 1 Class: 101 Value:
Names: SQ Ft: 0
Type:
Sub-Type:
SAND Status:
$0.00 Total Fees:
Balance Due:
OTIS LACY COMPANY
POM-L
CONTRACTOR 909·599-6878
OWNER
OTIS LACY COMPANY APPLICANT
Permit il 81117992 Applied: 11/08/2011 Issued: 12/06/2011 Final:
Work: REACTIVATE PERMIT 80815043 FOR NEW CUSTOM HOME
Address: 125 PUDDINGSTONE DRIVE City ID:
#Units: 1 Class: 101 Value:
Names: SQ Ft: o
POM-L OWNER
909-599-6878
Type:
Sub-Type:
SAND Status:
$0.00 Total Fees:
Balance Due:
OTIS LACY COMPANY
OTIS LACY COMPANY
CONTRACTOR 909-599-6878
APPLICANT
Permit # 81117993 Applied: 1 i/08/2011 Issued: 12/06/2011 Final:
Work: REACTIVATE PERMIT 80815045 FOR NEW CUSTOM HOME
Address: 129 PUDDINGSTONE DRIVE City 10: #Units: 1
Names:
Class: 101
SOFt: o Value:
909·599-6878
Type:
Sub-Type:
SAND Status:
$0.00 Total Fees:
Balance Due:
OTIS LACY COMPANY CONTRACTOR 909-599-6878
Tuesday, December 13, 2011 10:51:06 AM
COMBO
SNEW
ISSUED
$5,214.98
$0.00
COMBO
SNEW
ISSUED
$5,214.98
$0.00
COMBO
SNEW
ISSUED
$5,476.96
$0.00
COMBO
SNEW
ISSUED
$952.96
$0.00
COMBO
SNEW
ISSUED
$1,032.75
$0.00
COMBO
SNEW
ISSUED
$980.03
$0.00
Page 12 of 13
I
f
J 342
POM-L
OTIS LACY COMPANY
OWNER
APPLICANT 909-599-6878
Permit# B1118047 Applied: 12/01/2011 Issued: 12/02/2011 Final: Type:
Work: 576 SF DETACHED GARAGE WITH ELECTRICAL ONLY, MAIN PANEL ON DETA Sub-Type:
Address: 136 OBERG STREET City 10: SAND Status:
#Units:
Names:
Class: 101
SQ Ft: 576
LA PLACA CONSTRUCTION INC
LA PLACA CONSTRUCTION INC
LA PLACA CONSTRUCTION INC
Summary
Tuesday, December 13,2011 10:51:06 AM
Number of Permits:
Total Valuation:
Total SQ. Ft:
Total Fees:
Total Due:
Value: $21,260.16 Total Fees:
Balance Due:
CONTRACTOR 626·357-7777
APPLICANT
OWNER
626·357. 7777
626-357-7777
70
$14,530,357.76
220,773.00
$242,409.51
$2,866.42
COMBO
SNEW
ISSUED
$555.82
$0.00
Page 13 of 13
J
343

344

Affordable Apa1tment Search California
Results
The follow1ng properties meet your search c riteria:
City: SAN DIMAS State: CALIFORNIA Type: FAMILY
0 Newsearch
Contact
G & K Manag.:.ment C".o,. Inc. Phone: 909 !592 3609 [email protected]
Eugene Burger ManOig<:!ment Corporatoon Phone: 909 599·3412 [email protected]
C Newsearch
Found 2 entroes. dosplaytng records 1 • 2 of 2.
Property
VILLA SAt! DIMAS Family 249 S Acacoa St SAfl DIMAS. CA 91773·2961 Phone: 909 592•3609
VOORHIS VI LLAGE Famoly 505 N San Dimas Canyon Rd San Damas, CA 91773·2253 Phone: 909 599·3412
Number of bedrooms ..... X -' X
X X X X
345

346
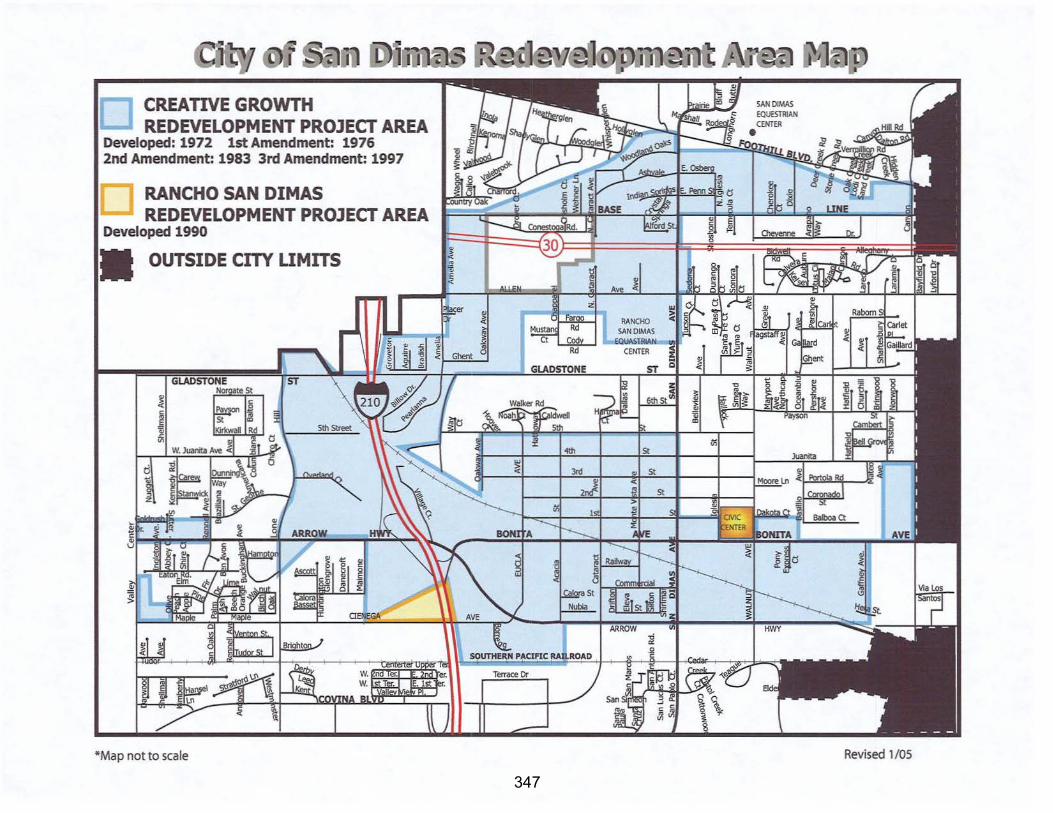
CREATIVE GROWTH REDEVELOPMENT PROJECT AREA
Developed: 1972 1st Amendment: 1976 2nd Amendment: 1983 3rd Amendment: 1997
RANCHO SAN DIMAS REDEVELOPMENT PROJECT AREA
Developed 1990
OUTSIDE CITY LIMITS
*Map not to scale Revised 1 /OS
347

348

CITY OF SAN DIMAS HU20: 0 HU35: 0
HU20: 17 HU35: 39
HU20: 2.82 HU35: 104
HU20: 22 HU35: 0
HU20: 27 HU35: 0
HU20: 180 HU35: 60
HU20: 0 HU35: 0
240020300 - SO Growth Areas
240030300 rZJ SO NON-Growth Areas
240030400 D GRIDCELL SAN DIMAS
240120200 MajorStreets
240130200 CJ CityBoundary
240131 100 - Open Space
240131101
~~~~~~2 240131200 ,We ong~ conSJOered 'il!ese sres as 0 These are S•tes tnat are w.tl'l., lhe :ReoeveiOOf'T'ent Area for :11e C•ty
.
potental 436 stes by 2020 ·Mill sne ne19 1 ~r Reoeve1oomen1 tunas ·Now W'l!n the aj$.$01V\n9 of :he Ag.ency .
HU20: 11 240370300 HU35: 0
• ~se SJ!es are a oeve<.opment un• f'tCY,I?'t '
~~~~~ ~ 240380200 HU20: 0 293000000 HU35: 3
~--- ---:-
N
w
s
.,..
. .........
HU20: 0 HU3S: 3
··-··
349

350

en <C :E - +-'
c c (/) <1> <( E ~ >. 0 0
z a. z E <(
<C w (/)
~ 0 _) (/) <1> +-' ro <1> <1> u
_J ro "0 <1> en m w ..... a. c 0
+-' (/) ::J ::Q (/) 0 ::J 0 ..... c m 0 0
~ ·ro <1> >. u. .c a. ~ (/) C) ~ 0 0
0 >
DO 0 1--0
--
I I I
z
( I I i .. I I
I I
J 1 I
: (
I
I i
• I t
>
\ 351

4.7 Appeal from the City of Dana Point
352

Agenda Item 4.7
DATE: July 12, 2012
TO: Regional Housing Needs Assessment (RHNA) Appeals Board
FROM: Ma’Ayn Johnson, Senior Regional Planner, (213) 236-1975, [email protected] Frank Wen, Manager, Research and Analysis, (213) 236-1854, [email protected]
SUBJECT: Appeal from the City of Dana Point
EXECUTIVE DIRECTOR’S APPROVAL:
RECOMMENDED ACTION (Please Select One):
APPROVE PARTIALLY APPROVE DENY
SUMMARY OF APPEAL: The City of Dana Point submits an appeal and requests a RHNA reduction for an unspecified amount of housing units based on their perspective of SCAG’s failure to determine the City’s share of the regional housing need in accordance with the adopted RHNA Methodology. Because of this factor, the City of Dana Point requests a reduction of an unspecified number of units from its Draft Allocation of 327 units. STRATEGIC PLAN: This item supports SCAG’s Strategic Plan; Goal 1: Improve Regional Decision Making by Providing Leadership and Consensus Building on Key Plans and Policies; Objective a: Create and facilitate a collaborative and cooperative environment to produce forward thinking regional plans. RATIONALE FOR RECOMMENDED ACTION: SCAG staff recommends that the RHNA Appeals Board deny the City’s appeal to reduce its Draft Allocation for several reasons. Per Government Code Section 65584.04(d)(2)(B), SCAG is not permitted to limit its consideration of suitable housing sites or land suitable for urban development to a jurisdiction’s existing zoning and land use policies and restrictions. SCAG also cannot consider current zoning or General Plans to justify a reduction in projected housing need. Moreover, per SCAG’s adopted RHNA Allocation Methodology, the household growth projections for the City of Dana Point were calculated using local input provided by the Center for Demographic Research (CDR) on behalf of the City for the Integrated Growth Forecast process. No indication has been provided that the City’s share of assigned housing need is inconsistent with the adopted RHNA Allocation Methodology. Thus, SCAG staff does not recommend a reduction based on this issue.
353

Agenda Item 4.7
BACKGROUND: The following is a chronology of the events related to Dana Point’s Draft RHNA Allocation to date:
1. On August 17, 2009, an initial letter was sent from SCAG to Mr. Kyle Butterwick, Community
Development Director, City of Dana Point, indicating the Draft household numbers would be provided at a later date. The following information for Dana Point was provided to the Center for Demographic Research (CDR) at California State University, Fullerton as the initial forecast for the city:
2008 Households 14,703 2020 Households 14,829 (126 increment from 2008) 2035 Households 15,122 (419 increment from 2008)
2. The initial input from the City of Dana Point was received through CDR on June 23, 2010 indicating
the following household numbers for the City:
2008 Households 14,587 2020 Households 15,236 (649 increment from 2008, an increase of 407 from SCAG’s initial
forecast) 2035 Households 15,565 (978 increment from 2008, an increase of 443 from SCAG’s initial
forecast)
3. On May 13, 2011, an email was sent from SCAG to Mr. Kyle Butterwick, Community Development Director, City of Dana Point, indicating that the growth forecast numbers were adjusted based on recently released data from the decennial Census and the California Employment Development Department. The associated table that was sent included information for all local jurisdictions in Orange County and indicated that the City of Dana Point’s Draft household forecast, which was adjusted as follows:
2008 Households 14,158 2020 Households 14,821 (663 increment from 2008, an increase of 14 households) 2035 Households 15,150 (992 increment from 2008, an increase of 14 households)
In addition, SCAG also provided other household information:
2010 Census (4/1/2010) 14,182 2011 DOF (1/1/2011) 14,188 2021 RHNA Projection Period (1/1/2014 - 10/1/2021) 14,846
4. On June 17, 2011, SCAG’s AB 2158 Survey and Housing Unit Demolition Survey were sent to the
City of Dana Point for their input. SCAG did not receive responses to the survey from the City.
5. On December 9, 2011, SCAG released the Draft RHNA Allocation Plan as part of the agenda for the RHNA Subcommittee meeting. The Draft Plan was recommended by the RHNA Subcommittee for further approval by the Community, Economic & Human Development Committee (CEHD) and the
Regional Council. The CEHD and the Regional Council reviewed and
354

Agenda Item 4.7
approved the Draft Allocation on February 2, 2012. The Draft RHNA Allocation for the City of Dana Point is 327.
6. On February 6, 2012, SCAG sent a letter to Mr. Douglas C. Chotkevys, City Manager, City of Dana Point, indicating the Draft RHNA Allocation for the City of Dana Point.
7. On March 8, 2012, Ms. Christy Teague, Manager of Economic Development, City of Dana Point, placed a phone call to SCAG stating that the City's Draft RHNA Allocation is too big and that the City is small. Ms. Teague asked for advice on the revision request process. Ma'Ayn Johnson, SCAG staff, explained to Ms. Teague that they need to prove that there is a planning factor or circumstance outside the City's control that would affect future household growth or accommodation for the growth. Ma’Ayn Johnson also explained that the household growth projections for all OCCOG cities were developed by CDR and submitted to SCAG.
8. On May 29, 2012, SCAG received a RHNA appeal from Mr. Kyle Butterwick, Community Development Director, City of Dana Point, based on their perspective of SCAG’s failure to determine the City’s share of the regional housing need in accordance with the adopted RHNA Methodology. The City requested a reduction an unspecified number of units from its Draft RHNA Allocation.
Summary Table
ANALYSIS: The City of Dana Point submits an appeal and requests a RHNA reduction for an unspecified amount of housing units based on their perspective of SCAG’s failure to determine the City’s share of the regional housing need in accordance with the adopted RHNA Methodology. RHNA Methodology [Govt. Code Section 65584.05(d)(1)] Issue: According to its appeal, the City argues that it is nearly completely built out with only a few remaining vacant parcels. In addition, its assigned housing need projection is unreasonable and unattainable,
which far exceeds the numbers assigned to adjacent South Orange County
City of Dana Point Source/Calculation Figure 2011 Households DOF 14,188 2020 Households Correspondence #4 14,821 2021 Households Interpolation 14,846 2011 to 2021 Projected Household Growth (10.75 years)
2021 Households – 2011 Households -or- = 14,846 - 14,188
658
2014 to 2021 Projected Household Growth (7.75 years)
(10.75 year growth/10.75 year period) x 7.75 year period -or- =(658/10.75) x 7.75
474
355
Agenda Item 4.7
cities with similar topography and size. Moreover, the City disagrees with its employment growth assignment and that it does not anticipate the significant demand for jobs or development potential in the future, which was provided by the City during the local input process. SCAG Staff Response: SCAG staff recommends that the RHNA Appeals Board deny the City’s request for a reduction of the assigned housing need for several reasons. First, per Government Code Section 65584.04(d)(2)(B), SCAG is not permitted to limit its consideration of suitable housing sites or land suitable for urban development to a jurisdiction’s existing zoning and land use policies and restrictions. State law requires that the consideration of the availability of land suitable for urban development must include other types of land use opportunities other than vacant land. The City can consider other opportunities for development. This includes the availability of underutilized land, opportunities for infill development and increased residential densities, or alternative zoning and density. Alternative development opportunities should be explored further and could possibly provide the land needed to zone for the City’s projected growth. Second, the purpose of the Regional Housing Needs Assessment is to identify the projected housing need for each individual jurisdiction. The process for developing future housing need is accomplished through a combination of the extensive local input and application of the observed data from established sources such as the 2010 Census and California Department of Finance. Due to the variation among jurisdictions such as local planning factors and other circumstances, assigned housing needs among different jurisdictions, even if similar in size, are difficult to compare. Third, per SCAG’s adopted RHNA Allocation Methodology, the household growth projections for the City of Dana Point were calculated using local input provided by CDR on behalf of the City from the Integrated Growth Forecast process. Employment data collected from this process was not used by SCAG for the purpose to directly calculate household growth projections. Moreover, the adopted regional Allocation Methodology examined existing and projected jobs-housing relationship at the jurisdictional and regional level. The resulting jobs-housing relationship from the Integrated Growth Forecast showed a stable or moderate improvement for SCAG region local jurisdictions throughout the planning horizon. There is no indication provided that the City’s share of assigned housing need is inconsistent with the adopted RHNA Allocation Methodology. Thus, SCAG staff does not recommend a reduction based on this basis of appeal. Other Considerations (Unmet Goals) Issue: In its appeal, the City states that it currently has unconstructed needs from the 1998-2005 [3rd] RHNA cycle. According to the City, these numbers are a challenging goal and the addition of its 5th RHNA cycle Allocation will make the total RHNA goals unrealistic and unattainable to achieve. SCAG Staff Response: With regard to unmet housing need, the Regional Housing Needs Assessment is not a building quota. Jurisdictions are required to plan and accommodate for future housing need through sites and zoning analysis, but they are not penalized if the building of these units do not occur. Additionally, as of July 2009, the City has a compliant 4th cycle housing element certified by the California Department of Housing and Community Development. State housing law requires jurisdictions to zone for unmet need
from the 4th cycle in addition to current need in cases where the jurisdiction did
356

Agenda Item 4.7
not complete the appropriate zoning or find suitable sites to accommodate its assigned RHNA Allocation, per Government Code Section 65584.09. However, it does not appear that this provision would apply to the City of Dana Point since its housing element has been certified. Thus, the City will only need to find suitable sites and zoning for its assigned 5th RHNA cycle need. In addition, it appears that the City of Dana Point may misinterpret that the 3rd, 4th and 5th RHNA cycle Allocation requirements will be combined in its next HCD site inventory review. Unused land use capacity from prior RHNA cycles may be re-used to address 5th cycle RHNA site inventory requirements as long as a jurisdiction such as the City of Dana Point has an HCD approved housing element. Only jurisdictions with uncertified housing elements are required to carry over and combine the deficit in their last RHNA cycle (4th cycle) site inventory with their 5th cycle RHNA Allocation’s site inventory responsibility. Gaps between the RHNA Allocation, i.e., the number of housing units to be zoned, and the number of housing units actually built are never carried over whether a jurisdiction has a certified or uncertified housing element. In short, the RHNA Allocation is not a building quota. FISCAL IMPACT: Work associated with this item is included in the current FY 12-13 General Fund Budget (13-800.0160.03: RHNA). ATTACHMENTS:
1. Appeal Application from the City of Dana Point 2. Supporting Documentation Provided by the City to Support Its Appeal
357

$0UTHERN CA.UTORNIA
Fifth Regional Housing Needs Assessment (RHNA) Cycle Appeal Request All appeal requests must be received by SCAG May 29, 2012, 5 p.m.·Late submissions will not.,.b;=e;:;a~cp;c~ep~t=e:-:d=. ==-=---
AssociATioN of 1 'O~CEJVED
GOVERNMENTS ~
Date: May 24, 2012 Jurisdiction: City of Dana Poin~yy 2 9 2012 County: Orange Subregion: 12 IRV. . Contact: Christy Teague Phone/Email: 949/248-3519 [email protected]
APPEAL AUTHORIZED BY: PLEASE CIRCLE BELOW:
Mayor Chief Administrative Officer City Manager
Name: ---------=K:.:.y"-=1-=e--==B:.=u:..:t'-'t"-'e~r=-=wick Chair of ~Community Development Director 949/248-3563 CountyBoard
BASES FOR APPEAL* org
)( RHNA Methodology
0 AB 2158 Factors (See Government Code Section 65584.04(d))
0 Existing or projected jobs-housing balance
0 Sewer or water infrastructure constraints for additional development
0 Availability of land suitable for urban development or for conversion to residential use
0 Lands protected from urban development under existing federal or state programs
0 County policies to preserve prime agricultural land
0 Distribution of household growth assumed for purposes of comparable Regional Transportation
Plans
0 Market demand for housing
0 County-city agreements to direct growth toward incorporated areas of County
0 Loss of units contained in assisted housing developments
0 High housing cost burdens
0 Housing needs offarmworkers
0 Housing needs generated by the presence of a university campus within a jurisdiction
0 Changed Circumstances
Brief Description of Appeal Request and Desired Outcome:
See Attached Description of Appeal Request and Outcome Request for Reduction of Housing Units for Dana Point in Fifth Regional Housing Needs Assessment Cycle based on RHNA Methodology.
list of Supporting Documentation, by Title and Number of Pages:
1.
2.
3.
Copy of CDR Annual Housing Element Progress Report
Copy of 2008 Feedback on per-Census Block Analysis, including appeal for job demand from residential jobs. Copy of County of Orange Cities' 2010 Census Summary
*Per Government Code Section 65584.05(d), appeals to the draft RHNA Allocation Plan can only be made by jurisdictions that have previously filed a revision request and do not accept the revision request findings made by SCAG, except for appeals based on RHNA methodology and changed circumstances.
FOR STAFF USE ONLY: Date. ________ _ Hearing Date:--------- Planner: _______ _
358
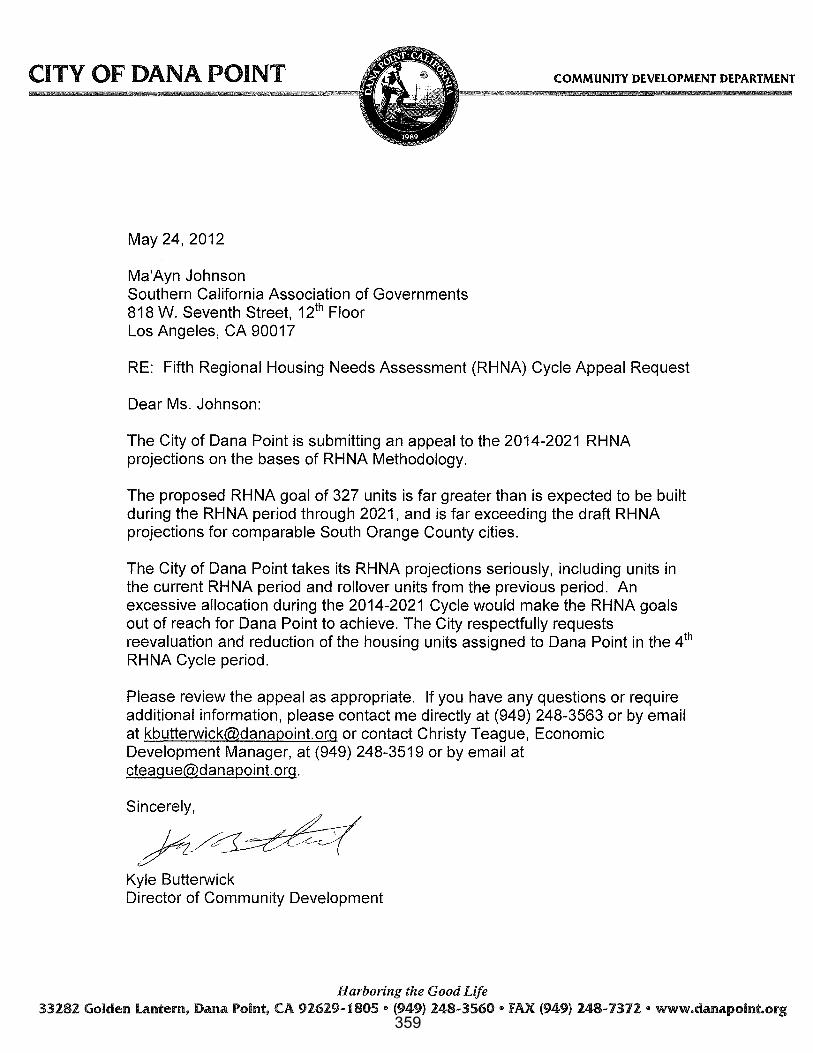
CITY OF DANA POINT
May 24, 2012
Ma'Ayn Johnson Southern California Association of Governments 818 W. Seventh Street, 1ih Floor Los Angeles, CA 90017
COMMUNITY DEVELOPMENT DEPARTMENT
RE: Fifth Regional Housing Needs Assessment (RHNA) Cycle Appeal Request
Dear Ms. Johnson:
The City of Dana Point is submitting an appeal to the 2014-2021 RHNA projections on the bases of RHNA Methodology.
The proposed RHNA goal of 327 units is far greater than is expected to be built during the RHNA period through 2021, and is far exceeding the draft RHNA projections for comparable South Orange County cities.
The City of Dana Point takes its RHNA projections seriously, including units in the current RHNA period and rollover units from the previous period. An excessive allocation during the 2014-2021 Cycle would make the RHNA goals out of reach for Dana Point to achieve. The City respectfully requests reevaluation and reduction of the housing units assigned to Dana Point in the 41
h
RHNA Cycle period.
Please review the appeal as appropriate. If you have any questions or require additional information, please contact me directly at (949) 248-3563 or by email at [email protected] or contact Christy Teague, Economic Development Manager, at (949) 248-3519 or by email at [email protected].
Sincerely, _
./z/~ Kyle Butterwick Director of Community Development
Harboring the Good Life 33281. Golden lcmtem, Dana Point, CA 91.61.9-1805 • (949) 248-3560" FAX (949) 248-7371. • www.danapoint.org
359
Fifth Regional Housing Needs Assessment (RHNA) Cycle Appeal Request
Description of Appeal
About the City of Dana Point Dana Point is a city of 6.7 square miles of mostly-sloping terrain along the coast. The City is known for its coastal bluffs, and the land generally slopes upward to the inland boundaries. The City is nearly completely built out, with only a few remaining vacant parcels, about a dozen of which are smaller, non-contiguous, one-half acre sites within the Town Center district. The exception is a 30-acre parcel owned by South Coast Water District designated for a desalination plant and other industrial-type uses adjacent to railroad tracks, on which a South Coast Water District resolution states housing is not an option. The Headlands subdivision of custom home sites and dedicated parkland includes about 30 completed or under-construction houses, with the remaining 85 lots to be purchased and/or constructed at some future time.
The current Draft RHNA projection for 2014-2021 in Dana Point is 327 units. This number is far greater than is possible during this time period. The last RHNA cycle goal was for 68 units, which was a realistic goal with the programs set forth in the Housing Element. The projection of 327 units is unreasonable and unattainable, and far exceeds the numbers assigned to adjacent South Orange County cities with similar topography, square miles of boundary areas, and number of housing units. Examples of comparable cities include Aliso Viejo (18,867 units and 7.5 square miles), Laguna Beach (12,923 units and 9 square miles}, Laguna Hills (11 ,046 units and 6.7 square miles) and Laguna Niguel (25,312 units and 14.8 square miles). All of these comparable cities have far fewer housing units assigned in the Draft 5th Cycle RHNA (39, 2, 2, 182 respectively).
The attached Annual Element Progress Reports indicate an average of 11 units have been constructed each year in Dana Point, including the houses built within the Headlands custom subdivision described above.
Census Data According to the 2010 Census, Dana Point includes 15,938 housing units. This was an increase of 256 units from the 2000 Census. The 2010 Census indicated that 1 ,756, or 11 %, of the housing units were vacant.
RHNA Allocation Methodology The City spent considerable time during each of three stages of development of the RTP/STP Integrated Growth Forecast process. At each step, the City disagreed with the assignment of future job growth within residential neighborhoods, from which job demand and resulting household growth is determined. This circular reasoning incorrectly skews the numbers unreasonably upward.
More significantly, the focus on future job demand in Dana Point was based largely on the potential revitalization of the Town Center mixed-use commercial/residential area. The job growth projections were based on a standard formula of job demand for
360

potential square footage, as identified in the Environmental Impact Report for the Town Center Plan. Though the formula may be applicable for new development, the Town Center is currently developed, though somewhat underutilized compared to the new zoning which was approved in 2008. Since the time of the Town Center plan approval, there has been no construction of new projects and no applications submitted for new projects. The City does not anticipate a significant demand for jobs in the Town Center, certainly not more than a slow, incremental growth over the next 20-30 years. Believing the City to be forthcoming in the Town Center development future, City staff may have been overly confident in adding the information of development potential into the RTP/STP Integrated Growth Forecast process. Due to the unrealistic and unlikely ultimate build-out models, the projections for job growth and residential units included in the RTP/STP far exceeds the actual development potential in the next decade. For this reason, the RHNA Allocation Methodology is incorrect and should be adjusted in order to reflect a more realistic future job and housing demand for Dana Point.
Current RHNA and Unmet Goals As indicated in the chart below, the current RHNA in Dana Point includes unmet needs from the 1998-2005 RHNA Cycle. These numbers are a challenging goal, but the addition of an excessive 327 units in the next cycle will make the total RHNA goals unrealistic to achieve and, ultimately, unattainable.
Dana Point Regional Housing Needs Assessment (RHNA)
Very low low Moderate Above- Moderate Total
1998-2005 RHNA 85 50 86 229 450
Constructed 0 41 61 244 346
Unmet Need 85 9 25 0 119
2006-2014 RHNA 15 12 13 28 68
Combined RHNA 100 21 38 28 187
With a current RHNA goal of 187 units, of which only 33 units have been constructed in 3 years, a RHNA allocation of 327 units far exceeds an attainable number to reach in Dana Point through 2021. The City of Dana Point is appealing to SCAG for reevaluation and requests the number of units to be reduced in order that the City can continue its progress toward the RHNA goals identified for Dana Point with reasonable expectation for achievement.
361
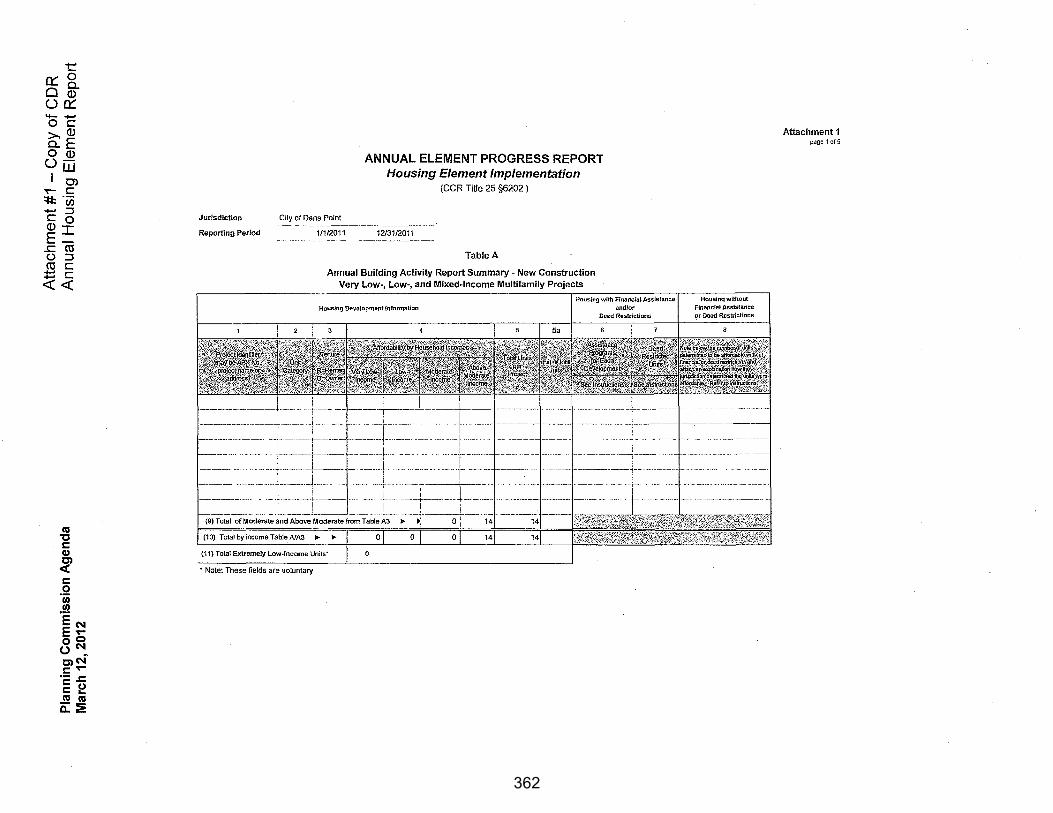
t::: 0:::0 o§r 00::: '+- ..... 0 c >.Q) c..E 0 Q) Ow I 0>
T"-C :t:l: ·u; ..... ::::::1 c 0 a> I E-..cro (.) ::::::1 ro c ~c <(<(
co "C c Cl)
~ c .2
-~ EN E..oo oN C)N~ c .... "2 .c c ~ .,!gco c..:::!li!
Jurisdiction
Reporting Period
City of Dana Point
1/1/2011
ANNUAL ELEMENT PROGRESS REPORT Housing Element Implementation
(CCR Title 25 §6202 )
12/3112011
Table A
Annual Building Activity Report Summary· New Construction Very Low·, Low·, and Mixed-Income Multifamily Projects
Housing Oevolopment £nformation Housfng with Financial Assistance
and/or
• Note: These fields are voluntary
Housing without Financial Assistance or Oaad Restrictions
Attachment 1 page 1 of5
362
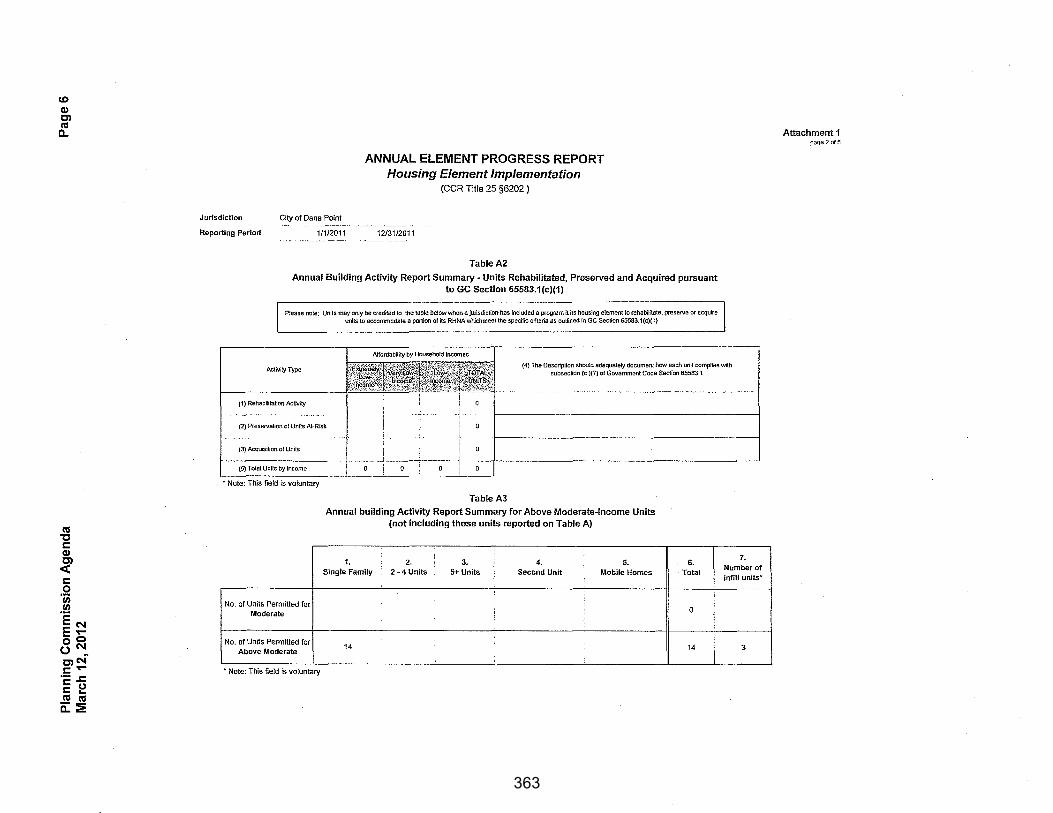
CD Cl) C) ns ll..
ns "t:l s::: Cl)
~ s::: .2 1/)
.!!! E E 0
(.)
N .... 0 N
mc-1 s:::'<"" ·c; .s::: s::: ~
.!!!CIS a..:ri!
Jurisdiction
Reporting Period
City of Dana Point -·-- --------
1/1/2011
ANNUAL ELEMENT PROGRESS REPORT Housing Element Implementation
(CCR Title 25 §6202 )
12/31/2011
Table A2
Annual Building Activity Report Summary- Units Rehabilitated, Preserved and Acquired pursuant to GC Section 65583.1(c)(1)
Please note: Units may only be credited to the table below when a jurisdiction has inc:lucled a program rt its housing element to rehabintate. preserve or acquire units to accommodate a portion of Its RHNA whichmeet the specific criteria as outlined in GC Secllon 65583.1(c)(1}
Activity Type (4} The Oescripllon should adequately document how each unit complies with
subsection (c )(7) of Government Code Section 65583.1
(1) Rehabir.tation Activity
(2) Preservation of Units Al-Risk
• Note: This field is voluntary
No. of Units Permitted for Moderate
No. of Units Permitted for Above Moderate
• Note: This field is voluntary
TableA3
Annual building Activity Report Summary for Above Moderate-Income Units (not including those units reported on Table A)
1. 2. 3. ; 4. 5. Single Family 2-4 Units 5+ Units Second Unit Mobile Homes
~ .
14
6. 7.
Total Number of infill units'"
0
14 3
I
I
Attachment 1 page 2 of5
363
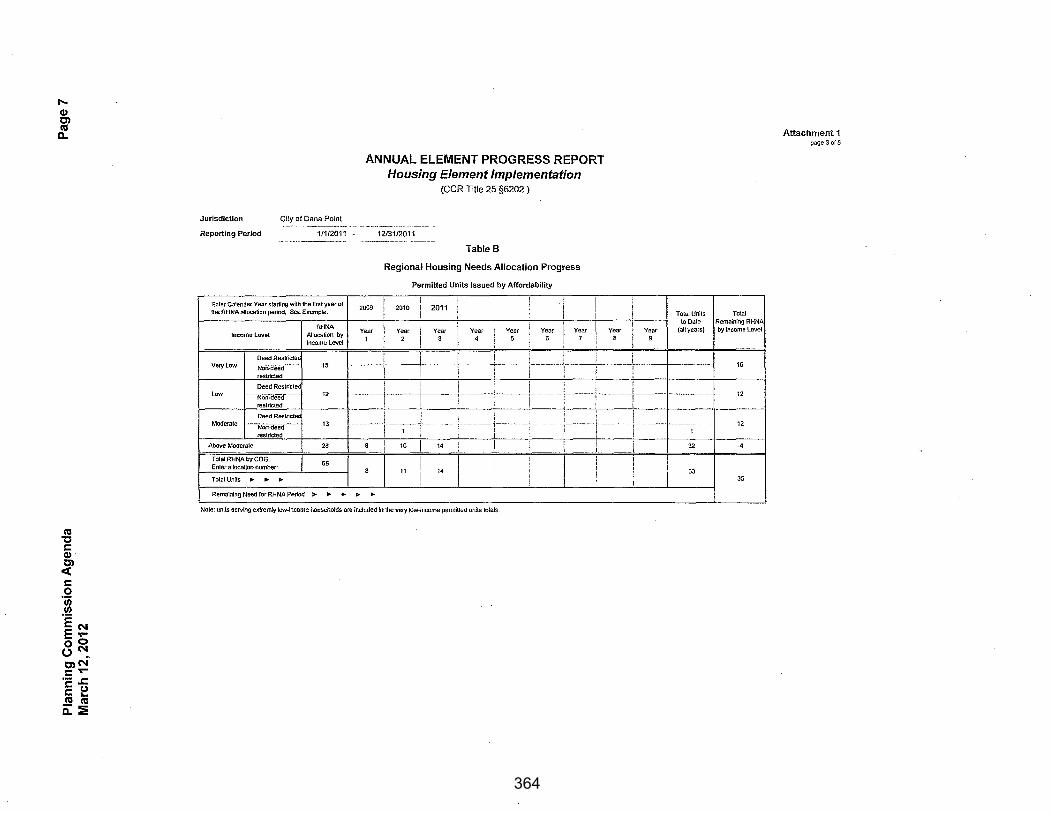
...... (I) C) cu c..
cu "C s:: (I) : s:: .2 .~ EN E..oo oN C)N~ s:: ..... ·c: J: s:: ~ .,!!!CU c..~
Jurisdiction
Reporting Period
City of Dana Point
1/1/2011
Enter Calendar Year slartinl} with the first year of the RHNA allocation period. See E~Cample.
lncomo Love!
Deed Restricted very Low 1·---··Ncm.-deea--
restricted
Deed Restricled Low --Non.deect ____ _
Moderate
Above Moderate
restricted
Deed Restricted
Non-deed ·
restricled
Total RHNA by COG. Enter allocation number:
Total Units .- .,. ,.
RHNA AHacalion by Income Level
15
12
13
28
68
ANNUAL ELEMENT PROGRESS REPORT Housing Element Implementation
(CCR Title 25 §6202 )
2009
Year 1
12/31/2011
Table 8
Regional Housing Needs Allocation Progress
2010
Year 2
Permitted Units Issued by Affordability
2011
Year 3
Year 4
Year 5
Year 6
Year 7
Year a
i ! i ! l i 1--,-- ---:---------r- r----r·--r----T Year
9
Total Units I Total to Date Remaining RHNA
(all ¥ears) by Income Level
15
12 1 ! ! j j I l -----r--+----- -1- ------'------ - :-----!-----+------f----1------ -----1 r I ' 1 i 1
12
' , . . I 1--------- -1--~----L- -- ------ !-- -i----- -:-·-- + -----t------1--------1
10 I 14 I, I i i 32 -4
35 ,-, r·:-r!-! 1 33
Remaining Need for RHNA Period ... ... ... • ..,.
Note: units serviog extremly low-Income households are included In the very low-income permitted units !olals.
Attachment 1 page 3of5
364

co Q) C') n:s c.
n:s "C r::: Q) : r::: .2 1/)
.Ia E E~ oo oN C')N~ r::: ..... '2 .r::: r::: ~ ,!!!n:l c.~
Jurisdiction
Reporting Period
City of Dana Point
1/1/2011
Program Description (By Housing Element Program Names)
Name of Program
1.1 Affordable Housing Development Plan
1.2 Expand Zoning for Multi-Family Housing .-> ~pana Lomng or t:mergency ;,neners
l•nd Tr~nsitinnal H-ousino ,~~ ~~~~~~;~~~'':.sn.~:;,:mergency ,:,ne11ers
1.4 Density Bonus Housing
1.5 Second Units
2.5 Housing Initiative Program
H.000~;~~am 1neu pprova s or I-\HOruau1e
~ ---------~ ' --· -----· ··--------
ANNUAL ELEMENT PROGRESS REPORT Housing Element Implementation
(CCR Title 25 §6202 )
12131/2011
Table C
Program Implementation Status
Housing Programs Progress Report - Government Code Section 65583. ~ Describe progress of all programs induding local efforts to remove governmental constraints to the maintenance,
improvement, and development of housing as identified in the housing element.
Objective Ti:e:~~e Status of Program Implementation _
ID Sites, Discuss w/CUSD 31-Dec-09 Discussions with CUSD Ongoing in 2011 , upaa e Lomng voae o permt iMulti-F•milv Housino in ·r.F Zone
31-Dec-09 Approved by City Council4126110 i jLomng c.ooe cnanges a anow em.
June 2010 Approved by City Council 4/2611 0 I shelters uo to 20 b.eds in r.F zone !
~~~~:' ;~~~~:~~~~~~~~~~:;; 1-Jun-10 Approved by City Council 412611 0 I l;:~= .. ~.~~~e opmen o ower 2006-2014 Discussions with vartous developers in 2011
1 :::,~o e anu f"'rmt .,_ um s per Annually 1
~~~:~~~~~~·;~,~~·;:~~~~ e anu urocroure, uu no .,econu uwt,mg
~~~~~n~~~~r~~~d~n~~~~~~~~:~ hv Annually 2011 employee program served 20 Dana Point residents
~~~~;~;~;::,~;~~~;:,~o 2~~wro';~y 1-Jun-10 Approved by City Council 4126110
----· -------- .... ----- -------- ----·
Attachment 1 page 4 ofs
365
0)
(I) Cl cu D.
cu "0 s::: (I) : s::: .2 1/)
.!!! EN E..oo o"' t»N c .... '2 ..s::: s::: u cu ... _cu a. :liE
Jurisdiction
Reporting Period
General Comments:
City of Dana Point
111/2011
ANNUAL ELEMENT PROGRESS REPORT Housing Element Implementation
(CCR Title 25 §6202 )
12131/2011
Attachment 1 page 5 of5
366
City
DANA POINT DANA POINT
DANA POINT DANA POINT
DANA POINT
DANA POINT DANA POiNT DANA POINT
DANA POINT DANA POINT
DANA POINT DANA POINT
DANA POINT DANA POINT DANA POINT DANA POINT
DANA POINT DANA POINT
DANA POINT
DANA POINT DANA POINT
DANA POINT DANA POINT DANA POINT
DANA POINT DANA POINT DANA POINT Total
co 00.... ofN(J) --Oo.... >-fa. a::: 0 ()¢:::
I ~ No ::t:l::c:: ..... o(/) c:: ~ c:: Q) (.) 0 Em:;:::. ..c::.ou (.) ""0 Q) m a> ·--. :::::a>e <(LLO....
2000 Census Tract
0423.05 0423.11
0423.11 0423.23 0423.23
0423.23
0423.23 0423.24
0423.38 0423.39
0423.39 0423.39
0423.13 0423.13 0423.13 0423.13
0423.13 0422.01 0422.01
0422.01 0422.01
0422.05 0422.06
0423.10 0423.10 0423.11 0423.11
CAA TAZ
64 1695
64 1696
64 1697
. 64 1693
64 1698
64 1699 64 1708 64 1692
.64 1694 64 1696
64 1701 64 1702
66 1707
66 1709
66 1710 66 1711 66 1713
67 1706
67 1712
67 1714
68 1687 68 1705
68 1730
68 1690 68 1703
68 1697 68 1700
2000 4/1/2000-Census 6/30/2008 Total Housing Net Housing Housing
Unit Count Activity Units (CHC) (HIS)- (TDU)
209 0 209
79 0 79
54 0 54
750 26 776
698 2 700
790 0 790
450 1 451
884 16 900 2,050 0 2,050
820 0 820 411 2 413
201 0 201 1,348 2 1,350 1,212 1 1,213
156 0 156 334 0 334 144 0 144
344 66 410 907 9 916
995 5 1,000 0 0 0
449 1 450
328 -1 327 291 0 291 631 0 631
790 -1 789 357 95 452
15,682 224 15,906
July 1, 2008
Single Family
Detached All Other Dana Housing Housing Population Resident Employment Point Dana P(
Units Units (POP) Population (EMP) Notes Est. Note~
198 11 455 455 33 No Comm'l, Residential only, Emp. Appears High
25 54 244 244 0 Appears ok
49 5 158 158 34 No Comm'l, Residential only, Emp. Appears High 100?
240 536 1,388 1,388 1,394 Appears ok
304 396 1,149 1,149 200 No Comm'l, Residential only, Emp. Appears High
378 412 1,514 1,514 390 Minimum Comm'l - Emj)loyee #Appears High 100?
229 222 921 921 385 No Comm'l, Residential only, Emp. Appears Hiqh 200? school or
416 484 1,822 1,809 679 Appears ok
1,339 711 4,993 4,986 1,606 Appears ok
195 625 2,098 2,098 197 Appears ok
5 408 841 841 47 No Comm'l, Residential only, Emp. Appears High
169 32 429 429 66 No Comm'l, Residential only, Emp. Appears High
497 853 3,350 3,350 402 Appears ok
448 765 3,200 3,190 934 Appears ok
0 156 219 219 861 Appears ok
67 267 535 535 1,728 Appears ok
0 144 197 197 902 No Residential Land Area - boats as residences?
107 303 1,046 1,038 789 Appears ok
403 513 2,239 2,239 741 Appears ok Beach Rc
766 234 2,340 2,316 558 No Comm'l, Residential only, Emp. Appears High 50? Mgmt
0 0 0 0 0 Appears ok
432 18 1,396 1,356 253 No Comm'l, Residential only, Emp. Appears High
220 107 927 826 240 Minimum Comm'l - Employee# Appears High
291 0 921 921 94 No Comm'l, Residential only, Emp. Appears High
0 631 1,207 1,207 235 Appears ok 742 47 2,231 2,191 375 No Comm'l, Residential only, Emp. Appears Hiqh
400 52 1,136 1,129 466 Appears ok (but school incorrectly shown)
7,920 7,986 36,956 36,706 13,609
367

>. ....... c C/) ::J ::J 0 C/)
Oc ._Q) 0() >-o c.....Oo ON I en
C') -~ ~:-!:: ....... o c IDQ)C:" E g ro .ernE (.) ..... ro 0 E ~-::J <(oCI)
Census 2010 Housing Units and Vacant Units: 2000 and 2010
Select California Data 2000-2010
April1, 2000 (1} April1, 2010 Numeric Change Percent Change Total Total Total Total
Housing Housing Housing Housing Place Units Vacant Units Units Vacant Units Units Vacant Units Units Aliso Viejo city (CDP in 2000) 16,602 461 18,867 663 2,265 202 13.6% Anaheim city 99,719 2,750 104,237 5,.943 4,518 3,193 4.5% Brea city 13,327 260 14,785 519 1,458 259 10.9% Buena Park city 23,826 494 24,623 937 797 443 3.3% Costa Mesa city 40,406 1,200 42,120 2,174 1,714 974 4.2% Cypress city 16,028 374 16,068 414 40 40 0.2% Dana Point city 15,682 1,226 15,938 1,756 256 530 1.6% Fountain Valley city 18,473 311 19,164 516 691 205 3.7% Fullerton city 44,771 1.162 47,869 2,478 3,098 1,316 6.9% Garden Grove city 46,703 912 47.755 1,718 1,052 806 2.3% Huntington Beach city 75,662 2,005 78,003 3,718 2,341 1,713 3.1% Irvine city 53,711 2,512 . 83,899 4,921 30,188 2,409 56.2% Laguna Beach city 12,965 1,454 12,923 2,102 -42 648 -0.3% Laguna Hills city 10,366 326 11,046 577 680 251 6.6% Laquna Nlouel city 23,885 668 25.312 1,080 1,427 412 6.0% Laguna Woods city 13,629 1,038 13,016 1,714 -613 676 -4.5% La Habra city 19,441 494 19,924 947 483 453 2.5% Lake Forest city 20,486 478 27.088 864 6,602 386 32.2% La Palma city 5,066 87 5,224 144 158 57 3.1% Los Alamitos city 4,329 83 4,355 143 26 60 0.6% Mission Viejo city 32,985 536 34,228 1,020 1,243 484 3.8% Newport Beach city 37,288 4,217 44,193 5,442 6,905 1,225 18.5%
Orange city 41,920 974 45,111 1,744 3,191 770 7.6% Placentia city 15,326 289 16,872 507 1,546 218 10.1% Rancho Santa Margarita city 16,515 262 r/'.2so 595 745 333 4.5% San Clemente city 20,653 1,258 25,966 2,060 5,313 802 25. 7'%
San Juan Capistrano city 11,320 390 11,940 546 620 156 5.5% Santa Ana city 74,588 1,586 76,896 3,722 2,308 2,136 3.1%
Seal Beach city 14,267 1,219 14,558 1,541 291 322 2.0%
Stanton city 11 ,011 244 11,283 458 272 214 2.5%
Tustin city 25,501 1,670 26,476 1,273 975 -397 3.8%
Villa Park city 1,992 58 2,016 40 24 -18 1.2%
Westminster city 26,940 534 27,650 1,486 710 952 2.6% Yorba Linda city 19,567 315 22,305 729 2,738 414 14.0% Remainder Unincorporated 44,534 2,350 39,937 1,635 -4,597 -715 -10.3% Orange County 969,484 34,197 1,048,907 56,126 79,423 21,929 8.2%
California 12,214,550 711,679 13,680,081 1,102,583 1,465,531 390,904 12.0%
Imperial County 43,891 4,507 56,067 6,941 12,176 2,434 27.7% Los Angeles County 3,270,909 137,135 3,445,076 203,872 174,167 66,737 5.3% Riverside County 584,674 78.456 800,707 114,447 216,033 35,991 36.9% San Bernardino County 601,369 72,775 699,637 88,019 98,268 15,244 16.3% San Diego County 1,040,149 45.472 1,164,786 77,921 124,637 32.449 12.0% Ventura County 251,'711 - --- 8.477 - , ___ 281,()!)5 14,775 ?!l,lliJL -- 6,298 11.9%_
(1) Census 2000 counts include changes from the Count Question Resolution program. Data may not match data pu~lished in Census 2000 reports. Source: Census 2010, Redistricting Data (Public Law 94-171) Summary File. Table modified from CA DOF DRU Table 2: http:l/www.dof.ca.gov/research/demographic/state_census_data_center/census_201 0/view.php Prepared by Center for Demographic Research, CSUF
Vacant Units 43.8%
116.1%
99.6% 1
~~:;~ !
10.7% I 43.2% 65.9%
113.3% 88.4% 85.4% 95.9% 44.6% 77.0% 61.7% 65.1% 91.7% 80.8% 65.5% 72.3% 90.3% 29.0% 79.1% 75.4%
127.1% 63.8% 40.0%
134.7% 26.4% 87.7%
-23.8% -31.0% 178.3% 131.4% -30.4% 64.1%
54.9%
54.0% 48.7% 45.9% 20.9% 71.4%
__ 74.3%
...
368
Related Documents