Mekong River Commission Regional Flood Management and Mitigation Centre MRC Weekly Flood Situation Report – Week 12 th September – 18 th September 2011 Page 1 Weekly Flood Situation Report for the Mekong River Basin Prepared on: 19/09/2011, covering the week from the 12 th to the 18 th September, 2011 Weather Patterns, General Behaviour of the Mekong River and Flood Situation General weather patterns During the week of the 12 th to the 18 th September 2011, four weather bulletins were issued by the Department of Meteorology (DOM) of Cambodia. The weather charts of the 12 th and the 19 th August bulletins are presented in the figures below: Figure 1: Weather map for 12 th September 2011 Figure 2: Weather map for 18 th September 2011 Strong to week South-West (SW) Monsoon Strong SW monsoon prevailed over Andaman Sea, the Gulf of Thailand, Thailand and Cambodia the beginning to the mid of the week and became weakening in the rest of the week (Figure 1 and 2). Inter Tropical Convergence Zone (ITCZ) ITCZ laid across the Myanmar, Thailand, Lao PDR and Viet Nam during last week (Figure 1 and 2). Tropical depressions (TD), tropical storms (TS) or typhoons (TY) No Tropical Depression, Tropical Storm or Typhoon has significant affected to the LMB in last week. Other weather phenomena that affect the discharge No other weather phenomena affecting the discharge were observed. Over weather situation A severe weather situation was occurred during the first half of the week. As the result of strong SW monsoon activity, appearances of ITCZ in the whole week and low pressure trough laid across Thailand, Lao PDR, Cambodia and Viet Nam at the height 1.5 km (850 hPa), heavy rain occurred in the North and central of Myanmar, Thailand, the North of Lao PDR and Viet Nam during the mid of the week. Figure 3 illustrates rainfall amount distribution over the LMB, covering last week. During

Welcome message from author
This document is posted to help you gain knowledge. Please leave a comment to let me know what you think about it! Share it to your friends and learn new things together.
Transcript

Mekong River Commission Regional Flood Management and Mitigation Centre
MRC Weekly Flood Situation Report – Week 12th September – 18
th September 2011 Page 1
U
Weekly Flood Situation Report for the Mekong River Basin
Prepared on: 19/09/2011, covering the week from the 12th to the 18th September, 2011
Weather Patterns, General Behaviour of the Mekong River and Flood Situation
General weather patterns
During the week of the 12th to the 18
th September 2011, four weather bulletins were issued by the
Department of Meteorology (DOM) of Cambodia. The weather charts of the 12th and the 19
th August
bulletins are presented in the figures below:
Figure 1: Weather map for 12th
September 2011
Figure 2: Weather map for 18th
September 2011
Strong to week South-West (SW) Monsoon
Strong SW monsoon prevailed over Andaman Sea, the Gulf of Thailand, Thailand and Cambodia the beginning to the mid of the week and became weakening in the rest of the week (Figure 1 and 2).
Inter Tropical Convergence Zone (ITCZ)
ITCZ laid across the Myanmar, Thailand, Lao PDR and Viet Nam during last week (Figure 1 and 2). Tropical depressions (TD), tropical storms (TS) or typhoons (TY) No Tropical Depression, Tropical Storm or Typhoon has significant affected to the LMB in last week.
Other weather phenomena that affect the discharge
No other weather phenomena affecting the discharge were observed.
Over weather situation
A severe weather situation was occurred during the first half of the week. As the result of strong SW monsoon activity, appearances of ITCZ in the whole week and low pressure trough laid across Thailand, Lao PDR, Cambodia and Viet Nam at the height 1.5 km (850 hPa), heavy rain occurred in the North and central of Myanmar, Thailand, the North of Lao PDR and Viet Nam during the mid of the week. Figure 3 illustrates rainfall amount distribution over the LMB, covering last week. During

Monday, 19th September 2011
MRC Weekly Flood Situation Report – Week 12th September – 18
th September 2011 Page 2
last week, heavy rain occurred in the upper and middle parts of LMB from Luang Prabang to Savannkhet/Mukdahan and the amounts of rainfall covering last week, which is over 300 mm, were recorded at Paksane (360mm); at Nong Khai (352.7mm); at Thakhek (304mm); at Nakon Phanom (357.8mm); at Ban Tha Kok Daeng (429.5mm); at Ban Phone Si (370.1 mm); at Muong Mai (583.4 mm).
Figure 3: Rainfall distribution over the LMB, covering the week 12 – 18 September, 2011
General behaviour of the Mekong River
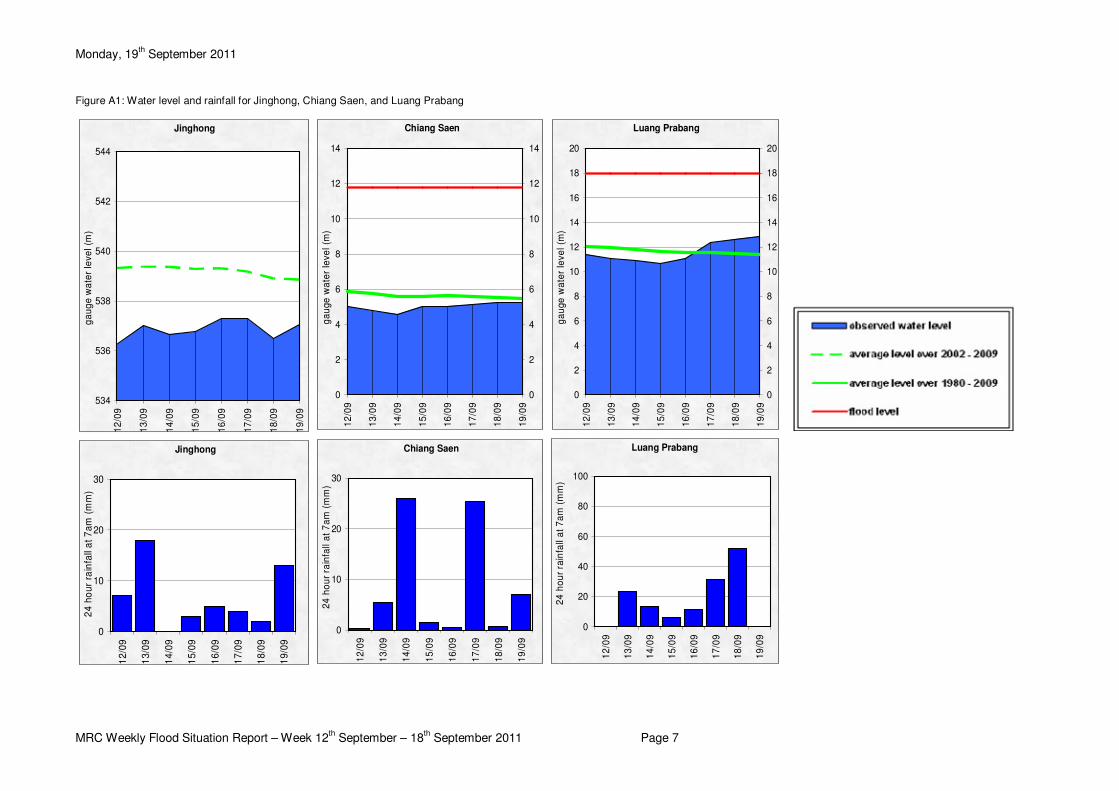
Water levels at most stations along the Mekong river were above the long-term average except Chiang Saen and Luang Prabang. While water level in the Mekong showed a falling and rising trend at stations in the upper reach, water levels at stations in the middle and lower reaches were rising during reporting period. Regarding to two stations in downstream at Tan Chau and Chau Doc, water levels at those two stations were fluctuated by tidal with increasing trend in the monitoring period.

Monday, 19th September 2011
MRC Weekly Flood Situation Report – Week 12th September – 18
th September 2011 Page 3
For stations from Chiang Saen to Vientiane/ Nong Khai
Water level showed a decreasing trend in the first half of the week then was increasing till the end of the week and these stations were recording levels that are somewhat over the long-term average except Chiang Saen and Luang Prabang where were recording levels that somewhat are below and around the long-term average for this time of the year.
For stations Paksane to Pakse
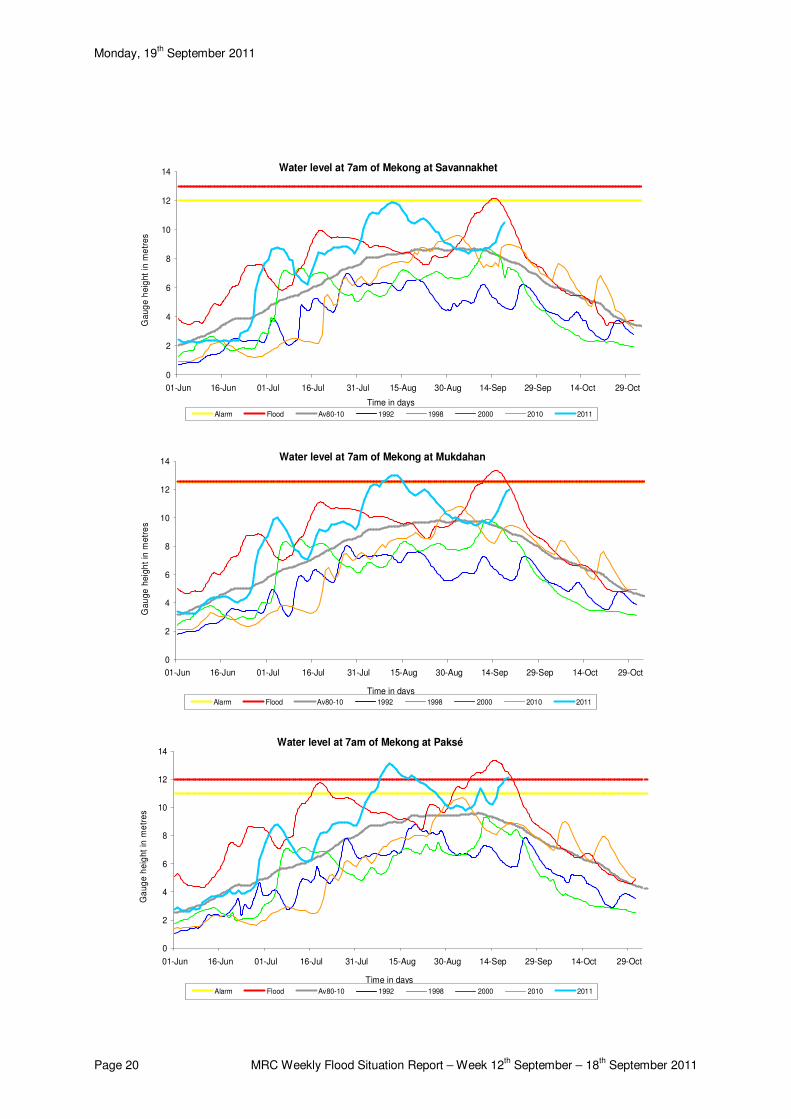
Water levels were rapidly rising with average intensity of 0.3 – 0.4 m/day as the result of inter tropical convergence zone and strong Southwest monsoon influences during last week. These stations were recording levels that are above the long-term average for this time of the year.
Figure 4 and 5 show rapidly rising of water levels at stations from Nakon Phanom/Thakhek to Khong Chiam in last week.
9.5
10.5
11.5
12.5
13.5
12-Sep 13-Sep 14-Sep 15-Sep 16-Sep 17-Sep 18-Sep
Time (day)
H (
m)
0
100
200
300
400
500
R (
mm
)
R_Nakon Phanom
R_Thakhek
H_Nakon Phanom
H_Thakhek
∆∆∆∆ HNakon Phanom = 2.07m
∆∆∆∆ HThakhek = 2.29m
Figure 4: Rapidly increasing of water level on mainstream at stations Nakon Phanom, Thakhek
8
9
10
11
12
13
14
15
16
12-Sep 13-Sep 14-Sep 15-Sep 16-Sep 17-Sep 18-Sep
Time (day)
H (
m)
0
100
200
300
400
500
R (
mm
)
R_Nakon PhanomR_ThakhekR_Khong ChiamH_MukdahanH_SavannakhetH_Khong Chiam
∆∆∆∆ HSavannakhet = 2.14m
∆∆∆∆ HKhong Chiam = 2.28m
∆∆∆∆ HMukdahan = 2.45m
Figure 5: Rapidly increasing of water level on mainstream at stations Savannakhet, Mukdahan and Khong Chiam

Monday, 19th September 2011
MRC Weekly Flood Situation Report – Week 12th September – 18
th September 2011 Page 4
Water levels at stations on the left bank tributaries of Lao PDR such as at Ban Phone Si of Nam Ca Dinh river, at Mahaxai of Se Bang Fai and at Ban Pak Kanhoung of Nam Ngun river rose up quickly in last week (Figure 6).
7
8
9
10
11
12
13
14
15
16
12-Sep 13-Sep 14-Sep 15-Sep 16-Sep 17-Sep 18-Sep
Time (day)
H (
m)
0
100
200
300
400
500
600
700
R (
mm
)
R_Ban Pak KanhoungR_Ban Phone SiR_MahaxaiH_Ban Pak KanhoungH_Ban Phone SiH_Mahaxai
∆∆∆∆ HBan Pak Kanhoung = 3.14m
∆∆∆∆ HMahaxai = 6.55m
∆∆∆∆ HBan Phone Si = 4.01m
Figure 6: Rapidly increasing of water levels at stations on tributaries: Nam Ca Dinh river at Ban Phone Si, Se Bang Fai river at Mahaxai and Nam Ngun river at Ban Pak Kanhoung
For stations Strung Treng to Kompong Cham
Water levels were falling in the first half of the week and then rising till the end of the week. These stations were recording levels are above the long-term average for this time of the year.
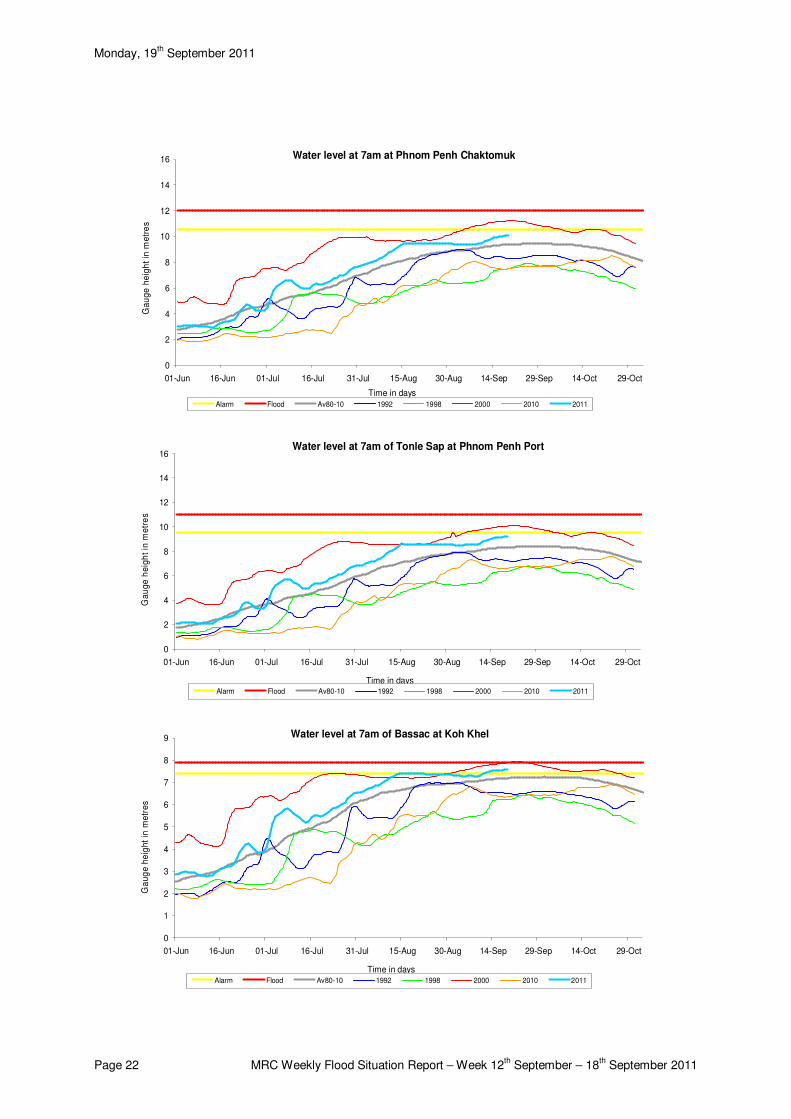
For stations from Phnom Penh Port/ Phnom Penh Bassac to Prek Dam
Water levels at these stations showed a slightly rising trend during last week and were above the long-term average for this time of the year.
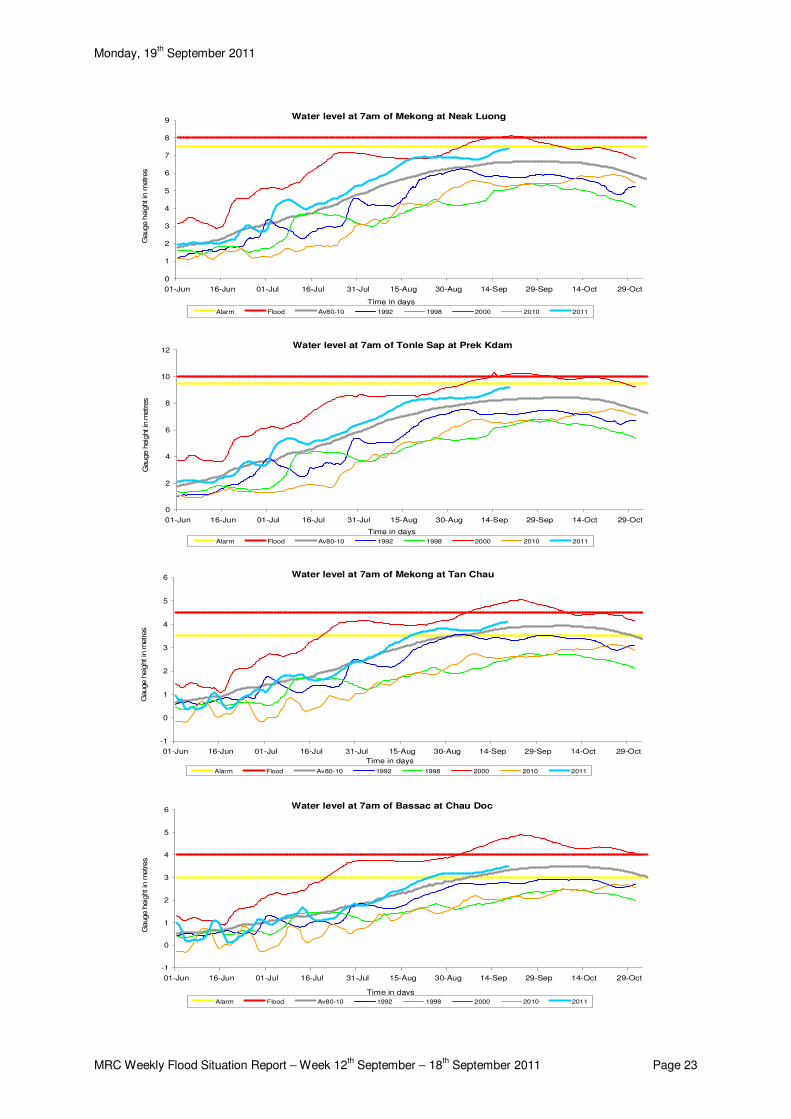
Tan Chau and Chau Doc
Water levels were rising till the end of the week. Both stations were recording levels that are above the long-term average for this time of the year and significantly affected by tidal.
Note: for areas between forecast stations, please refer to the nearest forecast station. U
U U
U

Monday, 19th September 2011
MRC Weekly Flood Situation Report – Week 12th September – 18
th September 2011 Page 5
Flood Situation
� Flood stage or alarm stage:
- The Mekong has reached flood stage at Pakse since 18th September, 2011.
- The Mekong has reached alarm situation at Tan Chau and Chau Doc monitoring stations.
For more details see the following annex:
- tables and graphs for water level and rainfall for the last week in Annex A
- a graph for accuracy in Annex B
- a table of forecast achievement in Annex B
- tables and graphs for performance in Annex B
- the water level graphs showing the observed water level for the season in Annex C
Monday, 19th September 2011
Page 6 MRC Weekly Flood Situation Report – Week 12th September – 18
th September 2011
Annex A: Graphs and Tables
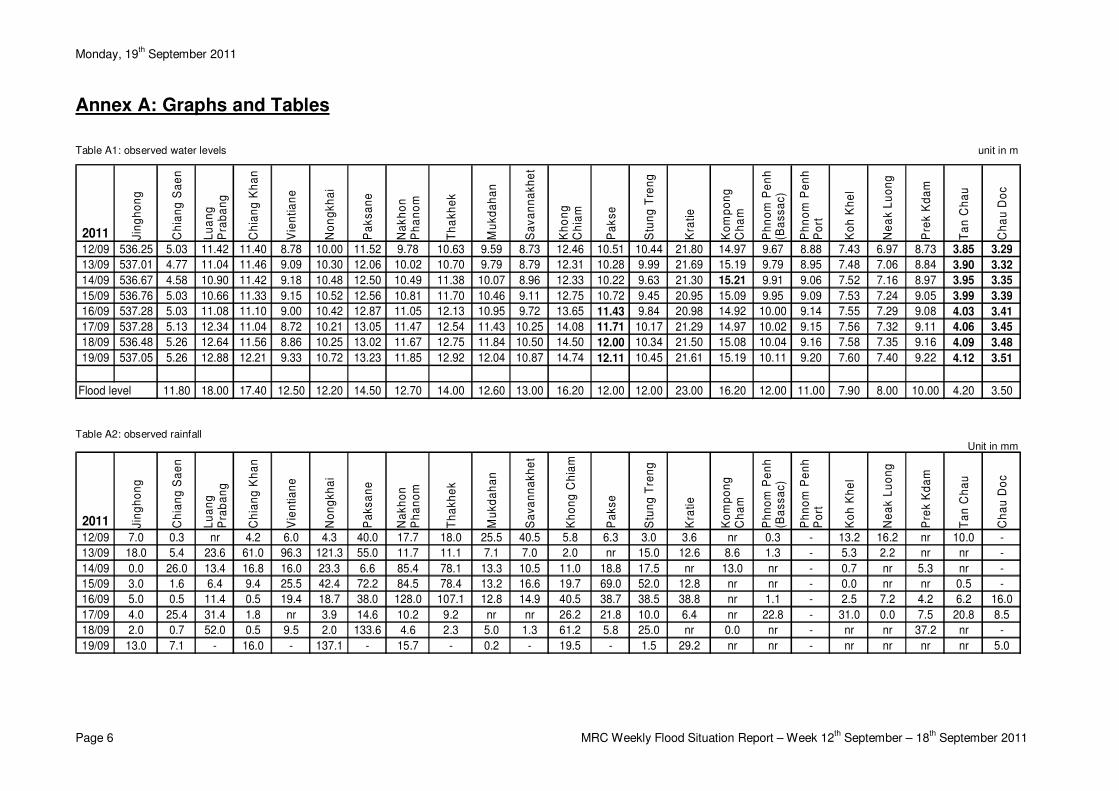
Table A1: observed water levels unit in m
2011 Jin
gh
on
g
Ch
ian
g S
ae
n
Lu
an
g
Pra
ba
ng
Ch
ian
g K
ha
n
Vie
nti
an
e
No
ng
kh
ai
Pa
ks
an
e
Na
kh
on
P
ha
no
m
Th
ak
he
k
Mu
kd
ah
an
Sa
va
nn
ak
he
t
Kh
on
g
Ch
iam
Pa
ks
e
Stu
ng
Tre
ng
Kra
tie
Ko
mp
on
g
Ch
am
Ph
no
m P
en
h
(Ba
ss
ac
)
Ph
no
m P
en
h
Po
rt
Ko
h K
he
l
Ne
ak
Lu
on
g
Pre
k K
da
m
Ta
n C
ha
u
Ch
au
Do
c
12/09 536.25 5.03 11.42 11.40 8.78 10.00 11.52 9.78 10.63 9.59 8.73 12.46 10.51 10.44 21.80 14.97 9.67 8.88 7.43 6.97 8.73 3.85 3.29
13/09 537.01 4.77 11.04 11.46 9.09 10.30 12.06 10.02 10.70 9.79 8.79 12.31 10.28 9.99 21.69 15.19 9.79 8.95 7.48 7.06 8.84 3.90 3.32
14/09 536.67 4.58 10.90 11.42 9.18 10.48 12.50 10.49 11.38 10.07 8.96 12.33 10.22 9.63 21.30 15.21 9.91 9.06 7.52 7.16 8.97 3.95 3.35
15/09 536.76 5.03 10.66 11.33 9.15 10.52 12.56 10.81 11.70 10.46 9.11 12.75 10.72 9.45 20.95 15.09 9.95 9.09 7.53 7.24 9.05 3.99 3.39
16/09 537.28 5.03 11.08 11.10 9.00 10.42 12.87 11.05 12.13 10.95 9.72 13.65 11.43 9.84 20.98 14.92 10.00 9.14 7.55 7.29 9.08 4.03 3.41
17/09 537.28 5.13 12.34 11.04 8.72 10.21 13.05 11.47 12.54 11.43 10.25 14.08 11.71 10.17 21.29 14.97 10.02 9.15 7.56 7.32 9.11 4.06 3.45
18/09 536.48 5.26 12.64 11.56 8.86 10.25 13.02 11.67 12.75 11.84 10.50 14.50 12.00 10.34 21.50 15.08 10.04 9.16 7.58 7.35 9.16 4.09 3.48
19/09 537.05 5.26 12.88 12.21 9.33 10.72 13.23 11.85 12.92 12.04 10.87 14.74 12.11 10.45 21.61 15.19 10.11 9.20 7.60 7.40 9.22 4.12 3.51
Flood level 11.80 18.00 17.40 12.50 12.20 14.50 12.70 14.00 12.60 13.00 16.20 12.00 12.00 23.00 16.20 12.00 11.00 7.90 8.00 10.00 4.20 3.50
Table A2: observed rainfall Unit in mm
2011 Jin
gh
on
g
Ch
ian
g S
ae
n
Lu
an
g
Pra
ba
ng
Ch
ian
g K
ha
n
Vie
nti
an
e
No
ng
kh
ai
Pa
ks
an
e
Na
kh
on
P
ha
no
m
Th
ak
he
k
Mu
kd
ah
an
Sa
va
nn
ak
he
t
Kh
on
g C
hia
m
Pa
ks
e
Stu
ng
Tre
ng
Kra
tie
Ko
mp
on
g
Ch
am
Ph
no
m P
en
h
(Ba
ss
ac
)
Ph
no
m P
en
h
Po
rt
Ko
h K
he
l
Ne
ak
Lu
on
g
Pre
k K
da
m
Ta
n C
ha
u
Ch
au
Do
c
12/09 7.0 0.3 nr 4.2 6.0 4.3 40.0 17.7 18.0 25.5 40.5 5.8 6.3 3.0 3.6 nr 0.3 - 13.2 16.2 nr 10.0 -
13/09 18.0 5.4 23.6 61.0 96.3 121.3 55.0 11.7 11.1 7.1 7.0 2.0 nr 15.0 12.6 8.6 1.3 - 5.3 2.2 nr nr -
14/09 0.0 26.0 13.4 16.8 16.0 23.3 6.6 85.4 78.1 13.3 10.5 11.0 18.8 17.5 nr 13.0 nr - 0.7 nr 5.3 nr -
15/09 3.0 1.6 6.4 9.4 25.5 42.4 72.2 84.5 78.4 13.2 16.6 19.7 69.0 52.0 12.8 nr nr - 0.0 nr nr 0.5 -
16/09 5.0 0.5 11.4 0.5 19.4 18.7 38.0 128.0 107.1 12.8 14.9 40.5 38.7 38.5 38.8 nr 1.1 - 2.5 7.2 4.2 6.2 16.0
17/09 4.0 25.4 31.4 1.8 nr 3.9 14.6 10.2 9.2 nr nr 26.2 21.8 10.0 6.4 nr 22.8 - 31.0 0.0 7.5 20.8 8.5
18/09 2.0 0.7 52.0 0.5 9.5 2.0 133.6 4.6 2.3 5.0 1.3 61.2 5.8 25.0 nr 0.0 nr - nr nr 37.2 nr -
19/09 13.0 7.1 - 16.0 - 137.1 - 15.7 - 0.2 - 19.5 - 1.5 29.2 nr nr - nr nr nr nr 5.0
Monday, 19th September 2011
MRC Weekly Flood Situation Report – Week 12th September – 18
th September 2011 Page 7
Figure A1: Water level and rainfall for Jinghong, Chiang Saen, and Luang Prabang
Jinghong
0
10
20
30
12
/09
13
/09
14
/09
15
/09
16
/09
17
/09
18
/09
19
/09
24
ho
ur
rain
fall
at
7a
m (
mm
)
Chiang Saen
0
2
4
6
8
10
12
14
12
/09
13
/09
14
/09
15
/09
16
/09
17
/09
18
/09
19
/09
ga
ug
e w
ate
r le
ve
l (m
)
0
2
4
6
8
10
12
14
Chiang Saen
0
10
20
30
12
/09
13
/09
14
/09
15
/09
16
/09
17
/09
18
/09
19
/09
24
ho
ur
rain
fall
at
7a
m (
mm
)
Luang Prabang
0
2
4
6
8
10
12
14
16
18
20
12
/09
13
/09
14
/09
15
/09
16
/09
17
/09
18
/09
19
/09
ga
ug
e w
ate
r le
ve
l (m
)
0
2
4
6
8
10
12
14
16
18
20
Luang Prabang
0
20
40
60
80
100
12
/09
13
/09
14
/09
15
/09
16
/09
17
/09
18
/09
19
/09
24
ho
ur
rain
fall
at
7a
m (
mm
)
Jinghong
534
536
538
540
542
544
12
/09
13
/09
14
/09
15
/09
16
/09
17
/09
18
/09
19
/09
ga
ug
e w
ate
r le
ve
l (m
)

Monday, 19th September 2011
Page 8 MRC Weekly Flood Situation Report – Week 12th September – 18
th September 2011
Figure A2: Water level and rainfall for Chiang Khan, Vientiane, Nongkhai, and Paksane
Vientiane
0
2
4
6
8
10
12
14
12
/09
13
/09
14
/09
15
/09
16
/09
17
/09
18
/09
19
/09
ga
ug
e w
ate
r le
ve
l (m
)
0
2
4
6
8
10
12
14
Vientiane
0
20
40
60
80
100
12
/09
13
/09
14
/09
15
/09
16
/09
17
/09
18
/09
19
/09
24
ho
ur
rain
fall
at
7a
m (
mm
)
Nongkhai
0
2
4
6
8
10
12
14
12
/09
13
/09
14
/09
15
/09
16
/09
17
/09
18
/09
19
/09
ga
ug
e w
ate
r le
ve
l (m
)
0
2
4
6
8
10
12
14
Nongkhai
0
30
60
90
120
150
12
/09
13
/09
14
/09
15
/09
16
/09
17
/09
18
/09
19
/09
24
ho
ur
rain
fall
at
7a
m (
mm
)
Paksane
0
2
4
6
8
10
12
14
16
12
/09
13
/09
14
/09
15
/09
16
/09
17
/09
18
/09
19
/09
ga
ug
e w
ate
r le
ve
l (m
)
0
2
4
6
8
10
12
14
16
Paksane
0
30
60
90
120
150
12
/09
13
/09
14
/09
15
/09
16
/09
17
/09
18
/09
19
/09
24
ho
ur
rain
fall
at
7a
m (
mm
)
Chiang Khan
0
2
4
6
8
10
12
14
16
18
20
12
/09
13
/09
14
/09
15
/09
16
/09
17
/09
18
/09
19
/09
ga
ug
e w
ate
r le
ve
l (m
)
0
2
4
6
8
10
12
14
16
18
20
Chiang Khan
0
20
40
60
80
100
12
/09
13
/09
14
/09
15
/09
16
/09
17
/09
18
/09
19
/09
24
ho
ur
rain
fall
at
7a
m (
mm
)

Monday, 19th September 2011
MRC Weekly Flood Situation Report – Week 12th September – 18
th September 2011 Page 9
Figure A3: Water level and rainfall for Nakhon Phanom, Thakhek, Mukdahan and Savannakhet
Thakhek
0
2
4
6
8
10
12
14
16
12
/09
13
/09
14
/09
15
/09
16
/09
17
/09
18
/09
19
/09
ga
ug
e w
ate
r le
ve
l (m
)
0
2
4
6
8
10
12
14
16
Thakhek
0
30
60
90
120
150
12
/09
13
/09
14
/09
15
/09
16
/09
17
/09
18
/09
19
/09
24
ho
ur
rain
fall
at
7a
m (
mm
)
Mukdahan
0
2
4
6
8
10
12
14
12
/09
13
/09
14
/09
15
/09
16
/09
17
/09
18
/09
19
/09
ga
ug
e w
ate
r le
ve
l (m
)
0
2
4
6
8
10
12
14
Mukdahan
0
10
20
30
12
/09
13
/09
14
/09
15
/09
16
/09
17
/09
18
/09
19
/09
24
ho
ur
rain
fall
at
7a
m (
mm
)
Savannakhet
0
2
4
6
8
10
12
14
12
/09
13
/09
14
/09
15
/09
16
/09
17
/09
18
/09
19
/09
ga
ug
e w
ate
r le
ve
l (m
)
0
2
4
6
8
10
12
14
Savannakhet
0
10
20
30
40
50
12
/09
13
/09
14
/09
15
/09
16
/09
17
/09
18
/09
19
/09
24
ho
ur
rain
fall
at
7a
m (
mm
)
Nakhon Phanom
0
2
4
6
8
10
12
14
12
/09
13
/09
14
/09
15
/09
16
/09
17
/09
18
/09
19
/09
ga
ug
e w
ate
r le
ve
l (m
)
0
2
4
6
8
10
12
14
Nakhon Phanom
0
30
60
90
120
150
12
/09
13
/09
14
/09
15
/09
16
/09
17
/09
18
/09
19
/09
24
ho
ur
rain
fall
at
7a
m (
mm
)

Monday, 19th September 2011
Page 10 MRC Weekly Flood Situation Report – Week 12th September – 18
th September 2011
Figure A4: Water level and rainfall for Khong Chiam, Pakse, Stung Treng, and Kratie
Pakse
0
2
4
6
8
10
12
14
12
/09
13
/09
14
/09
15
/09
16
/09
17
/09
18
/09
19
/09
ga
ug
e w
ate
r le
ve
l (m
)
0
2
4
6
8
10
12
14
Pakse
0
20
40
60
80
100
12
/09
13
/09
14
/09
15
/09
16
/09
17
/09
18
/09
19
/09
24
ho
ur
rain
fall
at
7a
m (
mm
)
Stung Treng
0
2
4
6
8
10
12
14
12
/09
13
/09
14
/09
15
/09
16
/09
17
/09
18
/09
19
/09
ga
ug
e w
ate
r le
ve
l (m
)
0
2
4
6
8
10
12
14
Stung Treng
0
20
40
60
80
100
12
/09
13
/09
14
/09
15
/09
16
/09
17
/09
18
/09
19
/09
24
ho
ur
rain
fall
at
7a
m (
mm
)
Kratie
0
4
8
12
16
20
24
12
/09
13
/09
14
/09
15
/09
16
/09
17
/09
18
/09
19
/09
ga
ug
e w
ate
r le
ve
l (m
)
0
4
8
12
16
20
24
Kratie
0
20
40
60
80
100
12
/09
13
/09
14
/09
15
/09
16
/09
17
/09
18
/09
19
/09
24
ho
ur
rain
fall
at
7a
m (
mm
)
Khong Chiam
0
2
4
6
8
10
12
14
16
18
12
/09
13
/09
14
/09
15
/09
16
/09
17
/09
18
/09
19
/09
ga
ug
e w
ate
r le
ve
l (m
)
0
2
4
6
8
10
12
14
16
18
Khong Chiam
0
20
40
60
80
100
12
/09
13
/09
14
/09
15
/09
16
/09
17
/09
18
/09
19
/09
24
ho
ur
rain
fall
at
7a
m (
mm
)

Monday, 19th September 2011
MRC Weekly Flood Situation Report – Week 12th September – 18
th September 2011 Page 11
Figure A5: Water level and rainfall for Kompong Cham, Phnom Penh (Bassac and Port), and Koh Khel
Phnom Penh (Bassac)
0
2
4
6
8
10
12
14
12
/09
13
/09
14
/09
15
/09
16
/09
17
/09
18
/09
19
/09
ga
ug
e w
ate
r le
ve
l (m
)
0
2
4
6
8
10
12
14
Phnom Penh (Bassac)
0
10
20
30
12
/09
13
/09
14
/09
15
/09
16
/09
17
/09
18
/09
19
/09
24
ho
ur
rain
fall
at
7a
m (
mm
)
Phnom Penh Port
0
2
4
6
8
10
12
12
/09
13
/09
14
/09
15
/09
16
/09
17
/09
18
/09
19
/09
ga
ug
e w
ate
r le
ve
l (m
)
0
2
4
6
8
10
12
Phnom Penh Port
0
10
12
/09
13
/09
14
/09
15
/09
16
/09
17
/09
18
/09
19
/09
24
ho
ur
rain
fall
at
7a
m (
mm
)
Koh Khel
0
1
2
3
4
5
6
7
8
9
12
/09
13
/09
14
/09
15
/09
16
/09
17
/09
18
/09
19
/09
ga
ug
e w
ate
r le
ve
l (m
)
0
1
2
3
4
5
6
7
8
9
Koh Khel
0
10
20
30
40
50
12
/09
13
/09
14
/09
15
/09
16
/09
17
/09
18
/09
19
/09
24
ho
ur
rain
fall
at
7a
m (
mm
)
Kompong Cham
0
2
4
6
8
10
12
14
16
18
12
/09
13
/09
14
/09
15
/09
16
/09
17
/09
18
/09
19
/09
ga
ug
e w
ate
r le
ve
l (m
)
0
2
4
6
8
10
12
14
16
18
Kompong Cham
0
10
20
30
12
/09
13
/09
14
/09
15
/09
16
/09
17
/09
18
/09
19
/09
24
ho
ur
rain
fall
at
7a
m (
mm
)

Monday, 19th September 2011
Page 12 MRC Weekly Flood Situation Report – Week 12th September – 18
th September 2011
Figure A6: Water level and rainfall for Neak Luong, Prek Kdam, Tan Chau and Chau Doc
Neak Luong
0
1
2
3
4
5
6
7
8
9
12
/09
13
/09
14
/09
15
/09
16
/09
17
/09
18
/09
19
/09
ga
ug
e w
ate
r le
ve
l (m
)
0
1
2
3
4
5
6
7
8
9
Neak Luong
0
10
20
30
12
/09
13
/09
14
/09
15
/09
16
/09
17
/09
18
/09
19
/09
24
ho
ur
rain
fall
at
7a
m (
mm
)
Prek Kdam
0
2
4
6
8
10
12
12
/09
13
/09
14
/09
15
/09
16
/09
17
/09
18
/09
19
/09
ga
ug
e w
ate
r le
ve
l (m
)
0
2
4
6
8
10
12
Prek Kdam
0
10
20
30
40
50
12
/09
13
/09
14
/09
15
/09
16
/09
17
/09
18
/09
19
/09
24
ho
ur
rain
fall
at
7a
m (
mm
)
Tan Chau
0
1
2
3
4
5
12
/09
13
/09
14
/09
15
/09
16
/09
17
/09
18
/09
19
/09
ga
ug
e w
ate
r le
ve
l (m
)
0
1
2
3
4
5
Tan Chau
0
10
20
30
12
/09
13
/09
14
/09
15
/09
16
/09
17
/09
18
/09
19
/09
24
ho
ur
rain
fall
at
7a
m (
mm
)
Chau Doc
0
1
2
3
4
5
12
/09
13
/09
14
/09
15
/09
16
/09
17
/09
18
/09
19
/09
ga
ug
e w
ate
r le
ve
l (m
)
0
1
2
3
4
5
Chau Doc
0
10
20
30
12
/09
13
/09
14
/09
15
/09
16
/09
17
/09
18
/09
19
/09
24
ho
ur
rain
fall
at
7a
m (
mm
)

Monday, 19th September 2011
MRC Weekly Flood Situation Report – Week 12th September – 18
th September 2011 Page 13
Annex B: Accuracy and performance
Accuracy
“Accuracy” describes the accuracy of the adjusted and published forecast, based on the results of the MRC Mekong Flood Forecasting System, which are then adjusted by the Flood Forecaster in Charge taking into consideration known biases in input data and his/her knowledge of the response of the model system and the hydrology of the Mekong River Basin. The information is presented as a graph below, showing the average flood forecasting accuracy along the Mekong mainstream.
In general, the overall accuracy is good for 1-day and 3-day forecast lead time at most stations; however accuracies at stations Luang Prabang and Khong Chiam for 4-day to 5-day forecast were less than expected.
The above differences due to 3 main factors: (1) high variability of the SRE and NWP when appearance of critical weather pattern as ITCZ; (2) internal model functionality in forecasting for middle reach of the LMB in taking into account flow contribution from tributaries, for which the parameter adjustment in the model is not possible; (3) the adjustment by flood forecaster-in-charge at those stations.
Figure B1: Average flood forecast accuracy along the Mekong mainstream

Monday, 19th September 2011
Page 14 MRC Weekly Flood Situation Report – Week 12th September – 18
th September 2011
Forecast Achievement
The forecast achievement indicates the % of days that the forecast at a particular station for a lead-time is successful against a respective benchmark (Table B2).
Table B1: Achievement of daily forecast against benchmarks unit in %
Ch
ian
g S
ae
n
Lu
an
g P
rab
an
g
Ch
ian
g K
ha
n
Vie
ntia
ne
No
ng
kh
ai
Pa
ksa
ne
Na
kh
on
P
ha
no
m
Th
akh
ek
Mu
kd
ah
an
Sa
va
nn
akh
et
Kh
on
g C
hia
m
Pa
kse
Stu
ng
Tre
ng
Kra
tie
Ko
mp
on
g C
ha
m
Ph
no
m P
en
h
(Ba
ssa
c)
Ph
no
m P
en
h
Po
rt
Ko
h K
he
l
Ne
ak L
uo
ng
Pre
k K
da
m
Ta
n C
ha
u
Ch
au
Do
c
Ave
rag
e
1-day 71.4 85.7 71.4 71.4 85.7 57.1 42.9 71.4 71.4 57.1 28.6 42.9 42.9 42.9 100.0 100.0 85.7 100.0 100.0 100.0 100.0 100.0 74.0
2-day 100.0 66.7 100.0 83.3 83.3 66.7 66.7 50.0 66.7 66.7 33.3 50.0 33.3 50.0 100.0 83.3 83.3 100.0 100.0 100.0 100.0 100.0 76.5
3-day 100.0 20.0 80.0 100.0 80.0 40.0 20.0 40.0 20.0 40.0 0.0 40.0 40.0 20.0 80.0 80.0 60.0 100.0 80.0 100.0 100.0 100.0 60.9
4-day 100.0 25.0 50.0 75.0 100.0 50.0 50.0 50.0 50.0 75.0 0.0 25.0 100.0 50.0 100.0 50.0 100.0 100.0 100.0 100.0 100.0 100.0 70.5
5-day 100.0 33.3 66.7 33.3 33.3 33.3 33.3 66.7 33.3 100.0 0.0 33.3 66.7 100.0 100.0 100.0 100.0 100.0 100.0 100.0 100.0 100.0 69.7
Table B2: Benchmarks of success (Indicator of accuracy in mean absolute error) Unit in cm
Ch
ian
g S
ae
n
Lu
an
g P
rab
an
g
Ch
ian
g K
ha
n
Vie
ntia
ne
No
ng
kh
ai
Pa
ksa
ne
Na
kh
on
P
ha
no
m
Th
akh
ek
Mu
kd
ah
an
Sa
va
nn
akh
et
Kh
on
g C
hia
m
Pa
kse
Stu
ng
Tre
ng
Kra
tie
Ko
mp
on
g C
ha
m
Ph
no
m P
en
h
(Ba
ssa
c)
Ph
no
m P
en
h
Po
rt
Ko
h K
he
l
Ne
ak L
uo
ng
Pre
k K
da
m
Ta
n C
ha
u
Ch
au
Do
c
1-day 25 25 25 10 10 10 10 10 10 10 10 10 10 10 10 10 10 10 10 10 10 10
2-day 50 50 50 25 25 25 25 25 25 25 25 25 25 25 25 10 10 10 10 10 10 10
3-day 50 50 50 25 25 25 25 25 25 25 25 25 25 25 25 10 10 10 10 10 10 10
4-day 75 75 50 50 50 50 50 50 50 50 50 50 50 50 50 10 25 10 25 25 10 10
5-day 75 75 50 50 50 50 50 50 50 50 50 50 50 50 50 25 25 25 25 25 25 25
Note: An indication of the accuracy given in the Table B2 is based on the performance of the forecast made in 2008 from the new flood forecasting system and the configuration for the 2009 flood season and is published on the website of MRC (http://ffw.mrcmekong.org/accuracy.htm).
A new set of performance indicators that is established by combining international standards and the specific circumstances in the Mekong River Basin is applied officially for the flood season of 2011 onward.

Monday, 19th September 2011
MRC Weekly Flood Situation Report – Week 12th September – 18
th September 2011 Page 15
Performance
Performance is assessed by evaluating a number of performance indicators, see table and graphs below:
Table B3: Overview of performance indicators for the past 5 days including the current report date
2011 FF
co
mp
lete
d
an
d s
en
t (t
ime
)
sta
tio
ns w
ith
ou
t
fore
ca
st
FF
2 c
om
ple
ted
an
d s
en
t (t
ime
)
We
ath
er
info
rma
itio
n
ava
ilab
le
(nu
mb
er)
NO
AA
da
ta
Ch
ina
Ca
mb
od
ia -
DH
RW
Ca
mb
od
ia -
DO
M
La
o P
DR
-
DM
H
Th
aila
nd
-
DW
R
Vie
t N
am
-
NC
HM
F
NO
AA
da
ta
Ch
ina
Ca
mb
od
ia -
DH
RW
Ca
mb
od
ia -
DO
M
La
o P
DR
-
DM
H
Th
aila
nd
-
DW
R
Vie
t N
am
-
NC
HM
F
week 10:37 0 - 5 08:08 08:19 07:23 06:27 09:07 07:41 06:58 0 0 10 46 143 3 44
month 10:33 0 - 14 08:09 08:13 07:21 06:05 09:06 07:46 07:00 0 0 12 139 489 4 197
season 10:29 4 00:00 60 08:12 08:19 07:35 06:10 08:54 07:52 07:11 3 16 39 883 1852 150 608
Flood Forecast: time sent Arrival time of input data (average) Missing data (number)
Week is the week for which this report is made; Month is actually the last 30 days (or less if the flood season has just begun); Season is the current flood season up to the date of this report.
Data Delivery - Delivery Times
07:00
08:00
09:00
10:00
12/09 13/09 14/09 15/09 16/09 17/09 18/09 19/09 Date
Time
NOAA
China
CAM DHRW
CAM DOM
LAO DMH
THAI DWR
VN NCHMF
Figure B2: Data delivery times for the past 8 days including the current report date

Monday, 19th September 2011
Page 16 MRC Weekly Flood Situation Report – Week 12th September – 18
th September 2011
Data Delivery - Missing Data
0
10
20
30
40
50
12/09 13/09 14/09 15/09 16/09 17/09 18/09 19/09 Date
Number
NOAA
China
CAM DHRW
CAM DOM
LAO DMH
THAI DWR
VN NCHMF
Figure B3: Missing data for the past 8 days including the current report date
Flood Forecast - Completion Time
09:00
10:00
11:00
12/09 13/09 14/09 15/09 16/09 17/09 18/09 19/09Date
Time
Figure B4: Flood forecast completion time
Flood Forecast - Stations without Forecast
0
2
4
6
8
10
12/09 13/09 14/09 15/09 16/09 17/09 18/09 19/09Date
Figure B5: Flood forecast stations without forecast
Flood Forecast - Second Forecast Needed
09:00
10:00
11:00
12:00
13:00
14:00
15:00
12/09 13/09 14/09 15/09 16/09 17/09 18/09 19/09Date
Time
Figure B6: Second forecast needed

Monday, 19th September 2011
MRC Weekly Flood Situation Report – Week 12th September – 18
th September 2011 Page 17
Annex C: Season Water Level Graphs
This Annex has the water level graphs of the report date. These graphs are distributed daily by email together with the Flood Bulletins.
HYDROGRAPHS OF THE MEKONG AT MAINSTREAM STATIONS
IN FLOOD SEASON FROM 1 JUNE TO 31 OCTOBER
Water level at 7am of Mekong at Chiang Saen
0
2
4
6
8
10
12
14
01-Jun 16-Jun 01-Jul 16-Jul 31-Jul 15-Aug 30-Aug 14-Sep 29-Sep 14-Oct 29-Oct
Time in days
Gauge h
eig
ht in
metr
es
Alarm Flood Av80-10 1992 1998 2000 2010 2011
Water level at 7am of Mekong at Luang Prabang
0
2
4
6
8
10
12
14
16
18
20
01-Jun 16-Jun 01-Jul 16-Jul 31-Jul 15-Aug 30-Aug 14-Sep 29-Sep 14-Oct 29-Oct
Time in days
Gauge h
eig
ht in
metr
es
Alarm Flood Av80-10 1992 1998 2000 2010 2011
Water level at 7am of Mekong at Jing Hong
534
536
538
540
542
544
546
548
15-Jun 30-Jun 15-Jul 30-Jul 14-Aug 29-Aug 13-Sep 28-Sep 13-Oct 28-Oct
Time in days
Gauge h
eig
ht in
metr
es
Av98-10 1998 2000 2010 2011

Monday, 19th September 2011
Page 18 MRC Weekly Flood Situation Report – Week 12th September – 18
th September 2011
Water level at 7am of Mekong at Chiang Khan
0
2
4
6
8
10
12
14
16
18
20
01-Jun 16-Jun 01-Jul 16-Jul 31-Jul 15-Aug 30-Aug 14-Sep 29-Sep 14-Oct 29-Oct
Time in days
Ga
ug
e h
eig
ht
in m
etr
es
Alarm Flood Av80-10 1992 1998 2000 2010 2011
Water level at 7am of Mekong at Vientiane Km4
0
2
4
6
8
10
12
14
01-Jun 16-Jun 01-Jul 16-Jul 31-Jul 15-Aug 30-Aug 14-Sep 29-Sep 14-Oct 29-Oct
Time in days
Ga
ug
e h
eig
ht
in m
etr
es
Alarm Flood Av80-10 1992 1998 2000 2010 2011
Water level at 7am of Mekong at Nong Khai
0
2
4
6
8
10
12
14
01-Jun 16-Jun 01-Jul 16-Jul 31-Jul 15-Aug 30-Aug 14-Sep 29-Sep 14-Oct 29-Oct
Time in days
Ga
ug
e h
eig
ht
in m
etr
es
Alarm Flood Av80-10 1992 1998 2000 2010 2011

Monday, 19th September 2011
MRC Weekly Flood Situation Report – Week 12th September – 18
th September 2011 Page 19
Water level at 7am of Mekong at Paksane
0
2
4
6
8
10
12
14
16
01-Jun 16-Jun 01-Jul 16-Jul 31-Jul 15-Aug 30-Aug 14-Sep 29-Sep 14-Oct 29-Oct
Time in days
Ga
ug
e h
eig
ht
in m
etr
es
Alarm Flood Av80-10 1992 1998 2000 2010 2011
Water level at 7am of Mekong at Nakhon Phanom
0
2
4
6
8
10
12
14
01-Jun 16-Jun 01-Jul 16-Jul 31-Jul 15-Aug 30-Aug 14-Sep 29-Sep 14-Oct 29-Oct
Time in days
Ga
ug
e h
eig
ht
in m
etr
es
Alarm Flood Av80-10 1992 1998 2000 2010 2011
Water level at 7am of Mekong at Thakhek
0
2
4
6
8
10
12
14
16
01-Jun 16-Jun 01-Jul 16-Jul 31-Jul 15-Aug 30-Aug 14-Sep 29-Sep 14-Oct 29-Oct
Time in days
Ga
ug
e h
eig
ht
in m
etr
es
Alarm Flood Av80-10 1992 1998 2000 2010 2011
Monday, 19th September 2011
Page 20 MRC Weekly Flood Situation Report – Week 12th September – 18
th September 2011
Water level at 7am of Mekong at Savannakhet
0
2
4
6
8
10
12
14
01-Jun 16-Jun 01-Jul 16-Jul 31-Jul 15-Aug 30-Aug 14-Sep 29-Sep 14-Oct 29-Oct
Time in days
Ga
ug
e h
eig
ht
in m
etr
es
Alarm Flood Av80-10 1992 1998 2000 2010 2011
Water level at 7am of Mekong at Mukdahan
0
2
4
6
8
10
12
14
01-Jun 16-Jun 01-Jul 16-Jul 31-Jul 15-Aug 30-Aug 14-Sep 29-Sep 14-Oct 29-Oct
Time in days
Ga
ug
e h
eig
ht
in m
etr
es
Alarm Flood Av80-10 1992 1998 2000 2010 2011
Water level at 7am of Mekong at Paksé
0
2
4
6
8
10
12
14
01-Jun 16-Jun 01-Jul 16-Jul 31-Jul 15-Aug 30-Aug 14-Sep 29-Sep 14-Oct 29-Oct
Time in days
Ga
ug
e h
eig
ht
in m
etr
es
Alarm Flood Av80-10 1992 1998 2000 2010 2011

Monday, 19th September 2011
MRC Weekly Flood Situation Report – Week 12th September – 18
th September 2011 Page 21
Water level at 7am of Mekong at Stung Treng
0
2
4
6
8
10
12
14
01-Jun 16-Jun 01-Jul 16-Jul 31-Jul 15-Aug 30-Aug 14-Sep 29-Sep 14-Oct 29-Oct
Time in days
Ga
ug
e h
eig
ht
in m
etr
es
Alarm Flood Av80-10 1992 1998 2000 2010 2011
Water level at 7am of Mekong at Kratie
0
2
4
6
8
10
12
14
16
18
20
22
24
26
01-Jun 16-Jun 01-Jul 16-Jul 31-Jul 15-Aug 30-Aug 14-Sep 29-Sep 14-Oct 29-Oct
Time in days
Ga
ug
e h
eig
ht
in m
etr
es
Alarm Flood Av80-10 1992 1998 2000 2010 2011
Water level at 7am of Mekong at Kompong cham
0
2
4
6
8
10
12
14
16
18
01-Jun 16-Jun 01-Jul 16-Jul 31-Jul 15-Aug 30-Aug 14-Sep 29-Sep 14-Oct 29-Oct
Time in days
Ga
ug
e h
eig
ht
in m
etr
es
Alarm Flood Av80-10 1992 1998 2000 2010 2011
Monday, 19th September 2011
Page 22 MRC Weekly Flood Situation Report – Week 12th September – 18
th September 2011
Water level at 7am at Phnom Penh Chaktomuk
0
2
4
6
8
10
12
14
16
01-Jun 16-Jun 01-Jul 16-Jul 31-Jul 15-Aug 30-Aug 14-Sep 29-Sep 14-Oct 29-Oct
Time in days
Ga
ug
e h
eig
ht
in m
etr
es
Alarm Flood Av80-10 1992 1998 2000 2010 2011
Water level at 7am of Tonle Sap at Phnom Penh Port
0
2
4
6
8
10
12
14
16
01-Jun 16-Jun 01-Jul 16-Jul 31-Jul 15-Aug 30-Aug 14-Sep 29-Sep 14-Oct 29-Oct
Time in days
Ga
ug
e h
eig
ht
in m
etr
es
Alarm Flood Av80-10 1992 1998 2000 2010 2011
Water level at 7am of Bassac at Koh Khel
0
1
2
3
4
5
6
7
8
9
01-Jun 16-Jun 01-Jul 16-Jul 31-Jul 15-Aug 30-Aug 14-Sep 29-Sep 14-Oct 29-Oct
Time in days
Ga
ug
e h
eig
ht
in m
etr
es
Alarm Flood Av80-10 1992 1998 2000 2010 2011
Monday, 19th September 2011
MRC Weekly Flood Situation Report – Week 12th September – 18
th September 2011 Page 23
Water level at 7am of Mekong at Neak Luong
0
1
2
3
4
5
6
7
8
9
01-Jun 16-Jun 01-Jul 16-Jul 31-Jul 15-Aug 30-Aug 14-Sep 29-Sep 14-Oct 29-Oct
Time in days
Gauge h
eig
ht in
metres
Alarm Flood Av80-10 1992 1998 2000 2010 2011
Water level at 7am of Tonle Sap at Prek Kdam
0
2
4
6
8
10
12
01-Jun 16-Jun 01-Jul 16-Jul 31-Jul 15-Aug 30-Aug 14-Sep 29-Sep 14-Oct 29-Oct
Time in days
Gauge h
eig
ht in
metres
Alarm Flood Av80-10 1992 1998 2000 2010 2011
Water level at 7am of Mekong at Tan Chau
-1
0
1
2
3
4
5
6
01-Jun 16-Jun 01-Jul 16-Jul 31-Jul 15-Aug 30-Aug 14-Sep 29-Sep 14-Oct 29-Oct
Time in days
Gauge h
eig
ht in
metres
Alarm Flood Av80-10 1992 1998 2000 2010 2011
Water level at 7am of Bassac at Chau Doc
-1
0
1
2
3
4
5
6
01-Jun 16-Jun 01-Jul 16-Jul 31-Jul 15-Aug 30-Aug 14-Sep 29-Sep 14-Oct 29-Oct
Time in days
Gauge h
eig
ht in
metres
Alarm Flood Av80-10 1992 1998 2000 2010 2011
Related Documents


![Flood Mitigation Planning for the Upper Wapsipinicon River ......Regulation Checklist that are important for flood mitigation planning [1]. There is a section for each flood mitigation](https://static.cupdf.com/doc/110x72/5f23df6e5f50b45b8f2214fc/flood-mitigation-planning-for-the-upper-wapsipinicon-river-regulation-checklist.jpg)