Regional Economic Integration in Asia and the Pacific Cyn-Young Park Director of Regional Cooperation and Integration Economic Research and Regional Cooperation Department (ERCD) Asian Development Bank ADB-KIEA-UNESCAP Conference 13-14 June 2017 | Seoul, Korea

Welcome message from author
This document is posted to help you gain knowledge. Please leave a comment to let me know what you think about it! Share it to your friends and learn new things together.
Transcript

Regional Economic Integration in Asia and the Pacific
Cyn-Young Park Director of Regional Cooperation and Integration
Economic Research and Regional Cooperation Department (ERCD)
Asian Development Bank
ADB-KIEA-UNESCAP Conference
13-14 June 2017 | Seoul, Korea

Outline
• Regional Economic Integration: Progress and Challenges
• Asia-Pacific Regional Integration Index
• Construction
• Interpretation
• Comparison with other regions
• Key findings
• Summary
2

Regional integration continue to deepen
3
Intraregional shares as % of total
FDI = based on inward foreign direct investment (flows data); Equity = based on equity asset holdings (stock data); Debt = based on debt asset holdings (stock
data).
Notes:
1. Trade, equity and debt data as of January to June 2016 (H1 2016).
2. Migration data in 2001 and 2015; available every 5 years.
3. Remittance data only available starting in 2010.
Source: ADB calculations using data from Association of Southeast Asian Nations (ASEAN) Secretariat, International Monetary Fund, Organisation for Economic
Co-operation and Development, United Nations, World Bank, and national sources.

Regional Integration
4
• Deeper regional integration offers economic and non-
economic benefits
• Economic gains by expanding markets, boosting
industrialization, enhancing market structure, fostering
productivity and investment opportunities
• Non-negligible non-economic gains by improving
political/security stability and socio-cultural harmonization
• Asia-Pacific made significant progress in regional
economic integration—but the degree of regional
integration remains illusive
• Policy needs for a tool to monitor and evaluate
progress against set goals

Asia-Pacific Regional Integration Index
5

Why a Composite Index?
• Regional integration is a multidimensional phenomenon and may not be captured by a single variable alone
• A composite index is constructed from compiling various indicators into a single index and allows for summarizing complex and multidimensional issues
• The index can assist in decision-making; improve accountability; and facilitate communication with general public
6

Introducing Asia-Pacific Regional Integration Index (APRII)
7
• Aims to assess the degree of integration in Asia-Pacific and
its subregions; identify strengths and weaknesses of
regional integration across different regions and different
dimensions; and monitor progress over time and against
the set goals
• Most comprehensive dataset: constructed from 26
indicators based on bilateral data, expressed as a ratio of
intra-regional sum (or average) to total sum (or average)
• Design of composite index: (OECD, 2008)
• Creation of six dimensional indexes and their overall index
• All indexes constructed by weight-averaging their respective
components, with weights determined by principal component
analysis (PCA)

Benefits of PCA
8
• Reduction of data dimensionality
(e.g., TV 2-dimensional, the subjects 3-dimensional)
• PCA summarizes a dataset into a smaller number of
dimensions while preserving the variation in the data to the
maximum extent possible
• Suppose a vector of two variables, X1, and X2
Z1=a11X1 + a21X2 Z2=a12X1 + a22X2
• PCA chooses the weights that maximize the variance of Z
• Amount to solving eigenvalues/eigenvectors of E(X’X)
• Var(Z1)≥Var(Z2), and Z2 is orthogonal to Z1

Structure of APRII
9
R1.
Trade and
Investment
Integration
R11 Proportion of intra-regional goods exports to total goods exports
R12 Proportion of intra-regional goods imports to total goods imports
R13 Intra-regional trade intensity index
R14 Proportion of intra-regional FDI inflows to total FDI inflows
R15 Proportion of intra-regional FDI inflows plus outflows to total FDI inflows plus outflows
R2.
Money and Finance
Integration
R21 Proportion of intra-regional cross-border equity liabilities to total cross-border equity liabilities
R22 Proportion of intra-regional cross-border bond liabilities to total cross-border bond liabilities
R23 Pair-wise dispersion of deposit rates averaged regionally relative to that averaged globally
R24 Pair-wise correlation of equity returns averaged regionally minus that averaged globally
R3.
Regional Value
Chain
R31 Ratio between the averaged trade complementarity index over regional trading partners and the averaged trade
complementarity index over all trading partners
R32 Ratio between the averaged trade concentration index over regional trading partners and the averaged trade
concentration index over all trading partners
R33 Proportion of intra-regional intermediate goods exports to total intra-regional goods exports
R34 Proportion of intra-regional intermediate goods imports to total intra-regional goods imports
R4.
Infrastructure and
Connectivity
R41 Ratio between the averaged trade cost over regional trading partners and the averaged trade cost over all trading
partners
R42 Ratio between the averaged liner shipping connectivity index over regional trading partners and the averaged liner
shipping connectivity index over all trading partners
R43 Logistics performance index (overall)
R44 Doing Business Index (overall)
R5.
Free Movement of
People
R51 Proportion of intra-regional outbound migration to total outbound migration
R52 Proportion of intra-regional tourists to total tourists (inbound plus outbound)
R53 Proportion of intra-regional remittances to total remittances
R54 Proportion of other Asian countries that do not require an entry visa
R6.
Institutional and
Social Integration
R61 Proportion of other Asian countries that have signed FTAs with
R62 Proportion of other Asian countries that have an embassy
R63 Proportion of other Asian countries that have signed business investment treaties with
R64 Proportion of other Asian countries that have signed double taxation treaties with
R65 Cultural proximity with other Asian countries relative to that with all other countries
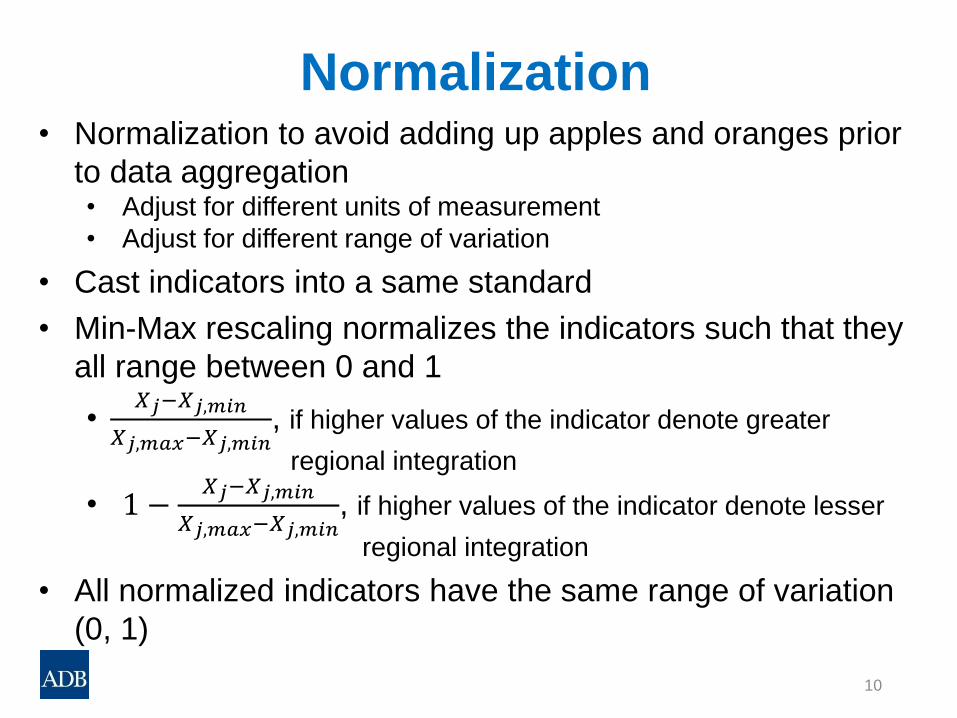
Normalization
10
• Normalization to avoid adding up apples and oranges prior
to data aggregation • Adjust for different units of measurement
• Adjust for different range of variation
• Cast indicators into a same standard
• Min-Max rescaling normalizes the indicators such that they
all range between 0 and 1
•𝑋𝑗−𝑋𝑗,𝑚𝑖𝑛
𝑋𝑗,𝑚𝑎𝑥−𝑋𝑗,𝑚𝑖𝑛, if higher values of the indicator denote greater
regional integration
• 1 −𝑋𝑗−𝑋𝑗,𝑚𝑖𝑛
𝑋𝑗,𝑚𝑎𝑥−𝑋𝑗,𝑚𝑖𝑛, if higher values of the indicator denote lesser
regional integration
• All normalized indicators have the same range of variation
(0, 1)
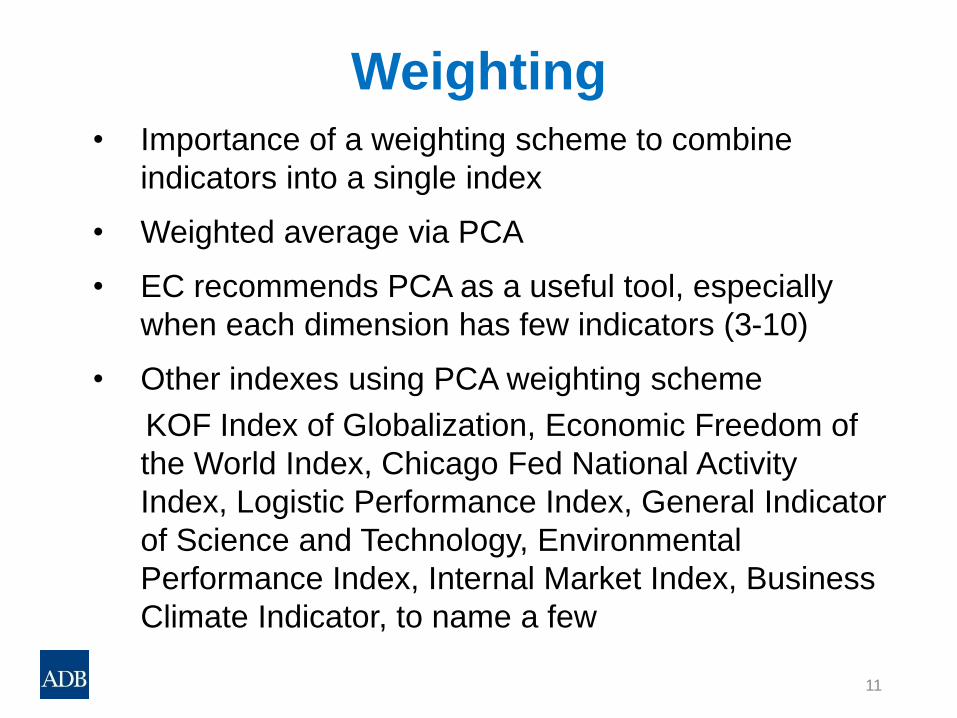
Weighting
11
• Importance of a weighting scheme to combine
indicators into a single index
• Weighted average via PCA
• EC recommends PCA as a useful tool, especially
when each dimension has few indicators (3-10)
• Other indexes using PCA weighting scheme
KOF Index of Globalization, Economic Freedom of
the World Index, Chicago Fed National Activity
Index, Logistic Performance Index, General Indicator
of Science and Technology, Environmental
Performance Index, Internal Market Index, Business
Climate Indicator, to name a few

Comparison with Other Regional Integration Indexes
12
• African Regional Integration Index: African Union Commission,
African Development Bank, UN Economic Commission for Africa
• First edition in 2016
• Min-Max rescaling
• Five dimensions and a total of 16 indicators
• No account for possible roles of the financial market in promoting
regional integration
• Weighting by arithmetic average (i.e., equal weighting) • Justifiable when many indicators (50-100) with a lack of consensus on
weighting
• A problem of double counting if indicators are highly correlated
• May assign a higher weight to the dimension that contains more
indicators
• PCA
• Correct for overlapping information between correlated indictors (No
double counting)
• No problem with different number of indicators in dimensions

Comparison with Other Asian Regional Integration Indexes
13
• Naeher, 2015, ADB Working Paper No. 445
• Measuring untapped potential of Asian countries for further integration
• Data Envelopment Analysis (efficiency frontier)
• Three dimensions of trade and investment, monetary and financial, and
cross-border mobility, with a total of 8 indicators
• A simple average used to yield an overall index of regional integration
• Madhur, 2016, UN-ESCAP
• Regional integration in terms of geography, infrastructure, connectivity,
economic policies, institutions, governance and rules of law
• Rankings (1 to 5) for Asia’s sub-regions based on expert judgment
• No country-level analysis
• Albis, ADB, Manuscript
• A dynamic factor model is estimated for each dimension of trade, finance, and
investment
• A simple average used to produce an overall index of regional integration

(1) Dimensional composite index (2) Overall index
R1
R2
R3
APRII
R4
R5
R6
Dimension 1 R11 R12 R13 R14 R15
Dimension 4 R41 R42 R43 R44
Dimension 3 R31 R32 R33 R34
Dimension 6 R61 R62 R63 R64 R65
Dimension 5 R51 R52 R53 R54
Dimension 2 R21 R22 R23 R24
Number of PCs=2
Number of PCs=2
Number of PCs=2
Number of PCs=2
Number of PCs=2
Number of PCs=2
Number of PCs=3
Construction

PCA Results
15
• No universal rules as to how many principal components should be
retained
• The standard practice is to choose components that
(1) have associated eigenvalues exceeding one (Kaiser criterion);
(2) contribute individually to the explanation of total variance by at least
10%;
(3) contribute cumulatively to explain more than 60% of total variance

Weighting
16
• In each step, the components are weight-averaged, with weights
determined by PCA
• The indicators appear to be given quantitatively different weights
across dimensions. This is consistent with our strategy of not using
the arithmetic average (i.e., equal weighting)
• Nardo et al. (2011) recommend a positive correlation of 0.4 to 0.8
between the dimensional and overall indexes. Our results coincide
with their criterion, as the corresponding cross correlations range from
0.53 to 0.76

Asia Regional Integration Index: Overall
17

Asia regional integration index: Dimensions (in order of overall ranking)
18

Asia regional integration index: Dimensions (in order of overall ranking)
19
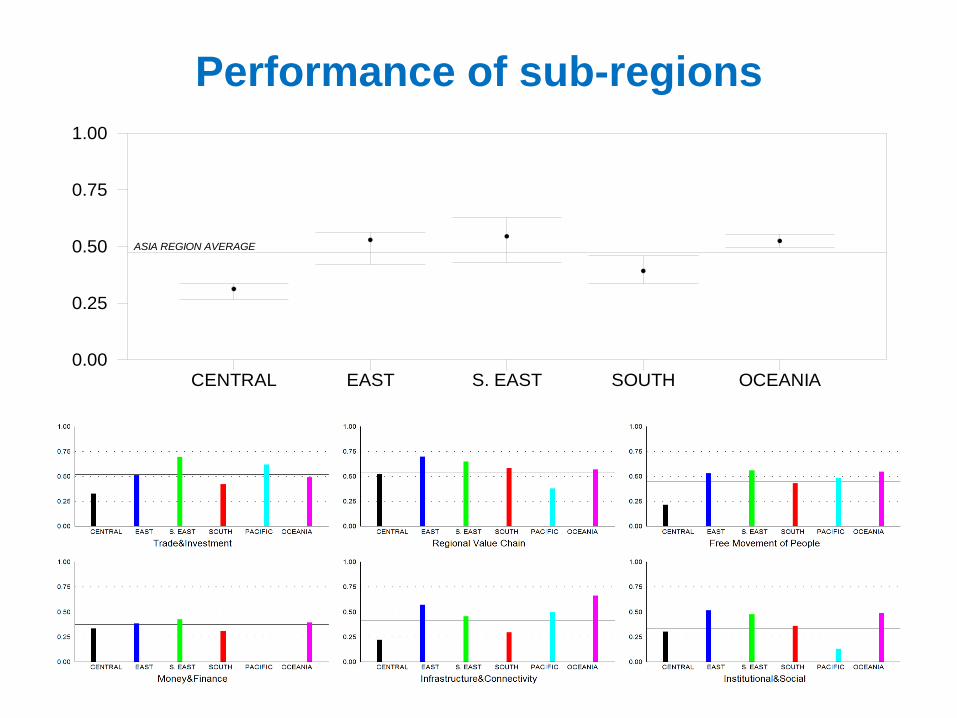
Performance of sub-regions
20
CENTRAL EAST S. EAST SOUTH OCEANIA0.00
0.25
0.50
0.75
1.00
ASIA REGION AVERAGE

Asia-Pacific Regional Integration Index
21
0.0
0.2
0.4
0.6
0.8
1.0
Trade and InvestmentIntegration
Money and FinanceIntegration
Regional Value Chain
Infrastructure andConnectivity
Free Movement of People
Insititutional and SocialIntegration
Central East Southeast South Oceania Pacific
Source: ADB estimates.

Asia regional integration index: Subregions (1)
22
0.0
0.2
0.4
0.6
0.8
1.0
Trade andInvestmentIntegration
Money andFinance
Integration
RegionalValue Chain
Infrastructureand
Connectivity
FreeMovement of
People
Insititutionaland SocialIntegration
Brunei Darussalam CambodiaIndonesia Lao PDRMalaysia MyanmarPhilippines SingaporeThailand Viet Nam
Southeast Asia East Asia
0.0
0.2
0.4
0.6
0.8
1.0
Trade andInvestmentIntegration
Money andFinance
Integration
Regional ValueChain
Infrastructureand
Connectivity
Free Movementof People
Insititutionaland SocialIntegration
PRC Hong Kong, China
Japan Korea, Rep. of
Mongolia Taipei,China

Asia regional integration index: Subregions (2)
23
South Asia Central Asia
0.0
0.2
0.4
0.6
0.8
1.0
Trade andInvestmentIntegration
Money andFinance
Integration
RegionalValue Chain
Infrastructureand
Connectivity
FreeMovement of
People
Insititutionaland SocialIntegration
Afghanistan Bangladesh BhutanIndia Maldives NepalPakistan Sri Lanka
0.0
0.2
0.4
0.6
0.8
Trade andInvestmentIntegration
Money andFinance
Integration
RegionalValue Chain
Infrastructureand
Connectivity
FreeMovement of
People
Insititutionaland SocialIntegration
Armenia Azerbaijan
Georgia Kazakhstan
Kyrgyz Republic Tajikistan
Turkmenistan Uzbekistan
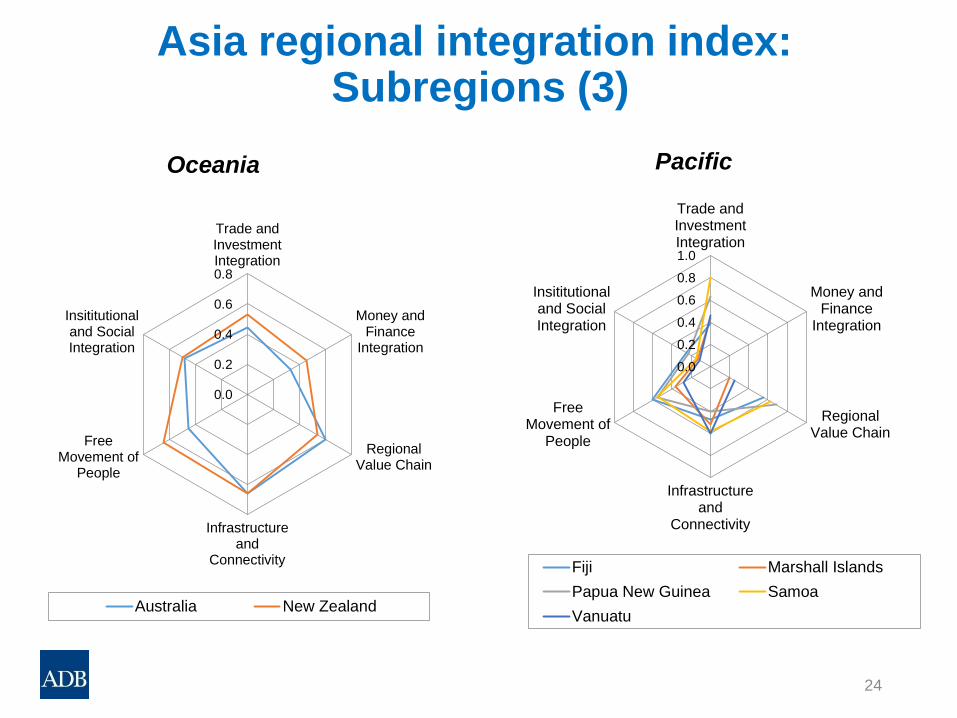
Asia regional integration index: Subregions (3)
24
Oceania Pacific
0.0
0.2
0.4
0.6
0.8
Trade andInvestmentIntegration
Money andFinance
Integration
RegionalValue Chain
Infrastructureand
Connectivity
FreeMovement of
People
Insititutionaland SocialIntegration
Australia New Zealand
0.0
0.2
0.4
0.6
0.8
1.0
Trade andInvestmentIntegration
Money andFinance
Integration
RegionalValue Chain
Infrastructureand
Connectivity
FreeMovement of
People
Insititutionaland SocialIntegration
Fiji Marshall Islands
Papua New Guinea Samoa
Vanuatu

Comparison with Other Regions: World-wise normalization
25
• Normalize data based on world maximum and minimum values for all regions
• The indexes can be compared at the same base

World-wise normalization: APRII estimates
26
Asia vs Other Regions
0.0
0.2
0.4
0.6
0.8
1.0
Trade andInvestmentIntegration
Money and FinanceIntegration
Regional ValueChain
Infrastructure andConnectivity
Free Movement ofPeople
Insititutional andSocial Integration
ASEAN Asia Africa Latin America EU

World rankings of the overall regional integration index
27
Rank Country Score Rank Country Score Rank Country Score
1 Poland 0.728 32 Lao PDR 0.495 63 Mongolia 0.383
2 Czech Republic 0.725 33 Korea, Rep. of 0.491 64 Venezuela 0.380
3 Austria 0.721 34 New Zealand 0.486 65 Nepal 0.379
4 Portugal 0.703 35 PRC 0.483 66 Botswana 0.376
5 Belgium 0.699 36 Hong Kong, China 0.481 67 Trinidad and Tobago 0.374
6 Slovak Republic 0.696 37 Indonesia 0.478 68 Mexico 0.373
7 Germany 0.693 38 Paraguay 0.460 69 Mozambique 0.365
8 Finland 0.686 39 Japan 0.458 70 Ecuador 0.362
9 Romania 0.684 40 Chile 0.433 71 Bangladesh 0.361
10 Netherlands 0.677 41 Australia 0.431 72 Uganda 0.360
11 Denmark 0.677 42 Benin 0.427 73 South Africa 0.351
12 Luxembourg 0.673 43 St. Lucia 0.426 74 Jamaica 0.349
13 Sweden 0.670 44 Viet Nam 0.426 75 Kenya 0.348
14 Spain 0.669 45 Zambia 0.425 76 Mali 0.345
15 Ireland 0.665 46 Uruguay 0.425 77 Brazil 0.342
16 Latvia 0.663 47 Colombia 0.423 78 Grenada 0.331
17 Italy 0.661 48 Costa Rica 0.422 79 Pakistan 0.330
18 Slovenia 0.655 49 Togo 0.421 80 Sri Lanka 0.330
19 France 0.650 50 Argentina 0.419 81 Senegal 0.324
20 Lithuania 0.647 51 Philippines 0.414 82 Tanzania 0.322
21 Hungary 0.645 52 Peru 0.410 83 Maldives 0.317
22 Estonia 0.642 53 Rwanda 0.409 84 Kyrgyz Republic 0.307
23 Bulgaria 0.623 54 Ghana 0.407 85 Nigeria 0.300
24 United Kingdom 0.614 55 Niger 0.406 86 Kazakhstan 0.294
25 Greece 0.590 56 Malawi 0.406 87 Mauritius 0.291
26 Malta 0.555 57 Panama 0.405 88 Georgia 0.284
27 Cyprus 0.544 58 Nicaragua 0.400 89 Seychelles 0.265
28 Singapore 0.542 59 India 0.399 90 Morocco 0.258
29 Malaysia 0.536 60 Cambodia 0.395 91 Bahamas, The 0.234
30 Swaziland 0.507 61 Namibia 0.389 92 Algeria 0.222
31 Thailand 0.497 62 Cote d'Ivoire 0.389 93 Sudan 0.218
Key Findings
28
• Large variations in regional integration across subregions and six
dimensions
• Regional integration in Southeast Asia is most advanced
• Trade and investment/regional value chains drive regional
integration in Asia-Pacific
• Regional integration is multidimensional process; lagging areas
(especially, money and finance/institutional and social framework)
require greater attention to promote regional integration
• Asia’s current level of overall regional integration fares better than
those of Latin America and Africa; but lags behind EU
• Trade and investment integration in Asia-Pacific is as advanced
as that in EU
• Institutional and social dimension of regional integration lags in
developing regions

Summary
• Regional integration in Asia-Pacific: Significant progress has been made, but the degree of regional integration varies across different subregions and socioeconomic dimensions
• Advanced trade and investment integration: Asian regional integration has been largely driven by trade and investment integration which is as advanced as that in EU; but progress has been slow in institutional and social dimension
• Regional integration is multidimensional process: Some dimensions (especially, money and finance/institutional and social framework) require greater attention to promote regional integration
29

Thank you!
Cyn-Young Park
Director of Regional Cooperation and Integration
Economic Research and Regional Cooperation Department
Asian Development Bank
Email: [email protected]
30

Extra slides
31

World rankings of the overall regional integration index
32
Rank Country Score Rank Country Score Rank Country Score
1 Poland 0.728 32 Lao PDR 0.495 63 Mongolia 0.383
2 Czech Republic 0.725 33 Korea, Rep. of 0.491 64 Venezuela 0.380
3 Austria 0.721 34 New Zealand 0.486 65 Nepal 0.379
4 Portugal 0.703 35 PRC 0.483 66 Botswana 0.376
5 Belgium 0.699 36 Hong Kong, China 0.481 67 Trinidad and Tobago 0.374
6 Slovak Republic 0.696 37 Indonesia 0.478 68 Mexico 0.373
7 Germany 0.693 38 Paraguay 0.460 69 Mozambique 0.365
8 Finland 0.686 39 Japan 0.458 70 Ecuador 0.362
9 Romania 0.684 40 Chile 0.433 71 Bangladesh 0.361
10 Netherlands 0.677 41 Australia 0.431 72 Uganda 0.360
11 Denmark 0.677 42 Benin 0.427 73 South Africa 0.351
12 Luxembourg 0.673 43 St. Lucia 0.426 74 Jamaica 0.349
13 Sweden 0.670 44 Viet Nam 0.426 75 Kenya 0.348
14 Spain 0.669 45 Zambia 0.425 76 Mali 0.345
15 Ireland 0.665 46 Uruguay 0.425 77 Brazil 0.342
16 Latvia 0.663 47 Colombia 0.423 78 Grenada 0.331
17 Italy 0.661 48 Costa Rica 0.422 79 Pakistan 0.330
18 Slovenia 0.655 49 Togo 0.421 80 Sri Lanka 0.330
19 France 0.650 50 Argentina 0.419 81 Senegal 0.324
20 Lithuania 0.647 51 Philippines 0.414 82 Tanzania 0.322
21 Hungary 0.645 52 Peru 0.410 83 Maldives 0.317
22 Estonia 0.642 53 Rwanda 0.409 84 Kyrgyz Republic 0.307
23 Bulgaria 0.623 54 Ghana 0.407 85 Nigeria 0.300
24 United Kingdom 0.614 55 Niger 0.406 86 Kazakhstan 0.294
25 Greece 0.590 56 Malawi 0.406 87 Mauritius 0.291
26 Malta 0.555 57 Panama 0.405 88 Georgia 0.284
27 Cyprus 0.544 58 Nicaragua 0.400 89 Seychelles 0.265
28 Singapore 0.542 59 India 0.399 90 Morocco 0.258
29 Malaysia 0.536 60 Cambodia 0.395 91 Bahamas, The 0.234
30 Swaziland 0.507 61 Namibia 0.389 92 Algeria 0.222
31 Thailand 0.497 62 Cote d'Ivoire 0.389 93 Sudan 0.218

Asia regional integration index, overall: Excluding Dimension 2 (Money and Finance)
33

Performance of sub-regions, overall: Excluding Dimension 2 (Money and Finance)
34
CENTRAL EAST S. EAST SOUTH PACIFIC OCEANIA PA+OC0.00
0.25
0.50
0.75
1.00
ASIA REGION AVERAGE

World rankings of the overall RII: Excluding Dimension 2 (Money and Finance)
35
Rank Country Score Rank Country Score Rank Country Score
1 Poland 0.727 32 Thailand 0.501 63 Togo 0.413
2 Czech Republic 0.708 33 Hong Kong, China 0.489 64 Philippines 0.410
3 Austria 0.697 34 New Zealand 0.482 65 Namibia 0.404
4 Germany 0.693 35 Indonesia 0.475 66 Congo, Democratic Republic of 0.403
5 Romania 0.688 36 Japan 0.472 67 Trinidad and Tobago 0.399
6 Slovak Republic 0.682 37 Chile 0.469 68 Niger 0.397
7 Portugal 0.677 38 Myanmar 0.467 69 Guatemala 0.394
8 Belgium 0.676 39 Samoa 0.467 70 Mongolia 0.393
9 Finland 0.668 40 Bhutan 0.466 71 Mexico 0.389
10 Denmark 0.664 41 Bolivia 0.462 72 Ghana 0.389
11 Netherlands 0.659 42 Paraguay 0.455 73 Rwanda 0.387
12 Sweden 0.659 43 Brunei Darussalam 0.455 74 El Salvador 0.385
13 Luxembourg 0.643 44 PRC 0.454 75 South Africa 0.385
14 France 0.638 45 Colombia 0.452 76 Cote d'Ivoire 0.382
15 Hungary 0.637 46 Lao PDR 0.445 77 St. Lucia 0.377
16 Ireland 0.636 47 Costa Rica 0.444 78 India 0.376
17 Latvia 0.635 48 Argentina 0.438 79 Ecuador 0.375
18 Spain 0.633 49 Uruguay 0.437 80 Fiji 0.367
19 Italy 0.621 50 Australia 0.434 81 Malawi 0.367
20 Slovenia 0.617 51 Peru 0.434 82 Brazil 0.364
21 United Kingdom 0.607 52 Panama 0.433 83 Mozambique 0.355
22 Lithuania 0.607 53 Burundi 0.428 84 Bangladesh 0.354
23 Bulgaria 0.598 54 Viet Nam 0.428 85 Botswana 0.352
24 Estonia 0.591 55 Papua New Guinea 0.425 86 Uganda 0.352
25 Greece 0.561 56 Venezuela 0.424 87 Nepal 0.349
26 Malaysia 0.555 57 Honduras 0.422 88 Gambia, The 0.345
27 Singapore 0.553 58 Nicaragua 0.421 89 Kenya 0.343
28 Cyprus 0.542 59 Benin 0.420 90 Burkina Faso 0.343
29 Malta 0.530 60 Cambodia 0.419 91 Sri Lanka 0.343
30 Korea, Rep. of 0.507 61 Zimbabwe 0.416 92 Dominican Republic 0.341
31 Swaziland 0.502 62 Zambia 0.414 93 Belize 0.340

World rankings of the overall RII: Excluding Dimension 2 (Money and Finance)
36
Rank Country Score Rank Country Score Rank Country Score
94 Mali 0.337 125 Morocco 0.254 Lesotho
95 Grenada 0.337 126 Ethiopia 0.252
96 Pakistan 0.333 127 Liberia 0.238
97 Maldives 0.327 128 Bahamas, The 0.225
98 Barbados 0.326 129 Sao Tome and Principe 0.224
99 Tanzania 0.324 130 Madagascar 0.223
100 Cape Verde 0.324 131 Algeria 0.221
101 Uzbekistan 0.319 132 Sudan 0.218
102 Senegal 0.318 133 Suriname 0.216
103 Tajikistan 0.312 134 Djibouti 0.200
104 Jamaica 0.310 135 Congo, Republic of 0.176
105 Guyana 0.309 Turkmenistan
106 Cameroon 0.309 Taipei,China
107 Mauritius 0.293 Cook Islands
108 Georgia 0.292 Kiribati
109 Nigeria 0.288 Micronesia, Fed. States.
110 Guinea 0.288 Nauru
111 Kazakhstan 0.281 Palau
112 Vanuatu 0.281 Solomon Islands
113 Angola 0.277 Timor-Leste
114 Armenia 0.272 Tonga
115 Azerbaijan 0.271 Tuvalu
116 Tunisia 0.270 Antigua and Barbuda
117 Marshall Islands 0.270 Dominica
118 Haiti 0.267 St. Kitts and Nevis
119 Sierra Leone 0.265 St. Vincent and the Grenadines
120 Chad 0.263 Central African Republic
121 Gabon 0.259 Comoros
122 Afghanistan 0.258 Equatorial Guinea
123 Kyrgyz Republic 0.256 Eritrea
124 Seychelles 0.254 Guinea-Bissau
Related Documents