Regional Applications of an Index of Biotic Integrity for Use in Water Resource Management David L. Miller, Paul M. Leonard, Robert M. Hughes, James R. Karr, Peter B. Moyle, Lynn H. Schrader, Bruce A. Thompson, Robert A. Daniels, Kurt D. Fausch, Gary A. Fitzhugh, James R. Gammon, David B. Halliwell, Paul L. Angermeier, and Donald J. Orth ABSTRACT The index of biotic integrity (IBI) integrates 12 measures of stream fish assemblages for assessing water resource quality. Initially developed and tested in the Midwest, the IBI recently was adapted for use in western Oregon, northeastern Colorado, New England, the Appalachians of West Virginia and Virginia, and northern California. The concept also was extended to Louisiana estuaries. In regions of low species richness, the IBI proved difficult to apply and often required extensive modification. Adapting the 1BI to those regions required that metrics be replaced, deleted, or added to accommodate regional differences in fish distribution and assemblage structure and function. Frequently replaced metrics include: proportion of individuals as green sunfish (Lepomis cyanellus), proportion of individuals as insectivorous cyprinids, proportion of individuals as hybrids, and number and identity of sunfish and darter species. The proportion of individuals as top carnivore metric was often deleted. Metrics added include total fish biomass and the number and identity of minnow species. These modifications generally followed the original IBI concept and its theoretical underpinnings. Problems remain in establishing tolerance rankings and scoring criteria, and adjusting scoring criteria for gradient differences in streams of similar size. The IBI holds promise for direct biological monitoring because of its strong ecological foundation and flexibility. Vermont, Tennessee Valley Authority, Ohio, Kentucky, and Illinois have incorporated the IBI into their monitoring or standards programs. The IBI thus serves as a quantitative, biological goal for water resource management. Introduction The Regulatory Mandate A principal objective of the 1972 Federal Water Pollution Con- trol Act and its 1977 and 1987 amend- ments is to restore and maintain the biological integrity of the nation's waters. The mandate for biological monitoring is clearly stated or implied in at least 19 sections of the Act and the 1977 amendments (Weber 1980). Nevertheless, most surface water mon- itoring programs rely primarily on mea- surement of physical and chemical pa- rameters. Biological monitoring, when attempted, commonly addresses only toxic effects instead of the wider array of human-induced perturbations that reduce biological integrity. The ration- ale for emphasizing physical/chemical monitoring is that chemical criteria, developed through toxicological stud- ies of standard aquatic organisms, serve as surrogate measures for monitoring biological integrity. Although this ap- proach gives the impression of empir- ical validity, it does not directly mea- sure the biological integrity of surface waters. As a consequence, biological integrity of the nation's waters has continued to decline because other fac- tors, such as physical habitat, are often limiting (Karr and Dudley 1981). In such cases, biological integrity is un- likely to be improved by controlling chemical pollution. We advocate an integrated approach to surface water quality monitoring (Karr 1987). Physical/chemical and di- rect biological monitoring complement and reinforce one another. Manage- ment decisions are incomplete unless both types of information are collected and evaluated. Direct biological mon- itoring is useful to detect water resource problems and to measure the extent and severity of these problems. On the other hand, physical/chemical moni- toring is indispensable for pinpointing When this paper was authored, David L. Miller was a senior scientist with Northrop Sevices, Inc., 200 SW 35th Street, Corvallis, OR 97333. He is now with the U.S. National Park Service in Denver, Colorado. Correspondence and reprint requests should be sent to Robert Hughes at Northrop Services, Inc. or to James Karr, Department of Biology, VPI&SU, Blacksburg, VA 24061. pollutants when they are responsible for degradation. Neither approach alone gives a complete picture. Biological Integrity Karr and Dudley (1981) define bio- logical (or biotic) integrity as "the ability to support and maintain a balanced, integrated, adaptive community of or- ganisms having a species composition, diversity, and functional organization comparable to that of natural habitat of the region." Accurate assessment of biological integrity requires a method that integrates ecological insights about the structure and dynamics of popu- lations, communities, and ecosystems (Karr 1987). However, use of direct biological monitoring has been ham- pered by a reliance on conceptually invalid (e.g., species diversity indices) or simplistic (e.g., indicator species) assessment tools (Karr et al. 1986). The Community Concept and the IBI The Index of Biotic Integrity (IBI) (Karr 1981; Fausch et al. 1984; Karr et al. 1986) overcomes many deficiencies of other biological assessment tools. Fisheries, Vol. 13, No. 5 12

Welcome message from author
This document is posted to help you gain knowledge. Please leave a comment to let me know what you think about it! Share it to your friends and learn new things together.
Transcript
Regional Applications of an Index of BioticIntegrity for Use
in Water Resource ManagementDavid L. Miller, Paul M. Leonard, Robert M. Hughes, James R. Karr, Peter B. Moyle,
Lynn H. Schrader, Bruce A. Thompson, Robert A. Daniels, Kurt D. Fausch,Gary A. Fitzhugh, James R. Gammon, David B. Halliwell, Paul L. Angermeier, and
Donald J. Orth
ABSTRACTThe index of biotic integrity (IBI) integrates 12 measures of stream fish assemblages for assessing water resource
quality. Initially developed and tested in the Midwest, the IBI recently was adapted for use in western Oregon,northeastern Colorado, New England, the Appalachians of West Virginia and Virginia, and northern California. Theconcept also was extended to Louisiana estuaries. In regions of low species richness, the IBI proved difficult to applyand often required extensive modification. Adapting the 1BI to those regions required that metrics be replaced, deleted,or added to accommodate regional differences in fish distribution and assemblage structure and function. Frequentlyreplaced metrics include: proportion of individuals as green sunfish (Lepomis cyanellus), proportion of individuals asinsectivorous cyprinids, proportion of individuals as hybrids, and number and identity of sunfish and darter species.The proportion of individuals as top carnivore metric was often deleted. Metrics added include total fish biomass andthe number and identity of minnow species. These modifications generally followed the original IBI concept and itstheoretical underpinnings. Problems remain in establishing tolerance rankings and scoring criteria, and adjusting scoringcriteria for gradient differences in streams of similar size. The IBI holds promise for direct biological monitoring becauseof its strong ecological foundation and flexibility. Vermont, Tennessee Valley Authority, Ohio, Kentucky, and Illinoishave incorporated the IBI into their monitoring or standards programs. The IBI thus serves as a quantitative, biologicalgoal for water resource management.
IntroductionThe Regulatory Mandate
A principal objective of the 1972Federal Water Pollution Con-
trol Act and its 1977 and 1987 amend-ments is to restore and maintain thebiological integrity of the nation'swaters. The mandate for biologicalmonitoring is clearly stated or impliedin at least 19 sections of the Act andthe 1977 amendments (Weber 1980).Nevertheless, most surface water mon-itoring programs rely primarily on mea-surement of physical and chemical pa-rameters. Biological monitoring, whenattempted, commonly addresses onlytoxic effects instead of the wider arrayof human-induced perturbations thatreduce biological integrity. The ration-ale for emphasizing physical/chemicalmonitoring is that chemical criteria,developed through toxicological stud-ies of standard aquatic organisms, serveas surrogate measures for monitoring
biological integrity. Although this ap-proach gives the impression of empir-ical validity, it does not directly mea-sure the biological integrity of surfacewaters. As a consequence, biologicalintegrity of the nation's waters hascontinued to decline because other fac-tors, such as physical habitat, are oftenlimiting (Karr and Dudley 1981). Insuch cases, biological integrity is un-likely to be improved by controllingchemical pollution.
We advocate an integrated approachto surface water quality monitoring(Karr 1987). Physical/chemical and di-rect biological monitoring complementand reinforce one another. Manage-ment decisions are incomplete unlessboth types of information are collectedand evaluated. Direct biological mon-itoring is useful to detect water resourceproblems and to measure the extentand severity of these problems. On theother hand, physical/chemical moni-toring is indispensable for pinpointing
When this paper was authored, David L. Miller was a senior scientist with NorthropSevices, Inc., 200 SW 35th Street, Corvallis, OR 97333. He is now with the U.S.National Park Service in Denver, Colorado. Correspondence and reprint requests shouldbe sent to Robert Hughes at Northrop Services, Inc. or to James Karr, Department ofBiology, VPI&SU, Blacksburg, VA 24061.
pollutants when they are responsiblefor degradation. Neither approach alonegives a complete picture.
Biological IntegrityKarr and Dudley (1981) define bio-
logical (or biotic) integrity as "the abilityto support and maintain a balanced,integrated, adaptive community of or-ganisms having a species composition,diversity, and functional organizationcomparable to that of natural habitatof the region." Accurate assessment ofbiological integrity requires a methodthat integrates ecological insights aboutthe structure and dynamics of popu-lations, communities, and ecosystems(Karr 1987). However, use of directbiological monitoring has been ham-pered by a reliance on conceptuallyinvalid (e.g., species diversity indices)or simplistic (e.g., indicator species)assessment tools (Karr et al. 1986).
The Community Concept andthe IBI
The Index of Biotic Integrity (IBI)(Karr 1981; Fausch et al. 1984; Karr etal. 1986) overcomes many deficienciesof other biological assessment tools.
Fisheries, Vol. 13, No. 512
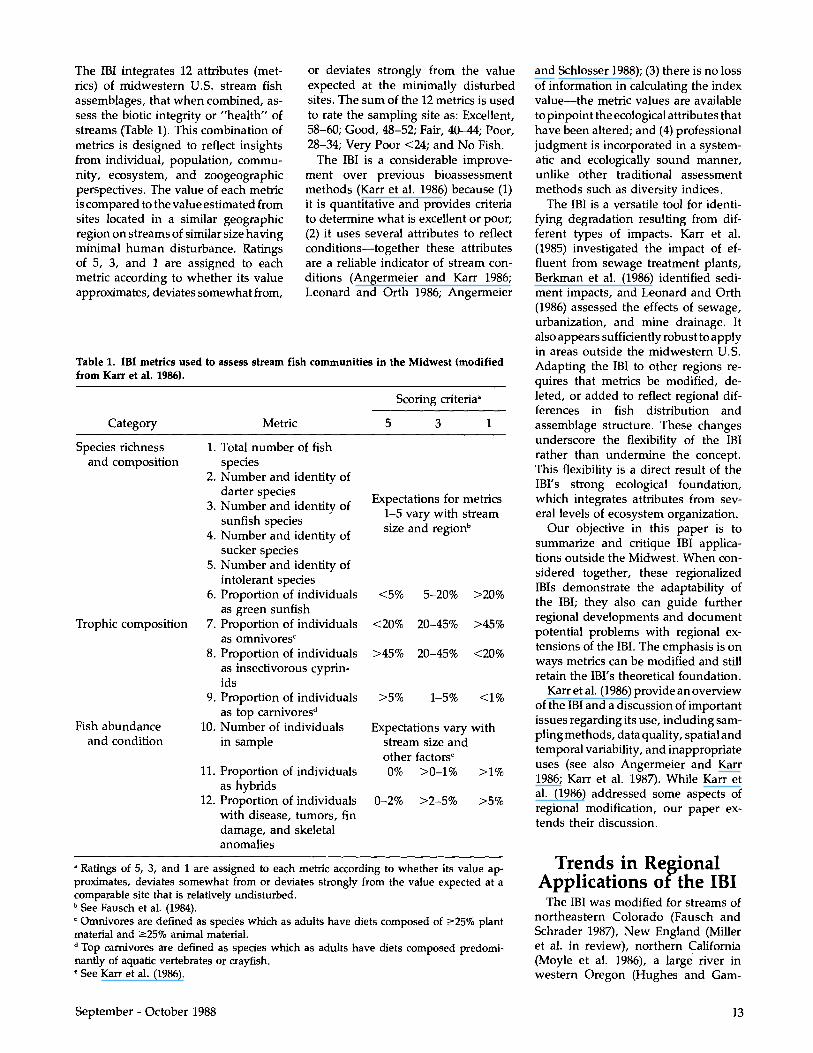
The IBI integrates 12 attributes (met-rics) of midwestern U.S. stream fishassemblages, that when combined, as-sess the biotic integrity or "health" ofstreams (Table 1). This combination ofmetrics is designed to reflect insightsfrom individual, population, commu-nity, ecosystem, and zoogeographicperspectives. The value of each metricis compared to the value estimated fromsites located in a similar geographicregion on streams of similar size havingminimal human disturbance. Ratingsof 5, 3, and 1 are assigned to eachmetric according to whether its valueapproximates, deviates somewhat from,
or deviates strongly from the valueexpected at the minimally disturbedsites. The sum of the 12 metrics is usedto rate the sampling site as: Excellent,58-60; Good, 48-52; Fair, 40-44; Poor,28-34; Very Poor <24; and No Fish.
The IBI is a considerable improve-ment over previous bioassessmentmethods (Karr et al. 1986) because (1)it is quantitative and provides criteriato determine what is excellent or poor;(2) it uses several attributes to reflectconditions-together these attributesare a reliable indicator of stream con-ditions (Angermeier and Karr 1986;Leonard and Orth 1986; Angermeier
Table 1. IBI metrics used to assess stream fish communities in the Midwest (modifiedfrom Karr et al. 1986).
Scoring criteria,
Category Metric 5 3 1
Species richness 1. Total number of fishand composition species
2. Number and identity ofdarter species Expectations for metrics3. Number and identity of 1-5 vary with streamsunfish species size and region b
4. Number and identity ofsucker species
5. Number and identity ofintolerant species
6. Proportion of individuals <5% 5-20% >20%as green sunfish
Trophic composition 7. Proportion of individuals <20% 20-45% >45%as omnivores
8. Proportion of individuals >45% 20-45% <20%as insectivorous cyprin-ids
9. Proportion of individuals >5% 1-5% <1%as top carnivores
Fish abundance 10. Number of individuals Expectations vary withand condition in sample stream size and
other factors'11. Proportion of individuals 0% >0-1% >1%
as hybrids12. Proportion of individuals 0-2% >2-5% >5%
with disease, tumors, findamage, and skeletalanomalies
a Ratings of 5, 3, and 1 are assigned to each metric according to whether its value ap-proximates, deviates somewhat from or deviates strongly from the value expected at acomparable site that is relatively undisturbed.b See Fausch et al. (1984).'Omnivores are defined as species which as adults have diets composed of 25% plantmaterial and 25% animal material.d Top carnivores are defined as species which as adults have diets composed predomi-nantly of aquatic vertebrates or crayfish.' See Karr et al. (1986).
and Schlosser 1988); (3) there is no lossof information in calculating the indexvalue-the metric values are availableto pinpoint the ecological attributes thathave been altered; and (4) professionaljudgment is incorporated in a system-atic and ecologically sound manner,unlike other traditional assessmentmethods such as diversity indices.
The IBI is a versatile tool for identi-fying degradation resulting from dif-ferent types of impacts. Karr et al.(1985) investigated the impact of ef-fluent from sewage treatment plants,Berkman et al. (1986) identified sedi-ment impacts, and Leonard and Orth(1986) assessed the effects of sewage,urbanization, and mine drainage. Italso appears sufficiently robust to applyin areas outside the midwestern U.S.Adapting the IBI to other regions re-quires that metrics be modified, de-leted, or added to reflect regional dif-ferences in fish distribution andassemblage structure. These changesunderscore the flexibility of the IBIrather than undermine the concept.This flexibility is a direct result of theIBI's strong ecological foundation,which integrates attributes from sev-eral levels of ecosystem organization.
Our objective in this paper is tosummarize and critique IBI applica-tions outside the Midwest. When con-sidered together, these regionalizedIBIs demonstrate the adaptability ofthe IBI; they also can guide furtherregional developments and documentpotential problems with regional ex-tensions of the IBI. The emphasis is onways metrics can be modified and stillretain the IBI's theoretical foundation.
Karr et al. (1986) provide an overviewof the IBI and a discussion of importantissues regarding its use, including sam-pling methods, data quality, spatial andtemporal variability, and inappropriateuses (see also Angermeier and Karr1986; Karr et al. 1987). While Karr etal. (1986) addressed some aspects ofregional modification, our paper ex-tends their discussion.
Trends in RegionalApplications of the IBI
The IBI was modified for streams ofnortheastern Colorado (Fausch andSchrader 1987), New England (Milleret al. in review), northern California(Moyle et al. 1986), a large river inwestern Oregon (Hughes and Gam-
September - October 1988 13
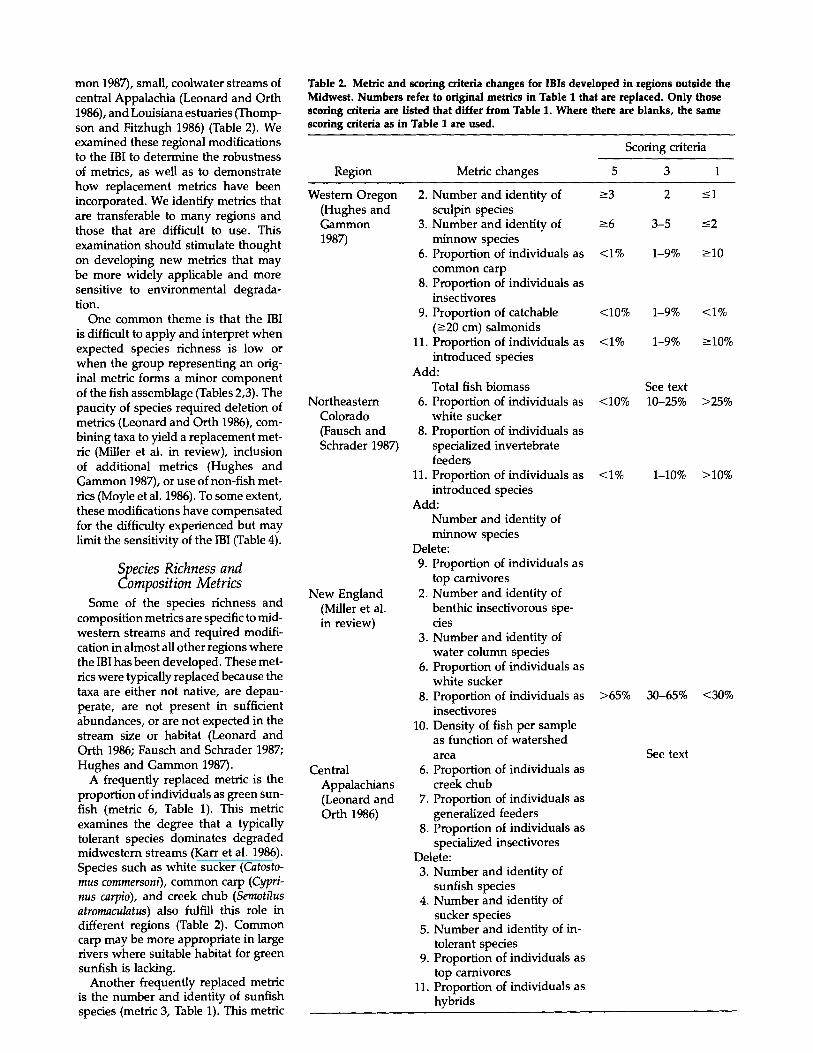
mon 1987), small, coolwater streams ofcentral Appalachia (Leonard and Orth1986), and Louisiana estuaries (Thomp-son and Fitzhugh 1986) (Table 2). Weexamined these regional modificationsto the IBI to determine the robustnessof metrics, as well as to demonstratehow replacement metrics have beenincorporated. We identify metrics thatare transferable to many regions andthose that are difficult to use. Thisexamination should stimulate thoughton developing new metrics that maybe more widely applicable and moresensitive to environmental degrada-tion.
One common theme is that the IBIis difficult to apply and interpret whenexpected species richness is low orwhen the group representing an orig-inal metric forms a minor componentof the fish assemblage (Tables 2,3). Thepaucity of species required deletion ofmetrics (Leonard and Orth 1986), com-bining taxa to yield a replacement met-ric (Miller et al. in review), inclusionof additional metrics (Hughes andGammon 1987), or use of non-fish met-rics (Moyle et al. 1986). To some extent,these modifications have compensatedfor the difficulty experienced but maylimit the sensitivity of the IBI (Table 4).
Species Richness andComposition Metrics
Some of the species richness andcomposition metrics are specific to mid-western streams and required modifi-cation in almost all other regions wherethe IBI has been developed. These met-rics were typically replaced because thetaxa are either not native, are depau-perate, are not present in sufficientabundances, or are not expected in thestream size or habitat (Leonard andOrth 1986; Fausch and Schrader 1987;Hughes and Gammon 1987).
A frequently replaced metric is theproportion of individuals as green sun-fish (metric 6, Table 1). This metricexamines the degree that a typicallytolerant species dominates degradedmidwestern streams (Karr et al. 1986).Species such as white sucker (Catosto-mus commersoni), common carp (Cypri-nus carpio), and creek chub (Semotilusatromaculatus) also fulfill this role indifferent regions (Table 2). Commoncarp may be more appropriate in largerivers where suitable habitat for greensunfish is lacking.
Another frequently replaced metricis the number and identity of sunfishspecies (metric 3, Table 1). This metric
Table 2. Metric and scoring criteria changes for IBIs developed in regions outside theMidwest. Numbers refer to original metrics in Table 1 that are replaced. Only thosescoring criteria are listed that differ from Table 1. Where there are blanks, the samescoring criteria as in Table 1 are used.
Scoring criteria
Region
Western Oregon(Hughes andGammon1987)
NortheasternColorado(Fausch andSchrader 1987)
New England(Miller et al.in review)
CentralAppalachians(Leonard andOrth 1986)
Metric changes
2. Number and identity ofsculpin species
3. Number and identity ofminnow species
6. Proportion of individuals ascommon carp
8. Proportion of individuals asinsectivores
9. Proportion of catchable(220 cm) salmonids
11. Proportion of individuals asintroduced species
Add:Total fish biomass
6. Proportion of individuals aswhite sucker
8. Proportion of individuals asspecialized invertebratefeeders
11. Proportion of individuals asintroduced species
Add:Number and identity ofminnow species
Delete:9. Proportion of individuals as
top carnivores2. Number and identity of
benthic insectivorous spe-cies
3. Number and identity ofwater column species
6. Proportion of individuals aswhite sucker
8. Proportion of individuals asinsectivores
10. Density of fish per sampleas function of watershedarea
6. Proportion of individuals ascreek chub
7. Proportion of individuals asgeneralized feeders
8. Proportion of individuals asspecialized insectivores
Delete:3. Number and identity of
sunfish species4. Number and identity of
sucker species5. Number and identity of in-
tolerant species9. Proportion of individuals as
top carnivores11. Proportion of individuals as
hybrids
5 3 1
2 -1-3
-6 3-5 _2
<1% 1-9% -10
<10% 1-9% <1%
<1% 1-9% -10%
See text<10% 10-25%
<1%
>25%
1-10% >10%
>65% 30-65% <30%
See text
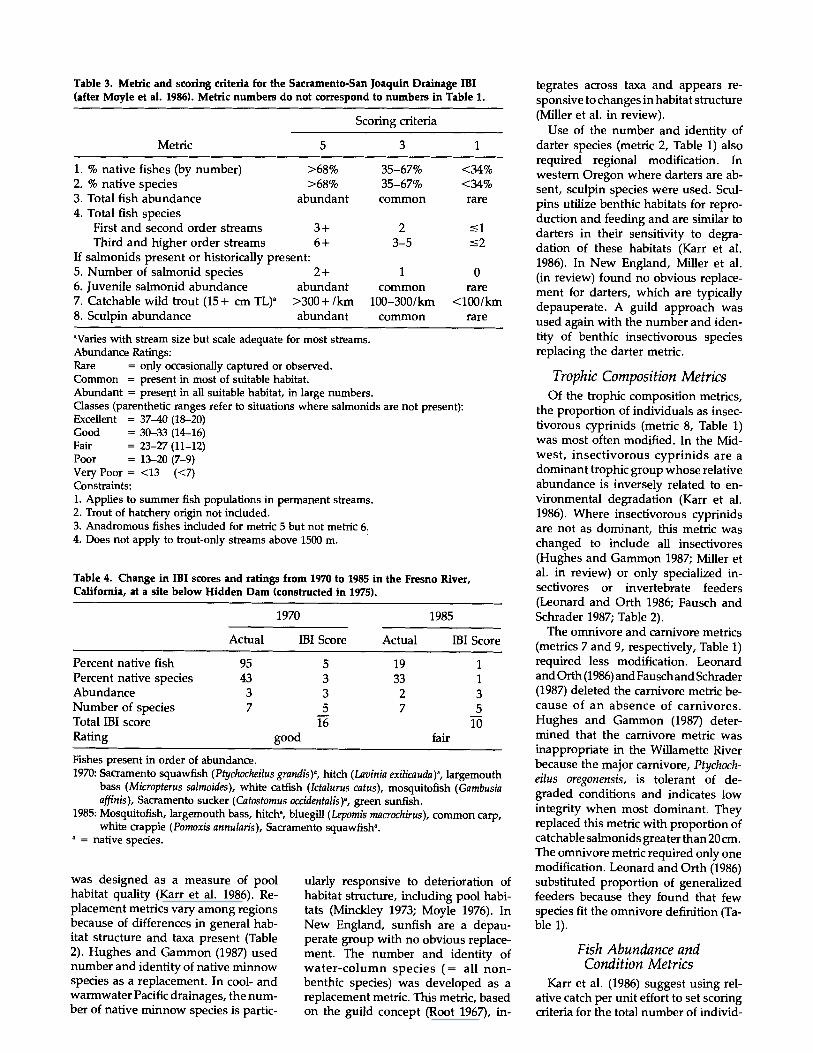
Table 3. Metric and scoring criteria for the Sacramento-San Joaquin Drainage IBI(after Moyle et al. 1986). Metric numbers do not correspond to numbers in Table 1.
Scoring criteria
Metric 5 3 1
1. % native fishes (by number) >68% 35-67% <34%2. % native species >68% 35-67% <34%3. Total fish abundance abundant common rare4. Total fish species
First and second order streams 3+ 2 -1Third and higher order streams 6 + 3-5 s2
If salmonids present or historically present:5. Number of salmonid species 2+ 1 06. Juvenile salmonid abundance abundant common rare7. Catchable wild trout (15 + cm TL)a >300+ /km 100-300/km <100/km8. Sculpin abundance abundant common rare
'Varies with stream size but scale adequate for most streams.Abundance Ratings:Rare = only occasionally captured or observed.Common = present in most of suitable habitat.Abundant = present in all suitable habitat, in large numbers.Classes (parenthetic ranges refer to situations where salmonids are not present):Excellent = 37-40 (18-20)Good = 30-33 (14-16)Fair = 23-27 (11-12)Poor = 13-20 (7-9)Very Poor = <13 (<7)Constraints:1. Applies to summer fish populations in permanent streams.2. Trout of hatchery origin not included.3. Anadromous fishes included for metric 5 but not metric 6.4. Does not apply to trout-only streams above 1500 m.
Table 4. Change in IBI scores and ratings from 1970 to 1985 in the Fresno River,California, at a site below Hidden Dam (constructed in 1975).
1970 1985
Actual IBI Score Actual IBI Score
Percent native fish 95 5 19 1Percent native species 43 3 33 1Abundance 3 3 2 3Number of species 7 5 7 5Total IBI score 16 10Rating good fair
Fishes present in order of abundance.1970: Sacramento squawfish (Ptychocheilus grandis)', hitch (Lavinia exilicauda)', largemouth
bass (Micropterus salmoides), white catfish (Ictalurus catus), mosquitofish (Gambusiaaffinis), Sacramento sucker (Catostomus occidentalis)', green sunfish.
1985: Mosquitofish, largemouth bass, hitch', bluegill (Lepomis macrochirus), common carp,white crappie (Pomoxis annularis), Sacramento squawfish'.
= native species.
was designed as a measure of poolhabitat quality (Karr et al. 1986). Re-placement metrics vary among regionsbecause of differences in general hab-itat structure and taxa present (Table2). Hughes and Gammon (1987) usednumber and identity of native minnowspecies as a replacement. In cool- andwarmwater Pacific drainages, the num-ber of native minnow species is partic-
ularly responsive to deterioration ofhabitat structure, including pool habi-tats (Minckley 1973; Moyle 1976). InNew England, sunfish are a depau-perate group with no obvious replace-ment. The number and identity ofwater-column species (= all non-benthic species) was developed as areplacement metric. This metric, basedon the guild concept (Root 1967), in-
tegrates across taxa and appears re-sponsive to changes in habitat structure(Miller et al. in review).
Use of the number and identity ofdarter species (metric 2, Table 1) alsorequired regional modification. Inwestern Oregon where darters are ab-sent, sculpin species were used. Scul-pins utilize benthic habitats for repro-duction and feeding and are similar todarters in their sensitivity to degra-dation of these habitats (Karr et al.1986). In New England, Miller et al.(in review) found no obvious replace-ment for darters, which are typicallydepauperate. A guild approach wasused again with the number and iden-tity of benthic insectivorous speciesreplacing the darter metric.
Trophic Composition MetricsOf the trophic composition metrics,
the proportion of individuals as insec-tivorous cyprinids (metric 8, Table 1)was most often modified. In the Mid-west, insectivorous cyprinids are adominant trophic group whose relativeabundance is inversely related to en-vironmental degradation (Karr et al.1986). Where insectivorous cyprinidsare not as dominant, this metric waschanged to include all insectivores(Hughes and Gammon 1987; Miller etal. in review) or only specialized in-sectivores or invertebrate feeders(Leonard and Orth 1986; Fausch andSchrader 1987; Table 2).
The omnivore and carnivore metrics(metrics 7 and 9, respectively, Table 1)required less modification. Leonardand Orth (1986) and Fauschand Schrader(1987) deleted the carnivore metric be-cause of an absence of carnivores.Hughes and Gammon (1987) deter-mined that the carnivore metric wasinappropriate in the Willamette Riverbecause the major carnivore, Ptychoch-eilus oregonensis, is tolerant of de-graded conditions and indicates lowintegrity when most dominant. Theyreplaced this metric with proportion ofcatchable salmonids greater than 20 cm.The omnivore metric required only onemodification. Leonard and Orth (1986)substituted proportion of generalizedfeeders because they found that fewspecies fit the omnivore definition (Ta-ble 1).
Fish Abundance andCondition Metrics
Karr et al. (1986) suggest using rel-ative catch per unit effort to set scoringcriteria for the total number of individ-
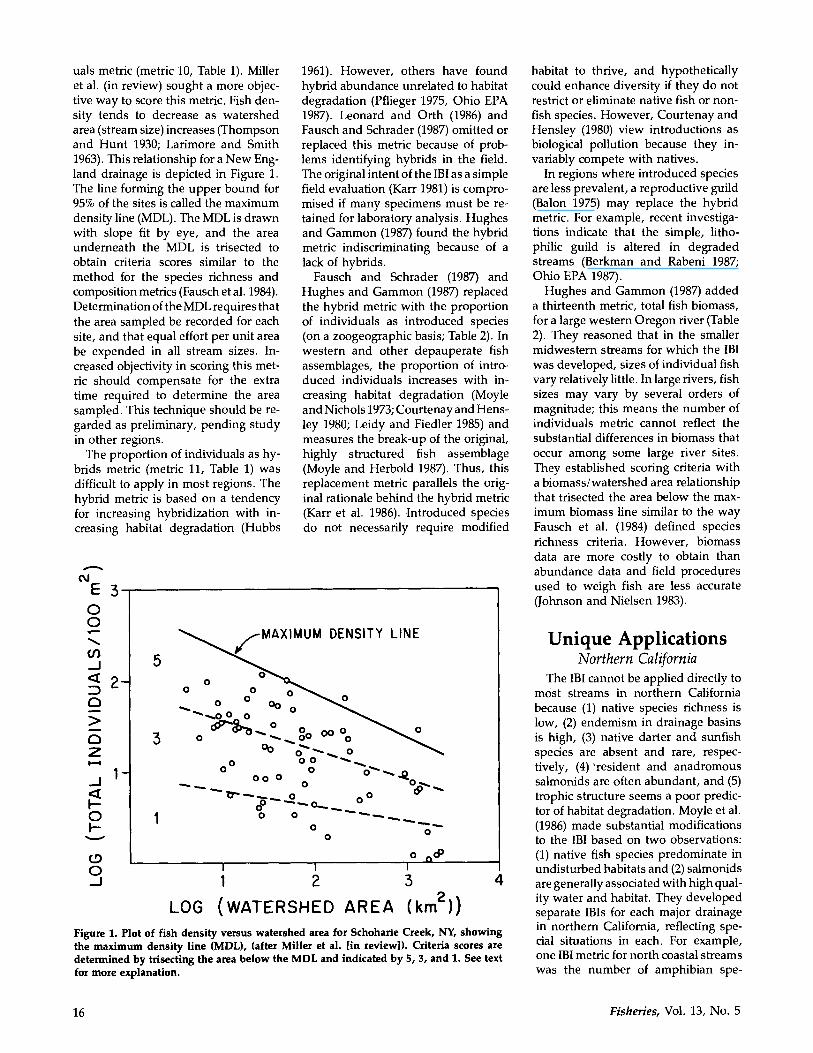
uals metric (metric 10, Table 1). Milleret al. (in review) sought a more objec-tive way to score this metric. Fish den-sity tends to decrease as watershedarea (stream size) increases (Thompsonand Hunt 1930; Larimore and Smith1963). This relationship for a New Eng-land drainage is depicted in Figure 1.The line forming the upper bound for95% of the sites is called the maximumdensity line (MDL). The MDL is drawnwith slope fit by eye, and the areaunderneath the MDL is trisected toobtain criteria scores similar to themethod for the species richness andcomposition metrics (Fausch et al. 1984).Determination of the MDL requires thatthe area sampled be recorded for eachsite, and that equal effort per unit areabe expended in all stream sizes. In-creased objectivity in scoring this met-ric should compensate for the extratime required to determine the areasampled. This technique should be re-garded as preliminary, pending studyin other regions.
The proportion of individuals as hy-brids metric (metric 11, Table 1) wasdifficult to apply in most regions. Thehybrid metric is based on a tendencyfor increasing hybridization with in-creasing habitat degradation (Hubbs
coE3OO
1
(.-J
D0
z
I--0
_J
5
I1
1961). However, others have foundhybrid abundance unrelated to habitatdegradation (Pflieger 1975, Ohio EPA1987). Leonard and Orth (1986) andFausch and Schrader (1987) omitted orreplaced this metric because of prob-lems identifying hybrids in the field.The original intent of the IBI as a simplefield evaluation (Karr 1981) is compro-mised if many specimens must be re-tained for laboratory analysis. Hughesand Gammon (1987) found the hybridmetric indiscriminating because of alack of hybrids.
Fausch and Schrader (1987) andHughes and Gammon (1987) replacedthe hybrid metric with the proportionof individuals as introduced species(on a zoogeographic basis; Table 2). Inwestern and other depauperate fishassemblages, the proportion of intro-duced individuals increases with in-creasing habitat degradation (Moyleand Nichols 1973; Courtenay and Hens-ley 1980; Leidy and Fiedler 1985) andmeasures the break-up of the original,highly structured fish assemblage(Moyle and Herbold 1987). Thus, thisreplacement metric parallels the orig-inal rationale behind the hybrid metric(Karr et al. 1986). Introduced speciesdo not necessarily require modified
2 3LOG (WATERSHED AREA (km2))
Figure 1. Plot of fish density versus watershed area for Schoharie Creek, NY, showingthe maximum density line (MDL), (after Miller et al. [in review]). Criteria scores aredetermined by trisecting the area below the MDL and indicated by 5, 3, and 1. See textfor more explanation.
habitat to thrive, and hypotheticallycould enhance diversity if they do notrestrict or eliminate native fish or non-fish species. However, Courtenay andHensley (1980) view introductions asbiological pollution because they in-variably compete with natives.
In regions where introduced speciesare less prevalent, a reproductive guild(Balon 1975) may replace the hybridmetric. For example, recent investiga-tions indicate that the simple, litho-philic guild is altered in degradedstreams (Berkman and Rabeni 1987;Ohio EPA 1987).
Hughes and Gammon (1987) addeda thirteenth metric, total fish biomass,for a large western Oregon river (Table2). They reasoned that in the smallermidwestern streams for which the IBIwas developed, sizes of individual fishvary relatively little. In large rivers, fishsizes may vary by several orders ofmagnitude; this means the number ofindividuals metric cannot reflect thesubstantial differences in biomass thatoccur among some large river sites.They established scoring criteria witha biomass/watershed area relationshipthat trisected the area below the max-imum biomass line similar to the wayFausch et al. (1984) defined speciesrichness criteria. However, biomassdata are more costly to obtain thanabundance data and field proceduresused to weigh fish are less accurateJohnson and Nielsen 1983).
Unique ApplicationsNorthern California
The IBI cannot be applied directly tomost streams in northern Californiabecause (1) native species richness islow, (2) endemism in drainage basinsis high, (3) native darter and sunfishspecies are absent and rare, respec-tively, (4) 'resident and anadromoussalmonids are often abundant, and (5)trophic structure seems a poor predic-tor of habitat degradation. Moyle et al.(1986) made substantial modificationsto the IBI based on two observations:(1) native fish species predominate inundisturbed habitats and (2) salmonidsare generally associated with high qual-ity water and habitat. They developedseparate IBIs for each major drainagein northern California, reflecting spe-cial situations in each. For example,one IBI metric for north coastal streamswas the number of amphibian spe-
Fisheries, Vol. 13, No. 5
DENSITY LINEMA X IMU M
0o o
0 0 0 000
-
0 0 0 0 6' -
'""' 0 0 'D- -. - -0 -
1 -__0
o ,cP
-
1-
16
cies. Certain commonly found speciesof amphibians were associated withstreams in old growth forests and seemto serve as accurate measures of tol-erant/intolerant species.
The IBI developed for the Sacra-mento-San Joaquin drainage is shownin Table 3. The percent native fishesby number and by species mirror theinvasibility by introduced fishes. Met-rics 1-4 may not adequately reflectdegradation in trout streams, becausetrout streams are occupied by an as-semblage of salmonids, sculpins, andsuckers which are resistant to invasionby non-salmonids (Moyle and Herbold1987). Thus, metrics 5, 6, and 7 allmeasure suitability of the stream forsalmonids, i.e., the number of speciesit can support, the presence of suitablespawning sites, and the amount ofhabitat for the adults. Metric 8 (Table3) is analogous to the darter speciesmetric of Table 1.
The IBIs developed to date for de-pauperate warmwater streams of Cal-ifornia may provide only a coarse in-dication of the degradation a streamhas suffered. For example, a dam builton the Fresno River changed a free-flowing (but moderately disturbed)stream dominated by native fishes toa series of stagnant pools dominatedby introduced species (Table 4). Therating, however, dropped only from"good" to "fair," mainly because thenumber of species stayed the same andoverall fish abundance did not dropdrastically. In the pre-dam Fresno River,fish abundance was low because theriver was naturally sandy-bottomed andunproductive. Thus, two of the fourmetrics showed little change (Table 4).Modifications of the number of speciesmetrics to include only native speciesand inclusion of more metrics, as sug-gested by Hughes and Gammon (1987),might better reflect the quality of thepost-dam fauna.
Louisiana EstuariesThe IBI concept was extended to
Louisiana estuaries (Thompson andFitzhugh 1986). This application fur-ther underscores the IBI's flexibility.The estuarine IBI keeps the three mainIBI categories, but modifies the metricsto reflect estuarine habitats and fishassemblages (metrics 1-13, Table 5). Inaddition, because estuarine systems
exhibit a high degree of seasonality intheir fish faunas, a measure of seasonalvariability was incorporated. Furtherwork is required to set scoring criteria.
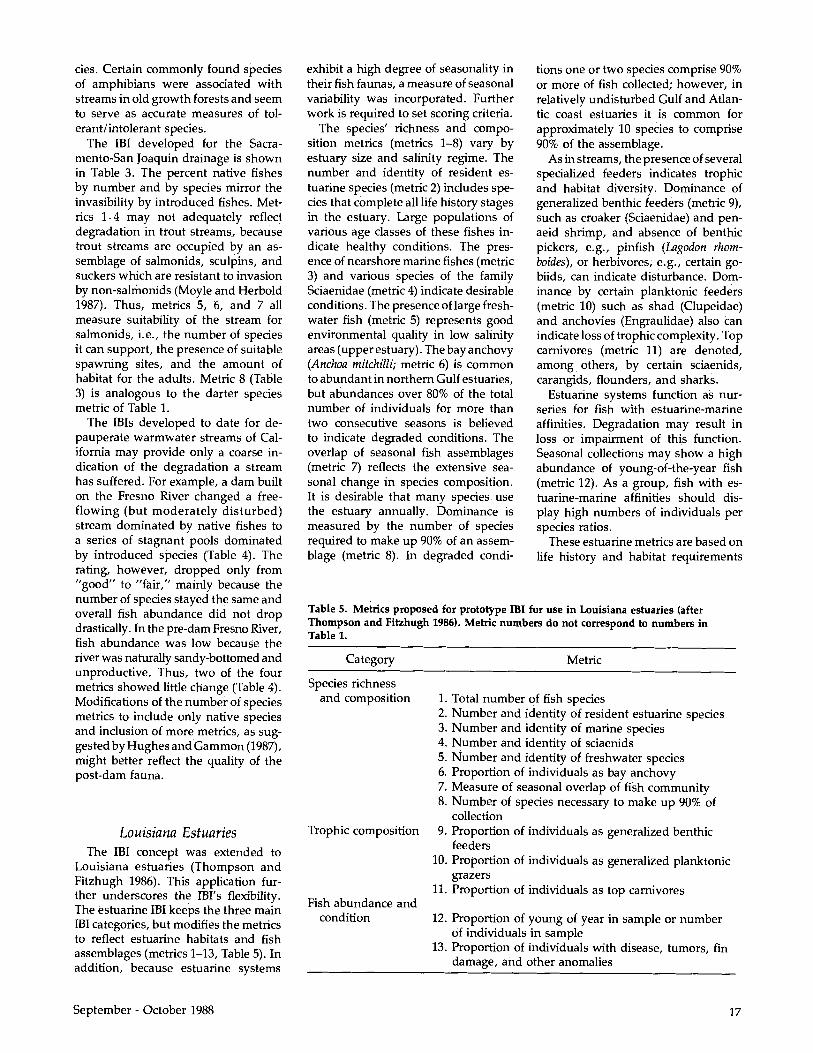
The species' richness and compo-sition metrics (metrics 1-8) vary byestuary size and salinity regime. Thenumber and identity of resident es-tuarine species (metric 2) includes spe-cies that complete all life history stagesin the estuary. Large populations ofvarious age classes of these fishes in-dicate healthy conditions. The pres-ence of nearshore marine fishes (metric3) and various species of the familySciaenidae (metric 4) indicate desirableconditions. The presence of large fresh-water fish (metric 5) represents goodenvironmental quality in low salinityareas (upper estuary). The bay anchovy(Anchoa mitchilli; metric 6) is commonto abundant in northern Gulf estuaries,but abundances over 80% of the totalnumber of individuals for more thantwo consecutive seasons is believedto indicate degraded conditions. Theoverlap of seasonal fish assemblages(metric 7) reflects the extensive sea-sonal change in species composition.It is desirable that many species usethe estuary annually. Dominance ismeasured by the number of speciesrequired to make up 90% of an assem-blage (metric 8). In degraded condi-
Category
Species richnessand composition
Trophic composition
Fish abundance andcondition
tions one or two species comprise 90%or more of fish collected; however, inrelatively undisturbed Gulf and Atlan-tic coast estuaries it is common forapproximately 10 species to comprise90% of the assemblage.
As in streams, the presence of severalspecialized feeders indicates trophicand habitat diversity. Dominance ofgeneralized benthic feeders (metric 9),such as croaker (Sciaenidae) and pen-aeid shrimp, and absence of benthicpickers, e.g., pinfish (Lagodon rhom-boides), or herbivores, e.g., certain go-biids, can indicate disturbance. Dom-inance by certain planktonic feeders(metric 10) such as shad (Clupeidae)and anchovies (Engraulidae) also canindicate loss of trophic complexity. Topcarnivores (metric 11) are denoted,among others, by certain sciaenids,carangids, flounders, and sharks.
Estuarine systems function as nur-series for fish with estuarine-marineaffinities. Degradation may result inloss or impairment of this function.Seasonal collections may show a highabundance of young-of-the-year fish(metric 12). As a group, fish with es-tuarine-marine affinities should dis-play high numbers of individuals perspecies ratios.
These estuarine metrics are based onlife history and habitat requirements
Metric
1. Total number of fish species2. Number and identity of resident estuarine species3. Number and identity of marine species4. Number and identity of sciaenids5. Number and identity of freshwater species6. Proportion of individuals as bay anchovy7. Measure of seasonal overlap of fish community8. Number of species necessary to make up 90% of
collection9. Proportion of individuals as generalized benthic
feeders10. Proportion of individuals as generalized planktonic
grazers11. Proportion of individuals as top carnivores
12. Proportion of young of year in sample or numberof individuals in sample
13. Proportion of individuals with disease, tumors, findamage, and other anomalies
September - October 1988
Table 5. Metrics proposed for prototype IBI for use in Louisiana estuaries (afterThompson and Fitzhugh 1986). Metric numbers do not correspond to numbers inTable 1.
17
similar to the freshwater IBI metrics. Itis assumed that the estuarine metricsrespond to degradation in a predictablemanner. This estuarine IBI should beregarded as a prototype until refine-menrit of metrics and development ofappropriate scoring criteria are com-pleted.
Special ConsiderationsEffects of Stream Gradient on
Species RichnessLeonard and Orth (1986) discussed
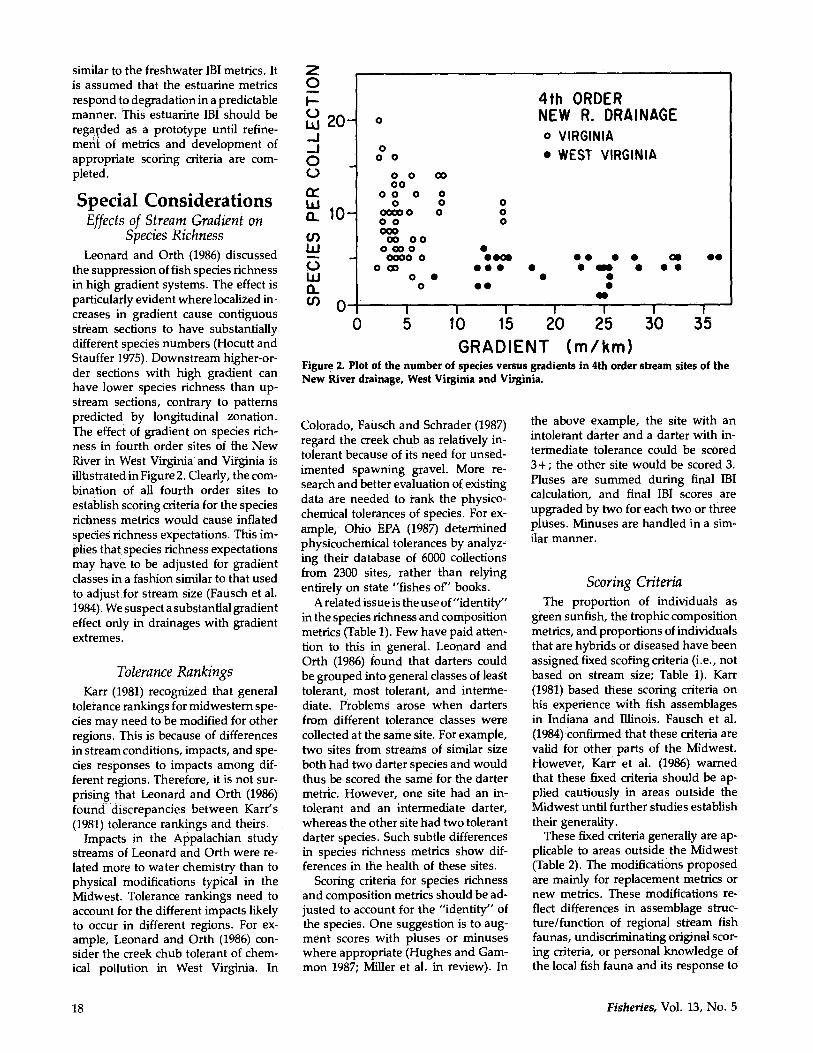
the suppression of fish species richnessin high gradient systems. The effect isparticularly evident where localized in-creases in gradient cause contiguousstream sections to have substantiallydifferent species numbers (Hocutt andStauffer 1975). Downstream higher-or-der sections with high gradient canhave lower species richness than up-stream sections, contrary to patternspredicted by longitudinal zonation.The effect of gradient on species rich-ness in fourth order sites of the NewRiver in West Virginia and Virginia isillustrated in Figure 2. Clearly, the com-bination of all fourth order sites toestablish scoring criteria for the speciesrichness metrics would cause inflatedspecies richness expectations. This im-plies that species richness expectationsmay have to be adjusted for gradientclasses in a fashion similar to that usedto adjust for stream size (Fausch et al.1984). We suspect a substantial gradienteffect only in drainages with gradientextremes.
Tolerance RankingsKarr (1981) recognized that general
tolerance rankings for midwestern spe-cies may need to be modified for otherregions. This is because of differencesin stream conditions, impacts, and spe-cies responses to impacts among dif-ferent regions. Therefore, it is not sur-prising that Leonard and Orth (1986)found discrepancies between Karr's(1981) tolerance rankings and theirs.
Impacts in the Appalachian studystreams of Leonard and Orth were re-lated more to water chemistry than tophysical modifications typical in theMidwest. Tolerance rankings need toaccount for the different impacts likelyto occur in different regions. For ex-ample, Leonard and Orth (1986) con-sider the creek chub tolerant of chem-ical pollution in West Virginia. In
O
0w 20--J-J
00
a. 10-U)
a.C) nA-
0
0
000
0 0 O00
00 0 00 0
0000 0 000000
00 000000
0000 00 00
0 00
4th ORDERNEW R. DRAINAGEo VIRGINIA* WEST VIRGINIA
0
0
000* m
00
00 0* em
0 0
0
00
I I I I I
5 10 15 20 25GRADIENT (/km)
06 0000
30 35
Figure 2. Plot of the number of species versus gradients in 4th order stream sites of theNew River drainage, West Virginia and Virginia.
Colorado, Fausch and Schrader (1987)regard the creek chub as relatively in-tolerant because of its need for unsed-imented spawning gravel. More re-search and better evaluation of existingdata are needed to rank the physico-chemical tolerances of species. For ex-ample, Ohio EPA (1987) determinedphysicochemical tolerances by analyz-ing their database of 6000 collectionsfrom 2300 sites, rather than relyingentirely on state "fishes of" books.
A related issue is the use of "identity"in the species richness and compositionmetrics (Table 1). Few have paid atten-tion to this in general. Leonard andOrth (1986) found that darters couldbe grouped into general classes of leasttolerant, most tolerant, and interme-diate. Problems arose when dartersfrom different tolerance classes werecollected at the same site. For example,two sites from streams of similar sizeboth had two darter species and wouldthus be scored the same for the dartermetric. However, one site had an in-tolerant and an intermediate darter,whereas the other site had two tolerantdarter species. Such subtle differencesin species richness metrics show dif-ferences in the health of these sites.
Scoring criteria for species richnessand composition metrics should be ad-justed to account for the "identity" ofthe species. One suggestion is to aug-ment scores with pluses or minuseswhere appropriate (Hughes and Gam-mon 1987; Miller et al. in review). In
the above example, the site with anintolerant darter and a darter with in-termediate tolerance could be scored3+; the other site would be scored 3.Pluses are summed during final IBIcalculation, and final IBI scores areupgraded by two for each two or threepluses. Minuses are handled in a sim-ilar manner.
Scoring CriteriaThe proportion of individuals as
green sunfish, the trophic compositionmetrics, and proportions of individualsthat are hybrids or diseased have beenassigned fixed scoring criteria (i.e., notbased on stream size; Table 1). Karr(1981) based these scoring criteria onhis experience with. fish assemblagesin Indiana and Illinois. Fausch et al.(1984) confirmed that these criteria arevalid for other parts of the Midwest.However, Karr et al. (1986) warnedthat these fixed criteria should be ap-plied cautiously in areas outside theMidwest until further studies establishtheir generality.
These fixed criteria generally are ap-plicable to areas outside the Midwest(Table 2). The modifications proposedare mainly for replacement metrics ornew metrics. These modifications re-flect differences in assemblage struc-ture/function of regional stream fishfaunas, undiscriminating original scor-ing criteria, or personal knowledge ofthe local fish fauna and its response to
Fisheries, Vol. 13, No. 5
v I
18
environmental stress.Hughes and Gammon (1987) most
frequently modified the fixed criteria(Table 2). This might be expected be-cause the empirical relationships of theIBI derived from small streams maynot hold for larger rivers. Minimal cri-teria modifications are proposed fornortheastern Colorado and New Eng-land (Table 2). In all cases, the fixedscoring criteria of Karr (1981) were usedas a basis for generating the new scor-ing criteria.
DiscussionThe concept of the IBI apparently
can be applied to regions outside theMidwest with considerably differentfaunas. While the IBI was modified tosuit regional patterns in fish ecologyand zoogeography, the overall conceptand its theoretical underpinnings wereretained. We stress that these regionalIBIs need to be further refined, eval-uated, and tested, especially in re-sponse to known environmental per-turbations or restorations. For example,no one has actually manipulated deg-radation and measured the hypothe-sized increase in omnivores with in-creasing degradation.
When is the integrity of the IBI com-promised? How valid are the reducedmetric formats used by Leonard andOrth (1986) and Moyle et al. (1986)(Tables 2,3)? At the time (1983) of theirstudy, Leonard and Orth lacked defin-itive information for dealing with met-rics that could not be scored. Theywere primarily interested in testing theresponse of the IBI to varying levels ofdegradation, and in the process re-duced the IBI to 7 metrics. Angermeierand Karr (1986), however, used theoriginal 12-metric IBI on the data setof Leonard and Orth. While an IBI offewer than 12 metrics may work, it maybe less responsive to a broad spectrumof degradation.
Moyle et al. (1986) come closest tocompromising the integrity of the IBI.These particular northern Californiawatersheds have fish communities sodepauperate that it may be better toanalyze each population separately.However, an appropriate question iswhether one has gained useful insightby looking at community-level metrics,such as the proportion of individualsas introduced or native species (Table3). We believe the answer is yes. The
regional usefulness of the IBI is a con-sequence of its foundation on a com-munity concept and the flexibility thispermits.
The metric and criteria modificationspresented should provide insights intothe kinds of considerations necessaryfor regional modifications. We haveattempted to maintain the underlyingstructure of the IBI by following therationale of Karr et al. (1986). However,regional variability in fish assemblagestructure and function preclude a trulyobjective basis for choosing metrics andcriteria. This should not be interpretedby potential users as providing carteblanche for IBI modifications. In thisregard, we stress that the IBI shouldbe modified and applied by experi-enced fish biologists familiar with theIBI, local fish faunas, and watershedconditions. Potential users should ex-ercise caution when attempting to mod-ify the IBI to their particular regions;replacing, deleting, or adding metricsoften may be unnecessary. Ultimately,the quality of assessments made withthe IBI will rest on their ability tocorrectly interpret the important fea-tures of the fish community in a par-ticular region. Finally, it is importantto view the IBI as a process, a com-munity approach for analysis, produc-ing an index value for a particularstream or many streams in a region.
Prospects for the FutureNovel approaches like the IBI that
ask for a reappraisal of establishedprocedures often fall prey to the "whychange what appears to work" attitude.Nonetheless, we are encouraged byseveral developments:
(1) A U.S. Environmental Protec-tion Agency committee andworkshop (USEPA 1987, 1988)supported increased reliance onbiological monitoring and biolog-ical criteria because of their cost-effectiveness.
(2) The revised water quality stan-dards (Federal Register, Volume48, No. 217:51400-51413, 1983)reflect a fundamental shift in per-spective from effluent control to-ward attainable water quality.Emphasis is placed on the bio-logical consequences of our pol-lution control actions. The IBIwas used to assess the environ-
mental benefits of tertiary treat-ment to three Illinois streams(Karr et al. 1985). The resultsshowed that in those cases ex-pensive tertiary treatment forammonia was unnecessary.
(3) The water quality standards fur-ther encourage criteria based onbiological surveys to supplementchemical criteria. Ohio EPA (1987)recently detailed its rationale forbiological monitoring and de-velopment of numerical biolog-ical criteria. Ohio EPA proposedmodified IBIs for fish and ma-croinvertebrates as quantitativemeasures of whethera waterbodysupports a designated aquatic lifeuse. Development of a macroin-vertebrate-based IBI is an impor-tant new biological monitoringtool for surface water monitoringprograms.
(4) The IBI compares favorably withmore traditional biological mon-itoring. Berkman et al. (1986)compared the ability of the IBIand a diversity index of macroin-vertebrates to measure habitatquality in northeastern Missouristreams. Both methods ade-quately evaluated stream quality.Angermeier and Schlosser (1988)used a diversity index of fish andthe IBI to evaluate environmentalquality in an Illinois stream. TheIBI identified known degradationin water quality and habitat struc-ture more reliably than did thediversity index. Only the IBI pro-duced consistently reliable as-sessments of site quality over thethree sample years.
We encourage continued develop-ment of the IBI in other regions. Ad-ditionally, we urge water resourcemanagers to further scrutinize the IBI,and to pursue this avenue for directbiological monitoring.
Note: As this article went to press,Steedman (1988) modified the IBI forapplication to streams in southern On-tario.
AcknowledgmentsThis paper was supported by the
U.S. Environmental Protection Agen-cy's Corvallis laboratory through con-tract no. 68-03-3246 to Northrop Ser-vices, Inc. We thank Joan Baker, Terry
September - October 1988 19
Boyle, Cliff Hawkes, Phil Larsen, andThom Whittier for reviewing earlierdrafts of this paper. Later reviews byCharles Hocutt and Gary Grossmangreatly improved the manuscript. Thispaper summarizes the content of asymposium presented at the 1986 an-nual meeting of the American FisheriesSociety. The symposium was spon-sored by the Monitoring and Data Sup-port and Criteria and Standards Divi-sions of the Office of Water, U.S. Envi-ronmental Protection Agency).>
ReferencesAngermeier, P. L., and J. R. Karr. 1986.
Applying an index of biotic integritybased on stream fish communities: con-siderations in sampling and interpre-tation. N. Am. J. Fish. Manage. 6:418-429.
Angermeier, P. L., and I. J. Schlosser. 1988.Assessing biotic integrity in the fishcommunity of a small Illinois stream. N.Am. J. Fish. Manage. 7:331-338.
Balon, E. K. 1975. Reproductive guilds offishes: a proposal and definition. J. Fish.Res. Board Can. 32:821-864.
Berkman, H. E., and C. F. Rabeni. 1987.Effect of siltation on stream fish com-munities. Environ. Biol. Fishes 18:285-294.
Berkman, H. E., C. F. Rabeni, and T. P.Boyle. 1986. Biomonitoring of streamquality in agricultural areas: fish versusinvertebrates. Environ. Manage. 10:413-419.
Courtenay, W. R. Jr., and D. A. Hensley.1980. Special problems associated withmonitoring exotic species. Pages 281-308 in C. H. Hocutt and J. R. Stauffer,Jr., eds. Biological monitoring of fish.D. C. Heath, Lexington, MA.
Fausch, K. D., J. R. Karr, and P. R. Yant.1984. Regional application of an indexof biotic integrity based on stream fishcommunities. Trans. Am. Fish. Soc.113:39-55.
Fausch, K. D., and L. H. Schrader. 1987.Use of the index of biotic integrity toevaluate the effects of habitat, flow, andwater quality on fish communities inthree Colorado Front Range streams. Fi-nal Report to the Kodak-Colorado Di-vision and the Cities of Fort Collins,Loveland, Greeley, Longmont, andWindsor. Department of Fishery andWildlife Biology, Colorado State Uni-versity, Fort Collins.
Hocutt, C. H., and J. R. Stauffer, Jr. 1975.Influence of gradient on distribution offishes in Conowingo Creek, Marylandand Pennsylvania. Chesapeake Sci.16:143-147.
Hubbs, C. L. 1961. Isolating mechanismsin the speciation of fishes. Pages 5-23in W. E Blair, ed. Vertebrate Speciation.University of Texas Press, Austin.
Hughes, R. M., and J. R. Gammon. 1987.Longitudinal changes in fish assem-blages and water quality in the Willam-ette River, Oregon. Trans. Am. Fish.Soc. 116:196-209.
Johnson, D. L., and L. A. Nielsen. 1983.Sampling considerations. Pages 1-21 inL. A. Nielsen and D. L. Johnson, eds.Fisheries techniques. American Fisher-ies Society, Bethesda, MD.
Karr, J. R. 1981. Assessment of biotic in-tegrity using fish communities. Fisher-ies (Bethesda) 6(6):21-27.
. 1987. Biological monitoring and en-vironmental assessment: a conceptualframework. Environ. Manage. 11:249-256.
Karr, J. R., and D. R. Dudley. 1981. Eco-logical perspective on water qualitygoals. Environ. Manage. 5:55-68.
Karr, J. R., R. C. Heidinger, and E. H.Helmer. 1985. Effects of chlorine andammonia from wastewater treatmentfacilities on biotic integrity. J. WaterPollut. Control Fed. 57:912-915.
Karr, J. R., K. D. Fausch, P. L. Angermeier,P. R. Yant, and I. J. Schlosser. 1986.Assessing biological integrity in run-ning waters: a method and its rationale.Ill. Nat. Hist. Surv. Spec. Publ. 5, Ur-bana.
Karr, J. R., P. R. Yant, K. D. Fausch, andI. J. Schlosser. 1987. Spatial and tem-poral variability of the index of bioticintegrity in three midwestern streams.Trans. Am. Fish. Soc. 116:1-11.
Larimore, R. W., and P. W. Smith. 1963.The fishes of Champaign County, Illi-nois, as affected by 60 years of streamchanges. m. Nat. Hist. Surv. Bull. 28:299-382.
Leidy, R. A., and P. L. Fiedler. 1985. Hu-man disturbance and patterns of fishspecies diversity in the San FranciscoBay drainage, California. Biol. Conserv.33:247-267.
Leonard, P. M., and D. J. Orth. 1986. Ap-plication and testing of an index of bioticintegrity in small, coolwater streams.Trans. Am. Fish. Soc. 115:401-415.
Miller, D. L., R. A. Daniels, and D. B.Halliwell. In review. Modification of anindex of biotic integrity based on fishcommunities for streams of the north-eastern United States. N. Am. J. Fish.Manage.
Minckley, W. L. 1973. Fishes of Arizona.Sims Printing Co., Phoenix, AZ.
Moyle, P. B. 1976. Inland fishes of Califor-nia. University of California Press,Berkeley.
Moyle, P. B., L. R. Brown, and B. Herbold.1986. Final report on development and
preliminary tests of indices of biotic in-tegrity for California. Final report to theU.S. Environmental Protection Agency,Environmental Research Laboratory,Corvallis, OR.
Moyle, P. B., and B. Herbold. 1987. Lifehistory patterns and community struc-ture in stream fishes of western NorthAmerica: comparisons with easternNorth America and Europe. Pages 25-32 in W. J. Matthews and D. C. Heins,eds. Community and evolutionary ecol-ogy of North American stream fishes.University of Oklahoma Press, Nor-man.
Moyle, P. B., and R. D. Nichols. 1973. Ecol-ogy of some native and introduced fishesof the Sierra Nevada foothills in centralCalifornia. Copeia 1973:478-490.
Ohio EPA. 1987. Users manual for biolog-ical field assessment of Ohio surfacewaters. Ohio Environmental ProtectionAgency, Division of Water QualityMonitoring and Assessment, SurfaceWater Section, Columbus, OH.
Pflieger, W. L. 1975. The fishes of Missouri.Missouri Department of Conservation,Jefferson City.
Root, R. B. 1967. The niche exploitation pat-tern of the Blue-gray Gnatcatcher. Ecol.Monogr. 37:317-350.
Steedman, R. J. 1988. Modification and as-sessment of an index of biotic integrityto quantify stream quality in southernOntario. Can. J. Fish. Aquat. Sci. 45:492-501.
Thompson, B. A., and G. R. Fitzhugh. 1986.A use attainability study: an evaluationof fish and macroinvertebrate assem-blages of the Lower Calcasieu River,Louisiana. Center for Wetland Re-sources, Coastal Fisheries Institute,Louisiana State University, Baton Rouge.LSU-CFI-29.
Thompson, D. H., and F. D. Hunt. 1930.The fishes of Champaign County: a studyof distribution and abundance of fishesin small streams. Ill. Nat. Hist. Surv.Bull. 19:1-101.
USEPA. (U.S. Environmental ProtectionAgency) 1987. Surface water monitor-ing: a framework for change. U.S. En-vironmental Protection Agency. Officeof Water and Office of Policy, Planning,and Evalation, Washington, DC.
-- . 1988. Report of the national work-shop on instream biological monitoringand criteria. U.S. Environmental Pro-tection Agency, Office of Water Regu-lations and Standards, Region V andEnvironmental Research Laboratory,Corvallis, OR.
Weber, C. I. 1980. Federal and state bio-monitoring programs. Pages 25-52 inD. Worf, ed. Biological monitoring forenvironmental effects. Lexington Books,Lexington, MA.
Fisheries, Vol. 13, No. 520
Related Documents


