Regional Anthropometric Measures and Hepatic Fibrosis in Patients With Nonalcoholic Fatty Liver Disease Ayako Suzuki * , Manal F. Abdelmalek * , Aynur Unalp–Arida ‡ , Katherine Yates ‡ , Arun Sanyal § , Cynthia Guy ‖ , and Anna Mae Diehl * * Division of Gastroenterology, Duke University, Durham, North Carolina ‡ NASH CRN Data Coordinating Center, Johns Hopkins Bloomberg School of Public Health, Baltimore, Maryland § Division of Gastroenterology, Virginia Commonwealth University, Richmond, Virginia ‖ Department of Pathology, Duke University, Durham, North Carolina Abstract BACKGROUND & AIMS—In overnourished individuals, impaired peripheral fat storage (ie, reduced fat mass in extremities) can increase delivery of surplus calories to the organs other than peripheral adipose tissues, including the liver (ie, lipid overload), and facilitate disease progression in patients with nonalcoholic fatty liver disease (NAFLD). We investigated whether peripheral and/or abdominal adipose depot size correlates with stage of hepatic fibrosis in patients with NAFLD in sex- and/or menopausal stage–specific manners. METHODS—We performed a cross-sectional analysis of 537 adult patients with NAFLD. Peripheral adipose depot size was defined as the sum of z-scores of 2 anthropometric parameters (middle upper arm circumference and hip circumference, relative to total body size) and expressed as extremity size. Abdominal adipose depot size was defined as waist circumference. Peripheral and abdominal adipose depot sizes were associated with fibrosis stage(s) (F0–F4) using multivariable analyses separately for men and pre- and post-menopausal women. RESULTS—After adjusting for caloric intake and energy expenditure during physical activity (MET; hours/week), peripheral and/or abdominal adipose depot sizes were differentially associated with fibrosis stages in men and pre- and post-menopausal women. Men with smaller extremity size, premenopausal women with larger extremity size, and postmenopausal women with larger abdominal size were more likely to have higher stages of fibrosis. CONCLUSIONS—In patients with NAFLD, regional anthropometric measures are associated with fibrosis severity in a sex- and menopausal stage–specific manner. Unlike premenopausal women, men with NAFLD who have small peripheral adipose depots are at an increased risk of having advanced fibrosis. Keywords Obesity; Regional Anthropometrics; Gender Difference; Reproductive Status © 2010 by the AGA Institute Address requests for reprints to: Ayako Suzuki, MD, PhD, MSc, Duke University Medical Center, Division of Gastroenterology, Duke South Orange Zone, Room 0340, PO 3913, Durham, North Carolina 27710. [email protected]; fax: (919) 681-8147. Supplementary Material Note: To access the supplementary material accompanying this article, visit the online version of Clinical Gastroenterology and Hepatology at www.cghjournal.org, and at doi:10.1016/j.cgh.2010.08.005. Conflicts of interest The authors disclose no conflicts. NIH Public Access Author Manuscript Clin Gastroenterol Hepatol. Author manuscript; available in PMC 2011 December 1. Published in final edited form as: Clin Gastroenterol Hepatol. 2010 December ; 8(12): 1062–1069. doi:10.1016/j.cgh.2010.08.005. NIH-PA Author Manuscript NIH-PA Author Manuscript NIH-PA Author Manuscript

Welcome message from author
This document is posted to help you gain knowledge. Please leave a comment to let me know what you think about it! Share it to your friends and learn new things together.
Transcript

Regional Anthropometric Measures and Hepatic Fibrosis inPatients With Nonalcoholic Fatty Liver Disease
Ayako Suzuki*, Manal F. Abdelmalek*, Aynur Unalp–Arida‡, Katherine Yates‡, ArunSanyal§, Cynthia Guy‖, and Anna Mae Diehl*
*Division of Gastroenterology, Duke University, Durham, North Carolina ‡NASH CRN DataCoordinating Center, Johns Hopkins Bloomberg School of Public Health, Baltimore, Maryland§Division of Gastroenterology, Virginia Commonwealth University, Richmond, Virginia‖Department of Pathology, Duke University, Durham, North Carolina
AbstractBACKGROUND & AIMS—In overnourished individuals, impaired peripheral fat storage (ie,reduced fat mass in extremities) can increase delivery of surplus calories to the organs other thanperipheral adipose tissues, including the liver (ie, lipid overload), and facilitate disease progressionin patients with nonalcoholic fatty liver disease (NAFLD). We investigated whether peripheraland/or abdominal adipose depot size correlates with stage of hepatic fibrosis in patients withNAFLD in sex- and/or menopausal stage–specific manners.
METHODS—We performed a cross-sectional analysis of 537 adult patients with NAFLD.Peripheral adipose depot size was defined as the sum of z-scores of 2 anthropometric parameters(middle upper arm circumference and hip circumference, relative to total body size) and expressedas extremity size. Abdominal adipose depot size was defined as waist circumference. Peripheraland abdominal adipose depot sizes were associated with fibrosis stage(s) (F0–F4) usingmultivariable analyses separately for men and pre- and post-menopausal women.
RESULTS—After adjusting for caloric intake and energy expenditure during physical activity(MET; hours/week), peripheral and/or abdominal adipose depot sizes were differentiallyassociated with fibrosis stages in men and pre- and post-menopausal women. Men with smallerextremity size, premenopausal women with larger extremity size, and postmenopausal womenwith larger abdominal size were more likely to have higher stages of fibrosis.
CONCLUSIONS—In patients with NAFLD, regional anthropometric measures are associatedwith fibrosis severity in a sex- and menopausal stage–specific manner. Unlike premenopausalwomen, men with NAFLD who have small peripheral adipose depots are at an increased risk ofhaving advanced fibrosis.
KeywordsObesity; Regional Anthropometrics; Gender Difference; Reproductive Status
© 2010 by the AGA InstituteAddress requests for reprints to: Ayako Suzuki, MD, PhD, MSc, Duke University Medical Center, Division of Gastroenterology,Duke South Orange Zone, Room 0340, PO 3913, Durham, North Carolina 27710. [email protected]; fax: (919) 681-8147.Supplementary MaterialNote: To access the supplementary material accompanying this article, visit the online version of Clinical Gastroenterology andHepatology at www.cghjournal.org, and at doi:10.1016/j.cgh.2010.08.005.Conflicts of interestThe authors disclose no conflicts.
NIH Public AccessAuthor ManuscriptClin Gastroenterol Hepatol. Author manuscript; available in PMC 2011 December 1.
Published in final edited form as:Clin Gastroenterol Hepatol. 2010 December ; 8(12): 1062–1069. doi:10.1016/j.cgh.2010.08.005.
NIH
-PA Author Manuscript
NIH
-PA Author Manuscript
NIH
-PA Author Manuscript

During the past decade, obesity has increased in an epidemic manner and has created asignificant public health problem in most developed nations.1–4 Nonalcoholic fatty liverdisease (NAFLD) has been suggested to increase globally along with the steep increment ofoverweight and obese populations.5,6 A certain proportion of patients with NAFLD mayprogress to cirrhosis or end-stage liver disease.7 Insulin resistance, oxidative stress, alteredhormonal milieus, and immunological deregulation may orchestrate and contribute to thedisease progression of NAFLD.8 However, the exact mechanism underlying diseaseprogression and who would likely develop cirrhosis has not been fully defined.
Obesity is a condition of excessive fat (ie, triglyceride) accumulation in adipose tissue as aconsequence of impaired energy balance.9 In the setting of overnutrition (ie, a chronic stateof positive energy balance), surplus calories are stored as fat in the white adipocytes, a cellgroup specifically designed to store excess fuel. When this storage capacity becomessaturated, it results in the ectopic accumulation of lipids (ie, triglycerides and other lipidssuch as fatty acids, fatty acid derivatives, and sphingolipids) in lean tissues such as muscle,pancreas, liver, heart, and blood vessels (ie, lipid overflow).10 The ectopic lipidaccumulation could compromise normal functionality in these organs and, at least partially,facilitate the development of obesity-related diseases, such as insulin resistance, diabetesmellitus, fatty liver, and atherosclerosis.10–12 Lipodystrophy provides an extreme exampleof abnormal lipid partitioning. In lipodystrophic patients, impaired peripheral fat storageincreases nonadipose (ectopic) lipid accumulation (ie, muscle, liver) and causes insulinresistance and fatty liver.13,14 Indeed, the prevalence of NAFLD, especially the more severeform of NAFLD (ie, steatohepatitis associated with fibrosis), is increased inlipodystrophy.14–16 It is conceivable that impaired peripheral fat storage (ie, reduced fatmass in extremities) may also impact on NAFLD progression in nonlipodystrophic patients.Perlemuter et al recently showed that, as observed for cardiovascular risk factors, leg andtrunk fat mass measured by dual-energy x-ray absorptiometry were independentlyoppositely associated with liver enzymes; leg fat mass was inversely correlated with liverenzymes while trunk fat mass was positively associated with liver enzymes.17 To date,however, whether peripheral adipose depot sizes are associated with severity of NAFLDremains unknown.
Sex and menopausal state influence regional fat distribution and adipocyte functionality viatheir different sex hormone levels.18 Sex hormones, both estrogen and androgen, havesignificant roles in site-specific adipocyte development.19–21 Accordingly, men and womenhave distinct regional fat distribution: android pattern (ie, upper body, truncal, central,abdominal, or visceral obesity) in men versus gynoid pattern (ie, lower body, gluteo-femoral, or peripheral obesity) in women. In women, fat distribution significantly changesalong with menopause and aging; women increase subcutaneous as well as visceralabdominal fat after menopause.22 Therefore, sex and menopausal status may impact theassociations between regional fat distribution and NAFLD severity. In several previousstudies evaluating the associations between regional fat distribution and liver enzymes (fattyliver or histologic severity), menopausal status was not taken into consideration.17,23,24 Abetter understanding of how sex and reproductive status influence the associations betweenregional fat distribution and NAFLD severity is needed.
In this study, we conducted a pilot analysis to refine the hypothesis that impaired peripheralfat storage (ie, reduced fat mass in extremities) impacts on NAFLD progression innonlipodystrophic patients, by evaluating the associations between regional fat distributionand NAFLD severity while taking into consideration sex and menopausal status. Ourspecific aim was to determine whether peripheral and/or abdominal adipose depot sizes (ie,
Suzuki et al. Page 2
Clin Gastroenterol Hepatol. Author manuscript; available in PMC 2011 December 1.
NIH
-PA Author Manuscript
NIH
-PA Author Manuscript
NIH
-PA Author Manuscript

regional anthropometric measures used as surrogates) are correlated with stages of hepaticfibrosis in patients with NAFLD, in sex-and/or menopausal stage–specific manners.
MethodsStudy Design and Population
We performed a hypothesis-driven, cross-sectional analysis using data from the NASHClinical Research Network (NASH CRN), both the NAFLD database and Pioglitazone vsVitamin E vs Placebo for the Treatment of Nondiabetic Patients with NonalcoholicSteatohepatitis (PIVENS) study, of patients diagnosed with NAFLD who were enrolledfrom September 2004 to January 2008.25,26 The study design and data collected from theNASH CRN database and PIVENS study have been recently reported.25,26 Our studypopulation was defined using the following criteria: (1) age at enrollment was ≥18 years; (2)the presence of liver histologic data; (3) no significant alcohol consumption (defined as >14drinks or 168 g of alcohol per week in men or >7 drinks or 84 g of alcohol per week inwomen on average within the past year); (4) no chronic liver diseases other than NAFLD asassessed by serologies and/or histology; (5) if women, the presence of menopausal historydata; and (6) the presence of study variables obtained at baseline and within 6 months ofliver biopsy. Our study population (n = 537) consisted of 215 men, 119 premenopausalwomen, and 203 postmenopausal women. The NASH CRN studies were approved by theInstitutional Review Boards at each participating center.
Liver HistologyThe primary outcome in this study was severity of hepatic fibrosis on histology. All liverbiopsies from the enrolled patients were stained with hematoxylin-eosin and Masson’strichrome stains, and reviewed and scored centrally by the Pathology Committee accordingto the published NASH CRN scoring system.27 Briefly, the stage of hepatic fibrosis wasassessed using a 5-point scale: 0 = none; 1 = zone 3 perisinusoidal or periportal fibrosis (1a= mild, zone 3, perisinusoidal; 1b = moderate, zone 3, perisinusoidal; 1c = portal/periportalonly); 2 = zone 3, perisinusoidal and periportal fibrosis, any combination; 3 = bridgingfibrosis; and 4 = cirrhosis. For the analyses, all the stage 1 (1a, 1b, and 1c) biopsies werecombined and treated as stage 1 biopsies, and stage 3 and 4 biopsies were combined andtreated as advanced fibrosis.
Study VariablesThe primary predictors in this study were regional (ie, peripheral and abdominal) adiposedepot sizes. Using available regional anthropometric measures in the database, we created aparameter describing “extremity size relative to total body size” in individuals tocharacterize their peripheral fat distribution within the study population. The parameter andabdominal circumference were utilized as surrogate measures of defining regional adiposedepot sizes. Total caloric intake and physical activity were treated as covariates for thepurposes of incorporating energy balance for individuals into the analysis.
Peripheral and abdominal adipose depot sizes—Body mass index (BMI; weight[kg]/height[m2]), the circumferences of waist (cm), hip (HIP; cm), and midupper arm(ARM; cm) were used to create anthropometric parameters to define peripheral andabdominal adipose depot sizes. In order to define the peripheral adipose depot size, the ratioof HIP and ARM to BMI were first calculated in each individual as HIP/BMI and ARM/BMI, to express sizes of lower and upper extremities relative to total body size (ie, BMI).Then, the distributions of the 2 variables, HIP/BMI and ARM/BMI, were each transformedto a z-score, (x-mean)/SD, and then summed to calculate a parameter of total peripheraladipose depots, expressed as extremity size (EXT) (EXT = standardized [HIP/BMI] +
Suzuki et al. Page 3
Clin Gastroenterol Hepatol. Author manuscript; available in PMC 2011 December 1.
NIH
-PA Author Manuscript
NIH
-PA Author Manuscript
NIH
-PA Author Manuscript

standardized [ARM/BMI]). EXT (summed z-score) of 0 indicates that the extremity size(relative to total body size) is average in this study population, while EXT of −2 (or −3)indicates that the extremity size is disproportionally smaller than average.
For the comparisons between men, pre-, and post-menopausal women, the abovestandardization was done using the total study population to determine the means and SDsof the parameters. In subgroup analyses, the standardization was computed within eachsubgroup. In order to define the abdominal adipose depot size, waist circumference wasutilized. To be consistent with the EXT variable, standardized waist circumference (z-score)was used in all the models (hereafter WAIST). To classify women into pre- andpostmenopause, we used self-reported postmenopausal status. All the women before orduring menopause were classified as premenopause.
Other study variables—Demographic information, physical activity, current smoking(cigarette), and the presence or absence of comorbidities of diabetes or impaired fastingglucose (IFG) (patient report and/or use of antidiabetic medication and/or fasting glucose>100 g/dL), hypertension (patient report and/or use of antihypertensive medication),hyperuricemia (serum uric acid >5.5 mg/dL), hypertriglyceridemia (serum triglycerides>150 mg/dL), elevated low-density lipoprotein (LDL)-cholesterol (serum LDL-cholesterol≥130 mg/dL), low high-density lipoprotein (HDL)-cholesterol (serum HDL- cholesterol <40mg/dL in men and <50 mg/dL in women), and depression (patient report) were collected atthe time of the study enrollment (within 6 months from liver biopsy) via case report formsdeveloped by the NASH CRN Steering Committee. For race and ethnicity, we used acombination variable (white [non-Hispanic], Hispanic, and others). Total caloric intake(Kcal/day) was calculated based on self-reported usual eating habits over the prior yearprovided via the Block 98.2 nutrition questionnaire.28 Levels of physical activity werecalculated based on self-reported information on averaged daily activities and regularweekly recreational activities provided via the National Institutes of Health (NIH) physicalactivity questionnaire.29 Specifically, averaged levels of daily activities (vigorous orstrenuous, moderate, or light activities for nonrecreational activities) with time (numbers ofhours per day) and all the recreational activities (engaged in at least 15 minutes per week)with time (hours and minutes per week) were self-recorded at enrollment and used tocalculate estimated energy expenditures for nonrecreational and recreational physicalactivities (metabolic equivalent tasks; MET-hours/week).29,30 Information on alcoholconsumption was collected through a standardized questionnaire (Alcohol Use DisordersIdentification Test or AUDIT)31 as well as the Block 98.2 nutrition questionnaire andanalyzed as a dichotomous variable (any amounts of alcohol within allowable limits forstudy inclusion vs no).
Statistical AnalysesData are reported as mean ± SD for continuous variables or proportion of patients with acondition. We first compared clinical characteristics between the 3 groups: men,premenopausal women, and postmenopausal women by using analysis of variance(ANOVA) or χ2 tests. Then, we assessed associations between clinical characteristics andfibrosis stages in men, premenopausal women, and postmenopausal women separately usinganalysis of variance (ANOVA) or χ2 tests. For the 2 parameters of regional adipose depotsizes (EXT and WAIST) the associations of each depot size on fibrosis were also assessedusing multiple linear regression models, adjusting for total caloric intake (Kcal/day) andrecreational/nonrecreational MET-hours/week (in order to take into account the magnitudeof excess energy). In the models, 3 indicator variables were used for fibrosis stage (1 = stage1, 2 = stage 2, 3 = advanced, stage 3 or 4) with stage 0 as the reference group to computeadjusted mean differences (vs stage 0), expressed as beta-coefficients.
Suzuki et al. Page 4
Clin Gastroenterol Hepatol. Author manuscript; available in PMC 2011 December 1.
NIH
-PA Author Manuscript
NIH
-PA Author Manuscript
NIH
-PA Author Manuscript

Multiple ordinal logistic regression models of fibrosis stage on regional adipose depot sizes(EXT and WAIST) were then developed separately. We first included all the potentialconfounder variables (listed in the “Other study variables”). Then, by manually removingvariables that did not influence odds ratios of the primary predictors (ie, EXT and WAIST),we developed the final models. The proportional odds assumption was tested as previouslydescribed.32 In cases where the proportional odds assumption was not met, multiple logisticregression analysis using advanced fibrosis (stages 3–4) as a dependent variable was alsoused. Adjusted cumulative odds ratios (COR) were estimated from the final modelsdeveloped in each subgroup.33 P values were determined from a likelihood ratio test.
For analyses, we used JMP statistical software version 7.0 (SAS Institute, Inc, Cary, NorthCarolina) and considered differences statistically significant when the P values were lessthan .05. All P values presented are 2-sided and have not been adjusted for multiplecomparisons.
ResultsClinical Characteristics
In the total population of 537 subjects, mean age and BMI were 48.0 ± 12.4 years old and34.6 ± 6.5; 39.9% were men, 52.3% had hypertension, 45.3% had diabetes or impairedfasting glucose, 49.2% had hypertriglyceridemia, 64.4% had low HDL-cholesterolemia,38.0% had high LDL-cholesterolemia, 60.9% had hyperuricemia, and 63.0% of womenwere postmenopausal. The comparisons of clinical characteristics among men, pre-, andpost-menopausal women are presented in Supplementary Table 1 (see supplementarymaterial online at www.cghjournal.org). The prevalence of advanced fibrosis (stage 3 or 4)was significantly different among groups and was highest in postmenopausal women(17.7%, 13.5%, and 36.1% for men, pre-, and post-menopausal women, respectively) (χ2
test, P < .0001 with the alpha-level of .017 for multiple comparison).
The Associations of Peripheral and Abdominal Adipose Depot Sizes With the Stage ofHepatic Fibrosis
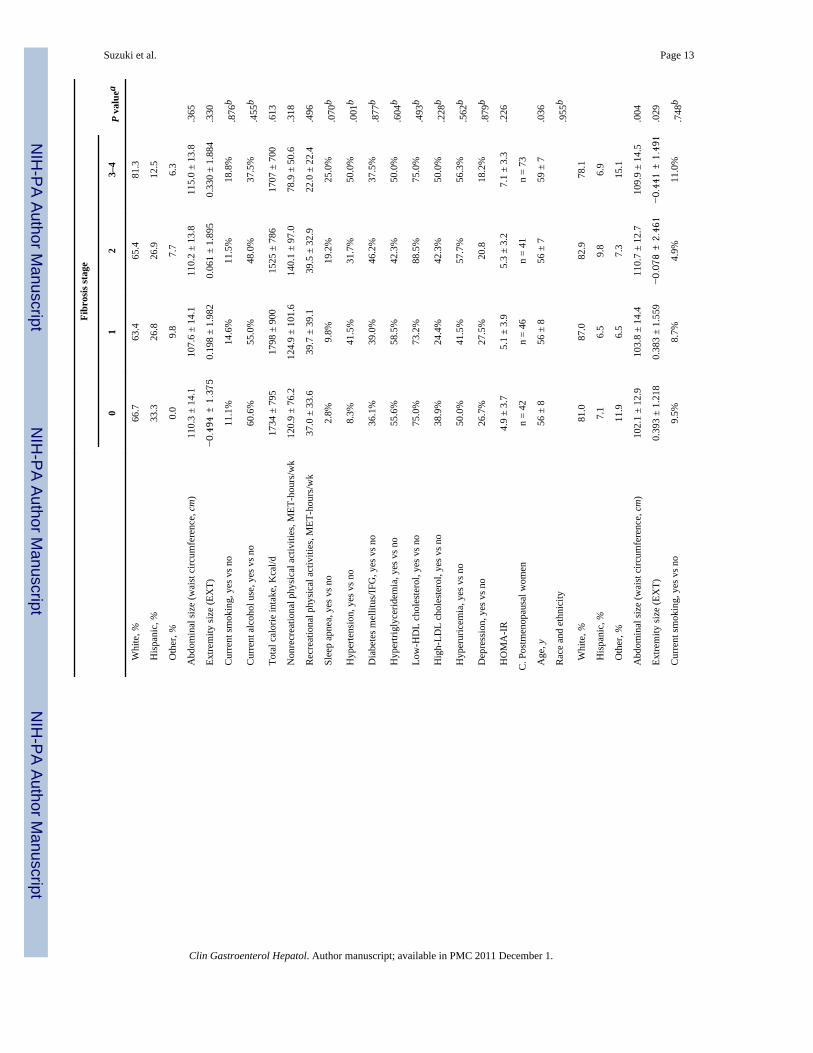
The results of the comparisons between clinical characteristics and stages of fibrosis in the 3subgroups are summarized in Table 1 (A, men; B, premenopausal women; and C,postmenopausal women). In univariate analyses, parameters of regional adipose depot sizes,extremity size (EXT) (P = .029), and abdominal size (waist circumference) (P = .004) wereassociated with fibrosis stages only in postmenopausal women (Table 1, C); smallerextremity size (EXT) and larger abdominal size (waist circumference) appeared to beassociated with more severe fibrosis.
The correlations between regional adipose depot sizes and fibrosis stages after adjusting fortotal caloric intake and MET-hours/week from physical activity levels are shown in Figure1A–C, for men, pre-, and post-menopausal women, respectively. The correlation resultsdiffer, depending on sex and menopausal status. There was a positive correlation betweenfibrosis stage and extremity size (EXT) in premenopausal women, while a negativecorrelation exists between fibrosis stage and extremity size (EXT) in men andpostmenopausal women. These findings implicate that, with a given magnitude of excessenergy, men with severe fibrosis (stage 3 or 4) had smaller peripheral adipose depot sizecompared with ones with stage 0 (difference in adjusted mean, ie, beta coefficient, ofextremity size [EXT] = −.944, P = .03), while premenopausal women with severe fibrosishad larger peripheral adipose depot size compared with ones with stage 0 (beta coefficientand P value =2.218, P = .002). Also, a positive correlation between abdominal size(WAIST) and fibrosis stages in men and postmenopausal women, but not in premenopausal
Suzuki et al. Page 5
Clin Gastroenterol Hepatol. Author manuscript; available in PMC 2011 December 1.
NIH
-PA Author Manuscript
NIH
-PA Author Manuscript
NIH
-PA Author Manuscript

women, was noted. Based on the models, with a given magnitude of excess energy, menwith severe fibrosis had larger abdominal adipose depot size compared with ones with stage0 (difference in adjusted mean, ie, beta coefficient, of abdominal size [WAIST] = .39, P = .08), while postmenopausal women with moderate (stage 2) or severe fibrosis (stages 3– 4)had larger abdominal adipose depot size compared with ones with stage 0 (beta coefficient= .63, P = .005 for stage 2 and beta coefficient = .53, P = .01 for stages 3– 4). As expected,there was significant interaction between premenopausal women versus men (P = .006) orpostmenopausal women (P = .009) in the association between fibrosis stage and extremitysize (but not waist).
Multiple ordinal logistic regression models developed in the 3 subgroups are summarized inTable 2. After adjusting for other factors, larger extremity size (EXT) was less likelyassociated with higher histologic stages of fibrosis among men (COR = 0.7, P = .008). Incontrast, larger extremity size (EXT) was more likely associated with higher histologicstages of fibrosis among premenopausal women (COR = 1.6, P = .003). Amongpostmenopausal women, larger abdominal size (WAIST), but not extremity size (EXT), wasmore likely associated with higher histologic stages of fibrosis (COR = 1.6, P = .032).
In the premenopausal women, the assumption for use of a proportional logistic regressionmodel was weakly met (P = .04); therefore, we also performed multiple logistic regressionanalysis using a binary fibrosis variable (stage 3–4 vs others). The logistic regression modelshowed consistent results; larger extremity size (EXT) was associated with an increasedlikelihood of advanced fibrosis (adjusted OR of having advanced fibrosis for 1 U increase inextremity size [EXT] = 3.9 [95% confidence interval, 1.4 –10.8], P = .008).
DiscussionWe have conducted a pilot analysis using data from the NASH CRN, taking into account sexand menopausal status for the purpose of validating our preliminary hypothesis. Ouranalyses revealed that after adjusting for energy balance (total caloric intake and energyexpenditure from physical activity levels), regional anthropometric measures (as surrogatesfor peripheral and/or abdominal adipose depot sizes) were significantly associated withhepatic fibrosis in sex- and menopausal status-specific manner. Men who preferentiallystored fat in peripheral adipose depots (as evidenced by larger extremities with smallerabdominal girths) were less likely to have severe hepatic fibrosis than men who stored lessfat in peripheral adipose depots (smaller extremities with larger abdominal girths). Incontrast, premenopausal women who had enlarged extremities were at an increased risk ofhaving more severe liver fibrosis. After menopause, however, the relationship betweenadipose depot size and liver fibrosis became more male-like; postmenopausal women withlarger waist circumference were at an increased risk of having more severe hepatic fibrosis.
In this study we investigated the cross-sectional associations between the 2 anthropometricparameters (ie, peripheral and abdominal adipose depot sizes) and fibrosis stages afteradjusting for other potentially confounding factors, to provide a basis for future validationstudies. The limitations of retrospective cross-sectional association studies precludeassessment of causality and/or pathogenic mechanisms underlying the observedassociations. However, the strength of the observed associations justifies further animal,preclinical, and/or clinical studies to elucidate the involved mechanisms.
Previous studies have also suggested an association between regional fat distribution andNAFLD. For example, Cheung et al reported that the presence of dorsocervicallipohypertrophy (ie, buffalo hump) is a strong predictor of the severity of steatohepatitis.23
The mechanisms underlying the development of a “buffalo hump” remain unknown and
Suzuki et al. Page 6
Clin Gastroenterol Hepatol. Author manuscript; available in PMC 2011 December 1.
NIH
-PA Author Manuscript
NIH
-PA Author Manuscript
NIH
-PA Author Manuscript

warrant further investigation. Nonetheless, the data are intriguing and potentially pertinent toabnormalities in lipid partitioning because buffalo hump is 1 of the clinical features inpatients with lipodystrophy, a condition of impaired peripheral fat storage.14,34 Jun et alinvestigated the associations between regional fat distribution (measured by computedtomography) and the presence of fatty liver disease (as diagnosed by ultrasound) in men andwomen.24 Among women (but not men), low femoral subcutaneous fat was independentlyassociated with the presence of fatty liver. Further, Perlemuter et al showed by using dual-energy x-ray absorptiometry that leg fat mass was inversely correlated with liver enzymeswhile trunk fat mass was positively associated with liver enzymes.17 Unfortunately, thesestudies did not distinguish pre- from post-menopausal women in their analysis, which mayhave significantly influenced regional fat distribution and NAFLD susceptibility. Lackingsuch information, it is difficult to compare the results of these earlier studies with ourcurrent work.
The safest place to store surplus calories is peripheral white adipose tissue. When the storagecapacity of the peripheral white adipose tissue becomes saturated (eg, due to the lack ofpreadipocyte differentiation or adipocyte maturation), surplus calories (ie, lipids) will bedistributed to visceral adipose tissue or normally lean nonadipose tissues, as seen in patientswith lipodystrophy. Thus, it is reasonable to speculate that obese patients who havedisproportionally smaller extremities relative to total adiposity (reflecting less-utilizedsubcutaneous fat depots) may deliver excessive lipids to normally lean tissues, such as theliver, thereby causing “lipotoxicity.” As age advances, peripheral adipogenesis becomesrelatively impaired and, at the same time, visceral fat depots increase in size.35 The increasein age and abdominal fat, along with the decrease in energy expenditure and physicalactivity, are especially notable risk factors for NAFLD among women followingmenopause.22 Thus, postmenopausal women may suffer from increased lipid delivery to theliver, which could partially explain their higher prevalence of advanced NAFLD. Thepositive association between extremity sizes and hepatic fibrosis that we observed inpremenopausal women is hard to explain at this point. This association was not eliminatedor altered after adding the combined ethnicity/race variable in the model, suggesting that theassociation may not be explained by ethnicity/race (data are not shown). Mechanisms otherthan lipotoxicity (eg, obesity-related hyperleptinemia with consequent activation of hepaticstellate cells to myofibroblasts or other adipose derived hormones/cytokines) may beinvolved in fibrosis progression under sufficient estrogen supply. Further investigation isrequired to delineate the specific mechanisms involved in premenopausal women.
We acknowledge several limitations in this study. We did not assess regional fat massdirectly, but used regional anthropometric measures as surrogates. Although our separateanalyses in men, pre-, and post-menopausal women partially controlled some differences inlean body mass, our results may have been confounded by variance in lean body mass.Validation studies using more accurate measures for fat distribution (eg, dual energy x-rayabsorptiometry scanning or magnetic resonance imaging) are warranted. Further, the cross-sectional study design and analysis does not allow us to address any causality. Regardless ofthese limitations, our study identified significant associations between regionalanthropometric measures and hepatic fibrosis in a sex- and menopausal status–specificmanner. Further investigation of peripheral adipogenesis as well as hepatic abilities to guardagainst lipotoxicity, while taking into account individual energy balance and sex hormonelevels in patients with NAFLD, may enrich our understanding of clinical pathobiology andfacilitate more individualized diagnostic and therapeutic approaches in the future.
In summary, our analyses show that after normalizing energy balance among a large groupof obese/overweight NAFLD patients, regional anthropometric measures that reflect sizes ofdifferent adipose depots significantly correlate with severity of hepatic fibrosis in a sex- and
Suzuki et al. Page 7
Clin Gastroenterol Hepatol. Author manuscript; available in PMC 2011 December 1.
NIH
-PA Author Manuscript
NIH
-PA Author Manuscript
NIH
-PA Author Manuscript

hormonal status–specific manner. Given the limitations and preliminary nature of this study,it remains hypothetical whether impaired peripheral fat storage has a significant impact ondisease progression of NAFLD among obese patients. However, further investigation, bothbasic and clinical, is justified to delineate the dynamic mechanism(s) associated withperipheral and abdominal adipose depot sizes and disease progression in NAFLD.
Supplementary MaterialRefer to Web version on PubMed Central for supplementary material.
AcknowledgmentsThe authors thank Dr Shein C. Chow and Jr Rung Lin for their critical consideration and insight regardingstatistical approach used in this analysis.
Abbreviations used in this paper
ARM circumference of midupper arm (cm)
BMI body mass index
COR cumulative odds ratio
EXT calculated parameter indicating extremity size
HDL high-density lipoprotein
HIP circumference of hip (cm)
IFG impaired fasting glucose
LDL low-density lipoprotein
MET metabolic equivalent of task
NAFLD nonalcoholic fatty liver disease
WAIST standardized waist circumference (z-score)
References1. Mokdad AH, Ford ES, Bowman BA, et al. Prevalence of obesity, diabetes, and obesity-related
health risk factors, 2001. JAMA. 2003; 289:76–79. [PubMed: 12503980]2. Huang KC. Obesity and its related diseases in Taiwan. Obes Rev. 2008; 9 Suppl 1:32–34. [PubMed:
18307696]3. Ogden CL, Yanovski SZ, Carroll MD, et al. The epidemiology of obesity. Gastroenterology. 2007;
132:2087–2102. [PubMed: 17498505]4. Schröder H, Elosua R, Vila J, et al. Secular trends of obesity and cardiovascular risk factors in a
Mediterranean population. Obesity (Silver Spring). 2007; 15:557–562. [PubMed: 17372304]5. Clark JM. The epidemiology of nonalcoholic fatty liver disease in adults. J Clin Gastroenterol.
2006; 40 Suppl 1:S5–S10. [PubMed: 16540768]6. Kojima S, Watanabe N, Numata M, et al. Increase in the prevalence of fatty liver in Japan over the
past 12 years: analysis of clinical background. J Gastroenterol. 2003; 38:954–961. [PubMed:14614602]
7. Adams LA, Lindor KD. Nonalcoholic fatty liver disease. Ann Epidemiol. 2007; 17:863–869.[PubMed: 17728149]
8. Angulo P. Nonalcoholic fatty liver disease. N Engl J Med. 2002; 346:1221–1231. [PubMed:11961152]
Suzuki et al. Page 8
Clin Gastroenterol Hepatol. Author manuscript; available in PMC 2011 December 1.
NIH
-PA Author Manuscript
NIH
-PA Author Manuscript
NIH
-PA Author Manuscript

9. Weinsier RL, Hunter GR, Heini AF, et al. The etiology of obesity: relative contribution of metabolicfactors, diet, and physical activity. Am J Med. 1998; 105:145–150. [PubMed: 9727822]
10. Slawik M, Vidal-Puig AJ. Lipotoxicity, overnutrition and energy metabolism in aging. Ageing ResRev. 2006; 5:144–164. [PubMed: 16630750]
11. Sethi JK, Vidal-Puig AJ. Thematic review series: adipocyte biology. Adipose tissue function andplasticity orchestrate nutritional adaptation. J Lipid Res. 2007; 48:1253–1262. [PubMed:17374880]
12. Unger RH. Lipid overload and overflow: metabolic trauma and the metabolic syndrome. TrendsEndocrinol Metab. 2003; 14:398–403. [PubMed: 14580758]
13. Samaras K. Metabolic consequences and therapeutic options in highly active antiretroviral therapyin human immunodeficiency virus-1 infection. J Antimicrob Chemother. 2008; 61:238–245.[PubMed: 18070830]
14. Grinspoon S, Carr A. Cardiovascular risk and body-fat abnormalities in HIV-infected adults. NEngl J Med. 2005; 352:48–62. [PubMed: 15635112]
15. Javor ED, Ghany MG, Cochran EK, et al. Leptin reverses nonalcoholic steatohepatitis in patientswith severe lipodystrophy. J Hepatol. 2005; 41:753–760.
16. Lemoine M, Barbu V, Girard PM, et al. Altered hepatic expression of SREBP-1 and PPARgammais associated with liver injury in insulin-resistant lipodystrophic HIV-infected patients. AIDS.2006; 20:387–395. [PubMed: 16439872]
17. Perlemuter G, Naveau S, Belle-Croix F, et al. Independent and opposite associations of trunk fatand leg fat with liver enzyme levels. Liver Int. 2008; 28:1381–1388. [PubMed: 18482272]
18. Suzuki A, Abdelmalek MF. Nonalcoholic fatty liver disease in women. Womens Health (LondEngl). 2009; 5:191–203. [PubMed: 19245356]
19. Blouin K, Boivin A, Tchernof A. Androgens and body fat distribution. J Steroid Biochem MolBiol. 2008; 108:272–280. [PubMed: 17945484]
20. Cooke PS, Naaz A. Role of estrogens in adipocyte development and function. Exp Biol MedMaywood. 2004; 229:1127–1135. [PubMed: 15564439]
21. Wake DJ, Strand M, Rask E, et al. Intra-adipose sex steroid metabolism and body fat distributionin idiopathic human obesity. Clin Endocrinol (Oxf). 2007; 66:440–446. [PubMed: 17302881]
22. Lovejoy JC, Champagne CM, de Jonge L, et al. Increased visceral fat and decreased energyexpenditure during the menopausal transition. Int J Obes (Lond). 2008; 32:949–958. [PubMed:18332882]
23. Cheung O, Kapoor A, Puri P, et al. The impact of fat distribution on the severity of nonalcoholicfatty liver disease and metabolic syndrome. J Hepatol. 2007; 46:1091–1100.
24. Jun DW, Han JH, Kim SH, et al. Association between low thigh fat and non-alcoholic fatty liverdisease. J Gastroenterol Hepatol. 2008; 23:888–893. [PubMed: 18466289]
25. Nonalcoholic steatohepatitis clinical research network. Hepatology. 2003; 37:244. [PubMed:12540771]
26. Chalasani NP, Sanyal AJ, Kowdley KV, et al. Pioglitazone versus vitamin E versus placebo for thetreatment of non-diabetic patients with non-alcoholic steatohepatitis: PIVENS trial design.Contemp Clin Trials. 2009; 30:88–96. [PubMed: 18804555]
27. Kleiner DE, Brunt EM, Van Natta M, et al. Design and validation of a histological scoring systemfor nonalcoholic fatty liver disease. Hepatology. 2005; 41:1313–1321. [PubMed: 15915461]
28. Block G, Hartman AM, Dresser CM, et al. A data-based approach to diet questionnaire design andtesting. Am J Epidemiol. 1986; 124:453–469. [PubMed: 3740045]
29. Ainsworth BE, Haskell WL, Whitt MC, et al. Compendium of physical activities: an update ofactivity codes and MET intensities. Med Sci Sports Exerc. 2000; 32(9 Suppl):S498–S504.[PubMed: 10993420]
30. Friedenreich CM, Courneya KS, Neilson HK, et al. Reliability and validity of the past year totalphysical activity questionnaire. Am J Epidemiol. 2006; 163:959–970. [PubMed: 16524954]
31. Saunders JB, Aasland OG, Babor TF, et al. Development of the Alcohol Use DisordersIdentification Test (AUDIT): WHO Collaborative Project on Early detection of persons withharmful alcohol consumption–II. Addiction. 1993; 88:791–804. [PubMed: 8329970]
Suzuki et al. Page 9
Clin Gastroenterol Hepatol. Author manuscript; available in PMC 2011 December 1.
NIH
-PA Author Manuscript
NIH
-PA Author Manuscript
NIH
-PA Author Manuscript

32. Lemeshow S, Hosmer DW Jr. A review of goodness of fit statistics for use in the development oflogistic regression models. Am J Epidemiol. 1982; 115:92–106. [PubMed: 7055134]
33. McCullagh P. Regression models for ordinal data (with discussion). J R Stat Soc B Stat Methodol.1980; 42:109–142.
34. Simha V, Garg A. Lipodystrophy: lessons in lipid and energy metabolism. Curr Opin Lipidol.2006; 17:162–169. [PubMed: 16531753]
35. Cartwright MJ, Tchkonia T, Kirkland JL. Aging in adipocytes: potential impact of inherent, depot-specific mechanisms. Exp Gerontol. 2007; 42:463–471. [PubMed: 17507194]
Suzuki et al. Page 10
Clin Gastroenterol Hepatol. Author manuscript; available in PMC 2011 December 1.
NIH
-PA Author Manuscript
NIH
-PA Author Manuscript
NIH
-PA Author Manuscript

Figure 1.The association between regional anthropometric parameters and hepatic fibrosis afteradjusting for total calorie intake and physical activity levels. (A) Men, (B) premenopausalwomen, and (C) postmenopausal women depict the associations between severity of hepaticfibrosis and parameters of peripheral and abdominal adipose depot sizes after taking intoconsideration the magnitude of excess energy. In each figure, the horizontal axis representsfibrosis stages, and the vertical axis represents beta coefficients and 95% confidenceintervals (bars and lines) from the multiple linear regression models.
Suzuki et al. Page 11
Clin Gastroenterol Hepatol. Author manuscript; available in PMC 2011 December 1.
NIH
-PA Author Manuscript
NIH
-PA Author Manuscript
NIH
-PA Author Manuscript

NIH
-PA Author Manuscript
NIH
-PA Author Manuscript
NIH
-PA Author Manuscript
Suzuki et al. Page 12
Tabl
e 1
Com
paris
ons o
f Clin
ical
Cha
ract
eris
tics A
mon
g D
iffer
ent F
ibro
sis S
tage
s in
NA
FLD
Fibr
osis
stag
e
01
23–
4P
valu
ea
A. M
enn
= 62
n =
71n
= 44
n =
38
Age
, y41
± 1
144
± 1
344
± 1
249
± 1
3.0
09
Rac
e an
d et
hnic
ity.0
59b
W
hite
, %54
.868
.675
.079
.0
H
ispa
nic,
%29
.011
.413
.67.
9
O
ther
, %16
.120
.011
.413
.2
Abd
omin
al si
ze (w
aist
circ
umfe
renc
e, c
m)
109.
4 ±
12.9
112.
9 ±
13.8
111.
8 ±
12.6
112.
9 ±
15.6
.463
Ext
rem
ity si
ze (E
XT)
0.33
3 ±
1.75
6−0.
012
± 1.
926
−0.
101
± 1.
466
−0.
260
± 2.
042
.486
Cur
rent
smok
ing,
yes
vs n
o4.
8%7.
0%4.
6%7.
9%.8
77b
Cur
rent
alc
ohol
use
, yes
vs n
o73
.7%
64.1
%57
.5%
47.4
%.0
65b
Tot
al c
alor
ie in
take
, Kca
l/d22
14 ±
104
819
71 ±
775
2419
± 1
382
2039
± 9
64.1
36
Non
recr
eatio
nal p
hysi
cal a
ctiv
ities
, MET
-hou
rs/w
k14
6.3
± 97
.212
6.5
± 80
.814
7.3
± 12
4.2
113.
3 ±
77.7
.306
Rec
reat
iona
l phy
sica
l act
iviti
es, M
ET-h
ours
/wk
38.9
± 3
0.7
38.2
± 3
6.5
37.8
± 4
5.5
36.0
± 3
4.6
.987
Sle
ep a
pnea
, yes
vs n
o14
.5%
22.5
%13
.6%
23.7
%.4
28b
Hyp
erte
nsio
n, y
es v
s no
38.7
%43
.7%
59.1
%63
.2%
.041
b
Dia
bete
s mel
litus
/IFG
, yes
vs n
o32
.3%
45.1
%50
.0%
52.6
%.1
51b
Hyp
ertri
glyc
erid
emia
, yes
vs n
o38
.7%
57.8
%68
.2%
39.5
%.0
07b
Low
-HD
L ch
oles
tero
l, ye
s vs n
o54
.8%
69.0
%63
.6%
55.3
%.3
13b
Hig
h-LD
L ch
oles
tero
l, ye
s vs n
o33
.9%
40.9
%49
.0%
23.7
%.2
82b
Hyp
erur
icem
ia, y
es v
s no
85.5
%88
.7%
79.6
%57
.9%
<.00
1b
Dep
ress
ion,
yes
vs n
o5.
3%12
.5%
18.0
%6.
1%.1
73b
HO
MA
-IR
4.2
± 2.
57.
4 ±
10.0
5.5
± 3.
77.
1 ±
5.9
.033
B. P
rem
enop
ausa
l wom
enn
= 36
n =
41n
= 26
n =
16
Age
, y38
± 9
39 ±
942
± 1
041
± 1
0.4
60
Rac
e an
d et
hnic
ity.3
77b
Clin Gastroenterol Hepatol. Author manuscript; available in PMC 2011 December 1.
NIH
-PA Author Manuscript
NIH
-PA Author Manuscript
NIH
-PA Author Manuscript
Suzuki et al. Page 13
Fibr
osis
stag
e
01
23–
4P
valu
ea
W
hite
, %66
.763
.465
.481
.3
H
ispa
nic,
%33
.326
.826
.912
.5
O
ther
, %0.
09.
87.
76.
3
Abd
omin
al si
ze (w
aist
circ
umfe
renc
e, c
m)
110.
3 ±
14.1
107.
6 ±
14.1
110.
2 ±
13.8
115.
0 ±
13.8
.365
Ext
rem
ity si
ze (E
XT)
−0.
494
± 1.
375
0.19
8 ±
1.98
20.
061
± 1.
895
0.33
0 ±
1.88
4.3
30
Cur
rent
smok
ing,
yes
vs n
o11
.1%
14.6
%11
.5%
18.8
%.8
76b
Cur
rent
alc
ohol
use
, yes
vs n
o60
.6%
55.0
%48
.0%
37.5
%.4
55b
Tot
al c
alor
ie in
take
, Kca
l/d17
34 ±
795
1798
± 9
0015
25 ±
786
1707
± 7
00.6
13
Non
recr
eatio
nal p
hysi
cal a
ctiv
ities
, MET
-hou
rs/w
k12
0.9
± 76
.212
4.9
± 10
1.6
140.
1 ±
97.0
78.9
± 5
0.6
.318
Rec
reat
iona
l phy
sica
l act
iviti
es, M
ET-h
ours
/wk
37.0
± 3
3.6
39.7
± 3
9.1
39.5
± 3
2.9
22.0
± 2
2.4
.496
Sle
ep a
pnea
, yes
vs n
o2.
8%9.
8%19
.2%
25.0
%.0
70b
Hyp
erte
nsio
n, y
es v
s no
8.3%
41.5
%31
.7%
50.0
%.0
01b
Dia
bete
s mel
litus
/IFG
, yes
vs n
o36
.1%
39.0
%46
.2%
37.5
%.8
77b
Hyp
ertri
glyc
erid
emia
, yes
vs n
o55
.6%
58.5
%42
.3%
50.0
%.6
04b
Low
-HD
L ch
oles
tero
l, ye
s vs n
o75
.0%
73.2
%88
.5%
75.0
%.4
93b
Hig
h-LD
L ch
oles
tero
l, ye
s vs n
o38
.9%
24.4
%42
.3%
50.0
%.2
28b
Hyp
erur
icem
ia, y
es v
s no
50.0
%41
.5%
57.7
%56
.3%
.562
b
Dep
ress
ion,
yes
vs n
o26
.7%
27.5
%20
.818
.2%
.879
b
HO
MA
-IR
4.9
± 3.
75.
1 ±
3.9
5.3
± 3.
27.
1 ±
3.3
.226
C. P
ostm
enop
ausa
l wom
enn
= 42
n =
46n
= 41
n =
73
Age
, y56
± 8
56 ±
856
± 7
59 ±
7.0
36
Rac
e an
d et
hnic
ity.9
55b
W
hite
, %81
.087
.082
.978
.1
H
ispa
nic,
%7.
16.
59.
86.
9
O
ther
, %11
.96.
57.
315
.1
Abd
omin
al si
ze (w
aist
circ
umfe
renc
e, c
m)
102.
1 ±
12.9
103.
8 ±
14.4
110.
7 ±
12.7
109.
9 ±
14.5
.004
Ext
rem
ity si
ze (E
XT)
0.39
3 ±
1.21
80.
383
± 1.
559
−0.
078
± 2.
461
−0.
441
± 1.
491
.029
Cur
rent
smok
ing,
yes
vs n
o9.
5%8.
7%4.
9%11
.0%
.748
b
Clin Gastroenterol Hepatol. Author manuscript; available in PMC 2011 December 1.

NIH
-PA Author Manuscript
NIH
-PA Author Manuscript
NIH
-PA Author Manuscript
Suzuki et al. Page 14
Fibr
osis
stag
e
01
23–
4P
valu
ea
Cur
rent
alc
ohol
use
, yes
vs n
o46
.2%
52.3
%46
.2%
33.3
%.2
13b
Tot
al c
alor
ie in
take
, Kca
l/d16
91 ±
738
1728
± 8
0117
47 ±
884
1626
± 9
98.8
88
Non
recr
eatio
nal p
hysi
cal a
ctiv
ities
, MET
-hou
rs/w
k10
7.0
± 68
.194
.6 ±
57.
910
7.3
± 63
.581
.9 ±
49.
9.1
25
Rec
reat
iona
l phy
sica
l act
iviti
es, M
ET-h
ours
/wk
50.0
± 4
1.1
33.4
± 2
8.5
38.9
± 3
8.6
35.6
± 3
1.4
.148
Sle
ep a
pnea
, yes
vs n
o7.
1%15
.2%
17.1
%30
.1%
.018
b
Hyp
erte
nsio
n, y
es v
s no
52.4
%65
.2%
61.0
%76
.7%
.054
b
Dia
bete
s mel
litus
/IFG
, yes
vs n
o40
.5%
34.8
%51
.2%
64.4
%.0
08b
Hyp
ertri
glyc
erid
emia
, yes
vs n
o50
.0%
58.7
%31
.7%
42.5
%.0
72b
Low
-HD
L ch
oles
tero
l, ye
s vs n
o61
.9%
56.5
%56
.1%
64.4
%.7
70b
Hig
h-LD
L ch
oles
tero
l, ye
s vs n
o42
.9%
43.5
%61
.0%
26.0
%.0
03b
Hyp
erur
icem
ia, y
es v
s no
47.6
%52
.2%
46.3
%43
.8%
.849
b
Dep
ress
ion,
yes
vs n
o29
.0%
27.5
%29
.7%
42.1
%.3
71b
HO
MA
-IR
4.7
± 3.
45.
9 ±
5.7
5.8
± 4.
49.
0 ±
7.3
<.00
1
EXT,
cal
cula
ted
para
met
er in
dica
ting
extre
mity
size
; HD
L, h
igh-
dens
ity li
popr
otei
n; H
OM
A-I
R, H
omeo
stas
is M
odel
of A
sses
smen
t - In
sulin
Res
ista
nce;
IFG
, im
paire
d fa
stin
g gl
ucos
e; L
DL,
low
-den
sity
lipop
rote
in; M
ET, m
etab
olic
equ
ival
ent o
f tas
k; N
AFL
D, n
onal
coho
lic fa
tty li
ver d
isea
se.
a P va
lues
wer
e fr
om χ
2 te
st o
r ana
lysi
s of v
aria
nce
(AN
OV
A).
b χ2
test
.
Clin Gastroenterol Hepatol. Author manuscript; available in PMC 2011 December 1.

NIH
-PA Author Manuscript
NIH
-PA Author Manuscript
NIH
-PA Author Manuscript
Suzuki et al. Page 15
Tabl
e 2
Adj
uste
d C
umul
ativ
e O
dds R
atio
s of A
dipo
se D
epot
Siz
es a
nd T
heir
Ass
ocia
tion
With
the
Seve
rity
of F
ibro
sis i
n M
en, P
rem
enop
ausa
l, an
dPo
stm
enop
ausa
l Wom
en
Men
Prem
enop
ausa
l wom
enPo
stm
enop
ausa
l wom
en
CO
R (9
5% C
I)P
valu
eC
OR
(95%
CI)
P va
lue
CO
R (9
5% C
I)P
valu
e
Age
, 10-
y in
crea
se1.
4 (1
.0–1
.8)
.021
——
1.7
(1.1
–2.6
).0
14
Rac
e, w
hite
2.3
(1.1
–4.7
).0
21—
——
—
Extre
mity
size
(EX
T), 1
U in
crea
se0.
7 (0
.6–0
.9)
.008
1.6
(1.2
–2.2
).0
031.
0 (0
.8–1
.3)
.711
Abd
omin
al si
ze (W
AIS
T), 1
U in
crea
se0.
8 (0
.5–1
.2)
.310
1.3
(0.7
–2.5
).3
571.
6 (1
.0–2
.5)
.032
Cur
rent
smok
ing
——
——
Cur
rent
alc
ohol
use
0.5
(0.3
–0.8
).0
08—
——
—
Tota
l cal
orie
inta
ke, 5
00 K
cal/d
incr
ease
0.9
(0.8
–1.1
).3
151.
0 (0
.8–1
.3)
.955
0.9
(0.8
–1.1
).4
24
Non
recr
eatio
nal p
hysi
cal a
ctiv
ities
, 10
MET
-h/w
k in
crea
se1.
0 (1
.0–1
.1)
.970
1.0
(0.9
–1.0
).8
201.
0 (0
.9–1
.0)
.562
Rec
reat
iona
l phy
sica
l act
iviti
es, 1
0 M
ET-h
/wk
incr
ease
1.0
(1.0
–1.0
).3
750.
9 (0
.8–1
.0)
.074
1.0
(0.9
–1.0
).8
61
Slee
p ap
nea
1.5
(0.7
–3.5
).3
312.
6 (0
.6–1
0.6)
.181
1.4
(0.6
–3.4
).4
40
Dia
bete
s mel
litus
1.5
(0.8
–2.8
).1
69—
——
—
Hyp
erte
nsio
n—
—2.
1 (0
.9–4
.8)
.078
——
Hyp
ertri
glyc
erid
emia
——
0.3
(0.1
–0.7
).0
09—
—
Low
-HD
L ch
oles
tero
l—
—1.
5 (0
.5–4
.2)
.442
——
Hig
h-LD
L ch
oles
tero
l—
——
—0.
7 (0
.4–1
.2)
.179
Hyp
erur
icem
ia0.
2 (0
.1–0
.5)
<.00
11.
8 (0
.8–4
.4)
.183
——
Hom
a-IR
, 5 U
incr
ease
——
1.2
(0.7
–2.2
).5
551.
4 (1
.0–1
.8)
.040
CI,
conf
iden
ce in
terv
al; C
OR
, adj
uste
d cu
mul
ativ
e od
ds ra
tio; E
XT,
cal
cula
ted
para
met
er in
dica
ting
extre
mity
size
; MET
, met
abol
ic e
quiv
alen
t of t
ask;
WA
IST,
stan
dard
ized
wai
st c
ircum
fere
nce
(z-s
core
).
Clin Gastroenterol Hepatol. Author manuscript; available in PMC 2011 December 1.
Related Documents