Regional and Global Spillovers and Diversification Opportunities in the GCC-Wide Equity Sectors across Market Regimes Mehmet Balcılar Department of Economics Eastern Mediterranean University Famagusta, T. R. North Cyprus, via Mersin 10, Turkey. Rıza Demirer Department of Economics & Finance Southern Illinois University Edwardsville Edwardsville, IL 62026-1102 Shawkat Hammoudeh † Lebow College of Business Drexel University Philadelphia, PA 19104, United States March 2014 † Corresponding Author. E-mail: [email protected] ; Tel: 610-949-0133; Fax: 215-895-6975

Welcome message from author
This document is posted to help you gain knowledge. Please leave a comment to let me know what you think about it! Share it to your friends and learn new things together.
Transcript

Regional and Global Spillovers and Diversification Opportunities in the GCC-Wide
Equity Sectors across Market Regimes
Mehmet Balcılar Department of Economics
Eastern Mediterranean University Famagusta, T. R. North Cyprus, via Mersin 10, Turkey.
Rıza Demirer Department of Economics & Finance
Southern Illinois University Edwardsville Edwardsville, IL 62026-1102
Shawkat Hammoudeh† Lebow College of Business
Drexel University Philadelphia, PA 19104, United States
March 2014
†Corresponding Author. E-mail: [email protected] ; Tel: 610-949-0133; Fax: 215-895-6975
2
Regional and Global Spillovers and Diversification Opportunities in the GCC Equity Sectors
across Market Regimes
Abstract
This paper examines the international diversification benefits of nine bloc-wide equity
sectors/subsectors in the oil-rich Gulf Cooperation Council (GCC) countries by comparing alternative
spillover models that encompass local, regional and global factors. Both the return and volatility
spillover effects are found to display time variations with regime-specific patterns based on low, high
and extreme market volatility states. Some GCC-wide equity sectors/subsectors are found to display
segmentation from global markets during periods of high and extreme market volatility, and thus can
serve as safe havens for international investors during such periods. The in- and out-of-sample
portfolio analyses further suggest that supplementing global portfolios with positions in the GCC
markets yield significant international diversification benefits, consistently offering much improved
risk-adjusted returns across the alternative spillover models.
JEL Classification: C32, G11, G15
Keywords: GCC-wide equity sectors; Multivariate regime-switching; Time-varying correlations; Financial integration; International portfolio diversification.
3
1. Introduction The recent financial crisis which originated in the U.S., the prolonged debt crisis and the
economic uncertainty that wrapped the Eurozone have sent severe shocks throughout the world’s
financial markets. These difficult times have also underscored the importance of emerging markets as
potential risk diversifiers and return enhancers when the developed markets are in crises. As Balli et
al. (2014) note, a number of factors including aging populations in mature markets and growing
interest for alternative investments have led to significant shifts in global wealth to emerging market
economies. Numerous studies have examined financial integration across global markets and its effect
on portfolio diversification. A number of studies in this literature have highlighted the importance of
return and volatility spillovers across advanced and emerging markets and the potential diversification
benefits that can be achieved by investing in emerging markets (e.g. Chiou, 2008; Middleton et al.,
2008; Bekaert et al., 2009; You and Daigler, 2010; Khalifa et al., 2014; among others).
An emerging strand of the literature on international diversification has also focused on the
cash- and oil-rich Gulf Arab stock markets (e.g. Yu and Hassan, 2008; Cheng et al., 2010; Mansourfar
et al., 2010). This literature in general suggests that the developing stock markets of the Gulf
Cooperation Council (GCC) member countries are to a varying degree segmented from international
markets, and thus diversification benefits can be achieved by allocating part of global portfolios to
investments from these oil-rich countries. Focusing specifically on a number of frontier markets
including the GCC nations of Kuwait, Oman, Saudi Arabia and UAE, Berger et al. (2011) find little
evidence of financial integration of these markets with global markets. However, as Berger et al.
(2011) also note, the literature has largely ignored structural changes and time variations in the
integration of these markets with global markets by assuming time-invariant parameters in their
models, thus providing an incomplete assessment of global spillovers and the potential benefits of
these markets for temporal international diversification.
Most GCC countries impose restrictions on foreign ownership in their stock markets in order
to shield themselves from the adverse effects of regional and global shocks. Foreign ownership
restrictions, along with a number of other institutional issues, have therefore prevented most of the
GCC markets from being classified as emerging markets. However, MSCI has recently promoted two
4
markets, i.e. Qatar and UAE, from frontier to emerging market status, which has implications for
increasing international investments in these markets. Considering the fact that more GCC economies,
which are currently classified as frontier markets, are in the process of implementing structural
reforms that would pave the way towards achieving the emerging market status, it is expected that
there will be greater interest espoused by international investors towards these under-studied oil-rich,
developing stock markets.
Despite the seemingly segmented nature of the GCC stock markets from the global markets
and limitations to access by foreign investors, several factors in fact link their economies to the world
economy. Government revenues and corporate profitability in the GCC countries are influenced by oil
prices and exports which are largely driven by global economic growth factors1. Information may also
flow to these markets through international macroeconomic linkages which include cross-country
trade and customs relationships, foreign direct investments, interrelated portfolios and monetary and
fiscal policy arrangements (Mensi and Hammoudeh, 2013). The GCC economies are also interlinked
with the U.S. market as their exchange rates are pegged to the U.S. dollar, which requires
coordination with the U.S. monetary policy. Therefore, it can be argued that the information and
shocks relevant to changes in the U.S. and other international stock markets may affect the GCC stock
markets from multiple channels. On the other hand, it can also be argued that global fundamental
uncertainties driving returns in advanced stock markets (e.g. credit market problems, political
deadlocks and Eurozone issues, etc.) do not necessarily have the same effect on the GCC markets.
This is in part due to the relatively closed nature of these markets compared to other emerging
markets, as well as due to the nature of their exposure to petroleum prices and their enormous foreign
asset cushions.
Clearly, major regional and global shocks and extreme events can lead to structural breaks
and regime changes in stock market returns. In the case of the GCC countries, it can be argued that at
certain times (e.g. the 2007/2008 global financial crisis and its aftermath), the GCC and the global
stock markets behave in a more integrated pattern, which necessitates that the regime-switching
1Saudi Arabia is placed first in the global oil exporter ranking, while UAE and Kuwait are ranked in the 6th and 10th positions, respectively.
5
processes describing their returns be synchronized. In other times (e.g. the Dubai debt crisis or a
regional market shock like the Arab Spring), the GCC markets have moved independently from
international markets, calling for employing an unsynchronized regime-switching specification.
Therefore, despite the evidence in the literature that these markets are largely segmented from the
global markets, it is possible that they exhibit segmentation (or integration) with respect to global
markets in a regime-specific fashion, which warrants a regime-based diversification analysis that also
takes into account the time variations in the linkages across these markets and the differences among
the GCC equity sectors. Furthermore, the sectors themselves offer another dimension of
diversification as they cover different aspects of the macroeconomy such as energy, basic materials,
industrials, banking, investment, real estate, telecommunication and utilities. Indeed, in an application
to the Euro area stock markets, Moerman (2008) shows that industry-based diversification yields
more efficient portfolios than country-based diversification.
The main goal of this paper is to explore the diversification benefits of the cash- and oil-rich
stock markets in the GCC bloc by examining the risk exposures of GCC-wide equity sectors with
respect to regional and global factors. We are particularly interested in sector-based portfolios since
portfolio managers who follow a top down approach usually pick countries and then sectors, and not
just the aggregate market index. That is, international investors who seek more attractive risk-return
tradeoffs in their portfolios go beyond investing in aggregate equity market indices and explore
investment opportunities in sectors that best suit the state of the global economy and their investment
objectives. For example, at times when developed economies are teetering into recession (as
experienced during the 2007/2008 crisis), defensive emerging market sectors like non-cyclical
consumer goods can help provide more diversification benefits. Similarly, in a bull market state,
growth sectors in emerging markets can offer enhanced returns for investors in advanced markets.
In this study, we examine a wide range of defensive and growth equity sectors including
financials, basic materials, industrial goods and services, energy, telecom and utilities. As
Hammoudeh et al. (2009) note, sector investing in the GCC stock markets has not yet reached the
level of sophistication their developed counterparts have reached. Investing in the GCC sectors
became opportune after the GCC countries have recently reorganized and classified their sectors with

6
much greater detail than before.2 To that end, a regime-based analysis of the risk exposures of
alternative GCC equity sectors with respect to regional and global shocks can provide valuable insight
for both local and international investors into the potential diversification benefits of these developing
markets.
This paper contributes to the literature on return/volatility spillovers and international
diversification in several aspects. First, it develops a dynamic two-factor model of GCC-wide equity
sector returns with regional and global market shocks as risk factors. Baele and Inghelbrecht (2010)
show that the restricted single factor specification, which is generally utilized in the literature, leads to
incorrect inferences regarding financial integration. Second, it investigates the regional and global
market exposures of the GCC-wide equity sectors using regime-switching spillover models in which
the global, regional, and sectoral returns are allowed to have common synchronized and
unsynchronized (general) return processes. While there have been several studies that examine the
transmission of returns among individual GCC country sectors (Hammoudeh et al. 2009), how the
volatility spillovers occur among various sectors and across different market regimes is yet to be
explored. Third, unlike in most studies in the literature (e.g. Bekaert and Harvey, 1995; Ang and
Bekaert, 2002, 2004; Baele, 2005; Baele and Inghelbrecht, 2009, 2010), this paper does not make
prior assumptions on the number of market regimes describing the return processes, but instead it
determines the number of regimes by formal statistical testing. Furthermore, we allow all model
parameters to vary across different regimes. By doing so, we provide a more realistic representation
of the structural changes in risk exposures as revealed by the data. Finally, unlike most spillover
studies in the literature (e.g. Baele and Inghelbrecht, 2009, 2010), we supplement our analysis by
comparing the in- and out-of-sample performance of the portfolios based on the static and regime-
based models.
Our findings suggest that the risk exposures of the GCC equity sectors with respect to the
regional and global shocks display time-varying characteristics, with regime-specific spillover effects
observed for all equity sectors as well as for the GCC region at large. The regime specification tests
yield three market regimes characterized as low, high and extreme volatility market regimes.
2 The new sector classification follows the Thomson Reuters Business Classification System.

7
Although the GCC as a region is found to have a positive risk exposure to global shocks during the
low and high volatility regimes, we find that the regional risk exposure to global shocks turns
negative during the extreme volatility regime which proxies for the duration and the aftermath of the
global crisis in late 2008 and the negotiations around the second bailout package for Greece in late
2011. Similarly, the sectors/subsector including industrials, industrial and commercial services,
transportation, financials and real estate are found to have negative risk exposures with respect to
global shocks during the high and/or extreme volatility regimes. This finding suggests that some
GCC-wide equity sectors/subsectors can serve as safe havens for international investors during
periods of high or extreme volatility, depending on the particular sector to be utilized in the portfolio.
On the other hand, we find that the constant parameter GARCH and the alternative common state
Markov-switching (MS) models fail to capture the dynamic nature of the return and risk spillovers.
They also do not provide a complete assessment of the diversification potential of these markets.
These findings underscore the regime specific patterns in the integration of the GCC stock markets
with global markets. Finally, examining the performance of portfolios constructed using the
covariance matrices based on the alternative spillover models, we find that supplementing the world
portfolio with positions in the GCC-wide equity sectors leads to more efficient portfolios with much
improved risk-adjusted returns. This finding is consistent across the constant parameter and the
regime-based spillover models and supported by both the in- and out-of-sample tests.
The remainder of the paper is organized as follows. Section 2 reviews the literature on the
spillovers and international diversification, with a focus on emerging stock markets. Section 3
presents the methodology which specifies the alternative spillover models. Section 4 provides the
empirical findings for the global and regional spillover models. Section 5 examines the performance
of the optimal portfolios and the diversification benefits of the GCC markets within a regime- specific
framework. Finally, Section 6 concludes the paper.
2. Literature Review
The literature offers numerous studies on the integration of global stock markets with a focus
on international diversification. A number of studies have examined the diversification benefits of
8
emerging and frontier markets for investors in advanced markets (e.g. Chiou, 2008; Middleton et al.,
2008; Bekaert et al., 2009; You and Daigler, 2010, Berger et al., 2011, among others). On the other
hand, fewer studies including Lagoarde-Segot and Lucey (2007), Yu and Hassan (2008), Cheng et al.
(2010), Mansourfar et al. (2010), Arouri and Rault (2012) and Chau et al. (2014) have focused on the
stock markets in the Middle East and North Africa (MENA) region. These studies generally suggest
that MENA stock markets offer significant diversification potential for global investors. However,
this strand of the literature has mostly ignored structural breaks and time variations in the risk
exposures of developing stock markets with respect to the global and regional factors, and thus
provided an incomplete assessment of international diversification benefits of these markets.
On the other hand, a well-established literature exists on financial integration and return/risk
spillovers across stock markets due to its relevance to portfolio diversification. Numerous studies
including Bekaert and Harvey (1997), Ng (2000), Baele (2005), Bekaert and Harvey (2005),
Hardouvelis et al. (2006), and Baele and Inghelbrecht (2009, 2010) have looked into the effect of the
local and global risk factors on asset prices in different contexts. Focusing on the oil-rich GCC stock
markets, Hammoudeh and Choi (2006) find that the volatility of the GCC returns is largely explained
by domestic and GCC specific shocks rather than by global factors, implying potential international
diversification benefits of these markets. On the other hand, Malik and Hammoudeh (2007) document
significant volatility transmissions from the oil market to the stock markets in Saudi Arabia, Kuwait,
and Bahrain with a bidirectional spillover relationship only for Saudi Arabia and the oil market. More
recently, Balli et al. (2013) find that GCC-wide equity sectors are mostly driven by their own
volatilities and highlight the dominance of regional shocks over global shocks on the volatility of
returns in these markets. However, Khalifa et al. (2014) find evidence of regime-specific volatility
transmission patterns between the GCC and global markets, with stronger linkages observed with the
global equity markets than with the oil market. However, this paper focuses on the GCC national
stock indices and examines volatility transmissions only, and thus provides an incomplete assessment
of diversification potential of these markets.

9
Focusing on the portfolio diversification aspects, Yu and Hassan (2008) show that GCC
markets are largely segmented from international markets, while Cheng et al. (2010) observe that
these markets offer returns uncorrelated with global markets. Similarly, Mansourfar et al. (2010) find
that the oil-producing GCC countries provide greater international diversification benefits than the
non-oil producing MENA countries. More recently, Arouri and Rault (2012) argue that international
diversification benefits can be achieved by allocating part of the global portfolios to investments in
the oil-exporting countries. In contrast, our study first develops a two-factor model of returns with
regional and global shocks as risk factors and extends the analysis of return/risk spillovers to a
regime-based context in which market regimes are identified by formal statistical testing, rather than
by making prior assumptions on the regime structure. We then extend the spillover analysis to explore
the portfolio diversification benefits across the market regimes, given the regional and global
spillovers. The two-factor model allows us to examine the portfolio diversification benefits from the
perspective of both regional and international investors. Finally, the in- and out-of-sample
performance of the portfolios constructed based on the static and regime-based models are compared
across alternative portfolio strategies that include positions in the GCC-wide equity sectors.
3. Methodology
This section develops a two-factor MS spillover model for nine GCC-wide equity sector/sub-
sector indices from the six GCC countries. Numerous studies in the literature have utilized MS
models in several contexts including international stock market returns (e.g. Hamilton, 1988; Tyssedal
and Tjostheim, 1988; Schwert, 1989; Pagan and Schwert, 1990; Kim, et al., 1998; Kim and Nelson,
1998), volatility spillovers (e.g. Ang and Bekaert, 2002; Baele, 2005; Baele and Inghelbrecht, 2009,
2010), and GCC stock market dynamics (Hammoudeh and Choi, 2007; Balcilar and Genc, 2010;
Balcilar et al. 2013a, 2013b; Khalifa et al., 2014).
The MS model utilized in this study has several novelties as indicated earlier. First, unlike
Bekaert and Harvey (1995), Ng (2000), Baele (2005) and Baele and Inghelbrecht (2010), the model
allows for time-varying asset exposures and volatilities that can be driven by structural changes as
10
well as fluctuations in risk factors. Furthermore, it allows for all model parameters to vary across
different regimes, thus offering a more accurate representation of the return dynamics by
endogenously modeling the structural changes and the various market regimes. Second, unlike most
international diversification studies in the literature (e.g. Bekaert and Harvey, 1995; Ang and Bekaert,
2000, 2004; Baele, 2005), we utilize regime switching models with more than two regimes where the
number of regimes is identified by formal statistical testing rather than by making assumptions on
possible regime structure in the return processes. Third, the regime transitions are governed by a
latent switching variable, which may be sector-specific, associated with regional or global factors or
common to all of these factors. Fourth, the volatility of sectoral, regional and global returns is
decomposed into regime-specific, systematic and idiosyncratic components. In order to correctly
specify the risk spillovers and thus to disentangle the systematic and idiosyncratic components, we
allow the GCC-wide sectors to be exposed to both regional (i.e. GCC bloc-specific) and global
shocks. As Baele and Inghelbrecht (2010) note, the two-factor specification allows one to distinguish
between partial (global) and regional integration and also outperforms the single factor model in
modelling cross-market correlations. Additionally, the global shocks are allowed to drive GCC
regional returns. Therefore, the model accommodates partial integration at both the regional and
global levels and accommodates structural breaks and temporal variations in market linkages.
Similar to Baele and Inghelbrecht (2010), we decompose the excess return, , of GCC
sector index k for day t as follows
(1)
where , k = 1, 2, …, n, are the latent regime variables for sector k, following a three-
state Markov process.3 In this specification is the regime-dependent expected excess return
3 A battery of tests for the optimal number of regimes supports three regimes against the linear (one regime) and the two-regime alternatives. Several studies including Cakmakli et al. (2011), Guidolin and Timmermann (2006) and Maheu et al. (2009) also document that that the three-regime specification better describes stock return dynamics than models with fewer regimes.
Rk ,t
Rk ,t k ,Sk ,t ,t1 k ,Sk ,t
reg reg,t1 k ,Sk ,t
w w,t1 k ,Sk ,t
reg reg,t k ,Sk ,t
w w,t k ,t
Sk ,t{1,2,3}
k ,Sk ,t ,t1

11
for sector k at time t-1, while and are the t-1 conditional excess returns for the GCC
region and the world index, respectively. 4 The unexpected return is decomposed into three
components: the sector-specific idiosyncratic shock that is conditionally heteroscedastic and specified
as , ~ 0,,
as well as two additional components due to regional (GCC-specific) and global
market shocks represented by the random variables and , respectively. The conditional
exposures of the GCC sector returns with respect to the regional and global shocks are specified by
the regional and global beta terms, and , respectively. To that end, the process specified
for the GCC-wide sector returns in Equation (1) generalizes the two-factor spillover model of Ng
(2000), Bekaert et al. (2005) and Baele (2005). However, our specification also allows for regime-
specific risk exposures with respect to the regional and global shocks where the regime-switching is
stochastic and governed by a Markov process. By doing so, this specification easily lends itself as a
robust tool for examining diversification opportunities during different market regimes.
Analogously, the processes for the regional and global excess returns, and , are
specified as
(2)
(3)
where the regional and global shocks are specified as , ~ 0,,
, l = reg and w, with the regime
variables, , (l = reg and w), each taking values in {1,2,3} and following a three-state, first order
Markov process. Note that that the return processes describing the regional and global excess returns
are indexed by their own regime variables, providing a flexible framework regarding the
synchronization (or otherwise) of regimes across the different markets. The excess return process in
Equation (2) is a generalization of the one-factor volatility spillover model of Bekaert and Harvey
(1997). is the regime-dependent regional expected return at time t-1 that can be explained
4 and represent the conditional expected excess returns obtained from the respective MS models for
the GCC region and the world market, respectively.
reg,t1
w,t1
reg,t
w,t
k ,Sk ,t
reg k ,Sk ,t
w
Rreg,t
Rw,t
Rreg,t
reg,Sreg ,tt1
reg,Sreg ,t
w w,t1
reg,Sreg ,t
w w,t
reg,t
Rw,t w,Sw,t ,t1 w,t
reg,Sreg ,t ,t1
reg,t1
w,t1
12
by the region-specific information available at time t-1. Similarly, represents the regime-
dependent world expected return at time t-1. Finally, the parameter measures the conditional
exposure of the GCC region with respect to the global shocks and captures the extent to which the
global risk spillover is common to the GCC region at large. Note that the model allows the spillover
effects to vary with the particular state of both the global economy and the region as the global shocks
are time-varying and governed by the state variable . Similarly, the GCC region’s exposure with
respect to the global shocks is time-varying as the beta ( ) term is governed by the state
variable .
As stated earlier, one of the contributions of this study is to investigate the risk exposure of
the GCC-wide equity sectors with respect to the regional and global factors within a regime-switching
return and volatility spillover specification. This also allows one to make inferences regarding the
potential diversification benefits of the GCC equity sectors. For this purpose, we examine the
performance of dynamic portfolios based on alternative regional and global spillover specifications.
In particular, we examine three alternative spillover specifications: the constant coefficient GARCH,
the unsynchronized MS dynamic spillover, and synchronized MS dynamic spillover specifications.
3.1. Constant coefficient GARCH specification
As the benchmark model, we use a spillover specification based on a constant coefficient
GARCH model which is widely employed in the literature (Bekaert and Harvey, 1997; Ng, 2000;
Bekaert et al. 2005; Balli et al., 2013). Under this specification, we use a GARCH(1,1) model for the
conditional volatility and assume constant spillover coefficients, leading to the following model for
the excess return on the equity index l at time t
(4)
(5)
(6)
w,Sw ,t ,t1
reg,Sreg ,t
w
Sw,t
reg,Sreg ,t
w
Sreg,t
Rl ,t
l ,t1
lreg
reg,t1
lw
w,t1
lreg
reg,t
lw
w,t
l ,t
l ,t
t1~ iid(0,
l ,t2 )
l ,t2
l
l
l ,t12
l
l ,t12
13
where l=k, reg, w (k=1,2,…,n), denoting sector k, GCC region, and global markets, respectively.
is the conditional variance, and denotes the information set available at time t-1. In order to
account for the fat tails in the return distribution, we use a student t distribution for and estimate
its degrees of freedom. In this specification, we set when l=w and obtain
, , , where is the conditional mean of at time t-1. Similarly, for the return
process describing the GCC region (l=reg), we set and obtain
reg,t Rreg,t reg,t1 regw w,t1 reg
w w,t. However, it must be noted that the constant coefficient
GARCH(1,1) specification is used for comparison purposes only.
Since our primary focus is to examine the diversification potential of the GCC equity sectors,
the conditional returns are specified as AR(1) processes.5 Following the approach adopted in Bekaert
and Harvey (1997), Ng (2000), and Bekaert et al. (2005), we obtain the conditional variances and
covariances across the sectoral, regional, and global indices as well as the percentage of the
conditional variances explained by the regional and global exposures.
3.2. Unsynchronized general MS dynamic spillover specification
This specification is given in Equations (1)-(3) and allows for flexible regime-switching in
the sectoral, regional and global return processes. No particular structure is imposed on how the
regime of each market evolves. Baele (2005) utilizes a similar MS model for 13 European markets
with spillovers emanating from the United States and Europe. However, the specification in Baele
(2005) is limited in the sense that it assumes a single regime (linear) model for the aggregate U.S. and
European market shocks and only allows regime-switching in the sector-specific equations. On the
other hand, the model described in Equations (1)-(3) allows for multiple market regimes describing
the sectoral, regional as well as the global market return processes and thus provides a more realistic
approach.
5 Studies including Ng (2000), Baele (2005) and Balli et al. (2013) use the same specification. This specification captures the time evolution of the spillovers from the regional and the global market, but does not help explain the factors leading to them. Bekaert and Harvey (1995, 1997), De Santis and Gerard (1997), Bekaert et al. (2005) and Baele and Inghelbrecht (2009) use various regional and global factors to explain the implications of the partial integration driving spillovers.
l ,t2
t1
l ,t
lreg
lw
lreg
lw 0
w,,t1
Rw,t
lreg
lreg 0
14
The unsynchronized general specification does not assume a particular structure for the
regime processes, (k = 1, 2,…, n), and for the sector, regional and global markets,
respectively. This specification is general in the sense that each process may follow a completely
unsynchronized or a partially synchronized regime rather than a common state for all markets. By
doing so, the model accommodates partial integration of the GCC equity sectors with the GCC region
at large and the global market, and thus provides a more comprehensive framework. The level of the
market risk and the parameters describing the global and regional risk exposures follow unrelated
regime-switching processes, while the risk exposure intensities of the sectors vary according to the
current state of a particular sector. Thus, the random variables (l = k, reg and w, k = 1, 2, …, n,)
are defined as three-state, first order Markov chains.
The specification is then completed by defining the transition probabilities of the Markov
chains as pijl P(Sl ,t1 i | Sl ,t j) . Thus, for sector or market l is the probability of being in
regime i at time t+1 given that the sector/market was in regime at time t, where the regimes i and j
take values in {1,2,3}. Finally, the transition probabilities satisfy .
3.3. Synchronized MS dynamic spillover specification
As noted earlier, the GCC countries are linked through a political and economic union and
their economies are highly sensitive to oil exports. This makes these economies particularly sensitive
to the global economic growth trends that drive the demand for oil imports and oil prices globally.
Therefore, it can be argued that an alternative specification in which one assumes a common state for
the GCC equity sectors, the GCC region and the world market is also applicable. This specification
clearly assumes that the GCC markets are highly integrated with the global markets which may be the
case during a particular market state like the 2007/2008 global financial crisis period when financial
markets across the globe experienced simultaneous crashes and high volatility. This is represented in
the model as which posits that all GCC sectors, the GCC region, and the
world index follow a common, three-state regime process, . The transition probabilities of the
Sk ,t
Sreg,t
Sw,t
Sl ,t
j
pijl 1
i1
3
Sk ,t S
reg,t S
w,t S
t
St

15
common regime are then defined as pij P(St1 i | St j) with . In this case,
Equations (1)-(3) form a system of multivariate MS (MV-MS) model and are estimated
simultaneously.
3.4. Conditional covariances and variance ratios
In order to provide further insight into the risk exposures of the GCC equity sectors with
respect to regional and global shocks as well as their time variations, we decompose the total
volatility of each GCC-wide sector into three components: (1) a component due to global shocks, (2)
a component due to regional shocks, and (3) a sector-specific or idiosyncratic component. Following
Equations (1)-(3), we use the following equations in order to estimate the sector-specific, regional and
global components
(7)
(8)
(9)
where the term refers to the unexplained component of excess returns specified in Equations (1)-(3).
Calculation of the conditional variances and covariances based on Equations (7)-(9) requires the
estimation of predictive probabilities, , i.e. the probability of asset l being in
regime i at time t given the data through t-1. Defining the vector of predictive probabilities as
, i=1,2,3, and the matrix of transition probabilities of sector/market l as , i, j
= 1,2,3, we then obtain the predictive probabilities as pt|t1l Pl pt1|t1
l , where pt1|t1l is the vector of
probabilities of asset l at time t-1 given data through t-1, that is,
pt1|t1l [ pi,t1|t1
l ] [P(Sl ,t1 i | t1]. This last set of probabilities is termed as filtered probabilities
and can be calculated using
(10)
pij 1
i1
3
k ,t
k ,Sk ,t
reg reg,t
k ,Sk ,t
w w,t
k ,t
reg,t
reg,Sreg ,t
w w,t
reg,t
w,t
w,t
pi,t|t1l P(S
l ,t i |
t1)
pt|t1l [ p
i,t|t1l ] Pl [ p
ijl ]
pi,t|tl
pi,t|t1l f( i) (Rl ,t | t , )
pi,t|t1l f
( i)(R
l ,t|
t, )
i1
3
16
where is the likelihood function of of asset l being in regime i and is the
parameter vector.
A novelty of the MS spillover model utilized in this study is that it allows for the computation
of the time-varying conditional moments using the predictive probabilities. We specify an AR(1)
model in order to obtain the conditional means. Defining as the risk exposure parameters in
Equations (1)-(3) of asset l in regime i and as the vector of independent variables, the conditional
means are obtained as
l ,t E[ Rl ,t | t1] pi,t|t1l [i xt
l ], l w, reg,ki1
3
(11)
Once the conditional means are obtained, the sectoral, regional and global market shocks are then
estimated as , where (k=1,2,…,n). In this specification, the conditional
mean term is computed as the weighted average of conditional means in each market regime with
weights equal to the predictive probability of the respective regimes. Similarly, the conditional
variances of are given by
l ,t2 E[
l ,t2 |
t1] p
i,t|t1l
l ,i2
i1
3
, l w,reg,k (12)
In order to complete the estimation of the spillover model, we next obtain the variances and
the covariances of the unexplained component of excess returns defined in Equations (7)-(9). We
assume that the sectoral, regional, and global market shocks are uncorrelated. Bekaert et al. (2009)
show that a two-factor, time-varying coefficient spillover model with global and regional shocks is
sufficiently rich to eliminate most of the idiosyncratic shock correlations even when the equations are
estimated independently.6 Given the nine GCC-wide sectors and sub-sectors as well as the regional
and global market returns, the procedure requires the estimation of 55 time-varying covariances and
6 The synchronized common state model jointly estimates all equations along with the correlations among the idiosyncratic shocks.
f( i)
(Rl ,t
|t, ) R
l ,t
il
xtl
l ,t R
l ,t
l ,t l w,reg,k
l ,t

17
11 time-varying variances for the unexplained component of excess returns. They are estimated using
the following equations:7
(13)
hreg,t
E[reg,t2 |
t1] p
i,t|t1reg (
reg,iw )2
w,t2
reg,i2
i1
3
(14)
hk ,t E[
k ,t2 |
t1] p
i,t|t1k (
k ,iw )2
w,t2 (
k ,ireg )2
reg,t2
k ,i2
i1
3
(15)
hk ,w,t
E[k ,t
w,t|
t1] p
i,t|t1k p
s,t|t1w
k ,iw
s,i2
s1
3
i1
3
(16)
hreg,w,t
E[reg,t
w,t|
t1] p
i,t|t1reg p
s,t|t1w
reg,iw
s,i2
s1
3
i1
3
(17)
hk ,reg,t
E[k ,t
reg,t|
t1] p
i,t|t1k p
s,t|t1reg
k ,iw
reg,sw
w,t2
k ,ireg
reg,t2
s1
3
i1
3
(18)
(19)
Given the variances and covariances in Equations (13)-(19), we obtain the time-varying
correlations of each GCC sector with regional as well as global shocks. The GCC region’s
correlations with the world index are also directly obtained from Equations (13)-(19). In short,
Equations (11)-(19) yield time-varying, but regime-independent moments and allow us to examine
alternative portfolio strategies without having to assume a particular market regime. This procedure
enables a more realistic approach to portfolio analysis as it is not possible to know, in practice, what
particular regime the market is in at any given point in time.
The variance ratios are then calculated as the percentage of the conditional variances of the
unexpected sector returns explained by the conditional variances of the regional and the global
unexpected returns
VRk ,tw
pi,t|t1k (
k ,iw )2
w,t2
i1
3h
k ,t
100 (20)
7 The common state model with synchronized regimes is a special case of the general case and Equations (13)-(19) still apply with simplifications.
hw,t E[
w,t2 |
t1] p
i,t|t1w
w,i2
i1
3
hk , j ,t
E[k ,t
j ,t|
t1] p
i,t|t1k p
s,t|t1j
k ,iw
j ,sw
w,t2
k ,ireg
j ,sreg
reg,t2
s1
3
i1
3
18
VRk ,treg
pi,t|t1k (
k ,ireg )2
reg,t2
i1
3h
k ,t
100 (21)
VRk ,tk
pi,t|t1k
k ,i2
i1
3h
k ,t
100 (22)
where VRk ,tw , VR
k ,treg , and VR
k ,tk are the percentage of conditional variances explained by the global,
regional and sector specific shocks, respectively.
3.5. Estimation method
For the benchmark GARCH and the general unsynchronized regime MS models, we adopt the
three-step estimation procedure of Bekaert and Harvey (1997) and Ng (2000).8 Given the recursive
structure of the global, regional and sector specific shocks in Equations (7)-(9) for the MS models, the
three-step approach does not possess a simultaneous equation bias.9 As described earlier, the model
structure is sufficiently rich to eliminate the cross correlations across the idiosyncratic shocks in
Equations (7)-(9). In the three-step estimation procedure, the first equation, i.e. Equation (3) (or
Equation (4) for the GARCH specification with relevant restrictions), is estimated and the global
market shocks are obtained. In the second step, the global shock from the first step is related to the
GCC regional shocks using Equation (8) for the MS spillover model and using Equation (4) for the
GARCH spillover model, given the relevant restriction.10 The third step of the estimation procedure
relates the global and regional market shocks to the GCC-wide sectors in Equation (7) for the general
MS spillover model and similarly in Equation (4) for the GARCH spillover model. This three-step
estimation procedure yields consistent, but not necessarily efficient, parameter estimates since we do
not correct for the likely estimation errors from the first and second steps.
The common state synchronized dynamic MS model is indeed a multivariate MS model and
is estimated as a system. We consider a general multivariate distribution for the idiosyncratic shocks
in Equations (7)-(9), although it yields almost the same results with a diagonal specification. This
8 This estimation approach is also used in Baele (2005), Baele and Inghelbrecht (2009, 2010), and Balli et al. (2013). 9 An analogous recursive structure is imposed on the GARCH spillover models with the assumptions we make. See the conditions stated below Equations (4)-(6). 10 Ng (2000) orthogonalizes the global and regional shocks and does not relate the global shocks to regional shocks as in Equation (8). Our specification sufficiently removes the correlation between the global and regional shocks, and the resulting orthogonalized shock essentially yields the same estimates. We prefer the specification in Equation (8) since it allows us to estimate the spillover of the global shocks to the GCC region at large.
19
finding indicates that the assumption of uncorrelated shocks for the general univariate MS and the
GARCH spillover models is indeed supported by the data given the model structure. We estimate the
parameters of the general and the common state MS spillover models, given that the number of
regimes is known, using the maximum likelihood estimation. The likelihood is evaluated using the
filtering procedure of Hamilton (1990) followed by the smoothing algorithm of Kim (1994). The log-
likelihoods of the MS models are functions of the parameters and the transition probabilities . The
estimates are obtained by maximizing the log-likelihood subject to the constraint that the probabilities
lie between 0 and 1 and sum to unity. The conditional moments of the MS spillover models in
Equations (13)-(19) as well as the conditional variance ratios in Equations (20)-(22) are estimated
using the predictive probabilities that are obtained from the transition probabilities and the filtered
probabilities of the Hamilton filter. The number of regimes in both models is selected using the
likelihood ratio (LR) tests with the upper bound for the p-values obtained according to Davies (1987).
We also supplement the LR tests with AIC.
The parameters of the univariate GARCH spillover model are estimated using the quasi
maximum likelihood procedure. A final choice in the estimation of the models is the distribution of
the idiosyncratic shocks. The normality tests reject the normal distribution for all excess returns, and
therefore we estimate the GARCH, the general MS, and the common-state MS models using the
student t distribution. Thus, the idiosyncratic shocks are distributed as l ,t ~ t(vSl ,t) where vSl ,t
(
l w, reg,k ) is the degrees of freedom of the student t distribution. We allow the degrees of freedom
of the student t distribution to switch with regimes, leading the tails of the distribution to vary across
regimes.
4. Empirical Results
4.1. Data
The empirical analysis includes a total of nine GCC-wide equity sector/subsector indices
spread over the six GCC countries, namely Bahrain, Kuwait, Oman, Qatar, United Arab Emirates
(UAE), and Saudi Arabia, obtained from Datastream. Since the GCC markets follow different trading
pij
20
days and observe dissimilar weekends from the Western markets (i.e. Fridays are part of the weekend
in the GCC countries and their markets are closed on those days), we utilize daily data for three-
trading days a week (Monday-Wednesday) when the GCC and the global markets are commonly
open. This frequency avoids the weekend effects in both sets of markets. The sample period includes
1/1/2006-11/25/2013 with 1,237 observations. The sample period is dictated by the availability of
data for the GCC equity sectors which have been recently re-classified.
The new sector classifications are based on the Thomson Reuters Business Classification
System (TRBC). As of November 2013, TRBC provides a five-level hierarchical classification
starting with ten top level sectors. Due to the limitations on the availability of sector level data for the
GCC countries, we only include the five top sectors, i.e. energy, basic materials, industrials,
financials, and utilities, in our analysis. Additionally, we include the industrial and commercial
services, and transportation sub-sectors for the industrials sector; and the banking and investment
services, and real estate sub-sectors for the financials sector.
In order to capture the effect of the regional shocks, we use the MSCI GCC index which
covers the large and mid-capitalization firms across the six GCC countries.11 The world market is
represented by the STOXX Global 1800 index which includes the developed markets only, having a
total fixed number of 1,800 constituent firms.12 This index excludes the GCC markets and is an
appropriate representation of the global investor who is currently not invested in any of the GCC
markets and is looking for diversification opportunities by allocating part of the global portfolio to
GCC stocks. Taking the perspective of a developed market investor, we use the 3-month U.S.
Treasury bill rate in order to calculate excess returns.
Table 1 provides the descriptive statistics of the logarithmic returns for the return series
examined. We observe negative mean returns for the return series in general, most likely as a result of
the 2007/2008 global financial crisis. The GCC stock returns are generally less volatile compared to
stocks in developed markets, possibly due to the institutional restrictions imposed on these markets to
protect them from the negative effects from abroad. On the other hand, most of the returns are found
11 MSCI GCC index covers about 85% of the free float-adjusted market capitalization in each GCC country. 12 The STOXX Global 1800 index includes stocks of 600 European, 600 American and 600 Asia/Pacific region firms.
21
to exhibit negative skewness which suggests a greater likelihood of experiencing losses than gains in
a given time period. The only exception is the energy sector which exhibits positive skewness
possibly due to this sector’s high correlation with global oil prices. Similarly, the return distributions
have kurtosis values higher than the normal distribution, implying the presence of extreme
movements in either direction, thus supporting the use of the t- distribution in the estimation process.
4.2. Estimation results
4.2.1. Estimation procedure and model identification
The GARCH spillover model and the conditional mean and variance models in Equations (4)-
(6) are jointly estimated by the QML method. Given the non-normality and the fat tails implied by the
descriptive statistics reported in Table 1, all GARCH spillover models are estimated with a student t
error distribution with the degrees of freedom of the t-distribution also estimated as an additional
parameter.
As noted earlier, a novelty of this study is that we determine the number of market regimes by
employing formal statistical tests, rather than making prior assumptions on the regime structure. The
empirical evidence obtained in Cakmakli et al. (2011), Guidolin and Timmermann (2006) and Maheu
et al. (2009) suggests that more than two regimes might be required to adequately capture the
dynamics of returns in stock markets. In the case of the GCC stock returns, Balcilar et al. (2013a,
2013b) show that the three-regime MS model best captures the return dynamics in these markets. In
our case, a battery of tests comparing linear, 2-regime MS and 3-regime MS models strongly rejects
alternative specifications in favor of the 3-regime heteroscedastic MS model, MSH(3). The selection
of the MSH(3) specification is consistently supported by the tests based on the likelihood ratio (LR)
statistic and the Akaike Information Criterion (AIC). The test results are not reported to save space,
but are available upon request. The three-regime specification is in contrast to Baele and Inghelbrecht
(2010) who argue that the third regime exhibits spike-like behavior implying short-lived events.
However, as will be discussed later, the third regime in our case proxies periods of extreme
fundamental uncertainty including the 2007/2008 crisis period as well as the Greek bailout
discussions in the Eurozone area. Furthermore, the findings indicate significantly different spillover
effects during the third regime with important diversification implications.
22
4.2.2. Global and regional spillover analysis
The estimates for the constant parameter GARCH spillover model (the benchmark model)
which are not reported here yield significant and positive estimates for both risk exposures and
across all GCC sectors/subsectors, indicating positive risk spillovers from the global and regional
shocks into these sectors in these benchmark models. The finding of a positive risk exposure with
respect to the regional and global risk factors is consistent with international asset pricing models and
suggests that these risk factors carry a positive price of risk in the GCC equity sectors/subsectors. It
also implies that the GCC-wide sectors are driven by the same fundamental uncertainties that also
drive the regional and global market returns. The largest spillover effect from both the regional and
global shocks is observed for the Real Estate sector/subsectors. This finding points to the high
integration of the real estate sector which is open to investors from the GCC countries, particularly
Dubai in UAE which also allows investments from non GCC citizens. The lowest regional spillover
effect is observed for the banking sector which is highly regulated and supervised within the national
borders due to its importance to the national economy and government. Most GCC countries have a
few banks and do not allow foreign banks to have offices in their countries. Similarly, the energy
sector is found to have the lowest exposure to global shocks, possibly due to the periodic regulatory
effect of OPEC and this sector is also considered ‘sovereign” by the GCC governments. Nevertheless,
both the global and regional spillover effects are found to be positive according to the constant
parameter (benchmark) model which does not take into account time-variations and possible regime-
specific patterns in the model parameters.
On the other hand, taking into account the effect of market regimes yields different results,
showing insignificant and sometimes significant and negative spillover coefficients, particularly
during periods of market stress (regimes 2 and 3). Table 2 presents the estimates for the general MS
spillover model which considers the low, high and extreme volatility market regimes. Examining the
regime-based parameter estimates in this model, we conclude that the positive spillover effects for the
benchmark GARCH model, where the spillover parameters are consistently found to be positive and
significant, represent in fact the effects of the regional and global shocks during the low volatility
23
regime. On the other hand, we observe in Table 2 that the GCC-wide equity sectors exhibit
heterogeneous risk exposures with respect to the regional and global shocks based on the prevailing
market regime. For example, although the GCC as a region is found to have a positive risk exposure
to the global shocks during the low and high volatility regimes, we see that the regional risk exposure
to global shocks turns negative during the extreme volatility regime, with an estimated value of -
0.4586 for l ,3
w . Examining the smoothed probability plots for the Global STOXX index’s returns in
Figure 1d, it is clear that the extreme volatility regime (regime 3) proxies for the duration and the
aftermath of the global crisis in late 2008 and the negotiations around the second bailout package for
Greece in late 2011. Clearly, this is a period of significant market uncertainty for global investors as
indicated by a standard deviation estimate of 2.5904% for world returns in regime 3 compared to
0.4623% in regime 1 and 0.9264% in regime 2. The negative risk exposure of the GCC region with
respect to the global market shocks in this regime then implies that the GCC stock markets could
serve as a safe haven for investors in advanced markets during the extreme volatility regime, which is
highly persistent with an average duration of 70.13 days. This finding is further supported by the
smoothed probability plots for the GCC indexes presented in Figures 2-12. The smoothed
probabilities for the GCC region as well as GCC-wide sectors suggest that the extreme volatility
periods for the world market largely falls into the low volatility regime (Regime 1) for the GCC stock
indexes. It also highlights the advantage of the general MS spillover model that allows us to capture
the distinct market regimes for global and local returns as each return process is designed to follow its
own regime process. As Figures 2-12 indicate, there are periods where all markets share the same
regime as well as periods where some markets are governed by different regime dynamics.
Similarly, industrials, industrial and commercial services, transportation, financials and real
estate are found to have negative risk exposures with respect to the global shocks during the high
volatility regime, whereas the same applies to the energy sector during the extreme volatility regime
only. Comparing the risk exposure values across sectors, we observe that real estate as well as
industrial and commercials services have the largest negative exposures to the global market shocks,
suggesting that these particular GCC sectors have the best potential as a safe haven for international
24
investors during periods of global market stress. Similarly, the finding of a negative risk exposure of
the Energy sector with respect to both the regional and global shocks in Table 2 suggests that this
GCC sector can serve as a safe haven for both GCC and global investors during crises or severe
geopolitical tension. On the other hand, from the perspective of the local investors in the GCC
markets, the finding of negative risk exposures of the energy, industrial and commercial services,
banks and real estate to the regional shocks during the high and extreme volatility regimes suggests
that these GCC sectors can also be used as safe havens in local GCC portfolios and help offset
portfolio losses during periods of high and extreme volatility.
Overall, the general MS spillover model captures useful information that can be used for
international and local diversification purposes which cannot be captured by the constant parameter
(benchmark) model. The benchmark model clearly packages the results, thus hiding and
compromising detailed information about the risk exposures of the sectors/subsectors across the
regimes. A similar argument can also be made for the common state multivariate MS (MV-MS)
spillover model which, similar to the constant parameter GARCH model, yields positive risk
exposure of the GCC region at large with respect to global shocks.13 However, several GCC sectors
including energy, industrials, financials and utilities are found to have negative risk exposures to the
global shocks during the extreme volatility regime under the common regime specification, providing
further support to the findings in Table 2. Nevertheless, we conclude that the assumption of a
common regime for the sectoral, regional and global markets in a way overlooks the differences
across the GCC sectors and the possible segmentation of these markets from the global markets. It
thus fails to appropriately capture the risk exposures of the GCC sectors with respect to the market
shocks.
In order to gain further insight into the extent of the global and regional spillovers, we next
compute the variance ratios defined in Equations (20)-(22) and compare the spillover effects implied
by the three alternative models. These are easily modified for the GARCH spillover (benchmark)
model. However, since the two MS spillover models have three regimes with each regime
13 The results for the MV-MS model are available upon request.
25
characterized by different volatility dynamics, similar to the various moments in Equations (11)-(19),
the variance ratios in Equations (20)-(22) are computed conditionally based on the predictive
probabilities. This formulation allows one to obtain regime independent variance ratio measures.
Table 3 presents the summary statistics for the estimated variance ratios due to the global (VRk ,tw ),
regional (VRk ,treg ), and idiosyncratic shocks (VRk ,t
k ). We observe that more than 90% of the return
variance for the GCC region is due to the regional shocks, with the global shocks accounting for only
2.501%, 7.863% and 4.055% of the variance of GCC returns based on the GARCH, MS and MV-MS
models, respectively. This finding is consistent with Hammoudeh and Choi (2006) and suggests that
the volatility of the GCC returns is largely explained by domestic shocks rather than by global factors.
It also reiterates the relative segmentation of these markets from global markets and further supports
that these markets can be potential diversifiers for global investors. On the other hand, the dominance
of regional shocks over global shocks means that local GCC investors will need to supplement
domestic portfolios by foreign assets in order to reduce portfolio risks.
Figure 13 presents the plots of variance ratio estimates based on the general MS spillover
model obtained from Equations (20)-(22).14 Among the three classes of models, the general MS
spillover model suggests the largest global spillover effects for the GCC region with global shocks
accounting for a larger percentage of sectoral and regional returns compared to the GARCH and MV-
MS models. Furthermore, the time series plots of VRreg,tw and VRreg,t
reg for the general MS spillover
model presented in Figure 13(a) suggest significant time variation in the global spillover values with
the global shocks accounting account for 10% to 40% of the return volatility in the GCC region
during the 2008-2010 period. The variance ratio for VRreg,tw reaches values above 40% at the end of
2011 and early 2012, implying that the global shocks accounted for more than 40% of the regional
return variation during this recent period.
In the case of the GCC-wide sectors shown in Figures 13 (b)-(j), we observe that among the
three models we consider, the general MS spillover model implies greater time variations for the
14 The variance ratio plots for the other spillover models are not included in the paper for brevity and are available upon request.
26
global and regional spillovers to the GCC-wide sectors. The global shock variance ratios are found to
vary between 1.179% (energy) and 5.573% (industrial and commercial services), whereas the
variance ratios for regional shocks vary between 5.905% (basic materials) and 16.036% (financials).
We also observe that the regional shock variance ratios based on the general MS model are higher
before 2010, varying between 10% and 60% for all GCC wide sectors. Not surprisingly, the variance
ratios due to global shocks are found to exceed 20% during 2009-2010 and the second half of 2011
for all GCC-wide sectors. On the other hand, the regional variance ratios generally decrease over time
for all sectors, suggesting increasing importance of the global shocks and perhaps greater integration
of these markets with global markets over time. Significant spillover effects of the global shocks are
observed on financials, industrials and related sub-sectors; with energy, transportation and utilities
relatively less affected by global market shocks probably because of heavy government subsidies.
Prices of goods and services in the oil-related sectors in the GCC countries are considerably below
world prices because of those subsidies. The relatively segmented nature of the subsidized energy
related sectors can be utilized by global investors in their diversification strategies. The higher
variance ratios for the finance-related (sub) sectors are consistent with Arouri and Rault (2012) who
suggest a significant link between the financial services in the GCC and the Western financial centers.
5. Diversification benefits of GCC-wide equity sectors
Having presented evidence on the risk exposures of GCC-wide equity sectors with respect to
regional and global shocks, we next divert our attention on the potential diversification benefits of
these sectors for investors. For this purpose, we compare the risk/return tradeoffs offered by
alternative portfolios implied by each spillover model and examine the in- and out-of-sample
performance of these portfolios.
From the perspective of a global investor, we use the developed equity market index
represented by the STOXX 1800 index as the benchmark portfolio in order to assess the relative
diversification benefits. This benchmark portfolio represents the undiversified investor who is
currently not invested in the GCC stock markets. We then create portfolios augmented with the seven
GCC-wide equity sectors described earlier. As noted earlier, we exclude the broad industrial and

27
financial top sectors as their sub-sectors are already included in the portfolio considerations. The in-
sample portfolios are constructed by first estimating each model over the sample period 1/1/2006-
8/14/2012 and computing the in-sample covariance matrix (t ) of the eight sector return series from
the moments obtained using Equations (13)-(19). The in-sample analysis contains 1,036 portfolio
points for the period 1/1/2006-8/14/2012. On the other hand, the out-of-sample portfolios are
constructed following a recursive procedure. We first estimate each model using data over the period
1/1/2006-8/14/2012 and obtain the predicted covariance matrix T 1for 8/15/2012. The first out-of-
sample portfolio is then constructed for 8/15/2012. We then adjust the portfolio holdings on a daily
basis and update the sample period by adding the next observation and updating the predicted
covariance matrix for the next day. Continuing recursively in this fashion, we obtain 200 out-of-
sample portfolio points over the period 8/15/2012-11/25/2013. Excess returns are then calculated
using the three-month U.S. Treasury bill rate.
Performance comparisons are made across five alternative portfolios given the estimates of
the covariance matrixt . We restrict the portfolio weights to sum to 1 and do not allow short-selling.
Portfolio 1: Undiversified global investor represented by STOXX 1800 with its historical return and
risk obtained from the respective model.
Portfolio 2: Diversified minimum-variance portfolio, i.e. the world portfolio augmented with the
GCC-wide equity sectors, with the historical return and risk obtained from the respective
models.
Portfolio 3: Diversified minimum-variance portfolio with the same return as the STOXX 1800
index.15
Portfolio 4: Diversified minimum-variance portfolio with the same risk as the STOXX 1800 index. 16
Portfolio 5: Diversified tangency portfolio with the maximum Sharpe ratio.
15 If the STOXX 1800 return is outside the range of returns for efficient portfolios, we replace it with the minimum or maximum efficient portfolio return, depending upon whether the STOXX 1800 return is below or above the range of efficient portfolio returns. 16 If the STOXX 1800 risk is outside the range of risk values for efficient portfolios, we replace it with the minimum or maximum efficient portfolio risk, depending on whether the STOXX 1800 risk
is below or above
the range of efficient portfolio risks
28
Table 4 reports the summary statistics of the daily returns for the dynamic in-sample portfolios
constructed using the covariance matrices obtained from the GARCH, MS, and MV-MS alternative
spillover models. As expected, the diversified minimum-variance portfolio augmented with the GCC-
wide equity sectors (Portfolio 2) yields the lowest level of risk, consistently across the three
alternative spillover models. Similarly, the undiversified global investor who does not hold any
positions in GCC stock markets (Portfolio 1) sustains the greatest level of portfolio risk in all
alternative model specifications. Not surprisingly, the diversified tangency portfolio (Portfolio 5)
offers the best risk/return tradeoff indicated by the greatest Sharpe ratio values. In general, all
augmented portfolios with the exception of Portfolio 2 yield better Sharpe ratios, compared to the
undiversified portfolio (Portfolio 1), suggesting that supplementing the global portfolio with positions
in the GCC equity sectors yields more efficient portfolios. On another note, comparing the results
across the three alternative spillover models, we observe that the dynamic portfolios constructed using
the covariance matrices obtained from the general MS model yield better risk-adjusted returns. Note
that the general MS model allows the sectoral, regional and global market returns to follow their
independent regimes and provides the flexibility for the regime-switching to be synchronized or vice
versa. The comparison of portfolio performances across the alternative models in Table 4 clearly
suggests that restricting the regimes of the GCC-wide equity sectors, the GCC-region, and the world
is suboptimal, leading to lower risk-adjusted returns.
The summary statistics for the dynamic out-of-sample portfolios reported in Table 5 further
support our findings for the in-sample findings in Table 4. Consistently across all three spillover
models, we observe that the portfolios supplemented with positions in the GCC-wide equity sectors
yield significantly more efficient portfolios, compared to the undiversified global investor portfolio
(Portfolio 1). The highest Sharpe ratio is once again observed for the diversified tangency portfolio
(Portfolio 5). We also find that the undiversified global investor experiences the greatest return
volatility, while the inclusion of GCC sector positions reduces the portfolio risk in all cases. Once
again, we observe that the dynamic portfolios constructed using the covariance matrices obtained
from the general MS spillover model dominate the portfolios based on the GARCH and MV-MS
models in terms of risk-adjusted returns.
29
Figure 14 presents the portfolio weights in the tangency portfolio based on the general MS
spillover model. We observe that the GCC-wide equity sector allocation in the best performing
portfolio (Portfolio 5) exceeds 60 percent for prolonged periods, thus underscoring the potential
diversification benefits of the GCC sectors. Furthermore, the GCC-wide sectors including utilities,
energy, banks, and basic materials are allocated higher weights, implying the significance of these
particular GCC sectors in global diversification strategies. Overall, both in- and out-of-sample results
support earlier findings on the spillover effects with respect to global shocks and suggest that GCC-
wide equity sectors can offer significant diversification benefits for global investors, regardless of the
model specifying the spillover effects. While our findings suggest enhanced risk/return tradeoffs and
potential safe haven benefits of the developing GCC markets for global investors, as Balli et al.
(2014) note, investors in mature economies have been slow to diversify their portfolios
internationally, suggesting a home bias in these markets. Our findings therefore provide compelling
evidence that emerging market stock markets can still provide international diversification benefits
despite the globalization of capital markets and underscore the importance of financial reforms that
will make these markets more easily accessible to investors in developed markets.
6. Conclusion
This paper extends the literature on international financial integration and portfolio
diversification by developing dynamic two-factor models of GCC-wide equity sector returns, with the
regional and global market shocks as the risk factors. In the first part of the analysis, we examine the
regional and global market exposures of the GCC-wide equity sectors using three alternative spillover
models: (i) the constant parameter GARCH model; (ii) the unsynchronized (general) regime-
switching model (MS); and (iii) the common synchronized regime-switching model (MV-MS). We
also compare the inferences from these alternative spillover models regarding regimes, risk exposures
and portfolio diversification. In contrast to most spillover studies in the literature, we determine the
market regimes by formal statistical testing rather than making assumptions on the possible regime
structure. We find that the three-regime specification best describes the returns, in which the third
regime proxies periods of extreme uncertainty. Finally, we supplement our analysis by adding a

30
comparison of the in- and out-of-sample performance of the five alternative portfolio strategies based
on the static and regime-based models.
Our findings suggest that the risk exposure of the GCC-wide equity sectors with respect to the
regional and global shocks display time-varying characteristics with regime-specific spillover effects
observed for all equity sectors as well as for the GCC region at large. The regime specification tests
identify three market regimes characterized as low, high and extreme volatility market regimes.
Although the GCC as a region is found to have a positive risk exposure to the global shocks during
the low and high volatility regimes, we find that the regional risk exposure to global shocks turns
negative during the extreme volatility regime which was the case during and aftermath of the global
crisis in late 2008 and around the second bailout package announcement for Greece in late 2011.
Similarly, the GCC-wide industrials, industrial and commercial services, transportation,
financials and real estate sectors/subsector are found to have negative risk exposures with respect to
the global shocks during the high volatility regime and the energy sector during the extreme volatility
regime. This finding suggests that the GCC-wide sectors can serve as a safe haven for international
investors during periods of market stress, depending on the particular sector to be utilized in the
portfolio. On the other hand, we find that the constant parameter GARCH and the common state MS
models (MV-MS) fail to capture the dynamic nature of return and risk spillovers, thus they fail to
provide a complete assessment of the international diversification potential of these markets. This is
further supported by the in- and out-of-sample portfolio tests which imply inferior risk-adjusted
returns for portfolios based on these two models compared to the unsynchronized MS model.
Finally, examining the performance of portfolios constructed using the covariance matrices
based on the alternative spillover models suggests that supplementing the world portfolio with
positions in the GCC-wide equity sectors/subsectors lead to more efficient portfolios with much
improved risk-adjusted returns. This finding is consistent across the alternative spillover models and
is also supported by both the in- and out-of-sample tests. Finally, we observe that the GCC-wide
sectors including utilities, energy, banks and basic materials carry greater weights in the most efficient
global portfolio, suggesting that global investors should well explore these particular sectors in their

31
international diversification strategies. However, some of these sectors may be considered
“sovereign” by the GCC governments, and thus may not be open to foreign investors.
In conclusion, the findings clearly suggest that taking into account the regime-specific and the
time-varying nature of the return and risk spillovers across the GCC stock markets provide valuable
insight to the diversification benefits offered by developing markets, particularly during periods of
market stress. By doing so, our dynamic models are able to successfully capture the significant
diversification potential offered by the cash- and oil- rich GCC stock markets, an assessment that
would not be possible to capture by time-invariant single regime as well as the common two-regime
spillover models. The much improved risk-adjusted performance of the world portfolio augmented
with positions in the GCC-wide sectors clearly supports the findings from the general dynamic
spillover analysis in that the partial segmentation of these markets can indeed be utilized to achieve
significant international diversification benefits.
32
References
Ang, A., Bekaert, G., 2002. International asset allocation with regime shifts. Review of Financial
Studies 15 (4), 1137–1187.
Ang, A., Bekaert, G., 2004. How regimes affect asset allocation. Financial Analysts Journal 60, 86-
99.
Arouri, M. E. H., Rault, C., 2012. Oil prices and stock markets in GCC countries: empirical evidence
from panel analysis. International Journal of Finance & Economics 17 (3), 242-253.
Baele, L., 2005. Volatility spillover effects in European equity markets. Journal of Financial and
Quantitative Analysis 40 (2), 373–402.
Baele, L., Inghelbrecht, K., 2009. Time-varying integration and international diversification
strategies. Journal of Empirical Finance 16 (3), 368–387.
Baele, L., Inghelbrecht, K., 2010. Time-varying integration, interdependence and contagion. Journal
of International Money and Finance 29, 791-818.
Balcilar, M., Genc, I., 2010. The links between crude oil prices and GCC stock markets: The time
varying Granger causality tests. EMU Economic Research Center Working Paper, No: 2010-001.
Balcilar, M., Demirer, R., Hammoudeh, S., 2013a. Investor herds and regime-switching: Evidence
from Gulf Arab stock markets. Journal of International Financial Markets, Institutions & Money
23, 295-321.
Balcilar, M., Demirer, R., Hammoudeh, S.M., Khalifa, A.A., 2013b. Do Global Shocks Drive Investor
Herds in Oil-Rich Frontier Markets? Working paper, Department of Economics, Eastern
Mediterranean University. (January 10, 2013).
Balli, F., Basher, S. A., Louis, R.J., 2013. Sectoral equity returns and portfolio diversification
opportunities across the GCC region. Journal of International Financial Markets, Institutions &
Money 25, 33– 48.
Balli, F., Basher, S.A., Rana, F., 2014. The determinants of the volatility of returns on cross-border
asset holdings. Journal of International Money and Finance 44, 1–23.
Bekaert, G., Harvey, C.R., 1995. Time-varying world integration. Journal of Finance 50, 403–444.
Bekaert, G., Harvey, C.R., 1997. Emerging equity market volatility. Journal of Financial Economics
43, 29–77.
Bekaert, G., Harvey, C.R., Ng, A., 2005. Market integration and contagion. Journal of Business 78
(1), 39–69.
Bekaert, G., Hodrick, R.J., Zhang, X., 2009. International stock return comovements. Journal of
Finance 64 (6), 2591–2626.
Berger, D., Pukthuanthong, K., Yang, J. J., 2011. International diversification with frontier markets.
Journal of Financial Economics 101, 227–242.
33
Cakmakli, C., R. Paap, R., van Dijk, D., 2011. Modeling and estimation of synchronization in
multistate Markov-switching models. Tinbergen Institute Discussion Paper no. 2011–002/4.
Chau, F., Deesomsaka, R., Wang, J., 2014. Political uncertainty and stock market volatility in the
Middle East and North African (MENA) countries. Journal of International Financial Markets,
Institutions & Money 28, 1– 19.
Cheng, A., Jahan-Parvar, M. R., Rothman, P., 2010. An empirical investigation of stock market
behavior in the Middle East and North Africa. Journal of Empirical Finance 17, 413–427.
Chiou, W. P., 2008. Who benefits more from international diversification? Journal of International
Financial Markets, Institutions & Money 18, 466–482.
Davies, R. B., 1987. Hypothesis testing when a nuisance parameter is present only under the
alternative. Biometrika 74, 33-43.
De Santis, G., Gerard, B., 1997. International asset pricing and portfolio diversification with time-
varying risk. Journal of Finance 52 (5), 1881-1912.
Guidolin, M., Timmermann, A., 2006. An econometric model of nonlinear dynamics in the joint
distribution of stock and bond returns. Journal of Applied Econometrics 21, 1–22.
Hamilton, J. D., 1988. Rational-expectations econometric analysis of changes in regime: an
investigation of the term structure of interest rates. Journal of Economic Dynamics and Control 12,
385-423.
Hamilton, J. D. 1990. Analysis of time series subject to changes in regime. Journal of Econometrics 4,
39–70.
Hammoudeh, S., Choi, K., 2006. Behavior of GCC stock markets and impacts of US oil and financial
markets. Research in International Business and Finance 20 (1), 22-44.
Hammoudeh, S., Choi, K., 2007. Characteristics of permanent and transitory returns in oil-sensitive
emerging stock markets: The case of GCC countries. Journal of International Financial Markets,
Institutions & Money 17 (2), 231–245.
Hammoudeh, S., Yuan, Y., McAleer, M., 2009. Shock and volatility spillovers among equity sectors
of the Gulf Arab stock markets. Quarterly Review of Economics and Finance 49 (2), 829-842.
Hardouvelis, G., Malliaropulos, D., Priestley, R., 2006. EMU and European stock market integration.
Journal of Business 79, 365–392.
Khalifa, A., Hammoudeh, S.,Otranto, E., 2014. Patterns of volatility transmissions within regime
switching across GCC and global markets. International Review of Economics and Finance 29,
512-524.
Kim, C., 1994. Dynamic linear models with Markov-switching. Journal of Econometrics 60, 1-22.
34
Kim, C., Nelson, C. R., 1998. Testing for mean reversion in heteroskedastic data II: Autoregression
tests based on Gibbs-sampling-augmented randomization. Journal of Empirical Finance 5, 385-
396.
Kim , C., Nelson, C. R., Startz, R., 1998. Testing for mean reversion in heteroskedastic data based
on Gibbs-sampling-augmented randomization. Journal of Empirical Finance 5, 131-154.
Lagoarde-Segot, T., Lucey, B. M., 2007. International portfolio diversification: Is there a role for the
Middle East and North Africa? Journal of Multinational Financial Management 17, 401–416.
Maheu, J. M., McCurdy, T. H., Song, Y., 2009. Extracting bull and bear markets from stock returns.
Working Paper, University of Toronto, Toronto, Canada.
Mansourfar, G., Mohamad, S., and Hassan, T., 2010. The behavior of MENA oil and non-oil
producing countries in international portfolio optimization. The Quarterly Review of Economics
and Finance 50 (4), 415–423.
Mensi, W., Hammoudeh, S., and S-M. Yoon, S-M., 2014. Structural breaks and long memory in
modeling and forecasting volatility of foreign exchange markets of oil exporters: The importance
of scheduled and unscheduled news announcements. International Review of Economics and
Finance (forthcoming).
Middleton, C.A.J., Fifield, S.G.M., Power, D.M., 2008. An investigation of the benefits of portfolio
investment in Central and Eastern European stock markets. Research in International Business and
Finance 22, 162-174.
Moerman, G. A., 2008. Diversification in euro area stock markets: Country versus industry. Journal of
International Money and Finance 27, 1122–1134.
Ng, A., 2000. Volatility spillover effects from Japan and the US to the Pacific–Basin. Journal of
International Money and Finance 19, 207–233.
Pagan, A. R., Schwert, G. W., 1990. Alternative models for conditional stock volatility. Journal of
Econometrics 45, 267-90.
Schwert, G. W., 1989. Business cycles, financial crises, and stock volatility. Carnegie-Rochester
Conference Series on Public Policy 31, 83-126.
Tyssedal, J. S. and Tjostheim, D., 1988. An autoregressive model with suddenly changing parameters
and an application to stock market prices. Applied Statistics 37, 353-69.
You, L., Daigler, R., 2010. Is international diversification really beneficial? Journal of Banking and
Finance 34, 163–173.
Yu, J. S., Hassan, M. K., 2008. Global and regional integration of the Middle East and North African
(MENA) stock markets. The Quarterly Review of Economics and Finance 48(3), 482–504.
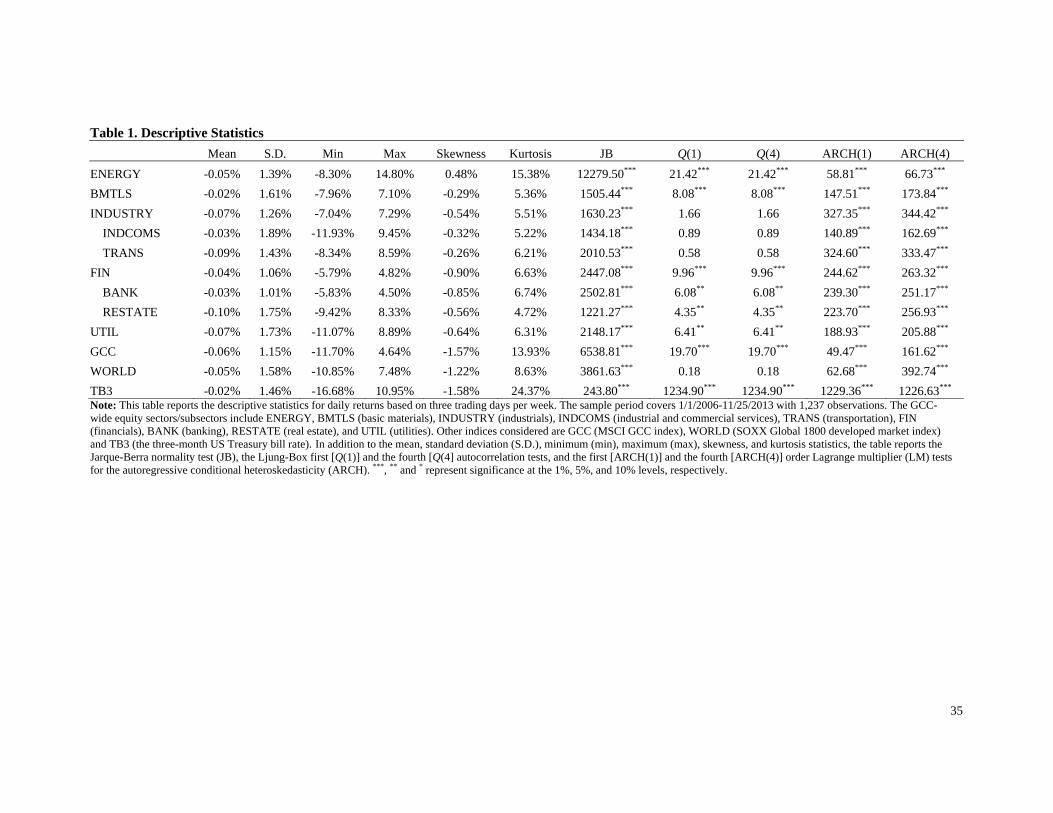
35
Table 1. Descriptive Statistics
Mean S.D. Min Max Skewness Kurtosis JB Q(1) Q(4) ARCH(1) ARCH(4)
ENERGY -0.05% 1.39% -8.30% 14.80% 0.48% 15.38% 12279.50*** 21.42*** 21.42*** 58.81*** 66.73***
BMTLS -0.02% 1.61% -7.96% 7.10% -0.29% 5.36% 1505.44*** 8.08*** 8.08*** 147.51*** 173.84***
INDUSTRY -0.07% 1.26% -7.04% 7.29% -0.54% 5.51% 1630.23*** 1.66 1.66 327.35*** 344.42***
INDCOMS -0.03% 1.89% -11.93% 9.45% -0.32% 5.22% 1434.18*** 0.89 0.89 140.89*** 162.69***
TRANS -0.09% 1.43% -8.34% 8.59% -0.26% 6.21% 2010.53*** 0.58 0.58 324.60*** 333.47***
FIN -0.04% 1.06% -5.79% 4.82% -0.90% 6.63% 2447.08*** 9.96*** 9.96*** 244.62*** 263.32***
BANK -0.03% 1.01% -5.83% 4.50% -0.85% 6.74% 2502.81*** 6.08** 6.08** 239.30*** 251.17***
RESTATE -0.10% 1.75% -9.42% 8.33% -0.56% 4.72% 1221.27*** 4.35** 4.35** 223.70*** 256.93***
UTIL -0.07% 1.73% -11.07% 8.89% -0.64% 6.31% 2148.17*** 6.41** 6.41** 188.93*** 205.88***
GCC -0.06% 1.15% -11.70% 4.64% -1.57% 13.93% 6538.81*** 19.70*** 19.70*** 49.47*** 161.62***
WORLD -0.05% 1.58% -10.85% 7.48% -1.22% 8.63% 3861.63*** 0.18 0.18 62.68*** 392.74***
TB3 -0.02% 1.46% -16.68% 10.95% -1.58% 24.37% 243.80*** 1234.90*** 1234.90*** 1229.36*** 1226.63*** Note: This table reports the descriptive statistics for daily returns based on three trading days per week. The sample period covers 1/1/2006-11/25/2013 with 1,237 observations. The GCC-wide equity sectors/subsectors include ENERGY, BMTLS (basic materials), INDUSTRY (industrials), INDCOMS (industrial and commercial services), TRANS (transportation), FIN (financials), BANK (banking), RESTATE (real estate), and UTIL (utilities). Other indices considered are GCC (MSCI GCC index), WORLD (SOXX Global 1800 developed market index) and TB3 (the three-month US Treasury bill rate). In addition to the mean, standard deviation (S.D.), minimum (min), maximum (max), skewness, and kurtosis statistics, the table reports the Jarque-Berra normality test (JB), the Ljung-Box first [Q(1)] and the fourth [Q(4] autocorrelation tests, and the first [ARCH(1)] and the fourth [ARCH(4)] order Lagrange multiplier (LM) tests for the autoregressive conditional heteroskedasticity (ARCH). ***, ** and * represent significance at the 1%, 5%, and 10% levels, respectively.
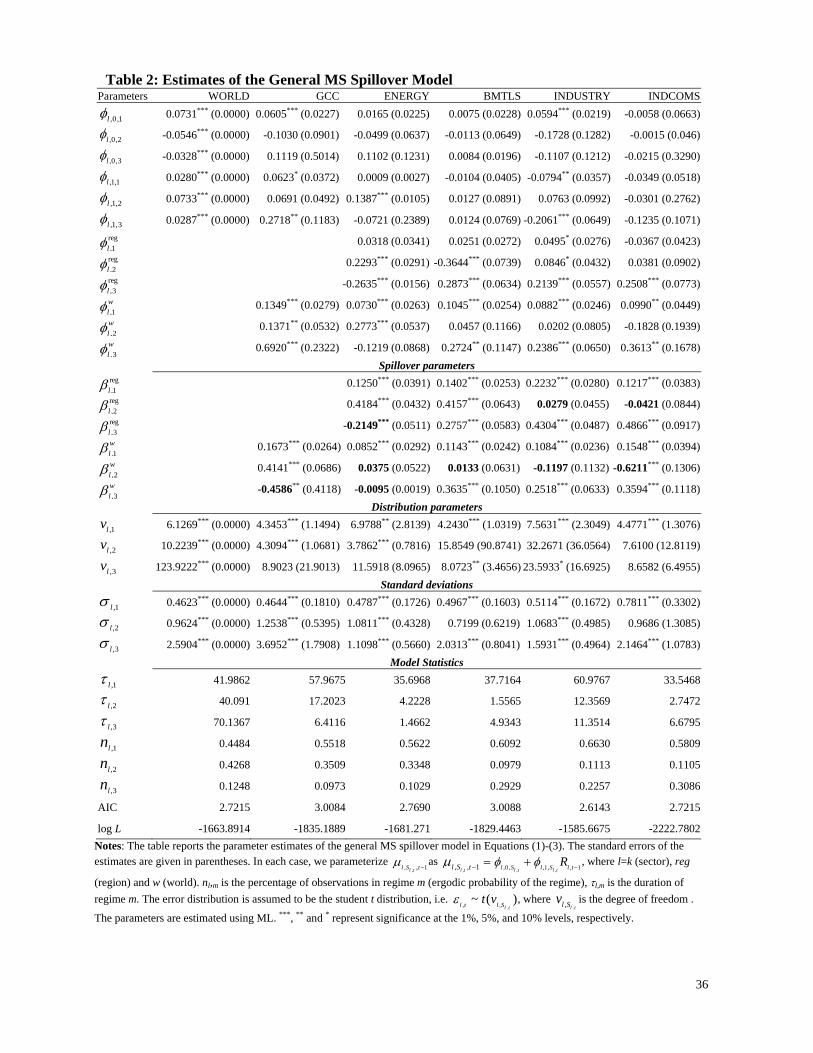
36
Table 2: Estimates of the General MS Spillover ModelParameters WORLD GCC ENERGY BMTLS INDUSTRY INDCOMS
l ,0,1 0.0731*** (0.0000) 0.0605*** (0.0227) 0.0165 (0.0225) 0.0075 (0.0228) 0.0594*** (0.0219) -0.0058 (0.0663)
l ,0,2 -0.0546*** (0.0000) -0.1030 (0.0901) -0.0499 (0.0637) -0.0113 (0.0649) -0.1728 (0.1282) -0.0015 (0.046)
l ,0,3 -0.0328*** (0.0000) 0.1119 (0.5014) 0.1102 (0.1231) 0.0084 (0.0196) -0.1107 (0.1212) -0.0215 (0.3290)
l ,1,1 0.0280*** (0.0000) 0.0623* (0.0372) 0.0009 (0.0027) -0.0104 (0.0405) -0.0794** (0.0357) -0.0349 (0.0518)
l ,1,2 0.0733*** (0.0000) 0.0691 (0.0492) 0.1387*** (0.0105) 0.0127 (0.0891) 0.0763 (0.0992) -0.0301 (0.2762)
l ,1,3 0.0287*** (0.0000) 0.2718** (0.1183) -0.0721 (0.2389) 0.0124 (0.0769) -0.2061*** (0.0649) -0.1235 (0.1071)
l ,1
reg 0.0318 (0.0341) 0.0251 (0.0272) 0.0495* (0.0276) -0.0367 (0.0423)
l ,2
reg 0.2293*** (0.0291) -0.3644*** (0.0739) 0.0846* (0.0432) 0.0381 (0.0902)
l ,3
reg -0.2635*** (0.0156) 0.2873*** (0.0634) 0.2139*** (0.0557) 0.2508*** (0.0773)
l ,1
w 0.1349*** (0.0279) 0.0730*** (0.0263) 0.1045*** (0.0254) 0.0882*** (0.0246) 0.0990** (0.0449)
l ,2
w 0.1371** (0.0532) 0.2773*** (0.0537) 0.0457 (0.1166) 0.0202 (0.0805) -0.1828 (0.1939)
l ,3
w 0.6920*** (0.2322) -0.1219 (0.0868) 0.2724** (0.1147) 0.2386*** (0.0650) 0.3613** (0.1678)
Spillover parameters
l ,1
reg 0.1250*** (0.0391) 0.1402*** (0.0253) 0.2232*** (0.0280) 0.1217*** (0.0383)
l ,2
reg 0.4184*** (0.0432) 0.4157*** (0.0643) 0.0279 (0.0455) -0.0421 (0.0844)
l ,3
reg -0.2149*** (0.0511) 0.2757*** (0.0583) 0.4304*** (0.0487) 0.4866*** (0.0917)
l ,1
w 0.1673*** (0.0264) 0.0852*** (0.0292) 0.1143*** (0.0242) 0.1084*** (0.0236) 0.1548*** (0.0394)
l ,2
w 0.4141*** (0.0686) 0.0375 (0.0522) 0.0133 (0.0631) -0.1197 (0.1132) -0.6211*** (0.1306)
l ,3
w -0.4586** (0.4118) -0.0095 (0.0019) 0.3635*** (0.1050) 0.2518*** (0.0633) 0.3594*** (0.1118)
Distribution parameters
vl ,1 6.1269*** (0.0000) 4.3453*** (1.1494) 6.9788** (2.8139) 4.2430*** (1.0319) 7.5631*** (2.3049) 4.4771*** (1.3076)
vl ,2 10.2239*** (0.0000) 4.3094*** (1.0681) 3.7862*** (0.7816) 15.8549 (90.8741) 32.2671 (36.0564) 7.6100 (12.8119)
vl ,3 123.9222*** (0.0000) 8.9023 (21.9013) 11.5918 (8.0965) 8.0723** (3.4656) 23.5933* (16.6925) 8.6582 (6.4955)
Standard deviations
l ,1 0.4623*** (0.0000) 0.4644*** (0.1810) 0.4787*** (0.1726) 0.4967*** (0.1603) 0.5114*** (0.1672) 0.7811*** (0.3302)
l ,2 0.9624*** (0.0000) 1.2538*** (0.5395) 1.0811*** (0.4328) 0.7199 (0.6219) 1.0683*** (0.4985) 0.9686 (1.3085)
l ,3 2.5904*** (0.0000) 3.6952*** (1.7908) 1.1098*** (0.5660) 2.0313*** (0.8041) 1.5931*** (0.4964) 2.1464*** (1.0783)
Model Statistics
l ,1 41.9862 57.9675 35.6968 37.7164 60.9767 33.5468
l ,2 40.091 17.2023 4.2228 1.5565 12.3569 2.7472
l ,3 70.1367 6.4116 1.4662 4.9343 11.3514 6.6795
nl ,1 0.4484 0.5518 0.5622 0.6092 0.6630 0.5809
nl ,2 0.4268 0.3509 0.3348 0.0979 0.1113 0.1105
nl ,3 0.1248 0.0973 0.1029 0.2929 0.2257 0.3086
AIC 2.7215 3.0084 2.7690 3.0088 2.6143 2.7215
log L -1663.8914 -1835.1889 -1681.271 -1829.4463 -1585.6675 -2222.7802
Notes: The table reports the parameter estimates of the general MS spillover model in Equations (1)-(3). The standard errors of the estimates are given in parentheses. In each case, we parameterize
l ,Sl ,t ,t1as l ,Sl ,t ,t1 l ,0 ,Sl ,t
l ,1,Sl ,t
Rl ,t1
, where l=k (sector), reg
(region) and w (world). nl,m is the percentage of observations in regime m (ergodic probability of the regime), l,m is the duration of
regime m. The error distribution is assumed to be the student t distribution, i.e. l ,t
~ t(vl ,Sl . t
), where vl ,Sl . tis the degree of freedom .
The parameters are estimated using ML. ***, ** and * represent significance at the 1%, 5%, and 10% levels, respectively.
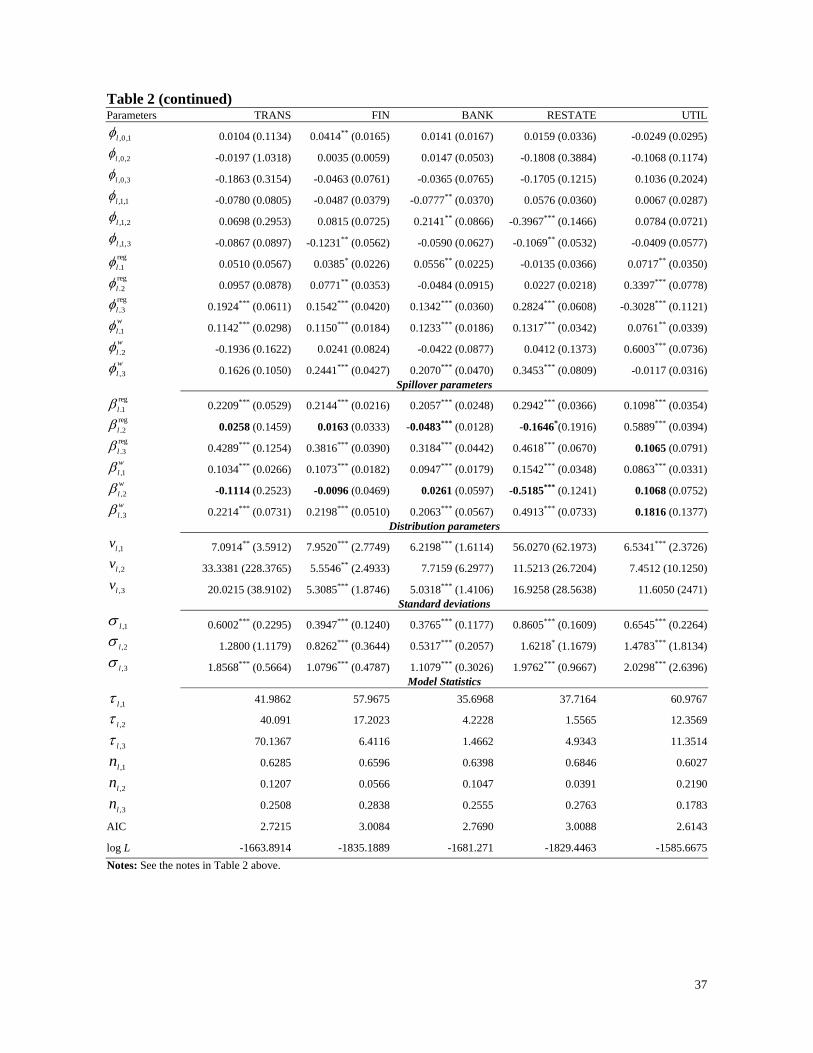
37
Table 2 (continued)Parameters TRANS FIN BANK RESTATE UTIL
l ,0,1 0.0104 (0.1134) 0.0414** (0.0165) 0.0141 (0.0167) 0.0159 (0.0336) -0.0249 (0.0295)
l ,0,2 -0.0197 (1.0318) 0.0035 (0.0059) 0.0147 (0.0503) -0.1808 (0.3884) -0.1068 (0.1174)
l ,0,3 -0.1863 (0.3154) -0.0463 (0.0761) -0.0365 (0.0765) -0.1705 (0.1215) 0.1036 (0.2024)
l ,1,1 -0.0780 (0.0805) -0.0487 (0.0379) -0.0777** (0.0370) 0.0576 (0.0360) 0.0067 (0.0287)
l ,1,2 0.0698 (0.2953) 0.0815 (0.0725) 0.2141** (0.0866) -0.3967*** (0.1466) 0.0784 (0.0721)
l ,1,3 -0.0867 (0.0897) -0.1231** (0.0562) -0.0590 (0.0627) -0.1069** (0.0532) -0.0409 (0.0577)
l ,1
reg 0.0510 (0.0567) 0.0385* (0.0226) 0.0556** (0.0225) -0.0135 (0.0366) 0.0717** (0.0350)
l ,2
reg 0.0957 (0.0878) 0.0771** (0.0353) -0.0484 (0.0915) 0.0227 (0.0218) 0.3397*** (0.0778)
l ,3
reg 0.1924*** (0.0611) 0.1542*** (0.0420) 0.1342*** (0.0360) 0.2824*** (0.0608) -0.3028*** (0.1121)
l ,1
w 0.1142*** (0.0298) 0.1150*** (0.0184) 0.1233*** (0.0186) 0.1317*** (0.0342) 0.0761** (0.0339)
l ,2
w -0.1936 (0.1622) 0.0241 (0.0824) -0.0422 (0.0877) 0.0412 (0.1373) 0.6003*** (0.0736)
l ,3
w 0.1626 (0.1050) 0.2441*** (0.0427) 0.2070*** (0.0470) 0.3453*** (0.0809) -0.0117 (0.0316)Spillover parameters
l ,1
reg 0.2209*** (0.0529) 0.2144*** (0.0216) 0.2057*** (0.0248) 0.2942*** (0.0366) 0.1098*** (0.0354)
l ,2
reg 0.0258 (0.1459) 0.0163 (0.0333) -0.0483*** (0.0128) -0.1646*(0.1916) 0.5889*** (0.0394)
l ,3
reg 0.4289*** (0.1254) 0.3816*** (0.0390) 0.3184*** (0.0442) 0.4618*** (0.0670) 0.1065 (0.0791)
l ,1
w 0.1034*** (0.0266) 0.1073*** (0.0182) 0.0947*** (0.0179) 0.1542*** (0.0348) 0.0863*** (0.0331)
l ,2
w -0.1114 (0.2523) -0.0096 (0.0469) 0.0261 (0.0597) -0.5185*** (0.1241) 0.1068 (0.0752)
l ,3
w 0.2214*** (0.0731) 0.2198*** (0.0510) 0.2063*** (0.0567) 0.4913*** (0.0733) 0.1816 (0.1377)Distribution parameters
vl ,1 7.0914** (3.5912) 7.9520*** (2.7749) 6.2198*** (1.6114) 56.0270 (62.1973) 6.5341*** (2.3726)
vl ,2 33.3381 (228.3765) 5.5546** (2.4933) 7.7159 (6.2977) 11.5213 (26.7204) 7.4512 (10.1250)
vl ,3 20.0215 (38.9102) 5.3085*** (1.8746) 5.0318*** (1.4106) 16.9258 (28.5638) 11.6050 (2471)
Standard deviations
l ,1 0.6002*** (0.2295) 0.3947*** (0.1240) 0.3765*** (0.1177) 0.8605*** (0.1609) 0.6545*** (0.2264)
l ,2 1.2800 (1.1179) 0.8262*** (0.3644) 0.5317*** (0.2057) 1.6218* (1.1679) 1.4783*** (1.8134)
l ,3 1.8568*** (0.5664) 1.0796*** (0.4787) 1.1079*** (0.3026) 1.9762*** (0.9667) 2.0298*** (2.6396)
Model Statistics
l ,1 41.9862 57.9675 35.6968 37.7164 60.9767
l ,2 40.091 17.2023 4.2228 1.5565 12.3569
l ,3 70.1367 6.4116 1.4662 4.9343 11.3514
nl ,1 0.6285 0.6596 0.6398 0.6846 0.6027
nl ,2 0.1207 0.0566 0.1047 0.0391 0.2190
nl ,3 0.2508 0.2838 0.2555 0.2763 0.1783
AIC 2.7215 3.0084 2.7690 3.0088 2.6143
log L -1663.8914 -1835.1889 -1681.271 -1829.4463 -1585.6675
Notes: See the notes in Table 2 above.

38
Table 3: Summary Statistics for the Variance Ratios
Variance due to Global Shocks Variance due to Regional ShocksVariance due to Idiosyncratic
ShocksMean S.D. Min Max Mean S.D. Min Max Mean S.D. Min Max
The GARCH Spillover ModelGCC Region 2.501 2.866 0.018 17.558 97.499 2.866 82.442 99.983ENERGY 0.789 0.902 0.009 7.015 8.764 7.534 0.030 45.089 90.447 7.761 52.233 99.946BMTLS 1.243 1.426 0.061 10.603 6.079 5.782 0.190 51.629 92.678 6.019 48.146 99.675INDUSTRY 2.174 2.228 0.061 15.539 14.443 10.702 1.362 57.461 83.384 10.937 41.609 98.091INDCOMS 1.468 1.516 0.055 10.252 3.788 4.543 0.136 40.455 94.745 4.965 59.053 99.721TRANS 1.418 1.764 0.054 14.177 9.328 7.986 0.682 53.622 89.254 8.268 46.211 98.944FIN 2.914 2.953 0.054 22.753 16.199 11.237 0.614 64.599 80.886 11.444 35.134 99.220BANK 2.333 2.376 0.053 18.057 12.994 9.861 0.307 56.171 84.673 10.092 43.591 99.607RESTATE 3.487 3.344 0.070 22.798 14.270 11.363 0.752 60.661 82.244 11.896 37.997 98.241UTIL 0.847 1.000 0.023 8.725 6.239 4.821 0.546 33.751 92.914 4.917 65.948 99.234
The General MS Spillover Model GCC Region 7.863 9.000 0.480 37.312 92.137 9.000 62.688 99.520
ENERGY 1.179 2.376 0.011 13.880 13.911 13.487 2.366 59.296 84.910 13.115 40.375 96.694
BMTLS 4.264 5.215 0.595 22.587 5.905 5.650 0.972 37.051 89.832 7.738 58.396 98.034
INDUSTRY 3.397 4.356 0.345 20.337 11.056 8.595 1.294 52.354 85.546 9.684 46.586 97.671
INDCOMS 5.573 6.899 0.672 45.032 5.983 6.809 0.881 35.902 88.444 10.063 44.809 97.823
TRANS 2.211 2.992 0.205 14.144 8.215 7.301 1.018 46.133 89.574 8.070 53.041 98.496
FIN 4.881 6.072 0.011 29.144 16.036 11.468 0.490 60.840 79.083 13.065 35.703 99.469
BANK 4.416 5.447 0.330 25.878 15.551 10.925 2.664 59.952 80.033 11.652 30.453 96.354
RESTATE 5.535 7.093 0.579 31.945 9.546 8.184 1.807 47.185 84.918 10.948 48.343 96.077
UTIL 1.249 1.759 0.087 8.925 8.195 9.297 1.300 51.158 90.556 9.407 48.742 98.207
The Common State MV-MS Spillover ModelGCC Region 4.055 0.660 2.961 5.179 95.945 0.660 94.820 97.039
ENERGY 2.866 0.467 1.970 3.222 13.531 0.876 11.976 14.332 83.602 1.266 82.446 85.462
BMTLS 2.649 0.691 2.172 4.073 13.085 1.616 10.217 14.413 84.266 1.067 83.264 85.895
INDUSTRY 3.757 0.147 3.393 3.912 24.826 3.562 18.410 27.684 71.417 3.691 68.403 78.003
INDCOMS 2.626 1.087 0.708 3.543 8.669 4.583 5.101 17.300 88.705 3.507 81.992 91.357
TRANS 2.054 0.591 1.703 3.261 17.245 1.541 16.100 20.276 80.701 2.120 76.463 82.176
FIN 4.149 0.324 3.711 4.775 28.834 7.723 15.467 35.449 67.018 7.548 60.402 79.757
BANK 3.295 0.564 2.488 3.866 28.627 4.808 20.443 32.747 68.078 5.320 63.388 76.853
RESTATE 5.023 1.450 3.999 7.885 24.374 4.062 16.728 27.405 70.603 2.623 68.595 75.387
UTIL 2.525 0.785 1.114 3.188 14.149 1.402 13.335 17.021 83.325 0.763 81.865 84.415Note: This table reports the mean, the standard deviation (S.D.), the minimum, and the maximum for the percentage variance ratios for the GARCH, general MS, and MV-MS spillover models. The variance ratios are computed over the full sample period 1/1/2006-11/25/2013, which is equivalent to 1,236 observations. The GARCH spillover Model is the benchmark model.

39
Table 4: Summary Statistics for In-sample Portfolios Portfolio Return Portfolio Risk Sharpe Ratio of Portfolio
Mean S.D. Min Max Mean S.D. Min Max Mean S.D. Min Max
The GARCH Spillover Model
Portfolio 1 0.002 1.316 -7.183 8.970 1.171 0.689 0.470 4.985 0.003 0.984 -4.377 3.743Portfolio 2 -0.057 0.993 -6.035 6.465 0.543 0.255 0.272 1.811 -0.043 1.481 -7.283 6.499Portfolio 3 0.388 1.060 -5.943 8.970 0.732 0.540 0.272 4.792 0.481 1.253 -5.819 6.499Portfolio 4 1.105 1.347 -4.700 14.797 1.093 0.619 0.470 4.792 1.060 1.123 -2.462 14.373Portfolio 5 1.065 1.218 -4.700 14.390 1.016 0.637 0.344 4.838 1.263 1.205 -2.180 14.378
The General MS Spillover Model
Portfolio 1 0.002 1.316 -7.183 8.970 1.101 0.657 0.498 2.572 0.006 1.096 -5.222 4.640Portfolio 2 -0.053 1.029 -6.349 6.681 0.442 0.173 0.256 1.215 -0.048 1.863 -9.789 7.432Portfolio 3 0.417 1.062 -5.943 8.970 0.640 0.506 0.256 2.572 0.610 1.526 -9.043 7.432Portfolio 4 1.172 1.416 -4.700 14.797 0.960 0.519 0.440 2.572 1.292 1.412 -3.628 19.927Portfolio 5 1.073 1.255 -4.700 14.797 0.828 0.465 0.292 2.572 1.547 1.545 -3.628 19.927
The Common State MV-MS Spillover Model
Portfolio 1 0.002 1.316 -7.183 8.970 1.164 0.252 0.957 1.607 0.003 1.102 -7.125 5.582Portfolio 2 -0.060 1.042 -5.757 7.146 0.600 0.155 0.479 0.878 -0.065 1.511 -12.006 8.141Portfolio 3 0.402 1.068 -5.757 8.970 0.752 0.305 0.479 1.607 0.470 1.302 -12.006 6.171Portfolio 4 1.268 1.390 -4.716 13.041 1.150 0.261 0.669 1.607 1.104 1.126 -4.923 11.297Portfolio 5 1.147 1.278 -4.700 14.797 1.036 0.399 0.513 2.755 1.247 1.228 -4.673 11.424Notes: This table reports the mean, the standard deviation (S.D.), the minimum, and the maximum for the dynamic in-sample portfolios constructed using covariance matrices obtained from the GARCH, the general MS, and the MV-MS spillover models. The models are estimated for the sample period 1/1/2006-8/14/2012, and 1,036 portfolios are constructed for the same period. P1 is the undiversified world portfolio represented by the STOXX 1800 developed market index. P2 is the diversified minimum variance portfolio which includes the STOXX 1800 index and the seven GCC-wide equity sectors including ENERGY, BMTLS (basic materials), INDUSTRY (industrials), INDCOMS (industrial and commercial services), TRANS (transportation), FIN (financials), BANK (banking), RESTATE (real estate), and UTIL (utilities). P3 is the diversified minimum variance portfolio with a target return equal to the efficient global return. P4 is the diversified minimum variance portfolio with a target risk equal to the efficient global risk. P5 is the diversified tangency portfolio with the maximum Sharpe ratio. The GARCH spillover Model is the benchmark model.

40
Table 5: Summary Statistics for the Out-of-sample Portfolios
Portfolio Return Portfolio Risk Sharpe Ratio of Portfolio
Mean S.D. Min Max Mean S.D. Min Max Mean S.D. Min Max
The GARCH Spillover Model
Portfolio 1 0.038 0.593 -1.703 2.146 0.684 0.123 0.492 1.141 0.032 0.889 -2.654 3.517Portfolio 2 0.059 0.467 -2.254 2.864 0.332 0.061 0.252 0.605 0.178 1.359 -6.762 5.631Portfolio 3 0.263 0.485 -1.318 2.864 0.393 0.136 0.252 0.904 0.618 1.197 -2.909 7.087Portfolio 4 0.806 0.705 -1.232 5.064 0.665 0.112 0.421 1.070 1.205 1.034 -2.249 7.195Portfolio 5 0.738 0.634 -1.104 4.739 0.645 0.789 0.317 10.683 1.385 1.125 -1.062 7.481
The General MS Spillover Model
Portfolio 1 0.038 0.593 -1.703 2.146 0.602 0.120 0.498 1.021 0.039 1.003 -3.025 4.137Portfolio 2 0.060 0.449 -2.212 2.478 0.287 0.050 0.247 0.541 0.212 1.501 -7.324 6.520Portfolio 3 0.262 0.472 -1.318 2.478 0.341 0.124 0.247 0.889 0.700 1.331 -3.661 7.864Portfolio 4 0.818 0.692 -1.216 4.436 0.586 0.111 0.379 0.988 1.382 1.126 -2.296 7.840Portfolio 5 0.731 0.650 -1.104 5.061 0.502 0.199 0.267 1.776 1.587 1.246 -1.227 8.449
The Common State MV-MS Spillover Model
Portfolio 1 0.038 0.593 -1.703 2.146 1.013 0.138 0.957 1.607 0.030 0.597 -1.774 2.226Portfolio 2 0.058 0.527 -2.359 3.977 0.511 0.082 0.479 0.878 0.120 0.946 -4.924 5.922Portfolio 3 0.274 0.518 -1.318 3.977 0.600 0.233 0.479 1.607 0.425 0.839 -2.503 5.922Portfolio 4 0.921 0.833 -1.137 7.419 1.002 0.152 0.669 1.607 0.920 0.768 -1.188 5.642Portfolio 5 0.814 0.724 -1.104 5.430 0.840 0.245 0.499 1.869 1.026 0.859 -1.004 7.022Notes: This table reports the mean, the standard deviation (S.D.), the minimum, and the maximum for the dynamic out-of-sample portfolios constructed using one-step ahead predicted covariance matrices obtained from the recursively estimated GARCH, MS, and MV-MS spillover models. The out of sample models are recursively estimated for the sample period 8/15/2012-11/25/2013 and 200 portfolios are constructed for the same period. P1 is the undiversified world portfolio represented by the STOXX 1800 developed market index. P2 is the diversified minimum variance portfolio which includes the STOXX 1800 index and the seven GCC-wide equity sectors including ENERGY, BMTLS (basic materials), INDUSTRY (industrials), INDCOMS (industrial and commercial services), TRANS (transportation), FIN (financials), BANK (banking), RESTATE (real estate), and UTIL (utilities). P3 is the diversified minimum variance portfolio with a target return equal to the efficient global return. P4 is the diversified minimum variance portfolio with a target risk equal to the efficient global risk. P5 is the diversified tangency portfolio with the maximum Sharpe ratio. The GARCH spillover Model is the benchmark model.
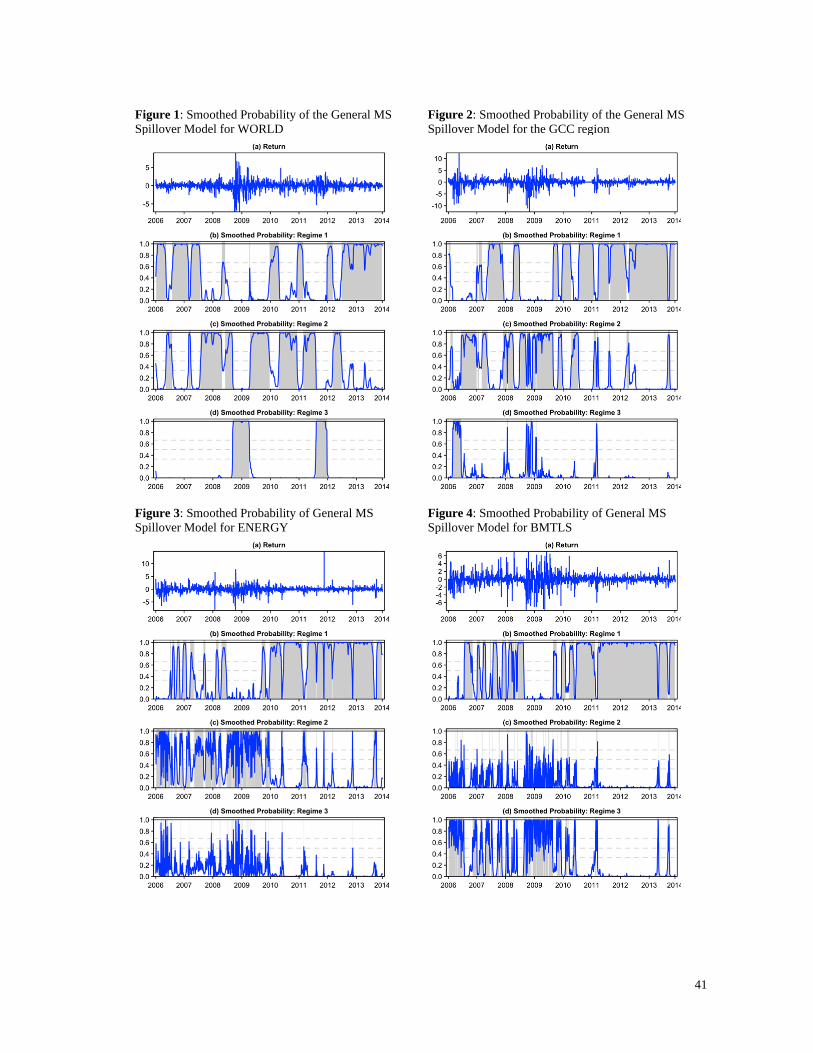
41
Figure 1: Smoothed Probability of the General MS Spillover Model for WORLD
Figure 2: Smoothed Probability of the General MS Spillover Model for the GCC region
Figure 3: Smoothed Probability of General MS Spillover Model for ENERGY
Figure 4: Smoothed Probability of General MS Spillover Model for BMTLS
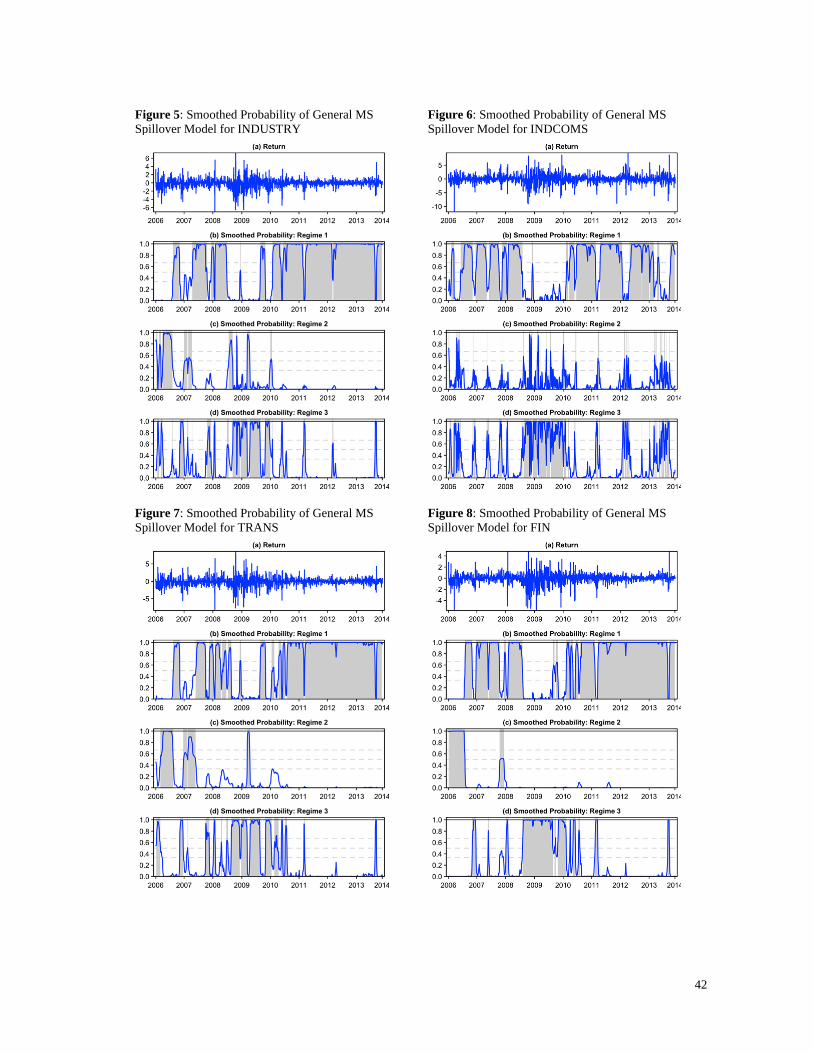
42
Figure 5: Smoothed Probability of General MS Spillover Model for INDUSTRY
Figure 6: Smoothed Probability of General MS Spillover Model for INDCOMS
Figure 7: Smoothed Probability of General MS Spillover Model for TRANS
Figure 8: Smoothed Probability of General MS Spillover Model for FIN
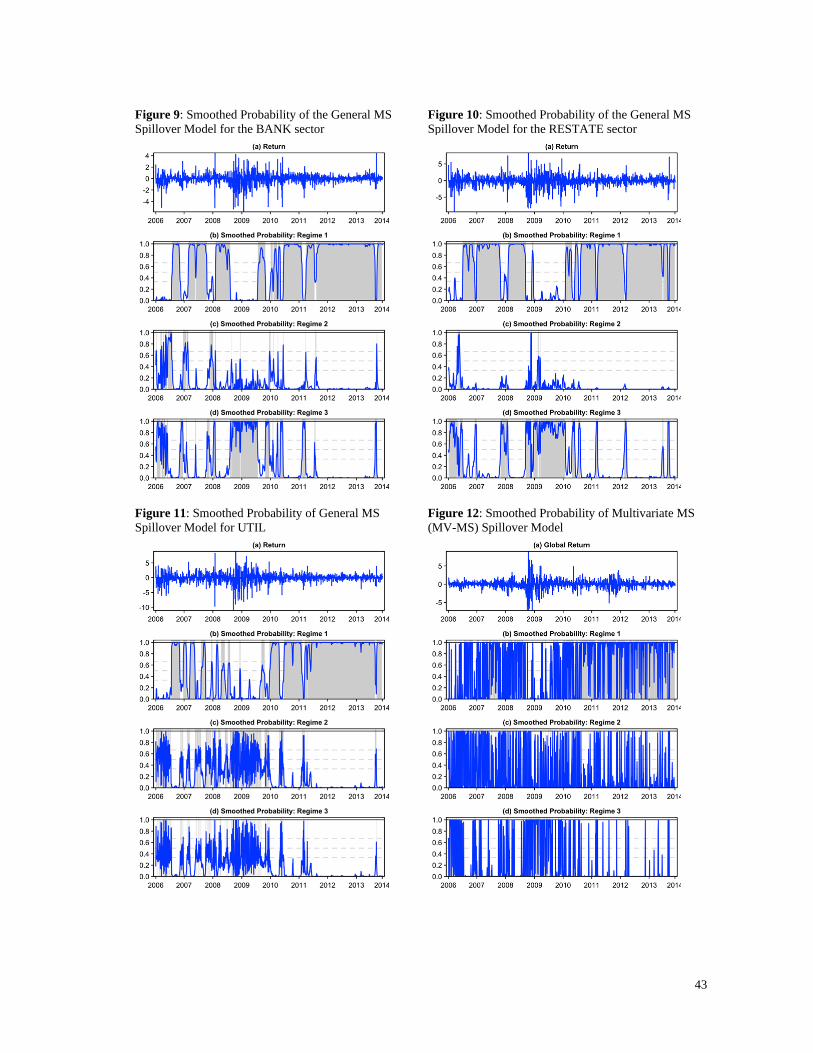
43
Figure 9: Smoothed Probability of the General MS Spillover Model for the BANK sector
Figure 10: Smoothed Probability of the General MS Spillover Model for the RESTATE sector
Figure 11: Smoothed Probability of General MS Spillover Model for UTIL
Figure 12: Smoothed Probability of Multivariate MS (MV-MS) Spillover Model
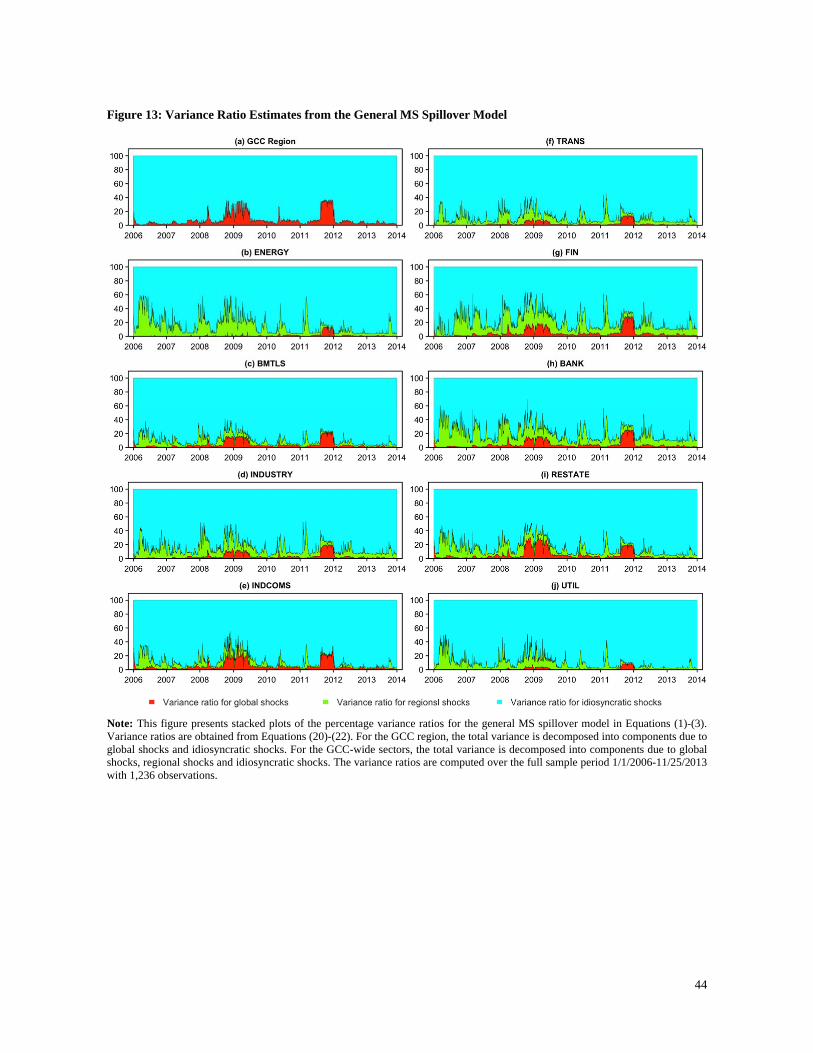
44
Figure 13: Variance Ratio Estimates from the General MS Spillover Model
Note: This figure presents stacked plots of the percentage variance ratios for the general MS spillover model in Equations (1)-(3). Variance ratios are obtained from Equations (20)-(22). For the GCC region, the total variance is decomposed into components due to global shocks and idiosyncratic shocks. For the GCC-wide sectors, the total variance is decomposed into components due to global shocks, regional shocks and idiosyncratic shocks. The variance ratios are computed over the full sample period 1/1/2006-11/25/2013 with 1,236 observations.
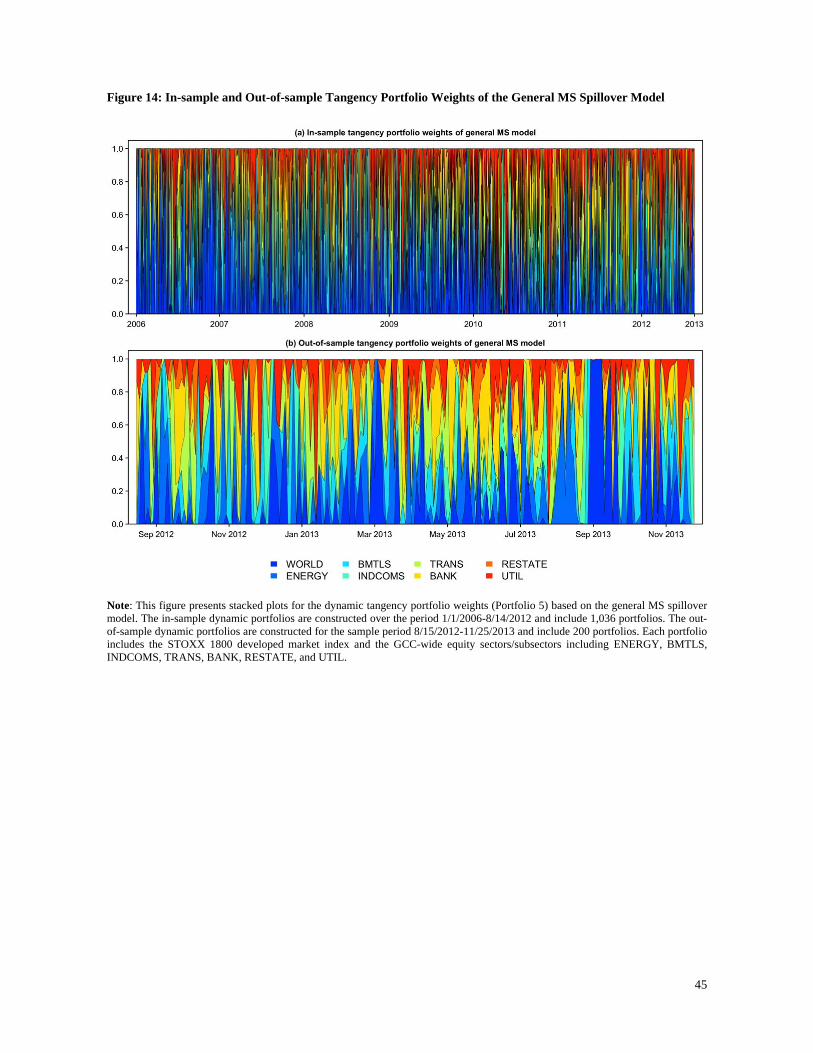
45
Figure 14: In-sample and Out-of-sample Tangency Portfolio Weights of the General MS Spillover Model
Note: This figure presents stacked plots for the dynamic tangency portfolio weights (Portfolio 5) based on the general MS spillover model. The in-sample dynamic portfolios are constructed over the period 1/1/2006-8/14/2012 and include 1,036 portfolios. The out-of-sample dynamic portfolios are constructed for the sample period 8/15/2012-11/25/2013 and include 200 portfolios. Each portfolio includes the STOXX 1800 developed market index and the GCC-wide equity sectors/subsectors including ENERGY, BMTLS, INDCOMS, TRANS, BANK, RESTATE, and UTIL.
Related Documents