Regional and cell-type-specific effects of DAMGO on striatal D1 and D2 dopamine receptor-expressing medium-sized spiny neurons Yao-Ying Ma* 1 , Carlos Cepeda { , Payush Chatta*, Lana Franklin*, Christopher J Evans* and Michael S Levine {2 *Stefan & Shirley Hatos Center for Neuropharmacology, David Geffen School of Medicine, University of California Los Angeles, Los Angeles, CA, U.S.A. { Intellectual and Developmental Disabilities Research Center, David Geffen School of Medicine, University of California Los Angeles, Los Angeles, CA, U.S.A. Cite this article as: Ma Y-Y, Cepeda C, Chatta P, Franklin L, Evans CJ and Levine MS (2012) Regional and cell-type-specific effects of DAMGO on striatal D1 and D2 dopamine receptor-expressing medium-sized spiny neurons. ASN NEURO 4(2):art:e00077.doi:10.1042/AN20110063 ABSTRACT The striatum can be divided into the DLS (dorsolateral striatum) and the VMS (ventromedial striatum), which includes NAcC (nucleus accumbens core) and NAcS (nucleus accumbens shell). Here, we examined differences in electrophysiological properties of MSSNs (medium- sized spiny neurons) based on their location, expression of DA (dopamine) D1/D2 receptors and responses to the m-opioid receptor agonist, DAMGO {[D-Ala 2 -MePhe 4 - Gly(ol) 5 ]enkephalin}. The main differences in morphological and biophysical membrane properties occurred among striatal sub-regions. MSSNs in the DLS were larger, had higher membrane capacitances and lower Rin (input resistances) compared with cells in the VMS. RMPs (resting membrane potentials) were similar among regions except for D2 cells in the NAcC, which displayed a significantly more depolarized RMP. In contrast, differences in fre- quency of spontaneous excitatory synaptic inputs were more prominent between cell types, with D2 cells receiving significantly more excitatory inputs than D1 cells, particularly in the VMS. Inhibitory inputs were not different between D1 and D2 cells. However, MSSNs in the VMS received more inhibitory inputs than those in the DLS. Acute application of DAMGO reduced the frequency of spontaneous excitatory and inhibitory postsynaptic cur- rents, but the effect was greater in the VMS, in particular in the NAcS, where excitatory currents from D2 cells and inhibitory currents from D1 cells were inhibited by the largest amount. DAMGO also increased cellular excitability in the VMS, as shown by reduced threshold for evoking APs (action potentials). Together the present findings help elucidate the regional and cell-type-specific substrate of opioid actions in the striatum and point to the VMS as a critical mediator of DAMGO effects. Key words: D1/D2 receptors, electrophysiology, nucleus accumbens, opioid receptors, striatum. INTRODUCTION The striatum is the principal input structure of the basal ganglia, and according to the classic anatomical perspective it can be divided into two main regions: the DLS (dorsolateral striatum) and the VMS (ventromedial striatum). The DLS mainly integrates sensorimotor information, whereas the VMS, comprising NAcC (nucleus accumbens core) and NAcS (nucleus accumbens shell), is principally involved in motiva- tion and reward (Pennartz et al., 2009). 1 Current address: Program in Neuroscience, Department of VCAPP, Washington State University, Wegner 205 (PO Box 646520), Pullman, WA 99164-6520, U.S.A. 2 To whom correspondence should be addressed (email [email protected]). Abbreviations: ACSF, artificial cerebrospinal fluid; AHP, after hyperpolarization; AP, action potential; AP-5, DL-2-amino-5-phosphonovaleric acid; BIC, bicuculline; CNQX, 6- cyano-7-nitroquinoxaline-2,3-dione; CsMeth, Cs-methanesulfonate; DA, dopamine; DAMGO, [D-Ala 2 -MePhe 4 -Gly(ol) 5 ]enkephalin; DLS, dorsolateral striatum; EPSC, excitatory postsynaptic current; EGFP, enhanced green fluorescent protein; IPSC, inhibitory postsynaptic current; KGluc, K-gluconate; mEPSC, miniature EPSC; mIPSC, miniature IPSC; MSSN, medium-sized spiny neuron; NAcC, nucleus accumbens core; NAcS, nucleus accumbens shell; Rin, input resistance; RMP, resting membrane potential; sEPSC, spontaneous EPSC; sIPSC, spontaneous IPSC; TBST, TBS containing 0.1% Tween 20; TTX, tetrodotoxin; UCLA, University of California at Los Angeles; VMS, ventromedial striatum; VTA, ventral tegmental area. E 2012 The Author(s) This is an Open Access article distributed under the terms of the Creative Commons Attribution Non-Commercial Licence (http:// creativecommons.org/licenses/by-nc/2.5/) which permits unrestricted non-commercial use, distribution and reproduction in any medium, provided the original work is properly cited. RESEARCH ARTICLE ASN NEURO 4(2):art:e00077.doi:10.1042/AN20110063 asnneuro.org / Volume 4 (2) / art:e00077 59

Welcome message from author
This document is posted to help you gain knowledge. Please leave a comment to let me know what you think about it! Share it to your friends and learn new things together.
Transcript
Regional and cell-type-specific effects ofDAMGO on striatal D1 and D2 dopaminereceptor-expressing medium-sized spinyneuronsYao-Ying Ma*1, Carlos Cepeda{, Payush Chatta*, Lana Franklin*, Christopher J Evans* and Michael S Levine{2
*Stefan & Shirley Hatos Center for Neuropharmacology, David Geffen School of Medicine, University of California Los Angeles, Los Angeles, CA, U.S.A.{Intellectual and Developmental Disabilities Research Center, David Geffen School of Medicine, University of California Los Angeles, Los Angeles, CA,U.S.A.
Cite this article as: Ma Y-Y, Cepeda C, Chatta P, Franklin L, Evans CJ and Levine MS (2012) Regional and cell-type-specific effects of DAMGO on striatalD1 and D2 dopamine receptor-expressing medium-sized spiny neurons. ASN NEURO 4(2):art:e00077.doi:10.1042/AN20110063
ABSTRACT
The striatum can be divided into the DLS (dorsolateralstriatum) and the VMS (ventromedial striatum), whichincludes NAcC (nucleus accumbens core) and NAcS(nucleus accumbens shell). Here, we examined differencesin electrophysiological properties of MSSNs (medium-sized spiny neurons) based on their location, expressionof DA (dopamine) D1/D2 receptors and responses to them-opioid receptor agonist, DAMGO {[D-Ala2-MePhe4-Gly(ol)5]enkephalin}. The main differences in morphologicaland biophysical membrane properties occurred amongstriatal sub-regions. MSSNs in the DLS were larger, hadhigher membrane capacitances and lower Rin (inputresistances) compared with cells in the VMS. RMPs (restingmembrane potentials) were similar among regions exceptfor D2 cells in the NAcC, which displayed a significantlymore depolarized RMP. In contrast, differences in fre-quency of spontaneous excitatory synaptic inputs weremore prominent between cell types, with D2 cells receivingsignificantly more excitatory inputs than D1 cells,particularly in the VMS. Inhibitory inputs were not differentbetween D1 and D2 cells. However, MSSNs in the VMSreceived more inhibitory inputs than those in the DLS.Acute application of DAMGO reduced the frequency of
spontaneous excitatory and inhibitory postsynaptic cur-rents, but the effect was greater in the VMS, in particular inthe NAcS, where excitatory currents from D2 cells andinhibitory currents from D1 cells were inhibited by thelargest amount. DAMGO also increased cellular excitabilityin the VMS, as shown by reduced threshold for evoking APs(action potentials). Together the present findings helpelucidate the regional and cell-type-specific substrate ofopioid actions in the striatum and point to the VMS as acritical mediator of DAMGO effects.
Key words: D1/D2 receptors, electrophysiology, nucleusaccumbens, opioid receptors, striatum.
INTRODUCTION
The striatum is the principal input structure of the basal
ganglia, and according to the classic anatomical perspective it
can be divided into two main regions: the DLS (dorsolateral
striatum) and the VMS (ventromedial striatum). The DLS
mainly integrates sensorimotor information, whereas the
VMS, comprising NAcC (nucleus accumbens core) and NAcS
(nucleus accumbens shell), is principally involved in motiva-
tion and reward (Pennartz et al., 2009).
1 Current address: Program in Neuroscience, Department of VCAPP, Washington State University, Wegner 205 (PO Box 646520), Pullman, WA 99164-6520, U.S.A.2 To whom correspondence should be addressed (email [email protected]).Abbreviations: ACSF, artificial cerebrospinal fluid; AHP, after hyperpolarization; AP, action potential; AP-5, DL-2-amino-5-phosphonovaleric acid; BIC, bicuculline; CNQX, 6-cyano-7-nitroquinoxaline-2,3-dione; CsMeth, Cs-methanesulfonate; DA, dopamine; DAMGO, [D-Ala2-MePhe4-Gly(ol)5]enkephalin; DLS, dorsolateral striatum; EPSC,excitatory postsynaptic current; EGFP, enhanced green fluorescent protein; IPSC, inhibitory postsynaptic current; KGluc, K-gluconate; mEPSC, miniature EPSC; mIPSC,miniature IPSC; MSSN, medium-sized spiny neuron; NAcC, nucleus accumbens core; NAcS, nucleus accumbens shell; Rin, input resistance; RMP, resting membrane potential;sEPSC, spontaneous EPSC; sIPSC, spontaneous IPSC; TBST, TBS containing 0.1% Tween 20; TTX, tetrodotoxin; UCLA, University of California at Los Angeles; VMS, ventromedialstriatum; VTA, ventral tegmental area.E 2012 The Author(s) This is an Open Access article distributed under the terms of the Creative Commons Attribution Non-Commercial Licence (http://creativecommons.org/licenses/by-nc/2.5/) which permits unrestricted non-commercial use, distribution and reproduction in any medium, provided the original work isproperly cited.
RESEARCH ARTICLEASN NEURO 4(2):art:e00077.doi:10.1042/AN20110063
asnneuro.org / Volume 4 (2) / art:e00077 59

It is generally believed that a common neural pathway, i.e.
DA (dopamine) neurons originating in the VTA (ventral
tegmental area) and terminating on GABAergic MSSNs
(medium-sized spiny neurons) in the NAc is involved in
reward mechanisms. Drugs of abuse, such as opiates, produce
reinforcing effects by modifications of the reward neuronal
circuits. However, converging evidence indicates that the
reinforcing actions involve both DA-dependent and DA-
independent mechanisms (Pettit et al., 1984; Swerdlow et al.,
1984; Hubner and Koob, 1990; Hnasko et al., 2005). Such
findings suggest that, regardless of VTA involvement,
reinforcing effects are mediated, at least in part, by MSSNs
in the NAc.
Although the NAc has been demonstrated to be a critical
component of the reward circuitry in drug abuse, the dorsal
striatum is receiving more attention in addiction research
(Fasano et al., 2009). The traditional dorsal and ventral divide
has been challenged in favour of a dorsolateral-to-ventromedial
gradient of anatomic glutamatergic and DA inputs, as well
GABAergic outputs, with relevance to reinforcing behaviour
(Voorn et al., 2004; Ma et al., 2009). This difference also applies
to the NAc per se, so that there is a dorsolateral (core) to
ventromedial (shell) gradient. Most addiction research has
focused on one of the sub-regions of the striatum, either
the DLS or the NAcC and NAcS. A complete picture of the
effects of opiates, including the three sub-regions following a
dorsolateral-to-ventromedial gradient, is not yet available.
Considering that more than 90% of neurons in the
striatum are MSSNs, and that m-opioid receptors are
primarily involved in opiate reward, it is important to know
which striatal region and cell type (DA D1 or D2 receptor-
containing) play a principal role. EGFP (enhanced green
fluorescent protein) has been used as a reporter gene for
MSSNs expressing DA D1 and D2 receptors, which are mostly
segregated into two populations of cells giving rise to the
direct (D1 cells) and indirect (D2 cells) pathways. These two
MSSN subtypes have distinct patterns of neuronal innerva-
tion, axonal projections and gene expression (Doig et al.,
2010). Electrophysiological and anatomical evidence demon-
strated important differences in morphology as well as
membrane and synaptic properties of each population (Day
et al., 2006, 2008; Cepeda et al., 2008; Gertler et al., 2008;
Andre et al., 2010; Doig et al., 2010; Kravitz et al., 2010).
However, most studies have concentrated on MSSNs of the
dorsal striatum, and only a handful of studies have examined
D1 and D2 MSSNs in ventral striatum (Kitaoka et al., 2007;
Durieux et al., 2009). Although the involvement of D1 and
D2 receptors has been extensively studied pharmacologically,
no studies have been performed to elucidate the potential
role of these two cell subpopulations in the effects of
opiates.
The purpose of the present study was 2-fold; first, to
examine sub-regional and cell-type-specific differences in
membrane and synaptic properties of D1 and D2 receptor-
containing MSSNs in DLS, NAcC and NAcS, and secondly, to
determine the effects of a m-opioid receptor agonist DAMGO
{[D-Ala2-MePhe4-Gly(ol)5]enkephalin}, on neuronal excitabil-
ity and excitatory and inhibitory neurotransmission.
MATERIALS AND METHODS
Experimental procedures were performed in accordance with
the United States Public Health Service Guide for Care and Use
of Laboratory Animals and were approved by the Institutional
Animal Care and Use Committee at the UCLA (University of
California at Los Angeles). Every effort was made to minimize
pain and discomfort, as well as the number of animals.
Experiments were conducted on D1 (n541) and D2 (n544)
EGFP-positive mice older than 28 days (average 42.9¡2.2).
Details of the methodology used to generate EGFP-positive
mice have been published (Gong et al., 2003) and are also
available at the GENSAT web page (www.gensat.org). All mice
used in the present study were heterozygous that had been
back-crossed to the FVB/N background for more than 10
generations and from colonies maintained at UCLA.
Localization of MSSNs in striatal sub-regionsAll the MSSNs included in this study were located within the
striatum, in coronal slices taken from 1.7 to 0 mm anterior to
Bregma (Franklin and Paxinos, 2007). The corpus callosum,
anterior commissure and the Islands of Calleja were used as
landmarks for locating the DLS, the NAcC and the NAcS.
Co-ordinates for recording were as follows: DLS 1.3–0 mm
anterior to Bregma, 200 mm within the dorsolateral arch of
the corpus callosum; NAcC 1.3–0.8 mm anterior to Bregma,
within 200 mm from the edge of the anterior commissure;
NAcS 1.7–1.0 mm anterior to Bregma, ,200–500 mm medial
to the anterior commissure and ,100–800 mm dorsal to the
islands of Calleja (Franklin and Paxinos, 2007).
Cell visualizationEGFP-positive cells were visualized in slices using a 640
water-immersion lens on an Olympus BX50WI microscope
equipped with differential interference contrast optics and
fluorescence. Details for cell visualization have been
described in previous papers (Cepeda et al., 2008; Andre et
al., 2010). Once a viable MSSN in the slice was identified with
IR video microscopy, the filter was switched to fluorescence
mode to determine if it also was labelled with EGFP. The
digitized IR image was superimposed over the fluorescence
image, and electrophysiological recordings proceeded only if
the cell identified with IR light showed a complete overlap
with EGFP fluorescence and was in the same focal plane.
Electrophysiological recordings in slicesWhole-cell patch clamp recordings of D1 or D2 EGFP-positive
MSSNs were performed using methods adapted from those
Y.-Y. Ma and others
60 E 2012 The Author(s) This is an Open Access article distributed under the terms of the Creative Commons Attribution Non-Commercial Licence (http://creativecommons.org/licenses/by-nc/2.5/)which permits unrestricted non-commercial use, distribution and reproduction in any medium, provided the original work is properly cited.

described previously (Cepeda et al., 2008). Cells also were
identified by somatic size, basic membrane properties [Rin
(input resistance), membrane capacitance and time constant],
and by addition of biocytin (0.15%) to the internal solution.
The patch pipette (3–5 MV) contained one of the following
solutions: (i) KGluc (K-gluconate) internal solution: 140 mM
KGluc, 10 mM Hepes, 2 mM MgCl2, 0.1 mM CaCl2, 1.1 mM EGTA
and 2 mM K2ATP, for voltage and current clamp or (ii) CsMeth
(Cs-methanesulfonate) internal solution: 130 mM CsMeth, 10
mM CsCl, 4 mM NaCl, 1 mM MgCl2, 5 mM MgATP, 5 mM EGTA,
10 mM Hepes, 0.5 mM GTP, 10 mM phosphocreatine and 0.1
mM leupeptin, for voltage clamp recordings (pH 7.25–7.3,
osmolality, 280–290 mOsm). Access resistances were ,25 MV.
Spontaneous postsynaptic currents were recorded in standard
ACSF (artificial cerebrospinal fluid) composed of the following:
130 mM NaCl, 26 mM NaHCO3, 3 mM KCl, 2 mM MgCl2, 1.25
mM NaHPO4, 2 mM CaCl2 and 10 mM glucose, pH 7.4
(osmolality, 300 mOsm). In specific experiments, sEPSCs [spon-
taneous EPSCs (excitatory postsynaptic currents)] were recorded
in the presence of the GABAA (c-aminobutyric acid type A)
receptor antagonist, BIC (bicuculline; 20 mM) in the external
solution, and by holding the membrane at 270 mV; sIPSCs
[spontaneous IPSCs (inhibitory postsynaptic currents)] were
recorded in the presence of NMDA (N-methyl-D-aspartate) and
AMPA (a-amino-3-hydroxy-5-methylisoxazole-4-propionic acid)
receptor antagonists AP-5 (DL-2-amino-5-phosphonovaleric acid;
50 mM) and CNQX (6-cyano-7-nitroquinoxaline-2,3-dione;
10 mM), and by holding the membrane at +10 mV. mEPSCs
(miniature EPSCs) and IPSCs were recorded after addition of TTX
(tetrodotoxin; 1 mM).
Recordings with KGluc internal solution
Cells were patched in voltage clamp mode and held at
270 mV. Cell membrane capacitance (in pF) was determined
by applying a depolarizing step voltage command (10 mV)
and using the membrane test function integrated in the
pClamp8 software (Axon Instruments). This function calcu-
lates cell membrane capacitance by dividing the total charge
by the voltage change. Then recordings were switched to
current clamp and other parameters were determined
following published methods (Heng et al., 2008). The RMP
(resting membrane potential) was measured 5 min after the
seal was ruptured. The I–V (current–voltage) relationship,
used to calculate inward rectification at hyperpolarized
membrane potentials, was obtained by injection of 500 ms
pulses (2300 to +50 pA in 50 pA increments). The rheobase
was determined as the minimal current to induce APs (action
potentials) either with a short (3 ms) or a long duration
(500 ms) pulse. The Rin was calculated from the voltage
response to a hyperpolarizing current pulse (2100 pA). The
membrane time constant was measured using Clampfit 8 by
standard exponential fitting of the first 100 ms of the
membrane voltage response to a 2100 pA current pulse
injection. For measurements of a single AP, a threshold was
determined by differentiating the AP waveform and setting a
rising rate of 10 mV/ms as the AP inflection point. The AP
amplitude was measured from the equipotential point of the
threshold to the spike peak, while the AHP (after hyperpolar-
ization) was measured from the equipotential point of the
threshold to the antipeak of the same spike. The AP duration
was measured at the point of half-amplitude of the spike.
Rise time (10–90% from AP threshold-to-peak) and decay
time (90–10% from AP peak-to-threshold) were also
calculated.
Recordings with CsMeth internal solution
After characterizing the basic membrane properties of the
neuron, sEPSCs/IPSCs or mEPSCs/IPSCs were recorded for 3–
6 min. The membrane current was filtered at 1 kHz and
digitized at 200 ms using Clampex. sEPSCs/IPSCs were
analysed off-line using the Mini Analysis Program (Jaejin
Software). The threshold amplitude for the detection of a
synaptic event (generally 6 pA for EPSCs and 10 pA for
IPSCs), was adjusted to be 2–3 times above root mean square
noise level. This software was also used to calculate EPSC
frequency, amplitude for each synaptic event, and to
construct time-frequency and inter-event interval histo-
grams. Frequencies were expressed as number of events per
second (Hz). EPSC/IPSC kinetic analysis used the Mini Analy-
sis Program. For each cell, all events between 10 and 70 pA
for sEPSCs or between 15 and 100 pA for sIPSCs were
averaged to obtain rise and decay times, and half-amplitude
durations.
Single-cell staining, confocal imaging andmorphology measurementsStriatal slices containing biocytin-filled cells were fixed by
immersion in 4% (w/v) paraformaldehyde in 0.1 M phosphate
buffer, pH 7.4, for 2 h. Slices were washed three times for 5,
10 and 60 min respectively in 0.05 M TBST (TBS containing
0.1% Tween 20). Then they were incubated at 4 C overnight
with Alexa FluorH 488-conjugated streptavidin (Invitrogen;
dilution 1:1000 with TBST) and washed with TBST. Images
were obtained with a confocal laser scanning microscope
(SP2 1P-FCS, Leica). Usually the cells were located 50–100 mm
from the slice surface. The somatic area and the number of
the primary/secondary dendrites were counted by a rater
blind to MSSN location or expression of DA receptor subtype.
Cells with less than three primary dendrites or less than one
pair of secondary dendrites were excluded. The somatic area
was calculated using Leica Confocal Software (version 2.61),
by manually outlining the soma.
StatisticsValues in the Figures, Tables and text are presented as
means¡S.E.M. Differences in mean values were assessed with
Student/paired two-tailed t tests (two groups) or appropriate
ANOVAs (multiple groups) followed by multiple comparisons
Effects of DAMGO on D1/D2 striatal MSSNs
E 2012 The Author(s) This is an Open Access article distributed under the terms of the Creative Commons Attribution Non-Commercial Licence (http://creativecommons.org/licenses/by-nc/2.5/)which permits unrestricted non-commerical use, distribution and reproduction in any medium, provided the original work is properly cited.
61

using Bonferroni post hoc tests. Differences between means
were considered statistically significant if P,0.05.
RESULTS
The present study examined the electrophysiological prop-
erties and morphology of DA D1 and D2 receptor-expressing
MSSNs stained with biocytin in striatal slices. Whole-cell
patch clamp recordings from 255 MSSNs labelled with EGFP
(n5122 D1 and n5133 D2) and 30 unlabelled MSSNs (n59
from D1 EGFP mice, putative D2 cells, and n521 from D2
EGFP mice, putative D1 cells) were obtained. Non-labelled
cells in D1 or D2 EGFP mice showed no significant differences
from EGFP-labelled cells in the D2 or D1 EGFP mice re-
spectively. Thus, even though the sample of non-labelled cells
was very small, the data from both labelled and non-labelled
cells were pooled in their respective categories.
Differential properties of striatal D1 and D2MSSNs follow a dorsolateral-to-ventromedialgradientDifferences in morphologyA subset of MSSNs labelled with biocytin (n535) was selected
for detailed morphological analysis based on the quality of
the label and their somatic and dendritic field integrity. A
dorsolateral-to-ventromedial gradient in cell morphology
from the DLS to the NAcC and NAcS was observed
(Figure 1A). Statistically significant differences in somatic
area (F2,29539.33, P,0.0001; post hoc test, P,0.01 NAcS/
NAcC versus DLS) (Figure 1B) and the number of primary
(F2,27521.18, P,0.0001; post hoc test, P,0.05 NAcS/NAcC
versus DLS) (Figure 1C) and secondary (F2,26516.63,
P,0.0001; post hoc test, P,0.05 NAcS versus DLS)
(Figure 1D) dendrites occurred. Thus, the more ventromedial
cells had smaller somatic sizes and fewer dendrites. Although
no cell-type-specific difference in somatic area was observed,
D1 cells displayed more primary (P,0.05 in the DLS, post
hoc test after significant ANOVA) and secondary (P,0.05 in
the DLS and NAcS, post hoc test after significant ANOVA)
dendrites compared with D2 cells in their respective
sub-regions.
Differences in passive membrane properties
Supporting morphological differences, basic membrane
properties using KGluc as the internal solution demonstrated
a clear dorsolateral-to-ventromedial gradient with membrane
capacitance being larger and Rin lower in DLS compared with
VMS (Table 1). In addition to regional differences, the time
constant values measured in current clamp mode were longer
in D1 cells in NAcS compared with NAcC and DLS. In contrast,
D2 cells in the NAcC displayed the longest time constants
compared with either NAcS or DLS (Bonferroni post hoc tests
P,0.05 after a significant two-way ANOVA).
Figure 1 Morphology of MSSNs(A) Confocal images of D1/D2 receptor-expressing MSSNs from the three sub-regions of striatum. Scale bar: 25 mm and applies to allpanels. (B–D) Graphs show the somatic area (B), the number of primary (C) and secondary dendrites (D) per D1/D2 MSSN in thestriatum. n54–6 in each group. In this and other Figures, data are expressed as means¡S.E.M. Data were analysed by two-wayANOVA followed by Bonferroni post hoc test. **P,0.01, ***P,0.001 respectively compared with DLS; #P,0.05, D1 versus D2 cells inthe same sub-region.
Y.-Y. Ma and others
62 E 2012 The Author(s) This is an Open Access article distributed under the terms of the Creative Commons Attribution Non-Commercial Licence (http://creativecommons.org/licenses/by-nc/2.5/)which permits unrestricted non-commercial use, distribution and reproduction in any medium, provided the original work is properly cited.

Differences in active membrane properties and cellularexcitability
In current clamp recordings all striatal MSSNs showed
hyperpolarized RMPs. There were no significant differences
in RMPs except for D2 cells in the NAcC, which were
significantly more depolarized (Table 1). Inward rectification,
which is caused by inwardly rectifying K+ channels, and
typically observed in striatal MSSNs, was more prominent in
VMS than in DLS (Figures 2A and 2B), specifically in D1 cells
of the NAcS. Differences between D1 cells from NAcS and DLS
were statistically significant (ANOVA repeated measures
confirmed by Bonferroni post hoc tests, P,0.05). A rapid,
small amplitude ‘sag’ (similar to the time- and voltage-
dependent rectification induced by Ih), was rarely seen in
MSSNs of DLS, but it became more prominent in MSSNs of
VMS, except for D2 cells in the NAcC (Figure 2A, Table 1).
Finally, the rheobase, which is the minimal current to evoke
APs, showed a significant decrease from DLS to VMS. In
general, D2 cells showed a lower rheobase compared with D1
cells, suggesting D2 cells, especially in the NAc, are more
excitable (Table 1).
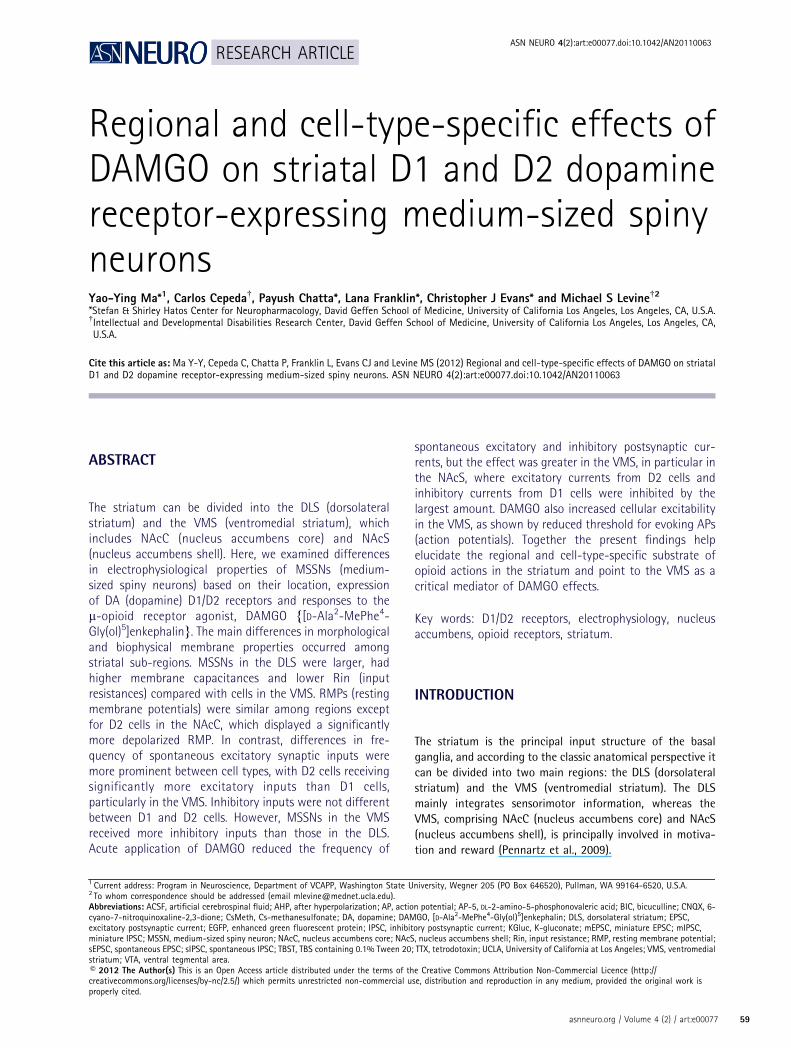
Differences in synaptic properties
sEPSCs were recorded at a holding membrane potential of
270 mV in the presence of BIC (20 mM). D1 cells from the
NAcC/NAcS displayed reduced sEPSC frequency compared
with D1 cells from DLS (Figures 3A and 3B, P,0.0001,
Bonferroni post hoc test after significant differences by two-
way ANOVA). In contrast, there were no differences in the
frequency of D2 cells among sub-regions (Figure 3B). Within
particular regions, there was a clear difference in frequency
Table 1 Basic membrane properties (KGluc internal solution)Data are shown as means¡S.E.M., analysed by two-way ANOVA followed by Bonferroni post hoc test. #P,0.05, ##P,0.01,###P,0.001 respectively D1 versus D2 cells; *P,0.05, **P,0.01, ***P,0.001 respectively compared among striatal sub-regions.
D1 D2
Property DLS NAcC NAcS DLS NAcC NAcS
Cm (pF) 90.1¡6.7 77.6¡8.1 82.3¡4.5 104.1¡7.8 92.1¡8.2 75.1¡6.7*Rin (MV) 76.1¡7 139.4¡20* 176.3¡21.4** 88.2¡15.0 200.7¡41.4 ** 149.5¡8.4Tau (ms) 5.4¡0.6 5.1¡0.5 8.7¡0.6*** 5.2¡0.5 9.2¡1.1***, ### 6.2¡0.3*, #
RMP (mV) 280.6¡2 279.1¡1.1 277.2¡0.7 280.0¡1.2 272.0¡1.5*, ## 279.1¡1.2Ih Amp (mV) 1.2¡0.2 3.5¡0.8*, # 2.9¡0.6* 1.8¡0.4 1.8¡0.2 3.1¡0.4*Rheobase (pA) 928.6¡80 641.7¡83.1** 642.9¡41.4** 762.5¡55.4 460.0¡60*,# 542.9¡56.1
Figure 2 Whole-cell current clamp recordings from striatal MSSNs(A) Sample traces show a gradient of inward rectification evaluated by recording responses to hyperpolarizing current steps: there isan increase from DLS to VMS (note increased voltage deflections below dashed lines in VMS compared with DLS). (B) I–V plots fromgroups of D1 (left panel) or D2 (right panel) receptor-expressing MSSNs, n59–10 in each group. The data were analysed usingANOVA with repeated measures followed by Bonferroni post hoc test. *P,0.05, ***P,0.001 respectively.
Effects of DAMGO on D1/D2 striatal MSSNs
E 2012 The Author(s) This is an Open Access article distributed under the terms of the Creative Commons Attribution Non-Commercial Licence (http://creativecommons.org/licenses/by-nc/2.5/)which permits unrestricted non-commerical use, distribution and reproduction in any medium, provided the original work is properly cited.
63
between D1 and D2 cells from VMS but less so in cells from
DLS (Figures 3C–3E). Thus, the probability of glutamate
release was significantly higher in D2 compared with D1
cells in NAcC/NAcS. A significant effect of D1 versus D2 cells
in the NAcC was reflected by the interaction between cell
type and inter-event intervals (F60,108051.81, P50.0002)
(Figure 3D). Moreover, a clear difference between D1 versus
D2 cells in the NAcS was demonstrated by the effect of sub-
region6cell type interaction (F60,108053.86, P,0.0001), and
Bonferroni post hoc test showed a significantly higher
probability of sEPSCs in D2 cells with intervals from 400 to
900 ms (Figure 3E).
sIPSCs were isolated pharmacologically by adding AP-5 (50
mM) and CNQX (10 mM) to the external solution and by
holding the membrane at +10 mV. The average frequency of
sIPSCs was higher in D1 cells from the NAcC/NAcS compared
with D1 cells from DLS (Figures 4A and 4B, P50.0007, two-
way ANOVA). In addition, D2 cells in the NAcS also displayed
higher frequencies compared with D2 cells in the NAcC
and DLS. However, contrary to the gradient of increased
Figure 3 Regional and cell-type-specific differences in frequency of sEPSCs in MSSNs(A) Representative traces of sEPSCs in D1/D2 cells from each sub-region (holding potential 270 mV). (B) Histograms showthe decreased frequency of sEPSCs as well as increased differences in frequency of sEPSCs between D1 versus D2 cells in the VMS.(C–E) Differences of cumulative inter-event interval probability between D1 versus D2 cells in the DLS, NAcC and NAcS. For(B–E), n510–13 in each group. The data were analysed using two-way ANOVA (B) or ANOVA with repeated measures (C–E) followedby Bonferroni post hoc tests. ***P,0.001, compared with the DLS; #P,0.05, D1 versus D2 cells.
Figure 4 Regional and cell-type-specific differences in frequency of sIPSCs in MSSNs(A) Representative traces of sIPSCs in D1/D2 cells from the DLS, NAcC and NAcS (holding potential +10 mV). (B) Histograms showthe increased frequency of sIPSCs in the VMS compared with the DLS. (C–E) Show inter-event interval cumulative probabilitiesbetween D1 versus D2 cells in the DLS, NAcC and NAcS. For (B–E), n59–11 in each group. The data were analysed using two-wayANOVA (B) or ANOVA with repeated measures (C–E) or followed by Bonferroni post hoc test. *P,0.05, **P,0.01, respectively,compared with the DLS.
Y.-Y. Ma and others
64 E 2012 The Author(s) This is an Open Access article distributed under the terms of the Creative Commons Attribution Non-Commercial Licence (http://creativecommons.org/licenses/by-nc/2.5/)which permits unrestricted non-commercial use, distribution and reproduction in any medium, provided the original work is properly cited.

differences in average sEPSC frequency between D1 and D2
cells from the DLS to the VMS, differences in sIPSC frequency
between D1 and D2 cells in the striatum did not occur
(Figures 4C–4E).
Differences in amplitude of sEPSCs/sIPSCs were not
detected among sub-regions and between D1 versus D2
sub-types of MSSNs (data not shown). Furthermore, after
addition of TTX (1 mM), neither regional nor D1/D2 subtype-
dependent differences in average frequency or amplitude of
mEPSC/mIPSC (miniature inhibitory postsynaptic current)
were observed (data not shown). These findings suggested
all the differences observed in the absence of TTX were AP-
dependent.
Differential effects of DAMGOEffects of DAMGO on excitatory synaptic transmission
The effects of the m-opioid receptor agonist DAMGO (1 mM)
on sEPSCs were evaluated 5–8 min after adding it to the
ACSF and in the presence of BIC (20 mM). The effects of
DAMGO on mEPSCs were determined when Na+ currents were
completely blocked by addition of TTX (1 mM). DAMGO
produced a marked reduction in the frequency of sEPSCs
(Figures 5A and 5B) and mEPSCs in both D1 and D2 cells from
the NAcC/NAcS (at least P,0.05, before versus after DAMGO,
by paired Student’s t tests). The effects in DLS were negligible
except for a significant decrease in the frequency of sEPSCs
in D2 cells. Furthermore, two-way ANOVA demonstrated a
significant sub-regional difference for effects of DAMGO on
the average frequency of EPSCs (F2,5757.75, P50.0011 in
sEPSCs; F2, 22521.84, P,0.0001 in mEPSCs). Bonferroni post
hoc tests showed significantly larger inhibitory effects of
DAMGO on sEPSCs and mEPSCs in D1 cells from the NAcC/
NAcS compared with the DLS. In D2 cells, the inhibitory
effects of DAMGO on sEPSCs in the DLS disappeared after TTX
application, whereas the effects on the NAcC/NAcS still
remained (Figures 5C and 5D). The amplitudes of sEPSCs/
mEPSCs were not modulated by adding DAMGO (data not
shown).
Effects of DAMGO on inhibitory synaptic transmission
The effects of DAMGO on sIPSCs were examined similarly to
those on sEPSCs except AP-5 (50 mM) and CNQX (10 mM)
were present in the ACSF solution. Generally, DAMGO
reduced the frequency of sIPSCs and mIPSCs in both D1
and D2 cells (at least P,0.05, before versus after DAMGO, by
paired Student’s t tests), except for the mIPSCs of D1 cells in
the NAcS and D2 cells in the NAcC (Figures 6A and 6B).
Furthermore, two-way ANOVAs demonstrated significant
sub-regional differences in the effects of DAMGO on the aver-
age frequency of IPSCs (F2,5053.60, P50.0348 in sIPSCs;
F2,2753.95, P50.0312 in mIPSCs), but no significant difference
between D1 versus D2 cells (F1,5051.13, P50.2922 in sIPSCs;
Figure 5 Effects of DAMGO on sEPSCs in MSSNs(A) Representative recordings of sEPSCs (holding potential 270 mV) in a D2 receptor-expressing MSSN from NAcS before, during,and after washout of DAMGO (1 mM). (B) Representative time-course of a typical recording from another D2 receptor-expressingMSSN from NAcS before, during and after DAMGO (1 mM). DAMGO decreased the frequency of sEPSCs, which was reversed afterDAMGO washout. (C, D) Histograms show the effects of DAMGO on sEPSCs (C) and mEPSCs (D) in D1/D2 cells in the DLS, NAcC andNAcS. In (C, D), data were calculated as changes of average frequencies of EPSCs during versus before DAMGO application, divided bythe corresponding values before DAMGO. n510–14 (C) or n55 (D) in each group. The data were analysed using two-way ANOVAsfollowed by Bonferroni post hoc tests. *P,0.05, **P,0.01, ***P,0.0001 compared with the DLS. Also, paired t tests were performedbetween the average frequencies of EPSCs before versus during DAMGO application. #P,0.05, ##P,0.01, ###P,0.001respectively.
Effects of DAMGO on D1/D2 striatal MSSNs
E 2012 The Author(s) This is an Open Access article distributed under the terms of the Creative Commons Attribution Non-Commercial Licence (http://creativecommons.org/licenses/by-nc/2.5/)which permits unrestricted non-commerical use, distribution and reproduction in any medium, provided the original work is properly cited.
65

F1,2750.14, P50.7072 in mIPSCs). Bonferroni post hoc tests
showed a statistically significant increase of inhibitory effects
on sIPSCs of D1, but not D2 cells in the NAcS compared with
the DLS. In contrast, the sub-regional difference among the
inhibitory effects on mIPSCs of D1 cells in the NAcS was
significantly lower than in the DLS and the NAcC (Figures 6C
and 6D). The amplitudes of sIPSCs/mIPSCs were not modulated
by adding DAMGO (data not shown). In contrast, in the
presence of DAMGO, sIPSCs had significantly slower kinetics,
(i.e. increased decay time and half-amplitude duration) in D1
cells from NAcC and NAcS and in D2 cells from DLS and NAcC
(two-way ANOVA followed by Bonferroni post hoc test,
P,0.05 to 0.01).
Effects of DAMGO on cellular excitability
DAMGO induced a small but significant depolarization of D1
cells in the NAcC/NAcS (before versus after DAMGO, t752.711,
P,0.05 in the NAcC; t752.541, P,0.05 in the NAcS), although
no changes in the threshold for APs were detected. In con-
trast, no changes of RMPs in D2 cells were observed (before
versus after DAMGO, t651.082, P.0.05 in the NAcC;
t750.3917, P.0.05 in the NAcS), but the thresholds for AP
generation were significantly more hyperpolarized in D2 cells
(before versus after DAMGO, t554.108, P,0.05 in the NAcC;
t752.747, P,0.05 in the NAcS), indicating increased excit-
ability (Figure 7A, Table 2).
Both D1 and D2 cells in the NAcC/NAcS showed decreased
amplitudes of AHPs (before versus after DAMGO, t652.576,
P,0.05, D1 cells in the NAcC; t555.257, P,0.01, D1 cells in
the NAcS; t553.013, P,0.05, D2 cells in the NAcC), except
for D2 cells in the NAcS (before versus after DAMGO,
t751.230, P.0.05) (Figure 7B). Furthermore, the rheobase of
D1 cells in the NAcS also was significantly decreased (before
versus after DAMGO, t652.739, P,0.05) (Figure 7C). This
evidence supports the general excitatory effects of DAMGO
on intrinsic excitability of D1 and D2 MSSNs in the NAcC/
NAcS (Table 2).
However, the effects of DAMGO on cellular excitability of
D1 and D2 MSSNs in the DLS were not consistently changed
based on assessment of different measures (summarized
in Table 2). DAMGO increased Rin in D1 cells from DLS
(Figure 8A, before versus after DAMGO, t752.608, P,0.05),
but a rightward shift of the current–response curve was seen
after DAMGO treatment and the number of spikes induced by
400–500 pA current steps was reduced significantly
(Figures 8B and 8C, P,0.05 at least, Bonferroni post hoc
tests after significant two-way ANOVA with repeated
measures). This indicates that the decrease in the number
of spikes is not due to a reduction in Rin as an increase in this
measure would predict more excitability, not less. Thus,
DAMGO could be modulating different ionic conductances,
e.g. Na+, K+ and Ca2+, to decrease the number of spikes. A
rightward shift of the current–response curve (P,0.05,
before versus after DAMGO, significant ANOVA with repeated
measures) and increased rheobase of D2 cells in the DLS
indicated inhibitory effects of DAMGO, whereas the
decreased amplitude of the AHP (before versus after
DAMGO, t553.207, P,0.05) suggested a probable increase
in cellular excitability of D2 cells in the DLS (Figure 7B).
Figure 6 Effects of DAMGO on sIPSCs in MSSNs(A) Representative traces of sIPSCs (holding potential +10 mV) in a D1 receptor-expressing MSSN from NAcS before, during and afterwashout of DAMGO (1 mM). (B) Typical time-course of a representative recording from another D1 receptor-expressing MSSN fromNAcS before, during and after DAMGO (1 mM). DAMGO decreased the frequency of sIPSCs, which recovered after DAMGO washout.Histograms in (C, D) show the effects of DAMGO on sIPSCs (C) and mIPSCs (D) in D1/D2 cells in the striatum. In (C, D), data werecalculated as described in Figure 5. n58–10 (C) or n55 (D) in each group. The data were analysed using two-way ANOVAs followedby Bonferroni post hoc tests. *P,0.05, **P,0.01 respectively compared with the DLS or NAcC. Also, paired t tests were performedbetween the average frequencies of IPSCs before versus after DAMGO. #P,0.05, ##P,0.01 respectively.
Y.-Y. Ma and others
66 E 2012 The Author(s) This is an Open Access article distributed under the terms of the Creative Commons Attribution Non-Commercial Licence (http://creativecommons.org/licenses/by-nc/2.5/)which permits unrestricted non-commercial use, distribution and reproduction in any medium, provided the original work is properly cited.

In current clamp mode (KGluc internal solution), effects of
DAMGO on the kinetics of APs were observed only in the
NAcC/NAcS, but not in the DLS; decay time, along with half-
amplitude duration of APs of D1 cells in the NAcC/NAcS were
prolonged, whereas in D2 cells they were shortened
significantly (data not shown).
DISCUSSION
The present study is the first systematic comparison of D1 and
D2 cells in different sub-regions of the striatum. The main
findings are that the morphology, basic membrane and
Figure 7 Effects of DAMGO on the intrinsic excitability of MSSNs in the NAcC/NAcS(A) Representative traces (left panel) show that DAMGO decreased the AP threshold of D2 cells in NAcS. Effects of DAMGO on APthreshold of D1/D2 cells in the striatum are shown in the histograms (right panel). (B) Representative traces show that DAMGOdecreased AHP amplitude of D1 cells in the NAcS. Effects of DAMGO on AHP amplitude of D1/D2 cells in the striatum are shown inthe histograms. (C) Representative traces show that DAMGO decreased the rheobase of D1 cells in NAcS. Effects of DAMGO onrheobase of D1/D2 cells in the striatum are shown in the histograms. n55–7 cells in each group. Data were calculated by changes ofthe value before versus during DAMGO application, divided by the corresponding values before DAMGO; analysed by two-wayANOVAs followed by Bonferroni post hoc tests, *P,0.05, **P,0.01, compared with the DLS. Also, paired t tests were performedbetween the average frequencies of IPSCs before versus during DAMGO in (C, D); #P,0.05, ##P,0.01, respectively.
Table 2 Effects of DAMGO on intrinsic cellular excitabilityData are shown as means¡S.E.M., analysed by paired t tests. *P,0.05, **P,0.01 respectively before versus after DAMGO.
D1 D2
Measurement Region Control DAMGO Control DAMGO
RMP (mV) DLS 280.6¡2.0 280.3¡2.6 280.0¡1.2 280.1¡2.4NAcC 279.1¡1.1 276.0¡1.7* 272.0¡1.5 274.3¡1.6NAcS 277.2¡0.7 265.3¡4.8* 279.1¡1.2 278.6¡2.2
AP Thr (mV) DLS 239.8¡1.8 240.7¡1.9 241.3¡1.1 243.6¡2.5NAcC 233.5¡2.8 233.3¡4.4 240.1¡0.5 245.6¡1.4*NAcS 235.0¡1.0 235.1¡1.7 236.7¡1.3 238.4¡0.9*
AHP Amp (mV) DLS 29.2¡1.0 28.9¡0.7 210.3¡0.9 28.4¡0.5*NAcC 210.6¡1.1 28.5¡1.2* 210.4¡1.0 28.3¡0.7*NAcS 211.0¡1.4 29.3¡1.3** 29.5¡0.8 29.0¡0.9
Rheobase (pA) DLS 928.6¡80.0 885.7¡103.3 762.5¡55.4 825.0¡52.0*NAcC 641.7¡83.1 610.0¡108.9 460.0¡60.0 430.0¡102.0NAcS 642.9¡41.4 370.0¡34.1* 542.9¡56.1 578.6¡68.0
Effects of DAMGO on D1/D2 striatal MSSNs
E 2012 The Author(s) This is an Open Access article distributed under the terms of the Creative Commons Attribution Non-Commercial Licence (http://creativecommons.org/licenses/by-nc/2.5/)which permits unrestricted non-commerical use, distribution and reproduction in any medium, provided the original work is properly cited.
67

synaptic properties of MSSNs are differential according to a
dorsolateral-to-ventromedial gradient and that the effects of
the m-opioid agonist DAMGO are more pronounced in the
VMS, providing evidence that this region is the more likely
anatomical substrate for the addictive properties of opiates.
Differential electrophysiological properties ofstriatal MSSNsIn terms of biophysical membrane properties, the present
findings demonstrated a significant sub-regional gradient
from DLS to NAcC and NAcS, whereby the cell capacitance
decreased and the Rin increased, consistent with morpho-
logical findings that somatic size and the number of primary/
secondary dendrites of MSSNs decreases from DLS to VMS.
In addition, and probably as a consequence of increased
Rin, MSSNs in the VMS displayed increased inward and
time-dependent rectification, whereas the rheobase was re-
duced, suggesting higher tonic intrinsic excitability of MSSNs
in the VMS compared with the DLS. The demonstration of
regional differences in neuronal excitability between DLS and
VMS represented by differences in Rin and rheobase, suggests
that excitatory inputs to the VMS will lead to cell firing more
readily than in the DLS. In agreement, previous studies
comparing Rin of MSSNs from NAc and dorsal striatum found
that the Rin of NAcS neurons were much higher and they
fired more frequently than those in the dorsal striatum (Hopf
et al., 2010).
Differences in basic membrane properties between D1 and
D2 receptor-expressing MSSNs within each sub-region were
more subtle than between sub-regions. Previous studies
comparing basic electrophysiological properties of D1 and D2
cells in DLS have been contradictory. While some studies did
not find significant differences between D1 and D2 cells
(Cepeda et al., 2008; Flores-Barrera et al., 2010), others
reported significantly more depolarized cell RMPs and higher
Rin in D2 cells (Gertler et al., 2008). The reason for this
discrepancy could be related to variations in recording sites
and the dorsolateral-to-ventromedial gradient demonstrated
in the present study. Nevertheless, differences occurred
particularly in the VMS. The observation that D2 cells in the
NAcC have the lowest rheobase, in conjunction with more
depolarized RMPs, makes these cells the most excitable of the
entire striatum and probably the most susceptible to changes
induced by rewarding stimulation.
In terms of synaptic inputs, significant differences between
D1 versus D2 cells were found, but these differences were
more pronounced for sEPSCs in the VMS. Thus, in the DLS, D1
and D2 cells displayed similar frequency of sEPSCs, while in
VMS D1 cells received significantly less excitatory inputs than
D2 cells (more so in NAcS than in NAcC). This suggests
reduced excitatory connections, possibly derived from cortical
regions, on to D1 cells. Previous studies on differences in
synaptic inputs between D1 and D2 cells in the DLS have been
inconclusive, with studies finding no differences (Day et al.,
2008), to studies finding significant differences (Cepeda
et al., 2008; Kreitzer and Malenka, 2008; Andre et al., 2010,
2011). Several factors could explain this discrepancy,
including, among others, age of mice, recording site, sample
size and presence or absence of TTX. More importantly, as the
present study shows, synaptic activity levels follow a
dorsolateral-to-ventromedial gradient, i.e. synaptic differ-
ences are more marked in VMS, particularly in NAcS.
The DLS receives glutamatergic inputs from sensorimotor
cortex, dorsal anterior cingulate cortex and dorsal prelim-
bic cortex, while the VMS is innervated by the ventral
prelimbic and the infralimbic cortices. Considering that the
regional and cell-type-specific differences of excitatory
inputs disappeared when TTX was added, firing from
presynaptic glutamatergic terminals is likely responsible for
these differences. Why D1 cells in the VMS appear to receive
less excitatory inputs remains to be elucidated, but it could
mean that cortical pyramidal neurons projecting to the VMS
Figure 8 Effects of DAMGO on the intrinsic excitability of MSSNs in theDLS(A) Representative traces and histograms show that DAMGO increased themembrane Rin of D1 cells in DLS, recorded in current clamp mode andcalculated from the voltage response to a hyperpolarizing current pulse(2100 pA). (B) Representative traces show that DAMGO decreased firing of aD1 MSSNs in DLS; (C) DAMGO caused a rightward shift in the current–response curve of D1 and D2 MSSNs in DLS. n57 in each group. Data areexpressed as means¡S.E.M., and analysed using ANOVA with repeatedmeasures (A) and paired t test (B); *P,0.05, **P,0.01, ***P,0.001respectively compared with the control value before DAMGO application.
Y.-Y. Ma and others
68 E 2012 The Author(s) This is an Open Access article distributed under the terms of the Creative Commons Attribution Non-Commercial Licence (http://creativecommons.org/licenses/by-nc/2.5/)which permits unrestricted non-commercial use, distribution and reproduction in any medium, provided the original work is properly cited.

fire less than those projecting to the DLS. Alternatively, inputs
to the VMS could be subjected to increased regulation by
presynaptic D1 receptors (Pennartz et al., 1992).
In contrast, sIPSC frequency was increased in VMS. These
differences were AP-dependent, as addition of TTX abolished
the differences. Furthermore, we also found that these
differences were cell-type-specific, so that D1 cells from the
NAcC/NAcS and D2 cells in the NAcS had increased fre-
quencies of sIPSCs compared with D1 and D2 cells in the DLS
respectively. In contrast with sEPSCs, the source of inhibitory
inputs is only from local circuits, including the collateral
connections between striatal MSSNs and synaptic connec-
tions from GABAergic interneurons (Taverna et al., 2008). Our
data suggest a higher firing rate of interneurons in the VMS,
compounded with increased intrinsic excitability of MSSNs.
However, the contribution of collateral connections between
MSSNs to the increased sIPSCs in the VMS cannot be ruled
out. Moreover, the fact that more sIPSCs were observed in
the VMS compared with DLS could be associated with the
suggestion of increased connectivity of cortical pyramidal
neurons with fast-spiking interneurons in the VMS, which are
principally entrained by high frequency oscillations in the
piriform cortex, particularly after rewards (Berke, 2009).
Effects of DAMGOIn the present study, DAMGO produced differential effects on
synaptic activity and intrinsic excitability, and these effects
were more pronounced in VMS compared with DLS. One
possibility is that sub-regional differences are related to the
relative density of m-opioid receptors throughout the stri-
atum. The patch compartment is identified by high density
of m-opioid receptors as well as enriched enkephalin and
substance P (Pert et al., 1976), while the matrix compartment
has high acetylcholinesterase density but is low in m-opioid
receptors (Graybiel et al., 1981). This compartmental
organization in the striatum is supported by strong evidence
in the DLS (Gerfen, 1984) and the NAcC in rodents (Jongen-
Relo et al., 1993), but it has been difficult to extend this
regional gradient to the organization of the NAcS (Jongen-
Relo et al., 1993). A higher density of patches in the
anteromedial compared with the posterolateral caudoputa-
men was shown in a series of in vitro superfusion studies
demonstrating that these regions in the rat differed in their
sensitivities to the inhibitory regulation of opioid receptor
ligands (Krebs et al., 1991, 1993, 1994). Another study
provided evidence that the patches around the anterior
commissure were enriched and larger compared with those in
the DLS (Jongen-Relo et al., 1993).
Considering the general dorsolateral-to-ventromedial gra-
dient (Voorn et al., 2004), we hypothesized that the
distribution of m-opioid receptors, used to identify the patch
compartment, followed such a gradient in the entire striatum.
This was supported by the present data demonstrating that
the effects of DAMGO on both sEPSCs and sIPSCs were
significantly greater in VMS than in DLS. The present study
has the limitation that we did not identify MSSNs located in
the patch versus the matrix compartments. However, a study
found that although corticostriatal EPSCs were inhibited by
m-opioid receptors to a similar extent in the two compart-
ments, inhibition of IPSCs by m-opioid receptor activation was
observed only in the patch compartment (Miura et al., 2007).
Our study demonstrated general inhibitory effects of
DAMGO on both sEPSCs and sIPSCs, similar to previous
studies demonstrating that both DA and the psychostimulant
amphetamine, depress both excitatory and inhibitory synaptic
transmission of MSSNs in the striatum, especially in the
NAcC/NAcS (Nicola et al., 1996; Nicola and Malenka, 1997).
Thus, we can hypothesize that inhibition of both excitatory
and inhibitory synaptic activity is required to modify
information processing by striatal MSSNs as a common
response to drugs of abuse (Johnson et al., 1983; Rolls et al.,
1984).
Negative regulation of both excitatory and inhibitory
inputs, with a few exceptions, appeared to be mainly pre-
synaptic as changes of frequency persisted after TTX, and
kinetics, for the most part, were unchanged. In contrast,
DAMGO increased intrinsic excitability of MSSNs. Both
effects were stronger in VMS compared with DLS. Inhibition
of synaptic inputs and increased intrinsic excitability of
striatal MSSNs by activation of m-opioid receptors could
increase the signal-to-noise ratio in output neurons from the
NAcC/NAcS in the striatum and affect information proces-
sing. Removal of inhibition could also facilitate increased
output from VMS. Thus, acute opioid treatment could
generate an integrated output in striatal MSSNs by dual
inhibition of spontaneous excitatory and inhibitory synaptic
transmissions and increased output.
More studies will be necessary to determine the exact roles
of D1 and D2 receptor-expressing neurons in addiction
behaviour (Lobo and Nestler, 2011). The present study
implicates both cell types in opioid effects, as D1 and D2
cells showed increases in intrinsic excitability in VMS.
However, the consequences of these changes on target
output nuclei are more difficult to predict. Recent studies
using selective ablation of D2 cells in the VMS showed that
lack of D2 cells increased amphetamine-induced conditioned
place preference. Thus, D2 striatopallidal neurons appear to
limit drug reinforcement (Durieux et al., 2009). By extension,
it can be suggested that D1 cells facilitate drug reinforcement
and addiction (Lee et al., 2006), similar to the general plan of
motor behaviour regulation by the DLS.
ACKNOWLEDGEMENTS
We thank Donna Crandall for help with the illustrations.
FUNDING
This work was supported by the USPHS (United States Public
Health Service) [grant numbers NS33538 (to M.S.L.) and
DA005010] and The Shirley and Stefan Hatos Foundation (to
C.J.E.).
Effects of DAMGO on D1/D2 striatal MSSNs
E 2012 The Author(s) This is an Open Access article distributed under the terms of the Creative Commons Attribution Non-Commercial Licence (http://creativecommons.org/licenses/by-nc/2.5/)which permits unrestricted non-commerical use, distribution and reproduction in any medium, provided the original work is properly cited.
69

REFERENCES
Andre VM, Cepeda C, Cummings DM, Jocoy EL, Fisher YE, William Yang X,Levine MS (2010) Dopamine modulation of excitatory currents in thestriatum is dictated by the expression of D1 or D2 receptors and modifiedby endocannabinoids. Eur J Neurosci 31:14–28.
Andre VM, Cepeda C, Fisher YE, Huynh M, Bardakjian N, Singh S, Yang XW,Levine MS (2011) Differential electrophysiological changes in striataloutput neurons in Huntington’s disease. J Neurosci 31:1170–1182.
Berke JD (2009) Fast oscillations in cortical-striatal networks switchfrequency following rewarding events and stimulant drugs. Eur JNeurosci 30:848–859.
Cepeda C, Andre VM, Yamazaki I, Wu N, Kleiman-Weiner M, Levine MS (2008)Differential electrophysiological properties of dopamine D1 and D2receptor-containing striatal medium-sized spiny neurons. Eur J Neurosci27:671–682.
Day M, Wang Z, Ding J, An X, Ingham CA, Shering AF, Wokosin D, Ilijic E, SunZ, Sampson AR, Mugnaini E, Deutch AY, Sesack SR, Arbuthnott GW,Surmeier DJ (2006) Selective elimination of glutamatergic synapses onstriatopallidal neurons in Parkinson disease models. Nat Neurosci 9:251–259.
Day M, Wokosin D, Plotkin JL, Tian X, Surmeier DJ (2008) Differentialexcitability and modulation of striatal medium spiny neuron dendrites.J Neurosci 28:11603–11614.
Doig NM, Moss J, Bolam JP (2010) Cortical and thalamic innervation of directand indirect pathway medium-sized spiny neurons in mouse striatum.J Neurosci 30:14610–14618.
Durieux PF, Bearzatto B, Guiducci S, Buch T, Waisman A, Zoli M, SchiffmannSN, de Kerchove d’Exaerde A (2009) D2R striatopallidal neurons inhibitboth locomotor and drug reward processes. Nat Neurosci 12:393–395.
Fasano S, Pittenger C, Brambilla R (2009) Inhibition of CREB activity in thedorsal portion of the striatum potentiates behavioral responses to drugsof abuse. Front Behav Neurosci 3:29.
Flores-Barrera E, Vizcarra-Chacon BJ, Tapia D, Bargas J, Galarraga E (2010)Different corticostriatal integration in spiny projection neurons fromdirect and indirect pathways. Front Syst Neurosci 4:15.
Franklin KBJ, Paxinos G (2007) The Mouse Brain in Stereotaxic Coordinates,3rd edn, Academic Press.
Gerfen CR (1984) The neostriatal mosaic: compartmentalization ofcorticostriatal input and striatonigral output systems. Nature 311:461–464.
Gertler TS, Chan CS, Surmeier DJ (2008) Dichotomous anatomical propertiesof adult striatal medium spiny neurons. J Neurosci 28:10814–10824.
Gong S, Zheng C, Doughty ML, Losos K, Didkovsky N, Schambra UB, Nowak NJ,Joyner A, Leblanc G, Hatten ME, Heintz N (2003) A gene expression atlasof the central nervous system based on bacterial artificial chromosomes.Nature 425:917–925.
Graybiel AM, Ragsdale CW Jr, Yoneoka ES, Elde RP (1981) An immunohisto-chemical study of enkephalins and other neuropeptides in the striatum ofthe cat with evidence that the opiate peptides are arranged to formmosaic patterns in register with the striosomal compartments visible byacetylcholinesterase staining. Neuroscience 6:377–397.
Heng LJ, Yang J, Liu YH, Wang WT, Hu SJ, Gao GD (2008) Repeated morphineexposure decreased the nucleus accumbens excitability during short-term withdrawal. Synapse 62:775–782.
Hnasko TS, Sotak BN, Palmiter RD (2005) Morphine reward in dopamine-deficient mice. Nature 438:854–857.
Hopf FW, Seif T, Mohamedi ML, Chen BT, Bonci A (2010) The small-conductance calcium-activated potassium channel is a key modulator offiring and long-term depression in the dorsal striatum. Eur J Neurosci31:1946–1959.
Hubner CB, Koob GF (1990) The ventral pallidum plays a role in mediatingcocaine and heroin self-administration in the rat. Brain Res 508:20–29.
Johnson SW, Palmer MR, Freedman R (1983) Effects of dopamine onspontaneous and evoked activity of caudate neurons. Neuropharmacology22:843–851.
Jongen-Relo AL, Groenewegen HJ, Voorn P (1993) Evidence for a multi-compartmental histochemical organization of the nucleus accumbens inthe rat. J Comp Neurol 337:267–276.
Kitaoka S, Furuyashiki T, Nishi A, Shuto T, Koyasu S, Matsuoka T, Miyasaka M,Greengard P, Narumiya S (2007) Prostaglandin E2 acts on EP1 receptorand amplifies both dopamine D1 and D2 receptor signaling in thestriatum. J Neurosci 27:12900–12907.
Kravitz AV, Freeze BS, Parker PR, Kay K, Thwin MT, Deisseroth K, Kreitzer AC(2010) Regulation of Parkinsonian motor behaviours by optogeneticcontrol of basal ganglia circuitry. Nature 466:622–626.
Krebs MO, Trovero F, Desban M, Gauchy C, Glowinski J, Kemel ML (1991)Distinct presynaptic regulation of dopamine release through NMDAreceptors in striosome- and matrix-enriched areas of the rat striatum.J Neurosci 11:1256–1262.
Krebs MO, Kemel ML, Gauchy C, Desban M, Glowinski J (1993) LocalGABAergic regulation of the N-methyl-d-aspartate-evoked release ofdopamine is more prominent in striosomes than in matrix of the ratstriatum. Neuroscience 57:249–260.
Krebs MO, Gauchy C, Desban M, Glowinski J, Kemel ML (1994) Role ofdynorphin and GABA in the inhibitory regulation of NMDA-induceddopamine release in striosome- and matrix-enriched areas of the ratstriatum. J Neurosci 14:2435–2443.
Kreitzer AC, Malenka RC (2008) Striatal plasticity and basal ganglia circuitfunction. Neuron 60:543–554.
Lee KW, Kim Y, Kim AM, Helmin K, Nairn AC, Greengard P (2006) Cocaine-induced dendritic spine formation in D1 and D2 dopamine receptor-containing medium spiny neurons in nucleus accumbens. Proc Natl AcadSci USA 103:3399–3404.
Lobo MK, Nestler EJ (2011) The striatal balancing act in drug addiction:distinct roles of direct and indirect pathway medium spiny neurons. FrontNeuroanat 5:41.
Ma YY, Cepeda C, Cui CL (2009) The role of striatal NMDA receptors in drugaddiction. Int Rev Neurobiol 89:131–146.
Miura M, Saino-Saito S, Masuda M, Kobayashi K, Aosaki T (2007)Compartment-specific modulation of GABAergic synaptic transmissionby m-opioid receptor in the mouse striatum with green fluorescentprotein-expressing dopamine islands. J Neurosci 27:9721–9728.
Nicola SM, Malenka RC (1997) Dopamine depresses excitatory and inhibitorysynaptic transmission by distinct mechanisms in the nucleus accumbens.J Neurosci 17:5697–5710.
Nicola SM, Kombian SB, Malenka RC (1996) Psychostimulants depressexcitatory synaptic transmission in the nucleus accumbens viapresynaptic D1-like dopamine receptors. J Neurosci 16:1591–1604.
Pennartz CM, Dolleman-Van der Weel MJ, Kitai ST, Lopes da Silva FH (1992)Presynaptic dopamine D1 receptors attenuate excitatory and inhibitorylimbic inputs to the shell region of the rat nucleus accumbens studied invitro. J Neurophysiol 67:1325–1334.
Pennartz CM, Berke JD, Graybiel AM, Ito R, Lansink CS, van der Meer M,Redish AD, Smith KS, Voorn P (2009) Corticostriatal interactions duringlearning, memory processing, and decision making. J Neurosci 29:12831–12838.
Pert CB, Kuhar MJ, Snyder SH (1976) Opiate receptor: autoradiographiclocalization in rat brain. Proc Natl Acad Sci USA 73:3729–3733.
Pettit HO, Ettenberg A, Bloom FE, Koob GF (1984) Destruction of dopamine inthe nucleus accumbens selectively attenuates cocaine but not heroinself-administration in rats. Psychopharmacology (Berl) 84:167–173.
Rolls ET, Thorpe SJ, Boytim M, Szabo I, Perrett DI (1984) Responses of striatalneurons in the behaving monkey. 3. Effects of iontophoretically applieddopamine on normal responsiveness. Neuroscience 12:1201–1212.
Swerdlow NR, Swanson LW, Koob GF (1984) Electrolytic lesions of thesubstantia innominata and lateral preoptic area attenuate the ‘super-sensitive’ locomotor response to apomorphine resulting from denervationof the nucleus accumbens. Brain Res 306:141–148.
Taverna S, Ilijic E, Surmeier DJ (2008) Recurrent collateral connections ofstriatal medium spiny neurons are disrupted in models of Parkinson’sdisease. J Neurosci 28:5504–5512.
Voorn P, Vanderschuren LJ, Groenewegen HJ, Robbins TW, Pennartz CM(2004) Putting a spin on the dorsal-ventral divide of the striatum. TrendsNeurosci 27:468–474.
Received 13 December 2011/accepted 24 January 2012
Published as Immediate Publication 25 January 2012, doi 10.1042/AN20110063
Y.-Y. Ma and others
70 E 2012 The Author(s) This is an Open Access article distributed under the terms of the Creative Commons Attribution Non-Commercial Licence (http://creativecommons.org/licenses/by-nc/2.5/)which permits unrestricted non-commercial use, distribution and reproduction in any medium, provided the original work is properly cited.
Related Documents


![[18F]Fluorodopa PETshows striatal dopaminergic dysfunction ...](https://static.cupdf.com/doc/110x72/628e71a806be7c7a267428b6/18ffluorodopa-petshows-striatal-dopaminergic-dysfunction-.jpg)