Regime shifts and heterogeneous trends in malaria time series from Western Kenya Highlands LUIS FERNANDO CHAVES 1,2 *, MASAHIRO HASHIZUME 3 , AKIKO SATAKE 1 and NOBORU MINAKAWA 3 1 Graduate School of Environmental Sciences and Global Center of Excellence Program on Integrated Field Environmental Science, Hokkaido University, Sapporo, Japan 2 Programa de Investigación en Enfermedades Tropicales, Escuela de Medicina Veterinaria, Universidad Nacional, Heredia, Costa Rica 3 Institute of Tropical Medicine (NEKKEN) and Global Center of Excellence Program on Tropical and Emergent Infectious Diseases, Nagasaki University, Nagasaki, Japan (Received 4 May 2011; revised 2 June and 18 August 2011; accepted 25 August 2011; first published online 14 October 2011) SUMMARY Large malaria epidemics in the East African highlands during the mid and late 1990s kindled a stream of research on the role that global warming might have on malaria transmission. Most of the inferences using temporal information have been derived from a malaria incidence time series from Kericho. Here, we report a detailed analysis of 5 monthly time series, between 15 and 41 years long, from West Kenya encompassing an altitudinal gradient along Lake Victoria basin. We found decreasing, but heterogeneous, malaria trends since the late 1980s at low altitudes (< 1600 m), and the early 2000s at high altitudes (>1600 m). Regime shifts were present in 3 of the series and were synchronous in the 2 time series from high altitudes. At low altitude, regime shifts were associated with a shift from increasing to decreasing malaria transmission, as well as a decrease in variability. At higher altitudes, regime shifts reflected an increase in malaria transmission variability. The heterogeneity in malaria trends probably reflects the multitude of factors that can drive malaria transmission and highlights the need for both spatially and temporally fine-grained data to make sound inferences about the impacts of climate change and control/elimination interventions on malaria transmission. Key words: time series, breakpoint, Plasmodium, Kericho, Kapsabet, Kisii, Kisumu, Maseno, Kendu Bay, climate change, seasonal autoregressive. INTRODUCTION Large malaria epidemics in the East African high- lands during the mid and late 1990s triggered a number of inquiries into the role that global warming might have on malaria transmission. Several authors proposed that spread of malaria into areas that rarely saw malaria transmission could be related to the impacts that small increases in temperature have on Plasmodium spp. development inside vectors (Lindsay and Birley, 1996; Patz and Olson, 2006). Traditionally considered a ‘malaria-free’ oasis inside a desert of high malaria transmission, the East African highlands are of special interest because of their geographical location (Lindsay and Martens, 1998). In particular, the role that climate change could have played on exacerbated malaria records in this area over recent years has been the focus of intensive research and debate (Chaves and Koenraadt, 2010). Studies from highland areas in Ethiopia, Tanzania, Kenya and Uganda have robustly shown signatures of climatic covariates on malaria time series (Abeku et al. 2004; Chaves and Koenraadt, 2010; Teklehaimanot et al. 2004; Zhou et al. 2004). A great deal of attention has been given to whether oscillations in the time series were intrinsically generated i.e., by the cyclic nature of immunity in growing populations (Hay et al. 2000), or were induced by exogenous factors (Pascual et al. 2008; Childs and Boots, 2010) and drug resistance (Artzy- Randrup et al. 2010). In addition, some studies have claimed to show that trends in temperature have driven the surge observed in transmission over recent years (Alonso et al. 2011). However, little attention has been given to the homogeneity/heterogeneity in transmission trends across the East African high- lands, especially as revealed by time series analysis. In fact, most time series analyses have been exclusively focused on a time series from Kericho in Kenya (Hay et al. 2000; Hay et al. 2002a; Shanks et al. 2000, 2002, 2005; Pascual et al. 2008; Artzy-Randrup et al. 2010; Childs and Boots, 2010; Alonso et al. 2011). Several cross-sectional studies that examined transmission patterns across altitudinal gradients in the East African highlands reported an overall decrease in * Corresponding author: Graduate School of Environmental Sciences, Hokkaido University, Suite A701, Kita-10, Nishi-5, Kita-Ku, Sapporo, Hokkai-do, 060-0810 Japan. Tel: + 81 11 706 2267. Fax: + 81 11 706 4954. E-mail: [email protected] 14 Parasitology (2012), 139, 14–25. © Cambridge University Press 2011. The online version of this article is published within an Open Access environment subject to the conditions of the Creative Commons Attribution-NonCommercial-ShareAlike licence <http://creativecommons. org/licenses/by-nc-sa/2.5/ >. The written permission of Cambridge University Press must be obtained for commercial re-use. doi:10.1017/S0031182011001685

Welcome message from author
This document is posted to help you gain knowledge. Please leave a comment to let me know what you think about it! Share it to your friends and learn new things together.
Transcript
Regime shifts and heterogeneous trends in malaria time seriesfrom Western Kenya Highlands
LUIS FERNANDO CHAVES1,2*, MASAHIRO HASHIZUME3, AKIKO SATAKE1
and NOBORU MINAKAWA3
1Graduate School of Environmental Sciences and Global Center of Excellence Program on Integrated Field EnvironmentalScience, Hokkaido University, Sapporo, Japan2Programa de Investigación en Enfermedades Tropicales, Escuela de Medicina Veterinaria, Universidad Nacional, Heredia,Costa Rica3Institute of Tropical Medicine (NEKKEN) and Global Center of Excellence Program on Tropical and Emergent InfectiousDiseases, Nagasaki University, Nagasaki, Japan
(Received 4 May 2011; revised 2 June and 18 August 2011; accepted 25 August 2011; first published online 14 October 2011)
SUMMARY
Largemalaria epidemics in the East African highlands during themid and late 1990s kindled a stream of research on the rolethat global warming might have on malaria transmission. Most of the inferences using temporal information have beenderived from a malaria incidence time series from Kericho. Here, we report a detailed analysis of 5 monthly time series,between 15 and 41 years long, fromWest Kenya encompassing an altitudinal gradient along Lake Victoria basin. We founddecreasing, but heterogeneous, malaria trends since the late 1980s at low altitudes (<1600m), and the early 2000s at highaltitudes (>1600m). Regime shifts were present in 3 of the series and were synchronous in the 2 time series from highaltitudes. At low altitude, regime shifts were associated with a shift from increasing to decreasing malaria transmission, aswell as a decrease in variability. At higher altitudes, regime shifts reflected an increase in malaria transmission variability.The heterogeneity in malaria trends probably reflects the multitude of factors that can drive malaria transmission andhighlights the need for both spatially and temporally fine-grained data tomake sound inferences about the impacts of climatechange and control/elimination interventions on malaria transmission.
Key words: time series, breakpoint, Plasmodium, Kericho, Kapsabet, Kisii, Kisumu, Maseno, Kendu Bay, climate change,seasonal autoregressive.
INTRODUCTION
Large malaria epidemics in the East African high-lands during the mid and late 1990s triggered anumber of inquiries into the role that global warmingmight have on malaria transmission. Several authorsproposed that spread of malaria into areas that rarelysaw malaria transmission could be related to theimpacts that small increases in temperature haveon Plasmodium spp. development inside vectors(Lindsay and Birley, 1996; Patz and Olson, 2006).Traditionally considered a ‘malaria-free’ oasis insidea desert of high malaria transmission, the EastAfrican highlands are of special interest because oftheir geographical location (Lindsay and Martens,1998). In particular, the role that climate changecould have played on exacerbated malaria recordsin this area over recent years has been thefocus of intensive research and debate (Chaves andKoenraadt, 2010).
Studies from highland areas in Ethiopia, Tanzania,Kenya and Uganda have robustly shown signaturesof climatic covariates on malaria time series (Abekuet al. 2004; Chaves and Koenraadt, 2010;Teklehaimanot et al. 2004; Zhou et al. 2004). Agreat deal of attention has been given to whetheroscillations in the time series were intrinsicallygenerated i.e., by the cyclic nature of immunity ingrowing populations (Hay et al. 2000), or wereinduced by exogenous factors (Pascual et al. 2008;Childs and Boots, 2010) and drug resistance (Artzy-Randrup et al. 2010). In addition, some studies haveclaimed to show that trends in temperature havedriven the surge observed in transmission over recentyears (Alonso et al. 2011). However, little attentionhas been given to the homogeneity/heterogeneity intransmission trends across the East African high-lands, especially as revealed by time series analysis. Infact, most time series analyses have been exclusivelyfocused on a time series fromKericho in Kenya (Hayet al. 2000; Hay et al. 2002a; Shanks et al. 2000, 2002,2005; Pascual et al. 2008; Artzy-Randrup et al. 2010;Childs and Boots, 2010; Alonso et al. 2011). Severalcross-sectional studies that examined transmissionpatterns across altitudinal gradients in the EastAfrican highlands reported an overall decrease in
* Corresponding author: Graduate School ofEnvironmental Sciences, Hokkaido University, SuiteA701, Kita-10, Nishi-5, Kita-Ku, Sapporo, Hokkai-do,060-0810 Japan. Tel: +81 11 706 2267. Fax:+81 11 706 4954. E-mail: [email protected]
14
Parasitology (2012), 139, 14–25. ©CambridgeUniversity Press 2011.The online version of this article is publishedwithin anOpenAccessenvironment subject to the conditions of the Creative Commons Attribution-NonCommercial-ShareAlike licence <http://creativecommons.org/licenses/by-nc-sa/2.5/>. The written permission of Cambridge University Press must be obtained for commercial re-use.doi:10.1017/S0031182011001685
transmission with altitude (Bødker et al. 2003, 2006;Drakeley et al. 2005). Similar studies looking atseveral time series have tended to use coarsely graineddata, for example, records from districts (Abeku et al.2004; Teklehaimanot et al. 2004), hospital time seriesfrom distant locations (Zhou et al. 2004) or havemixed inpatient data, i.e., virulent cases admitted to ahospital, with outpatient data, i.e., febrile cases thatvisit the hospital but require no further attention in ahospital and not parasitologically confirmed (Zhouet al. 2004; Pascual and Bouma, 2009). Others havefocused on showing the signatures of large-scaleclimatic phenomena such as the Indian Ocean Dipole(IOD) Mode on malaria transmission (Hashizumeet al. 2009). However, further inquiries into thehomogeneity of these trends, for example, whetherthe incidence is similarly increased or decreasedthrough time, or is dependent on the existence andsynchronicity of regime shifts, i.e., whether similarabrupt changes on the average and the variability ofmalaria incidence have been simultaneously observedin East Africa, has been out of the research agenda.Here, we employ 5 time series from hospitals in the
Lake Victoria basin region of Western Kenya, anarea with well-defined and regionally homogeneousseasonal climatic patterns (Anyah and Semazzi, 2004;Anyah et al. 2006), and ask whether these time seriesshow similar regime shifts. We also ask whetherincreasing transmission trends reported for Kericho(Shanks et al. 2000) are common to the whole LakeVictoria basin. We found that regime shifts, whenpresent, were asynchronous along the altitude rangebut synchronous at high altitude. Trends in the timeseries also changed with altitude. At low altitudes,i.e., below 1500m, malaria incidence began todecrease in the late 1980s. By contrast, the variabilityand average of malaria transmission either keptconstant or increased at higher altitudes, above1600m, especially during the 1990s, and began todecrease in the early 2000s. Finally, our resultshighlight the need for both spatially and temporallyfine-grained data to make sound inferences about theimpacts of climate change and control/eliminationinterventions on malaria transmission.
MATERIALS AND METHODS
Data
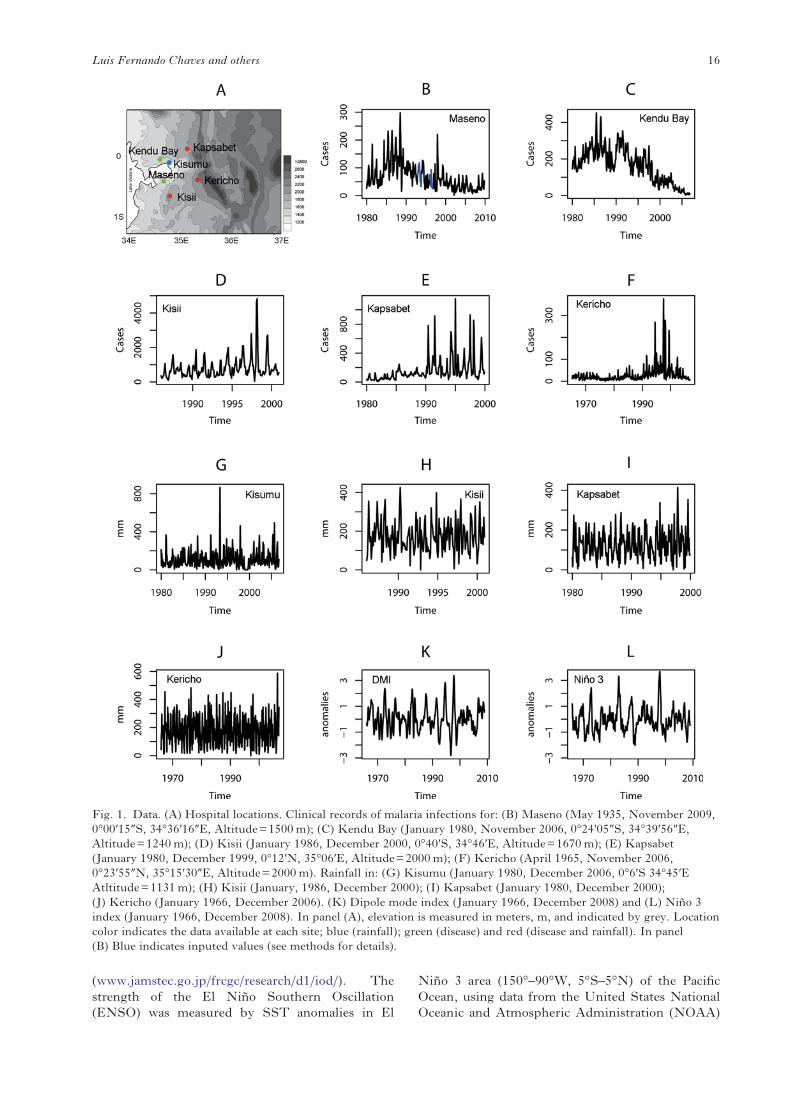
Figure 1A shows the location of our study sites withinLake Victoria basin and the elevation range thatthey span. Time series data used in our study aremonthly records of inpatients diagnosed with malariain Maseno (Fig. 1B), Kendu Bay (Fig. 1C), Kisii(Fig. 1D), Kapsabet (Fig. 1E), Kericho (Fig. 1F).Figure 1 also shows monthly rainfall records forKisumu (Fig. 1G), Kisii (Fig. 1H), Kapsabet(Fig. 1I), Kericho (Fig. 1J) and the dipole modeindex (DMI, Fig. 1K) and El Niño 3 (ENSO,
Fig. 1L). The 5 malaria time series are monthlycounts of inpatients admitted into the hospitalsbecause of high fever and other clinical malariasymptoms. In Kericho, all malaria cases whereconfirmed by blood-slide examination (bse) (Hayet al. 2000; Shanks et al. 2000, 2002, 2005). In theother 4 sites (Maseno, Kendu Bay, Kisii andKapsabet) we collected the data from books withmalaria-diagnosed inpatient records. Unfortunately,these books did not indicate whether all recordedmalaria cases were confirmed by bse. We wereinformed by staff members from each hospital thatcases were often confirmed by bse, but hospital staffmembers were unable to guarantee a confirmation ofall cases by such amethod. However, in each hospital,staff members indicated that, to the best of theirknowledge and experience, criteria for hospitalizationof diagnosed malaria cases have been consistentthrough the years presented in this study. Insummary, we selected these study sites because wewere informed that no seasonal or secular changes inmalaria diagnosis have occurred over the studiedperiods. In fact, with the exception of Maseno(Fig. 1B), our data did not include missing obser-vations. We also focused on the analysis of cases fromall ages to make sound comparisons with previousstudies looking at trends, which have been based on asimilar set of cases (Hay et al. 2000; Shanks et al.2000; Abeku et al. 2004; Teklehaimanot et al. 2004;Zhou et al. 2004; Pascual et al. 2008; Pascual andBouma, 2009; Artzy-Randrup et al. 2010; Childs andBoots, 2010; Alonso et al. 2011). In the analysis we donot include data for population growth because of thetechnical difficulties to estimate hospital catchmentpopulation, which will be the most desirable denomi-nator to study impacts of population growth on thesetime series. Although in some instances such growthhas been equated to the population growth of thegeopolitical subdivisions containing the studiedhospitals (Hay et al. 2002a) in the setting of ourstudy this procedure is unreliable because of changesin geopolitical subdivisions of Kenya containingthese hospitals, which increases the likelihood ofheterogeneous trends in population growth becauseof differences in the counted populations (Lewontinand Levins, 1989). Also, this information is not arequisite for non-stationary time series analysis,especially when time series trends are the subject ofstudy (Shumway and Stoffer, 2000).In our analyses we used rainfall data from
Kisumu as a proxy for rainfall in Maseno andKendu Bay, given the close geographical proximity,<35 km, and similar altitude. DMI is an index forthe IOD, defined as the difference in sea surfacetemperatures (SST) anomalies between western(10°S–10°N, 50°–70°E) and eastern (10°S–0°,90°–110°E) tropical Indian Ocean (Saji et al. 1999).The DMI data were obtained from Japan Agency forMarine-Earth Science and Technology, JAMSTEC,
15Shifts and Trends in Highland Malaria
(www.jamstec.go.jp/frcgc/research/d1/iod/). Thestrength of the El Niño Southern Oscillation(ENSO) was measured by SST anomalies in El
Niño 3 area (150°–90°W, 5°S–5°N) of the PacificOcean, using data from the United States NationalOceanic and Atmospheric Administration (NOAA)
Fig. 1. Data. (A) Hospital locations. Clinical records of malaria infections for: (B) Maseno (May 1935, November 2009,0°00′15″S, 34°36′16″E, Altitude=1500m); (C) Kendu Bay (January 1980, November 2006, 0°24′05″S, 34°39′56″E,Altitude=1240m); (D) Kisii (January 1986, December 2000, 0°40′S, 34°46′E, Altitude=1670m); (E) Kapsabet(January 1980, December 1999, 0°12′N, 35°06′E, Altitude=2000m); (F) Kericho (April 1965, November 2006,0°23′55″N, 35°15′30″E, Altitude=2000m). Rainfall in: (G) Kisumu (January 1980, December 2006, 0°6′S 34°45′EAtltitude=1131m); (H) Kisii (January, 1986, December 2000); (I) Kapsabet (January 1980, December 2000);(J) Kericho (January 1966, December 2006). (K) Dipole mode index (January 1966, December 2008) and (L) Niño 3index (January 1966, December 2008). In panel (A), elevation is measured in meters, m, and indicated by grey. Locationcolor indicates the data available at each site; blue (rainfall); green (disease) and red (disease and rainfall). In panel(B) Blue indicates inputed values (see methods for details).
16Luis Fernando Chaves and others
Climate Prediction Center (www.cpc.ncep.noaa.gov).
Time series analysis for breakpoints and regime shifts inthe time domain
Exploratory analysis. To explore the dynamics of thetime series, we performed an exploratory time seriesanalysis, by examining the autocorrelation functionof the malaria inpatient time series (Shumway andStoffer, 2000). This inspection showed that mostmalaria time series (yt) were first order seasonalautoregressive processes where observations arecorrelated at both short (1 month) and seasonaltime lags (12 months). Thus, we fitted the data to thefollowing seasonal autoregressive null model:
yt = μ+ ϕ1 yt−1 − μ( )+ ϕ12 yt−12 − μ
( )
+ ϕ1ϕ12 yt−13 − μ( )+ αTrend+ εt (1)
For Kisii and Kericho, the time series were betterdescribed by a second order autoregressive process:
yt = μ+ ϕ1 yt−1 − μ( )+ ϕ2 yt−2 − μ
( )+ αTrend+ εt
(2)Inmodels (1) and (2) μ is the average value of the timeseries, Trend, a non-linear trend estimated withLoess, is included to account for the non-stationarityin the data which, in this case, is the changing meanthrough time (Chaves and Pascual, 2006). Loess is anon-parametric regression method based on the localfit of polynomials to data which get linked to obtain asmooth function which captures non-linear trends intime series data (Shumway and Stoffer, 2000). Theerror was assumed to be independent and normallydistributed: ε *N(0,σ2). We used models (1) and (2)to pre-whiten the time series of the followingclimatic covariates: Rainfall, ENSO, and DMI. Pre-whitening is a process that rules out spuriouscorrelation between two time series, by removing(filtering) any common structure between the twostudied time series (Chaves and Pascual, 2006).Residuals of the model presented in (1) and the pre-whitened residuals of the climatic covariateswereusedto compute cross-correlation functions of the numberof inpatients with each one of the climatic covariates.
Breakpoints and regime shifts. Data in Fig. 1 suggestthe occurrence of secular changes in malaria inci-dence for the studied period. To test the significanceof those apparent changes, and to determine the exacttemporal localization of the changes (i.e., breakpoint,the time of an abrupt change indicating a regimeshift) we used generalized fluctuation tests for themalaria incidence time series. This technique fits aparametric model to the data and derives an empiricalfluctuation process (EFP). Briefly, an empiricalfluctuation process depicts residual fluctuation fromthe studied data. This information can be used to
detect unusual changes in, the variability or meandynamics of, a time series by comparing the un-explained variability of the time series with thefluctuation of a Gaussian random process (Plobergeret al. 1989). We estimated EFPs that capturedchanges in the parameter estimates, where structuralchanges (i.e., regime shifts) in the time series understudy can be observed in time (Ploberger et al. 1989;Chaves et al. 2008). We estimated the EFP usingmodels that were selected in the absence of break-points. We also estimated an EFP for each rainfalltime series to investigate possible impacts of regimeshifts in covariates as cause of regime shifts in themalaria time series. We did not estimate EFPs forDMI and ENSO since it is well known that most oftheir variability is interannual (Saji et al. 1999; Sajiand Yamagata, 2003).
Models to illustrate incidence changes associated withregime shifts. Based on the cross-correlation func-tions we built models with covariates at lags that hadsignificant cross-correlations and considered thetrends obtained with Loess. For the time series inwhich regime shifts were identified, we furtherestimated split trends by using the Loess methodon the time series split at their breakpoints. We alsofitted the best models that we obtained to the splitseries around the breakpoint. We studied changes onthe magnitude of the climatic forcing by thecovariates on the malaria time series by comparingthe regression coefficients for the model fitted to thedifferent segments of the split time series (Chaveset al. 2008). We selected the models using the AkaikeInformation Criterion (AIC), a metric that selectsmodels based on the number of parameters andlikelihood in order to avoid over-parameterizedmodels (Shumway and Stoffer, 2000). Finally, in allcases, assumptions about model error were verifiedusing standard procedures for time series analysis(Shumway and Stoffer, 2000).
RESULTS
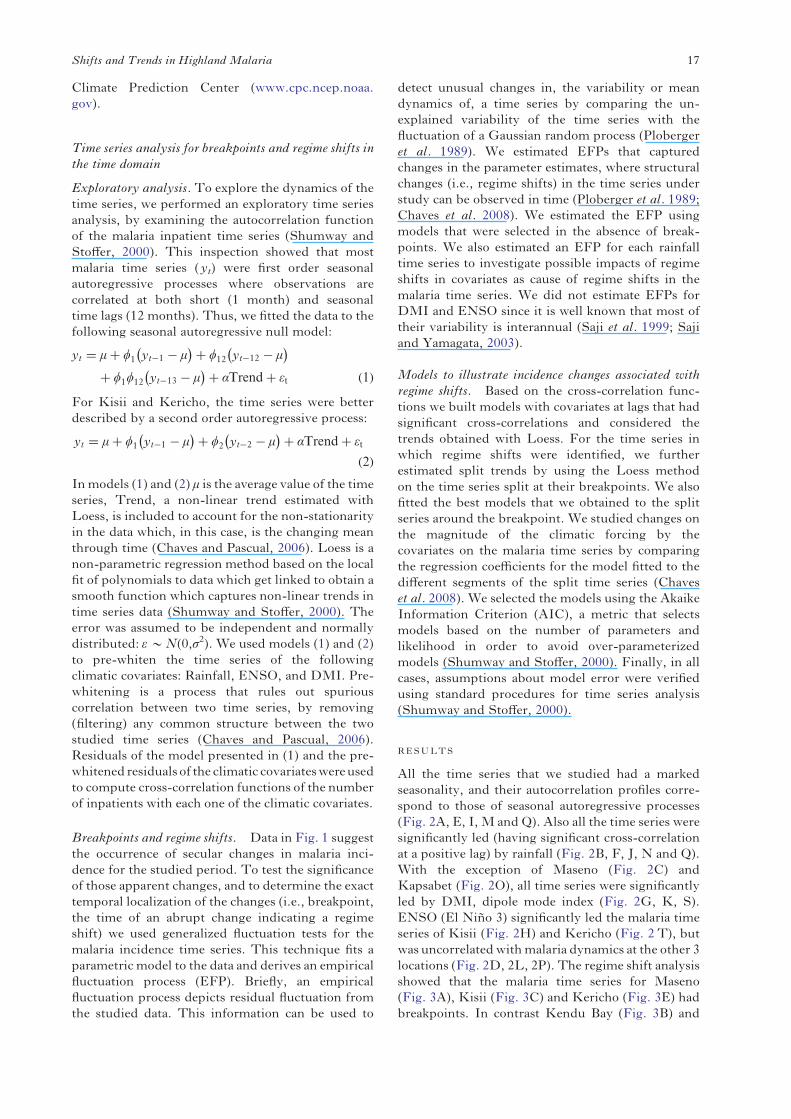
All the time series that we studied had a markedseasonality, and their autocorrelation profiles corre-spond to those of seasonal autoregressive processes(Fig. 2A, E, I, M and Q). Also all the time series weresignificantly led (having significant cross-correlationat a positive lag) by rainfall (Fig. 2B, F, J, N and Q).With the exception of Maseno (Fig. 2C) andKapsabet (Fig. 2O), all time series were significantlyled by DMI, dipole mode index (Fig. 2G, K, S).ENSO (El Niño 3) significantly led the malaria timeseries of Kisii (Fig. 2H) and Kericho (Fig. 2 T), butwas uncorrelatedwithmalaria dynamics at the other 3locations (Fig. 2D, 2L, 2P). The regime shift analysisshowed that the malaria time series for Maseno(Fig. 3A), Kisii (Fig. 3C) and Kericho (Fig. 3E) hadbreakpoints. In contrast Kendu Bay (Fig. 3B) and
17Shifts and Trends in Highland Malaria
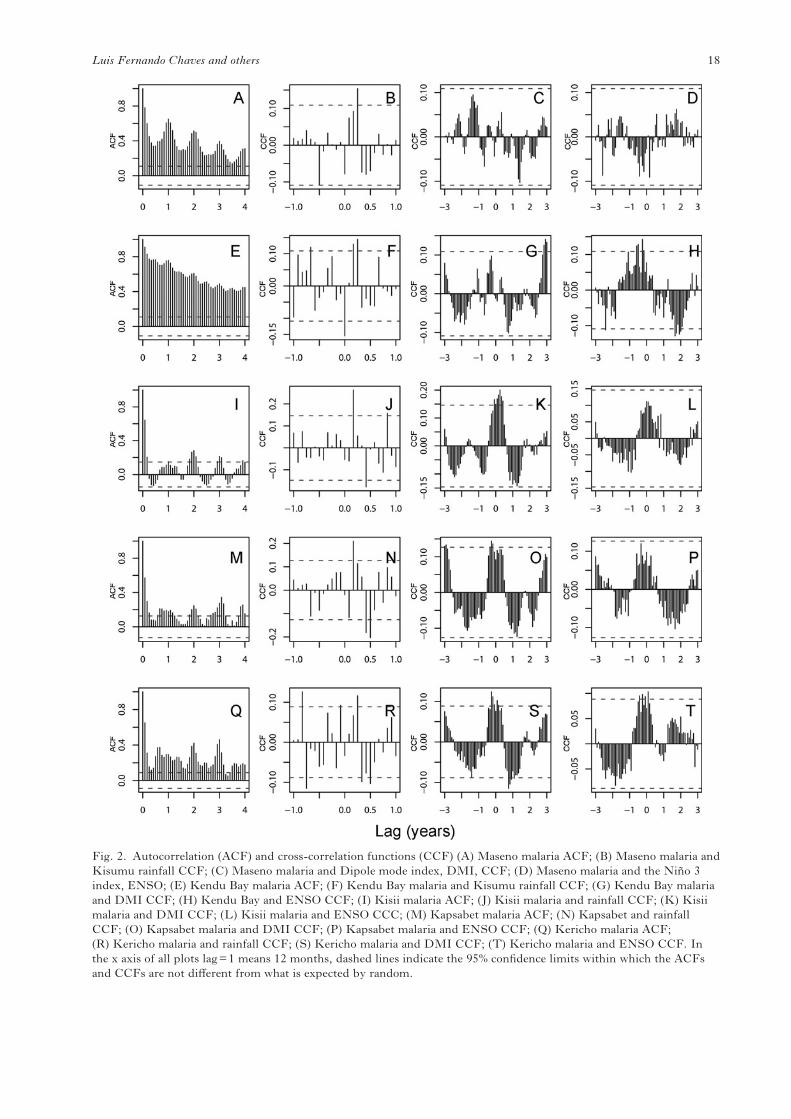
Fig. 2. Autocorrelation (ACF) and cross-correlation functions (CCF) (A) Maseno malaria ACF; (B) Maseno malaria andKisumu rainfall CCF; (C) Maseno malaria and Dipole mode index, DMI, CCF; (D) Maseno malaria and the Niño 3index, ENSO; (E) Kendu Bay malaria ACF; (F) Kendu Bay malaria and Kisumu rainfall CCF; (G) Kendu Bay malariaand DMI CCF; (H) Kendu Bay and ENSO CCF; (I) Kisii malaria ACF; (J) Kisii malaria and rainfall CCF; (K) Kisiimalaria and DMI CCF; (L) Kisii malaria and ENSO CCC; (M) Kapsabet malaria ACF; (N) Kapsabet and rainfallCCF; (O) Kapsabet malaria and DMI CCF; (P) Kapsabet malaria and ENSO CCF; (Q) Kericho malaria ACF;(R) Kericho malaria and rainfall CCF; (S) Kericho malaria and DMI CCF; (T) Kericho malaria and ENSO CCF. Inthe x axis of all plots lag=1 means 12 months, dashed lines indicate the 95% confidence limits within which the ACFsand CCFs are not different from what is expected by random.
18Luis Fernando Chaves and others
Kapsabet (Fig. 3D) had no breakpoints. None of therainfall time series showed any breakpoints (Fig. 3F,G, H, I).Seasonal autoregressive models confirmed the
association between malaria incidence and rainfall
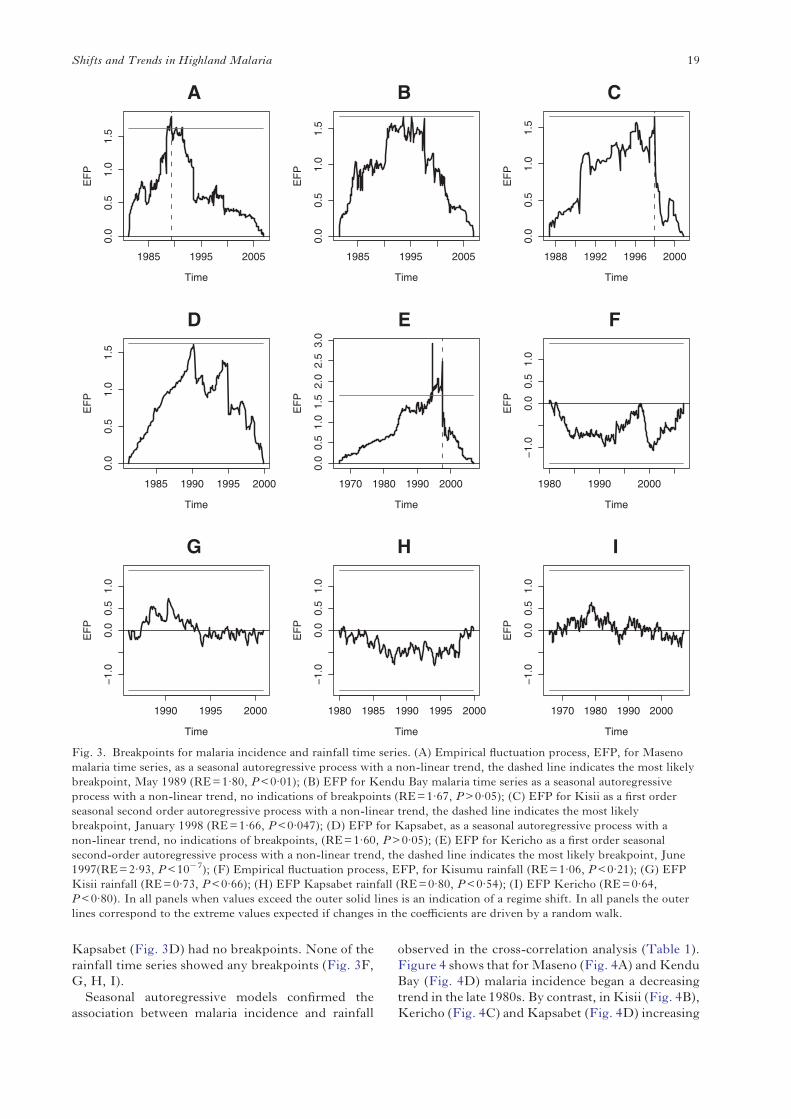
observed in the cross-correlation analysis (Table 1).Figure 4 shows that for Maseno (Fig. 4A) and KenduBay (Fig. 4D) malaria incidence began a decreasingtrend in the late 1980s. By contrast, inKisii (Fig. 4B),Kericho (Fig. 4C) and Kapsabet (Fig. 4D) increasing
A
Time
EF
P
1985 1995 2005
0.0
0.5
1.0
1.5
B
Time
EF
P
1985 1995 2005
0.0
0.5
1.0
1.5
C
Time
EF
P
1988 1992 1996 2000
0.0
0.5
1.0
1.5
D
Time
EF
P
1985 1990 1995 2000
0.0
0.5
1.0
1.5
E
Time
EF
P
1970 1980 1990 2000
0.0
0.5
1.0
1.5
2.0
2.5
3.0
F
TimeE
FP
1980 1990 2000
−1.
00.
00.
51.
0
G
Time
EF
P
1990 1995 2000
−1.
00.
00.
51.
0
H
Time
EF
P
1980 1985 1990 1995 2000
−1.
00.
00.
51.
0
I
Time
EF
P
1970 1980 1990 2000
−1.
00.
00.
51.
0
Fig. 3. Breakpoints for malaria incidence and rainfall time series. (A) Empirical fluctuation process, EFP, for Masenomalaria time series, as a seasonal autoregressive process with a non-linear trend, the dashed line indicates the most likelybreakpoint, May 1989 (RE=1·80, P<0·01); (B) EFP for Kendu Bay malaria time series as a seasonal autoregressiveprocess with a non-linear trend, no indications of breakpoints (RE=1·67, P>0·05); (C) EFP for Kisii as a first orderseasonal second order autoregressive process with a non-linear trend, the dashed line indicates the most likelybreakpoint, January 1998 (RE=1·66, P<0·047); (D) EFP for Kapsabet, as a seasonal autoregressive process with anon-linear trend, no indications of breakpoints, (RE=1·60, P>0·05); (E) EFP for Kericho as a first order seasonalsecond-order autoregressive process with a non-linear trend, the dashed line indicates the most likely breakpoint, June1997(RE=2·93, P<10−7); (F) Empirical fluctuation process, EFP, for Kisumu rainfall (RE=1·06, P<0·21); (G) EFPKisii rainfall (RE=0·73, P<0·66); (H) EFP Kapsabet rainfall (RE=0·80, P<0·54); (I) EFP Kericho (RE=0·64,P<0·80). In all panels when values exceed the outer solid lines is an indication of a regime shift. In all panels the outerlines correspond to the extreme values expected if changes in the coefficients are driven by a random walk.
19Shifts and Trends in Highland Malaria
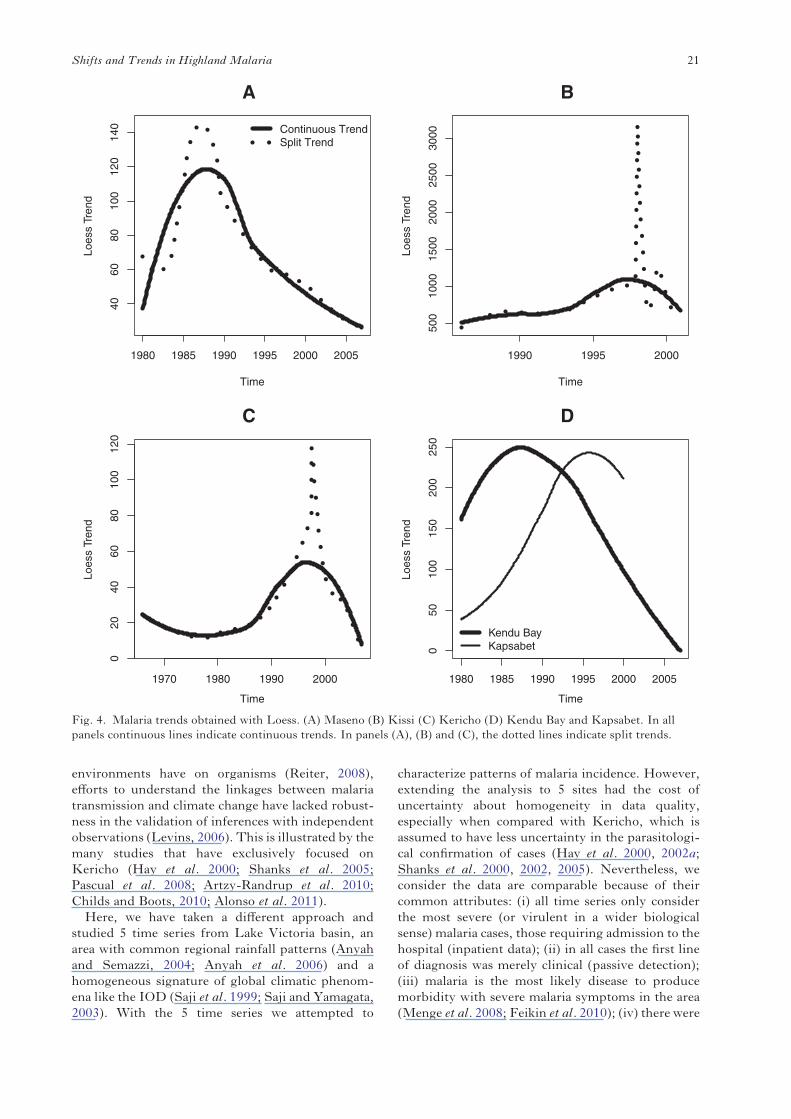
trends in malaria transmission were observed in themid and late 1990s and these trends began to decreasein the early 2000s (Fig. 4B, C andD). In general, splittrends showed similar patterns to contiguous trends(Fig. 4A, B, C). However, it is important to note thatin Kisii, the second half of the split trend gave toomuch importance to a few observations (Fig. 4B). Inall the best models (Table 1) normality and homo-kedasticity tests confirmed that the error was normal,independent and identically distributed, thus confi-rming the validity of our analyses.
Regarding the influence of climatic covariates, withthe exception of Kendu Bay and Kapsabet whererainfall had both positive and negative impacts onmalaria incidence, rainfall significantly increasedmonthly malaria incidence (Table 2). The processof model selection showed that for those time seriesthat were associated with both El Niño 3 and DMI,the latter was the best predictor (Table 1). Increasesin DMI were positively associated with increasesin malaria incidence. In Maseno and Kericho the
inclusion of the breakpoints and splits trendsmaximized the likelihood of the models (Table 1).In Kisii only the inclusion of the breakpointimproved model fit (Table 1), probably because ofthe irregular second half of the split time series(Fig. 4B). Finally, Maseno and Kericho showopposits patterns regarding the variability associatedwith their regime shifts. In Maseno, the variabilitymeasured model standard deviation (σ̂, Table 2)decreased after the breakpoint, while in Kisii andKericho it increased.
DISCUSSION
The possible association between changes in high-land malaria transmission patterns and global warm-ing has motivated a heated debate (Chaves andKoenraadt, 2010). From positions that claim tohave explained malaria trends as a direct product oftemperature trends (Alonso et al. 2011) to positionsthat neglect the known impacts that changing
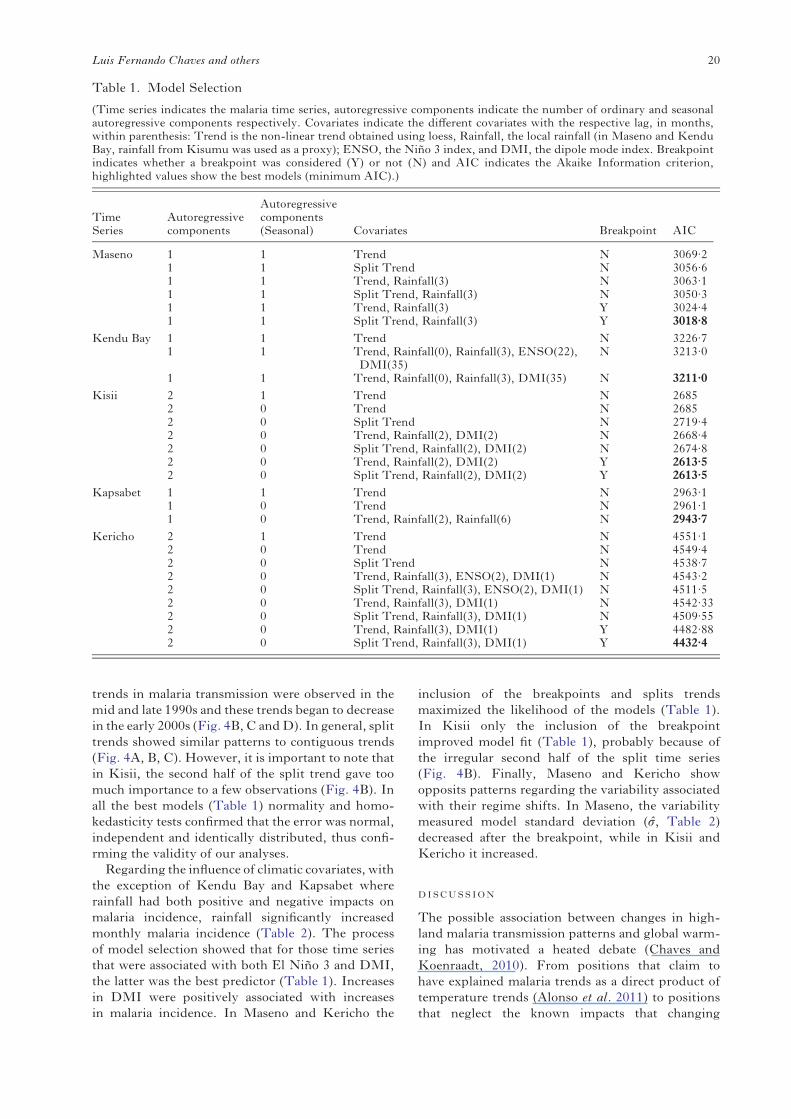
Table 1. Model Selection
(Time series indicates the malaria time series, autoregressive components indicate the number of ordinary and seasonalautoregressive components respectively. Covariates indicate the different covariates with the respective lag, in months,within parenthesis: Trend is the non-linear trend obtained using loess, Rainfall, the local rainfall (in Maseno and KenduBay, rainfall from Kisumu was used as a proxy); ENSO, the Niño 3 index, and DMI, the dipole mode index. Breakpointindicates whether a breakpoint was considered (Y) or not (N) and AIC indicates the Akaike Information criterion,highlighted values show the best models (minimum AIC).)
TimeSeries
Autoregressivecomponents
Autoregressivecomponents(Seasonal) Covariates Breakpoint AIC
Maseno 1 1 Trend N 3069·21 1 Split Trend N 3056·61 1 Trend, Rainfall(3) N 3063·11 1 Split Trend, Rainfall(3) N 3050·31 1 Trend, Rainfall(3) Y 3024·41 1 Split Trend, Rainfall(3) Y 3018·8
Kendu Bay 1 1 Trend N 3226·71 1 Trend, Rainfall(0), Rainfall(3), ENSO(22),
DMI(35)N 3213·0
1 1 Trend, Rainfall(0), Rainfall(3), DMI(35) N 3211·0Kisii 2 1 Trend N 2685
2 0 Trend N 26852 0 Split Trend N 2719·42 0 Trend, Rainfall(2), DMI(2) N 2668·42 0 Split Trend, Rainfall(2), DMI(2) N 2674·82 0 Trend, Rainfall(2), DMI(2) Y 2613·52 0 Split Trend, Rainfall(2), DMI(2) Y 2613·5
Kapsabet 1 1 Trend N 2963·11 0 Trend N 2961·11 0 Trend, Rainfall(2), Rainfall(6) N 2943·7
Kericho 2 1 Trend N 4551·12 0 Trend N 4549·42 0 Split Trend N 4538·72 0 Trend, Rainfall(3), ENSO(2), DMI(1) N 4543·22 0 Split Trend, Rainfall(3), ENSO(2), DMI(1) N 4511·52 0 Trend, Rainfall(3), DMI(1) N 4542·332 0 Split Trend, Rainfall(3), DMI(1) N 4509·552 0 Trend, Rainfall(3), DMI(1) Y 4482·882 0 Split Trend, Rainfall(3), DMI(1) Y 4432·4
20Luis Fernando Chaves and others
environments have on organisms (Reiter, 2008),efforts to understand the linkages between malariatransmission and climate change have lacked robust-ness in the validation of inferences with independentobservations (Levins, 2006). This is illustrated by themany studies that have exclusively focused onKericho (Hay et al. 2000; Shanks et al. 2005;Pascual et al. 2008; Artzy-Randrup et al. 2010;Childs and Boots, 2010; Alonso et al. 2011).Here, we have taken a different approach and
studied 5 time series from Lake Victoria basin, anarea with common regional rainfall patterns (Anyahand Semazzi, 2004; Anyah et al. 2006) and ahomogeneous signature of global climatic phenom-ena like the IOD (Saji et al. 1999; Saji and Yamagata,2003). With the 5 time series we attempted to
characterize patterns of malaria incidence. However,extending the analysis to 5 sites had the cost ofuncertainty about homogeneity in data quality,especially when compared with Kericho, which isassumed to have less uncertainty in the parasitologi-cal confirmation of cases (Hay et al. 2000, 2002a;Shanks et al. 2000, 2002, 2005). Nevertheless, weconsider the data are comparable because of theircommon attributes: (i) all time series only considerthe most severe (or virulent in a wider biologicalsense) malaria cases, those requiring admission to thehospital (inpatient data); (ii) in all cases the first lineof diagnosis was merely clinical (passive detection);(iii) malaria is the most likely disease to producemorbidity with severe malaria symptoms in the area(Menge et al. 2008; Feikin et al. 2010); (iv) there were
A
Time
Loes
s Tr
end
1980 1985 1990 1995 2000 2005
4060
8010
012
014
0 Continuous Trend dSplit Trend
B
Time
Loes
s Tr
end
1990 1995 2000
500
1000
1500
2000
2500
3000
C
Time
Loes
s Tr
end
1970 1980 1990 2000
020
4060
8010
012
0
D
Time
Loes
s Tr
end
1980 1985 1990 1995 2000 2005
050
100
150
200
250
Kendu BayKapsabet
Fig. 4. Malaria trends obtained with Loess. (A) Maseno (B) Kissi (C) Kericho (D) Kendu Bay and Kapsabet. In allpanels continuous lines indicate continuous trends. In panels (A), (B) and (C), the dotted lines indicate split trends.
21Shifts and Trends in Highland Malaria
no systematic changes in the implementation ofmalaria confirmation i.e., we have no reason tosuspect any seasonal, or secular, change in diagnosticcriteria at each site. Obviously, these biases on thedata limits the inferences to severe cases, which mostlikely underestimate disease transmission as shownby highly standardized blood-slide examination(Molineaux et al. 1980) and molecular diagnostictechniques (Ofulla et al. 2005;Menge et al. 2008), notto mention the likelihood of inaccuracy that couldemerge from stressed staff dealing with epidemics atresource limited health facilities. However, since thetype of cases studied over time were homogeneous,there is no threat to comparison validity over time,because the data fits the standards for a sound analysisof trends (Shumway and Stoffer, 2000).
Our results show that malaria incidence in LakeVictoria basin displayed trends that are similar overgiven altitudinal ranges. At altitudes below 1600m,we found that malaria trends began to decrease in thelate 1980s. In contrast, at higher altitudes, above1600m, we found that malaria increased in the midand late 1990s, confirming a pattern noticed in EastAfrica that linked unexpectedly high levels of malariatransmission associated with IOD and ENSO(Hashizume et al. 2009; Lindblade et al. 1999,2001; Zhou et al. 2004). In this context, populationgrowth is indirectly associated with malaria emer-gence in the African highlands because of its impacton land use change, and subsequent changes in theecology of living organisms involved in malariatransmission (Lindblade et al. 2000). Montane
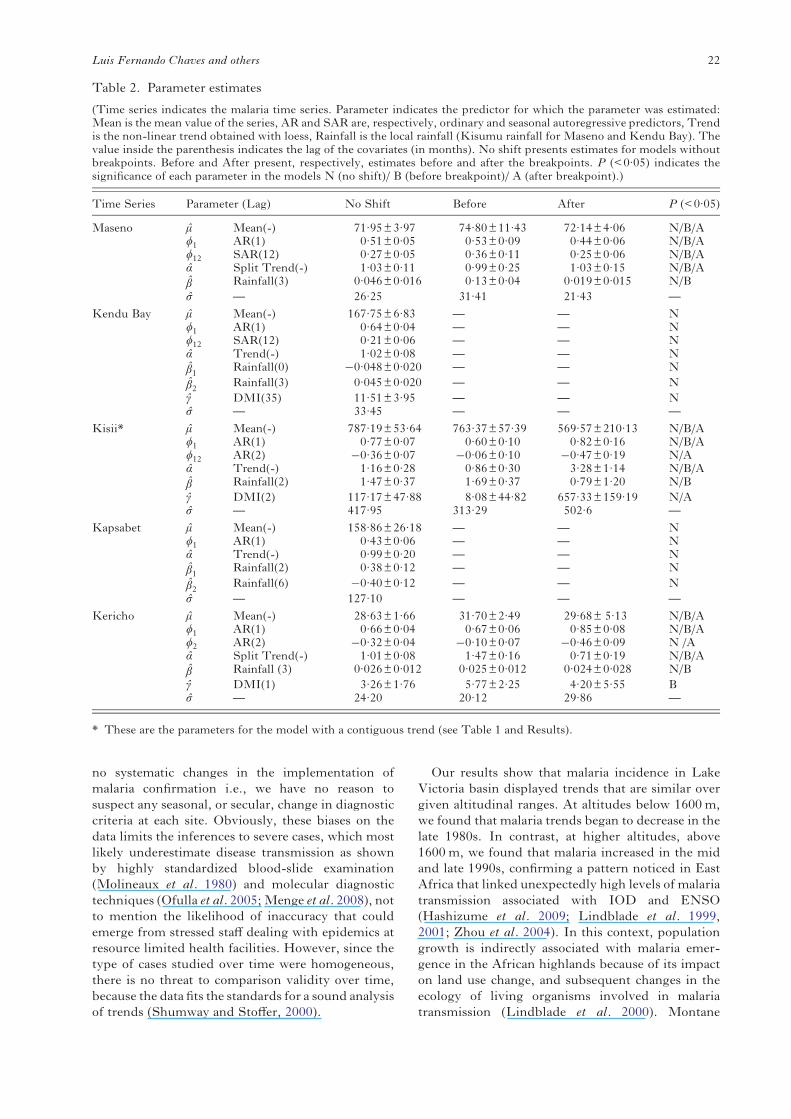
Table 2. Parameter estimates
(Time series indicates the malaria time series. Parameter indicates the predictor for which the parameter was estimated:Mean is the mean value of the series, AR and SAR are, respectively, ordinary and seasonal autoregressive predictors, Trendis the non-linear trend obtained with loess, Rainfall is the local rainfall (Kisumu rainfall for Maseno and Kendu Bay). Thevalue inside the parenthesis indicates the lag of the covariates (in months). No shift presents estimates for models withoutbreakpoints. Before and After present, respectively, estimates before and after the breakpoints. P (<0·05) indicates thesignificance of each parameter in the models N (no shift)/ B (before breakpoint)/ A (after breakpoint).)
Time Series Parameter (Lag) No Shift Before After P (<0·05)
Maseno μ̂ Mean(-) 71·95±3·97 74·80±11·43 72·14±4·06 N/B/Aϕ1 AR(1) 0·51±0·05 0·53±0·09 0·44±0·06 N/B/Aϕ12 SAR(12) 0·27±0·05 0·36±0·11 0·25±0·06 N/B/Aα̂ Split Trend(-) 1·03±0·11 0·99±0·25 1·03±0·15 N/B/Aβ̂ Rainfall(3) 0·046±0·016 0·13±0·04 0·019±0·015 N/Bσ̂ — 26·25 31·41 21·43 —
Kendu Bay μ̂ Mean(-) 167·75±6·83 — — Nϕ1 AR(1) 0·64±0·04 — — Nϕ12 SAR(12) 0·21±0·06 — — Nα̂ Trend(-) 1·02±0·08 — — Nβ̂1 Rainfall(0) −0·048±0·020 — — N
β̂2 Rainfall(3) 0·045±0·020 — — Nγ̂ DMI(35) 11·51±3·95 — — Nσ̂ — 33·45 — — —
Kisii* μ̂ Mean(-) 787·19±53·64 763·37±57·39 569·57±210·13 N/B/Aϕ1 AR(1) 0·77±0·07 0·60±0·10 0·82±0·16 N/B/Aϕ12 AR(2) −0·36±0·07 −0·06±0·10 −0·47±0·19 N/Aα̂ Trend(-) 1·16±0·28 0·86±0·30 3·28±1·14 N/B/Aβ̂ Rainfall(2) 1·47±0·37 1·69±0·37 0·79±1·20 N/Bγ̂ DMI(2) 117·17±47·88 8·08±44·82 657·33±159·19 N/Aσ̂ — 417·95 313·29 502·6 —
Kapsabet μ̂ Mean(-) 158·86±26·18 — — Nϕ1 AR(1) 0·43±0·06 — — Nα̂ Trend(-) 0·99±0·20 — — Nβ̂1 Rainfall(2) 0·38±0·12 — — N
β̂2 Rainfall(6) −0·40±0·12 — — Nσ̂ — 127·10 — — —
Kericho μ̂ Mean(-) 28·63±1·66 31·70±2·49 29·68± 5·13 N/B/Aϕ1 AR(1) 0·66±0·04 0·67±0·06 0·85±0·08 N/B/Aϕ2 AR(2) −0·32±0·04 −0·10±0·07 −0·46±0·09 N /Aα̂ Split Trend(-) 1·01±0·08 1·47±0·16 0·71±0·19 N/B/Aβ̂ Rainfall (3) 0·026±0·012 0·025±0·012 0·024±0·028 N/Bγ̂ DMI(1) 3·26±1·76 5·77±2·25 4·20±5·55 Bσ̂ — 24·20 20·12 29·86 —
* These are the parameters for the model with a contiguous trend (see Table 1 and Results).
22Luis Fernando Chaves and others
rainforests used to cover the highlands surroundingLake Victoria, while the lowlands in the lake basinwere less forested. Now the highland forests havemostly disappeared, and locals are still clearing thelast patches of forest that remained in the valleybottoms (Verschuren et al. 2002), mainly for thepurposes of self-subsistence agriculture (Ernst et al.2009). In addition, population growth in this region,with a long history of unequal access to land derivedfrom colonial plundering (Prothero, 1965; Chavesand Koenraadt, 2010), also forces locals to migrateto valley bottoms where they are likely exposed toa large number of vectors and high malaria trans-mission (Munyekenye et al. 2005). Thus, the indirectimpacts of population growth, which are ultimatelyexpressed in diverse degrees of land transformationand human movement, make our analysis robustto the lack of explicit consideration of populationgrowth data. Moreover, regulation of malaria trans-mission, which is best described by frequencydependent models (Hay et al. 2000; Pascual et al.2008; Chaves et al. 2009; Alonso et al. 2011), impliesthat population growth plays a relatively minor roleon the dynamics of transmission (McCallum et al.2001). In fact, several studies have shown that there isnot a direct mapping between population growthand trends in malaria transmission, both in thisarea (Hay et al. 2002a,b; Pascual et al. 2008;Alonso et al. 2011) and outside Africa (Chaveset al. 2009). On the other hand, frequency dependenttransmission models are sensitive to conditions ofpopulation immunity, which is indeed reducedin highland populations, when compared to low-land populations (John et al. 2002), as productof a decreased exposure to malaria infection(Drakeley et al. 2005).The late 1990s malaria epidemics in lake Victoria
basin, above 1600m, were so large that they sig-nificantly increased the variance of the time series;probably explaining the occurrence of breakpointsin Kisii and Kericho in 1997/1998. One hypothesisthat could explain the synchrony in the breakpoints,which requires further testing in the field, is thesynchronization of mosquito populations and sub-sequent malaria transmission triggered by rainfall.Previous studies have shown that catching adultAnopheles gambiae mosquitoes, the main malariavector in East Africa highlands, is extremely difficult(Koenraadt et al. 2006). Even so, vector densitieshave been shown to significantly increase followingrainfall (Minakawa et al. 2002, 2005b, 2006), even ifprolonged rainfall can wash away mosquito larvae(Paaijmans et al. 2007). Occasional floods and rainfallrunoff create numerous stagnant water pools in valleybottoms that are poorly drained. If riparian forestsare cleared, these stagnant water pools becomesuitable breeding sites for major malaria vectorsthat mainly inhabit small sun-lit water pools, An.gambiae and An. arabiensis (Gimnig et al. 2001;
Minakawa et al. 2005a). Besides its direct impact onmosquito density, rainfall also determines a seriesof wetness indices that are major risk factors formalaria infection in western Kenya (Cohen et al.2010), probably by enhancing mosquito movementacross the landscape, a pattern common amongseveral mosquito genera, including Anopheles(Silver, 2008). Thus, to explain the heterogeneity inmalaria transmission trends, we consider that finelygrained landscape transformation, in synergy withincreased rainfall associated with IOD (Hashizumeet al. 2009), probably were major drivers of the largeepidemics above 1600m.Regarding the decreasing malaria trends, the
mechanism driving changes at low and high altitudesseems to be different. At low altitude, below 1600m,malaria trends began to decrease before the 1990s,and could likely reflect self-regulation of trans-mission, either by immunity development (Hayet al. 2000; Pascual et al. 2008), or the more generalreduced inflow of susceptible individuals, i.e., im-mune adults and well protected children, as observedoutside Africa (Chaves et al. 2008, 2009, 2011;Kaneko et al. 1998, 2000). At high altitude(>1600m), large-scale malaria control interventionswith insecticide treated bednets could have drivenboth the reduction of malaria transmission andmosquito population size (Lindblade et al. 2004)and a shift of dominant vector species, from An.gambiae to An. arabiensis (Bayoh et al. 2010). In fact,the interruption of malaria transmission has beendocumented in highland sites near the locationswe studied (John et al. 2009; Zhou et al. 2011).More, generally differences in malaria incidencetrends can reflect a myriad of historic changes inEast Africa. From demographic changes to land usechanges (Lindblade et al. 2000; Lindsay andMartens, 1998), drug resistance (Shanks et al.2005), and global warming (Alonso et al. 2011)differences in malaria trends ultimately link thesensitivity of malaria transmission to its context(Chaves and Koenraadt, 2010). Finally, the scarcityof contextual information and long-term malariarecords necessary to robustly determine the driversbehind malaria transmission trends highlight theneed for surveillance and for climatic and demo-graphic systems able to record high quality data.These data are necessary to understand heterogene-ities in malaria transmission across spatial scales andto make sound inferences about the impacts ofclimate change and control/elimination interventionson malaria transmission.
ACKNOWLEDGEMENTS
We thank R. Snow for providing hospital and meteorolo-gical data for Kericho. We also thank the staff at the KenduBay, Maseno, Kisii and Kapsabet hospitals for their helpwith data compilation.
23Shifts and Trends in Highland Malaria
FINANCIAL SUPPORT
This study was supported by a Nagasaki UniversityInstitute of Tropical Medicine cooperative grant andJapan Society for the Promotion of Science.
REFERENCES
Abeku, T. A., De Vlas, S. J., Borsboom, G., Tadege, A., Gebreyesus, Y.,Gebreyohannes, H., Alamirew, D., Seifu, A., Nagelkerke, N. J. D.and Habbema, J. D. F. (2004). Effects of meteorological factors onepidemic malaria in Ethiopia: a statistical modelling approach based ontheoretical reasoning. Parasitology 128, 585–593. doi: 10.1017/s003182004005013.Alonso, D., Bouma, M. J. and Pascual, M. (2011). Epidemic malaria andwarmer temperatures in recent decades in an East African highland.Proceedings of the Royal Society of London, B 278, 1661–1669. doi: 10.1098/rspb.2010.2020.Anyah, R. and Semazzi, F. (2004). Simulation of the sensitivity of LakeVictoria basin climate to lake surface temperatures. Theoretical and AppliedClimatology 79, 55–69.Anyah, R., Semazzi, F. and Xie, L. (2006). Simulated physicalmechanisms associated with multi-scale climate variability over LakeVictoria Basin in East Africa. Monthly Weather Review 134, 3588–3609.Artzy-Randrup, Y., Alonso, D. and Pascual, M. (2010). Transmissionintensity and drug resistance in malaria population dynamics: Implicationsfor Climate Change. PLoS ONE 5, e13588. doi: 10.1371/journal.pone.0013588.Bayoh, M.N., Mathias, D. K., Odiere, M. R., Mutuku, F.M.,Kamau, L., Gimnig, J. E., Vulule, J. M., Hawley, W. A.,Hamel, M. J. and Walker, E. D. (2010). Anopheles gambiae: historicalpopulation decline associated with regional distribution of insecticide-treated bed nets in western Nyanza Province, Kenya.Malaria Journal 9, 62.doi: 10.1186/1475-2875-9-62.Bødker, R., Akida, J., Shayo, D., Kisinza, W., Msangeni, H. A.,Pedersen, E.M. andLindsay, S.W. (2003). Relationship between altitudeand intensity of malaria transmission in the Usambara Mountains,Tanzania. Journal of Medical Entomology 40, 706–717.Bødker, R., Msangeni, H. A., Kisinza, W. and Lindsay, S.W. (2006).Relationship between the intensity of exposure to malaria parasites andinfection in the Usambara Mountains, Tanzania. American Journal ofTropical Medicine and Hygiene 74, 716–723.Chaves, L. F., Kaneko, A. and Pascual, M. (2009). Random, top-down,or bottom-up coexistence of parasites: malaria population dynamics inmulti-parasitic settings. Ecology 90, 2414–2425.Chaves, L. F., Kaneko, A., Taleo, G., Pascual, M. and Wilson, M. L.(2008). Malaria transmission pattern resilience to climatic variability ismediated by insecticide-treated nets. Malaria Journal 7, 100.Chaves, L. F. and Koenraadt, C. J.M. (2010). Climate change andhighland malaria: fresh air for a hot debate. The Quarterly Review of Biology85, 27–55.Chaves, L. F. and Pascual, M. (2006). Climate cycles and forecasts ofcutaneous leishmaniasis, a nonstationary vector-borne disease. PlosMedicine 3, 1320–1328. doi: e29510.1371/journal.pmed.0030295.Chaves, L. F., Taleo, G., Kalkoa, M. and Kaneko, A. (2011).Spleen rates in children: an old and new surveillance tool for malariaelimination initiatives in island settings. Transactions of the Royal Society ofTropical Medicine and Hygiene 105, 226–231. doi: 10.1016/j.trstmh.2011.01.001.Childs, D. Z. and Boots, M. (2010). The interaction of seasonal forcing andimmunity and the resonance dynamics of malaria. Journal of the RoyalSociety Interface 7, 309–319. doi: 10.1098/rsif.2009.0178.Cohen, J.M., Ernst, K. C., Lindblade, K. A., Vulule, J.M., John, C. C.and Wilson, M. L. (2010). Local topographic wetness indices predicthousehold malaria risk better than land-use and land-cover in the westernKenya highlands. Malaria Journal 9, 328. doi: 10.1186/1475-2875-9-328.Drakeley, C. J., Carneiro, I., Reyburn, H., Malima, R.,Lusingu, J. P. A., Cox, J., Theander, T.G., Nkya, W.M.M.M.,Lemnge, M.M. and Riley, E.M. (2005). Altitude-dependent and-independent variations in Plasmodium falciparum prevalence inNortheastern Tanzania. Journal of Infectious Diseases 191, 1589–1598. doi:10.1086/429669.Ernst, K. C., Lindblade, K. A., Koech, D., Sumba, P. O.,Kuwuor, D. O., John, C. C. and Wilson, M. L. (2009). Environmental,socio-demographic and behavioural determinants of malaria risk in thewestern Kenyan highlands: a case–control study. Tropical Medicine
& International Health 14, 1258–1265. doi: 10.1111/j.1365-3156.2009.02370.x.Feikin, D. R., Audi, A., Olack, B., Bigogo, G.M., Polyak, C., Burke, H.,Williamson, J. and Breiman, R. F. (2010). Evaluation of the optimalrecall period for disease symptoms in home-based morbidity surveillance inrural and urban Kenya. International Journal of Epidemiology 39, 450–458.doi: 10.1093/ije/dyp374.Gimnig, J. E., Ombok, M., Kamau, L. and Hawley, W. A. (2001).Characteristics of larval anopheline (Diptera: Culicidae) habitats inWesternKenya. Journal of Medical Entomology 38, 282–288. doi: 10.1603/0022-2585-38.2.282.Hashizume,M., Terao, T. andMinakawa,N. (2009). The Indian OceanDipole and malaria risk in the highlands of western Kenya. Proceedings ofthe National Academy of Sciences, USA 106, 1857–1862. doi: 10.1073/pnas.0806544106.Hay, S. I., Myers, M. F., Burke, D. S., Vaughn, D.W., Endy, T.,Ananda, N., Shanks, G. D., Snow, R.W. and Rogers, D. J. (2000).Etiology of interepidemic periods of mosquito-borne disease. Proceedings ofthe National Academy of Sciences, USA 97, 9335–9339. doi: 10.1073/pnas.97.16.9335.Hay, S. I., Noor, A.M., Simba, M., Busolo, M., Guyatt, H. L.,Ochola, S. A. and Snow, R.W. (2002a). Clinical epidemiology of malariain the highlands of western Kenya. Emerging Infectious Diseases 8, 543–548.Hay, S. I., Simba, M., Busolo, M., Noor, A.M., Guyatt, H. L.,Ochola, S. A. and Snow, R.W. (2002b). Defining and detecting malariaepidemics in the highlands of western Kenya.Emerging Infectious Diseases 8,555–562.John, C. C., Ouma, J. H., Sumba, P. O., Hollingdale, M. R.,Kazura, J.W. and King, C. L. (2002). Lymphocyte proliferation andantibody responses to Plasmodium falciparum liver-stage antigen-1 in ahighland area of Kenya with seasonal variation in malaria transmission. TheAmerican Journal of Tropical Medicine and Hygiene 66, 372–378.John, C. C., Riedesel, M. A., Magak, N. G., Lindblade, K. A.,Menge, D.M., Hodges, J. S., Vulule, J.M. and Akhwale, W. (2009).Possible interruption of malaria transmission, Highland Kenya, 2007–2008.Emerging Infectious Diseases 15, 1917–1924. doi: 10.3201/eid1512.090627.Kaneko, A., Taleo, G., Kalkoa, M., Yamar, S., Kobayakawa, T. andBjörkman, A. (2000).Malaria eradication on islands.TheLancet 356, 1560–1564.Kaneko, A., Taleo, G., Kalkoa, M., Yaviong, J., Reeve, P. A.,Ganczakowski, M., Shirakawa, C., Palmer, K., Kobayakawa, T. andBjörkman, A. (1998). Malaria epidemiology, glucose 6-phosphate dehy-drogenase deficiency and human settlement in the Vanuatu Archipelago.Acta Tropica 70, 285–302. doi: 10.1016/s0001-706x(98)00035-7.Koenraadt, C. J.M., Paaijmans, K. P., Schneider, P., Githeko, A. K.and Takken, W. (2006). Low larval vector survival explains unstablemalaria in the western Kenya highlands. Tropical Medicine & InternationalHealth 11, 1195–1205. doi: 10.1111/j.1365-3156.2006.01675.x.Levins, R. (2006). Strategies of abstraction. Biology & Philosophy 21, 741–755. doi: 10.1007/s10539-006-9052-8.Lewontin, R. C. and Levins, R. (1989). On the characterization of densityand resource availability. American Naturalist 134, 513–524.Lindblade, K. A., Eisele, T. P., Gimnig, J. E., Alaii, J. A.,Odhiambo, F., ter Kuile, F. O., Hawley, W. A.,Wannemuehler, K. A., Phillips-Howard, P. A., Rosen, D. H.,Nahlen, B. L., Terlouw, D. J., Adazu, K., Vulule, J. M. andSlutsker, L. (2004). Sustainability of reductions in malaria transmissionand infant mortality in Western Kenya with use of insecticide-treatedbednets. JAMA: The Journal of the American Medical Association 291,2571–2580. doi: 10.1001/jama.291.21.2571.Lindblade, K. A., Katungu, J. and Wilson, M. L. (2001). Fever andmalaria in highland Uganda. Transactions of the Royal Society of TropicalMedicine and Hygiene 95, 502–503.Lindblade, K. A., Walker, E. D., Onapa, A.W., Katungu, J. andWilson, M. L. (1999). Highland malaria in Uganda: prospective analysisof an epidemic associated with El Niño. Transactions of the Royal Society ofTropical Medicine and Hygiene 93, 480–487.Lindblade, K. A., Walker, E. D., Onapa, A.W., Katungu, J. andWilson, M. L. (2000). Land use change alters malaria transmissionparameters by modifying temperature in a highland area of Uganda.Tropical Medicine & International Health 5, 263–274.Lindsay, S.W. and Birley, M.H. (1996). Climate change and malariatransmission. Annals of Tropical Medicine and Parasitology 90, 573–588.Lindsay, S.W. and Martens, W. J.M. (1998). Malaria in the Africanhighlands: past, present and future. Bulletin of the World HealthOrganization, 76, 33–45.McCallum, H., Barlow, N. and Hone, J. (2001). How should pathogentransmission be modelled? Trends in Ecology & Evolution 16, 295–300.
24Luis Fernando Chaves and others
Menge, D.M., Ernst, K. C., Vulule, J. M., Zimmerman, P. A., Guo, H.and John, C. C. (2008). Microscopy underestimates the frequency ofPlasmodium falciparum infection in symptomatic individuals in a lowtransmission highland area. The American Journal of Tropical Medicine andHygiene 79, 173–177.Minakawa, N., Munga, S., Atieli, F., Mushinzimana, E., Zhou, G.,Githeko, A. K. and Yan, G. (2005a). Spatial distribution of anophelinelarval habitats in western Kenyan highlands: effects of land cover types andtopography. The American Journal of Tropical Medicine and Hygiene 73,157–165.Minakawa, N., Omukunda, E., Zhou, G., Githeko, A. and Yan, G.(2006). Malaria vector productivity in relation to the highland environmentin Kenya. American Journal of Tropical Medicine and Hygiene 75, 448–453.doi: 75/3/448 [pii].Minakawa,N., Sonye, G.,Mogi,M., Githeko, A. and Yan, G. Y. (2002).The effects of climatic factors on the distribution and abundance of malariavectors in Kenya. Journal of Medical Entomology 39, 833–841.Minakawa, N., Sonye, G. and Yan, G. (2005b). Relationships betweenoccurrence of Anopheles gambiae s.l. (Diptera: Culicidae) and size andstability of larval habitats. Journal of Medical Entomology 42, 295–300.Molineaux, L., Storey, J., Cohen, J. E. and Thomas, A. (1980). Alongitudinal study of human malaria in the west African savanna in theabsence of control measures: relationships between different Plasmodiumspecies, in particular P. falciparum and P. malariae.The American Journal ofTropical Medicine and Hygiene 29, 725–737.Munyekenye, O. G., Githeko, A. K., Zhou, G., Mushinzimana, E.,Minakawa, N. and Yan, G. (2005). Spatial analysis of Plasmodiumfalciparum infections in western Kenya Highlands. Emerging InfectiousDiseases 10, 1571–1577.Ofulla, A. V., Moormann, A.M., Embury, P. E., Kazura, J.W.,Sumba, P. O. and John, C. C. (2005). Age-related differences in thedetection of Plasmodium falciparum infection by PCR andmicroscopy, in anarea of Kenya with holo-endemic malaria. Annals of Tropical Medicine andParasitology 99, 431–435. doi: 10.1179/136485905x36316.Paaijmans, K. P., Wandago, M. O., Githeko, A. K. and Takken, W.(2007). Unexpected high losses of Anopheles gambiae larvae due to rainfall.PLoS ONE, 2, e1146. doi: 10.1371/journal.pone.0001146.Pascual, M. and Bouma, M. J. (2009). Do rising temperatures matter?Ecology 90, 906–912.Pascual, M., Cazelles, B., Bouma, M. J., Chaves, L. F. and Koelle, K.(2008). Shifting patterns: malaria dynamics and rainfall variability in anAfrican highland. Proceedings of the Royal Society of London, B 275, 123–132. doi: 10.1098/rspb.2007.1068.Patz, J. A. and Olson, S. H. (2006). Malaria risk and temperature:influences from global climate change and local land use practices.Proceedings of the National Academy of Sciences, USA 103, 5635–5636.
Ploberger, W., Krämer, W. and Kontrus, K. (1989). A new test forstructural stability in the linear regression model. Journal of Econometrics 40,307–318.Prothero, R.M. (1965). Migrants and Malaria. Longmans, London, UK.Reiter, P. (2008). Global warming and malaria: knowing the horse beforehitching the cart. Malaria Journal 7, S3.Saji, N. H., Goswami, B. N., Vinayachandran, P. N. and Yamagata, T.(1999). A dipole mode in the tropical Indian Ocean. Nature, London 401,360–363.Saji, N. H. and Yamagata, T. (2003). Possible impacts ofIndian Ocean Dipole mode events on global climate. Climate Research 25,151–169.Shanks, G., Biomndo, K., Hay, S. and Snow, R. (2000). Changingpatterns of clinical malaria since 1965 among a tea estate population locatedin the Kenyan highlands. Transactions of the Royal Society of TropicalMedicine and Hygiene 94, 253–55.Shanks, G. D., Hay, S. I., Omumbo, J. A. and Snow, R.W. (2005).Malaria in Kenya’s western highlands. Emerging Infectious Diseases 11,1425–1432.Shanks, G. D., Hay, S. I., Stern, D. I., Biomndo, K. and Snow, R.W.(2002). Meteorologic influences on Plasmodium falciparum malaria in thehighland tea estates of Kericho, western Kenya. Emerging Infectious Diseases8, 1404–1408.Shumway, R. H. and Stoffer, D. S. (2000). Time Series Analysis and itsApplications. Springer, New York, USA.Silver, J. B. (2008). Mosquito Ecology: Field Sampling Methods, 3rd Edn.Springer, New York, USA.Teklehaimanot, H. D., Lipsitch, M., Teklehaimanot, A. andSchwartz, J. (2004). Weather-based prediction of Plasmodium falciparummalaria in epidemic-prone regions of Ethiopia I. Patterns of lagged weathereffects reflect biological mechanisms. Malaria Journal 3, 41. doi: 10.1186/1475-2875-3-41.Verschuren, D., Johnson, T. C., Kling, H. J., Edgington, D. N.,Leavitt, P. R., Brown, E. T., Talbot, M. R. and Hecky, R. E. (2002).History and timing of human impact on Lake Victoria, East Africa.Proceedings of the Royal Society of London, B 269, 289–294. doi: 10.1098/rspb.2001.1850.Zhou, G., Afrane, Y. A., Vardo-Zalik, A.M., Atieli, H., Zhong, D.,Wamae, P., Himeidan, Y. E., Minakawa, N., Githeko, A. K. andYan, G. (2011). Changing patterns of malaria epidemiology between 2002and 2010 in Western Kenya: the fall and rise of malaria. PLoS ONE 6,e20318.Zhou, G., Minakawa, N., Githeko, A. K. and Yan, G. Y. (2004).Association between climate variability and malaria epidemics in the EastAfrican highlands. Proceedings of the National Academy of Sciences, USA101, 2375–2380. doi: 10.1073/pnas.0308714100.
25Shifts and Trends in Highland Malaria
Related Documents