Regenerative potential of prostate luminal cells revealed by single-cell analysis The MIT Faculty has made this article openly available. Please share how this access benefits you. Your story matters. As Published 10.1126/SCIENCE.AAY0267 Publisher American Association for the Advancement of Science (AAAS) Version Author's final manuscript Citable link https://hdl.handle.net/1721.1/136008 Terms of Use Article is made available in accordance with the publisher's policy and may be subject to US copyright law. Please refer to the publisher's site for terms of use.

Welcome message from author
This document is posted to help you gain knowledge. Please leave a comment to let me know what you think about it! Share it to your friends and learn new things together.
Transcript
Regenerative potential of prostate luminalcells revealed by single-cell analysis
The MIT Faculty has made this article openly available. Please share how this access benefits you. Your story matters.
As Published 10.1126/SCIENCE.AAY0267
Publisher American Association for the Advancement of Science (AAAS)
Version Author's final manuscript
Citable link https://hdl.handle.net/1721.1/136008
Terms of Use Article is made available in accordance with the publisher'spolicy and may be subject to US copyright law. Please refer to thepublisher's site for terms of use.
Regenerative potential of prostate luminal cells revealed by single cell analysis
Wouter R. Karthaus1,§, Matan Hofree2,§, Danielle Choi1, Eliot L. Linton1, Mesruh Turkekul7, Alborz Bejnood2, Brett Carver1, Anuradha Gopalan1, Wassim Abida1, Vincent Laudone1, Moshe Biton2, Ojasvi Chaudhary3, Tianhao Xu3, Ignas Masilionis3, Katia Manova7, Linas Mazutis3, Dana Pe’er3,6, Aviv Regev2,4,5, Charles L. Sawyers1,4
1Human Oncology and Pathogenesis Program, Memorial Sloan Kettering Cancer Center, New York, NY 10065, USA
2Klarman Cell Observatory, Broad Institute of MIT and Harvard, Cambridge, MA 02142, USA
3Program for Computational and Systems Biology, Sloan Kettering Institute, Memorial Sloan Kettering Cancer Center, New York, NY 10065, USA
4Howard Hughes Medical Institute
5Koch Institute of Integrative Cancer Research, Department of Biology, Massachusetts Institute of Technology, Cambridge, MA 02139, USA
6Parker Institute for Cancer Immunotherapy, Memorial Sloan Kettering Cancer Center, New York, NY 10065, USA
7Molecular Cytology, Memorial Sloan Kettering Cancer Center, New York, NY 10065, USA
Abstract
Androgen deprivation is the cornerstone of prostate cancer treatment, resulting in involution of the
normal gland to ~90% its original size due to loss of luminal cells. The prostate regenerates when
androgen is restored, a process postulated to involve stem cells. Using single cell RNA-
sequencing, we identify a rare luminal population in the mouse prostate that expresses stem-like
genes (Sca1+, Psca+) and a large population of differentiated cells (Nkx3.1+, Pbsn+). In organoids
Corresponding author: [email protected] (A.R.); [email protected] (C.L.S).Author Contributions: W.R.K & C.L.S conceived the project. W.R.K. designed the experiments. W.R.K. performed stainings and confocal microscopy. W.R.K., M.H., A.R & C.L.S wrote the manuscript. W.R.K, D.C, and E.L.L. performed all mouse work. W.R.K performed organoid work. M.H., A.B. performed bioinformatics analyses. W.K., M.H., A.R and C.L.S interpreted the data. M.T. performed IHC and RNA FISH. B.C. A.G. W.A. provided human prostate samples. M.B., O.C., I.M, O.C. and T.X. performed single cell sequencing. L.M., D.P. oversaw the single cell sequencing experiments. A.R, C.L.S oversaw the project.§Equal contribution to this work
Competing interests: C.L.S is on the Board of Directors of Novartis; is a cofounder of ORIC Pharmaceuticals and is a co-inventor of the prostate cancer drugs enzalutamide and apalutamide, covered by US patents 7,709,517; 8,183,274; 9,126,941; 8,445,507; 8,802,689; 9,388,159 filed by the University of California; C.L.S. is on the Scientific Advisory Boards of the following biotechnology companies: Agios, Beigene, Blueprint, Column Group, Foghorn, Housey Pharma, Nextech, KSQ Therapeutics, Petra Pharma, and PMV Pharma; and is a cofounder of Seragon Pharmaceuticals, purchased by Genentech/Roche in 2014. A.R. is a co-founder of and equity holder of Celsius Therapeutics, equity holder of Immuntias, and is on the Scientific Advisory Boards of Syros Pharmaceuticals, Neogene Therapeutics, ASIMOV Biotechnology and ThermoFisher Scientific. W.R.K. is a coinventor on patent WO2012168930A2 filed by Koninklijke Nederlandse Akademie Van Wetenschappen that covers organoid technology.
Data and Materials availability: Gene expression data (raw and/or processed data) are available at GEO and DUOS (accession numbers are pending).
HHS Public AccessAuthor manuscriptScience. Author manuscript; available in PMC 2020 November 01.
Published in final edited form as:Science. 2020 May 01; 368(6490): 497–505. doi:10.1126/science.aay0267.
Author M
anuscriptA
uthor Manuscript
Author M
anuscriptA
uthor Manuscript
and in mice, both populations contribute equally to prostate regeneration, partly through androgen-
driven expression of growth factors (Nrg2, Rspo3) by mesenchymal cells acting in a paracrine
fashion on luminal cells. Analysis of human prostate tissue revealed similar differentiated and
stemlike luminal subpopulations that likewise acquire enhanced regenerative potential after
androgen ablation. We propose that prostate regeneration is driven by nearly all persisting luminal
cells, not just by rare stem cells.
Epithelial tissue homeostasis, at steady state or in response to injury, depends on
replenishment of cells by stem cell populations. Whether such stem cells are rare cells with
multilineage and self-renewal potential or are recruited from lineage committed cells
(facultative stem cells) varies across different tissues (1). The normal prostate gland includes
luminal epithelial cells, basal epithelial cells and rare neuroendocrine cells, surrounded by
stroma and vasculature (2, 3). After surgical or pharmacological castration (a common
treatment for advanced prostate cancer), the prostate involutes to approximately 90% of its
size, mainly due to loss of luminal epithelial cells (3, 4). Upon exogenous addition of
testosterone, the mouse prostate fully regenerates with four weeks, which has sparked efforts
to identify an underlying stem cell population (4–6). To provide further insight into this
question, we used single cell RNA-seq (scRNA-seq) to characterize cell types in the murine
and human prostate and track their gene expression programs during castration and, in
mouse, during regeneration.
Results
To characterize the different cell populations of the prostate, we collected droplet-based
scRNA-seq profiles from 13,398 cells from the mouse prostate (concentrating initially on the
anterior lobe), without fluorescence-activated cell sorting (FACS). We identified 15 distinct
cell subsets by unsupervised graph clustering (Fig. 1A and fig. S1, a and b), with further
partitioning to 22 subsets, spanning 6 epithelial and 16 non-epithelial subsets (fig. S1, d to f
and fig. S2). To ensure adequate representation of all epithelial cells, we also profiled
Epcam-positive and negative cells isolated by FACS, but found substantial reduction in
quality and near-complete loss of two luminal populations (fig S1c). We therefore conducted
all subsequent experiments using whole mouse prostate anterior lobe without enrichment.
We annotated each of the six epithelial subsets by the expression of marker genes, revealing
three seminal vesicle (SV) subsets, a basal subset, and three luminal subsets. The SV subsets
(fig. S1e) were defined by two small clusters with high expression of Pax2, Pate4 and
Calml3, known epididymal genes, which were likely carried over during surgical dissection
due to the anatomical proximity of the SV to the prostate lobes. One large subset consisted
of basal cells marked by expression of the canonical genes Trp63, Krt5 and Krt14 (fig. S1f).
Finally, there were three subsets of luminal cells: a large population and two smaller subsets,
all three expressing the canonical luminal markers CD24a, Krt8 and Krt18 (fig. S1f), labeled
as luminal 1, 2 and 3 cells (L1, L2, L3), respectively.
The non-epithelial subsets revealed previously unappreciated complexity in the stromal
compartment, specifically the identification of two mesenchymal subpopulations (designated
M1 and M2), myofibroblasts and smooth muscle cells. The mesenchymal populations were
Karthaus et al. Page 2
Science. Author manuscript; available in PMC 2020 November 01.
Author M
anuscriptA
uthor Manuscript
Author M
anuscriptA
uthor Manuscript
distinguished by expression of ligands and/or receptors known to be associated with
epithelial growth and differentiation such as Wnt2, Wnt6, Wnt10a and RorB (in M1 cells)
and Rspo1, Fgf10 and Sultle1 (in M2 cells) (fig. S2b). In addition to M1 and M2, we
identified myofibroblasts and smooth muscle populations based on expression of canonical
contractile genes, such as Acta2 and MyH11. These cells separately expressed Rspo3 or
Notch3 (fig. S2e), revealing a level of complexity greater than that suggested previously (7).
Importantly, all these populations expressed the gene encoding the androgen receptor,
suggestive of hormone-driven communication with epithelial cells (discussed later). We also
identified multiple immune populations, such as B and T lymphocytes, natural killer (NK)
cells, dendritic cells (Xcr1) and four subpopulations of monocytes/macrophages (CD14,
IBA1). Other cells types included vascular endothelial cells (CD31), lymphatic endothelial
cells (CD31, Prox1) and glial cells (Sox10) (fig. S2, b and c). We did not observe a distinct
neuroendocrine cluster, most likely due to the rarity of neuroendocrine cells (fig. S2, d).
Of the three luminal subpopulations, L1 cells are predominant (~96% of profiled luminal
cells) and express high levels of canonical androgen receptor target genes, such as Pbsn and
Nkx3.1, as well as CD26/Dpp4+, CD59a and CD133/Prom1 (Fig. 1B and fig. S3, a and b).
Although Ll cells form a single subset using unsupervised graph clustering (tSNE), there is
variation within the subset as revealed by hierarchical clustering of differentially expressed
genes (fig S3, d). In contrast, L2 (~3%) and L3 (1%) are distinct minority luminal
populations. L2 cells express Sca1/Ly6a, Tacstd2/Trop2 and Psca, all of which have been
previously associated with stem cell-like activity, as well as Krt4 and Claudin10 (Fig. 1B
and fig. S3 a, b and h). L3 cells are defined by expression of the transcription factor Foxi1, a
master regulator of subunits of the vacuolar ATPase proton pump, such as Atp6v1g3 and
Atp6b1b (8), both of which are strongly expressed in these cells (Fig. 1B and fig. S3, a and
b). We and others have recently identified Foxi1+pulmonary ionocytes with similar features
to those of cells in the gills of freshwater fish that regulate ion transport (19,20). Pulmonary
ionocytes regulate salt balance in airway secretions and may be implicated in the
pathophysiology of cystic fibrosis (9, 10). We also detected Foxil-expressing cells among the
Pax2+ SV population (fig. S3a). Male Foxi1 null mice are infertile due to failure to properly
acidify the epididymal fluid (11).
In situ analysis revealed that L1 cells (CD26/Dpp4+CD133/Prom1+) are almost exclusively
found in the distal prostate ducts, whereas L2 cells (Trop2+) are predominantly located in
the proximal prostate (Fig. 1C and fig. S3, e to h), a pattern consistent with prior studies of
Psca+ or Sca1high/Ly6a+ cells (12, 13). Notably, the spatial transition from L2 to L1 cells is
abrupt when moving distally along a proximal duct (Fig. 1D), suggesting that anatomically
localized inductive signals have a role in defining L1 versus L2 cell fates. In contrast,
ionocyte-like L3 cells are interspersed in both proximal and distal locations (Fig. 1C). The in situ pattern for L1, L2 and L3 cells was similar in the dorsolateral prostate but not in the
ventral prostate, where we observed an expanded number of Trop2+ and Claudin10+ L2
cells, indicative of variability in the relative percentage of L1 and L2 cells in different lobes
(fig. S4).
Karthaus et al. Page 3
Science. Author manuscript; available in PMC 2020 November 01.
Author M
anuscriptA
uthor Manuscript
Author M
anuscriptA
uthor Manuscript
Gene expression changes in the mouse prostate across a castration/regeneration cycle
Because the murine prostate gland can fully regenerate after castration-induced involution,
there has been considerable interest in defining potential stem cells underlying this
regeneration. While a fraction of luminal cells are known to persist post castration (14, 15),
little is known about their transcriptional features relative to those in hormonally intact mice.
The small fraction of L2 cells (~3%) relative to L1 cells, together with prior data implicating
the L2-expressed genes Sca1/Ly6a, Psca and Tacstd2/Trop2 as prostate stem cell markers
(13, 16), prompted us to investigate whether L2 cells function as stem cells in regeneration.
To this end, we collected scRNA-seq profiles of the mouse prostate throughout a complete
castration/regeneration (C/R) cycle (Fig. 2A and fig. S5, a and b). We first compared the
relative frequency of L1 and L2 cells in castrate mice using FACS with cell surface markers
that distinguish between L1 (CD26/Dpp4; CD133/Prom1) and L2 (Sca1/Ly6a) cells. L2
cells were 2-3 fold enriched in castrate versus intact mice, consistent with a potential stem
cell role (12); however, the majority (>50%) of persistent luminal cells (CD24+; CD49f−)
were L1 (CD26/Dpp4+; CD133/Prom1+) (fig. S5, c to e).
Computational analysis of transcriptomes across the C/R cycle revealed, based on
scatterplots of L1 versus L2 signature scores, that L1 cells gain features remarkably similar
to L2 cells after castration (day 28) but revert back to baseline during regeneration (Fig. 2B
and fig. S6, c). This result is seen using both raw and scaled classification scores (fig. S6, d)
and is further supported by pairwise correlation of L1 and L2 expression profiles, which
peak on day 28 post-castration then decline during regeneration (fig. S6b). In addition,
hierarchical clustering based on program genes showed that L1 and L2 cells co-cluster 28
days post-castration and 1 day into regeneration, but not at other time points (fig. S7). In
contrast, L3 cells remain distinct from L1 and L2 throughout this cycle despite robust
androgen receptor expression (p<0.05, Wilcoxon rank-sum test) (fig. S6, b to d). Finally,
when visualized by PHATE (17), a graph-diffusion based 2D embedding approach that
preserves global distance relationships, transcriptional profiles of L1 and L2 cells are closely
embedded day 28 post-castration but separated by day 28 postregeneration (Fig. 2C and fig.
S6a). Similar co-embedding was also observed with other dimensionality reduction methods
(fig. S5b). One reason for the similarity in transcriptional features of L1-L2 cells post
castration is loss of androgen receptor-regulated transcription, which contributes
substantially to the distinction between these two populations in the presence of androgen.
For example, there is a dramatic decline in the expression of CD59a and Nkx3.1 in L1 cells,
and of Psca in L2 cells. On the other hand, genes whose transcription is not dependent on the
androgen receptor, such as CD26/Dpp4 and Sca1/Ly6a, maintain L1 and L2-specific
expression (fig. S8b), indicating that the two populations remain distinct.
Enhanced regenerative potential of luminal cells in mouse organoid culture
In light of the overlapping transcriptomic features of L1 and L2 cells following castration,
we explored the relative contribution of each to regeneration, starting with an analysis of
their recruitment into cell cycle following androgen (testosterone) addback. Strikingly, 68%
of L1 cells and 45% of L2 cells had a surge in Ki67 transcript expression (a marker of
proliferating cells), just 2 days after implantation of testosterone pellets; in addition, there
Karthaus et al. Page 4
Science. Author manuscript; available in PMC 2020 November 01.
Author M
anuscriptA
uthor Manuscript
Author M
anuscriptA
uthor Manuscript
was increased expression of G1/S and G2/M cell cycle gene sets (p<0.05, Wilcoxon rank-
sum test) (Fig. 2D and fig. S5, f and g). These findings are confirmed in situ, based on robust
Ki67 staining throughout the prostate 2 to 3 days after androgen addback, particularly in the
distal gland where L1 cells reside (Fig. 2E and fig. S9). L3 cells and basal epithelial cells
also showed increased Mki67 expression but at more modest levels (11% and 15%
respectively; p<0.05, Wilcoxon rank-sum test) (Fig. 2D and fig. S5h).
The fact that so many luminal cells rapidly enter the cell cycle during the C/R cycle
suggested to us that a larger number of persisting cells might contribute to regeneration than
would be predicted from a conventional stem cell model. As a first test of this hypothesis,
we measured the organoid regeneration potential of a pan-luminal epithelial cell population
(CD24+, CD49f−) from castrate mice and from mice after 1, 2 or 3 days of androgen
addback. We observed an increase in the efficiency of organoid formation from ~5% to
>20% within 2 days (fig. S10a). To dissect the relative roles of L1 and L2 cells in this
regeneration, we isolated L1 cells (CD26/Dpp4+ or CD133/Prom1+) and L2 cells (Sca1/
Ly6a+) at different time points along the C/R cycle and compared their organoid formation
potential. L2 cells from intact mice showed superior organoid formation (910%) compared
to L1 cells (~4%) (p< 0.05, t-test) (Fig. 3A), as expected from prior studies of Sca1/Ly6a+
cells (12). However, L1 cells generated 2-fold more organoids in the castrate setting (~9%;
p<0.05, t-test), with a further doubling (~20%) 2 days into regeneration (p<0.05, t-test) (Fig.
3A and B, fig. S10, b and c). L2 cells also generated more organoids 2 days post
regeneration (Fig. 3B), but the change post-castration was not significant (Fig. 3A). In
addition, both L1- and L2-derived organoids gave rise to Krt5+ basal cells (Fig. 3C; fig.
S10d), indicative of their bi-lineage potential. L1-derived organoids also displayed more
polarized morphology and thicker walls, consistent with their more differentiated gene
expression profile in hormonally intact glands (Fig. 3C; fig. S10d). Of note, regeneration
potential was not influenced by dihydrotestosterone (DHT) in the organoid culture medium
(p>0.05, t-test) (Fig. 3B), despite robust androgen receptor expression in L1 and L2 cells.
This result suggests that the effect of in vivo testosterone supplementation on luminal cell
regeneration is indirect, which we address further below.
Lineage tracing of luminal cells during murine prostate regeneration
To determine the contribution of persisting luminal cells to prostate regeneration in vivo, we
conducted a lineage tracing experiment by crossing the Rosa26/four-color Confetti allele
(18) with the luminal-specific Krt8 CreERT2 driver (19) (Fig. 3D). In contrast to prior lineage
tracing experiments using a prostate-specific antigen Cre driver (20), Krt8 expression is
robust in luminal cells after castration, as shown by successful marking of single luminal
cells throughout the prostate (~6%) one week after injecting mice with tamoxifen (Fig. 3E,
fig. S11a, and table S1 and S2a). We were unable to identify any labeled basal cells (3 mice,
n=1,204 cells), indicative of the specificity of the K8-Cre driver for luminal cells (table S1a,
fig. S 11b). To determine the relative contribution of labeled cells to regeneration, we
examined fully reconstituted prostate glands 4 weeks after androgen addback. Analysis of
~450 clones from each of three independent mice revealed an average clone size of ~4.5
cells (4.40 ± 0.39, 95% confidence intervals), indicative of 2-3 doublings per cell. The
different clones were distributed throughout the proximal and distal regions of individual
Karthaus et al. Page 5
Science. Author manuscript; available in PMC 2020 November 01.
Author M
anuscriptA
uthor Manuscript
Author M
anuscriptA
uthor Manuscript
prostate ducts, suggesting that they each arose locally rather than by migration from
proximal ‘stem-like’ cells (Fig. 3E and F, fig. S11c to e, and table S2). Moreover, the
number of labeled luminal cells remained constant (~6%) after 28 days (table S6a),
suggesting they contribute uniformly to the regenerated gland. Proximal clones were slightly
smaller (3.47 cells ± 0.21) than the overall clone size (4.4 cells ± 0.35, p <0.05 Welch’s t-
test) (table S5b). In situ analysis using L1 (CD26/Dpp4) and L2 (Tacstd2/Trop2) specific
markers revealed that the majority of clones (located distally) are composed of L1 cells,
whereas proximal clones are composed exclusively of L2 cells. Rare Krt5+ basal cells were
detected in some clones (<1% tracing events) (table S1c) indicating luminal cells retain bi-
lineage potential during regeneration (fig. S11c).
Mesenchymal-derived growth factors support luminal cell growth in organoid culture
To address the discrepancy between the effects of androgen addback in vivo (which greatly
enhanced the clonogenicity of L1 cells in organoid culture) versus androgen
supplementation in vitro (which had no effect), we postulated that the effect of in vivo androgen addback is indirect, despite robust androgen receptor expression in L1 cells.
Indeed, early work using renal capsule tissue recombination assays reported an essential role
of androgen receptor in mesenchymal cells in prostate regeneration, demonstrating the
importance of androgen-regulated mesenchymal growth factors (21). More recent studies of
conditional Ar deletion have shown that androgen receptor is dispensable for luminal
regeneration after castration but is required for certain functions, such as proliferation of
castration-resistant Nkx3.1-expressing luminal cells (CARNs) (22).
To address this question, we examined the effect of in vivo androgen addback on non-
epithelial cells and observed profound transcriptional changes in M1 and M2 mesenchymal
subpopulations during the C/R cycle (fig. S12, a and b), similar in extent to the changes seen
in luminal cells (Fig. 2C) and in basal cells (fig. S12b). We reasoned that reciprocal changes
in the levels of ligands and/or cognate receptors may provide clues to cell-cell circuits that
drive prostate regeneration. We thus searched for changes in androgen-dependent expression
of previously annotated ligand/receptor pairs (23) across the complete C/R cycle in all cells
in the prostate. Between every pair of cell subtypes (e.g., L1 and M2), we tested the
enrichment of receptor-ligand pairs that are differentially expressed across the subtypes
(table S3). Among the most dramatic changes in ligand expression at the mRNA level were
neuregulin 2 (Nrg2)(M1 and smooth muscle 1), insulin-like growth factor 1 (Igf1)(M1 and
M2), fibroblast growth factor 10 (Fgf10)(M2) and r-spondin 3 (Rspo3)(smooth muscle 1)
(Fig. 4A, fig. S12c), with corresponding changes in fibroblast growth factor receptor 2
(Fgfr2) and leucine rich repeat containing G protein-coupled receptor 4 (Lgr4) expression,
primarily in L1 cells. All these signaling pathways are implicated in prostate development
(24–27). We also observed a modest increase in epidermal growth factor (Egf) ligand
expression by L1 cells within 24 hours of androgen addback that peaked after full
reconstitution. This is noteworthy because EGF is a key component of epithelial organoid
culture media (Fig. 4A, fig. S12c). We confirmed the spatiotemporal expression of these
growth factors in situ during the C/R cycle using RNA fluorescence in situ hybridization
(RNA-FISH) (Fig. 4B, fig. S13).
Karthaus et al. Page 6
Science. Author manuscript; available in PMC 2020 November 01.
Author M
anuscriptA
uthor Manuscript
Author M
anuscriptA
uthor Manuscript
To test the functional impact of these mRNA expression changes, we compared the organoid
generation potential of L1 and L2 cells isolated from castrated mice in standard medium
(with EGF, Noggin, R-spondin, A83) to new media conditions guided by the growth factor
expression changes identified by single cell analysis (Fig. 4C, fig. S14a). Nrg stimulated
growth 10-fold in L1 cells and 5-fold in L2 cells, even when androgen receptor signaling
was pharmacologically inhibited by enzalutamide. Histologically, Nrg-treated organoids had
larger lumens with more polarized luminal cells, a phenotype that was inhibited by
enzalutamide (fig. S12e and fig. S14b). Fgf10 had a more modest effect on growth (2-fold
over background), whereas Igf1 was inactive (Fig. 4C, fig. S12e and fig. S14a).
Combinations of Erg+Nrg or Egf+Fgf10 stimulated growth and lumen size even more
potently, at levels 2 to 3-fold above those seen with Egf alone (Fig. 4D, fig. S12f and fig.
S14c). These growth factors were similarly active in promoting growth of normal human
prostate organoids, indicative of cross-species conservation (Fig. 4E, fig. S12, g and h, and
fig. S14, d and e).
Luminal subpopulations are present in human prostate, with enhanced regenerative properties after androgen ablation
To determine if the castration-induced changes in the regenerative potential of murine
luminal cells extends to human prostate, we isolated luminal populations from prostate
samples derived from men who were treated for prostate cancer by radical prostatectomy
after receiving androgen deprivation therapy (ADT) (fig. S15a). We focused specifically on
histologically normal regions to minimize contamination with tumor cells. As controls, we
isolated luminal cells samples from five hormonally intact prostate cancer patients treated
with radical prostatectomy. CD26/DPP4+ cells isolated from ADT-treated patients displayed
a 3-fold increase in organoid formation (14.6 ± 3.9%) compared to those from the
hormonally intact patients (4.9± 2.5%) (p< 0.05, Welch’s t-test) (Fig. 5A and fig. S15b),
consistent with our findings with mice. Moreover, these CD26/DPP4+ cells can give rise to
PSCA+ luminal cells and CK5+ basal cells, indicative of their multipotency in vitro (Fig. 5B
and fig. S15c).
To determine the effect of androgen withdrawal on RNA expression in the human prostate,
we generated scRNA-Seq profiles from the histologically normal regions of eight of these
samples (four hormonally intact, four ADT-treated) (Fig. 5C). To ensure that our analysis
was restricted to normal cells (and not tumor cells), we inferred single cell DNA copy
number alterations (CNA) profiles based on expression of genes from large genomic regions
(28). CNAs typical of those seen in primary prostate cancer, such as 3p14, 8p, 8q, 13q and
16q (29), were faithfully identified by inferCNV in luminal cells from samples with
histologically confirmed tumor cells (e.g., intact sample 2, ADT sample 3) (fig. S16 and fig.
S17). However, cells with predicted CNAs consistent with known prostate cancer alterations
were also detected in histologically normal regions at frequencies ranging from 17 to 50% of
luminal cells in the hormonally intact patients. Although some of these cells clustered by
their expression profiles with their copy neutral counterparts (fig. S18) and therefore may be
false positives, we conservatively filtered all CNA-predicted cells from all subsequent
analyses to ensure that we focused on normal prostate cells.
Karthaus et al. Page 7
Science. Author manuscript; available in PMC 2020 November 01.
Author M
anuscriptA
uthor Manuscript
Author M
anuscriptA
uthor Manuscript
Unsupervised clustering defined 20 cell subsets in the hormonally intact prostate.
Reminiscent of the murine prostate, B cell, T cell, NK cell, macrophage and dendritic cell
populations were present in all samples (fig. S19a). The stromal compartment contained
vascular and lymphatic endothelium, glia, and two distinct smooth muscle and mesenchymal
populations expressing WNT2, FGF10 or RSPO3 (fig. S20). We identified four distinct
epithelial clusters (two basal, two luminal) and one small neuroendocrine cluster (fig. S19, b
to d). The two basal cell clusters share expression of the canonical basal markers KRT5+ and
TP63+ and are primarily distinguished by expression of KRT13+. Basal cells expressing
KRT13+ have previously been observed in the lung trachea in unique histological structures
termed “hillocks” (9, 30). The larger luminal population shares features with L1 cells in the
mouse, such as expression of secretory and AR-regulated genes (CD26/DPP4high,
KLK3/PSAhigh, PLA2G2A+). The smaller luminal population is more stem-like (PSCA+,
KRT4+), reminiscent of L2 cells in the mouse, and is primarily distinguished by expression
of the secretoglobulin family gene SCGB1A1+. Murine Scgb1a1 is a marker of club cells, a
subpopulation in the lung with long term repopulating activity (31, 32) (Fig. 5D, fig. S19b,
fig. S21 and fig. S22). Luminal cells expressing both L1 (PLA2G2Alow) and L2 (PSCA)
markers were detected in some samples (fig. S19b and fig. S21). These are unlikely to be
doublets from co-encapsulation or incomplete digestion because of their relatively high
abundance and the fact that L1 and L2 cells are spatially distinct. Their presence thus
suggests the possibility of bi-potent progenitor cells or cells in transition, which we label
luminal intermediate (fig. S21). Although we did not identify a distinct human luminal 3
(ionocyte) cluster by scRNA-seq, we observed rare FOXI1+ cells interspersed throughout the
gland using immunohistochemistry (IHC) (fig. S19d). To determine if the human
counterparts of mouse L1 and L2 cells also share transcriptional features following androgen
withdrawal, we compared their expression profiles in hormonally intact and ADT samples.
Signatures of human L1 and L2 cells from two of the ADT samples (samples 5 and 8)
showed evidence of co-embedding in either tSNE or a PHATE map and had a higher
correlation of L1 and L2 profiles compared to intact samples (Fig. 5D and E, fig. S23, a to c,
and fig. S24). Of note, one of the ADT samples where L1 and L2 cells did not show this
enhancement in shared features had significant tumor content (~50% by histology, Gleason
grade 9) despite our attempts at filtering by inferred CNA profiles (fig. S23, d to f).
Discussion
Our study has uncovered a previously unappreciated complexity of cell subtypes within the
prostate. In addition, we found that after castration the majority of persisting luminal cells
(rather than a rare population of stem cells) contribute to the proliferative response, akin to
the regenerative process observed after liver injury (33). In hormonally intact mice, the
prostate gland contains three primary luminal subtypes, the most predominant of which are
secretory epithelial cells lining the distal branching ducts, which we call L1 or secretory
luminal cells. Murine L2 cells (Sca1/Ly6a+, Psca+, Tacstd2/Trop2+) have been described
previously in independent reports examining the expression of each of these markers, but our
work now consolidates this into a single subtype. Anatomically, L2 cells line the proximal
duct with a remarkably sharp transition to L1 cells in distal branching ducts, suggestive of a
hierarchical relationship during prostate development. In humans, the L2 counterpart is
Karthaus et al. Page 8
Science. Author manuscript; available in PMC 2020 November 01.
Author M
anuscriptA
uthor Manuscript
Author M
anuscriptA
uthor Manuscript
primarily defined by the club cell marker SCGB1A1+; in the lung, cells with this marker are
responsible for airway maintenance (31). L3 cells have not been previously identified; they
resemble pulmonary ionocytes, which have been implicated in the regulation of salt balance
within airways (9, 10). Analogous luminal subpopulations are present in human, with the
caveat that L3 cells were detected by IHC only.
An important question is the mechanism by which persisting luminal cells acquire enhanced
self-renewal, particularly since L1 cells are well-differentiated secretory cells at baseline.
The fact that L1 and L2 cells acquire stem-like transcriptional features in response to
castration suggests a reprogramming event or cell state change. This hypothesis is further
supported by androgen-regulated expression of known stem cell niche factors (Nrg, Fgf10,
Rspo3) in mesenchymal cells. While we cannot rule out the possibility that a subset of cells
with pre-existing self-renewal properties is present within the hormonally intact gland, our
transcriptomic analysis failed to define a distinct subpopulation matching that of persistent
L1 cells (fig. S6e).
Although we have not yet directly explored the implications of these luminal cell subtypes in
cancer, it is noteworthy that mice with Nkx3.1- and CD133/Prom1-specific Cre expression
(each of which is L1-restricted) develop prostate cancers when crossed with various floxed
cancer driver alleles (34, 35). Thus, L1 cells can clearly serve as cell of origin for prostate
cancer. It will be of interest to explore this question with L2-specific Cre drivers (e.g., Psca)
as well as in L3 cells. Another question is whether the persistence of large numbers of
luminal cells after castration has clinical relevance, particularly for the use of ADT in
prostate cancer patients. A precise molecular understanding of how differentiated normal
luminal cells acquire stem-like regenerative properties could provide insight into ways to
interfere with this process in malignant prostate cells. Our work suggests that
microenvironmental niche factors such as NRG and FGF10 may play a role. Since cancer
cells often exploit the stem-like niches used by normal cells, these insights could point
toward new prostate cancer therapies that might be useful in combination with AR blockade.
Supplementary Material
Refer to Web version on PubMed Central for supplementary material.
ACKNOWLEDGMENTS
We thank members of the Regev lab and the Sawyers lab for valuable critiques and discussions; the Molecular Cytology Core Facility at MSKCC for help with confocal microscopy and IHC; and the Flow Cytometry Core Facility at MSKCC for help with FACS experiments.
Funding: C.L.S. is supported by HHMI; National Institutes of Health grants CA193837; CA092629; CA224079; CA155169; CA008748; and the Starr Cancer Consortium grant I12-0007. A.R. is an HHMI Investigator and is supported by the Klarman Cell Observatory, NCI grants 1U24CA180922, R33-CA202820, the Koch Institute NCI Support (core) grant P30-CA14051, and the Ludwig Center at MIT (AR). W.R.K. is supported by a fellowship from the Dutch Cancer Foundation and a Prostate Cancer Foundation Young Investigator Award.
REFERENCES AND NOTES
1. Clevers H, Watt FM, Defining Adult Stem Cells by Function, not by Phenotype. Annu Rev Biochem 87, 1015–1027 (2018). [PubMed: 29494240]
Karthaus et al. Page 9
Science. Author manuscript; available in PMC 2020 November 01.
Author M
anuscriptA
uthor Manuscript
Author M
anuscriptA
uthor Manuscript
2. McNeal JE, Normal histology of the prostate. Am J Surg Pathol 12, 619–633 (1988). [PubMed: 2456702]
3. English HF, Kyprianou N, Isaacs JT, Relationship between DNA fragmentation and apoptosis in the programmed cell death in the rat prostate following castration. Prostate 15, 233–250 (1989). [PubMed: 2555799]
4. Wang X et al., A luminal epithelial stem cell that is a cell of origin for prostate cancer. Nature 461, 495–500 (2009). [PubMed: 19741607]
5. Choi N, Zhang B, Zhang L, Ittmann M, Xin L, Adult murine prostate basal and luminal cells are self-sustained lineages that can both serve as targets for prostate cancer initiation. Cancer Cell 21, 253–265 (2012). [PubMed: 22340597]
6. Ousset M et al., Multipotent and unipotent progenitors contribute to prostate postnatal development. Nat Cell Biol 14, 1131–1138 (2012). [PubMed: 23064263]
7. Kwon OJ et al., Functional Heterogeneity of Mouse Prostate Stromal Cells Revealed by Single-Cell RNA-Seq. iScience 13, 328–338 (2019). [PubMed: 30878879]
8. Vidarsson H et al., The forkhead transcription factor Foxi1 is a master regulator of vacuolar H-ATPase proton pump subunits in the inner ear, kidney and epididymis. PLoS One 4, e4471 (2009). [PubMed: 19214237]
9. Montoro DT et al., A revised airway epithelial hierarchy includes CFTR-expressing ionocytes. Nature 560, 319–324 (2018). [PubMed: 30069044]
10. Plasschaert LW et al., A single-cell atlas of the airway epithelium reveals the CFTR-rich pulmonary ionocyte. Nature 560, 377–381 (2018). [PubMed: 30069046]
11. Blomqvist SR, Vidarsson H, Soder O, Enerback S, Epididymal expression of the forkhead transcription factor Foxi1 is required for male fertility. EMBO J 25, 4131–4141 (2006). [PubMed: 16932748]
12. Kwon OJ, Zhang L, Xin L, Stem Cell Antigen-1 Identifies a Distinct Androgen-Independent Murine Prostatic Luminal Cell Lineage with Bipotent Potential. Stem Cells 34, 191–202 (2016). [PubMed: 26418304]
13. Ross S, Spencer SD, Lasky LA, Koeppen H, Selective expression of murine prostate stem cell antigen in fetal and adult tissues and the transgenic adenocarcinoma of the mouse prostate model of prostate carcinogenesis. Am J Pathol 158, 809–816 (2001). [PubMed: 11238029]
14. English HF, Santen RJ, Isaacs JT, Response of glandular versus basal rat ventral prostatic epithelial cells to androgen withdrawal and replacement. Prostate 11, 229–242 (1987). [PubMed: 3684783]
15. Evans GS, Chandler JA, Cell proliferation studies in the rat prostate: II. The effects of castration and androgen-induced regeneration upon basal and secretory cell proliferation. Prostate 11, 339–351 (1987). [PubMed: 3684785]
16. Goldstein AS et al., Trop2 identifies a subpopulation of murine and human prostate basal cells with stem cell characteristics. Proc Natl Acad Sci U S A 105, 20882–20887 (2008). [PubMed: 19088204]
17. Moon KR et al., Visualizing structure and transitions in high-dimensional biological data. Nat Biotechnol 37, 1482–+ (2019). [PubMed: 31796933]
18. Snippert HJ et al., Intestinal crypt homeostasis results from neutral competition between symmetrically dividing Lgr5 stem cells. Cell 143, 134–144 (2010). [PubMed: 20887898]
19. Van Keymeulen A et al., Distinct stem cells contribute to mammary gland development and maintenance. Nature 479, 189–193 (2011). [PubMed: 21983963]
20. Liu J et al., Regenerated luminal epithelial cells are derived from preexisting luminal epithelial cells in adult mouse prostate. Mol Endocrinol 25, 1849–1857 (2011). [PubMed: 21940754]
21. Cunha GR, Lung B, The possible influence of temporal factors in androgenic responsiveness of urogenital tissue recombinants from wild-type and androgen-insensitive (Tfm) mice. J Exp Zool 205, 181–193 (1978). [PubMed: 681909]
22. Xie Q et al., Dissecting cell-type-specific roles of androgen receptor in prostate homeostasis and regeneration through lineage tracing. Nat Commun 8, 14284 (2017). [PubMed: 28112153]
23. Ramilowski JA et al., A draft network of ligand-receptor-mediated multicellular signalling in human. Nat Commun 6, 7866 (2015). [PubMed: 26198319]
Karthaus et al. Page 10
Science. Author manuscript; available in PMC 2020 November 01.
Author M
anuscriptA
uthor Manuscript
Author M
anuscriptA
uthor Manuscript
24. Marker PC, Donjacour AA, Dahiya R, Cunha GR, Hormonal, cellular, and molecular control of prostatic development. Dev Biol 253, 165–174 (2003). [PubMed: 12645922]
25. Donjacour AA, Thomson AA, Cunha GR, FGF-10 plays an essential role in the growth of the fetal prostate. Dev Biol 261, 39–54 (2003). [PubMed: 12941620]
26. Luo W et al., Lgr4 is a key regulator of prostate development and prostate stem cell differentiation. Stem Cells 31, 2492–2505 (2013). [PubMed: 23897697]
27. Mehta V et al., Atlas of Wnt and R-spondin gene expression in the developing male mouse lower urogenital tract. Dev Dyn 240, 2548–2560 (2011). [PubMed: 21936019]
28. Tirosh I et al., Dissecting the multicellular ecosystem of metastatic melanoma by single-cell RNA-seq. Science 352, 189–196 (2016). [PubMed: 27124452]
29. Taylor BS et al., Integrative genomic profiling of human prostate cancer. Cancer Cell 18, 11–22 (2010). [PubMed: 20579941]
30. Henry GH et al. , A Cellular Anatomy of the Normal Adult Human Prostate and Prostatic Urethra. Cell Rep 25, 3530–3542 e3535 (2018). [PubMed: 30566875]
31. Rawlins EL et al., The role of Scgb1a1+ Clara cells in the long-term maintenance and repair of lung airway, but not alveolar, epithelium. Cell Stem Cell 4, 525–534 (2009). [PubMed: 19497281]
32. Hong KU, Reynolds SD, Giangreco A, Hurley CM, Stripp BR, Clara cell secretory protein-expressing cells of the airway neuroepithelial body microenvironment include a label-retaining subset and are critical for epithelial renewal after progenitor cell depletion. Am J Respir Cell Mol Biol 24, 671–681 (2001). [PubMed: 11415931]
33. Schaub JR, Malato Y, Gormond C, Willenbring H, Evidence against a stem cell origin of new hepatocytes in a common mouse model of chronic liver injury. Cell Rep 8, 933–939 (2014). [PubMed: 25131204]
34. Wang ZA et al., Lineage analysis of basal epithelial cells reveals their unexpected plasticity and supports a cell-of-origin model for prostate cancer heterogeneity. Nat Cell Biol 15, 274–283 (2013). [PubMed: 23434823]
35. Zhu L et al., Multi-organ Mapping of Cancer Risk. Cell 166, 1132–1146 e1137 (2016). [PubMed: 27565343]
Karthaus et al. Page 11
Science. Author manuscript; available in PMC 2020 November 01.
Author M
anuscriptA
uthor Manuscript
Author M
anuscriptA
uthor Manuscript
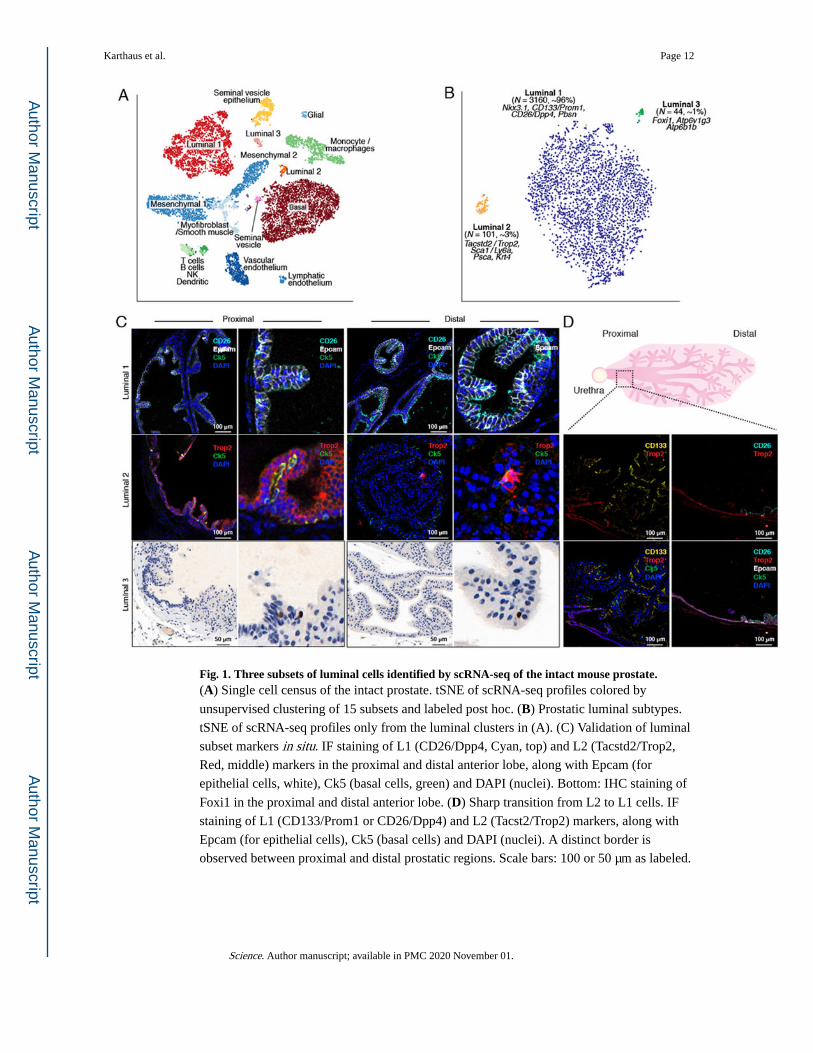
Fig. 1. Three subsets of luminal cells identified by scRNA-seq of the intact mouse prostate.(A) Single cell census of the intact prostate. tSNE of scRNA-seq profiles colored by
unsupervised clustering of 15 subsets and labeled post hoc. (B) Prostatic luminal subtypes.
tSNE of scRNA-seq profiles only from the luminal clusters in (A). (C) Validation of luminal
subset markers in situ. IF staining of L1 (CD26/Dpp4, Cyan, top) and L2 (Tacstd2/Trop2,
Red, middle) markers in the proximal and distal anterior lobe, along with Epcam (for
epithelial cells, white), Ck5 (basal cells, green) and DAPI (nuclei). Bottom: IHC staining of
Foxi1 in the proximal and distal anterior lobe. (D) Sharp transition from L2 to L1 cells. IF
staining of L1 (CD133/Prom1 or CD26/Dpp4) and L2 (Tacst2/Trop2) markers, along with
Epcam (for epithelial cells), Ck5 (basal cells) and DAPI (nuclei). A distinct border is
observed between proximal and distal prostatic regions. Scale bars: 100 or 50 μm as labeled.
Karthaus et al. Page 12
Science. Author manuscript; available in PMC 2020 November 01.
Author M
anuscriptA
uthor Manuscript
Author M
anuscriptA
uthor Manuscript
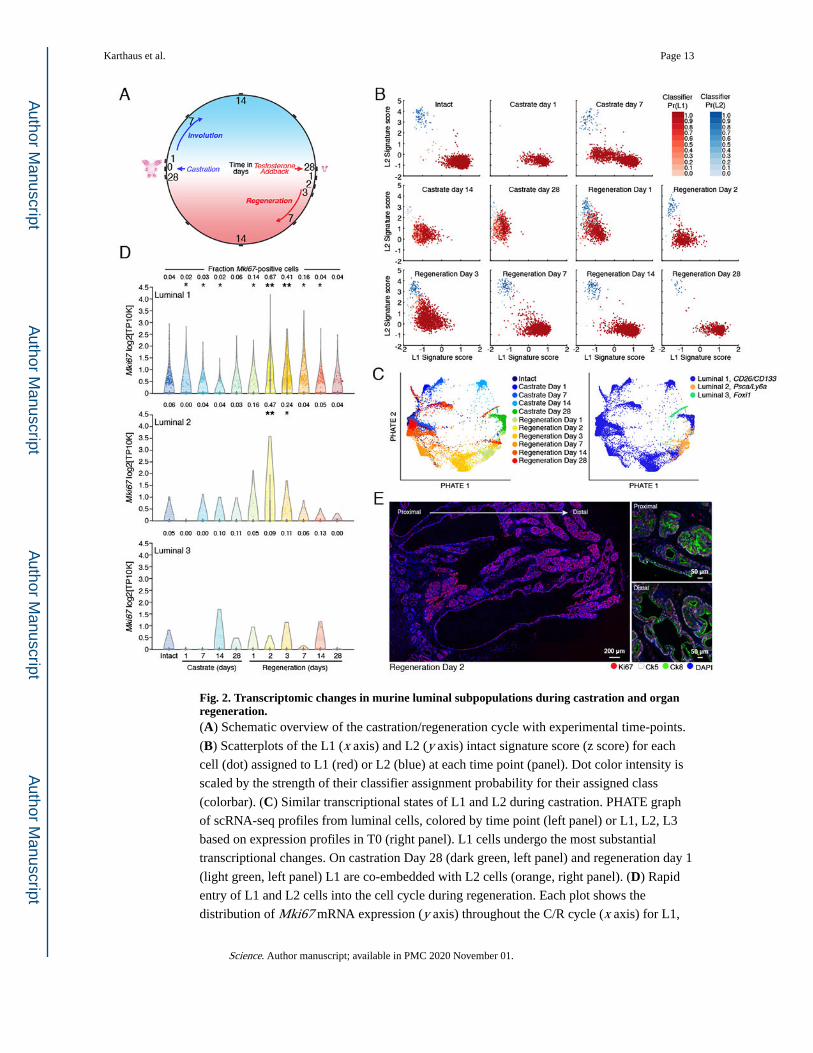
Fig. 2. Transcriptomic changes in murine luminal subpopulations during castration and organ regeneration.(A) Schematic overview of the castration/regeneration cycle with experimental time-points.
(B) Scatterplots of the L1 (x axis) and L2 (y axis) intact signature score (z score) for each
cell (dot) assigned to L1 (red) or L2 (blue) at each time point (panel). Dot color intensity is
scaled by the strength of their classifier assignment probability for their assigned class
(colorbar). (C) Similar transcriptional states of L1 and L2 during castration. PHATE graph
of scRNA-seq profiles from luminal cells, colored by time point (left panel) or L1, L2, L3
based on expression profiles in T0 (right panel). L1 cells undergo the most substantial
transcriptional changes. On castration Day 28 (dark green, left panel) and regeneration day 1
(light green, left panel) L1 are co-embedded with L2 cells (orange, right panel). (D) Rapid
entry of L1 and L2 cells into the cell cycle during regeneration. Each plot shows the
distribution of Mki67 mRNA expression (y axis) throughout the C/R cycle (x axis) for L1,
Karthaus et al. Page 13
Science. Author manuscript; available in PMC 2020 November 01.
Author M
anuscriptA
uthor Manuscript
Author M
anuscriptA
uthor Manuscript
L2 and L3 cells. Fraction of cells with Mki67 expression detected is noted on top.
*expression is significantly different from intact (T0) (Bonferroni corrected P < 0.05, one
sided Wilcoxon rank-sum test) **designates fold change of 1.5 or greater, and AUC of 0.65.
(E) IF staining of Ki67 in the anterior lobe at regeneration day 2. Left: Low magnification
showing proximal and distal regions. Right: representative higher magnification (20x) of
proximal and distal regions. Ki67 (red), Ck8 (Green), Ck5 (white) and DAPI (purple). Scale
bars: 200 or 50μm as labeled.
Karthaus et al. Page 14
Science. Author manuscript; available in PMC 2020 November 01.
Author M
anuscriptA
uthor Manuscript
Author M
anuscriptA
uthor Manuscript
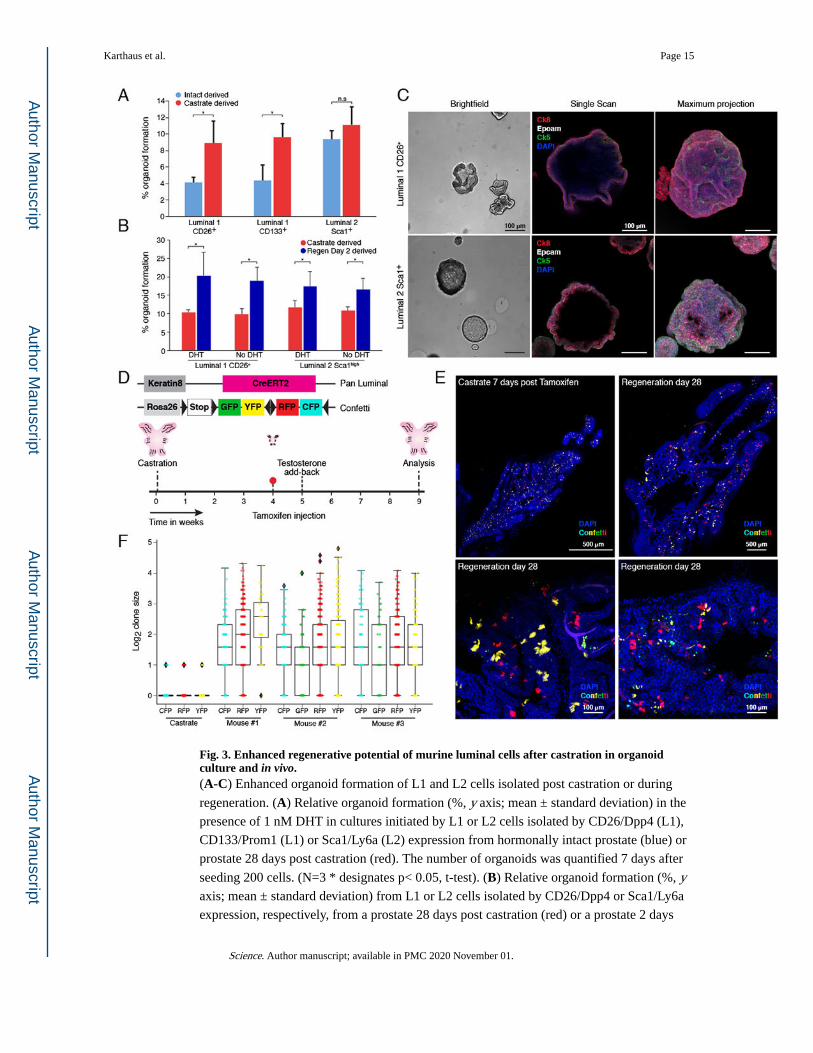
Fig. 3. Enhanced regenerative potential of murine luminal cells after castration in organoid culture and in vivo.(A-C) Enhanced organoid formation of L1 and L2 cells isolated post castration or during
regeneration. (A) Relative organoid formation (%, y axis; mean ± standard deviation) in the
presence of 1 nM DHT in cultures initiated by L1 or L2 cells isolated by CD26/Dpp4 (L1),
CD133/Prom1 (L1) or Sca1/Ly6a (L2) expression from hormonally intact prostate (blue) or
prostate 28 days post castration (red). The number of organoids was quantified 7 days after
seeding 200 cells. (N=3 * designates p< 0.05, t-test). (B) Relative organoid formation (%, y axis; mean ± standard deviation) from L1 or L2 cells isolated by CD26/Dpp4 or Sca1/Ly6a
expression, respectively, from a prostate 28 days post castration (red) or a prostate 2 days
Karthaus et al. Page 15
Science. Author manuscript; available in PMC 2020 November 01.
Author M
anuscriptA
uthor Manuscript
Author M
anuscriptA
uthor Manuscript
into regeneration (blue) in the presence or absence of 1 nM DHT. The number of organoids
was quantified 7 days after seeding 200 cells. (N=3 * designates p< 0.05, t-test). (C)
Representative images of organoids derived from CD26/Dpp4+ L1 cells (top) or Sca1 L2
cells (bottom). Left: brightfield; Right: Confocal images (single Z and maximum projection)
stained with Ck8 (red), Ck5 (green), Epcam (white) and DAPI (purple) 7 days post
establishment. Scale bars: 100μm. (D) Lineage tracing strategy. (E, F) Contribution of
multiple clones to prostate gland regeneration. (E) Top: Maximum projection of a castrated
prostate 7 days post tamoxifen injection (left) and 4 weeks post regeneration (right). Only
red fluorescence protein (RFP) and yellow fluorescence protein (YFP) are shown. Scale
bars: 500μm. Bottom: Higher magnification of lineage-traced prostates showing contribution
of multiple clones to gland regeneration. Scale bars: 100μm. (F) Distribution of size of
different color clones. Log2 clone size (y axis) is plotted from three independent mice
compared to control (castrate 7 days post tamoxifen) (x axis). Raw data is in table S2. As
observed previously, GFP+ clones are infrequent in the prostate (34).
Karthaus et al. Page 16
Science. Author manuscript; available in PMC 2020 November 01.
Author M
anuscriptA
uthor Manuscript
Author M
anuscriptA
uthor Manuscript
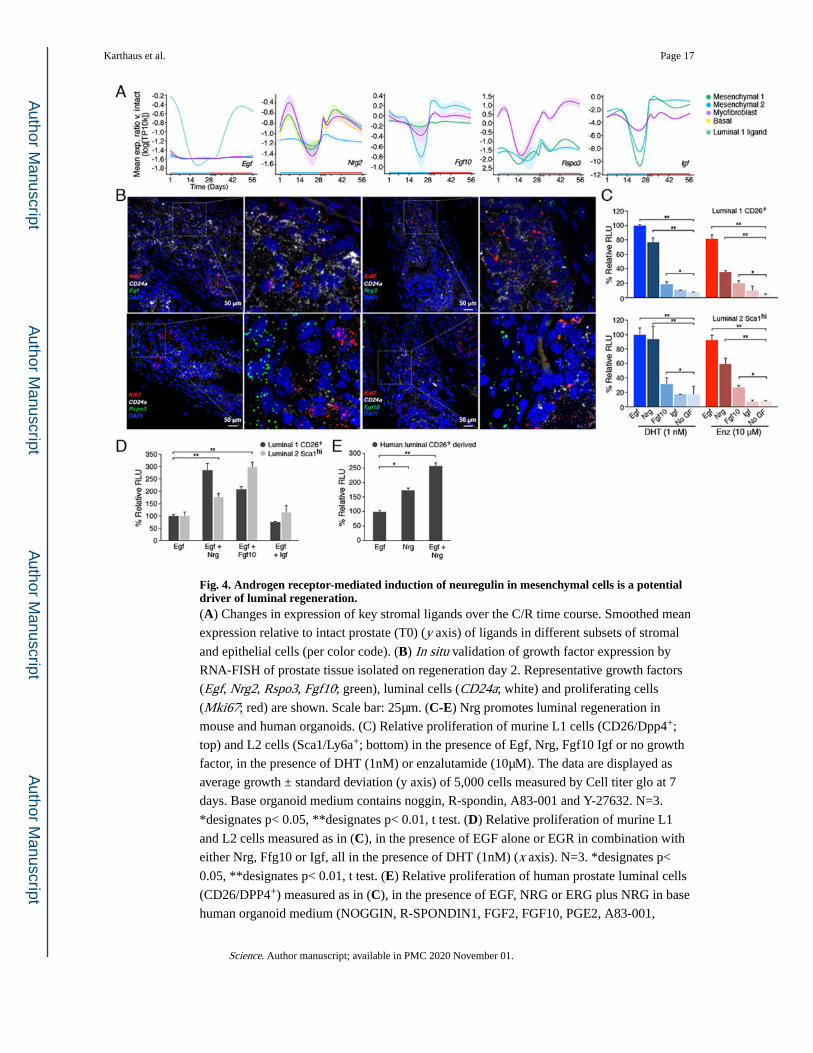
Fig. 4. Androgen receptor-mediated induction of neuregulin in mesenchymal cells is a potential driver of luminal regeneration.(A) Changes in expression of key stromal ligands over the C/R time course. Smoothed mean
expression relative to intact prostate (T0) (y axis) of ligands in different subsets of stromal
and epithelial cells (per color code). (B) In situ validation of growth factor expression by
RNA-FISH of prostate tissue isolated on regeneration day 2. Representative growth factors
(Egf, Nrg2, Rspo3, Fgf10; green), luminal cells (CD24a; white) and proliferating cells
(Mki67; red) are shown. Scale bar: 25μm. (C-E) Nrg promotes luminal regeneration in
mouse and human organoids. (C) Relative proliferation of murine L1 cells (CD26/Dpp4+;
top) and L2 cells (Sca1/Ly6a+; bottom) in the presence of Egf, Nrg, Fgf10 Igf or no growth
factor, in the presence of DHT (1nM) or enzalutamide (10μM). The data are displayed as
average growth ± standard deviation (y axis) of 5,000 cells measured by Cell titer glo at 7
days. Base organoid medium contains noggin, R-spondin, A83-001 and Y-27632. N=3.
*designates p< 0.05, **designates p< 0.01, t test. (D) Relative proliferation of murine L1
and L2 cells measured as in (C), in the presence of EGF alone or EGR in combination with
either Nrg, Ffg10 or Igf, all in the presence of DHT (1nM) (x axis). N=3. *designates p<
0.05, **designates p< 0.01, t test. (E) Relative proliferation of human prostate luminal cells
(CD26/DPP4+) measured as in (C), in the presence of EGF, NRG or ERG plus NRG in base
human organoid medium (NOGGIN, R-SPONDIN1, FGF2, FGF10, PGE2, A83-001,
Karthaus et al. Page 17
Science. Author manuscript; available in PMC 2020 November 01.
Author M
anuscriptA
uthor Manuscript
Author M
anuscriptA
uthor Manuscript
NICOTINAMID, SB202190, DHT and Y-27632). N=3. *designates p< 0.05, **designates
p< 0.01, t test. Human organoids for this panel were derived from normal prostate tissue
isolated during cystectomy surgery.
Karthaus et al. Page 18
Science. Author manuscript; available in PMC 2020 November 01.
Author M
anuscriptA
uthor Manuscript
Author M
anuscriptA
uthor Manuscript
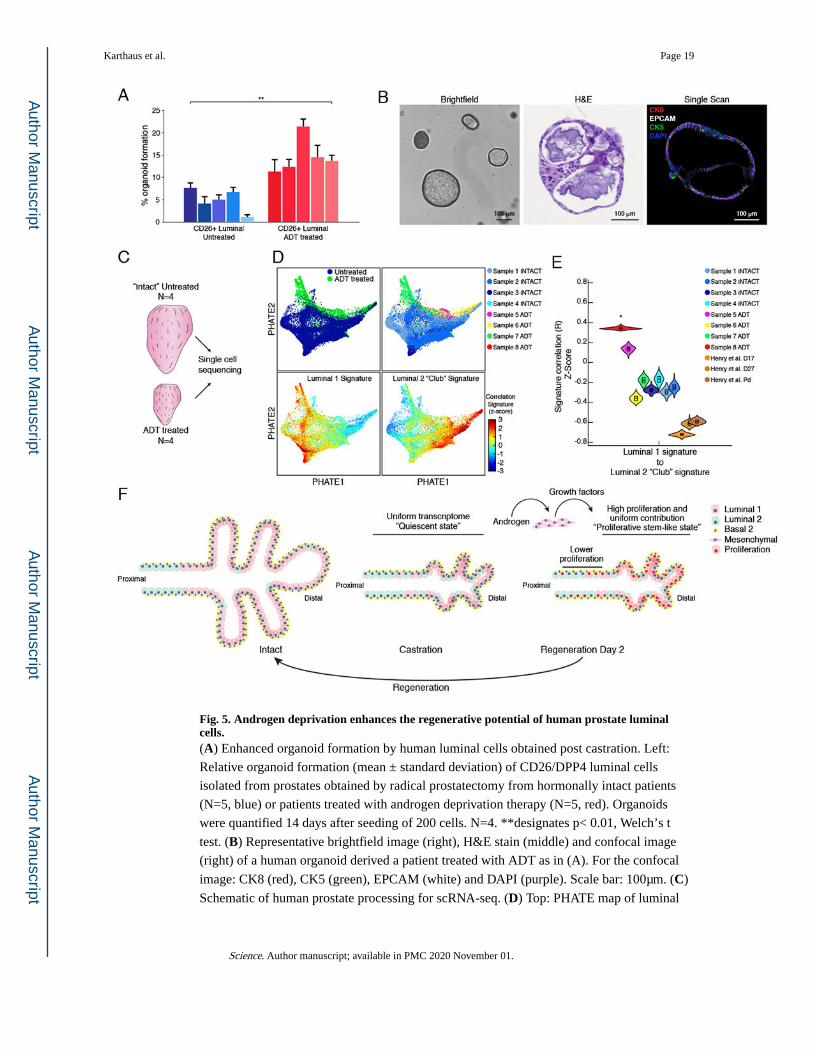
Fig. 5. Androgen deprivation enhances the regenerative potential of human prostate luminal cells.(A) Enhanced organoid formation by human luminal cells obtained post castration. Left:
Relative organoid formation (mean ± standard deviation) of CD26/DPP4 luminal cells
isolated from prostates obtained by radical prostatectomy from hormonally intact patients
(N=5, blue) or patients treated with androgen deprivation therapy (N=5, red). Organoids
were quantified 14 days after seeding of 200 cells. N=4. **designates p< 0.01, Welch’s t
test. (B) Representative brightfield image (right), H&E stain (middle) and confocal image
(right) of a human organoid derived a patient treated with ADT as in (A). For the confocal
image: CK8 (red), CK5 (green), EPCAM (white) and DAPI (purple). Scale bar: 100μm. (C)
Schematic of human prostate processing for scRNA-seq. (D) Top: PHATE map of luminal
Karthaus et al. Page 19
Science. Author manuscript; available in PMC 2020 November 01.
Author M
anuscriptA
uthor Manuscript
Author M
anuscriptA
uthor Manuscript
cells from all samples stratified by treatment (left) and by sample (right). Bottom: PHATE
maps colored by correlation to RNA signatures derived from Henry et. al. (30). L1 (left); L2
“Club” (right). (E) Pairwise correlation of signature scores for L1 and L2 “Club” cells (30)
per patient after CNA filtering. Signatures were generated using previously published human
prostate luminal cell data (30). * designates significant change of the median correlation
(p<0.05, Welch’s t-test, one-sided test). (F) Model of prostate regeneration. The prostate
gland shrinks ~90% following androgen deprivation (castration) due to loss of luminal
epithelial cells. During this process, the transcriptome of L1 cells closely resembles that of
more stem-like L2 cells. Androgen addback stimulates production of growth factors by
distinct populations of mesenchymal cells, which rapidly recruit nearly all persisting luminal
cells into cell cycle. Each of these proliferating luminal cells collectively contributes to
regeneration of the prostate gland, rather than a rare stem cell population.
Karthaus et al. Page 20
Science. Author manuscript; available in PMC 2020 November 01.
Author M
anuscriptA
uthor Manuscript
Author M
anuscriptA
uthor Manuscript
Related Documents