Regelation: why does ice melt under pressure? Phase-boundary reversible dispersivity and hydrogen-bond extraordinary recoverability Chang Q Sun [email protected] Nanyang Technological University, Singapore Unlike other unusual materials whose bonds contract under compression, the O:H nonbond undergoes contraction and the H-O bond elongation towards O:H and H-O length symmetry in water and ice. The energy drop of the H-O bond dictates the melting point T m depression of ice. Once the pressure is relieved, the O:H-O bond fully recovers its initial state, resulting in Regelation. Ref: [1] Anomaly 2: Floating ice, http://arxiv.org/abs/1501.04171 [2] Anomaly 1: Mpemba effect, http://arxiv.org/abs/1501.00765 [3] Hydrogen-bond relaxation dynamics: resolving mysteries of water ice. Coord. Chem. Rev., 2015. 285: 109-165. 1 Anomaly: Ice Regelation Observations in Figure 1 revealed the following: 1) Ice melts under pressure and freezes again when the pressure is relieved [1-4]Error! Bookmark not defined.. An ice block remains a solid after a weighted wire cutting it through [5]. 2) Ice melts at a limit temperature of -22C under 210 MPa pressure but a -95 MPa pressure (tension) raises the melting point up to +6.5C [6, 7].

Welcome message from author
This document is posted to help you gain knowledge. Please leave a comment to let me know what you think about it! Share it to your friends and learn new things together.
Transcript
Regelation: why does ice melt under pressure? Phase-boundary reversible dispersivity and hydrogen-bond extraordinary recoverability
Chang Q Sun
Nanyang Technological University, Singapore
Unlike other unusual materials whose bonds contract under compression, the O:H
nonbond undergoes contraction and the H-O bond elongation towards O:H and H-O
length symmetry in water and ice. The energy drop of the H-O bond dictates the melting
point Tm depression of ice. Once the pressure is relieved, the O:H-O bond fully recovers
its initial state, resulting in Regelation.
Ref:
[1] Anomaly 2: Floating ice, http://arxiv.org/abs/1501.04171
[2] Anomaly 1: Mpemba effect, http://arxiv.org/abs/1501.00765
[3] Hydrogen-bond relaxation dynamics: resolving mysteries of water ice. Coord. Chem. Rev., 2015. 285:
109-165.
1 Anomaly: Ice Regelation
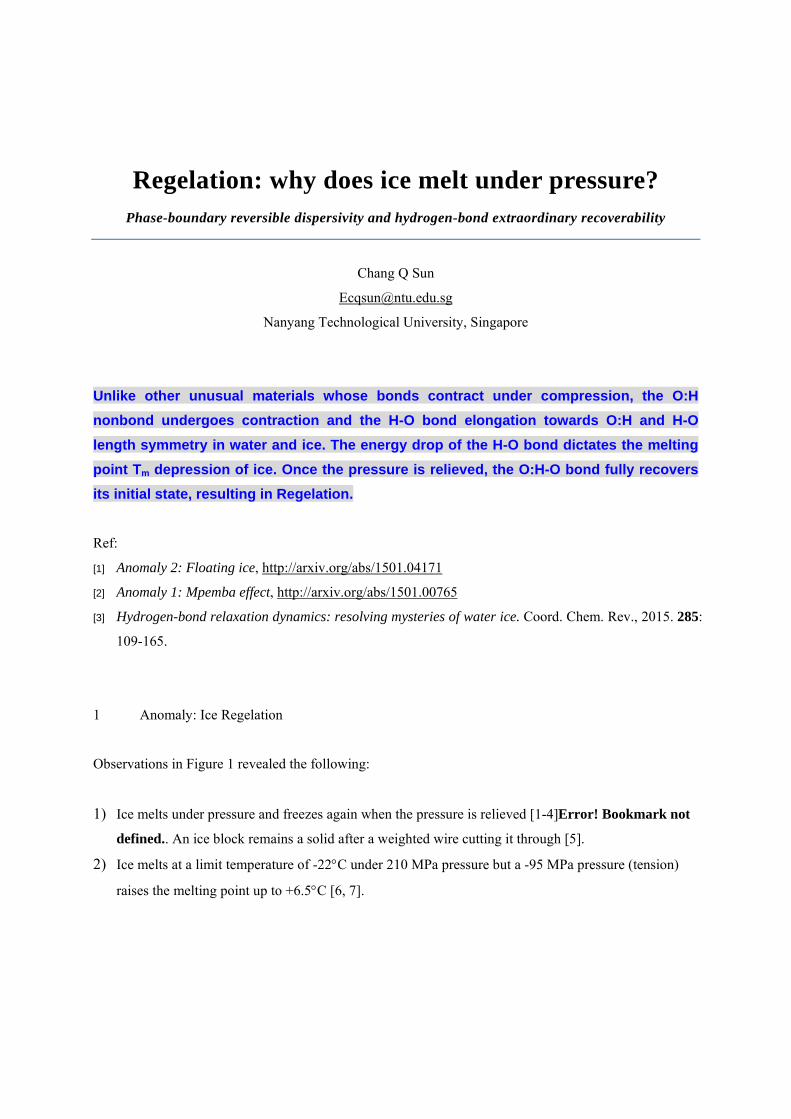
Observations in Figure 1 revealed the following:
1) Ice melts under pressure and freezes again when the pressure is relieved [1-4]Error! Bookmark not
defined.. An ice block remains a solid after a weighted wire cutting it through [5].
2) Ice melts at a limit temperature of -22C under 210 MPa pressure but a -95 MPa pressure (tension)
raises the melting point up to +6.5C [6, 7].
0
0 0
( )1 1
( )
V
HVC
C H
pdvT P
T P E
-100 -50 0 50 100 150 200250
260
270
280
Tm(K
)
P(MPa)
Quasi-solid Liquid
b
Figure 1 Regelation of ice. (a) A weighted wire cuts a block of ice through without severing it [5]. (b)
Theoretical formulation [8] of the pressure dependence of the ice melting temperature Tm(P) or the phase
boundary between the liquid and quasi-solid [6, 7] indicates that the H-O bond energy relaxation dictates
the Tm(P).
2 Reasons: hydrogen-bond memory and phase boundary dispersivity
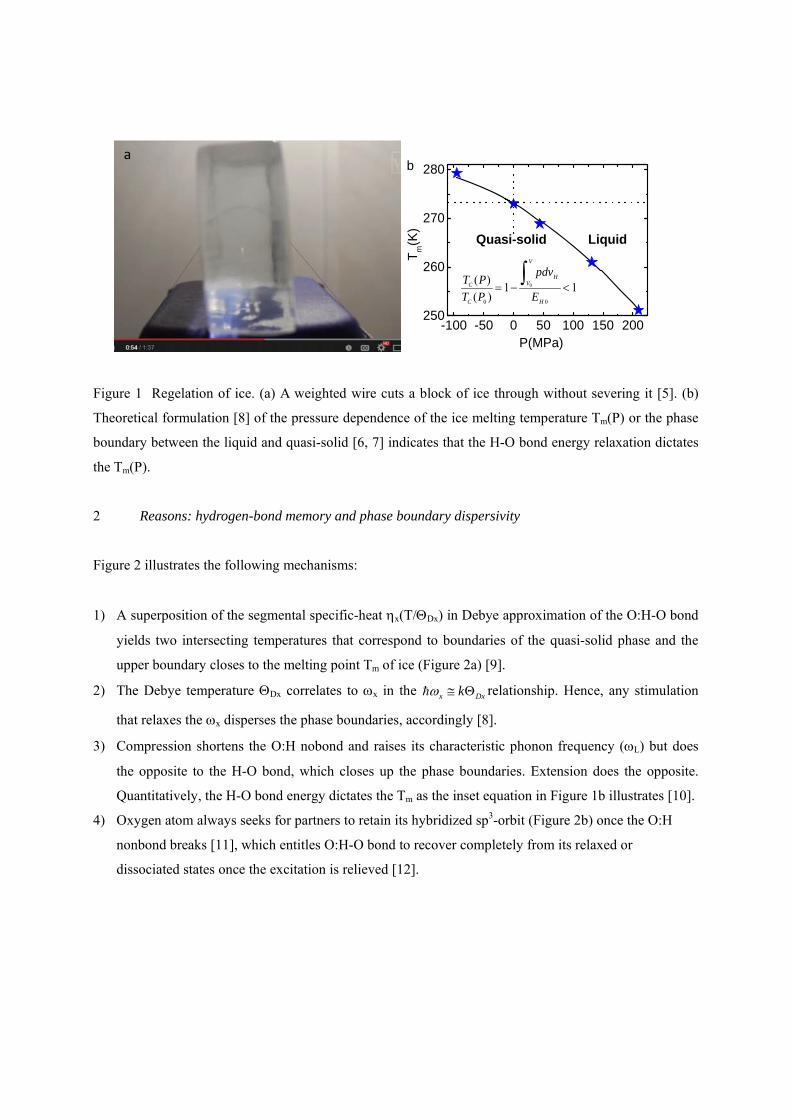
Figure 2 illustrates the following mechanisms:
1) A superposition of the segmental specific-heat x(T/Dx) in Debye approximation of the O:H-O bond
yields two intersecting temperatures that correspond to boundaries of the quasi-solid phase and the
upper boundary closes to the melting point Tm of ice (Figure 2a) [9].
2) The Debye temperature Dx correlates to x in the x Dxk relationship. Hence, any stimulation
that relaxes the x disperses the phase boundaries, accordingly [8].
3) Compression shortens the O:H nobond and raises its characteristic phonon frequency (L) but does
the opposite to the H-O bond, which closes up the phase boundaries. Extension does the opposite.
Quantitatively, the H-O bond energy dictates the Tm as the inset equation in Figure 1b illustrates [10].
4) Oxygen atom always seeks for partners to retain its hybridized sp3-orbit (Figure 2b) once the O:H
nonbond breaks [11], which entitles O:H-O bond to recover completely from its relaxed or
dissociated states once the excitation is relieved [12].
a
0.00 0.05 0.10 0.15
Spe
cific
Hea
t (a.
u.)
T/DH
D
D
P > 0quasi-solidsolid liquid
a
Figure 2. Schematic illustration of pressure squeezed quasi-solid phase boundaries and an H2O molecule.
(a) An superposition of the specific-heat x(T) curves for the O:H (x = L) and the H-O (x = H) segment
defines two crossing points as boundaries of the quasi-solid phase. The high-temperature boundary
corresponds to the temperature of maximal density (277 K) closing to the melting point Tm(273 K for
bulk) and the lower to freezing (TN for homogeneous ice nucleation, 258 K for bulk). Compression (P >
0)/tension (P < 0) disperses the boundaries inwardly/outwardly by relaxing the O:H-O bond (inset) and
the segmental x that determines the Dx. Excessive pressure (> 210 MPa) eliminates the phase
boundaries, preventing Tm from being further depressed. (b) Oxygen forms the tetrahedral structure of a
water molecule at temperatures above 5 K [13] with two bonded H+ ions (yellow) and two Hp dipoles
(blue) induced by the lone pairs of the central O2- ion (red; < 1 is the charge quantity, which is assumed
unity for discussion convenience)[12].
3 Examples of Regelation
The regelation is exceedingly interesting, because of its relation to glacial action under nature
circumstances [14], in its bearing upon molecular action [15], and damage recovery of living cells.
Observations indicate that O:H-O bond has extraordinary ability of recovering its relaxation and damage
[16].
3.1 Ice cutting
One example of regelation can be seen by looping a fine wire over an ice cube and attaching a heavy
weight to the wire (Figure 1a). The pressure of the wire exerts on the ice will melt the local ice gradually
until the wire passing through the entire block of ice. The water refreezes behind the path of the wire so
b
one can pull the wire through the ice, while leaving the ice cube intact. While regelation is occurring,
some of the melting may be caused by heating conduction of the wire under tension. A molecular-
dynamics (MD) study of a nanowire cutting through ice suggests that the transition mode and the cutting
rate depend on the wetting properties of the wire - hydrophobic and thicker wires cut ice faster [17]. A
video clip shows that a copper wire cutting ice faster than a fishing wire because of thermal conductivity
[18].
3.2 Glacier: Source of river
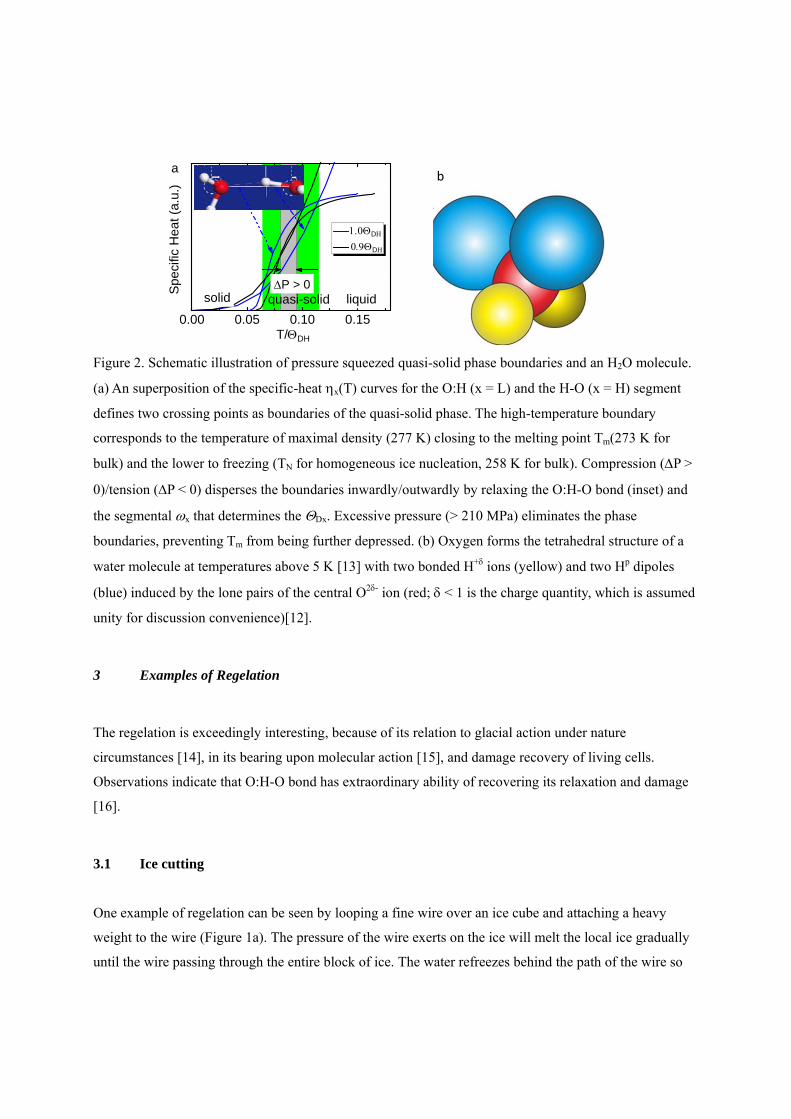
Regelation occurs in glaciers, which forms the sources of Rivers like Yangze. Glaciers of Himalayas
Mountains (8881 km apex in the boundary of India and Chania) in Asia source the India River,
Yaluzangbu River, and Heng River. The mass of a glacier allows it to exert a sufficient amount of
pressure on its lower surface to lower the melting point of the ice at its base, melting the ice and allowing
the glacier to slide over the liquid. Under the right conditions, liquid water can flow from the base of a
glacier to lower altitudes when the temperature of the air is above the freezing point of water [1, 2] (left
panel of Figure 3).
Figure 3 Glacier regelation and spiky ice. (Left) Meili Mountain in Yuannan, China, located at the
junction of Nu river, Lanchang river, and Jinsha river (Photograph by Yi Sun, 2010). (Right) Spiked ice
(called penitentes that can be 4 meters high) formed naturally on high-altitude glaciers in the relative
humidity of ~70% and the -10 and -20 C temperature range under irradiation. (Reprinted with permission
from [19, 20].)
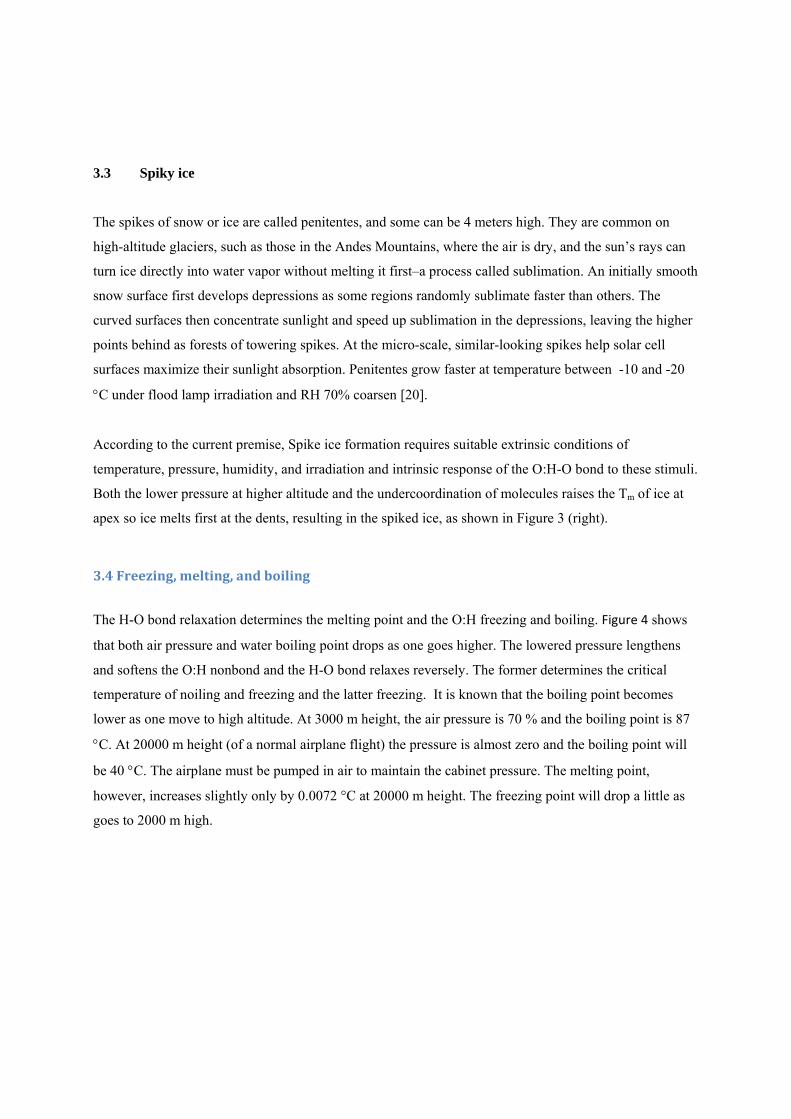
3.3 Spiky ice
The spikes of snow or ice are called penitentes, and some can be 4 meters high. They are common on
high-altitude glaciers, such as those in the Andes Mountains, where the air is dry, and the sun’s rays can
turn ice directly into water vapor without melting it first–a process called sublimation. An initially smooth
snow surface first develops depressions as some regions randomly sublimate faster than others. The
curved surfaces then concentrate sunlight and speed up sublimation in the depressions, leaving the higher
points behind as forests of towering spikes. At the micro-scale, similar-looking spikes help solar cell
surfaces maximize their sunlight absorption. Penitentes grow faster at temperature between -10 and -20
C under flood lamp irradiation and RH 70% coarsen [20].
According to the current premise, Spike ice formation requires suitable extrinsic conditions of
temperature, pressure, humidity, and irradiation and intrinsic response of the O:H-O bond to these stimuli.
Both the lower pressure at higher altitude and the undercoordination of molecules raises the Tm of ice at
apex so ice melts first at the dents, resulting in the spiked ice, as shown in Figure 3 (right).
3.4Freezing,melting,andboiling
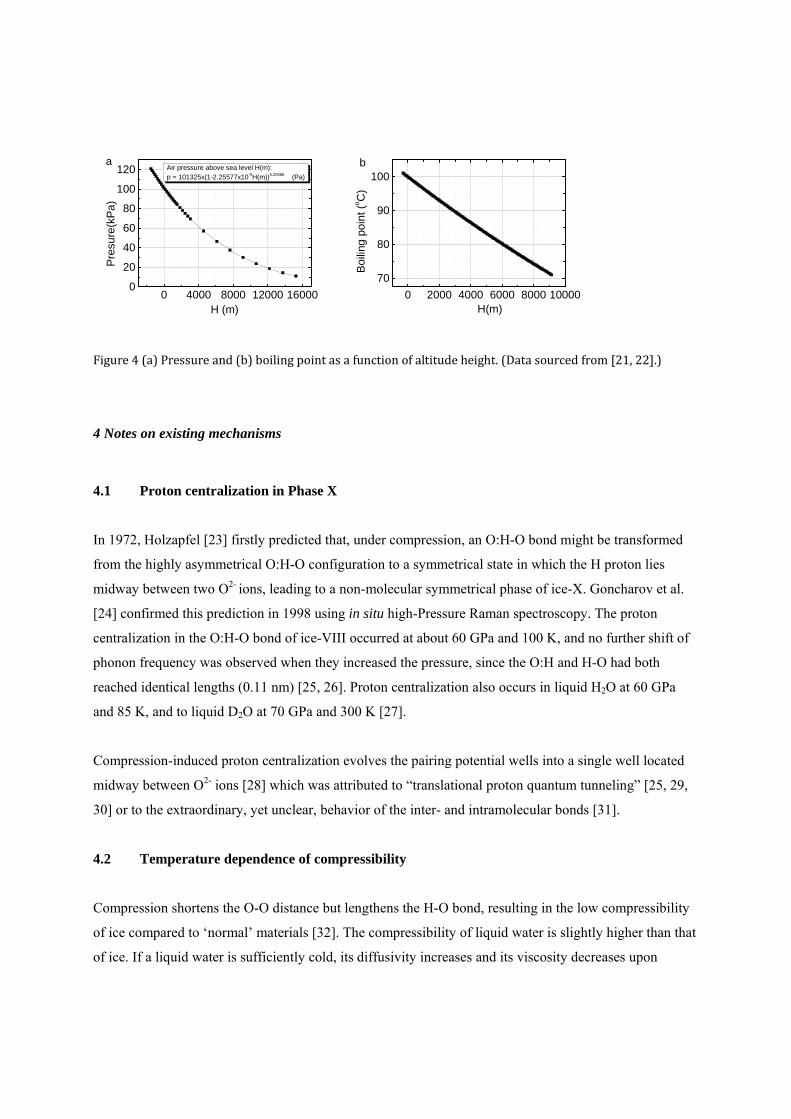
The H-O bond relaxation determines the melting point and the O:H freezing and boiling. Figure 4 shows
that both air pressure and water boiling point drops as one goes higher. The lowered pressure lengthens
and softens the O:H nonbond and the H-O bond relaxes reversely. The former determines the critical
temperature of noiling and freezing and the latter freezing. It is known that the boiling point becomes
lower as one move to high altitude. At 3000 m height, the air pressure is 70 % and the boiling point is 87
C. At 20000 m height (of a normal airplane flight) the pressure is almost zero and the boiling point will
be 40 C. The airplane must be pumped in air to maintain the cabinet pressure. The melting point,
however, increases slightly only by 0.0072 °C at 20000 m height. The freezing point will drop a little as
goes to 2000 m high.
0 4000 8000 12000 160000
20
40
60
80
100
120
Air pressure above sea level H(m):p = 101325x(1-2.25577x10⁻⁵H(m))5.25588 (Pa)
Pre
sure
(kP
a)
H (m)
a
0 2000 4000 6000 8000 10000
70
80
90
100
Boi
ling
poi
nt (
oC
)
H(m)
b
Figure4(a)Pressureand(b)boilingpointasafunctionofaltitudeheight.(Datasourcedfrom[21,22].)
4 Notes on existing mechanisms
4.1 Proton centralization in Phase X
In 1972, Holzapfel [23] firstly predicted that, under compression, an O:H-O bond might be transformed
from the highly asymmetrical O:H-O configuration to a symmetrical state in which the H proton lies
midway between two O2- ions, leading to a non-molecular symmetrical phase of ice-X. Goncharov et al.
[24] confirmed this prediction in 1998 using in situ high-Pressure Raman spectroscopy. The proton
centralization in the O:H-O bond of ice-VIII occurred at about 60 GPa and 100 K, and no further shift of
phonon frequency was observed when they increased the pressure, since the O:H and H-O had both
reached identical lengths (0.11 nm) [25, 26]. Proton centralization also occurs in liquid H2O at 60 GPa
and 85 K, and to liquid D2O at 70 GPa and 300 K [27].
Compression-induced proton centralization evolves the pairing potential wells into a single well located
midway between O2- ions [28] which was attributed to “translational proton quantum tunneling” [25, 29,
30] or to the extraordinary, yet unclear, behavior of the inter- and intramolecular bonds [31].
4.2 Temperature dependence of compressibility
Compression shortens the O-O distance but lengthens the H-O bond, resulting in the low compressibility
of ice compared to ‘normal’ materials [32]. The compressibility of liquid water is slightly higher than that
of ice. If a liquid water is sufficiently cold, its diffusivity increases and its viscosity decreases upon
compression. In contrast, compression of most other liquids leads to a progressive loss of fluidity as
molecules are squeezed closer together [33].
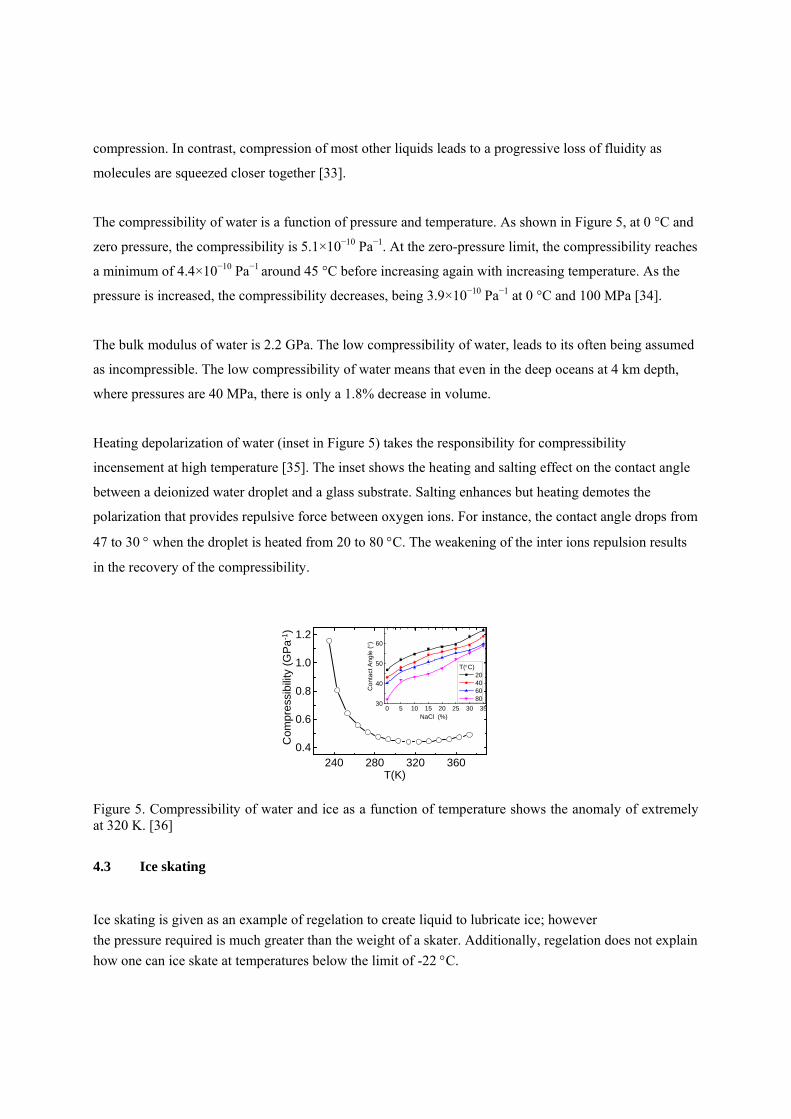
The compressibility of water is a function of pressure and temperature. As shown in Figure 5, at 0 °C and
zero pressure, the compressibility is 5.1×10⁻¹⁰ Pa−1. At the zero-pressure limit, the compressibility reaches
a minimum of 4.4×10⁻¹⁰ Pa−1 around 45 °C before increasing again with increasing temperature. As the
pressure is increased, the compressibility decreases, being 3.9×10⁻¹⁰ Pa−1 at 0 °C and 100 MPa [34].
The bulk modulus of water is 2.2 GPa. The low compressibility of water, leads to its often being assumed
as incompressible. The low compressibility of water means that even in the deep oceans at 4 km depth,
where pressures are 40 MPa, there is only a 1.8% decrease in volume.
Heating depolarization of water (inset in Figure 5) takes the responsibility for compressibility
incensement at high temperature [35]. The inset shows the heating and salting effect on the contact angle
between a deionized water droplet and a glass substrate. Salting enhances but heating demotes the
polarization that provides repulsive force between oxygen ions. For instance, the contact angle drops from
47 to 30 when the droplet is heated from 20 to 80 C. The weakening of the inter ions repulsion results
in the recovery of the compressibility.
240 280 320 3600.4
0.6
0.8
1.0
1.2
0 5 10 15 20 25 30 3530
40
50
60
Co
nta
ct A
ngl
e ()
NaCl (%)
T(C) 20 40 60 80
Com
pres
sibi
lity
(GP
a-1
)
T(K)
Figure 5. Compressibility of water and ice as a function of temperature shows the anomaly of extremely at 320 K. [36]
4.3 Ice skating
Ice skating is given as an example of regelation to create liquid to lubricate ice; however
the pressure required is much greater than the weight of a skater. Additionally, regelation does not explain
how one can ice skate at temperatures below the limit of -22 C.
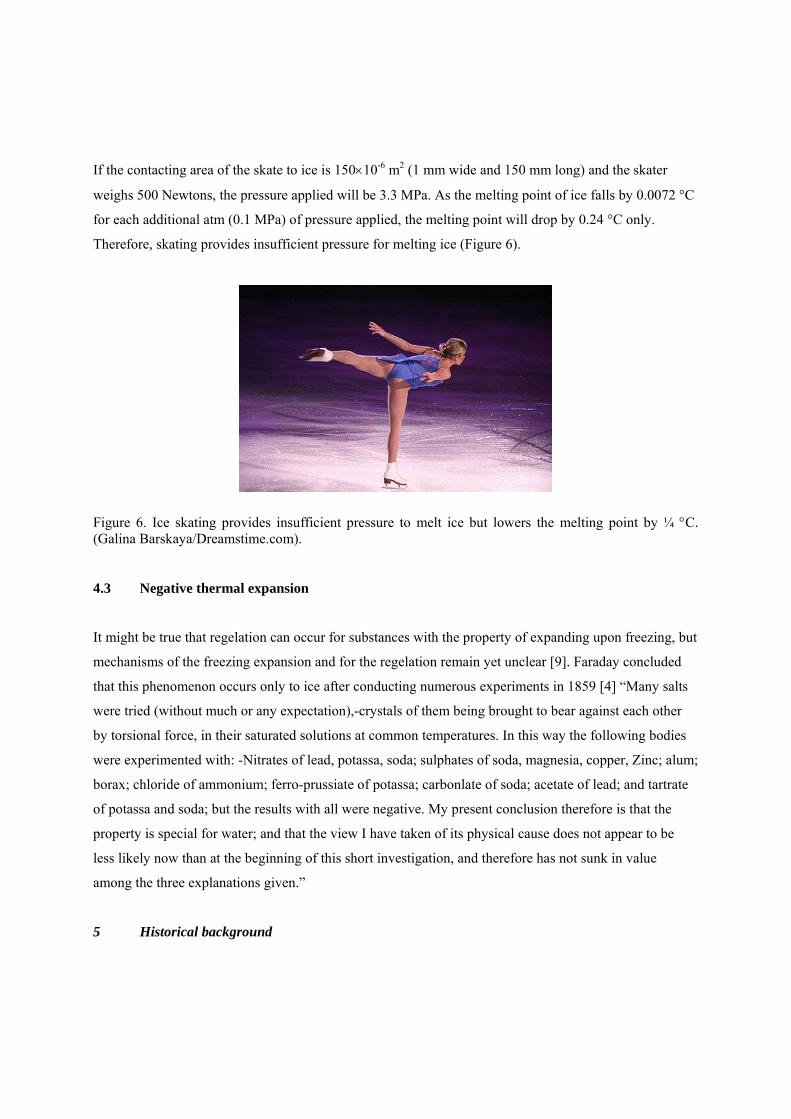
If the contacting area of the skate to ice is 15010-6 m2 (1 mm wide and 150 mm long) and the skater
weighs 500 Newtons, the pressure applied will be 3.3 MPa. As the melting point of ice falls by 0.0072 °C
for each additional atm (0.1 MPa) of pressure applied, the melting point will drop by 0.24 °C only.
Therefore, skating provides insufficient pressure for melting ice (Figure 6).
Figure 6. Ice skating provides insufficient pressure to melt ice but lowers the melting point by ¼ C. (Galina Barskaya/Dreamstime.com).
4.3 Negative thermal expansion
It might be true that regelation can occur for substances with the property of expanding upon freezing, but
mechanisms of the freezing expansion and for the regelation remain yet unclear [9]. Faraday concluded
that this phenomenon occurs only to ice after conducting numerous experiments in 1859 [4] “Many salts
were tried (without much or any expectation),-crystals of them being brought to bear against each other
by torsional force, in their saturated solutions at common temperatures. In this way the following bodies
were experimented with: -Nitrates of lead, potassa, soda; sulphates of soda, magnesia, copper, Zinc; alum;
borax; chloride of ammonium; ferro-prussiate of potassa; carbonlate of soda; acetate of lead; and tartrate
of potassa and soda; but the results with all were negative. My present conclusion therefore is that the
property is special for water; and that the view I have taken of its physical cause does not appear to be
less likely now than at the beginning of this short investigation, and therefore has not sunk in value
among the three explanations given.”
5 Historical background
Discovered by Faraday [4], Thomson [37], and Forbes [1, 2] in 1850’s (Figure 7), regelation is the
phenomenon of ice melting under pressure and freezing again when the pressure is relieved at
temperatures around -10 C. Faraday noted in his paper that [4], ‘Two pieces of thawing ice, if put
together, adhere and become one; at a place where liquefaction was proceeding, congelation suddenly
occurs. The effect will take place in air, in water, or in vacuo. It will occur at every point where the two
pieces of ice touch; but not with ice below the freezing point, i.e., with dry ice, or ice so cold as to be
everywhere in the solid state’. The generally accepted explanation for the phenomena is that sufficient
compressive stresses exist at the contact area to cause melting when the pieces of ice are brought together,
and when this stress is released solidification occurs. This was originally proposed by James Thomson [3]
and endorsed by his brother, Lord Kelvin (William Thomson) (Figure 8).
James Thomson noted [37]: “The phenomenon (Regelation) is a consequence of the properties,
announced from theory by Prof. James Thomson, and then exemplified by an experiment; and the
explanation depends on the theories put forward by him-the first (1857) founded on the lowering of the
freezing point of water by pressure, and the second (1861) founded on the tendency to melt given by the
application to the solid ice of forces whose nature is to produce change of form as distinguished from
forces applied alike to the liquid and solid. The stress upon the ice, due to its pressure on the network,
gives it a tendency to melt at the point in contact with the wire, and the ice, in the form of water
intermixed with fragments and new crystals, moves so as to relieve itself of pressure.”
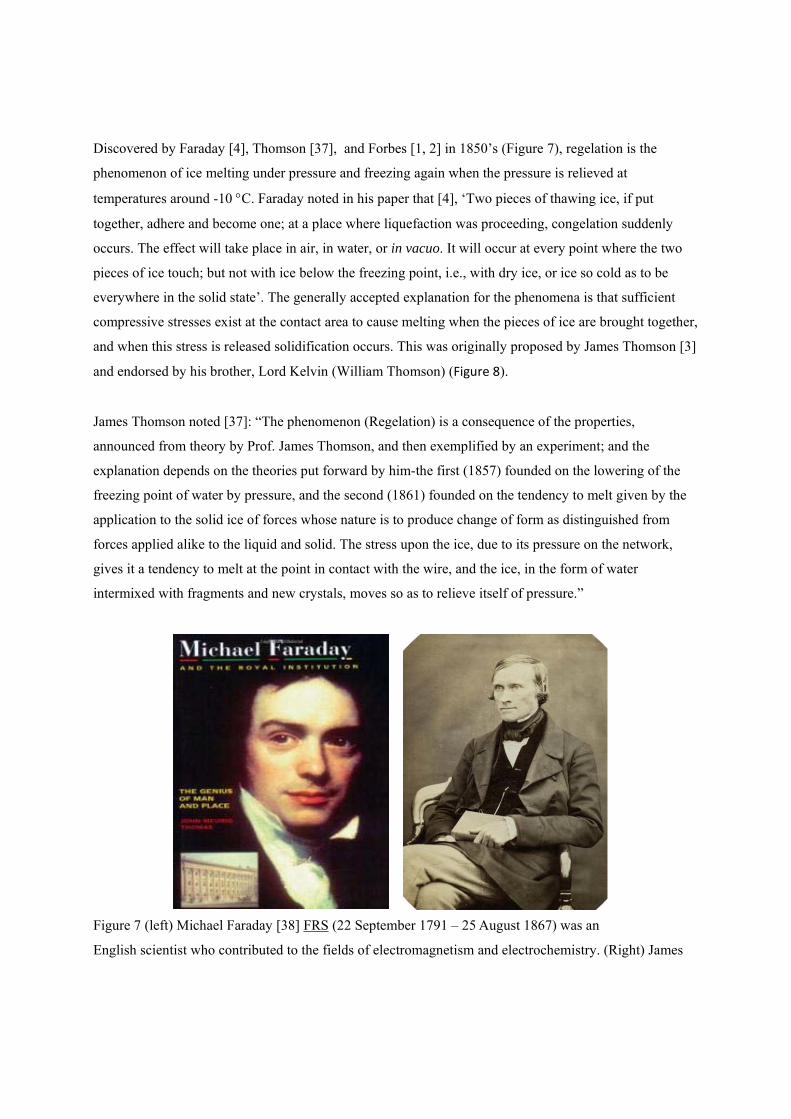
Figure 7 (left) Michael Faraday [38] FRS (22 September 1791 – 25 August 1867) was an
English scientist who contributed to the fields of electromagnetism and electrochemistry. (Right) James
David Forbes FRS FRSE FGS (20 April 1809 – 31 December 1868) was a Scottish physicist
and glaciologist who worked extensively on the conduction of heat and seismology.
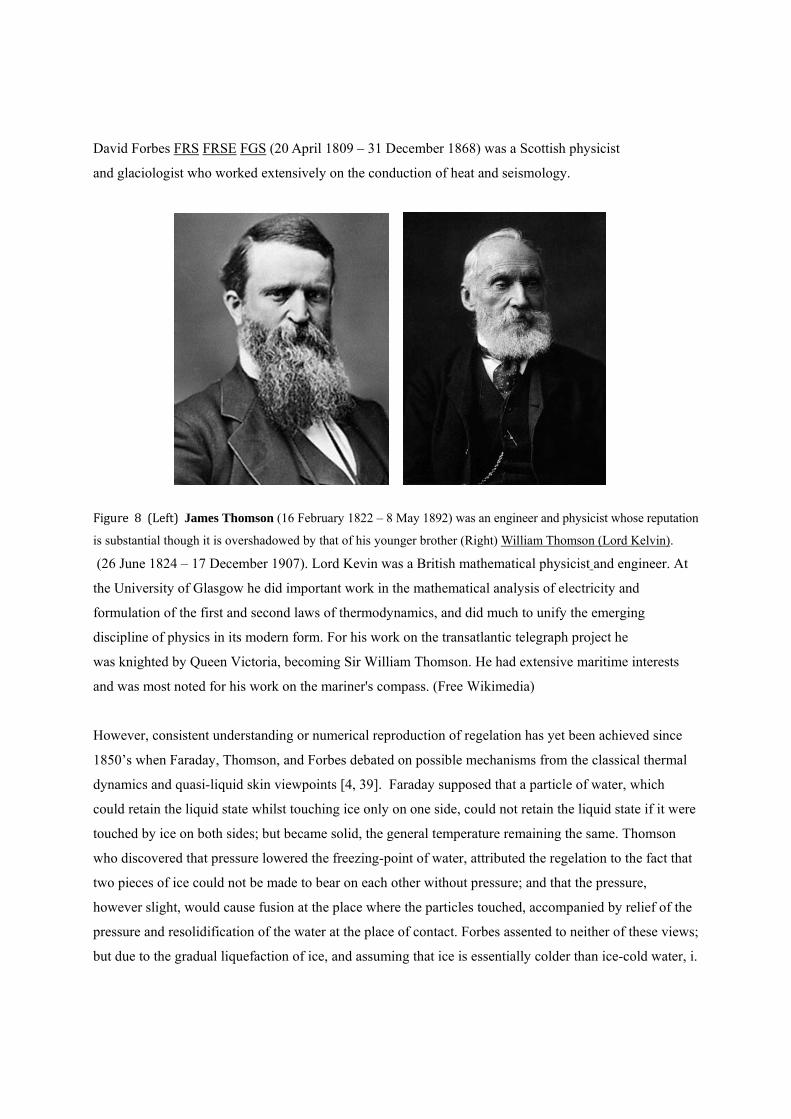
Figure 8 (Left) James Thomson (16 February 1822 – 8 May 1892) was an engineer and physicist whose reputation
is substantial though it is overshadowed by that of his younger brother (Right) William Thomson (Lord Kelvin).
(26 June 1824 – 17 December 1907). Lord Kevin was a British mathematical physicist and engineer. At
the University of Glasgow he did important work in the mathematical analysis of electricity and
formulation of the first and second laws of thermodynamics, and did much to unify the emerging
discipline of physics in its modern form. For his work on the transatlantic telegraph project he
was knighted by Queen Victoria, becoming Sir William Thomson. He had extensive maritime interests
and was most noted for his work on the mariner's compass. (Free Wikimedia)
However, consistent understanding or numerical reproduction of regelation has yet been achieved since
1850’s when Faraday, Thomson, and Forbes debated on possible mechanisms from the classical thermal
dynamics and quasi-liquid skin viewpoints [4, 39]. Faraday supposed that a particle of water, which
could retain the liquid state whilst touching ice only on one side, could not retain the liquid state if it were
touched by ice on both sides; but became solid, the general temperature remaining the same. Thomson
who discovered that pressure lowered the freezing-point of water, attributed the regelation to the fact that
two pieces of ice could not be made to bear on each other without pressure; and that the pressure,
however slight, would cause fusion at the place where the particles touched, accompanied by relief of the
pressure and resolidification of the water at the place of contact. Forbes assented to neither of these views;
but due to the gradual liquefaction of ice, and assuming that ice is essentially colder than ice-cold water, i.
e. the water in contact with it, he concluded that two wet pieces of ice will have the water between them
frozen at the place where they come into contact.
6 Quantitative evidence
6.1 O:H-O bond length symmetrization and compressibility
Generally, compression shortens all bonds of a normal substance. However, for the O:H-O bond in water
and ice, compression shortens the softer O:H nonbond and lengthens the stiffer H-O by different amounts.
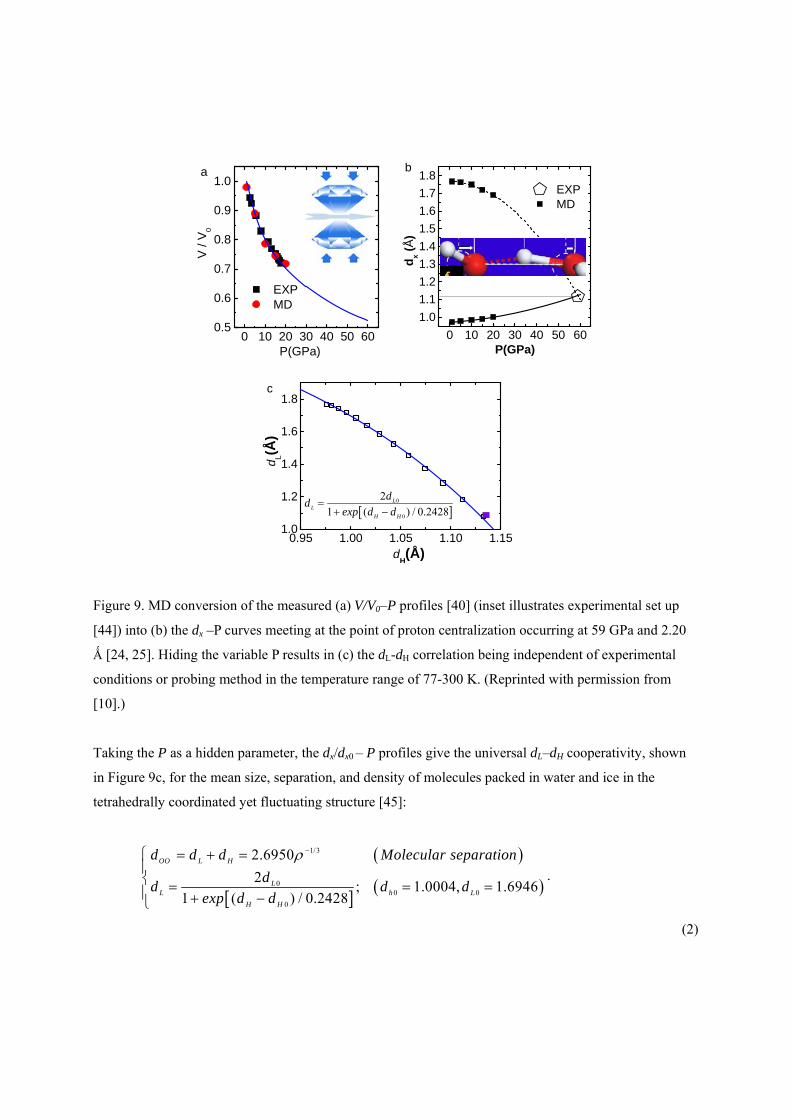
The O:H shortens more than the H-O elongation through inter oxygen ions repulsion. Figure 9a shows
the V/V0(P) profiles of water (300 K) and ice (77 K) measured using in situ high-pressure and
low-temperature synchrotron XRD and Raman spectroscopy [40]. Molecular dynamics (MD) calculations
converted the V/V0–P profiles into the dx/dx0 – P curves [10]. As shown in Figure 9b, compression
shortens the O:H nonbond from .1.767 to 0.1.692 Ǻ, meanwhile lengthens the H-O bond from 0.974 to
1.003 Ǻ when the pressure is increased from 1 to 20 GPa [41-43]. An extrapolation of the dx/dx0 – P
curves meet at the exact point of proton centralization occurred in phase X [24, 25, 40] at 58.6-59.0 GPa
with an O-O distance of 2.21-.2.20 Ǻ [25].
Therefore, the proton centralization arises from pressure-induced O:H-O bond asymmetrical relaxation
rather than from transitional H+ proton quantum tunneling that is unlikely because of the strong H-O bond
of 3.97 eV energy. Constrained by measured proton centralization and the V/V0 –P profiles, the dx/dx0 – P
curves represent the true situation in large temperature range (77-300 K) irrespective of the probing
techniques or conditions.
The following polynomials formulate the O:H-O bond length relaxations, in which P0 = 0.1 MPa is the
atmospheric pressure that approximates to zero:
4 1
5 2
/ 0.975 9.510 2.89310
/1.768 1 3.477 10.28010
/1.060 238.000 47.000
H
L
dP
dP
V
.
(1)
0 10 20 30 40 50 600.5
0.6
0.7
0.8
0.9
1.0
EXP MD
V /
V0
P(GPa)
a
0 10 20 30 40 50 60
1.0
1.1
1.2
1.3
1.4
1.5
1.6
1.7
1.8 EXP MD
dx (
Å)
P(GPa)
b
0.95 1.00 1.05 1.10 1.151.0
1.2
1.4
1.6
1.8
d L(Å
)
dH(Å)
c
0
0
2
1 ( / 0.2428)L
L
H H
dd
exp d d
Figure 9. MD conversion of the measured (a) V/V0–P profiles [40] (inset illustrates experimental set up
[44]) into (b) the dx –P curves meeting at the point of proton centralization occurring at 59 GPa and 2.20
Ǻ [24, 25]. Hiding the variable P results in (c) the dL-dH correlation being independent of experimental
conditions or probing method in the temperature range of 77-300 K. (Reprinted with permission from
[10].)
Taking the P as a hidden parameter, the dx/dx0 – P profiles give the universal dL–dH cooperativity, shown
in Figure 9c, for the mean size, separation, and density of molecules packed in water and ice in the
tetrahedrally coordinated yet fluctuating structure [45]:
1/3
00 0
0
1.0004, 1.6946
2.6950
2;
1 ( / 0.24) 28
OO L H
LL
H
h L
H
d d d
dd
e
Molecula
x
r separatio
p
n
ddd
d
.
(2)
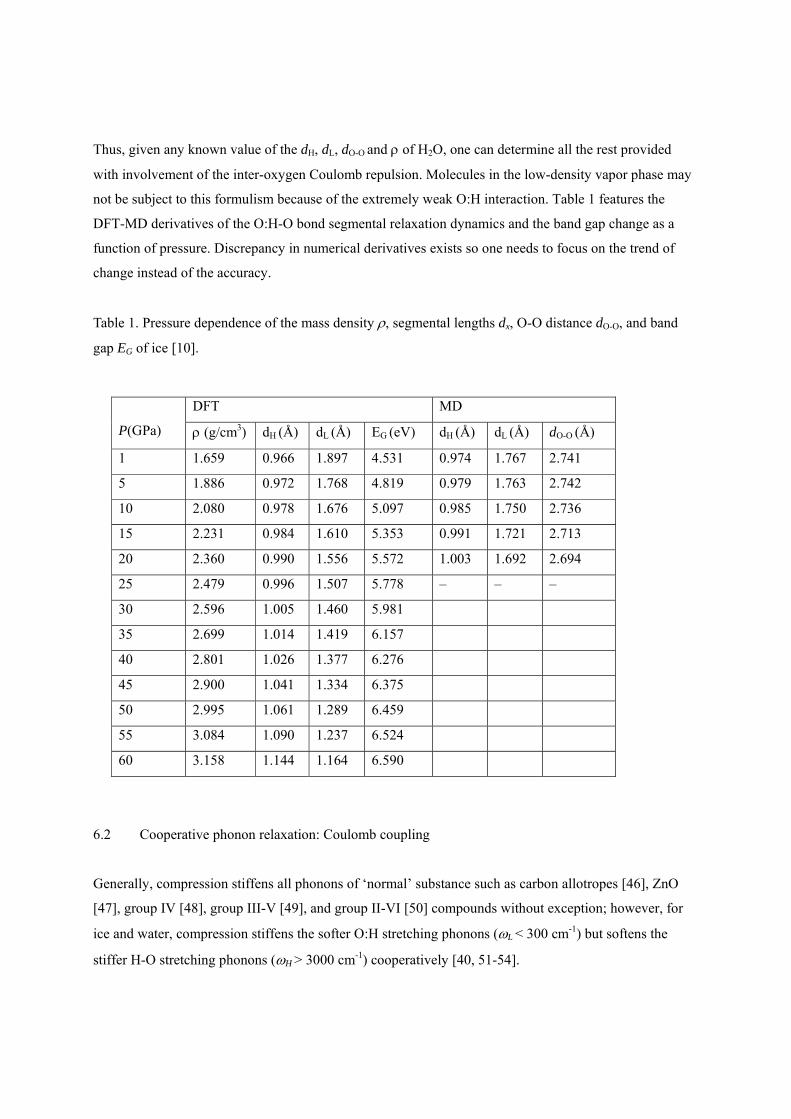
Thus, given any known value of the dH, dL, dO-O and of H2O, one can determine all the rest provided
with involvement of the inter-oxygen Coulomb repulsion. Molecules in the low-density vapor phase may
not be subject to this formulism because of the extremely weak O:H interaction. Table 1 features the
DFT-MD derivatives of the O:H-O bond segmental relaxation dynamics and the band gap change as a
function of pressure. Discrepancy in numerical derivatives exists so one needs to focus on the trend of
change instead of the accuracy.
Table 1. Pressure dependence of the mass density , segmental lengths dx, O-O distance dO-O, and band
gap EG of ice [10].
P(GPa)
DFT MD
(g/cm3) dH (Å) dL (Å) EG (eV) dH (Å) dL (Å) dO-O (Å)
1 1.659 0.966 1.897 4.531 0.974 1.767 2.741
5 1.886 0.972 1.768 4.819 0.979 1.763 2.742
10 2.080 0.978 1.676 5.097 0.985 1.750 2.736
15 2.231 0.984 1.610 5.353 0.991 1.721 2.713
20 2.360 0.990 1.556 5.572 1.003 1.692 2.694
25 2.479 0.996 1.507 5.778 – – –
30 2.596 1.005 1.460 5.981
35 2.699 1.014 1.419 6.157
40 2.801 1.026 1.377 6.276
45 2.900 1.041 1.334 6.375
50 2.995 1.061 1.289 6.459
55 3.084 1.090 1.237 6.524
60 3.158 1.144 1.164 6.590
6.2 Cooperative phonon relaxation: Coulomb coupling
Generally, compression stiffens all phonons of ‘normal’ substance such as carbon allotropes [46], ZnO
[47], group IV [48], group III-V [49], and group II-VI [50] compounds without exception; however, for
ice and water, compression stiffens the softer O:H stretching phonons (L < 300 cm-1) but softens the
stiffer H-O stretching phonons (H > 3000 cm-1) cooperatively [40, 51-54].
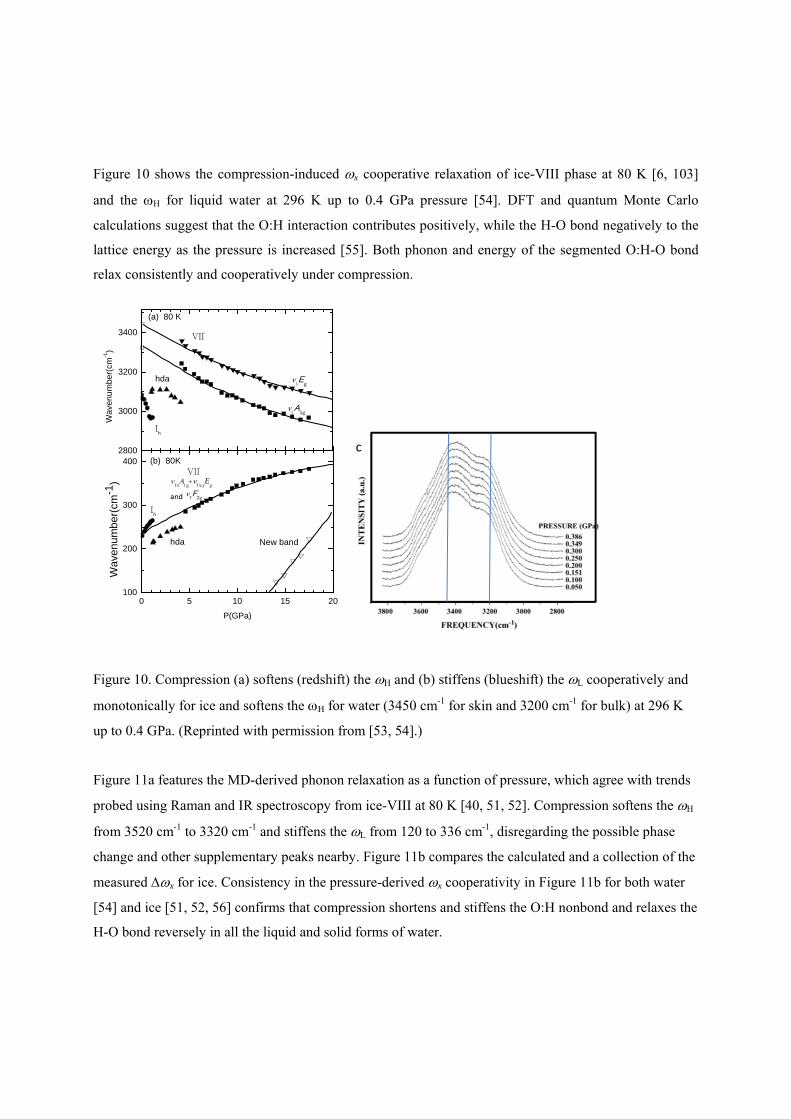
Figure 10 shows the compression-induced x cooperative relaxation of ice-VIII phase at 80 K [6, 103]
and the H for liquid water at 296 K up to 0.4 GPa pressure [54]. DFT and quantum Monte Carlo
calculations suggest that the O:H interaction contributes positively, while the H-O bond negatively to the
lattice energy as the pressure is increased [55]. Both phonon and energy of the segmented O:H-O bond
relax consistently and cooperatively under compression.
Figure 10. Compression (a) softens (redshift) the H and (b) stiffens (blueshift) the L cooperatively and
monotonically for ice and softens the H for water (3450 cm-1 for skin and 3200 cm-1 for bulk) at 296 K
up to 0.4 GPa. (Reprinted with permission from [53, 54].)
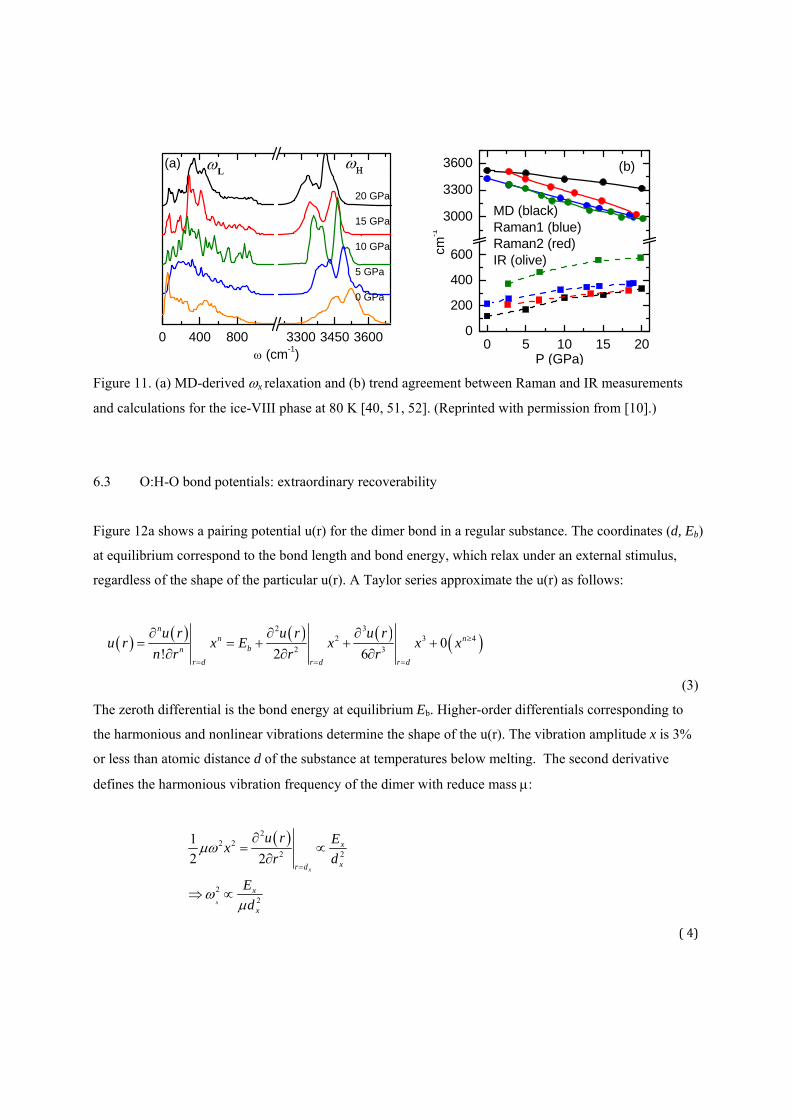
Figure 11a features the MD-derived phonon relaxation as a function of pressure, which agree with trends
probed using Raman and IR spectroscopy from ice-VIII at 80 K [40, 51, 52]. Compression softens the H
from 3520 cm-1 to 3320 cm-1 and stiffens the L from 120 to 336 cm-1, disregarding the possible phase
change and other supplementary peaks nearby. Figure 11b compares the calculated and a collection of the
measured x for ice. Consistency in the pressure-derived x cooperativity in Figure 11b for both water
[54] and ice [51, 52, 56] confirms that compression shortens and stiffens the O:H nonbond and relaxes the
H-O bond reversely in all the liquid and solid forms of water.
0 5 10 15 20100
200
300
400
New band
Ih
hda
z
g
x,yE
g
andF2g
VII(b) 80K
Wa
venu
mbe
r(cm
-1)
P(GPa)
2800
3000
3200
3400
Ih
VII
Wa
ven
um
ber
(cm
-1)
(a) 80 K
hda Eg
A
1g
c
0 400 800 3300 3450 3600
(cm-1)
20 GPa
15 GPa
10 GPa
5 GPa
0 GPa
(a) L
0 5 10 15 200
200
400
600
3000
3300
3600
cm-1
P (GPa)
MD (black)Raman1 (blue)Raman2 (red)IR (olive)
(b)
Figure 11. (a) MD-derived x relaxation and (b) trend agreement between Raman and IR measurements
and calculations for the ice-VIII phase at 80 K [40, 51, 52]. (Reprinted with permission from [10].)
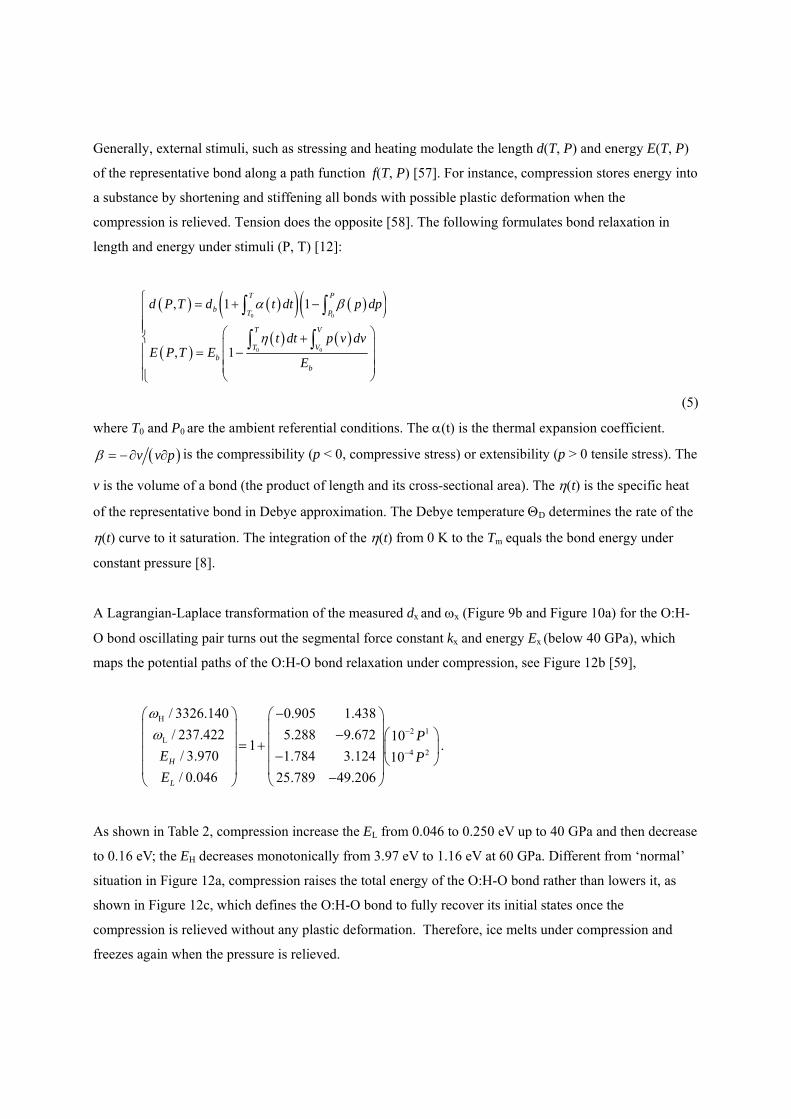
6.3 O:H-O bond potentials: extraordinary recoverability
Figure 12a shows a pairing potential u(r) for the dimer bond in a regular substance. The coordinates (d, Eb)
at equilibrium correspond to the bond length and bond energy, which relax under an external stimulus,
regardless of the shape of the particular u(r). A Taylor series approximate the u(r) as follows:
2 3
2 3 42 3
0! 2 6
nn n
bn
r d r d r d
u r u r u ru r x E x x x
n r r r
(3)
The zeroth differential is the bond energy at equilibrium Eb. Higher-order differentials corresponding to
the harmonious and nonlinear vibrations determine the shape of the u(r). The vibration amplitude x is 3%
or less than atomic distance d of the substance at temperatures below melting. The second derivative
defines the harmonious vibration frequency of the dimer with reduce mass :
22 2
2 2
22
1
2 2x
x
x
xr d
x
x
u r Ex
r d
E
d
(4)
Generally, external stimuli, such as stressing and heating modulate the length d(T, P) and energy E(T, P)
of the representative bond along a path function f(T, P) [57]. For instance, compression stores energy into
a substance by shortening and stiffening all bonds with possible plastic deformation when the
compression is relieved. Tension does the opposite [58]. The following formulates bond relaxation in
length and energy under stimuli (P, T) [12]:
0 0
0 0
, 1 1
, 1
T P
b T P
T V
T Vb
b
d P T d t dt p dp
t dt p v dvE P T E
E
(5)
where T0 and P0 are the ambient referential conditions. The (t) is the thermal expansion coefficient.
v v p is the compressibility (p < 0, compressive stress) or extensibility (p > 0 tensile stress). The
v is the volume of a bond (the product of length and its cross-sectional area). The (t) is the specific heat
of the representative bond in Debye approximation. The Debye temperature D determines the rate of the
(t) curve to it saturation. The integration of the (t) from 0 K to the Tm equals the bond energy under
constant pressure [8].
A Lagrangian-Laplace transformation of the measured dx and x (Figure 9b and Figure 10a) for the O:H-
O bond oscillating pair turns out the segmental force constant kx and energy Ex (below 40 GPa), which
maps the potential paths of the O:H-O bond relaxation under compression, see Figure 12b [59],
H
2 1L
4 2
/ 3326.140 0.905 1.438
/ 237.422 5.288 9.672 101
/ 3.970 1.784 3.124 10
/ 0.046 25.789 49.206H
L
P
E P
E
.
As shown in Table 2, compression increase the EL from 0.046 to 0.250 eV up to 40 GPa and then decrease
to 0.16 eV; the EH decreases monotonically from 3.97 eV to 1.16 eV at 60 GPa. Different from ‘normal’
situation in Figure 12a, compression raises the total energy of the O:H-O bond rather than lowers it, as
shown in Figure 12c, which defines the O:H-O bond to fully recover its initial states once the
compression is relieved without any plastic deformation. Therefore, ice melts under compression and
freezes again when the pressure is relieved.
0.6 0.8 1.0 1.2-1.5
-1.0
-0.5
0.0
0.5a
u(P
)/u(
P0)
f(P)
d(P)/d(P0)
P > 0
-0.50
-0.25
0.00
0.25
0.50
-1.5 -1.0 1.0 1.5
dx/Å
CompressionElongation
Vx(d
x)/eVb
P > 0
-5.0
-2.5
0.0
2.5
5.0
0 10 20 30 40 50 60
0.0
0.5
1.0
1.5
2.0
2.5
3.0
E
(eV
)
P(GPa)
c
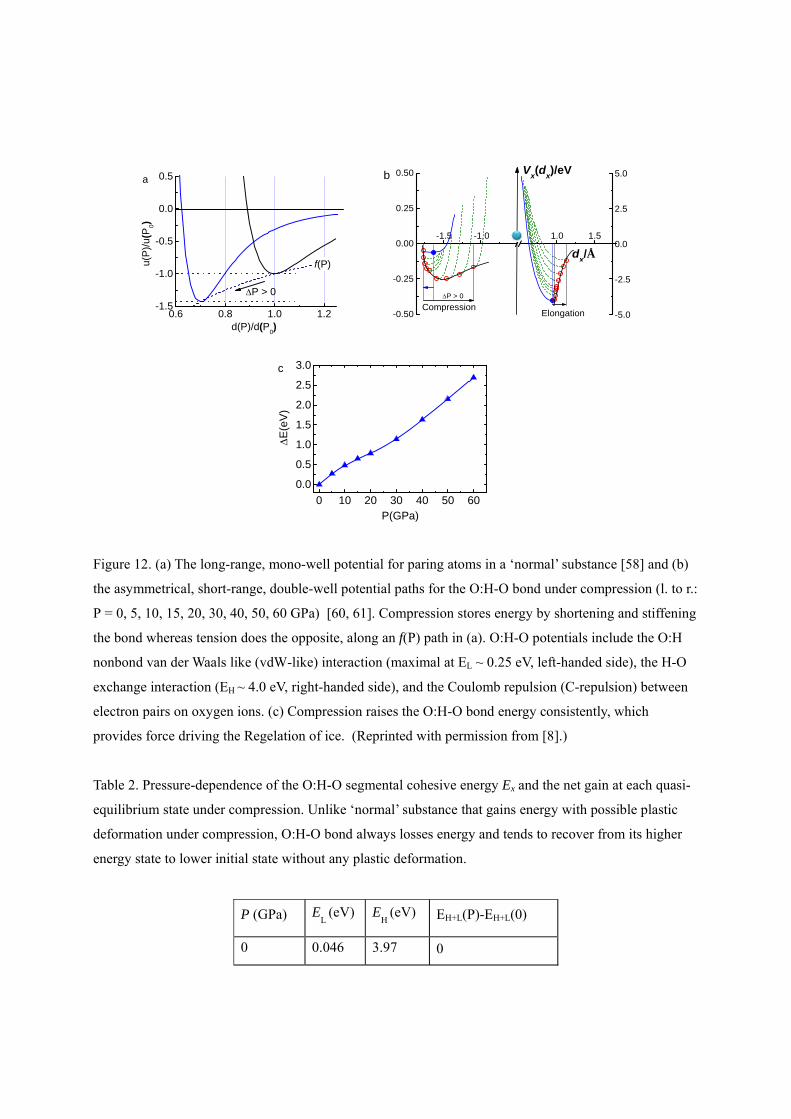
Figure 12. (a) The long-range, mono-well potential for paring atoms in a ‘normal’ substance [58] and (b)
the asymmetrical, short-range, double-well potential paths for the O:H-O bond under compression (l. to r.:
P = 0, 5, 10, 15, 20, 30, 40, 50, 60 GPa) [60, 61]. Compression stores energy by shortening and stiffening
the bond whereas tension does the opposite, along an f(P) path in (a). O:H-O potentials include the O:H
nonbond van der Waals like (vdW-like) interaction (maximal at EL ~ 0.25 eV, left-handed side), the H-O
exchange interaction (EH ~ 4.0 eV, right-handed side), and the Coulomb repulsion (C-repulsion) between
electron pairs on oxygen ions. (c) Compression raises the O:H-O bond energy consistently, which
provides force driving the Regelation of ice. (Reprinted with permission from [8].)
Table 2. Pressure-dependence of the O:H-O segmental cohesive energy Ex and the net gain at each quasi-
equilibrium state under compression. Unlike ‘normal’ substance that gains energy with possible plastic
deformation under compression, O:H-O bond always losses energy and tends to recover from its higher
energy state to lower initial state without any plastic deformation.
P (GPa) EL
(eV) EH
(eV) EH+L(P)-EH+L(0)
0 0.046 3.97 0
5 0.098 3.64 -0.278
10 0.141 3.39 -0.485
15 0.173 3.19 -0.653
20 0.190 3.04 -0.786
30 0.247 2.63 -1.139
40 0.250 2.13 -1.636
50 0.216 1.65 -2.15
60 0.160 1.16 -2.696
6.4 Band gap modulation: Blue iceberg
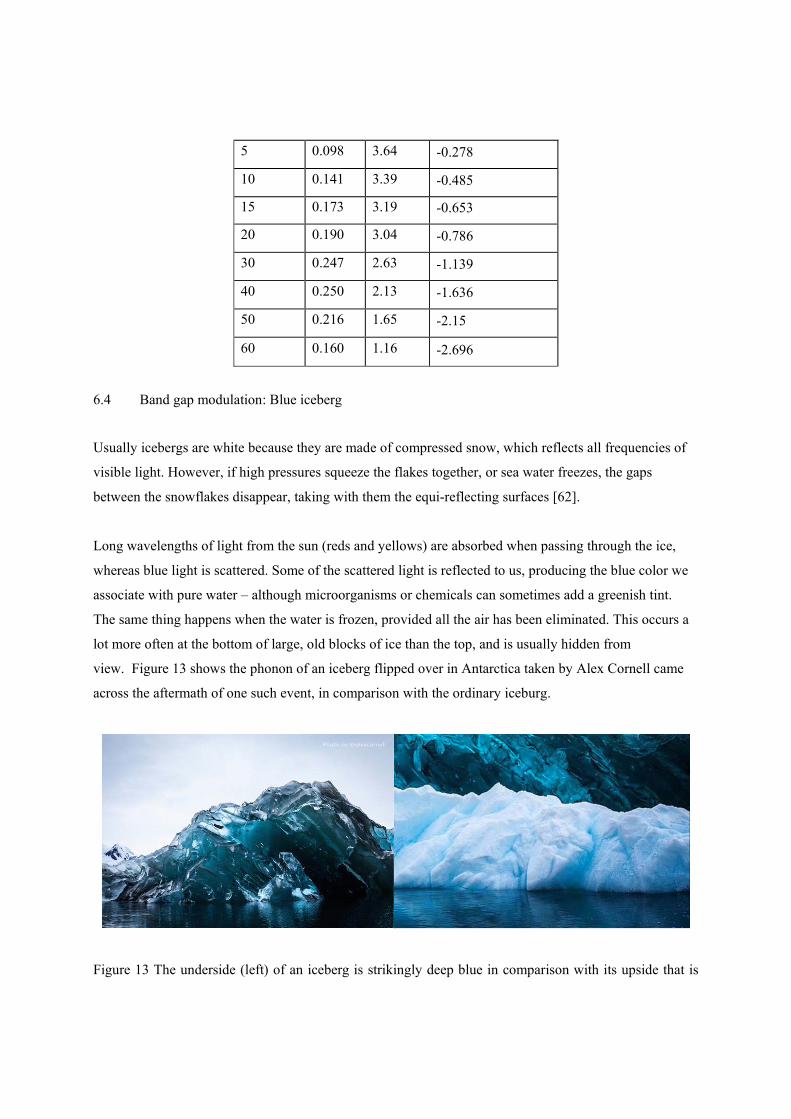
Usually icebergs are white because they are made of compressed snow, which reflects all frequencies of
visible light. However, if high pressures squeeze the flakes together, or sea water freezes, the gaps
between the snowflakes disappear, taking with them the equi-reflecting surfaces [62].
Long wavelengths of light from the sun (reds and yellows) are absorbed when passing through the ice,
whereas blue light is scattered. Some of the scattered light is reflected to us, producing the blue color we
associate with pure water – although microorganisms or chemicals can sometimes add a greenish tint.
The same thing happens when the water is frozen, provided all the air has been eliminated. This occurs a
lot more often at the bottom of large, old blocks of ice than the top, and is usually hidden from
view. Figure 13 shows the phonon of an iceberg flipped over in Antarctica taken by Alex Cornell came
across the aftermath of one such event, in comparison with the ordinary iceburg.
Figure 13 The underside (left) of an iceberg is strikingly deep blue in comparison with its upside that is
white in Antarctica (photo credit: Alex Cornell [62]) .
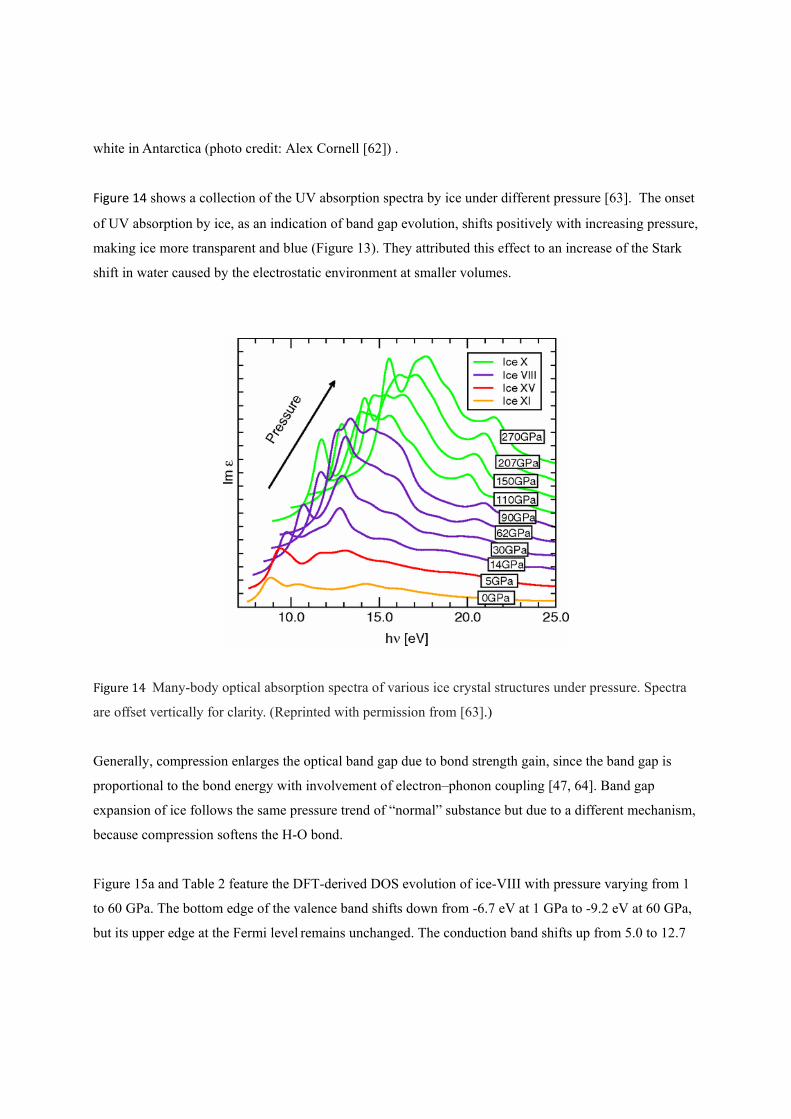
Figure 14 shows a collection of the UV absorption spectra by ice under different pressure [63]. The onset
of UV absorption by ice, as an indication of band gap evolution, shifts positively with increasing pressure,
making ice more transparent and blue (Figure 13). They attributed this effect to an increase of the Stark
shift in water caused by the electrostatic environment at smaller volumes.
Figure14 Many-body optical absorption spectra of various ice crystal structures under pressure. Spectra
are offset vertically for clarity. (Reprinted with permission from [63].)
Generally, compression enlarges the optical band gap due to bond strength gain, since the band gap is
proportional to the bond energy with involvement of electron–phonon coupling [47, 64]. Band gap
expansion of ice follows the same pressure trend of “normal” substance but due to a different mechanism,
because compression softens the H-O bond.
Figure 15a and Table 2 feature the DFT-derived DOS evolution of ice-VIII with pressure varying from 1
to 60 GPa. The bottom edge of the valence band shifts down from -6.7 eV at 1 GPa to -9.2 eV at 60 GPa,
but its upper edge at the Fermi level remains unchanged. The conduction band shifts up from 5.0 to 12.7
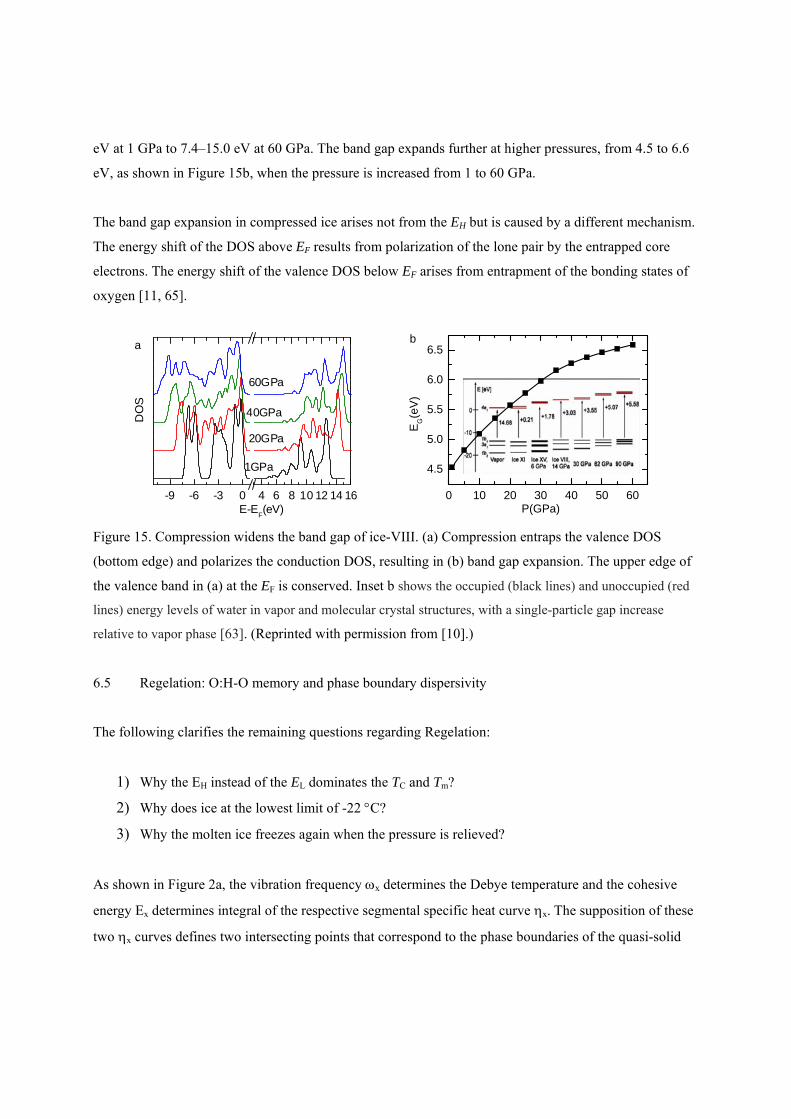
eV at 1 GPa to 7.4–15.0 eV at 60 GPa. The band gap expands further at higher pressures, from 4.5 to 6.6
eV, as shown in Figure 15b, when the pressure is increased from 1 to 60 GPa.
The band gap expansion in compressed ice arises not from the EH but is caused by a different mechanism.
The energy shift of the DOS above EF results from polarization of the lone pair by the entrapped core
electrons. The energy shift of the valence DOS below EF arises from entrapment of the bonding states of
oxygen [11, 65].
-9 -6 -3 0 4 6 8 10 12 14 16
DO
S
E-EF(eV)
1GPa
20GPa
40GPa
60GPa
a
0 10 20 30 40 50 60
4.5
5.0
5.5
6.0
6.5
EG(e
V)
P(GPa)
b
Figure 15. Compression widens the band gap of ice-VIII. (a) Compression entraps the valence DOS
(bottom edge) and polarizes the conduction DOS, resulting in (b) band gap expansion. The upper edge of
the valence band in (a) at the EF is conserved. Inset b shows the occupied (black lines) and unoccupied (red
lines) energy levels of water in vapor and molecular crystal structures, with a single-particle gap increase
relative to vapor phase [63]. (Reprinted with permission from [10].)
6.5 Regelation: O:H-O memory and phase boundary dispersivity
The following clarifies the remaining questions regarding Regelation:
1) Why the EH instead of the EL dominates the TC and Tm?
2) Why does ice at the lowest limit of -22 C?
3) Why the molten ice freezes again when the pressure is relieved?
As shown in Figure 2a, the vibration frequency x determines the Debye temperature and the cohesive
energy Ex determines integral of the respective segmental specific heat curve x. The supposition of these
two x curves defines two intersecting points that correspond to the phase boundaries of the quasi-solid
phase or the extreme density temperatures. The high-temperature boundary is sensitive to the H rather
than the L, and therefore, the EH and H determine the Tm.
Compression/tension (P > 0)/(P < 0) disperses these boundaries simultaneously and reversely by
modulating the Dx Dx, on the base of an extension of Einstein’s relationship [8]: / /DL DH L H .
As shown in Figure 10, compression stiffens the L and meanwhile softens the H, which closes up the
crossing temperatures and lowers the Tm. Negative pressure does the opposite to raise the Tm. The entire
process is reversible according to total energy change, shown Figure 12c.
The EL determines molecular dissociation turning liquid water into vapour at TV. If remove one H2O
molecule from the bulk, one has to break four O:H nonbonds with energy of 0.38 eV per molecule at the
ambient pressure [66]. As elaborated above, the Tm depends on the EH though the Tm is lower than the TV
at the ambient pressure.
Regelation happens under the conditions of -95 MPa P 210 MPa and 252 K T < 273 K. If the
pressure is higher than the critical value of 210 MPa, the quasi-solid phase disappears and the liquid
transits into phase III, VI and V.
Once the O:H nonbond breaks by perturbation, oxygen atoms will find new partners to retain the sp3-
orbital hybridization, which is the same to diamond oxidation and metal diffusive corrosion [11].
Therefore, O:H-O bond has the strong recoverability for relaxation and dissociation without any plastic
deformation. Compression stores energy into water ice by raising the total bond energy, EL+EH, through
inter electron pair repulsion [16], once the pressure is relieved, the O:H-O bond will relax to its initially
low energy states.
7 Further extension
7.1 Boundary formulation of water phase diagram
The phase diagram of water and ice in Figure 16 shows the following boundary TC(P) features according
to their slopes:
, ( , ),
0 , ,
0 , ( , , , )
0 , ,
C
X XI X VII VIII etc
Ic VI XV VI etcdTLiquid Vapour Liquid III IV V VIIdP
VII VIII Ih Liquid etc
(6)
The versatile TC(P) slopes represent different yet unclear dynamics of O:H-O bond relaxation at the phase
boundaries. Numerous formulae described the TC(P) from the classical thermodynamic point of view,
mainly for the Liquid-Vapor phase transition. For instances, Clausius–Clapeyron equation [67] describes
water vapor under typical atmospheric conditions (near standard temperature and pressure) and August-
Roche-Magnus formula [68] approximates the temperature dependence of the saturation vapor pressure
PS:
2
17.6256.1094exp
243.04
v ss
v
s
L T PdPClausius Clapeyron
dT R T
TP T August Roche Magnus
T
(7)
Where Lv is the specific latent heat of evaporation of water and RS is the gas constant of vapor.
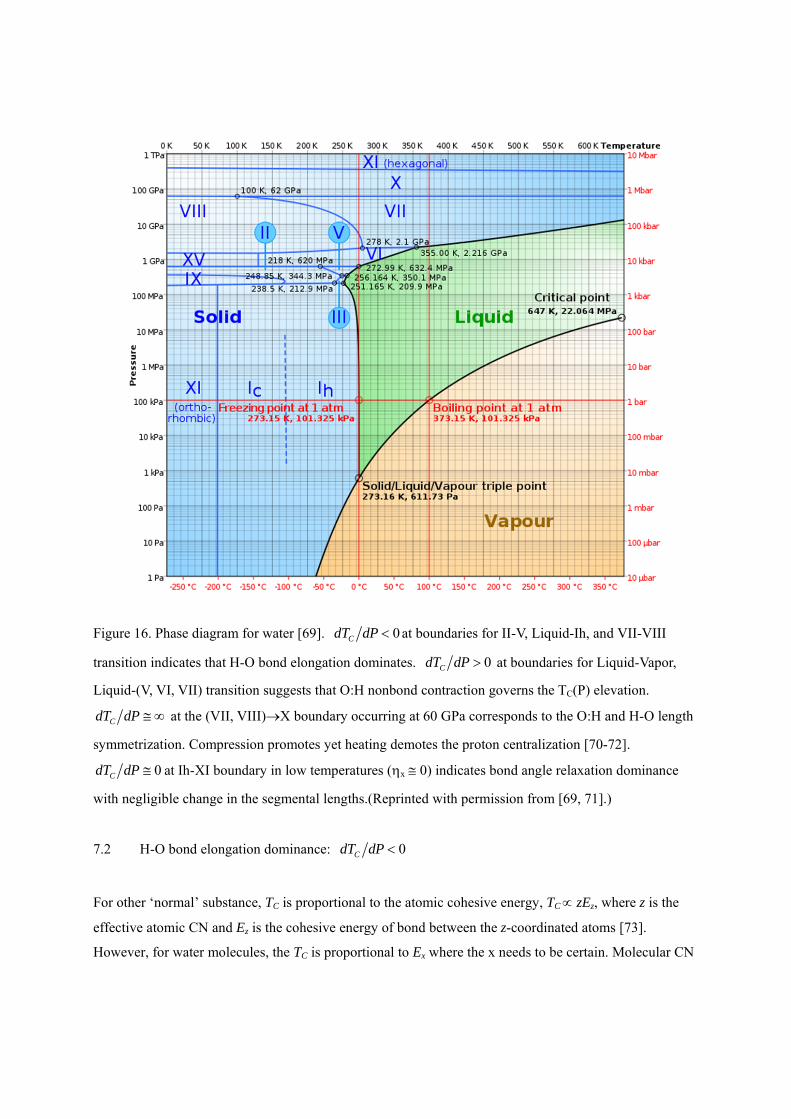
Figure 16. Phase diagram for water [69]. 0CdT dP at boundaries for II-V, Liquid-Ih, and VII-VIII
transition indicates that H-O bond elongation dominates. 0CdT dP at boundaries for Liquid-Vapor,
Liquid-(V, VI, VII) transition suggests that O:H nonbond contraction governs the TC(P) elevation.
CdT dP at the (VII, VIII)X boundary occurring at 60 GPa corresponds to the O:H and H-O length
symmetrization. Compression promotes yet heating demotes the proton centralization [70-72].
0CdT dP at Ih-XI boundary in low temperatures (x 0) indicates bond angle relaxation dominance
with negligible change in the segmental lengths.(Reprinted with permission from [69, 71].)
7.2 H-O bond elongation dominance: 0CdT dP
For other ‘normal’ substance, TC is proportional to the atomic cohesive energy, TC zEz, where z is the
effective atomic CN and Ez is the cohesive energy of bond between the z-coordinated atoms [73].
However, for water molecules, the TC is proportional to Ex where the x needs to be certain. Molecular CN
contributes indirectly to the bond length and energy but not to the TC Ex, because of the ‘isolation’ of
the H2O molecule by its surrounding lone pairs.
It is universally true that compression shortens the softer O:H nonbond more than the stiffer H-O bond
elongates because of the repulsion between electron pairs on adjacent O ions. The shortened O:H
nonbond is associated with energy and vibration frequency gain but the lengthened H-O bond is suffered
frequency and energy loss.
The following generalizes TC(P) as a function of the segmental volume change vx = sxdx under pressure (x
= H for the H-O bond and x = L for the O:H nonbond) with sx being the cross-sectional area of the
segment,
0
0 0 0
0
0( ) ( )1 1
0( )
VL
xV HC x
C x x
dpdv dT P E P
T P E E
(8)
The Ex0 is the reference of the segmental cohesive energy at the ambient conditions. The dL, dH, and are
factors dominating the respective TC(P) profile.
The TC(P) profiles for the Liquid-Ic and the Ice VII-VIII phase transition epitomize the situation of
negative slopes. With the known dx(P) relation, the following proves that EH relaxation dictates these
TC(P). According to eq (5), the TC changes with Ex but x = H is as yet to be confirmed [57],
0
0 0
d( )
1 1( )
PH
HPC
C H
ds p dp
T P dpT P E
.
(9)
Reproduction of the measured TC(P) for the VII–VIII phase transition [51, 52, 56], and the Tm(P) for ice
melting (-22 C at 210 MPa; +6.5 C at -95 MPa, see Figure 1b) [6, 74] requires that the integral must be
positive, or the dx decreases when the pressure is applied. Only the dH in Eq. (1), meets this criterion.
Therefore, the H-O bond dominates the Tm and the TC, as shown in Figure 1b and Figure 17. With the
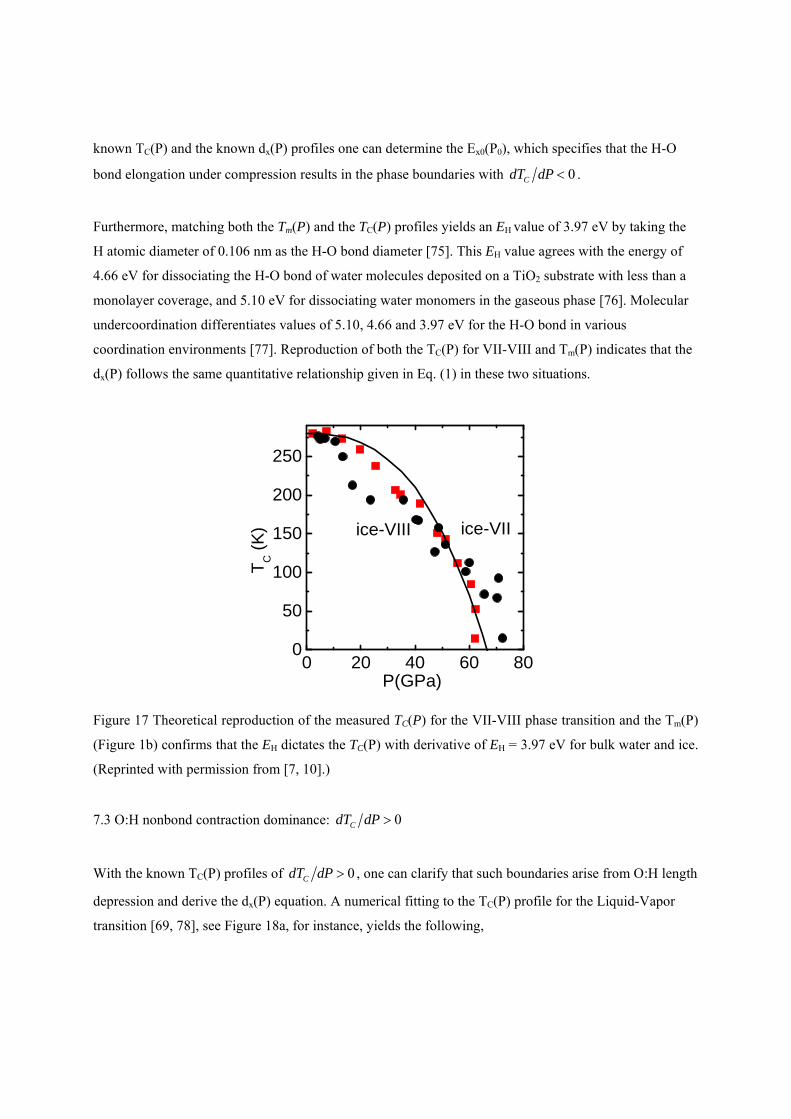
known TC(P) and the known dx(P) profiles one can determine the Ex0(P0), which specifies that the H-O
bond elongation under compression results in the phase boundaries with 0CdT dP .
Furthermore, matching both the Tm(P) and the TC(P) profiles yields an EH value of 3.97 eV by taking the
H atomic diameter of 0.106 nm as the H-O bond diameter [75]. This EH value agrees with the energy of
4.66 eV for dissociating the H-O bond of water molecules deposited on a TiO2 substrate with less than a
monolayer coverage, and 5.10 eV for dissociating water monomers in the gaseous phase [76]. Molecular
undercoordination differentiates values of 5.10, 4.66 and 3.97 eV for the H-O bond in various
coordination environments [77]. Reproduction of both the TC(P) for VII-VIII and Tm(P) indicates that the
dx(P) follows the same quantitative relationship given in Eq. (1) in these two situations.
0 20 40 60 800
50
100
150
200
250
TC (
K)
P(GPa)
ice-VIII ice-VII
Figure 17 Theoretical reproduction of the measured TC(P) for the VII-VIII phase transition and the Tm(P)
(Figure 1b) confirms that the EH dictates the TC(P) with derivative of EH = 3.97 eV for bulk water and ice.
(Reprinted with permission from [7, 10].)
7.3 O:H nonbond contraction dominance: 0CdT dP
With the known TC(P) profiles of 0CdT dP , one can clarify that such boundaries arise from O:H length
depression and derive the dx(P) equation. A numerical fitting to the TC(P) profile for the Liquid-Vapor
transition [69, 78], see Figure 18a, for instance, yields the following,
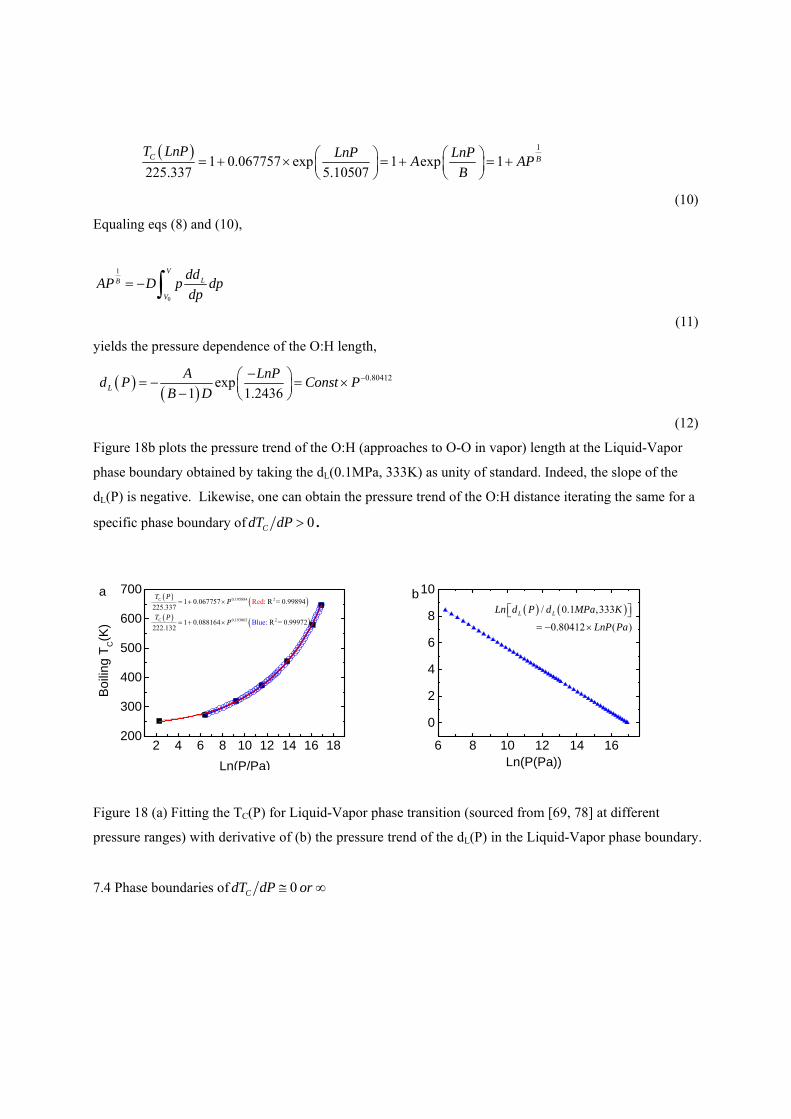
1
1 0.067757 exp 1 exp 1225.337 5.10507
C BT LnP LnP LnP
A APB
(10)
Equaling eqs (8) and (10),
0
1 VLB
V
ddAP D p dp
dp
(11)
yields the pressure dependence of the O:H length,
0.80412exp
1 1.2436L
A LnPd P Const P
B D
(12)
Figure 18b plots the pressure trend of the O:H (approaches to O-O in vapor) length at the Liquid-Vapor
phase boundary obtained by taking the dL(0.1MPa, 333K) as unity of standard. Indeed, the slope of the
dL(P) is negative. Likewise, one can obtain the pressure trend of the O:H distance iterating the same for a
specific phase boundary of 0CdT dP .
2 4 6 8 10 12 14 16 18200
300
400
500
600
700
Boi
ling
TC(K
)
Ln(P/Pa)
0.195884 2
0.193003 2
1 0.067757 : R = 0.99894225.337
1 0.088164 R = 0.99972
Re
222.13Bl e
2
d
u :
C
C
T PP
T PP
a
6 8 10 12 14 16
0
2
4
6
8
10
Ln(P(Pa))
b / 0.1 ,333
0.80412 ( )
L LLn d P d MPa K
LnP Pa
Figure 18 (a) Fitting the TC(P) for Liquid-Vapor phase transition (sourced from [69, 78] at different
pressure ranges) with derivative of (b) the pressure trend of the dL(P) in the Liquid-Vapor phase boundary.
7.4 Phase boundaries of 0CdT dP or
The phase boundaries of 0CdT dP or means that the TC is energy independent. The O:H-O
cooperative relaxation in length and energy contributes insignificantly to the phase transition at these
boundaries but bond angle relaxation changing the geometry configuration of ice.
TC(P) 70 K at the Ic-XI phase boundary is within the IVth temperature regime where the specific heat
x 0 [9]. Neither the O:H nor the H-O bond is subject to length and energy change but the O:H-O
containing angle become dominance in the structure relaxation [9].
The phase boundaries meet the criterion, CdT dP , or TC (PC), at rather high pressures are
insensitive to temperature, typically the boundaries of X-XI, X-(VIII,VIII). (PC) = 1 if P = PC, else, (PC)
= 0. The O:H and the H-O are identical in length of 0.11 Ǻ in phase X [10]. Insignificant length relaxation
happens to both segments at these boundaries but geometrical evolution.
7.5 Mechanical freezing of ambient water
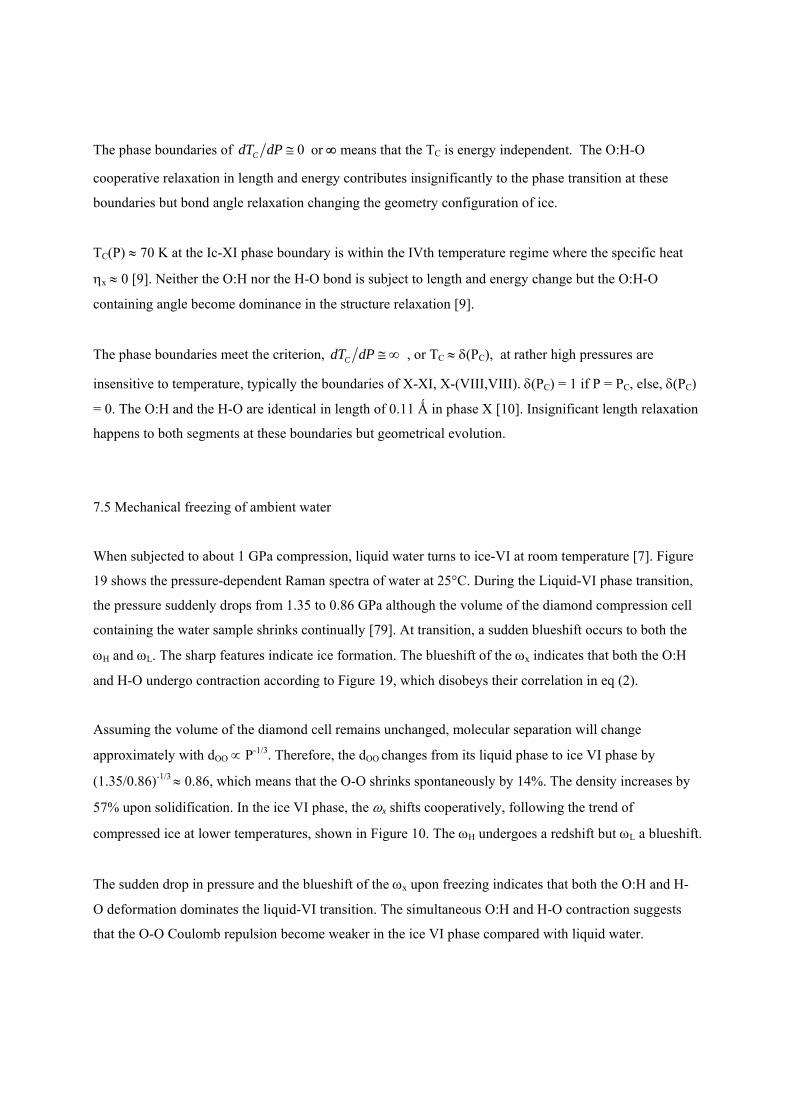
When subjected to about 1 GPa compression, liquid water turns to ice-VI at room temperature [7]. Figure
19 shows the pressure-dependent Raman spectra of water at 25°C. During the Liquid-VI phase transition,
the pressure suddenly drops from 1.35 to 0.86 GPa although the volume of the diamond compression cell
containing the water sample shrinks continually [79]. At transition, a sudden blueshift occurs to both the
H and L. The sharp features indicate ice formation. The blueshift of the x indicates that both the O:H
and H-O undergo contraction according to Figure 19, which disobeys their correlation in eq (2).
Assuming the volume of the diamond cell remains unchanged, molecular separation will change
approximately with dOO P-1/3. Therefore, the dOO changes from its liquid phase to ice VI phase by
(1.35/0.86)-1/3 0.86, which means that the O-O shrinks spontaneously by 14%. The density increases by
57% upon solidification. In the ice VI phase, the x shifts cooperatively, following the trend of
compressed ice at lower temperatures, shown in Figure 10. The H undergoes a redshift but L a blueshift.
The sudden drop in pressure and the blueshift of the x upon freezing indicates that both the O:H and H-
O deformation dominates the liquid-VI transition. The simultaneous O:H and H-O contraction suggests
that the O-O Coulomb repulsion become weaker in the ice VI phase compared with liquid water.
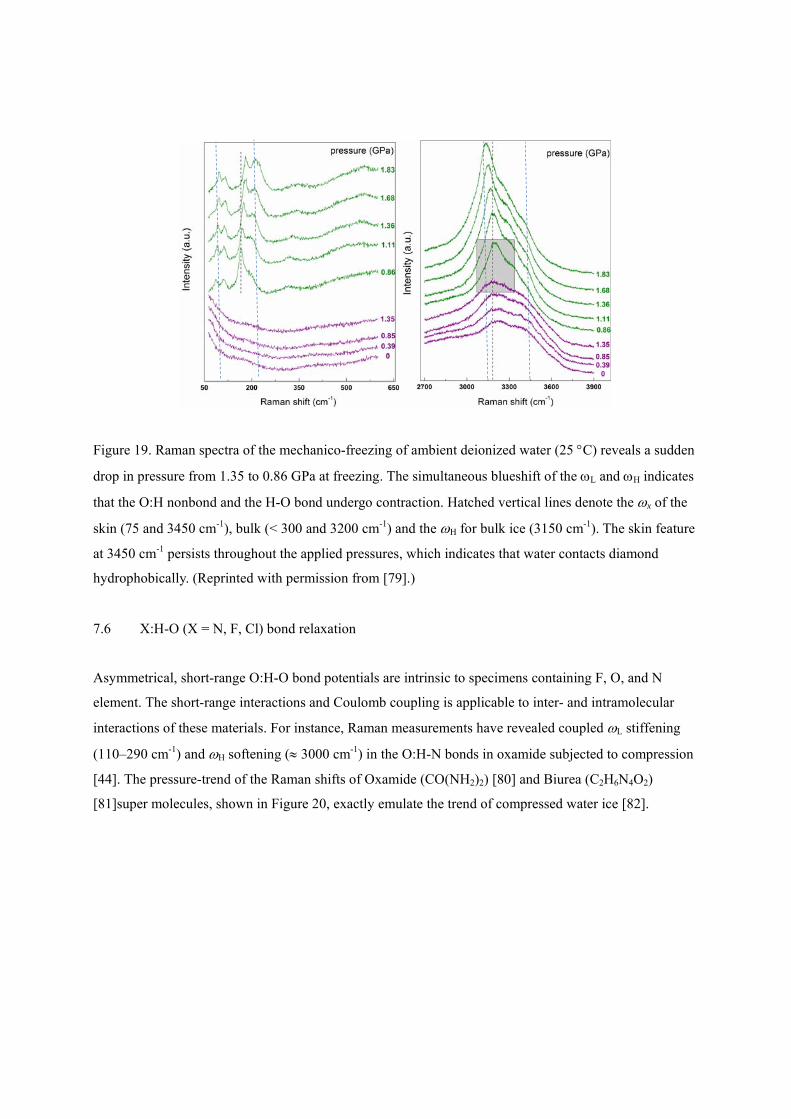
Figure 19. Raman spectra of the mechanico-freezing of ambient deionized water (25 C) reveals a sudden
drop in pressure from 1.35 to 0.86 GPa at freezing. The simultaneous blueshift of the L and H indicates
that the O:H nonbond and the H-O bond undergo contraction. Hatched vertical lines denote the x of the
skin (75 and 3450 cm-1), bulk (< 300 and 3200 cm-1) and the H for bulk ice (3150 cm-1). The skin feature
at 3450 cm-1 persists throughout the applied pressures, which indicates that water contacts diamond
hydrophobically. (Reprinted with permission from [79].)
7.6 X:H-O (X = N, F, Cl) bond relaxation
Asymmetrical, short-range O:H-O bond potentials are intrinsic to specimens containing F, O, and N
element. The short-range interactions and Coulomb coupling is applicable to inter- and intramolecular
interactions of these materials. For instance, Raman measurements have revealed coupled L stiffening
(110–290 cm-1) and H softening ( 3000 cm-1) in the O:H-N bonds in oxamide subjected to compression
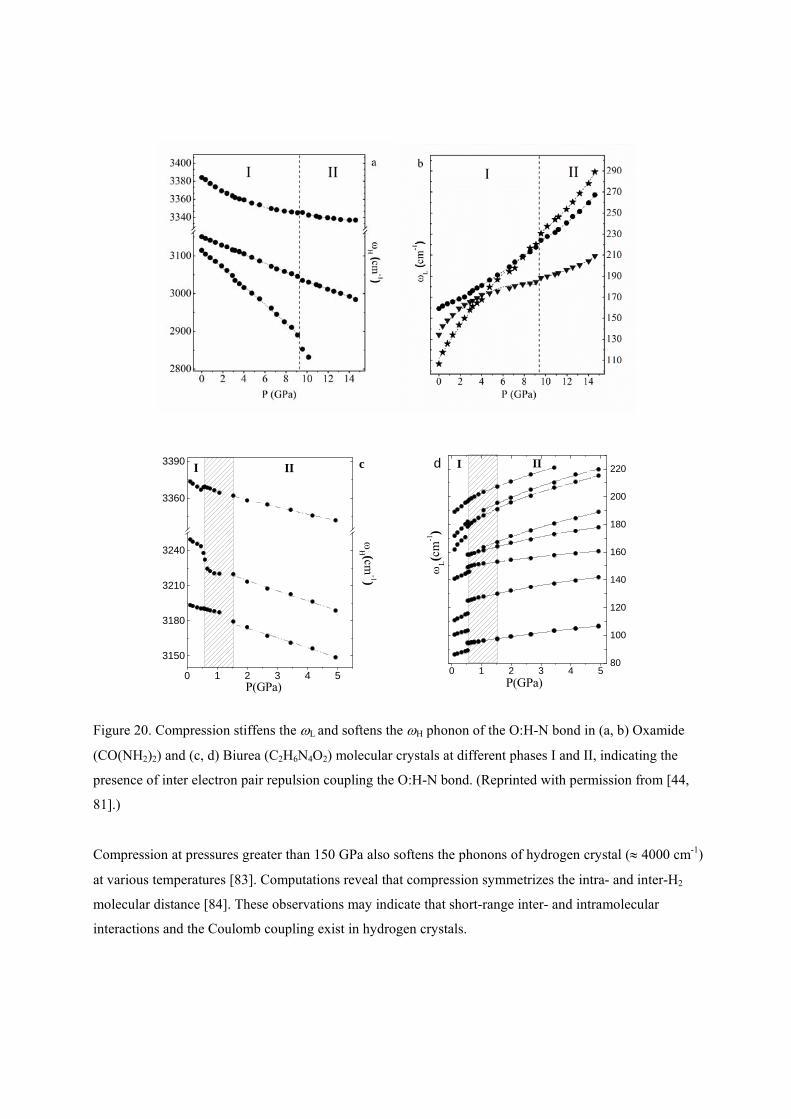
[44]. The pressure-trend of the Raman shifts of Oxamide (CO(NH2)2) [80] and Biurea (C2H6N4O2)
[81]super molecules, shown in Figure 20, exactly emulate the trend of compressed water ice [82].
0 1 2 3 4 5
3150
3180
3210
3240
3360
3390 c
P(GPa)
H (cm
-1)
I II
0 1 2 3 4 580
100
120
140
160
180
200
220
L(c
m-1
)
P(GPa)
I IId
Figure 20. Compression stiffens the L and softens the H phonon of the O:H-N bond in (a, b) Oxamide
(CO(NH2)2) and (c, d) Biurea (C2H6N4O2) molecular crystals at different phases I and II, indicating the
presence of inter electron pair repulsion coupling the O:H-N bond. (Reprinted with permission from [44,
81].)
Compression at pressures greater than 150 GPa also softens the phonons of hydrogen crystal ( 4000 cm-1)
at various temperatures [83]. Computations reveal that compression symmetrizes the intra- and inter-H2
molecular distance [84]. These observations may indicate that short-range inter- and intramolecular
interactions and the Coulomb coupling exist in hydrogen crystals.
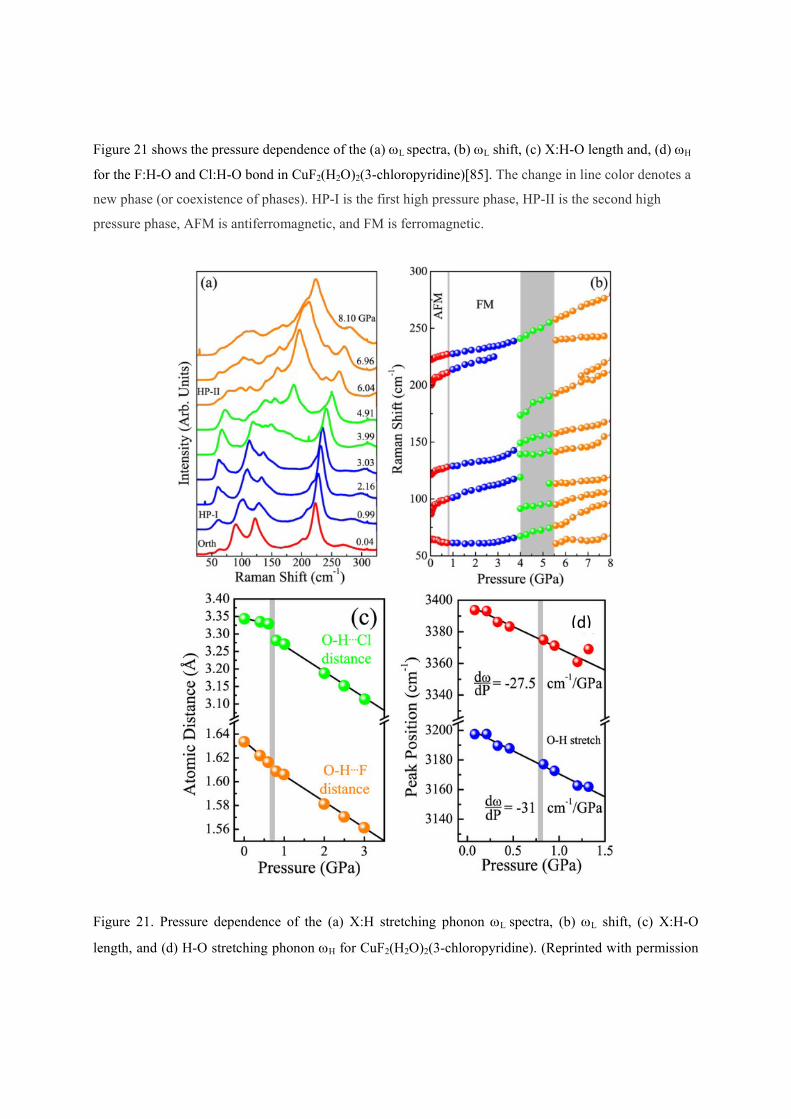
Figure 21 shows the pressure dependence of the (a) L spectra, (b) L shift, (c) X:H-O length and, (d) H
for the F:H-O and Cl:H-O bond in CuF2(H2O)2(3-chloropyridine)[85]. The change in line color denotes a
new phase (or coexistence of phases). HP-I is the first high pressure phase, HP-II is the second high
pressure phase, AFM is antiferromagnetic, and FM is ferromagnetic.
Figure 21. Pressure dependence of the (a) X:H stretching phonon L spectra, (b) L shift, (c) X:H-O
length, and (d) H-O stretching phonon H for CuF2(H2O)2(3-chloropyridine). (Reprinted with permission
(d)
from [85].)
Likewise, all the X:H-O bonds share the same pressure trend of segmental length and stiffness relaxation.
Compression shortens the X:H length and stiffens its stretching phonon L but lengthens the H-O distance
slightly and soften its stretching phonon H, resulting in the X:H-O contraction or density gain. The La:F
[86] and Fe:S [87] stretching phonons at L 500 cm-1 also undergo compression stiffening.
Therefore, X:H-O bond exists in a wide range of materials — H2O, NH3, HF, H2, oxides, nitrides and
fluorides — because of the presence of short-range interactions. N, O and F create nonbonding lone pairs
upon reacting with atoms of other less-electronegative elements. Based on the current notation of O:H-O
bond cooperativity, it is expected that asymmetrical relaxation in length and stiffness of the O:H-O bond
dictates the functionality of species with O:H-O bond-like involvement, including biomolecules, organic
materials, H crystals, among others.
8 Summary
Regelation arises from the O:H-O bond memory and the phase boundary dispersivity:
1) Compression shortens and stiffens the O:H nonbond and lengthens and softens the H-O bond in all
phases towards proton centralization, which lowers the compressibility of water ice and makes the
O:H contribute positively, while the H-O contributes negatively to the lattice energy of compressed
ice.
2) Compression closes up the separation between boundaries of the quasi-solid phase and depresses the
Tm, resulting in ice regelation. Negative pressure does the opposite.
3) Unlike the bond in a ‘normal’ substance that gains energy with plastic deformation, compression
raises the O:H-O bond to higher energy states monotonically. When the pressure is relieved, the O:H-
O bond recovers completely its initial states with memory.
4) The O:H nonbond compression dictates the TC(P) phase boundaries with positive slopes like Liquid-
Vapor transition - boiling; the H-O bond elongation dictates the TC(P) phase boundaries with
negative slopes like melting and VII-VIII transition; O:H-O length and energy conserve at boundaries
of zero or infinite slopes like (XII,XIII)-X and IC-VI transition.
References
1. J.D. Forbes, Illustrations of the Viscous Theory of Glacier Motion. Part II. An Attempt to Establish by Observation the Plasticity of Glacier Ice. Philos. Trans. R. Soc. London, 1846. 136: 157-175.
2. J.D. Forbes, Illustrations of the Viscous Theory of Glacier Motion. Part I. Containing Experiments on the Flow of Plastic Bodies, and Observations on the Phenomena of Lava Streams. Philos. Trans. R. Soc. London, 1846. 136: 143-155.
3. J. Thomson, Note on Professor Faraday's Recent Experiments on Regelation. Proceedings of the Royal Society of London, 1859. 10: 151-160.
4. M. Faraday, Note on Regelation. Proc. R. Soc. London, 1859. 10: 440-450. 5. YouTube. Does Pressure Melt Ice? ; Available from:
https://www.youtube.com/watch?v=gM3zP72-rJE 6. J.L. Green, D.J. Durben, G.H. Wolf, and C.A. Angell, Water and Solutions at Negative Pressure:
Raman Spectroscopic Study to -80 Megapascals. Science, 1990. 249(4969): 649-652. 7. M. Chaplin. Water structure and science: http://www.lsbu.ac.uk/water/. 8. Y. Huang, X. Zhang, Z. Ma, Y. Zhou, W. Zheng, J. Zhou, and C.Q. Sun, Hydrogen-bond
relaxation dynamics: resolving mysteries of water ice. Coord. Chem. Rev., 2015. 285: 109-165. 9. C.Q. Sun, X. Zhang, X. Fu, W. Zheng, J.-l. Kuo, Y. Zhou, Z. Shen, and J. Zhou, Density and
phonon-stiffness anomalies of water and ice in the full temperature range. J Phys Chem Lett, 2013. 4: 3238-3244.
10. C.Q. Sun, X. Zhang, and W.T. Zheng, Hidden force opposing ice compression. Chem Sci, 2012. 3: 1455-1460.
11. C.Q. Sun, Oxidation electronics: bond-band-barrier correlation and its applications. Prog. Mater Sci., 2003. 48(6): 521-685.
12. C.Q. Sun, Relaxation of the Chemical Bond. Springer Series in Chemical Physics 108. Vol. 108. 2014 Heidelberg: Springer. 807 pp.
13. J. Guo, X. Meng, J. Chen, J. Peng, J. Sheng, X.-Z. Li, L. Xu, J.-R. Shi, E. Wang, and Y. Jiang, Real-space imaging of interfacial water with submolecular resolution. Nat Mater, 2014. 13: 184-189.
14. J.D. Goddard, The viscous drag on solids moving through solids. AlChE J., 2014. 60(4): 1488-1498.
15. D.T.F. Moehlmann, Are nanometric films of liquid undercooled interfacial water bio-relevant? Cryobiology, 2009. 58(3): 256-261.
16. C.Q. Sun, Regelation: Hydrogen-bond recoverability of relaxation and dissociation Communicated.
17. T. Hynninen, V. Heinonen, C.L. Dias, M. Karttunen, A.S. Foster, and T. Ala-Nissila, Cutting Ice: Nanowire Regelation. Phys. Rev. Lett., 2010. 105(8).
18. D. Petely, Our strange desire to find a landslide trigger. http://ihrrblog.org/2013/11/08/our-strange-desire-to-find-a-landslide-trigger/, 2013.
19. J. Corripio, Spiked ice, 2001, Edinburgh, Scotland. 20. V. Bergeron, C. Berger, and M. Betterton, Controlled Irradiative Formation of Penitentes. Phys.
Rev. Lett., 2006. 96(9). 21. Air Pressure and Altitude above Sea Level. Engineering toolbox; Available from:
http://www.engineeringtoolbox.com/air-altitude-pressure-d_462.html. 22. Boiling Points of Water at Various Elevations. Engineering toolbox; Available from:
http://www.engineeringtoolbox.com/boiling-points-water-altitude-d_1344.html. 23. W. Holzapfel, On the Symmetry of the Hydrogen Bonds in Ice VII. J Chem Phys, 1972. 56(2): 712. 24. A.F. Goncharov, V.V. Struzhkin, H.-k. Mao, and R.J. Hemley, Raman Spectroscopy of Dense
H2O and the Transition to Symmetric Hydrogen Bonds. Phys. Rev. Lett., 1999. 83(10): 1998-2001.
25. M. Benoit, D. Marx, and M. Parrinello, Tunnelling and zero-point motion in high-pressure ice. Nature, 1998. 392(6673): 258-261.
26. P. Loubeyre, R. LeToullec, E. Wolanin, M. Hanfland, and D. Husermann, Modulated phases and proton centring in ice observed by X-ray diffraction up to 170 GPa. Nature, 1999. 397(6719): 503-506.
27. A.F. Goncharov, V.V. Struzhkin, M.S. Somayazulu, R.J. Hemley, and H.K. Mao, Compression of ice to 210 gigapascals: Infrared evidence for a symmetric hydrogen-bonded phase. Science, 1996. 273(5272): 218-220.
28. J. Teixeira, High-pressure physics - The double identity of ice X. Nature, 1998. 392(6673): 232-233.
29. I.A. Ryzhkin, "Symmetrical" phase and collective excitations in the proton system of ice. Journal of Experimental and Theoretical Physics, 1999. 88(6): 1208-1211.
30. F.H. Stillinger and K.S. Schweizer, Ice under compression-transition to symmetrical hydrogen-bonds. J. Phys. Chem., 1983. 87(21): 4281-4288.
31. L.N. Tian, A.I. Kolesnikov, and J.C. Li, Ab initio simulation of hydrogen bonding in ices under ultra-high pressure. J Chem Phys, 2012. 137(20).
32. G.M. Marion and S.D. Jakubowski, The compressibility of ice to 2.0 kbar. Cold Regions Science and Technology, 2004. 38(2-3): 211-218.
33. P.G. Debenedetti and H.E. Stanley, Supercooled and Glassy Water. Phys. Today, 2003. 56 (6): 40-46.
34. R.A. Fine and F.J. Millero, Compressibility of water as a function of temperature and pressure. J Chem Phys, 1973. 59(10): 5529-5536.
35. X. Zhang, T. Yan, Y. Huang, Z. Ma, X. Liu, B. Zou, and C.Q. Sun, Mediating relaxation and polarization of hydrogen-bonds in water by NaCl salting and heating. PCCP, 2014. 16(45): 24666-24671.
36. G.S. Kell, Density, thermal expansivity, and compressibility of liquid water from 0. deg. to 150. deg.. Correlations and tables for atmospheric pressure and saturation reviewed and expressed on 1968 temperature scale. J. Chem. Eng. Data, 1975. 20(1): 97-105.
37. T.B. James, Melting and Regelation of Ice. Nature (London), 1872. 5: 185. 38. J.M. Thomas, Michael Faraday and The Royal Institution: The Genius of Man and Place1991. 39. J. Thomson, Note on Professor Faraday's Recent Experiments on Regelation. Proc. R. Soc.
London, 1860. 11: 198-204. 40. Y. Yoshimura, S.T. Stewart, M. Somayazulu, H. Mao, and R.J. Hemley, High-pressure x-ray
diffraction and Raman spectroscopy of ice VIII. J Chem Phys, 2006. 124(2): 024502. 41. K. Liu, J.D. Cruzan, and R.J. Saykally, Water clusters. Science, 1996. 271(5251): 929-933. 42. R. Ludwig, Water: From clusters to the bulk. Ang. Chem. Int. Ed., 2001. 40(10): 1808-1827. 43. D. Kang, J. Dai, Y. Hou, and J. Yuan, Structure and vibrational spectra of small water clusters
from first principles simulations. J Chem Phys, 2010. 133(1): 014302. 44. T. Yan, S. Li, K. Wang, X. Tan, Z. Jiang, K. Yang, B. Liu, G. Zou, and B. Zou, Pressure-induced
phase transition in N-H...O hydrogen-bonded molecular crystal oxamide. J. Phys. Chem. B, 2012. 116(32): 9796-9802.
45. Y. Huang, X. Zhang, Z. Ma, Y. Zhou, J. Zhou, W. Zheng, and C.Q. Sun, Size, separation, structure order, and mass density of molecules packing in water and ice. Scientific Reports, 2013. 3: 3005.
46. W.T. Zheng and C.Q. Sun, Underneath the fascinations of carbon nanotubes and graphene nanoribbons. Energy Environ. Sci., 2011. 4(3): 627-655.
47. J.W. Li, S.Z. Ma, X.J. Liu, Z.F. Zhou, and C.Q. Sun, ZnO meso-mechano-thermo physical chemistry. Chem. Rev., 2012. 112(5): 2833-2852.
48. M.X. Gu, Y.C. Zhou, L.K. Pan, Z. Sun, S.Z. Wang, and C.Q. Sun, Temperature dependence of the elastic and vibronic behavior of Si, Ge, and diamond crystals. J. Appl. Phys., 2007. 102(8): 083524.
49. M.X. Gu, L.K. Pan, T.C.A. Yeung, B.K. Tay, and C.Q. Sun, Atomistic origin of the thermally driven softening of Raman optical phonons in group III nitrides. J. Phys. Chem. C, 2007. 111(36): 13606-13610.
50. C. Yang, Z.F. Zhou, J.W. Li, X.X. Yang, W. Qin, R. Jiang, N.G. Guo, Y. Wang, and C.Q. Sun, Correlation between the band gap, elastic modulus, Raman shift and melting point of CdS, ZnS, and CdSe semiconductors and their size dependency. Nanoscale, 2012. 4: 1304-1307.
51. M. Song, H. Yamawaki, H. Fujihisa, M. Sakashita, and K. Aoki, Infrared absorption study of Fermi resonance and hydrogen-bond symmetrization of ice up to 141 GPa. Phys. Rev. B, 1999. 60(18): 12644.
52. P. Pruzan, J.C. Chervin, E. Wolanin, B. Canny, M. Gauthier, and M. Hanfland, Phase diagram of ice in the VII-VIII-X domain. Vibrational and structural data for strongly compressed ice VIII. Journal of Raman Spectroscopy, 2003. 34(7-8): 591-610.
53. Y. Yoshimura, S.T. Stewart, M. Somayazulu, H.K. Mao, and R.J. Hemley, Convergent Raman Features in High Density Amorphous Ice, Ice VII, and Ice VIII under Pressure. J. Phys. Chem. B, 2011. 115(14): 3756-3760.
54. T. Okada, K. Komatsu, T. Kawamoto, T. Yamanaka, and H. Kagi, Pressure response of Raman spectra of water and its implication to the change in hydrogen bond interaction. Spectrochimica Acta A, 2005. 61(10): 2423-2427.
55. B. Santra, J. Klimeš, D. Alfè, A. Tkatchenko, B. Slater, A. Michaelides, R. Car, and M. Scheffler, Hydrogen Bonds and van der Waals Forces in Ice at Ambient and High Pressures. Phys. Rev. Lett., 2011. 107(18): 185701.
56. K. Aoki, H. Yamawaki, and M. Sakashita, Observation of Fano interference in high-pressure ice VII. Phys. Rev. Lett., 1996. 76(5): 784-786.
57. C.Q. Sun, Thermo-mechanical behavior of low-dimensional systems: The local bond average approach. Prog. Mater Sci., 2009. 54(2): 179-307.
58. X. Liu, M.L. Bo, L. Li, Y.G. Nie, H. Tian, X. Zhang, S. Xu, Y. Wang, and C.Q. Sun, Coordination-resolved electron spectromentrics. Chem. Rev., 2014: Accepted on Oct 03, 2014.
59. Y. Huang, X. Zhang, Z. Ma, Y. Zhou, G. Zhou, and C.Q. Sun, Hydrogen-bond asymmetric local potentials in compressed ice. J. Phys. Chem. B, 2013. 117(43): 13639-13645.
60. G.R. Desiraju, A Bond by Any Other Name. Ang Chem Int Ed, 2010: n/a-n/a. 61. L.R. Falvello, The Hydrogen Bond, Front and Center. Ang Chem Int Ed, 2010. 49(52): 10045-
10047. 62. S. Luntz and A. Cornell. This Is What The Underside Of An Iceberg Looks Like. 2015; Available
from: http://www.iflscience.com/environment/underside-iceberg. 63. A. Hermann and P. Schwerdtfeger, Blueshifting the Onset of Optical UV Absorption for Water
under Pressure. Phys. Rev. Lett., 2011. 106(18): 187403. 64. L.K. Pan, S.Q. Xu, W. Qin, X.J. Liu, Z. Sun, W.T. Zheng, and C.Q. Sun, Skin dominance of the
dielectric-electronic-phononic-photonic attribute of nanostructured silicon. Surf. Sci. Rep., 2013. 68(3-4): 418-455.
65. C.Q. Sun, Dominance of broken bonds and nonbonding electrons at the nanoscale. Nanoscale, 2010. 2(10): 1930-1961.
66. M. Zhao, W.T. Zheng, J.C. Li, Z. Wen, M.X. Gu, and C.Q. Sun, Atomistic origin, temperature dependence, and responsibilities of surface energetics: An extended broken-bond rule. Phys. Rev. B, 2007. 75(8): 085427.
67. K. Wark, Generalized Thermodynamic Relationships in the Thermodynamics (5th ed.)1988, New York: McGraw-Hill, Inc.
68. O. Alduchov and R. Eskridge, Improved Magnus' Form Approximation of Saturation Vapor Pressure, in Department of Commerce, Asheville, NC (United States)1997.
69. J. Baez. Phase diagram of water. 2012; Available from: http://math.ucr.edu/home/baez/chemical/725px-Phase_diagram_of_water.svg.png.
70. D.D. Kang, J.Y. Dai, and J.M. Yuan, Changes of structure and dipole moment of water with temperature and pressure: A first principles study. J Chem Phys, 2011. 135(2): 024505.
71. D.D. Kang, J. Dai, H. Sun, Y. Hou, and J. Yuan, Quantum similation of thermally driven phase transition and O k-edge absorption of high-pressure ice. Scientifc reports, 2013. 3: 3272.
72. K. Umemoto, R.M. Wentzcovitch, S. de Gironcoli, and S. Baroni, Order-disorder phase boundary between ice VII and VIII obtained by first principles. Chem. Phys. Lett., 2010. 499(4-6): 236-240.
73. C.Q. Sun, Size dependence of nanostructures: Impact of bond order deficiency. Prog. Solid State Chem., 2007. 35(1): 1-159.
74. G. Malenkov, Liquid water and ices: understanding the structure and physical properties. J. Phys.-Condes. Matter, 2009. 21(28): 283101.
75. C.Q. Sun, H.L. Bai, B.K. Tay, S. Li, and E.Y. Jiang, Dimension, strength, and chemical and thermal stability of a single C-C bond in carbon nanotubes. J. Phys. Chem. B, 2003. 107(31): 7544-7546.
76. S.A. Harich, D.W.H. Hwang, X. Yang, J.J. Lin, X. Yang, and R.N. Dixon, Photodissociation of H2O at 121.6 nm: A state-to-state dynamical picture. J Chem Phys, 2000. 113(22): 10073-10090.
77. C.Q. Sun, X. Zhang, J. Zhou, Y. Huang, Y. Zhou, and W. Zheng, Density, Elasticity, and Stability Anomalies of Water Molecules with Fewer than Four Neighbors. J Phys Chem Lett, 2013. 4: 2565-2570.
78. Chemical data. Available from: http://chemlab.qdu.edu.cn/html/other/bhszqb.htm. 79. X. Zhang, T. Yan, B. Zou, and C.Q. Sun, Mechano-freezing of the ambient water
http://arxiv.org/abs/1310.1441. 80. K. Wang, D. Duan, R. Wang, A. Lin, Q. Cui, B. Liu, T. Cui, B. Zou, X. Zhang, J. Hu, G. Zou,
and H.K. Mao, Stability of hydrogen-bonded supramolecular architecture under high pressure conditions: pressure-induced amorphization in melamine-boric acid adduct. Langmuir, 2009. 25(8): 4787-4791.
81. T. Yan, K. Wang, X. Tan, K. Yang, B. Liu, and B. Zou, Pressure-Induced Phase Transition in N–H···O Hydrogen-Bonded Molecular Crystal Biurea: Combined Raman Scattering and X-ray Diffraction Study. J. Phys. Chem. C, 2014. 118(28): 15162-15168.
82. Y. Yoshimura, S.T. Stewart, H.K. Mao, and R.J. Hemley, In situ Raman spectroscopy of low-temperature/high-pressure transformations of H2O. J Chem Phys, 2007. 126(17): 174505.
83. C.-S. Zha, Z. Liu, and R. Hemley, Synchrotron Infrared Measurements of Dense Hydrogen to 360 GPa. Phys. Rev. Lett., 2012. 108(14): 146402.
84. H. Liu, H. Wang, and Y. Ma, Quasi-Molecular and Atomic Phases of Dense Solid Hydrogen. J. Phys. Chem. C, 2012. 116 (16): 9221-9226.
85. K.R. O'Neal, T.V. Brinzari, J.B. Wright, C. Ma, S. Giri, J.A. Schlueter, Q. Wang, P. Jena, Z. Liu, and J.L. Musfeldt, Pressure-Induced Magnetic Crossover Driven by Hydrogen Bonding in CuF2(H2O)2(3-chloropyridine). Sci. Rep., 2014. 4: 6054.
86. W.A. Crichton, P. Bouvier, B. Winkler, and A. Grzechnik, The structural behaviour of LaF(3) at high pressures. Dalton Trans, 2010. 39(18): 4302-4311.
87. A. Kleppe and A. Jephcoat, High-pressure Raman spectroscopic studies of FeS2 pyrite. Mineralogical Magazine, 2004. 68(3): 433-441.
Related Documents


