BioOne sees sustainable scholarly publishing as an inherently collaborative enterprise connecting authors, nonprofit publishers, academic institutions, research libraries, and research funders in the common goal of maximizing access to critical research. Refugia in Glacial Ages Led to the Current Discontinuous Distribution Patterns of the Dark Red-backed Vole Myodes rex on Hokkaido, Japan Author(s): Kuniko Kawai , Frank Hailer , Anna Pauline de Guia , Hideo Ichikawa , and Takashi Saitoh Source: Zoological Science, 30(8):642-650. 2013. Published By: Zoological Society of Japan DOI: http://dx.doi.org/10.2108/zsj.30.642 URL: http://www.bioone.org/doi/full/10.2108/zsj.30.642 BioOne (www.bioone.org ) is a nonprofit, online aggregation of core research in the biological, ecological, and environmental sciences. BioOne provides a sustainable online platform for over 170 journals and books published by nonprofit societies, associations, museums, institutions, and presses. Your use of this PDF, the BioOne Web site, and all posted and associated content indicates your acceptance of BioOne’s Terms of Use, available at www.bioone.org/page/terms_of_use . Usage of BioOne content is strictly limited to personal, educational, and non-commercial use. Commercial inquiries or rights and permissions requests should be directed to the individual publisher as copyright holder.

Welcome message from author
This document is posted to help you gain knowledge. Please leave a comment to let me know what you think about it! Share it to your friends and learn new things together.
Transcript
BioOne sees sustainable scholarly publishing as an inherently collaborative enterprise connecting authors, nonprofit publishers, academic institutions,research libraries, and research funders in the common goal of maximizing access to critical research.
Refugia in Glacial Ages Led to the Current Discontinuous Distribution Patternsof the Dark Red-backed Vole Myodes rex on Hokkaido, JapanAuthor(s): Kuniko Kawai , Frank Hailer , Anna Pauline de Guia , Hideo Ichikawa , and TakashiSaitohSource: Zoological Science, 30(8):642-650. 2013.Published By: Zoological Society of JapanDOI: http://dx.doi.org/10.2108/zsj.30.642URL: http://www.bioone.org/doi/full/10.2108/zsj.30.642
BioOne (www.bioone.org) is a nonprofit, online aggregation of core research in the biological, ecological,and environmental sciences. BioOne provides a sustainable online platform for over 170 journals and bookspublished by nonprofit societies, associations, museums, institutions, and presses.
Your use of this PDF, the BioOne Web site, and all posted and associated content indicates your acceptance ofBioOne’s Terms of Use, available at www.bioone.org/page/terms_of_use.
Usage of BioOne content is strictly limited to personal, educational, and non-commercial use. Commercialinquiries or rights and permissions requests should be directed to the individual publisher as copyright holder.

2013 Zoological Society of JapanZOOLOGICAL SCIENCE 30: 642–650 (2013)
Refugia in Glacial Ages Led to the Current Discontinuous
Distribution Patterns of the Dark Red-backed Vole
Myodes rex on Hokkaido, Japan
Kuniko Kawai1,2, Frank Hailer3,4, Anna Pauline de Guia5,
Hideo Ichikawa1, and Takashi Saitoh1*
1Field Science Center, Hokkaido University, Kita-11, Nishi-10, Sapporo 060-0811, Japan2Division of Mammals, National Museum of Natural History, Smithsonian Institution,
Washington, DC 20013-7012, USA3Center for Conservation and Evolutionary Genetics, Smithsonian Conservation
Biology Institute, 3001 Connecticut Ave. NW, Washington, DC 20008, USA4Biodiversity and Climate Research Center (BiK-F), Ecological Genomics,
Senckenberg Gesellschaft für Naturforschung, Senckenberganlage 25,60325 Frankfurt, Germany
5Animal Biology Division, Institute of Biological Sciences, College of Artsand Sciences, University of the Philippines Los Baños,
Laguna 4031, Philippines
The terrestrial mammalian fauna of the North Japanese island, Hokkaido, is more similar to that of
Southern Siberia than to the main island of Japan, Honshu. Three species of the genus Myodes (Muridae, Rodentia) are found on Hokkaido, but not on Honshu. While Myodes rufocanus and M. rutilus are widely distributed across Hokkaido as well as the Eurasian continent, M. rex, which is
endemic to Hokkaido and its adjacent islands, shows a discontinuous distribution pattern. We ana-
lyzed the phylogeographic history of M. rex using the mitochondrial DNA control region in order
to interpret their discontinuous distribution pattern. Phylogenetic relationships among 54 distinct
haplotypes showed that M. rex can be divided into four clades that occur on the northern, central,
and southern regions of the Hokkaido mainland and on Rishiri Island, respectively. The phylo-
groups in the northern and central regions were largely separated in space, although several areas
of sympatry were found. The phylogroup in the southern region, which was clearly separated from
other phylogroups, showed markedly low genetic variability. All analyzed individuals from the pop-
ulation on Rishiri belonged to a separate lineage. Across a range of divergence rate estimates, we
dated the basal divergence of all phylogroups to the mid to late Pleistocene, with subsequent sig-
nals of population expansion within lineages. We conclude that current phylogeographic structure
in M. rex likely reflects Pleistocene survival in several separate refugia in situ. Past glacial ages
have thus played an important role in shaping the current distribution patterns of mammalian spe-
cies on Hokkaido.
Key words: Myodes rex, mitochondrial DNA control region, haplotype, distribution pattern, refugia
INTRODUCTION
The Japanese archipelago is a long chain of islands
located on the eastern coast of Asia, and includes four
major islands: Hokkaido in the north, Honshu in the central
region, Shikoku, in the west, and Kyushu in the southwest.
Hokkaido is separated from Honshu by the Tsugaru Strait,
which is known as a major biogeographical demarcation
called “Blakiston’s Line.” Honshu harbors many endemic
mammalian species, with approximately 40% of all Japanese
endemic mammals (Abe et al., 2005). In contrast, the terres-
trial fauna of Hokkaido, located to the north of Blakiston’s
Line, is more similar to that of Southern Siberia than that of
Honshu (Fujimaki, 1994). Because of the shallowness of the
Mamiya and Soya Straits, Hokkaido was repeatedly con-
nected to the Eurasian continent during periods of lower sea
level in glacial ages, allowing terrestrial mammals to migrate
from Siberia to Hokkaido across a land bridge (Fig. 1). On
the other hand, the Tsugaru Strait is relatively deep and has
separated Hokkaido from Honshu since the Late Pleistocene,
although some migrations between Hokkaido and Honshu
occurred in the Middle Pleistocene (Oshima, 1990). Thus,
the terrestrial mammalian fauna of Hokkaido shows a rela-
* Corresponding author. Tel. : +81-11-706-2590;
Fax : +81-11-706-3450;
E-mail: [email protected]
doi:10.2108/zsj.30.642

Phylogeography of the Vole Myodes rex 643
tively low degree of endemism.
Species of the genus Myodes (Arvicolinae, Muridae,
Rodentia) are widely distributed across the Eurasian
continent, including Hokkaido, but are absent from
Honshu. Three species are currently recognized: the
dark red-backed vole Myodes rex (Imaizumi, 1971), the gray-sided vole M. rufocanus (Sundevall, 1846),
and the northern red-backed vole M. rutilus (Pallas,
1779). Myodes rufocanus and M. rutilus are widely
distributed on Hokkaido as well as the Eurasian conti-
nent (Ohdachi et al., 2009), while M. rex is rare and
restricted to Hokkaido and its adjacent islands (Iwasa
and Kaneko, 2009). Myodes rex is, therefore, an
important species that could help elucidate the forma-
tion and evolution of the mammalian fauna of
Hokkaido. However, knowledge of the geographic dis-
tribution of M. rex is limited, and the phylogeography
of the species has not been reported.
The distribution of M. rex is discontinuous in
Hokkaido (Fig. 1): the northwestern (Nakata, 2000),
the central such as the Taisetsu Mountains (Abe et al.,
1971; Kashiwabara and Onoyama, 1988; Kaneko,
1994; Nakata, 2000), the Hidaka Mountains (Imaizumi,
1972; Haga et al., 1979; Yanagawa and Itoh, 1990;
Nakata, 2000), and the southern regions (Kadosaki
and Inage, 1998; Nakata, 2000; Ichikawa, 2002). No
records have been reported from the northeastern and
eastern regions of Hokkaido. Myodes rex also occurs
in the adjacent northwestern islands of Rebun and
Rishiri (Imaizumi, 1971; Kaneko and Sato, 1993;
Nakata, 2000), Sakhalin Island (Abramson et al., 2009),
probably in Shikotan (Iwasa et al., 2001; Motokawa,
2008), Kunashiri, and Shibotsu Islands (Koyasu et al.,
1996).
Why is the distribution of M. rex discontinuous, dif-
fering from that of the other two Myodes species on
Hokkaido? A combination of geographical and gene
genealogical information can yield important insights
into the phylogeographic history that have shaped the
current distribution and patterns of genetic variation of
extant species (Avise, 2000). For example, phylogeo-
graphic analyses have contributed to understanding the cur-
rent fauna formation in Europe. Mediterranean phylogroups
did not contribute to the postglacial recolonization of central
and northern Europe for temperate forest mammal species,
and the presence of central glacial refugia are evidenced by
case studies on the bank vole (Myodes glareolus) (Bilton et
al., 1998; Deffontaine et al., 2005; Kotlik et al., 2006). The
current discontinuous distribution of M. rex might therefore
result from the phylogeographic history, although ecological
competition with the dominant species M. rufocanus may
also play a role (Iwasa and Nakata, 2011).
In this paper, we surveyed genetic variation at the mito-
chondrial DNA (mtDNA) control region and analyzed the
phylogeographic history of M. rex in order to elucidate the
processes which have shaped its current discontinuous dis-
tribution.
MATERIALS AND METHODS
The Field Science Center for Northern Biosphere, Hokkaido
University has been collecting specimens of the genus Myodes,
Fig. 1. Collection localities for M. rex on Hokkaido and adjacent islands.
Circles indicate the localities collected in this study; color intensity indicates
which phylogroup the specimen belongs to, corresponding to Figs. 2 and 3.
Numbers with circles correspond to the locality number in Table 1. Black
dots indicate localities found in previous reports (Nakata, 2000; Ichikawa,
2002; Motokawa, 2008; Abramson et al., 2009), and grey shadow indicates
the distributional area by Iwasa and Kaneko (2009).
Hokkaido
Sakhalin
Kunashiri Is.
Shikotan Is.
Shibotsu Is.
Rebun Is.
Rishiri Is.
Sea of Okhotsk
Pacific Ocean
Tsugaru Strait
(Blakiston’s line)
Soya Strait
0 1000
kmkm
Honshu
Hokkaido
SakhalinEurasia
Kamchatka
Mamiya
Strait
Tsugaru Strait
Soya Strait
Ishikari lowland
1 23
45
67
89
10
11
1213
14
15
Table 1. Sampling localities and phylogroup of Myodes rex.
Locality
number1 LocalityNumber of
individualsLatitude Longitude Phylogroup
1 Rishiri 24 45.24 141.22 D
2 Hamatonbetsu 2 45.13 142.36 A
3 Teshio 8 44.89 141.74 A
4 Utanobori 3 44.68 142.50 A
5 Nakagawa 21 44.68 142.12 A/C
6 Haboro 3 44.36 141.71 A
7 Takinoshita 18 43.88 143.18 A
8 Obira 1 44.05 141.86 A
9 Mashike 12 43.86 141.76 A/C
10 Bibai 2 43.20 141.88 A/C
11 Otarunai 1 43.07 141.10 B
12 Okujozankei 1 42.85 141.17 B
13 Niseko 9 42.80 140.69 B
14 Kunnui 6 42.47 140.25 B
15 Hidaka 11 42.09 143.27 C1 These locality numbers correspond with those of Fig. 1 and Table 2.
K. Kawai et al.644
acquiring more than 1500 individuals in total from various areas of
Hokkaido between 1998 and 2011, with support from the Hokkaido
Regional Office, Forestry Agency of Japan in the period of 1998–
2008. Of these samples, 112 individuals from 12 localities in
Hokkaido were identified as M. rex (Fig. 1, Table 1). Species iden-
tification of M. rex was based on whether the form of upper third
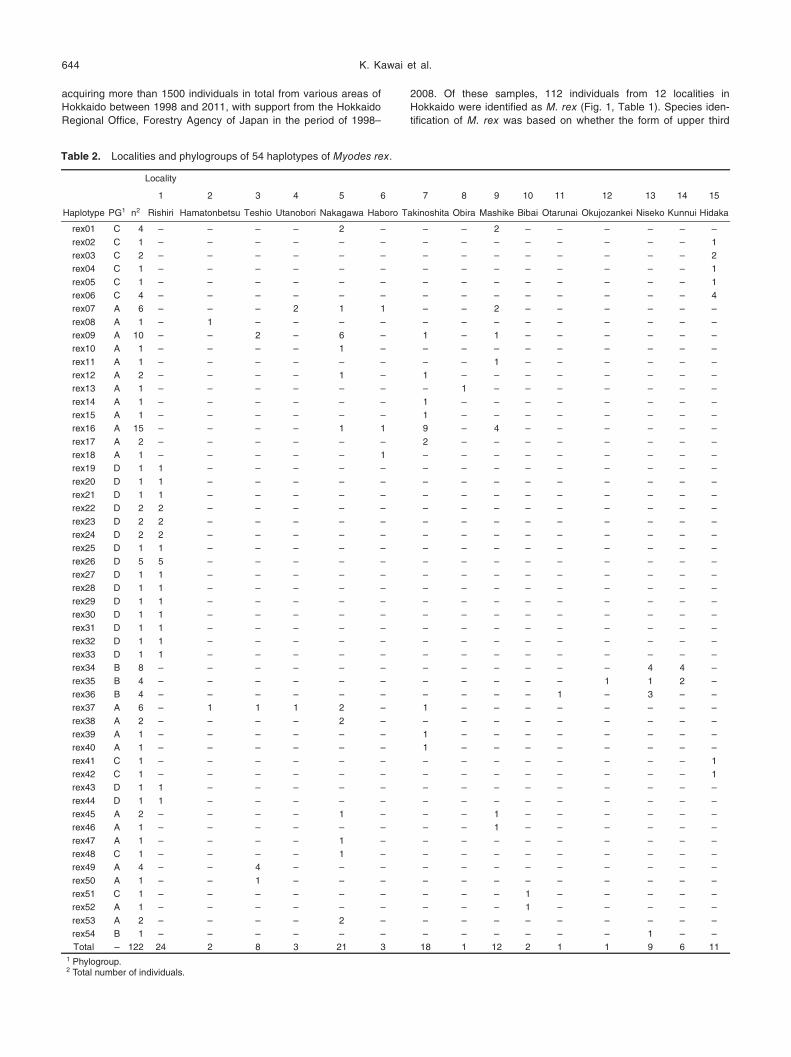
Table 2. Localities and phylogroups of 54 haplotypes of Myodes rex.
Locality
1 2 3 4 5 6 7 8 9 10 11 12 13 14 15
Haplotype PG1 n2 Rishiri Hamatonbetsu Teshio Utanobori Nakagawa Haboro Takinoshita Obira Mashike Bibai Otarunai Okujozankei Niseko Kunnui Hidaka
rex01 C 4 – – – – 2 – – – 2 – – – – – –
rex02 C 1 – – – – – – – – – – – – – – 1
rex03 C 2 – – – – – – – – – – – – – – 2
rex04 C 1 – – – – – – – – – – – – – – 1
rex05 C 1 – – – – – – – – – – – – – – 1
rex06 C 4 – – – – – – – – – – – – – – 4
rex07 A 6 – – – 2 1 1 – – 2 – – – – – –
rex08 A 1 – 1 – – – – – – – – – – – – –
rex09 A 10 – – 2 – 6 – 1 – 1 – – – – – –
rex10 A 1 – – – – 1 – – – – – – – – – –
rex11 A 1 – – – – – – – – 1 – – – – – –
rex12 A 2 – – – – 1 – 1 – – – – – – – –
rex13 A 1 – – – – – – – 1 – – – – – – –
rex14 A 1 – – – – – – 1 – – – – – – – –
rex15 A 1 – – – – – – 1 – – – – – – – –
rex16 A 15 – – – – 1 1 9 – 4 – – – – – –
rex17 A 2 – – – – – – 2 – – – – – – – –
rex18 A 1 – – – – – 1 – – – – – – – – –
rex19 D 1 1 – – – – – – – – – – – – – –
rex20 D 1 1 – – – – – – – – – – – – – –
rex21 D 1 1 – – – – – – – – – – – – – –
rex22 D 2 2 – – – – – – – – – – – – – –
rex23 D 2 2 – – – – – – – – – – – – – –
rex24 D 2 2 – – – – – – – – – – – – – –
rex25 D 1 1 – – – – – – – – – – – – – –
rex26 D 5 5 – – – – – – – – – – – – – –
rex27 D 1 1 – – – – – – – – – – – – – –
rex28 D 1 1 – – – – – – – – – – – – – –
rex29 D 1 1 – – – – – – – – – – – – – –
rex30 D 1 1 – – – – – – – – – – – – – –
rex31 D 1 1 – – – – – – – – – – – – – –
rex32 D 1 1 – – – – – – – – – – – – – –
rex33 D 1 1 – – – – – – – – – – – – – –
rex34 B 8 – – – – – – – – – – – – 4 4 –
rex35 B 4 – – – – – – – – – – – 1 1 2 –
rex36 B 4 – – – – – – – – – – 1 – 3 – –
rex37 A 6 – 1 1 1 2 – 1 – – – – – – – –
rex38 A 2 – – – – 2 – – – – – – – – – –
rex39 A 1 – – – – – – 1 – – – – – – – –
rex40 A 1 – – – – – – 1 – – – – – – – –
rex41 C 1 – – – – – – – – – – – – – – 1
rex42 C 1 – – – – – – – – – – – – – – 1
rex43 D 1 1 – – – – – – – – – – – – – –
rex44 D 1 1 – – – – – – – – – – – – – –
rex45 A 2 – – – – 1 – – – 1 – – – – – –
rex46 A 1 – – – – – – – – 1 – – – – – –
rex47 A 1 – – – – 1 – – – – – – – – – –
rex48 C 1 – – – – 1 – – – – – – – – – –
rex49 A 4 – – 4 – – – – – – – – – – – –
rex50 A 1 – – 1 – – – – – – – – – – – –
rex51 C 1 – – – – – – – – – 1 – – – – –
rex52 A 1 – – – – – – – – – 1 – – – – –
rex53 A 2 – – – – 2 – – – – – – – – – –
rex54 B 1 – – – – – – – – – – – – 1 – –
Total – 122 24 2 8 3 21 3 18 1 12 2 1 1 9 6 11
1 Phylogroup.2 Total number of individuals.
Phylogeography of the Vole Myodes rex 645
molar is complex, since this character has been demonstrated to
yield reliable identification of this species (Kaneko et al., 1998). The
liver or pectoral muscle were sampled and preserved in 99% etha-
nol.
Genomic DNA was extracted from the tissue using a DNeasy
Blood & Tissue Kit (Qiagen, Germany). The mtDNA control region
was amplified using primers of Lpro (5′-TCAGCACCCAAAGCTGA-
TATTCTACTT-3′) and Hphe (5′-ATCTAAGGCATTTTCAGTGCTTT-
GCTT-3′), which were designed based on the M. rufocanussequence. PCR amplification was carried out using a GeneAmp
PCR System 9700 (Applied Biosystems, USA) in 20 μl reaction mix-
tures containing 0.2 mM dNTP, 10 mM Tris-HCl (pH 8.3), 50 mM
KCl, 1.5 mM MgCl2, 0.001% (w/v) gelatin, 0.25 μM of each primer,
and 0.5 units of AmpliTaq Gold (Applied Biosystems). 0.5 μl solution
containing 10–100 ng genomic DNA was used for each reaction.
After incubation at 95°C for 10 minutes, cycling was performed for
30 cycles of 20 s at 93°C, 20 s at 50°C, and 60 s at 72°C, with a
postcycling extension at 72°C for 7 minutes. After removing
excess primers and dNTP, the PCR products were sequenced
using the primer Lpro and BigDye Terminator v3.1 Cycle Sequenc-
ing chemistry (Applied Biosystems). Cycle sequencing products
were run on an ABI Prism 3100 Avant Genetic Analyzer (Applied
Biosystems).
Alignment of the sequences was done with the Clustal W 1.82
program within the Geneious Pro 4.7.5 (Biomatters Ltd., USA) soft-
ware, with further manual corrections. To infer the distinct haplo-
types and to calculate haplotype (H) and nucleotide diversity (π,
based on uncorrected genetic distances p) using all of the data, the
DNASP Ver. 5.10.01 (Rozas et al., 2003) and ARLEQUIN Ver. 3.5.1
(Excoffier et al., 2010) programs were used.
Haplotype trees were constructed using two methods: Maximum
Likelihood (ML) analysis was implemented in the RAxML 7.0.4
(Stamatakis, 2006); Bayesian analysis in the MrBayes v.3.2.1
(Ronquist et al., 2012). Both analyses were conducted with
GTR+G+I model. For the Bayesian, MCMC settings were as fol-
lows; chain length 6,400,000, subsampling frequency 1,000, num-
ber of heated chain 4, burn-in length 1,600,000 and temperature of
heated chain 0.2. The haplotype trees were drawn as an unrooted
tree. This is because lengths of the control region among genus
Myodes species were diverse (Matson and Baker, 2001), and we
could not align the sequences of M. rex with those of the other
Myodes species.
A statistical parsimony network (Templeton et al., 1992) of the
nucleotide sequences was constructed using the TCS 1.21 program
(Clement et al., 2000) with the default setting of 95% parsimony
connection limit.
We calculated mean genetic distances between phylogroups
based on the number of base substitutions per site using MEGA5
software (Tamura et al., 2011). Standard error was obtained by a
bootstrap procedure with 1,000 replicates. The analyses were con-
ducted using the Tamura-Nei model of sequence evolution (Tamura
and Nei, 1993), modeling the rate variation among sites with a
gamma distribution.
To investigate the demographic history of M. rex within phylo-
groups, Tajima’s D (Tajima, 1989) and Fu’s FS (Fu, 1997) values
were calculated based on the total number of mutations in the align-
ment. We tested for signals of sudden population expansion using
mismatch distribution approach (Rogers and Harpending, 1992)
implemented in the ARLEQUIN software. The 95% confidence inter-
val of τ was calculated with parametric bootstrapping. The expan-
sion event was dated using the formula t = τ / 2u, where u = μ(mutation rate per site and year) × k (sequence length). To obtain
a time estimate, we used two different rate calibrations for the diver-
gence of the mtDNA control region of arvicoline rodents: μ = 3.6%
per bp and million years (Myr) (Matson and Baker, 2001) and 17%
per bp and Myr (Fedorov and Stenseth, 2001).
RESULTS
Distribution and Genetic diversity
In total, 112 M. rex samples were collected at 15 local-
ities (Table 1, Fig. 1). Although most localities of our collec-
tions (circles in Fig. 1) overlapped with those of previous
records (black dots in Fig. 1), we found new records for five
localities in the southern, central, and northern regions of
Hokkaido, where M. rex had not been recorded previously:
two individuals found at Locality 2 and three at Locality 4
(both in the northeastern region); one at Locality 8, and nine
at Locality 9 (in the central region); six at Locality 14 repre-
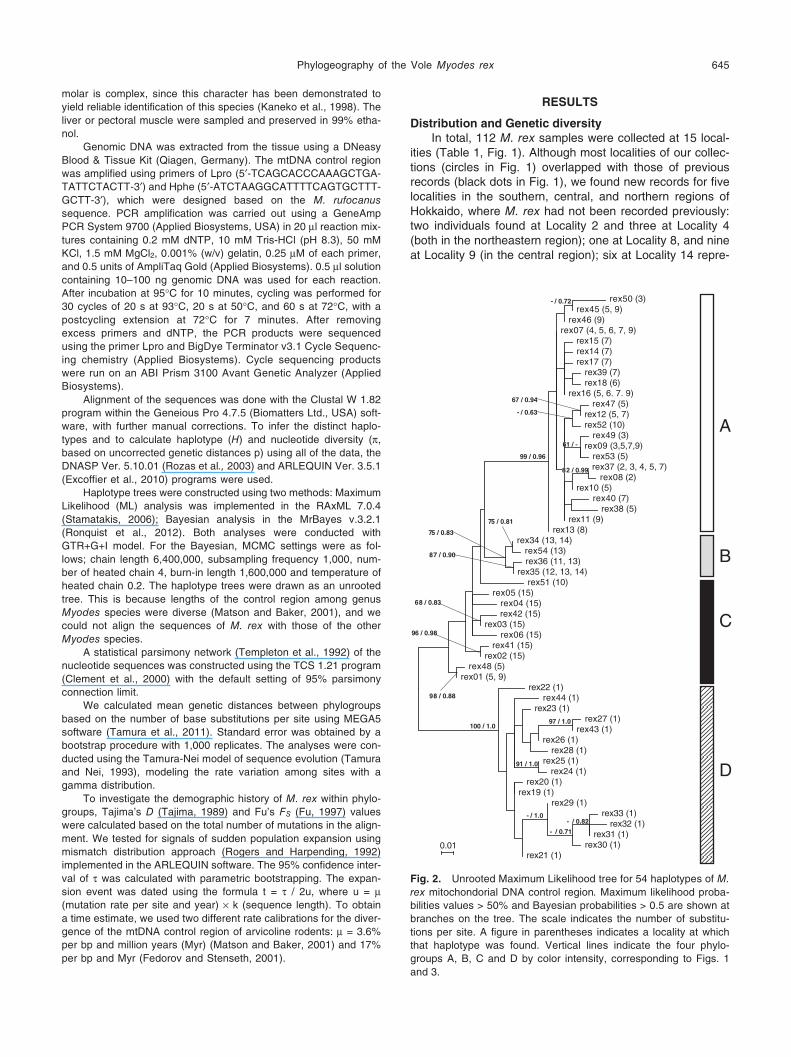
Fig. 2. Unrooted Maximum Likelihood tree for 54 haplotypes of M. rex mitochondorial DNA control region. Maximum likelihood proba-
bilities values > 50% and Bayesian probabilities > 0.5 are shown at
branches on the tree. The scale indicates the number of substitu-
tions per site. A figure in parentheses indicates a locality at which
that haplotype was found. Vertical lines indicate the four phylo-
groups A, B, C and D by color intensity, corresponding to Figs. 1
and 3.
rex50 (3)rex45 (5, 9)
rex46 (9)rex07 (4, 5, 6, 7, 9)
rex15 (7)rex14 (7)rex17 (7)
rex39 (7)rex18 (6)
rex16 (5, 6. 7. 9)rex47 (5)
rex12 (5, 7)rex52 (10)
rex49 (3)rex09 (3,5,7,9)
rex53 (5)rex37 (2, 3, 4, 5, 7)
rex08 (2)rex10 (5)
rex40 (7)rex38 (5)
rex11 (9)rex13 (8)
rex34 (13, 14)rex54 (13)rex36 (11, 13)
rex35 (12, 13, 14)rex51 (10)
rex05 (15)rex04 (15)rex42 (15)
rex03 (15)rex06 (15)
rex41 (15)rex02 (15)
rex48 (5)rex01 (5, 9)
rex22 (1)rex44 (1)
rex23 (1)rex27 (1)
rex43 (1)rex26 (1)
rex28 (1)rex25 (1)
rex24 (1)rex20 (1)
rex19 (1)rex29 (1)
rex33 (1)rex32 (1)
rex31 (1)rex30 (1)
rex21 (1)
67 / 0.94
75 / 0.81
87 / 0.90
75 / 0.83
97 / 1.0
91 / 1.0
100 / 1.0
98 / 0.88
96 / 0.98
68 / 0.83
99 / 0.96
82 / 0.992 / 0.99
61 / -1 / -
82 / 0.99
61 / -
0.01
- / 0.82
- / 0.71
- / 0.63
- / 0.72
- / 1.0
A
B
C
D
K. Kawai et al.646
sent the southernmost known occurrence
of M. rex. These results suggest that the
distribution of M. rex in Hokkaido is wider
than previously thought.
Using 720-bp sequences of the partial
mtDNA control region from the 112 M. rex specimens, 71 segregating sites that
defined 54 distinct mtDNA haplotypes were
found (Table 2). The sequences have been
deposited in Genbank (Accession num-
bers: AB732022–AB732075). No insertions
or deletions were observed. Based on
sequences from all specimens, haplotype
diversity (H) was 0.965, the average num-
ber of nucleotide differences (K) was 12.5,
and nucleotide diversity (π) was 0.017.
While 44 haplotypes were restricted to
one locality, 10 haplotypes were shared
among 2 to 5 localities. Haplotype Rex16
was the most frequent in the total data set,
occurring in 15 individuals from 4 localities
in the central-northern region of Hokkaido
(Table 2). None of the 17 haplotypes
found in the specimens from Rishiri Island
were shared any other localities.
Phylogenetic relationships among hap-
lotypes
To elucidate phylogenetic relation-
ships among the 54 haplotypes, we con-
structed unrooted haplotype trees and a
statistical parsimony network. The ML tree
was supported with the highest log likeli-
hood (–1759.2492). The tree (Fig. 2) and
network (Fig. 3) both showed that M. rexhaplotypes were divided into four phylo-
groups, namely A, B, C, and D. While the
Phylogroups A, B, and D were supported
with high probability in the tree, the Phylo-
group C was not, but it could be separated
from the other three in the network. The
haplotype network was divided into two
unconnected networks at the 95% proba-
bility connection limit in the TCS. All hap-
lotypes from Rishiri (phylogroup D) consti-
tuted one network, and those from the
remaining region (phylogroups A, B, and
C) clustered in another network. Phylo-
group A was separated from B/C by at
least eight mutational steps. The four phy-
logroups reflected the underlying geographic distribution of
our sampling: phylogroup A consisted of haplotypes from
specimens in the central-northern region of the Hokkaido
mainland; B in the southern region of the mainland; C in the
central region of the mainland; D in Rishiri Island. While
specimens from most localities (12 out of 15) had haplo-
types from only one phylogroup (either A, B, C, or D), spec-
imens from the other three localities had haplotypes related
to phylogroups A and C, namely Nakagawa (5 in Fig. 1),
Mashike (9 in Fig. 1), and Bibai (10 in Fig. 1).
Estimates of haplotype diversity (H) and nucleotide diver-
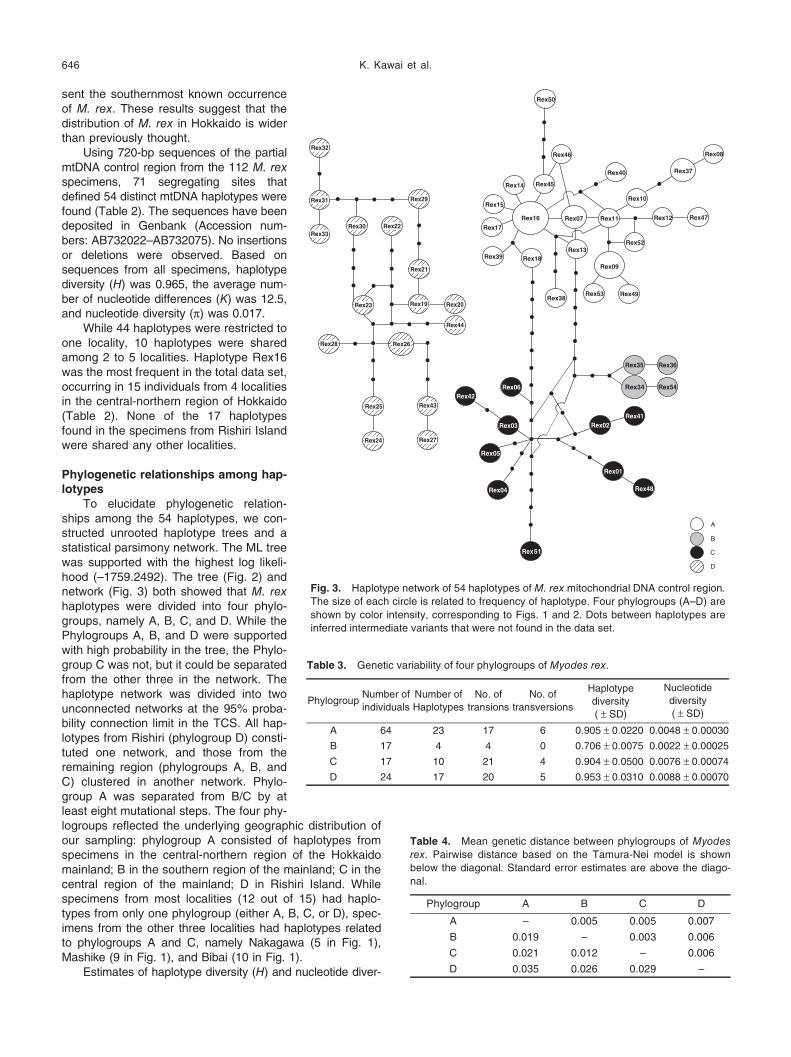
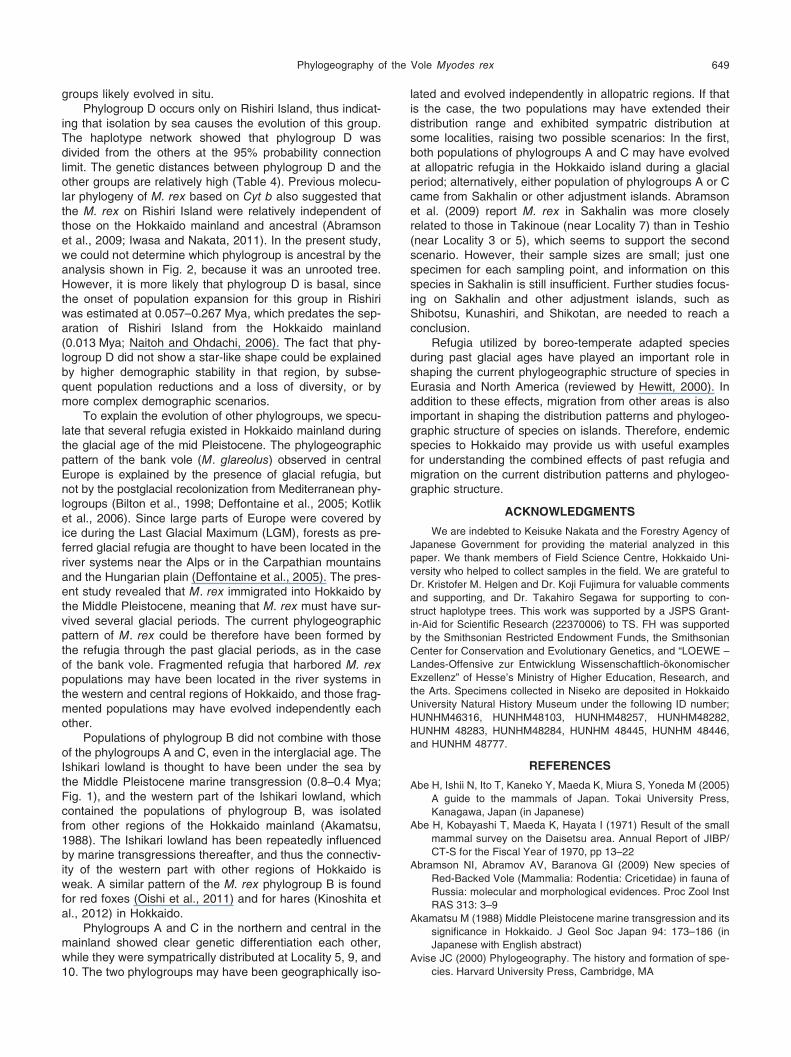
Fig. 3. Haplotype network of 54 haplotypes of M. rex mitochondrial DNA control region. The size of each circle is related to frequency of haplotype. Four phylogroups (A–D) are
shown by color intensity, corresponding to Figs. 1 and 2. Dots between haplotypes are
inferred intermediate variants that were not found in the data set.
Table 3. Genetic variability of four phylogroups of Myodes rex.
PhylogroupNumber of
individuals
Number of
Haplotypes
No. of
transions
No. of
transversions
Haplotype
diversity
( ± SD)
Nucleotide
diversity
( ± SD)
A 64 23 17 6 0.905 ± 0.0220 0.0048 ± 0.00030
B 17 4 4 0 0.706 ± 0.0075 0.0022 ± 0.00025
C 17 10 21 4 0.904 ± 0.0500 0.0076 ± 0.00074
D 24 17 20 5 0.953 ± 0.0310 0.0088 ± 0.00070
Rex16
Rex14
Rex15
Rex17
Rex40
Rex10
Rex38
Rex13Rex39
Rex11 Rex12
Rex09
Rex37
Rex08
Rex45
Rex46
Rex47
Rex52
Rex53 Rex49
Rex50
Rex07
Rex04
Rex01
Rex06
Rex18
Rex05
Rex03
Rex42
Rex41
Rex02
A
C
B
D
Rex48
Rex51
Rex36Rex35
Rex54Rex34
Rex32
Rex31
Rex33
Rex30 Rex22
Rex21
Rex20Rex19Rex23
Rex28 Rex26
Rex44
Rex43Rex25
Rex24 Rex27
Rex29
Table 4. Mean genetic distance between phylogroups of Myodes rex. Pairwise distance based on the Tamura-Nei model is shown
below the diagonal. Standard error estimates are above the diago-
nal.
Phylogroup A B C D
A – 0.005 0.005 0.007
B 0.019 – 0.003 0.006
C 0.021 0.012 – 0.006
D 0.035 0.026 0.029 –

Phylogeography of the Vole Myodes rex 647
sity (π; per site) were similarly high for the phylogroup A, C,
and D, while phylogroup B exhibited lower variability (Table 3).
Consistent with the results from the phylogenetic analy-
ses (Figs. 1, 2), average genetic distances among the
phylogroups indicated that phylogroup D was clearly differ-
entiated from the other phylogroups, while phylogroups B
and C were closely related to each other (Table 4).
Demographic history
Phylogroup A showed a star-like pattern in the haplo-
type network (Fig. 3), in which the haplotypes radiated from
the haplotype Rex16 by a single or double mutational
changes. The phylogroup C also showed a star-like pattern,
but no core haplotype for the radiation was found. These
network shapes suggested that M. rex populations of the
northern and central regions of the mainland (phylogroups A
and C) were long isolated and have experienced recent
demographic expansions. On the other hand, phylogroup D
from Risihri did not show a star-like shape, and the network
shape for phylogroup B was unclear, possibly due to the
small number of observed haplotypes.
To substantiate the above inferences regarding popula-
tion growth and/or range expansion, we calculated Tajima’s
D and Fu’s FS. These tests were conducted for nine demo-
graphic groupings, as follows (Table 5): All four phylogroups
(A/B/C/D); all of the three phylogroups of the mainland (A/B/
C); each phylogroup separately (A, B, C, D); conceivable
groupings of two phylogroups on the mainland (A/B, A/C, B/
C). Phylogroup B and A/B showed positive values of
Tajima’s D, while the others were negative, but all of them
were not significantly different from zero, consistent with
effectively neutral evolution of the sequences. Fu’s FS was
significantly negative for A/B/C/D, A/B/C, A, D, and A/C,
indicating that most populations/groupings underwent a
demographic expansion in the past. Results for the phylo-
group B remained less conclusive (see above).
The validity of the sudden expansion model was tested
by the sum of square deviations between the observed and
the expected mismatch distributions. No significant differ-
ences were found between these distributions for all the
nine groupings (Table 5; Fig. 4), supporting that the sudden
expansion model was valid. The observed distribution pat-
tern of A/B/C/D showed multimodal, supporting that the M. rex populations comprise at least three clades. The
observed distribution patterns of A/B/C, A/B, and A/C were
also bimodal. The observed distribution pattern of each phy-
logroup on its own was unimodal. The phylogroups C and D
showed a higher value of τ among the groups, suggesting
that they are older than the other groups (Table 5). The dis-
tribution pattern of phylogroup B was biased towards to
zero, suggesting that this population underwent a recent
bottleneck.
The expansion time was estimated based on τ in the
mismatch distribution analysis (Table 5). Irrespective of the
rate calibration employed (3.6% or 17%/Myr), the diver-
gence of all phylogroups was placed in the mid to late Pleis-
tocene (0.12 to 0.58 million years ago, Mya). Based on the
3.6% rate, estimated expansion time for the individual phy-
logroups was between 0.10–0.27 Mya, or between 0.022–
0.057 Mya based on the 17% rate (see Table 5 for details
and 95% confidence intervals).
DISCUSSION
The Hokkaido-endemic species Myodes rex is classified
as “Near Threatened” in the Japanese Red List (Iwasa and
Kaneko, 2009), due to its discontinuous distribution and lim-
ited records. Fragmentation of distribution ranges generally
leads to a reduction of population size, and subsequently to
a decrease of genetic divergence via genetic drift. The low
genetic divergence of M. rex in Hokkaido on the mtDNA
cytochrome b (Cyt b) gene has been understood in this con-
text (Iwasa and Nakata, 2011). In this study, we revised the
distribution range of M. rex, suggesting that the species is
more widely distributed than previously thought, and
revealed that M. rex on Hokkaido harbors considerable
genetic variability at the mtDNA control region. Since
sequences of the mtDNA control region evolve more rapidly
than those of the Cyt b gene (Matson and Baker, 2001), our
data from the mtDNA control region can provide a more
detailed understanding of the evolutionary history of M. rex.
Table 5. Demographic values in nine groupings of Myodes rex.
Groupings of
phylogroup
Neutrality test Mismatch analysis
Confidential
intervals2
of the τ
Estimated population
expansion time (years ago)
based on 3.6%/Myr3
Estimated population
expansion time (years ago)
based on 17%/Myr3
Tajima’s D Fu’s FS τ1 P-value Low High Low High Low High
A/B/C/D –0.17112 –15.62795 *** 14.910 0.450 4.914 97.910 575,231 189,583 3,777,392 121,814 40,147 799,918
A/B/C –0.42202 –9.33682 * 2.750 0.130 0.041 87.750 106,096 1,582 3,385,417 22,467 335 716,912
A –0.91263 –10.45783 *** 4.504 0.165 1.678 7.277 173,762 64,738 280,748 36,797 13,709 59,453
B 0.97159 0.85812 2.688 0.382 0.000 5.432 103,684 0 209,568 21,957 0 44,379
C –1.03157 –1.20123 6.531 0.066 2.689 9.848 251,977 103,742 379,938 53,360 21,969 80,458
D –0.21284 –5.91989 ** 6.930 0.389 3.871 8.873 267,349 149,344 342,323 56,615 31,626 72,492
A/B 0.08056 –5.32277 2.086 0.192 0.000 16.158 80,476 0 623,380 17,042 0 132,010
A/C –0.63494 –10.02966 ** 2.293 0.245 0.002 20.592 88,463 77 794,444 18,733 16 168,235
B/C –0.795 –1.06534 8.742 0.060 4.182 12.723 337,269 161,343 490,856 71,422 34,167 103,946
* P < 0.05, ** P < 0.02, *** P < 0.011 Deviation from the sudden expansion model was assessed by parametric bootstrapping in the ARLEQUIN.2 Confidential intervals were obtained by the percentile method (alpha = 0.050) based on 1000 replicates.3 Population expansion time was calculated based on the mutation rate of 3.6% or 17% per million years (Myr).

K. Kawai et al.648
Our results suggest that M. rex includes four phylo-
groups corresponding to regional populations found in the
northern, central, and southern regions of the mainland
Hokkaido, as well as in Rishiri. The haplotype tree (Fig. 2),
haplotype network (Fig. 3), and mismatch distribution analy-
sis (Fig. 4) we generated all
support the idea that the four
distinct haplogroups reflect
M. rex populations in these
four regions.
Our estimates of the tim-
ing of population divergence
and demographic expansions
remain vague due to limita-
tions in the Myodes fossil
record and uncertainty about
the true evolutionary rate of
the mtDNA control region.
Nevertheless, our estimates
indicate that M. rex has been
present on Hokkaido since
the mid- or late Pleistocene
(0.12–0.58 Mya). Wakana et
al. (1996) estimated that M. rufocanus colonized on
Hokkaido since the last gla-
cial maximum, ca. 0.01–0.02
Mya. McKay (2012) shows
that five divergence events
occurred in terrestrial mam-
mals of Hokkaido at 0.048
Mya (0–0.192, the 95% high-
est posterior densities), 0.104
Mya (0–0.456), 0.256 Mya (0–
0.896), 0.896 Mya (0.384–
1.416), and 1.360 Mya (0.736–
1.608). This suggests that M. rufocanus may have colo-
nized Hokkaido from the
Eurasian continent at the lat-
est divergence event, while
M. rex likely arrived as the
result of an earlier event.
Iwasa and Nakata (2011)
explain that the discontinu-
ous distribution pattern of M. rex may result from ecologi-
cal competition with dominant
species of M. rufocanus.
They implicitly assumed that
M. rex was continuously dis-
tributed in Hokkaido before
the arrival of M. rufocanus.
Our results, however, indi-
cate that M. rex genetically
differentiated into the four
populations prior to the arrival
of M. rufocanus (Table 5).
Therefore, the current distri-
butional pattern of M. rexmay have been shaped by
past demographic history rather than by competition with M. rufocanus.
How were the four phylogroups of M. rex formed? Since
the distribution range of M. rex is restricted to Hokkaido and
its adjacent islands (Iwasa and Kaneko, 2009), these phylo-
Fig. 4. Mismatch distribution for nine groupings of M. rex. On each grouping, bars indicate observed
frequency, and a line indicates expected frequency, which was based on a population expansion model.
A, phylogroup in the northern region of the mainland Hokkaido. B, in the southern region of the mainland.
C, in the central region of the mainland. D, in Rishiri.
0
0.02
0.04
0.06
0.08
0 4 8 12 16 20 24 28
Fre
quency
Pairwise differences
A/B/C/D
0.00
0.02
0.04
0.06
0.08
0.10
0.12
0 2 4 6 8 10 12 14 16 18
Fre
quency
A/B/C
0.05
0.15
0 2 4 6 8 10 12 14 16 18
Fre
quency
D
0.00
0.05
0.10
0.15
0.20
0.25
Fre
quency
A
C
0 2 4 6 8 10 12 14 16 18
A/C
B/C
A/B
B
0.00
0.00
0.10
0.10
0.20
0.20
0.30
0.35
Fre
quency
0.05
0.15
0.25
Pairwise differences
Pairwise differences
0 2 4 6 8 10 12 14 16 18
Pairwise differences
Pairwise differences
0.05
0.15
Fre
quency
0.00
0.10
0.00
0.05
0.10
0.15
0.20
0.25
Fre
quency
0.05
0.15
Fre
quency
0.00
0.10
0.00
0.10
0.20
0.30
Fre
quency
0.05
0.15
0.25
Pairwise differences
0 2 4 6 8 10 12 14 16 18
Pairwise differences
0 2 4 6 8 10 12 14 16 18
Pairwise differences
0 2 4 6 8 10 12 14 16 18
Pairwise differences
0 2 4 6 8 10 12 14 16 18
Phylogeography of the Vole Myodes rex 649
groups likely evolved in situ.
Phylogroup D occurs only on Rishiri Island, thus indicat-
ing that isolation by sea causes the evolution of this group.
The haplotype network showed that phylogroup D was
divided from the others at the 95% probability connection
limit. The genetic distances between phylogroup D and the
other groups are relatively high (Table 4). Previous molecu-
lar phylogeny of M. rex based on Cyt b also suggested that
the M. rex on Rishiri Island were relatively independent of
those on the Hokkaido mainland and ancestral (Abramson
et al., 2009; Iwasa and Nakata, 2011). In the present study,
we could not determine which phylogroup is ancestral by the
analysis shown in Fig. 2, because it was an unrooted tree.
However, it is more likely that phylogroup D is basal, since
the onset of population expansion for this group in Rishiri
was estimated at 0.057–0.267 Mya, which predates the sep-
aration of Rishiri Island from the Hokkaido mainland
(0.013 Mya; Naitoh and Ohdachi, 2006). The fact that phy-
logroup D did not show a star-like shape could be explained
by higher demographic stability in that region, by subse-
quent population reductions and a loss of diversity, or by
more complex demographic scenarios.
To explain the evolution of other phylogroups, we specu-
late that several refugia existed in Hokkaido mainland during
the glacial age of the mid Pleistocene. The phylogeographic
pattern of the bank vole (M. glareolus) observed in central
Europe is explained by the presence of glacial refugia, but
not by the postglacial recolonization from Mediterranean phy-
logroups (Bilton et al., 1998; Deffontaine et al., 2005; Kotlik
et al., 2006). Since large parts of Europe were covered by
ice during the Last Glacial Maximum (LGM), forests as pre-
ferred glacial refugia are thought to have been located in the
river systems near the Alps or in the Carpathian mountains
and the Hungarian plain (Deffontaine et al., 2005). The pres-
ent study revealed that M. rex immigrated into Hokkaido by
the Middle Pleistocene, meaning that M. rex must have sur-
vived several glacial periods. The current phylogeographic
pattern of M. rex could be therefore have been formed by
the refugia through the past glacial periods, as in the case
of the bank vole. Fragmented refugia that harbored M. rexpopulations may have been located in the river systems in
the western and central regions of Hokkaido, and those frag-
mented populations may have evolved independently each
other.
Populations of phylogroup B did not combine with those
of the phylogroups A and C, even in the interglacial age. The
Ishikari lowland is thought to have been under the sea by
the Middle Pleistocene marine transgression (0.8–0.4 Mya;
Fig. 1), and the western part of the Ishikari lowland, which
contained the populations of phylogroup B, was isolated
from other regions of the Hokkaido mainland (Akamatsu,
1988). The Ishikari lowland has been repeatedly influenced
by marine transgressions thereafter, and thus the connectiv-
ity of the western part with other regions of Hokkaido is
weak. A similar pattern of the M. rex phylogroup B is found
for red foxes (Oishi et al., 2011) and for hares (Kinoshita et
al., 2012) in Hokkaido.
Phylogroups A and C in the northern and central in the
mainland showed clear genetic differentiation each other,
while they were sympatrically distributed at Locality 5, 9, and
10. The two phylogroups may have been geographically iso-
lated and evolved independently in allopatric regions. If that
is the case, the two populations may have extended their
distribution range and exhibited sympatric distribution at
some localities, raising two possible scenarios: In the first,
both populations of phylogroups A and C may have evolved
at allopatric refugia in the Hokkaido island during a glacial
period; alternatively, either population of phylogroups A or C
came from Sakhalin or other adjustment islands. Abramson
et al. (2009) report M. rex in Sakhalin was more closely
related to those in Takinoue (near Locality 7) than in Teshio
(near Locality 3 or 5), which seems to support the second
scenario. However, their sample sizes are small; just one
specimen for each sampling point, and information on this
species in Sakhalin is still insufficient. Further studies focus-
ing on Sakhalin and other adjustment islands, such as
Shibotsu, Kunashiri, and Shikotan, are needed to reach a
conclusion.
Refugia utilized by boreo-temperate adapted species
during past glacial ages have played an important role in
shaping the current phylogeographic structure of species in
Eurasia and North America (reviewed by Hewitt, 2000). In
addition to these effects, migration from other areas is also
important in shaping the distribution patterns and phylogeo-
graphic structure of species on islands. Therefore, endemic
species to Hokkaido may provide us with useful examples
for understanding the combined effects of past refugia and
migration on the current distribution patterns and phylogeo-
graphic structure.
ACKNOWLEDGMENTS
We are indebted to Keisuke Nakata and the Forestry Agency of
Japanese Government for providing the material analyzed in this
paper. We thank members of Field Science Centre, Hokkaido Uni-
versity who helped to collect samples in the field. We are grateful to
Dr. Kristofer M. Helgen and Dr. Koji Fujimura for valuable comments
and supporting, and Dr. Takahiro Segawa for supporting to con-
struct haplotype trees. This work was supported by a JSPS Grant-
in-Aid for Scientific Research (22370006) to TS. FH was supported
by the Smithsonian Restricted Endowment Funds, the Smithsonian
Center for Conservation and Evolutionary Genetics, and “LOEWE –
Landes-Offensive zur Entwicklung Wissenschaftlich-ökonomischer
Exzellenz” of Hesse’s Ministry of Higher Education, Research, and
the Arts. Specimens collected in Niseko are deposited in Hokkaido
University Natural History Museum under the following ID number;
HUNHM46316, HUNHM48103, HUNHM48257, HUNHM48282,
HUNHM 48283, HUNHM48284, HUNHM 48445, HUNHM 48446,
and HUNHM 48777.
REFERENCES
Abe H, Ishii N, Ito T, Kaneko Y, Maeda K, Miura S, Yoneda M (2005)
A guide to the mammals of Japan. Tokai University Press,
Kanagawa, Japan (in Japanese)
Abe H, Kobayashi T, Maeda K, Hayata I (1971) Result of the small
mammal survey on the Daisetsu area. Annual Report of JIBP/
CT-S for the Fiscal Year of 1970, pp 13–22
Abramson NI, Abramov AV, Baranova GI (2009) New species of
Red-Backed Vole (Mammalia: Rodentia: Cricetidae) in fauna of
Russia: molecular and morphological evidences. Proc Zool Inst
RAS 313: 3–9
Akamatsu M (1988) Middle Pleistocene marine transgression and its
significance in Hokkaido. J Geol Soc Japan 94: 173–186 (in
Japanese with English abstract)
Avise JC (2000) Phylogeography. The history and formation of spe-
cies. Harvard University Press, Cambridge, MA

K. Kawai et al.650
Bilton DT, Mirol PM, Mascheretti S, Fredga K, Zima J, Searle JB
(1998) Mediterranean Europe as an area of endemism for small
mammals rather than a source for northwards postglacial colo-
nization. Proc R Soc Lond B Biol Sci 265: 1219–1226
Clement M, Posada D, Crandall KA (2000) TCS: a computer pro-
gram to estimate gene genealogies. Mol Ecol 9: 1657–1660
Deffontaine V, Libois R, Kotlik P, Sommer R, Nieberding C, Paradis
E, et al. (2005) Beyond the Mediterranean peninsulas: evidence
of central European glacial refugia for a temperate forest mam-
mal species, the bank vole (Clethrionomys glareolus). Mol Ecol
14: 1727–1739
Excoffier L, Lischer HEL (2010) Arlequin suite ver 3.5: A new series
of programs to perform population genetics analyses under
Linux and Windows. Mol Ecol Res 10: 564–567
Fedorov VB, Stenseth NC (2001) Glacial survival of the Norwegian
lemming (Lemmus lemmus) in Scandinavia: inference from
mitochondrial DNA variation. Proc R Soc Lond B Biol Sci 268:
809–814
Fu Y-X (1997) Statistical tests of neutrality of mutations against pop-
ulation growth, hitchhiking and background selection. Genetics
147: 915–925
Fujimaki Y (1994) Over the straits—mixture of faunas. In “Formation
History of Nature of Hokkaido” Ed by K Ishigaki, M Fukuta,
Hokkaido University Press, Sapporo, Japan, pp 167–179 (in
Japanese)
Haga R, Fujimaki Y, Onoyama K (1979) Mammals. In “Research
Report on Natural Ecosystem of the Hidaka Mountains”
Hokkaido Government, Sapporo, Japan, pp 3–56 (in Japanese)
Hewitt GM (2000) The genetic legacy of the Quaternary ice ages.
Nature 405: 907–913
Ichikawa H (2002) Occurrence of Myodes rex in Niseko and its hab-
itat. Bulletin of Botanic Garden, Hokkaido University 2: 66–68
(in Japanese)
Imaizumi Y (1971) A new vole of the Clethrionomys rufocanus group
from Rishiri Island, Japan. Journal of the Mammalogical Society
of Japan 5: 99–103
Imaizumi Y (1972) Land mammals of the Hidaka Mountains,
Hokkaido, Japan, with special references to the origin of an
endemic species of the genus Clethrionomys. Memoirs of the
National Science Museum 5: 131–149 (in Japanese with an
English summary)
Iwasa MA, Kaneko Y (2009) Muridae. In “The Wild Mammals of
Japan” Ed by SD Ohdachi, Y Ishibashi, MA Iwasa, T Saitoh,
Shoukadoh, Kyoto, Japan, pp 144–179
Iwasa MA, Serizawa K, Sato M (2001) Taxonomic problems of the
dark red-backed vole, Clethrionomys rex. Rishiri Studies 20:
43–53 (in Japanese with English abstract)
Iwasa MA, Nakata K (2011) A note on the genetic status of the dark
red-backed vole, Myodes rex, in Hokkaido, Japan. Mammal
Study 36: 99–103
Kadosaki M, Inage M (1998) An individual of Clethrionomys rex cap-
tured at Shiraigawa, Jozankei. Forest Protection 266: 31–32 (in
Japanese)
Kaneko Y (1994) Muridae. In “A Prictorial Guide to the Mammals of
Japan” Ed by H Abe, Tokai University Press, Tokyo, Japan, pp
90–109, 168–183 (in Japanese)
Kaneko Y, Sato M (1993) Identification and distribution of the red-
backed voles from Is. Rishiri, Hokkaido (Preliminary study).
Annual Report of the Rishiri Museum 12: 37–47 (in Japanese)
Kaneko Y, Nakata K, Saitoh T, Stenseth NC, Bjørnstad ON (1998)
The biology of the vole Clethrionomys rufocanus: A review. Res
Popul Ecol 40: 21–37
Kashiwabara S, Onoyama K (1988) Karyotypes and G-banding pat-
terns of the red-backed voles, Clethrionomys montanus and C. rufocanus bedfordiae (Rodentia, Microtinae). Journal of the
Mammalogical Society of Japan 13: 33–41
Kinoshita G, Nunome M, Han SH, Hirakawa H, Suzuki H (2012)
Ancient colonization and within-island vicariance revealed by
mitochondrial DNA phylogeography of the Mountain hare
(Lepus timidus) in Hokkaido, Japan. Zool Sci 29: 776–85
Kotlik P, Deffontaine V, Mascheretti S, Zima J, Michaux JR, Searle JB
(2006) A northern glacial refugium for bank voles (Clethrionomys glareolus). P Natl Acad Sci USA 103: 14860–14864
Koyasu K, Zholnerovskaya EI, Oda S (1996) Mammals from the
Kuril Islands and the Sakhalin Islands in the Zoological
Museum in Siberia. J Growth 35: 125–129
Matson CW, Baker RJ (2001) DNA sequence variation in the mito-
chondrial control region of red-backed voles (Clethrionomys).
Mol Biol Evol 18: 1494–1501
McKay BD (2012) A new timeframe for the diversification of Japan’s
mammals. J Biogeogr 39: 1134–1143
Motokawa M (2008) Taxonomic status of Neoaschizomys sikotanensis Tokuda, 1935 (Rodentia, Muridae) after re-
examination of type specimens. Mammal Study 33: 71–75
Naitoh Y, Ohdachi SD (2006) Population genetic structure of Sorex unguiculatus and Sorex caecutiens (Soricidae, Mammalia) in
Hokkaido, based on microsatellite DNA polymorphism. Ecol
Res 21: 586–596
Nakata K (2000) Distribution and habitat of the dark red-backed vole
Clethrionomys rex in Japan. Mammal Study 25: 87–94
Ohdachi SD, Ishibashi Y, Iwasa MA, Saitoh T (2009) The wild mam-
mals of Japan. Shoukadoh, Kyoto, Japan
Ohshima K (1990) The history of straits around the Japanese
islands in the late- Quaternary. The Quaternary Research 29:
193–208 (in Japanese with English abstract)
Oishi T, Uraguchi K, Takahashi K, Masuda R (2011) Population
structures of the red fox (Vulpes vulpes) on the Hokkaido
Island, Japan, revealed by microsatellite analysis. J Heredity
102: 38–46
Rogers AR, Harpending H (1992) Population growth makes waves
in the distribution of pairwise genetic differences. Mol Biol Evol
9: 552–569
Ronquist F, Teslenko M, van der Mark P, Ayres DL, Darling A, Höhna
S, et al. (2012) MrBayes 3.2: efficient Bayesian phylogenetic
inference and model choice across a large model space. Syst
Biol 61: 539–342
Rozas J, Sanchez-DelBarrio JC, Messeguer X, Rozas R (2003)
DnaSP, DNA polymorphism analyses by the coalescent and
other methods. Bioinformatics 19: 2496–2497
Stamatakis A (2006) RAxML-VI-HPC: maximum likelihood-based
phylogenetic analyses with thousands of taxa and mixed mod-
els. Bioinformatics 22: 2688–2690
Tajima F (1989) Statistical method for testing the neutral mutation
hypothesis by DNA polymorphism. Genetics 123: 585–595
Tamura K, Nei M (1993) Estimation of the number of nucleotide sub-
stitutions in the control region of mitochondrial DNA in humans
and chimpanzees. Mol Biol Evol 9: 512–526
Tamura K, Peterson D, Peterson N, Stecher G, Nei M, Kumar S
(2011) MEGA5: Molecular evolutionary genetics analysis using
maximum likelihood, evolutionary distance, and maximum par-
simony methods. Mol Biol Evol 28: 2731–2739
Templeton AR, Crandall KA, Sing CF (1992) A cladistic analysis of
phenotypic associations with haplotypes inferred from restric-
tion endonuclease mapping and DNA sequence data. III. Cla-
dogram estimation. Genetics 132: 619–633
Yanagawa H, Itoh H (1990) Vertical distribution of small mammals
on Mt. Petegari, the Hidaka Mountains, Hokkaido. Research
Bulletin of Obihiro University, Natural Science 17: 69–75
Wakana S, Sakaizumi M, Tsuchiya K, Asakawa M, Han S-H, Nakata
K, Suzuki H (1996) Phylogenetic implications of variations in
rDNA and mtDNA in red-backed voles collected in Hokkaido,
Japan, and in Korea. Mammal Study 21: 15–25
(Received August 22, 2012 / Accepted March 25, 2013)
Related Documents