Reforms and agricultural productivity in Central and Eastern Europe and the Former Soviet Republics: 1989–2005 Johan F. M. Swinnen • Liesbet Vranken Published online: 27 November 2009 Ó Springer Science+Business Media, LLC 2009 Abstract This paper analyses the changes in agricultural performance in Central and Eastern Europe and the Former Soviet republics since the start of the transition process. We provide a conceptual framework for the evolution of productivity and efficiency measures and link this evolu- tion to the issue of factor abundance taking into account specific transition characteristics. We document the chan- ges in agricultural performance using empirical data on the evolution of partial productivity and total factor produc- tivity estimates and we illustrate how productivity varies between countries at various stages of the transition pro- cess. Over the past twenty years, virtually all transition countries witnessed an initial decline in productivity, and virtually all countries currently witness an increase in productivity. However, the depth and length of the initial decline differs enormously between countries. Our analysis indicates that the productivity changes were related to the extent of the pre-reform distortions, initial resource endowments and technology use, and the reform imple- mentation in the countries. Keywords Transition agriculture Labor productivity Yields Technical efficiency Total factor productivity Resource endowment Reform implementation JEL Classification Q12 P27 P32 R11 1 Introduction Economic and institutional reforms have dramatically affected agricultural organization, output, and production efficiency in Central and Eastern Europe and the Former Soviet republics. Not only did farm output fall dramatically in the transition countries of Europe and the former Soviet Union (FSU), some studies find that efficiency decreased as well during transition. In a review of the evidence, Rozelle and Swinnen (2004) conclude that productivity started increasing early on during transition in Central Europe and parts of the Balkans and the Baltic states, but continued to decline much longer in other parts of the FSU. Initial declines in productivity were associated with initial dis- ruptions due to land reforms and farm restructuring in Eastern Europe (Macours and Swinnen 2000a) or with poor incentives and soft budget constraints in some of the countries of the former Soviet Union (Sedik et al. 1999; Lerman et al. 2004) and with disorganization in the supply chains (Gow and Swinnen 1998). However, there are several problems in comparing efficiency studies and drawing implications from them. First, a limitation is that those studies which include more countries and a longer time horizon use aggregate data J. F. M. Swinnen L. Vranken (&) LICOS Centre for Institutions and Economic Performance, University of Leuven (KULeuven), Deberiotstraat 34, Leuven 3000, Belgium e-mail: [email protected] J. F. M. Swinnen e-mail: [email protected] J. F. M. Swinnen Department of Economics, University of Leuven (KULeuven), Deberiotstraat 34, Leuven 3000, Belgium L. Vranken Centre for Corporate Sustainability, HUBrussel, Stormstraat 2, Brussel 1000, Belgium L. Vranken Unit Transition Energy Environment, VITO, Boeretang 200, Mol 2400, Belgium 123 J Prod Anal (2010) 33:241–258 DOI 10.1007/s11123-009-0162-6

Welcome message from author
This document is posted to help you gain knowledge. Please leave a comment to let me know what you think about it! Share it to your friends and learn new things together.
Transcript
Reforms and agricultural productivity in Central and EasternEurope and the Former Soviet Republics: 1989–2005
Johan F. M. Swinnen • Liesbet Vranken
Published online: 27 November 2009
� Springer Science+Business Media, LLC 2009
Abstract This paper analyses the changes in agricultural
performance in Central and Eastern Europe and the Former
Soviet republics since the start of the transition process.
We provide a conceptual framework for the evolution of
productivity and efficiency measures and link this evolu-
tion to the issue of factor abundance taking into account
specific transition characteristics. We document the chan-
ges in agricultural performance using empirical data on the
evolution of partial productivity and total factor produc-
tivity estimates and we illustrate how productivity varies
between countries at various stages of the transition pro-
cess. Over the past twenty years, virtually all transition
countries witnessed an initial decline in productivity, and
virtually all countries currently witness an increase in
productivity. However, the depth and length of the initial
decline differs enormously between countries. Our analysis
indicates that the productivity changes were related to the
extent of the pre-reform distortions, initial resource
endowments and technology use, and the reform imple-
mentation in the countries.
Keywords Transition agriculture � Labor productivity �Yields � Technical efficiency � Total factor productivity �Resource endowment � Reform implementation
JEL Classification Q12 � P27 � P32 � R11
1 Introduction
Economic and institutional reforms have dramatically
affected agricultural organization, output, and production
efficiency in Central and Eastern Europe and the Former
Soviet republics. Not only did farm output fall dramatically
in the transition countries of Europe and the former Soviet
Union (FSU), some studies find that efficiency decreased as
well during transition. In a review of the evidence, Rozelle
and Swinnen (2004) conclude that productivity started
increasing early on during transition in Central Europe and
parts of the Balkans and the Baltic states, but continued to
decline much longer in other parts of the FSU. Initial
declines in productivity were associated with initial dis-
ruptions due to land reforms and farm restructuring in
Eastern Europe (Macours and Swinnen 2000a) or with poor
incentives and soft budget constraints in some of the
countries of the former Soviet Union (Sedik et al. 1999;
Lerman et al. 2004) and with disorganization in the supply
chains (Gow and Swinnen 1998).
However, there are several problems in comparing
efficiency studies and drawing implications from them.
First, a limitation is that those studies which include more
countries and a longer time horizon use aggregate data
J. F. M. Swinnen � L. Vranken (&)
LICOS Centre for Institutions and Economic Performance,
University of Leuven (KULeuven), Deberiotstraat 34,
Leuven 3000, Belgium
e-mail: [email protected]
J. F. M. Swinnen
e-mail: [email protected]
J. F. M. Swinnen
Department of Economics, University of Leuven (KULeuven),
Deberiotstraat 34, Leuven 3000, Belgium
L. Vranken
Centre for Corporate Sustainability, HUBrussel, Stormstraat 2,
Brussel 1000, Belgium
L. Vranken
Unit Transition Energy Environment, VITO, Boeretang 200,
Mol 2400, Belgium
123
J Prod Anal (2010) 33:241–258
DOI 10.1007/s11123-009-0162-6
(Mathijs and Swinnen 2001) while studies using farm-level
data are restricted to one country and short time periods,
often even 1 year. Second, cross-country comparisons and
conclusions are complicated by differences in data sam-
ples. Third, linking efficiency changes to specific reforms
is difficult, but important in understanding which factors
have been crucial in constraining or stimulating efficiency
growth.
To get a comprehensive picture of productivity
developments and to accommodate important data con-
straints, we analyze four sets of productivity indicators:
labor productivity (output per unit of labor use) as this
relates to wages; yields (output per unit of land) as this
relates to land rents; aggregate total factor productivity
(TFP) as this relates to the rate of cost-reduction; and
micro-data based total factor productivity (micro-TFP)
based on data envelopment analysis (DEA) as this relates
to potential output that can be generated with the current
input use.
The most comprehensive indicator of productivity is
micro-data based TFP. However because of the absence of
consistent panel data both across countries and over time,
comparative and reliable estimates of micro-TFP analyses
across countries and over time are not consistently avail-
able. For those countries where (even aggregate) TFP
series are available, comparisons have to be done carefully
because of differences in methodologies, time frames,
sampling and commodity coverage. Information for the
partial productivity measures is more readily available, and
so we start by examining indicators of partial productivity
and complement the analysis with TFP estimates.
This paper has seven parts. After this introduction, we
provide in the second part a conceptual framework for the
evolution of productivity and efficiency measures and link
this evolution to the issue of factor abundance taking into
account specific transition characteristics. The third part
summarizes and updates earlier studies and empirical data
on the evolution of partial productivity estimates, such as
labor productivity and yields. The fourth part presents a set
of new total factor productivity estimates. The fifth section
uses farm-level survey data to estimate how productivity
varies between countries at various stages of the transition
process. The sixth section discusses the role of technology
and resource endowments and the nature of the produc-
tivity gains. The final section draws conclusions from the
combination of these pieces of empirical evidence.
For much of the discussion in this paper we will refer to
and compare productivity (changes) in four periods: the
pre-reform period (before 1990), early transition (year 1–5;
roughly the first half of the 1990s), mid transition (year
6–10; the second half of the 1990s), the recent period (after
1999). In Central Europe and the Balkans, the start of the
reforms is assumed to be the year 1989, while in the FSU
(Baltics, European CIS, Transcaucasus and Central Asia)1
the start is assumed in 1990.
2 Resource endowments, reforms, technical change and
productivity in transition: a conceptual framework
There were (and still are) major differences in resource
endowments and the nature of technology in agriculture
among the transition countries. For example, the pre-
reform labor/land ratio in Russia and Kazakhstan was
many times lower than in, for example, Albania, Azer-
baijan, Moldova or Romania (see Table 7). It is well
known that resource endowments (factor proportions) can
play an important role in agricultural productivity growth.
Most famously, Hyami and Ruttan (1970) showed how
technological adaptation can occur through a sequence of
induced innovations in technology biased toward saving
the limiting factors.2 Hence, in countries where land is
relatively scarce and labor abundant, innovations in tech-
nology will be biased towards using land, the scarce factor,
more efficiently—such as through biological innovations
(e.g. seed improvements). In contrast, in countries where
labor is relatively scarce and land abundant, technological
innovations will be induced that contribute to a more
efficient use of labor, the limiting factor. This can come
through, for example, mechanical innovations, which
substitute labor by land and/or capital, leading to a
decrease in the labor/land ratio.
It is also well-known that resource endowments (or
initial technology) also played an important role in the
institutional reforms and productivity changes in transition
agriculture (Macours and Swinnen 2002). However, the
very nature of the transition process, and its inherent policy
and institutional reforms which interact with pre-reform
distortions, makes the impact of resource endowments on
productivity growth considerably more complex than the
original Hayami-Ruttan model (or its more recent exten-
sions) would predict in transition economies.
First, under the Communist system, government regu-
lations caused distortions in many output and factor prices
and in company and household allocation decisions.
Hence, the removal of these distortions in the transition
process caused important readjustments in factor alloca-
tions which primarily reflected pre-reform distortions
1 We refer both to the former Soviet Union (FSU) and to the
Commonwealth of Independent States (CIS), which include all FSU
states except for the Baltic states. Central and Eastern Europe usually
refers to the combination of the Baltic states, the Central European
countries and the Balkan countries (see also Table 1 for a country
classification).2 See e.g. Koppel (1995) for a critical assessment and more recent
interpretations of the Hayami-Ruttan induced innovation model.
242 J Prod Anal (2010) 33:241–258
123

(Liefert et al. 2003). For example, under the central plan-
ning system, labor was inefficiently used in most sectors of
the economy, but this was especially the case for the
agricultural sector (Brada 1989; Bofinger 1993; Jackman
1994). Hence, reforms which allow a more efficient labor
allocation would induce an outflow of agricultural labor
from agriculture to other sectors, and hence a decline in the
labor/land ratio, and the size of this would strongly be
affected by the pre-reform distortions, rather than by
induced technical change.
Second, actual factor adjustments depend on several
factors. One of them is the actual implementation of the
reform policies. In many transition countries, reforms were
implemented with delays, or not, which affected the real-
location of production factors to more efficient uses.
Hence, many of the predicted factor adjustments were
conditional on sufficient progress in the reform process.
Similarly, in order to induce technical innovations to use
land and labor more productively, access to credit for
investment in agricultural machinery and working capital to
buy for example fertilizer and chemicals is crucial. How-
ever, in the early transition years, external credit was scarce
and expensive which resulted in problems accessing phys-
ical inputs (Arnade and Gopinath 1998; Petrick 2004).
Consequently, technical innovations that one would expect
based on the initial resource endowments might not be
observed. Again, progress in reforms was essential to make
this occur, either in making domestic finance available to
farmers and the food industry or by attracting international
capital through foreign direct investment (FDI) in the food
industry and agribusiness with positive vertical spill-overs
on farms. The latter process, which was conditional on the
progress of reforms, has been a very important source of
access to inputs, technology, credit and markets for transi-
tion country farmers, resulting in substantial productivity
growth (Gow and Swinnen 1998; Dries and Swinnen 2004).
Third, another element is that restructuring is a timely
and costly process and factor reallocation will be deter-
mined by opportunity costs in the transition process itself,
which may be affected by government policies and the
level of development. For example, mobility out of agri-
culture is determined by the probability of finding
employment in other sectors and by social benefits that an
individual would receive when leaving agriculture. In
richer transition countries, labor that was laid off (also
from large farms) received sufficient unemployment pay-
ments or pensions to become effectively unemployed or to
retire. In poorer countries, such social payments were
insufficient as an income source for households and the
agricultural sector played a buffer role (‘‘labor sink’’)
during transition, absorbing and providing an income
generating activity to those laid off in other sectors (Seeth
et al. 1998).
Fourth, an important element of ‘‘induced innova-
tion’’—more in line with the broader Hyami and Ruttan
(1985) framework—which strongly affected productivity
change during transition was the endogenous adjustments
of the structure of farms. The relative efficiency of farm
organizations and thus incentives for farm restructuring are
significantly affected by initial resource endowments
because they affect the costs and benefits of shifting to
family farms (from corporate farms). If labor/land ratios
are high, i.e. if agricultural production processes are rela-
tively labor intensive, the benefits of shifting to family
farms (from corporate farms) are larger, while the costs of
shifting are lower (Swinnen and Rozelle 2006). As a result,
particularly land productivity gains which stem from the
shift to household farming are observed. On the other hand,
if labor/land ratios are low, i.e. if agricultural production is
relatively land intensive, the benefits of shifting to family
farms is lower so that large-scale corporate farming
remained. In that case, particularly labor productivity gains
which stem from laying off corporate farm workers will be
observed.
Again, however, it should be emphasized that these
adjustments and these induced farm restructuring processes
were conditional on land reforms and farm privatization
policies being implemented. In many countries, these effects
were delayed (or did not occur) because such reforms were
implemented with delay or not implemented at all.
Finally, an important element of ‘‘induced innovation’’
during transition was the endogenous choice of land
reforms. This effect is beyond the focus of this paper and
we refer to Rozelle and Swinnen (2004) for a discussion
and analysis of this effect.
In summary, resource endowments played an important
role in affecting productivity changes in the transition
process. For example, they affected the incentives for
endogenous farm restructuring and adjustments in factor
proportions. However, these adjustments and the mecha-
nism of productivity growth and technical change were
also strongly affected by the level of development of a
country and its progress and implementation of various
institutional and policy reforms. Moreover, the choice and
implementation of the reforms were often affected by the
level of development and the resource endowments, mak-
ing the set of interactions in determining the pace and
mechanism of productivity growth complex.
3 Partial productivity indicators
3.1 Labor productivity
Agricultural labor productivity (ALP) is measured as out-
put per farm worker. Changes in ALP since the start of
J Prod Anal (2010) 33:241–258 243
123

transition are summarized in Fig. 1 and Table 1. As most
productivity indicators, ALP evolutions differ strongly
among transition countries.
3.1.1 Early and mid-transition
Despite strong decreases in aggregate output (see Table 2),
output per worker rises strongly over the first decade of
transition in Central European countries such as Hungary,
the Czech Republic, and Slovakia. The dramatic reduction
in the use of agricultural labor drives the rise of ALP in
Central Europe (see Table 4). Official employment data
from Central Europe show an average reduction of labor
use of 35% during the first 5 years of transition. The
strongest reductions occur in Hungary (57%) and the Czech
Republic (46%). The same process occurs in Estonia, an
early and radically reforming country, where labor use
-60
-40
-20
0
20
40
60
80
100
120
0 1 2 3 4 5 6 7 8 9 10 11 12 13 14 15
Years after start reforms
ALP
Inde
x
Central Europe
Balkan
Baltics
European CIS
Transcaucasus
Fig. 1 Changes in agricultural labor productivity (output per farm
worker—ALP) index in transition countries. Note European CIS
includes Russia and Ukraine and excludes Moldova and Belarus.
Transcaucasus includes Armenia and Azerbaijan and excludes
Georgia
Table 1 Growth of agricultural labor productivity (output per farm worker—ALP) in ECA countries (index = 100 in first year of reform)
Year with
lowest ALP
ALP index in year
of lowest ALP
ALP index
after 5 years
ALP index after
10 years
ALP index after
13/14/15 years
Average annual change
Years
0–5
Years
5–10
Years
10–13/14/15
Central Europe
Czech Republic 1 97 140 198 240 8.0 11.7 8.3
Hungary 1 99 164 207 306 12.8 8.5 19.9
Poland 5 86 86 102 117 -2.9 3.3 2.9
Slovakia 1 100 110 145 233 1.9 7.1 17.5
Balkans
Albania 2 77 108 119 195 1.6 2.1 15.3
Bulgaria 14 57 69 64 65 -6.3 -0.8 0.1
Romania 3 67 79 81 158 -4.2 0.4 15.4
Slovenia 3 61 85 85 96 -3.0 -0.1 2.2
Baltics
Estonia 1 71 138 153 196a 7.7 2.9 10.8a
Latvia 8 54 64 68 75 -7.3 0.9 1.6
Lithuania 4 59 61 73 100 -7.8 2.4 6.7
European CIS
Russia 10 55 63 55 84a -7.3 -1.7 7.2a
Ukraine 9 51 65 55 63a -7.1 -2.0 2.1a
Transcaucasus
Armenia 11 36 42 40 52a -11.5 -0.4 3.1a
Azerbaijan 9 48 57 53 61a -8.7 -0.8 2.2a
Central Asia
Kazakhstan 6 58 60 192 155a -8.0 26.5 -12.5a
Kyrgyzstan 5 58 58 67 74b -8.3 1.7 2.4b
Tajikistan 9 36 46 39 42b -10.7 -1.4 1.0b
Turkmenistan 6 55 88 71 103b -2.4 -3.4 10.6b
Uzbekistan 6 80 88 98 113b -2.4 2.0 5.2b
Other countries have data for 15 years after start of reform. Source: FAO, Asian Development Bank, ILO, OECDa Countries with Estonia, European CIS, Transcaucasus and Kazakhstan have data for 14 years after start of reformb Countries with Kyrgyzstan, Tajikistan, Turkmenistan, Uzbekistan have data for 13 years after start of reform
244 J Prod Anal (2010) 33:241–258
123

declines by 58% within the first 5 years of reform, also
causing an increase in ALP.
In other East European countries, such as Poland, Lat-
via, and Lithuania, ALP falls immediately after reform, but
recovers and rises after the first 4 years. Since then labor
productivity growth has been consistently positive.
However, further East and South, labor productivity
generally falls for much of the first decade of transition.
For example in Russia, Ukraine and Central Asia ALP falls
between 35 and 50% between 1990 and 1999. The most
dramatic fall is in the early years of transition when aver-
age annual ALP declines are more than 7% for several
countries. The productivity decline slows down in the
second half of the 1990s, but the decline continues in many
countries.
In contrast to Central Europe, agricultural labor use
increases in parts of the Transcaucasus and Central Asia.
For example, in Kyrgyzstan agricultural employment
surged between 1990 and 2000, rising by 64% (ILO 2001).
There, as in other countries in the region, a rising number
of people in agriculture coupled with stagnant output led to
the fall in ALP.
The story is mixed in the Balkans. There is a strong ALP
decline in Bulgaria and Romania, and stagnation in the
second half of the 1990s. Albania which has seen contin-
uous ALP growth from the start of transition has more
positive development.
3.1.2 Recent period
Since 1999 there is labor productivity growth in all tran-
sition countries, albeit at quite different growth rates. In
Central Europe and some of the Baltic countries ALP
growth continues from the previous period, with further
outflow of labor from agriculture. In some countries, such
as Hungary, Slovakia, Czech Republic, Estonia and Lith-
uania, productivity growth is very strong (between 7 and
20% average per year). Notice that all these countries have
a significant part of their agriculture organized in large
scale farming companies.
Table 2 Growth of gross
agricultural output (GAO) in
ECA countries (index = 100 in
first year of reform)
Source: FAO
Years after start
of reform with
lowest GOA
GOA index
in year of
lowest GOA
GOA index
after 5 years
of reform
GOA index
after 10 years
of reform
GOA index
after 15 years
of reform
Central Europe
Czech Republic 13 63 75 77 69
Hungary 6 69 70 73 79
Poland 5 77 77 85 90
Slovakia 11 61 77 68 76
Balkans
Albania 2 77 100 113 132
Bulgaria 14 55 63 62 63
Romania 3 75 93 93 117
Slovenia 3 65 81 79 85
Baltics
Estonia 8 41 55 42 45
Latvia 9 37 50 38 48
Lithuania 11 61 69 65 72
European CIS
Belarus 9 57 61 58 69
Russia 8 58 64 62 68
Ukraine 13 50 69 55 58
Transcaucasus
Armenia 3 72 82 80 92
Azerbaijan 5 55 55 72 91
Georgia 10 51 62 51 61
Central Asia
Kazakhstan 8 41 53 52 54
Kyrgyzstan 5 79 79 110 106
Tajikistan 9 48 61 53 71
Turkmenistan 6 69 106 99 160
Uzbekistan 6 90 98 97 119
J Prod Anal (2010) 33:241–258 245
123
In countries dominated by individual farms, such as
Poland, Latvia, and Slovenia, labor productivity growth is
much smaller—reflecting very different labor governance
models on both types of farms (Dries and Swinnen 2002,
2004; Swinnen et al. 2005).
In the rest of the transition region, labor productivity
turned around in the recent period, growing very strongly
in Russia (7%) and Turkmenistan (10%), while growing
more slowly (3% or less per year) in countries such as
Ukraine, Armenia, Azerbaijan, Kyrgyzstan, Tajikistan.3
3.2 Yields and land productivity
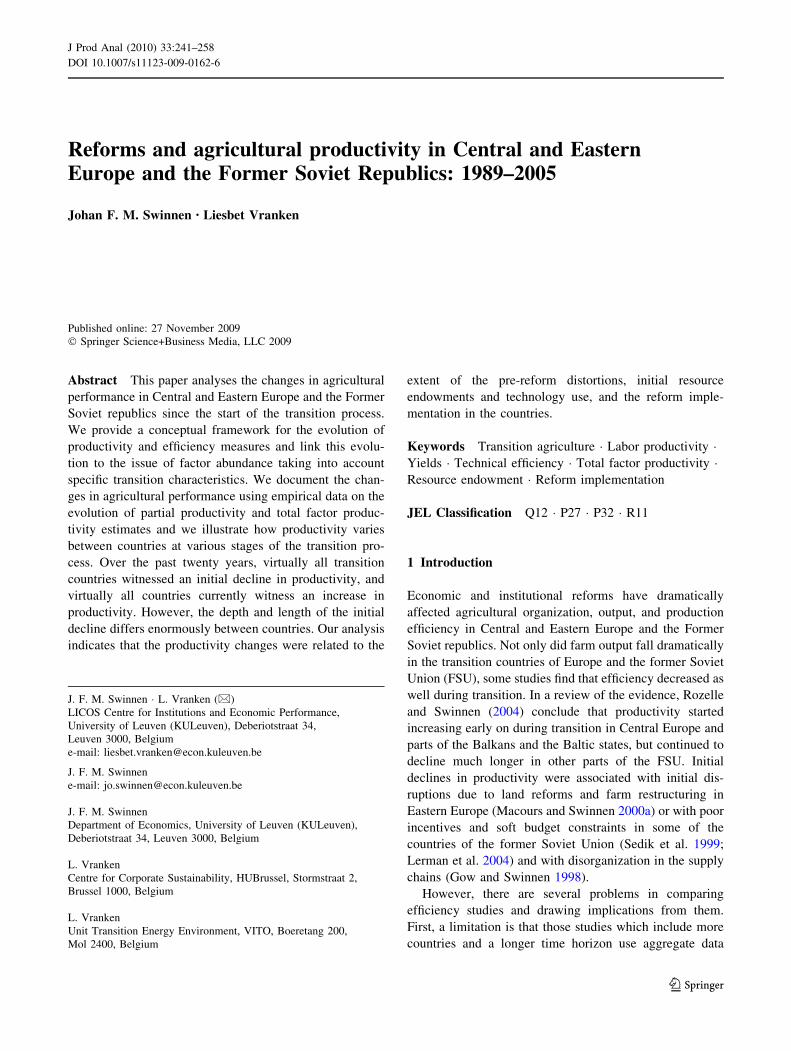
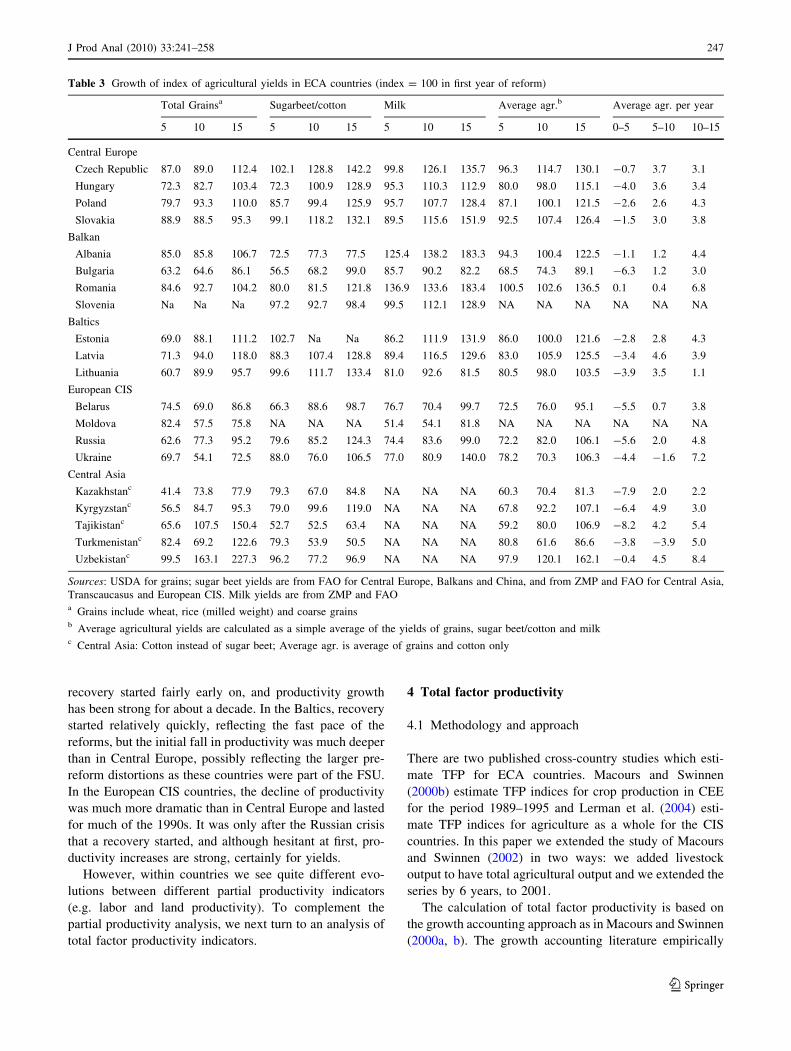
The changes in yields are reported in Fig. 2 and Table 3 for
three 5 year periods. The numbers in the tables are sum-
maries of yield evolutions for selected commodities:
grains, sugar beet/ cotton,4 and milk.
3.2.1 Early transition (0–5 years)
Average yields fall during the first few years after reform
for all transition countries (with the exception of Romania
where they are stable). The fall is strongest in the FSU
countries where average annual declines vary from 3.4% in
the Baltics to more than 5% in the rest of the FSU. In
Russia and Ukraine and in Central Asia, yields fall rapidly
during the first 5 years of transition to levels about 25%
lower than pre-reform yields.
3.2.2 Mid-transition (5–10 years)
As in the case of labor productivity, after the initial post-
transition years, the paths of yield evolution differ strongly
between the regions. Central European yields not only
decline less than those in countries further East—by
10–15% on average during the first few years of transi-
tion—they also begin recovering faster (generally from the
third year of transition onward). Agricultural yields
increase, on average, by 3.6% annually in the second half
of the 1990s. A similar, but more pronounced, yield pattern
can be observed in the Baltics. Average yields in the
Baltics dropped initially to almost 25% below their pre-
reform levels. In the second half of the mid 1990s, how-
ever, they recover, rising by an average of 4.6% annually.
In other regions, the recovery is slower and starts later.
In the Balkan countries, the decline in yields is less than in
the Baltic states and more comparable to the decline in
Central Europe: the average total decline is 10–15%. But
their yield recovery is slower, an average of 1.0% annually
during the second half of the 1990s. In the European CIS,
the average growth rate is zero, with positive yield growth
in Russia being offset by declining yields in Ukraine and
Moldova. In Central Asia, growth is strongly positive at
3.2% average, with only Turkmenistan still having
(strongly) declining yields.
3.2.3 Recent period (10–15 years)
Since 1999 yields are improving in all transition regions,
albeit at quite different growth rates. Yields continue to
increase at the same rate (3.5% average annually) in
Central Europe. In the Balkans, yield growth is stronger at
4.5% on average, while somewhat less in the Baltics (3.0%,
down from 4.6% in the previous period). Yield growth
however is strongest in the rest of the FSU. In the European
part of the CIS, yield growth is strong at 5.7%, but is even
outperformed by Central Asia at 7.1% on average.
3.3 Summary
In general, partial productivity indicators follow a J (or U)
curve: initially a decline in productivity is observed fol-
lowed by a recovery later on. However, while productivity
generally fell following the reforms which were launched
in the late 1980s and early 1990s, the extent of the decline
(i.e. its depth and length) and the strength of the recovery
differs strongly between countries.
The productivity indicators presented above suggest that
the productivity changes were related to the extent of the
pre-reform distortions and the reform implementation in
the countries. In the most advanced reformers (mostly in
Central Europe) the decline was relatively mild and
-35
-30
-25
-20
-15
-10
-5
0
5
10
15
20
25
0 1 2 3 4 5 6 7 8 9 10 11 12 13 14 15
Ave
rag
e ag
r. y
ield
ind
ex
Central Europe
Balkans
Baltics
European CIS
Fig. 2 Change in average agricultural yields. Agricultural yield index
is calculated as the average yield index of grains and milk. Given the
sensitivity of grain yields to the weather conditions, the figures show
the moving average over 3 years. Balkans includes Albania, Bulgaria,
Romania and excludes Slovenia
3 Kazakhstan changed its definitions of agricultural labor making
comparisons across time impossible with the official data.4 Cotton for Central Asia and sugar beets for other countries.
246 J Prod Anal (2010) 33:241–258
123
recovery started fairly early on, and productivity growth
has been strong for about a decade. In the Baltics, recovery
started relatively quickly, reflecting the fast pace of the
reforms, but the initial fall in productivity was much deeper
than in Central Europe, possibly reflecting the larger pre-
reform distortions as these countries were part of the FSU.
In the European CIS countries, the decline of productivity
was much more dramatic than in Central Europe and lasted
for much of the 1990s. It was only after the Russian crisis
that a recovery started, and although hesitant at first, pro-
ductivity increases are strong, certainly for yields.
However, within countries we see quite different evo-
lutions between different partial productivity indicators
(e.g. labor and land productivity). To complement the
partial productivity analysis, we next turn to an analysis of
total factor productivity indicators.
4 Total factor productivity
4.1 Methodology and approach
There are two published cross-country studies which esti-
mate TFP for ECA countries. Macours and Swinnen
(2000b) estimate TFP indices for crop production in CEE
for the period 1989–1995 and Lerman et al. (2004) esti-
mate TFP indices for agriculture as a whole for the CIS
countries. In this paper we extended the study of Macours
and Swinnen (2002) in two ways: we added livestock
output to have total agricultural output and we extended the
series by 6 years, to 2001.
The calculation of total factor productivity is based on
the growth accounting approach as in Macours and Swinnen
(2000a, b). The growth accounting literature empirically
Table 3 Growth of index of agricultural yields in ECA countries (index = 100 in first year of reform)
Total Grainsa Sugarbeet/cotton Milk Average agr.b Average agr. per year
5 10 15 5 10 15 5 10 15 5 10 15 0–5 5–10 10–15
Central Europe
Czech Republic 87.0 89.0 112.4 102.1 128.8 142.2 99.8 126.1 135.7 96.3 114.7 130.1 -0.7 3.7 3.1
Hungary 72.3 82.7 103.4 72.3 100.9 128.9 95.3 110.3 112.9 80.0 98.0 115.1 -4.0 3.6 3.4
Poland 79.7 93.3 110.0 85.7 99.4 125.9 95.7 107.7 128.4 87.1 100.1 121.5 -2.6 2.6 4.3
Slovakia 88.9 88.5 95.3 99.1 118.2 132.1 89.5 115.6 151.9 92.5 107.4 126.4 -1.5 3.0 3.8
Balkan
Albania 85.0 85.8 106.7 72.5 77.3 77.5 125.4 138.2 183.3 94.3 100.4 122.5 -1.1 1.2 4.4
Bulgaria 63.2 64.6 86.1 56.5 68.2 99.0 85.7 90.2 82.2 68.5 74.3 89.1 -6.3 1.2 3.0
Romania 84.6 92.7 104.2 80.0 81.5 121.8 136.9 133.6 183.4 100.5 102.6 136.5 0.1 0.4 6.8
Slovenia Na Na Na 97.2 92.7 98.4 99.5 112.1 128.9 NA NA NA NA NA NA
Baltics
Estonia 69.0 88.1 111.2 102.7 Na Na 86.2 111.9 131.9 86.0 100.0 121.6 -2.8 2.8 4.3
Latvia 71.3 94.0 118.0 88.3 107.4 128.8 89.4 116.5 129.6 83.0 105.9 125.5 -3.4 4.6 3.9
Lithuania 60.7 89.9 95.7 99.6 111.7 133.4 81.0 92.6 81.5 80.5 98.0 103.5 -3.9 3.5 1.1
European CIS
Belarus 74.5 69.0 86.8 66.3 88.6 98.7 76.7 70.4 99.7 72.5 76.0 95.1 -5.5 0.7 3.8
Moldova 82.4 57.5 75.8 NA NA NA 51.4 54.1 81.8 NA NA NA NA NA NA
Russia 62.6 77.3 95.2 79.6 85.2 124.3 74.4 83.6 99.0 72.2 82.0 106.1 -5.6 2.0 4.8
Ukraine 69.7 54.1 72.5 88.0 76.0 106.5 77.0 80.9 140.0 78.2 70.3 106.3 -4.4 -1.6 7.2
Central Asia
Kazakhstanc 41.4 73.8 77.9 79.3 67.0 84.8 NA NA NA 60.3 70.4 81.3 -7.9 2.0 2.2
Kyrgyzstanc 56.5 84.7 95.3 79.0 99.6 119.0 NA NA NA 67.8 92.2 107.1 -6.4 4.9 3.0
Tajikistanc 65.6 107.5 150.4 52.7 52.5 63.4 NA NA NA 59.2 80.0 106.9 -8.2 4.2 5.4
Turkmenistanc 82.4 69.2 122.6 79.3 53.9 50.5 NA NA NA 80.8 61.6 86.6 -3.8 -3.9 5.0
Uzbekistanc 99.5 163.1 227.3 96.2 77.2 96.9 NA NA NA 97.9 120.1 162.1 -0.4 4.5 8.4
Sources: USDA for grains; sugar beet yields are from FAO for Central Europe, Balkans and China, and from ZMP and FAO for Central Asia,
Transcaucasus and European CIS. Milk yields are from ZMP and FAOa Grains include wheat, rice (milled weight) and coarse grainsb Average agricultural yields are calculated as a simple average of the yields of grains, sugar beet/cotton and milkc Central Asia: Cotton instead of sugar beet; Average agr. is average of grains and cotton only
J Prod Anal (2010) 33:241–258 247
123
accounts for growth in output by measuring factor inputs
and an unexplained residual, which is generally attributed to
technological change. More specifically, total factor pro-
ductivity is measured as an output-input ratio where the
estimated coefficients of the different production factors in
a Cobb-Douglas production function are used as input
weights. The output is the net agricultural production index
number (PIN) reported by the FAO. The index equals total
agricultural production excluding the amount of produce
used as animal feed and seed. The index is calculated by the
Laspeyres formula:
Pqtpo
.P
qopo;
where the net production quantity of each commodity
produced in the current year (qt) is weighted by the 1999–
2001 average per unit international commodity prices (po)
and summed for each year. To obtain the index, the
aggregate for a given year is divided by the average for the
base period 1999–2001 where qo is the net production
quantity in the base period (FAO 1986). To ensure com-
parability, a single set of international commodity prices
was used by the FAO for all countries and country groups.
As input factors, we included land, labor, capital, fer-
tiliser and animal stock. As input weights, we used the
coefficients of production function estimated in Cungu and
Swinnen (2003).5 The input variables and data were
obtained as follows:
• Land: following the FAO definition, land includes
arable land and land under permanent crop cultivation,
excluding that left idle.6 The area under permanent
crops includes also land under flowering shrubs, fruit-
trees, nut trees and vines, but excludes land under trees
grown for wood.
• Labor is the number of people who are economically
active in agriculture including those that are either
engaged or seeking employment in agriculture. For the
Central Asian republics, the data comes from the Asian
Development Bank. For the other countries in our
sample, the information has been put together from a
variety of sources including the International Labour
Organisation (ILO), the Organisation for Economic
Cooperation in Europe (OECD), the FAO, and indi-
vidual country reports.7
• Livestock data are also from the FAO database. We
take account of the number of cattle indicated as the
number of live animal heads in a country at the time of
enumeration, except for chicken.
• Capital is based on the physical number of tractors in
use, as reported by the FAO. We do not have
information on the power of those tractors for each
country/year. Therefore, the assumption here is that, in
each country, the type of tractors in terms of their
horsepower stayed the same throughout the entire
period. As such, the horsepower as a conversion factor
drops out when the yearly to 1989 ratios are calculated.
• Fertiliser is the quantity of pure nutrient fertiliser in
metric tonnes consumed in agriculture by a country, as
reported by the FAO. Three types of fertilisers have
been aggregated to produce this measure: nitrogenous,
phosphate, and potash fertilisers.
4.2 Results
We estimate TFP for eight Central and Eastern European
countries: Czech Republic, Hungary, Poland, Slovakia
(Central Europe) and Albania, Bulgaria, Romania and
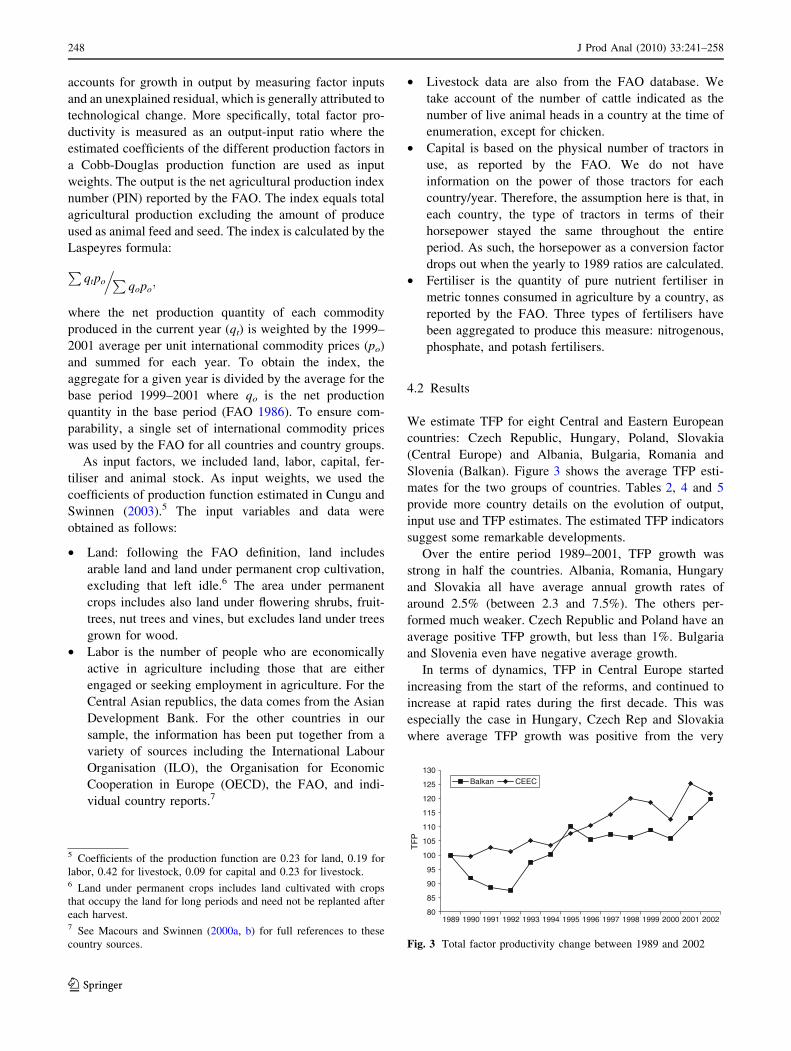
Slovenia (Balkan). Figure 3 shows the average TFP esti-
mates for the two groups of countries. Tables 2, 4 and 5
provide more country details on the evolution of output,
input use and TFP estimates. The estimated TFP indicators
suggest some remarkable developments.
Over the entire period 1989–2001, TFP growth was
strong in half the countries. Albania, Romania, Hungary
and Slovakia all have average annual growth rates of
around 2.5% (between 2.3 and 7.5%). The others per-
formed much weaker. Czech Republic and Poland have an
average positive TFP growth, but less than 1%. Bulgaria
and Slovenia even have negative average growth.
In terms of dynamics, TFP in Central Europe started
increasing from the start of the reforms, and continued to
increase at rapid rates during the first decade. This was
especially the case in Hungary, Czech Rep and Slovakia
where average TFP growth was positive from the very
80
85
90
95
100
105
110
115
120
125
130
1989 1990 1991 1992 1993 1994 1995 1996 1997 1998 1999 2000 2001 2002
TF
P
Balkan CEEC
Fig. 3 Total factor productivity change between 1989 and 2002
5 Coefficients of the production function are 0.23 for land, 0.19 for
labor, 0.42 for livestock, 0.09 for capital and 0.23 for livestock.6 Land under permanent crops includes land cultivated with crops
that occupy the land for long periods and need not be replanted after
each harvest.7 See Macours and Swinnen (2000a, b) for full references to these
country sources.
248 J Prod Anal (2010) 33:241–258
123

beginning, and grew strongly at around 3% per year in the
1992–1995 period and around 4% per year in the 1995–
1998 period. In all other countries, including Poland, there
was an initial decline in TFP.
What is remarkable is that in Central Europe, after robust
TFP growth through the 1992–1998 period, TFP growth has
slowed down in these countries, and has even gone negative
in Hungary and the Czech Republic over 1998–2001. To
understand why this is the case, we looked into the partial
productivity indicators. In the early transition period (first
5 years of transition), the use of all inputs, except for land is
decreasing and the decrease is faster than the decrease
in output (Tables 2, 4). In the mid transition period
(5–10 years after the start of the reforms), labor use con-
tinued to decline, while tractor and fertilizer use started to
increase and agricultural output more or less stabilized
(Tables 2, 4). As a result, labor productivity keeps
improving through the period, but output per tractor and
output per unit of fertilizer goes down, reflecting substantial
increases in investments in tractors and more fertilizer use.
In the Balkans the TFP evolutions are also mixed.
Bulgaria has performed worst of all, having recorded
Table 4 Growth of index of input use in ECA countries (index = 100 in first year of reform)
Years after start
of reform
Animal stock Fertiliser Labor Land Tractors
5 10 15 5 10 12/13a 5 10 14/15b 5 10 13/14c 5.0 10.0 13/14c
Central Europe
Czech Rep. 69.0 52.9 45.6 29.4 23.5 32.3 53,7 38,8 31,8 103.3 103.5 103.2 58.1 71.2 82.3
Hungary 58.9 51.4 43.5 14.7 20.3 23.6 42,6 35,1 26,6 94.4 95.4 90.5 71.8 72.0 88.5
Poland 81.2 69.2 56.5 35.4 37.8 37.4 89,3 82,9 77,1 99.4 98.0 85.9 113.7 113.3 119.0
Slovakia 65.1 46.2 35.4 17.0 15.3 21.4 70,6 47,0 32,8 99.8 99.7 99.5 88.8 64.7 61.2
Balkans
Albania 121.3 106.5 96.8 18.6 13.3 44.4 92,3 95,7 67,9 101.4 103.2 101.0 74.4 67.0 70.1
Bulgaria 47.3 42.3 45.9 24.9 13.6 18.4 92,3 95,5 96,9 97.6 90.0 84.4 69.0 74.7 57.7
Romania 62.6 49.7 45.8 27.1 17.1 23.6 118,2 115,1 74,2 100.3 100.1 99.7 106.3 108.0 111.5
Slovenia 86.2 81.8 81.3 56.4 52.2 46.4 95,3 93,4 88,5 90.9 82.8 84.4 56.2 71.7 69.8
Baltics
Estonia 50.4 32.1 30.0 16.9 21.2 16.3 39,7 27,5 22,5 107.4 106.9 89.8 105.8 108.4 115.7
Latvia 37.7 25.9 25.4 21.3 48.6 48.4 78,8 56,4 55,8 99.1 96.8 96.3 82.2 90.9 90.1
Lithuania 52.1 40.6 35.8 10.3 13.3 16.9 112,6 88,8 77,6 100.1 99.5 99.4 118.3 138.1 138.5
European CIS
Belarus 79.5 63.6 58.3 24.6 37.9 35.2 85,6 NA NA 97.6 96.7 92.9 92.1 57.9 46.7
Moldova 64.4 32.2 25.2 42.4 1.9 3.7 113,9 NA NA 102.2 101.8 101.1 92.8 77.7 76.2
Russia 73.6 46.7 38.3 11.2 9.1 9.4 100,2 113,1 80,1 98.3 98.6 98.2 81.5 57.9 45.4
Ukraine 75.2 40.7 26.6 24.3 12.0 16.1 106,1 100,3 91,0 99.6 98.5 98.4 91.7 62.3 76.4
Transcaucasus
Armenia 56.6 53.8 64.5 10.8 10.8 17.4 193,7 199,2 182,9 101.9 108.0 108.0 119.1 117.0 126.8
Azerbaijan 81.7 101.2 122.0 NA NA NA 97,3 137,0 135,5 96.1 103.0 106.1 90.4 90.6 90.8
Georgia 49.3 56.7 63.2 22.3 30.2 20.4 86.2 84.9 85.0 70.6 73.2 93.0
Central Asia
Kazakhstan 77.2 38.2 49.6 15.7 6.1 10.7 88,5 27,0 33,9 96.4 93.0 93.5 78.3 22.8 23.0
Kyrgyzstan 60.6 61.4 68.2 NA NA NA 134,8 164,0 146,0 99.2 101.5 102.0 99.2 101.7 87.7
Tajikistan 86.5 75.2 94.5 29.5 3.8 11.8 131,5 134,5 151,3 97.3 94.1 92.9 84.0 84.0 84.0
Turkmenistan 123.9 89.2 129.0 39.6 31.9 29.5 121,2 140,1 153,5 73.1 73.6 74.4 79.7 54.2 66.4
Uzbekistan 116.1 111.6 114.4 34.1 52.6 51.7 111,7 99,0 98,1 88.9 88.8 87.7 94.4 94.4 94.4
Sources: FAO, Asian Development Bank, International Labor Organisation, OECDa Fertilizer: Data for 12 years after the start of reform for countries in Central Europe and the Balkans and data for 13 years after the start of the
reform for the remaining countriesb Labor: Data for 15 years after the start of reform for countries in Central Europe and the Balkans and data for 14 years after the start of the
reform for the remaining countriesc Land and Tractors: Data for 14 years after the start of reform for countries in Central Europe and the Balkans and data for 13 years after the
start of the reform for the remaining countries
J Prod Anal (2010) 33:241–258 249
123

negative TFP growth for most of the 1989–2001 period,
except for the 1992–1995 period. Romania shows a process
of ups and downs. Periods of substantial TFP declines
(1989–1992 and 1995–1998) interact with periods of very
strong TFP growth (1992–1995 and 1998–2001).
Slovenia and Albania have remarkable TFP records, for
opposite reasons. While Slovenia is a member of the EU
now, and the richest country of all ECA, its average agri-
cultural TFP growth has been negative over the 1989–2001
period, showing negative TFP growth again in the 1998–
2001 period. In stark contrast, Albania, the poorest country
included in this analysis, has, after a small initial decline in
productivity before 1992, strong TFP growth since 1992
when the land reforms and farm restructuring really took off.
5 Farm-level productivity analysis
5.1 Approach and interpretation
To further study the differences in agricultural productivity
we relate them to aggregate changes at the farm level by
analyzing agricultural productivity at the farm level. Our
analysis uses micro data from a set of farm survey data from
eight transition countries (three Central European countries
(Czech Republic, Hungary, Slovakia), two Balkan countries
(Albania and Bulgaria), and three countries from various
parts of the CIS (Moldova, Azerbaijan and Kazakhstan)). We
first calculate farm-level efficiency indicators using data
envelopment analysis (DEA) and calculate kernel density
estimates for each of the countries. We compare efficiency
distributions between countries and calculate aggregated
(country-level) efficiency estimates. We then correlate these
with various indicators of reforms. We discuss how the share
of farmers producing efficiently changes during transition
and which aspects of the reforms are important in explaining
differences in the efficiency distributions of the countries.
It is important to notice that, unless stated explicitly, we
compare differences in efficiency distributions between
countries. Our approach is focused on measuring the rela-
tive efficiency of various farms compared to the most effi-
cient farm within the same country. Based on this we can
estimate an average efficiency level for each country, but
this measure reflects mostly the distribution of farms within
the country rather than a comparison to an external standard
which is the same for all countries. In other words, we do
not compare the efficiency of a specific farm in Kazakhstan
to the efficiency of a specific farm in Hungary—but we do
compare the relative efficiencies of all farms in Kazakhstan
with the relative efficiencies of all farms in Hungary.
This approach means that we do not assume that all
farms across these very different countries have access to
the same technology. We use a much less restrictive
assumption that all farms within a country have access to
the same technology. What is important is that we think
that cross-country comparisons of these distributions are
still relevant because the relative efficiency distributions do
give an important insight into the extent to which the vast
majority of farms have (not) been able to catch up with the
most efficient farms within the country, using the local
technology, know-how, infrastructure.
It is important to realize that, although there will always
be heterogeneity in efficiency among farms in any country,
one would expect that in a country’s transformation pro-
gress to a market economy the gap between the most and
the least efficient farm would decrease, and that the bulk of
the farms would become relatively close to the most effi-
cient farm. As we will show below this is still very dif-
ferent in the various transition countries analysed here.
A critique of our approach could be that in today’s world
most countries have access to the same technology. To
allow for this possibility we also use a more restrictive
assumption and we re-estimated the model assuming a
multi-country frontier and we compare the original
Table 5 Annual growth rates
of total factor productivity for
agriculture in the Balkans and
Central and Eastern Europe for
selected years (%)
Source: own calculations
Average annual change 1989–2001 1989–1992 1992–1995 1995–1998 1998–2001
Albania 2.6 -1.1 5.6 2.1 3.9
Bulgaria -0.4 -1.3 4.0 -4.1 -0.2
Romania 2.5 -4.2 11.6 -4.8 7.5
Slovenia -0.4 -9.9 9.0 1.6 -2.2
Balkans 1.1 -4.1 7.5 -1.3 2.3
Czech Republic 1.4 1.3 2.3 3.9 1.6
Hungary 4.0 1.9 3.4 5.1 5.6
Poland 0.8 -1.7 0.5 3.3 0.9
Slovakia 2.2 0.1 2.4 4.3 2.1
Central Europe 2.1 0.4 2.2 4.2 1.7
All 1.6 -1.9 4.9 1.4 2.0
250 J Prod Anal (2010) 33:241–258
123
efficiency estimations with the efficiency scores relative to
this more general frontier.
5.2 Data
Our analysis with micro data uses a set of farm survey data
from eight ECA countries. The data are a combination of
two different sets of data. The first is of five Central and
East European countries (Albania, Bulgaria, Czech
Republic, Hungary, and Slovakia) and was collected in the
1997–2000 period and based on a common set of survey
instruments—all surveys were coordinated by the same
experts (from the University of Leuven and the University
of Athens). The surveys in Hungary and Bulgaria were
implemented in 1998 and have representative data for
1997. Data for Albania, Czech and Slovak Republics are
for the production year 1999. The second set of surveys
was jointly organized under a 2003–2004 World Bank
project and has survey data from three CIS countries:
Moldova, Azerbaijan and Kazakhstan.
To increase the accuracy of comparisons, we take only
crop farms into consideration to enhance the homogeneity
of the dataset. To be included in our analysis the value of
grain production in the value of total production needed to
be more than 50%. Selection of farms out of the total
sample occurred according to objective criteria and did not
occurred randomly. Further, all country data were checked
for outliers and observations with incomplete information
were dropped.
The cleaning of the data resulted in a dataset of 178
Hungarian farms (63 cooperatives, 40 companies and 75
family farms), 93 Bulgarian farms (45 cooperatives, 9
companies and 39 family farms), 183 Czech farms (38
cooperatives, 14 companies and 131 family farms), 210
Albanian family farms, 783 Azerbaijan farms (15 corporate
farms and 768 family farms), 800 Kazakh farms (22 cor-
porate farms and 778 family farms) and 700 Moldovan
farms (24 corporate farms and 676 family farms).
The Albanian, Hungarian and Bulgarian datasets are
representative for the whole country, while in the Czech
and Slovak Republics some regions were selected for
surveying, but we selected regions with significant varia-
tions in the location of the farms (hills, low land and more
urban areas). In Azerbaijan, Kazakhstan and Moldova, the
datasets are representative within selected regions. There-
fore, the main farming system zones in the country were
first identified and then representative districts were
selected from these main zones. Though the type of agri-
culture practiced was the most important factor in the
identification of these zones, there was also an effort to
ensure coverage of a variety of farm types, different
degrees of poverty and various degrees of isolation (Dud-
wick et al. 2005).
The countries differ largely in terms of income levels,
reforms, land use, and economic conditions (see e.g. the
reform indicators in Table 6). Most countries have a
fragmented land ownership structure due to land restitution
or distribution processes implemented in 1990s. However
in all countries the land reform process was well advanced
by the time of the survey.
In Albania, the poorest country in Europe, almost half of
the active population is still employed in agriculture, and
virtually all agricultural land is cultivated by small indi-
vidual farms. Also in Azerbaijan, land is mostly used by
individual farms. Slovakia and the Czech Republic are the
opposite of Albania and Azerbaijan in most respects. They
are much richer and only around 5% of employment is in
agriculture. The vast majority of the land is used by large-
scale farming companies, successor organizations of for-
mer collective and state farms. The other countries repre-
sent a more mixed structure, albeit with considerable
differences among them. In Hungary, Bulgaria, Moldova
and Kazakhstan land is used by a mixture of large-scale
farming companies and small scale individual farms, with
much regional variation. Hungary has a considerably
higher level of income than Bulgaria and Kazakhstan.
Rural Moldova is the poorest region.
5.3 Methodology
To investigate how average efficiency and the distribution
of efficiency scores have changed during various stages of
transition, we first calculate farm level total technical
efficiency scores using Data Envelopment Analysis
(DEA) for each country. To measure technical efficiency
requires the specification of a frontier production func-
tion, and the measurement of the deviation or distance of
the farms from the frontier, which is then a measure of
technical inefficiency. The technique of DEA constructs a
convex hull around the observed data (Charnes et al.
1978). As in Fare et al. (1985), we assume that production
is characterized by a non-parametric piecewise-linear
technology, so that simple linear programming techniques
can be used to calculate efficiency. We further assume
strong disposability of outputs and inputs and estimate the
non-parametric deterministic frontier, expressed in terms
of minimizing input requirements. Input-oriented techni-
cal efficiency for each farm i (i = 1, 2, …, N) can be
calculated by solving the following linear programming
problem:
minz;k
k
s:t: zY � yi; zX� kxi; z� 0
where k is the efficiency measure, Y is the 1 9 N vector of
observed outputs, yi is the output of farm i, X is the matrix
J Prod Anal (2010) 33:241–258 251
123
of observed inputs, xi is a vector of inputs employed by
farm i and z is a vector of intensities that characterizes each
farm. A farm displays total technical efficiency if it pro-
duces on the boundary of the production possibility set, i.e.
it maximizes output with given inputs and after having
chosen technology. This boundary or frontier is defined as
the best practice observed.
The data used in the DEA calculations are similar for all
countries and include gross output, expressed in local
currency, and data on land, labor, capital and other variable
inputs. Output is the value of physical production valued at
fixed prices. These fixed prices are calculated based on the
price information in the survey. Labor is expressed in
annual working units which correspond to 2,150 labor
hours or the number of hours that a full-time worker can
perform in 1 year. Land is the total amount of agricultural
land cultivated. To take into account quality differences in
land, the area cultivated is multiplied by a land quality
indicator. The value of estimated farm buildings and
agricultural machinery is used as a proxy for capital. Fur-
ther, we also take into account the amount of money spent
on the purchase of seeds, feed, grains, roughage, concen-
trated feed, fertilizers, energy and services. Different
frontiers are assumed for each country.
When calculating efficiency scores using a multi-coun-
try frontier, we expressed output in Euro’s using 2003 as
base year8 and took only two inputs (land and labor) into
account. Quality differences could not be accounted for as
different indicators were applicable across the different
countries. The value of farm buildings and agricultural
machinery as well as the amount spent on variable inputs
could also not be included when calculating the efficiency
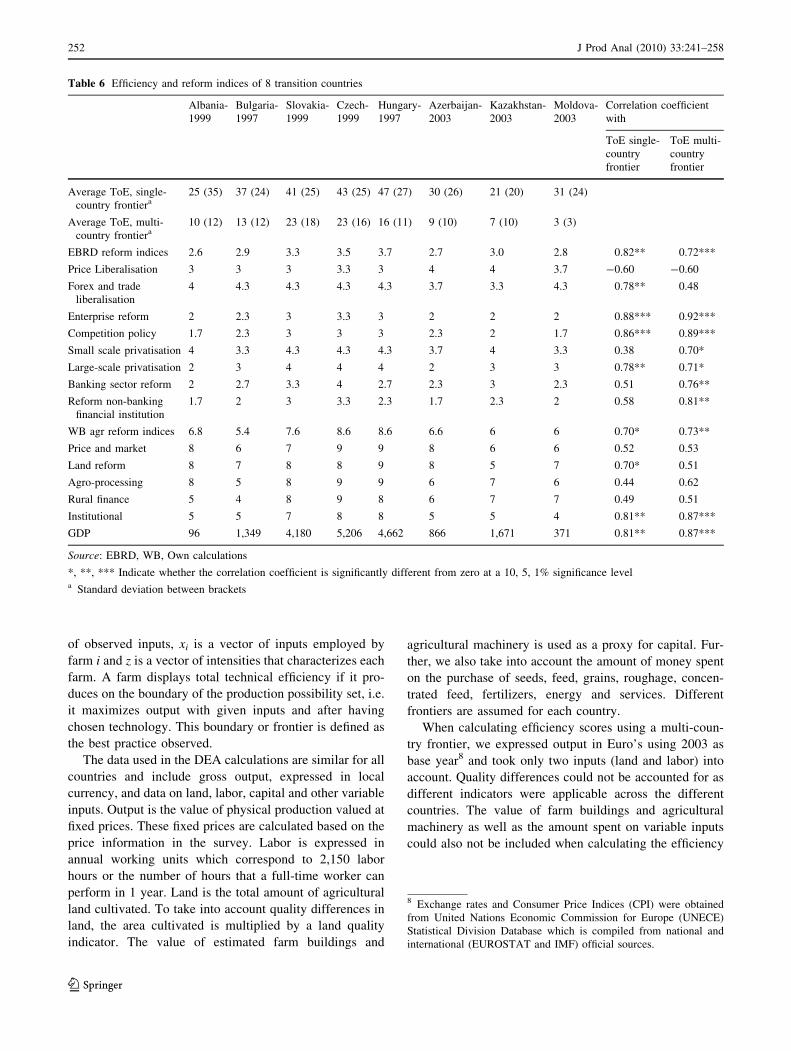
Table 6 Efficiency and reform indices of 8 transition countries
Albania-
1999
Bulgaria-
1997
Slovakia-
1999
Czech-
1999
Hungary-
1997
Azerbaijan-
2003
Kazakhstan-
2003
Moldova-
2003
Correlation coefficient
with
ToE single-
country
frontier
ToE multi-
country
frontier
Average ToE, single-
country frontiera25 (35) 37 (24) 41 (25) 43 (25) 47 (27) 30 (26) 21 (20) 31 (24)
Average ToE, multi-
country frontiera10 (12) 13 (12) 23 (18) 23 (16) 16 (11) 9 (10) 7 (10) 3 (3)
EBRD reform indices 2.6 2.9 3.3 3.5 3.7 2.7 3.0 2.8 0.82** 0.72***
Price Liberalisation 3 3 3 3.3 3 4 4 3.7 -0.60 -0.60
Forex and trade
liberalisation
4 4.3 4.3 4.3 4.3 3.7 3.3 4.3 0.78** 0.48
Enterprise reform 2 2.3 3 3.3 3 2 2 2 0.88*** 0.92***
Competition policy 1.7 2.3 3 3 3 2.3 2 1.7 0.86*** 0.89***
Small scale privatisation 4 3.3 4.3 4.3 4.3 3.7 4 3.3 0.38 0.70*
Large-scale privatisation 2 3 4 4 4 2 3 3 0.78** 0.71*
Banking sector reform 2 2.7 3.3 4 2.7 2.3 3 2.3 0.51 0.76**
Reform non-banking
financial institution
1.7 2 3 3.3 2.3 1.7 2.3 2 0.58 0.81**
WB agr reform indices 6.8 5.4 7.6 8.6 8.6 6.6 6 6 0.70* 0.73**
Price and market 8 6 7 9 9 8 6 6 0.52 0.53
Land reform 8 7 8 8 9 8 5 7 0.70* 0.51
Agro-processing 8 5 8 9 9 6 7 6 0.44 0.62
Rural finance 5 4 8 9 8 6 7 7 0.49 0.51
Institutional 5 5 7 8 8 5 5 4 0.81** 0.87***
GDP 96 1,349 4,180 5,206 4,662 866 1,671 371 0.81** 0.87***
Source: EBRD, WB, Own calculations
*, **, *** Indicate whether the correlation coefficient is significantly different from zero at a 10, 5, 1% significance levela Standard deviation between brackets
8 Exchange rates and Consumer Price Indices (CPI) were obtained
from United Nations Economic Commission for Europe (UNECE)
Statistical Division Database which is compiled from national and
international (EUROSTAT and IMF) official sources.
252 J Prod Anal (2010) 33:241–258
123

scores using a multi-country frontier as the list of items
within these categories differed among countries.
5.4 Results of efficiency calculations
The DEA calculations yield efficiency scores for all the
farms which can then be used to calculate an efficiency
distribution for all the countries. Based on the efficiency
distribution for each country, we estimate a kernel density
function. We can calculate the average total technical
efficiency for each country assuming these density func-
tions (see the first line of Table 6).
The DEA calculations show that there are large differ-
ences in efficiency distribution between the countries. In
Kazakhstan, for example most farmers (80%) have an
efficiency score lower than 30 and only a very small share
(2%) of the farmers are achieve an efficiency score close to
100. On the other hand, we observe that in Hungary most
farmers have an efficiency score between 40 and 70 and
9% have an efficiency score between 90 and 100.
The differences in efficiency distribution between
countries are also reflected in the average efficiency scores
(Table 6). The highest average efficiency is in Hungary in
1997 with 47, which means that, on average, farms obtain
47% of the maximum efficiency possible. In Hungary, most
farmers have an efficiency score between 40 and 70 and
9% have an efficiency score between 90 and 100. Also
Slovakia and the Czech Republic do relatively well, with
higher averages than 40. The poorest efficiency indicators
are for Kazakhstan (21), and Albania (25).
The efficiency scores which are calculated using a multi-
country frontier (see the second line of Table 6) are gen-
erally consistent with the previous conclusions. The aver-
age efficiency score of Czech, Slovakian and Hungarian
farmers are higher than those of the Bulgarian farmers and
much higher than those of the Albanian, Azeri, Kazak and
Moldovan farmers—all measured for their respective sur-
vey years.
5.5 Reforms and efficiency
To see whether these estimated differences in country-level
efficiency are related to reforms which have been imple-
mented we compare the efficiency indicators of the coun-
tries with indicators of reforms, from the World Bank and
the European Bank for Reconstruction and Development
(EBRD).9 While one should be careful to draw conclusions
from such cross-comparisons with these data, and in par-
ticular in linking them with country-level indicators, the
correlation estimates in Table 6 and further comparisons
suggest that a country which is further advanced in reform
implementation and in the transition stage has more farms
that can be found on the boundary of the production pos-
sibility set and that the farms reach on average a higher
efficiency level. There is a positive correlation between the
progress of reforms implemented in a country and the
average efficiency level reached by the agricultural pro-
ducers. In countries which are less advanced in the tran-
sition process, there are relatively more inefficient
production units. In countries more advanced in transition,
there are relatively fewer efficient farms.
These observations are in line with our conceptual
arguments in Sect. 2 and the data in the other sections
where productivity growth started first and was strongest in
countries which were most advanced in the implementation
of reforms. Other studies, such as Lerman (2008), also
conclude that agricultural growth and performance are
positively linked with various measures of policy reforms.
While the correlations between the aggregate reform
indicators suggest an important causal affect, the indicators
as such tell us little about the mechanism. Therefore, let us
take a closer look at the correlations between efficiency
scores and the various reform indices. The first observation
is that there is a closer correlation with the EBRD index (a
non-agricultural index) than with the WB agricultural
reform index. This suggests that the key factor may not be
specific to agriculture. One important factor is that all these
surveys were done in countries, and at times, when farms
used private land plots and faced hard budget constraints.
Hence, in these situations, other factors, such as access to
input and output markets are likely to become the prime
determinants of efficiency.
Second, if we disentangle the reform indices and cor-
relate them with the observed efficiency scores (Table 6),
we see that there is significant correlation between effi-
ciency and competition policy, enterprise reform, and
institutional reforms. Again these correlations indicate the
importance of general institutional reforms and reforms of
the sectors ‘‘surrounding agriculture’’ as a source of effi-
ciency growth. In general, good competition policy to
reduce abuse of market power is beneficial for the
9 The World Bank agricultural reform index is an aggregate index of
progress in land reform, price and market liberalization, reforms in
the agro-processing sector and rural finance and of the institutional
reforms. A score of one means no reform, i.e. a situation comparable
with a centrally planned economy. The maximum score that a country
can reach is 10 which means the market reforms have been completed
Footnote 9 continued
and the situation is a free market economy. The EBRD transition
indicator gives a score from 1 to 4. It aggregates assessments of the
privatization of small- and large scale enterprises, enterprise
restructuring, price liberalization, trade and foreign exchange system
liberalization, competition policy, bank and non-bank financial sector
reforms. A rate of 4? is given when standards and performance are
comparable with those of advanced industrial economies. The general
EBRD indicator is the average of the score given to the reforms in
each area.
J Prod Anal (2010) 33:241–258 253
123
performance of an industry. However, in agriculture there
is little market power. Therefore, maybe most important
though is its indirect impact on agricultural producers. It
may have an important impact on firms up- and down-
stream such as agribusiness and food processors. Domi-
nation of large companies in the in- or output markets will
strongly affect farms. Enterprise reforms which contributed
to significant and sustained harder budget constraints and
to promoting corporate governance (e.g. through privati-
sation combined with tight credit and subsidy policies and/
or enforcement of bankruptcy legislation) may also cause
higher efficiency of the farms. Remarkably Table 6 indi-
cates that there is no significant correlation with price and
market reforms, but much more with institutional reform.
Elsewhere (in Swinnen and Vranken 2005), we have
developed a theoretical model to provide some hypotheses
to explain these correlations, and to identify the mecha-
nisms through which general institutional reforms and
factor market imperfections in labor and capital can be the
prime determinants of farm efficiency change during
transition. According to our model, as transition progresses
two developments occur (simultaneously or not) which are
likely to cause an increase in average agricultural pro-
ductivity. The first mechanism is through the labor market.
Labor opportunity costs increase either due to improved
off-farm employment or with improved governments’ fis-
cal situations leading to improved social benefits (unem-
ployment benefits and pensions).10 If returns to labor
outside agriculture relative to the returns to agricultural
labor are higher (lower) for efficient than inefficient pro-
ducers, the most efficient (inefficient) producers might be
inclined to leave agriculture. This results in a narrowing of
the gap between the least and most efficient producers. The
second factor is that other rural factor markets improve,
because of a reduction in transaction costs or improvement
in institutions (or both), which leads to a reduction in
capital costs and improved access to credit, technology and
quality inputs. As a result, more farmers are able to invest
and to increase their efficiency level. The combination of
both factors causes a reduction in the bulk of less efficient
farms and an increase in the group of (rather) efficient
farmers. Simulations based on our theoretical model are
consistent with the empirically observed changes in effi-
ciency distributions during transition.
In combination, these findings lend support to the
hypotheses that farm productivity increases are strongly
constrained by factor market imperfections, including labor
market imperfections, and limited opportunities for off-
farm employment. Farm productivity is strongly correlated
with general institutional reforms and reforms of the sec-
tors ‘‘surrounding agriculture’’.
6 Technology, resource endowments, and the nature
of productivity gains
In our conceptual framework in Sect. 2 we have outlined
that one should expect a complex relationship between
resource endowments, technological change and produc-
tivity change. The evidence on productivity changes that
we present in the rest of this paper indicates that there
exists indeed a link between technology, policy and pro-
ductivity changes. In terms of policy effects, our evidence
is indeed consistent with the hypotheses that substantial
progress in reforms is required for productivity growth to
occur. That said, the productivity impact of specific policy
reforms differs among countries.
For example, although gains in productivity have come
both from property rights reforms and organizational
restructuring, the relative importance of each component
differs between countries reflecting technology and policy
differences. In countries with labor-intensive technologies
(such as Albania) the shift from large-scale collective
farming to small-scale individual farming caused dramatic
gains in technical efficiency with relatively small losses in
scale efficiency. In capital and land intensive regions (such
as Czech Republic and Slovakia), gains in labor produc-
tivity, if any, came primarily from large farms shedding
labor with privatization of the farms (see Table 7 for an
overview of the labor intensities at the start of transition).
These different sources of productivity gains are not
coincidental. Technology and a region’s resource endow-
ments have an important impact on the relative efficiency
of different farm organizations, and thus on the incentives
for farm restructuring. As we already indicated in Sect. 2,
technology affects both the costs and benefits of the shift to
individual farming. An important factor in the optimal
scale of farming is transaction costs in labor management.
Large operations in agriculture face transaction costs
because of principal agent problems and monitoring costs
in labor contracting, which are typically large in agriculture
(Pollak 1985). Hence, individual farming will improve
labor effort and a farmer’s control over farm activities and
this will lead to efficiency gains. However, the importance
of these efficiency gains vary with specialization and
technology (Allen and Lueck 1998). Since the greatest
improvement in efficiency from farm individualization is
attributable to rising effort from better incentives, the
benefits will be relatively greater for systems in which
labor plays a greater role.
10 Empirical evidence suggests that changes in the relative wages and
in access to unemployment benefits or pensions has a significant
impact on labor use in agriculture during transition (Dries and
Swinnen 2002; Swinnen et al. 2005).
254 J Prod Anal (2010) 33:241–258
123
However, there are also costs that are incurred when
collective or corporate farms are broken up into individual
farms. In many cases there are two major types of costs. First,
there is one set of costs that could arise due to the loss in scale
economies. As in the case of the incentive effects, the impact
on scale economies will be sensitive to the nature of the
technology. The economy of scale losses may be consider-
able in the case of capital intensive production systems,
systems in which we would expect economies of scale to be
relatively significant since there are many fixed expenses and
many large assets used in farming activities. In countries in
which farming is labor intensive and few capital inputs are
used, however, such losses could be minimal.
Second, there also may be costs associated with disor-
ganization that will occur with the restructuring of farms.
The costs will arise from the mismatch that can occur
between the farm’s needs for inputs, services and equip-
ment and the infrastructure that has been set up to provide
those inputs and services. Initially designed for large scale
farming, the inputs and services that the nation’s agricul-
tural input supply chain are set up to provide are not always
suitable for individual farms. Hence, newly formed indi-
vidual farms may require an entirely different set of inputs,
services and equipment. The disorganization and econo-
mies of scale costs could be high (initially) if such inputs,
services, and equipment play an important role in the local
farming systems. Again, this is affected by technology.
These disruption costs are more likely to be lower in labor
intensive systems than in more advanced, integrated and
capital-intensive agricultural systems.
The importance of technology (resource intensity) in the
growth of individual farming is illustrated empirically by
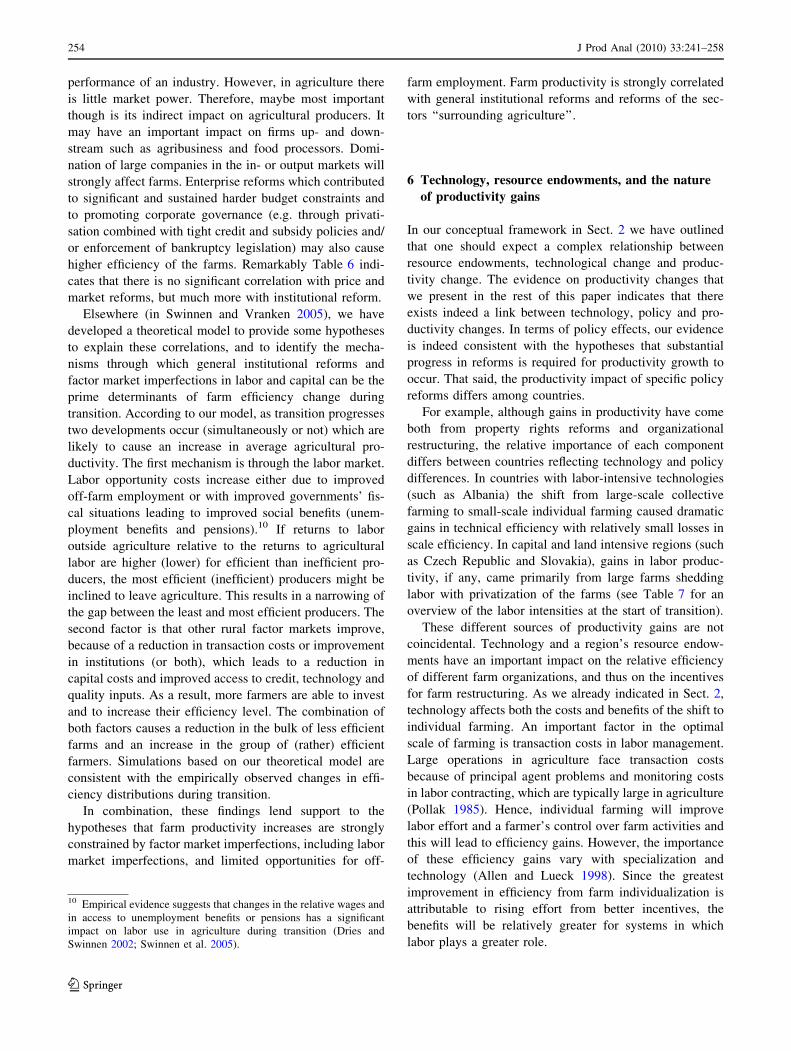
Table 7 Selected initial
condition indicators and land
reform procedure in ECA
Source: Macours and Swinnen
(2002) and Swinnen and
Rozelle (2006)a Pre-reform indicators are
from 1989 for the Central
Europe and the Balkans, from
1990 for Asia, Transcaucasus
and the Baltics
Initial conditionsa Land reform
procedureShare of agriculture
in empl (%)
Labor/land
(person/ha)
Agricultural land
in ind. farms
Central Asia
Mongolia 32.7 0.002 0 Distribution
Kazakhstan 22.6 0.008 0 Distribution
Kyrgyzstan 32.6 0.054 4 Distribution
Tajikistan 43.0 0.185 4 Distribution
Turkmenistan 41.8 0.015 2 Distribution
Uzbekistan 39.2 0.109 5 Distribution
Transcaucasus
Armenia 17.4 0.218 7 Distribution
Azerbaijan 30.7 0.203 2 Distribution
Georgia 25.2 0.217 12 Distribution
European CIS
Belarus 19.1 0.105 7 Distribution
Moldova 32.5 0.269 7 Distribution
Russia 12.9 0.044 2 Distribution
Ukraine 19.5 0.118 6 Distribution
Baltics
Estonia 12.0 0.072 4 Restitution
Latvia 15.5 0.085 4 Restitution
Lithuania 18.6 0.098 9 Restitution
Central Europe
Czech 9.9 0.122 1 Restitution
Hungary 17.9 0.131 13 Restit ? distr ? voucher
Poland 26.4 0.258 76 –
Slovakia 12.2 0.139 2 Restitution
Balkans
Albania 49.4 0.627 3 Distribution
Bulgaria 18.1 0.132 14 Restitution
Romania 28.2 0.204 14 Restitution ? distr.
Slovenia 11.8 0.116 83 –
J Prod Anal (2010) 33:241–258 255
123
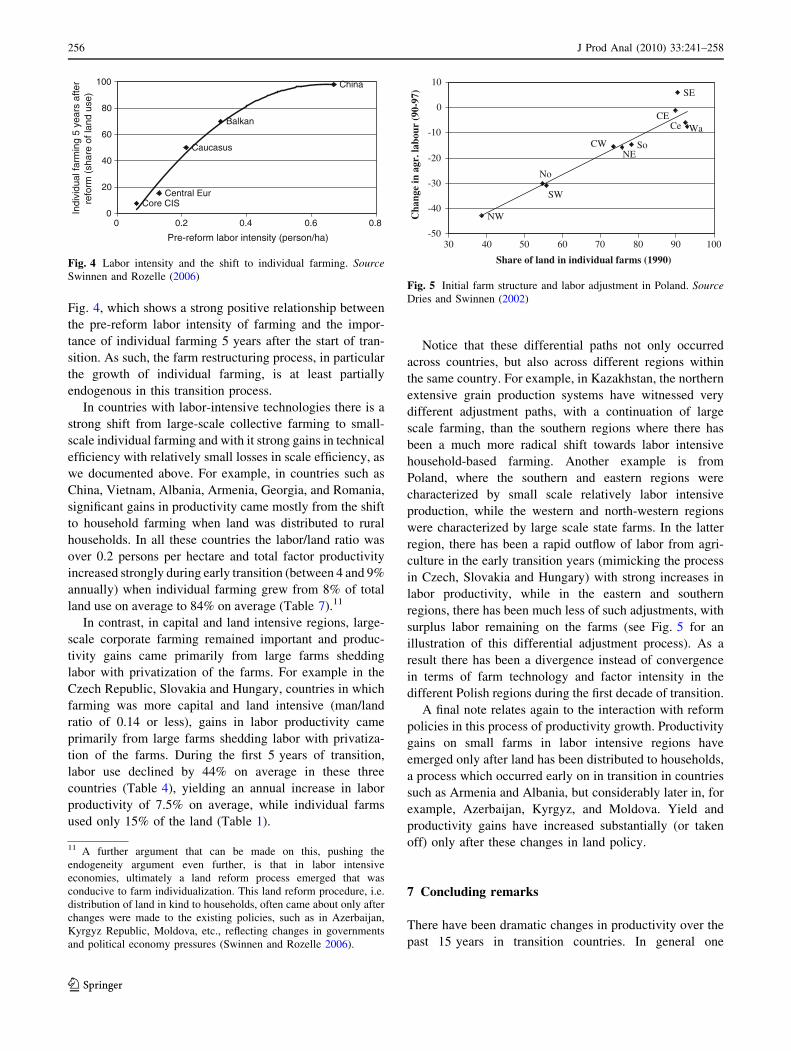
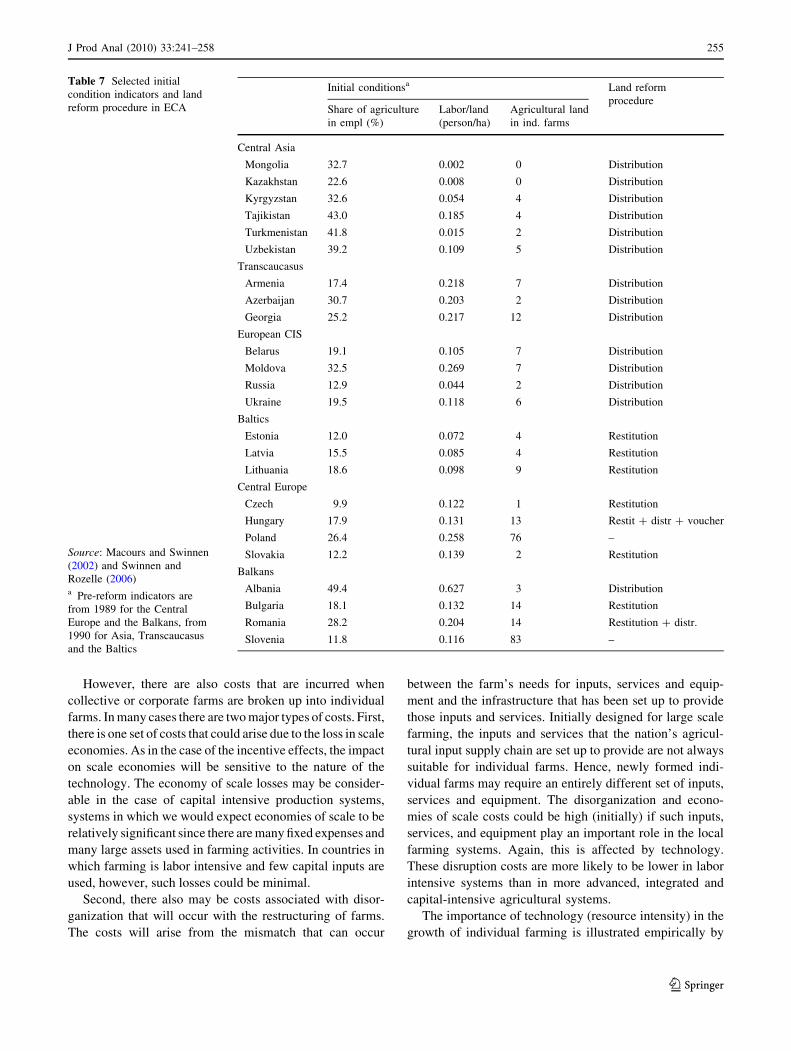
Fig. 4, which shows a strong positive relationship between
the pre-reform labor intensity of farming and the impor-
tance of individual farming 5 years after the start of tran-
sition. As such, the farm restructuring process, in particular
the growth of individual farming, is at least partially
endogenous in this transition process.
In countries with labor-intensive technologies there is a
strong shift from large-scale collective farming to small-
scale individual farming and with it strong gains in technical
efficiency with relatively small losses in scale efficiency, as
we documented above. For example, in countries such as
China, Vietnam, Albania, Armenia, Georgia, and Romania,
significant gains in productivity came mostly from the shift
to household farming when land was distributed to rural
households. In all these countries the labor/land ratio was
over 0.2 persons per hectare and total factor productivity
increased strongly during early transition (between 4 and 9%
annually) when individual farming grew from 8% of total
land use on average to 84% on average (Table 7).11
In contrast, in capital and land intensive regions, large-
scale corporate farming remained important and produc-
tivity gains came primarily from large farms shedding
labor with privatization of the farms. For example in the
Czech Republic, Slovakia and Hungary, countries in which
farming was more capital and land intensive (man/land
ratio of 0.14 or less), gains in labor productivity came
primarily from large farms shedding labor with privatiza-
tion of the farms. During the first 5 years of transition,
labor use declined by 44% on average in these three
countries (Table 4), yielding an annual increase in labor
productivity of 7.5% on average, while individual farms
used only 15% of the land (Table 1).
Notice that these differential paths not only occurred
across countries, but also across different regions within
the same country. For example, in Kazakhstan, the northern
extensive grain production systems have witnessed very
different adjustment paths, with a continuation of large
scale farming, than the southern regions where there has
been a much more radical shift towards labor intensive
household-based farming. Another example is from
Poland, where the southern and eastern regions were
characterized by small scale relatively labor intensive
production, while the western and north-western regions
were characterized by large scale state farms. In the latter
region, there has been a rapid outflow of labor from agri-
culture in the early transition years (mimicking the process
in Czech, Slovakia and Hungary) with strong increases in
labor productivity, while in the eastern and southern
regions, there has been much less of such adjustments, with
surplus labor remaining on the farms (see Fig. 5 for an
illustration of this differential adjustment process). As a
result there has been a divergence instead of convergence
in terms of farm technology and factor intensity in the
different Polish regions during the first decade of transition.
A final note relates again to the interaction with reform
policies in this process of productivity growth. Productivity
gains on small farms in labor intensive regions have
emerged only after land has been distributed to households,
a process which occurred early on in transition in countries
such as Armenia and Albania, but considerably later in, for
example, Azerbaijan, Kyrgyz, and Moldova. Yield and
productivity gains have increased substantially (or taken
off) only after these changes in land policy.
7 Concluding remarks
There have been dramatic changes in productivity over the
past 15 years in transition countries. In general one
Balkan
Caucasus
Central EurCore CIS
China
0
20
40
60
80
100
0.40 0.2 0.6 0.8
Pre-reform labor intensity (person/ha)
Indi
vidu
al fa
rmin
g 5
year
s af
ter
refo
rm (
shar
e of
land
use
)
Fig. 4 Labor intensity and the shift to individual farming. SourceSwinnen and Rozelle (2006)
NW
No
SW
NECW So
Ce WaCE
SE
-50
-40
-30
-20
-10
0
10
30 40 50 60 70 80 90 100
Share of land in individual farms (1990)
Cha
nge
in a
gr. l
abou
r (9
0-97
)
Fig. 5 Initial farm structure and labor adjustment in Poland. SourceDries and Swinnen (2002)
11 A further argument that can be made on this, pushing the
endogeneity argument even further, is that in labor intensive
economies, ultimately a land reform process emerged that was
conducive to farm individualization. This land reform procedure, i.e.
distribution of land in kind to households, often came about only after
changes were made to the existing policies, such as in Azerbaijan,
Kyrgyz Republic, Moldova, etc., reflecting changes in governments
and political economy pressures (Swinnen and Rozelle 2006).
256 J Prod Anal (2010) 33:241–258
123
observes a J-shaped (or U-shaped) effect: an initial decline
in productivity and a recovery later on. Virtually all
countries witnessed an initial decline in productivity, and
virtually all countries currently witness an increase in
productivity, and in several transition countries the growth
in productivity over the past 5 years is quite spectacular.
However, the depth and length of the initial decline
differs enormously between countries. Our analysis suggest
that the productivity changes were related to the extent of
the pre-reform distortions and the reform implementation
in the countries. In the most advanced reformers (mostly in
Central Europe) the decline was relatively mild and
recovery started fairly early on, and productivity growth, in
particular labor productivity, has been strong for more than
a decade. In the Baltics, recovery started relatively quickly,
reflecting the fast pace of the reforms, but the initial fall in
productivity was much deeper than in Central Europe,
possibly reflecting the larger pre-reform distortions as these
countries were part of the FSU. In many of the CIS
countries, the decline of productivity was much more
dramatic (around 25% in several countries) and lasted for
much of the 1990s. It was only after the Russian crisis that
a recovery started, and although hesitant at first, produc-
tivity increases are strong, certainly for yields.
However, early recovery and growth was not limited to
the richer Central European countries. Remarkably, a
country such as Albania has recorded strong productivity
growth continuously since the start of the land and farm
reforms in 1992. The combination of immediate Chinese-
style land reform giving land rights to rural households in a
very labor intensive production system and widespread
migration with remittances which have provided access to
finance for the remaining farm population have allowed
productivity growth to start early and continue since.12
It is clear that policies have played a very important role
in this process. Those that have implemented the necessary
reforms early on, such as the Central European countries,
have started to witness productivity growth earlier. How-
ever it is also clear that initial conditions mattered. The
institutional and human capital hurdles to create a market
economy were larger in the countries further east and
therefore it is no surprise that the transition productivity
declines have been deeper and longer.
What is remarkable is that the nature of productivity
gains has differed starkly between countries, and even
between countries fairly close in other aspects of develop-
ment and reforms. In countries such as Hungary, Czech
Republic and Slovakia, there has been very strong labor
productivity growth from the outset of transition. In these
countries, large private farming companies have survived
and have laid off many workers, thereby driving labor
productivity to grow. This is very different from the reforms
in, for example, Poland, another Central European country.
There, such process only took place in the North and the
Western parts of the country with the privatization of the
large state farms. In other parts where small farms domi-
nated, there was no reduction of labor for the most part of
the 1990s and productivity gains have been more limited.
The productivity growth in labor intensive countries
such as Albania, Azerbaijan, etc has not come from laying
off workers, since in many cases, there has not been a
significant outflow of labor from agriculture, at least not in
the first decade of transition. Initially it came from land
reforms, providing better incentives for labor governance
in labor intensive agricultural systems. Once this one-off
productivity shock from land reform (which typically
needs to come through the distribution of physical plots of
land to rural households) is ‘‘consumed’’ it is crucial to
focus on other sources of productivity growth.
More recent growth in productivity has come from a
combination of improved options for employment outside
of agriculture (either in other sectors or through migration),
from improvements in social payments (pensions and
unemployment benefits) allowing subsistence farmers to
leave agriculture, and from improved access to factor and
output markets. The latter has come about through general
reforms which have stimulated investments in the food
industry (including the inflow of foreign investment) which
brought new technology and capital into the agrifood
chains, and a more stable general investment climate
leading to off-farm employment creation.
Further the improvement of competitiveness with the
ruble devaluation and of the fiscal situation in Russia and
some of the other energy and mineral exporting with
increasing international prices have led to higher demand,
more timely payments, higher farm profits, etc, all of which
have improved the financial situation of the farms and
thereby their opportunities to use better inputs and to invest
in new technology in these countries, and to less disrup-
tions in the exchanges between farms and the up- and
downstream companies. All these factors have contributed
to increased productivity.
Acknowledgments The authors thank Anneleen Vandeplas for
research assistance and Azeta Cungu for comments and providing
access to data and estimation procedures. The views in this paper are
those of the authors and not necessarily reflect those of organizations
they are associated with or those that funded the research.
References
Allen DW, Lueck D (1998) The nature of the farm. J Law Econ
41:343–386
12 See Cungu and Swinnen (1998) on the special character of the
Albanian reform process.
J Prod Anal (2010) 33:241–258 257
123
Arnade C, Gopinath M (1998) Capital adjustment in US agriculture
and food processing: a cross-sectoral model. J Agric Resour
Econ 23(1):85–98
Bofinger P (1993) The output decline in Central and Eastern Europe:
a classical explanation. CEPR discussion paper, London
Brada JC (1989) Technical progress and factor utilization in eastern
european economic growth. Economica 56:433–448
Charnes A, Cooper WW, Rhodes E (1978) Measuring the Efficiency
of Decision Making Units. Eur J Oper Res 2:429–444
Cungu A, Swinnen J (2003) Transition and total factor productivity in
agriculture 1992–1999. PRG working paper
Dries L, Swinnen J (2002) Institutional reform and labor reallocation
during transition: theory and evidence from polish agriculture.
World Dev 30(3):457–474
Dries L, Swinnen J (2004) Foreign direct investment, vertical
integration and local suppliers: evidence from the polish dairy
sector. World Dev 32(9):1525–1544
Dudwick N, Fock K, Sedik D (2005) A stock-taking of land reform
and farm restructuring in Bulgaria, Moldova, Azerbaijan and
Kazakhstan. World Bank report
FAO (1986) Inter-country comparisons of agricultural production
aggregates. FAO Economic and Social Development paper no.
61, Rome
Fare R, Grosskopf S, Lovell C (1985) The measurement of efficiency
in production. Kluwer, Boston
Gow H, Swinnen J (1998) Up- and downstream restructuring, foreign
direct investment, and hold-up problems in agricultural transi-
tion. Eur Rev Agric Econ 25(3):331–350
Hyami Y, Ruttan VW (1970) Factor Prices and technical change in
agricultural development: The United States and Japan, 1880–
1960. J Polit Econ 78(5):1115–1141
Hyami Y, Ruttan VW (1985) Agricultural development: an interna-
tional perspective. Johns Hopkins University Press, Baltimore,
MD
International Labour Organization (ILO) (1997–2002) Yearbook on
labour statistics. ILO, Geneva
Jackman, R (1994) Economic policy and employment in the transition
economies of Central and Eastern Europe: what have we
learned? Int Labour Rev 133(3):327–345
Koppel B (1995) Induced innovation theory and international
agricultural development: a reassessment. Johns Hopkins Uni-
versity Press, Baltimore, MD
Lerman Z (2008) Agricultural recovery in the former Soviet Union:
an overview of 15 years of land reform and farm restructuring.
Post-Communist Econ 20(4):391–412
Lerman Z, Csaki C, Feder G (2004) Agriculture in transition: land
policies and evolving farm structures in post-Soviet Countries.
Lexington Books, Lanham, MD
Liefert M, Gardner B, Serova E (2003) Allocative efficiency in
Russian agriculture: the case of fertilizer and grain. Am J Agric
Econ 85(5):1228–1233
Macours K, Swinnen J (2000a) Causes of output decline during
transition: the case of Central and Eastern European agriculture.
J Comp Econ 28:172–206
Macours K, Swinnen J (2000b) Impact of initial conditions and
reform policies on agricultural performance in Central and
Eastern Europe, the former Soviet Union, and East Asia. Am J
Agric Econ 82(5):1149–1155
Macours K, Swinnen J (2002) Patterns of Agrarian Transition. Econ
Dev Cult Change 50(2):365–395
Mathijs E, Swinnen J (2001) Production efficiency and organization
during transition: an empirical analysis of East German agricul-
ture. Rev Econ Stat 83(1):100–107
Petrick M (2004) Farm investment, credit rationing, and governmen-
tally promoted credit access in Poland: a cross-sectional analysis.
Food Policy 29(3):275–294
Pollak RA (1985) A transaction cost approach to families and
households. J Econ Lit 23(2):581–608
Rozelle S, Swinnen J (2004) Success and failure of reforms: insights
from transition agriculture. J Econ Lit 42(2):405–456
Sedik D, Trueblood M, Arnade C (1999) Corporate farm performance
in Russia, 1991–1995: an efficiency analysis. J Comp Econ
27:514–533
Seeth HT, Chachnov S, Surinov A, von Braun J (1998) Russian
poverty: muddling though economic transition with garden plots.
World Dev 26(9):1611–1623
Swinnen J, Rozelle S (2006) From Marx and Mao to the market. The
economics and politics of agricultural transition. Oxford Uni-
versity Press, Oxford
Swinnen J, Vranken L (2005) Reforms and efficiency changes in
transition agriculture. LICOS discussion paper no. 172
Swinnen J, Dries L, Macours K (2005) Transition and agricultural
labour. Agric Econ 32(1):15–34
258 J Prod Anal (2010) 33:241–258
123
Related Documents