1 Reform and the distribution of income — an economy-wide approach The effects of four microeconomic reforms — tariff reductions, reforms in the electricity and telecommunications industries and increasing the competitive tendering and contracting of government services — on household incomes are modelled. The relationships between these reforms and changes in household incomes and economic structure are estimated in an economy-wide framework. The analysis indicates that the income gains from the reforms modelled are fairly evenly distributed. Households in the middle and upper end of the income distribution gain relatively more than households in the two lowest income groups. The analysis also shows that the effects of reforms can be offsetting. Results show that although a reform may reduce employment in an industry, other reforms can generate offsetting employment gains within that industry. The Industry Commission’s work is aimed at assisting governments determine where and how they can improve the performance of the economy. The Commission has recommended that a broad reform program is required to improve Australia’s economic performance (IC 1996a and PC 1996). However, there is community concern that this program could pursue higher productivity to the detriment of equity. The Commission is conscious of these concerns and is endeavouring to explore more thoroughly the relationships between equity and higher productivity

Welcome message from author
This document is posted to help you gain knowledge. Please leave a comment to let me know what you think about it! Share it to your friends and learn new things together.
Transcript

1
Reform and the distribution ofincome — an economy-wideapproach
The effects of four microeconomic reforms —tariff reductions, reforms in the electricity andtelecommunications industries and increasingthe competitive tendering and contracting ofgovernment services — on household incomesare modelled. The relationships between thesereforms and changes in household incomes andeconomic structure are estimated in aneconomy-wide framework.
The analysis indicates that the income gainsfrom the reforms modelled are fairly evenlydistributed. Households in the middle and upperend of the income distribution gain relativelymore than households in the two lowest incomegroups.
The analysis also shows that the effects ofreforms can be offsetting. Results show thatalthough a reform may reduce employment inan industry, other reforms can generateoffsetting employment gains within thatindustry.
The Industry Commission’s work is aimed at assisting governmentsdetermine where and how they can improve the performance of theeconomy. The Commission has recommended that a broad reform programis required to improve Australia’s economic performance (IC 1996a andPC 1996). However, there is community concern that this program couldpursue higher productivity to the detriment of equity. The Commission isconscious of these concerns and is endeavouring to explore morethoroughly the relationships between equity and higher productivity

2 I N D U S T R Y
C O M M I S S I O N S T A F F
I N F O R M A T I O N P A P E R
through its inquiry program, research activities and conferences such asThe Industry Commission Conference on Equity, Efficiency and Welfare(IC 1996e) held by the Commission in November 1995.
In its research activities, the Commission has recently been developingtwo modelling approaches to examine the distribution of the benefits andcosts of microeconomic reform. Both approaches simulate the effects ofspecific reforms on households. As it is difficult, if not impossible, touncover the effects on households of specific microeconomic reforms byobserving real world outcomes (long) after the event, simulation is themost appropriate way to separate out the effects of reform.
In the companion paper GBE Price Reform — Effects on HouseholdExpenditure (IC 1996d), the effects of price changes (such as electricityprices) on the purchasing power of different households are analysed. Inthis paper, modelling work is used to analyse the effects of a specific setof reforms on the sources of household incomes. Differences in impactsdue to households’ different consumption patterns are not investigatedhere. The two approaches are therefore complementary.
This approach uses the Monash model, an applied general equilibriummodel of the Australian economy (see Adams et al. 1994) and anassociated income distribution model, Monash–ID (see Meagher 1996aand 1996b).
The prime interest is to illustrate the effects on household incomes ofmarket adjustments resulting from a set of microeconomic reforms. Thesereforms cause some industries to expand and others to contract. Differentindustries employ different mixes of occupations. Some industries arecapital intensive and others are labour intensive. Some people receivetheir income from holding equity or other forms of capital, others receivetheir income principally from wages and salaries. This means that reformhas the potential to alter the distribution of income by changing thedistribution of employment between industries and occupations, and bychanging wage and profit levels.
Other research groups, such as the National Centre for Social andEconomic Modelling, have also developed simulation models to study theeffects of policy change on income distribution. The primary foci of thesemodels are the direct effects on individuals, households and families, of

R E F O R M A N D T H E
D I S T R I B U T I O N O F
I N C O M E
3
changes in taxes and government benefits.1 The modelling work reportedin this paper differs from that work in that it attempts to simulate theeffects of structural change on market incomes.
A FRAMEWORK FOR ANALYSING THE EFFECTSOF REFORM ON INCOMES
The framework used to analyse the distributional effects of reformcombines the Monash model and the Monash Income Distribution(Monash–ID) model. Figure 1 gives a schematic representation of thelinkages between the two models. The Monash model describes thedemand and supply side of commodity and factor markets (including thelabour market) of the economy. Microeconomic reform affects firms andhouseholds which in turn affects incomes in the economy through itseffects on factor markets. The advantage of using a general equilibriummodel in the analysis is that it captures the distributional effects of reformthat occur through an extensive range of adjustments in the economy.
Figure 1: Process for calculating the economy wide effects ofreform on income distribution
Direct effects of implementingpolicy reform
Changes in factor incomes
Changes in income of
households by income groups
Monashmodel
Monash-IDmodel
The Monash–ID model uses the changes in factor incomes projected bythe Monash model to estimate the impact of policy changes on thedistribution of incomes across Australian households.2 These incomes
--------------------------------------
1 See for example Paul et al. (1993).2 For the purposes of this paper, households are defined as income units. Monash–
ID uses the following definition which is based on ABS (1990). An income unitis either a nuclear family, or an individual with or without dependent children.Under this definition, an unmarried person aged 15–20 years living with theirparent(s), who is not a full-time student, is a separate income unit. The ABSdistinguishes between the terms ‘household’ and ‘income unit’. In this paper,these terms are used interchangeably.

4 I N D U S T R Y
C O M M I S S I O N S T A F F
I N F O R M A T I O N P A P E R
include wage income, income arising from the ownership ofunincorporated enterprises and property, and unemployment benefits.This paper focuses on changes in incomes of households within differentincome groups. Important assumptions in the Monash and Monash–IDframework are summarised below. Further details on the theoreticalstructure of the Monash–ID model are found in the appendix.
THE MONASH MODEL
The Monash model is the latest in a succession of general equilibriummodels of the Australian economy based on the work of Powell, Dixon,Parmenter, and their colleagues (Dixon et al. 1982). Several features ofthe Monash model distinguish it from its predecessors (Adams et al.1994). One of these distinctions is the model’s capability to trace the timepath of the economy as it adjusts to modelled policy changes. However,this paper uses the model in long-run comparative static mode. This meansthat only the pre-reform economy and the post-reform economy (after alladjustments have taken place) are compared. The time path between thosestates is not modelled.
The Monash model’s core data comes from input–output tables (Dixonand McDonald 1993).3 The input–output core of the Monash model hasbeen updated to 1991–92. As a result, the pre-reform economy is similarto that of 1991–92.
The model incorporates a number of assumptions in relation to markets,consumer behaviour and the technology underlying production:
• firms maximise profits in perfectly competitive markets usingconstant return to scale technology; and
• consumers maximise utility by allocating expenditure on differentcommodities within their budgets, according to relative prices.
In long-run comparative static mode, the model is not time dependent, sofirms are assumed to have enough time to adjust their production plansand capacities to the changed policy environment. Any reductions in
--------------------------------------
3 Input-output tables are essentially a disaggregation of industry activity. Theyreport the inter and intra-industry flows of goods and services involved ineconomic production.
R E F O R M A N D T H E
D I S T R I B U T I O N O F
I N C O M E
5
production costs are assumed to be passed on to users and consumers inthe form of lower prices. Consumers have enough time to alter theirconsumption patterns in response to changing prices and incomes.
In this analysis, the policy and macroeconomic environments aredetermined exogenously. It is assumed that the government adjustsmacroeconomic policies:
• to achieve a balance of trade target; and
• so that investment and private and public consumption change inproportion with aggregate domestic expenditure.
The impact of macroeconomic changes could be modelled, giveninformation on their nature. However, the approach in this paper is toisolate the effect of the reforms analysed from those of other policies bymaking relatively simple assumptions regarding the macroeconomicenvironment.
The main task of the model is to determine changes in the employment offactors of production (labour and capital) by industry and region, andchanges in prices and factor incomes. Most reforms considered here areexpected to increase the productivity of factors of production andreallocate resources to better performing parts of the economy. Thereforms are not expected to affect aggregate employment greatly. Thelevel of unemployment depends on the success of macroeconomic policiesin achieving a real wage level consistent with full employment, given theproductivity of the economy (Vincent 1980).4 Therefore, in this analysis,it is assumed that total employment is not affected by the reforms. Realwage rates are assumed to adjust uniformly across industries andoccupations, in response to changes in labour demand.
The rates of return to capital in different industries are assumed to begiven by world capital markets in the long run. These markets are assumednot to be affected by changes in Australian policies. Changes in the rate ofreturn to capital induced by policy changes are therefore only temporary.Firm investment responds to temporary changes in the rate of return tocapital. Investment increases in industries where the rate of return
--------------------------------------
4 The relevant policy instruments are not modelled. If views are held aboutaggregate employment changes or the shares of macroeconomic aggregates inGDP, they could be incorporated in the simulations.

6 I N D U S T R Y
C O M M I S S I O N S T A F F
I N F O R M A T I O N P A P E R
temporarily exceeds world rates and decreases in industries where rates ofreturn temporarily fall below world rates. Eventually, rates of return tocapital in each industry are equalised to the world rate.
INCOME DISTRIBUTION WITH MONASH–ID
The Monash–ID model, a microsimulation model, is used to analyse theeffects of policy changes on household incomes. Changes in the incomesof factors of production, obtained from the Monash model, are used tosimulate changes in household incomes. Monash–ID uses informationfrom the 1990 Survey of Income, Housing Costs and Amenities (IHS)(ABS 1990). The IHS provides information on the levels and sources ofincomes of households classified by state. Sources of income used byMonash–ID are wage income, income from unincorporated enterprises,property income and government cash benefits. The Monash–ID modelapplies changes obtained from a Monash simulation to the base data fromthe IHS, to estimate the effects of reform on household incomes.
In the Monash–ID model, changes in wage incomes are determined bychanges in the employment status and wage rates of household members.Changes in employment status of household members are determined bychanges in labour demand within 1536 sub-groups defined by a person’soccupation, region of residence, age group and gender.5 These changesare projected using information on employment by industry from theMonash model. Changes in wage rates, estimated by the model, are thesame for all employed persons.
--------------------------------------
5 Not all members of a household are considered to be in the labour force. Onlythe employment status of those members considered in the labour force canchange (see appendix).

R E F O R M A N D T H E
D I S T R I B U T I O N O F
I N C O M E
7
Box 1: Defining income groups
The distribution of income is defined across households. The distribution ofincome (and the composition of the income groups) is determined as follows:
• Assign all persons in the IHS (persons over the age of 15 years) to incomeunits. An income unit is a group within which income is shared (forexample a couple with dependent children).
• Define an equivalence scale for each income unit.6 The equivalence scale isused to adjust the income of the income unit to take account of differencesin need (for example, a single person can achieve a higher level of materialwell-being than a couple on the same income with two children).
• Divide the gross income (with imputed capital income; see footnote 7) ofthe income units by the equivalent adult scale to determine the equivalentincome of the income unit (for example if an income unit consisting of twoadults and two children aged less than 15 has a gross income of $100 000,the equivalent income (the income a single adult requires to achieve thesame level of material well-being) is $40 000 ($100 000 divided by 2.5, theequivalent scale).
• Assign to each adult person in the income unit the equivalent income of theincome unit.
• Weight each adult in the IHS (an observation in the survey) by thepopulation weights provided in the IHS (the weights indicate how manyindividuals an observation represents in the adult population of Australia).This converts the sample of 30 444 observations into a population ofapproximately 13 million representing the adult population of Australia.
--------------------------------------
6 Following Agrawal (1987), income groups are defined on equivalent adultincomes which are derived from gross incomes as follows. The number NE ofequivalent adults in an income unit is expressed as:
NE = 1.0 + 0.7(N1-1) + 0.7N2 + 0.4N3where N1 is the number of adults, N2 is the number of dependant children aged15 to 20, and N3 is the number of dependant children aged less than 15. Alladults in the income unit are then allocated an income equal to their combinedgross incomes in the survey year divided by NE.

8 I N D U S T R Y
C O M M I S S I O N S T A F F
I N F O R M A T I O N P A P E R
• The persons are then ranked in the order of their income level and allocatedto ten groups. The lowest 10 per cent of income earners are allocated to thefirst income group, the next 10 per cent to the second income group, and soon.

R E F O R M A N D T H E
D I S T R I B U T I O N O F
I N C O M E
9
Changes in capital income (income from unincorporated enterprises andproperty income) for each household are determined by the assets ownedby each household and the changes in their rental rates (obtained from theMonash model). Changes in unemployment benefits depend upon changesin the unemployment benefit rate (indexed to changes in consumer prices)and changes in employment status. More details are found in theappendix.
In this paper, the results from the Monash–ID model are presented interms of changes in the incomes of households within different groups ofthe income distribution (see box 1 for the definition of income groups).The groups are based on household incomes before reform.Results arethus interpreted as average changes in the incomes — and sources ofincome — of all households allocated to a group.
THE DISTRIBUTION AND COMPOSITION OF HOUSEHOLDINCOME IN AUSTRALIA
To understand the estimated changes in income by income group, it isnecessary to consider the original distribution of income. Features of thedistribution of income among households in 1989–90 are shown infigure 2.7
Panel A shows two Lorenz curves. The Lorenz curve is the cumulativedistribution of household incomes.8
--------------------------------------
7 In the year of the IHS survey (1989–90), many asset owners reported negativeproperty and unincorporated enterprise income. As a consequence, there is atendency for many asset owners to end up in the lowest groups when theirreported asset incomes are used in the allocation to income groups. To overcomethis problem, earnings from the ownership of assets are adjusted by calculatingsynthetic gross incomes that are used to allocate the individuals to incomegroups. The synthetic estimates are generated by calculating the return on assetswhich income units would have received in 1989–90 if they had the averagereturn on assets in 1989–90. Once the individuals have been allocated to a group,the gross income of each group is calculated based on the asset returns reportedin the IHS for 1989–90.
8 In a Lorenz curve, the 45 degree line represents an equal distribution of income.The shaded areas represent degrees of inequality in the distribution of incomes.For a detailed explanation of Lorenz curves, see Creedy 1996, pp. 162 andonwards. While Lorenz curves could be used to show the impacts of a series ofpolicies, the results obtained are too small to discern the differences.

1 0 I N D U S T R Y
C O M M I S S I O N S T A F F
I N F O R M A T I O N P A P E R
Figure 2: Household income in Australia, 1989–90
Panel A: Lorenz curves: the distribution of market and net incomes
Per cent of households
Per
cen
t of i
ncom
e
0102030405060708090
100
0 10 20 30 40 50 60 70 80 90 100
Net
Market
Panel B: Composition and distribution of household gross income, by incomegroup (per cent of total household income)
0
2
4
6
8
10
12
14
16
18
Lowest 2 3 4 5 6 7 8 9 Highest
Wages Unincorp. Property Gov. Ben. Other
Source: Commission estimates based on Monash–ID
The Lorenz curves represent the distribution of market and net incomes(see glossary). The net income curve lies closest to the diagonal, thusgovernment transfers and income taxes result in a more equal distributionof incomes in Australia.

R E F O R M A N D T H E
D I S T R I B U T I O N O F
I N C O M E
1 1
Panel B shows the sources and distribution of gross incomes forhouseholds within each group of the income distribution.9 Wages andsalaries are the major source of income within all groups, particularly forhouseholds in the middle of the distribution. Any reform that affects wagerates and employment will therefore have a large impact. Property incomeis an important source of income for households in the higher incomegroups.
Government benefits, in particular unemployment benefits, accruing tohouseholds are concentrated in the first two groups of the distribution.Households in these two groups derive 25 and 35 per cent respectively oftheir income from government benefits.
REFORMS CONSIDERED
The four reforms used to illustrate the effects of reform on differenthouseholds are:
• the projected reductions in the levels of tariffs on imports ofmanufactured goods from 1996 to the year 2000;
• reforms currently under way and foreshadowed for the electricityindustry;
• reform of the telecommunications industry; and
• the extension of competitive tendering and contracting (CTC) bygovernments and government business enterprises (GBEs).
The direct effects of these reforms, used as a basis for the simulations, arediscussed below. A more comprehensive review of current and futuretariff policy is available in the Assistance to Agricultural andManufacturing Industries (IC 1995a). For the electricity andtelecommunications reforms, more detail can be found in The Growth andRevenue Implications of Hilmer and Related reforms (IC 1995b). Detailsof the direct effects of increasing CTC in government services can be
--------------------------------------
9 The first income decile has more income than the second income decile becauseof the imputation of capital income. See footnote 7 for a description of theimputation of capital income.

1 2 I N D U S T R Y
C O M M I S S I O N S T A F F
I N F O R M A T I O N P A P E R
found in Competitive Tendering and Contracting by Public SectorAgencies (IC 1996b).10
REDUCTIONS IN TARIFF LEVELS
The structure of protection from foreign competition has been the subjectof continuing reform. In May 1988, tariff reductions to maximum levels of10–15 per cent for most manufacturing industries by 1992 wereannounced (IC 1995a). In March 1991, further tariff reductions to 5 percent by July 1996 for most manufacturing industries were announced, andendorsed in Working Nation (Keating 1994). Special plans exist forassistance in the textile, clothing and footwear (TCF) and passenger motorvehicles (PMV) industries. Under current plans, the PMV industry will beprotected by a 15 per cent tariff and the TCF industry by tariffs of between10 and 25 per cent by 2000.
In addition to domestic initiatives in reducing protection, Australia hasinternational commitments as a member of the World Trade Organisationwhich was formed as a consequence of the Uruguay round of GeneralAgreement on Tariffs and Trade (GATT) negotiations. The Uruguay roundof negotiations produced agreement by member countries to extend thebinding of tariff rates. In many cases however, Australia’s bindings(maximum levels) are above the levels that are already in place inAustralia.
Within the Asia-Pacific Economic Cooperation (APEC) forum, Australiahas agreed to free trade by the year 2010.
The tariff reforms modelled here are the reduction in tariffs on importedmanufactured goods to the year 2000 levels announced in WorkingNation. The major changes in tariffs occur in the PMV and TCF industries.Small tariff changes are modelled for other manufacturing industries.
--------------------------------------
10 Previous general equilibrium analyses of these reforms (IC 1995b and IC 1996b)were conducted using the Orani model of the Australian economy. The analysisin this paper is conducted using the Monash model. Differences between themodels and their databases account for some of the different results. In particular,the financing changes modelled (IC 1995b) cannot be modelled with the Monashmodel in its current state. However, the results obtained from the simulations hereare consistent with the results obtained with the Orani model.

R E F O R M A N D T H E
D I S T R I B U T I O N O F
I N C O M E
1 3
Estimating the gains from trade liberalisation
There are two broad types of gains from reducing tariffs. First there arethe gains from obtaining a more efficient allocation of resources. Second,there are the gains from trade that arise from changes in productiontechnology, changes to market structure and economies of scale. Forexample, with regard to resource allocation, tariffs impose costs onconsumers who pay more for commodities and on firms using protectedgoods as intermediate inputs. Export-oriented firms are also made lesscompetitive from tariffs through exchange rate effects.
Attempts to measure the benefits from past trade liberalisation in Australiahave estimated an increase in Gross Domestic Product (GDP) fromreducing nominal rates of assistance by about 0.5 per cent. Theseestimates do not take into account economies of scale, technologychanges or changes in market structure. Studies in Australia (Horridge1987) and overseas (Harris 1986) have shown that allowing for some ofthese other sources of gains can substantially increase the gains of tariffreform in terms of GDP changes. The estimation of these gains iscontroversial. A recent attempt (EPAC 1996) has shown some progress inestimating the link between productivity gains and tariff reform.
REFORM IN THE ELECTRICITY INDUSTRY
Reforms in the electricity industry aim to facilitate the creation of anelectricity market between New South Wales, the Australian CapitalTerritory, Victoria, Queensland and South Australia. It is envisaged thatthis increases competition among electricity generators. Other reforms aimto increase the commercial focus of electricity distributors. The scope forachieving economic benefits from reform to the electricity industry hasbeen assessed by the Commission (IC 1996c, 1995b, 1991). Reform isexpected to lower the costs of producing electricity through productivitygains and change the relative prices charged to households and businessusers.
The Commission has compared productivity indicators and output pricesof generation plants across different Australian states and betweencountries (IC 1995b). It was concluded that improved capacity utilisationcould result in a 4 per cent improvement in output per unit of capitalinstalled (IC 1995b). Furthermore, international comparisons of labourproductivity indicate that output could be maintained with 50 per cent of

1 4 I N D U S T R Y
C O M M I S S I O N S T A F F
I N F O R M A T I O N P A P E R
the current workforce. The use of best practice methods in constructinggeneration capacity and the move toward cheaper gas fired plants (seetable 1) was also estimated to reduce construction costs of electricitygenerating plants by about 20 per cent.
A large proportion of the expected increase in labour productivity in theelectricity industry has already taken place. In Australia, there was a28.6 per cent increase in labour productivity (measured by sales peremployee) between 1992–93 and 1994–95. This followed a 27 per centincrease in labour productivity between 1990–91 and 1992–93. Smallimprovements in capital productivity are also shown to have taken placeover the same period (SCGTE 1996).
Table 1: Estimated direct effects of reforms affecting theelectricity industry
Productivity improvement per cent
Reduced capital requirements in electricity production 4
Reduced capital requirements in plant construction 20
Reduced labour requirements in electricity production 50
Fuel substitutions
Reduced requirements in black coal 1
Reduced requirements in brown coal 36
Increased requirements in gas 95
Associated price changes
Price reduction for bulk users 26
Price reduction for business users 29
Price change for residential consumers 0
Gas price reduction associated with interconnection 4
Source: IC 1995b
Reform in the gas industry is also expected to affect the way in whichelectricity is produced and the wider energy sector in Australia. Theinterconnection of the state gas markets is expected to reduce the price ofgas by 4 per cent and nearly double its use in the production of electricityat the expense of black coal. A reduction of 1 per cent in the amount ofblack coal and a 36 per cent reduction in the amount of brown coal used inthe fuel mix for electricity is anticipated. In 1994–95, considerablerestructuring of the industry took place, most of which was aimed at
R E F O R M A N D T H E
D I S T R I B U T I O N O F
I N C O M E
1 5
increasing competition between gas suppliers in different states (SCGTE1996). It is expected these reforms result in lower input costs forelectricity generators.
There have also been a number of pricing policy changes associated withreform in electricity supply, including the removal of the cross-subsidyfor residential users and a fall in margins. The price changes modelledestimate net price reductions to business of 29 per cent, 26 per cent tobulk users and no price change for residential consumers.11 Data fromSCGTE (1996) shows that around a third of the expected price falls havealready occurred. Between 1990–91 and 1994–95, the electricity pricespaid by industrial and business users fell by 11 per cent while those paidby residential consumers changed little. The expected direct impacts ofreforms affecting the electricity industry are summarised in table 1.
REFORM IN TELECOMMUNICATIONS
Under the Telecommunications Act 1991, government price controlsrequire Telstra to reduce the real average price of its services annually by5.5 per cent from 1 July 1994. New entrants have been allowed to competewith Telstra in the mobile phone, long distance and local markets. Furthercompetitive pressure is expected after the review of price controls in1997.
Improvements in prices and labour and capital productivity have beenoccurring in this industry. SCGTE (1996) shows that real prices fortelecommunications fell by 21 per cent in the five years since 1990–91.Labour productivity — measured in terms of lines per employee, calls peremployee and revenue per employee — has risen steadily, mainly due tothe 16.5 per cent reduction in Telstra’s workforce. Capital productivity —measured by calls per unit of fixed assets — has risen by around 20 percent in the five years to 1994–95. This is largely due to an increase in thevolume of calls.
Comparisons of productivity undertaken by the Bureau of IndustryEconomics (BIE) indicate that reductions in unit labour and capital--------------------------------------
11 The pulp and paper industry, cement industries and non ferrous metals industriesare considered bulk use industries. Within the electricity industry, transmissioncompanies are also considered to be bulk users of electricity. The electricityindustry is modelled as a bulk supplier to itself.

1 6 I N D U S T R Y
C O M M I S S I O N S T A F F
I N F O R M A T I O N P A P E R
requirements of 45 and 22 per cent respectively may be possible(BIE 1992). These improvements are associated with an expected decreasein the price of telecommunication services in the order of 20 per cent.These improvements in labour and capital productivity and prices wereincorporated in the model.
COMPETITIVE TENDERING AND CONTRACTING OFGOVERNMENT SERVICES
Modelling of the economy-wide impact of CTC in government serviceswas recently undertaken by the Commission in its inquiry into CompetitiveTendering and Contracting by Public Sector Agencies (IC 1996b). Asmany aspects of CTC are subject to a high degree of uncertainty, a rangeof possible effects of CTC was estimated. Alternative assumptions weremade regarding the further use of CTC by all levels of governmentthroughout Australia; the cost reductions possible from CTC; and the mixof productivity improvements and reductions in wages and conditions inachieving the cost reductions. As a result, eight different scenarios wereconsidered, yielding savings of 0.8 to 3.3 per cent of budget and GBEcosts, and giving a range of the possible economy-wide effects.
Across the different scenarios the annual economy-wide gains from CTCwere estimated to be in the range of 0.3 to 1.7 per cent of GDP, with realwages increasing by between 0.2 and 1.3 per cent. Adjustment costs maybe incurred in achieving these economy-wide gains. For example, amongthose industries subject to CTC, the modelling indicated that there couldbe a reduction in full-time equivalent jobs of between 12 500 and 74 700.However, increased employment in other industries compensated for thesereductions and resulted in no net reduction in aggregate employment.12
Estimates of the impact of further CTC in this report are based onprojections which result in reduced costs in government budgets and GBEexpenditures in the order of 3 per cent, based on 1993–94 figures.
--------------------------------------
12 The version of the Orani model used in that exercise allowed for some change inaggregate employment through the participation rate.

R E F O R M A N D T H E
D I S T R I B U T I O N O F
I N C O M E
1 7
AGGREGATE EFFECTS OF THE REFORMS
The reforms considered here affect all parts of the economy. They areillustrative of reforms being undertaken. The results show the impacts ofreform on industries, the structure of the economy and the incomes ofdifferent groups of households. Projections of the changes in economicaggregates due to each reform and their combination are shown intable 2.13
Table 2: Projected macroeconomic impacts of reforms(percentage changes)
Tariff Electricity Telecom. CTCa Total
Real GDP 0.14 1.22 0.61 1.26 3.22
Real consumption 0.13 1.25 0.51 1.25 3.13
Export volume 0.70 0.01 2.24 1.17 4.13
Import volume 0.63 0.16 1.69 1.13 3.61
Real wages 0.28 1.29 1.08 0.51 3.17
a The estimated change in GDP for the CTC reform is lower than that found in IC (1996b)because it excludes the impacts of CTC on the provision of electricity andtelecommunication services. This avoids double-counting as the impact of CTC is part of theelectricity and telecommunications reforms. The estimated impacts are larger than thoseobtained in the report on Hilmer and related reforms (IC 1995b) as the coverage here isbroader than the coverage of the CTC simulations in the earlier report (for details, seeIC 1996b ).
Source: Commission estimates using the Monash model
Improvements in productivity are the main source of the increase in GDPfrom the electricity, telecommunications and CTC reforms. Part of theelectricity reforms involves removal of the cross-subsidy of residentialusers by business. The gains from this part of the reform occur from amore efficient allocation of resources. The gains from tariff reform (as--------------------------------------
13 The reforms modelled are occurring to some degree simultaneously (for example,the changes in the electricity industry modelled have occurred since 1991 and arecontinuing, and the part of tariff reform modelled is that which is projected tooccur between 1996 and 2000). More importantly, the effects of these reformsinvolve some time lags as firms, households and labour markets adapt to the newpolicy environments. The time lags are however not accounted for explicitly.Rather, when assuming that reforms occur simultaneously, it is assumed thatfirms can make the adjustments required in response to the package of reforms.

1 8 I N D U S T R Y
C O M M I S S I O N S T A F F
I N F O R M A T I O N P A P E R
measured by the increase in GDP) also result from a more efficientallocation of resources in the economy.
Each reform increases the demand for labour. As it is assumed that totalemployment is unchanged by each reform, the increase in labour demandincreases real wages.14
INDUSTRY EFFECTS OF THE REFORMS
The impact of these reforms on output and employment within broadindustry sectors is shown in table 3.
Reforms in the electricity and telecommunications sectors are projected toreduce employment in these sectors. This lowers the costs to userindustries, increasing their production and demand for electricity andtelecommunications services. Employment reductions in the publicservices industry due to the increasing use of CTC reflects a more efficientuse of labour in the provision of services. Reducing tariffs on imports ofmanufactured goods increases the competition faced by domesticproducers. As a result, output in relatively highly assisted manufacturingindustries falls. Resources are reallocated to other industries which areprojected to expand (including manufacturing industries, but especiallyprimary industries).
OFFSETTING EFFECTS OF REFORMS
The impact of different reforms on industries can be offsetting. Forexample, in isolation, tariff reductions reduce the output of themanufacturing sector, but simultaneous reform in the telecommunicationsindustry is projected to increase output in this sector.15 The combinationof the four reforms increases output in all sectors, but by differentproportions. The combined reforms cause employment shifts from sectorsexperiencing large improvements in productivity (such as electricity, gas
--------------------------------------
14 An alternative formulation of the model would have allowed for employment toincrease given fixed real wages.
15 It is estimated that telecommunications reform will increase output in thetelecommunications industry. This is expected to increase output in themanufacturing industry as much of the equipment used in telecommunications isproduced in manufacturing.
R E F O R M A N D T H E
D I S T R I B U T I O N O F
I N C O M E
1 9
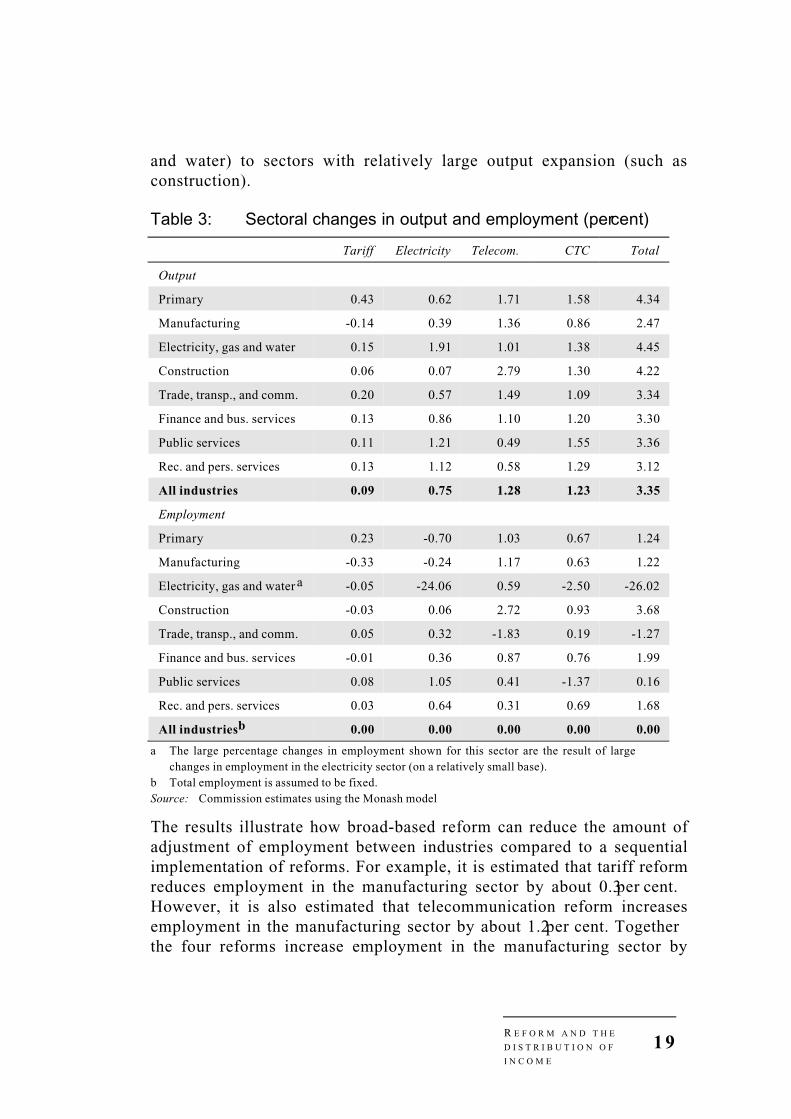
and water) to sectors with relatively large output expansion (such asconstruction).
Table 3: Sectoral changes in output and employment (per cent)
Tariff Electricity Telecom. CTC Total
Output
Primary 0.43 0.62 1.71 1.58 4.34
Manufacturing -0.14 0.39 1.36 0.86 2.47
Electricity, gas and water 0.15 1.91 1.01 1.38 4.45
Construction 0.06 0.07 2.79 1.30 4.22
Trade, transp., and comm. 0.20 0.57 1.49 1.09 3.34
Finance and bus. services 0.13 0.86 1.10 1.20 3.30
Public services 0.11 1.21 0.49 1.55 3.36
Rec. and pers. services 0.13 1.12 0.58 1.29 3.12
All industries 0.09 0.75 1.28 1.23 3.35
Employment
Primary 0.23 -0.70 1.03 0.67 1.24
Manufacturing -0.33 -0.24 1.17 0.63 1.22
Electricity, gas and water a -0.05 -24.06 0.59 -2.50 -26.02
Construction -0.03 0.06 2.72 0.93 3.68
Trade, transp., and comm. 0.05 0.32 -1.83 0.19 -1.27
Finance and bus. services -0.01 0.36 0.87 0.76 1.99
Public services 0.08 1.05 0.41 -1.37 0.16
Rec. and pers. services 0.03 0.64 0.31 0.69 1.68
All industriesb 0.00 0.00 0.00 0.00 0.00
a The large percentage changes in employment shown for this sector are the result of largechanges in employment in the electricity sector (on a relatively small base).
b Total employment is assumed to be fixed.Source: Commission estimates using the Monash model
The results illustrate how broad-based reform can reduce the amount ofadjustment of employment between industries compared to a sequentialimplementation of reforms. For example, it is estimated that tariff reformreduces employment in the manufacturing sector by about 0.3 per cent.However, it is also estimated that telecommunication reform increasesemployment in the manufacturing sector by about 1.2 per cent. Togetherthe four reforms increase employment in the manufacturing sector by
2 0 I N D U S T R Y
C O M M I S S I O N S T A F F
I N F O R M A T I O N P A P E R
about 1.2 per cent. Therefore, implementing the reforms simultaneouslyavoids some of the structural adjustment of employment associated withimplementing them sequentially.
REFORMS AND THE MIX OF OCCUPATIONS
Potentially, the largest contributor to changes in the income of mosthouseholds is a change in employment status. As reforms change thestructure of the economy, the aggregate mix of skills required changes.Demand for those occupations which are used intensively in expandingindustries grows, and demand for those occupations used intensively indeclining industries falls.16
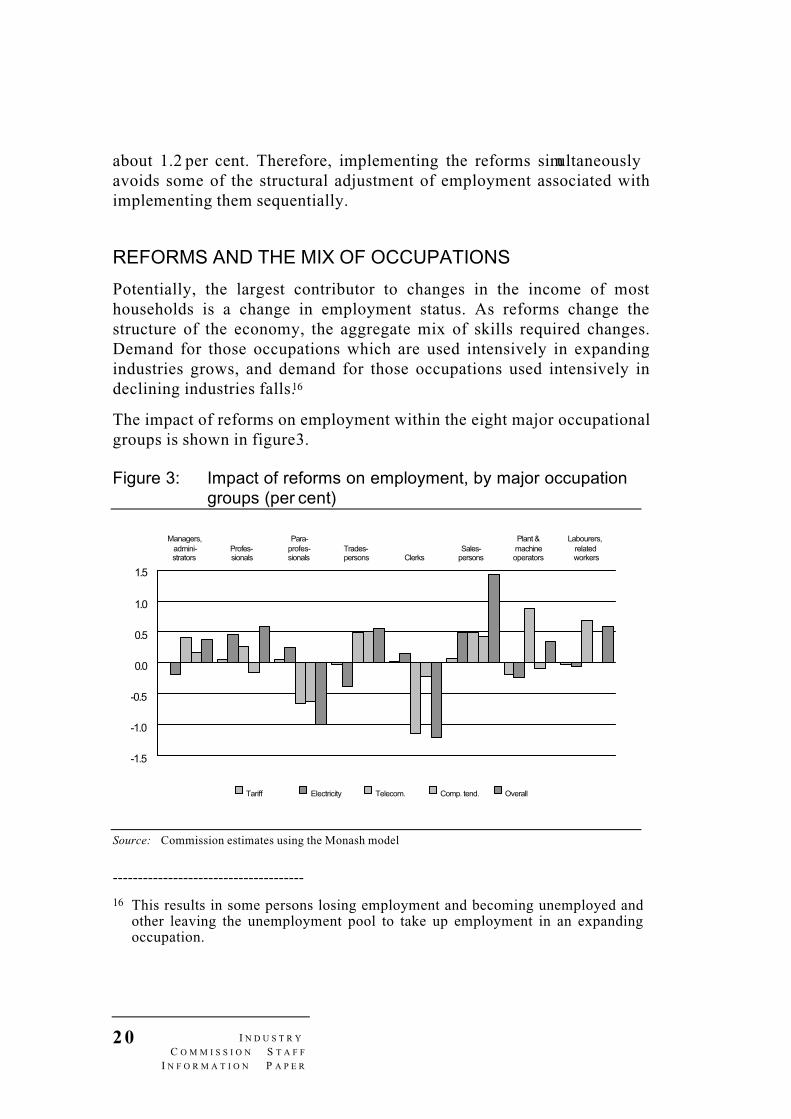
The impact of reforms on employment within the eight major occupationalgroups is shown in figure 3.
Figure 3: Impact of reforms on employment, by major occupationgroups (per cent)
-1.5
-1.0
-0.5
0.0
0.5
1.0
1.5
Managers,admini-strators
Profes-sionals
Para-profes-sionals
Trades-persons Clerks
Sales-persons
Plant &machineoperators
Labourers,relatedworkers
Tariff Electricity Telecom. Comp. tend. Overall
Source: Commission estimates using the Monash model
--------------------------------------
16 This results in some persons losing employment and becoming unemployed andother leaving the unemployment pool to take up employment in an expandingoccupation.

R E F O R M A N D T H E
D I S T R I B U T I O N O F
I N C O M E
2 1
In some occupations, the new job opportunities associated with onereform are offset by a reduction of jobs associated with another reform.For example, telecommunications reform encourages the creation of jobsfor plant and machine operators, and labourers, while these twooccupations experience job losses from electricity reform.17 In othercases, the impact of one reform reinforces the effect of another. Thecombination of the four reforms results in a net creation of positions formanagers, professionals, tradespersons, salespersons, plant and machineoperators, and labourers and a net reduction of positions for para-professionals and clerks.18
CHANGES IN INCOME BY INCOME GROUPS
As shown in figure 4, average household gross income increases within allincome groups as a result of the simulated reforms. This occurs inaggregate and as a result of each reform. This does not imply that incomewithin all households increases. Rather, on average households withineach of the income groups gain.
The estimated increases in income are fairly similar across income groups,ranging from 2.2 to 3.5 per cent of income. On average, the income ofhouseholds increase most (in percentage terms) in the fourth and fifthincome groups. The smallest income gains occur in the first two incomegroups.
The largest income increases arise from telecommunications andelectricity reform. These reforms result in the largest increase in real wagerates. The smallest gains across all income groups come from tariff reform.
--------------------------------------
17 The large percentage increases in the employment of plant and machineoperators, and labourers as a result of telecommunications reform are related tothe expansion of manufacturing (see footnote 15). As a large proportion of plantand machine operators, and labourers are employed in manufacturing, this in turnleads to a large increase in employment in these occupations.
18 The Monash–ID model uses the minor occupation classification (52 occupations)to match supply and demand for specific occupations. Some of the adjustmentsassociated with the heterogeneity of occupations and difficulty in matchingsupply and demand are therefore accounted for.

2 2 I N D U S T R Y
C O M M I S S I O N S T A F F
I N F O R M A T I O N P A P E R
Figure 4: Change in gross income from all reforms, by incomegroupa (per cent)
Panel A: Reform components
0.0
0.5
1.0
1.5
2.0
2.5
3.0
3.5
Lowest 2nd 3rd 4th 5th 6th 7th 8th 9th Highest
Tariff Electricity Telecom. CTC
Panel B: Income components
0.0
0.5
1.0
1.5
2.0
2.5
3.0
3.5
Lowest 2nd 3rd 4th 5th 6th 7th 8th 9th Highest
Wages Unincorp. Property
a In this analysi s households are not reallocated to new groups when their incomes change as aresult of the modelled reforms.
Source: Monash-ID results

R E F O R M A N D T H E
D I S T R I B U T I O N O F
I N C O M E
2 3
As shown in panel B of figure 4, the sources of the increases in householdincomes differ substantially across income groups. For households in thelower income groups, increases in wage income comprise most of theincrease in gross income. Households in higher income groups have morecapital assets. As a result, changes in income from unincorporatedenterprises and property income are relatively more important.
Changes in government benefits are too small to appear in panel B. Theonly portion of these benefits directly affected by reform isunemployment benefits. The changes in unemployment benefits are smallsince they are related to the net changes in employment within an incomegroup.
To understand more about the changes in household income across groupsrequires understanding of the changes in income by each source.
CHANGES IN WAGE AND SALARY INCOME
Wages and salaries are the main contributor to income in all incomegroups. They account for nearly 70 per cent of gross income economy-wide and up to 80 per cent in the third and fourth income groups (figure 2panel B). Changes in real wage income in an income group occur throughchanges in real wage rates and in employment.19
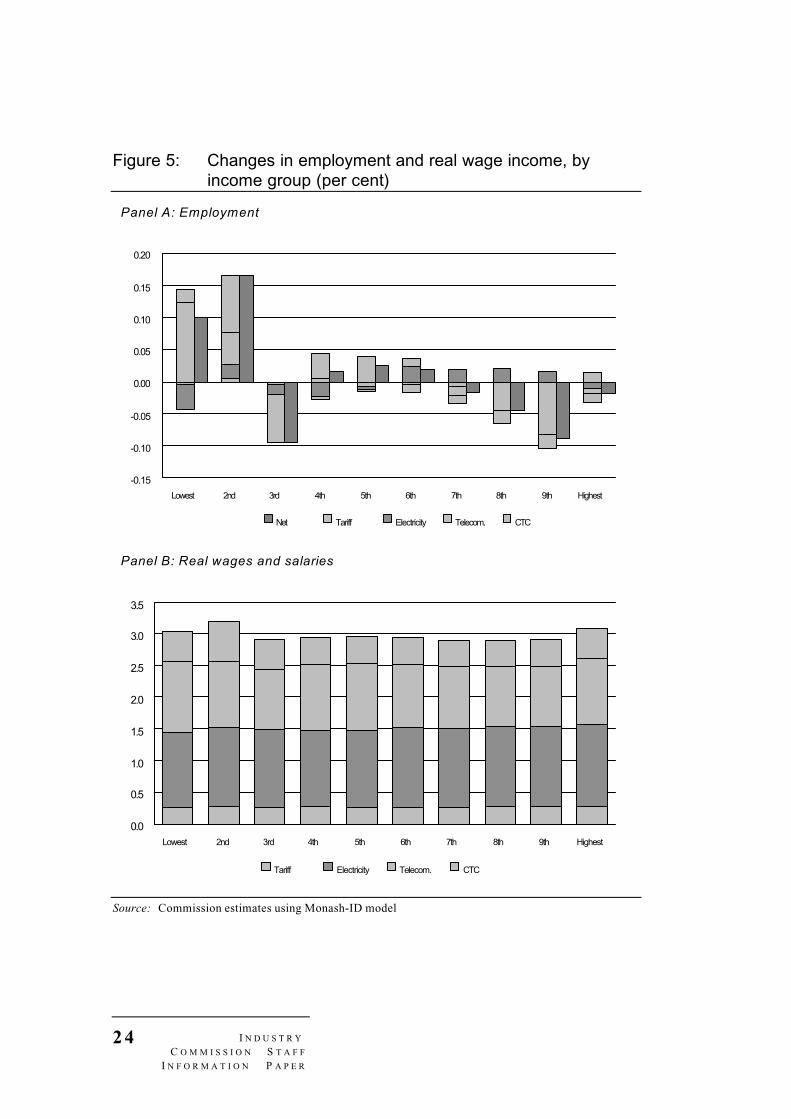
Real wage rates increase by the same proportion for all employed workers.The changes in employment within occupations discussed in the previoussection, translate into the changes in employment within income groups asshown in panel A of figure 5. The changes in employment patternsprojected are determined by the changes in the structure of occupations asa result of the reforms and the initial distribution of workers with theseskills. Figure 5 shows that within income groups the effects of differentreforms on employment can be offsetting. For example, increased CTCreduces employment in the sixth to ninth income groups, whilst electricityreform increases employment in these income groups.
--------------------------------------
19 Aggregate employment is fixed by assumption, but employment within anincome group can change as a result of adjustments in the structure ofemployment. Changes in real wages occur in the same proportions across alloccupations.
2 4 I N D U S T R Y
C O M M I S S I O N S T A F F
I N F O R M A T I O N P A P E R
Figure 5: Changes in employment and real wage income, byincome group (per cent)
Panel A: Employment
-0.15
-0.10
-0.05
0.00
0.05
0.10
0.15
0.20
Lowest 2nd 3rd 4th 5th 6th 7th 8th 9th Highest
Net Tariff Electricity Telecom. CTC
Panel B: Real wages and salaries
0.0
0.5
1.0
1.5
2.0
2.5
3.0
3.5
Lowest 2nd 3rd 4th 5th 6th 7th 8th 9th Highest
Tariff Electricity Telecom. CTC
Source: Commission estimates using Monash-ID model

R E F O R M A N D T H E
D I S T R I B U T I O N O F
I N C O M E
2 5
Overall, implementing the four reforms results in net decreases inemployment in the third and four highest income groups. The largeemployment gains in the lowest two income groups reflect the fact thatsome people who were unemployed before the reforms gainedemployment because they have the skills required by the new industrystructure.
Changes in employment and real wage rates translate into the changes inreal wage and salary income displayed in panel B. The columns representthe estimated percentage changes in real wage and salary incomesassociated with each reform. In general, these changes reflect the changesin real wage rates projected for each reform. The variations betweenincome groups mainly reflect the changes in employment shown inpanel A.
A major determinant in the percentage change in gross income within anincome group is the initial source of income for that group. For example,in the second income group wages and salaries, relative to other incomegroups, comprise a smaller proportion of gross income. Even thoughwages and salaries in that income group increase most in percentage terms(panel B of figure 5) this does not translate to as large a percentageincrease in gross income (panel B of figure 4).
CHANGES IN UNINCORPORATED INCOMES
The effects of reform on unincorporated income are determined by theprofitability of the sector in which assets are employed. Most increases inunincorporated income result from increased income earned in theagricultural, construction, retail, and finance and business services sectors(panel B of figure 4). As shown in panel B of figure 2, unincorporatedincomes are concentrated in the middle and higher income groups wheremost self-employed persons are located in the income distribution.
CHANGES IN PROPERTY INCOME
Property income is composed of net interest on bank and similar accounts,dividends from the ownership of shares, rent received from lettingproperty and an imputed rent to reflect the value derived from ownershipof dwellings by owner-occupiers. It is estimated that the reforms increaseproperty incomes. As property is predominantly owned by higher incomegroups, the gains accrue to households in the highest income group.

2 6 I N D U S T R Y
C O M M I S S I O N S T A F F
I N F O R M A T I O N P A P E R
SUMMARY
The effects of four microeconomic reforms on household incomes aremodelled in an economy-wide framework. Although the models used hereare simplifications of the real world and do not fully reflect all itscomplexities, particularly in the labour market, the results provide insightsinto the relationships between reform and changes in household incomesand economic structure.
It is estimated that the reforms modelled increase incomes, on average, forhouseholds in all income groups. These income gains are fairly evenlydistributed, although households in the middle and higher end of theincome distribution gain relatively more than households in the twolowest income groups.20
The projected changes in industry and occupational structure indicate thatadjustments in the labour market are required. However, implementingreforms on several fronts reduces the amount of adjustment required,compared with implementing reforms one at a time.
--------------------------------------
20 Further investigation is required to identify specific groups in the Australianpopulation (within income groups) which might not gain from the reformsmodelled.

R E F O R M A N D T H E
D I S T R I B U T I O N O F
I N C O M E
2 7

2 8 I N D U S T R Y
C O M M I S S I O N S T A F F
I N F O R M A T I O N P A P E R
Appendix: the Monash–ID Model
The aim of this appendix is to explain the approach used to estimate thechanges in household income (within different income groups) that areprojected as a result of the four reforms analysed. The approach combinestwo models: the Monash applied general equilibrium model,21 and theMonash–ID model. A more detailed discussion of the Monash–ID modelwhich forms the basis of the framework can be found in Meagher (1996aand 1996b). The version of the model used here is simplified as it takes itsinput from the Monash model run in comparative static mode. Therefore,no adjustments are made to take into account changes in the demographiccomposition of the population as may be necessary in dynamicsimulations. This version of the model does not account for regionaleffects either.
The Monash general equilibrium model is used to model the economy-wide effects of each reform. In response to the reforms analysed, themodel provides changes in:
• wage rates;
• employment by industry; and
• capital income.
The Monash–ID model is a microsimulation model. To simulate the effectsof each reform on household incomes the Monash–ID model combines thechanges from the Monash model with details of the sources of income formembers of each household.
By drawing on the solution of a general equilibrium model, the Monash–ID model differs from other microsimulation models used to analyse theeffects of policy changes on household incomes.22 First, it allows theeffects of policies that alter household income through changes in wageincome and capital income to be analysed. Second, it allows the effects ofchanges in the behaviour of firms and households (through commodity--------------------------------------
21 In this paper, the Monash model is run in comparative static mode to betterdistinguish the effects of the reforms modelled from other influences that affectincomes.
22 Such as microsimulation models like STINMOD (see Paul et al. 1993).
R E F O R M A N D T H E
D I S T R I B U T I O N O F
I N C O M E
2 9
and factor markets) in response to policy changes, to be captured in thedistributional analysis.
The remainder of this appendix outlines the detailed data on householdincome used in Monash–ID and how the Monash–ID model modifies thisdetailed data using information from the Monash model to simulate theeffects of reforms on income components.
INCOME DATA FOR INDIVIDUALS
Data on the income sources for the members of each household comesfrom the 1990 Survey of Income, Housing Costs and Amenities (IHS) (seeABS 1990). The IHS contains information on about 30 000 persons ofworking age.23 It includes information on each respondent’s income fromfive broad sources: wages and salaries, income from unincorporatedenterprises, property income, government benefits, and other income. Inaddition to information on income, the IHS contains detailed informationon each respondent’s characteristics (such as age, sex, marital status,family status, labour force status, occupation, residential location andhousing status). A weight is associated with each observation — thenumber of persons that are represented by that observation.
CALCULATION OF THE CHANGES IN INCOMES
The data in the IHS forms the base data of the Monash–ID model. Thechanges in wage rates, employment and returns to capital obtained fromthe Monash model are then used to modify the base data. The differencebetween the base data and the modified data shows how the incomes ofdifferent groups of households are affected by the policy reform.
The way information from the Monash model is used to alter the base datadepends on the source of the income.
--------------------------------------
23 The IHS comprises individuals of 15 years of age or older except dependentstudents. Dependent students are only included if they are 21 years of age orolder.

3 0 I N D U S T R Y
C O M M I S S I O N S T A F F
I N F O R M A T I O N P A P E R
WAGE AND SALARY INCOME
The change in wage income of individuals depends upon their occupation,age and gender. In the form of the Monash–ID model used in this paper,there are eight occupations (see box A), six regions,24 sixteen age groups25
and two genders. Each combination of these characteristics determines anemployment class. In total there are 1536 employment classes. Percentagechanges in wage incomes are estimated for each employment class. Thisestimated percentage change is then applied to each individual within thatclass.
The percentage change in wage income across all individuals within eachclass is equal to the sum of the percentage change in employment in thatclass and the percentage change in the wage rate.
The change in the wage rate is obtained from the Monash model and is thesame for all employment classes.
The percentage change in employment is determined as follows:
• For each class, the number of persons employed, unemployed andnot currently in the labour force are determined from the IHS.
• The change in the demand for labour within each class is estimated.The Monash model projects the change in labour demand for 113industries as a result of reform. In the Monash–ID model, thesechanges are transformed into changes in demand by occupation, ageand gender type using updated versions of the regional employmentmatrices from the 1991 Census. The matrices are updated using the1993–94 Labour Force Survey and information on how theoccupational shares within industries have changed over time.26
--------------------------------------
24 The regions represent the 6 states. Persons living in the ACT are included withthose living in NSW, and persons living in the NT are included with those livingin SA.
25 The age groups are: 15 years, 16 years, 17 years, 18 to 20 years, 21 to 24 years,then five year intervals up to 74 years, and 75 years and over.
26 Although the IHS and Monash–ID results are presented in terms of majoroccupations (8 occupations), this part of the model uses the minor occupationlevel (52 occupations). This allows for a finer match between the supply anddemand for specific occupations than if the major occupation level was used andintroduces some heterogeneity in the classification, making it more difficult tosubstitute persons that may be classified in the same major occupation.

R E F O R M A N D T H E
D I S T R I B U T I O N O F
I N C O M E
3 1
• If it is estimated that labour demand increases, this is met from thosewithin the employment class who are either unemployed or not in thelabour force.27
• If it is estimated that labour demand decreases, employment withinthe employment class falls.
• To determine the change in the numbers unemployed (within anemployment class), it is assumed that the ratio of those unemployedto those not in the labour force remains constant. This means that ifthere is a decrease in employment within an employment class, boththe numbers unemployed and not in the labour force increase.
Box A: Definition of major occupational groups
Major occupation Examples
1. Managers and administrators legislators, managing supervisors, and farmers
2. Professionals scientists, building professionals and engineers,and teachers
3. Para-professionals medical officers and technicians, engineering and building technicians
4. Tradespersons vehicle, machining and electrical trades persons
5. Clerks stenographers, data processing and despatching clerks
6. Salespersons and investment, insurance and real estatepersonal service workers salespersons, tellers, cashiers and ticket salespersons
7. Plant and machine operators, road and rail transport driversand drivers
8. Labourers and related workers trade assistants and factory hands, agricultural labourers and related labourers, cleaners, and construction and mining labourers
Source: ABS Cat. No. 1222.0
--------------------------------------
27 It is possible that the increase in labour demand will exhaust those unemployedand not in the labour force within an employment class. This does not occur inthe exercise reported in this paper. Refer to Meagher (1996b) for details of howany such excess labour demand is met in Monash–ID.

3 2 I N D U S T R Y
C O M M I S S I O N S T A F F
I N F O R M A T I O N P A P E R
INCOME FROM UNINCORPORATED ENTERPRISES
Income from unincorporated enterprises (self-employment income) ofindividuals in the IHS depends upon the quantity of capital in theincorporated enterprises they own and the net rate of profit. The net rate ofprofit depends upon the industry in which the capital is employed.
Reform changes the net rate of profit and quantity of capital employed byindustry. These are obtained from the Monash model.28
One difficulty encountered in this procedure is that fact that the IHSidentifies individuals’ income from unincorporated enterprises, but notthe quantity of capital. The latter was estimated from information onunincorporated income (see Meagher1996a).29
PROPERTY INCOME
Property income comprises interest on bank and similar accounts,dividends, rent received from letting property and imputed rent on owner-occupied housing.
Interest on bank accounts is assumed to be unaffected by the reforms,while dividends are assumed to change in proportion with the economy-wide rate of change of the gross operating surplus (as projected by theMonash model). Changes in imputed rent on owner-occupied dwellingsand landlord rent are more difficult to estimate.
Imputed rent and landlord rent for individuals in the IHS depend upontheir quantity of housing stock and the net profit rate per unit of housingstock.
--------------------------------------
28 As the Monash model does not distinguish between incorporated andunincorporated enterprises, the percentage change in the net rate of profit and thepercentage change in the quantity of capital, is the same for both. The Monashmodel provides data on the percentage changes in the gross operating surplus foreach industry. This is converted into a net profit rate assuming the same rate ofdepreciation, interest rate and debt-equity ratio across all industries.
29 The procedure used by Meagher (1996a) takes account of the fact that althoughindividuals own positive quantities of capital, in the survey, many report negativeincome from unincorporated enterprises.

R E F O R M A N D T H E
D I S T R I B U T I O N O F
I N C O M E
3 3
It is assumed that additions to the housing stock increase incomes ofowners or landlords in proportion with their original holdings. The samechange in net profit rate is applied to all owners or landlords.
As with unincorporated enterprise ownership, the IHS does not provideinformation on the value and outstanding debt on rental properties. As it isnecessary to calculate the change in rental incomes, the value and debtassociated with property is imputed (see Meagher 1996a).
GOVERNMENT BENEFITS
Government benefits are composed of unemployment benefits, othertaxable benefits, non-taxable benefits, and benefits from overseas. Onlyunemployment benefits are affected by the reforms analysed in this paper.
Income from unemployment benefits depends upon the unemploymentbenefits rate and the number of persons unemployed. Changes in theformer are indexed to the national consumer price index. Changes to thelatter depend on changes in the structure of employment (see wage andsalary income).
3 4 I N D U S T R Y
C O M M I S S I O N S T A F F
I N F O R M A T I O N P A P E R
References
ABS (Australian Bureau of Statistics) 1986, Australian StandardClassification of Occupations (ASCO) Statistical Classification, ABSCatalogue No. 1222.0, AGPS, Canberra.
—– 1990, Survey of Income and Housing Costs and Amenities, ABSCatalogue No. 6523.0, AGPS, Canberra.
—– 1993, Australian and New Zealand Standard Industrial Classification1993, ABS Catalogue No. 1292.0, AGPS, Canberra.
Adams, P., Dixon, P., McDonald, D., Meagher, G., and Parmenter, B. 1994,‘Forecasts for the Australian economy using the Monash model’,International Journal of Forecasting, no. 10, pp. 557–571.
Agrawal, N. 1987, Analysing Distributional Issues Using Equivalent AdultDisposable Incomes, IMPACT Project Preliminary Working Paperno. IP–32, University of Melbourne, July.
BIE (Bureau of Industry Economics) 1992, International PerformanceIndicators–Telecommunications, Research Paper 48, AGPS,Canberra.
Creedy, J. 1996, ‘Measuring Income Inequality and Tax Progressivity: AnIntroduction’, in IC (ed.) The Industry Commission Conference onEquity, Efficiency and Welfare, 1995 Conference Proceedings.
Dixon, P. and McDonald, D. 1993, Creating 1990–91 Input–Output Tablesfor Australia by ORANI Simulation, paper presented at the 17thAnnual ANZRSA Conference, Armadale.
Dixon, P., Parmenter, B., Sutton, J., and Vincent, D. 1982, ORANI: aMultisectoral Model of the Australian Economy, North-Holland,Amsterdam.
EPAC (Economic Planning Advisory Council) 1996, Tariff Reform andEconomic Growth, Commission Paper No. 10, AGPS, Canberra.
R E F O R M A N D T H E
D I S T R I B U T I O N O F
I N C O M E
3 5
Harris, R. G. 1986, ‘Market Structure and Trade Liberalization: A GeneralEquilibrium Assessment’, Srinivasan, T. N., and Whalley, J., eds.General Equilibrium Trade Policy Modelling, Cambridge, Mass., andLondon: MIT Press, pp. 231–50.
Horridge, M. 1987, Increasing Returns to Scale and the Long Run Effectsof a Tariff Reform, IMPACT Working Paper OP-62, IMPACTProject, Melbourne.
IC (Industry Commission) 1991, Energy Generation and Distribution,Report no. 11, AGPS, Canberra.
—–1995a, Assistance to Agricultural and Manufacturing Industries,Information Paper, AGPS, Canberra.
—–1995b, The Growth and Revenue Implications of Hilmer and RelatedReforms, A Report by the Industry Commission to the Council ofAustralian Governments, Final Report, AGPS, Canberra.
—–1996a, Annual Report 1995–96, AGPS, Canberra.
—–1996b, Competitive Tendering and Contracting by Public ServiceAgencies, Report no. 48, AGPS, Canberra.
—–1996c, The Electricity Industry in South Australia, AGPS, Canberra.
—–1996d, GBE Price Reform — Effects on Household Expenditure,Industry Commission Staff Information Paper, Melbourne.
—–1996e, The Industry Commission Conference on Equity, Efficiency andWelfare, 1995 Conference Proceedings 1–2 November 1995, AGPS,Canberra.
Keating, P. (Prime Minister of Australia) 1994, Working Nation: Policiesand Programs, AGPS, Canberra.
Meagher, G. 1996a, ‘Forecasting Changes in the Distribution of Income:an Applied General Equilibrium Approach’ in Harding, A., ed.Microsimulation and public policy, North-Holland, Amsterdam.
—– 1996b, Monash–ID: an Income Distribution Model for use with theMONASH Model of the Australian Economy, CoPS/IMPACTWorking Paper, Melbourne.

3 6 I N D U S T R Y
C O M M I S S I O N S T A F F
I N F O R M A T I O N P A P E R
Paul, S., Percival, R., Cox, D. and Lambert, S. 1993, STINMOD User Guide— Release/94A (Beta), National Centre for Social and EconomicModelling, Faculty of Management, University of Canberra,December.
PC (Productivity Commission) 1996, Stocktake of Progress inMicroeconomic Reform, AGPS, Canberra.
SCGTE (Steering Committee on National Performance Monitoring ofGovernment Trading Enterprises) 1996, Government TradingEnterprises Performance Indicators 1990–91 to 1994–95, AGPS,Canberra.
Vincent, D. 1980, Some Implications for the Australian Economy of TradeGrowth with Newly Industrialising Asia: the Use and Limitations ofthe Orani framework, Preliminary Working Paper No. OP–26,IMPACT Project, Melbourne.
Related Documents