1 Refining, Transportation & Marketing (RTM), and Petrochemicals

Refining transportation &_marketing_(rtm)_and_petrochemicals
Aug 20, 2015
Welcome message from author
This document is posted to help you gain knowledge. Please leave a comment to let me know what you think about it! Share it to your friends and learn new things together.
Transcript

1
Refining, Transportation & Marketing (RTM), and Petrochemicals

2
This presentation may contain forward-looking statements. Such statements reflect only the expectations of the Company's management regarding the future conditions of the economy, the industry, the performance and financial results of the Company, among other factors. Such terms as "anticipate", "believe", "expect", "forecast", "intend", "plan", "project", "seek", "should", along with similar expressions, are used to identify such statements. These predictions evidently involve risks and uncertainties, whether foreseen or not by the Company. Consequently, these statements do not represent assurance of future results of the Company. Therefore, the Company's future results of operations may differ from current expectations, and readers must not base their expectations solely on the information presented herein. The Company is not obliged to update the presentation and forward-looking statements in light of new information or future developments. Amounts informed for the year 2011 and upcoming years are either estimates or targets.
The United States Securities and Exchange Commission permits oil and gas companies, in their filings with the SEC, to disclose proved reserves that a company has demonstrated by actual production or conclusive formation tests to be economically and legally viable under existing economic and operating conditions. We use certain terms in this presentation, such as discoveries, that the SEC’s guidelines strictly prohibit us from including in filings with the SEC.
Cautionary statement for U.S. investors:
DISCLAIMER
3
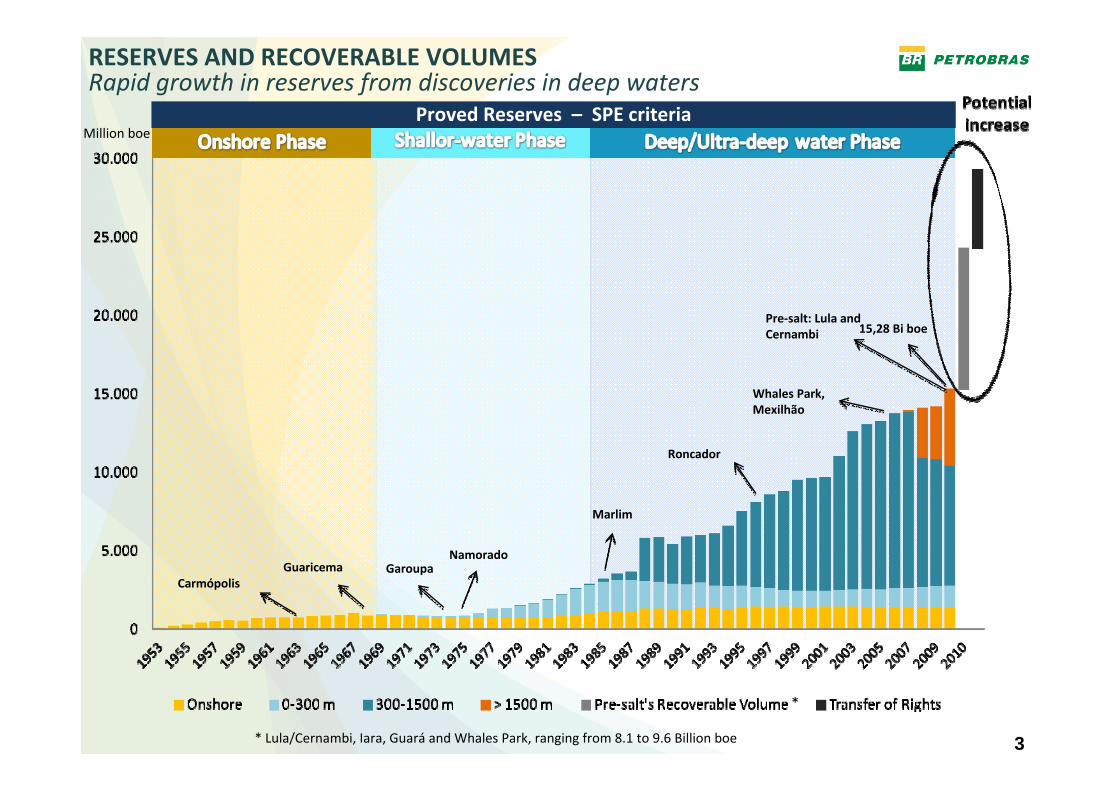
Million boeProved Reserves – SPE criteria
* Lula/Cernambi, Iara, Guará and Whales Park, ranging from 8.1 to 9.6 Billion boe
*
GaroupaNamorado
Marlim
Roncador
Whales Park, Mexilhão
Pre‐salt: Lula andCernambi 15,28 Bi boe
CarmópolisGuaricema
RESERVES AND RECOVERABLE VOLUMESRapid growth in reserves from discoveries in deep waters
4
23
Return rate (%)
Key Assumptions:
•Refinery with trains of 300 k bpd
•Refining scheme with HCC, Coking and HDT
•Refining costs in line with the current refineries that has the same scale
• Integrated Analysis
•Production for the domestic market
•Does not include tax benefits in the operation of the asset
Case 3 ‐ Capex US$ 50.000/bpd
Case 1 – Capex US$ 30.000/bpd
Case 2 – Capex US$ 40.000/bpd
ProfitabilityNew refining projects have return rate above the cost of capital
Margin
US$/bblExpected Scenario
0
2
4
6
8
10
12
14
16
18
13 14 15 16 17 18 19 20 21 22 23
8
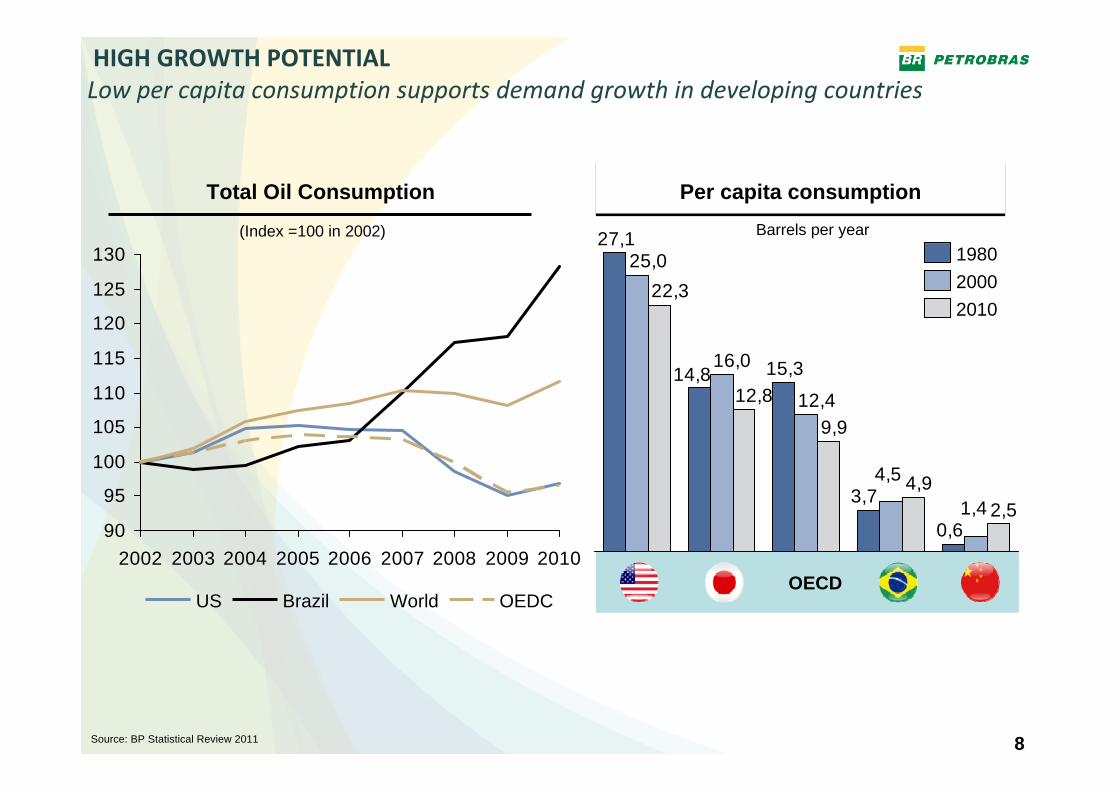
0,6
3,7
15,314,8
27,1
1,4
4,5
12,4
16,0
25,0
2,54,9
9,9
12,8
22,3201020001980
90
95
100
105
110
115
120
125
130
2002 2003 2004 2005 2006 2007 2008 2009 2010
OEDCWorldBrazilUS
Source: BP Statistical Review 2011
OECD
Total Oil Consumption Per capita consumptionPer capita consumptionBarrels per year(Index =100 in 2002)
HIGH GROWTH POTENTIALLow per capita consumption supports demand growth in developing countries
8
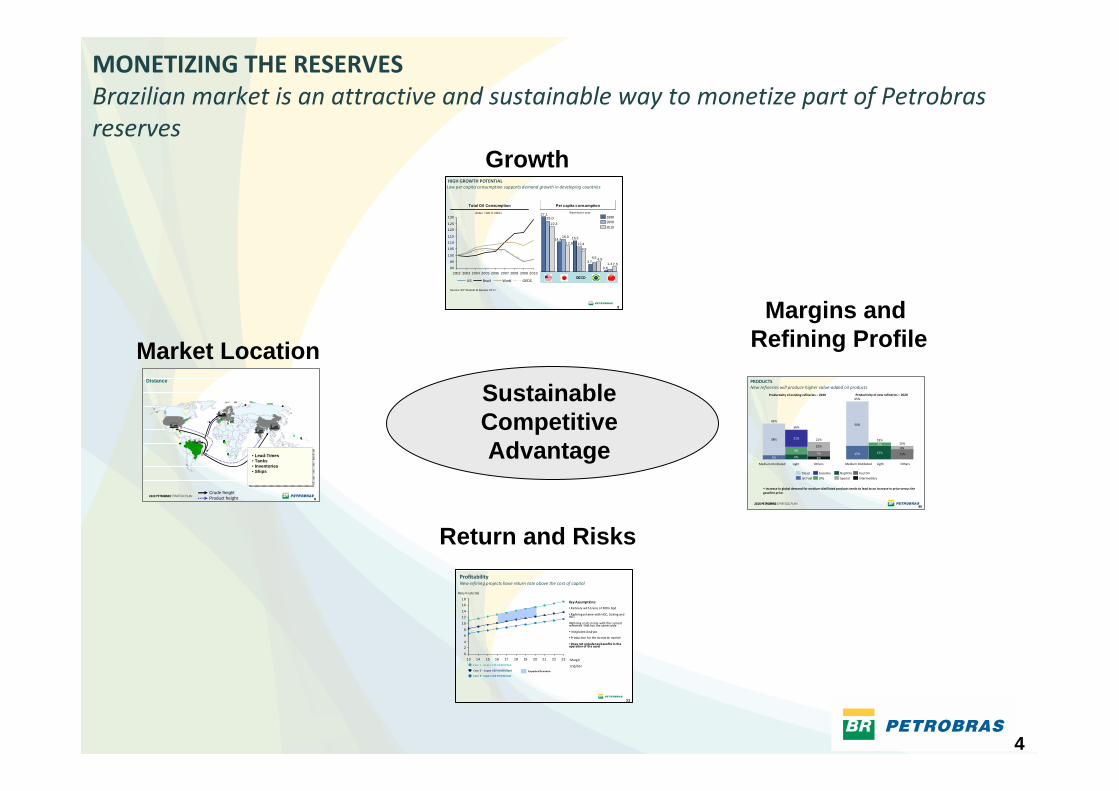
Distance
Crude freightProduct freight
• Lead-Times• Tanks• Inventories• Ships
Market Location
Growth
40
21%
4%7%
10%
Light
36%
6%
9%
21%
Medium Distillated
43%
5%
38%
Others
Fuel Oil
Special
Naphtha
LPG
Gasoline
Jet Fuel
Diesel
Intermediary
4%
15%
19%
4%
11%
15%
65%
15%
50%
Productivity of existing refineries – 2020
LightMedium Distillated Others
Productivity of new refineries – 2020
• Increase in global demand for medium‐distillated products tends to lead to an increase in price versus the gasoline price.
PRODUCTSNew refineries will produce higher value‐added oil products
Margins and Refining Profile
MONETIZING THE RESERVESBrazilian market is an attractive and sustainable way to monetize part of Petrobras reserves
Sustainable Competitive Advantage
Return and Risks

5
Growth Potential

6
Trucks Maritime and OthersTrains
81%
46%
43%
43%
37%
25%
25%
13%
17%
11%
11%8%
50%
32%
Brazil
China
USA
53% 4%
43%
Australia
Canada
Russia
58%
TRANSPORT MATRIX (Cargo)The Brazilian transportation matrix strongly depends on trucks
4.000
5.000
6.000
7.000
8.000
9.000
10.000
jan 10jan 09jan 08jan 07
+12%a.a.
jan 12jan 11
Number of passengers carried ‐ Air Transportation in Brazil (thousand)
JET FUEL MARKET
MIDDLE DISTILLATE DEMAND EVOLUTIONExpectations of strong middle distillate growth
90
100
110
120
130140
150
160
170
180
+52%
1Q10
1Q09
1Q08
1Q07
1Q06
1Q05
1Q04
1Q03
1Q02
1Q01
1Q00
Agriculture GDPGDP
GDP and AGRICULTURE GDP IN BRAZIL
‐4‐20
2468
1012
09080706050403020100 11*10
Historical GDP
Historical Demand
GDP AND OIL DEMAND GROWTH IN BRAZIL (%)
Source: ANAC
Sources: Plano Nacional de Logística e Transportes 2010 (PNLT)
* 2011 GDP as of september; Demand growth in 2011 correspond to Petrobras sales growth.
7
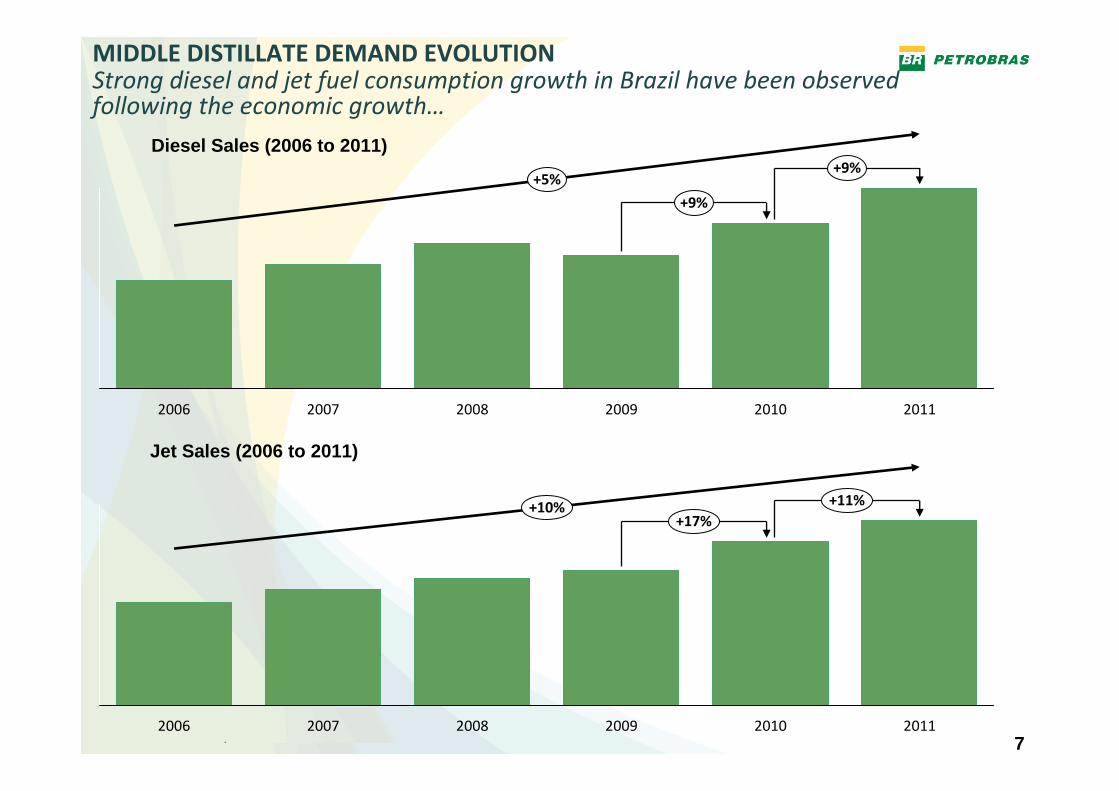
+5%+9%
+9%
201120102009200820072006
+10% +11%+17%
201120102009200820072006
Jet Sales (2006 to 2011)
Diesel Sales (2006 to 2011)
MIDDLE DISTILLATE DEMAND EVOLUTIONStrong diesel and jet fuel consumption growth in Brazil have been observed following the economic growth…
8
0,6
3,7
15,314,8
27,1
1,4
4,5
12,4
16,0
25,0
2,54,9
9,9
12,8
22,3201020001980
90
95
100
105
110
115
120
125
130
2002 2003 2004 2005 2006 2007 2008 2009 2010
OEDCWorldBrazilUS
Source: BP Statistical Review 2011
OECD
Total Oil Consumption Per capita consumptionPer capita consumptionBarrels per year(Index =100 in 2002)
HIGH GROWTH POTENTIALLow per capita consumption supports demand growth in developing countries

9-20
-10
0
10
20
1990 1992 1994 1996 1998 2000 2002 2004 2006 2008 2010
DOWNSTREAM EXPANSIONReduced dependence on imports of oil products
Notes: 1. Source: IEA – 2010 World Energy Statistics 2. Without considering Capacity Expansion 3. Source: EPE, considers LPG, Naphta, Gasoline, Diesel, Jet and Fuel Oil.
389
299
152
197
148118
201120102009200820072006
40
2422
2116
11
108
53
Brazil (2020)Indonesia
MexicoSpainJapanChina
GermanyFrance
Brazil (2010)USA
Net Imports as a percentage of total demand (%)’000 bpd
Increase in import levels will lead to higherlogistical costs...
... and to high levels of exposure to international supply
Brazilian net Imports as a percentage of total demand (%)
1
2
3

10
Demand 2001-2010 Demand 2010-2015
3,1%763
579
1,4% 1.384
1.224
4,9% 968
763
1.6753,9%
1.384
REGIONAL GROWTHIn the last decade the growth has been higher in the North, Northeast and Mid‐west regions of Brazil…
11
Market in 2015Market in 2010
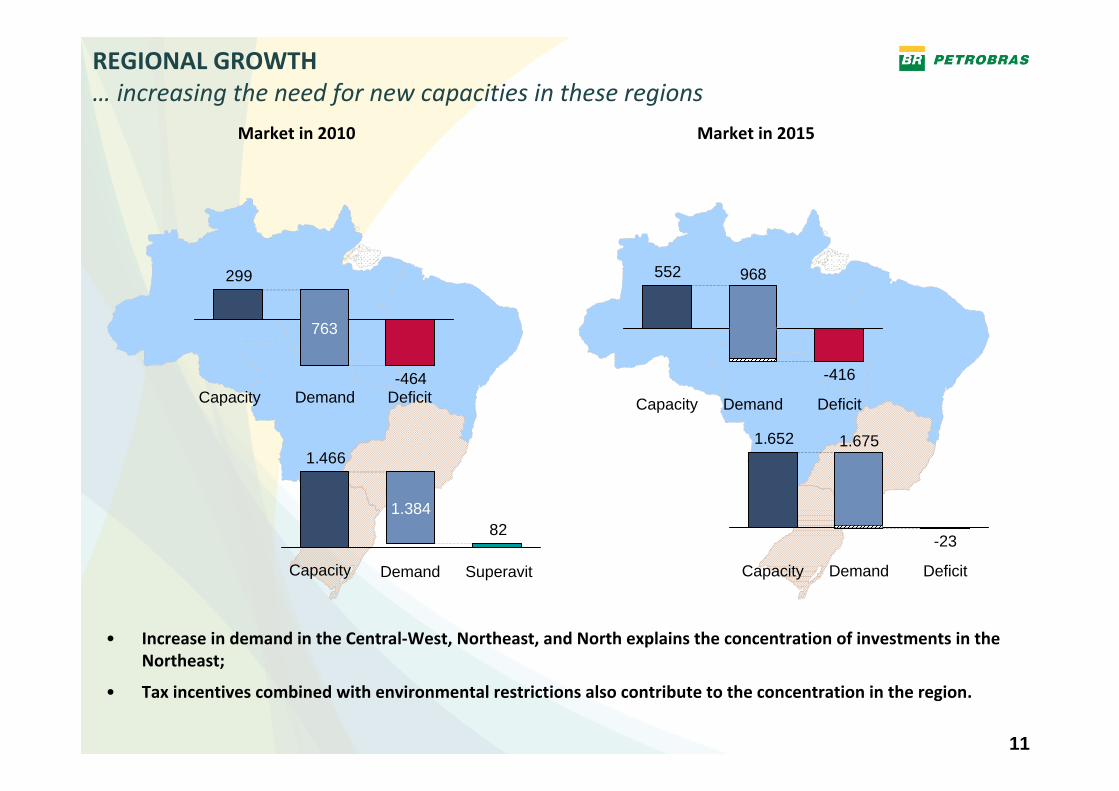
REGIONAL GROWTH… increasing the need for new capacities in these regions
• Increase in demand in the Central‐West, Northeast, and North explains the concentration of investments in the Northeast;
• Tax incentives combined with environmental restrictions also contribute to the concentration in the region.
552
Deficit
-416
Demand
968
Capacity
1.652
Deficit
-23
Demand
1.675
Capacity
299
-464
763
82
1.466
1.384
DeficitDemandCapacity
SuperavitDemandCapacity

12
INTEGRATION AND BALANCEConstruction of new refineries intended to meet Brazilian demand
• No new refineries built since 1980
Abreu e LimaRefinery (RNE)230,000 bpd
(2013)
COMPERJ(1st phase)165,000 bpd
(2014)
PREMIUM I(1st phase)300,000 bpd
(2016)
PREMIUM I(2nd phase)300,000 bpd
(2019)
PREMIUM II300,000 bpd
(2017)
COMPERJ(2nd phase)165,000 bpd
(2018)
Thous bpd
2,536
2,643 3,095
3,327
1,641
2,205
3,217
181
2,004
3,070
4,910
1,3931,798
1,036
2,1471,814
1,323
... ... ... ...

13
CrudeProducts
2,8
2,8
7,7
4,1
4,9 5,4
Processing in Brazil implies:• Lower Lead-Times• Reduced Tankage needs• Lower Inventories• Reduced need for ships
Freight cost ($/bbl)
LOGISTICSDistance from the Brazilian coast to refining centers is at least 5.000 miles, or 16 to 33 days of travel
1Petrobras estimates in october/2011
1

14
Refining Profile, Margins and Return

15
REFINING MARGINSMargins can have large amplitude according to the type of processed oil and product yields
-5
0
5
10
15
20
25
30
201020092008200720062005200420032002
USG Maya CokingUSG LLS Cracking
NWE Brent CrackingNWE Brent ToppingPBR Downstream Margin
$/bbl (US$ of 2010)
Source: Margens internacionais - PIRA
19
11
6+6
-8
USG Maya
Coking
PBR Downstream
Margin
USG LLS Cracking

16
PETROBRAS X MAYA COKINGComparison shows that crude cost and yields explain the deviation of our margins to Maya Coking
US$/bbl 2010
Petrobras vs. Maya Coking (average 2002-2010)
3
5
11
19
Petrobras MarginYield effectRaw material cost effect
Maya CokingMargin

17
65%
31% 26%
27%
10%
0
10
20
30
40
50
60
70
RNE
65%
Existing Refineries
(2010)
37%
PREMIUM
64%
38%
COMPERJ
68%
36%
HCCFCCCoker
CONVERSIONNew refineries will have higher conversion than existing ones with lower crude cost
Average Cost of Oil (2020)
-5,8
-2,3
PREMIUMExistent Refineries
Brent
(US$/bbl)
Convertion Capacity/ Destilation Capacity
1 Considering a Brent of 75 $/bbl
1

18
21%
4%7%
10%
Light
36%
6%
9%
21%
Medium Distillated
43%
5%
38%
Others
Fuel Oil
Special
Naphtha
LPG
Gasoline
Jet Fuel
Diesel
Intermediary
4%
15%
19%
4%
11%
15%
65%
15%
50%
Productivity of existing refineries – 2020
LightMedium Distillated Others
Productivity of new refineries – 2020
• Increase in global demand for medium‐distillated products tends to lead to an increase in price versus the gasoline price.
PRODUCTSNew refineries will produce higher value‐added oil products
19
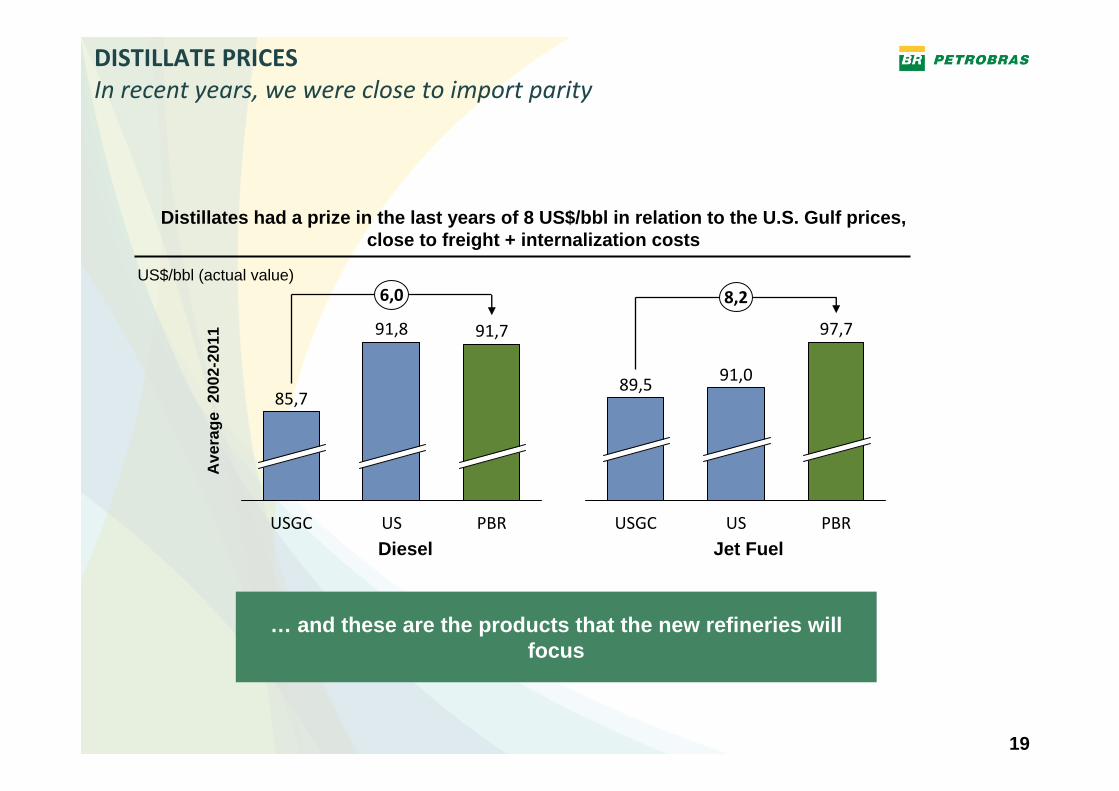
DISTILLATE PRICESIn recent years, we were close to import parity
Ave
rage
2002
-201
1
Jet FuelDiesel
6,0
PBR
91,7
US
91,8
USGC
85,7
8,2
PBR
97,7
US
91,0
USGC
89,5
US$/bbl (actual value)
Distillates had a prize in the last years of 8 US$/bbl in relation to the U.S. Gulf prices, close to freight + internalization costs
… and these are the products that the new refineries will focus

20
• Design competition based on the lowest final cost
• Selection of UOP ‐ international company with extensive refining experience
• Single design integrating all the refinery on‐site and off‐site
• Designer involved from conceptual design to technical assistance in the start up
• Scale economies (RPRE: 300kbpd modules)
• Maximum standardization of equipments specification
• Scheduling the construction stage allowing long‐term planning for equipment suppliers
• Reuse of the executive project allowing the incorporation of lessons learned
6,8
5,6
2,8
20
30
40
50
60
70
0 100 200 300 400
Age (years)
Scale (’000 bpd)
RESOURCE OPTIMIZATION AT PREMIUM REFINERIES
Current downstream cost(US$ / bbl in 2011)
Lower refining costs due to design quality and scale
Economies of scale and new implementationstrategies to reduce Capex, including:

21
PREMIUM REFINERIES PROJECTIn line with industry standards and more optimized than RNEST
Distillation Tower
Diesel Hidrotreater
Coker Unit
Metric: Reactor Weight (Kg)REPRE result: 38% lower than average
Metric: Atmosferic Column Weight (MT/Kbpd)REPRE result: 19% lower than average
Metric: Vacum Column Weight (MT/Kbpd)REPRE result: 28% lower than average
Metric: Coke Drum Weight kgs/KbpdREPRE result: 5% lower than average
Metric: Coke Furnace MM BTU HR/KbpdREPRE result: 18% lower than average
Metric: Wet Gas Compressor Motor HP/KbpdREPRE result: 28% lower than average
Benchmark results using a process plants database
Cable-rack (above grade)
Underground structure
Electric System Interconnection
Pipe-rack83 bridges (20 of
96m and 63 of18m on average)
Pipelines
9.140 k bbl (30,5 bbl/ bpd)
9.280 k bbl (40,4 bbl/ bpd)
Crude and Products Tanks
4 coke drums 2 furnaces
6 coke drums 3 furnacesCoker
1 reactor 1 fired heater6 reactors
2 fired heatersMiddle Distillate Hydrotreatment
RPRE 300 kbpd
RNEST 230 kbpd
Scope Optimized
Benchmark results comparing with RNEST project
More detailed analysis will be possible with the conclusion of the Basic Design (in the coming weeks) and conclusion of the FEED - Front End Engineering Detail (in the 1st Half of 2012)

22
Return rate (%)
Key Assumptions:
• Refinery with trains of 300 k bpd
• Refining scheme with HCC, Coking and HDT
•Refining costs in line with the current refineries that has the same scale
• Integrated Analysis
• Production for the domestic market
• Does not include tax benefits in the operation of the asset
Case 3 ‐ Capex US$ 50.000/bpd
Case 1 – Capex US$ 30.000/bpd
Case 2 – Capex US$ 40.000/bpd
PROFITABILITYNew refining projects have return rate above the cost of capital
Margin
US$/bblExpected Scenario
0
2
4
6
8
10
12
14
16
18
13 14 15 16 17 18 19 20 21 22 23

23
COMPERJCOMPERJ
NEW REFINERIESRNEST and Comperj are under construction and Premium I is doing the underground work
REPRE IREPRE I
RNESTRNEST

24
40%28%
06-10
14%
01-0596-0091-9586-9081-8576-8071-75
29%
44%
23%
20%
32%
06-10
7%
14%
01-0596-0091-9586-9081-8576-8071-75
30%
3%
Fuel OilDiesel*
JetGasoline
NaphtaLPG
19%
29%
06-10
8%
01-0596-0091-9586-9081-8576-8071-75
3%
Demand profile changes over time Refining Naphta X Gasoline yields over time
Source: EPE and MME *does not include biodiesel
HISTORY OF PRODUCT MIX ADJUSTMENTSThese new refineries will allow Petrobras keep its’ history of adjusting its’ products mix to the market needs
Refining Diesel X Fuel Oil yields over time
5 years periods
25
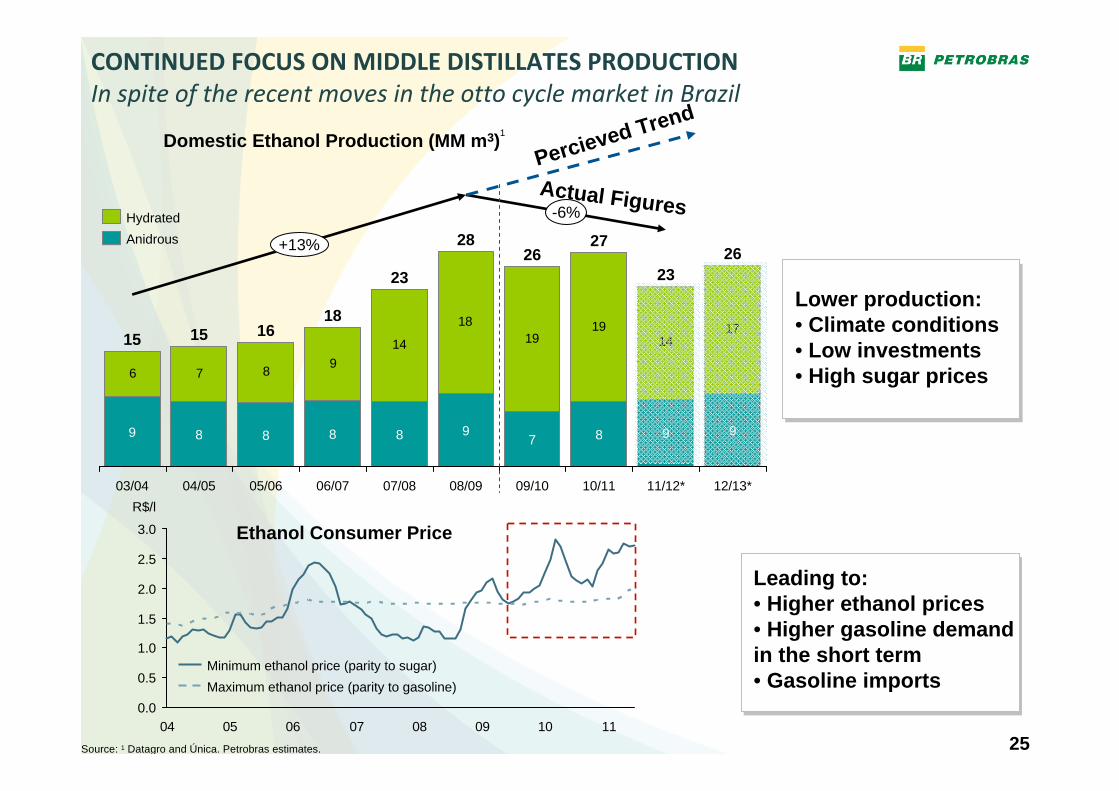
CONTINUED FOCUS ON MIDDLE DISTILLATES PRODUCTIONIn spite of the recent moves in the otto cycle market in Brazil
6 7 8 914
1819
1914
17
-6%
+13%
12/13*
26
9
11/12*
23
9
10/11
27
8
09/10
26
7
08/09
28
9
07/08
23
8
06/07
18
8
05/06
16
8
04/05
15
8
03/04
15
9
Source: 1 Datagro and Única. Petrobras estimates.
Domestic Ethanol Production (MM m3)Percieved Trend
Actual FiguresAnidrousHydrated
Lower production:• Climate conditions• Low investments• High sugar prices
Leading to:• Higher ethanol prices• Higher gasoline demandin the short term• Gasoline imports
R$/l
2.5
3.0
2.0
1.5
1.0
0.5
0.01110090807060504
Maximum ethanol price (parity to gasoline)Minimum ethanol price (parity to sugar)
Ethanol Consumer Price
1

26
Supply
Capacity additions in Asia and Middle East to meet
regional demand
Distillate demand will push crude runs leading to
byproduct gasoline supply
RefinedGasoline
Oversupply
Demand
Ambitious goals to improve fuel efficiency in
passenger cars
Economic growth
Weak Refined Gasoline
Demand GrowthDieselization and alternative fuels (electric vehicles, natural gas, …)
Penetration of alternative forms of supply (NGL, biofuels, CTL, GTL...)
Leading to gasoline surplus, especially in the Atlantic Basin, driving weak gasoline crack spreads.
INTERNATIONAL CONTEXT FOR GASOLINE DEMANDIncrease in gasoline surplus will make the product available at low prices
Gasoline demand growth in non-OECD and decrease in OECD

27
GASOLINE PRODUCTIONPetrobras position in this segment will be driven towards seeking higher refining flexibility in the existing assets
+12%
20112010
351
395
+25%
2011
442
2010
355
GASOLINE PRODUCTIONGASOLINE SALES
In the long run, highervolatility in gasolineconsumption is expected, requiring flexible refiningoperations
We will keep focusing our investments in Diesel and Jet, while seeking flexibilities in the current assets for gasoline, like:• Shifts in cut points• FCC operation optimization• Different catalysts ...
Recent Flexibility Results (kbpd)
0
10.000
20.000
30.000
40.000
50.000
60.000
20151005009590
Gasolina CHidratado
Flex-fuelDiesel
Light Vehicles Fleet Evolution
1 Natural gas Veihcles are cosidered in gasoline and flex-fuel fleet
1

28
Business Integration
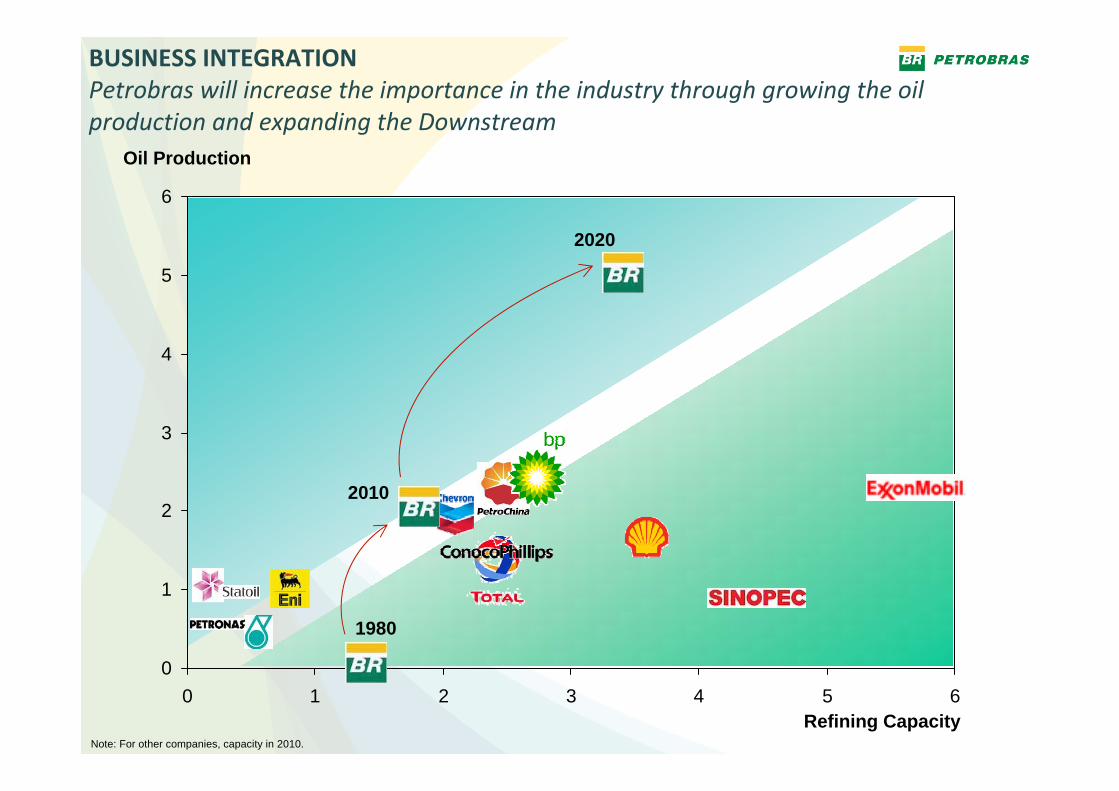
29Refining Capacity
Oil Production
BUSINESS INTEGRATIONPetrobras will increase the importance in the industry through growing the oil production and expanding the Downstream
Note: For other companies, capacity in 2010.
0
1
2
3
4
5
6
0 1 2 3 4 5 6
1980
2010
2020

30
28%
51%
Supply
Pre‐SaltProjects
21%
Plangás
30%Others
70%
Oil
US$ 3,5 billionUS$ 4,4 billion
Capex for Fleet Expansion Capex for Logistics for Oil
SUPPORTTING UPSTREAM OPERATIONSThis integrated performance can be verified in Capex of "downstream" dedicated to support upstream operations

31
Final Remarks

32
US$70.6 billion
• Refining Capacity Expansion: Abreu e Lima Refinery, Premium I and II, and Comperj;
• Quality and Conversion: Modernization, conversion, and hydrodesulfurization;
• Operating improvement: maintenance and optimization, HSEE, and R&D;
• Fleet Expansion
• Logistics for Oil: oil supply for refineries and infrastructure for oil exports.
1.1%4.5%
26.4%
0.8%15.2%
Logistics for Oil
International
Fleet Expansion
Quality and Conversion
Refining Capacity Expansion
Operating improvement
1.0%
23.9%
13.9%
4.9%
Petrochemical Investments amount to US$3.8 billion
DOWNSTREAM INVESTMENTSNew refineries, fuel quality and modernization sum up to 74% of RTM investments

33
Refineries Producing Diesel S-50 Comercialization Sites of Diesel S-50 Petrobras Stations with Diesel S-50Since March 2012Since December 2011
Available in more than 900 stations in Brazil
Refineries Producing Diesel S-50
Comercialization Sites of Diesel S-50
2012 2013
Road Diesel Evolution
DIESEL S‐50New treating units will fulfill growing quality requirements in Brazil

34
2011 2012 2013 2014 2015
1000 ppm Tranasition 50 ppm
RECAP Diesel and Gasoline
REFAP Gasoline
REGAP Gasoline
RLAM Gasoline
RPBC Gasoline
REPAR Gasoline
REPLAN Gasoline
REVAP Gasoline
2011 2012 2013 2014 2015 and beyond
Diesel S-1800
Diesel S-500
Diesel S-50
Diesel S-10
RECAP Diesel and Gasoline
RLAM Diesel
REFAP Diesel
REPLAN Diesel
REGAP Diesel
RPBC Diesel
REGAP Revamp HDT
Gasoline Quality Diesel Quality:
… reassuring Petrobras’ commitment with sustainability and sulfur emission reduction over time.
REDUC Gasoline
REDUC DieselREPAR
Diesel
QUALITY INVESTMENTSNew units in existing refineries are being built
Construction concludedBusiness Plan 11-15 schedule
Legend:

35
QUALITY INVESTMENTSSeveral units were concluded in 2011 and more units will be available in 2012
HDS GasolineHDT Nafta Ck
HDT DieselReform
REPAR
REDUC
REGAP
RLAM
REPLAN
REVAPRECAP
RPBC
2011 2012
US$ 16 Bi
1,01,0
3,2
4,9
5,9
7,0
4,5
2,3
1,1
0,20,1
15141312111098765
Quality investments (Business Plan 11-15)

36
Preserving our unique position in the Brazilian market as the best way to monetize our crude reserves
Shifting the refining system towards middle distillates production while increasing fuel quality standards
Reducing import levels through refining capacity expansion and domestic crude processing maximization
Optimizing capital allocation through new refining modules concept and implementation strategy
Creating efficient and reliable infrastructure to get the best value of crude oil export operations
Mitigate risks and use the flexibilities in the existing refining facilities to optimize the product portfolio
FINAL REMARKSAdding value in Refining, Transportation and Marketing (RTC) and Petrochemicals

Related Documents