Reference values and improvement of aerodynamic drag in professional cyclists JUAN GARCI ´ A-LO ´ PEZ 1 , JOSE ´ ANTONIO RODRI ´ GUEZ-MARROYO 1 , CARL-ETIENNE JUNEAU 2 , JOSE ´ PELETEIRO 1 , ALFREDO CO ´ RDOVA MARTI ´ NEZ 3 ,& JOSE ´ GERARDO VILLA 1 1 Physical Education and Sports, University of Leon, Leon, Spain, 2 Department of Kinesiology, University of Montreal, Montreal, Quebec, Canada, and 3 Department of Physiology and Biochemistry, University of Valladolid, Valladolid, Spain (Accepted 8 June 2007) Abstract The aims of this study were to measure the aerodynamic drag in professional cyclists, to obtain aerodynamic drag reference values in static and effort positions, to improve the cyclists’ aerodynamic drag by modifying their position and cycle equipment, and to evaluate the advantages and disadvantages of these modifications. The study was performed in a wind tunnel with five professional cyclists. Four positions were assessed with a time-trial bike and one position with a standard racing bike. In all positions, aerodynamic drag and kinematic variables were recorded. The drag area for the time- trial bike was 31% higher in the effort than static position, and lower than for the standard racing bike. Changes in the cyclists’ position decreased the aerodynamic drag by 14%. The aero-helmet was not favourable for all cyclists. The reliability of aerodynamic drag measures in the wind tunnel was high (r 4 0.96, coefficient of variation 5 2%). In conclusion, we measured and improved the aerodynamic drag in professional cyclists. Our results were better than those of other researchers who did not assess aerodynamic drag during effort at race pace and who employed different wheels. The efficiency of the aero-helmet, and the validity, reliability, and sensitivity of the wind tunnel and aerodynamic field testing were addressed. Keywords: Biomechanics, aerodynamics, cycling, wind tunnel, time-trial Introduction It has been reported that the aerodynamic drag influences cycling performance (Kyle, 1979), espe- cially in individual and team time-trial races (Padilla, Mujika, Angulo, & Goiriena, 2000). Aerodynamic drag is the main resistive force (about 80% of the total resistive force at 30 km h 71 ) on level ground (Di Prampero, 2000). The external power required for the cyclist – bicycle system to overcome the aerodynamic drag is a third-order polynomial of the system velocity (Swain, 1994), so it is necessary to double the pedalling power to increase cycling speed from 32.4 to 43.2 km h 71 (Grappe, Candau, Belli, & Rouillon 1997). Consequently, if we consider that the cyclist’s power is limited, it becomes important to reduce the aerodynamic drag to improve cycling performance. One option is to modify the bicycle’s dimensions and the cyclist’s posture in accordance with the rules of the Interna- tional Cycling Union (UCI, 2006). Many cycling world hour records were broken some time ago, when special bicycles were allowed, but these records have since been declared null and void (Bassett, Kyle, Passfield, Broker, & Burke, 1999; Padilla et al., 2000). Nowadays, it is possible to use bicycles with an aerodynamic frame, special handlebars, and special (lenticular) wheels to improve the aerody- namic drag (Jeukendrup & Martin, 2001). These strategies could reduce pedalling power by 60 W at 50 km h 71 (Menard, 1992). This reduction repre- sents about 12% of the pedalling power at maximal oxygen uptake ( _ V O 2max ) in professional cyclists (Lucia, Hoyos, & Chicharro, 2000). Increases in aerodynamic drag have been reported when cyclists wear standard helmets instead of aero-helmets (Kyle, 1989), which would increase pedalling power to maintain a given velocity by 9 – 18 W Correspondence: J. Garcı ´a-Lo ´ pez, Physical Education and Sports, University of Leon, c/Campus de Vegazana, Leon 24071, Spain. E-mail: [email protected] Journal of Sports Sciences, February 1st 2008; 26(3): 277 – 286 ISSN 0264-0414 print/ISSN 1466-447X online Ó 2008 Taylor & Francis DOI: 10.1080/02640410701501697

Welcome message from author
This document is posted to help you gain knowledge. Please leave a comment to let me know what you think about it! Share it to your friends and learn new things together.
Transcript

Reference values and improvement of aerodynamic drag inprofessional cyclists
JUAN GARCIA-LOPEZ1, JOSE ANTONIO RODRIGUEZ-MARROYO1,
CARL-ETIENNE JUNEAU2, JOSE PELETEIRO1, ALFREDO CORDOVA MARTINEZ3, &
JOSE GERARDO VILLA1
1Physical Education and Sports, University of Leon, Leon, Spain, 2Department of Kinesiology, University of Montreal,
Montreal, Quebec, Canada, and 3Department of Physiology and Biochemistry, University of Valladolid, Valladolid, Spain
(Accepted 8 June 2007)
AbstractThe aims of this study were to measure the aerodynamic drag in professional cyclists, to obtain aerodynamic dragreference values in static and effort positions, to improve the cyclists’ aerodynamic drag by modifying their position andcycle equipment, and to evaluate the advantages and disadvantages of these modifications. The study was performed in awind tunnel with five professional cyclists. Four positions were assessed with a time-trial bike and one position with astandard racing bike. In all positions, aerodynamic drag and kinematic variables were recorded. The drag area for the time-trial bike was 31% higher in the effort than static position, and lower than for the standard racing bike. Changes in thecyclists’ position decreased the aerodynamic drag by 14%. The aero-helmet was not favourable for all cyclists. The reliabilityof aerodynamic drag measures in the wind tunnel was high (r4 0.96, coefficient of variation5 2%). In conclusion,we measured and improved the aerodynamic drag in professional cyclists. Our results were better than those of otherresearchers who did not assess aerodynamic drag during effort at race pace and who employed different wheels. Theefficiency of the aero-helmet, and the validity, reliability, and sensitivity of the wind tunnel and aerodynamic field testingwere addressed.
Keywords: Biomechanics, aerodynamics, cycling, wind tunnel, time-trial
Introduction
It has been reported that the aerodynamic drag
influences cycling performance (Kyle, 1979), espe-
cially in individual and team time-trial races (Padilla,
Mujika, Angulo, & Goiriena, 2000). Aerodynamic
drag is the main resistive force (about 80% of the
total resistive force at 30 km � h71) on level ground
(Di Prampero, 2000). The external power required
for the cyclist – bicycle system to overcome the
aerodynamic drag is a third-order polynomial of the
system velocity (Swain, 1994), so it is necessary to
double the pedalling power to increase cycling speed
from 32.4 to 43.2 km � h71 (Grappe, Candau,
Belli, & Rouillon 1997). Consequently, if we
consider that the cyclist’s power is limited, it
becomes important to reduce the aerodynamic drag
to improve cycling performance. One option is to
modify the bicycle’s dimensions and the cyclist’s
posture in accordance with the rules of the Interna-
tional Cycling Union (UCI, 2006). Many cycling
world hour records were broken some time ago,
when special bicycles were allowed, but these records
have since been declared null and void (Bassett,
Kyle, Passfield, Broker, & Burke, 1999; Padilla et al.,
2000). Nowadays, it is possible to use bicycles with
an aerodynamic frame, special handlebars, and
special (lenticular) wheels to improve the aerody-
namic drag (Jeukendrup & Martin, 2001). These
strategies could reduce pedalling power by 60 W at
50 km � h71 (Menard, 1992). This reduction repre-
sents about 12% of the pedalling power at maximal
oxygen uptake ( _V O2max) in professional cyclists
(Lucia, Hoyos, & Chicharro, 2000). Increases in
aerodynamic drag have been reported when cyclists
wear standard helmets instead of aero-helmets
(Kyle, 1989), which would increase pedalling
power to maintain a given velocity by 9 – 18 W
Correspondence: J. Garcıa-Lopez, Physical Education and Sports, University of Leon, c/Campus de Vegazana, Leon 24071, Spain.
E-mail: [email protected]
Journal of Sports Sciences, February 1st 2008; 26(3): 277 – 286
ISSN 0264-0414 print/ISSN 1466-447X online � 2008 Taylor & Francis
DOI: 10.1080/02640410701501697
(2 – 3% _V O2max). Conversely, this power is
reduced (6%) by small changes in cyclists’ position
(Jeukendrup & Martin, 2001).
Different techniques have been used to evaluate
the aerodynamic drag in cycling (Garcıa-Lopez et al.,
2002; Grappe et al., 1997): traction resistance test,
lab-to-field extrapolation, simplified deceleration
method, force transducers, and wind tunnel. The
wind tunnel is the most valid and reliable technique
(Hoerner, 1965), because it is sensitive to different
types of handlebars, frames, and wheels in the same
bicycle (Dal Monte, Leonardi, Menchinelli, &
Marini, 1987; Menard, 1992; Tew & Sayers,
1999). Its main disadvantage is its high cost.
Therefore, few studies have been performed with
professional road cyclists in a wind tunnel; most
aerodynamic drag measurements have been obtained
using other methods (Garcıa-Lopez et al., 2002).
The other major shortcoming of wind tunnel studies
is that they were not performed during actual cycling
locomotion. Only one study (Martin, Milliken,
Cobb, McFadden, & Coggan, 1998) simulated
pedalling (no resistance), despite the belief that there
are differences between dynamic and static positions
(Candau et al., 1999). No other study has assessed
aerodynamic drag in a wind tunnel during effort at
race pace.
The aims of this study were to: (a) measure
aerodynamic drag in a representative group of
professional cyclists in a wind tunnel; (b) obtain
reference values in the static and effort (at race pace)
positions; (c) improve cyclists’ aerodynamic drag by
modifying bicycle position and equipment; and
(d) evaluate the advantages and disadvantages of
these modifications.
Methods
Participants
Five professional road cyclists aged 22 – 30 years
(mean body mass 71.6 kg, s¼ 2.7; height 1.79 m,
s¼ 0.03) participated in the study. All participants
were healthy males who had been international
competitors with the Kelme-Costa Blanca team and
had several years’ cycling experience. After the study,
all of them participated in the Tour de France and
the Vuelta a Espana 2001 and 2002. The evaluation
protocol for sportsmen was designed according to
the Helsinki Conference for Research on Human
Beings, and all cyclists signed informed consent
before starting the study.
Experimental design
The cyclists performed five wind-tunnel tests in
different positions (Figure 1). The first four tests
(positions 1 – 4) were carried out with a special time-
trial bike (model KG 3961, Look SA, France)
equipped with an aero-handlebar (model ITM
System Extensions, Italmanubri SA, Italy). The fifth
test (position 5) was undertaken with a standard
bike (model KG 3811, Look SA, France) equipped
with a standard handlebar (model ITM, Italmanubri
SA, Italy). For all five tests, the front and rear wheels
were standard wheels (Mavic Open Pro SUP1,
Salomon SA, France) with 32 oval spokes (diameter
1.8 mm), and the tyres were 700 mm in diameter and
23 mm in cross-sectional width (Vittoria Pro Team
Kevlar1, Vittoria SA, Italy). They were inflated to a
pressure of 9 atmospheres. The cyclists only wore
aero-helmets (Catlike Crono1, Catlike SA, Spain)
during the first three tests. The tests were static
(without pedalling, position 1) and dynamic (pedal-
ling against resistance, positions 2 – 5). The bike was
fixed attached to a power meter (Elite Axiom Power
Train1, Italy) and both were placed on a force
balance to measure the aerodynamic drag. The
cyclists then warmed up for 15 min on the power
meter in the wind tunnel (5 min at 2 W � kg71, 5 min
at 3.5 W � kg71, and 5 min at 5 W � kg71). After the
warm-up, the cyclists pedalled for 10 min at
5.5 W � kg71, the same intensity being used for all
the dynamic tests. This intensity corresponded to
90% _V O2max; in theory, the cyclists should be able to
maintain this intensity for 1 h (Atkinson, Davison,
Jeukendrup, & Passfield, 2003). During the five tests,
the aerodynamic drag and cyclists’ positions were
recorded simultaneously with a force balance and
two-dimensional photogrammetry.
Figure 1. The five positions analysed in this study. On the time-
trial bike: position 1¼ static, with the original configuration used
by the cyclists and both cranks placed horizontally; position
2¼dynamic, similar to position 1, but during effort at race pace
(5.5 W � kg71) for 10 min; position 3*¼ similar to position 2, but
after lowering the handlebars and advancing the pads (forearm
support) by 2 – 3 cm; position 4¼ similar to position 3, but
without the aero-helmet. On the standard racing bike: position
5¼ grabbing of handlebars and without helmet. *It was impossible
to depict the differences with respect to position 2.
278 J. Garcıa-Lopez et al.
Aerodynamic drag was measured in a subsonic
wind tunnel (up to 56 m � s71). The tunnel was of the
closed loop circuit type (Technological Institute of
Renewable Energy, ITER, Tenerife, Spain), with a
test section (2.2 m wide and 3 m long) on which to
place the bike and cyclist, plus a control room to
record all test variables (Figure 2) (Gonzalez et al.,
1998). The wind speed (limited to 22 m � s71 for
safety reasons) was controlled by a remote computer
with special software (ITER, Tenerife, Spain) and a
wind speed transducer (model TSI-84551, USA;
range 0.125 to 50 m � s71 and precision of
0.06 m � s71). It sent the information through a micro
controller connected to a system (model Meltrac-
A140E-220K1, Mitsubishi, USA) that changed the
rotation frequency of nine fans (model HCT-100-
4T-301, SODECA, UK; power 22 kW and maximal
speed 1760 rev �min71) to obtain the desired wind
speed in the test section (15 m � s71 or 54 km � h71).
We selected a wind speed of 54 km � h71 because
cyclists aiming to win individual time-trial races on
flat terrain should average velocities higher than
50 km � h71. Mean velocities in team time-trial races
are even higher (455 km � h71). Nonetheless,
Bassett et al. (1999) estimate that cyclists’ drag
coefficient is typically constant when wind speed
ranges between 50 and 60 km � h71.
Before the tests, the force balance was zeroed at a
wind speed of 15 m � s71, to exclude the aerody-
namic drag of the power meter. Measurements were
taken once the wind speed was stabilized (around
15 m � s71) in the force balance, which was a
rectangular plate (0.661.5 m surface) equipped with
a strain-gauge force transducer (model RS-632-
7421; range 0 to 58.84 N and precision of
0.04 N). Force data were sampled at 10 Hz and
synchronized with the wind speed data. Both were
captured by a special card (Daqboard/216a1, Iotech
Inc., USA; 16 bits and 100 kHz) and processed with
Daqview1 software (Iotech Inc., USA). The strain
gauge was calibrated using calibration weights before
the study and reset to zero before each trial.
Measurements were recorded at five intervals (2, 4,
6, 8, and 10 min) for no longer than 5 s, with the
mean aerodynamic drag taken as the reference value.
Aerodynamic drag and wind speed were registered
simultaneously; therefore, the aerodynamic drag
measurements were corrected for fluctuations of
instantaneous wind speed (+0.1 m � s71).
The variables derived from the aerodynamic drag
(equation 1) were obtained using Newton’s equation
(Hoerner, 1965). The drag area to body mass ratio
(SCx � kg71) was calculated by dividing the drag area
by the cyclist’s body mass:
AD ¼ 0:5 � SCx � v2 � r ð1Þ
where AD is the aerodynamic drag in Newtons, S is
the cyclist – bike frontal area in square metres, Cx is
the drag coefficient, SCx is the drag area in square
metres, v is the wind speed, and r is the air density in
kg �m73.
Assuming a negligible effect of air humidity (Di
Prampero, 2000; Grappe et al., 1997), we estimated
the air density for each test using a formula (2) that
takes ambient pressure and temperature into account
(weather station, model BAR913H61, Oregon
Scientific Inc., USA):
r ¼ r0 � 0:359 � P � T�1 ð2Þ
where r is the air density in kg �m73, r0 is the
standard air density (1.293 kg �m73) at 760 mmHg
and 08C (273 K), 0.359 is a constant relation
(273/760) between standard pressure and standard
temperature, P is the atmospheric pressure in
mmHg, and T is the ambient temperature in degrees
Kelvin.
The cyclists’ positions were analysed by two-
dimensional photogrammetry. One film of the
cyclists’ profile (sagittal plane) was taken every time
the aerodynamic drag was measured. A model with
17 anatomical markers on the cyclist’s body was
selected to reproduce his position on the bike, plus
seven fixed markers for the bike itself (frame size,
distance between the two shafts, etc.). All these
markers were used to establish a scale and the
relationship between the cyclist and the bike. We
used a 25-Hz digital camera (GR-DVM75U1, JVC
SA, USA) placed perpendicular to the sagittal plane.
The representative image of the cyclist’s position was
selected with both cranks positioned horizontally.
Special software was used to analyse the images
(Kinescan-20011, IBV, Spain), allowing calculation
of kinematic variables (Figure 3).
Figure 2. Characteristics of the closed loop circuit subsonic wind
tunnel (Technological Institute of Renewable Energy, ITER,
Tenerife, Spain).
Aerodynamic drag in professional cyclists 279

Before and after three tests (positions 3, 4, and 5),
a frontal plane photograph was taken to calculate the
cyclist – bike frontal area, taking the mean frontal
area as the reference value. This was calculated by
weighting (precision balance, model ER182A,
A&D Company, Japan; precision 1 � 100,00071 g)
and comparing the masses of the pictures of the
cyclist – bike ensemble and that of the reference
area (262 m reference system) (Olds & Olive,
1999; Swain, Richard, Clifford, Milliken, & Stray-
Gundersen, 1987). The cyclist’s body surface area
(equation 3) was estimated using Du Bois and Du
Bois’ equation (Padilla et al., 2000):
BSA ¼ 0:007184 � BM0:425 �H0:725 ð3Þ
where BSA is the cyclist’s body surface area in square
metres, BM is the cyclist’s body mass in kilograms,
and H is the cyclist’s height in centimetres.
Statistical analyses
Statistical analysis was carried out using Statistics-
v4.5 for Windows (Statsoft Inc, USA). Results
are expressed as the mean and standard error of
the mean (sx). Differences between the five tests were
analysed by repeated-measures analyses of variance.
Relationships between variables were analysed by the
non-parametric Spearman test. Statistical signifi-
cance was set at P5 0.05.
Results
Table I shows that the drag area increased signifi-
cantly (by 31%) in position 2 (during effort) with
respect to position 1 (static). It later decreased (by
14%) in position 3 (modifications to the handlebars)
with respect to position 2, and did not change in
position 4 (without aero-helmet) with respect to
position 3. Drag area values in positions 1 – 4 (time-
trial bike) were significantly lower (P5 0.05) than in
position 5 (standard racing bike). The frontal area
and drag coefficient were significantly higher
(P5 0.05) in position 5 than in positions 3 and 4.
Horizontal – torso angle was the only kinematic
variable to be related to drag area (Table II). We
observed significant correlations (P5 0.05) between
horizontal – torso angle and drag area (r¼ 0.42;
Figure 4), and between horizontal – torso angle and
the drag area to body mass ratio (r¼ 0.40).
Table II summarizes significant correlations
when the time-trial bike was used. Apart from the
correlations between anthropometric variables, the
correlations between the drag area to body mass
ratio and other variables were notable. The relation-
ship between drag area and the drag area to body
mass ratio was significant (r¼ 0.69, P5 0.001).
Table III shows that all cyclists obtained the lowest
drag area in positions 3 and 4. The wearing of an
aero-helmet (position 3) reduced drag area in three
Figure 3. Kinematic variables of the cyclist and bicycle.
PH¼profile height, PL¼profile length, Dc-fs¼horizontal dis-
tance between the crank and the front shaft, Dc-bl¼horizontal
distance between the crank and the brake levers. Angles: aH-T
(horizontal – torso), aA-T (arm – torso), and aF-A (forearm – arm).
Table I. Aerodynamic drag measurements and kinematic variables in the five positions (mean+ sx).
Position 1 Position 2 Position 3 Position 4 Position 5
SCx (m2) 0.260+ 0.011 0.341+ 0.013* 0.293+0.003* 0.297+ 0.013 0.481+ 0.017*
S (m2) – – 0.305+0.008 0.301+ 0.011 0.364+ 0.012*
Cx – – 0.96+0.03 0.99+ 0.05 1.33+ 0.07*
aH-T (8) 16.9+ 1.2 19.2+ 1.2* 15.4+1.5* 15.8+ 1.4 23.1+ 2.2*
aA-T (8) 86.6+ 4.1 84.0+ 3.9 86.1+2.2 84.1+ 1.6 76.8+ 2.1*
aF-A (8) 106.8+ 3.9 109.6+ 4.1 107.8+2.9 108.8+ 4.0 119.8+ 7.7*
PH (cm) 114.5+ 2.1 121.4+ 2.0* 116.1+2.6* 112.8+ 2.6 114.6+ 2.9*
PL (cm) 89.4+ 3.4 85.4+ 2.1* 87.3+1.7* 85.5+ 1.8* 85.7+ 1.9
Dc-fs (cm)a 57.5+ 0.9 57.7+ 0.9 57.7+0.8 57.8+ 0.8 58.7+ 0.7*
Dc-bl (cm)b 71.2+ 2.3 71.3+ 1.8 73.0+2.3* 73.2+ 2.0 68.9+ 2.1*
Note: SCx¼drag area, S¼ frontal area, Cx¼drag coefficient. See legend to Figure 3 for the definition of other terms.
*Significantly different from previous position (P50.05). International Cycling Union rules: amaximum distance of 65 cm (article 1.3.016),bmaximum distance of 75 cm (article 1.3.023).
280 J. Garcıa-Lopez et al.

cyclists (participants 2 – 4), raised it in one (partici-
pant 1), and had no effect on participant 5. In the five
cyclists studied, the minimum drag area did not
coincide with the minimum drag area to body mass
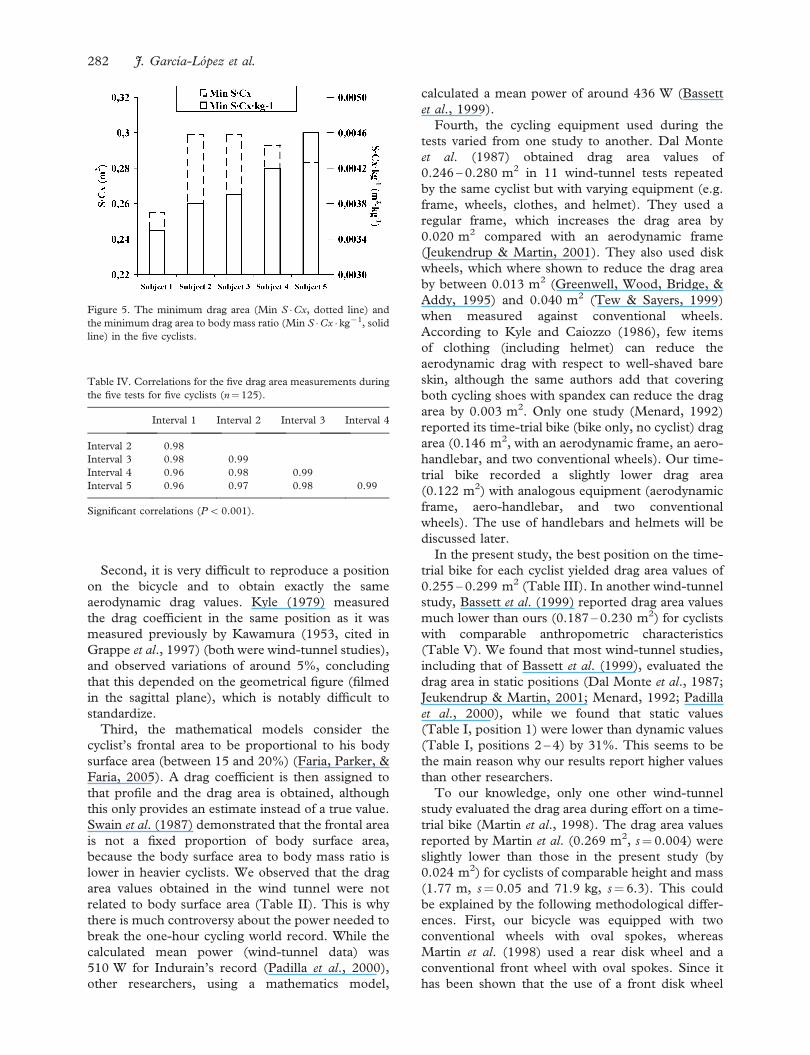
ratio (Figure 5).
In each of the five tests, the five drag area
measurements showed high reliability (Table IV)
and the mean coefficient of variation (CV) for all
measurements was 1.1% (range 0.3 – 2.0%).
Discussion
In this study, we obtained reference values for
aerodynamic drag in a representative group of
professional cyclists who adopted different positions
on the bicycle. We compared our cyclists’ values
with those obtained by other researchers and
observed a high variability of drag area values for
the same position (Garcıa-Lopez et al., 2002;
Grappe et al., 1997): upright position between
0.299 and 0.390 m2, dropped position between
0.251 and 0.370 m2, aerodynamic position be-
tween 0.191 and 0.304 m2, and optimized positions
(e.g. Obree’s and Boardman’s positions) between
0.172 and 0.275 m2. This variability could be due to
several methodological problems.
First, various techniques have been used to
measure aerodynamic drag, some of which may not
be sufficiently valid or reliable to estimate the drag
area. These techniques include (1) the traction
resistance test, where the towing vehicle and the
atmospheric conditions alter the measurements (De
Groot, Sargeant, & Geysel, 1995). (2) The lab-to-
field extrapolation of mechanical power and meta-
bolic rate also has its drawbacks, including different
environmental and/or physiological conditions be-
tween laboratory and field measurements (Brooks,
Fahey, White, & Baldwin, 2000). (3) The simplified
deceleration method overestimates the aerodynamic
drag (3.8%) and its test – retest reliability is low
(CV5 10%) (Hoerner, 1965). Candau et al. (1999)
showed that high reliability is possible (CV¼ 1 – 2%),
although the large number of trials and the difficulty
with which a cyclist can repeat the same position are
problems. (4) Force transducers on the rear-wheel
hub or on the crank (SRM1, Max One1 and Power-
Tap1) are useful to measure power output during
training, competitions, and laboratory testing
(Bertucci, Duc, Villerius, Pernin, & Grappe,
2005a), but their validity, reliability (Gardner et al.,
2004), and sensitivity to measure the aerodynamic
drag have yet to be demonstrated.
Table II. Correlations between anthropometric, kinematic, and
drag area variables for the time-trial bike.
BM
(kg)
H
(m)
BSA
(m2)
aH-T
(8)SCx
(m2)
H (m) 0.90***
BSA (m2) 0.92*** 0.90***
aH-T (8) – – –
SCx (m2) – – – 0.42*
SCx � kg71
(m2 � kg71)
70.54*** 70.42* 70.54*** 0.40* 0.69***
Note: H¼ cyclist’s height, BM¼body mass, BSA¼ body surface
area, aH-T ¼horizontal – torso angle, SCx ¼drag area,
SCx � kg71¼drag area to body mass ratio. Significant correlations:
*P5 0.05; **P50.01; ***P50.001.
Figure 4. Correlation between drag area and horizontal – torso
angle on the time-trial bike. Significant correlation (P5 0.05).
Table III. Drag area for each subject in the five positions, minimum drag area to body mass ratio and aero-helmet influence.
Position 1
SCx (m2)
Position 2
SCx (m2)
Position 3
SCx (m2)
Position 4
SCx (m2)
Position 5
SCx (m2)
Min SCx � kg71
(m2 � kg71)
Helmet
Inf. (%)
Cyclist 1 0.237 0.366 0.292 0.255 0.469 3.561073 þ14.5
Cyclist 2 0.276 0.307 0.299 0.315 0.521 3.861073 75.1
Cyclist 3 0.291 0.321 0.299 0.306 0.515 3.961073 72.3
Cyclist 4 0.237 0.377 0.293 0.326 0.469 4.261073 710.1
Cyclist 5 0.259 0.333 0.283 0.283 0.428 4.661073 0.0
Mean 0.260 0.341 0.293 0.297 0.481 4.061073 71.3
sx 0.010 0.012 0.003 0.011 0.015 0.261073 0.08
Note: SCx¼drag area in each position, Min SCx � kg71¼minimum drag area to body mass ratio from effort positions, Helmet Inf.¼aero-helmet influence. The minimum drag area values for each cyclist are shown in bold type.
Aerodynamic drag in professional cyclists 281
Second, it is very difficult to reproduce a position
on the bicycle and to obtain exactly the same
aerodynamic drag values. Kyle (1979) measured
the drag coefficient in the same position as it was
measured previously by Kawamura (1953, cited in
Grappe et al., 1997) (both were wind-tunnel studies),
and observed variations of around 5%, concluding
that this depended on the geometrical figure (filmed
in the sagittal plane), which is notably difficult to
standardize.
Third, the mathematical models consider the
cyclist’s frontal area to be proportional to his body
surface area (between 15 and 20%) (Faria, Parker, &
Faria, 2005). A drag coefficient is then assigned to
that profile and the drag area is obtained, although
this only provides an estimate instead of a true value.
Swain et al. (1987) demonstrated that the frontal area
is not a fixed proportion of body surface area,
because the body surface area to body mass ratio is
lower in heavier cyclists. We observed that the drag
area values obtained in the wind tunnel were not
related to body surface area (Table II). This is why
there is much controversy about the power needed to
break the one-hour cycling world record. While the
calculated mean power (wind-tunnel data) was
510 W for Indurain’s record (Padilla et al., 2000),
other researchers, using a mathematics model,
calculated a mean power of around 436 W (Bassett
et al., 1999).
Fourth, the cycling equipment used during the
tests varied from one study to another. Dal Monte
et al. (1987) obtained drag area values of
0.246 – 0.280 m2 in 11 wind-tunnel tests repeated
by the same cyclist but with varying equipment (e.g.
frame, wheels, clothes, and helmet). They used a
regular frame, which increases the drag area by
0.020 m2 compared with an aerodynamic frame
(Jeukendrup & Martin, 2001). They also used disk
wheels, which where shown to reduce the drag area
by between 0.013 m2 (Greenwell, Wood, Bridge, &
Addy, 1995) and 0.040 m2 (Tew & Sayers, 1999)
when measured against conventional wheels.
According to Kyle and Caiozzo (1986), few items
of clothing (including helmet) can reduce the
aerodynamic drag with respect to well-shaved bare
skin, although the same authors add that covering
both cycling shoes with spandex can reduce the drag
area by 0.003 m2. Only one study (Menard, 1992)
reported its time-trial bike (bike only, no cyclist) drag
area (0.146 m2, with an aerodynamic frame, an aero-
handlebar, and two conventional wheels). Our time-
trial bike recorded a slightly lower drag area
(0.122 m2) with analogous equipment (aerodynamic
frame, aero-handlebar, and two conventional
wheels). The use of handlebars and helmets will be
discussed later.
In the present study, the best position on the time-
trial bike for each cyclist yielded drag area values of
0.255 – 0.299 m2 (Table III). In another wind-tunnel
study, Bassett et al. (1999) reported drag area values
much lower than ours (0.187 – 0.230 m2) for cyclists
with comparable anthropometric characteristics
(Table V). We found that most wind-tunnel studies,
including that of Bassett et al. (1999), evaluated the
drag area in static positions (Dal Monte et al., 1987;
Jeukendrup & Martin, 2001; Menard, 1992; Padilla
et al., 2000), while we found that static values
(Table I, position 1) were lower than dynamic values
(Table I, positions 2 – 4) by 31%. This seems to be
the main reason why our results report higher values
than other researchers.
To our knowledge, only one other wind-tunnel
study evaluated the drag area during effort on a time-
trial bike (Martin et al., 1998). The drag area values
reported by Martin et al. (0.269 m2, s¼ 0.004) were
slightly lower than those in the present study (by
0.024 m2) for cyclists of comparable height and mass
(1.77 m, s¼ 0.05 and 71.9 kg, s¼ 6.3). This could
be explained by the following methodological differ-
ences. First, our bicycle was equipped with two
conventional wheels with oval spokes, whereas
Martin et al. (1998) used a rear disk wheel and a
conventional front wheel with oval spokes. Since it
has been shown that the use of a front disk wheel
Figure 5. The minimum drag area (Min S �Cx, dotted line) and
the minimum drag area to body mass ratio (Min S �Cx � kg71, solid
line) in the five cyclists.
Table IV. Correlations for the five drag area measurements during
the five tests for five cyclists (n¼125).
Interval 1 Interval 2 Interval 3 Interval 4
Interval 2 0.98
Interval 3 0.98 0.99
Interval 4 0.96 0.98 0.99
Interval 5 0.96 0.97 0.98 0.99
Significant correlations (P5 0.001).
282 J. Garcıa-Lopez et al.

reduces the drag area by about 0.027 m2 (average of
the values of Greenwell et al., 1995 and Tew &
Sayers, 1999), and it has been estimated that the rear
wheel causes 50% less resistance that the front wheel
(Jeukendrup & Martin, 2001), this should account
for only 0.013 m2 of the total difference. Second, our
cyclists pedalled at race pace (5.5 W � kg71), while
those in the study by Martin et al. (1998) simulated
pedalling against no resistance. This might account
for the remaining difference (0.014 m2), since we
cannot compare the drag area of the time-trial bike
we used (0.122 m2) with that used by Martin et al.
Third, the front wheel did not rotate in our study,
because it was fixed on an Axiom ergometer. This
could have a slight effect on aerodynamic drag
measurements. However, careful examination of
the data of Tew and Sayers (1999) reveals that there
was no significant difference in aerodynamic drag
when wheels with 36 oval spokes were rotated at
varying speeds (with a yaw angle of 08), which leads
us to believe that the front wheel’s rotation impact, if
there is any, should be minimal. Futures studies
should evaluate the exact impact of the rotation of
the front wheel on the drag area.
Drag area should be expressed in absolute terms
(e.g. 0.255 m2), but also in relative terms (drag area
to body mass ratio, e.g. 3.561073 m2 � kg71), be-
cause both variables provide a different appreciation
of cyclists’ aerodynamics. We calculated these two
variables for the cyclists in the present study and
those in the study of Bassett et al. (1999) (Table V
and Figure 6), and found that small cyclists had a
higher drag area to body mass ratio than large cyclists
(and therefore poorer aerodynamics). Swain (1994)
also observed this trend, and added that this is not
compensated by a higher relative _V O2max in small
cyclists. This explanation can be related to the
‘‘allometric scale’’ concept (Astrand & Rodahl,
1986), which implies a lower mass exponent for
drag area (1/3) than _V O2max (2/3) (Faria et al.,
2005). Lucia et al. (2000) also noted significant
differences in body mass (12.4%) between climbers
(64.3 kg, s¼ 2.2) and time-trialists (72.3 kg, s¼ 2.3),
but not in relative power output at _V O2max. After
having applied the equations of Figure 6 to the
cyclists of Lucia et al. (2000), we found that the drag
area to body mass ratio was 9.8 – 17.4% higher for
climbers. This is a disadvantage for small cyclists,
for the reasons explained previously. The two
following anecdotal examples relate to that notion:
participant 3 in the present study (61 kg) lost the
Vuelta a Espana 2001 by 62 s in the final stage
(individual time-trial, 38 km on level ground) to a
much larger cyclist (74 kg). Conversely, participant 4
(69 kg) won the Vuelta a Espana 2002 by 132 s in
the final stage (individual time-trial, 41.2 km on level
ground) because he was able to beat a smaller cyclist
(60 kg).
The frontal areas (Table I) we obtained on the
time-trial bike (50.31 m2) using a direct method
(Swain et al., 1987) were lower than those estimated
by indirect methods such as body surface area
(40.40 m2) in cyclists with similar anthropometric
characteristics (Capelli et al., 1998; Di Prampero,
2000). We did not observe any correlation between
body surface area and frontal area measured by the
direct method (Table II). Heil (2001) reported a
weak correlation between these two variables,
because frontal area also depended on the
horizontal – torso and seat-tube angles. The frontal
areas were a little larger (0.318 – 0.322 m2) than in our
study (0.301 – 0.305 m2), although the horizontal –
torso angles were similar (*158). This was because
the cyclists studied by Heil (2001) were a little larger
(74.4 kg and 1.82 m). The drag coefficients we
obtained (Table I) were higher than those obtained
by other authors on time-trial (0.55 – 0.75) and
standard racing (0.8 – 1.0) bikes (Capelli et al.,
Table V. Drag area for eight cyclists in a wind tunnel when on a
time-trial bike (Bassett et al., 1999).
H
(m)
BM
(kg)
AD
(N)
SCx
(m2)
SCx � kg71
(m2 � kg71)
Cyclist 1a 1.63 47.6 23.00 0.212 4.561073
Cyclist 2a 1.75 59.9 23.22 0.214 3.661073
Cyclist 3a 1.80 69.0 24.99 0.230 3.361073
Cyclist 4b 1.80 74.0 21.01 0.194 2.661073
Cyclist 5b 1.80 74.0 20.42 0.188 2.561073
Cyclist 6b 1.80 77.0 21.35 0.197 2.661073
Cyclist 7b 1.86 81.0 20.24 0.187 2.361073
Cyclist 8b 1.93 87.0 22.79 0.210 2.461073
Mean 1.80 71.2 22.13 0.207 3.061073
sx 0.03 4.1 0.54 0.005 0.261073
Note: H¼ cyclist’s height, BM¼body mass, AD¼ aerodynamic
drag, SCx¼drag area, SCx � kg71¼drag area to body mass ratio.aKyle’s and bBroker and Kyle’s original data: Wind speed of
48 km �h71, assuming that air density was 1.204 kg �m73 (at sea
level and 208C, equation 2).
Figure 6. Correlation between drag area to body mass ratio
(SCx � kg71) and body mass (BM) on the time-trial bike. Present
study (the best position for each cyclist, n¼5) and that of Bassett
et al. (1999) (compilation of two studies, n¼8).
Aerodynamic drag in professional cyclists 283

1998; Di Prampero, 2000; Padilla et al., 2000).
Several factors could explain this difference: carrying
out the test during effort, obtaining the frontal area
by a direct method, and using the wind tunnel and
not other techniques.
We compared the modifications in drag area we
obtained with those of other studies even if the
methodology varied from one study to the other. In
our study, the International Cycling Union rules
(UCI, 2006) were taken into account. Modifications
to the handlebar position (forearm support) de-
creased the drag area by 14% (Table I). Similar
results were obtained by others when comparing
different positions on the bicycle (upright, dropped,
aerodynamic, and optimized positions) (Grappe
et al., 1997). The individual modifications decreased
the horizontal – torso angle (Table I, positions 2 – 4),
and this was associated with a lower drag area.
Jeukendrup and Martin (2001) reported similar
decreases in drag area (11%) when the aerodynamic
handlebar was modified, but their study focused on
only one cyclist. Heil and colleagues (Heil,
Derrick, & Whittlesey, 1997) described the increase
in metabolic cost and kinematic variations in hip,
knee, and ankle angles when cyclists used horizontal –
torso angles in the range 10 – 208 (similar to the
present study). Grappe and colleagues (Grappe,
Candau, Busso, & Rouillon, 1998) reported that,
at high speed (from 11 m � s71), the increase in
metabolic cost would be compensated by a reduction
of aerodynamic drag, resulting in improved perfor-
mance. The limitation of our study and that of
Jeukendrup and Martin (2001) was that the
impact of the metabolic cost of modifying the cyclists’
position was not evaluated. Although these new
positions improved the aerodynamic drag, they
might have increased the metabolic cost required
to produce cycling power. Also, previous studies
examined physiological and biomechanical
responses when cyclists used aerodynamic handlebars
and positions, but did not investigate the cyclists’
adaptation to these positions. That is, it is possible
that the increase in metabolic cost associated with
an unusual position is reduced by training in that
specific position. Future studies should evaluate
whether the potential increase in metabolic cost
induced by a new position is counterbalanced by
training in that position.
In the present study, the wearing of an aero-helmet
did not decrease the drag area for all cyclists
(Table I). After biomechanical evaluation, we pro-
duced a report for each cyclist with recommenda-
tions regarding the best position to adopt and
whether or not to wear the aero-helmet, since cyclists
were allowed to compete with or without a helmet
until 2003. Some authors reported that wearing a
rubber helmet decreased the drag area by 0.4%;
however, their results were obtained using a scaled
wind tunnel (0.6160.81 m test section) and a
mannequin head (Kyle, 1989; Kyle & Caiozzo,
1986). Dal Monte et al. (1987) measured the impact
of four types of aero-helmet on the drag area of one
cyclist in a wind tunnel. Only one type decreased the
drag area, but it was too uncomfortable and the
cyclist refused to wear it. These authors suggested
that the helmet geometry must be adapted to each
cyclist to decrease the drag area. Today, it is not
possible to compete without safety headgear, due to
the new competition rules (UCI, 2006, article
1.3.031). However, no study has yet proved the
aerodynamic efficiency of this safety headgear,
especially in individual and team time-trial races.
Future studies should examine this aspect.
It would be much simpler and practical to carry
out aerodynamic drag testing in field conditions,
without the use of a wind tunnel. Several investiga-
tors have tried to do so in a variety of facilities (e.g. a
80-m long level indoor hallway, an airport taxiway,
and a velodrome) (Candau et al., 1999; Martin,
Gardner, Barras, & Martin, 2006). The main
limitations of these studies are: (a) controlling and
replicating the atmospheric conditions; (b) building a
sport-specific facility; and (c) taking into account
that air resistance is lower when riding around a
velodrome curve than when cycling in a straight line
(Olds, 2001). Future research should attempt to
model and compare field data collected in velodrome
with wind-tunnel data. Hence, we think that the
wind tunnel is still the reference method to measure
the aerodynamic drag in cycling for the following
reasons. First, it is very sensitive to small changes in
aerodynamic drag, whereas no study of the
SRM power meter demonstrated such sensitivity.
Second, wind-tunnel testing is very reliable. We
found high test – retest reliability (r4 0.96,
P5 0.001; Table IV) and a low coefficient of
variation (52%). This coefficient was lower than
the significant differences in this study. Still, no
study of the SRM power meter assessed its test –
retest reliability for measuring derived parameters
of aerodynamic drag (e.g. drag area).
Future wind-tunnel studies should also take
account of the following methodological considera-
tions, which were not addressed in the present study:
1. Pedalling ‘‘at race pace’’ should be below
5.5 W � kg71. We chose 5.5 W � kg71 based
on theoretical estimates of previous studies
(Atkinson et al., 2003), and the cyclists main-
tained this pace without difficulty for 10 min.
However, Vogt et al. (2006) recently reported a
mean power output of 5.5 W � kg71 during a
13-km uphill time-trial that lasted 23 min. The
pedalling intensity should be lowered so that it
284 J. Garcıa-Lopez et al.
represents more adequately the mean power
maintained for 30 – 60 min.
2. The bicycle should be fixed to a valid power
meter. We used the Elite Axiom Power Train,
which Bertucci and colleagues (Bertucci, Duc,
Villerius, & Grappe, 2005b) recently showed
does not provide a valid power output measure-
ment. The power output was probably closer to
4.9 – 5.0 W � kg71. Moreover, the power meter
should allow lateral movement of the cyclist – bi-
cycle system, since this affects the estimation of
the power output in the laboratory (Bertucci,
Taiar, & Grappe, 2005c) and could affect the
measurement of aerodynamic drag.
3. Measurement of aerodynamic drag should be
done during longer and homogeneous time
intervals (*30 s). Only Martin et al. (1998)
(30 s) and the present study (5 s) specified
these time intervals; it would be interesting to
implement a standard interval time in wind-
tunnel cycling studies. Thirty seconds seems
most appropriate, since longer measurement
intervals would improve the reliability of the
data.
4. The force balance and the bicycle’s crank
should be synchronized. Our wind tunnel, like
most tunnels not designed with a sporting
application in mind, did not offer this possibi-
lity. None of the published wind-tunnel studies
synchronized the force balance and the bike’s
cranks. It is important to do so, so that the
aerodynamic drag may be registered exactly
based on the number of complete turns of the
crank, avoiding possible interference of the
forces applied to the pedals.
5. The front wheel should rotate, for the reasons
we explained previously.
Conclusions
We have obtained reference values of aerodynamic
drag in five professional cyclists in a wind tunnel, and
observed a high level of heterogeneity in the drag
area values presented by other authors with respect
to the same bicycle positions; this was due to a
number of methodological considerations that
should be taken into account. Our drag area values
were higher than those obtained in other wind-tunnel
studies that did not assess the aerodynamic drag
during effort at race pace and that used different
wheels. Modifications to the bikes decreased the
cyclists’ aerodynamic drag by 14%, although future
studies should evaluate the training and metabolic
adaptations induced by these modifications. The use
of the aero-helmet did not decrease the aerodynamic
drag in all cyclists, because the helmets were not
individualized. Future studies should investigate the
aerodynamic efficiency of new safety headgear. The
drag area to body mass ratio is a good indicator of
aerodynamic performance and it tends to be higher
in small cyclists. Future studies should take this into
account. Similar studies under field conditions (i.e.
in indoor cycle tracks) are necessary. For this
purpose, it is necessary to (1) assess the reliability
and sensitivity in measuring the drag area of the
mobile ergometers available, and (2) validate a
mathematical model to measure drag area during
steady-state cycling in a velodrome, where the
atmospheric conditions can be easily reproduced.
At this time, the wind tunnel is the reference method
to measure drag area in cycling, because it has
demonstrated high reliability and sensitivity. Never-
theless, future studies should take into account the
methodological considerations mentioned previously
to increase its validity.
Acknowledgements
The authors would like to thank the Kelme-Costa
Blanca Team for its collaboration during the study
and the authorization to communicate the results.
Thanks also to: the Technological Institute of
Renewable Energy (ITER) in Tenerife (Spain) for
their help in developing this study, Grad. Susana
Rodrıguez and PhD Juan Zarandona for their
assistance and English translation aid. This work
has been supported by the ‘‘Consejerıa de Educacion
y Cultura de la Junta de Castilla y Leon (Spain)’’ and
the ‘‘Consejo Superior de Deportes. Ministerio de
Educacion, Cultura y Deporte, Spain’’ (Grant 12/
UPB10/07).
References
Astrand, P. O., & Rodahl, K. (1986). Body dimensions and
muscular exercise. In P. O. Astrand & K. Rodahl (Eds.),
Textbook of eork physiology (3rd edn., pp. 391 – 411). New York:
McGraw-Hill.
Atkinson, G., Davison, R., Jeukendrup, A., & Passfield, L. (2003).
Science and cycling: Current knowledge and future directions
for research. Journal of Sports Sciences, 21, 767 – 787.
Bassett, D. R., Kyle, C. R., Passfield, L., Broker, J. P., &
Burke, E. R. (1999). Comparing cycling world hour records,
1967 – 1996: modeling with empirical data. Medicine and Science
in Sports and Exercise, 31, 1665 – 1676.
Bertucci, W., Duc, S., Villerius, V., Pernin, J. N., & Grappe, F.
(2005a). Validity and reliability of the PowerTap mobile cycling
powermeter when compared with the SRM device. International
Journal of Sports Medicine, 26, 868 – 873.
Bertucci, W., Duc, S., Villerius, V., & Grappe, F. (2005b).
Validity and reliability of the Axiom powertrain cycle ergometer
when compared with an SRM powermeter. International Journal
of Sports Medicine, 26, 59 – 65.
Bertucci, W., Taiar, R., & Grappe, F. (2005c). Differences
between sprint tests under laboratory and actual cycling
conditions. Journal of Sports Medicine and Physical Fitness, 45,
277 – 283.
Aerodynamic drag in professional cyclists 285
Broker, J. P., Kyle, C. R., & Burke, E. R. (1999). Racing cyclist
power requirements in 4000-m individual and team pursuits.
Medicine and Science in Sports and Exercise, 31, 1677 – 1685.
Brooks, G. A., Fahey, T. D., White, T. G., & Baldwin, K. M.
(2000). Exercise physiology: Human bioenergetics and its applica-
tions (3rd edn.). New York: McGraw-Hill.
Candau, R. B., Grappe, F., Menard, M., Barbier, B., Millet, G.
Y., Hoffman, M. D. et al. (1999). Simplified deceleration
method for assessment of resistive forces in cycling. Medicine
and Science in Sports and Exercise, 31, 1441 – 1444.
Capelli, C., Schena, F., Zamparo, P., Dal Monte, A., Faina, M., &
Di Prampero, P. E. (1998). Energetics of best performances in
track cycling. Medicine and Science in Sports and Exercise, 30,
614 – 624.
Dal Monte, A., Leonardi, L. M., Menchinelli, C., & Marini, C.
(1987). A new bicycle design based on biomechanics and
advanced technology. International Journal of Sports Biomecha-
nics, 3, 287 – 292.
De Groot, G., Sargeant, A., & Geysel, J. (1995). Air friction and
rolling resistance during cycling. Medicine and Science in Sports
and Exercise, 27, 1090 – 1095.
Di Prampero, P. E. (2000). Cycling on Earth, in space, on the
Moon. European Journal of Applied Physiology, 82, 345 – 360.
Faria, E. K., Parker, D. L., & Faria, I. E. (2005). The science of
cycling: Factors affecting performance – Part 2. Sports Medicine,
36, 313 – 337.
Garcıa-Lopez, J., Peleteiro, J., Rodrıguez, J. A., Cordova, A.,
Gonzalez, M. A., & Villa, J. G. (2002). Biomechanical
assessment of aerodynamic resistance in professional
cyclists: Methodological aspects. In K. E. Gianikellis (Ed.),
Proceedings of the XXth International Symposium on Biomecha-
nics in Sports (pp. 286 – 289). Caceres: University of
Extremadura.
Gardner, A. S., Stephens, S., Martin, D. T., Lawton, E., Lee, H.,
& Jenkins, D. (2004). Accuracy of SRM and Power Tap
monitoring systems for bicycling. Medicine and Science in Sports
and Exercise, 36, 1252 – 1258.
Gonzalez, M. A., Perez, G., Martın, A., Perez, A., Priego, R.,
Robledo, J. et al. (1998). Wind tunnel applications for training
and improvement of sports technique. Investigations on Sport
Sciences, 19, 11 – 71.
Grappe, F., Candau, R., Belli, A., & Rouillon, J. D. (1997).
Aerodynamic drag in field cycling with special reference to the
Obree’s position. Ergonomics, 40, 1299 – 1311.
Grappe, F., Candau, R., Busso, T., & Rouillon, J. D. (1998).
Effect of cycling position on ventilatory and metabolic variables.
International Journal of Sports Medicine, 19, 336 – 341.
Greenwell, D. I., Wood, N. J., Bridge, E. K. L., & Addy, R. J.
(1995). Aerodynamic characteristics of low-drag bicycle wheels.
Aeronautical Journal, 99, 109 – 120.
Heil, D. P. (2001). Body mass scaling of projected frontal area in
competitive cyclists. European Journal of Applied Physiology, 85,
358 – 366.
Heil, D. P., Derrick, T. R., & Whittlesey, S. (1997). The
relationship between preferred and optimal positioning during
submaximal cycle ergometry. European Journal of Applied
Physiology, 75, 160 – 165.
Hoerner, S. F. (1965). Resistance to the advance of a fluid. Paris:
Gauthier-Villars.
Impellizzeri, F. M., Rampinini, E., Sassi, A., Mognoni, P., &
Marcora, S. (2005). Physiological correlates to off-road cycling
performance. Journal of Sports Sciences, 23, 41 – 47.
Jeukendrup, A. E., & Martin, J. (2001). Improving cycling per-
formance. Sports Medicine, 31, 559 – 569.
Kyle, C. R. (1979). Reduction of wind resistance and power
output of racing cyclists and runners traveling in groups.
Ergonomics, 3, 387 – 397.
Kyle, C. R. (1989). The aerodynamics of handlebars and helmets.
Cycling Science, 1, 22 – 25.
Kyle, C. R., & Caiozzo, V. J. (1986). The effect of athletic clothing
aerodynamics upon running speed. Medicine and Science in
Sports and Exercise, 18, 509 – 515.
Lucia, A., Hoyos, H., & Chicharro, J. L. (2000). Physiological
response to professional road cycling: Climbers vs. time
trialists. International Journal of Sports Medicine, 21, 505 – 512.
Martin, J. C., Gardner, A. S., Barras, M., & Martin, D. T. (2006).
Modeling sprint cycling using field derived parameters and
forward integration. Medicine and Science in Sports and Exercise,
38, 592 – 597.
Martin, J. C., Milliken, D. L., Cobb, J. E., McFadden, K. L., &
Coggan, A. D. (1998). Validation of a mathematical model for
road cycling power. Journal of Applied Biomechanics, 14,
276 – 291.
Menard, M. (1992). The aerodynamics in cycling. In International
Symposium of Cycling Biomechanics, Tour 1992 (pp. 1 – 23).
Donostia-San Sebastian: Center for Studies and Technical
Investigations of Guipuzkoa.
Olds, T. (2001). Modelling human locomotion: Applications to
cycling. Sports Medicine, 31, 497 – 509.
Olds, T., & Olive, S. (1999). Methodological considerations in the
determination of projected frontal area in cyclists. Journal of
Sports Sciences, 17, 335 – 345.
Padilla, S., Mujika, I., Angulo, F., & Goiriena, J. J. (2000).
Scientific approach to the 1-h cycling word record: A case
study. Journal of Applied Physiology, 89, 1522 – 1527.
Swain, D. P. (1994). The influence of body mass in endurance
bicycling. Medicine and Science in Sports and Exercise, 26, 58 – 63.
Swain, D. P., Richard, J., Clifford, P. S., Milliken, M. C., &
Stray-Gundersen, J. (1987). Influence of body size on oxygen
consumption during bicycling. Journal of Applied Physiology, 62,
668 – 672.
Tew, G. S., & Sayers, A. T. (1999). Aerodynamics of yawed racing
cycle wheels. Journal of Wind Engineering and Industrial
Aerodynamics, 82, 209 – 222.
UCI (2006). UCI cycling regulations (available at: http://www.
uci.ch/imgArchive/Rules/2road-E.pdf).
Vogt, S., Heinrich, L., Schumacher, Y. O., Blum, A., Roecker, K.,
Dickhuth, H. et al. (2006). Power output during stage racing in
professional road cycling. Medicine and Science in Sports and
Exercise, 38, 147 – 151.
286 J. Garcıa-Lopez et al.
Related Documents