THE DWIGHT DAVID EISENHOWER TRANSPORTATION FELLOWSHIP PROGRAM REFERENCE MARKERS PERFORMANCE SURVEY FINAL REPORT YILIA M. BAUCAGE BOU Graduate Student University of Puerto Rico at Mayagüez June 5, 2002

Welcome message from author
This document is posted to help you gain knowledge. Please leave a comment to let me know what you think about it! Share it to your friends and learn new things together.
Transcript

THE DWIGHT DAVID EISENHOWER TRANSPORTATION
FELLOWSHIP PROGRAM
REFERENCE MARKERS PERFORMANCE SURVEY
FINAL REPORT
YILIA M. BAUCAGE BOU
Graduate Student University of Puerto Rico at Mayagüez
June 5, 2002

ii
TABLE OF CONTENT
PAGE NUMBER
LIST OF ACHRONISMS v
INTRODUCTION 1
BACKGROUND AND IMPORTANCE 3
OBJECTIVES 6
LITERATURE REVIEW 7
Previous Works 7 Wireless Communications 8 Highway Sign Standards 10 Manual on Uniform Traffic Control Devices 12 History of Traffic Control Devices 13 Standardization of Traffic Control Devices 14
Evolution of the MUTCD 15 MUTCD Millennium Edition 16
EXPERIMET DESCRIPTION 18
RESULTS 19
CONCLUSIONS AND RECOMMENDATION 33
REFERENCES 35
APPENDIX 1 Reference Markers Performance Survey questionnaire 37
APPENDIX 2. Results of the Integrated Data Analysis 40

iii
LIST OF FIGURES
Page Number
Figure 1. Reference Markers currently installed in U.S. Highways 2 Figure 2. Example of a Regulatory Stop Sign 11 Figure 3. Examples of Warning Signs 11 Figure 4. Example of a Guide Sign 12 Figure 5. Drivers reporting incidents using reference markers in Lexington 20 Figure 6. Accuracy from drivers as perceived by questionnaire participants in Lexington 20 Figure 7. Improvement in response time perceived by the questionnaire participants In Lexington 21 Figure 8. Drivers reporting incidents using reference markers in New Jersey 22 Figure 9. Accuracy from drivers as perceived by questionnaire participants in New Jersey 23 Figure 10. Improvement in response time perceived by the questionnaire participants in New Jersey 23 Figure 11. Drivers reporting incidents using reference markers in Pennsylvania 24 Figure 12. Accuracy from drivers as perceived by questionnaire participants in Pennsylvania 24 Figure 13. Improvement in response time perceived by the questionnaire participants in Pennsylvania 25 Figure 14. Drivers reporting incidents using reference markers in Tennessee 26 Figure 15. Accuracy from drivers as perceived by questionnaire participants in Tennessee 26 Figure 16. Improvement in response time perceived by the questionnaire participants in Tennessee 27 Figure 17. Drivers reporting incidents using reference markers in Virginia 28 Figure 18. Accuracy from drivers as perceived by questionnaire participants in Virginia 28

iv
Figure 19. Improvement in response time perceived by the questionnaire participants in Virginia 28 Figure 20. Drivers reporting incidents using reference markers for the integrated data analysis 30 Figure 21. Accuracy from drivers as perceived by all the questionnaire participants 31 Figure 22. Improvement in response time perceived by all the questionnaire participants 32

v
LIST OF ACHRONISMS
AASHO American Association of State Highway Officials
AASHTO American Association of State Highway and Transportation Officials
ADA Americans with Disabilities Act
ARTIMIS Advance Regional Traffic Interactive Management and Information
System
CTIA Cellular Telecommunications and Internet Association
FHWA Federal Highway Administration
ITS Intelligent Transportation Systems
JC Joint Committee
MDUCT Manual de Dispositivos Uniformes para el Control del Tránsito
MUTCD Manual on Uniform Traffic Control Devices
NCSHS National Conference on Street and Highway Safety
NHTSA National Highway Traffic Safety Administration
TCC Traffic Control Centers
USA United States of America

1
INTRODUCTION
Reported experience at several traffic control centers nationwide
suggested that wireless phones callers provide an important source of incident
detection information, sometimes resulting in much faster detection. Wireless
phone users can report incidents that traditional incident detection methods
cannot capture. Inaccurate information about the location of the incident is one of
the major obstacles to reliable incident detection by wireless phones. It is usually
difficult for a driver to report his/her location correctly and to provide meaningful
information for the operator at the traffic control center to adequately characterize
the incident in hand. As a result, valuable minutes are lost in providing medical
care as the emergency service provider searches for the crash. This situation is
even worse with unfamiliar motorists.
Location markers have been found to be very useful to avoid this problem.
This signs help informers to know exactly where the incident is, and response
teams will more easily know which route to take to get to the reported location in
the minimum amount of time possible.
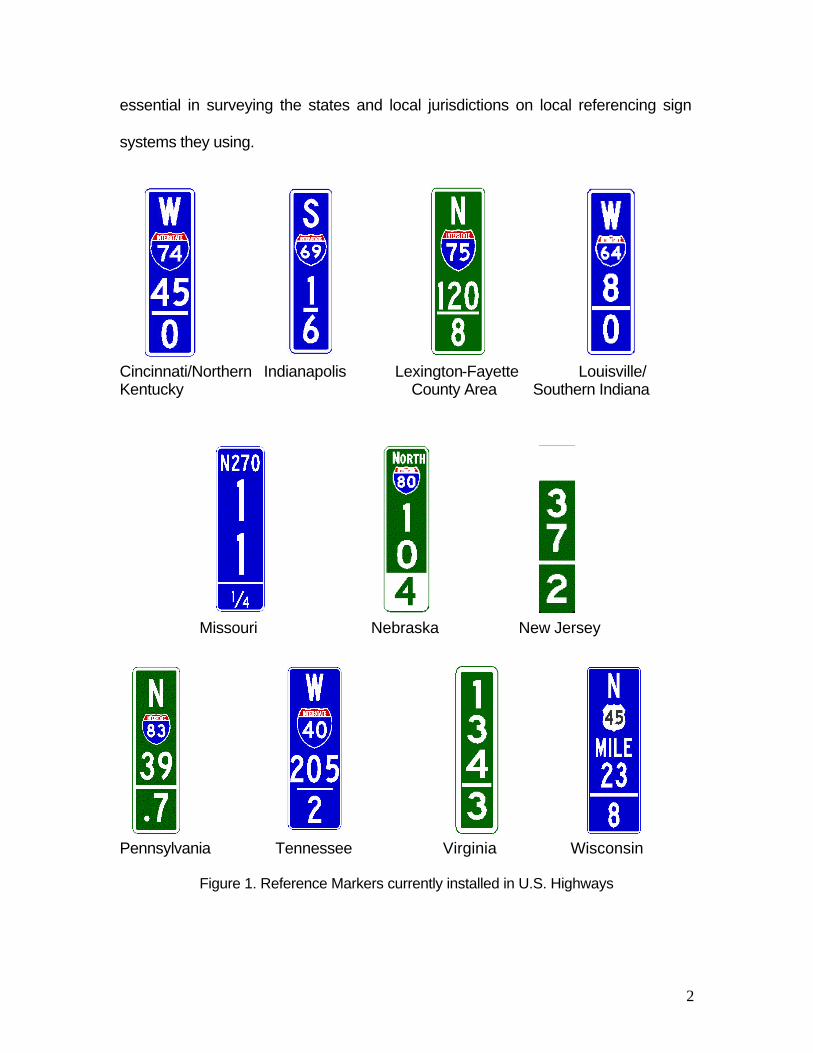
Reference markers have been in used in eleven states within the United
States (Figure 1). Their performance in a real world scenario must be studied in
order to understand their usefulness and possible flaws. An intense study is
2
essential in surveying the states and local jurisdictions on local referencing sign
systems they using.
Cincinnati/Northern Indianapolis Lexington-Fayette Louisville/ Kentucky County Area Southern Indiana Missouri Nebraska New Jersey Pennsylvania Tennessee Virginia Wisconsin
Figure 1. Reference Markers currently installed in U.S. Highways

3
BACKGROUND AND IMPORTANCE
It is estimated that over half of the traffic congestion in the United States is
caused by incidents. Such incidents as accidents, adverse weather conditions,
sporting events, parades, construction and maintenance activities, tourist
attractions, or other events can cause congestions by temporarily increasing
demand or reducing the capacity of the transportation network. Those not directly
affected by the incident can lead to further congestion and delays. Even minor
incidents, such as an abandoned vehicle on the shoulder, can reduce roadway
capacity and create a potential safety hazard. Incident Management programs
have been implemented in various locations throughout the country as a
systematic approach to minimizing the traffic congestion and safety impacts of
incidents. From these programs, Incident Management has proven to be one of
the most successful ways to reduce traffic congestion, but the associate
commitment of resources and institutional arrangements often appears
frightening. Including of new Intelligent Transportation Systems (ITS)
technologies and concepts promises to make Incident Management more
effective, less resource-intensive, and more feasible for widespread application
throughout the United States.
Incident Management services help to immediately and correctly identify a
variety of incidents, and to implement a set of actions to minimize the effects of
those incidents on the movement of goods and people. Furthermore, the service

4
will help to distinguish or forecast hazardous weather, traffic, and facility
conditions so that they can take action in advance to prevent incidents or
minimize their impacts. A major concern and focal point of the Incident
Management user service is improving the response to unpredicted incidents.
These include unexpected events such as vehicle breakdowns, accidents, and
loss of cargo situations. Because these situations give no advanced warnings,
the time of detecting the situation and of implementation of proper response is
critical. The longer it takes to correct this situation, the more congestion there will
be.
The concept of developing a product, based on available research, for
providing location referencing via signs has been a desirable target of incident
management system. While the concept in not new, only recently have
researchers determined the necessity of developing recommendations and
guidance material in regards to location marker signs.
The continued application of advanced communication and information
technologies to traffic systems operations will perform a range of possibilities in
this regard. The implementation of this system will efficiently diminish response
times needed to help alleviate the problem of inaccurate location reporting.
Feasibility of providing freeway location signs at frequent intervals to assist in
accurately locating the scene and the need for rapid verification of the nature,

5
location, magnitude, and appropriate response mechanisms for reported
incidents.

6
OBJECTIVES
The main objective of this research is to access the actual performance of
some of the existing reference markers to understand the importance of the
markers for incident management and to identify flaws to be corrected.

7
LITERATURE REVIEW
Previous Works
The Kentucky Transportation Center at the University of Kentucky
(1) has being investigating the reference markers in Cincinnati-Northern
Kentucky, Lexington-Fayette County Area, Louisville Southern Indiana,
and Indianapolis. The Interim Report, published in December 1998, was
prepared in a cooperative with the Kentucky Transportation Cabinet, the
Ohio Department of Transportation, and Federal Highway Administration.
The first phase of the report document the installation
characteristics for the four markers studied. Information about the system
under the markers were installed, the quantity of markers used, the exact
installation location, the markers size, and the installation cost is
summarized in this part.
The report summarizes the conditions and procedures followed by
the second phase of the project. The second phase consist of a condition
and an opinion survey of reference markers. Results of the condition
surveys present the physical conditions of the installed markers. The
missing, and damage markers were counted and reported. The opinion
survey was conducted by passing questionnaires to staff members related
to the markers. Three different questionnaire versions were distributed to
8
ARTIMIS (Advance Regional Traffic Interactive Management and In
formation System) staff in Cincinnati-Northern Kentucky. The results of the
survey are summarized and analyzed by the reporters
Wireless Communications
Transportation systems are developing constantly and the need to
improve highways capacity have created a new approach that integrates
technology with roadways systems. Technology has permitted
communications to become wireless and these have created a great
advantage in highway safety. Reported experience at several traffic
control centers nationwide suggested that wireless phones callers provide
an important source of incident detection information, sometimes resulting
in much faster detection. Wireless phone users can report incidents that
traditional incident detection methods cannot capture. (8)
The use of cellular phones has become popular among the
population. Cellular phone subscribers in the United States have
increased from about 55 millions at the end of 1997 to approximately
120,880,698 in August 2001(5). In an estimate done by the Cellular
Telecommunications and Internet Association (CTIA) it is expected that
about 33 percent of drivers nationwide are expected to be subscribers (5)
9
This means a great advantage for the implementation of drivers with
cellular phones in the incident report stage.
Reporting of freeway incidents by drivers by personal mobile
phones has become common in the United States (5). A 10 % prevalence
of mobile phones would assure detection of an incident in less than a
minute even under low volume conditions (7).
There is a safety issue related to the use of cellular phone in the
car. Concern with this issue, CTIA developed an educational campaign to
avoid the incorrect use of cellular phones on automobiles. (4)
The National Highway Traffic Safety Administration (NHTSA)
recently released a new survey that confirms that education is a priority on
the driver distraction. The survey also found that 54 percent of drivers
usually have a wireless phone in their vehicle with them, recognizing the
inherent safety benefits. It should be recognized that drivers also carry
cellular phones on their cars for safety reasons, and that sometimes this
could represent the only means to save somebody’s life. All drivers should
be encouraged to use their wireless phones safely and responsibly, but
their safety benefits cannot be overlooked. (4)

10
Highway Sign Standards
When studying markers, it is essential to understand the standards
for highway signs in the United States. It is important to know the
standards that exist and the requirements that these standards have.
Traffic signs are the most extensively used form of traffic control in
the United States. More than 55 million traffic signs line the nation’s
roadsides (2). They provide information about speed limits and road
conditions. They direct traffic along certain routes and to specific
destinations. By using signs, traffic control planners tell drivers what to do,
what to watch for, and where to drive (2).
In the United States the Manual on Uniform Traffic Control Devices
(MUTCD) standardizes traffic control devices such as signs. This manual
contains standards, guidance, and options for signing within the right-of-
way of all types of highways open to public travel (9). MUTCD classifies
signs in three major categories: Regulatory, Warning, and Guidance.
Regulatory signs, as defined by the MUTCD, should be used to
inform the road user of traffic laws and regulations, and indicate the
applicability of the legal requirement. The colors used in most of these
signs are red, white, and black (9). These markers usually have distinctive

11
shapes to avoid confusion. Figure 2 presents an example of a regulatory
sign (the Stop sign).
Figure 2. Example of a Regulatory Stop Sign
(Source: MUTCD Millennium Edition)
Warning signs are designed to inform unexpected conditions on or
adjacent to the road and situations that are not apparent to the road user.
All these signs are diamond shaped with a yellow background and a black
legend (9). Figure 3 presents various examples of typical warning signs.
Figure 3. Examples of Warning Signs (Source: MUTCD Millennium Edition)
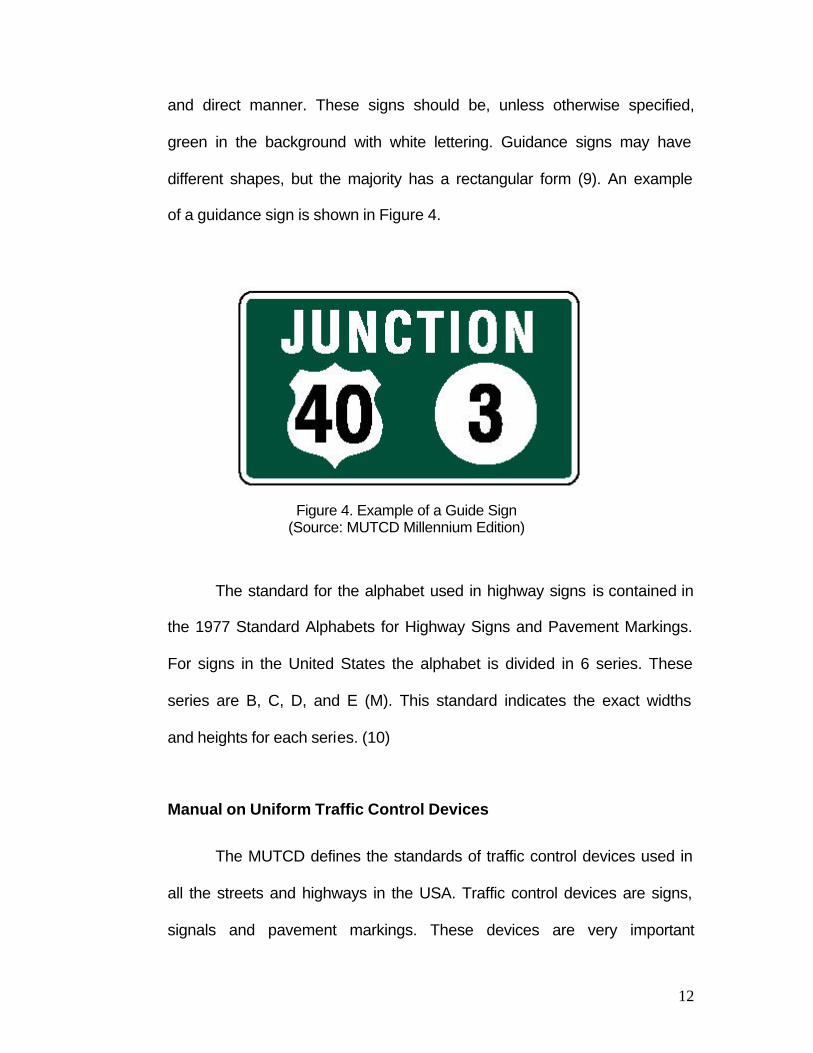
Guidance signs are essential to direct road users, and to inform
them of intersecting routes to help them along their way in the most simple
12
and direct manner. These signs should be, unless otherwise specified,
green in the background with white lettering. Guidance signs may have
different shapes, but the majority has a rectangular form (9). An example
of a guidance sign is shown in Figure 4.
Figure 4. Example of a Guide Sign
(Source: MUTCD Millennium Edition)
The standard for the alphabet used in highway signs is contained in
the 1977 Standard Alphabets for Highway Signs and Pavement Markings.
For signs in the United States the alphabet is divided in 6 series. These
series are B, C, D, and E (M). This standard indicates the exact widths
and heights for each series. (10)
Manual on Uniform Traffic Control Devices
The MUTCD defines the standards of traffic control devices used in
all the streets and highways in the USA. Traffic control devices are signs,
signals and pavement markings. These devices are very important
13
because they improve traffic performance, promote uniformity, and help
improve safety by reducing the number and severity of traffic incidents.
History of Traffic Control Devices
Motor vehicles appeared in the United States at the beginning of
the 20th century (3). In the beginning the use of cars was complicated
because drivers tended to get lost due to the lack of signalization (6). In
1899 owners of the new vehicles in New York City formed the automobile
club responsible for maintaining signs in the principal local highways and
assuring these devices were able to guide drivers to common destinations
(6).
Additional clubs formed around the country, and they started to
signalize their roads. (6) Unfortunately, competition for signing certain
popular routes grew and became increasingly aggressive as to which club
would sign which routes. A study showed that about 40 to 50 percent of
the most frequently traveled roads, had as many as 11 different signs for
one single route.(6)
Other traffic control devices, besides the signs, were developed at
the beginning of this century. In 1911 the first centerline was painted in

14
Michigan, in 1914 the first electric traffic signal was placed in Cleveland,
and in 1920, 3 color traffic signal was installed in Detroit (6).
Standardization of Traffic Control Devices
In the early 1920s, representatives from Indiana, Minnesota, and
Wisconsin gathered to develop a basis for uniform signs and road
markings. The group reported its findings in 1932. The results were
standards for sign shapes, some of which are still in use as we enter the
21st century. In 1924, the First National Conference on Street and
Highway Safety (NCSHS) improved earlier efforts and proposed the
standardization of colors for traffic control devices. Again, many of the
approved signs remain in use today. In 1924, the American Association of
State Highway Officials (AASHO, the forerunner of AASHTO) took earlier
efforts one step further by issuing a report that combined the previous
efforts to standardize sign shapes and colors (6).
The importance of the AASHO report is that it became the basis for
the first guidebook, Manual and Specifications for the Manufacture,
Display, and Erection of U.S. Standard Road Markers and Signs,
published in 1927. However, that manual exclusively addressed the use
and design for signs, and did not address signals or markings. Following a
national survey of existing traffic control devices, the Manual on Street

15
Traffic Signs, Signals, and Markings was published (6). The Manual
included signs, signals, pavement markings, and devices for safety zones.
Evolution of the MUTCD
In 1932, AASHO and NCSHS formed the first Joint Committee on
Uniform Traffic Control Devices (JC). In 1935, the first MUTCD was
published. It was approved as an American Standard by November 1935.
The content of this first manual was separated into four parts that
addressed signs, markings, signals, and islands (6).
This edition started to grow and various supplements were written
afterward. In 1939, the JC issued the first supplement that recommended
changes in signs illumination, speed signs, no-passing zones paving
markings, signal warrants, and pedestrian signals. A new supplement was
published in 1942. It described the types of traffic control devices to be
used in blackout conditions (as a result from the war) (6).
In 1948, a new edition of the MUTCD was published. The new
format used has every control device divided to avoid repetition or
confusion. It also addresses the need to simplify word signs by adopting a
rounded-letter alphabet. Other editions of the MUTCD were written in
1961 and 1971. The 1961 edition adopted two new parts; one addressed

16
construction and maintenance operations, and the other included civil
defense signing. The 1971 edition had definitions for the use of the words
“should”, “shall”, and “may”. In this edition school signs were also adopted
(6).
In 1978 the fifth edition of the MUTCD was published. This edition
contained two new parts that addressed highway-rail crossings and traffic
control for bicycle facilities. The next edition was published ten years later,
in 1988. The 1988 edition suffered a change in 1993 with the inclusion of
part VI concerning temporary traffic signals. The 1988 MUTCD edition was
the last edition ever written before the current Millennium Edition (9).
MUTCD Millennium Edition
The last edition of the MUTCD currently available was published in
December 2000. This new edition will make it easier for users to keep up
with updates and revisions (9). The edition was made in a book mode
divided in modules, in CD-ROM and on the Internet
(http://mutcd.fhwa.dot.gov), which permits greater access to new
information (9).
The millennium edition was formatted to improve overall
organization and discussion, and facilitate availability and understanding.

17
The edition contains changes of various sections including: new signs and
pavement markings, changes in standards and guidance, two new
sections (rural roads and light rails), major changes in work zones section,
and the addition of the Americans with Disabilities Act (ADA) and
pedestrian guidance. (9).
There are two chapters of the MUTCD that are directly related to
this research project: chapter 2 and chapter 5. Chapter 2 contains the
regulations for traffic signs. Chapter 5 is related to traffic control devices
for low-volume flows. Both chapters are related to the research because
they have regulations concerning traffic signs, which are the devices this
work is based on.

18
EXPERIMENT DESCRIPTION
In order to understand the performance level of reference markers that are
currently operational. In order to obtain information on how these markers are
working in real world situations, a questionnaire was developed (Appendix 1).
Six markers were randomly chosen for this survey. The selected markers
are the ones located in Lexington, New Jersey, Missouri, Pennsylvania,
Tennessee, and Virginia. Questionnaires were distributed to state highway
officials and response center operators in this locations.
The questionnaire was developed to assess the performance of these
devices based on the opinion of the personnel that is working with them on a
daily basis. It intended to find out if any instructions were given to operators
about the use of the markers. The questionnaires inquire about the configuration
of any educational campaign to educate the public about the usage of these new
markers.

19
RESULTS
The performance survey was distributed to six offices in the USA that
manages reference markers as explained previously. The participant areas were:
Lexington/Fayette County Area, Missouri, New Jersey, Pennsylvania,
Tennessee, and Virginia. Results were studied independently for each area and
altogether.
Lexington/Fayette County Area
In this area the performance survey questionnaire was distributed to 17
state highway officials and response center operators. These markers have been
in use on two main interstates (I-64, and I-75) in this area for approximately 3
years. Results showed that according to the majority of the participants an
educational campaign for the drivers has not been conducted in this particular
area.
Results based on the opinion of the majority of the participants showed that:
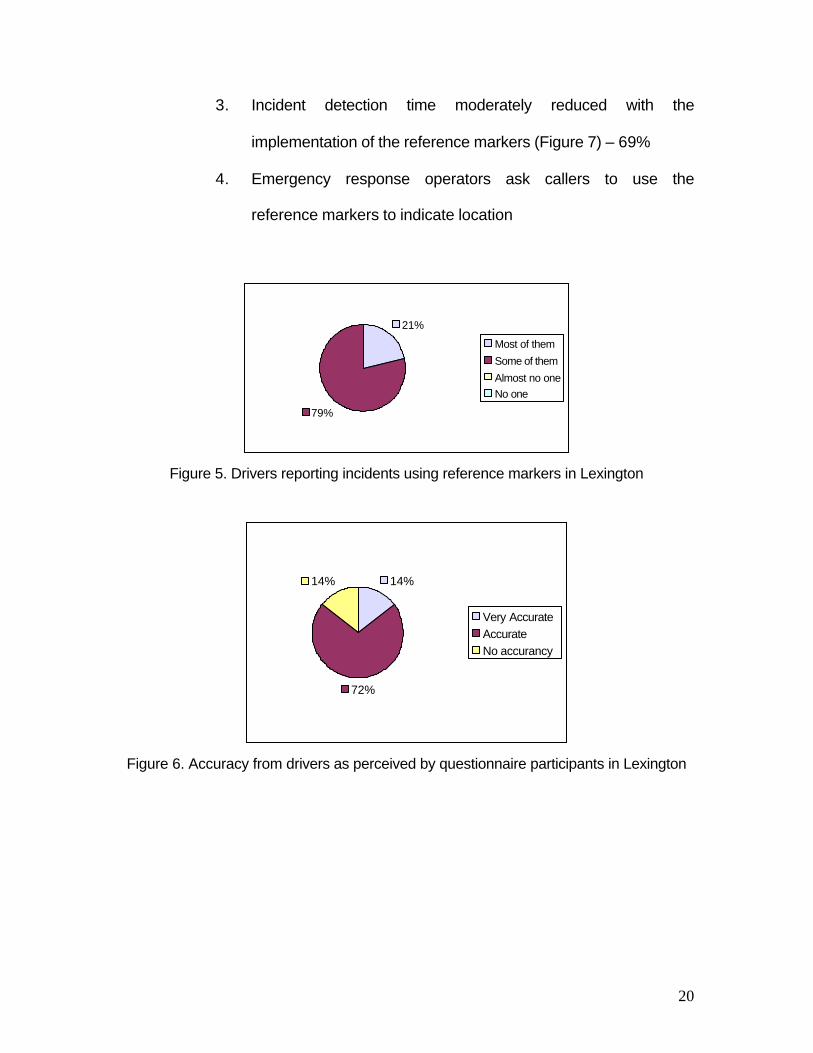
1. Only some of the drivers reporting incidents use the reference
markers (Figure 5) – 79%
2. When drivers use markers for location, they are at least
accurate on their report (Figure 6) – 86%
20
3. Incident detection time moderately reduced with the
implementation of the reference markers (Figure 7) – 69%
4. Emergency response operators ask callers to use the
reference markers to indicate location
21%
79%
Most of them
Some of them
Almost no oneNo one
Figure 5. Drivers reporting incidents using reference markers in Lexington
14%
72%
14%
Very Accurate AccurateNo accurancy
Figure 6. Accuracy from drivers as perceived by questionnaire participants in Lexington

21
23%
69%
8%
Considerably
Moderatly
Minimal
None
Figure 7. Improvement in response time perceived by the questionnaire participants in
Lexington
Missouri
Only one performance survey questionnaire was distributed in the
Missouri area due to personnel availability constraints. The markers have been
operational in the Saint Louis area for approximately 4 to 5 years. The participant
stated that an educational campaign for the drivers has been conducted in this
area.
It was also stated on the questionnaire that some of the drivers calling to
inform incidents use the markers for reference. When callers refer to reference
markers for location, they tend to be accurate on their location report. A
moderate reduction on incident response time has been gained in this area since
the markers were located.

22
New Jersey
In this location three participants responded to the performance survey
questionnaires. Markers on two main interstate in this area have been
operational for about 4 to 7 years as stated by participants. In this area, no public
educational campaign related to these devices has been performed.
Results based on the opinion of the majority of the participants showed that:
1. Only some of the drivers reporting incidents used the reference
markers (Figure 8) – 67%
2. When drivers use markers for location, they are accurate on
their report (Figure 9) – 67%
3. Incident detection time moderately reduced with the
implementation of the reference markers (Figure 10) – 67%
4. Emergency response operators always ask callers to use the
reference markers to indicate location
33%
67%
Some of them
Most of them
Figure 8. Drivers reporting incidents using reference markers in New Jersey

23
33%
67%
Accurate
Very Accurate
Figure 9. Accuracy from drivers as perceived by questionnaire participants in New Jersey
3 3 %
67%
Moderatly
Cosiderably
Figure 10. Improvement in response time perceived by the questionnaire participants
in New Jersey
Pennsylvania
The questionnaires for this area were distributed to 12 state highway
officials and response centers. The markers in three main highways in this area
have been working from 4 to 5 years. Based on the answers, an educational
campaign for drivers has not been done yet.
Results based on the opinion of the majority of the participants showed that:
24
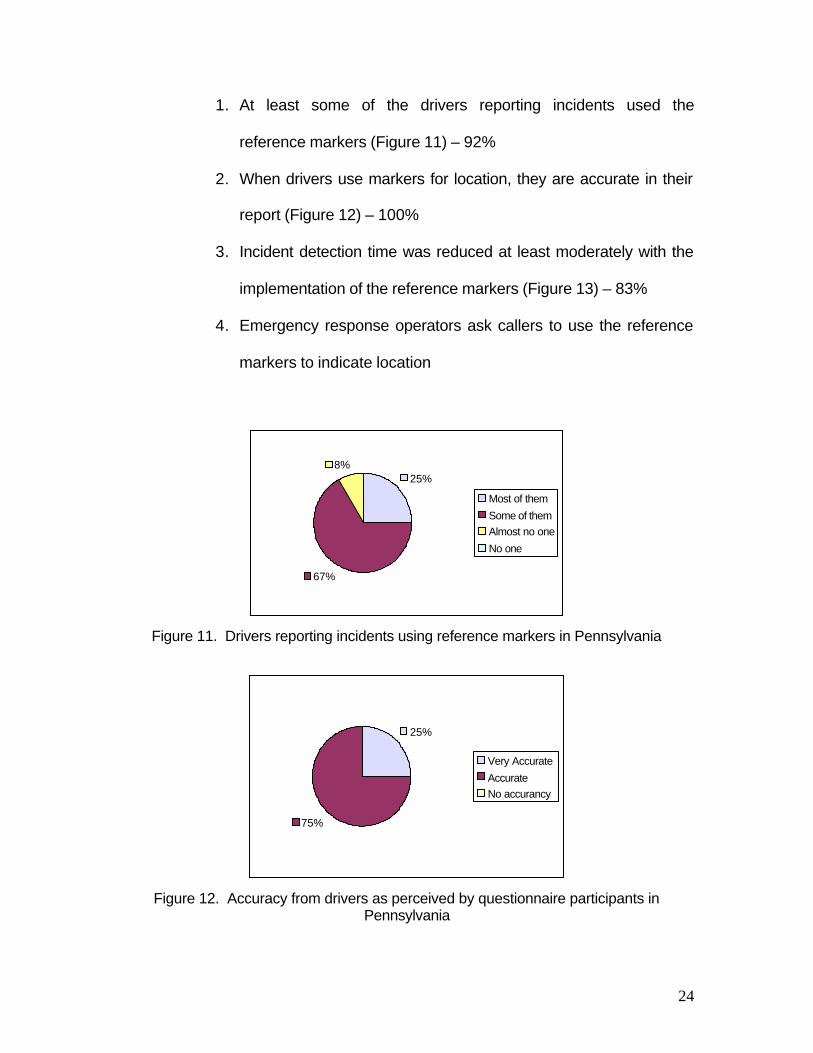
1. At least some of the drivers reporting incidents used the
reference markers (Figure 11) – 92%
2. When drivers use markers for location, they are accurate in their
report (Figure 12) – 100%
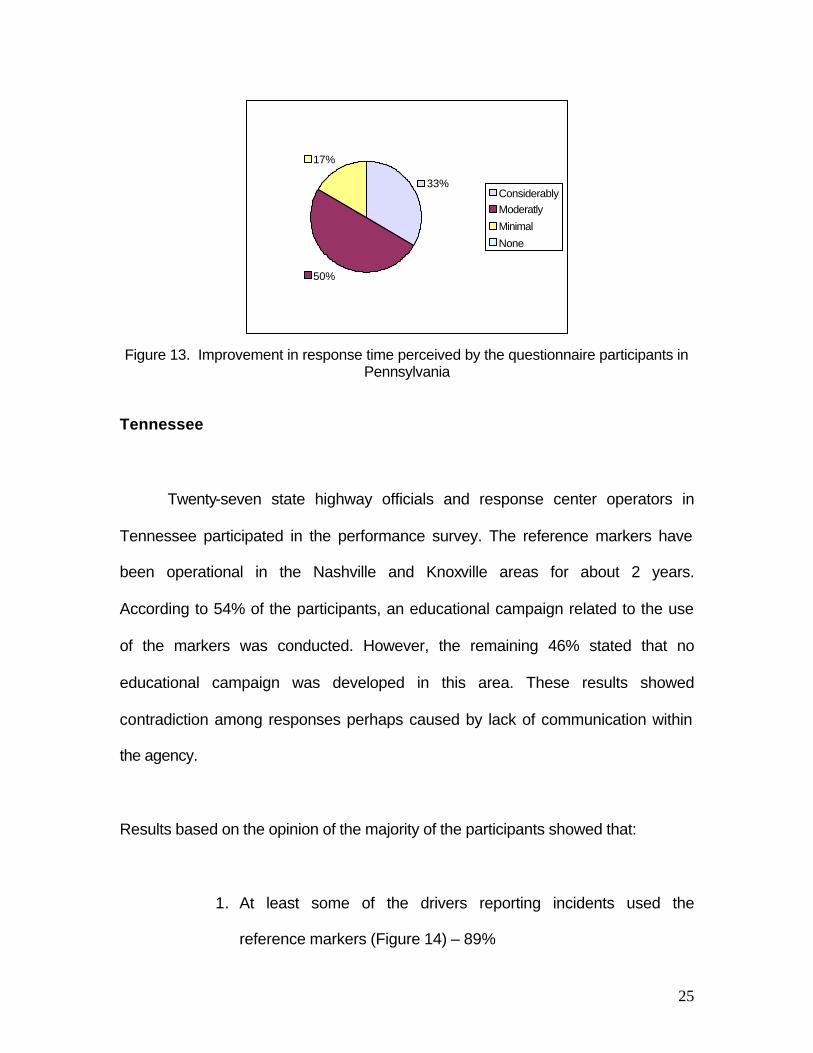
3. Incident detection time was reduced at least moderately with the
implementation of the reference markers (Figure 13) – 83%
4. Emergency response operators ask callers to use the reference
markers to indicate location
25%
67%
8%
Most of them
Some of themAlmost no one
No one
Figure 11. Drivers reporting incidents using reference markers in Pennsylvania
25%
75%
Very Accurate
AccurateNo accurancy
Figure 12. Accuracy from drivers as perceived by questionnaire participants in
Pennsylvania
25
33%
50%
17%
ConsiderablyModeratly
Minimal
None
Figure 13. Improvement in response time perceived by the questionnaire participants in
Pennsylvania
Tennessee
Twenty-seven state highway officials and response center operators in
Tennessee participated in the performance survey. The reference markers have
been operational in the Nashville and Knoxville areas for about 2 years.
According to 54% of the participants, an educational campaign related to the use
of the markers was conducted. However, the remaining 46% stated that no
educational campaign was developed in this area. These results showed
contradiction among responses perhaps caused by lack of communication within
the agency.
Results based on the opinion of the majority of the participants showed that:
1. At least some of the drivers reporting incidents used the
reference markers (Figure 14) – 89%

26
2. When drivers use markers for location, they are accurate in their
report (Figure 15) – 78%
3. Incident detection time reduced at least moderately with the
implementation of the reference markers (Figure 16) – 85%
4. Emergency response operators always ask callers to use the
reference markers to indicate location
30%
59%
11%
Most of them
Some of them
Almost no one
No one
Figure 14. Drivers reporting incidents using reference markers in Tennessee
33%
45%
22%
Very Accurate AccurateNo accurancy
Figure 15. Accuracy from drivers as perceived by questionnaire participants in
Tennessee

27
7%
78%
15%
Considerably
Moderatly
Minimal
None
Figure 16. Improvement in response time perceived by the questionnaire participants in
Tennessee
Virginia
In the Virginia area 13 state highway officials and response center
operators participated in the performance survey. Markers have been working in
a major interstate in this area for 3-5 years. An educational campaign for highway
users about the marker has not been performed in the area based on the
participant’s responses.
Results based on the opinion of the majority of the participants showed that:
1. Most of the drivers reporting incidents used the reference
markers (Figure 17) – 62%
2. When drivers use markers for location, they are accurate in their
report (Figure 18) – 62%
3. Incident detection time was considerably reduced with the
implementation of the reference markers (Figure 19) – 77%

28
4. Emergency response operators always ask callers to use the
reference markers to indicate location
62%
38% Most of themSome of them
Almost no one
No one
Figure 17. Drivers reporting incidents using reference markers in Virginia
38%
62%
Very Accurate Accurate
No accurancy
Figure 18. Accuracy from drivers as perceived by questionnaire participants in Virginia
77%
23%
Considerably
ModeratlyMinimal
None
Figure 19. Improvement in response time perceived by the questionnaire participants in
Virginia
29
Integrated Data Analysis
All the data from the six areas was grouped for the analysis (Appendix 2).
The 73 questionnaires were studied to obtained results that will explain how in
general these markers are working in the highways and roads where they are
displayed in experimental stage granted by the FHWA.
Responses obtained for the different questions asked are presented here:
1. Do drivers use these signs to report incidents location?
The results presented on Figure 20 show that the majority of the
participants (66%) indicate that some of the callers use the reference markers for
incidents location. A 23% indicated that most drivers use the marker, and only a
7% believed that almost none of the callers used these signs. The remaining 4%
indicated that none of the drivers used the markers for this purpose.

30
23%
66%
7%4%
Most of them
Some of them
Almost no one
No one
Figure 20. Drivers reporting incidents using reference markers for the integrated data
analysis
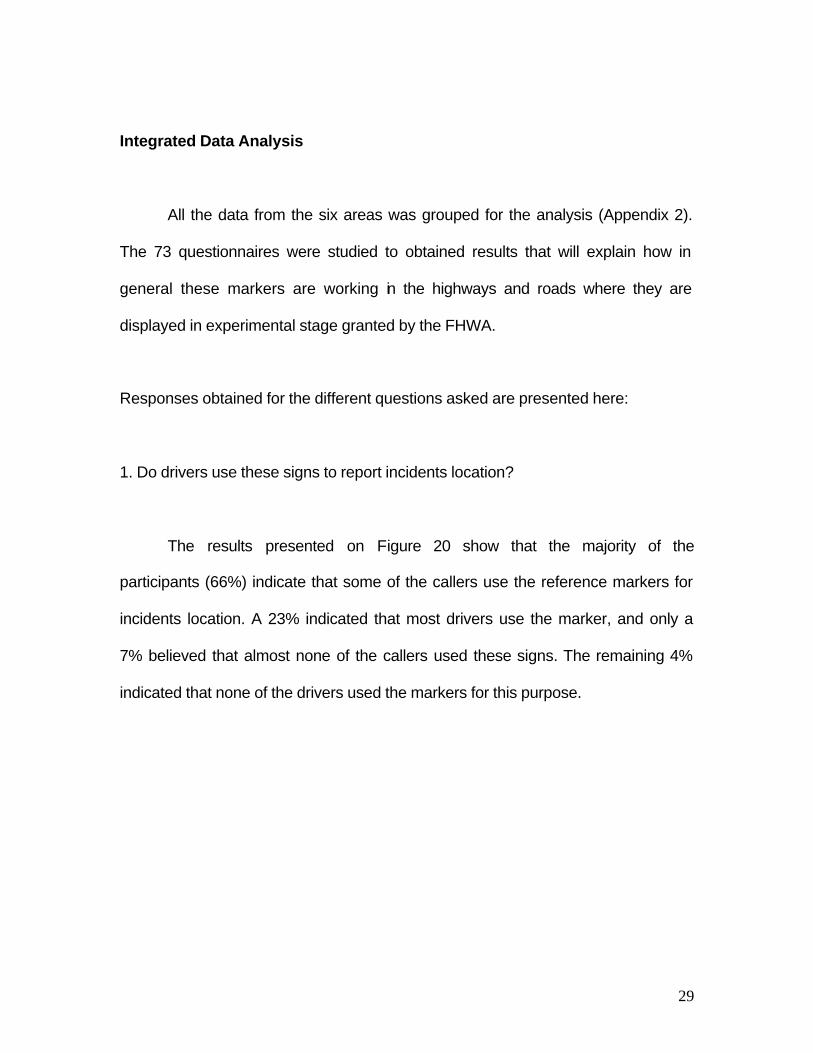
2. How accurate are the drivers when reporting incidents location using these
markers?
Results on Figure 21 show that the majority (63%) of the responders
indicated that drivers using reference marker for location were accurate in their
reports. Twenty six percent (26%) indicated that drivers were very accurate.
Adding these two results lead to an 89% of the responders indicating some
accuracy when using the markers. Seven percent (7%) responded that drivers
presented no accuracy; the remaining 4% did not answer this question.
31
63%
26%
7%
4%
Very AccurateAccurateNo accurancyNo Response
Figure 21. Accuracy from drivers as perceived by all the questionnaire participants
3. According to your experience, the incident detection time has improved with
the implementation of these signs.
The responses obtained are shown in Figure 22. Forty four percent of the
participants answered that incident detection was moderately reduced when the
markers were implemented. Thirty eight percent (38%) indicated that the
response time was considerably reduced. Adding these two results showed that
the majority (82%) of the participants indicated that the markers reduced
response time to some extent. Twelve percent believed that it was only minimally
reduced, while only a 5% indicated that no reduction on response time took place
after the implementation of the markers.

32
38%
5%
12%
44%
ConsiderablyModeratly
MinimalNone
Figure 22. Improvement in response time perceived by all the questionnaire participants
It was also found in this analysis that 88% of the interviewed operators
indicated that when they receive a call to inform of an incident situation they ask
drivers to use the markers for location. This percentage was divided in 43% of
responders that always use this procedure, and 45% that only apply the
procedure sometimes.

33
CONCLUSIONS AND RECOMMENDATIONS
The results obtained showed that the markers have proven to be
advantageous in incident management system reducing incident detection times.
It was found that some drivers are using the reference markers when reporting
incidents in the real world. Drivers using the markers were usually accurate in
their reports, showing a good level of marker understanding. This situation is
improved because the vast majority of the response center operators interviewed
asked callers to use the markers to identify the precise location of the incident
they were reporting.
The results of this performance survey also showed a lack of public
awareness and the need for an educational campaign directed to teaching
general public about the new reference markers. The results lead to the
recommendation of the usage of these markers as part of the incident
management programs around the USA, but complemented by a public
awareness and educational campaign, and a good training to TCC operators
about the usage and importance of these markers. An effective public awareness
educational campaign can be performed in various manners such as:
1. Creation of an educational brochure
2. Press releases
3. Driving license examination
34
4. Driving license renewals
5. Advertisements on TV or on the road
Reference mile markers are important safety devices. Their main purpose
is to provide fast and precise information mostly in high-speed highways. For
incident detection every minute is important not only for congestion, but to save
lives. Therefore, having a system to inform drivers their exact location under
incident situations should be a major task to avoid liability issues related to lack
of information along the highway. This is particularly important in cases where
multiple jurisdictions are involved. In such cases it is crucial to identify the exact
incidents location in order to send the corresponding emergency team through
the shortest path.
35
REFERENCES
1. ARTIMIS; http://www.dot.state.oh.us/dist8/artimis.htm; April 24, 2000
2. Encarta Encyclopedia; “Traffic Control”; 2002
3. Encarta Encyclopedia; “Transportation History”; 2002
4. Federal Highway Administration.” Standard Alphabets for Highway Signs
and Pavement Markings”; 1977 Edition; PAGES 30-31
5. Federal Highway Administration-Nebraska Division;” Federal-Aid:
Intelligent Transportation Systems: Activities in Nebraska”;
http://www.fhwa.dot.gov/nediv/itsnum2.htm; August 3, 2000
6. H Gene Hawskins, Jr.; “MUTCD Development”; ITE Journal; 1991-1994
7. Tennessee Department of Transportation. “Intelligent Transportation
Systems Strategy Plan”; Annual Report; July 1999
8. The Kentucky Transportation Cabinet; “Trimarc Takes to the Streets”
;http://www.kytc.state.ky.us/news/TRIMARC1.htm; August 9, 2000

36
9. US Department of Transportation, Federal Highway Administration;
“Manual on Uniform Traffic Control Devises – Millennium Edition”;
December 2000
10. US Department of Transportation, Federal Highway Administration;
”Standard Alphabets for Highway Signs and Pavement Markings”; 1977
Edition

37
APPENDIX 1. REFERENCE MARKERS PERFORMANCE SURVEY
QUESTIONNAIRE

38
Reference Signs Performance Survey Please answer the following questions as accurate and clear as possible
The University of Puerto Rico at Mayagüez is performing a project for FHWA about reference
signs. This questionnaire has been developed to find out how the existing signs have been
working around the country. Your help will be very significant for the success of this research.
Demographic Information:
1. Where do you work?
___________________________________________________________
2. What is your position in this work?
___________________________________________________________
3. How is your job related to reference markers signs?
___________________________________________________________
___________________________________________________________
Select the best answer, and if you have any comment, please write them in the
provided space:
Reference Signs Markers:
1. How long have these signs being in use in your area?
q 6-7 years (6)
q 4-5 years (5)
q 3 years (4)
q 2 years (3)
q 1 year (2)
q Less than a year (1)
q Don’t know (7)
Comments:
39
2. Do the drivers use these signs to report incidents location?
q Most of them (1)
q Some of them (2)
q Almost no one (3)
q No one (4)
3. How accurate are the drivers when reporting incidents location using
these markers?
q Very accurate (1)
q Accurate (2)
q No accuracy (3)
4. According to your experience, the incident detection time has improved
with the implementation of these signs:
q Considerably (1)
q Moderately (2)
q Minimally (3)
q None (4)
Public Awareness:
1. Have any campaign been conducted in your area to educate drivers about
the function of these signs?
q Yes (1)
q No (2)
2. If you are a response center operator: When you receive a call, do you
ask the caller to report his/her position using these signs?
q Always
q Sometimes
q Never
Comments:
Comments:
Comments:
Comments:
Comments:

40
APPENDIX 2. RESULTS OF THE INTEGRATED DATA ANALYSIS

41
Analysis Summary Data variable: Time Number of observations: 73 Number of unique values: 7 The StatAdvisor --------------- This procedure counts the number of times each of the 7 unique values of Time occurs. It then displays tables and graphs of the tabulation.
Barchart for Time
0 5 10 15 20 25 30
frequency
1
2
3
4
5
6
7
Frequency Table for Time ------------------------------------------------------------------------ Relative Cumulative Cum. Rel. Class Value Frequency Frequency Frequency Frequency ------------------------------------------------------------------------ 1 1 2 0.0274 2 0.0274 2 2 8 0.1096 10 0.1370 3 3 26 0.3562 36 0.4932 4 4 10 0.1370 46 0.6301 5 5 11 0.1507 57 0.7808 6 6 8 0.1096 65 0.8904 7 7 8 0.1096 73 1.0000 ------------------------------------------------------------------------ The StatAdvisor --------------- This table shows the number of times each value of Time occurred, as well as percentages and cumulative statistics. For example, in 2 rows of the data file Time equaled 1. This represents 2.73973% of the 73 values in the file. The rightmost two columns give cumulative counts and percentages from the top of the table down.

42
Piechart for Time
Time1234567
2.74%10.96%
35.62%
13.70%
15.07%
10.96%
10.96%
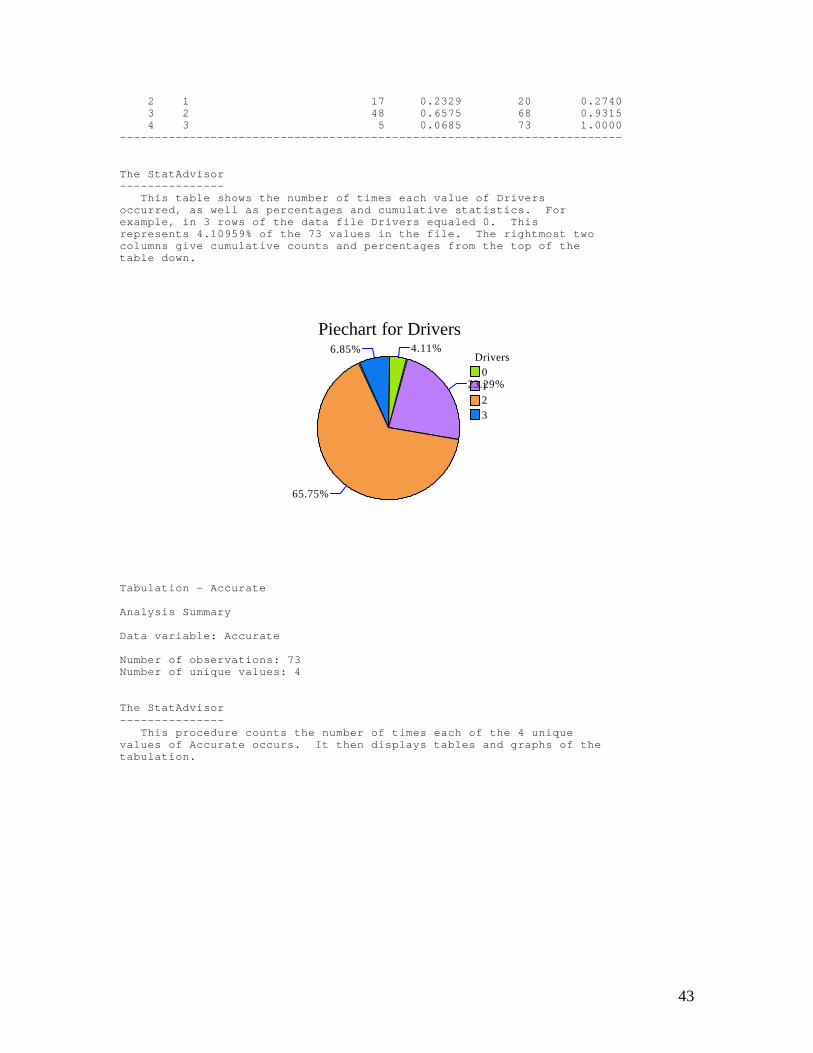
Tabulation - Drivers Analysis Summary Data variable: Drivers Number of observations: 73 Number of unique values: 4 The StatAdvisor --------------- This procedure counts the number of times each of the 4 unique values of Drivers occurs. It then displays tables and graphs of the tabulation.
Barchart for Drivers
frequency0 10 20 30 40 50
0
1
2
3
Frequency Table for Drivers ------------------------------------------------------------------------ Relative Cumulative Cum. Rel. Class Value Frequency Frequency Frequency Frequency ------------------------------------------------------------------------ 1 0 3 0.0411 3 0.0411
43
2 1 17 0.2329 20 0.2740 3 2 48 0.6575 68 0.9315 4 3 5 0.0685 73 1.0000 ------------------------------------------------------------------------ The StatAdvisor --------------- This table shows the number of times each value of Drivers occurred, as well as percentages and cumulative statistics. For example, in 3 rows of the data file Drivers equaled 0. This represents 4.10959% of the 73 values in the file. The rightmost two columns give cumulative counts and percentages from the top of the table down.
Piechart for Drivers
Drivers0123
4.11%
23.29%
65.75%
6.85%
Tabulation - Accurate Analysis Summary Data variable: Accurate Number of observations: 73 Number of unique values: 4 The StatAdvisor --------------- This procedure counts the number of times each of the 4 unique values of Accurate occurs. It then displays tables and graphs of the tabulation.

44
Barchart for Accurate
frequency0 10 20 30 40 50
0
1
2
3
Frequency Table for Accurate ------------------------------------------------------------------------ Relative Cumulative Cum. Rel. Class Value Frequency Frequency Frequency Frequency ------------------------------------------------------------------------ 1 0 3 0.0411 3 0.0411 2 1 19 0.2603 22 0.3014 3 2 46 0.6301 68 0.9315 4 3 5 0.0685 73 1.0000 ------------------------------------------------------------------------ The StatAdvisor --------------- This table shows the number of times each value of Accurate occurred, as well as percentages and cumulative statistics. For example, in 3 rows of the data file Accurate equaled 0. This represents 4.10959% of the 73 values in the file. The rightmost two columns give cumulative counts and percentages from the top of the table down.
Piechart for Accurate
Accurate0123
4.11%
26.03%
63.01%
6.85%
Tabulation - Detection
45
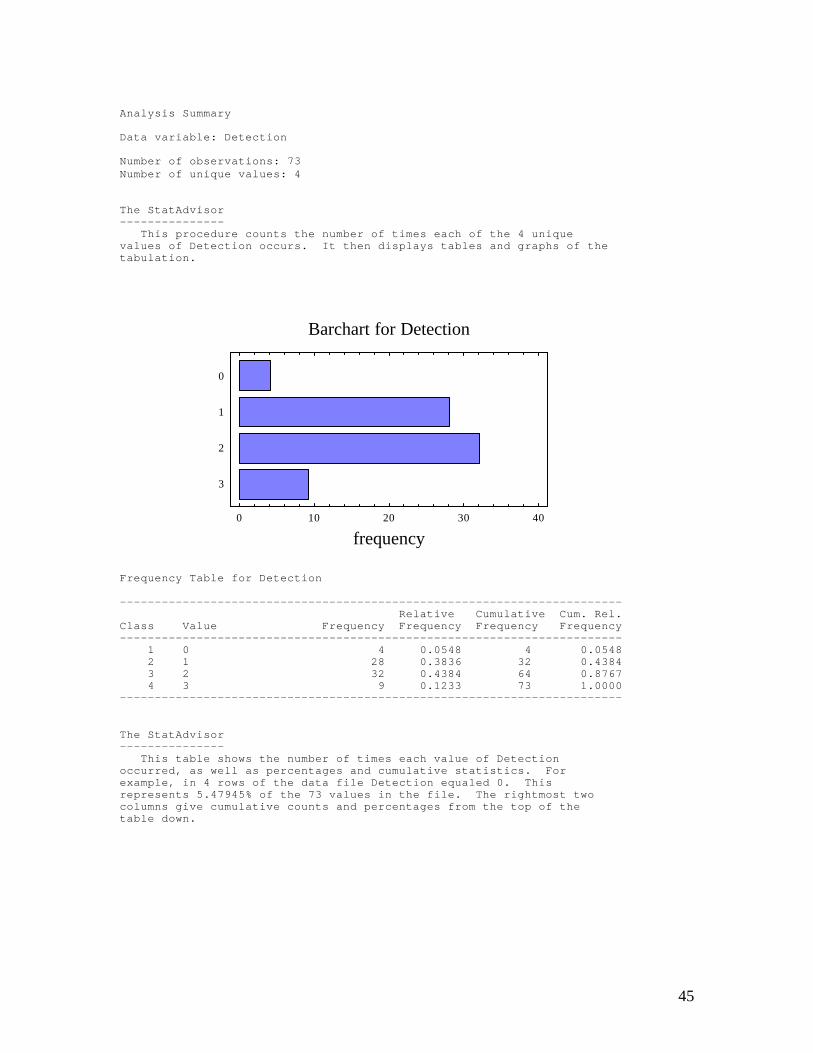
Analysis Summary Data variable: Detection Number of observations: 73 Number of unique values: 4 The StatAdvisor --------------- This procedure counts the number of times each of the 4 unique values of Detection occurs. It then displays tables and graphs of the tabulation.
Barchart for Detection
frequency0 10 20 30 40
0
1
2
3
Frequency Table for Detection ------------------------------------------------------------------------ Relative Cumulative Cum. Rel. Class Value Frequency Frequency Frequency Frequency ------------------------------------------------------------------------ 1 0 4 0.0548 4 0.0548 2 1 28 0.3836 32 0.4384 3 2 32 0.4384 64 0.8767 4 3 9 0.1233 73 1.0000 ------------------------------------------------------------------------ The StatAdvisor --------------- This table shows the number of times each value of Detection occurred, as well as percentages and cumulative statistics. For example, in 4 rows of the data file Detection equaled 0. This represents 5.47945% of the 73 values in the file. The rightmost two columns give cumulative counts and percentages from the top of the table down.

46
Piechart for Detection
Detection0123
5.48%
38.36%
43.84%
12.33%
Tabulation - Campaign Analysis Summary Data variable: Campaign Number of observations: 73 Number of unique values: 3 The StatAdvisor --------------- This procedure counts the number of times each of the 3 unique values of Campaign occurs. It then displays tables and graphs of the tabulation.
Barchart for Campaign
frequency0 10 20 30 40
0
1
2
Frequency Table for Campaign ------------------------------------------------------------------------ Relative Cumulative Cum. Rel. Class Value Frequency Frequency Frequency Frequency ------------------------------------------------------------------------ 1 0 6 0.0822 6 0.0822

47
2 1 27 0.3699 33 0.4521 3 2 40 0.5479 73 1.0000 ------------------------------------------------------------------------ The StatAdvisor --------------- This table shows the number of times each value of Campaign occurred, as well as percentages and cumulative statistics. For example, in 6 rows of the data file Campaign equaled 0. This represents 8.21918% of the 73 values in the file. The rightmost two columns give cumulative counts and percentages from the top of the table down.
Piechart for Campaign
Campaign012
8.22%
36.99%54.79%
Tabulation - Operator Analysis Summary Data variable: Operator Number of observations: 73 Number of unique values: 4 The StatAdvisor --------------- This procedure counts the number of times each of the 4 unique values of Operator occurs. It then displays tables and graphs of the tabulation.

48
Barchart for Operator
frequency0 10 20 30 40
0
1
2
3
Frequency Table for Operator ------------------------------------------------------------------------ Relative Cumulative Cum. Rel. Class Value Frequency Frequency Frequency Frequency ------------------------------------------------------------------------ 1 0 31 0.4247 31 0.4247 2 1 33 0.4521 64 0.8767 3 2 8 0.1096 72 0.9863 4 3 1 0.0137 73 1.0000 ------------------------------------------------------------------------ The StatAdvisor --------------- This table shows the number of times each value of Operator occurred, as well as percentages and cumulative statistics. For example, in 31 rows of the data file Operator equaled 0. This represents 42.4658% of the 73 values in the file. The rightmost two columns give cumulative counts and percentages from the top of the table down.
Piechart for Operator
Operator012342.47%
45.21%
10.96%1.37%
Related Documents


