Reference Data for the Density and Viscosity of Liquid Cadmium, Cobalt, Gallium, Indium, Mercury, Silicon, Thallium, and Zinc Marc J. Assael, a) and Ivi J. Armyra Chemical Engineering Department, Aristotle University, 54124 Thessaloniki, Greece Juergen Brillo Institut fu ¨r Materialphysik im Weltraum, Deutsches Zentrum fu ¨r Luft- und Raumfahrt, 51170 Köln, Germany Sergei V. Stankus Kutateladze Institute of Thermophysics, Siberian Brunch of the Russian Academy of Sciences, Lavrentyev ave. 1, 630090 Novosibirsk, Russia Jiangtao Wu Center of Thermal and Fluid Science, School of Energy and Power Engineering, Xi’an Jiaotong University, Shaanxi 710049, People’s Republic of China William A. Wakeham Chemical Engineering Department, Imperial College, London SW7 2BY, United Kingdom (Received 2 May 2012; accepted 31 May 2012; published online 16 July 2012) The available experimental data for the density and viscosity of liquid cadmium, cobalt, gallium, indium, mercury, silicon, thallium, and zinc have been critically examined with the intention of establishing both a density and a viscosity standard. All experimental data have been categorized into primary and secondary data according to the quality of measurement, the technique employed and the presentation of the data, as specified by a series of criteria. The proposed standard reference correlations for the density of liquid cadmium, cobalt, gallium, indium, silicon, thallium, and zinc are characterized by percent deviations at the 95% confidence level of 0.6, 2.1, 0.4, 0.5, 2.2, 0.9, and 0.7, respectively. In the case of mercury, since density reference values already exist, no further work was carried out. The standard reference correlations for the viscosity of liquid cadmium, cobalt, gallium, indium, mercury, silicon, thallium, and zinc are characterized by percent devia- tions at the 95% confidence level of 9.4, 14.0, 13.5, 2.1, 7.3, 15.7, 5.1, and 9.3, respectively. # 2012 American Institute of Physics. [http://dx.doi.org/10.1063/1.4729873] Key words: cadmium; cobalt; density; gallium; indium; melt; mercury; reference data; silicon; tin; thallium; viscosity; zinc CONTENTS 1. Introduction ............................. 2 2. Primary and Secondary Data ................ 2 3. Density ................................. 3 3.1. Experimental techniques .................. 3 3.2. Data compilation ......................... 3 3.3. Density reference correlation ............. 6 4. Viscosity ................................ 8 4.1. Experimental techniques .................. 8 4.2. Data compilation ......................... 9 4.3. Viscosity reference correlation ............ 12 5. Conclusions ............................. 15 Acknowledgments ........................ 15 6. References .............................. 15 List of Tables 1. Datasets considered for the density of liquid cad- mium, cobalt, gallium, indium, silicon, thallium, and zinc........................................ 4 2. Temperature range, coefficients, and deviations at the 95% confidence level of Eq. (1)............. 6 3. Recommended values for the density and viscosity of cadmium, cobalt, gallium, indium, mercury, silicon, thallium, and zinc....................... 9 a) Author to whom correspondence should be addressed; Electronic mail: [email protected]. # 2012 American Institute of Physics. 0047-2689/2012/41(3)/033101/16/$30.00 033101-1 J. Phys. Chem. Ref. Data, Vol. 41, No. 3, 2012 Downloaded 16 Jul 2012 to 132.163.193.180. Redistribution subject to AIP license or copyright; see http://jpcrd.aip.org/about/rights_and_permissions

Welcome message from author
This document is posted to help you gain knowledge. Please leave a comment to let me know what you think about it! Share it to your friends and learn new things together.
Transcript

Gallium, Indium, Mercury,
Reference Data for the Density and Viscosity of Liquid Cadmium, Cobalt,Silicon, Thallium, and Zinc
Marc J. Assael, a) and Ivi J. ArmyraChemical Engineering Department, Aristotle University, 54124 Thessaloniki, Greece
Juergen BrilloInstitut fur Materialphysik im Weltraum, Deutsches Zentrum fur Luft- und Raumfahrt, 51170 Köln, Germany
Sergei V. StankusKutateladze Institute of Thermophysics, Siberian Brunch of the Russian Academy of Sciences, Lavrentyev ave. 1, 630090 Novosibirsk, Russia
Jiangtao WuCenter of Thermal and Fluid Science, School of Energy and Power Engineering, Xi’an Jiaotong University,
Shaanxi 710049, People’s Republic of China
William A. WakehamChemical Engineering Department, Imperial College, London SW7 2BY, United Kingdom
(Received 2 May 2012; accepted 31 May 2012; published online 16 July 2012)
a)Author to whom cor
# 2012 American Ins
0047-2689/2012/41(3
Down
The available experimental data for the density and viscosity of liquid cadmium, cobalt,
gallium, indium, mercury, silicon, thallium, and zinc have been critically examined with
the intention of establishing both a density and a viscosity standard. All experimental data
have been categorized into primary and secondary data according to the quality of
measurement, the technique employed and the presentation of the data, as specified by
a series of criteria. The proposed standard reference correlations for the density of liquid
cadmium, cobalt, gallium, indium, silicon, thallium, and zinc are characterized by percent
deviations at the 95% confidence level of 0.6, 2.1, 0.4, 0.5, 2.2, 0.9, and 0.7, respectively. In
the case of mercury, since density reference values already exist, no further work was
carried out. The standard reference correlations for the viscosity of liquid cadmium, cobalt,
gallium, indium, mercury, silicon, thallium, and zinc are characterized by percent devia-
tions at the 95% confidence level of 9.4, 14.0, 13.5, 2.1, 7.3, 15.7, 5.1, and 9.3, respectively.
# 2012 American Institute of Physics. [http://dx.doi.org/10.1063/1.4729873]
Key words: cadmium; cobalt; density; gallium; indium; melt; mercury; reference data; silicon; tin; thallium;
viscosity; zinc
CONTENTS 5. Conclusions . . . . . . . . . . . . . . . . . . . . . . . . . . . . . 15
1. Introduction . . . . . . . . . . . . . . . . . . . . . . . . . . . . .
respondence should be addressed; Electron
titute of Physics.
)/033101/16/$30.00
loaded 16 Jul 2012 to 132.163.193.180. Redistribution
2
2. Primary and Secondary Data . . . . . . . . . . . . . . . .
23. Density . . . . . . . . . . . . . . . . . . . . . . . . . . . . . . . . .
33.1. Experimental techniques . . . . . . . . . . . . . . . . . .
33.2. Data compilation . . . . . . . . . . . . . . . . . . . . . . . . .
33.3. Density reference correlation . . . . . . . . . . . . .
64. Viscosity . . . . . . . . . . . . . . . . . . . . . . . . . . . . . . . .
84.1. Experimental techniques . . . . . . . . . . . . . . . . . .
84.2. Data compilation . . . . . . . . . . . . . . . . . . . . . . . . .
94.3. Viscosity reference correlation . . . . . . . . . . . .
12ic mail:
033101-1
subject to AIP l
J. Phys. Chem. Ref. Data, Vol. 41, No.
icense or copyright; see http://jpcrd.aip.org/about/rights_and_permissions
Acknowledgments . . . . . . . . . . . . . . . . . . . . . . . .
156. References . . . . . . . . . . . . . . . . . . . . . . . . . . . . . .
15List of Tables
1. Datasets considered for the density of liquid cad-
mium, cobalt, gallium, indium, silicon, thallium,
and zinc. . . . . . . . . . . . . . . . . . . . . . . . . . . . . . . . . . . . . . . .
42. Temperature range, coefficients, and deviations at
the 95% confidence level of Eq. (1). . . . . . . . . . . . .
63. Recommended values for the density and viscosity
of cadmium, cobalt, gallium, indium, mercury,
silicon, thallium, and zinc.. . . . . . . . . . . . . . . . . . . . . .
93, 2012

033101-2 ASSAEL ET AL.
4. Datasets considered for the viscosity of liquid
cadmium, cobalt, gallium, indium, mercury, sili-
con, thallium, and zinc.. . . . . . . . . . . . . . . . . . . . . . . . .
J. Phys. Chem. Ref. Data, Vol. 41, No. 3, 2012
Downloaded 16 Jul 2012 to 132.163.193.180. Redistribution s
10
5. Temperature range, coefficients, and deviations at
the 95% confidence level of Eq. (2). . . . . . . . . . . . .
13List of Figures
1. Primary density data and their percentage devia-tions from Eq. (1) for liquid cadmium as a functionof temperature. . . . . . . . . . . . . . . . . . . . . . . . . . . . . . . . .
72. Primary density data and their percentage devia-tions from Eq. (1) for liquid cobalt as a function oftemperature.. . . . . . . . . . . . . . . . . . . . . . . . . . . . . . . . . . .
73. Primary density data and their percentage devia-tions fromEq. (1) for liquid gallium as a function oftemperature. . . . . . . . . . . . . . . . . . . . . . . . . . . . . . . . . . .
74. Primary density data and their percentage devia-tions from Eq. (1) for liquid indium as a function oftemperature. . . . . . . . . . . . . . . . . . . . . . . . . . . . . . . . . . .
75. Primary density data and their percentage devia-tions from Eq. (1) for liquid silicon as a function oftemperature. . . . . . . . . . . . . . . . . . . . . . . . . . . . . . . . . . .
86. Primary density data and their percentage devia-tions from Eq. (1) for liquid thallium as a functionof temperature. . . . . . . . . . . . . . . . . . . . . . . . . . . . . . . . .
87. Primary density data and their percentage devia-tions from Eq. (1) for liquid zinc as a function oftemperature. . . . . . . . . . . . . . . . . . . . . . . . . . . . . . . . . . .
88. Primary viscosity data and their percentagedeviations from Eq. (2) for liquid cadmium as afunction of temperature. . . . . . . . . . . . . . . . . . . . . . . .
139. Primary viscosity data and their percentagedeviations from Eq. (2) for liquid cobalt as afunction of temperature. . . . . . . . . . . . . . . . . . . . . . . .
1310. Primary viscosity data and their percentagedeviations from Eq. (2) for liquid gallium as afunction of temperature. . . . . . . . . . . . . . . . . . . . . . . .
1311. Primary viscosity data and their percentagedeviations from Eq. (2) for liquid indium as afunction of temperature. . . . . . . . . . . . . . . . . . . . . . . .
1412. Primary viscosity data and their percentagedeviations from Eq. (2) for liquid mercury as afunction of temperature. . . . . . . . . . . . . . . . . . . . . . . .
1413. Primary viscosity data and their percentagedeviations from Eq. (2) for liquid silicon as afunction of temperature. . . . . . . . . . . . . . . . . . . . . . . .
1414. Primary viscosity data and their percentagedeviations from Eq. (2) for liquid thallium as afunction of temperature. . . . . . . . . . . . . . . . . . . . . . . .
1415. Primary viscosity data and their percentagedeviations from Eq. (2) for liquid zinc as a functionof temperature. . . . . . . . . . . . . . . . . . . . . . . . . . . . . . . . .
15ubject to AIP lice
1. Introduction
There is a continual increase in the use of mathematical
models to simulate a variety of processes involving liquid
metals such as shape-casting; primary and secondary metal
production; powder production by spray forming; and weld-
ing, but also in more specialized uses like self-repair broken
circuits that employ micro-capsules filled with liquid metals.
Depending on which aspect of the process is modeled, there is
a need for viscosity and density data for the relevant alloys.
Historically, there are wide discrepancies in the viscosity data
reported for the metallic elements and alloys.1 For example,
there is a spread of about 400% in the reported values of the
viscosity for molten aluminum and about 100% for molten
iron. For these reasons, a project was initiated by the Inter-
national Association for Transport Properties, IATP (former
Subcommittee on Transport Properties of the International
Union of Pure and Applied Chemistry, IUPAC) to critically
evaluate the density and the viscosity of selected liquidmetals.
Thus:
(i) In 2006, recommended values for the density and the
viscosity of liquid aluminum and iron were published,2
as a result of a project supported by IUPAC.
(ii) Following this, in 2010, values for the density and
viscosity for liquid copper and tin were proposed.3 That
workwas also carried out under the auspices of IATP and
was supported by IUPAC.
(iii) In 2011, the work was continued and reference correla-
tions of the density and viscosity of liquid bismuth,
nickel, lead, silver, and antimony were proposed.4
(iv) The current paper concludes the work on the density and
viscosity of pure liquid metals by presenting reference
correlations for liquid cadmium, cobalt, gallium, indium,
mercury, silicon, thallium, and zinc. For the remaining
liquid metals, very limited literature is available.
2. Primary and Secondary Data
According to the recommendation adopted by the Sub-
committee of Transport Properties (now known as The
International Association for Transport Properties) of the Inter-
national Union of Pure and Applied Chemistry, experimental
data canbeplaced into two categories according to the quality of
the data: primary and secondary data. As already discussed,2,3
the primary data are identified by the following criteria:5
(i) Measurements must have been made with a primary
experimental apparatus, i.e., one for which a complete
working equation is available.
(ii) The form of the working equation should be such that
sensitivity of the property measured to the principal vari-
ables doesnotmagnify the randomerrorsofmeasurement.
(iii) All principal variables should be measurable to a high
degree of precision.
(iv) The published work should include some description of
purification methods and a guarantee of the purity of the
sample.
nse or copyright; see http://jpcrd.aip.org/about/rights_and_permissions

REFERENCE DATA FOR DENSITY AND VISCOSITY OF LIQUID METALS 033101-3
(v) The data reportedmust be unsmoothed data.While graphs
and fitted equations are useful summaries for the reader,
they are not sufficient for standardization purposes.
(vi) The lack of accepted values of the density and viscosity of
standard reference materials implies that only absolute,
and not relative, measurement results can be considered.
(vii) Explicit quantitative estimates of the uncertainty of
reported values should be given, taking into account the
precision of experimental measurements and possible
systematic errors.
(viii) Owing to the desire to produce reference values of low
uncertainty, limits must be imposed on the uncertainty of
the primary datasets. These limits are determined after
critical evaluation of the existing datasets.
These criteria have been successfully employed to propose
standard reference values for the viscosity and thermal con-
ductivity of fluids over a wide range of conditions, with
uncertainties in the region of 1%.
In the case, however, of the liquid metals, it was argued that
these criteria needed to be relaxed slightly, especially since the
uncertainty of the measurements is much higher, primarily
owing to (i) the difficulties associated with the techniques
employed at such high temperatures, and (ii) the purity of the
liquid metal sample which can be strongly affected by the
surrounding atmosphere and the container used for the melt.
3. Density
3.1. Experimental techniques
Among the experimental work identified for the density of
molten materials, a large number of techniques have been
employed to measure the density of molten cadmium, cobalt,
gallium, indium, mercury, silicon, thallium, and zinc. Methods
employed include: Archimedean; pycnometric; bubble-pres-
sure; sessile-drop; falling-drop; levitation; gamma radiation
attenuation. Thesemethods have been presented in our previous
compilation2 and will only very briefly be discussed here.
The most commonly employed technique for the measure-
ment of the density is the Archimedean technique. According
to this method, a solid sinker of known weight in air is
suspended by a wire attached to the arm of a balance. When
the sinker is entirely immersed in the liquidmetal specimen, an
apparent loss of weight is observed, arising mainly from the
buoyant force exerted by the liquid metal sample. The loss of
weight is simply related to the density of the liquid of immer-
sion. Another very accurate absolute technique is the pycno-
metric technique, which refers to the filling of a vessel or
crucible of known volume with the liquid metal. Upon freez-
ing, the solid metal specimen is weighed at room temperature.
A similar technique, based on the principle of weighing the
solid, is the areometric technique.
Themaximum-bubble-pressure technique is based upon the
formation of a hemispherical bubble of an inert gas at the tip of
a capillary tube immersed to a certain depth in the melt. The
density can be determined by measuring the difference in
the overpressure required to form a hemispherical bubble of
Downloaded 16 Jul 2012 to 132.163.193.180. Redistribution subject to AIP l
the inert gas at the tip of the capillary at different depths in the
liquid. The technique is not as accurate as the pycnometric
method but allows density measurements at higher tempera-
tures. The sessile-drop technique employs a liquid drop of
knownmass resting on a plate or substrate. Provided the shape
of the drop is fully symmetrical, the volume of the drop, and
hence its density, can accurately be calculated.
In the levitation technique, a small drop of the liquid metal
can be supported by one of the three techniques: (a) aero-
dynamically by gas flow in a convergent/divergent nozzle;(b) electrostatically by electrically charging the drop and
holding it steady using an electrical potential; or (c) by
electromagnetic forces using a high-frequency coil. In the
case of aerodynamic and electrostatic levitation, the drop is
heated by a high-power laser but frequently the electromag-
netic field is used to both levitate and heat the drop. The
volume of the drop is obtained from sectional images which
are frequently taken from three orthogonal directions.
The gamma radiation attenuation technique is based on the
attenuation of a γ-ray beam passing through the liquid metal.
The incident beam is attenuated according to the mass of the
liquid metal. Finally, a fast pulse-heating technique coupled
with fast photography has recently been employed for the
measurement of density of liquid metals.
3.2. Data compilation
Table 1 presents the datasets found for the measurement of
the density of liquid cadmium, cobalt, gallium, indium, silicon,
thallium, and zinc. In this table, the purity of the sample, the
technique employed, and the uncertainty quoted are also
presented. Furthermore, the form in which the data are pre-
sented and the temperature range covered are also noted. The
datasets have been classified into primary and secondary sets
according to the criteria presented in Sec. 2 and in conjunction
with a review of the techniques described in Sec. 3.1. More
specifically, following the brief presentation of the various
techniques employed for themeasurement of the density of the
liquid metals, the following can be noted:
(i) Cadmium: Seven investigators reported density mea-
surements for cadmium. The measurements of Crawley9
were performed in absolute pycnometerswith lowuncer-
tainty and were considered as primary data. The mea-
surements of Karamurzov7 and Alchagirov et al.,8
performed in an areometer densimeter, and those of
Fisher and Philips,11 taken in bubble-pressure instru-
ments, were also part of the primary dataset, together
with the γ-ray measurements of Stankus6 and of
Schneider and Heymer.10 Finally, the measurements of
Chentsov,12 performed in a sessile-drop instrument,
were considered as secondary data, as they were much
higher than the results of other workers and also showed
quite a different temperature gradient.
(ii) Cobalt: In the case of cobalt, 11 sets of density measure-
ments were considered. All these sets were characterized
by an uncertainty of less than 1%, except the measure-
ments of Brillo et al.13 and Saito et al.,19 which were
J. Phys. Chem. Ref. Data, Vol. 41, No. 3, 2012
icense or copyright; see http://jpcrd.aip.org/about/rights_and_permissions

TABLE 1. Datasets considered for the density of liquid cadmium, cobalt, gallium, indium, silicon, thallium, and zinc.
First author Publ. year
Technique
employedaPurity
(mass%)
Uncertainty
quoted (%) No. of data Form of databTemperature
range (K)
Cadmium
Primary data
Stankus6 1992 γ-Ray (Abs) 99.99 0.2 7 P 594–700
Karamurzov7 1975 Areometer (Abs) na 1.0 6 E 594–800
Alchagirov8 1974 Areometer (Abs) na 0.1 6 E 594–773
Crawley9 1968 Pycnometer (Abs) 99.999 0.02 7 P 608–709
Schneider10 1956 γ-Ray (Abs) na 0.2 5 P 658–833
Fisher11 1954 Bubble pressure
(Abs)
99.989 na 4 P 603–673
Secondary data
Chentsov12 1971 Sessile drop 99.99 1 5 E 600–800
Cobalt
Primary data
Brillo13 2006 EML (Abs) na 1.5 14 D 1724–1875
Sato14 2002 Pycnometer (Abs) 99.8 0.5 5 D 1774–1867
Stankus6 1992 γ-Ray (Abs) 99.9 0.5 5 P 1765–1950
Lucas15 1972 Archimedean
(Abs)
na 0.3 5 E 1774–1972
Watanabe16 1971 Bubble pressure
(Ads)
99.9 0.7 8 E 1793–1898
Shergin17 1970 Sessile drop (Abs) na 1 7 E 1765–2123
Levin18 1970 Sessile drop (Abs) na 1 10 D 1774–2077
Saito19 1969 EML (Abs) na 1.4 24 D 2060–2470
Vertman20 1964 Sessile drop (Abs) 99.9 0.2 6 D 1769–1926
Frohberg21 1964 Bubble pressure
(Abs)
99.97 na 6 D 1775–1843
Kirshebaum22 1963 Archimedean
(Abs), bubble
pressure (Abs)
99.9 0.2 10 D 1858–2391
Secondary data
–
Gallium
Primary data
Yagodin23 2008 γ-Ray (Abs) 99.999 0.2 50 D 526–1501
Stankus24 1991 γ-Ray (Abs) 99.9997 0.2 15 E 310–1000
Alchagirov25 1974 Areometer (Abs) na 0.1 11 E 310–773
Nal’giev26 1973 Pycnometer (Abs) 99.99 na 10 P 303–723
Koster27 1970 Pycnometer (Abs) 99.999 0.03 12 P 323–873
Nizhenko28 1965 Sessile drop (Abs) na 0.03 11 E 380–1580
Secondary data
Geng29 2010 Archimedean 99.9 5 20 D 312–1073
Yatsenko30 1972 Sessile drop (Abs) na 1.5 18 D 327–1179
Spells31 1935 na na na 17 P 326–1373
Indium
Primary data
Alchagirov8 2004 Pycnometer (Abs) 99.9 0.1 45 P 433–580
Wang32 2004 γ-Ray na na 14 E 429–1073
McClelland33 1995 Sessile drop 99.99 0.95 5 D 429–774
Stankus24 1991 γ-Ray (Abs) 99.9997 0.05 13 E 532–1100
Karamurzov7 1975 Areometer (Abs) na 1.0 8 E 429–773
Berthou34 1970 Archimedean
(Abs)
99.999 na 19 E 433–805
Crawley9 1968 Pycnometer (Abs) 99.999 0.05 12 P 434–537
Schneider10 1956 γ-Ray (Abs) na 0.2 7 P 504–694
Secondary data
Yatsenko30 1972 Sessile drop (Abs) na 1.5 9 D 454–921
Williams35 1950 Dilatometer (Rel) 99.98 0.2 5 E 437–573
Gamertsfelder36 1941 Dilatometer (Rel) na na 5 E 430–550
Silicon
Primary data
Watanabe37 2007 EML (Abs) na na 7 E 1683–1990
Zhou38 2003 ESL (Abs) 99.999 1.5 7 E 1683–1830
Mukai39 2000 Sessile drop na 0.3 8 E 1683–1853
033101-4 ASSAEL ET AL.
J. Phys. Chem. Ref. Data, Vol. 41, No. 3, 2012
Downloaded 16 Jul 2012 to 132.163.193.180. Redistribution subject to AIP license or copyright; see http://jpcrd.aip.org/about/rights_and_permissions

TABLE 1. Datasets considered for the density of liquid cadmium, cobalt, gallium, indium, silicon, thallium, and zinc.—Continued
First author Publ. year
Technique
employedaPurity
(mass%)
Uncertainty
quoted (%) No. of data Form of databTemperature
range (K)
Sato40 2000 Pycnometric
(Abs)
na 0.5 7 P 1698–1853
Oshaka41 1997 ESL (Abs) 99.9995 0.2 7 E 1683–1825
Rhim42 1997 ESL (Abs) 99.9995 0.2 7 E 1683–1825
Sasaki43 1993 Archimedean
(Abs)
na 1.1 10 D 1719–1910
Khilya44 1973 Sessile drop na 1.5 7 E 1773–1863
Shergin17 1970 Sessile drop na 1.0 8 E 1683–2000
Glazov45 1967 Archimedean
(Abs)
na 1.5 7 E 1728–1906
Lucas46 1964 Bubble pressure
(Abs)
na 0.2 6 P 1683–1923
Secondary data
Langen47 1998 EML (Abs) na 5.0 4 D 1682–1759
Vatolin48 1963 Pycnometer na 2.0 1 P 1713
Logan49 1958 X-ray diffraction na 1.0 1 P 1698
Thallium
Primary data
Stankus50 1988 γ-Ray (Abs) 99.95 0.07–0.11 5 P 577–800
Kanda51 1979 Archimedean
(Abs)
99.999 na 18 P 577–773
Martinez52 1973 Archimedean
(Abs)
99.999 0.03 14 P 577–1178
Berthou53 1968 Archimedean
(Abs)
99.999 na 12 E 580–1020
Crawley54 1968 Pycnometer (Abs) 99.999 0.1 10 P 587–781
Schneider10 1956 γ-Ray (Abs) na 0.2 10 P 665–924
Secondary data
–
Zinc
Primary data
Stankus50 1988 γ-Ray (Abs) 99.95 0.07–0.11 3 P 693–900
Karamurzov7 1975 Areometer (Abs) na 1.0 6 E 723–953
Thresh55 1968 Pycnometer (Abs) 99.99 0.1 20 D 693–792
Lucas46 1964 Bubble pressure
(Abs)
na 0.2 10 D 708–907
Gebhardt56 1955 Archimedean
(Abs)
na na 3 P 773–973
Secondary data
Otter57 1996 Pulse-heating
(Abs)
99.99 4.0 7 E 700–1300
aAbs = absolute; ESL = electrostatic levitation; EML = electromagnetic levitation; Rel = relative.bD = diagram; E = equation; P = points.
REFERENCE DATA FOR DENSITY AND VISCOSITY OF LIQUID METALS 033101-5
performed by the electromagnetic levitation technique
with uncertainties of 1.5% and 1.4%, respectively.
Because both these sets were considered as primary data
in a previous publication,4 in this work they were
also considered in the same category. All remaining
datasets were also considered as primary data. The
measurements of Sato et al.14 were performed in an
absolute pycnometer, while the measurements of Stan-
kus6 were performed in a γ-ray instrument. The Archi-
medean technique was used by Lucas15 and
Kirshenbaum and Cahill.22 Bubble-pressure instruments
were employed by Watanabe,16 Frohberg and Weber,21
andKirshenbaum andCahill.22 Finally, Shergin,17 Levin
et al.,18 and Vertman et al.20 employed a sessile-drop
device.
Downloaded 16 Jul 2012 to 132.163.193.180. Redistribution subject to AIP l
(iii) Gallium: In the case of gallium, the recent measurements
ofGeng et al.29were considered as secondary data owing
to their high uncertainty. Density measurements were
reported by Spells31 in 1935, but with no details of the
method or the uncertainty; these were also considered as
secondary data. Also the measurements of Yatsenko
et al.30 performed in a sessile-drop instrument were
considered as secondary data, as they showed a different
temperature gradient than the other investigators. The
remaining six sets of measurements were all primary
data. Pycnometers were employed by Nal’giev and
Ibragimov26 and by Köster et al.,27 an areometer densi-
meter was employed by Alchagirov,25 while Nizhenko
et al.28 employed a sessile-drop instrument, andYagodin
et al.23 and Stankus and Tyagel’sky24 γ-ray instruments.
J. Phys. Chem. Ref. Data, Vol. 41, No. 3, 2012
icense or copyright; see http://jpcrd.aip.org/about/rights_and_permissions

033101-6 ASSAEL ET AL.
(iv) Indium: 11 investigators reported measurements of the
densityof indium.Themeasurements ofAlchagirovetal.8
and Crawley9 were performed in absolute pycnometers
andwith very lowuncertainty andwere thus considered as
primary data. The measurements of Stankus and Tya-
gel’sky24 and Schneider and Heymer,10 performed in a γ-ray instrumentwith very lowuncertainty,were alsopart of
the primary dataset. It should however be noted that,
although the measurements of Stankus and Tyagel’sky24
extended to 1500 K, we have not included the data above
1100Kbecause no other investigator performedmeasure-
ments higher than 1100 K. Part of the primary dataset
were also themeasurements ofWang et al.32 performed in
a γ-ray instrument and of Karamurzov7 performed in an
areometer densimeter, as well as the measurements of
McClelland and Sze33 performed in a sessile-drop appa-
ratus and Berthou and Tougas53 obtained by the Archi-
medean technique.ThemeasurementsofYatsenko et al.30
performed in a sessile-drop instrument with 1.5% uncer-
taintywere not included in the primary set, as they showed
a different temperature gradient than the rest (the same
different trend was observed in gallium). The measure-
ments of Williams and Miller35 and Gamertsfelder,36
performed on a relative basis with a dilatometer, were
also considered as secondary data.
(v) Mercury: In the case of mercury, Bigg58 in 1964 pro-
posed standard values for the density ofmercury between
�20 °C and 300 °C. The data were based on the values
proposed by Beattie et al.59 in 1941 and the measure-
ments of Harlow60 in 1913. It is worthwhile noting that
both sets agreed within a few parts per million. The
values proposed by Beattie were based themselves on a
collection of data (Chappuis,61 Callendar and Moss,62
James,63 Sears,64 and Harlow60). In 1994, Sommer and
Poziemski65 published a paper on the density of mercury
at 20 °C and 101 kPa after considering all recent inves-
tigators (Cook,66 Furtig,67 Adametz,68 Patterson and
Prowse69) including their own measurements. Finally
in 2004, Bettin and Fehlauer70 performed new measure-
ments and proposed the reference values for the density
of mercury that are in use today.
(vi) Silicon: In this case 11 sets of measurements were
considered as primary data. The measurements of Wata-
nabe et al.,37 Zhou et al.,38 Oshaka et al.,41 and Rhim
et al.42 were performed in an electrostatic levitation
instrument. Mukai and Yuan,39 Khilya and Ivash-
chenko,44 and Shergin17 employed a sessile instrument,
while Sasaki et al.43 employed an instrument based on
TABLE 2. Temperature range, coefficients, and deviations at the 95% confidence
Trange (K) c1 (kg m�3) c2 (kg m
Cadmium 594–833 8008 1.2
Cobalt 1768–2500 7827 0.9
Gallium 303–1500 6077 0.6
Indium 430–1100 7022 0.7
Silicon 1687–2000 2550 0.2
Thallium 576–1200 11233 1.2
Zinc 692–910 6559 0.8
J. Phys. Chem. Ref. Data, Vol. 41, No. 3, 2012
Downloaded 16 Jul 2012 to 132.163.193.180. Redistribution subject to AIP lice
the Archimedean principle. A pycnometric apparatus
was employed by Sato et al.,40 while Lucas46 performed
his measurements in a bubble-pressure instrument. It
should be noted that there is a relatively wide spread of
values in the diagram. The measurements of Langen
et al.,47 performed in an electromagnetic levitator, are
quoted with 5% uncertainty, and hence were considered
as secondary data. The singlemeasurement of Logan and
Bond49 performed in an x-ray diffraction apparatus was
also considered as a secondary datum. Finally, the single
measurement of Vatolin and Esin48 performedwith a 2%uncertainty was part of the secondary data.
(vii) Thallium: All six sets of density measurements were
considered as primary data. The measurements of
Stankus and Khairulin50 and Schneider et al.10 were
performed in an absolute γ-ray instrument. The Archi-
medean technique was employed in an absolute way by
Kanda and Dominique,51 Martinez and Walls,52 and
Berthou and Tougas.53 Finally, the measurements of
Crawley54 were obtained in an absolutepycnometer.
(viii) Zinc: The primary dataset is composed of five sets of
measurements. Themeasurements of Stankus andKhair-
ulin50 were performed in a γ-ray instrument in an abso-
lute way. A bubble-pressure instrument was employed
by Lucas46 in an absolute fashion. Thresh55 employed an
absolute pycnometer, Karamurzov7 employed the areo-
metric technique, and Gebhardt et al.56 employed the
Archimedean technique. Otter et al.57 employed the
pulse-heating technique for the measurement of liquid
zinc with an uncertainty of 4%. These measurements
deviated very much from all other sets and were thus
considered as secondary data.
3.3. Density reference correlation
Theprimary density data for liquidmetals, shown inTable 1,
were employed in a linear regression analysis to represent the
density at 0.1 MPa as a function of the temperature. Since the
quoted uncertainties of all works were of similar magnitude,
the datawereweighted only according to the number of points.
The following equations were obtained for the density,
ρ (kg m�3), as a function of the absolute temperature, T (K),
r ¼ c1 � c2ðT � TrefÞ; ð1Þand the coefficients c1 (kgm
�3), c2 (kgm�3K�1), aswell as the
melting temperature Tref (K), are shown for each liquid metal
in Table 2. In the same table, the percentage deviation (2σ) of
level of Eq. (1).
�3 K�1) Tref (K) Deviation (2σ) (%)
51 594.219 (Ref. 71) 0.6
36 1768.0 (Ref. 72) 2.1
11 302.914 (Ref. 73) 0.4
62 429.748 (Ref. 73) 0.5
64 1687.0 (Ref. 41) 2.2
00 576.7 (Ref. 74) 0.9
84 692.677 (Ref. 73) 0.7
nse or copyright; see http://jpcrd.aip.org/about/rights_and_permissions

FIG. 1. Primary density data and their percentage deviations from Eq. (1) for
liquid cadmium as a function of temperature. Stankus6 (□), Karamurzov7 (◊),Alchagirov et al.8 (- -), Crawley9 (●), Schneider and Heymer10 (▲), Fisherand Philips11 (Δ).
FIG. 3. Primary density data and their percentage deviations from Eq. (1) for
liquid gallium as a function of temperature. Yagodin et al.23 (Δ), Stankus andTyagel'sky24 (—–), Alchagirov25 (∙∙∙), Nal'giev and Ibragimov26 (♦),Nizhenko et al.28 (- -), Köster et al.27 (�).
REFERENCE DATA FOR DENSITY AND VISCOSITY OF LIQUID METALS 033101-7
each equation at the 95% confidence level is also shown. It
should be noted, as already discussed, that in the case of
mercury, since reference values do exist, no further work was
done.
Figures 1–7 show the primary data and their percentage
deviations from the above equation for each liquid metal,
except mercury. The dashed vertical line shows the melting
point for each metal. The following can be observed:
FIG. 2. Primary density data and their percentage deviations from Eq. (1) for
liquid cobalt as a function of temperature. Brillo et al.13 (■), Sato et al.14 (□),Stankus6 (♦), Lucas15(○), Watanabe16 (●), Levin et al.18 (*), Shergin17 (○+),Saito et al.19 (◊), Frohberg and Weber21 (Δ), Vertman et al.20 (��),Kirshenbaum and Cahill22 (▲).
Downloaded 16 Jul 2012 to 132.163.193.180. Redistribution subject to AIP l
(i) In the case of cadmium (Fig. 1), gallium (Fig. 3), indium
(Fig. 4), thallium (Fig. 6), and zinc (Fig. 7), the devia-
tions from Eq. (1) are in general within the quoted
uncertainty of each investigator. These six reference
density correlations can be considered to represent the
data well and the overall uncertainty is commensurate
with the authors’ claim.
FIG. 4. Primary density data and their percentage deviations from Eq. (1) for
liquid indium as a function of temperature. Alchagirov et al.8 (Δ), Wanget al.32 (∙∙∙), Schneider and Heymer10 (●), McClelland and Sze33 (□), Stankusand Tyagel'sky24 (�), Karamurzov7 (- -), Berthou and Tougas53 (—–),Crawley9 (◊).
J. Phys. Chem. Ref. Data, Vol. 41, No. 3, 2012
icense or copyright; see http://jpcrd.aip.org/about/rights_and_permissions
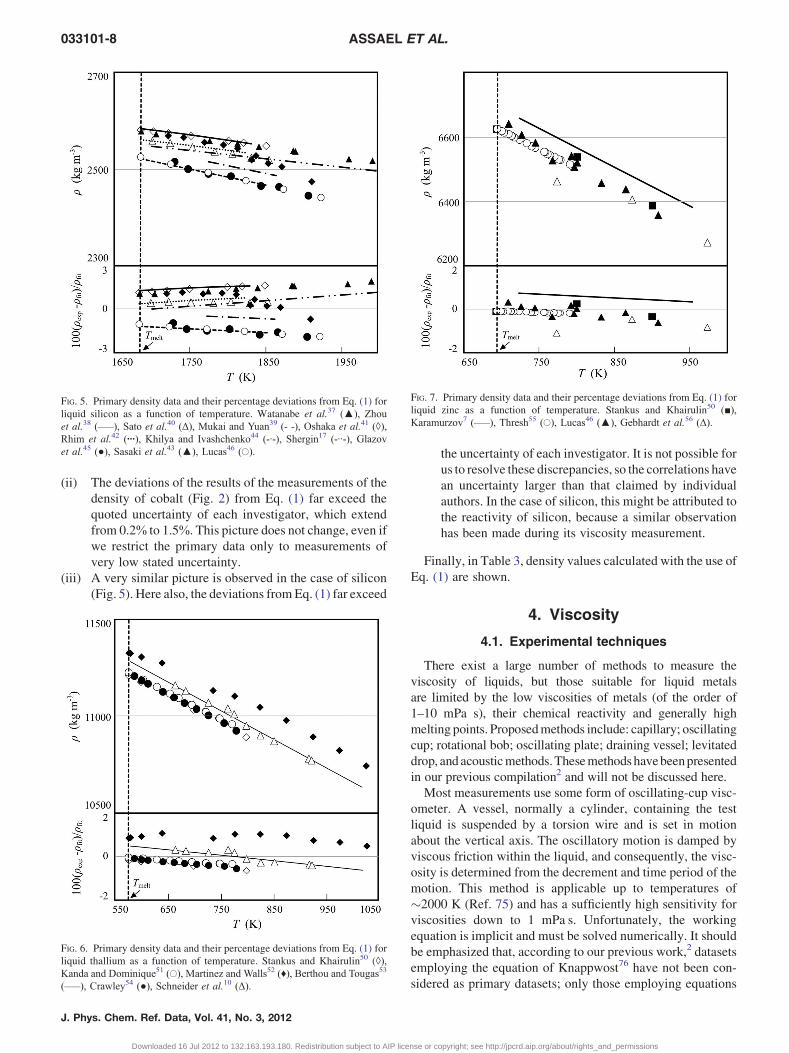
FIG. 5. Primary density data and their percentage deviations from Eq. (1) for
liquid silicon as a function of temperature. Watanabe et al.37 (▲), Zhouet al.38 (—–), Sato et al.40 (Δ), Mukai and Yuan39 (- -), Oshaka et al.41 (◊),Rhim et al.42 (∙∙∙), Khilya and Ivashchenko44 (-∙-), Shergin17 (-∙∙-), Glazovet al.45 (●), Sasaki et al.43 (▲), Lucas46 (�).
FIG. 7. Primary density data and their percentage deviations from Eq. (1) for
liquid zinc as a function of temperature. Stankus and Khairulin50 (■),Karamurzov7 (—–), Thresh55 (�), Lucas46 (▲), Gebhardt et al.56 (Δ).
033101-8 ASSAEL ET AL.
(ii) The deviations of the results of the measurements of the
density of cobalt (Fig. 2) from Eq. (1) far exceed the
quoted uncertainty of each investigator, which extend
from 0.2% to 1.5%. This picture does not change, even if
we restrict the primary data only to measurements of
very low stated uncertainty.
(iii) A very similar picture is observed in the case of silicon
(Fig. 5). Here also, the deviations fromEq. (1) far exceed
FIG. 6. Primary density data and their percentage deviations from Eq. (1) for
liquid thallium as a function of temperature. Stankus and Khairulin50 (◊),Kanda and Dominique51 (�), Martinez and Walls52 (♦), Berthou and Tougas53
(—–), Crawley54 (●), Schneider et al.10 (Δ).
J. Phys. Chem. Ref. Data, Vol. 41, No. 3, 2012
Downloaded 16 Jul 2012 to 132.163.193.180. Redistribution subject to AIP lice
the uncertainty of each investigator. It is not possible for
us to resolve these discrepancies, so the correlations have
an uncertainty larger than that claimed by individual
authors. In the case of silicon, this might be attributed to
the reactivity of silicon, because a similar observation
has been made during its viscosity measurement.
Finally, in Table 3, density values calculated with the use of
Eq. (1) are shown.
4. Viscosity
4.1. Experimental techniques
There exist a large number of methods to measure the
viscosity of liquids, but those suitable for liquid metals
are limited by the low viscosities of metals (of the order of
1–10 mPa s), their chemical reactivity and generally high
melting points. Proposedmethods include: capillary; oscillating
cup; rotational bob; oscillating plate; draining vessel; levitated
drop, andacousticmethods.Thesemethodshavebeenpresented
in our previous compilation2 and will not be discussed here.
Most measurements use some form of oscillating-cup visc-
ometer. A vessel, normally a cylinder, containing the test
liquid is suspended by a torsion wire and is set in motion
about the vertical axis. The oscillatory motion is damped by
viscous friction within the liquid, and consequently, the visc-
osity is determined from the decrement and time period of the
motion. This method is applicable up to temperatures of
�2000 K (Ref. 75) and has a sufficiently high sensitivity for
viscosities down to 1 mPa s. Unfortunately, the working
equation is implicit and must be solved numerically. It should
be emphasized that, according to our previous work,2 datasets
employing the equation of Knappwost76 have not been con-
sidered as primary datasets; only those employing equations
nse or copyright; see http://jpcrd.aip.org/about/rights_and_permissions

TABLE 3. Recommended values for the density and viscosity of cadmium, cobalt, gallium, indium, mercury, silicon, thallium, and zinc.
T (K) ρ (kg m�3) η (mPa s) T (K) ρ (kg m�3) η (mPa s) T (K) ρ (kg m�3) η (mPa s) T (K) ρ (kg m�3) η (mPa s)
Liquid cadmium Liquid cobalt Liquid gallium Liquid indium
600 8001 2.708 1800 7797 4.543 350 6048 1.369 450 7007 1.748
650 7938 2.326 1850 7750 4.123 400 6018 1.158 500 6968 1.521
700 7876 2.043 1900 7703 3.761 450 5987 1.016 550 6930 1.357
750 7813 1.825 1950 7657 3.446 500 5957 0.915 600 6892 1.234
800 7751 1.654 2000 7610 3.172 550 5926 0.840 650 6854 1.139
850 7688 1.516 2050 7563 2.932 600 5895 0.783 700 6816 1.063
900 7625 1.403 2100 7516 2.719 650 5865 0.737 750 6778 1.001
2150 7469 700 5834 0.700 800 6740 0.951
2200 7423 750 5804 0.669 850 6702 0.908
2250 7376 800 5773 0.643 900 6664 0.871
2300 7329 850 5743 950 6626 0.840
2350 7282 900 5712 1000 6587 0.813
2400 7235 950 5682 1050 6549
2450 7189 1000 5651 1100 6511
2500 7142 1050 5621
1100 5590
1150 5559
1200 5529
1250 5498
1300 5468
1350 5437
1400 5407
1450 5376
1500 5346
Liquid mercury Liquid silicon Liquid thallium Liquid zinc
250 … 1.875 1700 2547 0.605 600 11205 2.434 700 6553 3.737
300 … 1.531 1750 2533 0.571 650 11145 2.155 750 6508 3.254
350 … 1.324 1800 2520 0.541 700 11085 1.941 800 6464 2.883
400 … 1.187 1850 2507 0.514 750 11025 1.773 850 6420 2.591
450 … 1.091 1900 2494 0.490 800 10965 1.638 900 6376 2.356
500 … 1.020 1950 2481 850 10905 950 6332 2.164
550 … 0.965 2000 2467 900 10845 1000 2.005
600 … 0.921 950 10785 1050 1.871
1000 10725 1100 1.756
1050 10665
1100 10605
1150 10545
1200 10485
REFERENCE DATA FOR DENSITY AND VISCOSITY OF LIQUID METALS 033101-9
based upon the work of Roscoe,77 published in 1958, have
been considered.
In addition to the oscillating-cup technique, the capillary
technique2 (and the double-capillary technique), has success-
fully been employed for the measurement of the viscosity of
liquid metals. The capillary rheometer is generally thought to
be the best method for the measurement of the viscosity of
liquids,1 and is based upon the time for a finite volume of
liquid to flow through a narrow-bore tube under a given
pressure. The relation between viscosity and efflux time is
given by a modified Poiseuille equation or a Hagen-Poiseuille
equation.2 This technique is often used as a relative, rather than
absolute, method, because the experimental procedures are
simple, and any errors arising from the measurement of
dimensions are thereby avoided. Measurements performed by
the capillary technique are usually considered as primary data.
The electrostatic levitation (ESL) and electromagnetic levi-
tation (EML) techniques employed for the measurement of the
Downloaded 16 Jul 2012 to 132.163.193.180. Redistribution subject to AIP l
density of liquid metals are employed as well for the measure-
ment of the viscosity. When employed properly, both techni-
ques can produce very good results.
A few other measurements were performed by various
secondary techniques;2 the oscillating-sphere technique, the
rotating-cylinder method, and the vibration technique are
considered to produce secondary data as they do not satisfy
most of the aforementioned criteria, the most important of
which being the lack of a complete theory describing these
techniques.
4.2. Data compilation
Table 4 presents the datasets found for the measurement of
the viscosity of liquid cadmium, cobalt, gallium, indium,
mercury, silicon, thallium, and zinc. As in the case of the
density measurements, papers prior to 1930 were not consid-
ered, because sample purity was disputed before that time. In
J. Phys. Chem. Ref. Data, Vol. 41, No. 3, 2012
icense or copyright; see http://jpcrd.aip.org/about/rights_and_permissions

TABLE 4. Datasets considered for the viscosity of liquid cadmium, cobalt, gallium, indium, mercury, silicon, thallium, and zinc.
First author Publ. year
Technique
employedaPurity
(mass%)
Uncertainty
quoted (%) No. of data Form of databTemperature
range (K)
Cadmium
Primary data
Djemili78 1981 Oscillating cup
(Abs)
99.999 na 12 P 598–710
Iida79 1980 Oscillating cup
(Rel)
99.99 na 5 P 607–804
Iida80 1975 Capillary (Abs) 99.9999 0.5 6 P 613–873
Kanda81 1973 Oscillating cup
(Abs)
99.999 1.0 1 D 623
Crawley82 1969 Oscillating cup
(Abs)
99.999 0.5 10 P 595–724
Menz83 1966 Double capillary
(Abs)
99.999 2.0 3 D 606–692
Secondary data
Fisher11 1954 Oscillating cup na na 5 P 623–723
Cobalt
Primary data
Sato84 2005 Oscillating cup
(Abs)
99.9 1.0 20 P 1755–1881
Lad’yanov85 2000 Oscillating cup
(Abs)
na 1.5 8 E 1773–1973
Kaplun86 1977 Oscillating cup
(Rel)
na 5.0 9 E 1797–2090
Watanabe16 1971 Oscillating cup
(Rel)
na 5.0 31 D 1781–2032
Cavalier87 1963 Oscillating cup
(Abs)
99.87 na 8 P 1723–2023
Secondary data
Paradis88 2008 ESL (Abs) 99.9 na 11 E 1690–1950
Han89 2002 EML (Abs) 99.999 na 6 D 1772–1973
Bodakin90 1978 Oscillating cup na 3.0 8 D 1759–1972
Gallium
Primary data
Tippelskirch91 1976 Oscillating cup
(Abs)
99.99 0.5 42 P 307–800
Genrikh92 1972 Vibration method
(Rel)
99.9 1.5 33 P 337–366
Menz83 1966 Double capillary
(Abs)
na 2.0 4 D 449–602
Secondary data
Iida79 1980 Oscillating cup
(Rel)
99.99 na 6 P 293–1293
Iida80 1975 Capillary (Abs) 99.99 0.5 14 P 305–547
Spells31 1935 Capillary (Rel) na na 17 P 326–1373
Indium
Primary data
Walsdorfer93 1988 Capillary (Abs) na na 12 P 443–1273
Djemili78 1981 Oscillating cup
(Abs)
99.999 na 16 P 436–899
Iida80 1975 Capillary (Abs) 99.99 0.5 12 P 443–1273
Ganovici94 1969 Oscillating cup 99.999 1.0 7 P 438–1073
Crawley82 1969 Oscillating cup
(Abs)
na 0.5 23 P 432–607
Secondary data
Cheng95 2003 X-ray 99.999 5 12 D 561–1023
Nakajima96 1976 Oscillating cup
(Rel)
na … 20 D 453–653
Culpin97 1957 Oscillating sphere
(Rel)
na … 8 P 437–607
Mercury
Primary data
Grouvel98 1977 Oscillating cup
(Abs)
na 1.5 12 P 293–450
033101-10 ASSAEL ET AL.
J. Phys. Chem. Ref. Data, Vol. 41, No. 3, 2012
Downloaded 16 Jul 2012 to 132.163.193.180. Redistribution subject to AIP license or copyright; see http://jpcrd.aip.org/about/rights_and_permissions

TABLE 4. Datasets considered for the viscosity of liquid cadmium, cobalt, gallium, indium, mercury, silicon, thallium, and zinc.—Continued
First author Publ. year
Technique
employedaPurity
(mass%)
Uncertainty
quoted (%) No. of data Form of databTemperature
range (K)
Iida99 1973 Capillary (Abs) 99.999 0.5 30 P 235–513
Menz83 1966 Double capillary
(Abs)
99.999 2.0 1 D 461
Thresh100 1965 Oscillating cup
(Abs)
99.98 1.0 5 P 296–373
Suhrmann101 1955 Capillary na 0.5 18 P 234–303
Chalilov102 1938 Capillary na na 34 P 298–833
Secondary data
–
Silicon
Primary data
Zhou38 2003 ESL (Abs) 99.999 7.0 11 D 1634–1844
Nishimura103 2002 Oscillating cup
(Abs)
na na 8 D 1826–1721
Sato14 2002 Oscillating cup
(Abs)
na 3.0 27 P 1664–1790
Sasaki104 1995 Oscillating cup
(Abs)
na na 25 D 1685–1883
Secondary data
Rhim105 2000 ESL (Abs) na 10 9 D 1589–1754
Kakimoto106 1989 Oscillating cup
(Abs)
na na 12 D 1691–1871
Thallium
Primary data
Walsdorfer107 1988 Capillary (Abs) na na 3 P 623–723
Kanda51 1979 Oscillating cup
(Abs)
99.999 1.0 18 P 576–773
Crawley54 1968 Oscillating cup
(Abs)
99.999 0.5 11 P 576–730
Cahill108 1965 Oscillating cup
(Rel)
99.99 2 10 P 644–800
Secondary data
Andrianova109 1971 Oscillating cup
(Abs)
na 3.3 8 E 500–1200
Zinc
Primary data
Mudry110 2008 Oscillating cup
(Abs)
99.99 3.0 16 D 766–936
Iida79 1980 Oscillating cup
(Rel)
99.9 4.0 5 P 700–913
Iida80 1975 Capillary (Abs) 99.98 0.5 6 P 698–973
Harding111 1975 Oscillating cup 99.99 1.2 12 D 676–809
Thresh100 1965 Oscillating cup
(Abs)
99.99 1.0 36 P 695–744
Ofte112 1963 Oscillating cup
(Abs)
99.99+ na 14 P 693–1096
Gebhardt56 1955 Oscillating cup
(Abs)
na na 3 P 500–700
Secondary data
Jeyakumar113 2011 Rotated cylinder 99.99 5.0 4 D 697–771
Yao114 1952 Oscillating cup
(Rel)
99.9962 na 38 P 692–873
Hopkins115 1950 Oscillating cup 99.83 na 6 P 702–753
aAbs = absolute; ESL = electrostatic levitation; EML = electromagnetic levitation; Rel = relative.bD = diagram; E = equation; P = points.
REFERENCE DATA FOR DENSITY AND VISCOSITY OF LIQUID METALS 033101-11
the table, for every dataset, the technique employed, the purity
of the sample, the uncertainty quoted, the form of the data
presented, the number of data points as well as the temperature
range they refer, are also shown. The datasets have been
classified into primary and secondary sets according to the
Downloaded 16 Jul 2012 to 132.163.193.180. Redistribution subject to AIP l
criteria presented in Sec. 2 and in conjunction with the
techniques described in Sec. 4.1.
In the case of the viscosity datasets and in relation to the
discussion of Sec. 4.1, the following points can be
noted:
J. Phys. Chem. Ref. Data, Vol. 41, No. 3, 2012
icense or copyright; see http://jpcrd.aip.org/about/rights_and_permissions

033101-12 ASSAEL ET AL.
(i) Cadmiun: The primary dataset is composed of six sets of
measurements. The oscillating-cup technique was
employed successfully by Djemili et al.,78 Iida
et al.,79 Kanda and Falkiewicz,81 and Crawley and
Thresh,82 while capillary viscometers were employed
by Iida et al.80 and Menz and Sauerwald.83 The mea-
surements of Fisher and Phillips,11 performed by the
oscillating-cup technique, were considered as second-
ary, as according to our previous work2 datasets employ-
ing the equation of Knappwost76 have not been
considered as primary datasets.
(ii) Cobalt: Five datasets, Sato et al.,84 Lad’yanov et al.,85
Kaplun and Avaliani,86 Watanabe,16 and Cavalier,87 all
employing the oscillating-cup technique, composed the
primary dataset. The recent measurements of Paradis
et al.88 performed by the ESL were not considered as
primary data as they were much higher than everybody
else. The electromagnetic EML was employed by Han
et al.;89 these measurements showed a distinctively
different slope with temperature than the rest of the data
and were thus considered as secondary. Finally, the
measurements of Bodakin et al.90 were also considered
as secondary because they were only presented in a very
small diagram.
(iii) Gallium: There are six sets of measurements of the
viscosity of gallium. The measurements of Spells31
performed in 1935 in a relative basis were considered
as secondary data. Also, the measurements of Iida79 are
much higher than the rest and were thus considered also
as part of the secondary data. The remaining three sets
formed the primary data. The measurements of Tippels-
kirch,91 performed in an absolute oscillating cup with an
uncertainty of 0.5%, are probably the best measure-
ments. They covered a range from 307 to 1806 K, but
since no other investigator performed measurements
over 800 K, they were restricted to this temperature.
Also part of the primary sets were the measurements of
Genrikh et al.92 and Menz and Sauerwald.83
(iv) Indium: In the case of indium, the primary data are
composed from five datasets: the measurements of Dje-
mili et al.,78 Ganovici and Ganovici,94 and Crawley and
Thresh82 were performed in oscillating cup instruments,
while the measurements of Walsdorfer et al.93 and Iida
et al.80 were performed in capillary viscometers. The
data of Cheng et al.,95 performed by the x-ray diffraction
technique in a relative manner, as well as the data of
Culpin,97 performed in an oscillating-sphere instrument,
were not considered as primary data, since these tech-
niques were never fully developed. The data of Naka-
jima96 were also considered as secondary data according
to our aforementioned discussion, because the equation
of Knappwost was employed in the interpretation of the
oscillating-cup measurements.
(v) Mercury: All six datasets were considered as primary
data. The oscillating-cup technique was employed by
Grouvel et al.98 and Thresh,100 while Iida et al.,99 Menz
and Sauerwald,83 Suhrmann and Winter,101 and Chali-
lov102 employed the capillary technique.
J. Phys. Chem. Ref. Data, Vol. 41, No. 3, 2012
Downloaded 16 Jul 2012 to 132.163.193.180. Redistribution subject to AIP lice
(vi) Thallium: There are five sets of viscosity measurements.
The measurements of Kanda and Dominique51 and of
Crawley54 were performed in an oscillating-cup visc-
ometer in an absolute way and were part of the primary
dataset. The measurements of Cahill and Grosse108 were
obtained in an oscillating-cup viscometer but in a rela-
tive way. This set was also part of the primary data. The
measurements of Walsdorfer et al.107 were obtained in
an absolute capillary instrument, and were also consid-
ered as primary data. Finally, the diffusivity measure-
ments of Andrianova et al.109 were considered as
secondary data.
(vii) Silicon: Sato et al.14 performed experiments with the
oscillating-cup technique, employing cups made from
different materials (Al2O3, Si3N4, PBN (pyrolytic boron
nitride), SiO2, 8% YSZ-yittria stabilized zirconia, SiC,
and graphite). They concluded that all of the above
materials produced excellent results, except the cups
made from SiC and graphite which produced very high
viscosity values. Sato et al. concluded by stating that the
reasons for this difference were not entirely clear, but
were related to the wettability of the material. Sasaki
et al.104 employed two different cups made from PBN
and SiC. Consistent with the analysis of Sato et al.,14 the
values obtained with the SiC cup were too high; hence
only the PBN-cup measurements were considered as
primary data. Nishimura et al.103 employed a SiC cup,
but their viscosity values were very low, near the values
of Sato et al. They argued that this was attributed to the
very large inertia disk that they employed. These mea-
surements were also considered as primary data. Zhou
et al.38 employed an upgraded ESL, trying to take care of
all fine corrections. His measurements also formed part
of the primary data. Finally, Rhim and Ohsaka105
employed the first version of the ESL, and their data
were considered as secondary data together with the data
of Kakimoto et al.106 whose measurements were only
presented in a very small diagram.
(viii) Zinc: The primary data are composed of seven sets of
viscosity measurements. Six of them, Mudry et al.,110
Iida et al.,79 Harding and Davis,111 Thresh,100 Ofte and
Wittenberg,112 and Gebhardt et al.56 were performed in
oscillating-cup instruments. Iida et al.80 also performed
viscosity measurements with a capillary viscometer. The
measurements of Jeyakumar et al.,113 performed in a
concentric-cylinder relative instrument, were considered
as secondary data together with the data of Hopkins and
Toye115 and Yao and Kondig,114 which were both per-
formed in oscillating-cup instruments but employed
Knappwost’s equation for the analysis of the data.
4.3. Viscosity reference correlation
The primary viscosity data for liquid cadmium, cobalt,
gallium, indium, mercury, silicon, thallium, and zinc, shown
in Table 4, were employed in a regression analysis as a
function of the temperature. The datawereweighted according
nse or copyright; see http://jpcrd.aip.org/about/rights_and_permissions

TABLE 5. Temperature range, coefficients, and deviations at the 95%confidence level of Eq. (2).
Trange (K) a1 (-) a2 (K)
Deviation
(2σ) (%)
Cadmium 900–1300 0.4239 513.89 9.4
Cobalt 1768–2100 0.9030 2808.7 14.0
Gallium 304–800 0.4465 204.03 13.5
Mercury 234–600 0.2561 132.29 2.1
Indium 429–1000 0.3621 272.06 7.3
Silicon 1685–1900 1.0881 1478.7 15.7
Thallium 577–800 0.3017 412.84 5.1
Zinc 695–1100 0.3291 631.12 9.3
FIG. 9. Primary viscosity data and their percentage deviations from Eq. (2)
for liquid cobalt as a function of temperature. Sato et al.84 (◊), Lad'yanovet al.85 (■), Watanabe16 (●), Kaplun and Avaliani86 (♦), Cavalier87 (Δ).
REFERENCE DATA FOR DENSITY AND VISCOSITY OF LIQUID METALS 033101-13
to the number of points. The following equations were
obtained for the viscosity, η (mPa s), as a function of the
absolute temperature, T (K),
log10ðh=hoÞ ¼ �a1 þ a2
T; ð2Þ
where ηo = 1 mPa s, and the coefficients a1 (-) and a2 (K) are
shown for each liquid metal in Table 5. In the same table, the
percentage deviation (2σ) of each equation at the 95% con-
fidence level is also shown.
Figures 8–15 show the primary viscosity data and their
percentage deviations from the above equation for each liquid
metal. The dashed vertical line shows the melting point for
each metal. The following can be observed:
(i) In the case of mercury (Fig. 11) and thallium (Fig. 14),
the deviations from Eq. (2) are in general within the
FIG. 8. Primary viscosity data and their percentage deviations from Eq. (2)
for liquid cadmium as a function of temperature. Djemili et al.78 (�), Iidaet al.79 (□), Iida et al.80 (♦), Kanda and Falkiewicz81 (▲), Crawley andThresh82 (◊), Menz and Sauerwald83 (●).
Downloaded 16 Jul 2012 to 132.163.193.180. Redistribution subject to AIP l
quoted uncertainty of each investigator. These two
reference viscosity correlations can be considered very
good.
(ii) In the case of cadmium (Fig. 8), indium (Fig. 12), and
zinc (Fig. 15), the deviations from Eq. (2) are somewhat
larger. Nevertheless, these are also acceptable
correlations.
(iii) Finally, in the case of cobalt (Fig. 9), gallium (Fig. 10),
and silicon (Fig. 13), the deviations from Eq. (2) are
FIG. 10. Primary viscosity data and their percentage deviations from Eq. (2)
for liquid gallium as a function of temperature. Tippelskirch91 (Δ), Genrikhet al.92 (□), Menz and Sauerwald83 (●).
J. Phys. Chem. Ref. Data, Vol. 41, No. 3, 2012
icense or copyright; see http://jpcrd.aip.org/about/rights_and_permissions

FIG. 11. Primary viscosity data and their percentage deviations from Eq. (2)
for liquid indium as a function of temperature. Walsdorfer et al.93 (�),Djemili et al.78 (●), Iida et al.80 (◊), Ganovici and Ganovici94 (□), Crawleyand Thresh82 (Δ).
FIG. 13. Primary viscosity data and their percentage deviations from Eq. (2)
for liquid silicon as a function of temperature. Zhou et al.38 (●), Nishimuraet al.103 (□), Sato et al.14 (♦), Sasaki et al.104 (�).
033101-14 ASSAEL ET AL.
quite high. This is attributed to the discrepancies
between the various authors, probably arising from the
difficulties associated with the measurement of the
viscosity of these three liquid metals – certainly that
was the casewith silicon. These three correlations are the
FIG. 12. Primary viscosity data and their percentage deviations from Eq. (2)
for liquid mercury as a function of temperature. Grouvel et al.98 (▲), Iidaet al.99 (�), Menz and Sauerwald83 (●), Thresh100 (■), Suhrmann andWinter101 (◊), Chalilov102 (Δ).
FIG. 14. Primary viscosity data and their percentage deviations from Eq. (2)
for liquid thallium as a function of temperature. Walsdorfer et al.93 (▲),Kanda and Dominique51 (�), Cahill et al.108 (Δ), Crawley54 (●).
J. Phys. Chem. Ref. Data, Vol. 41, No. 3, 2012
Downloaded 16 Jul 2012 to 132.163.193.180. Redistribution subject to AIP lice
best that can be achieved with the sets of measurements
presently available.
Viscosity values calculated from Eq. (2) are contained in
Table 3.
nse or copyright; see http://jpcrd.aip.org/about/rights_and_permissions

FIG. 15. Primary viscosity data and their percentage deviations from Eq. (2)
for liquid zinc as a function of temperature. Mudry et al.110 (▲), Iida et al.79
(+), Iida et al.80 (◊), Harding and Davis111 (♦), Thresh100 (X), Ofte andWittenberg112 (●), Gebhardt et al.56 (Δ).
REFERENCE DATA FOR DENSITY AND VISCOSITY OF LIQUID METALS 033101-15
5. Conclusions
The available experimental data for the density and visc-
osity of liquid cadmium, cobalt, gallium, indium, mercury,
silicon, thallium, and zinc have been critically examined with
the intention of establishing a density and a viscosity standard.
All experimental data have been categorized into primary and
secondary data according to the quality of measurement, the
technique employed and the presentation of the data, as
specified by a series of criteria. The proposed standard refer-
ence correlations for the density of liquid cadmium, cobalt,
gallium, indium, silicon, thallium, and zinc are, respectively,
characterized by deviations of 0.6%, 2.1%, 0.4%, 0.5%, 2.2%,
0.9%, and 0.7% at the 95% confidence level. In the case of
mercury, since density reference values did exist, no further
work was carried out in this paper. The standard reference
correlations for the viscosity of liquid cadmium, cobalt, gal-
lium, indium, mercury, silicon, thallium, and zinc are, respec-
tively, characterized by deviations of 9.4%, 14.0%, 13.5%,
2.1%, 7.3%, 15.7%, 5.1%, and 9.3% at the 95% confidence
level.
It is apparent that more work on the measurement of the
density of liquid cobalt and silicon, as well as on the measure-
ment of the viscosity of liquid cobalt, gallium, and silicon, is
still needed.
The proposed correlations are for vapor–liquid saturation
conditions. Although in some applications, such as the flow in
a tube or a nozzle, the pressure is higher than the saturation
pressure, the pressure dependences of the density and the
viscosity of liquid metals is not sufficiently high that the
variation exceeds the uncertainty in the correlations reported
here.
Downloaded 16 Jul 2012 to 132.163.193.180. Redistribution subject to AIP l
Acknowledgments
The work described in this paper was carried out under the
auspices of the International Association for Transport Proper-
ties (formerly known as the Subcommittee of Transport Prop-
erties of the International Union of Pure and Applied
Chemistry).
6. References
1T. Iida and R. I. L. Guthrie, The Physical Properties of Liquid Metals
(Clarendon, Oxford, 1988).2M. J. Assael, K. E. Kakosimos, R. M. Bannish, J. Brillo, I. Egry, R.
Brooks, P. N. Quested, K. C. Mills, A. Nagashima, Y. Sato, and W. A.
Wakeham, J. Phys. Chem. Ref. Data 35, 285 (2006).3M. J. Assael, A. E. Kalyva, K. E. Antoniadis, R. M. Bannish, I. Egry, P. N.
Quested, J. Wu, E. Kaschnitz, and W. A. Wakeham, J. Phys. Chem. Ref.
Data 39, 033105 (2010).4M. J. Assael, A. E. Kalyva, K. E. Antoniadis, R. M. Bannish, I. Egry, J.
Wu, E. Kaschnitz, andW. A.Wakeham, High Temp. - High Press. 41, 161(2012).
5M. J. Assael, M. L. V. Ramires, C. A. Nieto de Castro, and W. A.
Wakeham, J. Phys. Chem. Ref. Data 19, 113 (1990).6S. V. Stankus, Ph.D. thesis, Institute of Thermophysics, Novosibirsk,
USSR, 1992.7B. S. Karamurzov, Ph.D. thesis, Nalchik, USSR, 1975.8B. B. Alchagirov, A. G. Mozgovoi, and A. M. Katsukov, High Temp. 42,1003 (2004).
9A. F. Crawley, Trans. Metall. Soc. AIME 242, 2237 (1968).10A. Schneider and G. Heymer, Z. Anorg. Allg. Chem. 286, 118 (1956).11H. J. Fisher and A. Phillips, J. Met. 6, 1060 (1954).12V. P. Chentsov, Ph.D. thesis, Sverdlovsk, USSR, 1972.13J. Brillo, I. Egry, and T. Matsushita, Int. J. Mater. Res. 97, 1526 (2006).14Y. Sato, Y. Kameda, T. Nagasawa, T. Sakamoto, S. Moriguchi, T.
Yamamura, and Y. Waseda, J. Cryst. Growth 249, 404 (2002).15L. D. Lucas, Mem. Sci. Rev. Metal. 69, 479 (1972).16S. Watanabe, Trans. Jpn. Inst. Met. 12, 17 (1971).17L. M. Shergin, Ph.D. thesis, Sverdlovsk, Russia, 1970.18E. S. Levin, G. D. Ayushina, and V. K. Zav’yalov, Trans. UPI—Sver-
dlovsk 186, 92 (1970).19T. Saito, Y. Shiraishi, and Y. Sakuma, Trans. Iron Steel Inst. Jpn. 9, 118(1969).
20A. A. Vertman, A.M. Samarin, and F. S. Filippov, Sov. Phys.- Dokl. 9, 233(1964).
21M. G. Frohberg and R. Weber, Arch. Eisenhuettenwes. 35, 877 (1964).22A. D. Kirshebaum and J. A. Cahill, Trans. Amer. Soc. Met. 56, 281 (1963).23D. A. Yagodin, V. V. Filippov, P. S. Popel, V. E. Sidirov, and L. D. Son,
J. Phys.: Conf. Ser. 98, 1 (2008).24S. V. Stankus and P. V. Tyagel’sky, Rasplavy 2, 14 (1991).25B. B. Alchagirov, Ph.D. thesis, Nalchik, USSR, 1974.26A. G. M. Nal’giev and H. I. Ibragimov, Zh. Fiz. Khim. 48, 1289 (1974).27H. Köster, F. Hensel, and E. U. Franck, Ber. Bunsenges. Phys. Chem. 74,43 (1970).
28V. I. Nizhenko, V. N. Eremenko, and L. I. Sklyarchuk, Ukr. Chem. J. 6,559 (1965).
29H. Geng, G. Zhang, Z. Wang, Y. Deng, and H. Qin, Appl. Phys. A 98, 227(2010).
30S. P. Yatsenko, V. I. Kononenko, and A. L. Suhman, High Temp. 10, 66(1972).
31K. E. Spells, Proc. Phys. Soc. 48, 299 (1935).32L. Wang, A. Xian, and H. Shao, Acta Metall. Sin. 40, 643 (2004).33M. A. McClelland and J. S. Sze, Surf. Sci. 330, 313 (1995).34P. E. Berthou and R. Tougas, Metall. Trans. 1, 2978 (1970).35D. D. Williams and R. R. Miller, J. Am. Chem. Soc. 72, 3821 (1950).36C. Gamertsfelder, J. Chem. Phys. 9, 450 (1941).37M. Watanabe, M. Adachi, T. Morishita, K. Higuchi, H. Kobotake, and
H. Fukuyama, Faraday Discuss. 136, 279 (2007).38Z. Zhou, S. Mukherjee, andW.-K. Rhim, J. Cryst. Growth 257, 350 (2003).39K. Mukai and Z. Yuan, Mater. Trans. 41, 323 (2000).
J. Phys. Chem. Ref. Data, Vol. 41, No. 3, 2012
icense or copyright; see http://jpcrd.aip.org/about/rights_and_permissions

033101-16 ASSAEL ET AL.
40Y. Sato, T. Nishizuka, K. Hara, T. Yamamura, and Y. Waseda, Int. J.
Thermophys. 21, 1463 (2000).41K. Oshaka, S. K. Chung, W. K. Rhim, and J. C. Holzer, Appl. Phys. Lett.
70, 423 (1997).42W. K. Rhim, S. K. Chung, A. J. Rulison, and R. E. Spjut, Int. J.
Thermophys. 18, 459 (1997).43H. Sasaki, E. Tokizaki, K. Terashima, and S. Kimura, J. Cryst. Growth
139, 225 (1994).44G. P. Khilya and Y.M. Ivashchenko, Rep. UkrSSRAcad. Sci. 1, 69 (1973).45V. M. Glazov, S. N. Chizhevskaya, and N. N. Glagoleva, Liquid Semi-
conductors (Nauka, Moscow, 1967).46L. D. Lucas, Mem. Sci. Rev. Metall. 61, 1 (1964).47M. Langen, T. Hibiya, M. Eguchi, and I. Egry, J. Cryst. Growth 186, 550(1998).
48N. A. Vatolin and O. A. Esin, Phys. Met. Metallogr. 16, 936 (1963).49R. A. Logan and W. L. Bond, J. Appl. Phys. 30, 322 (1959).50S. V. Stankus and R. A. Khairulin, Change of Thermal Properties of Zink,
Antimony, and Thallium on Melting (Institute of Thermophysics SB AS,
Novosibirsk, 1988).51F. A. Kanda and J. A. Dominique, J. Less-Common Met. 64, 135 (1979).52J. Martinez and H. A. Walls, Metall. Trans. 4, 1419 (1973).53P. E. Berthou and R. Tougas, J. Less-Common Met. 16, 465 (1968).54A. F. Crawley, Trans. Metall. Soc. AIME 242, 2309 (1968).55H. R. Thresh, J. Inst. Met. 96, 308 (1968).56E. Gebhardt, M. Becker, and S. Dorner, Aluminium 31, 315 (1955).57C. Otter, G. Pottlacher, and H. Jäger, Int. J. Thermophys. 17, 987 (1996).58P. H. Bigg, Brit. J. Appl. Phys. 15, 1111 (1964).59J. A. Beattie, B. E. Blaisdell, J. Kaye, H. T. Gerry, and C. A. Johnson, Proc.
Am. Acad. Arts Sci. 74, 371 (1941).60F. J. Harlow, Proc. Phys. Soc. London 26, 85 (1913).61P. Chappuis, Trav. Mem. Bur. Int. Poids Mes. 16, 31 (1917).62H. L. Callendar and H. Moss, Philos. Trans. 211A, 1 (1912).63C. B. James, Trans. R. Soc. Canada 1118, 51 (1914).64G. W. Sears, Proc. Phys. Soc. London 26, 95 (1914).65K. D. Sommer and J. Poziemski, Metrologia 30, 665 (1994).66A. H. Cook, Philos. Trans. A 254 (1961).67M. Furtig, Exp. Techn. Phys. 21, 521 (1973).68H. Adametz and M. Wloka, Metrologia 28, 333 (1991).69J. B. Patterson and D. B. Prowse, Metrologia 21, 107 (1985).70H. Bettin and H. Fehlauer, Metrologia 41, S16 (2004).71G. V. D. Tiers, Anal. Chim. Acta 237, 241 (1990).72L. Crovini, R. E. Bedford, and A. Moser, Metrologia 13, 197 (1977).73H. Preston-Thomas, Metrologia 27, 3 (1990).74R. C. Dorf, CRC Handbook of Engineering Tables (CRC, Boca Raton, FL,
2003).75M. Kehr, W. Hoyer, and I. Egry, Int. J. Thermophys. 28, 1017 (2007).76A. Knappwost, Z. Phys. Chem. 200, 81 (1952).77R. Roscoe, Proc. Phys. Soc. 72, 576 (1958).78B. Djemili, L. Martin-Garin, R. Martin-Garin, and P. Despre, J. Less-
Common Met. 79, 29 (1981).79T. Iida, A. Satoh, S. Ishiura, S. Ishiguro, and Z.Morita, J. Jpn. Inst. Met. 44,443 (1980).
J. Phys. Chem. Ref. Data, Vol. 41, No. 3, 2012
Downloaded 16 Jul 2012 to 132.163.193.180. Redistribution subject to AIP lice
80T. Iida, Z. Morita, and S. Takeuchi, J. Jpn. Inst. Met. 39, 1169 (1975).81F. Kanda and J. Falkiewicz, High Temp. Sci. 5, 252 (1973).82A. F. Crawley and H. R. Thresh, Trans. Metall. Soc. AIME 245, 424(1969).
83W. Menz and F. Sauerwald, Acta Metall. 14, 1617 (1966).84Y. Sato, K. Sugisawa, D. Aoki, and T. Yamamura, Meas. Sci. Technol. 16,363 (2005).
85V. I. Lad’yanov, A. L. Bel’tyukov, K. G. Tronin, and L. V. Kamaeva, JETP
Lett. 72, 301 (2000).86A. B. Kaplun and M. I. Avaliani, Teplofiz. Vys. Temp. 15, 305 (1977).87G. Cavalier, Compt. Rend. 256, 1308 (1963).88P.-F. Paradis, T. Ishikawa, and N. Koike, High Temp. - High Press. 37, 5(2008).
89X. J. Han, N. Wang, and B. Wei, Philos. Mag. Lett. 82, 451 (2002).90N. E. Bodakin, B. A. Baum, and G. V. Tyagunov, Izv. Vyssh. Uchebn.
Zaved., Chem. Metall. 7, 9 (1978).91H. V. Tippelskirch, Ber. Bunsenges. Phys. Chem. 80, 726 (1976).92V. Genrikh, A. B. Kaplun, and A. N. Solov’ev, Study of Liquid Viscosity by
Means of Vibration Method (Foreign Technology Division, USAF, FTD-
HT-23-332-72, 1972).93H. Walsdorfer, I. Arpshofen, and B. Predel, Z. Metallkd. 79, 503 (1988).94L. Ganovici and I. Ganovici, Rev. Roum. Chim. 14, 1011 (1969).95S.-J. Cheng, X.-F. Bian, J.-X. Zhang, X.-B. Qin, and Z.-H. Wang, Mater.
Lett. 57, 4191 (2003).96H. Nakajima, Trans. Jpn. Inst. Met. 17, 403 (1976).97M. F. Culpin, Proc. Phys. Soc. London B 70, 1069 (1957).98J. M. Grouvel, J. Kestin, and H. Khalifa, Ber. Bunsenges. Phys. Chem. 81,339 (1977).
99T. Iida, A. Kasama, Z. Morita, I. Okamoto, and S. Tokumoto, J. Jpn. Inst.
Met. 37, 841 (1973).100H. R. Thresh, Trans. Metall. Soc. AIME 223, 79 (1965).101V. R. Suhrmann and E. O. Winter, Z. Naturforsch. 10a, 985 (1955).102C. Chalilov, Zh. Tekh. Fiz. 19, 1249 (1938).103S. Nishimura, S. Matsumoto, and K. Terashima, J. Cryst. Growth 237–239,
1667 (2002).104H. Sasaki, E. Tokizaki, X. Huang, K. Terashima, and S. Kimura, Jpn. J.
Appl. Phys. 34, 3432 (1995).105W.-K. Rhim and K. Ohsaka, J. Cryst. Growth 208, 313 (2000).106K. Kakimoto, M. Eguchi, H.Watanabe, and T. Hibiya, J. Cryst. Growth 94,
412 (1989).107H. Walsdorfer, I. Arpshofen, and B. Predel, Z. Metallkd. 79, 654 (1988).108J. A. Cahill and A. V. Grosse, J. Phys. Chem. 69, 518 (1965).109T. N. Andrianova, A. A. Aleksandrov, V. S. Okhotin, L. A. Razumei-
chenko, and Z. I. Panina, High Temp. 9, 850 (1971).110S. Mudry, Y. Plevachuk, V. Sklyarchuk, and A. Yakymovych, J. Non-
Cryst. Solids 354, 4415 (2008).111M. P. Harding and A. Davis, J. Australas. Inst. Met. 20, 150 (1975).112D. Ofte and L. J. Wittenberg, Trans. Metall. Soc. AIME 227, 706 (1963).113M. Jeyakumar,M. Harmed, and S. Shankar, J. Non-Newtonian FluidMech.
166, 831 (2011).114T. P. Yao and V. Kondig, J. Inst. Met. 81, 17 (1952-53).115M. R. Hopkins and T. C. Toye, Proc. Phys. Soc. B 63, 773 (1950).
nse or copyright; see http://jpcrd.aip.org/about/rights_and_permissions
Related Documents