Author's personal copy Virus Research 176 (2013) 91–100 Contents lists available at SciVerse ScienceDirect Virus Research jo ur nal home p age: www.elsevier.com/locate/virusres Reduction of leaf area and symptom severity as proxies of disease-induced plant mortality: The example of the Cauliflower mosaic virus infecting two Brassicaceae hosts Juliette Doumayrou a,b , Sophie Leblaye b , Rémy Froissart a,b,** , Yannis Michalakis a,* a Laboratoire “Maladies Infectieuses et Vecteurs: Ecologie, Génétique, Evolution et Contrôle” (MIVEGEC), UMR 5290 CNRS-IRD-UM1-UM2, 911 Avenue Agropolis, 34394 Montpellier, France b Laboratoire “Biologie & Génétique des Interactions Plantes-Parasites” (BGPI), UMR 385 INRA-CIRAD-SupAgro, Campus international de Baillarguet, 34398 Montpellier, France a r t i c l e i n f o Article history: Received 29 April 2013 Accepted 19 May 2013 Available online 3 June 2013 Keywords: Virulence Mortality proxies Cauliflower mosaic virus Brassica rapa Arabidopsis thaliana Data Archived: Dryad doi:10.5061/dryad.5mh88 a b s t r a c t Disease induced effects on host survival are important to understand the evolution of parasitic viru- lence and host resistance/tolerance. Unfortunately, experiments evaluating such effects are in most cases logistically demanding justifying the measurement of survival proxies. For plant hosts commonly used proxies are leaf area and the nature and severity of visual qualitative disease symptoms. In this study we tested whether these traits are indeed correlated to the host mortality rate induced by viral infection. We infected Brassica rapa and Arabidopsis thaliana plants with different natural isolates of Cauliflower mosaic virus (CaMV) and estimated over time the development of symptoms and the relative reduction of leaf area compared to healthy plants and followed plant mortality. We observed that the mortality of infected plants was correlated with the relative reduction of leaf area of both B. rapa and A. thaliana. Measures of mortality were also correlated with the severity of visual qualitative symptoms but the magnitude of the correlations and the time frame at which they were significant depended on the host plant: stronger and earlier correlations were observed on A. thaliana. © 2013 Elsevier B.V. All rights reserved. 1. Introduction Diseases affect host fitness through modifications of host life history traits. For horizontally transmitted parasites a host life his- tory trait commonly measured is the reduction of host survival due to parasite infection (e.g. de Roode et al., 2008; Ferguson and Read, 2002; Jensen et al., 2006). Evaluation of host survival is indeed relevant to our understanding of the ecology and evolution of host–parasite interactions since host survival directly impacts the time during which the parasites may be transmitted, and hence parasite fitness (e.g. Anderson and May, 1982; Frank, 1996; Levin, 1996). Because measures of host survival are often logistically com- plicated, it has become common use to measure various potential proxies such as reduction of size (Jensen et al., 2006), biomass (de Roode et al., 2008), wing asymmetry (Agnew and Koella, 1997). * Corresponding author. Tel.: +33 4 67 41 61 54; fax: +33 4 67 41 62 99. ** Corresponding author at: Laboratoire “Maladies Infectieuses et Vecteurs: Ecolo- gie, Génétique, Evolution et Contrôle” (MIVEGEC), UMR 5290 CNRS-IRD-UM1-UM2, 911 Avenue Agropolis, 34394 Montpellier, France. E-mail addresses: [email protected] (R. Froissart), [email protected] (Y. Michalakis). When the hosts are plants such proxies may be modifications of plant height, leaf biomass or area, or the nature and severity of visual qualitative disease symptoms such as chlorosis and/or mosaic, necrosis, host stunting or other leaf disorders. Measures of leaf area reduction and visual qualitative symptom severity are non-destructive and can be taken repeatedly during the course of infection. Surprisingly, at least for viral plant diseases very few experi- ments evaluated in the same biological system the reductions of host survival, leaf area, and/or severity of visual qualitative symp- toms (Table 1). More importantly, no study tested statistically the relationship between these potential proxies with plant survival. Moreover, despite the broad host range of most plant viruses (Hull, 2001), we found only one study reporting the effect of infection of a luteovirus on both survival and leaf area of different host species (Malmstrom et al., 2005). However, even this study did not report on the correlation between the two traits. In the present manuscript, we aimed at testing whether the rel- ative reduction of leaf area and the severity of visual qualitative symptoms are indeed correlated with disease induced host mor- tality when two natural host plants (Brassica rapa and Arabidopsis thaliana) were singly infected by several viral natural isolates of the Cauliflower mosaic virus (CaMV). 0168-1702/$ – see front matter © 2013 Elsevier B.V. All rights reserved. http://dx.doi.org/10.1016/j.virusres.2013.05.008

Welcome message from author
This document is posted to help you gain knowledge. Please leave a comment to let me know what you think about it! Share it to your friends and learn new things together.
Transcript
Author's personal copy
Virus Research 176 (2013) 91– 100
Contents lists available at SciVerse ScienceDirect
Virus Research
jo ur nal home p age: www.elsev ier .com/ locate /v i rusres
Reduction of leaf area and symptom severity as proxies ofdisease-induced plant mortality: The example of the Cauliflowermosaic virus infecting two Brassicaceae hosts
Juliette Doumayroua,b, Sophie Leblayeb, Rémy Froissarta,b,!!, Yannis Michalakisa,!
a Laboratoire “Maladies Infectieuses et Vecteurs: Ecologie, Génétique, Evolution et Contrôle” (MIVEGEC), UMR 5290 CNRS-IRD-UM1-UM2, 911 AvenueAgropolis, 34394 Montpellier, Franceb Laboratoire “Biologie & Génétique des Interactions Plantes-Parasites” (BGPI), UMR 385 INRA-CIRAD-SupAgro, Campus international de Baillarguet, 34398Montpellier, France
a r t i c l e i n f o
Article history:Received 29 April 2013Accepted 19 May 2013Available online 3 June 2013
Keywords:VirulenceMortality proxiesCauliflower mosaic virusBrassica rapaArabidopsis thaliana
Data Archived: Dryaddoi:10.5061/dryad.5mh88
a b s t r a c t
Disease induced effects on host survival are important to understand the evolution of parasitic viru-lence and host resistance/tolerance. Unfortunately, experiments evaluating such effects are in most caseslogistically demanding justifying the measurement of survival proxies. For plant hosts commonly usedproxies are leaf area and the nature and severity of visual qualitative disease symptoms. In this study wetested whether these traits are indeed correlated to the host mortality rate induced by viral infection. Weinfected Brassica rapa and Arabidopsis thaliana plants with different natural isolates of Cauliflower mosaicvirus (CaMV) and estimated over time the development of symptoms and the relative reduction of leafarea compared to healthy plants and followed plant mortality. We observed that the mortality of infectedplants was correlated with the relative reduction of leaf area of both B. rapa and A. thaliana. Measures ofmortality were also correlated with the severity of visual qualitative symptoms but the magnitude of thecorrelations and the time frame at which they were significant depended on the host plant: stronger andearlier correlations were observed on A. thaliana.
© 2013 Elsevier B.V. All rights reserved.
1. Introduction
Diseases affect host fitness through modifications of host lifehistory traits. For horizontally transmitted parasites a host life his-tory trait commonly measured is the reduction of host survival dueto parasite infection (e.g. de Roode et al., 2008; Ferguson and Read,2002; Jensen et al., 2006). Evaluation of host survival is indeedrelevant to our understanding of the ecology and evolution ofhost–parasite interactions since host survival directly impacts thetime during which the parasites may be transmitted, and henceparasite fitness (e.g. Anderson and May, 1982; Frank, 1996; Levin,1996).
Because measures of host survival are often logistically com-plicated, it has become common use to measure various potentialproxies such as reduction of size (Jensen et al., 2006), biomass (deRoode et al., 2008), wing asymmetry (Agnew and Koella, 1997).
! Corresponding author. Tel.: +33 4 67 41 61 54; fax: +33 4 67 41 62 99.!! Corresponding author at: Laboratoire “Maladies Infectieuses et Vecteurs: Ecolo-
gie, Génétique, Evolution et Contrôle” (MIVEGEC), UMR 5290 CNRS-IRD-UM1-UM2,911 Avenue Agropolis, 34394 Montpellier, France.
E-mail addresses: [email protected] (R. Froissart),[email protected] (Y. Michalakis).
When the hosts are plants such proxies may be modificationsof plant height, leaf biomass or area, or the nature and severityof visual qualitative disease symptoms such as chlorosis and/ormosaic, necrosis, host stunting or other leaf disorders. Measuresof leaf area reduction and visual qualitative symptom severity arenon-destructive and can be taken repeatedly during the course ofinfection.
Surprisingly, at least for viral plant diseases very few experi-ments evaluated in the same biological system the reductions ofhost survival, leaf area, and/or severity of visual qualitative symp-toms (Table 1). More importantly, no study tested statistically therelationship between these potential proxies with plant survival.Moreover, despite the broad host range of most plant viruses (Hull,2001), we found only one study reporting the effect of infection ofa luteovirus on both survival and leaf area of different host species(Malmstrom et al., 2005). However, even this study did not reporton the correlation between the two traits.
In the present manuscript, we aimed at testing whether the rel-ative reduction of leaf area and the severity of visual qualitativesymptoms are indeed correlated with disease induced host mor-tality when two natural host plants (Brassica rapa and Arabidopsisthaliana) were singly infected by several viral natural isolates of theCauliflower mosaic virus (CaMV).
0168-1702/$ – see front matter © 2013 Elsevier B.V. All rights reserved.http://dx.doi.org/10.1016/j.virusres.2013.05.008

Author's personal copy
92 J. Doumayrou et al. / Virus Research 176 (2013) 91– 100
Table 1Studies reporting concomitant measures of reductions of leaf area, severity of symptoms, and/or host survival induced by plant viruses on their host.
Virus Number ofvirus genotypetested
Host plantspecies
Survivalrelative tohealthy plants
Leaf arearelative tohealthy plants
Evaluation ofsymptoms
References
Banana bunchy top virus 1 Musa acuminata • " + Hooks et al. (2008)Barley yellow dwarf virus [-PAV] 1 Wild grass species #pe #py • Malmstrom et al. (2005)Cucumber mosaic virus 10 Cucumis melo " • + Betancourt et al. (2011)Lettuce mosaic virus 9 Lactuca sativa • " + Bos et al. (1994)Indian peanut clump virus pop$ Triticum aestivum " • + Delfosse et al. (1999)Rice yellow mottle virus 2 Oryza sativa spp. + "vp + Fargette et al. (2002)Tobacco leaf curl virus pop Eupatorium chinense " " • Yahara and Oyama (1993)Tobacco leaf curl virus pop Eupatorium makioni #e % + Funayama et al. (1997)Cauliflower mosaic virus & Turnip rosette virus pop Brassica nigra • "ve + Thurston et al. (2001)Turnip mosaic virus & Turnip yellow mosaic virus pop Brassica oleracea " = + Maskell et al. (1999)Turnip mosaic virus 1 Brassica juncea • " + Guo et al. (2005)
": Decrease of the considered trait compared to healthy plants.#: Decrease or no change of the considered trait compared to healthy plants.%: Increase or no change of the considered trait compared to healthy plants.=: No change of the considered trait compared to healthy plants.+: Authors report variation on the trait.p: Variation according to the plant genotype.y: Variation according to the year of experiment.e: Variation according to the environment.v: Variation according to the viral genotype.$: Pop corresponds to a viral population isolated from the field without any further characterization.•: Data not available.
2. Materials and methods
2.1. Plant growth conditions
Seeds of Brassica rapa-rapifera (L.) cv. ‘Just Right’ and A. thalianaecotype Col-0 were sown in batches in a glasshouse (24 ± 2 $C,13 h light). Seven days after seeding, seedlings were transplantedinto individual 9 cm & 9 cm pots for B. rapa or 5.5 cm & 5.5 cm for A.thaliana (24 pots per batch) with Huminsubstrat Neuhaus N2, pH5.5–6.5 (Klasman Deilmann GmBH, Geeste, Germany). Plants werethen immediately transferred in a phytotron with 9 h light (3600lux) at 22 ± 1 $C, 15 h night at 20 ± 1 $C, and 80 ± 5% relative humid-ity. They were also irrigated with 15:10:30 NPK + oligonutrients.Plants continued to grow as rosettes after 6 weeks; none of theinfected plants initiated flowering while less than one percent ofhealthy plants did under these growth conditions.
2.2. Viral isolates and inoculation
CaMV is a reverse-transcribing pararetrovirus with doublestranded DNA (dsDNA) virus transmitted exclusively horizontallyby aphids (Mink, 1993; Tomlinson and Walker, 1973). We eval-uated proxies of survival and decrease in host survival inducedby twenty viral isolates of CaMV provided by Dr. Nadia S. Al-Kaff(John Innes Institute, UK; Al-Kaff and Covey, 1994, 1995; Cecchiniet al., 1998). All these isolates were collected worldwide in thefield either on Brassica spp. or on unspecified hosts (Table S1; Hull,1980). After its sampling in nature, each viral population was pas-saged twice on B. rapa-rapifera (L.) cv. ‘Just Right’ and stored asdehydrated material in the John Innes Institute. We used this dehy-drated material to initiate the viral populations of each isolate.Samples of each dehydrated plant infected by a single viral isolatewere first suspended into inoculation buffer (Tris 10 mM; MgCl22.5 mM; pH 7.5). We then inoculated 50 !l of each solution on thefourth or fifth leaf of four weeks old turnips (B. rapa-rapifera cv.‘Just Right’) by using an abrasive powder (Carborundum, Sigma).These singly-inoculated plants were grown in a glasshouse. Thirtydays post-inoculation (dpi) all systemically infected leaves wereharvested and stored at '80 $C. This material was then used assource of inoculum for the experiments. We thus first suspendedsamples of leaves of infected plants into inoculation buffer and
quantified (qPCR, SYBR-green® technology, MxPro3005, Strata-gene) the viral DNA with one set of primers to target the virus(F – 1487 5(-AACAACCTCATTGAGATTGTAGGA-3( and R – 1553 5(-TCCGAAGGGTCTTTGCTTAG-3(). For each isolate, a dilution factorwas calculated as the ratio of the quantification of the isolate rel-ative to the least concentrated isolate. Each isolate was dilutedwith inoculation buffer according to the dilution factor except forthe least concentrated isolate. Inoculation of each of the twentyCaMV isolates was performed as described above on B. rapa on 6plants. For logistic reasons, only a subset of nine CaMV isolates wereinoculated on all leaves (approximately eight developed leaves) offour weeks old A. thaliana (15 per isolate). All inoculated plants forthe experiments were grown in the phytotron and their positionswere randomized. Control plants corresponded to mock-inoculatedplants, i.e. inoculated with samples of healthy B. rapa ground intoinoculation buffer.
2.3. Proxies and host mortality
We followed the survival of individual plants and measured hostmortality directly as hazard ratios of infected relative to healthyplants. We also measured host mortality of each isolate as the per-centage of plants infected by this isolate which had died at the datewhere between isolate variance of mortality was maximal. Thatdate was determined a posteriori by following mortality over time.
We measured throughout the infection two proxies of survival,namely: (i) the reduction of leaf area due to viral infection and (ii)the severity of qualitative symptoms by visually rating symptoms.
2.3.1. MortalityThe mortality of plants (infected and control) was followed
every one to five days after 33 dpi and 35 dpi (no plant had diedbefore that date) until 228 dpi and 98 dpi (the death of all infectedplants) for B. rapa and A. thaliana, respectively. Plants were consid-ered as dead when the apex was yellow, old leaves were dried andno new leaves were growing anymore. For B. rapa, the mortalityrate per isolate and controls was estimated on 6 plants while forA. thaliana, the mortality rate per isolate was estimated on 6–15infected plants (i.e. depending on the infectivity of the differentisolates) and on 51 plants for uninfected controls. For each groupof plants Kaplan–Meier survival parameters were estimated.
Author's personal copy
J. Doumayrou et al. / Virus Research 176 (2013) 91– 100 93
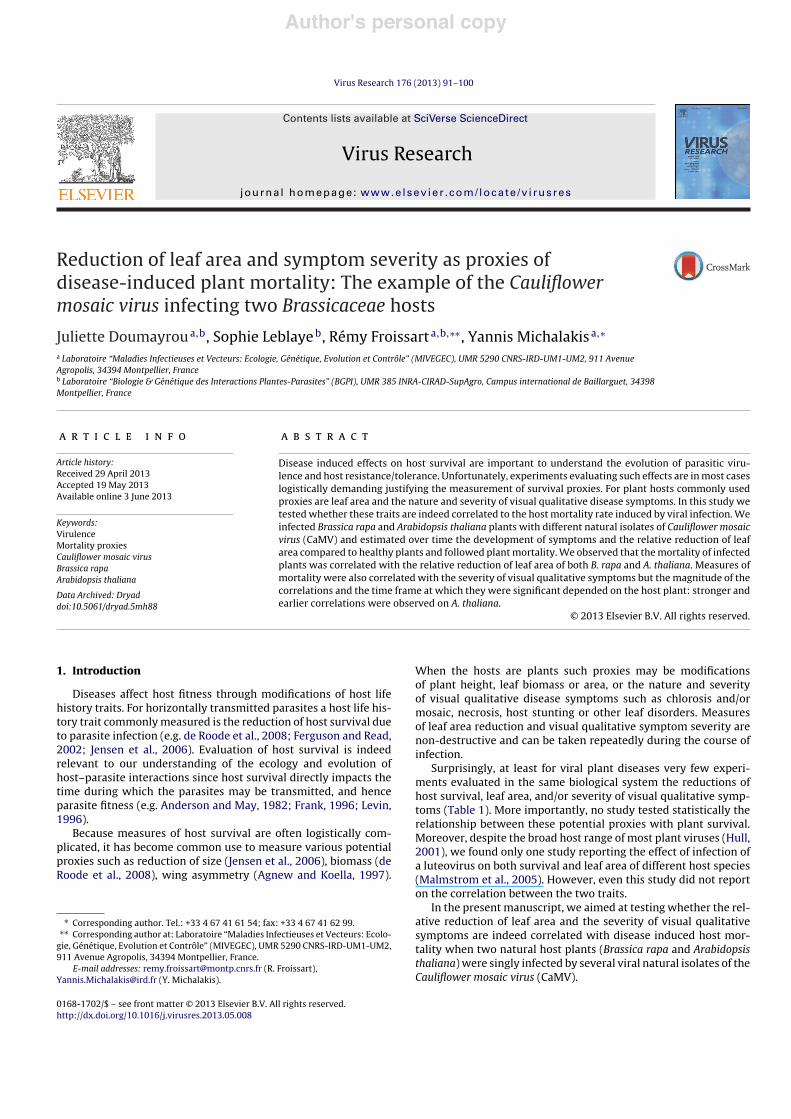
Fig. 1. Survival curves of Brassica rapa singly-infected plants by each of twenty isolates of Cauliflower mosaic virus (black squares) and uninfected controls (open triangles).Each panel displays the survival curves and hazard ratios of five isolates and the control. The same control survival curves are repeated in each panel to facilitate comparisonbetween infected versus healthy plants.
We used Cox’s proportional hazards model (Allison, 1995) toinvestigate whether mortality rates differed between isolates andestimated hazard ratios for plants infected by each isolate relativeto control plants. Plants evaluated as dead were immediatelyremoved. Experiments were ended when the last infected hostdied. We also characterized mortality as the percentage of plantsinfected by each isolate which had died by the date at which thebetween isolates variance in mortality was maximal.
2.3.2. Relative reduction of leaf areaPictures of individual plants were taken from the above. Leaf
areas of plants (infected and control) were measured at severaltimes after infection (0, 9, 18, 23, 27, 34 and 46 dpi for B. rapa;0, 15, 21 and 34 dpi for A. thaliana). Each picture was analyzed bythe software “Cell Image Analyzer” based on the Image J software(Research Services Branch, National Institute of Mental Health,Bethesda, Maryland, USA) with an added visual scripting interfacecoded by Volker Bäcker (the code of the plug-in is available onrequest). The output of the image analysis yielded the projectedleaf area. These projected leaf areas were then transformed to arelative reduction of leaf area index for each plant according to Eq.(1):
Relative reduction of leaf area = 1 '�
(Sx dpi/S0 dpi)sample
E(Sx dpi/S0 dpi)control
�(1)
where Sx dpi and S0 dpi correspond to the projected leaf area mea-sured at “x dpi” and at the day of inoculation (0 dpi), respectively.The ratio Sx/S0 of each sample was standardized by the averageratio of the control plants grown under the same conditions.
2.3.3. Measure of visual qualitative symptom severityVisual qualitative symptoms induced by CaMV infection were
monitored every 2–5 days after their first appearance, i.e. 7 dpi onB. rapa and 15 dpi on A. thaliana up to 28 and 31 dpi on the two hosts,respectively. Symptom notation was performed as following, and inagreement with Al-Kaff and Covey (1995) and Cecchini et al. (1998):“0”: no symptoms; “1”: local lesions on inoculated leaf; “2”: weakvein clearing with mosaic on the first systemically infected leaf;“3”: medium vein clearing and mosaic with weak leaf-curling onat least two systemically infected leaves; “4”: strong vein clearingand mosaic on all leaves with a beginning of leaf stunting, distortionand eventually necrosis; and “5”: strong leaf stunting, mosaic andeventually necrosis on all leaves of the plant (Fig. S1).
2.4. Statistical analysis
Data on relative leaf area reduction were analyzed using ANOVAmodels; repeated-measures ANOVA models were used to accountfor repeated measures whenever these traits were measured on thesame plants at different time points.
Data on visual qualitative symptoms were analyzed usingone-factor (isolate) nonparametric analysis of ordinal data withrepeated measures following the procedures outlined by Shah andMadden (2004).
To estimate mortality we followed two approaches. The firstconsisted of following the survival of individual plants until all ofthem were dead, and then use hazard ratios as parameters reflect-ing relative mortality, i.e. in this case virulence. Because followingsurvival until all infected plants are dead can take a long time,we also estimated relative mortalities at a fixed date. Since wedid not have any a priori idea on which date would be the mostsuitable, we chose the date where the between-isolates variance
Author's personal copy
94 J. Doumayrou et al. / Virus Research 176 (2013) 91– 100
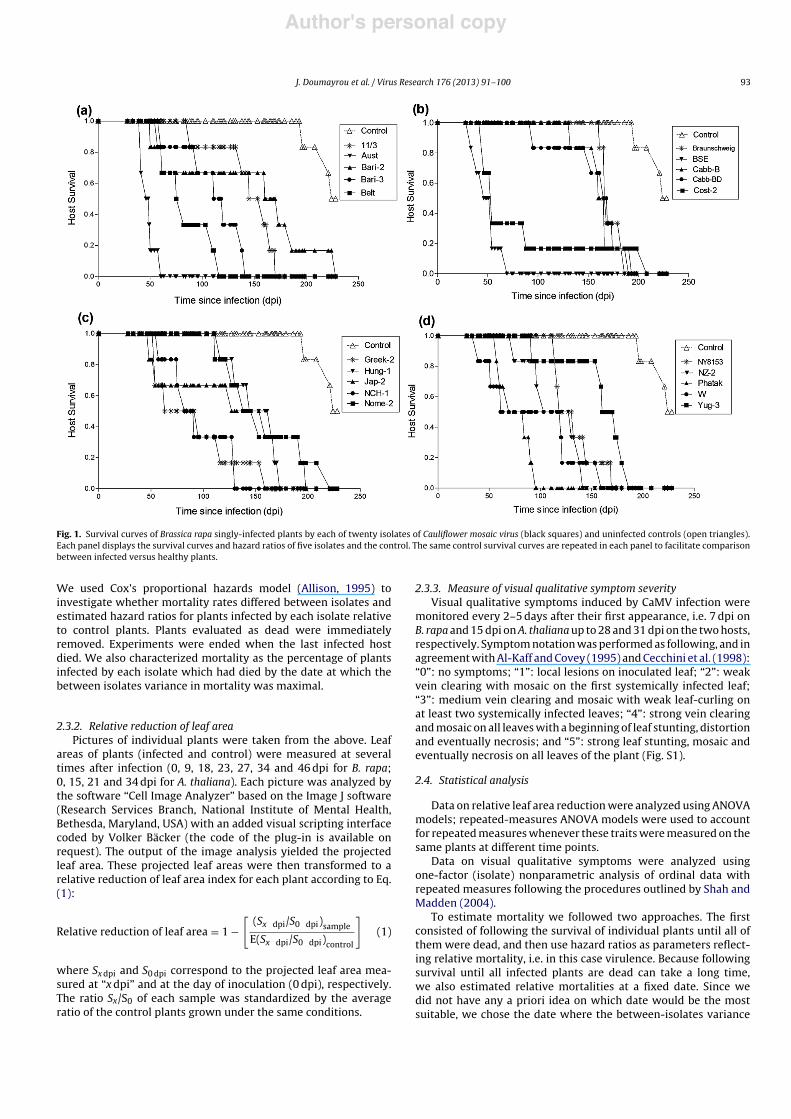
Fig. 2. Evolution of leaf area of Brassica rapa plants infected by each of twenty Cauliflower mosaic virus isolates. Graphs (a) and (b) present the evolution of leaf area at 0, 9,18, 23, 27, 34 and 46 days post-inoculation of turnip plants infected by each of twenty isolates of CaMV ranked in alphabetical order and represented by black and dashedlines. (a) corresponds to the first ten isolates and (b) to the remaining ten isolates. The black bold line corresponds to the evolution of leaf area of healthy plants (control).
of mortality rates was maximal. The percentages of dead plantswere analyzed considering a binary response variable, i.e. whethereach individual plant had died or not at a given date, using a GLMmodel with a binomial distribution and a logit link function. Toaccount for the fact that some isolates had killed none and othersall plants they had infected we used Firth’s penalized likelihood.Because the distributions of hazard ratios of infected relative tohealthy plants strongly deviated from normal distributions, weused Spearman’s correlation coefficient to correlate hazard ratiosto either proxies or the percentages of dead plants at a fixed date.We also used Spearman’s correlation coefficient in all correlationsinvolving the visual qualitative symptoms. The remaining correla-tions (i.e. those between leaf area reduction and the percentages ofdead plants for each host plant) were estimated through Pearson’scorrelation coefficient. Statistical analyses were carried out usingJMP 8.0 (SAS Institute Inc.), SAS 9.3 (SAS Institute Inc.), and R 2.9.2(R Development Core Team, 2008).
3. Results
3.1. Effect of CaMV infection on B. rapa
3.1.1. Mortality rateThe variance in the time to death of infected plants was very
large since the first infected plant died at 33 dpi (BSE) and thelast at 228 dpi (Bari-2). We used Cox’ proportional hazards model
to analyze the effects of the different isolates on plant mortality.The analysis revealed that almost all isolates significantly increasedplant mortality (proportional hazards model considering all 20 iso-lates and the control group, df = 20, !2 = 118.77, P < 0.0001; Fig. 1)The confidence interval of the regression parameter ˇ, character-izing the effect of each isolate on plant mortality, did not overlapwith that of the control plants for all isolates except Bari-2 indi-cating that these 19 isolates significantly increased plant mortality(Table S1). The ratio of the hazard ratio of each isolate relative tothe controls varied significantly across isolates, ranging from 5.95(Bari-2) to 626.07 (Aust; Table S2).
We then looked at mortality at a fixed date. To choose the fixeddate we followed the between isolates variance in the percentageof dead plants per isolate and chose the date which maximizedthis variance; in our experimental conditions this correspondedto 110 dpi (Fig. S2a). At that date, none of the control plants haddied, while the percentages of dead plants varied significantlybetween the twenty isolates: some isolates (Braunschweig, Cabb-BD, Hung-1, Nome-2 and NY8153) had caused no plant mortality, incontrast to others (Aust, BSE and Phatak) which had already killedall infected plants (GLM, df = 19, !2 = 71.87, P < 0.0001).
3.1.2. Reduction of leaf areaWe first looked at whether infection significantly affected
leaf area by opposing plants infected by any of the isolates to

Author's personal copy
J. Doumayrou et al. / Virus Research 176 (2013) 91– 100 95
control plants. We found a significant interaction between infec-tion and time since infection, due to the fact that the effect ofinfection on leaf area surface increased from 9 to 46 dpi (inter-action infected/control & time, repeated measures ANOVA, F-test,F6,138 = 106.79, P < 0.0001; Fig. 2 and Table S3). Indeed, looking atthe effect on leaf area of each isolate separately, we found thatnone of the isolates reduced leaf area surface at the early stagesof infection (twenty-one isolates with control as isolate at 9 dpi,ANOVA, df = 20, P = 0.37; Fig. 2 and Table S3). At 18 dpi, five isolates(Aust, Bari-2, Cost-2, Jap-2 and W) already significantly reducedleaf area compared to controls (twenty-one isolates with controlas isolate at 18 dpi, ANOVA, df = 20, F = 2.73, P = 0.0004; isolatescompared to control, Dunnett test, P # 0.04 for the above cited iso-lates; Fig. 2 and Table S3). At later stages of infection, all isolatessignificantly reduced the leaf area of infected plants (twenty-oneisolates with control as isolate at either 23, 27, 34 or 46 dpi, ANOVA,df = 20, P < 0.0004 in all dates; isolates compared to control, Dun-nett test, P < 0.05 for all isolates; Fig. 2 and Table S3). There was
significant variation among isolates in the relative reduction of leafarea they caused in late stages of infection (at 23, 27, 34 and 46 dpi,ANOVA, df = 19, P < 0.0001 for each date); the relative reduction ofleaf area ranged from 43% ± 22% (11/3) to 97.5% ± 5.6% (Aust) at46 dpi. Finally, at the late stages of infection the relative ranks of theisolates were conserved through time (interaction time & isolatefrom 23 dpi to 46 dpi, ANOVA, df = 57, F = 0.48, P = 0.99, Fig. 2 andTable S3). For example, we observed a significant positive corre-lation between relative leaf surface area reduction at 23 dpi and46 dpi (n = 20, Pearson correlation coefficient r = 0.72, P = 0.0003).
3.1.3. Visual qualitative symptomsThe per isolate average visual qualitative symptoms notation
followed an S-shaped curve with time, reaching a plateau after arapid increase phase (Fig. 3a). The isolates significantly differedamong them in the amount of visual qualitative symptoms theycaused; not surprisingly these symptoms increased with time,while the isolate & time interaction was also significant indicating
Fig. 3. Average (±SD) visual qualitative symptoms notation per CaMV isolate through time on (a) Brassica rapa and (b) Arabidopsis thaliana.

Author's personal copy
96 J. Doumayrou et al. / Virus Research 176 (2013) 91– 100
Table 2Nonparametric analysis of visual qualitative symptoms on (a) Brassica rapa and (b)Arabidopsis thaliana.
Analysis of variance-type statistic
Effect dfN dfD F P-value
(a) Brassica rapaIsolate 13.875 71.949 11.086 <0.001Time 4.909 ) 990.52 <0.001Isolate & time 40.686 ) 3.688 <0.001
(b) Arabidopsis thalianaIsolate 5.8472 42.206 8.6452 <0.001Time 2.7212 ) 326.86 <0.001Isolate & time 12.306 ) 2.6926 0.001
dfN: degrees of freedom of numerator; dfD: degrees of freedom of denominator.
that the way these visual qualitative symptoms increased with timediffered from one isolate to the other (Table 2a).
3.1.4. Relationship between mortality measures and proxiesThe percentages of dead plants at 110 dpi were positively corre-
lated to the hazard ratios (n = 20, Spearman correlation coefficient" = 0.77, P < 0.0001). The hazard ratios and the relative reductions ofleaf area were positively correlated at the late stages of infection at34 dpi (n = 20, Spearman correlation coefficient " = 0.53, P = 0.015;Fig. 4a) and 46 dpi (n = 20, Spearman correlation coefficient " = 0.61P = 0.0045). The percentages of dead plants at 110 dpi were also
positively correlated to the relative reductions of leaf area from23 dpi to 46 dpi (n = 20, Pearson correlation, for all dates P # 0.036).However, the Pearson correlation coefficients were the highest at34 and 46 dpi (0.62 and 0.61, respectively; Fig. 4b).
Overall the per isolate average notation of visual qualitativesymptoms was not correlated to the hazard ratios (n = 20, Spearmancorrelation " < 0.37, P % 0.10) except at 28 dpi were a significant cor-relation was found (n = 20, Spearman correlation " = 0.54, P = 0.014;Fig. 4c). The visual qualitative symptoms were more correlated(i.e. earlier and with higher correlation coefficients) with the per-centages of dead plants at 110 dpi (n = 20, Spearman correlation,at 23 dpi " = 0.53, P = 0.016; at 25 dpi " = 0.64, P = 0.002; at 28 dpi" = 0.76, P < 0.0001; Fig. 4d).
3.2. Impact of viral infection on A. thaliana
3.2.1. Mortality rateMortality was followed during 98 days after inoculation, when
all infected plants had died. The first dead plants were observedat 35 dpi (infected by Bari-2, Bari-3, Cabb-BD, Jap-2, NY8153 andYug-3 isolates) and the last infected plant died at 98 dpi (Aust iso-late). The Cox proportional hazards analysis revealed that infectionby all isolates increased plant mortality relative to controls (pro-portional hazards model with 9 isolates and control group; df = 9,"2 = 118.77, P < 0. 0001; Fig. 5 and Table S5). The confidence inter-val of the regression coefficient # of all isolates did not overlap
Fig. 4. Relationship between mortality measures and proxies of mortality induced by twenty isolates of Cauliflower mosaic virus on Brassica rapa: (a) relative reductions ofleaf area at 34 days post-inoculation (dpi) and hazard ratios relative to control plants; (b) relative reductions of leaf area at 34 days post-inoculation (dpi) and the percentageat 110 dpi of dead plants for each isolate; (c) visual qualitative symptoms at 28 dpi and hazard ratios relative to control plants and (d) visual qualitative symptoms at 28 dpiand the percentage at 110 dpi of dead plants for each isolate. The lines correspond to linear relationships and are provided as graphical illustrations.

Author's personal copy
J. Doumayrou et al. / Virus Research 176 (2013) 91– 100 97
Fig. 5. Survival curves over time of Arabidopsis thaliana singly-infected plants by each of nine isolates of Cauliflower mosaic virus (black lines with black and white filledsquares) and uninfected controls (dashed line with open triangles).
with that of the control plants (Table S5) indicating that all isolatessignificantly increased plant mortality (Table S5). The hazard ratioof each isolate relative to that of the controls varied significantlyacross isolates ranging from 21.09 (Aust) to 243.95 (Bari-2) (TableS5).
The between isolates variance of the proportion of dead plantsreached a maximum at 49 dpi (Fig. S2b). At that date none of thecontrol plants had died, while the percentages of dead plants var-ied significantly among the nine isolates: mortality ranged from0% (Aust and Hung-1) to 100% (Jap-2) (GLM, df = 8, !2 = 70.32,P < 0.0001).
3.2.2. Reduction of leaf areaAs for turnips, we first looked at whether infection significantly
affected leaf area by opposing plants infected by any of the iso-lates to control plants. We found a significant interaction betweeninfection and time since infection, due to the fact that the effectof infection on leaf area surface increased from 15 to 34 dpi (inter-action infected/control & time, repeated measures ANOVA, F-test,F3,158 = 25.14, P < 0.0001; Fig. 6 and Table S6). The leaf area of plants
infected by any of the isolates did not differ from that of controlplants at the early stages of infection (nine isolates and control at15 dpi, ANOVA, df = 20, P = 0.37; Fig. 6 and Table S6). At 21 dpi, onlythree isolates (Bari-2, Jap-2 and Yug-3) caused a significant reduc-tion of leaf area compared to controls (nine isolates and controlat 21 dpi, ANOVA, df = 9, F = 4.44, P < 0.0001; isolates compared tocontrol, Dunnett test, for the three isolates cited above P # 0.003;Fig. 6 and Table S6). At later stages of infection, more isolatesinduced reductions of leaf area compared to controls (nine iso-lates and control at 34 dpi, ANOVA, df = 9, P < 0.0001; only threeisolates, Aust, Hung-1 and Braunschweig, did not affect leaf area;for these three isolates compared to control, Dunnett test, P % 0.09;Fig. 6 and Table S6). The isolates differed greatly in the relativereduction of leaf area they caused ranging from 0 ± 24% (Hung-1) to63 ± 13.5% (Jap-2) at 34 dpi. Finally, similarly to what we observedin turnips, the different isolates overall conserved their relativeranks as infection progressed, except for the Aust isolate (Fig. 6and Table S6): we observed a positive correlation between relativeleaf area reductions at 21dpi and 34dpi (n = 9, Pearson correlationcoefficient r = 0.82, P = 0.0062).
Fig. 6. Evolution of leaf area of Arabidopsis thaliana plants infected by each of nine Cauliflower mosaic virus isolates. The graph presents the leaf area at 0, 14, 21 and 34 dayspost-inoculation of singly-infected plants by each of nine isolates of CaMV. The black bold line corresponds to the controls.
Author's personal copy
98 J. Doumayrou et al. / Virus Research 176 (2013) 91– 100
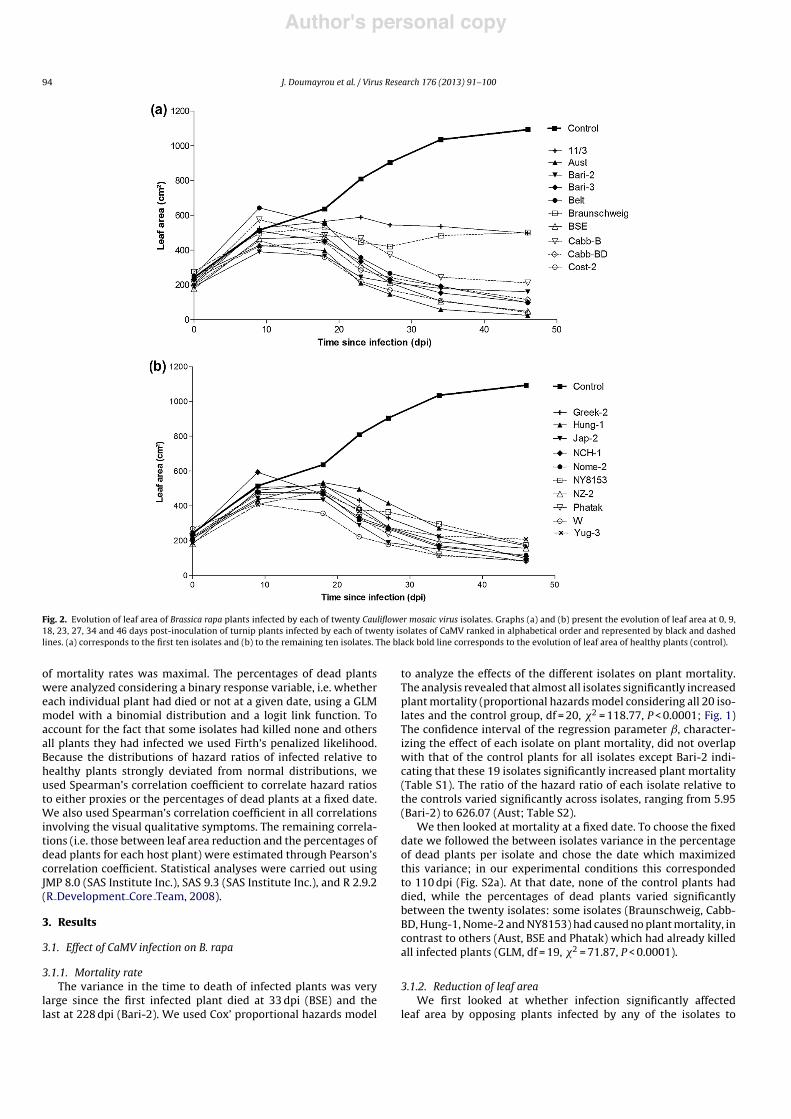
Fig. 7. Relationship between mortality measures and proxies of mortality induced by nine isolates of Cauliflower mosaic virus on Arabidopsis thaliana: (a) relative reductions ofleaf area at 34 days post-inoculation (dpi) and hazard ratios relative to control plants; (b) relative reductions of leaf area at 34 days post-inoculation (dpi) and the percentageat 49 dpi of dead plants for each isolate; (c) visual qualitative symptoms at 31 dpi and hazard ratios relative to control plants and (d) visual qualitative symptoms at 31 dpiand the percentage at 49 dpi of dead plants for each isolate. The dashed lines correspond to linear relationships and are provided as graphical illustrations.
3.2.3. Visual qualitative symptomsSimilarly to what was observed on turnips, the per isolate
average visual qualitative symptoms notation increased withtime, though only several isolates seemed to reach a plateauwithin the time frame of our observations (Fig. 3b). The isolatessignificantly differed among them in the amount of visual qual-itative symptoms they caused; not surprisingly these symptomsincreased with time, while the isolate & time interaction was alsosignificant indicating that the way these visual qualitative symp-toms increased with time differed from one isolate to the other(Table 2b).
3.2.4. Relationship between mortality measures and proxiesThe percentages of dead plants at 49 dpi were positively corre-
lated to the hazard ratios (n = 9, Spearman correlation coefficient" = 0.93, P = 0.0003). The relative reductions of leaf area were cor-related at the late stage of infection to the hazard ratios (at 34 dpi,n = 9, Spearman correlation coefficient " = 0.78, P = 0.013; Fig. 7a)and the percentages of dead plants at 49 dpi (at 34 dpi, n = 9, Pear-son correlation coefficient r = 0.84, P = 0.005; Fig. 7b). At the earlystages of infection, the relative reductions of leaf area were not cor-related to either the hazard ratios (at 15 and 21 dpi n = 9, Spearmancorrelation, in both cases P % 0.07) or the percentages of dead plantsat 49 dpi (n = 9, Pearson correlation, P % 0.13).
The measures of visual qualitative symptoms were positivelycorrelated to the ln(hazard ratios) at all observation dates (n = 9,Spearman correlation, 15 dpi: " = 0.75, P = 0.02; 16 dpi: " = 0.79,P = 0.01; 21 dpi: " = 0.78, P = 0.014; 23 dpi: " = 0.92, P = 0.0005;28 dpi: " = 0.83, P = 0.005; 31 dpi: " = 0.90, P = 0.0009; Fig. 7c); theywere also positively correlated at all observation dates to the per-centages of dead plants at 49 dpi (n = 9, Spearman correlation,15 dpi: " = 0.71, P = 0.03; 16 dpi: " = 0.73, P = 0.025; 21 dpi: " = 0.84,P = 0.004; 23 dpi: " = 0.84, P = 0.004; 28 dpi: " = 0.86, P = 0.003;31 dpi: " = 0.89, P = 0.001; Fig. 7d).
Finally, we considered only the 9 isolates inoculated in bothhosts to ask whether the isolates which induced the highest mor-tality on one host were the ones inducing the highest mortality onthe other host. This was not the case, as neither the hazard ratios(n = 9, Spearman correlation coefficient " = '0.60, P = 0.09) nor thepercentages of dead plants (n = 9, Pearson correlation coefficientr = '0.33, P = 0.38) induced by the different isolates were correlatedacross host plants.
4. Discussion
Phytopathologists often refer to correlations between effects ofinfection on host fitness and effects on traits such as leaf area,symptom severity, or reduction in seed production. For instance,

Author's personal copy
J. Doumayrou et al. / Virus Research 176 (2013) 91– 100 99
viral infection has been shown to provoke a reduction in photosyn-thetic rates of the host when infection induced symptoms on leaves(Balachandran et al., 1997). Consequently, reductions in photosyn-thetic rates impact the quantity of assimilates and thereafter plantfitness (Funayama et al., 1997; He et al., 2004). The damages causedby infection might thus impact the reproductive performance ofthe host through seed production reduction and/or the vegetativeperformance such as the reduction of plant biomass or leaf area.Note that both parameters will affect parasite fitness differentlyaccording to the parasite mode of transmission: everything elsebeing equal, reduction of reproductive performance will decreasethe fitness of vertically transmitted parasites while reduction ofvegetative performance will decrease the fitness of either verticallyor horizontally transmitted parasites.
Generally, diseases can affect host fitness either by affectinghost reproduction (e.g. in plants) (Lapidot et al., 1997; N’Guessanet al., 2001; Pagan et al., 2007); or host survival. Effects on hostreproduction are obviously relevant from the point of view ofhost defense evolution. They are also relevant to the evolution ofvertically transmitted parasites, as for such parasites host repro-duction is directly related to parasite transmission. However, theyare not directly relevant to the evolution of parasites transmittedexclusively horizontally, such as CaMV. For such parasites the onlyvirulence component relevant to their evolution are reductions ofhost survival (Alizon et al., 2009).
Surprisingly, while many studies report host mortality effectsinduced by horizontally transmitted animal viruses (e.g. HIV, Palellaet al., 2006; Influenza, Murray et al., 2007), studies reporting sucheffects by plant viruses are scarce (e.g. Potato virus Y on potato,Hamm et al., 2010). Our results explicitly show the dynamics ofmortality of infected plants compared to healthy plants. We foundthat all CaMV isolates induced a significant decrease of survival oftwo host plant species (Figs. 1 and 5).
Our main goal in this study was to investigate whether the sever-ity of visual qualitative symptoms or relative reduction of leaf areacould be used as proxies of the host mortality induced by the CaMVon two different host species it infects naturally (Brassicaceae).Due to their direct visual impact, visual qualitative symptomsare one of the first parameters used to evaluate the severity ofa disease (Table 1). In fact, they might reflect (i) differential lev-els of host tolerance (Baucom and de Roode, 2010; Sacristan andGarcia-Arenal, 2008) or (ii) differential levels of within-host viralaccumulation that might influence the symptom severity (Froissartet al., 2010). Also, these mechanisms could lead to differential inter-actions between genotypes of both viruses and plants (Al-Kaff andCovey, 1995; Cecchini et al., 1998). Our results indicate that overall,and at least under our experimental conditions, visual qualitativesymptoms reflect the decrease in survival of infected plants onlyat relatively late stages of infection on B. rapa, while we observedstronger significant positive correlations between visual qualitativesymptom severity and mortality during earlier stages of infectionof A. thaliana (Figs. 4 and 7).
Other studies have previously measured the visual qualitativesymptom severity on B. rapa and A. thaliana, characterized in a simi-lar way, of several of the CaMV isolates we used in our study (Al-Kaffand Covey, 1995; Cecchini et al., 1998). We thus looked at whetherour measures of visual qualitative symptoms were correlated withthe previous measures, across the isolates common in the differ-ent studies. We found a positive correlation between our resultsfrom 21 to 28 dpi and the Al-Kaff and Covey (1995) results (n = 20,Spearman coefficient, P # 0.036; Table S4). Similarly, we found apositive correlation between the Cecchini et al. (1998) results at30 dpi (symptoms notation from 1 to 5; Table S4) and ours from 18to 28 dpi on B. rapa (n = 16, Spearman correlation, P # 0.034). There-fore the different measures of visual qualitative symptom severityof the same isolates across different studies, and thus experimental
conditions, are overall in good agreement on B. rapa. Unfortunatelythe limited number of common isolates across studies does notallow test the relationship between our results on A. thaliana (TableS7) and the results of the other studies on B. rapa.
Relative reduction of leaf area has been used as an estimateof phytoviruses’ virulence (e.g. Yahara and Oyama, 1993; Maskellet al., 1999; Fargette et al., 2002; Malmstrom et al., 2005), followingthe assumption that if leaves are smaller, fewer assimilates will besynthesized, which in turn should lead to lower survival and/or seedproduction. Our results showed that this trait can indeed be usedas a proxy of survival since disease induced mortality (percentagesof dead plants and hazard ratios) was positively correlated with therelative reduction of leaf area at the relatively late stages of infec-tion of both B. rapa and A. thaliana (Figs. 4 and 7, respectively). Therelative reduction of leaf area at the early stages of infection wasnot correlated to mortality probably because the infection had nothad time to significantly affect this trait.
Several studies reported the use of other proxies in order to esti-mate disease effects on host fitness, such as biomass of leaves (e.g.Friess and Maillet, 1996; Thurston et al., 2001) or roots (Funayamaet al., 1997; Mukasa et al., 2006). The measurement of these traitsis destructive and can thus be evaluated only once during the hostlifespan which precludes their estimation, as well as that of othertraits of interest, such as viral accumulation or transmission, atmore than one occasion.
In conclusion, our results show viral infection significantlyincreased the mortality of infected plants (percentages of deadplants and hazard ratios). The mortality rate was correlated with acommonly used proxy, the reduction of leaf area induced by CaMVinfection, at similar time frames on both B. rapa and A. thaliana. Howgood a proxy of mortality the severity of visual qualitative symp-toms is depends on the combination of the host plant, on whethersymptoms are observed relatively late after the initial infection, andpotentially on environmental conditions not studied here.
Acknowledgments
We thank Jean-Luc Macia and Michel Yvon for technical assis-tance and plant care. We are grateful to Stéphane Blanc, BérengerJanzac, Benoit Moury and Cica Urbino for their critical readingof the manuscript. We are grateful to two anonymous review-ers for constructive comments on the manuscript and to oneanonymous reviewer for suggesting the nonparametric analysisof visual qualitative symptoms. This work was supported by theEmergent Infectious Disease Program of the Centre National dela Recherche Scientifique (CNRS) and the Institut National de laRecherche Agronomique (INRA SPE). JD fellowship was supportedboth by Languedoc-Roussillon region and the CNRS. RF and YMacknowledge support from CNRS and the Institut de Recherchepour le Développement (IRD).
Appendix A. Supplementary data
Supplementary data associated with this article can befound, in the online version, at http://dx.doi.org/10.1016/j.virusres.2013.05.008.
References
Agnew, P., Koella, J.C., 1997. Virulence, parasite mode of transmission, and host fluc-tuating asymmetry. Proceedings of the Royal Society B: Biological Sciences 264(1378), 9–15.
Al-Kaff, N., Covey, S.N., 1994. Variation in biological properties of Cauliflower mosaicvirus clones. Journal of General Virology 75, 3137–3145.
Al-Kaff, N.S., Covey, S.N., 1995. Biological diversity of Cauliflower mosaic virus isolatesexpressed in two Brassica species. Plant Pathology 44, 516–526.

Author's personal copy
100 J. Doumayrou et al. / Virus Research 176 (2013) 91– 100
Alizon, S., Hurford, A., Mideo, N., Van Baalen, M., 2009. Virulence evolution and thetrade-off hypothesis: history, current state of affairs and the future. Journal ofEvolutionary Biology 22 (2), 245–259.
Allison, P.D., 1995. Survival Analysis Using SAS. A Practical Guide. SAS Institute, Cary,NC.
Anderson, R.M., May, R.M., 1982. Coevolution of hosts and parasites. Parasitology 85(2), 411–426.
Balachandran, S., Hurry, V.M., Kelley, S.E., Osmond, C.B., Robinson, S.A.,Rohozinski, J., Seaton, G.G.R., Sims, D.A., 1997. Concepts of plant bioticstress. Some insights into the stress physiology of virus-infected plants,from the perspective of photosynthesis. Physiologia Plantarum 100 (2),203–213.
Baucom, R.S., de Roode, J.C., 2010. Ecological immunology and tolerance in plantsand animals. Functional Ecology 25 (1), 18–28.
Betancourt, M., Fraile, A., Garcia-Arenal, F., 2011. Cucumber mosaic virus satelliteRNAs that induce similar symptoms in melon plants show large differences infitness. Journal of General Virology 92 (Pt 8), 1930–1938.
Bos, L., Huijberts, N., Cuperus, C., 1994. Further observations on variation of Lettucemosaic virus in relation to lettuce (Lactuca sativa), and a discussion of resistanceterminology. European Journal of Plant Pathology 100 (5), 293–314.
Cecchini, E., Al-Kaff, N.S., Bannister, A., Giannakou, M.E., McCallum, D.G., Maule,A.J., Milner, J.J., Covey, S.N., 1998. Pathogenic interactions between variants ofCauliflower mosaic virus and Arabidopsis thaliana. Journal of Experimental Botany49 (321), 731–737.
de Roode, J.C., Yates, A.J., Altizer, S., 2008. Virulence-transmission trade-offs andpopulation divergence in virulence in a naturally occurring butterfly parasite.Proceedings of the National Academy of Sciences of the United States of America105 (21), 7489–7494.
Delfosse, P., Reddy, A.S., Legreve, A., Devi, P.S., Thirumala Devi, K., Maraite, H., Reddy,D.V.R., 1999. Indian peanut clump virus (IPCV) infection on wheat and barley:symptoms, yield loss and transmission through seed. Plant Pathology 48 (2),273–282.
Fargette, D., Pinel, A., Traoré, O., Ghesquière, A., Konaté, G., 2002. Emergence ofresistance-breaking isolates of Rice yellow mottle virus during serial inoculations.European Journal of Plant Pathology 108, 585–591.
Ferguson, H.M., Read, A.F., 2002. Why is the effect of malaria parasites on mosquitosurvival still unresolved? Trends in Parasitology 18 (6), 256–261.
Frank, S.A., 1996. Models of parasite virulence. Quarterly Review of Biology 71 (1),37–78.
Friess, N., Maillet, J., 1996. Influence of Cucumber mosaic virus infection on theintraspecific competitive ability and fitness of purslane (Portulaca oleracea). NewPhytologist 132 (1), 103–111.
Froissart, R., Doumayrou, J., Vuillaume, F., Alizon, S., Michalakis, Y., 2010. Thevirulence-transmission trade-off in vector-borne plant viruses: a review of (non-)existing studies. Philosophical Transactions of the Royal Society B: BiologicalSciences 365 (1548), 1907–1918.
Funayama, S., Hikosaka, K., Yahara, T., 1997. Effects of virus infection andgrowth irradiance on fitness components and photosynthetic propertiesof Eupatorium makinoi (Compositae). American Journal of Botany 84 (6),823–829.
Guo D.P., Yan, P., Zhao, J.P., Hui, L.I.U., Yan, P., Wang, Q.M., Chen, J.S., Rao, G.Z., 2005.Photosynthetic rate and chlorophyll fluorescence in leaves of stem mustard(Brassica juncea var. tsatsai) after Turnip mosaic virus infection. Plant Science168, 7.
Hamm, P., Hane, D., Pavek, M., Leroux, L., Gieck, S., David, N., 2010. Potato cultivarsdiffer in current season Potato Virus Y (PVY) infection. American Journal of PotatoResearch 87 (1), 19–26.
He, J., Ouyang, W., Chia, T.F., 2004. Growth and photosynthesis of virus-infected andvirus-eradicated orchid plants exposed to different growth irradiances undernatural tropical conditions. Physiologia Plantarum 121 (4), 612–619.
Hooks, C.R.R., Wright, M.G., Kabasawa, D.S., Manandhar, R., Almeida, R.P.P., 2008.Effect of Banana bunchy top virus infection on morphology and growth charac-teristics of banana. Annals of Applied Biology 153 (1), 1–9.
Hull, R., 1980. Structure of the Cauliflower mosaic virus genome. III. Restrictionendonuclease mapping of thirthy-three isolates. Virology 100, 76–90.
Hull, R., 2001. Matthews’ Plant Virology, 4th ed. Academic Press, San Diego.Jensen, K.H., Little, T., Skorping, A., Ebert, D., 2006. Empirical support for optimal
virulence in a castrating parasite. Public Library of Science Biology Biology 4 (7),1265–1269.
Lapidot, M., Friedmann, M., Lachman, O., Yehezkel, A., Nahon, S., Cohen, S., Pilowsky,M., 1997. Comparison of resistance level to Tomato yellow leaf curl virus amongcommercial cultivars and beeding Lines. Plant Disease 81, 1425–1428.
Levin, B.R., 1996. The evolution and maintenance of virulence in microparasites.Emerging Infectious Disease 2 (2), 93–102.
Malmstrom, C.M., Hughes, C.C., Newton, L.A., Stoner, C.J., 2005. Virus infection inremnant native bunchgrasses from invaded California grasslands. New Phyto-logist 168 (1), 217–230.
Maskell, L.C., Raybould, A.F., Cooper, J.I., Edwards, M.L., Gray, A.J., 1999. Effects ofTurnip mosaic virus and Turnip yellow mosaic virus on the survival, growth andreproduction of wild cabbage (Brassica oleracea). Annals of Applied Biology 135(1), 401–407.
Mink, G.I., 1993. Pollen-transmitted and seed-transmitted viruses and viroids.Annual Review of Phytopathology 31, 375–402.
Mukasa, S.B., Rubaihayo, P.R., Valkonen, J.P.T., 2006. Interactions between acrinivirus, an ipomovirus and a potyvirus in coinfected sweetpotato plants. PlantPathology 55 (3), 458–467.
Murray, C.J.L., Lopez, A.D., Chin, B., Feehan, D., Hill, K.H., 2007. Estimation of potentialglobal pandemic influenza mortality on the basis of vital registry data from the1918–20 pandemic: a quantitative analysis. The Lancet 368 (9554), 2211–2218.
N’Guessan, P., Pinel, A., Sy, A.A., Ghesquière, A., Fargette, D., 2001. Distribution,pathogenicity, and interactions of two strains of Rice yellow mottle virus inforested and savanna zones of West Africa. Plant Disease 85 (1), 59–64.
Pagan, I., Alonso-Blanco, C., Garcia-Arenal, F., 2007. The relationship of within-hostmultiplication and virulence in a plant–virus system. PLoS ONE 2 (8), e786.
Palella Jr., F.J., Baker, R.K., Moorman, A.C., Chmiel, J.S., Wood, K.C., Brooks, J.T.,Holmberg, S.D., Investigators, H.I.V.O.S., 2006. Mortality in the highly activeantiretroviral therapy era: changing causes of death and disease in the HIVoutpatient study. Journal of Acquired Immune Deficiency Syndromes 43 (1),27–34.
R Development Core Team, 2008. R: A Language and Environment for StatisticalComputing. R Foundation for Statistical Computing, Vienna, Austria.
Sacristan, S., Garcia-Arenal, F., 2008. The evolution of virulence and pathogenicityin plant pathogen populations. Molecular Plant Pathology 9 (3), 369–384.
Shah, D.A., Madden, L.V., 2004. Nonparametric analysis of ordinal data in designedfactorial experiments. Phytopathology 94 (1), 33–43.
Thurston, M.I., Pallett, D.W., Cortina-Borja, M., Edwards, M.L., Raybould, A.F., Cooper,J.I., 2001. The incidence of viruses in wild Brassica nigra in Dorset (UK). Annalsof Applied Biology 139 (3), 277–284.
Tomlinson, J.A., Walker, V.M., 1973. Further studies on seed transmission in theecology of some aphid-transmitted viruses. Annals of Applied Biology 73 (3),293–298.
Yahara, T., Oyama, K., 1993. Effects of virus infection on demographic traits of anagamospermous population of Eupatorium chinense (Asteraceae). Oecologia 96(3), 310–315.
Related Documents