REDUCTION IN CARBON DIOXIDE EMISSIONS: ESTIMATING THE POTENTIAL CONTRIBUTION FROM WIND-POWER A Report by David White, BSc, C Eng, F I Chem E Commissioned and published by the Renewable Energy Foundation December 2004

Welcome message from author
This document is posted to help you gain knowledge. Please leave a comment to let me know what you think about it! Share it to your friends and learn new things together.
Transcript

REDUCTION IN CARBON DIOXIDE EMISSIONS: ESTIMATING THE POTENTIAL CONTRIBUTION
FROM WIND-POWER
A Report by David White, BSc, C Eng, F I Chem E
Commissioned and published by the Renewable Energy Foundation
December 2004

2
Reduction in carbon dioxide emissions: Estimating the potential contribution from wind-power
Executive Summary
• Climate change has risen to the top of the political agenda. The Prime Minister has
presented it as a topic on which his views might be seen to differ from those of
President Bush, and the government’s Chief Scientific Advisor, Professor David King,
expressed the view that global warming posed a greater threat to the world than
terrorism, while Michael Howard claimed his Party was giving it high priority.
• The UK Government’s Energy White Paper has one clear objective: i.e. to reduce CO
2
emissions by 10% from the 1990 base by 2010.
• In the UK, the parallel objective is to generate 10% of the UK’s electricity from
renewable sources by 2010. Renewable electricity has become synonymous with
CO
2
reduction. However,
the relationship between renewables and CO
2
reduction in
the power generation sector does not appear to have been examined in detail, and
the likelihood, scale, and cost of emissions abatement from renewables is very
poorly understood.
• The target date chosen, 2010, leaves inadequate time to examine the full range of
renewable options: for example, wave, tidal, tidal stream, solar and biomass. The
Government created the New and Renewable Energy Centre (NaREC) in 2002 to
study these options but before any considered evaluation has been made, policy has
effectively constrained the marked to select wind-power.
1
• The purpose of this report is to analyse a wide range of technical literature that
questions whether the renewables policy can achieve its goals of emissions reduction
and power generation. To some, renewable energy has the simple and unanalysed
virtue of being “green”. However, the reality of this quality is dependent on practical
issues relating to electricity supply.
• Wind turbine technology has been developing in Europe for nearly twenty years, and
ample experience has been gained to show
wind generated power to be variable,
unpredictable, and uncontrollable
. In fact, the European experience shows
conclusively that the annual production is
routinely disappointing
, and
this does not
augur well for the UK’s chances of achieving significant emissions abatement.
• Denmark’s wind density is striking (0.88 kW of wind-power per head of population,
the highest level of any country in the world
2
), and it is credited with supplying 20%
of the country’s electricity. The fact is that this is a speciously impressive half-truth,
1 http://www.narec.co.uk/
2 For German data see E.ON Netz GmbH,
Wind Report 2004
(E.ON Netz: Bayreuth, 2004). Available from http://www.eon-netz.com/. For Danish data see Hugh Sharman, (Incoteco Aps), “The UK’s Dash for Wind How the UK might adapt its energy planning policies and ambitions in the light of recent and current experiences of West Denmark” (2004), report commissioned by the Renewable Energy Foundation, and forthcoming in the journal of the Institute of Civil Engineers.

REF
REDUCTION IN CARBON DIOXIDE EMISSIONS
3
and results from an arithmetical calculation putting Danish demand in relation to
installed wind production. It is not an accurate representation of daily operation. In
fact, 80% of this Danish wind power is exported to neighbouring countries, Norway
and Sweden for example.
3
In order to absorb the random intermittency of wind
power, Denmark operates this system in conjunction with its neighbours’ hydro-
electric systems via cable inter-connections which exceed the current installed wind
capacity, a unique geographic annexation which provides the operating flexibility that
is essential to absorb full wind power output. Island power systems such as those of
the UK or Ireland, by contrast, must balance their grid systems internally. It should be
noted, also, that Denmark achieves little or no direct reduction of emissions, because
CO
2
-free wind power is working alongside CO
2
-free hydro-power.
• The key lesson learnt by the Danish and German utilities is that wind does not
generate as much power as anticipated (typically an 18-20% annual load factor – not
the 30% assumed for UK onshore wind turbines) and production does not match the
daily and seasonal fluctuations of demand. Both countries have experienced
consistently low annual load factors that have led various commentators to articulate
concern about the cost and the level of subsidy needed to approach the targets set
for renewable energy by the European Union. These low annual load factors do not
bode well for the performance of wind farms in the UK where, with the exception of
North-west Scotland, the wind conditions are similar to those experienced in
Denmark and Germany.
•
The CO
2
emissions reduction from renewable energy in an island power system
must be assessed on the basis on the impact that the accommodation of wind
power into the grid will have on the whole supply chain
. Electricity differs from
other forms of energy, and cannot be stored directly on an industrial scale.
Consequently, generation and demand have to be balanced on the grid continuously,
and second by second. Policy-makers appear to have only a weak grasp of this critical
fact and its implications. Indeed, the accommodation of the variable output from wind
turbines into the transmission system is complex and the technical challenges are
barely understood outside professional circles.
Fossil-fuelled capacity operating as
reserve and backup is required to accompany wind generation and stabilise
supplies to the consumer. That capacity is placed under particular strains when
working in this supporting role because it is being used to balance a reasonably
predictable but fluctuating demand with a variable and largely unpredictable
output from wind turbines.
Consequently, operating fossil capacity in this mode
generates more CO
2
per kWh generated than if operating normally.
This
compromising effect is very poorly understood
, a fact acknowledged recently by the
Council of European Energy Regulators.
4
3 See Hugh Sharman, “The UK’s Dash for Wind” (2004).
4 Council Of European Energy Regulators (CEER),
Current Experience With Renewable Support Schemes In Europe
(2004), pp. 57, 59.
REF
REDUCTION IN CARBON DIOXIDE EMISSIONS
4
• Thus, the CO
2
saving from the use of wind in the UK is probably much less than
assumed by Government advisors, who correctly believe that wind could displace
some capacity and save some CO
2
, but have not acknowledged the emissions impact
of matching both demand and wind output simultaneously. As a result, current policy
appears to have been framed as if CO
2
emissions savings are guaranteed by the
introduction of wind-power, and that wind power has no concomitant difficulties or
costs.
This is not the case.
• Even amongst government bodies there is uncertainty as to the emissions abatement
effect of randomly intermittent renewables, and the DTI, DEFRA, and the Carbon
Trust all offer different methods for calculating the CO
2
savings resulting from the
introduction of wind power.
• DEFRA employ a fixed emissions factor figure based on a grid average, while the DTI
recognise that the precise fuel type and generating technology displaced by wind
must play a key role in the level of emissions that could be saved. However, even the
DTI’s figures overstate the likely emissions savings because of the frequency with
which conventional plant must start-up and shut-down in the course of matching
demand and ensuring that wind power is absorbed as smoothly as may be into the
grid.
• Still more strikingly, the British Wind Energy Association (BWEA) has prominently and
consistently claimed a 17 Mt CO
2
saving from 3,500 wind turbines projected by
2010.
5
This is twice the level of saving suggested by DEFRA, and appears highly
unlikely since it assumes the displacement of coal-fired capacity only. However, the
BWEA’s guideline figure is being used to support planning applications around the
UK.
• With this level of disagreement between governmental authorities and trade bodies it
is hardly surprising that there is general public confusion over the issue.
This
uncertainty is most undesirable, not least because of the economic implications of
an erroneously reasoned choice of carbon abatement technology.
• The current renewables programme is being driven by substantial financial incentives
created through the Climate Change Levy and the Renewable Obligation. Both
sources of funding result in significant increases in the price of electricity, penalising
industry and causing a domino effect on the rest of the economy. Electrical power is,
for example, the major cost to the water and sewage industries. Ultimately, a
commitment to wind on the scale proposed seems guaranteed to force up power
price in the domestic sector, the very sector the Government’s Energy Policy is
designed to protect. Bluntly, it is not clear that wind power is compatible with the
White Paper’s aim “to ensure that every home is adequately and affordably heated”.
• It is for, example, well known that power from wind turbines is more expensive than
that from other generating technologies such as combined cycle gas turbines.
5 BWEA, “Calculations for wind energy”, see http://www.bwea.com/edu/calcs.html.
REF
REDUCTION IN CARBON DIOXIDE EMISSIONS
5
Onshore wind turbines cost £650 per kW while offshore installations are about £1,000
per kW. In comparison, the estimated cost of Combined Cycle Gas Turbine CCGT is
around £270–350 per kW,
6
a fact which becomes particularly salient when we recall
the Danish/German annual load factor of around 20% for wind and put it alongside
the typical 85–90% load factor for CCGT plant. These low load factors for wind
obviously illustrate a very poor utilisation of high cost assets, particularly so when we
bear in mind that gas turbines can now guarantee CO
2
emissions reduction of around
60% in comparison with coal generation. If these comparative costs are applied in
conjunction with the need for continuous fossil-fuelled back-up and its associated
CO
2
emission, the cost of using wind turbines as a method of CO
2
avoidance is very
high. In fact, it emerges as the highest cost option.
7
• While no one is opposed to the encouragement of renewable energy, a controlled
learning programme as set up under NaREC would appear to be the prudent
approach. Trials for offshore wind would be justified to assess load factors in UK
waters, and could make a valuable contribution when suitable methods of electricity
storage can be developed, for example, the reversible fuel cell. However, the sheer
numbers of turbines needed to approach the 10% of generated power (not installed
capacity) set as the Government’s target would have a colossal impact on the UK,
penalise electricity consumers with higher prices, and lead to only modest CO
2
reduction. Indeed, the knock-on effect of wind on emissions is unclear, and deserves
serious consideration.
•
Market forces will fix wholesale electricity prices at a level that discourages new
investment in modern plant,
and
the focus on wind power for new generating
capacity is likely to lead to the retention of old, low efficiency, coal-fired plant for an
extended period
.
But an increase in wind capacity will have to be matched by new
conventional capacity required to cover winter peak demand when there is no wind.
This new capacity would be under-utilised, again raising the unit cost and deterring
investment. UK demand will continue to grow, as forecast by National Grid Transco,
and power shortages seem inevitable in the medium term if the “secure” generation
capacity needed to replace obsolete plant is not forthcoming.
• In conclusion, it seems reasonable to ask why wind-power is the beneficiary of
such extensive support if it not only fails to achieve the CO2 reductions required,
but also causes cost increases in back-up, maintenance and transmission, while at
the same time discouraging investment in clean, firm generation.
6 See the trade Press such as
Gas Turbine World
.
7 Other reports have come to similar conclusions. See, Council Of European Energy Regulators (CEER),
Current Experience With Renewable Support Schemes In Europe
(2004), e.g. p. 12, available from http://www.ceer-eu.org/. See also, ESB National Grid,
Impact of Wind Power Generation in Ireland on Operation of Conventional Plant
(ESB National Grid, 2004).

REF
REDUCTION IN CARBON DIOXIDE EMISSIONS
6
1.0 Introduction
1.1 Government Policy for Renewables and Emissions Reduction
Two key objectives of the Government’s 2003 Energy White Paper are:
8
• To generate 10% of our electrical power from renewable sources by 2010
• To reduce CO
2
emissions by 10% by 2010 with an aspiration to attain a 20%
reduction by that date
The task of delivering CO
2
emissions abatement is, nominally, spread across all sectors,
but policy focuses most attention on renewable forms of generating electricity, with the
result that the renewables target and the emissions abatement target are implicitly linked
by the strong assumption that the lion’s share of CO
2
reductions will be achieved if the
renewables electricity target can be met.
One DTI Report states that “The
(Offshore)
industry will provide a significant source of
sustainable non-carbon-emitting electricity”.
9
Patricia Hewitt, the Secretary of State for
Trade and Industry, and the then Energy Minister, Stephen Timms, have both made public
statements to the effect that the Government’s targets will be achieved on schedule. The
view that the targets are interlinked, and achievable, has been prominently reinforced by
the economist Professor Paul Ekins, and the British Wind Energy Association (BWEA) in
the persons of Professor Leon Freris and Richard Ford (Head of Grid and Technical
Affairs), who stated their views in letters to the
Guardian
in August 2004.
10
The claims
made are very strong:
Mr Ford remarked that:
By 2010, we aim to install 3,500 more turbines on and off shore. This will mean the wind
industry could then be preventing the emission of up to 17m tonnes of carbon dioxide each
year.
Professor Ekins committed himself to the view that:
Every 1 kWh of electricity from wind will substitute for 1 kWh generated from other sources.
No less unguarded was Professor Freris, who remarked that:
The fact is turbines do make sizeable reductions in carbon dioxide emissions, as in Denmark,
where 20% of electrical energy is provided by wind with commensurate reduction in
emissions.
These may well be the messages the Government wants to hear, and superficially it may
be thought to enhance the view that renewables are the way towards reduced carbon
emissions. However, we may reasonably ask whether these views are consistent with
8
Our Energy future: Creating a Low-Carbon Economy
(The Stationery Office: London, 2003).
9 DTI,
Offshore Wind Report
(April, 2002).
10
The Guardian
, 19 Aug. 2004: http://www.guardian.co.uk/letters/story/0,3604,1285966,00.html.
REF
REDUCTION IN CARBON DIOXIDE EMISSIONS
7
other facts provided by the Government advisors. Indeed, it is not clear that statements of
this kind can be supported by technical evidence, and that the goals are, in fact,
achievable. Similarly, we might wonder whether the Government’s dual objectives are
actually best served by using incentive schemes to stimulate huge investment in wind-
based power generation.
In summary, it does not appear to have been wise to initiate a
remarkably ambitious programme of interlinked renewable development and carbon-
dioxide abatement without a more careful analysis of the technical and economic
implications, to say nothing of the prospects for success.
Though reluctant to admit that it is picking winners, the government’s choice of 2010 as
the due date has made it almost inevitable that the market will select wind turbine genera-
tion as the only readily available form of renewable technology on the scale required.
This report sets out to examine the technical evidence related to the level of CO
2
reduction that can be expected to result from the progressive introduction of wind-power.
It asks whether the currently available data supports the contention that wind-power is
a cost effective way to reduce CO
2
. Further, it asks whether wind-power is a cost
effective way to generate electricity.
1.2 Is wind-power CO
2
-free?
Nobody disputes the fact that wind-generated power is free of CO
2
emissions at the point
of generation, and for the purposes of the Emissions Trading Scheme, DEFRA classifies all
renewables as having zero CO
2
emission.
11
However,
the assessment of the national
emissions benefit is a much more complicated matter, and has to be based on the
extent to which wind generated power can displace conventionally generated power
from the total electricity supply system on a minute by minute basis
.
This is highly
relevant to the UK’s situation, since our grid is electrically an island, with only a single
substantial interconnector, a 2,000 MW cable link to France, equivalent to just 3.5% of our
winter peak demand. Since electricity cannot be stored economically on an industrial
scale all balancing of the UK grid will of necessity be internal to the network.
Wind generated electricity is accepted to be a variable, unpredictable and unreliable
source.
12
However, electricity consumers require power on demand. Consequently, the
accommodation of wind-generated power into the island’s power system is more
complex than simply shutting down fossil-fuelled capacity whenever the wind happens to
be blowing. Starting up and shutting down power plant may take minutes or hours,
depending on the type of plant, while power may be needed in seconds, and firm thermal
generation cannot be treated in this way if the lights are to be kept on.
Consequently, any calculation of the CO
2
emissions reduction from wind must take into
account the quantity of conventional generating capacity that has to be retained in varying
11 DEFRA,
Guidelines for the Measurement and Reporting of Emissions by Direct Participants in the UK Emissions Trading Scheme
, UKETS(01)05rev2 (June 2003).
12 If there is any doubt about this, the reader can be referred to the recent E.ON Netz
Wind Report 2004
.
REF
REDUCTION IN CARBON DIOXIDE EMISSIONS
8
states of readiness while the wind-generated power is taken into the grid. Furthermore,
existing generation capacity is being asked to simultaneously accommodate the intermit-
tent input of wind-produced power and satisfy the needs of nearly 60 million electricity
users, and this necessitates changes in operational behaviour which are highly significant
and cannot be brushed aside.
In fact, analysis of data from the UK, Denmark, Ireland, Germany and the USA shows
that a substantial part of the theoretical CO
2
saving does not accrue in practice (these
points are addressed by country in the Appendix). In some circumstances there may be
only minimal benefit. This information also casts doubt on the wisdom and cost effective-
ness of deploying wind-power on the grand scale to generate electricity or to reduce CO
2
emissions. The Council of European Energy Regulators (CEER) has stated unequivocally
that the cost of emissions abatement via the generation of electricity from renewables in
general is significant:
The costs for the reduction of greenhouse gas emissions through RES-E [Renewable Energy
Systems Electricity] are very high.”
13
This issue has also been raised in Spain and Austria, while Germany
14
and Ireland
15
have
pointed out the considerable levels of annual subsidy needed (
€
3.5 billion at present in
Germany to approach the EU’s Directive level of 10% renewable electricity by 2010).
16
1.3 Information given to Government on CO
2
savings
A survey of the literature reveals curious inconsistencies. While there is a consensus that
some CO
2
saving could result from the introduction of wind power, there is a wide differ-
ence of opinion about the magnitude of the saving. With the notable exception of the
recent CEER report noted above, none of the assessments examined reflect the fact that
the back-up capacity required will be running inefficiently, with consequent CO2 emis-
sions.17 Still more significantly, only the generators themselves, and the equipment
suppliers, seem to recognize that different levels of back-up emission will apply
depending on the fuels used (see Appendix).
For example, the DTI states in its Wind Energy Fact Sheet 14:
[…] the emissions avoided when a wind farm operates depend on what type of power plant
wind displaces and the operating emissions of that power plant. Reductions in emissions will
be greatest if wind displaces coal, significantly less if it displaces gas or nuclear. The UK
13 Council Of European Energy Regulators (CEER), Current Experience With Renewable Support Schemes In Europe (2004), p. 12, available from http://www.ceer-eu.org/.
14 Financial Times, 03.06.04.
15 ESB National Grid Impact of Wind Power Generation in Ireland on Operation of Conventional Plant (ESB National Grid, 2004).
16 Reuters Power News, 01.06.04.
17 Council Of European Energy Regulators (CEER), Current Experience With Renewable Support Schemes In Europe (2004), pp. 57, 59.

REF REDUCTION IN CARBON DIOXIDE EMISSIONS
9
electricity market is extremely complex, particularly under the New Electricity Trading
Arrangements (introduced March 2001), and it is not possible to make categorical statements
on how wind changes the generation mix.18
Table 1 sets out the spread of savings set out by the DTI dependent on the fuel used. The
wind figures are deducted from the fuel-based cases to arrive at the saving.
Table 1
These figures are explained in detail later, but at the present stage of the argument it will
be enough to note that they recognise the complexity of the market.
DEFRA’s recent Guidelines for the Measurement and Reporting of Emissions by Direct
Participants in the UK Emissions Trading Scheme gives a grid average emissions figure of
430g CO2 per kWh.19 OFGEM also employs this same grid average figure when setting
down the guidelines for converting Renewable Obligation Certificates into Emissions
Trading Scheme Credits.20 However, the assumptions underlying this are questionable.
The footnote in the DEFRA Protocol states:
A common factor is used for all electricity supplied from public supply network. This
emissions factor does not vary from year to year.
No rationale is offered for this statement, but it is obviously inconsistent with the DTI’s
technically accurate statement that emissions saving depends on the plant being
operated. Likewise, the Carbon Trust recommends the use of a grid average emissions
factor, 0.43 tonnes per MWh, when estimating the saving of a renewable energy
generator.21 These figures are all constant and fail to reflect the fuel used and the changes
in plant efficiency operating in reserve mode.
The British Wind Energy Association recommends an emissions factor of 0.86 tonnes
per MWh (i.e. 0.86 kg per kWh), and explains that wind can be expected to replace coal
generation.22 This assumption is all the more surprising when it is remembered that the
“dash for gas” has already brought about a significant shift in the pattern of generating
equipment. Furthermore, although this figure is exactly twice that recommended by
DEFRA, it is significantly less than that suggested by The Parliamentary Office of Science
and Technology for coal-fired generating emissions, namely 936–1079 grams per kWh
(recognising fuel quality and efficiency). The BWEA offers an unconvincing explanation
18 DTI, Efficiency and performance, Wind Energy Fact Sheet 14 (August 2001), p. 4.
Onshore Wind Offshore wind Coal with FGD Gas(CCGT) Average Mix 1993
CO2 9 g/kWh 12 g/kWh 987 g/kWh 446 g/kWh 654 g/kWh
19 DEFRA, Guidelines for the Measurement and Reporting of Emissions by Direct Participants in the UK Emissions Trading Scheme (June 2003), Protocol A1, p. 20.
20 Ofgem, ROC Register End user guide (July 2003 Version 2.0), p. 7.
21 http://www.thecarbontrust.co.uk/carbontrust/low_carbon_tech?dict2_1_6_4.hmtl.
22 http://www.bwea.com/edu/calcs.html.

REF REDUCTION IN CARBON DIOXIDE EMISSIONS
10
for their choice, and it remains an outstanding puzzle as to why it is, on the one hand, so
high, and yet, on the other, lower than the actual emission of a coal-fired station.23
1.4 Is the “Dash for wind” a defensible policy?
The Government concedes that the targets set for renewables are challenging. However,
challenges of this magnitude are accompanied by risk, and a reduction in security of elec-
tricity supply and an increase in electricity cost are likely outcomes of an overambitious
policy.
The issue of cost is particularly sensitive. Wind-power increases the complexity of the
transmission and distribution system, and it is therefore inevitable that transmission
losses will increase because of the additional miles of cabling required, both factors
increasing costs. Overall, not only will the incentives offered by Government to drive the
investment in wind farms be paid for by consumers, increases in electricity prices will also
be necessary to cover other secondary costs.
Bearing this in mind, it is surprising that the Government has set a substantially more
ambitious programme than other countries, in spite of having access to European and US
data on wind energy. The USA implemented a first-generation wind programme in the
1980s, largely in California, but with very poor results, and much of that early capacity has
been abandoned.24 In November 2003, the US Department of Energy published a major
report referring to the Californian experience and setting out a seven year technical
programme running until 2010 in which all facets of wind generation will be studied and
demonstrated.25 Their aim is a controlled step-wise move towards a target of 100 MW in
16 states by 2010 (cf. the 3,500 additional turbines offshore and onshore mentioned by
BWEA above, and equivalent to, approximately, 7,000 MW). The US research and devel-
opment programme is backed by funding, annual monitoring, and prescribed review
procedures.
This measured US approach to renewables may be fruitfully compared with the Energy
White Paper proposals. In 2002, the Government created the New and Renewable Energy
Centre (NaREC) with the stated objective of researching all forms of new and renewable
energy as a support to policy and market development. But before NaREC could establish
itself and offer guidance on the basis of its findings the White Paper has established a
policy. Indeed, in spite of pronouncements to the contrary, that policy has in effect,
“selected its chosen winner” by so constricting the scope of our endeavours that wind-
generated electrical energy emerges, to all appearances, as the only means of achieving
both the renewable generation and emissions abatement targets.
23 See Appendix below for further comments.
24 According to figures reported in Vaclav Simil, Energy at the Crossroads: Global Perspectives and Uncertainties (MIT Press: Cambridge Mass. and London, 2003), 272, the 637 MW installed at Altamont Pass in California was generating some 550 GWh per year in 1985, which gives a load factor of under 10%.
25 US Department of Energy Report, Energy Efficiency and Renewable Energy (November 2003).
REF REDUCTION IN CARBON DIOXIDE EMISSIONS
11
In fact, because the White Paper directives have been driven forward without a full
review of consequential costs in infrastructure and in the operation of the back-up
capacity needed to balance the grid, the policy is not proceeding as planned, and it is well
known that the chances of even nominal success are slender at best. Indeed, the House of
Lords Science and Technology Committee investigated this matter and reported that:
We found almost no one outside Government who believed the White Paper Targets were
likely to be met.26
Far from being “challenging”, these targets appear to be simply impractical.
2.0 Balancing a stable grid
Perhaps the most important area of public misunderstanding in relation to energy policy is
the nature of electricity, and particularly the fact that it cannot be stored economically on
an industrial scale. Most domestic consumers view their instant access to electricity as if it
were similar to the water supply. The average consumer seems to assume that
somewhere behind the switch there is a reservoir of power. In practice, that is exactly
what seems to happen, and unsurprisingly it is taken for granted. In fact, that electric
power is generated the split second it is required. Power must be available on demand.
National Grid Transco constantly works with the generators and distributors to ensure
customer needs are met by maintaining a continuous dynamic balance between supply
and demand. To protect that dynamic balance it is necessary to operate with some
“spare” capacity ready to meet daily and seasonal fluctuations as they occur.
The UK’s electricity supply system must have the flexibility to cope not only with winter
peak demand of about 59,000 MW (the third largest in Europe, and still growing),27 but
also with instant load changes at a cross-regional level. For example, at half time during a
2003 World Cup match National Grid Transco experienced a sudden surge in demand of
over 2,500 MW.28 That type of demand change could not have been handled by wind
power, which has only a minimal degree of instant operational flexibility, since the output
is dependent on wind availability, and this is randomly intermittent in regard to demand. It
is, therefore, obvious that wind power is only viable as a co-operating member of a
portfolio, and thus, when we are estimating the emissions abatement of wind power it
is the emissions of the overall portfolio of technologies that must be considered.
It is equally important to set the global use of electricity in perspective. The facts are
simple. Electricity has become the cleanest and most important form of energy extant,
and absolute continuity of supply is essential to protect services as diverse as hospitals,
air traffic control, computer systems, industry, food storage and traffic flow. It is a truism
26 House of Lords: Science and Technology Committee, 4th Report of Session 2003-04. Renewable Energy Practicalities (TSO, 15 July 2004), para 1.15.
27 See DTI, Digest of United Kingdom Energy Statistics 2004 (July 2004).
28 Energy World (July 2003).
REF REDUCTION IN CARBON DIOXIDE EMISSIONS
12
that electrical power supply at a competitive cost underpins the world’s economies, a fact
which makes it all the more surprising that the Energy White Paper should be focused on
wind turbines as a form of generation, when these are known to be unpredictable,
variable, unreliable, and expensive.
Data from the Meteorological Office indicates that most of the UK will experience some
1,400 hours (equivalent to 58 days) in a typical year when there will be insufficient wind to
generate any significant power.29 The often-stated view that the wind will be blowing
somewhere at all times, or that probability theory can be applied in determining the UK’s
generating capacity, does not address the fact of widespread total calm. Our land-mass is
not large, and an anticyclone can easily cover the whole country, and these conditions
tend to coincide with periods of high demand due to extreme cold and extreme heat.
E.ON Netz writes in its Wind Report 2004:
Both cold wintry periods and periods of summer heat are attributable to stable high-pressure
weather systems. Low wind levels are meteorologically symptomatic of such high-pressure
weather systems. This means that in these periods, the contribution made by wind energy
plants to covering electricity consumption is correspondingly low.30
Daily observation of wind patterns illustrates that it will be calm at dawn and dusk with
wind increasing up to noon. This frequent daily pattern also indicates that wind power is
least likely to be available during the morning and evening peaks, exacerbating the call on
fossil-fired capacity.
Conventional reliable generation capable of meeting peak load must be retained in the
portfolio to deal with this situation, and consequenlty, as E.ON Netz remark, wind can only
“save on fuel”.31 If wind-power does not, in fact, achieve significant CO2 reductions, the
choice of wind as a principal source of renewable energy will be highly questionable until
a commercially attractive electricity storage system can be developed to cover periods of
interruption. Unfortunately, storage capacity on the scale needed is not at present feasible
or likely to become so even in the medium term.
The role of fossil-fuelled capacity
The introduction of wind generated power into the UK’s supply chain presents a range of
challenges to National Grid Transco. In its simplest terms, generation must equal demand.
The First Law of Thermodynamics is applicable: Energy can take many different forms but
cannot be created or destroyed.
In a presentation given to the DTI on 27 July 2004 National Grid Transco made the
following points:
29 Royal Academy of Engineering, evidence to the House of Lords Science and Technology Committee, House of Lords: Science and Technology Committee, 4th Report of Session 2003-04. Renewable Energy Practicalities (TSO, 15 July 2004), Vol. II, Evidence, p.326
30 E.ON Netz, Wind Report 2004 (2004), p. 6.
31 E.ON Netz, Wind Report 2004 (2004), p. 7.

REF REDUCTION IN CARBON DIOXIDE EMISSIONS
13
1 While there is some “storage” or kinetic energy in the electricity supply system, it is
about 5 MWh or sufficient to cover an interruption of a 1,000 MW power plant failure
for just a few seconds.32
2 Production and consumption therefore have to be balanced, but there is uncertainty
about both variables, and consequently the resulting solution is dependent on the
skills of the system operator.
3 Not only must the supply chain be capable of coping with surges in demand caused
by consumer activity, for example that resulting from breaks in TV programmes, but it
must also cope with weather, diurnal change, and the seasons. A 1oC temperature
drop below freezing requires the additional input equivalent to the generation of a
500 MW station. Very heavy cloud cover could mean that the equivalent of three such
power stations must be made available.
German and Danish data illustrates that even technologically advanced wind forecasts
are prone to error, and wind power output can decline unpredictably. Denmark has
recorded falls of 400 MW within an hour, and E.ON reports a fall of 3,640 MW in six hours
at a rate of 10 MW per minute.33 If the Danish falls are rescaled to the UK situation
projected by the current policy, this would amount approximately to 3,000 MW. It is
impossible to start a coal-fired station from cold in so short a time.
To manage this balancing act, National Grid Transco needs ready access to generation
capacity in several tranches of time, ranging from generation able to provide immediate
response, to that which can be available within two minutes, within 20 minutes and so on.
Longer periods of time apply for seasonal cover (further details are given in Appendix). In
practice, significant capacity has to be operating and synchronised to be available for
rapid response, which in turn means fossil-fired capacity operating in parallel with wind to
accommodate production into the grid. This supporting capacity will be operating below
its optimum efficiency, and such operating procedures will produce more CO2/kWh than if
plant operations were optimised.
Consequently, in the UK (or any island) power system, wind-power cannot displace CO2
emissions from the equivalent fossil capacity on a kWh for kWh basis, as claimed by the
economist Professor Paul Ekins (cited above). The actual level of emission will depend on
the type or mix of fossil-fuelled capacity being operated to match the output of the wind-
power. It could be coal-fired, a combined cycle gas turbine system, or an open cycle peak-
shaving system. These technologies all have different efficiency characteristics on full-
and part- load, and will consequently emit different levels of CO2 if used as a running-mate
for wind-power. In other words, the more wind capacity that is introduced, the more of
the lower efficiency capacity will be required to operate on part-load with increased
emissions.
32 Lewis Dale, National Grid Transco, paper delivered to DTI meeting on electricity storage, 27.07.04: http://www.dti.gov.uk/energy/sepn/energy_storage.shtml.
33 See, for German data, E.ON Netz Wind Report 2004 (2004), p. 6; and for Danish data, see Hugh Sharman, “The UK’s Dash for Wind” (2004).
REF REDUCTION IN CARBON DIOXIDE EMISSIONS
14
In its presentation to the DTI, National Grid Transco observed that wind increases the
generating uncertainty. Thus, it results in:
• Increased demand for a continuous frequency response service.
• Increased demand for short-term reserves.
• Greater requirement for flexibility (NB the need to retain flexible plant in service at a
lower load factor displaces plant capable of a higher load factor and higher
efficiency).
• Potential for constraints due to weak connections to remote wind sources.
The third point is particularly likely to result in increased CO2 emissions. National Grid
Transco also remarked that in addition to the technical requirements there is a commercial
overlay on the power sources. The electricity trading conditions set by Ofgem must be
taken into account when setting generating priorities. Generators need to bid quantities of
power into the market ahead of “gate-closing”, and this has contributed to an increase in
the UK’s emissions because this situation favours “low merit” plant. A similar regime
prevails in Denmark’s local market and influences the routing of wind-power and thus has
a negative effect on CO2 saving.
3.0 Quantifying the CO2 emissions abatement related to the introduction of
wind
The extant literature presents a wide range of methods for the quantification of CO2
emissions abatement consequent on the introduction of wind power. Some methodolo-
gies proceed by considering the UK’s current installed capacity, while other analyses
estimate the emissions from the capacity that will become necessary to back up every
1,000 MW of new wind capacity introduced to the system. It is evident, however, from
the limitations of the various approaches that the emissions abatement effect of a
randomly intermittent renewable within a dynamic operating system cannot be
predicted with a single emissions factor.
In addition to the Government advisors’ figures mentioned above, a number of other
forecasts for CO2 reduction resulting from the introduction of wind-power should be
noted: namely, the calculations offered by the IEA Greenhouses Gases Programme,
Greenpeace, Ilex, and engineers in some universities. Power generators including ESB,
Elsam in Denmark, and Innogy (RWE, Npower) have also placed data in the public domain
(further data is examined in the Appendix). Of these, only the power generators, along
with Siemens and Mitsui Babcock as equipment suppliers, have remarked on the increase
in CO2 emissions consequent on a decline in generating efficiency and reduced load,
though, as noted, CEER’s recent comments suggest that there is growing European
recognition of this issue. Without exception, all the other assessments are fixed figures or
averages that do not reflect the dynamics of electricity generation in an operating system.
In a paper given at the Institution of Mechanical Engineers, Innogy described the actual
UK operating experience with the accommodation of modest wind output as follows (the
emphasis is that of the present author):

REF REDUCTION IN CARBON DIOXIDE EMISSIONS
15
When plant is de-loaded to balance the system, it results in a significant proportion of de-
loaded plant which operates relatively inefficiently. […] Coal plant will be part-loaded such that
the loss of a generating unit can swiftly be replaced by bringing other units on to full load. In
addition to increased costs of holding reserve in this manner, it has been estimated thatthe entire benefit of reduced emissions from the renewables programme has beennegated by the increased emissions from part loaded plant under NETA.34
While the trading arrangements can be modified, the underlying need for back-up fossil-
fired capacity working below optimal efficiency persists. The Council of European Energy
Regulators comes to similar conclusions in its recent survey of European experience of
wind energy, where it observes that while the Spanish market is better designed for the
introduction of wind this does not address the fundamental issue:
This relatively robust market design ensures that the technical aspects of balancing wind
power will be [more] easily met than in other market designs. Nevertheless, here too the
question of actual real cost of wind and effect on carbon emissions (in light of additional
thermal generation needed for balancing and compensation) remains.35
The importance of such remarks for the UK should not be underestimated, for, as has
been noted several times already, an island system must be able to balance its grid
internally.
Chart 1
34 David Tolley (Innogy Plc), “NETA The Consequences – A Keynote Address”, Institution of Mechanical Engineers, Jan. 2003.
35 Council Of European Energy Regulators (CEER), Current Experience With Renewable Support Schemes In Europe (2004), pp. 57, 59.
REF REDUCTION IN CARBON DIOXIDE EMISSIONS
16
The chart above produced by Siemens illustrates the change in specific emission for a
given fuel and technology, and is an invaluable visual summary of CO2 emissions from
different fuels, different technologies and a wide range of efficiencies.36
Most importantly, the chart reminds us that small declines in efficiency have significant
effects on emissions, particularly for coal-fired and open cycle, peak shaving, gas turbines
(GT). As we have already noted, the efficiency of generation will drop and the unit
emission of CO2 per kWh increase as the boilers or gas turbines are ramped up and down
to cope with load. This can easily be 2% or more on either boilers or turbines, and
depending on the degree of ramp-down, the loss could be more on CCGT (GUD, the
German acronym for CCGT, in the above chart), because steam turbine performance is
dependent on the temperature of waste heat emerging from the gas turbine. On a coal-
fired boiler, a 2% reduction in efficiency increases the unit emissions from 950 grams per
kWh to nearly 1,100 grams per kWh, a change of 150 grams per kWh, whereas on a CCGT
the change might only be 30–50 grams per kWh. An open cycle peak shaving turbine (GT)
is likely to be in between those figures.
The crucial point here is that the level of CO2 emissions associated with the reserve
generation needed to support wind-power is dependent on the type of capacity being
used.
A further point of significance which can be inferred from this chart is that the UK’s
“dash for gas” generation has resulted in a major reduction in CO2 emissions. Simply by
switching from coal to CCGT a reduction of around 55% can and has been achieved.
CCGT turbine design is still improving, and the new GE device currently on field trials at
Baglan Bay would lead to a reduction of over 60% compared to a coal generator. It might
be argued that the extension of this type of technology offers a route to reduced CO2
emissions vastly superior to wind generation supported with lower efficiency fossil based
power. Indeed, it seems likely that if left to make an unbiased choice the generating
companies would select this option. However, a significant dependence on gas raises in
an acute form the issue of energy security, since the UK will not be alone in finding this
option attractive as a means to achieve the EU emissions directives. Competition for
available gas reserves is likely to be intense, and there is no guarantee that the UK will
always be able to access let alone afford the supplies it needs.
It will already be clear that the central observation emerging from this phase of the
analysis is that the use of some continuously operating supporting capacity is essential
for wind-power integration, and that the CO2 emissions from back-up capacity are not
insignificant. However, there are other factors of parallel significance.
Principal amongst these is the fact that supporting or back-up plant is called upon to
operate in ways that were not foreseen in the design specification. In order to match a
changing pattern of demand frequent changes in backup output are needed to compen-
sate for the output fluctuations from wind power. In such operating conditions heavy duty
36 Chart from Siemens reproduced from Science in Parliament, 60/2 (Whit 2003).
REF REDUCTION IN CARBON DIOXIDE EMISSIONS
17
gas turbines suffer thermal stresses that will shorten the period between maintenance
shutdowns, and this will be proportional to the number of stops and starts. Coal-fired
stations face similar difficulties. Acting in the support role for wind entails additional
operating and maintenance costs; it is unclear how companies providing this function will
recoup their additional costs.
Wind-power and other randomly intermittent renewables will make a more valuable
contribution if commercially attractive storage mechanisms can be developed. Hydro and
pumped storage are the most economical form at present, and this has been the key to
the Danish operating system, where the grid operators have been able to balance most of
the wind turbine output on the Norwegian and Swedish hydro system, with a reciprocal
arrangement to draw power supply when needed.37 While it is true that the UK has the
Dinorweg and Ffestiniog pumped storage facilities and small systems in Scotland that
would provide some back-up capacity, their overall contribution is small, and the
prospects for further hydro and pumped storage in the UK are negligible. Consequently,
the rate and extent of proposed wind turbine build will enforce the use of back-up
which is overwhelmingly fossil-fuelled. We must conclude that the emission of CO2 from
back-up generation is a serious consideration and must be taken into account when
assessing the potential emissions abatement of wind-power.
4.0 Operating experience
The Appendix provides a referenced analysis of the operating experience of wind power
in Ireland, Germany, Denmark, the UK, the USA, and New Zealand. (The reader is also
referred to the sober analyses of CEER, whose report surveys the experience of a number
of countries.38) The common threads are:
• The requirement for operational back-up capacity.
• The emissions that result from the manner in which coal and gas-fired plants must be
operated while in support mode.
Ireland had grid management problems that led to a moratorium on new wind turbine
connections in December 2003, a ban which was only lifted in July 2004 with the
introduction of a new grid code which places an onus on wind-power operators to control
output. This burden of responsibility, while entirely reasonable and no more than any
other generator would have to shoulder, may be challenging for wind turbine operators
and it will be interesting to observe the results.
Denmark’s adoption of wind-power leans heavily on much earlier and unrelated invest-
ment in interconnections to Norway and Sweden, thus enabling wind output to be
balanced on hydro-power and nuclear generation. Since zero-emission wind is matched
by zero-emission hydro and nuclear, there is no net reduction in CO2 emissions. If wind-
37 See Hugh Sharman, “The UK’s Dash for Wind” (2004).
38 Council Of European Energy Regulators (CEER), Current Experience With Renewable Support Schemes In Europe (2004), pp. 50–60.

REF REDUCTION IN CARBON DIOXIDE EMISSIONS
18
power is taken directly into the Danish market, fossil-fired back-up generation is required.
The annual load factor has been consistently around 20%, and wind speeds have been
below the claimed statistical norm for four out of the past five years.
Germany has experienced even lower annual load factors. Some figures for 2003
suggest a figure of 18.9%, while data in the E.ON Netz Wind Report 2004 suggests that the
actual figure may have been around 15%.39 Certainly, the cumulative average of the past
six years yields a figure of about 15%. Such a low utilisation of assets emphasises the
high cost of wind-power, and taken together with the level of subsidy required to support
the industry has drawn attention to the fact that meeting the EU targets for renewables will
have significant financial penalties for the national economies concerned. Logic suggests
that the UK assumptions with regard to load factor, 30% onshore, may still be too opti-
mistic, since this figure has never been achieved in spite of the currently installed turbines
being located in the windiest locations and still relatively new and therefore as yet untrou-
bled by wear and tear. In fact, in 2003 the UK’s wind turbines achieved a load factor of only
24.1%.40 Recent reports by EON Netz, the German grid operator, and UCTE (the Union for
the Co-ordination of Transmission of Electricity, whose members serve 450 million people
in continental Europe) have given more data for wind power.41 UCTE add that for two
thirds of the year, output will not exceed 20% of the installed capacity while for one third it
will not exceed 10%. They also mention that in five of the last ten periods of peak
demand, there has been zero input of wind-power. It is obvious, therefore, that other
supporting firm capacity is absolutely essential.
Information from both Denmark and Germany highlights a problem that increases in
severity with increased wind generating capacity. Even the best wind forecasting suffers
from a significant degree of error, and both countries experience episodes when wind
production can fall dramatically and unexpectedly.42 It is not feasible to meet such
demands by starting plant from cold, and this reinforces the need for already operating
back-up. Translating that Danish experience to the level of wind penetration proposed for
the UK grid would mean a rapid change of some 3,000 MW, a power fluctuation equiva-
lent to two large coal-fired stations. Further problems arise in relation to unpredictably
high winds which can force the turbines to shut down rapidly to prevent mechanical
damage, thus tripping the system when close to maximum production resulting in a
sudden surge of demand upon the back-up capacity.
The issue was well-summarised in a trenchant letter to Professional Engineering
making two key comments. In the first the writer noted difficulties in managing frequency
control with the accommodation of wind. In the second it was pointed out that:
39 E.ON Netz, Wind Report 2004 (2004), 3.
40 DTI, Digest of United Kingdom Energy Statistics 2004 (2004).
41 The UCTE Position Paper on Integrating wind power in the European power systems: prerequisites for successful and organic growth (May 2004) is available from http://www.ucte.org/.
42 For Danish data see Hugh Sharman, “The UK’s Dash for Wind” (2004). For German data see E.ON Netz, Wind Report 2004, 6.

REF REDUCTION IN CARBON DIOXIDE EMISSIONS
19
[…] a 660 MW turbo-alternator cannot be run up and down like a 3 kW kettle. The time taken to
start up and load a large unit is very much dependent on how it was shut down. The rate of
repowering mirrors the shutdown. If the machine is unwanted for a day or so, it will cool to the
point where start-up and loading will take several hours.43
Engineers in the United States currently base their power generation planning for wind on
the assumption of a load factor of 25%. The first programme, in California, became
entangled with changes in generating structure, particularly in the aftermath of a period
when, in spite of growing demand, there was under-investment in generating equipment,
a combination that led to power-cuts. The new programme pursues a more cautious step-
wise programme intended to demonstrate and investigate the potential of turbines
designed for a wider range of wind speeds.
New Zealand, Ireland and Denmark have all commented on the low marginal value of
wind generated power in a market-driven electricity supply system. This results in poor
returns to investors, and New Zealand considers that commercialisation of electricity
storage will be needed to make wind power viable. Denmark expressed the view that
there is a growing problem in NW Europe, where due to high densities of wind generators
there is excess output during windy summer conditions when there is low demand. There
is a clear likelihood that the Danish and German wind carpets will peak more or less simul-
taneously and overload transmission capacity.
The other clear message centres on issues already noted. Namely: 1. a substantial
increase in the frequency of start-up and shut-down of back-up plant and an associated
inefficiency causing increased CO2 emissions; and 2. The fact that maintenance and
operating costs increase accordingly.
5.0 Cost of carbon avoidance
An approach that is fast gaining prominence in studies of CO2 abatement options is the
calculation of the cost of emissions avoidance via a particular technology. This has the
merit of reminding us that there is considerable scope for reducing our production of
greenhouse gases, and that our choices should be guided by a broad range of consider-
ations, including relative cost-effectiveness.
This approach is not only used in the United States but also by the Inter-governmental
Panel on Climate Change (IPCC). Studies commissioned from SFA Pacific by the IPCC and
the US Department of Energy employ complex models to produce estimates for the cost
of CO2 avoidance.44 Assuming a 30% annual load factor this model predicts that the use
of land-based wind turbines will save CO2 at a cost of US $91 per tonne, and a capital cost
starting at $700 per kW. The latter cost is probably conservative. Evidence to the House of
Lords states the cost of onshore wind in the UK will be £650 per kW and offshore around
43 Paul Spare, Letter, Professional Engineering (08.09.04).
44 SFA Pacific: www.sfapacific.com.

REF REDUCTION IN CARBON DIOXIDE EMISSIONS
20
£1,000 per kW.45 The following table summarises the results of evaluating these capital
costs in the SFA Pacific model. The figures represent the cost of CO2 avoidance from a
base example of existing coal-fired plant. It should be remembered that the currently
achieved onshore load factor in Germany is around 15%, in Denmark around 20%, and in
the UK 24.1%.
Table 2
Cost of CO2 avoidance via wind turbines
(Units: $/mt CO2 avoidance)
These figures are very high compared with all other methods of CO2 mitigation. CCGT,
advanced coal systems, clean coal technology, and the co-firing of biomass all result in
avoidance figures in the $50–$65 per mt range.
In the light of this calculation we might note, again, CEER’s general comments on the
cost of emissions abatement via renewable electricity, and that the ESB National Grid
study of wind-power’s potential calculated a figure of €138 per tonne ($109 per tonne).
ESB rightly concludes that:
The cost of CO2 abatement arising from using large levels of wind energy penetration appears
high relative to other alternatives.46
The doubts hanging over the cost-effectiveness of wind power as a means of elec-tricity generation cannot be over-emphasised, and raise in an acute form the questionof whether it is wise to promote randomly intermittent renewable energy as theprincipal means of achieving carbon reduction.
6.0 Discussion
Three quotations from letters to the Guardian were cited in the Section 1.1 above. The
BWEA claimed that the building of 3,500 wind turbines would save 17 million tonnes of
CO2. The attainment of that reduction appears to be based on the assumption that coal
capacity would be displaced and that an annual average load factor of 30% can be
sustained. While that level of load factor may, perhaps, be achievable by individual wind
turbine installations in certain locations in the UK, it seems highly unlikely to be true of the
wind carpet as a whole. Many years of Danish and German experience in areas having
45 Royal Academy of Engineering, evidence to the House of Lords Science and Technology Committee, House of Lords: Science and Technology Committee, 4th Report of Session 2003-04. Renewable Energy Practicalities (TSO: London, 15 July 2004), Vol. II, Evidence, p. 322.
Capital
($ per kW)
Load Factor
20% 25% 30% 35%
Onshore 1,157 181 141 114 95
Offshore 1,780 288 226 185 156
46 ESB National Grid, Impact of Wind Power Generation in Ireland on the Operation of Conventional Plant and the Economic Implications (ESB National Grid, Feb. 2004).
REF REDUCTION IN CARBON DIOXIDE EMISSIONS
21
wind speed profiles broadly similar to the UK has typically been 20%. Even if we take a
charitable view of the projected load factor, it is impossible to avoid the conclusion that
the BWEA estimate substantially exaggerates the likely CO2 saving through mistakenly
assuming that wind will displace coal only.
The statement that wind will displace fossil-fired capacity on a kW to kW basis is incor-
rect. The evidence cited from DTI and DEFRA undermines that claim, and even those
governmental figures may themselves be optimistic, through failing to take adequate
account of emissions from back-up generation.
Professor Freris’s remark concerning the energy generated by the Danish installed wind
capacity is partially correct in saying that there is the theoretical capability to meet 20% of
Denmark’s power demand. However, to accommodate that amount of wind power in
practice, the Danish grid purchases hydro-electric and nuclear generated power from
Norway and Sweden in times of need, and exports its wind surplus, around 80% of its
wind production, at a dramatic loss, often to Germany. Wind-power is not used directly in
Denmark without fossil-fuelled back-up and CO2 emission. In practice, then, the degree of
CO2 saving is questionable, because of the high level of exchange with Denmark’s neigh-
bours.
On more general UK issues, the electricity trading arrangements add a dimension to the
accommodation of wind. The New Electricity Trading Arrangements (NETA) may already
have had an adverse effect on wind power, and its successor, Ofgem’s British Electricity
Trading and Transmission Arrangements (BETTA), have drawn critical comment from
Scotland because transmission charges have risen and are to be related to distance,
rather being based on a flat rate across the UK. No matter how the costs are split, it does
not alter the fact that there is a substantial potential for clean generating capacity at
existing power plants already connected to the grid, a potential that is not burdened, as
wind-power is, with the substantial expense of harnessing, transmitting and providing
back-up power.
To put wind turbines in perspective, the capacity of the Drax power plant alone would
require 2,000 x 2 MW wind turbines to replace the nominal power capacity if the wind
turbines operated at 100% of the time on full load.47 Since no firm generation can be
expected of wind it is in fact only reasonable to talk in terms of equivalent energy produc-
tion, and assuming a load factor of 24.1% it would require nearly 5,000 turbines of 2 MW
to produce the equivalent energy. If load factors in the UK prove to be similar to those in
Denmark and Germany then the figure would be somewhere in the range of 6,000–8,000
wind turbines. This is very poor use of national assets.
The capital cost of wind-power is between two and three times that of CCGT capacity
with an 85–90% annual load factor, and with the latest CCGT technology a 60% reduction
in emissions can be guaranteed, a reduction which is substantially larger than the
uncertain gains achievable from wind with back-up.
47 Drax has six 660 MW generators.

REF REDUCTION IN CARBON DIOXIDE EMISSIONS
22
When planning an optimal route to produce electric power at an economic price and
with minimum pollution, all options must be considered, and especial emphasis should
be placed on the extent to which capital assets are utilised. We should not forget that
while the global thermal efficiency of coal-fired plant is as low as 30%, this can rise as
high as 90% for combined heat and power systems. Clearly, there is a considerable scope
to explore energy efficiency and decentralised power such as CHP, even on a micro-scale,
as a mechanism to reduce CO2.
7.0 Conclusions
The following conclusions can be drawn from a review of available data:
• Wind power has been developing in Europe for nearly twenty years. Ample
experience has been gained over that time to show the variable, unpredictable and
uncontrollable nature of wind power.
• The pattern of production does not match the “power on demand” criterion for
electricity and the annual load factors realised in practice within Europe fall well
below the assumptions being made for the performance of wind farms in the UK.
• The UK’s application of wind technology cannot be modelled on that of Denmark and
Germany, though we can learn from those experiences. Denmark relies on its cable
links to Norway, Sweden and Germany for operability, while Germany is connected to
the continental grid. The UK is effectively an island power system with little scope to
exchange.
• Privatisation of the power industry was a political decision. The concept of an open
market in electricity, as a parallel move to the liberalisation of the gas market, took no
account of the differences between these energy sources. In other words, it failed to
recognize the fact that electricity differs from other forms of energy. Electricity cannot
be stored directly, so supply and demand have to be balanced continuously second
by second.
• The accommodation of variable, wind generated, power into the transmission/
distribution system is complex and the technical difficulties are not well understood.
• Current policy is framed as if CO2 emissions savings are guaranteed by the
introduction of wind and have no concomitant difficulties or costs. This is not the case.
• Fossil-fuelled reserve capacity is required to accompany wind generation and
stabilise supplies to the consumer. This reserve capacity generates more CO2 than
has been assumed by Government advisors. It can now be seen that it is essential to
examine the emissions savings from the complete electricity generating system,
rather than basing our calculations on narrow and theoretical assumptions about
kWh replaced.
• Forecast CO2 savings from the DTI and DEFRA differ considerably. DEFRA’s fixed
figure cannot be reconciled with the DTI’s recognition that fuel type and generating
technology play a key role in the level of emissions. No single “emissions factor”
figure can represent the dynamics of back-up supplies, and variation in achieved
saving will vary considerably from situation to situation.

REF REDUCTION IN CARBON DIOXIDE EMISSIONS
23
• In practice, the introduction of wind-generated power creates a variable inefficiency
in the conventional plant which is required to operate in parallel. Hence, even the DTI
figures overstate the savings because of the frequency of start-up and shut-down of
conventional plant in absorbing the wind production while matching demand.
• BWEA assume twice the level of saving given by DEFRA. BWEA’s claim of 17 Mt CO2
saving from 3,500 wind turbines appears very optimistic.
• Claims that wind is CO2 free replacement for fossil fuels on a unit for unit basis are not
correct. Evidence from the UK, Ireland, Germany, Denmark and the USA prove the point.
• The current programme is being driven by substantial financial incentives created
through the Climate Change Levy and the Renewable Obligation. The first of these is
a tax on commercial consumption of electricity and is collected by suppliers and
remitted to the Exchequer. The second is a more complicated indirect subsidy drawn
from consumers via suppliers. Both sources of funding result in significant increases
in the price of electricity. The Climate Change Levy is set at £4.30 per MWh, and the
RO system is currently costing £500 million a year and is expected to cost on average
£1 billion per annum until 2020.48 The National Audit Office calculates that the
Renewables Obligation already accounts for 2% of domestic electricity bills.49
• Price increases for electricity cause a domino effect in the rest of the economy. For
example, power is the major cost to the water and sewage industries. Furthermore, the
commitment to wind on the scale proposed is a mechanism guaranteed to force up
power price in the domestic sector, which is the very sector the Government’s Energy
Policy is designed to protect. Extensive deployment of wind is incompatible with the
White Paper’s objective “to ensure that every home is adequately and affordably heated”.
• There are cheaper and more certain methods of reducing CO2 emissions and it is
almost certainly wiser to place more reliance upon those, and less upon wind. A
greater reduction in CO2 could be achieved by building CCGT at much lower cost. As
natural gas prices rise, it will be economic to convert coal into gas and burn the fuel in
systems equipped with CO2 capture.
• CO2 capture and sequestration, perhaps for Enhanced Oil Recovery, is unreasonably
neglected in the UK, but is being developed and employed vigorously in other parts
of the world. There are strong arguments in favour its cost-effectiveness.50
48 House of Lords: Science and Technology Committee, 4th Report of Session 2003-04. Renewable Energy Practicalities (TSO, 15 July 2004). HL Paper 126-1. para 5.4, and the National Audit Office, http://www.nao.gov.uk/pn/02-03/0203624.htm.
49 The New Electricity Trading Arrangements in England and Wales, Report By The Comptroller And Auditor General, HC 624 Session 2002-2003: 9 May 2003. Available on http://www.nao.gov.uk/pn/02-03/0203624.htm
50 See, for example, the written evidence supplied by Air Products plc to the House of Lords: Science and Technology Committee, 4th Report of Session 2003-04. Renewable Energy Practicalities (TSO, 15 July 2004). HL Paper 126-1, Vol II, pp. 222–227. See also the Renewable Energy Foundation’s own response to the DTI’s consultation Carbon Abatement Technologies (Cat): A Strategy for Fossil Fuel Power Generation (http://www.ref.org.uk/pages/newpub.html).

REF REDUCTION IN CARBON DIOXIDE EMISSIONS
24
• Combined Heat and Power, and other energy efficiency measures, offer yet more
options for economical emissions abatement.
• The encouragement of renewable energy enjoys general public support in principle,
but there is little understanding, even amongst decision-makers, of the merits of
the various technologies available. NaREC was established to evaluate a range of
options, and guide policy through its recommendations. However, before the Centre
could begin work or provide feedback, the Government’s policy has created
conditions launching a massive wind programme. Low annual load factor and high
capital cost suggests that windpower is an expensive way to 1. generate power and
to 2. reduce CO2 emissions.
• A controlled learning programme for offshore wind would be justified to assess load
factors in UK waters. However, the sheer numbers of onshore turbines needed to
approach even a fraction of the 10% of power demand set as the Government’s
target would have a considerable negative economic impact, and a dramatic effect on
the UK, with little or no economic gain and a barely significant CO2 reduction.
• The focus on wind power for new generating capacity is likely to lead to the retention
of old, low-efficiency, coal-fired plant for an extended period because market forces
hold prices at a level that discourages new investment.
• In conclusion, it seems reasonable to ask why wind-power is the beneficiary ofsuch extensive support if it not only fails to achieve the CO2 reductions required,but also causes cost increases in back-up, maintenance and transmission, while atthe same time discouraging investment in clean, firm generation capacity.

25
Appendix
This Appendix contains a summary of experience gained in countries that have under-
taken the development of wind power. The reader is also referred to the report by the
Council of European Energy Regulators, which provides details and references to further
documents.1
A.1 IrelandOne of the more comprehensive studies of the impact of extensive deployment of wind
has been carried out in Ireland where problems have already been experienced in accom-
modating a relatively low level of wind capacity in an island system.2 In December 2003,
the Irish Government issued a moratorium on the connection of new capacity to the grid
to protect power supply. The Electricity Supply Board (ESB) National Grid then undertook
a review of new wind farm connections and their impact on the whole electricity supply
system. Even though only a modest number of wind-farms had been connected, a range
of technical issues had arisen and needed to be resolved to avoid power cuts triggered by
major, unpredicted, changes in the weather pattern. The report identified many system
weaknesses resulting from the addition of wind-power, and some aspects will take much
time to resolve. The fundamental problems stem from meteorological changes and the
fact that a weather front is able to pass across Ireland in as little as 2.5 hours. In that time-
frame, wind-power output can change from near maximum to nothing at all with little
precise accuracy on the timing.
The study highlights the fact that:
Unlike conventional plant, the (wind) output is not related to customer demand. Maximum
wind production may occur during low customer demand periods, or conversely at times of
peak demand there may be little or no wind generated power. [...] As a consequence, the
output required from the other sources of electricity is more volatile in nature.
One key message is the need to operate fossil-fuelled capacity in parallel with wind when
supplying an isolated island power system. Another is the type of technology used for
back-up, because much of the Irish generating capacity is now based on combined-cycle
gas turbines. The variable output from the wind turbines has to be matched by controlled
changes in the output of their coal and CCGT plant.
ESB National Grid point out that a single start-up of one of their large thermal plants
would use €10,000 worth of fuel, and produce significant quantities of CO2 without
generating a single kWh. In other words, operating gas turbines by ramping up and down
1 Council Of European Energy Regulators (CEER), Current Experience With Renewable Support Schemes In Europe (2004), p. 12, available from http://www.ceer-eu.org/.
2 ESB National Grid, Impact of Wind Power Generation in Ireland on the Operation of Conventional Plant and the Economic Implications (ESB National Grid, Feb. 2004), 18.

REF REDUCTION IN CARBON DIOXIDE EMISSIONS: APPENDIX
26
generates more CO2 per kWh of electrical generation than if the gas turbines were
operated on the normal planned load. Dependent on the weather forecasts, it may be
possible to shut down some capacity for brief periods, but this may frequently be for only
a matter of hours. Fuel is then wastefully consumed and CO2 emitted as the plant is
started up again, without any power being generated, before it is returned to load-bearing
grid service. This frequent ramping and start-up pattern was not taken into account when
the turbines were designed and such a mode of operation not only increases the CO2
emissions, but also causes otherwise avoidable wear and tear, and so shortens the
periods between overhauls thereby adding to maintenance costs. To cover themselves as
manufacturers, General Electric has prepared a comprehensive technical paper on the
consequences of running gas turbines in this mode and the real risk of increasing
scheduled overhauls.3
While gas turbines can be started up relatively quickly, this is not true of coal-fired
stations, and if this capacity is used to balance the wind generators, the control is
achieved merely by reducing power output while continuing to burn fuel. Obviously, this
causes an increase in CO2 emission per kWh generated.
CO2 emissions from the fossil-fired plant will also vary according to the level of wind
capacity installed. The Irish evidence shows that as the level of wind capacity increases,
the CO2 emissions actually increase as a direct result of having to cope with the variation
of wind-power output. These larger swings will necessitate the ramping up and down of
both mid-merit and high-merit capacity, and the introduction of coal-fired plant. ESB
stresses the consequential cost-effects of wind generation and their assessment is
meeting the EU target will entail a 15% increase in electricity cost. These conclusions are
similar to those expressed above by National Grid Transco.
The most recent outcome of the review of wind-power in Ireland is ESB National Grid’s
creation of a new Grid Code. The “Wind Farm Power Station Grid Code Provisions” place
stringent constraints on owners of new capacity.4 The general intent may be summarised
as requiring generators to accept responsibility for contributing to the security of the
power supply system, and to discourage the speculative building of wind farms the output
of which the grid operator is required to accept at all times. The new provisions dictate
some very specific steps that the owner must take to “manage” the input to the grid with
careful control of frequency, % Active Power and other relevant matters, thereby making
the owner a responsible member of the generation/distribution team. If successful this will
limit the fluctuations the impact on conventional capacity acting in the backup role. It is
premature to judge the outcome of this new Grid Code, but it is worth nothing that the
requirements though onerous are entirely justifiable, and may well curtail investment in
randomly intermittent generation.
3 Maintenance guidelines GER 3260J downloadable from GE’s website: http://gepower.com/prod_serv/products/tech_docs/en/all_gers.htm
4 WFPS1 Wind Farm Power Station Grid Code Provisions (2004), available from www.esb.ei.

REF REDUCTION IN CARBON DIOXIDE EMISSIONS: APPENDIX
27
A.2 DenmarkDenmark has, proportionate to population and demand for electricity, more experience of
wind turbines than any other European country. Currently, Denmark has installed 3,100
MW of wind turbine capacity.5 In principle, it is capable of generating 20% of the country’s
electricity demand. This theoretical statistic is misleading because it is frequently quoted
to imply that 20% of Denmark’s power is actually supplied continuously from their wind
capacity (also the aim of the UK government for 2020). The case is then made that if the
Danes can achieve such a high figure, then other countries can follow. However, the figure
is not a factual representation of the supply/operating pattern.
Of the 3,100 MW capacity, 2,374 MW is located in Western Denmark (Jutland and
Funen). Jutland has cable connections to Norway, Sweden, and Germany with a capacity
of 2,750 MW. In other words, Denmark has the means of exporting all of its wind produc-
tion if it wishes. This actually happens in practice, and the 2003 annual report of Eltra, the
Western Denmark transmission company, suggests an export figure of 84% of total wind
production to these countries last year. These export figures have increased rapidly over
previous years as Denmark found it was unable to absorb its untimely wind output into
the domestic system.
The interconnections between Denmark and its neighbours hold the key to system
operability, by permitting the accommodation of wind output even if it is not required in
Denmark. Norway is almost entirely reliant on hydro-electric generation, while Sweden
employs a mixture of hydro-electric and nuclear capacity. Norway and Sweden can either
take wind-derived power into their grid while reducing their hydro output, or can use the
power to pump water to elevated reservoirs in order to recover power at a later date.
Likewise, if there is little wind, the Danes may choose to buy in power from Norway and
Sweden.
Jutland also exchanges power with Germany, roughly in equal quantities, and almost a
time exchange. This operational flexibility does not exist in any island power system such
as in Ireland or the UK.
When operating in this mode, the Danes achieve little or no CO2 saving simply because
zero-emission wind-power is displacing zero-emission hydro-power. However, if the wind-
power were to be taken into the Danish local system, spinning reserve using coal-fired
stations would be required, with corresponding CO2 emissions. Elsam, the Jutland power
generator, has stated as recently as 27 May 2004, at a meeting of the Danish Wind Energy
Association and the Danish Ministry of Energy, that further increases in installed wind-
power will not produce corresponding decreases in CO2 emissions. The typical annual
load factor from Danish wind farms is just 19–21%. Eltra also cites meteorological data for
wind speeds being below “normal” for 4 out of the last 5 years and only 73.2% in 2003.
5 Eltra, 2003 Annual Report, and Hugh Sharman, House of Lords: Science and Technology Committee, 4th Report of Session 2003-04, Renewable Energy Practicalities (TSO, 15 July 2004).

REF REDUCTION IN CARBON DIOXIDE EMISSIONS: APPENDIX
28
Emerging problems relate to controlling the surges of power due to unexpected
increases in wind speed, and the sudden decline when forecast winds decline earlier than
anticipated. Changes of between 250 and 400 MW can occur within an hour, and in stormy
weather a complete wind farm can trip when the winds reach 25m/s. Such problems have
been manageable in the past, but increasing capacity present these difficulties in an acute
form. Of particular concern is the fact that the Danish installation fluctuates in parallel to
the vast and growing German wind capacity, a situation which is leading to disposal
problems for both countries in situations of high wind and low demand.
A.3 GermanyGermany has installed the largest amount of wind capacity in Europe to date, over 14,000
MW, but the experience being gained from a huge investment and heavy subsidy appears
to be raising some serious doubts about the programme and the cost of achieving the EU
targets.
Recent Reuters reports for 2003 gave figures for annual load factor of just 18.7%.6 A
more recent Reuters article cited the results of a study covering the German wind system
over the 6 years 1998–2003 inclusive. If the annual average load factor is back-calculated
over the 6 year period, it is a mere 14.7%.7
To quote the introduction of the article:
Germany's installed wind-power capacity grew faster than the amount of electricity actually
produced by wind energy plants in the last six years, the national VDEW power industry group
said. This revealed the inefficiency of German government programmes to promote wind-
power and underlined that green energy can only be a supplement in the overall energy mix
and not replace energy sources such as coal. ‘State subsidies have triggered a fivefold rise in
installed wind-power capacity between 1998–2003, while wind energy production only
quadrupled’. But the law is under review because the rising costs have run into opposition
from energy-intensive industries in an economic downturn.
It is certainly prudent to see “green” energy as a supplement in the overall mix, and the
following quote from Professor Alt’s report, The economics of wind power within the
generating mix, mirrors the views emerging from Ireland about balancing and reserve
capacity.8
Different qualities of balancing energy and reserve capacity are required:
• Up to 10 seconds: load balancing between generation and consumption comes from
the dynamics of all rotating masses (generators and motors) and a corresponding
frequency change in normal operation of up to around ~0.1Hz.
6 Reuters Power News (April 2004)
7 Reuters Power News (June 2004)
8 Professor Helmut Alt, The economics of wind power within the generating mix (Presentation dated 05.11.03)

REF REDUCTION IN CARBON DIOXIDE EMISSIONS: APPENDIX
29
• 10 seconds to 2–3 minutes: load balancing by primary control of all plants operating
in parallel at a drop of 4% with backup supply through the boiler steam pressure of
conventional power plants in proportion to the overall network power frequency
characteristic of the UCTE inter-connected system.9
• 2–3 minutes to 10–15 minutes: activation of reserve capacity through secondary
control and calling up of pumped storage capacity and gas turbine reserve capacity in
compliance with network power frequency characteristics of the national grid or
control areas.
• 8–10 hours: calling up and starting up reserve power plants from different levels of
readiness.
The sequence of control required to manage the supply outlined above reinforces the
fact that much fuel is used inefficiently in start-up, shutdown, and ramping routines. While
such steps have always been necessary, the advent of a growing amount of wind-
generated power exacerbates the management problem by increasing the magnitude of
the swings. German studies have not articulated the reduction in CO2 specifically. In fact,
Professor Alt stated that since his prime purpose was to address the economics of wind-
power, he would refrain from commenting on CO2. Nevertheless, he does point out that
the proposed decline in nuclear capacity in Germany will lead to an increase in CO2
emissions because of the back-up fossil-fired capacity needed to support wind.
To maintain a perspective on size of systems, peak German demand stands at over 73
GW, peak UK demand at 59 GW, and Ireland at about 5 GW. When determining methods of
securing stable electrical power for the UK, the sheer size of demand must be borne in
mind when considering the need for back-up to support non-firm generation. Alt’s report
emphasises this point by noting that in 5 out of the last 10 winter peaks there has been no
wind input at all. Hence, unless rapid, reliable demand-side management can be put in
place, conventional capacity in excess of winter peak demand remains essential.
Additional information from E.ON Netz goes some way to explaining the low annual
load figures.10 At no stage last year did the wind carpet output exceed 80% of the
installed capacity even in good wind conditions. For over half the year, the 6,250 MW of
installed wind fed less than 11% of its theoretical capacity into the grid. Further increases
in installed capacity are leading to very large and randomly occurring fluctuations of wind
power, thereby increasing demand on grid control and a corresponding increase in cost.
E.ON Netz also point out that the average weather forecasting error ranges from – 370
MW to + 477 MW on their 6,250 MW installed capacity, and that, breathtakingly, during
individual hours the error was as large as +/– 2,900 MW. E.ON Netz comments:
Of crucial importance to the wind-related demand for reserve capacity is the expected
maximum forecast deviation and not, for example, the mean forecast error. This is because
even if the actual infeed deviates from the forecast level only on a few days in the year, the
9 A representative UCTE network would, for example, be the 17,000 MW/Hz RWE control area.
10 E.ON Netz Wind Report 2004.
REF REDUCTION IN CARBON DIOXIDE EMISSIONS: APPENDIX
30
transmission system operator must also be prepared for this eventuality and have sufficient
capacity available so that a reliable supply is still guaranteed.11
E.ON Netz further note that infrastructure expansion will also be needed with some 390
km of extra-high voltage lines in Lower Saxony and Schleswig Holstein alone, and at a
cost of approximately €190 million. They emphasise the need for new transmission
systems to be developed simultaneously with new windpower installation because of the
cost of delay and mismatched timing. Since different companies may be responsible for
the separate phases and planning consents may be handled by different authorities this is
no small challenge. In Germany as a whole it is estimated that by 2016 approximately
1,500km of new high-voltage and extra-high voltage cabling will be needed to
accommodate wind power. No costings are available for this work.
A.4 USACalifornia and other parts of the United States have encouraged extensive development of
wind energy, but after many years of investment it remains no more than 0.5% of the
USA’s generating capacity. Much has been written about the Californian black-outs, and
this is now part of the history of power. The situation on renewables is well summarised in
a response to a State Legislator by a specialist consultant, Glenn Schleede, who empha-
sised with particular force the fickle nature of wind.
Electric systems (“grids” or “bulk power” systems) must be kept in balance on a real time
basis to maintain system reliability – e.g., in terms of frequency, balance between demand and
generation (supply), and load on particular transmission lines.
Because the output from wind turbines is intermittent, highly variable, largely
uncontrollable and unpredictable, other generating units (i.e., “dispatchable” units) must be
kept immediately available to “back-up” the wind turbines by increasing or decreasing their
production of electricity. Units serving this backup role must be on line (connected to the grid
and producing electricity) and running below their peak capacity and efficiency, or in a
“spinning reserve” mode (i.e., connected to the grid and synchronized but not putting
electricity into the grid).
The generating units serving this role incur costs that they would not normally incur if they
were not serving the backup role, including fuel and operating costs and extra wear and tear
on the units as they are ramped up and down. These “backup power” costs are a part of the
full, true costs of electricity from wind.12
In either case, CO2 is being emitted that negates part of the advantage of wind-power.
These comments mirror the comments by all the operating companies who are experts in
the power generation field.
11 E.On Netz, Wind Report 2004, p. 9.
12 Glenn Schleede, “Wind Energy Economics in West Virginia: A description of the environmental, scenic and property value implications and an analysis of the economic benefits and costs associated with existing and proposed ‘wind farms’ in West Virginia” (Jan. 2003), p. 4. Available from http://friendsofthealleghenyfront.org/news.htm

REF REDUCTION IN CARBON DIOXIDE EMISSIONS: APPENDIX
31
The US Department of Energy (DoE) has recently published a comprehensive report
covering the steps they are to implement in order to bring the development of wind
energy.13 The programme is spread over the next seven years and aims at installing a
total of 100 MW in each of sixteen states by 2010. Three primary targets are identified: 1.
technology characterisation and data collection, 2. tools and methods of development,
and 3. applications and implementation. A substantial research and development
programme is needed to examine both high and low wind speed turbines, including the
deployment of smaller wind systems in distributed settings. Judging from this structured
plan, the DoE wishes to develop a vision of the future potential of wind and move progres-
sively towards a manageable system.
By contrast with this measured and prudent approach, the wind development industry
has set itself a target of 100 GW of wind power in the USA by 2020, and calculate a saving
of 65 million tonnes of “carbon equivalent” per year. They have given no data on assumed
load factor or whether this is CO2 or carbon so it is not practicable on the information in
the report to assess their assumptions on grams per kWh CO2 saving.
The most significant differences between the USA and Europe are the low population
density of many states and the notable avoidance of wind development in potential
hurricane areas.
Another significant view has been expressed in a discussion with the Electric Power
Research Institute (EPRI) in California, an internationally renowned research facility
operating on behalf of the whole of the US Power Generating Industry.14 EPRI now recog-
nises the operability problems associated with accommodating wind production into
complex power distribution networks and the need to operate CO2 emitting reserve. A
project to evaluate this aspect in more detail has been initiated, and EPRI agrees that 1. it
is technically incorrect to assume that wind power will displace fossil generated power
and save CO2 emissions on a kWh for kWh basis, and 2. in a real operating situation where
storage is not available, the CO2 saving will be small.
A.5 New ZealandIn spite of excellent wind conditions, New Zealand has installed just 1.2 MW of grid-
connected capacity in the past 3 years, though 120 MW is currently under construction,
and a further 200 MW under investigation.15 However, a recent report commissioned for
the New Zealand government’s Energy Efficiency and Conservation Authority highlights
the fact that:
13 U.S. Dept. of Energy, Wind Energy Program Multi Year Technical Plan For 2004-2010. See: http://www.nrel.gov/wind_meetings/2003_imp_meeting/pdfs/mytp_nov_2003.pdf
14 http://www.epri.com/
15 See East Harbour Management Services, “Renewable Energy: Industry Status Report Hydro, Geothermal & Wind Energy”, p. 39 Commissioned and published by the Energy Efficiency and Conservation Authority (EECA). File available http://www.eeca.govt.nz/publications/publications.aspx?MediaCatID=5#11

REF REDUCTION IN CARBON DIOXIDE EMISSIONS: APPENDIX
32
Renewable energy is often non-firm (wind, solar, tidal) and has to be used as it is converted
into a useable form. This limits its value and subsequently it is sold at lower prices than firm
controllable energy. Until ways of storing non-firm renewable energy are developed it will
continue to be treated as a lower value product.16
A.6 UKData from Innogy has been mentioned previously. Data from the following individuals and
organisations will be evaluated in this section: Robert J. Bass and Dr Peter Wilmott of
Loughborough University, the British Wind Energy Association, the DTI, Energy Tech-
nology Support Unit (ETSU), AEA Technology, Ilex Energy Consulting, and the IEA Green-
house Gases Programme.
Robert J Bass and Peter Wilmott
Robert J Bass and Peter Wilmot of the University of Loughborough have approached the
problem from a different viewpoint than most other analysts.17 Rather than assuming a
displacement value, they considered the introduction of the new wind capacity and
assessed the fossil-fuelled capacity that would be needed to support it, bearing in mind
the relatively low annual load factor for wind-power. In their approach the CO2 emitted
from the overall system is calculated by assuming zero emission from the wind power
itself, but full emission from the back-up for the period that the support facilities would be
running. This process, in fact, charitably overstates the CO2 reduction because it assumes
that 30% of the year will be powered by wind and 70% of the year by fossil fuel. In other
words, the system dynamics, the ramping necessary to accommodate fluctuations in load
and output, are left out of the equation. Nevertheless, Bass and Wilmot’s procedure is an
interesting measure of the effect of introducing a variable quantity of power from wind
into a complete system. The study considers the following technologies as running mates
for wind: CCGT, open cycle gas turbines, oil-fired plants, and coal-fired power plants.
Assuming a 30% load factor, the results were that the maximum CO2 saving that could be
achieved would be 836 grams per kWh if coal was displaced, 360 grams per kWh in the
case of open cycle gas turbines and 228 grams per kWh if CCGT was displaced.
The British Wind Energy Association
The British Wind Energy Association based their figures for the emissions reductions on
what appears to be a typical emission saving of 860 grams per kWh, which is their
estimate of the emissions displaced from coal-fired capacity.18 In deriving this figure, they
16 See East Harbour Management Services, Executive summary to “Renewable Energy: Industry Status Report Hydro, Geothermal & Wind Energy”, p. 9. Commissioned and published by the Energy Efficiency and Conservation Authority (EECA). File available http://www.eeca.govt.nz/publications/publications.aspx?MediaCatID=5#11
17 R Bass & Dr P Wilmot, “Wind may not be the answer”, UK Power, 2 (2004).
18 BWEA, “Calculations for wind energy”, see http://www.bwea.com/edu/calcs.html.
REF REDUCTION IN CARBON DIOXIDE EMISSIONS: APPENDIX
33
have used an annual load factor of 30% on the rated wind turbine capacity. They concede
that these figures are somewhat lower than those given by the Parliamentary Office of
Science of Technology as typical of a coal station, namely 936–1097 grams per kWh
(figures which are in line with the calculations of Siemens and reflecting the variability of
coal quality and efficiency).19 However, the BWEA justify their case for a lower figure by
saying “It is important to realise that gaseous emissions from conventional power sources
are decreasing, due to increases in efficiency and the use of pollution abatement”. This is
rather strange logic and incorrect. Sulphur dioxide and NOx emissions have been reduced
by the use of flue gas desulphurisation at Drax and Ratcliffe. Low NOx burners have been
fitted on most plants, but are unlikely to alter CO2 emission. Moreover, while there may be
marginal efficiency improvements on a few stations following privatisation, the overall
CO2 emissions profile of the UK’s coal generation will not have been reduced. The intro-
duction of Flue Gas Desulphurisation (FGD), especially at Drax, requires a significant
consumption of power and reduces efficiency by at least 1%, negating CO2 abatement
elsewhere in the system. In addition, the process of absorbing the SO2 in limestone also
displaces more CO2 to the atmosphere. None of this is mentioned by the BWEA, and there
does not appear to be any technically sound explanation for their assumption of a lower
figure. The consequent implicit claim that every kWh produced by wind will displace only
coal-fired capacity, and that therefore the emissions saving will be 860 grams per kWh, is
no better grounded. Overall, this emissions factor is a mystery, at once too high and inex-
plicably too low.
Energy Technology Support Unit (ETSU)
ETSU’s principal contribution on this matter was made in New and Renewable Energy:
Prospects for the 21st Century, Supporting Analyses.20 This document emphasizes that
estimation of the emissions abatement effect depends to a large degree on comparison of
the “life-cycle” emissions of the various technologies, a point of particular importance in
relation to renewable technologies. As ETSU write:
In general, such emissions are thought to be equivalent to, or even greater than, those arising
from the same parts of the life cycles of conventional generating technologies. This is because
renewables convert ‘dilute’ sources of energy compared to the concentrated fossil fuels and
uranium used in conventional generating systems. Therefore, the collection of these dilute
sources and conversion to useful energy requires more machinery and larger structures per
unit of electricity produced; these in turn require more energy in their manufacture and
construction.21
19 Parliamentary Office of Science and Technology, Select Committee Briefing: Environmental Aspects of Wind Generation (1994).
20 ETSU, New and Renewable Energy: Prospects for the 21st Century, Supporting Analysis(March 1999), pp. 212–214, and 276.
21 ETSU, New and Renewable Energy, p. 212.
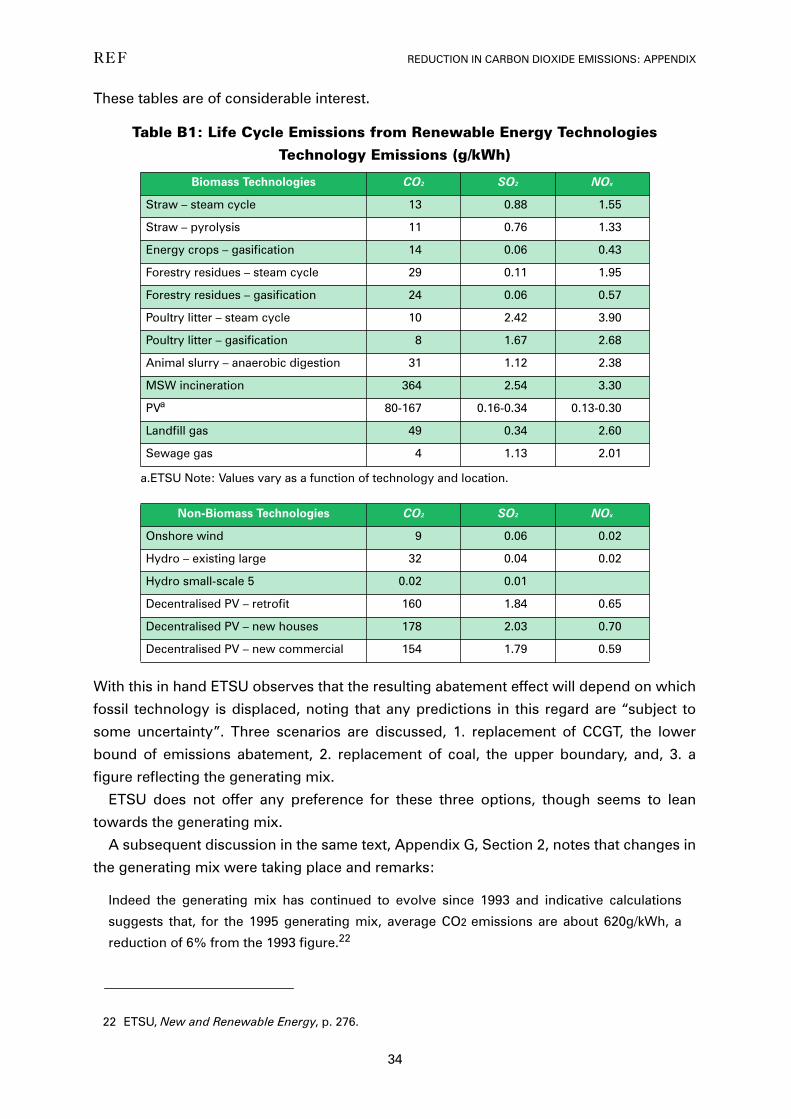
REF REDUCTION IN CARBON DIOXIDE EMISSIONS: APPENDIX
34
These tables are of considerable interest.
Table B1: Life Cycle Emissions from Renewable Energy Technologies
Technology Emissions (g/kWh)
With this in hand ETSU observes that the resulting abatement effect will depend on which
fossil technology is displaced, noting that any predictions in this regard are “subject to
some uncertainty”. Three scenarios are discussed, 1. replacement of CCGT, the lower
bound of emissions abatement, 2. replacement of coal, the upper boundary, and, 3. a
figure reflecting the generating mix.
ETSU does not offer any preference for these three options, though seems to lean
towards the generating mix.
A subsequent discussion in the same text, Appendix G, Section 2, notes that changes in
the generating mix were taking place and remarks:
Indeed the generating mix has continued to evolve since 1993 and indicative calculations
suggests that, for the 1995 generating mix, average CO2 emissions are about 620g/kWh, a
reduction of 6% from the 1993 figure.22
Biomass Technologies CO2 SO2 NOx
Straw – steam cycle 13 0.88 1.55
Straw – pyrolysis 11 0.76 1.33
Energy crops – gasification 14 0.06 0.43
Forestry residues – steam cycle 29 0.11 1.95
Forestry residues – gasification 24 0.06 0.57
Poultry litter – steam cycle 10 2.42 3.90
Poultry litter – gasification 8 1.67 2.68
Animal slurry – anaerobic digestion 31 1.12 2.38
MSW incineration 364 2.54 3.30
PVa
a.ETSU Note: Values vary as a function of technology and location.
80-167 0.16-0.34 0.13-0.30
Landfill gas 49 0.34 2.60
Sewage gas 4 1.13 2.01
Non-Biomass Technologies CO2 SO2 NOx
Onshore wind 9 0.06 0.02
Hydro – existing large 32 0.04 0.02
Hydro small-scale 5 0.02 0.01
Decentralised PV – retrofit 160 1.84 0.65
Decentralised PV – new houses 178 2.03 0.70
Decentralised PV – new commercial 154 1.79 0.59
22 ETSU, New and Renewable Energy, p. 276.
REF REDUCTION IN CARBON DIOXIDE EMISSIONS: APPENDIX
35
The emissions factor range is stated as ranging from 445.5 g/kWh to 986.5 g/kWh, the lower
boundary of which now, some 8 years later, appears too high.
It should be noted that the ETSU text takes no account of considerations relating to
back-up and efficiency.
Department of Trade and Industry
The DTI adopts the ETSU approach and uses life-cycle analyses on the different gener-
ating technologies.23 Life cycle analysis usually takes account of the CO2 associated with
the construction of the facility and accounts for the difference between onshore and
offshore wind.
The DTI then takes the difference between wind and the fossil-fired option to estimate
the kWh saving. The assessment is made on the basis of the lifetime emissions of the
particular technology, including the CO2 that would be emitted during fabrication, hence
the positive and different values for onshore and offshore wind. If displacing coal with
offshore wind-power the emissions saving would be 975 grams per kWh, or if the 1993
mix of coal and gas were to be displaced then 654 grams per kWh. These averages can be
misleading because the price of gas and coal along with the marginal cost of operating
either gas or coal stations will influence the order in which power is offered to National
Grid Transco. Furthermore, there is no reflection of the loss of efficiency with varying load.
Notwithstanding, the calculation shows that DTI recognises 1. that a substantial emission
from the fossil stations will occur while wind is supplying the system, and that 2. there is a
difference between coal and gas.
Greenpeace
In a 2002 report prepared by AEA Technology for Greenpeace, the saving was assumed to
be 430 grams of CO2 per kWh based on fossil-fired capacity.24 AEA describe this as an
“average mix emissions” factor.
Carbon Trust
The Carbon Trust describes its approach as being based on DEFRA guidelines.25 A
worked example cites savings on 10 x 1 MW units of renewable technology – not stated
as wind – that would generate 613 million kWh over 10 years. They then apply an
emissions factor of 0.43 tonnes per MWh to calculate the saving, which is then unjustifi-
ably rounded up to 0.3 million tonnes of CO2.
23 DTI, Efficiency and performance, Wind Energy Fact Sheet 14 (August 2001).
24 AEA Technology, for Greenpeace, Sea Wind East: how offshore wind in East Anglia could supply a quarter of UK electricity needs (July 2002), p. 8.
25 http://www.thecarbontrust.co.uk/carbontrust/low_carbon_tech/dlct2_1_6_4.html
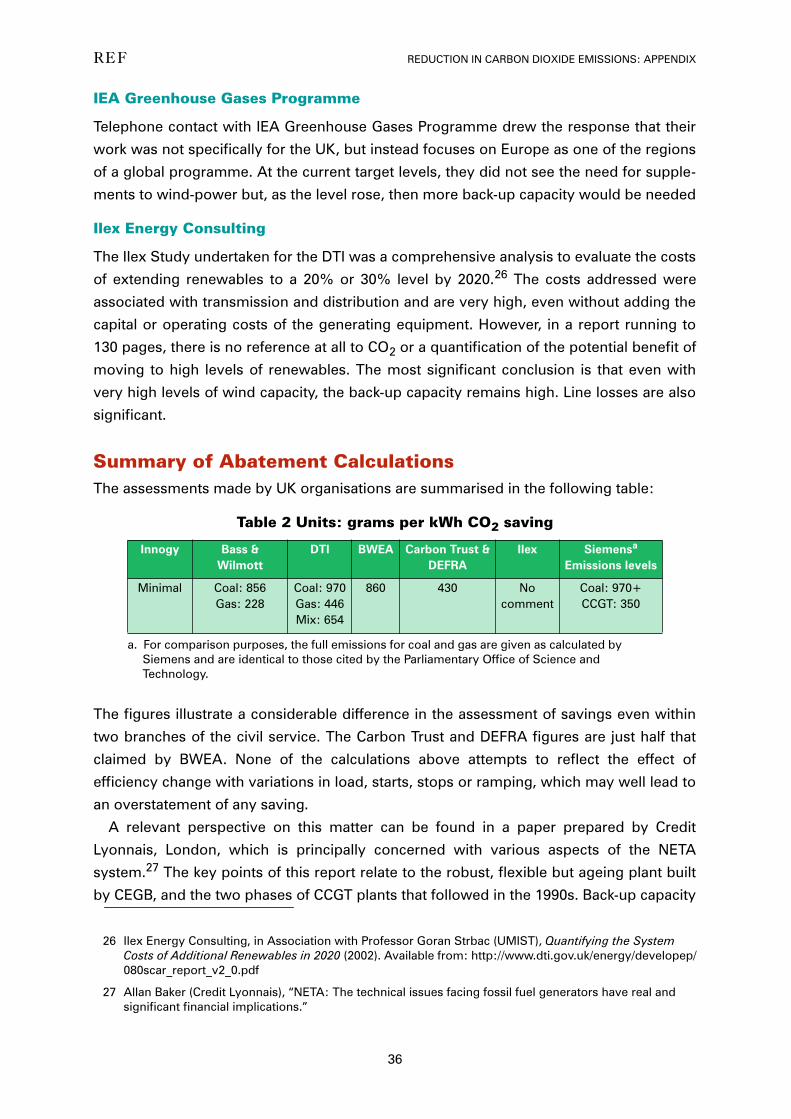
REF REDUCTION IN CARBON DIOXIDE EMISSIONS: APPENDIX
36
IEA Greenhouse Gases Programme
Telephone contact with IEA Greenhouse Gases Programme drew the response that their
work was not specifically for the UK, but instead focuses on Europe as one of the regions
of a global programme. At the current target levels, they did not see the need for supple-
ments to wind-power but, as the level rose, then more back-up capacity would be needed
Ilex Energy Consulting
The Ilex Study undertaken for the DTI was a comprehensive analysis to evaluate the costs
of extending renewables to a 20% or 30% level by 2020.26 The costs addressed were
associated with transmission and distribution and are very high, even without adding the
capital or operating costs of the generating equipment. However, in a report running to
130 pages, there is no reference at all to CO2 or a quantification of the potential benefit of
moving to high levels of renewables. The most significant conclusion is that even with
very high levels of wind capacity, the back-up capacity remains high. Line losses are also
significant.
Summary of Abatement CalculationsThe assessments made by UK organisations are summarised in the following table:
Table 2 Units: grams per kWh CO2 saving
The figures illustrate a considerable difference in the assessment of savings even within
two branches of the civil service. The Carbon Trust and DEFRA figures are just half that
claimed by BWEA. None of the calculations above attempts to reflect the effect of
efficiency change with variations in load, starts, stops or ramping, which may well lead to
an overstatement of any saving.
A relevant perspective on this matter can be found in a paper prepared by Credit
Lyonnais, London, which is principally concerned with various aspects of the NETA
system.27 The key points of this report relate to the robust, flexible but ageing plant built
by CEGB, and the two phases of CCGT plants that followed in the 1990s. Back-up capacity
26 Ilex Energy Consulting, in Association with Professor Goran Strbac (UMIST), Quantifying the System Costs of Additional Renewables in 2020 (2002). Available from: http://www.dti.gov.uk/energy/developep/080scar_report_v2_0.pdf
Innogy Bass & Wilmott
DTI BWEA Carbon Trust &DEFRA
Ilex Siemensa
Emissions levels
a. For comparison purposes, the full emissions for coal and gas are given as calculated by Siemens and are identical to those cited by the Parliamentary Office of Science and Technology.
Minimal Coal: 856Gas: 228
Coal: 970Gas: 446Mix: 654
860 430 No comment
Coal: 970+CCGT: 350
27 Allan Baker (Credit Lyonnais), “NETA: The technical issues facing fossil fuel generators have real and significant financial implications.”

REF REDUCTION IN CARBON DIOXIDE EMISSIONS: APPENDIX
37
for wind is provided by this range of plants and nuclear. However, the operation of the
NETA system has already subjected the CCGT plants to thermal stresses that were not
envisaged in the original design. This has added to operations and maintenance costs,
while start-ups and shut-downs have an added cost every time they occur through fuel
inefficiencies. This cost is currently carried by the generator. The accommodation of fluc-
tuating wind-power will accentuate this problem, and many existing CCGTs may need to
be upgraded to mitigate the problem. This is not cheap, and is estimated at £10–15 million
per plant. Further, amendments to the Large Combustion Plant Directive taking effect after
2007 may also have important consequences for the use of coal-fired stations, leading to
their closure, and capacity could well be lost from the system over that period if wholesale
prices do not rise sufficiently to keep these plants in service. Nevertheless, as is shown
elsewhere in this study, fossil-fired back-up is essential as a partner for wind, so while new
investment may well be needed it may not be forthcoming unless government takes steps
to ensure that a capacity charge system is constructed to ensure that owners are compen-
sated for holding otherwise disadvantaged back-up plant.
About the Author: David White, BSc, C Eng, F I Chem E
David White is an energy consultant, and has held a range of senior management posts with
Esso Petroleum Co. and the Exxon Group over a 30 year period. He spent the first 10 years in
plant operations management at their UK refinery. He was one of few chemical engineers to
switch from refining to marketing where he was responsible for a wide range of market
developments in the UK. He held appointments with Esso Europe in London, Exxon Corpora-
tion in New York, and Exxon Coal International. He took early retirement from Exxon Coal
International in 1987, and created an energy consultancy practice. He has focused on tech-
nologies that offer solutions to emission problems from a range of fossil fuels and wastes by
the application of energy conversion technologies. He monitors developments in EU and US
environmental legislation along with data prepared by the Inter-Governmental Panel on
Climate Change on ways to ameliorate global warming.
He has directed courses on “Advanced Power Generation Technologies” and “Under-
standing the Refinery-Petrochemical Interface” for the College of Petroleum and Energy
Studies, Oxford. Until recently, he chaired the Institution of Chemical Engineers Gasification
Conference Steering Committee. He also sits on the IChemE Energy Technology Subject
Group Committee and represents IChemE on a number of Inter-Institutional Committees and
the Parliamentary Group for Energy Studies. He also drafts many of the Institution's
responses to government consultation papers on energy related issues.

REF REDUCTION IN CARBON DIOXIDE EMISSIONS: APPENDIX
38
About the Renewable Energy Foundation
REF is a newly created foundation which has arisen from widespread and growing public
concern that the current renewables energy policy is in itself unbalanced, and causing subse-
quent imbalances in the rest of the energy sector. The Foundation encourages the develop-
ment of renewable energy and energy conservation whilst safe-guarding the landscapes of
the United Kingdom from unsustainable industrialisation. In pursuit of this goal, REF high-
lights the need for an overall energy policy that is balanced, ecologically sensitive and effec-
tive.
The Renewable Energy Foundation is currently commissioning research and commentary
from leading consultants and industry experts in order foster a full and informed debate. For
further information see http://www.ref.org.uk.
While focusing on renewable energy technologies, REF recognizes that a non-confronta-
tional relationship with fossil fuels is essential for reasons of economy and social responsi-
bility. Many renewables are intermittent, some randomly so. Consequently, and for the
foreseeable future, renewables must work in partnership with fossil generation. It is therefore
essential that the UK concentrates on high value renewables that do not degrade the
performance of the overall energy portfolio.
Related Documents


![Human carbon dioxide emissions [ Mt C]](https://static.cupdf.com/doc/110x72/56813d0c550346895da6bffd/human-carbon-dioxide-emissions-mt-c.jpg)