Reducing Pesticide Use Through Spatial Mapping and Precision Targeting Jeffrey A. Weier Sprague Pest Solutions.
Dec 18, 2015
Welcome message from author
This document is posted to help you gain knowledge. Please leave a comment to let me know what you think about it! Share it to your friends and learn new things together.
Transcript


Reducing Pesticide Use Through Spatial Mapping and
Precision Targeting
Jeffrey A. Weier
Sprague Pest Solutions

Expectations for New Technology
• Computer Modeling, “Killing Pests With Information”
• Increase Efficiency
• Decrease Pesticide Risk
• Proactive and Preventative

Using Spatial Analysis
• Locate source of infestation
• Determine magnitude of activity
• Precision targeting of control efforts
• Document changes in pest activity
• Document results of control efforts
• Locate immigration points
• Separate sources of multiple infestations
Illustration of Non-spatial vs. Spatial Data Analysis
Typical non-spatial analysis of egg counts in 54 locations at a naval communication base in Hawaii
The same data when spatial relationships of observations are considered.
Red areas are highest populations, only those areas require intervention.
900 3275 5650 8025 10400
Easting
8100
10400
12700
15000
17300
19600
21900
Northing
M t. S t. H elen s
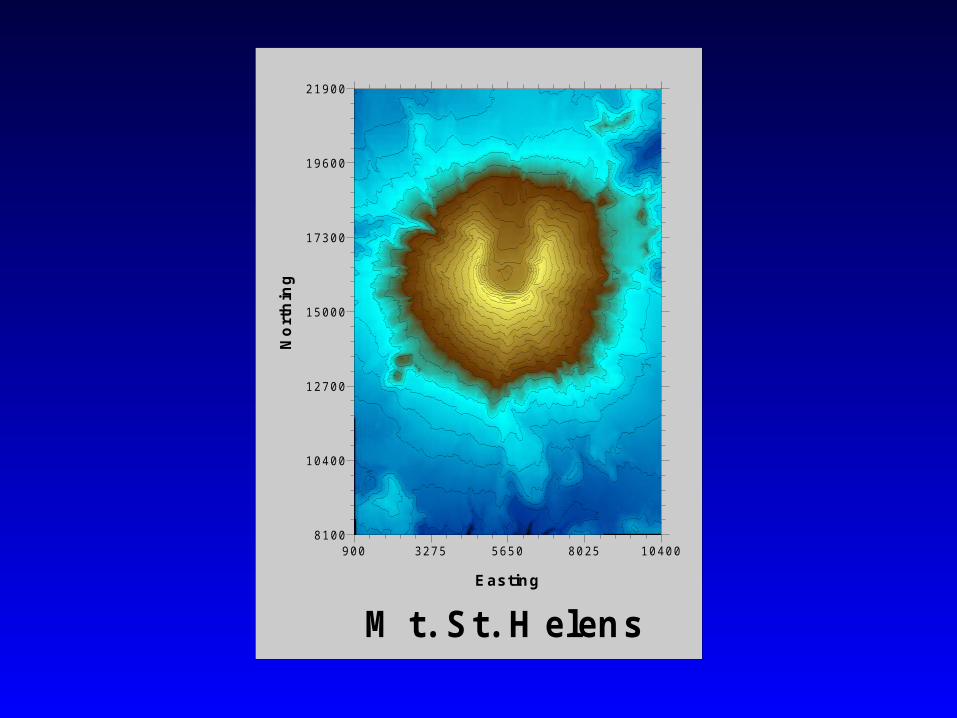
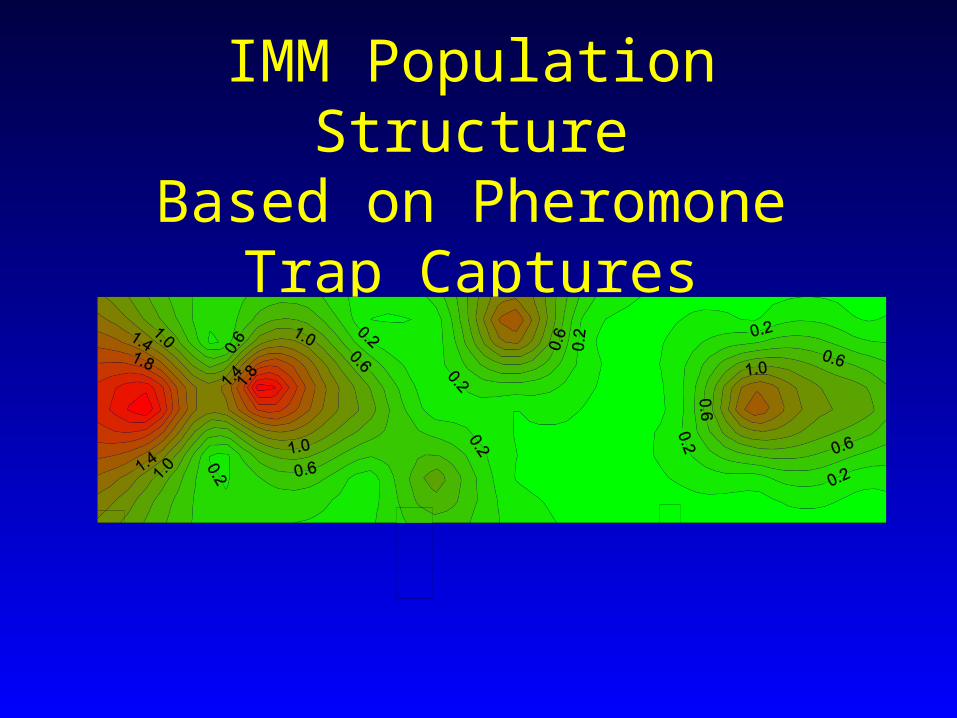
IMM Population StructureBased on Pheromone Trap
Captures
- 2
0
2
4
6
8
1 0
1 2
1 4
1 6
1 8
2 0
2 2
2 4

Two Software Packages
• Surfer• Lower Cost• Some Limitations
• Arcview GIS• Higher Cost• More Capable

Constructing Maps in Surfer
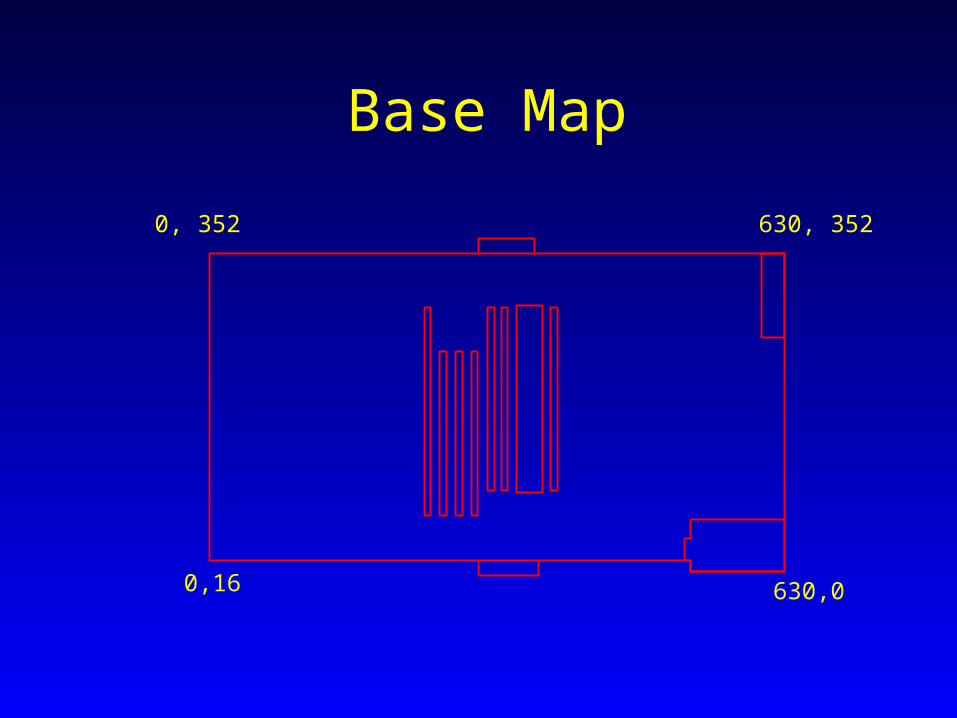
Base Map
0,16 630,0
630, 3520, 352

Types of Data
• Sticky Traps (Number of Insects or Rodents Captured)
• Pheromone Traps (Number of Insects Captured)
• Light Traps (Weights or Numbers of Insects Captured)
• Rodent Traps or Baits (Consumption or Number Captured)

Trap Locations
1
2
3
4
5
6
7
8
9
10
11
12
13
14
15
19
20
21
25
26
27
31
32
33
37
38
39

Contour Map Generation
• Computer software calculates grid nodes for the contour map (actual trap capture numbers are not used to generate contour map)
• Software created a 49x10 node grid• Nodes with identical values are connected by
smooth curves• Spaces between contour curve are filled in with
different colors

Nodes Created by Surfer
IMM Population StructureBased on Pheromone Trap
Captures

Using Contour Maps
• Locate source of infestation
• Determine magnitude of activity
• Locate immigration points
• Document changes in activity
• Document results of control efforts
• Separate sources of multiple infestations

Initial Indian Meal Moth Activity

Infestation Growing

Infestation Spreads Throughout Warehouse

After Treatment of Infestation Foci
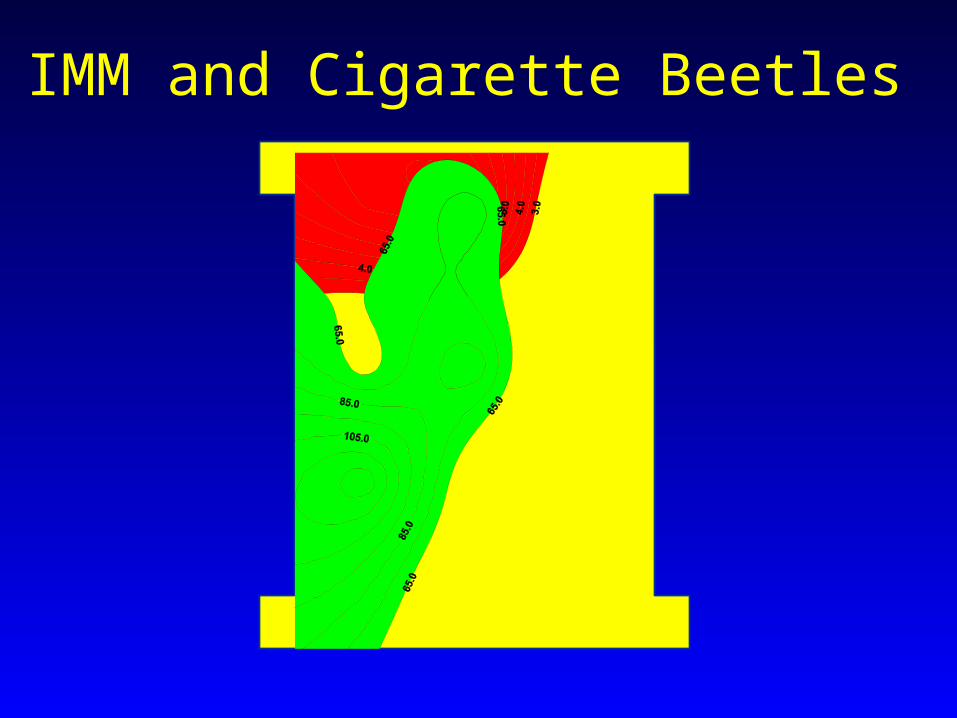
IMM and Cigarette Beetles

How Traps Affect Contour Map Accuracy
• More traps give better results• Zero captures are as important as traps that
capture insects• Traps that attract over longer distances will
make the maps less accurate. They will still give valuable information.
• Traps, used in mapping, should not be moved or shuffled

12 Traps 120 Traps

With Zeros Without Zeros

Probability Maps
• Sort traps by number of captures• Calculate the summary percentage
compared to total, ranking for each trap• Assign a value of “1” to each trap until the
75% level is reached• Assign a value of “0” to other traps• Grid the 0 and 1 values and generate a
contour map based on this grid
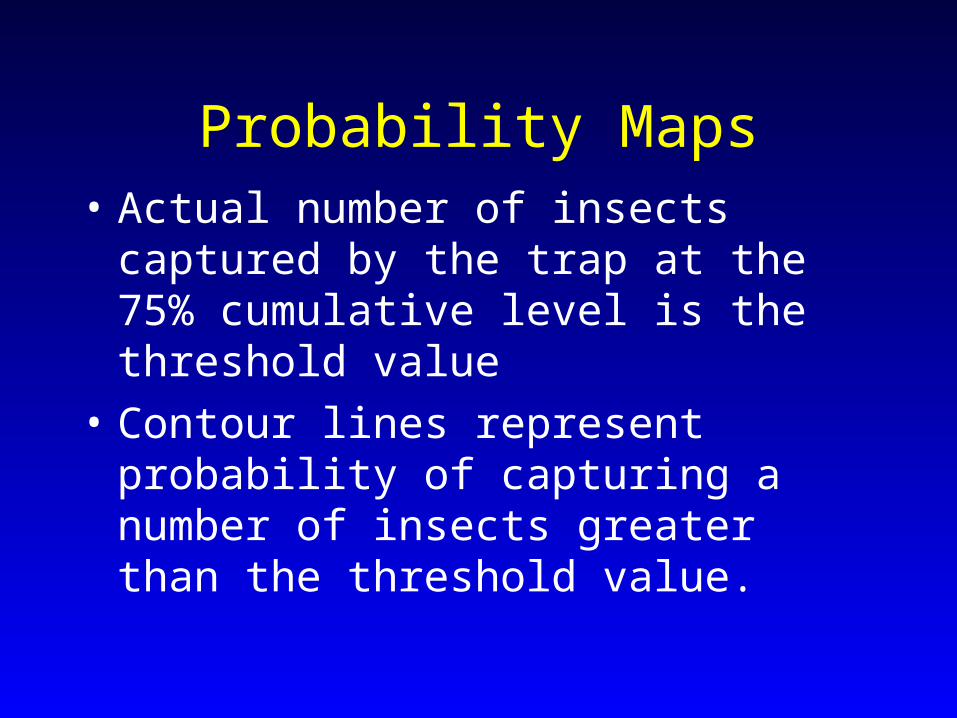
Probability Maps• Actual number of insects captured by the
trap at the 75% cumulative level is the threshold value
• Contour lines represent probability of capturing a number of insects greater than the threshold value.

Probability Map

Spatial Dynamics Index
• Subtracts consecutive probability values to create a new grid.
• Compares pest populations from one service to the next.
• Negative values indicate population decrease; positive values equal population increase; Zero values indicate no change
• Because values represent probabilities the magnitude of number has no meaning

Spatial Dynamics Index


Representation of Multi Level Trapping

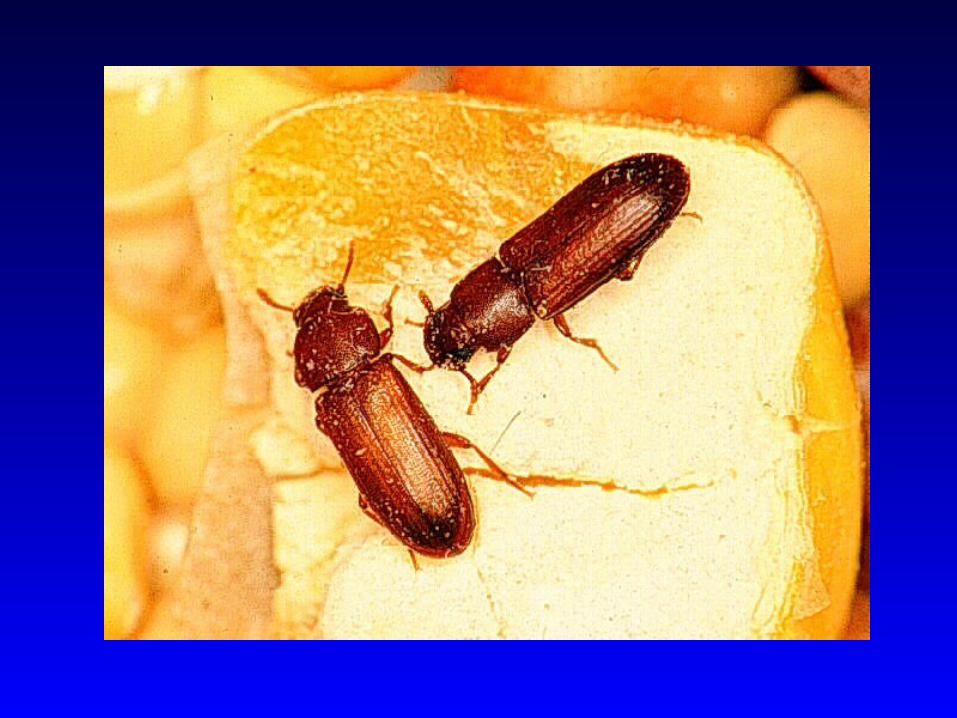

Red and Confused Flour Beetles
• Short range attraction; place close together near suspect product
• Must use a food attractant in combination with pheromone
• Use pitfall trap (Flitetrak M2) or Pantry Patrol• Not practical for routine monitoring of entire
facility; use near susceptible or suspect product
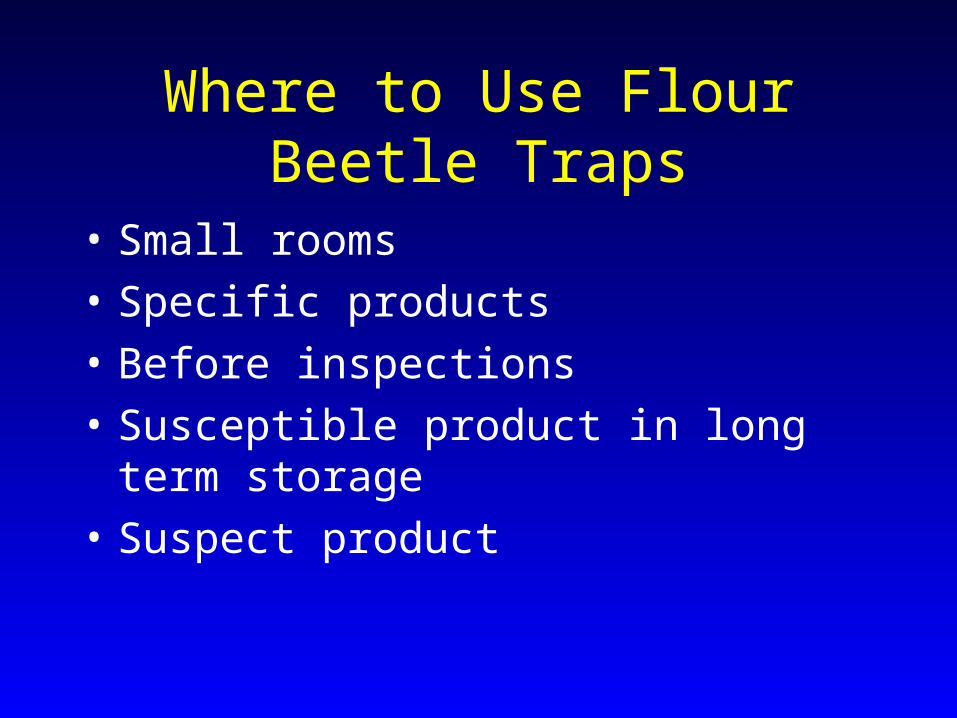
Where to Use Flour Beetle Traps
• Small rooms
• Specific products
• Before inspections
• Susceptible product in long term storage
• Suspect product

Pitfall Traps


Flour Beetle Traps in Electrical Room
0 5 10 15 20 25 30 35 40 45 50 550
5
10
15
20
25
30
35
40
45
1
2
3
4
5
6
7
8 9

0 5 10 15 20 25 30 35 40 45 50 550
5
10
15
20
25
30
35
40
45

Environmental Effects

7/2
6/9
5
8/1
0/9
5
8/2
3/9
5
9/1
3/9
5
9/2
7/9
5
10/
11/
95
10/
25/
95
11/
6/9
5
11/
22/
95
12/
13/
95
12/
27/
95
1/1
0/9
6
1/2
4/9
6
2/7
/96
2/2
1/9
6
3/6
/96
3/2
0/9
6
War
ehou
se T
empe
ratu
re
60
61
62
63
64
65
66
67
68
69
70
71
72
73
74
75
76
77
78
Tot
al M
oths
Cap
ture
d in
Tra
ps
0
10
20
30
40
50
60

Warehouse Temperature Pheromone Trap Captures

Summary• Contour maps help focus control measures• Contour mapping can detect the source of low-
level activity• Mapping of environmental factors can help
predict activity• Spatial dynamics index can quantify changes in
populations• Contour maps can help pinpoint sources of
immigration• Contour maps can track efficacy of treatments

Want to Know More?
Edward H. Isaaks and R. Mohan Srivastava. Applied Geostatistics, New York:Oxford University Press, 1989. Richard J. Brenner, Dana A. Focks, Richard T. Arbogast, David K. Weaver, and Dennis
Shuman. Practical Use of Spatial Analysis in Precision Targeting for Integrated Pest Management. Anonymous. Anonymous. American Entomologist 44(2):79-101, 1998. R. T. Arbogast, P. E. Kendra, R. W. Mankin, and J. E. McGovern. Monitoring insect
pests in retail stores by trapping and spatial analysis. Anonymous. Anonymous. Journal of Economic Entomology 93(5):1531-1542, 2000.
Related Documents