BioMed Central Page 1 of 15 (page number not for citation purposes) BMC Neurology Open Access Research article Reduced responsiveness is an essential feature of chronic fatigue syndrome: A fMRI study Masaaki Tanaka 1 , Norihiro Sadato 2,3 , Tomohisa Okada 2 , Kei Mizuno 1 , Tetsuya Sasabe 1,4 , Hiroki C Tanabe 2 , Daisuke N Saito 2 , Hirotaka Onoe 5 , Hirohiko Kuratsune 6 and Yasuyoshi Watanabe* 1,3 Address: 1 Department of Physiology, Osaka City University Graduate School of Medicine, 1-4-3 Asahimachi, Abeno-ku, Osaka 545-8585, Japan, 2 Division of Cerebral Integration, Department of Cerebral Research, National Institute for Physiological Sciences, 38 Nishigonaka, Myodaiji, Okazaki, Aichi 444-8585, Japan, 3 Japan Science and Technology Corporation (JST)/Research Institute of Science and Technology for Society (RISTEX), 4-1-8 Honcho, Kawaguchi, Saitama 332-0012, Japan, 4 Department of Oral Physiology, Osaka University Graduate School of Dentistry, 1-8 Yamadaoka, Suita, Osaka 565-0871, Japan, 5 Department of Psychology, Tokyo Metropolitan Institute for Neuroscience, 2-6 Musashidai, Fuchu, Tokyo 183-8526, Japan and 6 Department of Health Science, Faculty of Health Science for Welfare, Kansai University of Welfare Sciences, 3-11-1 Asahigaoka, Kashihara, Osaka 582-0026, Japan Email: Masaaki Tanaka - [email protected]; Norihiro Sadato - [email protected]; Tomohisa Okada - [email protected]; Kei Mizuno - [email protected]; Tetsuya Sasabe - [email protected]; Hiroki C Tanabe - [email protected]; Daisuke N Saito - [email protected]; Hirotaka Onoe - [email protected]; Hirohiko Kuratsune - [email protected]; Yasuyoshi Watanabe* - [email protected] * Corresponding author Abstract Background: Although the neural mechanism of chronic fatigue syndrome has been investigated by a number of researchers, it remains poorly understood. Methods: Using functional magnetic resonance imaging, we studied brain responsiveness in 6 male chronic fatigue syndrome patients and in 7 age-matched male healthy volunteers. Responsiveness of auditory cortices to transient, short- lived, noise reduction was measured while subjects performed a fatigue-inducing continual visual search task. Results: Responsiveness of the task-dependent brain regions was decreased after the fatigue-inducing task in the normal and chronic fatigue syndrome subjects and the decrement of the responsiveness was equivalent between the 2 groups. In contrast, during the fatigue-inducing period, although responsiveness of auditory cortices remained constant in the normal subjects, it was attenuated in the chronic fatigue syndrome patients. In addition, the rate of this attenuation was positively correlated with the subjective sensation of fatigue as measured using a fatigue visual analogue scale, immediately before the magnetic resonance imaging session. Conclusion: Chronic fatigue syndrome may be characterised by attenuation of the responsiveness to stimuli not directly related to the fatigue-inducing task. Background Chronic fatigue syndrome (CFS) is a disorder character- ised by profound disabling fatigue that persists for at least 6 months without relief and is not lessened by ordinary rest [1]. Patients with CFS have substantial impairment of functional status, resulting in significant personal and economic morbidity [2,3]. Several symptoms reported by CFS patients, including impaired concentration, atten- Published: 22 February 2006 BMC Neurology 2006, 6:9 doi:10.1186/1471-2377-6-9 Received: 15 November 2005 Accepted: 22 February 2006 This article is available from: http://www.biomedcentral.com/1471-2377/6/9 © 2006 Tanaka et al; licensee BioMed Central Ltd. This is an Open Access article distributed under the terms of the Creative Commons Attribution License (http://creativecommons.org/licenses/by/2.0 ), which permits unrestricted use, distribution, and reproduction in any medium, provided the original work is properly cited.

Welcome message from author
This document is posted to help you gain knowledge. Please leave a comment to let me know what you think about it! Share it to your friends and learn new things together.
Transcript
BioMed CentralBMC Neurology
ss
Open AcceResearch articleReduced responsiveness is an essential feature of chronic fatigue syndrome: A fMRI studyMasaaki Tanaka1, Norihiro Sadato2,3, Tomohisa Okada2, Kei Mizuno1, Tetsuya Sasabe1,4, Hiroki C Tanabe2, Daisuke N Saito2, Hirotaka Onoe5, Hirohiko Kuratsune6 and Yasuyoshi Watanabe*1,3Address: 1Department of Physiology, Osaka City University Graduate School of Medicine, 1-4-3 Asahimachi, Abeno-ku, Osaka 545-8585, Japan, 2Division of Cerebral Integration, Department of Cerebral Research, National Institute for Physiological Sciences, 38 Nishigonaka, Myodaiji, Okazaki, Aichi 444-8585, Japan, 3Japan Science and Technology Corporation (JST)/Research Institute of Science and Technology for Society (RISTEX), 4-1-8 Honcho, Kawaguchi, Saitama 332-0012, Japan, 4Department of Oral Physiology, Osaka University Graduate School of Dentistry, 1-8 Yamadaoka, Suita, Osaka 565-0871, Japan, 5Department of Psychology, Tokyo Metropolitan Institute for Neuroscience, 2-6 Musashidai, Fuchu, Tokyo 183-8526, Japan and 6Department of Health Science, Faculty of Health Science for Welfare, Kansai University of Welfare Sciences, 3-11-1 Asahigaoka, Kashihara, Osaka 582-0026, Japan
Email: Masaaki Tanaka - [email protected]; Norihiro Sadato - [email protected]; Tomohisa Okada - [email protected]; Kei Mizuno - [email protected]; Tetsuya Sasabe - [email protected]; Hiroki C Tanabe - [email protected]; Daisuke N Saito - [email protected]; Hirotaka Onoe - [email protected]; Hirohiko Kuratsune - [email protected]; Yasuyoshi Watanabe* - [email protected]
* Corresponding author
AbstractBackground: Although the neural mechanism of chronic fatigue syndrome has been investigated by a number ofresearchers, it remains poorly understood.
Methods: Using functional magnetic resonance imaging, we studied brain responsiveness in 6 male chronic fatiguesyndrome patients and in 7 age-matched male healthy volunteers. Responsiveness of auditory cortices to transient, short-lived, noise reduction was measured while subjects performed a fatigue-inducing continual visual search task.
Results: Responsiveness of the task-dependent brain regions was decreased after the fatigue-inducing task in the normaland chronic fatigue syndrome subjects and the decrement of the responsiveness was equivalent between the 2 groups.In contrast, during the fatigue-inducing period, although responsiveness of auditory cortices remained constant in thenormal subjects, it was attenuated in the chronic fatigue syndrome patients. In addition, the rate of this attenuation waspositively correlated with the subjective sensation of fatigue as measured using a fatigue visual analogue scale, immediatelybefore the magnetic resonance imaging session.
Conclusion: Chronic fatigue syndrome may be characterised by attenuation of the responsiveness to stimuli not directlyrelated to the fatigue-inducing task.
BackgroundChronic fatigue syndrome (CFS) is a disorder character-ised by profound disabling fatigue that persists for at least6 months without relief and is not lessened by ordinary
rest [1]. Patients with CFS have substantial impairment offunctional status, resulting in significant personal andeconomic morbidity [2,3]. Several symptoms reported byCFS patients, including impaired concentration, atten-
Published: 22 February 2006
BMC Neurology 2006, 6:9 doi:10.1186/1471-2377-6-9
Received: 15 November 2005Accepted: 22 February 2006
This article is available from: http://www.biomedcentral.com/1471-2377/6/9
© 2006 Tanaka et al; licensee BioMed Central Ltd. This is an Open Access article distributed under the terms of the Creative Commons Attribution License (http://creativecommons.org/licenses/by/2.0), which permits unrestricted use, distribution, and reproduction in any medium, provided the original work is properly cited.
Page 1 of 15(page number not for citation purposes)

BMC Neurology 2006, 6:9 http://www.biomedcentral.com/1471-2377/6/9
tion, and memory abilities [4,5], suggest that central nerv-ous system (CNS) may be involved in thepathophysiology of CFS.
Magnetic resonance imaging (MRI) studies have shownanatomical anomalies of cortical [6,7] and subcortical [8-10] brain regions of CFS patients. Other studies using sin-gle-photon emission computed tomography have dem-onstrated reduced regional cerebral blood flowthroughout the brain of CFS patients [11,12]. A positronemission tomography study confirmed reduced level ofcerebral blood flow [13], and CFS patients also showedreduced cerebral glucose metabolism in some brainregions [14,15]. Therefore, overall, neuroimaging studiesare generally consistent in demonstrating abnormalitiesof CNS in CFS patients.
Functional magnetic resonance imaging (fMRI) studieshave also shown abnormal neuroimaging data in CFSpatients. During motor imagery task, CFS patients evokedstronger responses in visually related structures relative tonormal subjects [16]. When complex auditory informa-tion processing was required, CFS patients utilised moreextensive regions of the network associated with verbalworking memory system than normal subjects [17]. Thus,pattern of BOLD signal change of CFS subjects may be areflection of the networks operation under conditions ofincreased mental effort [18-21] in order to overcome theexperience of mental fatigue [17].
These previous studies only focused on static changeunder the condition without fatigue-load. Responsivenesscan be defined as BOLD signal change responded by somestimuli in each brain region as measured using fMRI, andamplitudes of motor evoked potential elicited by transcra-nial magnetic stimulation were transiently decreased afterexercise, indicating fatigue of motor pathways in the CNS[22]. Accordingly, CNS fatigue may induce reducedresponsiveness. We hypothesised that, since CFS patientsshow marked fatigability in their daily activities, reducedresponsiveness would be seen during fatigue-inducingperiod. Therefore, for further clarification of the neuralmechanism of CFS, it may be essential to investigate brainresponsiveness of CFS patients during a fatigue-load.
fMRI studies on human normal volunteers have demon-strated that continual visual stimuli from flashing gogglescauses a decrease in signal intensity in the visual cortex[23-25], and that odorant-induced activity in the olfactorycortex decreases following prolonged odorant stimuli[26,27]. There is a problem to utilise these tasks as fatigue-inducing ones, since, in these studies, it is not clearwhether subjects felt fatigue sensation during continualstimulation tasks. Therefore, we selected a task by whichsubjects could have fatigue sensation: A prolonged contin-
ual visual search task. This task was modified one ofAdvanced Trail Making Test, which can assess the degreeof fatigue [28]. Many workers feel fatigue sensation byperforming long-time personal computer works. Accord-ingly, fatigue-inducing visual search task was simulated tofatigue-inducing daily office works.
Fatigue can be induced without task-specific manner. Inaddition, responsiveness of task-dependent brain regionsmay be modulated by some confounds (e.g., mentalefforts, attention, or learning). Thus, in order to clarify theneural mechanism of CFS using fMRI, it may be insuffi-cient to evaluate the responsiveness of only task-depend-ent brain regions; since responsiveness of task-independent brain regions is not influenced by those con-founds, it may also be necessary to evaluate the respon-siveness of task-independent brain regions. However, thiswas difficult to achieve using fMRI. Recently, we estab-lished a new method to obtain the responsiveness of audi-tory cortices by transient reduction of the fMRIacquisition noise [29]. This can be used to monitor theresponsiveness of the auditory cortices simultaneously toactivation by other non-auditory tasks, facilitating evalua-tion of a cross-modal interaction. Therefore, by using thismethod, we may be able to evaluate the responsiveness ofboth task-independent and task-dependent brain regionswhile subjects conduct a fatigue-inducing task. We evalu-ated the responsiveness of task-independent and -depend-ent brain regions simultaneously during a fatigue-inducing visual search task in normal and CFS patientsgroups using a 3.0 tesla MR scanner.
MethodsSubjectsThe patient group consisted of 7 men with CFS (age, 30.4± 4.8 years; mean ± SD). All values are expressed as mean± SD, unless described elsewhere. They were outpatientsof the Department of Hematology and Oncology of OsakaUniversity. A diagnosis of CFS was made based on clinicalcriteria proposed previously [1]. None of these patientswere able to carry out normal occupational, educational,social, or personal activities more than 2 days a weekbecause of severe fatigue sensation. Duration of CFS was24.2 ± 15.7 months. CFS patients who manifested psychi-atric comorbidity (e.g. depression) were excluded fromthe study. Seven age-matched healthy male volunteers(26.1 ± 6.3 years of age) were recruited as a control. Therewas no history of psychiatric or neurological illnessamong the normal subjects. None of the normal or CFSsubjects were taking medication known to affect cerebralblood flow, all had normal auditory function, and theywere all right-handed according to the Edinburgh handed-ness inventory [30]. We excluded data of 1 CFS patientfrom the analyses on the basis of difficulties related to taskperformance. The research protocol was approved by the
Page 2 of 15(page number not for citation purposes)
BMC Neurology 2006, 6:9 http://www.biomedcentral.com/1471-2377/6/9
ethics committee of the National Institute for Physiologi-cal Sciences, and all subjects gave their written informedconsent for the study.
TaskBefore the fMRI experiments, all subjects completed visualsearch tasks 3 times, for 6 min each, to evaluate theircapacity to perform this task. The number of targets usedin the visual search tasks in the subsequent fMRI experi-ments was determined separately for each individualbased on their performance in the pre-imaging visualsearch tasks, thus minimizing possible confoundingeffects of a difference in task difficulty among the subjects.We determined the number of targets for which subjectscould provide correct answers to visual search trials inapproximately 90% of cases. The number of targets was22.6 ± 2.0 for the normal subjects, whereas that was 19.0± 1.3 for the CFS patients. During experiments, subjectsperformed "present", "absent", or "null" trials (Figure 1),and the experiments consisted of 3 sessions: pre-fatigue,
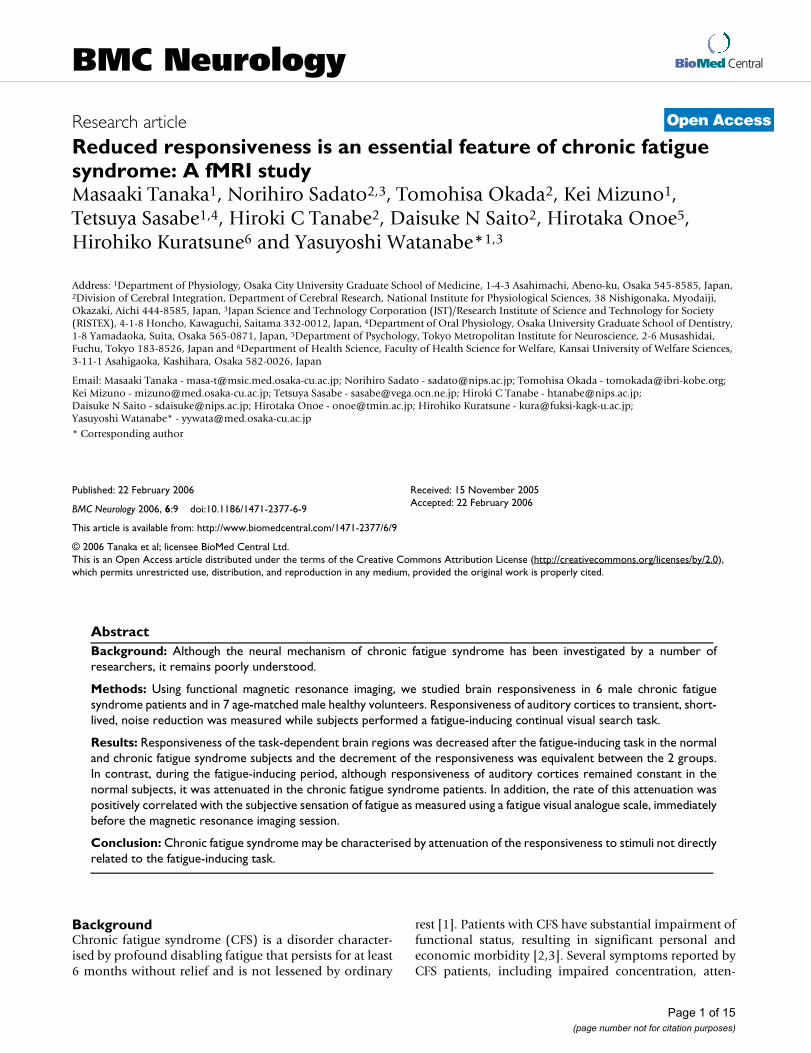
fatigue, and post-fatigue sessions (Figure 2). Each sessionincluded 2 or 3 experimental conditions: "present" and"absent" trials or "present", "absent", and "null" trials. Forpresent and absent trials, a randomly selected digit from20 to 99 was presented on the centre of the viewing screenfor 500 ms, followed by a test sequence of digits (targets)presented for 3,500 ms. In a given trial, subjects judgedwhether the digit first presented was among the targets. Ifthey thought the presented target digit matched the firstdigit, subjects should press the left button (present trial);if not, they should press the right button (absent trial).There was no time interval between trials. For the nulltrial, the word "NULL" was presented on the centre of theviewing screen for 500 ms, followed by a test sequencepresented for 3,500 ms. Subjects judged whether therewas a black circle among the white circles. When a blackcircle was presented among the white ones, subjectsshould press the left button; and when all of the circleswere white, they should press the right button. Subjectsperformed pre-fatigue, fatigue, and post-fatigue sessions
Time course of the stimulus display sequence of the task trialsFigure 1Time course of the stimulus display sequence of the task trials. For present and absent trials, a randomly selected digit from 20 to 99 was presented on the centre of the viewing screen for 500 ms, followed by a test sequence of digits (targets) presented for 3,500 ms. In a given trial, subjects judged whether the digit first presented was among the targets. If they believed the pre-sented target digit matched the first digit, subjects pressed the left button (present trial); if not, they pressed the right button (absent trial). There was no time interval between trials. For the null trial, the word "NULL" was presented on the centre of the viewing screen for 500 ms, followed by a test sequence presented for 3,500 ms. Subjects judged whether there was a black circle among the white circles. When a black circle was present among the white ones, subjects pressed the left button; and when all of the circles were white, they pressed the right button. There was no time interval between the trials.
Cue Test
33
5932
32
93
71 83
36
72
2944
9382
49
24
64
53
53
NEXT ButtonPresent trial
Visual search trials
54
33
5932
32
93
71 83
36
72
2944
9382
49
24
6453
NEXT ButtonAbsent trial
500 ms
Null trial (Present)NULL 71
NEXT
NULL 71
NEXT
Button
Null trials
ButtonNull trial (Absent)
3500 ms
Time
Page 3 of 15(page number not for citation purposes)
BMC Neurology 2006, 6:9 http://www.biomedcentral.com/1471-2377/6/9
lying on the MRI scanner table with both ears plugged.The time interval between 2 successive sessions wasapproximately 1 min. We determined session time offatigue-inducing period from the preliminary studies. Forthe fatigue session (fatigue-inducing period), normal sub-jects performed visual search trials (present or absent tri-als) for 1 hour. After considering the physical and mentalcondition of the CFS patients, we determined that 30 minwas a suitable period for these patients to perform the tri-als. During the fatigue-inducing period, present or absenttrials were given randomly and the occurrence of each trialwas equal. Also during this period, only continual visualsearch trials were performed; null trials were not includedas they might have enabled subjects to recover fromfatigue to some extent. During the pre- and post-fatiguesessions, present, absent, and null trials were presentedrandomly, and the occurrence of each trial was equal. Inthe pre- or post-fatigue sessions, subjects performed trialsfor 6 min. During scanning, stimuli were generated by apersonal computer and projected onto a semitransparentscreen from a liquid crystal display projector (DLA-M200L, Victor, Yokohama, Japan). The subjects saw thestimuli through a tilted mirror attached to the head coil ofthe scanner. The visual angle of each target used as a stim-ulus was approximately 1°. Immediately before and after
the MRI experiments, subjects were asked to rate their sub-jective sensation of fatigue on the visual analogue scale(VAS) from 0 (no fatigue) to 10 (total exhaustion) [31].
Magnetic resonance imagingA time-course series of 364 (pre- and post-fatigue ses-sions), 1,804 (fatigue-inducing period for the CFS sub-jects), or 3,604 (fatigue-inducing period for the normalsubjects) volumes were acquired using T2-weighted, gra-dient echo, echo planar imaging (EPI) sequences with a3.0 tesla MR imager (Allegra; Siemens, Erlangen, Ger-many). Each volume consisted of 16 slices, each having athickness of 6.0 mm, with a 1.2-mm gap between slices, toinclude the entire brain. The following parameters wereused: time-interval, 1,000 ms; echo time, 30 ms; flip angle(FA), 60°; field of view (FOV), 19.2 cm; in-plane matrixsize, 64 × 64 pixels; pixel dimensions, 3.0 × 3.0 mm. Mag-netic shim was optimised so that a true in-plane resolu-tion of 3.0 × 3.0 mm was realised. Tight but comfortablefoam padding was placed around the subject's head tominimize head movement. For anatomical reference, T1-weighted fast-spin echo images (time-interval, 1,460 ms;echo time, 4.88 ms; FA, 8°; FOV, 19.2 cm; in-plane reso-lution, 0.9 × 0.8 mm; slice thickness, 3.6 mm; 16 axialslices covering the entire brain) were obtained from each
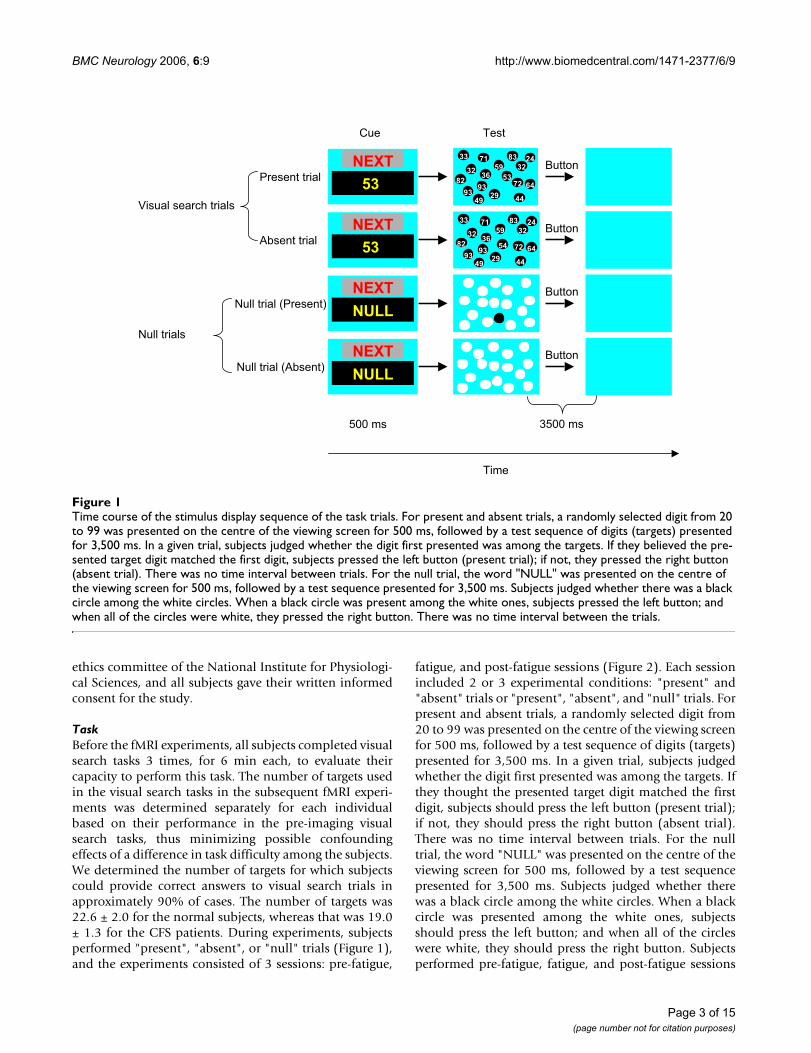
Experimental procedureFigure 2Experimental procedure. Experiment included 3 sessions: Pre-fatigue, fatigue, and post-fatigue sessions. Subjects performed pre-fatigue, fatigue, and post-fatigue sessions lying on the MRI scanner table with both ears plugged. The time interval between 2 successive sessions was 1 min. For the fatigue session (fatigue-inducing period), normal subjects performed visual search trials (present or absent trials) for 1 hour, while CFS patients performed visual search trials for 30 min. During this period, continual visual search trials were performed; null trials were not included. In the pre- or post-fatigue sessions, subjects performed visual search or null trials for 6 min.
Time Time Time
53
NEXT
NULL 71
NEXT
29
NEXT
NULL 71
NEXT
72
NEXT
NULL
NEXT
54
NEXT
NULL
NEXT
83
NEXT
49
NEXT
42
NEXT
31
NEXT
4 s 4 s 4 s
Pre-fatigue session Interval Fatigue session Interval Post-fatigue session
1 min 6 min6 min 1 min 1 hr or 30 min
Page 4 of 15(page number not for citation purposes)
BMC Neurology 2006, 6:9 http://www.biomedcentral.com/1471-2377/6/9
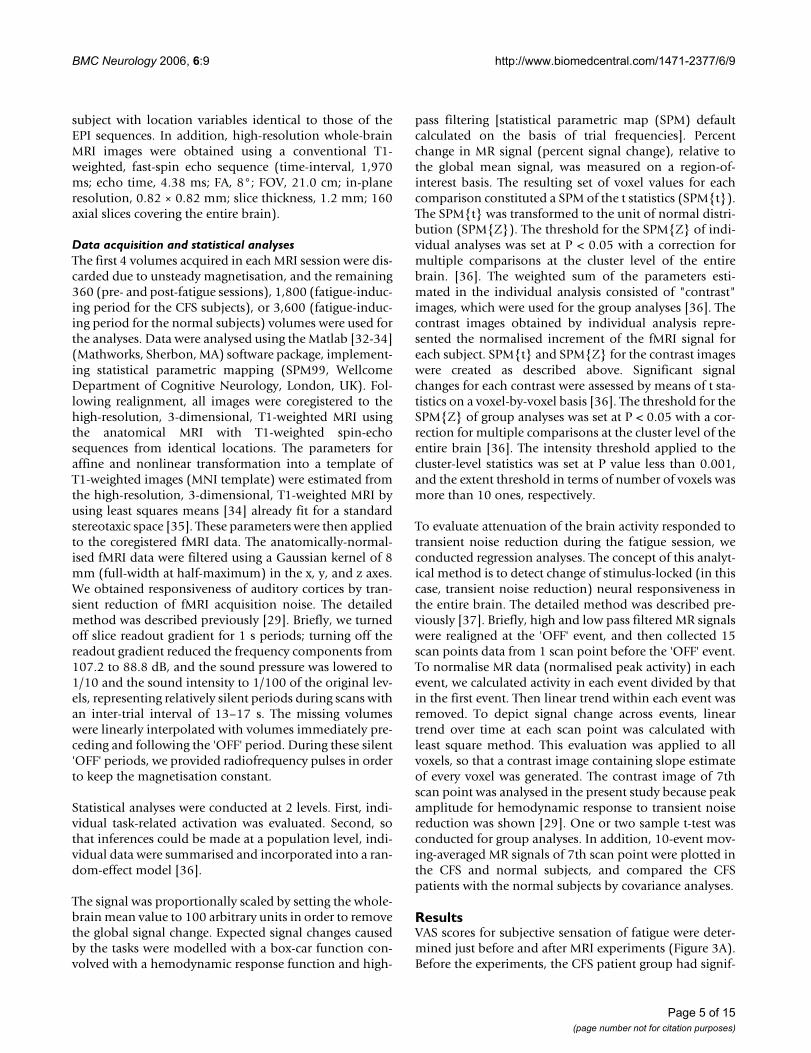
subject with location variables identical to those of theEPI sequences. In addition, high-resolution whole-brainMRI images were obtained using a conventional T1-weighted, fast-spin echo sequence (time-interval, 1,970ms; echo time, 4.38 ms; FA, 8°; FOV, 21.0 cm; in-planeresolution, 0.82 × 0.82 mm; slice thickness, 1.2 mm; 160axial slices covering the entire brain).
Data acquisition and statistical analysesThe first 4 volumes acquired in each MRI session were dis-carded due to unsteady magnetisation, and the remaining360 (pre- and post-fatigue sessions), 1,800 (fatigue-induc-ing period for the CFS subjects), or 3,600 (fatigue-induc-ing period for the normal subjects) volumes were used forthe analyses. Data were analysed using the Matlab [32-34](Mathworks, Sherbon, MA) software package, implement-ing statistical parametric mapping (SPM99, WellcomeDepartment of Cognitive Neurology, London, UK). Fol-lowing realignment, all images were coregistered to thehigh-resolution, 3-dimensional, T1-weighted MRI usingthe anatomical MRI with T1-weighted spin-echosequences from identical locations. The parameters foraffine and nonlinear transformation into a template ofT1-weighted images (MNI template) were estimated fromthe high-resolution, 3-dimensional, T1-weighted MRI byusing least squares means [34] already fit for a standardstereotaxic space [35]. These parameters were then appliedto the coregistered fMRI data. The anatomically-normal-ised fMRI data were filtered using a Gaussian kernel of 8mm (full-width at half-maximum) in the x, y, and z axes.We obtained responsiveness of auditory cortices by tran-sient reduction of fMRI acquisition noise. The detailedmethod was described previously [29]. Briefly, we turnedoff slice readout gradient for 1 s periods; turning off thereadout gradient reduced the frequency components from107.2 to 88.8 dB, and the sound pressure was lowered to1/10 and the sound intensity to 1/100 of the original lev-els, representing relatively silent periods during scans withan inter-trial interval of 13–17 s. The missing volumeswere linearly interpolated with volumes immediately pre-ceding and following the 'OFF' period. During these silent'OFF' periods, we provided radiofrequency pulses in orderto keep the magnetisation constant.
Statistical analyses were conducted at 2 levels. First, indi-vidual task-related activation was evaluated. Second, sothat inferences could be made at a population level, indi-vidual data were summarised and incorporated into a ran-dom-effect model [36].
The signal was proportionally scaled by setting the whole-brain mean value to 100 arbitrary units in order to removethe global signal change. Expected signal changes causedby the tasks were modelled with a box-car function con-volved with a hemodynamic response function and high-
pass filtering [statistical parametric map (SPM) defaultcalculated on the basis of trial frequencies]. Percentchange in MR signal (percent signal change), relative tothe global mean signal, was measured on a region-of-interest basis. The resulting set of voxel values for eachcomparison constituted a SPM of the t statistics (SPM{t}).The SPM{t} was transformed to the unit of normal distri-bution (SPM{Z}). The threshold for the SPM{Z} of indi-vidual analyses was set at P < 0.05 with a correction formultiple comparisons at the cluster level of the entirebrain. [36]. The weighted sum of the parameters esti-mated in the individual analysis consisted of "contrast"images, which were used for the group analyses [36]. Thecontrast images obtained by individual analysis repre-sented the normalised increment of the fMRI signal foreach subject. SPM{t} and SPM{Z} for the contrast imageswere created as described above. Significant signalchanges for each contrast were assessed by means of t sta-tistics on a voxel-by-voxel basis [36]. The threshold for theSPM{Z} of group analyses was set at P < 0.05 with a cor-rection for multiple comparisons at the cluster level of theentire brain [36]. The intensity threshold applied to thecluster-level statistics was set at P value less than 0.001,and the extent threshold in terms of number of voxels wasmore than 10 ones, respectively.
To evaluate attenuation of the brain activity responded totransient noise reduction during the fatigue session, weconducted regression analyses. The concept of this analyt-ical method is to detect change of stimulus-locked (in thiscase, transient noise reduction) neural responsiveness inthe entire brain. The detailed method was described pre-viously [37]. Briefly, high and low pass filtered MR signalswere realigned at the 'OFF' event, and then collected 15scan points data from 1 scan point before the 'OFF' event.To normalise MR data (normalised peak activity) in eachevent, we calculated activity in each event divided by thatin the first event. Then linear trend within each event wasremoved. To depict signal change across events, lineartrend over time at each scan point was calculated withleast square method. This evaluation was applied to allvoxels, so that a contrast image containing slope estimateof every voxel was generated. The contrast image of 7thscan point was analysed in the present study because peakamplitude for hemodynamic response to transient noisereduction was shown [29]. One or two sample t-test wasconducted for group analyses. In addition, 10-event mov-ing-averaged MR signals of 7th scan point were plotted inthe CFS and normal subjects, and compared the CFSpatients with the normal subjects by covariance analyses.
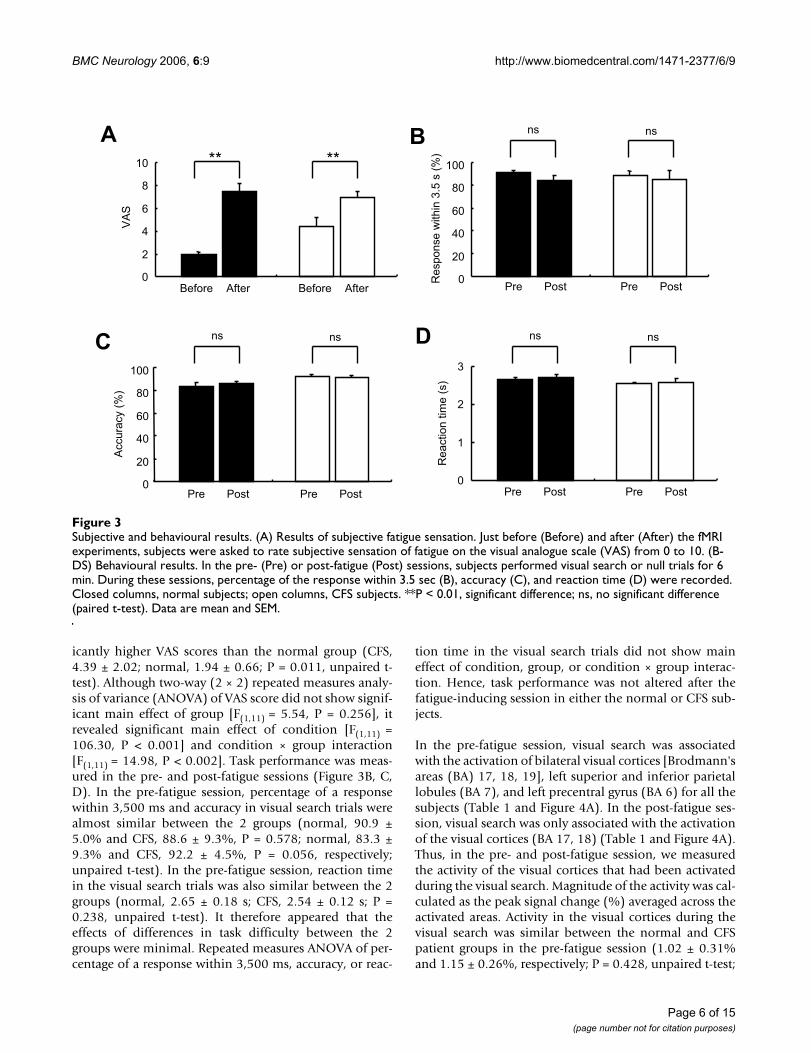
ResultsVAS scores for subjective sensation of fatigue were deter-mined just before and after MRI experiments (Figure 3A).Before the experiments, the CFS patient group had signif-
Page 5 of 15(page number not for citation purposes)
BMC Neurology 2006, 6:9 http://www.biomedcentral.com/1471-2377/6/9
icantly higher VAS scores than the normal group (CFS,4.39 ± 2.02; normal, 1.94 ± 0.66; P = 0.011, unpaired t-test). Although two-way (2 × 2) repeated measures analy-sis of variance (ANOVA) of VAS score did not show signif-icant main effect of group [F(1,11) = 5.54, P = 0.256], itrevealed significant main effect of condition [F(1,11) =106.30, P < 0.001] and condition × group interaction[F(1,11) = 14.98, P < 0.002]. Task performance was meas-ured in the pre- and post-fatigue sessions (Figure 3B, C,D). In the pre-fatigue session, percentage of a responsewithin 3,500 ms and accuracy in visual search trials werealmost similar between the 2 groups (normal, 90.9 ±5.0% and CFS, 88.6 ± 9.3%, P = 0.578; normal, 83.3 ±9.3% and CFS, 92.2 ± 4.5%, P = 0.056, respectively;unpaired t-test). In the pre-fatigue session, reaction timein the visual search trials was also similar between the 2groups (normal, 2.65 ± 0.18 s; CFS, 2.54 ± 0.12 s; P =0.238, unpaired t-test). It therefore appeared that theeffects of differences in task difficulty between the 2groups were minimal. Repeated measures ANOVA of per-centage of a response within 3,500 ms, accuracy, or reac-
tion time in the visual search trials did not show maineffect of condition, group, or condition × group interac-tion. Hence, task performance was not altered after thefatigue-inducing session in either the normal or CFS sub-jects.
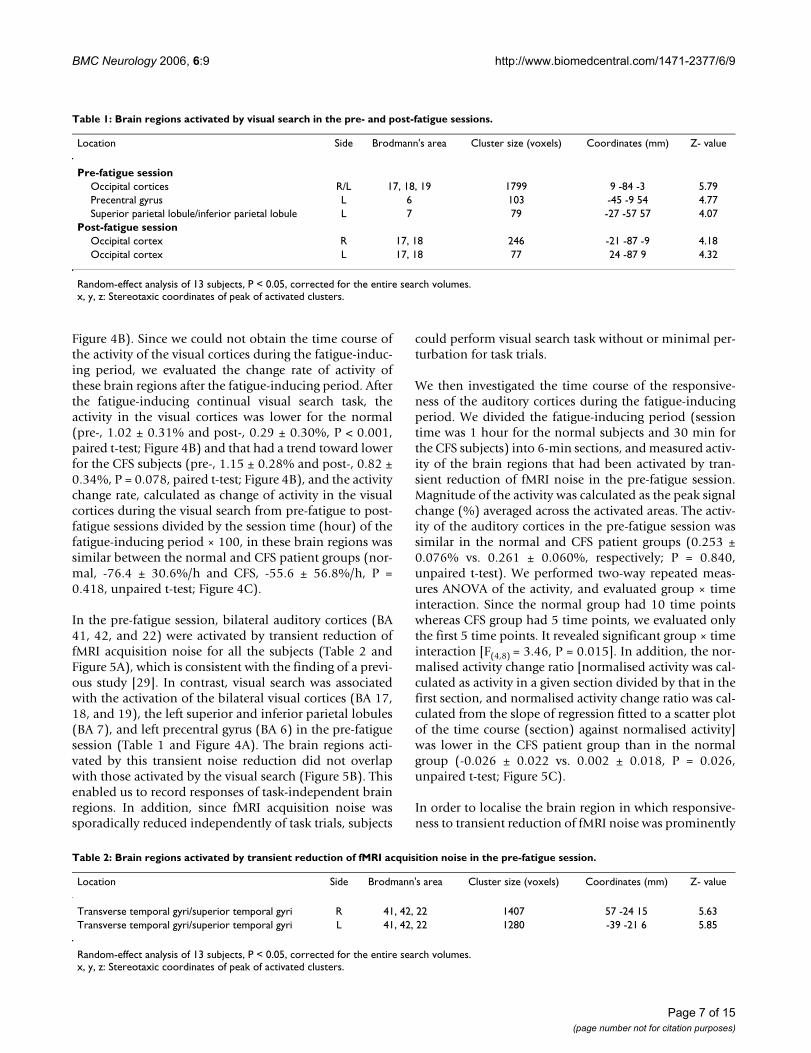
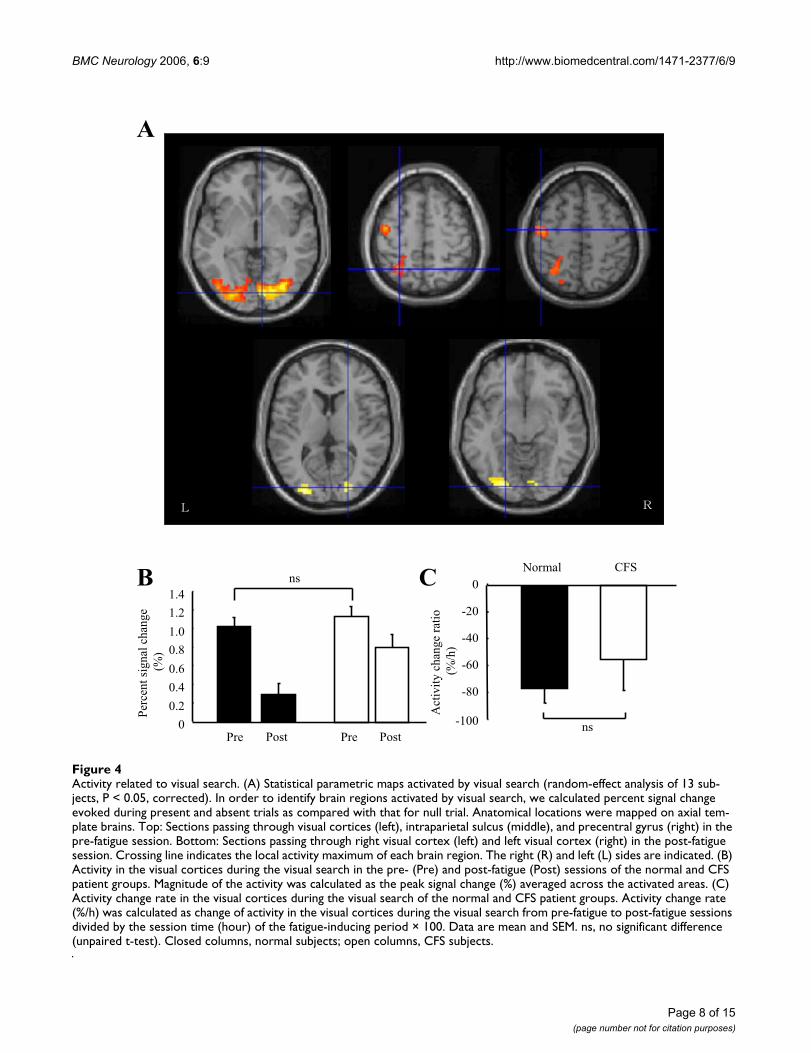
In the pre-fatigue session, visual search was associatedwith the activation of bilateral visual cortices [Brodmann'sareas (BA) 17, 18, 19], left superior and inferior parietallobules (BA 7), and left precentral gyrus (BA 6) for all thesubjects (Table 1 and Figure 4A). In the post-fatigue ses-sion, visual search was only associated with the activationof the visual cortices (BA 17, 18) (Table 1 and Figure 4A).Thus, in the pre- and post-fatigue session, we measuredthe activity of the visual cortices that had been activatedduring the visual search. Magnitude of the activity was cal-culated as the peak signal change (%) averaged across theactivated areas. Activity in the visual cortices during thevisual search was similar between the normal and CFSpatient groups in the pre-fatigue session (1.02 ± 0.31%and 1.15 ± 0.26%, respectively; P = 0.428, unpaired t-test;
Subjective and behavioural resultsFigure 3Subjective and behavioural results. (A) Results of subjective fatigue sensation. Just before (Before) and after (After) the fMRI experiments, subjects were asked to rate subjective sensation of fatigue on the visual analogue scale (VAS) from 0 to 10. (B-DS) Behavioural results. In the pre- (Pre) or post-fatigue (Post) sessions, subjects performed visual search or null trials for 6 min. During these sessions, percentage of the response within 3.5 sec (B), accuracy (C), and reaction time (D) were recorded. Closed columns, normal subjects; open columns, CFS subjects. **P < 0.01, significant difference; ns, no significant difference (paired t-test). Data are mean and SEM.
A Bns
C
After
D
0
20
40
60
Response w
ithin
3.5
s (
%)
ns
0
2
4
6
8
10
0
20
40
60
Accura
cy (
%) 80
100
Before After Before
Pre Post Pre Post
VA
S
** **
0
1
2
3
Pre Post Pre Post
Re
action t
ime
(s)
ns ns
ns
100
80
Pre Post Pre Post
ns
Page 6 of 15(page number not for citation purposes)
BMC Neurology 2006, 6:9 http://www.biomedcentral.com/1471-2377/6/9
Figure 4B). Since we could not obtain the time course ofthe activity of the visual cortices during the fatigue-induc-ing period, we evaluated the change rate of activity ofthese brain regions after the fatigue-inducing period. Afterthe fatigue-inducing continual visual search task, theactivity in the visual cortices was lower for the normal(pre-, 1.02 ± 0.31% and post-, 0.29 ± 0.30%, P < 0.001,paired t-test; Figure 4B) and that had a trend toward lowerfor the CFS subjects (pre-, 1.15 ± 0.28% and post-, 0.82 ±0.34%, P = 0.078, paired t-test; Figure 4B), and the activitychange rate, calculated as change of activity in the visualcortices during the visual search from pre-fatigue to post-fatigue sessions divided by the session time (hour) of thefatigue-inducing period × 100, in these brain regions wassimilar between the normal and CFS patient groups (nor-mal, -76.4 ± 30.6%/h and CFS, -55.6 ± 56.8%/h, P =0.418, unpaired t-test; Figure 4C).
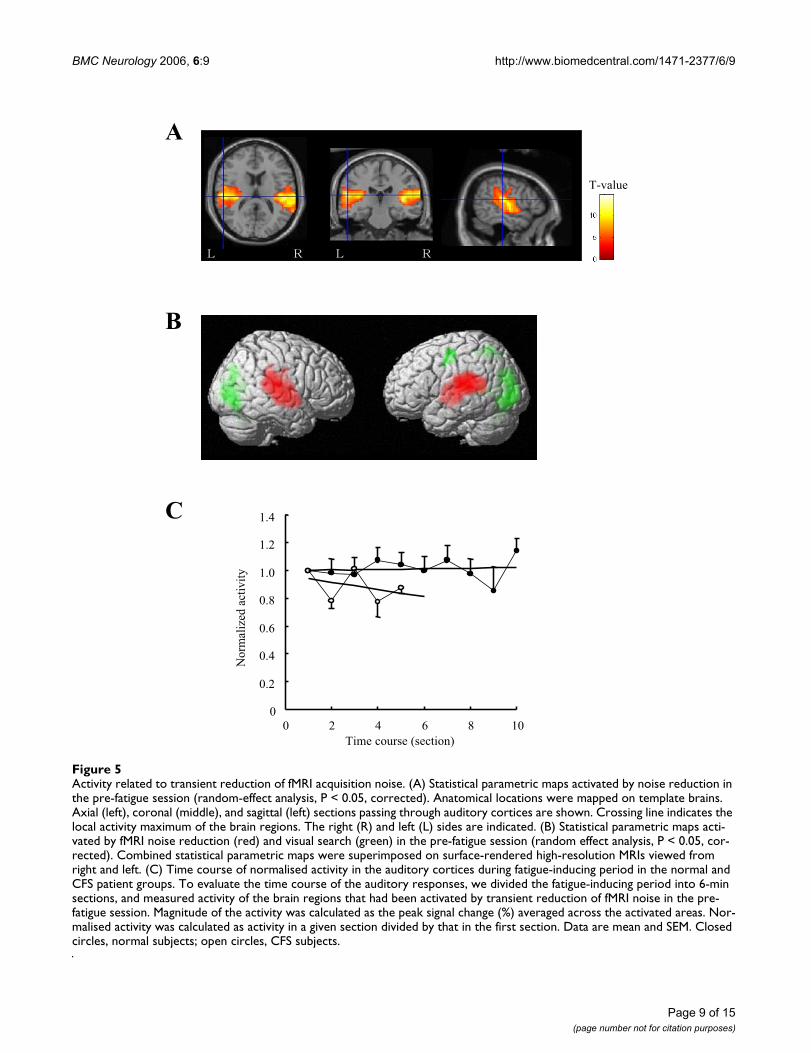
In the pre-fatigue session, bilateral auditory cortices (BA41, 42, and 22) were activated by transient reduction offMRI acquisition noise for all the subjects (Table 2 andFigure 5A), which is consistent with the finding of a previ-ous study [29]. In contrast, visual search was associatedwith the activation of the bilateral visual cortices (BA 17,18, and 19), the left superior and inferior parietal lobules(BA 7), and left precentral gyrus (BA 6) in the pre-fatiguesession (Table 1 and Figure 4A). The brain regions acti-vated by this transient noise reduction did not overlapwith those activated by the visual search (Figure 5B). Thisenabled us to record responses of task-independent brainregions. In addition, since fMRI acquisition noise wassporadically reduced independently of task trials, subjects
could perform visual search task without or minimal per-turbation for task trials.
We then investigated the time course of the responsive-ness of the auditory cortices during the fatigue-inducingperiod. We divided the fatigue-inducing period (sessiontime was 1 hour for the normal subjects and 30 min forthe CFS subjects) into 6-min sections, and measured activ-ity of the brain regions that had been activated by tran-sient reduction of fMRI noise in the pre-fatigue session.Magnitude of the activity was calculated as the peak signalchange (%) averaged across the activated areas. The activ-ity of the auditory cortices in the pre-fatigue session wassimilar in the normal and CFS patient groups (0.253 ±0.076% vs. 0.261 ± 0.060%, respectively; P = 0.840,unpaired t-test). We performed two-way repeated meas-ures ANOVA of the activity, and evaluated group × timeinteraction. Since the normal group had 10 time pointswhereas CFS group had 5 time points, we evaluated onlythe first 5 time points. It revealed significant group × timeinteraction [F(4,8) = 3.46, P = 0.015]. In addition, the nor-malised activity change ratio [normalised activity was cal-culated as activity in a given section divided by that in thefirst section, and normalised activity change ratio was cal-culated from the slope of regression fitted to a scatter plotof the time course (section) against normalised activity]was lower in the CFS patient group than in the normalgroup (-0.026 ± 0.022 vs. 0.002 ± 0.018, P = 0.026,unpaired t-test; Figure 5C).
In order to localise the brain region in which responsive-ness to transient reduction of fMRI noise was prominently
Table 1: Brain regions activated by visual search in the pre- and post-fatigue sessions.
Location Side Brodmann's area Cluster size (voxels) Coordinates (mm) Z- value
Pre-fatigue sessionOccipital cortices R/L 17, 18, 19 1799 9 -84 -3 5.79Precentral gyrus L 6 103 -45 -9 54 4.77Superior parietal lobule/inferior parietal lobule L 7 79 -27 -57 57 4.07
Post-fatigue sessionOccipital cortex R 17, 18 246 -21 -87 -9 4.18Occipital cortex L 17, 18 77 24 -87 9 4.32
Random-effect analysis of 13 subjects, P < 0.05, corrected for the entire search volumes.x, y, z: Stereotaxic coordinates of peak of activated clusters.
Table 2: Brain regions activated by transient reduction of fMRI acquisition noise in the pre-fatigue session.
Location Side Brodmann's area Cluster size (voxels) Coordinates (mm) Z- value
Transverse temporal gyri/superior temporal gyri R 41, 42, 22 1407 57 -24 15 5.63Transverse temporal gyri/superior temporal gyri L 41, 42, 22 1280 -39 -21 6 5.85
Random-effect analysis of 13 subjects, P < 0.05, corrected for the entire search volumes.x, y, z: Stereotaxic coordinates of peak of activated clusters.
Page 7 of 15(page number not for citation purposes)
BMC Neurology 2006, 6:9 http://www.biomedcentral.com/1471-2377/6/9
Page 8 of 15(page number not for citation purposes)
Activity related to visual searchFigure 4Activity related to visual search. (A) Statistical parametric maps activated by visual search (random-effect analysis of 13 sub-jects, P < 0.05, corrected). In order to identify brain regions activated by visual search, we calculated percent signal change evoked during present and absent trials as compared with that for null trial. Anatomical locations were mapped on axial tem-plate brains. Top: Sections passing through visual cortices (left), intraparietal sulcus (middle), and precentral gyrus (right) in the pre-fatigue session. Bottom: Sections passing through right visual cortex (left) and left visual cortex (right) in the post-fatigue session. Crossing line indicates the local activity maximum of each brain region. The right (R) and left (L) sides are indicated. (B) Activity in the visual cortices during the visual search in the pre- (Pre) and post-fatigue (Post) sessions of the normal and CFS patient groups. Magnitude of the activity was calculated as the peak signal change (%) averaged across the activated areas. (C) Activity change rate in the visual cortices during the visual search of the normal and CFS patient groups. Activity change rate (%/h) was calculated as change of activity in the visual cortices during the visual search from pre-fatigue to post-fatigue sessions divided by the session time (hour) of the fatigue-inducing period × 100. Data are mean and SEM. ns, no significant difference (unpaired t-test). Closed columns, normal subjects; open columns, CFS subjects.
A
B C
Per
cen
t si
gn
al c
han
ge
(%)
0
0.2
0.4
0.6
0.8
1.0
1.2
1.4
CFSNormalns
0
Pre Post Pre Post
Act
ivit
y c
han
ge
rati
o
(%/h
)
-100
-80
-60
-40
-20
ns
BMC Neurology 2006, 6:9 http://www.biomedcentral.com/1471-2377/6/9
Page 9 of 15(page number not for citation purposes)
Activity related to transient reduction of fMRI acquisition noiseFigure 5Activity related to transient reduction of fMRI acquisition noise. (A) Statistical parametric maps activated by noise reduction in the pre-fatigue session (random-effect analysis, P < 0.05, corrected). Anatomical locations were mapped on template brains. Axial (left), coronal (middle), and sagittal (left) sections passing through auditory cortices are shown. Crossing line indicates the local activity maximum of the brain regions. The right (R) and left (L) sides are indicated. (B) Statistical parametric maps acti-vated by fMRI noise reduction (red) and visual search (green) in the pre-fatigue session (random effect analysis, P < 0.05, cor-rected). Combined statistical parametric maps were superimposed on surface-rendered high-resolution MRIs viewed from right and left. (C) Time course of normalised activity in the auditory cortices during fatigue-inducing period in the normal and CFS patient groups. To evaluate the time course of the auditory responses, we divided the fatigue-inducing period into 6-min sections, and measured activity of the brain regions that had been activated by transient reduction of fMRI noise in the pre-fatigue session. Magnitude of the activity was calculated as the peak signal change (%) averaged across the activated areas. Nor-malised activity was calculated as activity in a given section divided by that in the first section. Data are mean and SEM. Closed circles, normal subjects; open circles, CFS subjects.
A
T-value
B
C
No
rmal
ized
act
ivit
y
0
0.2
0.4
0.6
0.8
1.0
1.2
1.4
0 2
Time course (section)
4 6 8 10

BMC Neurology 2006, 6:9 http://www.biomedcentral.com/1471-2377/6/9
decreased in the CFS subjects relative to the normal sub-jects, we conducted regression analyses in the auditorycortices during the fatigue-inducing period over 30 min.Although there were no brain regions in which theresponsiveness was decreased during the fatigue session inthe normal subjects (Table 3), in the right planum tempo-rale (BA 22), the responsiveness was decreased in the CFSpatients (Table 3 and Figure 6A). A difference wasobserved in the left planum temporale between the 2groups (BA 22; Table 3 and Figure 6B). Moving-averagednormalised activity confirmed this difference, and respon-siveness to the transient noise reduction was significantlydiminished in the CFS patients relative to the normal sub-jects during the fatigue session (Figure 6C).
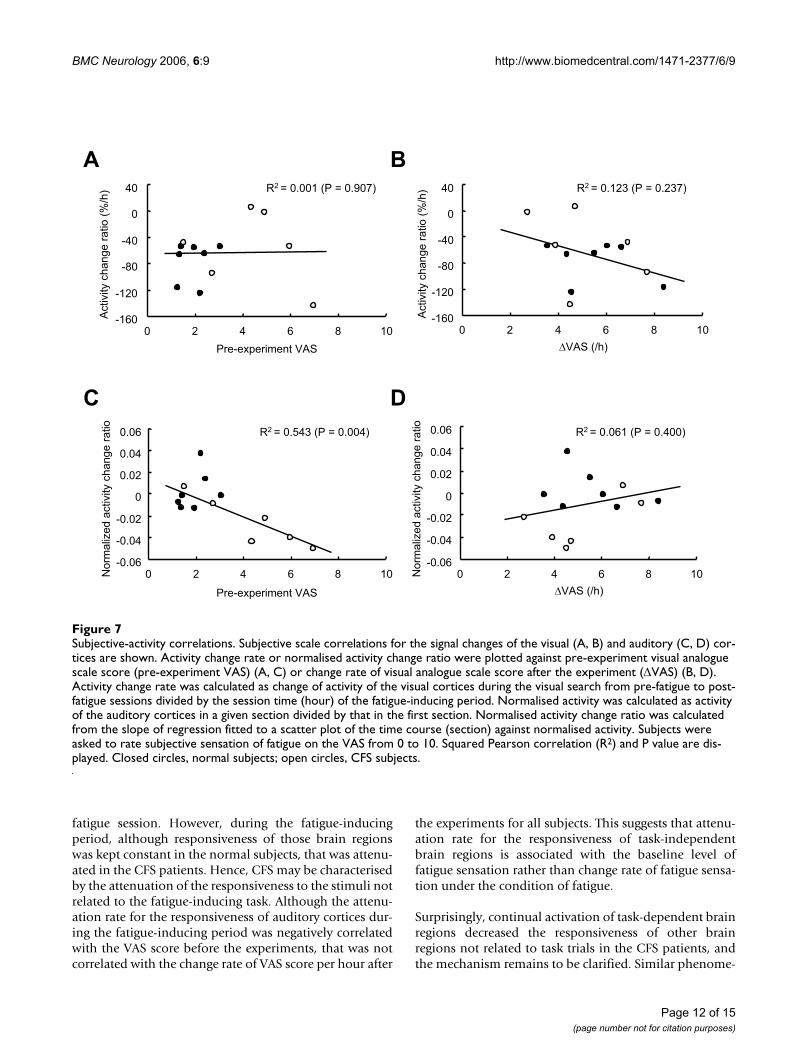
Finally, we investigated the subjective correlations for thesignal change of the visual and auditory cortices. Activitychange rate in the visual cortices was neither correlatedwith the VAS score before the experiments nor change rateof VAS score per hour after the experiments for all the sub-jects (R2 = 0.001, P = 0.907, Figure 7A; R2 = 0.237, P =0.123, Figure 7B, respectively). The normalised activitychange ratio in the auditory cortices was negatively corre-lated with the VAS score before the experiments for allsubjects (R2 = 0.543, P = 0.004, Figure 7C). This correla-tion was stronger when limited in the CFS patient group(R2 = 0.828, P = 0.012). The normalised activity changeratio in the auditory cortices was not correlated with thechange rate of VAS score per hour after the experiments forall subjects (R2 = 0.061, P = 0.400, Figure 7D).
DiscussionIn the present study, we demonstrated that the responsive-ness in the task-dependent brain regions was decreasedafter the fatigue-inducing continual visual search task inthe normal and CFS patient groups and that the decre-ment of the responsiveness in those brain regions wasequivalent between the 2 groups. In addition, we foundthat, during the fatigue-inducing period, although respon-siveness in the task-independent brain regions remained
constant in the normal subjects, it was attenuated in theCFS patients. Moreover, rate of attenuation in the task-independent brain regions was positively correlated withthe pre-experiment subjective sensation of fatigue asmeasured using a fatigue VAS.
After the fMRI experiments, the CFS and normal groupsexhibited a significant increase in fatigue VAS score. Thisshows that both CFS and normal subjects had increasedfatigue sensation by performing the continual visualsearch task, and that the task which we used in the fMRIexperiments was valid as a fatigue-inducing task. Wedetermined the number of targets for which subjectscould provide correct answers to visual search trials inapproximately 90% of cases. The CFS patients performedtask trials with smaller number of targets relative to thenormal subjects (19.0 ± 1.3 vs. 22.6 ± 2.0, P = 0.003,unpaired t-test). This suggests that the CFS subjects haddifficulties for the task trials in terms of mental speed ormotivation. In our study, although fatigue VAS score wasincreased, task performance was not altered after thefatigue-inducing task in the CFS and normal subjects.Therefore, task performance might not be a proper scale tomeasure the levels of CNS fatigue.
In the pre-fatigue session, visual search was associatedwith the activation of the visual cortices (BA 17, 18, and19), superior and inferior parietal lobules (BA 7), and pre-central gyrus (BA 6). As indicated in a review article onthis subject [38], the activated brain regions in the pre-fatigue session of our study were almost similar to thosereported previously by many researchers during manykinds of visual search trials using fMRI. We founddecreased responsiveness of the visual cortices after thefatigue-inducing continual visual search task in the nor-mal and CFS patient groups. However, the decrement ofthe activity in these brain regions was similar between the2 groups. In addition, this decrement was not correlatedwith the fatigue VAS score before the experiments orchange rate of fatigue VAS score after the experiments.
Table 3: Brain regions in which responsiveness to transient noise reduction was decreased during 30-min fatigue session.
Location Side Brodmann's area Cluster size (voxels) Coordinates (mm) Z- value
NormalNot detectable
CFSTransverse temporal gyri* R 22 22 54 -21 12 4.08
CFS > NormalTransverse temporal gyri* L 22 65 -54 -33 18 3.18
Limited within auditory cortices.*P < 0.05, uncorrected for the entire search volumes.x, y, z: Stereotaxic coordinates of peak of activated clusters.
Page 10 of 15(page number not for citation purposes)

BMC Neurology 2006, 6:9 http://www.biomedcentral.com/1471-2377/6/9
These results suggest that reduction of the responsivenessof task-dependent brain regions is a common featureacross normal and CFS subjects, and that decrement iscaused not only by CNS fatigue but also by some con-founds (e.g., mental efforts, attention, or learning).
In the pre-fatigue session, auditory cortices (BA 41, 42,and 22) were activated by transient reduction of the fMRIacquisition noise for 1 s, which is consistent with a previ-ous finding [29]. The responsiveness to 1 s silent periodmainly represents 'OFF'-set activity [29], and electrophys-iological and fMRI 'OFF'-set responses imply increased
activity in auditory cortical neurons following sound'OFF'-set [39-43]. The brain regions activated by this tran-sient noise reduction did not overlap with those activatedby the visual search (Figure 5B). This enabled us to recordresponses of task-independent brain regions. In addition,since fMRI acquisition noise was sporadically reducedindependently of task trials, subjects could perform visualsearch task without or with minimal perturbation for tasktrials.
The responsiveness in the auditory cortices was similarbetween the normal and CFS patient groups in the pre-
Activity related to noise reduction by regression analysesFigure 6Activity related to noise reduction by regression analyses. Brain regions in which responsiveness to transient noise reduction was decreased in the CFS patients (A), and those in which responsiveness to transient noise reduction was decreased in the CFS patients relative to the normal subjects (B) during the fatigue session over 30 min (P < 0.05, uncorrected) are shown. Brain regions shown in Figure 6A and B are limited within auditory cortices. Anatomical locations were mapped on coronal template brains, with coordinate in mm from the anterior commissure. The left side (L) is indicated. (C) Time course of 10-event moving-averaged normalised peak activity of the left planum temporale. Normalised peak activity was calculated as shown in 'Materials and Methods' section. Linear regression lines are shown. Closed circles, normal subjects; open circles, CFS subjects. Data are mean and SEM.
AB
Ly = -33
L y = -21
T-value T-value
C
Norm
aliz
ed p
eak a
ctivity
0
0.4
0.8
1.2
1.6
2.0
0 10 20 30 40 50 60
Time (min)
Page 11 of 15(page number not for citation purposes)
BMC Neurology 2006, 6:9 http://www.biomedcentral.com/1471-2377/6/9
fatigue session. However, during the fatigue-inducingperiod, although responsiveness of those brain regionswas kept constant in the normal subjects, that was attenu-ated in the CFS patients. Hence, CFS may be characterisedby the attenuation of the responsiveness to the stimuli notrelated to the fatigue-inducing task. Although the attenu-ation rate for the responsiveness of auditory cortices dur-ing the fatigue-inducing period was negatively correlatedwith the VAS score before the experiments, that was notcorrelated with the change rate of VAS score per hour after
the experiments for all subjects. This suggests that attenu-ation rate for the responsiveness of task-independentbrain regions is associated with the baseline level offatigue sensation rather than change rate of fatigue sensa-tion under the condition of fatigue.
Surprisingly, continual activation of task-dependent brainregions decreased the responsiveness of other brainregions not related to task trials in the CFS patients, andthe mechanism remains to be clarified. Similar phenome-
Subjective-activity correlationsFigure 7Subjective-activity correlations. Subjective scale correlations for the signal changes of the visual (A, B) and auditory (C, D) cor-tices are shown. Activity change rate or normalised activity change ratio were plotted against pre-experiment visual analogue scale score (pre-experiment VAS) (A, C) or change rate of visual analogue scale score after the experiment (∆VAS) (B, D). Activity change rate was calculated as change of activity of the visual cortices during the visual search from pre-fatigue to post-fatigue sessions divided by the session time (hour) of the fatigue-inducing period. Normalised activity was calculated as activity of the auditory cortices in a given section divided by that in the first section. Normalised activity change ratio was calculated from the slope of regression fitted to a scatter plot of the time course (section) against normalised activity. Subjects were asked to rate subjective sensation of fatigue on the VAS from 0 to 10. Squared Pearson correlation (R2) and P value are dis-played. Closed circles, normal subjects; open circles, CFS subjects.
A B
-160
-120
-80
-40
0
40
0 2 4 6 8 10-160
-120
-80
-40
0 2
Pre-experiment VAS
C D
Activity c
han
ge
ra
tio
(%
/h)
Activity c
han
ge
ra
tio
(%
/h)R2 = 0.001 (P = 0.907) R2 = 0.123 (P = 0.237)40
0
4 6 8 10
VAS (/h)
-0.06
-0.04
-0.02
0
0.02
0.04
0.06
0 2 4 6 8 10-0.06
-0.04
-0.02
0
0 2 4 6 8
Pre-experiment VAS
Norm
aliz
ed a
ctivity c
hange r
ati
Norm
aliz
ed a
ctivity c
hange r
ati
o o
0.06R2 = 0.543 (P = 0.004) R2 = 0.061 (P = 0.400)
0.04
0.02
10
VAS (/h)
Page 12 of 15(page number not for citation purposes)

BMC Neurology 2006, 6:9 http://www.biomedcentral.com/1471-2377/6/9
non can be seen during and after cortical spreadingdepression. Cortical spreading depression is a pro-nounced depolarisation of neurons and glia that spreadsslowly across the cortex followed by a period of depressedelectrophysiological activity [44]. A fMRI study demon-strated that signal amplitude, duration, and time to peakshowed little recovery at 60 min post-induction of spread-ing depression, and analysis of spontaneous vasomotoractivity suggested a breakdown of the neurovascular cou-pling relationship [45]. Of course, during the fatigue-inducing period, pronounced depolarisation of neuronsand glia must not happen in the task-dependent brainregions, continual activation of some cortical regions mayintroduce breakdown of the neurovascular coupling rela-tionship across other cortical regions in the CFS patients.Since CFS patients showed impaired vasomotor function[46], insult of CNS fatigue in the task-dependent brainregions may easily cause reduced responsiveness throughbreakdown of the neurovascular coupling relationshipeven in the task-independent brain regions. Alternatively,since change of responsiveness may be due to totalchanges of neurovascular coupling or neuronal activity[47-49], it is possible that reduced BOLD signal duringfatigue-load indicates reduced activation of auditory corti-cal neurons. In any case, CNS fatigue may attenuate notonly neurovascular coupling relationship and/or neuro-nal activities of the task-dependent brain regions but alsothose of other brain regions through interneuronal andintercortical connections.
During the fatigue-inducing period, responsiveness in thetask-independent brain regions was reduced with slowfluctuations in the CFS patients. Low frequency (0.1 Hz)fluctuations of signal intensity have been shown in fMRIstudies [50,51], and the fluctuations are likely to be vaso-motor in origin [51]. Thus, CNS fatigue may induce break-down of feedback in neurovascular coupling followed byan increase in the magnitude and a reduction of fluctua-tions in the CFS patients.
In the right planum temporale, the responsiveness wasdecreased in the CFS patients, and in the left planum tem-porale, reduction of responsiveness by transient reductionof fMRI noise was shown in the CFS patients relative tothe normal subjects during the fatigue-inducing periodover 30 min. It seems that the reduced level of the respon-siveness was literalised among task-independent brainregions. However, although not statistically significant,those phenomena could be seen in the opposite sides(data not shown). We assume that, although reduced levelof the responsiveness is heterogeneous among task-inde-pendent brain regions, reduction can be seen among allthe task-independent brain regions. Further studies wouldanswer this problem.
Our findings have valuable clinical implications for CFS.CFS is currently diagnosed on a symptomatic basis ratherthan from physical examinations or routine laboratoryfindings [1]; no physiological diagnostic tests have yetbeen established. Since we could to some extent distin-guish CFS patients from normal subjects by comparingthe attenuation rate for the responsiveness of task-inde-pendent brain regions during the fatigue-inducing periodusing fMRI, we believe that this new method could facili-tate the diagnosis of CFS. In addition, since attenuationrate was positively correlated with pre-experiment VASscores in the CFS patients (R2 = 0.828, P = 0.012), we pro-pose this parameter as a new objective and quantitativescale to measure the severity of CFS.
This study had 3 limitations. First, the auditory corticeswere the only task-independent brain regions evaluated.Further studies are needed to determine the responsive-ness of other brain regions. Second, as a sample size wassmall in this study, larger numbers of subjects need to beinvestigated before our findings can be generalised.Finally, as for the fatigue session, there existed time differ-ences between the CFS and normal subjects. After consid-ering the physical and mental condition of the CFSpatients, we determined that 30 min was a suitable periodfor these patients to perform the trials. In contrast, inorder to have similar level of fatigue sensation relative tothe CFS subjects after the MRI experiments, it was essen-tial for the normal subjects to perform task trials for 1hour. However, results of regression analyses during thefatigue-inducing period over 30 min ensure the validity ofthe reduced responsiveness of the task-independent brainregion in the CFS patients.
ConclusionIn conclusion, CFS may be characterised by the attenua-tion of brain responsiveness not directly related to task tri-als. Our findings provide a new perspective on thepathophysiology of CFS and the neural basis of CNSfatigue.
List of abbreviationsANOVA, analysis of variance; BA, Brodmann's area; CFS,chronic fatigue syndrome; CNS, central nervous system;EPI, echo planar imaging; FA, flip angle; fMRI; functionalmagnetic resonance imaging; FOV, field of view; MRI,magnetic resonance imaging; VAS, visual analogue scale
Competing interestsThe author(s) declare that they have no competing inter-ests.
Authors' contributionsMT carried out the fMRI studies, participated in the studydesign, analysed the fMRI data, and drafted the manu-
Page 13 of 15(page number not for citation purposes)

BMC Neurology 2006, 6:9 http://www.biomedcentral.com/1471-2377/6/9
script. NS participated in the study design, performed thefMRI studies, and helped to draft the manuscript. TO per-formed the fMRI studies and analyzed the fMRI data. KMperformed the fMRI studies and analysed the fMRI data.TS performed the fMRI studies. HT analysed the fMRI dataand helped to draft the manuscript. DS performed thefMRI studies. HO participated in the study design, ana-lysed the fMRI data, and helped to draft the manuscript.HK was responsible for medical assessment of the patientsand assisted the execution of fMRI studies. YW partici-pated in the study design and helped to draft the manu-script. All authors read and approved the finalmanuscript.
AcknowledgementsThis work was supported in part by Special Coordination Funds for Pro-moting Science and Technology, the 21st Century COE Program "Base to Overcome Fatigue", from the Ministry of Education, Culture, Sports, Sci-ence and Technology, the Japanese Government, and by the Japan Science and Technology Corporation (JST)/Research Institute of Science and Tech-nology for Society (RISTEX). We thank Dr. Tara Chatterjee for editorial help with the manuscript.
References1. Fukuda K, Straus SE, Hickie I, Sharpe MC, Dobbins JG, Komaroff A:
The chronic fatigue syndrome: a comprehensive approachto its definition and study. International Chronic FatigueSyndrome Study Group. Ann Intern Med 1994, 121:953-959.
2. Bombardier CH, Buchwald D: Chronic fatigue, chronic fatiguesyndrome, and fibromyalgia. Disability and health-care use.Med Care 1996, 34:924-930.
3. Buchwald D, Pearlman T, Umali J, Schmaling K, Katon W: Functionalstatus in patients with chronic fatigue syndrome, otherfatiguing illnesses, and healthy individuals. Am J Med 1996,101:364-370.
4. Altay HT, Toner BB, Brooker H, Abbey SE, Salit IE, Garfinkel PE: Theneuropsychological dimensions of postinfectious neurom-yasthenia (chronic fatigue syndrome): a preliminary report.Int J Psychiatry Med 1990, 20:141-149.
5. DeLuca J, Johnson S, Beldowicz D, Natelson B: Neuropsychologicalimpairments in chronic fatigue syndrome, multiple sclerosis,and depression. J Neurol Neurosurg Psychiatry 1995, 58:38-43.
6. Okada T, Tanaka M, Kuratsune H, Watanabe Y, Sadato N: Mecha-nisms underlying fatigue: a voxel-based morphometric studyof chronic fatigue syndrome. BMC Neurol 2004, 4:14.
7. de Lange FP, Kalkman JS, Bleijenberg G, Hagoort P, van der Meer JW,Toni I: Gray matter volume reduction in the chronic fatiguesyndrome. Neuroimage 2005, 26:777-781.
8. Buchwald D, Cheney PR, Peterson DL, Henry B, Wormsley SB, Gei-ger A, Ablashi DV, Salahuddin SZ, Saxinger C, Biddle R: A chronicillness characterized by fatigue, neurologic and immunologicdisorders, and active human herpesvirus type 6 infection.Ann Intern Med 1992, 116:103-113.
9. Natelson BH, Cohen JM, Brassloff I, Lee HJ: A controlled study ofbrain magnetic resonance imaging in patients with thechronic fatigue syndrome. J Neurol Sci 1993, 120:213-217.
10. Lange G, DeLuca J, Maldjian JA, Lee H, Tiersky LA, Natelson BH:Brain MRI abnormalities exist in a subset of patients withchronic fatigue syndrome. J Neurol Sci 1999, 171:3-7.
11. Ichise M, Salit IE, Abbey SE, Chung DG, Gray B, Kirsh JC, FreedmanM: Assessment of regional cerebral perfusion by 99Tcm-HMPAO SPECT in chronic fatigue syndrome. Nucl Med Com-mun 1992, 13:767-772.
12. Schwartz RB, Komaroff AL, Garada BM, Gleit M, Doolittle TH, BatesDW, Vasile RG, Holman BL: SPECT imaging of the brain: com-parison of findings in patients with chronic fatigue syndrome,AIDS dementia complex, and major unipolar depression. AmJ Roentgenol 1994, 162:943-951.
13. Kuratsune H, Yamaguti K, Lindh G, Evengard B, Hagberg G, Mat-sumura K, Iwase M, Onoe H, Takahashi M, Machii T, Kanakura Y,Kitani T, Langstrom B, Watanabe Y: Brain regions involved infatigue sensation: reduced acetylcarnitine uptake into thebrain. Neuroimage 2002, 17:1256-1265.
14. Tirelli U, Chierichetti F, Tavio M, Simonelli C, Bianchin G, Zanco P,Ferlin G: Brain positron emission tomography (PET) inchronic fatigue syndrome: preliminary data. Am J Med 1998,105:54-58.
15. Siessmeier T, Nix WA, Hardt J, Schreckenberger M, Egle UT, Barten-stein P: Observer independent analysis of cerebral glucosemetabolism in patients with chronic fatigue syndrome. J Neu-rol Neurosurg Psychiatry 2003, 74:922-928.
16. DeLange FP, Kalkman JS, Bleijenberg G, Hagoort P, van der Werf SP,van der Meer JW, Toni I: Neural correlates of the chronicfatigue syndrome – an fMRI study. Brain 2004, 127:1948-1957.
17. Lange G, Steffener J, Cook DB, Bly BM, Christodoulou C, Liu WC,Deluca J, Natelson BH: Objective evidence of cognitive com-plaints in Chronic Fatigue Syndrome: a BOLD fMRI study ofverbal working memory. Neuroimage 2005, 26:513-524.
18. Cohen JD, Perlstein WM, Braver TS, Nystrom LE, Noll DC, Jonides J,Smith EE: Temporal dynamics of brain activation during aworking memory task. Nature 1997, 386:604-608.
19. Woodard JL, Grafton ST, Votaw JR, Green RC, Dobraski ME, Hoff-man JM: Compensatory recruitment of neural resources dur-ing overt rehearsal of word lists in Alzheimer's disease.Neuropsychology 1998, 12:491-504.
20. Christodoulou C, DeLuca J, Ricker JH, Madigan NK, Bly BM, Lange G,Kalnin AJ, Liu WC, Steffener J, Diamond BJ, Ni AC: Functional mag-netic resonance imaging of working memory impairmentafter traumatic brain injury. J Neurol Neurosurg Psychiatry 2001,71:161-168.
21. Gould RL, Brown RG, Owen AM, ffytche DH, Howard RJ: fMRIBOLD response to increasing task difficulty during successfulpaired associates learning. Neuroimage 2003, 20:1006-1019.
22. Brasil-Neto JP, Pascual-Leone A, Valls-Sole J, Cammarota A, CohenLG, Hallett M: Postexercise depression of motor evokedpotentials: a measure of central nervous system fatigue. ExpBrain Res 1993, 93:181-184.
23. Hathout GM, Kirlew KA, So GJ, Hamilton DR, Zhang JX, Sinha U,Sinha S, Sayre J, Gozal D, Harper RM: MR imaging signal responseto sustained stimulation in human visual cortex. J Magn ResonImaging 1994, 4:537-543.
24. Elliott MR, Bowtell RW, Morris PG: The effect of scanner soundin visual, motor, and auditory functional MRI. Magn Reson Med1999, 41:1230-1235.
25. Pfleiderer B, Ostermann J, Michael N, Heindel W: Visualization ofauditory habituation by fMRI. Neuroimage 2002, 17:1705-1710.
26. Sobel N, Prabhakaran V, Zhao Z, Desmond JE, Glover GH, SullivanEV, Gabrieli JD: Time course of odorant-induced activation inthe human primary olfactory cortex. J Neurophysiol 2000,83:537-551.
27. Poellinger A, Thomas R, Lio P, Lee A, Makris N, Rosen BR, KwongKK: Activation and habituation in olfaction – an fMRI study.NeuroImage 2001, 13:547-560.
28. Kajimoto O: Technique for assessment of degree of fatigue.Igaku No Ayumi 2003, 204:377-380. (in Japanese)
29. Okada T, Honda M, Okamoto J, Sadato N: Activation of the pri-mary and association auditory cortex by the transition ofsound intensity: a new method for functional examination ofthe auditory cortex in humans. Neurosci Lett 2003, 359:119-123.
30. Oldfield RC: The assessment and analysis of handedness: theEdinburgh inventory. Neuropsychologia 1971, 9:97-113.
31. Lee KA, Hicks G, Nino-Murcia G: Validity and reliability of ascale to assess fatigue. Psychiatry Res 1991, 36:291-298.
32. Friston KJ, Worsley KJ, Frackowiak RS, Mazziotta JC, Evans AC:Assessing the significance of focal activations using their spa-tial extent. Hum Brain Mapp 1994, 1:210-220.
33. Friston KJ, Holmes AP, Worseley KL, Poline JB, Frith CD, FrackowiakRS: Statistical parametric maps in functional imaging: A gen-eral linear approach. Hum Brain Mapp 1995, 2:189-210.
34. Friston KJ, Ashburner J, Frith CD, Heather JD, Frackowiak RS: Spa-tial registration and normalization of images. Hum Brain Mapp1995, 2:165-189.
35. Evans AC, Kamber M, Collins DL, MacDonald D: An MRI-basedProbablistic Atlas of Neuroanatomy. In Magnetc resonance scan-
Page 14 of 15(page number not for citation purposes)
http://www.ncbi.nlm.nih.gov/entrez/query.fcgi?cmd=Retrieve&db=PubMed&dopt=Abstract&list_uids=7978722
http://www.ncbi.nlm.nih.gov/entrez/query.fcgi?cmd=Retrieve&db=PubMed&dopt=Abstract&list_uids=7978722
http://www.ncbi.nlm.nih.gov/entrez/query.fcgi?cmd=Retrieve&db=PubMed&dopt=Abstract&list_uids=7978722
http://www.ncbi.nlm.nih.gov/entrez/query.fcgi?cmd=Retrieve&db=PubMed&dopt=Abstract&list_uids=8792781
http://www.ncbi.nlm.nih.gov/entrez/query.fcgi?cmd=Retrieve&db=PubMed&dopt=Abstract&list_uids=8792781
http://www.ncbi.nlm.nih.gov/entrez/query.fcgi?cmd=Retrieve&db=PubMed&dopt=Abstract&list_uids=8873506
http://www.ncbi.nlm.nih.gov/entrez/query.fcgi?cmd=Retrieve&db=PubMed&dopt=Abstract&list_uids=8873506
http://www.ncbi.nlm.nih.gov/entrez/query.fcgi?cmd=Retrieve&db=PubMed&dopt=Abstract&list_uids=8873506
http://www.ncbi.nlm.nih.gov/entrez/query.fcgi?cmd=Retrieve&db=PubMed&dopt=Abstract&list_uids=2394541
http://www.ncbi.nlm.nih.gov/entrez/query.fcgi?cmd=Retrieve&db=PubMed&dopt=Abstract&list_uids=2394541
http://www.ncbi.nlm.nih.gov/entrez/query.fcgi?cmd=Retrieve&db=PubMed&dopt=Abstract&list_uids=7823065
http://www.ncbi.nlm.nih.gov/entrez/query.fcgi?cmd=Retrieve&db=PubMed&dopt=Abstract&list_uids=7823065
http://www.ncbi.nlm.nih.gov/entrez/query.fcgi?cmd=Retrieve&db=PubMed&dopt=Abstract&list_uids=7823065
http://www.ncbi.nlm.nih.gov/entrez/query.fcgi?cmd=Retrieve&db=PubMed&dopt=Abstract&list_uids=1309285
http://www.ncbi.nlm.nih.gov/entrez/query.fcgi?cmd=Retrieve&db=PubMed&dopt=Abstract&list_uids=1309285
http://www.ncbi.nlm.nih.gov/entrez/query.fcgi?cmd=Retrieve&db=PubMed&dopt=Abstract&list_uids=8138812
http://www.ncbi.nlm.nih.gov/entrez/query.fcgi?cmd=Retrieve&db=PubMed&dopt=Abstract&list_uids=8138812
http://www.ncbi.nlm.nih.gov/entrez/query.fcgi?cmd=Retrieve&db=PubMed&dopt=Abstract&list_uids=8138812
http://www.ncbi.nlm.nih.gov/entrez/query.fcgi?cmd=Retrieve&db=PubMed&dopt=Abstract&list_uids=1491843
http://www.ncbi.nlm.nih.gov/entrez/query.fcgi?cmd=Retrieve&db=PubMed&dopt=Abstract&list_uids=1491843
http://www.ncbi.nlm.nih.gov/entrez/query.fcgi?cmd=Retrieve&db=PubMed&dopt=Abstract&list_uids=9121583
http://www.ncbi.nlm.nih.gov/entrez/query.fcgi?cmd=Retrieve&db=PubMed&dopt=Abstract&list_uids=9121583
http://www.ncbi.nlm.nih.gov/entrez/query.fcgi?cmd=Retrieve&db=PubMed&dopt=Abstract&list_uids=9805319
http://www.ncbi.nlm.nih.gov/entrez/query.fcgi?cmd=Retrieve&db=PubMed&dopt=Abstract&list_uids=9805319
http://www.ncbi.nlm.nih.gov/entrez/query.fcgi?cmd=Retrieve&db=PubMed&dopt=Abstract&list_uids=8467889
http://www.ncbi.nlm.nih.gov/entrez/query.fcgi?cmd=Retrieve&db=PubMed&dopt=Abstract&list_uids=8467889
http://www.ncbi.nlm.nih.gov/entrez/query.fcgi?cmd=Retrieve&db=PubMed&dopt=Abstract&list_uids=7949678
http://www.ncbi.nlm.nih.gov/entrez/query.fcgi?cmd=Retrieve&db=PubMed&dopt=Abstract&list_uids=7949678
http://www.ncbi.nlm.nih.gov/entrez/query.fcgi?cmd=Retrieve&db=PubMed&dopt=Abstract&list_uids=5146491
http://www.ncbi.nlm.nih.gov/entrez/query.fcgi?cmd=Retrieve&db=PubMed&dopt=Abstract&list_uids=5146491

BMC Neurology 2006, 6:9 http://www.biomedcentral.com/1471-2377/6/9
Publish with BioMed Central and every scientist can read your work free of charge
"BioMed Central will be the most significant development for disseminating the results of biomedical research in our lifetime."
Sir Paul Nurse, Cancer Research UK
Your research papers will be:
available free of charge to the entire biomedical community
peer reviewed and published immediately upon acceptance
cited in PubMed and archived on PubMed Central
yours — you keep the copyright
Submit your manuscript here:http://www.biomedcentral.com/info/publishing_adv.asp
BioMedcentral
ning and epilepsy Edited by: Shorvon SD. New York: Plenum Press;1994:263-274.
36. Friston KJ, Holmes AP, Worsley KJ: How many subjects consti-tute a study? NeuroImage 1999, 10:1-5.
37. Tanabe HC, Honda N, Sadato N: Functionally segregated neuralsubstrates for arbitrary audiovisual paired-association learn-ing. J Neurosci 2005, 25:6409-6418.
38. Pollmann S, von Cramon DY: Object working memory and visu-ospatial processing: functional neuroanatomy analyzed byevent-related fMRI. Exp Brain Res 2000, 133:12-22.
39. Goldstein MH Jr, Hall JL 2nd, Butterfield BO: Single-unit activity inthe primary auditory cortex of unanesthetized cats. J AcoustSoc Am 1968, 43:444-455.
40. Abeles M, Goldstein MH Jr: Responses of single units in the pri-mary auditory cortex of the cat to tones and to tone pairs.Brain Res 1972, 42:337-352.
41. He J, Hashikawa T, Ojima H, Kinouchi Y: Temporal integrationand duration tuning in the dorsal zone of cat auditory cortex.J Neurosci 1997, 17:2615-2625.
42. Recanzone GH: Response profiles of auditory cortical neuronsto tones and noise in behaving macaque monkeys. Hear Res2000, 150:104-118.
43. Liang L, Lu T, Wang X: Neural representations of sinusoidalamplitude and frequency modulations in the primary audi-tory cortex of awake primates. J Neurophysiol 2002,87:2237-2261.
44. Sugiya E, Takato M, Noda Y: Neuronal and glial activity duringspreading depression in cerebral cortex of cat. J Neurophysiol1975, 38:822-841.
45. Guiou M, Sheth S, Nemoto M, Walker M, Pouratian N, Ba A, TogaAW: Cortical spreading depression produces long-term dis-ruption of activity-related changes in cerebral blood volumeand neurovascular coupling. J Biomed Opt 2005, 10:11004.
46. Stewart JM: Autonomic nervous system dysfunction in adoles-cents with postural orthostatic tachycardia syndrome andchronic fatigue syndrome is characterized by attenuatedvagal baroreflex and potentiated sympathetic vasomotion.Pediatr Res 2000, 48:218-226.
47. Heeger DJ, Huk AC, Geisler WS, Albrecht DG: Spikes versusBOLD: what does neuroimaging tell us about neuronal activ-ity? Nat Neurosci 2000, 3:631-633.
48. Rees G, Friston K, Koch C: A direct quantitative relationshipbetween the functional properties of human and macaqueV5. Nat Neurosci 2000, 3:716-723.
49. Logothetis NK, Pauls J, Augath M, Trinath T, Oeltermann A: Neuro-physiological investigation of the basis of the fMRI signal.Nature 2001, 412:150-157.
50. Biswal B, Yetkin FZ, Haughton VM, Hyde JS: Functional connectiv-ity in the motor cortex of resting human brain using echo-planar MRI. Magn Reson Med 1995, 34:537-541.
51. Mitra PP, Ogawa S, Hu X, Ugurbil K: The nature of spatiotempo-ral changes in cerebral hemodynamics as manifested in func-tional magnetic resonance imaging. Magn Reson Med 1997,37:511-518.
Pre-publication historyThe pre-publication history for this paper can be accessedhere:
http://www.biomedcentral.com/1471-2377/6/9/prepub
Page 15 of 15(page number not for citation purposes)
http://www.ncbi.nlm.nih.gov/entrez/query.fcgi?cmd=Retrieve&db=PubMed&dopt=Abstract&list_uids=5640950
http://www.ncbi.nlm.nih.gov/entrez/query.fcgi?cmd=Retrieve&db=PubMed&dopt=Abstract&list_uids=5640950
http://www.ncbi.nlm.nih.gov/entrez/query.fcgi?cmd=Retrieve&db=PubMed&dopt=Abstract&list_uids=5050171
http://www.ncbi.nlm.nih.gov/entrez/query.fcgi?cmd=Retrieve&db=PubMed&dopt=Abstract&list_uids=5050171
http://www.ncbi.nlm.nih.gov/entrez/query.fcgi?cmd=Retrieve&db=PubMed&dopt=Abstract&list_uids=9065521
http://www.ncbi.nlm.nih.gov/entrez/query.fcgi?cmd=Retrieve&db=PubMed&dopt=Abstract&list_uids=9065521
http://www.ncbi.nlm.nih.gov/entrez/query.fcgi?cmd=Retrieve&db=PubMed&dopt=Abstract&list_uids=1159468
http://www.ncbi.nlm.nih.gov/entrez/query.fcgi?cmd=Retrieve&db=PubMed&dopt=Abstract&list_uids=1159468
http://www.ncbi.nlm.nih.gov/entrez/query.fcgi?cmd=Retrieve&db=PubMed&dopt=Abstract&list_uids=8524021
http://www.ncbi.nlm.nih.gov/entrez/query.fcgi?cmd=Retrieve&db=PubMed&dopt=Abstract&list_uids=8524021
http://www.ncbi.nlm.nih.gov/entrez/query.fcgi?cmd=Retrieve&db=PubMed&dopt=Abstract&list_uids=8524021
http://www.ncbi.nlm.nih.gov/entrez/query.fcgi?cmd=Retrieve&db=PubMed&dopt=Abstract&list_uids=9094072
http://www.ncbi.nlm.nih.gov/entrez/query.fcgi?cmd=Retrieve&db=PubMed&dopt=Abstract&list_uids=9094072
Related Documents