Reduced protein oxidation in Wistar rats supplemented with marine o3 PUFAs Lucı ´a Me ´ ndez a,n , Manuel Pazos a , Jose ´ M. Gallardo a , Josep L. Torres b , Jara Pe ´ rez-Jime ´ nez b , Rosa Nogue ´s c , Marta Romeu c , Isabel Medina a a Instituto de Investigaciones Marinas, Consejo Superior de Investigaciones Cientificas (IIM-CSIC), E-36208 Vigo, Spain b Instituto de Quı ´mica Avanzada de Catalunya, Consejo Superior de Investigaciones Cientificas (IQAC-CSIC), E-08034 Barcelona, Spain c Unidad de Farmacologı ´a, Facultad de Medicina y Ciencias de la Salud, Universidad Rovira i Virgili, E-43201 Reus, Spain article info Article history: Received 2 July 2012 Received in revised form 10 October 2012 Accepted 5 November 2012 Available online 16 November 2012 Keywords: Dietary intervention Wistar rats Fish oil Eicosapentaenoic acid Docosahexaenoic acid Linoleic acid Linolenic acid Oxidative stress Protein carbonylation Free radicals abstract The potential effects of various dietary eicosapentaenoic acid (EPA; 20:5) and docosahexaenoic acid (DHA; 22:6) ratios (1:1, 2:1, and 1:2, respectively) on protein redox states from plasma, kidney, skeletal muscle, and liver were investigated in Wistar rats. Dietary fish oil groups were compared with animals fed soybean and linseed oils, vegetable oils enriched in o6 linoleic acid (LA; 18:2) and o3 a-linolenic acid (ALA; 18:3), respectively. Fish oil treatments were effective at reducing the level of total fatty acids in plasma and enriching the plasmatic free fatty acid fraction and erythrocyte membranes in EPA and DHA. A proteomic approach consisting of fluorescein 5-thiosemicarbazide (FTSC) labeling of protein carbonyls, FTSC intensity visualization on 1-DE or 2-DE gels, and protein identification by MS/MS was used for the protein oxidation assessment. Albumin was found to be the most carbonylated protein in plasma for all dietary groups, and its oxidation level was significantly modulated by dietary interventions. Supplementation with an equal EPA:DHA ratio (1:1) showed the lowest oxidation score for plasma albumin, followed in increasing order of carbonylation by 1:2 o2:1 E linseed o soybean. Oxidation patterns of myofibrillar skeletal muscle proteins and cytosolic proteins from kidney and liver also indicated a protective effect on proteins for the fish oil treatments, the 1:1 ratio exhibiting the lowest protein oxidation scores. The effect of fish oil treatments at reducing carbonylation on specific proteins from plasma (albumin), skeletal muscle (actin), and liver (albumin, argininosuccinate synthetase, 3-a-hydroxysteroid dehydrogenase) was remarkable. This investigation highlights the efficiency of dietary fish oil at reducing in vivo oxidative damage of proteins compared to oils enriched in the 18-carbon polyunsaturated fatty acids o3 ALA and o6 LA, and such antioxidant activity may differ among different fish oil sources because of variations in EPA/DHA content. & 2012 Elsevier Inc. All rights reserved. Reactive oxygen species (ROS) 1 are formed from the electron- transfer reactions involved in aerobic metabolism, but they are also generated from exposure to various toxicants. ROS are essential in vital biochemical processes such as intracellular messaging, cellular differentiation, growth arrestment, apoptosis, and immunity against microorganisms [1]. However, impairment in the normal reduction–oxidation (redox) balance provokes ROS overproduction, a condition known as oxidative stress that triggers oxidative damage of cellular biomolecules (i.e., lipids, proteins, and DNA) and has been linked to the development of a wide range of metabolic diseases, including atherosclerosis, type 2 diabetes, and obesity, and even to cellular aging [2]. Several oxidized products of lipids (e.g., F2-isoprostane and malondialde- hyde), DNA (typically 8-oxo-7,8-dihydro-2 0 -deoxyguanosine), and proteins (e.g., protein carbonyls) are generally monitored to evaluate oxidative stress in vivo [3]. Regular consumption of o3 PUFAs of marine origin, principally EPA (20:5 n-3) and DHA (22:6 n-3), has been implicated in prevention of autoimmune disorders, diabetes, and coronary heart disease [4–6]. EPA and DHA (a) alter membrane fluidity; (b) interact with transcription factors such as peroxisome proliferator-activated receptor (PPAR), nuclear factor kB, and sterol regulatory element Contents lists available at SciVerse ScienceDirect journal homepage: www.elsevier.com/locate/freeradbiomed Free Radical Biology and Medicine 0891-5849/$ - see front matter & 2012 Elsevier Inc. All rights reserved. http://dx.doi.org/10.1016/j.freeradbiomed.2012.11.004 Abbreviations: 1/2-DE, one/two-dimensional gel electrophoresis; AKR, 3-a-hydroxysteroid dehydrogenase; ALA, a-linolenic acid; ARA, arachidonic acid; ASS, argininosuccinate synthetase; AST, aspartate aminotransferase; DHA, docosahexaenoic acid; DNPH, 2,4-dinitrophenylhydrazine; DTT, dithiothreitol; EDTA, ethylenediaminetetraacetic acid; EPA, eicosapentaenoic acid; FTSC, fluor- escein 5-thiosemicarbazide; GC/FID, gas chromatography/flame ionization detec- tor; LA, linoleic acid; LC–ESI–IT–MS/MS, high-performance liquid chromatography coupled with electrospray ionization ion trap tandem mass spectrometry; MDA, malondialdehyde; PUFA, polyunsaturated fatty acid; ROS, reactive oxygen species; SDS–PAGE, sodium dodecyl sulfate–polyacrylamide gel electrophoresis. n Corresponding author. Fax: þ34 986 292762. E-mail address: [email protected] (L. Me ´ ndez). Free Radical Biology and Medicine 55 (2013) 8–20

Welcome message from author
This document is posted to help you gain knowledge. Please leave a comment to let me know what you think about it! Share it to your friends and learn new things together.
Transcript
Free Radical Biology and Medicine 55 (2013) 8–20
Contents lists available at SciVerse ScienceDirect
Free Radical Biology and Medicine
0891-58
http://d
Abbre
3-a-hyd
ASS, arg
docosah
EDTA, e
escein 5
tor; LA,
coupled
MDA, m
species;n Corr
E-m
journal homepage: www.elsevier.com/locate/freeradbiomed
Reduced protein oxidation in Wistar rats supplemented withmarine o3 PUFAs
Lucıa Mendez a,n, Manuel Pazos a, Jose M. Gallardo a, Josep L. Torres b, Jara Perez-Jimenez b,Rosa Nogues c, Marta Romeu c, Isabel Medina a
a Instituto de Investigaciones Marinas, Consejo Superior de Investigaciones Cientificas (IIM-CSIC), E-36208 Vigo, Spainb Instituto de Quımica Avanzada de Catalunya, Consejo Superior de Investigaciones Cientificas (IQAC-CSIC), E-08034 Barcelona, Spainc Unidad de Farmacologıa, Facultad de Medicina y Ciencias de la Salud, Universidad Rovira i Virgili, E-43201 Reus, Spain
a r t i c l e i n f o
Article history:
Received 2 July 2012
Received in revised form
10 October 2012
Accepted 5 November 2012Available online 16 November 2012
Keywords:
Dietary intervention
Wistar rats
Fish oil
Eicosapentaenoic acid
Docosahexaenoic acid
Linoleic acid
Linolenic acid
Oxidative stress
Protein carbonylation
Free radicals
49/$ - see front matter & 2012 Elsevier Inc. A
x.doi.org/10.1016/j.freeradbiomed.2012.11.00
viations: 1/2-DE, one/two-dimensional
roxysteroid dehydrogenase; ALA, a-linolenic
ininosuccinate synthetase; AST, aspartate am
exaenoic acid; DNPH, 2,4-dinitrophenylhydr
thylenediaminetetraacetic acid; EPA, eicosap
-thiosemicarbazide; GC/FID, gas chromatogr
linoleic acid; LC–ESI–IT–MS/MS, high-perform
with electrospray ionization ion trap tandem
alondialdehyde; PUFA, polyunsaturated fatty
SDS–PAGE, sodium dodecyl sulfate–polyacry
esponding author. Fax: þ34 986 292762.
ail address: [email protected] (L. Mend
a b s t r a c t
The potential effects of various dietary eicosapentaenoic acid (EPA; 20:5) and docosahexaenoic acid
(DHA; 22:6) ratios (1:1, 2:1, and 1:2, respectively) on protein redox states from plasma, kidney, skeletal
muscle, and liver were investigated in Wistar rats. Dietary fish oil groups were compared with animals
fed soybean and linseed oils, vegetable oils enriched in o6 linoleic acid (LA; 18:2) and o3 a-linolenic
acid (ALA; 18:3), respectively. Fish oil treatments were effective at reducing the level of total fatty acids
in plasma and enriching the plasmatic free fatty acid fraction and erythrocyte membranes in EPA and
DHA. A proteomic approach consisting of fluorescein 5-thiosemicarbazide (FTSC) labeling of protein
carbonyls, FTSC intensity visualization on 1-DE or 2-DE gels, and protein identification by MS/MS was
used for the protein oxidation assessment. Albumin was found to be the most carbonylated protein in
plasma for all dietary groups, and its oxidation level was significantly modulated by dietary
interventions. Supplementation with an equal EPA:DHA ratio (1:1) showed the lowest oxidation score
for plasma albumin, followed in increasing order of carbonylation by 1:2 o2:1 E linseed o soybean.
Oxidation patterns of myofibrillar skeletal muscle proteins and cytosolic proteins from kidney and liver
also indicated a protective effect on proteins for the fish oil treatments, the 1:1 ratio exhibiting the
lowest protein oxidation scores. The effect of fish oil treatments at reducing carbonylation on specific
proteins from plasma (albumin), skeletal muscle (actin), and liver (albumin, argininosuccinate
synthetase, 3-a-hydroxysteroid dehydrogenase) was remarkable. This investigation highlights the
efficiency of dietary fish oil at reducing in vivo oxidative damage of proteins compared to oils enriched
in the 18-carbon polyunsaturated fatty acids o3 ALA and o6 LA, and such antioxidant activity may
differ among different fish oil sources because of variations in EPA/DHA content.
& 2012 Elsevier Inc. All rights reserved.
Reactive oxygen species (ROS)1 are formed from the electron-transfer reactions involved in aerobic metabolism, but they arealso generated from exposure to various toxicants. ROS areessential in vital biochemical processes such as intracellularmessaging, cellular differentiation, growth arrestment, apoptosis,
ll rights reserved.
4
gel electrophoresis; AKR,
acid; ARA, arachidonic acid;
inotransferase; DHA,
azine; DTT, dithiothreitol;
entaenoic acid; FTSC, fluor-
aphy/flame ionization detec-
ance liquid chromatography
mass spectrometry;
acid; ROS, reactive oxygen
lamide gel electrophoresis.
ez).
and immunity against microorganisms [1]. However, impairmentin the normal reduction–oxidation (redox) balance provokes ROSoverproduction, a condition known as oxidative stress thattriggers oxidative damage of cellular biomolecules (i.e., lipids,proteins, and DNA) and has been linked to the development of awide range of metabolic diseases, including atherosclerosis, type2 diabetes, and obesity, and even to cellular aging [2]. Severaloxidized products of lipids (e.g., F2-isoprostane and malondialde-hyde), DNA (typically 8-oxo-7,8-dihydro-20-deoxyguanosine), andproteins (e.g., protein carbonyls) are generally monitored toevaluate oxidative stress in vivo [3].
Regular consumption of o3 PUFAs of marine origin, principallyEPA (20:5 n-3) and DHA (22:6 n-3), has been implicated inprevention of autoimmune disorders, diabetes, and coronary heartdisease [4–6]. EPA and DHA (a) alter membrane fluidity; (b) interactwith transcription factors such as peroxisome proliferator-activatedreceptor (PPAR), nuclear factor kB, and sterol regulatory element
L. Mendez et al. / Free Radical Biology and Medicine 55 (2013) 8–20 9
binding proteins that engage genes that influence cellulardifferentiation and growth and metabolism of lipid, protein, andcarbohydrates; and (c) are substrates for enzymes includingcyclooxygenase, lipoxygenase, and cytochrome P450 [7,8]. As aresult, the healthy outcome of marine n-3 PUFA consumption hasbeen mainly attributed to their effects in reducing elevated plasmatriglyceride levels, increasing high-density lipoprotein cholesterol,reducing platelet aggregation, improving endothelial function, andpreventing inflammatory pathways [9,10].
Several investigations have also indicated a potential modula-tion of marine lipids on in vivo redox balance, although bothin vitro and in vivo experiments have yielded contradictoryresults. In vitro supplementation of human platelets showed abiphasic effect of DHA with antioxidant and pro-oxidant effects atlow and high concentrations, respectively [11]. This pro-oxidantaction was ascribed to the high DHA accumulation in membranesand the theoretical direct relation between PUFA oxidation andunsaturation degree. A similar tendency was found in a nutri-tional intervention study in healthy men [12]. Intake of 200 mg ofDHA/day provided antioxidative protection by increasing theendogenous antioxidant a-tocopherol and reducing urinary F2-isoprostanes, whereas supplementation of 1600 mg of DHAexerted a pro-oxidant effect by increasing isoprostane levels.Conversely, elevated supplementations of fish oil or purified EPAand DHA, ranging from 3.6 to 4.4 g per day, were effective atreducing urinary F2-isoprostanes in non-insulin-dependent type2 diabetic patients [13,14], but had no effect in reducing oxidativestress in exercise-trained men, considering plasma malondialde-hyde (MDA), antioxidant capacity, and protein carbonylation [15].Another nutritional intervention showed an increment of plasmaMDA after supplementation with fish oil containing 2.5 g EPA and1.8 g DHA, but it did not modify plasma protein carbonylation[16]. Recent investigations have suggested that both DHA and fishoil, but not EPA, have beneficial effects on lipoprotein metabolismand oxidative stress [17]. A differential redox modulation by EPAand DHA, together with methodological limitations, can explainin part the above-mentioned contradictory results. Numerousstudies evaluate exclusively free MDA; however, it is fundamen-tally bound to proteins because of the affinity of MDA and otherreactive carbonyls to form protein adducts. Protein carbonylationis a good alternative to estimate jointly the formation of reactivecarbonyl compounds and free radical processes that also lead toprotein carbonyls. Moreover, carbonylation alters biochemicalproperties of proteins such as enzymatic activity, DNA-bindingactivity of transcription factors, and susceptibility to proteolyticdegradation, and the oxidation of low-density lipoprotein (LDL) issuggested to induce important events triggering atherosclerosispathogenesis [18]. At present, the spectrophotometric measure-ment of the reaction of protein carbonyls with 2,4-dinitrophe-nylhydrazine (DNPH) is routinely used for monitoring proteincarbonylation despite its reduced sensitivity and selectivity [19].Recent advances in mass spectrometry and proteomic tools makepossible a massive identification and quantification of posttran-slational modifications such as protein carbonylation, althoughthese methodologies have been scarcely implemented to evaluatediet influence on protein oxidation.
This investigation was aimed to delve deeper into the effect ofdietary interventions with various EPA:DHA ratios on the indivi-dual redox state of proteins from plasma, kidney, skeletal muscle,and liver. To achieve such purpose, healthy Wistar rats wereemployed as an animal model. Rats were fed standard dietsenriched with fish oil containing three different EPA:DHA ratios(1:1, 2:1, and 1:2) and were compared with diets containingsoybean oil and linseed oil. Soybean oil is a rich source of the o6LA (18:2), whereas linseed oil has an elevated content of o3 ALA(18:3), the dietary precursor of long-chain o3 PUFA biosynthesis.
The influence of fatty acid supplementation on redox regulation ofproteins was evaluated by using a proteomic procedure based onlabeling protein carbonyls with fluorescein 5-thiosemicarbazide(FTSC), protein separation on 1-DE or 2-DE gels, and proteinidentification by tandem mass spectrometry.
Materials and methods
Materials and reagents
Oils differing in EPA:DHA ratio were obtained by mixing appro-priate quantities of the commercial fish oils AFAMPES 121 EPA(AFAMSA, Vigo, Spain), EnerZona Omega 3 RX (Milan, Italy), andOligen liquid DHA 80% (IFIGEN-EQUIP 98, S.L., Barcelona, Spain).Soybean oil, obtained from unrefined organic soy oil (first coldpressing) was from Clearspring Ltd. (London, UK), and linseed oil,obtained from unrefined organic flax oil (first cold pressing), wasfrom Biolasi S.L. (Ordizia, Guipuzcoa, Spain). Nonadecanoic acid waspurchased from Larodan Fine Chemicals (Malmo, Sweden). Diethylether, formic acid, and methanol were purchased from Merck(Darmstadt, Germany). FTSC was purchased from Invitrogen(Carlsbad, CA, USA) and porcine sequencing-grade modified trypsinwas from Promega (Madison, WI, USA). Ketamine chlorhydrate(Imalgene 1000) was purchased from Merial Laboratorios S.A.(Barcelona, Spain) and xylazine (Rompun 2%) was from QuimicaFarmaceutica S.A. (Barcelona, Spain). ProteoBlock protease inhibitorcocktail was purchased from Thermo Fisher Scientific (Rockford, IL,USA). Dichloromethane, phenylmethylsulfonyl fluoride (PMSF),dithiothreitol (DTT), iodoacetamide, ethylenediaminetetraacetic acid(EDTA), trichloroacetic acid (TCA), Tris–HCl, 3,3-cholaminopropyldi-methylammonio-1-propanesulfonate (Chaps), sodium phosphate,magnesium chloride anhydrous, and bicinchoninic acid (BCA) werepurchased from Sigma (St. Louis, MO, USA). Urea, thiourea, sodiumdodecyl sulfate (SDS), glycine, glycerol and Serdolit MB-1 wereobtained from USB (Cleveland, OH, USA). Immobiline DryStrip gels(pH 3–10, 11 cm), IPG buffer, pharmalyte 3–10, ammonium persul-fate, bromophenol blue, and 1,2-bis(dimethylamino)ethane werepurchased from GE Healthcare Bio-Sciences AB (Uppsala, Sweden).Acrylamide, bis-N,N0-methylene-bis-acrylamide, and Bio-Rad pro-tein assay were obtained from Bio-Rad (Hercules, CA, USA). All otherchemicals and reagents used were of analytical reagent grade andwater was purified using a Milli-Q system (Millipore, Billerica,MA, USA).
Animals and diets
Briefly, experiments were performed with 35 female Wistarrats (Janvier, St. Berthevin, France) with an initial age of 13 weeks.Animals were kept in an isolated room with a constantly regu-lated temperature (2272 1C) and controlled (50710%) humidityon a 12-h artificial light cycle. They were randomized into fivegroups: soybean group (n ¼ 7), linseed group (n ¼ 7), EPA:DHA1:1 group (n ¼ 7), EPA:DHA 2:1 group (n ¼ 7), and EPA:DHA 1:2group (n ¼ 7). All groups were fed the standard pelleted chowdiet A04 from Harlan Iberica (Barcelona, Spain), which contained,on a wet basis, 16.0% protein, 60.0% carbohydrate, 4.0% fiber, 3.0%fat, and 5.0% mineral and provided an energy density of 2.9 kcalper gram. The levels of the micronutrients per kilogram ofstandard chow diet were 8400 mg for Ca, 5700 mg for P,2500 mg for Na, 6400 mg for K, 70 mg for Mn, 6600 UI for vitaminA, 900 UI for vitamin D3, and 30 mg for vitamin E. The animalshad ad libitum access to water and food. Each specific group wasgiven a weekly oral dose of 0.8 ml/kg of the corresponding oil aslisted in Table 1. The incorporation of PUFAs from the diet was
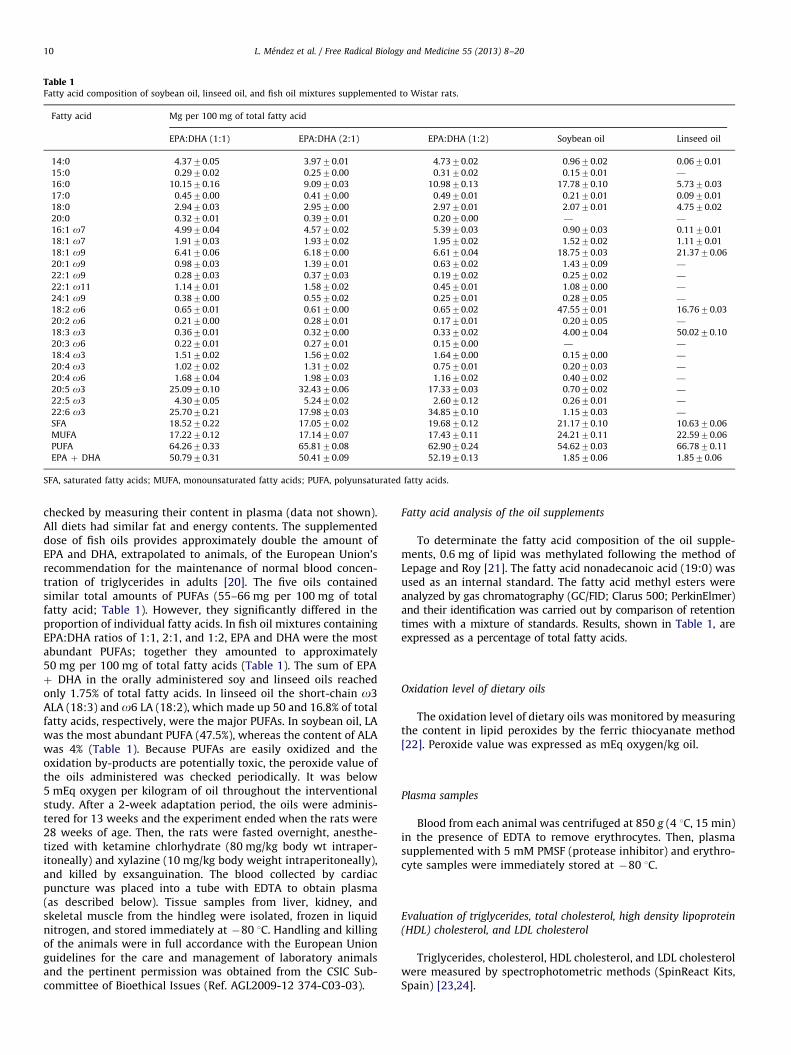
Table 1Fatty acid composition of soybean oil, linseed oil, and fish oil mixtures supplemented to Wistar rats.
Fatty acid Mg per 100 mg of total fatty acid
EPA:DHA (1:1) EPA:DHA (2:1) EPA:DHA (1:2) Soybean oil Linseed oil
14:0 4.3770.05 3.9770.01 4.7370.02 0.9670.02 0.0670.01
15:0 0.2970.02 0.2570.00 0.3170.02 0.1570.01 —
16:0 10.1570.16 9.0970.03 10.9870.13 17.7870.10 5.7370.03
17:0 0.4570.00 0.4170.00 0.4970.01 0.2170.01 0.0970.01
18:0 2.9470.03 2.9570.00 2.9770.01 2.0770.01 4.7570.02
20:0 0.3270.01 0.3970.01 0.2070.00 — —
16:1 o7 4.9970.04 4.5770.02 5.3970.03 0.9070.03 0.1170.01
18:1 o7 1.9170.03 1.9370.02 1.9570.02 1.5270.02 1.1170.01
18:1 o9 6.4170.06 6.1870.00 6.6170.04 18.7570.03 21.3770.06
20:1 o9 0.9870.03 1.3970.01 0.6370.02 1.4370.09 —
22:1 o9 0.2870.03 0.3770.03 0.1970.02 0.2570.02 —
22:1 o11 1.1470.01 1.5870.02 0.4570.01 1.0870.00 —
24:1 o9 0.3870.00 0.5570.02 0.2570.01 0.2870.05 —
18:2 o6 0.6570.01 0.6170.00 0.6570.02 47.5570.01 16.7670.03
20:2 o6 0.2170.00 0.2870.01 0.1770.01 0.2070.05 —
18:3 o3 0.3670.01 0.3270.00 0.3370.02 4.0070.04 50.0270.10
20:3 o6 0.2270.01 0.2770.01 0.1570.00 — —
18:4 o3 1.5170.02 1.5670.02 1.6470.00 0.1570.00 —
20:4 o3 1.0270.02 1.3170.02 0.7570.01 0.2070.03 —
20:4 o6 1.6870.04 1.9870.03 1.1670.02 0.4070.02 —
20:5 o3 25.0970.10 32.4370.06 17.3370.03 0.7070.02 —
22:5 o3 4.3070.05 5.2470.02 2.6070.12 0.2670.01 —
22:6 o3 25.7070.21 17.9870.03 34.8570.10 1.1570.03 —
SFA 18.5270.22 17.0570.02 19.6870.12 21.1770.10 10.6370.06
MUFA 17.2270.12 17.1470.07 17.4370.11 24.2170.11 22.5970.06
PUFA 64.2670.33 65.8170.08 62.9070.24 54.6270.03 66.7870.11
EPA þ DHA 50.7970.31 50.4170.09 52.1970.13 1.8570.06 1.8570.06
SFA, saturated fatty acids; MUFA, monounsaturated fatty acids; PUFA, polyunsaturated fatty acids.
L. Mendez et al. / Free Radical Biology and Medicine 55 (2013) 8–2010
checked by measuring their content in plasma (data not shown).All diets had similar fat and energy contents. The supplementeddose of fish oils provides approximately double the amount ofEPA and DHA, extrapolated to animals, of the European Union’srecommendation for the maintenance of normal blood concen-tration of triglycerides in adults [20]. The five oils containedsimilar total amounts of PUFAs (55–66 mg per 100 mg of totalfatty acid; Table 1). However, they significantly differed in theproportion of individual fatty acids. In fish oil mixtures containingEPA:DHA ratios of 1:1, 2:1, and 1:2, EPA and DHA were the mostabundant PUFAs; together they amounted to approximately50 mg per 100 mg of total fatty acids (Table 1). The sum of EPAþ DHA in the orally administered soy and linseed oils reachedonly 1.75% of total fatty acids. In linseed oil the short-chain o3ALA (18:3) and o6 LA (18:2), which made up 50 and 16.8% of totalfatty acids, respectively, were the major PUFAs. In soybean oil, LAwas the most abundant PUFA (47.5%), whereas the content of ALAwas 4% (Table 1). Because PUFAs are easily oxidized and theoxidation by-products are potentially toxic, the peroxide value ofthe oils administered was checked periodically. It was below5 mEq oxygen per kilogram of oil throughout the interventionalstudy. After a 2-week adaptation period, the oils were adminis-tered for 13 weeks and the experiment ended when the rats were28 weeks of age. Then, the rats were fasted overnight, anesthe-tized with ketamine chlorhydrate (80 mg/kg body wt intraper-itoneally) and xylazine (10 mg/kg body weight intraperitoneally),and killed by exsanguination. The blood collected by cardiacpuncture was placed into a tube with EDTA to obtain plasma(as described below). Tissue samples from liver, kidney, andskeletal muscle from the hindleg were isolated, frozen in liquidnitrogen, and stored immediately at �80 1C. Handling and killingof the animals were in full accordance with the European Unionguidelines for the care and management of laboratory animalsand the pertinent permission was obtained from the CSIC Sub-committee of Bioethical Issues (Ref. AGL2009-12 374-C03-03).
Fatty acid analysis of the oil supplements
To determinate the fatty acid composition of the oil supple-ments, 0.6 mg of lipid was methylated following the method ofLepage and Roy [21]. The fatty acid nonadecanoic acid (19:0) wasused as an internal standard. The fatty acid methyl esters wereanalyzed by gas chromatography (GC/FID; Clarus 500; PerkinElmer)and their identification was carried out by comparison of retentiontimes with a mixture of standards. Results, shown in Table 1, areexpressed as a percentage of total fatty acids.
Oxidation level of dietary oils
The oxidation level of dietary oils was monitored by measuringthe content in lipid peroxides by the ferric thiocyanate method[22]. Peroxide value was expressed as mEq oxygen/kg oil.
Plasma samples
Blood from each animal was centrifuged at 850 g (4 1C, 15 min)in the presence of EDTA to remove erythrocytes. Then, plasmasupplemented with 5 mM PMSF (protease inhibitor) and erythro-cyte samples were immediately stored at �80 1C.
Evaluation of triglycerides, total cholesterol, high density lipoprotein
(HDL) cholesterol, and LDL cholesterol
Triglycerides, cholesterol, HDL cholesterol, and LDL cholesterolwere measured by spectrophotometric methods (SpinReact Kits,Spain) [23,24].
L. Mendez et al. / Free Radical Biology and Medicine 55 (2013) 8–20 11
C-reactive protein and soluble intercellular adhesion
molecule-1 measurement
C-reactive protein (CRP) and soluble intercellular adhesionmolecule-1 (sICAM-1) were evaluated in plasma by ELISA kits(Cusabio Biotech, China).
Analysis of plasmatic total fatty acids, plasmatic free fatty acids, and
fatty acids from erythrocyte membranes
Plasma for the analysis of total fatty acids (TFA) and free fattyacids (FFA) was first spiked with an internal standard of non-adecanoic acid and then extracted with a dichloromethane:methanol:water mixture (2:2:1, v/v) using a Bligh and Dyerprocedure as previously described [25]. TFA were directly ana-lyzed in the organic phase after drying under a stream of nitrogengas, transesterification, and GC/FID analysis, as indicated above.To isolate the FFA fraction, the resulting lipid mixture obtainedfrom the Bligh and Dyer extraction was subjected to solid-phaseextraction (SPE) on customized glass-barrel SPE aminopropylcolumns (Biotage, UK). FFA were eluted with 2% acetic acid indiethyl ether as previously described [26]. Finally, the solvent wasremoved under a stream of nitrogen gas and subjected totransesterification and GC analysis.
To study the profile of fatty acids from the erythrocytemembranes, lyophilized erythrocyte samples were extracted withthe Bligh and Dyer procedure, and then, the organic phase wasdried under a stream of nitrogen gas and spiked with the internalstandard nonadecanoic acid. Later, erythrocyte fatty acids weresubjected to transesterification and analysis by GC/FID as indi-cated above to TFA and FFA.
Extraction of tissue proteins
Cytoplasmic proteins were isolated from rat liver and kidneyand myofibrillar proteins from skeletal muscle. For each experi-ment, 200–400 mg of liver, kidney, or muscle was homogenizedin 25 volumes of 20 mM sodium phosphate, pH 6.0, 0.5 mMMgCl2, 1 mM EDTA, and 10 ml/ml buffer for ProteoBlock proteaseinhibitor cocktail (100 mM AEBSF–HCl, 80 mM aprotinin, 5 mMbestatin, 1.5 mM E64, 2 mM leupeptin, and 1 mM pepstatin A), byusing an Ultra-Turrax high-performance disperser. After centri-fugation at 100,000 g for 1 h at 4 1C, the cytosolic fractionremained in the resulting supernatant. To isolate myofibrillarskeletal muscle proteins, the remaining pellets were homoge-nized in 10 volumes of 10 mM Tris–HCl, pH 7.2, 0.6 M NaCl, 1 mMEDTA, 10 ml/ml buffer for ProteoBlock protease inhibitor cocktail.After centrifugation at 16,000 g for 15 min at 4 1C, the myofibrillarfraction remained in the resulting supernatant. The concentrationof cytoplasmic and myofibrillar proteins was measured by theBCA assay [27].
Preparation of FTSC-derivatized proteins
To evaluate the influence of dietary oils on rat protein oxida-tion, the carbonyl residues generated in vivo on plasma and tissueproteins were tagged as previously described [28]. Cytoplasmic ormyofibrillar proteins from kidney, liver, and muscle, extracted asdescribed above, were incubated with 1 mM FTSC in the dark(37 1C, 2.5 h). The labeling of carbonylated proteins in plasma wasperformed by direct incubation of either nondepleted or depletedplasma with FTSC. Seven abundant plasma proteins (albumin, IgG,IgM, haptoglobin, a1-antitrypsin, transferrin, fibrinogen) wereremoved from depleted plasma samples by using Seprot rat spincolumns (Sigma) based on avian antibody–antigen interac-tions. After incubation, proteins were precipitated with an equal
volume of 20% chilled TCA (v/v) and centrifuged at 16,000g (20 1C,10 min). Then, the pellets were washed five times with themixture ethanol:ethyl acetate (1:1), to remove the FTSC excess,and finally redissolved in urea buffer (7 M urea, 2 M thiourea, 2%Chaps, 0.5% Pharmalyte 3–10, 0.5% IPG 3–10 buffer, and 0.4%DTT). Fluorescein-labeled proteins were stored at �80 1C untiluse. Protein concentration in each sample was determined byBradford assay [29].
SDS–PAGE (1-DE and 2-DE)
Protein carbonylation was analyzed by either 1-DE or 2-DElaboratory-made 10% SDS–PAGE [30]. To visualize the globalprotein carbonyl levels in the samples, 30 mg of protein samplewas subjected to monodimensional electrophoresis and run in aMini-Protean 3 cell (Bio-Rad). Further, to study the proteincarbonyl levels of individual proteins, proteins were resolvedusing 2-DE, through adaptation of a protocol described earlier[31]. Briefly, 400 mg of protein was applied to 11-cm IPG 3–10strips by two rehydration steps (0 V for 6 h and 50 V for 4 h) at20 1C on an Ettan IPGphor II isoelectric focusing system(GE Healthcare Science). Protein focusing on 11-cm IPG 3–10strips was performed at 20 1C on the Ettan IPGphor II unit byapplying the voltage/time profiles suggested by the manufacturer(GE Healthcare Science): the voltage was held at 500 V for 1 h,linearly raised from 500 to 1000 V for 1 h and from 1000 to6000 V for 2 h, and maintained at 6000 V for 40 min. Afterfocusing, the strips were kept frozen at �80 1C until use. Beforerunning the second dimension, strips were equilibrated for15 min in DTT buffer (6 M urea, 2% SDS, 50 mM Tris–HCl, pH8.8, 30% glycerol, 0.075% DTT) and then equilibrated with thesame buffer in the presence of 4.5% iodoacetamide instead of DTT.The gels were run at a constant current setting (10 mA/gel for 1 hand 20 mA/gel for approximately 12 h) in an Ettan Daltsixelectrophoresis system (GE Healthcare) at 15 1C. Two 11-cm IPGstrips corresponding to each diet were run in each 2-DE poly-acrylamide gel (24-cm wide) and six gels were run in each assay.Two different running buffers were used for the second dimen-sion, anode buffer (0.67% (w/v) Tris-base, 1.44% glycine, and 0.1%SDS) and cathode buffer (same composition but with 0.2% SDS).After electrophoresis, FTSC-tagged proteins were visualized byexposing the gel to a UV transilluminator (Molecular Imager GelDoc XR System; Bio-Rad) equipped with a 520-nm band-passfilter (520DF30 62 mm). After the fluorescent signal from FTSCbound to oxidized proteins was measured, the gels were stainedovernight with the Coomassie dye PhastGel Blue R-350 (GEHealthcare) to visualize the total protein amount in each sample.
In-gel digestion and peptide extraction
Protein spots of interest were manually excised and digestedwith trypsin according to a protocol previously described [32].Briefly, protein spots were washed with water, dehydrated withacetonitrile, and dried in a vacuum centrifuge. Gel pieces wererehydrated with a 0.5 mM solution of sequencing-grade bovinetrypsin in 50 mM ammonium bicarbonate buffer, pH 8.0, for atleast 40 min on ice. After a rehydration step, the samples weredigested overnight at 37 1C.
Protein identification by LC–ESI–IT–MS/MS
Protein identity was ascertained by an LC System ModelSpectraSystem P4000 (Thermo Scientific, San Jose, CA, USA)coupled to an ion trap mass spectrometer Model LCQ Deca XPPlus with an ESI interface (Thermo Scientific). Peptide separationwas performed on a BioBasic-18 RP column, 0.18�150 mm, 5 mm
L. Mendez et al. / Free Radical Biology and Medicine 55 (2013) 8–2012
(Thermo Scientific), using 0.5% aqueous acetic acid and in 80%acetonitrile as mobile phases A and B, respectively. A 90-minlinear gradient from 5 to 60% B, at a flow rate of 1.5–1.7 ml/min,was used. Peptides were detected using survey scans from 400 to1600 Da (3 mscans), followed by MS/MS scans (3 mscans) of thefour more intense peaks using an isolation width of 5 Da and anormalized collision energy of 35%. Fragmented masses were setin dynamic exclusion for 3 min after the third fragmentationevent and singly charged ions were excluded from MS/MSanalysis. Protein identification was performed by searching forhomology in the experimental MS/MS peak lists with theoreticalMS/MS spectra contained in the nr.fasta databases (NCBIResources, NIH, Bethesda, MD, USA) using two different searchengines, SEQUEST (BioWorks 3.2 package; Thermo-Finnigan) andMascot (Matrix Science Ltd, London, UK). The following searchcriteria were applied: tryptic cleavage, up to 1 missed cleavagesite, and tolerances 71.5 Da for precursor ions and 70.8 Da forMS/MS fragments ions. The variable modifications allowed weremethionine oxidation (M) and carbamidomethylation of cysteine (C).
Image analysis
Scanned monodimensional gels were analyzed with the 1-DEgel analysis software LabImage 1D (Kapelan Bio-Imaging Solu-tions, Halle, Germany). The global protein carbonylation level foreach sample was quantified based on the overall optical volumeof each lane in the FTSC-stained 1-DE gel, whereas the oxidationlevel of a specific protein band was estimated by its opticalintensity (peak height). The rubber band method was applied toreduce the background with LabImage 1D software. The analysisof 2-DE SDS–PAGE gels was performed using PDQuest softwareversion 7.1 (Bio-Rad). Gel images were processed for removal ofbackground, and protein spots were detected and matched amongthe gels. The intensity of the spots was expressed as parts permillion of the total integrated optical density of the gel, whichwas approximately constant among gels. To monitor the influenceof different diets on the protein carbonylation, the spot/bandintensity was quantified in the FTSC-stained gels. The comparisonof spot intensity in Coomassie-stained gels was used to evaluate
Table 2Body weight and abdominal fat in Wistar rats supplemented with EPA:DHA 1:1, 2:1, a
EPA/DHA (1:1) EPA/DHA (2:1)
Initial body weight (g) 248.576.4 238.577.5
Final body weight (g) 260.374.2a 259.374.8a
Abdominal fat (%) 3.970.4a 3.670.3a
Values are shown as means7SD. Values with different superscript letters in the same
Table 3Levels of total fatty acids, triglycerides, total cholesterol, low-density lipoprotein chole
soluble intercellular adhesion molecule-1 in plasma from Wistar rats fed EPA:DHA 1:1
EPA:DHA 1:1 EPA:DHA 2:1
Total FA (mg/dl) 267.7746.1ab 233.8724.2a
TG (mg/dl) 93.8767.8a 64.0723.4a
Cholesterol (mg/dl) 102726.45a 98714.84a
LDL (mg/dl) 8.5873.27a 7.3970.75a
HDL (mg/dl) 41.16711.1a 42.2577.95a
HDL:LDL 5.0271.35a 5.7370.94a
CRP (mg/ml) 147.0720.5a 147.1722.4a
sICAM-1 (ng/ml) 0.5970.21a 0.6170.22a
FA, fatty acids; TG, triglycerides; LDL, low-density lipoprotein cholesterol; HDL, high-den
adhesion molecule-1. Values are shown as means7SD. Values with different supersc
dietary groups.
possible diet influence on protein expression. To normalize theprotein carbonylation level with the protein abundance, anadditional parameter was estimated, oxidation index. Oxidationindex was calculated by dividing the intensity of the spot in theFTSC-stained gel by the protein concentration represented by theintensity of the spot in the Coomassie-stained gel.
Statistical analysis
Individual and global oxidation protein intensities were deter-mined as means7standard deviation (SD). Statistical analyseswere performed by one-way analysis of variance with theStatistica 6.0 program (Statsoft, Tulsa, OK, USA) and the meanswere compared by the post hoc test Fisher least squares differ-ence. Significant difference was set at po0.05.
Results
Effects of dietary interventions with varying n-3 PUFA content on
animal biometrics, hematocrit, plasma lipid content, erythrocyte fatty
acids, and inflammatory markers
The final weight and abdominal fat of the animals subjected tothe various diets were not significantly different (p 40.05) at theend of the dietary intervention experiment and ranged respec-tively from 255 to 266 and from 3.6 to 4.3 g (Table 2). Dietarysupplementation did not exert any significant activity on blooderythrocyte content, the hematocrit content ranging from 39.8 to43.6 for all animal groups. The supplementation with dietarylipids also showed no significant effect on plasma triglycerides(TG), plasma total cholesterol, and LDL cholesterol (p40.05),although a noticeable tendency was observed for these indexes:animals fed soybean oil presented higher averaged values for TG,total cholesterol, and LDL than animals supplemented with fishoils (Table 3). In agreement with this trend, rats supplementedwith the fish oils presented the highest mean values for HDLcholesterol and HDL:LDL ratio, and those fed soybean oil had thelowest HDL and HDL:LDL ratio values, although the differences
nd 1:2 and soybean and linseed oils.
EPA/DHA (1:2) Soybean Linseed
230.273.7 231.472.9 240.172.8
255.574.2a 259.173.6a 266.373.4a
4.170.3a 4.370.30a 4.370.3a
row indicate significant difference at p o 0.05 between dietary groups.
sterol, high-density lipoprotein cholesterol, HDL:LDL ratio, C-reactive protein, and
, 2:1, and 1:2 and soybean and linseed oils.
EPA:DHA 1:2 Soybean Linseed
280.8730.3ab 355.6787.7c 316.9761.0abc
83.1710.4a 108.5751.9a 73.5725.2a
112.3720.79a 125.8716.52a 133.36741.19a
8.371.27a 10.3972.24a 10.0677.12a
47.378.14a 51.2677.82a 49.6979.11a
5.770.44a 4.9970.49a 5.971.7a
140.1752.7a 172.9738.2a 142.9752.0a
0.5370.24a 0.4570.21a 0.5970.29a
sity lipoprotein cholesterol; CRP, C-reactive protein; sICAM-1, soluble intercellular
ript letters in the same row indicate significant difference at p o 0.05 between
L. Mendez et al. / Free Radical Biology and Medicine 55 (2013) 8–20 13
were not significant (p40.05). However, diets enriched in fishoils exerted a significant effect on reducing the level of TFA tovalues between 234 and 280 mg/dl, in contrast to the 317 and356 mg/dl observed respectively in plasma from animals supple-mented with linseed and soybean oils (Table 3).
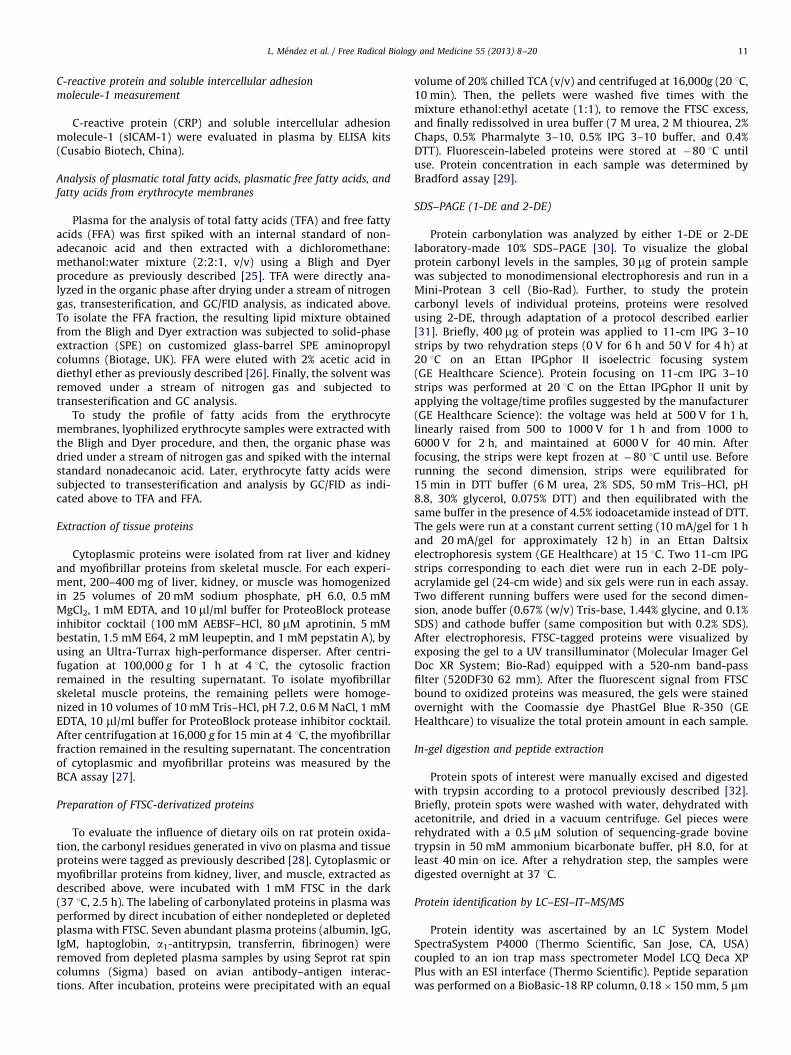
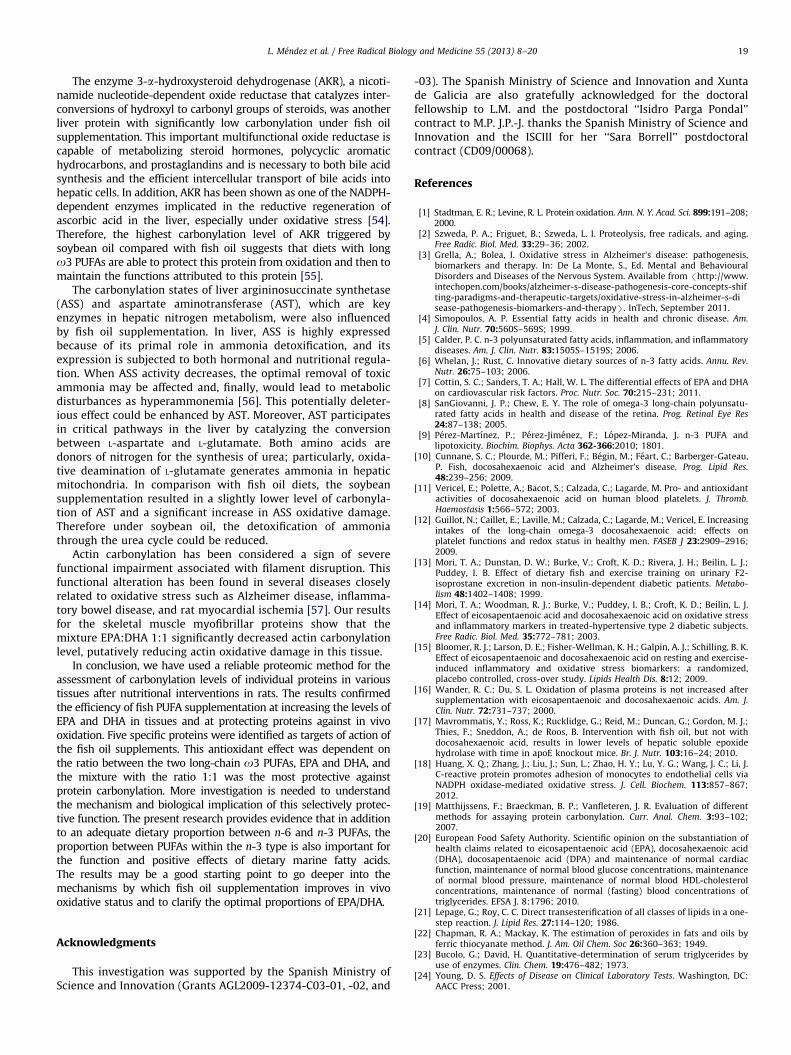
The influence of dietary interventions on the levels andcomposition of plasmatic FFA was also evaluated (Fig. 1A). FFAencompass only a small fraction of plasmatic total fatty acidsarising from adipose tissue [33] that have relevant functions assignaling molecules participating in inflammation and oxidativestress [34]. Fish oil supplementation did not change the totalamount of plasmatic FFA, their levels ranging from 190 to 220 mg/ml, but it altered the profile of the individual FFA. Animals fed fishoils exhibited significantly higher levels of EPA (20:5 n-3) andDHA (22:6 n-3) compared to those fed soybean oil (Fig. 1A). Thesupplementation with linseed oil provided similar levels of EPAcompared to those observed in the FFA fraction from animalssupplemented with fish oil; however, the amount of DHA in theFFA fraction was intermediate between those supplemented withfish and those with soybean oils (Fig. 1A). Animals fed linseed oilshowed the highest amount of free LA (18:3 n-3), in agreementwith the elevated content of LA in the linseed oil (Table 1).
The incorporation of dietary fatty acids in tissues was mon-itored by the fatty acid profile of erythrocyte membranes. Theresults showed a significant enrichment of the animals supple-mented with fish oil in the o3 marine EPA and DHA comparedto those supplemented with soybean oil (Fig. 1B). EPA alsoexhibited an elevated concentration in erythrocyte membranes
1:1 2:1 1:2
Eryt
hroc
yte
fatty
aci
ds (m
ol %
) 20:5w3 22:5w3
22:6w3
0.0
1.0
2.0
3.0
4.0
5.0
6.0
8.0
9.0
7.0
SOY LINSEED
0
1
2
3
4
1:1 2:1 1: 2 SOY LINSEED
18:3w3 20:5w322:6w3
Free
fatty
aci
ds (m
ol %
)
Fig. 1. Levels of (A) plasmatic o3 free fatty acid a-linolenic acid (18:3 n-3),
eicosapentaenoic acid (20:5 n-3; EPA), and docosahexaenoic acid (22:6 n-3; DHA)
and of (B) o3 EPA, docosapentaenoic acid (22:5 n-3), and DHA in erythrocytes in
Wistar rats fed EPA:DHA 1:1, EPA:DHA 2:1, EPA:DHA 1:2, and soybean and linseed
oils. Values are shown as means 7 SD.
from animals fed linseed oil, whereas DHA was more poorlyincorporated in linseed animals than in fish oil animals (po0.05).Fish oils also provided more elevated proportions of docosapen-taenoic acid (22:5 n-3; DPA), which is an intermediary productbetween EPA and DHA formed from the elongation of EPA,compared to those fed soybean oil (Fig. 1B). Conversely, the levelof ARA was significantly reduced in erythrocytes from the dietaryfish oil groups 1:1, 2:1, and 1:2, with percentages ranging from21.6 to 22.6% on a molar basis, against the soybean and linseedgroups, for which the ARA proportion reached 23.9–24.8%. The o3ALA was not significantly incorporated into the erythrocytemembranes by any of the dietary interventions (data not shown).The levels of ARA, EPA, DPA, and DHA in the erythrocytes did notdiffer significantly among animals supplemented with the dietaryfish oil groups 1:1, 2:1, and 1:2 (Fig. 1B).
Regarding the inflammatory markers CRP and sICAM-1, therewere no significant differences among dietary groups, althoughthe noticeably highest averaged CRP value was found in thesoybean group (Table 3).
Effects of diets with varying n-3 PUFA content on plasma protein
oxidation in vivo
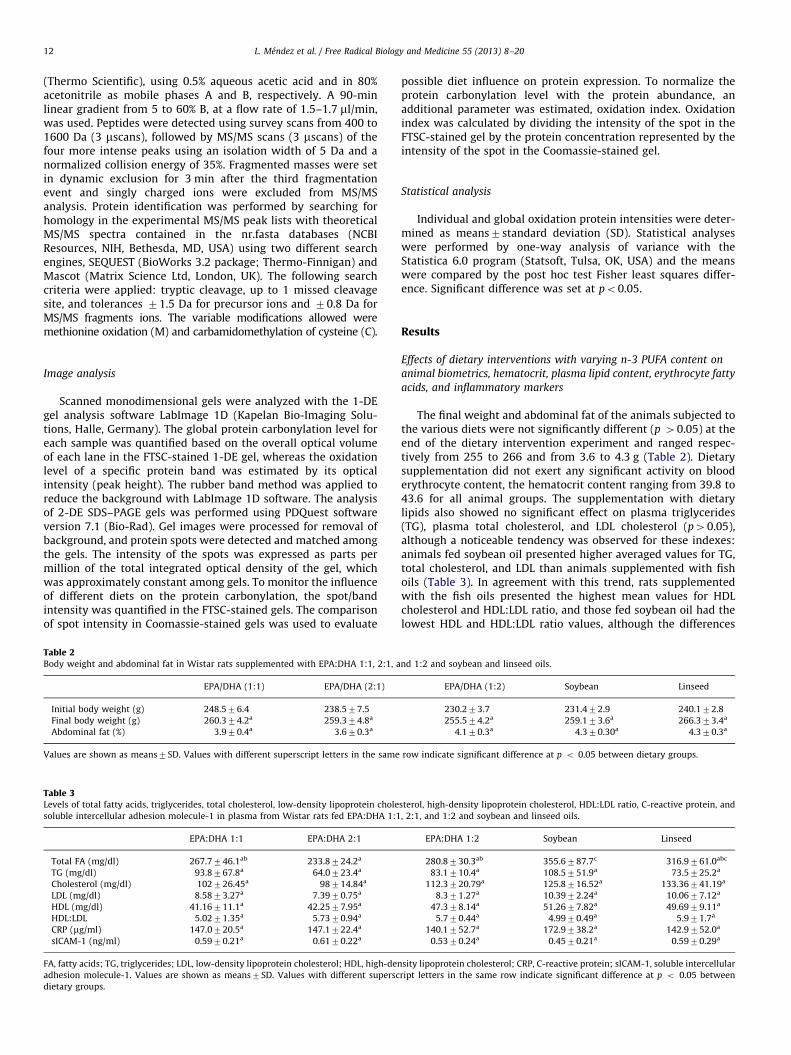
Fig. 2A shows the FTSC residues attached to plasma proteinsvisualized on 1-DE SDS–PAGE gels. These results evidence theexistence of a protein band of an estimated molecular weightof 66 kDa with strong carbonylation. Protein identification bytandem mass spectrometry and database homology assigned thisband as albumin (gi9298351527; Mascot score 489). This markedoxidation in albumin was common for all dietary interventions,representing 55–70% of total protein oxidation for all diets andstressing a relevant role of plasma albumin as a target ofoxidation. This important contribution of albumin to the globalprotein oxidation could be in part explained by its high relativeabundance in plasma. Albumin regularly constitutes 55% of totalplasma proteins [35]. The evaluation of protein oxidation among
97
66
45
220
Lane 152 3 4 5 6 7 81 14131211109
1:1 2:1 1:2 Soy Linseed
kDa
albumin
0
40
80
120
160
200
b,ca,b
a
c
b,c
1:22:11:1 SOY LINSEED
Alb
umin
Car
bony
latio
n (F
TSC
inte
nsity
)
Fig. 2. Oxidized plasma proteins of Wistar rats supplemented with different diets.
(A) 1-DE FTSC-stained gel of fresh plasma proteins from the various dietary
groups. Lanes 1, 2, and 3, EPA:DHA 1:1; lanes 4, 5, and 6, EPA:DHA 2:1; lanes 7, 8,
and 9, EPA:DHA 1:2; lanes 10, 11, and 12, soybean oil; lanes 13, 14, and 15, linseed
oil. (B) Plasma albumin carbonylation (FTSC intensity) for the various dietary
groups. Data are presented as means 7 SD.
Lane
66
45
220
30
97
p25
kDa
152 3 4 5 6 7 81 14131211109 16 17
1:1 2:1 Soy Linseed1:2
1:1 2:1 SOY LINSEED1:20
40
80
120
160
p25
Car
bony
latio
n (F
TSC
Inte
nsity
)
a a
aa
b
Fig. 3. Oxidized kidney proteins of Wistar rats supplemented with various diets.
(A) 1-DE FTSC-stained gel of cytoplasmatic kidney proteins from the various
dietary groups. Lanes 1–4, EPA:DHA 1:1; lanes 5–7, EPA:DHA 2:1; lanes 8 and 9,
EPA:DHA 1:2; lanes 10–13, soybean oil; lanes 14–17, linseed oil. (B) Protein
carbonylation (FTSC intensity) of the kidney protein band with strongest oxida-
tion, p25, for the various dietary groups. Data are presented as means 7 SD.
66
45
30
97
kDa
Lane 152 3 4 5 6 7 81 14131211109
1:1 2:1 1:2 Soy Linseed
16
0
10
20
30
40
50
60
70
a
a,bb
bb
Act
in C
arbo
nyla
tion
(FTS
C In
tens
ity)
actin
LINSEEDSOY1:22:11:1
Fig. 4. Oxidized skeletal muscle proteins of Wistar rats supplemented with
various diets. (A) 1-DE FTSC-stained gel of fresh myofibrillar skeletal muscle
proteins from the various dietary groups. Lanes 1–3, EPA:DHA 1:1; lanes 4–7,
EPA:DHA 2:1; lanes 8–10, EPA:DHA 1:2; lanes 11–13, soybean oil; lanes 14–16,
linseed oil. (B) Total skeletal protein carbonylation (FTSC intensity) for the various
dietary groups. Data are presented as means 7 SD.
L. Mendez et al. / Free Radical Biology and Medicine 55 (2013) 8–2014
the dietary groups revealed significant differences in the carbo-nylation status of albumin (Fig. 2B). Control animals suppliedwith soybean oil, whose major component is LA (18:2 n-6), whichrepresents 47.5% of the total fatty acids, exhibited a significantlyhigher carbonylation level compared to animals on the diets thatincorporated linseed and fish oils, which are composed ofapproximately 50% o3 PUFAs (Table 1). Significant differenceswere also observed in the effect of dietary fish oil supplementa-tion depending on the EPA:DHA ratio. Albumin exhibited lower(po0.05) carbonylation in plasma from animals fed EPA/DHA(1:1). Animal supplementation with EPA/DHA (1:2) resulted in anintermediate oxidation level, whereas the mixture with thehighest amount of EPA/DHA (2:1) showed higher albumin oxida-tion (Fig. 2B). The levels of albumin oxidation in the EPA:DHA(2:1) group were similar to those provided by the diet enriched inthe short-chain o3 ALA (18:3), the linseed dietary group. There-fore, albumin oxidation revealed the following increasing trend:1:1 o1:2 o2:1E linseed o soybean.
The analysis of the oxidative level of plasma proteins afterdepletion of the seven most abundant proteins (albumin, IgG,IgM, haptoglobin, a1-antitrypsin, transferrin, fibrinogen) did notreveal a significant effect of dietary intervention on the carbony-lation state of the less abundant plasma proteins (data notshown). These results stress that albumin is the most importanttarget of protein oxidation in plasma and that its oxidative statusis highly influenced by the type of fatty acids consumed. Dietsrich in the long-chain n-3 EPA and DHA, in particular with a ratio1:1, provided an important reduction of albumin oxidationcompared to diets enriched in the o6 LA.
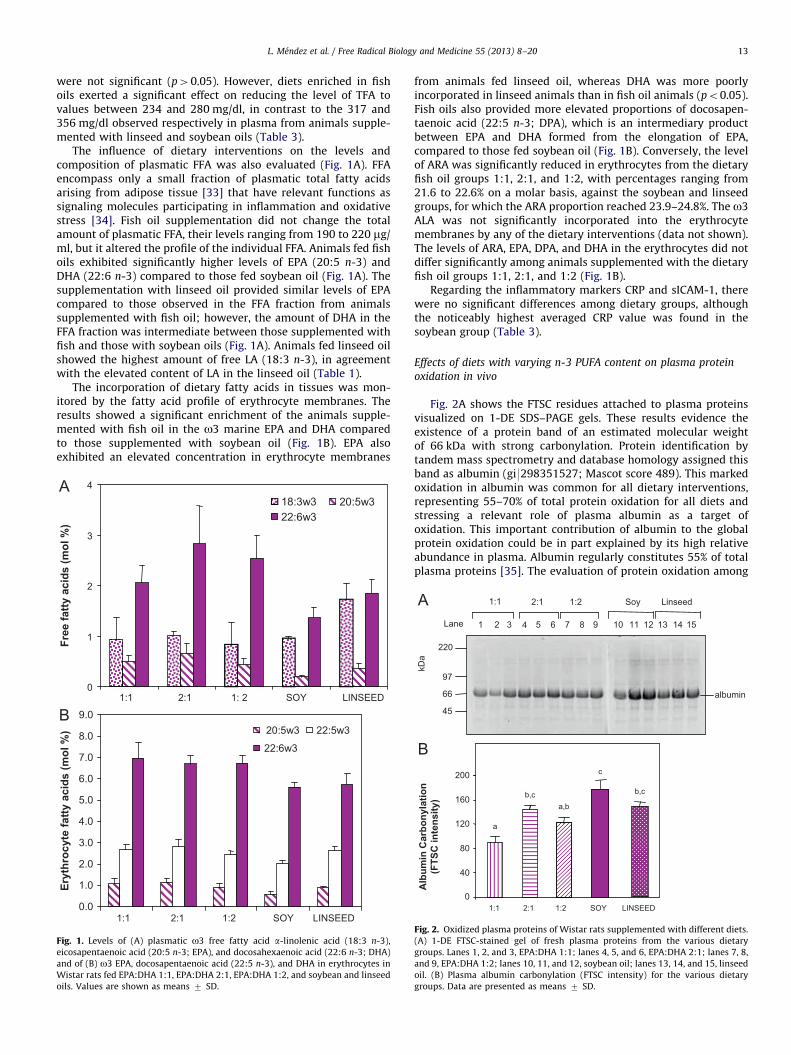
Effects of diets with varying n-3 PUFA content on kidney protein
oxidation in vivo
Fig. 3A illustrates the oxidative state of cytoplasmic kidneyproteins found in the five experimental animal groups. Thepresence of a protein band over 25 kDa, p25, with strong carbo-nylation was observed for all diets, although it was present atvery low abundance and was not visualized in the Coomassie-stained gel (data not shown). The low concentration for p25 didnot enable satisfactory protein identification. Minor carbonylationwas observed for the other proteins. The supplementation withfish PUFAs resulted in reduced p25 oxidation (Fig. 3B). In agree-ment with data of plasma albumin, animals fed EPA/DHA at the1:1 ratio exhibited p25 with the weakest mean oxidation score,and the highest level of oxidation was observed in rats supple-mented with soybean oil (po0.05). Diets incorporating linseed oilor other proportions of EPA/DHA (2:1 and 1:2) showed p25 at anintermediate oxidative state.
Effects of diets with varying n-3 PUFA content on skeletal muscle
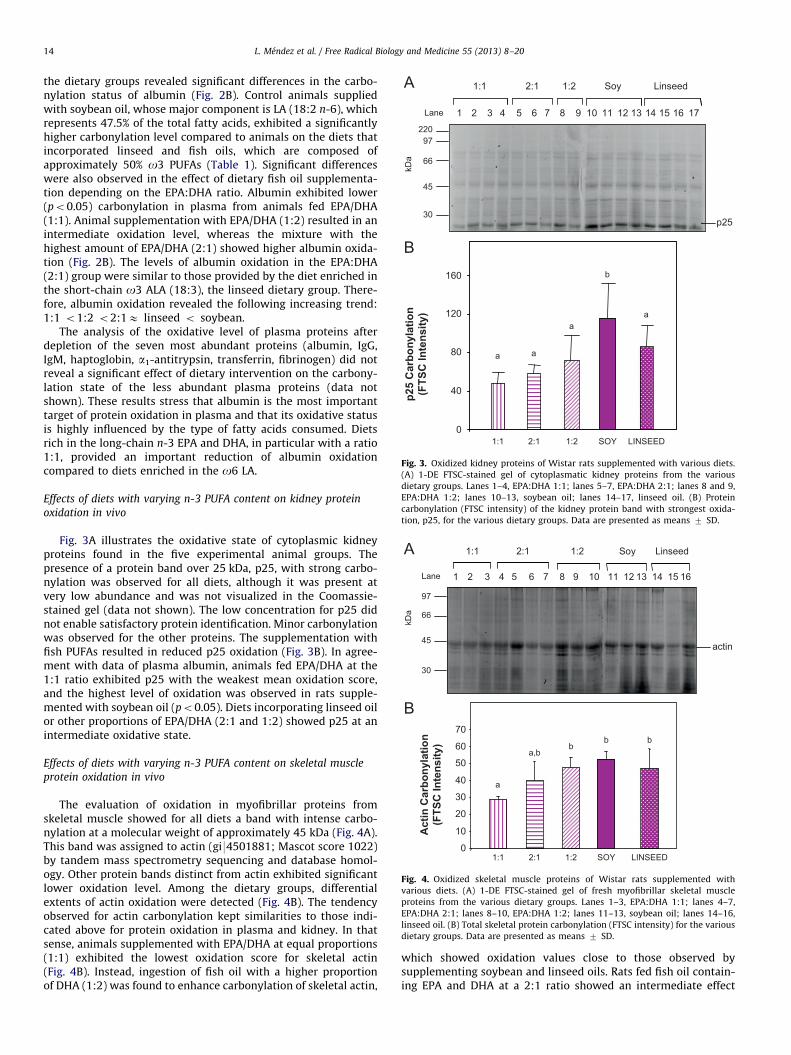
protein oxidation in vivo
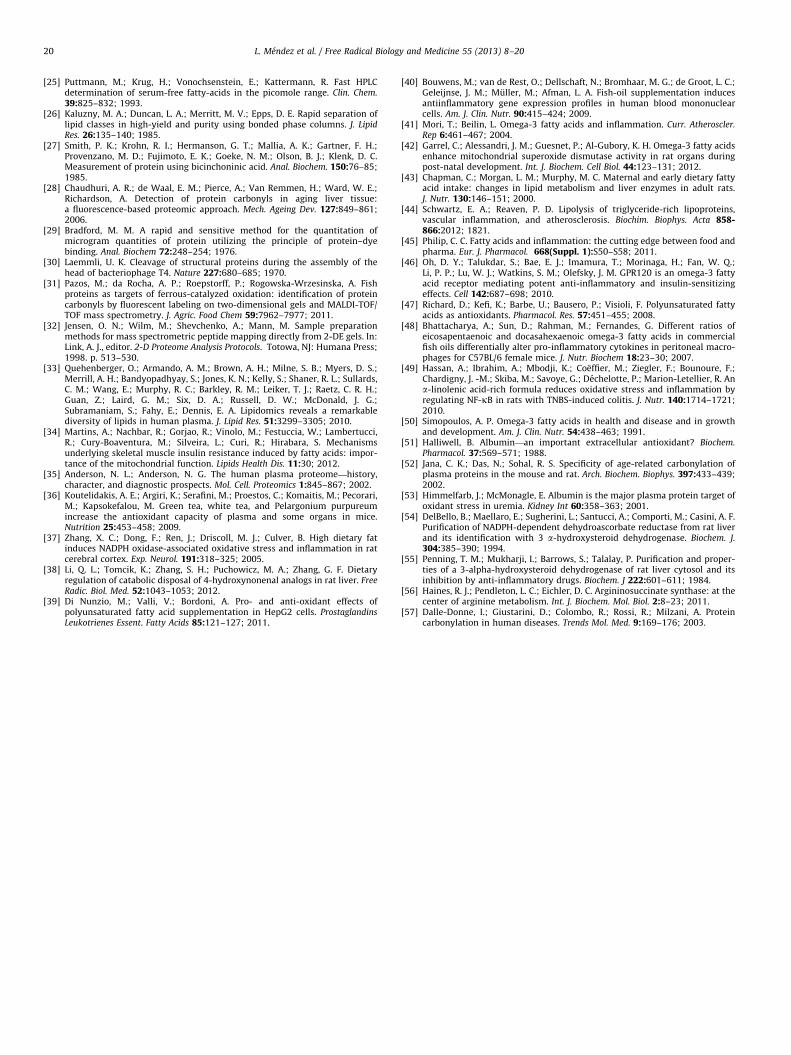
The evaluation of oxidation in myofibrillar proteins fromskeletal muscle showed for all diets a band with intense carbo-nylation at a molecular weight of approximately 45 kDa (Fig. 4A).This band was assigned to actin (gi94501881; Mascot score 1022)by tandem mass spectrometry sequencing and database homol-ogy. Other protein bands distinct from actin exhibited significantlower oxidation level. Among the dietary groups, differentialextents of actin oxidation were detected (Fig. 4B). The tendencyobserved for actin carbonylation kept similarities to those indi-cated above for protein oxidation in plasma and kidney. In thatsense, animals supplemented with EPA/DHA at equal proportions(1:1) exhibited the lowest oxidation score for skeletal actin(Fig. 4B). Instead, ingestion of fish oil with a higher proportionof DHA (1:2) was found to enhance carbonylation of skeletal actin,
which showed oxidation values close to those observed bysupplementing soybean and linseed oils. Rats fed fish oil contain-ing EPA and DHA at a 2:1 ratio showed an intermediate effect
L. Mendez et al. / Free Radical Biology and Medicine 55 (2013) 8–20 15
between the lowest and the highest actin oxidation level providedrespectively by 1:1 and 1:2 ratios.
Effects of diets with varying n-3 PUFA content on in vivo liver
protein oxidation
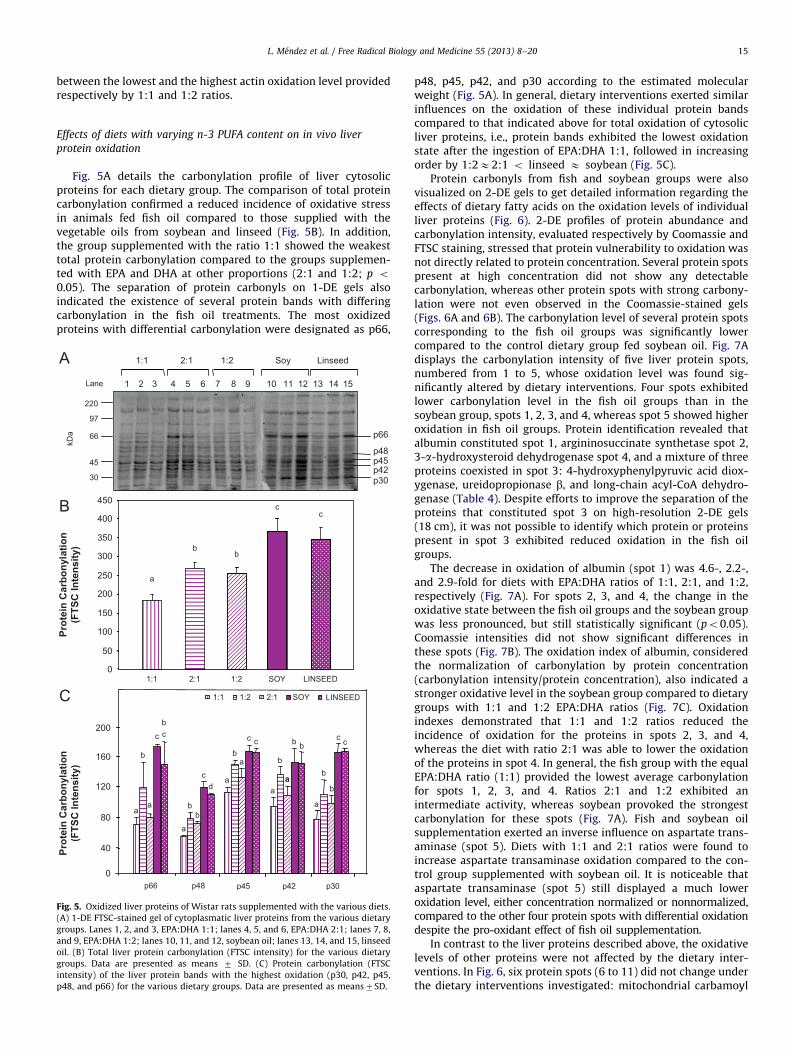
Fig. 5A details the carbonylation profile of liver cytosolicproteins for each dietary group. The comparison of total proteincarbonylation confirmed a reduced incidence of oxidative stressin animals fed fish oil compared to those supplied with thevegetable oils from soybean and linseed (Fig. 5B). In addition,the group supplemented with the ratio 1:1 showed the weakesttotal protein carbonylation compared to the groups supplemen-ted with EPA and DHA at other proportions (2:1 and 1:2; p o0.05). The separation of protein carbonyls on 1-DE gels alsoindicated the existence of several protein bands with differingcarbonylation in the fish oil treatments. The most oxidizedproteins with differential carbonylation were designated as p66,
Fig. 5. Oxidized liver proteins of Wistar rats supplemented with the various diets.
(A) 1-DE FTSC-stained gel of cytoplasmatic liver proteins from the various dietary
groups. Lanes 1, 2, and 3, EPA:DHA 1:1; lanes 4, 5, and 6, EPA:DHA 2:1; lanes 7, 8,
and 9, EPA:DHA 1:2; lanes 10, 11, and 12, soybean oil; lanes 13, 14, and 15, linseed
oil. (B) Total liver protein carbonylation (FTSC intensity) for the various dietary
groups. Data are presented as means 7 SD. (C) Protein carbonylation (FTSC
intensity) of the liver protein bands with the highest oxidation (p30, p42, p45,
p48, and p66) for the various dietary groups. Data are presented as means7SD.
p48, p45, p42, and p30 according to the estimated molecularweight (Fig. 5A). In general, dietary interventions exerted similarinfluences on the oxidation of these individual protein bandscompared to that indicated above for total oxidation of cytosolicliver proteins, i.e., protein bands exhibited the lowest oxidationstate after the ingestion of EPA:DHA 1:1, followed in increasingorder by 1:2E2:1 o linseed E soybean (Fig. 5C).
Protein carbonyls from fish and soybean groups were alsovisualized on 2-DE gels to get detailed information regarding theeffects of dietary fatty acids on the oxidation levels of individualliver proteins (Fig. 6). 2-DE profiles of protein abundance andcarbonylation intensity, evaluated respectively by Coomassie andFTSC staining, stressed that protein vulnerability to oxidation wasnot directly related to protein concentration. Several protein spotspresent at high concentration did not show any detectablecarbonylation, whereas other protein spots with strong carbony-lation were not even observed in the Coomassie-stained gels(Figs. 6A and 6B). The carbonylation level of several protein spotscorresponding to the fish oil groups was significantly lowercompared to the control dietary group fed soybean oil. Fig. 7Adisplays the carbonylation intensity of five liver protein spots,numbered from 1 to 5, whose oxidation level was found sig-nificantly altered by dietary interventions. Four spots exhibitedlower carbonylation level in the fish oil groups than in thesoybean group, spots 1, 2, 3, and 4, whereas spot 5 showed higheroxidation in fish oil groups. Protein identification revealed thatalbumin constituted spot 1, argininosuccinate synthetase spot 2,3-a-hydroxysteroid dehydrogenase spot 4, and a mixture of threeproteins coexisted in spot 3: 4-hydroxyphenylpyruvic acid diox-ygenase, ureidopropionase b, and long-chain acyl-CoA dehydro-genase (Table 4). Despite efforts to improve the separation of theproteins that constituted spot 3 on high-resolution 2-DE gels(18 cm), it was not possible to identify which protein or proteinspresent in spot 3 exhibited reduced oxidation in the fish oilgroups.
The decrease in oxidation of albumin (spot 1) was 4.6-, 2.2-,and 2.9-fold for diets with EPA:DHA ratios of 1:1, 2:1, and 1:2,respectively (Fig. 7A). For spots 2, 3, and 4, the change in theoxidative state between the fish oil groups and the soybean groupwas less pronounced, but still statistically significant (po0.05).Coomassie intensities did not show significant differences inthese spots (Fig. 7B). The oxidation index of albumin, consideredthe normalization of carbonylation by protein concentration(carbonylation intensity/protein concentration), also indicated astronger oxidative level in the soybean group compared to dietarygroups with 1:1 and 1:2 EPA:DHA ratios (Fig. 7C). Oxidationindexes demonstrated that 1:1 and 1:2 ratios reduced theincidence of oxidation for the proteins in spots 2, 3, and 4,whereas the diet with ratio 2:1 was able to lower the oxidationof the proteins in spot 4. In general, the fish group with the equalEPA:DHA ratio (1:1) provided the lowest average carbonylationfor spots 1, 2, 3, and 4. Ratios 2:1 and 1:2 exhibited anintermediate activity, whereas soybean provoked the strongestcarbonylation for these spots (Fig. 7A). Fish and soybean oilsupplementation exerted an inverse influence on aspartate trans-aminase (spot 5). Diets with 1:1 and 2:1 ratios were found toincrease aspartate transaminase oxidation compared to the con-trol group supplemented with soybean oil. It is noticeable thataspartate transaminase (spot 5) still displayed a much loweroxidation level, either concentration normalized or nonnormalized,compared to the other four protein spots with differential oxidationdespite the pro-oxidant effect of fish oil supplementation.
In contrast to the liver proteins described above, the oxidativelevels of other proteins were not affected by the dietary inter-ventions. In Fig. 6, six protein spots (6 to 11) did not change underthe dietary interventions investigated: mitochondrial carbamoyl
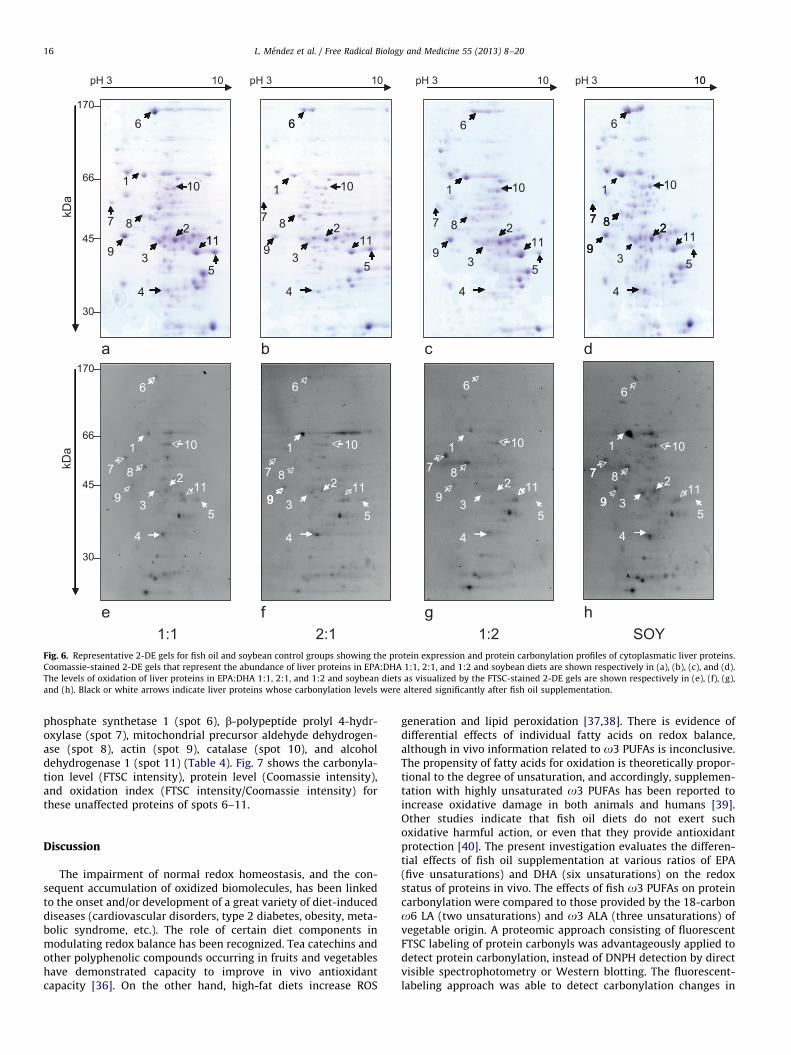
Fig. 6. Representative 2-DE gels for fish oil and soybean control groups showing the protein expression and protein carbonylation profiles of cytoplasmatic liver proteins.
Coomassie-stained 2-DE gels that represent the abundance of liver proteins in EPA:DHA 1:1, 2:1, and 1:2 and soybean diets are shown respectively in (a), (b), (c), and (d).
The levels of oxidation of liver proteins in EPA:DHA 1:1, 2:1, and 1:2 and soybean diets as visualized by the FTSC-stained 2-DE gels are shown respectively in (e), (f), (g),
and (h). Black or white arrows indicate liver proteins whose carbonylation levels were altered significantly after fish oil supplementation.
L. Mendez et al. / Free Radical Biology and Medicine 55 (2013) 8–2016
phosphate synthetase 1 (spot 6), b-polypeptide prolyl 4-hydr-oxylase (spot 7), mitochondrial precursor aldehyde dehydrogen-ase (spot 8), actin (spot 9), catalase (spot 10), and alcoholdehydrogenase 1 (spot 11) (Table 4). Fig. 7 shows the carbonyla-tion level (FTSC intensity), protein level (Coomassie intensity),and oxidation index (FTSC intensity/Coomassie intensity) forthese unaffected proteins of spots 6–11.
Discussion
The impairment of normal redox homeostasis, and the con-sequent accumulation of oxidized biomolecules, has been linkedto the onset and/or development of a great variety of diet-induceddiseases (cardiovascular disorders, type 2 diabetes, obesity, meta-bolic syndrome, etc.). The role of certain diet components inmodulating redox balance has been recognized. Tea catechins andother polyphenolic compounds occurring in fruits and vegetableshave demonstrated capacity to improve in vivo antioxidantcapacity [36]. On the other hand, high-fat diets increase ROS
generation and lipid peroxidation [37,38]. There is evidence ofdifferential effects of individual fatty acids on redox balance,although in vivo information related to o3 PUFAs is inconclusive.The propensity of fatty acids for oxidation is theoretically propor-tional to the degree of unsaturation, and accordingly, supplemen-tation with highly unsaturated o3 PUFAs has been reported toincrease oxidative damage in both animals and humans [39].Other studies indicate that fish oil diets do not exert suchoxidative harmful action, or even that they provide antioxidantprotection [40]. The present investigation evaluates the differen-tial effects of fish oil supplementation at various ratios of EPA(five unsaturations) and DHA (six unsaturations) on the redoxstatus of proteins in vivo. The effects of fish o3 PUFAs on proteincarbonylation were compared to those provided by the 18-carbono6 LA (two unsaturations) and o3 ALA (three unsaturations) ofvegetable origin. A proteomic approach consisting of fluorescentFTSC labeling of protein carbonyls was advantageously applied todetect protein carbonylation, instead of DNPH detection by directvisible spectrophotometry or Western blotting. The fluorescent-labeling approach was able to detect carbonylation changes in
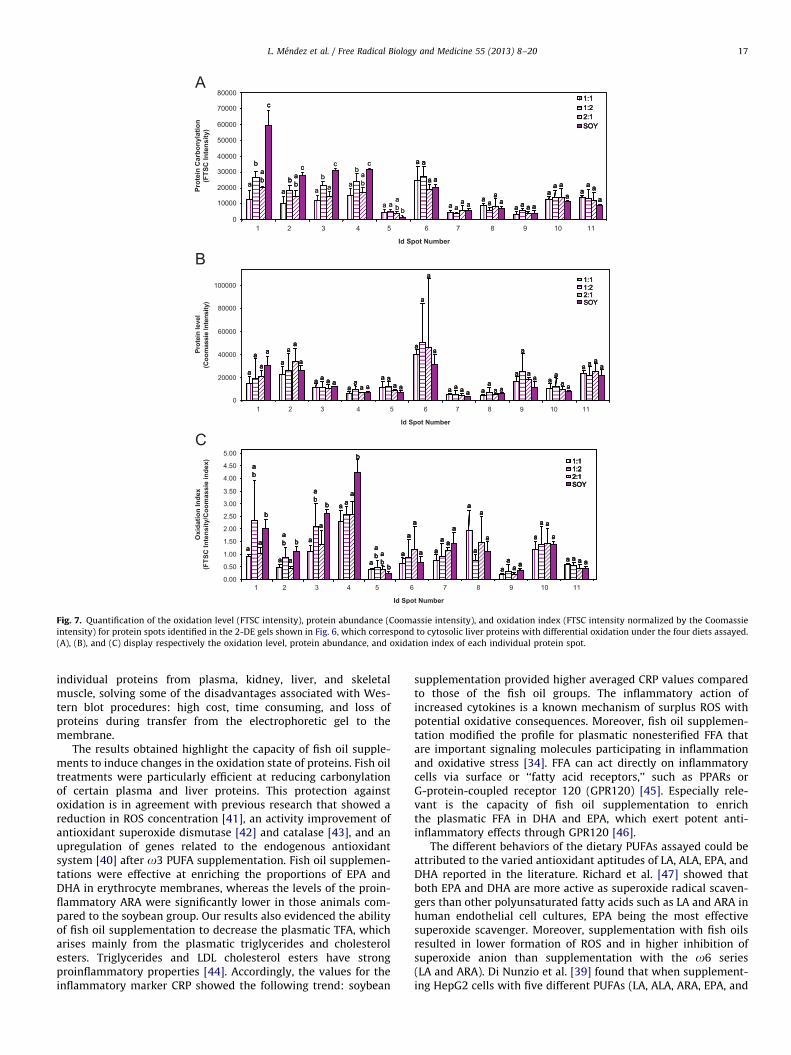
Fig. 7. Quantification of the oxidation level (FTSC intensity), protein abundance (Coomassie intensity), and oxidation index (FTSC intensity normalized by the Coomassie
intensity) for protein spots identified in the 2-DE gels shown in Fig. 6, which correspond to cytosolic liver proteins with differential oxidation under the four diets assayed.
(A), (B), and (C) display respectively the oxidation level, protein abundance, and oxidation index of each individual protein spot.
L. Mendez et al. / Free Radical Biology and Medicine 55 (2013) 8–20 17
individual proteins from plasma, kidney, liver, and skeletalmuscle, solving some of the disadvantages associated with Wes-tern blot procedures: high cost, time consuming, and loss ofproteins during transfer from the electrophoretic gel to themembrane.
The results obtained highlight the capacity of fish oil supple-ments to induce changes in the oxidation state of proteins. Fish oiltreatments were particularly efficient at reducing carbonylationof certain plasma and liver proteins. This protection againstoxidation is in agreement with previous research that showed areduction in ROS concentration [41], an activity improvement ofantioxidant superoxide dismutase [42] and catalase [43], and anupregulation of genes related to the endogenous antioxidantsystem [40] after o3 PUFA supplementation. Fish oil supplemen-tations were effective at enriching the proportions of EPA andDHA in erythrocyte membranes, whereas the levels of the proin-flammatory ARA were significantly lower in those animals com-pared to the soybean group. Our results also evidenced the abilityof fish oil supplementation to decrease the plasmatic TFA, whicharises mainly from the plasmatic triglycerides and cholesterolesters. Triglycerides and LDL cholesterol esters have strongproinflammatory properties [44]. Accordingly, the values for theinflammatory marker CRP showed the following trend: soybean
supplementation provided higher averaged CRP values comparedto those of the fish oil groups. The inflammatory action ofincreased cytokines is a known mechanism of surplus ROS withpotential oxidative consequences. Moreover, fish oil supplemen-tation modified the profile for plasmatic nonesterified FFA thatare important signaling molecules participating in inflammationand oxidative stress [34]. FFA can act directly on inflammatorycells via surface or ‘‘fatty acid receptors,’’ such as PPARs orG-protein-coupled receptor 120 (GPR120) [45]. Especially rele-vant is the capacity of fish oil supplementation to enrichthe plasmatic FFA in DHA and EPA, which exert potent anti-inflammatory effects through GPR120 [46].
The different behaviors of the dietary PUFAs assayed could beattributed to the varied antioxidant aptitudes of LA, ALA, EPA, andDHA reported in the literature. Richard et al. [47] showed thatboth EPA and DHA are more active as superoxide radical scaven-gers than other polyunsaturated fatty acids such as LA and ARA inhuman endothelial cell cultures, EPA being the most effectivesuperoxide scavenger. Moreover, supplementation with fish oilsresulted in lower formation of ROS and in higher inhibition ofsuperoxide anion than supplementation with the o6 series(LA and ARA). Di Nunzio et al. [39] found that when supplement-ing HepG2 cells with five different PUFAs (LA, ALA, ARA, EPA, and
Table 4Identification of cytosolic liver proteins with various carbonylation levels among groups supplemented with dietary oils.
Spot Identification NCBI Acc.
No.
SEQUEST
score
No.
matching
peptides
(MS)
Sequence
coverage
(%)
Peptide sequences MW
(kDa)
1 Albumin gi919705431 208 9 19 CCTLPEAQR; DLGEQHFK; LRDNYGELADCCAK;
AADKDNCFATEGPNLVAR; SIHTLFGDK; AETFTFHSDICTLPDKEK;
FPNAEFAEITK; TVMGDFAQFVDK; RHPYFAPELLYYAEK
68.7
2 Argininosuccinate
synthetase
gi916950633 152 6 18 MPEFYNR; NQAPPGLYTK; GQVYILGR; QHGIPIPVTPK;
FAELVYTGFQHSPECEFVR; EQGYDVIAYLANIGQK
46.5
3 4-Hydroxyphenylpyruvic
acid dioxygenase
gi98393557 142 7 23 GNLTDLETNGVR; TEDIITTIR; MGFEPLAYK; ENMDVLEELK;
SQIQEYVDYNGGAGVQHIALR; DIAFEVEKCEHIVQK; GMEFLAVPSSYYR
45.1
b-Ureidopropionase gi916758704 120 8 25 VGLVQNR; VGQEHYPNEFTSGDKK; GYAFGAAK; HLPPDDLSQVK;
NLDLPR; ELAEAVKPNYSPNIVK; IPLPTSAPVAEQVSALHK;
EKLPWTEFAESAEDGLTTR
44.0
Long-chain acyl-CoA
dehydrogenase,
mitochondrial precursor
gi96978431 94 4 12 EQIEQFIPQMTAGK; LPASALLGEENK; AFVDSCLQLHETK;
VQPIYGGTNEIMK
47.6
4 3-a-Hydroxysteroid
dehydrogenase
gi919924087 136 6 27 YFDDHPNHPFTDE; GVVPLIR; SKDIILVSYCTLGSSR; SPVLLDDPVLCAIAK;
VALNDGNFIPVLGFGTTVPEK; HFDSAYLYEVEEEVGQAIR
37.0
5 Aspartate transaminase gi9350611 320 9 30 DAGMQLEGYR; VGASFLQR; ASAELALGENSEVLK; FVTVQTISGTGALR;
HFIEQGINVCLCQSYAK; IAATILTSPDLR; ILIRPLYSNPPLNGAR;
NLDKEYLPIGGLADFCK; TCGFDFSGALEDISK; EYLPIGGLADFCK
44.3
6 Carbamoyl-phosphate
synthetase 1, mitochondrial
gi98393186 280 14 14 VMGESVDEK; DELGLNK; ETLMDLGTK; GQNQPVLNITNR;
GLNSESVTEETLR; AFAMTNQILVER; GTTITSVLPK; ANENNMSLDEIVK;
GQILTMANPIIGNGGAPDTTAR; SAYALGGLGSGICPNK;
IEFEGQSVDFDPNKQNLIAEVSTK; HLPTLEQPIIPSDYVAIK;
EPLFGISTGNIITGLAAGAK; QADAVYFLPITPQFVTEVIK
164.5
7 Prolyl 4-hydroxylase,
b polypeptide
gi96981324 242 13 27 MDSTANEVEAVK; YKPESDELTAEK; TVIDYNGER; NNFEGEITK;
FFPASADR; IFGGEIK; LITLEEEMTK; ITQFCHHFLEGK;
VDATEESDLAQQYGVR; NFEEVAFDEK; DGVVLFK; QLAPIWDK;
EADDIVNWLK
56.8
8 Aldehyde dehydrogenase,
mitochondrial precursor
(ALDH class 2)
gi9118502 86 4 7 LLCGGGAAADR; VTLEIGGK; VVGNPFDSR; YGLAAAVFTK 56.7
9 Actin gi966821579 222 7 19 DSYVGDEAQSK; AGFAGDDAPR; IIAPPER; EEYDESGPSIVHR;
ELTALAPSTMK; IWHHTFYNELR; AVFPSIVGR
41.6
10 Catalase gi96978607 168 7 17 NLPVEEAGR; LAQEDPDYGLR; NFTDVHPDYGAR;
APQKPDVLTTGGGNPIGDK; VQALLDQYNSQKPK; DAQLFIQR;
EAETFPFNPFDLTK
59.7
11 Alcohol dehydrogenase
1 (ADH A subunit)
gi96978607 248 8 31 HPESNLCCQTK; GALLDGTSR; IDAAAPLDK; ELGATDCINPQDYTK;
VIPLFSPQCGK; VCLIGCGFSTGYGSAVQVAK; KFPLEPLITHVLPFEK;
VTPGSTCAVFGLGGVGLSVVIGCK
39.6
Spots of interest were identified by LC–ESI–IT–MS/MS as described under Experimental procedures. Protein spot numbers refer to the numbered spots in the 2-DE gels
shown in Fig. 6. For each protein spot, different parameters supporting the protein identification by MS are indicated: number of matching peptides, percentage sequence
coverage, sequences of sequenced peptides, SEQUEST score, and theoretical protein mass (MW).
L. Mendez et al. / Free Radical Biology and Medicine 55 (2013) 8–2018
DHA) DHA was the most effective at improving antioxidantdefenses without showing any adverse effect on cell viability.Other authors have suggested that fish oils with higher EPA:DHAratios enhance the activity of some antioxidant enzymes in mice[48]. These differential effects of EPA and DHA on in vivo redoxbalance may contribute to the different degrees of protein oxida-tion observed in animals fed fish oils varying in EPA and DHAcontent. In contrast with these studies, our results suggest that1:1 is the optimal EPA:DHA ratio to prevent irreversible oxidativemodifications such as protein carbonylation.
Our data highlight the beneficial effect of fish oil in reducingprotein oxidation compared to diets enriched in less unsaturatedo3 and o6 PUFAs such as ALA and LA. In agreement with theliterature, the o6 series ALA and ARA are less effective atpromoting the antioxidative systems. The worse antioxidantability of soybean oil could be due to the fact that this oil,although in itself not having significantly higher amounts ofARA, is rich in LA (natural precursor of ARA) and it has beenshown that ARA itself generates ROS through ARA-derived eico-sanoids [47]. Supplementation with ALA, the major n-3 PUFA inthe linseed diet, has demonstrated beneficial effects on cardio-vascular disease, inflammatory processes, and oxidative stressmarkers [49]. Our results indicate that ALA is not as effective as
fish oils for decreasing in vivo protein oxidation. This fact may bedue to the poor physiological conversion of dietary ALA to EPAand DHA [6,50], and therefore, ALA cannot equal the effects foundfor the direct supplementation with EPA and DHA.
The results obtained show that albumin is the major target foroxidation in plasma, in agreement with Halliwell [51], whoproposed albumin as an important extracellular antioxidant.Several investigations have also identified albumin as the majortarget for oxidation either in natural processes such as aging [52]or in pathological conditions as chronic renal failure [53]. Plas-matic albumin exerts an important function in the transport ofplasmatic FFA. Dietary fish oil interventions modified significantlythe profile of FFA by increasing the levels of the oxidizable EPAand DHA, but it did not correspond to increased oxidative damageof the plasmatic albumin. The soybean treatment provided thehighest oxidation of plasmatic albumin although levels of plas-matic nonesterified EPA and DHA were the lowest. Becauseplasma albumin oxidation seems to be indicative of the oxidativestress level, it is worth noting the efficiency of fish oil, especiallywith the 1:1 EPA:DHA ratio, at repressing albumin oxidationcompared to soybean supplementation. In liver, the oxidativelevel of albumin was significantly increased with soybean sup-plementation and reduced in the 1:1 group.
L. Mendez et al. / Free Radical Biology and Medicine 55 (2013) 8–20 19
The enzyme 3-a-hydroxysteroid dehydrogenase (AKR), a nicoti-namide nucleotide-dependent oxide reductase that catalyzes inter-conversions of hydroxyl to carbonyl groups of steroids, was anotherliver protein with significantly low carbonylation under fish oilsupplementation. This important multifunctional oxide reductase iscapable of metabolizing steroid hormones, polycyclic aromatichydrocarbons, and prostaglandins and is necessary to both bile acidsynthesis and the efficient intercellular transport of bile acids intohepatic cells. In addition, AKR has been shown as one of the NADPH-dependent enzymes implicated in the reductive regeneration ofascorbic acid in the liver, especially under oxidative stress [54].Therefore, the highest carbonylation level of AKR triggered bysoybean oil compared with fish oil suggests that diets with longo3 PUFAs are able to protect this protein from oxidation and then tomaintain the functions attributed to this protein [55].
The carbonylation states of liver argininosuccinate synthetase(ASS) and aspartate aminotransferase (AST), which are keyenzymes in hepatic nitrogen metabolism, were also influencedby fish oil supplementation. In liver, ASS is highly expressedbecause of its primal role in ammonia detoxification, and itsexpression is subjected to both hormonal and nutritional regula-tion. When ASS activity decreases, the optimal removal of toxicammonia may be affected and, finally, would lead to metabolicdisturbances as hyperammonemia [56]. This potentially deleter-ious effect could be enhanced by AST. Moreover, AST participatesin critical pathways in the liver by catalyzing the conversionbetween L-aspartate and L-glutamate. Both amino acids aredonors of nitrogen for the synthesis of urea; particularly, oxida-tive deamination of L-glutamate generates ammonia in hepaticmitochondria. In comparison with fish oil diets, the soybeansupplementation resulted in a slightly lower level of carbonyla-tion of AST and a significant increase in ASS oxidative damage.Therefore under soybean oil, the detoxification of ammoniathrough the urea cycle could be reduced.
Actin carbonylation has been considered a sign of severefunctional impairment associated with filament disruption. Thisfunctional alteration has been found in several diseases closelyrelated to oxidative stress such as Alzheimer disease, inflamma-tory bowel disease, and rat myocardial ischemia [57]. Our resultsfor the skeletal muscle myofibrillar proteins show that themixture EPA:DHA 1:1 significantly decreased actin carbonylationlevel, putatively reducing actin oxidative damage in this tissue.
In conclusion, we have used a reliable proteomic method for theassessment of carbonylation levels of individual proteins in varioustissues after nutritional interventions in rats. The results confirmedthe efficiency of fish PUFA supplementation at increasing the levels ofEPA and DHA in tissues and at protecting proteins against in vivooxidation. Five specific proteins were identified as targets of action ofthe fish oil supplements. This antioxidant effect was dependent onthe ratio between the two long-chain o3 PUFAs, EPA and DHA, andthe mixture with the ratio 1:1 was the most protective againstprotein carbonylation. More investigation is needed to understandthe mechanism and biological implication of this selectively protec-tive function. The present research provides evidence that in additionto an adequate dietary proportion between n-6 and n-3 PUFAs, theproportion between PUFAs within the n-3 type is also important forthe function and positive effects of dietary marine fatty acids.The results may be a good starting point to go deeper into themechanisms by which fish oil supplementation improves in vivooxidative status and to clarify the optimal proportions of EPA/DHA.
Acknowledgments
This investigation was supported by the Spanish Ministry ofScience and Innovation (Grants AGL2009-12374-C03-01, -02, and
-03). The Spanish Ministry of Science and Innovation and Xuntade Galicia are also gratefully acknowledged for the doctoralfellowship to L.M. and the postdoctoral ‘‘Isidro Parga Pondal’’contract to M.P. J.P.-J. thanks the Spanish Ministry of Science andInnovation and the ISCIII for her ‘‘Sara Borrell’’ postdoctoralcontract (CD09/00068).
References
[1] Stadtman, E. R.; Levine, R. L. Protein oxidation. Ann. N. Y. Acad. Sci. 899:191–208;2000.
[2] Szweda, P. A.; Friguet, B.; Szweda, L. I. Proteolysis, free radicals, and aging.Free Radic. Biol. Med. 33:29–36; 2002.
[3] Grella, A.; Bolea, I. Oxidative stress in Alzheimer’s disease: pathogenesis,biomarkers and therapy. In: De La Monte, S., Ed. Mental and BehaviouralDisorders and Diseases of the Nervous System. Available from /http://www.intechopen.com/books/alzheimer-s-disease-pathogenesis-core-concepts-shifting-paradigms-and-therapeutic-targets/oxidative-stress-in-alzheimer-s-disease-pathogenesis-biomarkers-and-therapyS. InTech, September 2011.
[4] Simopoulos, A. P. Essential fatty acids in health and chronic disease. Am.J. Clin. Nutr. 70:560S–569S; 1999.
[5] Calder, P. C. n-3 polyunsaturated fatty acids, inflammation, and inflammatorydiseases. Am. J. Clin. Nutr. 83:1505S–1519S; 2006.
[6] Whelan, J.; Rust, C. Innovative dietary sources of n-3 fatty acids. Annu. Rev.Nutr. 26:75–103; 2006.
[7] Cottin, S. C.; Sanders, T. A.; Hall, W. L. The differential effects of EPA and DHAon cardiovascular risk factors. Proc. Nutr. Soc. 70:215–231; 2011.
[8] SanGiovanni, J. P.; Chew, E. Y. The role of omega-3 long-chain polyunsatu-rated fatty acids in health and disease of the retina. Prog. Retinal Eye Res24:87–138; 2005.
[9] Perez-Martınez, P.; Perez-Jimenez, F.; Lopez-Miranda, J. n-3 PUFA andlipotoxicity. Biochim. Biophys. Acta 362-366:2010; 1801.
[10] Cunnane, S. C.; Plourde, M.; Pifferi, F.; Begin, M.; Feart, C.; Barberger-Gateau,P. Fish, docosahexaenoic acid and Alzheimer’s disease. Prog. Lipid Res.48:239–256; 2009.
[11] Vericel, E.; Polette, A.; Bacot, S.; Calzada, C.; Lagarde, M. Pro- and antioxidantactivities of docosahexaenoic acid on human blood platelets. J. Thromb.Haemostasis 1:566–572; 2003.
[12] Guillot, N.; Caillet, E.; Laville, M.; Calzada, C.; Lagarde, M.; Vericel, E. Increasingintakes of the long-chain omega-3 docosahexaenoic acid: effects onplatelet functions and redox status in healthy men. FASEB J 23:2909–2916;2009.
[13] Mori, T. A.; Dunstan, D. W.; Burke, V.; Croft, K. D.; Rivera, J. H.; Beilin, L. J.;Puddey, I. B. Effect of dietary fish and exercise training on urinary F2-isoprostane excretion in non-insulin-dependent diabetic patients. Metabo-lism 48:1402–1408; 1999.
[14] Mori, T. A.; Woodman, R. J.; Burke, V.; Puddey, I. B.; Croft, K. D.; Beilin, L. J.Effect of eicosapentaenoic acid and docosahexaenoic acid on oxidative stressand inflammatory markers in treated-hypertensive type 2 diabetic subjects.Free Radic. Biol. Med. 35:772–781; 2003.
[15] Bloomer, R. J.; Larson, D. E.; Fisher-Wellman, K. H.; Galpin, A. J.; Schilling, B. K.Effect of eicosapentaenoic and docosahexaenoic acid on resting and exercise-induced inflammatory and oxidative stress biomarkers: a randomized,placebo controlled, cross-over study. Lipids Health Dis. 8:12; 2009.
[16] Wander, R. C.; Du, S. L. Oxidation of plasma proteins is not increased aftersupplementation with eicosapentaenoic and docosahexaenoic acids. Am. J.Clin. Nutr. 72:731–737; 2000.
[17] Mavrommatis, Y.; Ross, K.; Rucklidge, G.; Reid, M.; Duncan, G.; Gordon, M. J.;Thies, F.; Sneddon, A.; de Roos, B. Intervention with fish oil, but not withdocosahexaenoic acid, results in lower levels of hepatic soluble epoxidehydrolase with time in apoE knockout mice. Br. J. Nutr. 103:16–24; 2010.
[18] Huang, X. Q.; Zhang, J.; Liu, J.; Sun, L.; Zhao, H. Y.; Lu, Y. G.; Wang, J. C.; Li, J.C-reactive protein promotes adhesion of monocytes to endothelial cells viaNADPH oxidase-mediated oxidative stress. J. Cell. Biochem. 113:857–867;2012.
[19] Matthijssens, F.; Braeckman, B. P.; Vanfleteren, J. R. Evaluation of differentmethods for assaying protein carbonylation. Curr. Anal. Chem. 3:93–102;2007.
[20] European Food Safety Authority. Scientific opinion on the substantiation ofhealth claims related to eicosapentaenoic acid (EPA), docosahexaenoic acid(DHA), docosapentaenoic acid (DPA) and maintenance of normal cardiacfunction, maintenance of normal blood glucose concentrations, maintenanceof normal blood pressure, maintenance of normal blood HDL-cholesterolconcentrations, maintenance of normal (fasting) blood concentrations oftriglycerides. EFSA J. 8:1796; 2010.
[21] Lepage, G.; Roy, C. C. Direct transesterification of all classes of lipids in a one-step reaction. J. Lipid Res. 27:114–120; 1986.
[22] Chapman, R. A.; Mackay, K. The estimation of peroxides in fats and oils byferric thiocyanate method. J. Am. Oil Chem. Soc 26:360–363; 1949.
[23] Bucolo, G.; David, H. Quantitative-determination of serum triglycerides byuse of enzymes. Clin. Chem. 19:476–482; 1973.
[24] Young, D. S. Effects of Disease on Clinical Laboratory Tests. Washington, DC:AACC Press; 2001.
L. Mendez et al. / Free Radical Biology and Medicine 55 (2013) 8–2020
[25] Puttmann, M.; Krug, H.; Vonochsenstein, E.; Kattermann, R. Fast HPLCdetermination of serum-free fatty-acids in the picomole range. Clin. Chem.39:825–832; 1993.
[26] Kaluzny, M. A.; Duncan, L. A.; Merritt, M. V.; Epps, D. E. Rapid separation oflipid classes in high-yield and purity using bonded phase columns. J. LipidRes. 26:135–140; 1985.
[27] Smith, P. K.; Krohn, R. I.; Hermanson, G. T.; Mallia, A. K.; Gartner, F. H.;Provenzano, M. D.; Fujimoto, E. K.; Goeke, N. M.; Olson, B. J.; Klenk, D. C.Measurement of protein using bicinchoninic acid. Anal. Biochem. 150:76–85;1985.
[28] Chaudhuri, A. R.; de Waal, E. M.; Pierce, A.; Van Remmen, H.; Ward, W. E.;Richardson, A. Detection of protein carbonyls in aging liver tissue:a fluorescence-based proteomic approach. Mech. Ageing Dev. 127:849–861;2006.
[29] Bradford, M. M. A rapid and sensitive method for the quantitation ofmicrogram quantities of protein utilizing the principle of protein–dyebinding. Anal. Biochem 72:248–254; 1976.
[30] Laemmli, U. K. Cleavage of structural proteins during the assembly of thehead of bacteriophage T4. Nature 227:680–685; 1970.
[31] Pazos, M.; da Rocha, A. P.; Roepstorff, P.; Rogowska-Wrzesinska, A. Fishproteins as targets of ferrous-catalyzed oxidation: identification of proteincarbonyls by fluorescent labeling on two-dimensional gels and MALDI-TOF/TOF mass spectrometry. J. Agric. Food Chem 59:7962–7977; 2011.
[32] Jensen, O. N.; Wilm, M.; Shevchenko, A.; Mann, M. Sample preparationmethods for mass spectrometric peptide mapping directly from 2-DE gels. In:Link, A. J., editor. 2-D Proteome Analysis Protocols. Totowa, NJ: Humana Press;1998. p. 513–530.
[33] Quehenberger, O.; Armando, A. M.; Brown, A. H.; Milne, S. B.; Myers, D. S.;Merrill, A. H.; Bandyopadhyay, S.; Jones, K. N.; Kelly, S.; Shaner, R. L.; Sullards,C. M.; Wang, E.; Murphy, R. C.; Barkley, R. M.; Leiker, T. J.; Raetz, C. R. H.;Guan, Z.; Laird, G. M.; Six, D. A.; Russell, D. W.; McDonald, J. G.;Subramaniam, S.; Fahy, E.; Dennis, E. A. Lipidomics reveals a remarkablediversity of lipids in human plasma. J. Lipid Res. 51:3299–3305; 2010.
[34] Martins, A.; Nachbar, R.; Gorjao, R.; Vinolo, M.; Festuccia, W.; Lambertucci,R.; Cury-Boaventura, M.; Silveira, L.; Curi, R.; Hirabara, S. Mechanismsunderlying skeletal muscle insulin resistance induced by fatty acids: impor-tance of the mitochondrial function. Lipids Health Dis. 11:30; 2012.
[35] Anderson, N. L.; Anderson, N. G. The human plasma proteome—history,character, and diagnostic prospects. Mol. Cell. Proteomics 1:845–867; 2002.
[36] Koutelidakis, A. E.; Argiri, K.; Serafini, M.; Proestos, C.; Komaitis, M.; Pecorari,M.; Kapsokefalou, M. Green tea, white tea, and Pelargonium purpureumincrease the antioxidant capacity of plasma and some organs in mice.Nutrition 25:453–458; 2009.
[37] Zhang, X. C.; Dong, F.; Ren, J.; Driscoll, M. J.; Culver, B. High dietary fatinduces NADPH oxidase-associated oxidative stress and inflammation in ratcerebral cortex. Exp. Neurol. 191:318–325; 2005.
[38] Li, Q. L.; Tomcik, K.; Zhang, S. H.; Puchowicz, M. A.; Zhang, G. F. Dietaryregulation of catabolic disposal of 4-hydroxynonenal analogs in rat liver. FreeRadic. Biol. Med. 52:1043–1053; 2012.
[39] Di Nunzio, M.; Valli, V.; Bordoni, A. Pro- and anti-oxidant effects ofpolyunsaturated fatty acid supplementation in HepG2 cells. ProstaglandinsLeukotrienes Essent. Fatty Acids 85:121–127; 2011.
[40] Bouwens, M.; van de Rest, O.; Dellschaft, N.; Bromhaar, M. G.; de Groot, L. C.;Geleijnse, J. M.; Muller, M.; Afman, L. A. Fish-oil supplementation inducesantiinflammatory gene expression profiles in human blood mononuclearcells. Am. J. Clin. Nutr. 90:415–424; 2009.
[41] Mori, T.; Beilin, L. Omega-3 fatty acids and inflammation. Curr. Atheroscler.Rep 6:461–467; 2004.
[42] Garrel, C.; Alessandri, J. M.; Guesnet, P.; Al-Gubory, K. H. Omega-3 fatty acidsenhance mitochondrial superoxide dismutase activity in rat organs duringpost-natal development. Int. J. Biochem. Cell Biol. 44:123–131; 2012.
[43] Chapman, C.; Morgan, L. M.; Murphy, M. C. Maternal and early dietary fattyacid intake: changes in lipid metabolism and liver enzymes in adult rats.J. Nutr. 130:146–151; 2000.
[44] Schwartz, E. A.; Reaven, P. D. Lipolysis of triglyceride-rich lipoproteins,vascular inflammation, and atherosclerosis. Biochim. Biophys. Acta 858-866:2012; 1821.
[45] Philip, C. C. Fatty acids and inflammation: the cutting edge between food andpharma. Eur. J. Pharmacol. 668(Suppl. 1):S50–S58; 2011.
[46] Oh, D. Y.; Talukdar, S.; Bae, E. J.; Imamura, T.; Morinaga, H.; Fan, W. Q.;Li, P. P.; Lu, W. J.; Watkins, S. M.; Olefsky, J. M. GPR120 is an omega-3 fattyacid receptor mediating potent anti-inflammatory and insulin-sensitizingeffects. Cell 142:687–698; 2010.
[47] Richard, D.; Kefi, K.; Barbe, U.; Bausero, P.; Visioli, F. Polyunsaturated fattyacids as antioxidants. Pharmacol. Res. 57:451–455; 2008.
[48] Bhattacharya, A.; Sun, D.; Rahman, M.; Fernandes, G. Different ratios ofeicosapentaenoic and docasahexaenoic omega-3 fatty acids in commercialfish oils differentially alter pro-inflammatory cytokines in peritoneal macro-phages for C57BL/6 female mice. J. Nutr. Biochem 18:23–30; 2007.
[49] Hassan, A.; Ibrahim, A.; Mbodji, K.; Coeffier, M.; Ziegler, F.; Bounoure, F.;Chardigny, J. -M.; Skiba, M.; Savoye, G.; Dechelotte, P.; Marion-Letellier, R. Ana-linolenic acid-rich formula reduces oxidative stress and inflammation byregulating NF-kB in rats with TNBS-induced colitis. J. Nutr. 140:1714–1721;2010.
[50] Simopoulos, A. P. Omega-3 fatty acids in health and disease and in growthand development. Am. J. Clin. Nutr. 54:438–463; 1991.
[51] Halliwell, B. Albumin—an important extracellular antioxidant? Biochem.Pharmacol. 37:569–571; 1988.
[52] Jana, C. K.; Das, N.; Sohal, R. S. Specificity of age-related carbonylation ofplasma proteins in the mouse and rat. Arch. Biochem. Biophys. 397:433–439;2002.
[53] Himmelfarb, J.; McMonagle, E. Albumin is the major plasma protein target ofoxidant stress in uremia. Kidney Int 60:358–363; 2001.
[54] DelBello, B.; Maellaro, E.; Sugherini, L.; Santucci, A.; Comporti, M.; Casini, A. F.Purification of NADPH-dependent dehydroascorbate reductase from rat liverand its identification with 3 a-hydroxysteroid dehydrogenase. Biochem. J.304:385–390; 1994.
[55] Penning, T. M.; Mukharji, I.; Barrows, S.; Talalay, P. Purification and proper-ties of a 3-alpha-hydroxysteroid dehydrogenase of rat liver cytosol and itsinhibition by anti-inflammatory drugs. Biochem. J 222:601–611; 1984.
[56] Haines, R. J.; Pendleton, L. C.; Eichler, D. C. Argininosuccinate synthase: at thecenter of arginine metabolism. Int. J. Biochem. Mol. Biol. 2:8–23; 2011.
[57] Dalle-Donne, I.; Giustarini, D.; Colombo, R.; Rossi, R.; Milzani, A. Proteincarbonylation in human diseases. Trends Mol. Med. 9:169–176; 2003.
Related Documents