Reduced functional connectivity in visual evoked potentials in children with autism spectrum disorder J.R. Isler a, * , K.M. Martien b,d , P.G. Grieve a , R.I. Stark a , M.R. Herbert c,d a Department of Pediatrics, Columbia University, 630 W. 168th St., New York, NY 10032, USA b Lurie Family Autism Center-LADDERS Clinic, Department of Pediatrics, Massachusetts General Hospital, Boston, MA, USA c Department of Neurology, Massachusetts General Hospital, Boston, MA, USA d TRANSCEND Research Program, Massachusetts General Hospital, Boston, MA, USA article info Article history: Accepted 6 May 2010 Available online 4 June 2010 Keywords: Autism Coherence EEG Power Synchrony Connectivity abstract Objective: An analysis of EEG synchrony between homologous early visual areas tested the hypothesis that interhemispheric functional connectivity during visual stimulation is reduced in children with aut- ism compared to controls. Methods: EEG power and coherence within and between two homologous regions of the occipital cortex were measured during long latency flash visual evoked potentials. Measures were compared between two groups of children (5.5–8.5 years), one with autism spectrum disorders and the other with typical development. Results: In and below the theta band, interhemispheric synchrony was reduced in autistic subjects com- pared to typical controls by as much as 50%. Above the theta band interhemispheric synchrony in autistic children became indistinguishable from what would occur for uncorrelated cortical activity. Interhemi- spheric synchrony in autistic subjects was decreased in spite of bilaterally increased power. Wavelet power showed autistic children had a more rapid initial response to stimulation, a slower recovery, and more modulation at longer latencies. Conclusions: Results suggest that the sensory cortices of autistic children are hypersensitive to stimula- tion with concurrent diminished functional connectivity between hemispheres. Significance: Simultaneously increased intrahemispheric power and decreased interhemispheric syn- chronization of elemental visual information suggests either that power increases cause poor interhemi- spheric connectivity or that processes, such as thalamocortical regulation, impact power and coherence independently. Ó 2010 International Federation of Clinical Neurophysiology. Published by Elsevier Ireland Ltd. All rights reserved. 1. Introduction Theories of autism spectrum disorders (ASD) propose that af- fected persons have diminished capacity for integration of brain activity because locally specialized cortical regions are less ana- tomically and/or functionally connected (Belmonte et al., 2004; Just et al., 2007). Anatomical studies have shown brain volume and white matter increases more frequently in younger than older subjects (Courchesne et al., 2001; Herbert et al., 2003; Herbert et al., 2004; Amaral et al., 2008), suggesting that these anatomical findings may not be directly implicated in function, since neuro- psychological findings putatively attributable to connectivity do not vary in the same manner. In contrast, functional connectivity studies more consistently show decreases in subjects with ASD (Just et al., 2004, 2007; Villalobos et al., 2005; Cherkassky et al., 2006; Coben et al., 2008), though results are mixed (Murias et al., 2007). An alternative, perhaps complementary, view is that inadequate integration is not solely based on a deficit in connectivity, but is also the consequence of sensory hypersensitivity. Elevated re- sponse to stimulation in sensory areas may overwhelm the capac- ity for effective communication further downstream within the brain (Belmonte and Yurgelun-Todd, 2003; Happe and Frith, 2006). Of interest this form of disconnection might yield richly detailed sensory processing capacities, perhaps accounting for per- ceptual advantages and savant skills (Gomot et al., 2008; Mottron et al., 2009). Electroencephalography (EEG) provides windows into both proposed modes of disconnection. EEG power at a single electrode 1388-2457/$36.00 Ó 2010 International Federation of Clinical Neurophysiology. Published by Elsevier Ireland Ltd. All rights reserved. doi:10.1016/j.clinph.2010.05.004 * Corresponding author. Address: Department of Pediatrics, College of Physicians and Surgeons, Columbia University, P&S 3-440, 630 W. 168th St., New York, NY 10032, USA. Tel.: +1 212 342 4151; fax: +1 212 305 0956. E-mail address: [email protected] (J.R. Isler). Clinical Neurophysiology 121 (2010) 2035–2043 Contents lists available at ScienceDirect Clinical Neurophysiology journal homepage: www.elsevier.com/locate/clinph

Welcome message from author
This document is posted to help you gain knowledge. Please leave a comment to let me know what you think about it! Share it to your friends and learn new things together.
Transcript

Clinical Neurophysiology 121 (2010) 2035–2043
Contents lists available at ScienceDirect
Clinical Neurophysiology
journal homepage: www.elsevier .com/locate /c l inph
Reduced functional connectivity in visual evoked potentials in childrenwith autism spectrum disorder
J.R. Isler a,*, K.M. Martien b,d, P.G. Grieve a, R.I. Stark a, M.R. Herbert c,d
a Department of Pediatrics, Columbia University, 630 W. 168th St., New York, NY 10032, USAb Lurie Family Autism Center-LADDERS Clinic, Department of Pediatrics, Massachusetts General Hospital, Boston, MA, USAc Department of Neurology, Massachusetts General Hospital, Boston, MA, USAd TRANSCEND Research Program, Massachusetts General Hospital, Boston, MA, USA
a r t i c l e i n f o
Article history:Accepted 6 May 2010Available online 4 June 2010
Keywords:AutismCoherenceEEGPowerSynchronyConnectivity
1388-2457/$36.00 � 2010 International Federation odoi:10.1016/j.clinph.2010.05.004
* Corresponding author. Address: Department of Peand Surgeons, Columbia University, P&S 3-440, 63010032, USA. Tel.: +1 212 342 4151; fax: +1 212 305 0
E-mail address: [email protected] (J.R. Isler).
a b s t r a c t
Objective: An analysis of EEG synchrony between homologous early visual areas tested the hypothesisthat interhemispheric functional connectivity during visual stimulation is reduced in children with aut-ism compared to controls.Methods: EEG power and coherence within and between two homologous regions of the occipital cortexwere measured during long latency flash visual evoked potentials. Measures were compared betweentwo groups of children (5.5–8.5 years), one with autism spectrum disorders and the other with typicaldevelopment.Results: In and below the theta band, interhemispheric synchrony was reduced in autistic subjects com-pared to typical controls by as much as 50%. Above the theta band interhemispheric synchrony in autisticchildren became indistinguishable from what would occur for uncorrelated cortical activity. Interhemi-spheric synchrony in autistic subjects was decreased in spite of bilaterally increased power. Waveletpower showed autistic children had a more rapid initial response to stimulation, a slower recovery,and more modulation at longer latencies.Conclusions: Results suggest that the sensory cortices of autistic children are hypersensitive to stimula-tion with concurrent diminished functional connectivity between hemispheres.Significance: Simultaneously increased intrahemispheric power and decreased interhemispheric syn-chronization of elemental visual information suggests either that power increases cause poor interhemi-spheric connectivity or that processes, such as thalamocortical regulation, impact power and coherenceindependently.� 2010 International Federation of Clinical Neurophysiology. Published by Elsevier Ireland Ltd. All rights
reserved.
1. Introduction
Theories of autism spectrum disorders (ASD) propose that af-fected persons have diminished capacity for integration of brainactivity because locally specialized cortical regions are less ana-tomically and/or functionally connected (Belmonte et al., 2004;Just et al., 2007). Anatomical studies have shown brain volumeand white matter increases more frequently in younger than oldersubjects (Courchesne et al., 2001; Herbert et al., 2003; Herbertet al., 2004; Amaral et al., 2008), suggesting that these anatomicalfindings may not be directly implicated in function, since neuro-psychological findings putatively attributable to connectivity do
f Clinical Neurophysiology. Publish
diatrics, College of PhysiciansW. 168th St., New York, NY956.
not vary in the same manner. In contrast, functional connectivitystudies more consistently show decreases in subjects with ASD(Just et al., 2004, 2007; Villalobos et al., 2005; Cherkassky et al.,2006; Coben et al., 2008), though results are mixed (Murias et al.,2007).
An alternative, perhaps complementary, view is that inadequateintegration is not solely based on a deficit in connectivity, but isalso the consequence of sensory hypersensitivity. Elevated re-sponse to stimulation in sensory areas may overwhelm the capac-ity for effective communication further downstream within thebrain (Belmonte and Yurgelun-Todd, 2003; Happe and Frith,2006). Of interest this form of disconnection might yield richlydetailed sensory processing capacities, perhaps accounting for per-ceptual advantages and savant skills (Gomot et al., 2008; Mottronet al., 2009).
Electroencephalography (EEG) provides windows into bothproposed modes of disconnection. EEG power at a single electrode
ed by Elsevier Ireland Ltd. All rights reserved.

2036 J.R. Isler et al. / Clinical Neurophysiology 121 (2010) 2035–2043
reflects the degree of locally synchronous cortical activation (i.e. anincrease in spectral power, analogous to but inherently bettertime-locked than ‘‘activation” in fMRI). EEG coherence is a bivari-ate measure of the degree of oscillatory synchrony (phase locking)between two brain regions and provides a measure of electrocorti-cal functional connectivity (Nunez et al., 1997; Sporns et al., 2000).
Generally, synchronization of electric field potential oscillationsis an efficient mechanism for coalescing local and regional assem-blies into more widespread networks (Varela et al., 2001). Oscilla-tory synchrony is associated with cognitive functions includingperception (Gray et al., 1989; Tallon-Baudry et al., 1996), attention(Buschman and Miller, 2007; Lakatos et al., 2008), memory(Sederberg et al., 2003), awareness (Rodriguez et al., 1999), andbehavior control (Pfurtscheller et al., 1994; von Stein et al.,2000). In each of the traditional EEG frequency bands (delta1–4 Hz, theta 4–8 Hz, alpha 8–12 Hz, beta 12–25 Hz, gam-ma > 25 Hz), synchrony facilitates distinct cognitive functions(Buzsaki and Draguhn, 2004; Buschman and Miller, 2007).
Interhemispheric synchrony between homologous sensory andmotor areas provides an inherent mechanism for coordinatingbilateral sensory and motor processing. For example, interhemi-spheric synchrony in the alpha band is correlated with objectrecognition (Mima et al., 2001) while in the beta band interhemi-spheric synchrony is associated with bilateral movement coordina-tion (Nikouline et al., 2001).
Here, we tested the hypothesis that sensory specific functionalconnectivity is reduced in children with ASD. To that end, weevaluated interhemispheric synchrony between homologous earlyvisual areas during visual stimulation. We also investigated theactivation of sensory cortex in the same subjects by evaluatingdifferences in EEG power in early visual regions.
2. Materials and methods
2.1. Participants
Twenty subjects between the ages of 5.5 and 8.5 years of agewere recruited for this study: nine children with a clinical diagno-sis of an ASD and eleven typically developing children. Legal guard-ians provided informed consent and competent subjects providedverbal assent in accord with the Institutional Review Board at Mas-sachusetts General Hospital in Boston. Fourteen of the twenty par-ticipants provided adequate artifact-free long latency visualevoked potential (VEP) data for analysis. Of the participants whosedata was excluded, three were autistic and three typically develop-ing. The final cohort (see Table 1) was composed of individualsmeeting full diagnostic criteria for autism (n = 4), individuals meet-ing criteria for an ASD (n = 2) and typically developing controls(n = 8).
Clinical impression of either an ASD or typical development onscreening at the time of recruitment was required for initial inclu-sion. Diagnosis of an ASD was confirmed using the Autism Diag-nostic Interview – Revised [ADI-R WPS] (Lord et al., 1994) and
Table 1Autistic subjects.
Subject Gender Age Clinical Dx
1 M 6.7 Autism2 F 7.8 ASD3 M 7.8 Autism4 M 8.1 ASD5 M 8.1 Autism6 M 8.3 Autism
* Met criteria for autism on social and communication, not repetitive behavior.
the Autism Diagnostic Observation Schedule [ADOS WPS] (Lordet al., 2000) (see Table 1). Diagnostic impression of an ASD was for-mally established after careful consideration of ADI-R and ADOSscores, in combination with expert clinical judgment that eachsubject met ASD criteria as set out in the Diagnostic and StatisticalManual of Mental Disorders, Fourth Edition (Association, 1994). Inthe two cases where full ADI/ADOS criteria of autism was not met,a diagnosis of an ASD was made based on meeting autism criteriaon 2 of 3 domains on ADI-R and meeting ‘ASD’ criteria on the ADOS.Participants were excluded if, on review of medical history, any ofthe following conditions were identified: premature birth before35 weeks, hypoxic/ischemic event at any point during develop-ment, sensorimotor deficit; known presence of structural brain le-sion, major genetic or syndromic disorder; uncontrolled seizures orclinical evidence of progressive encephalopathy. Typically develop-ing control candidates were included after screening out medicalconditions affecting normal development and/or indications ofdevelopmental disability, psychiatric, or neurological disorder. Thisscreening was performed utilizing parent questionnaires includingSocial Communication Questionnaire [WPS] (Berument et al.,1999), the Behavioral Assessment System for Children [BASC-2](Pearson Education, 2008) (see Table 2), and a medical historyquestionnaire. Additionally, all subjects were required to have Eng-lish as the primary language spoken in the home.
For data analysis purposes, the ASD group was defined as allthose children with autism or an ASD. The ASD group (n = 6) andtypical group (n = 8) differed in mean age by one year (M ageASD group = 7.8 years, SD = 0.57, range 6.7–8.3; M age typicalgroup = 6.8 years, SD = 0.76. range 5.9–8.0). Male to female ratiofor the autistic sample was 5:1 (consistent with reported preva-lence by gender), and for the typical group was 1:1. IQ was esti-mated using the Differential Abilities Scale [DAS] (Pearson)which generates a General Conceptual Ability (GCA) as well as ver-bal, non-verbal and spatial reasoning abilities (see Table 1). Thegroups differed significantly on GCA SS (ASD group M = 67.83,SD = 27.15, SS Range = 43–105; typical group M = 117.13,SD = 9.75, SS Range = 106–134). Among the six children in theASD group, one had a diagnosis of epilepsy which was controlledby two antiepileptic drugs (AED): valproate (Depakote) and topira-mate (Topamax), and took the nutritional supplement carnitine(Carnitor); one was on an AED, valproate, for an abnormal EEGwithout evidence of clinical seizures; one was reported to havean abnormal EEG with unilateral slowing and no history of sei-zures; one was being treated with an SSRI (fluvoxamine) for anxi-ety. Two participants, one autistic and one typical, were treatedwith anti-inflammatory/cytokine modulating agents: one (autistic)was on montelukast (Singulair) for food allergies and one (control)was on sulfasalizine (Azulfidine) for inflammatory bowel disease.One additional control was on fexofenadine (Allegra) for environ-mental allergies.
The Dunn Sensory Profile (Dunn, 1999) parent questionnairewas used to determine atypicality of sensory system functioning.All children with ASD had numerous sensory differences on theprofile varying by subject but including domains of: sensory
ADOS/ADI-R classification DAS–GCA Seizure history?
Autism/autism 43 NoASD/autism 92 NoAutism/autism 53 NoAutism/ASD* 39 YesAutism/autism 105 NoAutism/autism 75 No
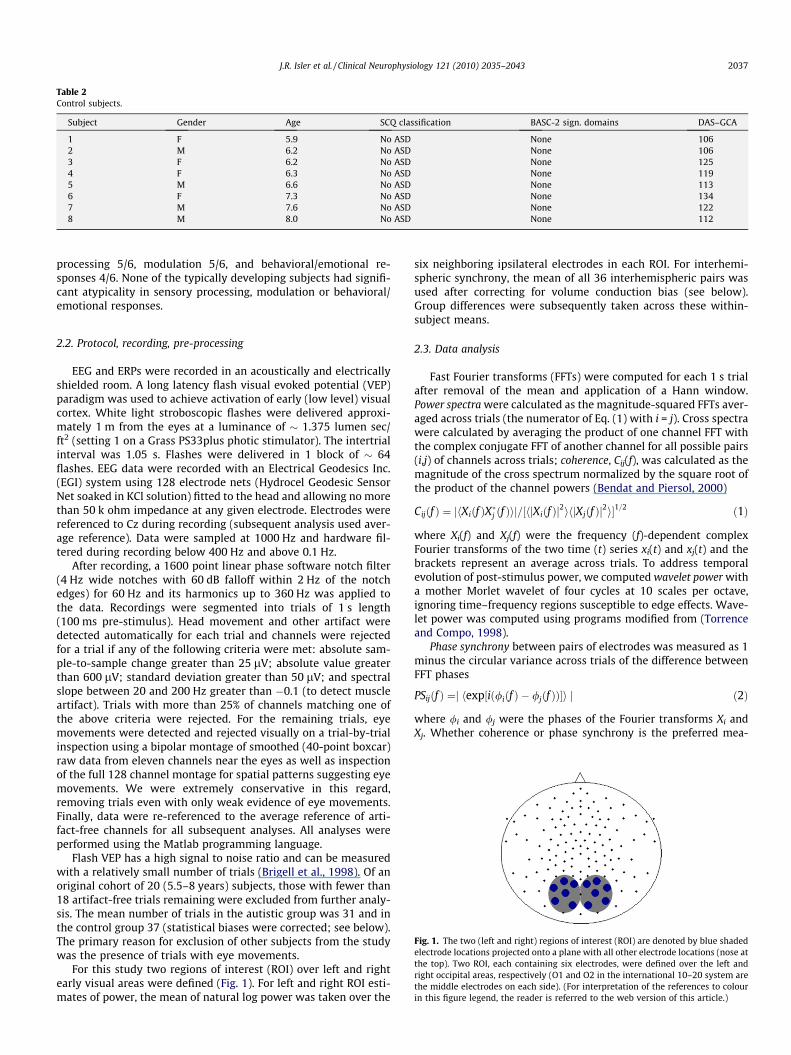
Table 2Control subjects.
Subject Gender Age SCQ classification BASC-2 sign. domains DAS–GCA
1 F 5.9 No ASD None 1062 M 6.2 No ASD None 1063 F 6.2 No ASD None 1254 F 6.3 No ASD None 1195 M 6.6 No ASD None 1136 F 7.3 No ASD None 1347 M 7.6 No ASD None 1228 M 8.0 No ASD None 112
J.R. Isler et al. / Clinical Neurophysiology 121 (2010) 2035–2043 2037
processing 5/6, modulation 5/6, and behavioral/emotional re-sponses 4/6. None of the typically developing subjects had signifi-cant atypicality in sensory processing, modulation or behavioral/emotional responses.
ig. 1. The two (left and right) regions of interest (ROI) are denoted by blue shadedlectrode locations projected onto a plane with all other electrode locations (nose ate top). Two ROI, each containing six electrodes, were defined over the left and
ight occipital areas, respectively (O1 and O2 in the international 10–20 system aree middle electrodes on each side). (For interpretation of the references to colourthis figure legend, the reader is referred to the web version of this article.)
2.2. Protocol, recording, pre-processing
EEG and ERPs were recorded in an acoustically and electricallyshielded room. A long latency flash visual evoked potential (VEP)paradigm was used to achieve activation of early (low level) visualcortex. White light stroboscopic flashes were delivered approxi-mately 1 m from the eyes at a luminance of � 1.375 lumen sec/ft2 (setting 1 on a Grass PS33plus photic stimulator). The intertrialinterval was 1.05 s. Flashes were delivered in 1 block of � 64flashes. EEG data were recorded with an Electrical Geodesics Inc.(EGI) system using 128 electrode nets (Hydrocel Geodesic SensorNet soaked in KCl solution) fitted to the head and allowing no morethan 50 k ohm impedance at any given electrode. Electrodes werereferenced to Cz during recording (subsequent analysis used aver-age reference). Data were sampled at 1000 Hz and hardware fil-tered during recording below 400 Hz and above 0.1 Hz.
After recording, a 1600 point linear phase software notch filter(4 Hz wide notches with 60 dB falloff within 2 Hz of the notchedges) for 60 Hz and its harmonics up to 360 Hz was applied tothe data. Recordings were segmented into trials of 1 s length(100 ms pre-stimulus). Head movement and other artifact weredetected automatically for each trial and channels were rejectedfor a trial if any of the following criteria were met: absolute sam-ple-to-sample change greater than 25 lV; absolute value greaterthan 600 lV; standard deviation greater than 50 lV; and spectralslope between 20 and 200 Hz greater than �0.1 (to detect muscleartifact). Trials with more than 25% of channels matching one ofthe above criteria were rejected. For the remaining trials, eyemovements were detected and rejected visually on a trial-by-trialinspection using a bipolar montage of smoothed (40-point boxcar)raw data from eleven channels near the eyes as well as inspectionof the full 128 channel montage for spatial patterns suggesting eyemovements. We were extremely conservative in this regard,removing trials even with only weak evidence of eye movements.Finally, data were re-referenced to the average reference of arti-fact-free channels for all subsequent analyses. All analyses wereperformed using the Matlab programming language.
Flash VEP has a high signal to noise ratio and can be measuredwith a relatively small number of trials (Brigell et al., 1998). Of anoriginal cohort of 20 (5.5–8 years) subjects, those with fewer than18 artifact-free trials remaining were excluded from further analy-sis. The mean number of trials in the autistic group was 31 and inthe control group 37 (statistical biases were corrected; see below).The primary reason for exclusion of other subjects from the studywas the presence of trials with eye movements.
For this study two regions of interest (ROI) over left and rightearly visual areas were defined (Fig. 1). For left and right ROI esti-mates of power, the mean of natural log power was taken over the
six neighboring ipsilateral electrodes in each ROI. For interhemi-spheric synchrony, the mean of all 36 interhemispheric pairs wasused after correcting for volume conduction bias (see below).Group differences were subsequently taken across these within-subject means.
2.3. Data analysis
Fast Fourier transforms (FFTs) were computed for each 1 s trialafter removal of the mean and application of a Hann window.Power spectra were calculated as the magnitude-squared FFTs aver-aged across trials (the numerator of Eq. (1) with i = j). Cross spectrawere calculated by averaging the product of one channel FFT withthe complex conjugate FFT of another channel for all possible pairs(i,j) of channels across trials; coherence, Cij(f), was calculated as themagnitude of the cross spectrum normalized by the square root ofthe product of the channel powers (Bendat and Piersol, 2000)
Cijðf Þ ¼ jhXiðf ÞX�j ðf Þij=½hjXiðf Þj2ihjXjðf Þj2i�1=2 ð1Þ
where Xi(f) and Xj(f) were the frequency (f)-dependent complexFourier transforms of the two time (t) series xi(t) and xj(t) and thebrackets represent an average across trials. To address temporalevolution of post-stimulus power, we computed wavelet power witha mother Morlet wavelet of four cycles at 10 scales per octave,ignoring time–frequency regions susceptible to edge effects. Wave-let power was computed using programs modified from (Torrenceand Compo, 1998).
Phase synchrony between pairs of electrodes was measured as 1minus the circular variance across trials of the difference betweenFFT phases
PSijðf Þ ¼j hexp½ið/iðf Þ � /jðf ÞÞ�i j ð2Þ
where /i and /j were the phases of the Fourier transforms Xi andXj. Whether coherence or phase synchrony is the preferred mea-
Fethrthin

2038 J.R. Isler et al. / Clinical Neurophysiology 121 (2010) 2035–2043
sure of synchrony remains a subject of some debate (Nolte et al.,2004); each may be susceptible to its own subtle forms of ‘‘algo-rithmic” artifact. For these reasons, to quantify synchrony we cal-culated both quantities. Coherence has a statistical bias that isproportional to N�1/2, where N is the number of trials, but that alsodepends on the ‘‘true” value of the quantity being computed(Carter et al., 1973). Since the latter is unknown and the N’s in thisstudy were not large, we chose to exploit our system’s amplifiernoise in order to estimate statistical bias. Since a low-pass hard-ware filter at 400 Hz was applied during recording and the sam-pling rate is 1000 Hz, spectral quantities near the Nyquistfrequency of 500 Hz should only reflect properties of the amplifiernoise, because physiological signals have been filtered out at thosefrequencies. Assuming that amplifier noise is random and uncorre-lated across electrode channels, an estimate of maximal statisticalbias for the case of zero synchrony can be calculated as the meanof values near 500 Hz (we used 480–499 Hz). This estimate wasthen removed on a per subject basis, since there were variablenumbers of trials across subjects, prior to group analysis. Prior tothis procedure, each subject’s coherence and phase synchronyreached an asymptotically flat, non-zero value at the highest fre-quencies, but at a level that varied across subjects. After this pro-cedure, all the subjects had approximately the same non-zerovalue at the highest frequencies (due to residual volume conduc-tion bias, discussed next).
Both synchrony measures (coherence and phase synchrony) fornearby electrodes are biased by volume conduction, to a degreethat varies as a function of inter-electrode distance (see Discus-sion). As a consequence, coherence (or phase synchrony) averagedover pairs of electrodes is biased towards the physically closerpairs. However, Nunez et al. (1997) suggested a procedure to re-move the effects of volume conduction, using the formula ex-p[(1 � x)/a], where x is inter-electrode distance on the scalp anda is a scale factor. The procedure is to estimate volume conductionbias for each pair of electrodes, subtract it from the measuredcoherence, and set it to zero if it becomes negative. The resultingquantity, reduced coherence, estimates the true physiological syn-chronization of oscillations between two sites. Because coherenceis a nonlinear quantity, the simple subtraction used in reducedcoherence makes it a first order estimate of true physiological syn-chrony. We used the above formula with a = 3.73 cm for this study(corresponding to a 4 cm scale factor on the adult head (Nunezet al., 1997)) and with x calculated for a head radius of 8.4 cm(mean measured head circumferences were 54.5 cm in the ASDgroup and 52.7 cm in the control group). We then subtracted the
Fig. 2. Group mean natural log power within the left (A) and right (B) ROI (see Fig. 1 for lcurve. Errors bars denote standard error. Single (double) asterisks denote frequencies wactivation includes a peak in the alpha band in autistic subjects not seen in control sub
estimated bias from the computed coherence and phase synchronyfor each electrode pair between the two ROI.
Subsequently, group statistics (mean, standard error) were cal-culated for differences and t-tests were used to determine signifi-cance for each quantity, i.e. power, wavelet power, coherence, andphase synchrony. Repeated measures analysis of variance (ANOVA)was applied to log wavelet power at each frequency.
3. Results
Our results show that autistic children had less interhemi-spheric synchrony between early visual areas than controls, inspite of greater intrahemispheric power than controls. Fig. 2 showspower spectra averaged within the two ROI (left and right occipitalareas) for the autistic and control groups from 1 to 300 Hz. Meanpower in both ROI was greater in the autistic group than in thecontrol group over a broad range of frequencies. Significantly in-creased power in the autistic group occurred bilaterally at 4 Hzand in both the alpha and lower beta bands (10–15 Hz), but onlyon the right in the upper beta band (16–23 Hz). Spectral powertrended higher in the autistic group up to frequencies as high as100–150 Hz. Note the spectral peak in the autistic group in the al-pha band not present in the control group.
Fig. 3 shows time–frequency plots of wavelet power and re-gions with significant differences across groups. As it should,the time-averaged wavelet spectrum agrees with the results inFig. 2, namely increased power in both ROI in the autistic groupover a wide range of frequencies; however, the full wavelet re-sult reveals several features of the post-stimulus evolution ofpower. First, the response at early latencies (<200 ms) in theupper theta, alpha, and beta bands is significantly larger in autis-tic subjects and has a broader time–frequency peak. Second, inboth ROI, theta/alpha power peaks much earlier in the autisticgroup, especially on the right, where the peak occurs nearlytwice as rapidly. Specifically, alpha power peaks at �90 ms onthe right and �120 ms on the left in the ASD group, comparedto �160 ms on the right and �170 ms on the left in the controlgroup. Third, compared to control subjects, the decay of power atlonger latencies is less uniform in the ASD subjects. Inspection ofthe middle panel of Fig. 3 shows that at later time points powerin the alpha and beta bands shows greater post-stimulus modu-lation in ASD subjects than in controls. These modulations ac-count for the significant group differences at longer latencies(e.g. at about 400 ms on the right).
ocations). Autistic group is denoted by red solid curve, control group by blue dottedith significant (*p < .05, **p < .01) differences between groups. This measure of localjects.

Fig. 3. Control and autistic subjects log wavelet power in the left and right ROI. Visual flash is at t = 0. Time–frequency regions unresolved by the 1 s window are obscured bywhite shading. Bottom: values of autistic minus control subject log wavelet power. Contour lines show time–frequency regions where the difference is significant (p < .05within blue line, p < .01 within black line). Wavelet power trended higher in the autistic group across all frequencies excluding 4–8 Hz (compare Fig. 2). The autistic group hada stronger, more rapid and persistent response to the stimulus in the theta, alpha and beta bands. Repeated measures ANOVA indicated significant group by time interactionsin the right ROI from 4 to 11 Hz.
J.R. Isler et al. / Clinical Neurophysiology 121 (2010) 2035–2043 2039
Repeated measures analyses of variance of wavelet power in thetwo groups were carried out using group as a between subjectsvariable and time points (values for each ms) as the repeated, i.e.within subjects, measures. Separate analyses were conducted foreach frequency and ROI. The main effect for time was highly signif-icant (p < .001) for all frequencies in both ROI. The main effect forgroup was significant in both ROI from 10 to 20 Hz (to 24 Hz onthe right) and in the right ROI from 4 to 5 Hz. Interestingly, signif-icant group by time interactions were found for all frequenciesfrom 4 to 11 Hz, but only in the right ROI. At the upper end of thisrange, from 7 to 11 Hz, the group by time interaction was drivenby peak power occurring �70 ms earlier in the autistic comparedto the control group (90 ms versus 160 ms). At the lower frequen-cies of this range, from 4 to 6 Hz, the group by time interaction wasdriven by both a slower falloff from peak power and a tendency forpower to rise again after �500 ms in the ASD group.
Fig. 4 shows spectra of two measures (coherence and phase syn-chrony) that quantify the degree of interhemispheric synchronybetween the two homologous ROI. Both measures are normalizedquantities with 0 denoting uncorrelated signals and 1 denotingperfectly synchronized signals (with or without a lag in time).The frequency axis is shown in log format from 1 to 300 Hz as inFig. 2. Both coherence (top) and phase synchrony (bottom) havesimilar features for both groups of children.
For both phase synchrony and coherence and across bothgroups of children, the largest interhemispheric values occur atlow frequencies in the delta and theta bands. Above these bands,
the degree of synchrony fell to a level of about 0.1 and maintainedthis level out to the highest frequencies. However, there werenumerous differences between the two groups in both measures.In general, autistic subjects had less interhemispheric synchronythan controls, in spite of having greater power than controls in eachhemisphere separately. At and below the theta band, interhemi-spheric synchrony was reduced in the autistic group by as muchas 50%. Significant reductions occur at 2, 3, 5, 6, 8, 9, 10, 12–29and 44 Hz for coherence and at 2, 5, 10, 14, 16–19, 22–24 and27–30 Hz for phase synchrony. Strikingly, across the theta bandof the autistic group interhemispheric synchrony fell precipitouslyand by 9 Hz reached a high-frequency asymptotic value (likely dueto volume conduction; see below) for both coherence (top) andphase synchrony (bottom). In stark contrast, in the control groupboth measures of synchrony fell off much more gradually andreached an asymptotic value above �80 Hz. These differences inthe rapidity with which synchrony decays to an asymptotic valuewere the reason for the significant reductions of interhemisphericsynchrony in autistic compared to control subjects at numerousfrequencies in the alpha, beta and low gamma bands.
Fig. 4 shows frequencies (with asterisks) where group meanswere significantly different from each other. We also applied sig-nificance tests within each group, testing whether the group meanwas significantly different from the asymptotic high-frequency le-vel (computed as the mean from 100 to 300 Hz). Results showedthat coherence and phase synchrony in the ASD group were notsignificantly above the high-frequency asymptote for any frequency

Fig. 4. Interhemispheric synchrony between left and right ROI as measured by coherence (top) and phase synchrony (bottom) spectra. Autistic group is denoted by solid redcurve, control group by dotted blue curve. Errors bars denote standard error. To aid discussion in the text, vertical lines are drawn at 9 and 80 Hz. Group differences aresignificant at *p < .05, **p < .01.
2040 J.R. Isler et al. / Clinical Neurophysiology 121 (2010) 2035–2043
above 7 Hz, while for the control group significance was maintainedup to 30 Hz. The ASD group size is small (n = 6), so to address whatfraction of ASD subjects were at or below the asymptotic level atfrequencies above 9 Hz, we pooled results across subjects andfrequencies from 10 to 20 Hz and found that 70% were below thehigh-frequency asymptote in the ASD group, compared to 15% inthe control group.
4. Discussion
The primary goal of this study was to test the hypothesis thatwide-area functional connectivity in a stimulated state is reducedin children with autism compared to typically developing children.To this end, we evaluated interhemispheric functional connectivitybetween left and right early visual areas in response to light flashstimulation with computation of both coherence and phase syn-chrony. We found that both measures in fact discerned a reductionof interhemispheric synchrony in autistic subjects. Surprisingly,besides being reduced at frequencies at and below the theta band,interhemispheric synchrony above the theta band was essentiallythe same as an asymptotic high-frequency level in the autistic sub-jects in our study (see below). A second goal of the study was toinvestigate the degree of elevated sensory activation in autism.To that end we evaluated EEG power separately within left andright occipital regions as a measure of local activation of early vi-sual cortex. In agreement with previous studies, we found in-creased sensory activation in autistic subjects. The number ofsubjects in the final cohort was quite small, so there is the possibil-ity that results were driven by just a few subjects. However, wheresignificant differences were found, there was generally little over-lap between the two groups. For example, in Fig. 4 from 10 to25 Hz the overlap between the two groups was two subjects or lessat all frequencies where significance was found.
4.1. Power
Group differences in EEG power can be confounded by differentlevels of artifact, so first we discuss how we controlled for that. To
eliminate eye movement artifact, we removed all trials with blinksprior to analysis, as described in Section 2. Recently, however, itwas reported that even very small eye motions (microsaccades)generate scalp EEG power in the gamma and higher bands thatcan easily be mistaken for cortical activation in those bands(Yuval-Greenberg et al., 2008). To test whether our results werecontaminated by microsaccades, we looked at high-frequency powerover all electrodes, i.e. not just in the two ROI. The largest and mostsignificant group differences occurred over the occipital regionwhich is farthest from the eyes, providing strong evidence thatthe beta and low gamma band power differences between groupsobserved here are not due to microsaccades or other eye move-ments. Another source of artifact in EEG power is muscle activity.Muscle artifact most commonly arises from the temporalis musclesattached to parietal and frontal skull regions that control jawmovements. We cannot rule out the possibility that differentialoccipital (neck) muscle activity contributed to the group powerdifferences.
Previous studies found increased local activation in early audi-tory (Gomot et al., 2008) and visual (Orekhova et al., 2007; Milneet al., 2009) processing in autism, though results are mixed (Lazarevet al., 2009). Our finding of increased EEG power in the visualROI of autistic subjects extends the results from those studies inseveral ways. First, wavelet analysis revealed that theta/alphapower peaked much earlier in the autistic group, consistent witha similar finding by Milne et al. (2009) in a study of older(�12 years) autistic children. In our case, earlier theta/alpha powerwas most pronounced in the right occiput. Greater EEG power atlower latency suggests reduced inhibition in the thalamocorticalcircuitry of the early visual system in autism, and provides supportto the hypothesis that reduced functional connectivity in autismmay be due to hypersensitive sensory systems. Second, there wasa spectral peak in alpha band power in autistic children that wasabsent in control children. A prominent peak in the alpha bandhas long been known to occur in adults when eyes are closed, i.e.during reduced stimulation of visual cortex. In contrast, for autisticchildren we found a peak in the alpha band during visual stimula-tion. This may represent a disturbance in the circuitry responsible

J.R. Isler et al. / Clinical Neurophysiology 121 (2010) 2035–2043 2041
for generating the alpha rhythm. Perhaps this activity is due to astimulus-induced resonant ‘‘ringing” of the alpha circuit in autisticchildren that is usually prevented by inhibition. Elevated occipitalalpha power during visual stimulation was also noted by Milneet al. (2009), and appears to be consistent with findings reportedby Lazarev et al. (2009) (in Fig. 1, in Lazarev et al. (2009), alphapower at occipital electrodes during visual stimulation was �50%larger in the autistic subject in a comparison of representative sub-jects). Third, there was increased power bilaterally in the beta bandthat was shown by wavelet analysis to persist to longer times poststimulation in the autistic group.
It is important to note that because of the lack of a baseline per-iod, increased power in the ASD group might be stimulus-indepen-dent, consistent with reduced alpha blocking in subjects with ASD(see ‘‘Baseline differences” below). For example, Coben et al. (2008)found elevated right posterior theta band power in autistic sub-jects in unstimulated conditions. However, the consistency of ourfindings with those of Milne et al. (2009), who used a baseline per-iod, suggests that our finding is at least partially driven by the vi-sual stimulus.
In short, the early visual areas of autistic children were hyper-sensitive to stimulation compared to controls with a strongerand more rapid initial response, a slower recovery, and more mod-ulation than the same areas in the control group. The finding ofhypersensitive early visual cortex, especially in the alpha band,may relate to fMRI findings of increased thalamocortical connectiv-ity in autism (Mizuno et al., 2006). It could also be due to localalterations in cellular responsivity due to such factors as excitotox-icity related to glial cell activation (Pardo and Eberhart, 2007). Theresult also provides support for the idea that the ‘‘disconnectionsyndrome” of autism may be due to hypersensitive sensory areas(Belmonte and Yurgelun-Todd, 2003; Happe and Frith, 2006).
4.2. Interhemispheric synchrony
Group differences in synchrony can be confounded by groupdifferences in power, so first we discuss this confound. Volumeconduction contributes to measurements of synchrony becausethe potential field recorded at one location is a superposition ofpotentials from multiple sources that superimpose to some extentat nearby locations. Thus, a correlation between potentials fromneighboring electrodes exists even when the neural activity imme-diately beneath the electrodes is not correlated. As a result, syn-chrony estimates for nearby electrodes are biased by volumeconduction, to a degree that varies as a function of inter-electrodedistance. One way to mitigate the effect of volume conduction is bytaking spatial derivatives of the potential field at each electrode,usually either a first derivative (bipolar montage) or second deriv-ative (surface Laplacian, or current source density), and then ana-lyzing those quantities instead of the electric potentials. We didnot do this (applying spatial derivatives further reduced groupsizes, already small, because of more stringent good channel/trialrequirements); rather, we report reduced coherence (see Section 2),which removes an estimate of volume conduction bias from rawcoherence values. However, when (as in this study) group differ-ences are of primary interest, volume conduction bias subtractsout and the need for other approaches is partially mitigated. Vol-ume conduction effects would be completely removed if not forthe fact that differences in power are a potential confound for dif-ferences in synchrony. Increased (or decreased) power at one loca-tion increases (or decreases) the contribution of volumeconduction to the synchrony measured between that locationand other locations. The important point to bear in mind is thatpower differences can confound synchrony differences only if thedifferences in both cases have the same sign. Since the autistic groupin this study had reduced synchrony together with increased
power, the synchrony reduction cannot be an artifact of volumeconducted power differences.
4.3. Residual volume conduction bias
As mentioned above, in Fig. 4 in all cases (for both measures,from both groups) synchrony appears to achieve an asymptotic va-lue at the highest frequencies, suggestive of a measurement biasremnant in the reduced quantities. The mean of the coherencespectra between 100 and 300 Hz is 0.10 and 0.11 for the autisticand control subjects, respectively. Similarly, the mean of the phasesynchrony spectrum over the same range was smaller in autisticsubjects compared to control subjects (0.07 versus 0.08). Sincethe head sizes of the autistic children were slightly larger thanthose of controls (mean circumference of 54.5 cm versus52.7 cm), one would expect volume conduction bias to be slightlyless in autistic compared to control subjects because the inter-elec-trode distances were slightly greater. Thus, the slightly smallerasymptotic mean value for both measures in autistic subjects sup-ports its interpretation as a residual measurement bias, most likelydue to volume conduction bias that was not completely removedby the approximate formula used for reduced quantities. This pro-vides a new interpretation for Fig. 4 with respect to autism. If theasymptotic value of �0.1 is due to residual volume conductionbias, then the autistic subjects have interhemispheric synchroniza-tion above the theta band indistinguishable from what would occurfor uncorrelated cortical sources. In stark contrast, reduced syn-chrony in the control group does not become indistinguishablefrom the asymptotic value until 30 Hz, with values trending down-ward to 80 Hz.
As introduced earlier, synchronization of field potential oscilla-tions between brain regions is an efficient mechanism for coalesc-ing (connecting) regional assemblies into more widespreadnetworks. Various theories have put forward the notion that defi-cits in connectivity are a primary causal factor of autism. In partic-ular, it is supposed that widespread cortical areas do not functionin as integrated a fashion as normally required for higher-ordercognitive processes such as attention and memory. Our novel find-ing that autistic subjects have severely reduced functional connec-tivity between right and left visual areas in response to visualstimulus supports these theories. Previous studies of electrocorti-cal synchrony in autism have found a mixture of increased and de-creased coherence (Murias et al., 2007; Coben et al., 2008) but inthese studies EEG was recorded in the eyes closed resting staterather than a stimulated state as in the present study. This suggeststhat the process of active sensory processing may exacerbate theconnectivity deficits seen in autism. In a study that did include vi-sual stimulation, Lazarev et al. (2010) looked at thresholded coher-ence during photic driving stimulation and found asymmetry inautistic boys that was not present in typically developing boys,with greater coherence in the left hemisphere. However, theauthors note that within individuals coherence is well correlatedwith power at the driving frequencies, so their inferences regard-ing connectivity are confounded by power differences.
As noted in the Introduction, field potential oscillations in dis-tinct frequency bands may subserve distinct cognitive functions(Buzsaki and Draguhn, 2004; Buschman and Miller, 2007). In thislight, a salient feature of our findings, assuming the high-frequencyasymptotic levels in Fig. 4 are due to residual volume conductionbias, is that interhemispheric synchrony is reduced above the thetaband in autistic subjects to a level indistinguishable from whatwould occur due to uncorrelated cortical activity. In contrast, it felloff more gradually in control children, significantly to 30 Hz andtrending downward to �80 Hz. Within and below the theta band,interhemispheric synchrony was decreased by as much as 50% inthe ASD group. Group sizes are not large in this study and results

2042 J.R. Isler et al. / Clinical Neurophysiology 121 (2010) 2035–2043
will need to be confirmed in a larger study; but if these findings aretrue more globally in the brain (i.e. for more than just homologousvisual areas), then these deficits could provide a causal mechanismfor some of the features of autism. In fact, two predictions that fol-low directly from these results are that aspects of cognition sub-served by wide-area synchrony at and below the theta band willbe reduced in autistic subjects, while those aspects subserved bywide-area synchrony at frequencies above the theta band wouldbe absent or accomplished, if at all, by alternate mechanisms. Forexample, interhemispheric synchrony in the alpha band betweenhomologous visual areas has been correlated with object recogni-tion for objects spanning the visual midline (Mima et al., 2001).Thus, the reduction in interhemispheric synchrony seen in the al-pha band in this study suggests one potential source of impairedvisual perception in autistic children.
4.4. Potential covariates
The two groups of subjects had variable age, antiepileptic drug(AED) use, and IQ (IQ variables were DAS standard compositescores; GCA, VC, NVC, SC and SNC). Univariate ANOVA indicatedthat none of these covariables significantly predicted occipitalpower or interhemispheric coherence for pooled group values. Gi-ven the limited total number of subjects (n = 14), a proper multi-variate ANOVA even for two factors (group and one covariable)could not be performed. But it is interesting to note that none ofthe potential covariates was predictive of power or coherence forthe pooled group.
4.5. Medication effects
Two of the autistic subjects were on antiepileptic drugs (AEDs),valproate (n = 2) and topiramate (n = 1), at the time of testing. EEGstudies in epilepsy and VEP studies in bipolar disorder have founddecreased amplitude/power after AED treatment, for valproate inparticular (Clemens et al., 2006; Ozerdem et al., 2008). Thus, wedo not believe that the findings of power differences are likely tobe a result of AED effects, rather the differences might have beeneven greater if all the subjects had been AED drug naïve. The im-pact of AEDs on baseline or stimulated broad band coherence hasnot been well studied and therefore the impact of the AEDs onthe coherence findings cannot be assessed. Other drugs (SSRIsand non-steroidal anti-inflammatory drugs) used by some subjectsare unlikely to have impacted the findings, but there is essentiallyno literature on their effects in power or coherence.
4.6. ‘‘Baseline” differences
We made additional recordings EEG during a condition meantto expose group differences during ‘‘lack of stimulation”. In thiscondition, children sat quietly in a dimly lit room with eyes open.We found nearly all the children with ASD did not tolerate theexperience well and there was too much artifact in the EEG for sub-sequent analysis. For the visual flash experiment reported here, weanalyzed Fourier coherence (Fig. 4, top), phase synchrony (Fig. 4,bottom) and spectral power (Fig. 2) over a 1 s interval for maxi-mum frequency resolution. Therefore, there are no explicit pre-versus post-stimulus comparisons. However, as discussed above,wavelet power differences (Fig. 3, bottom) provide some insight.On the one hand, in the left ROI in the beta band differences areas large in the pre-stimulus period as afterwards, suggesting a rel-atively stimulus-independent effect, though it is equally possiblethat during stimulation ‘‘baseline” levels rise in the ASD groupbut not in the control group. On the other hand, in the right ROIin the alpha and theta bands there is clearly a time-dependent,low latency effect while in the beta band the largest differences
are also at those times. Thus, in the right ROI for EEG power, thereare group differences that are unambiguously stimulus-driven.
The findings reported here suggest that the sensory cortices ofthe autistic brain are hypersensitive to stimulation with poor func-tional connectivity to homologous cortex across hemispheres.Whether hypersensitivity undermines functional connectivity oris merely a co-existent phenomenon remains to be elucidated.But if this combination of properties occurs more generally in di-verse areas of cortex, it could explain the fact that a savant’s skills,which may depend upon relatively localized activation, can be dra-matically above normal levels while co-occurring with profounddeficits in cognitive functions that require wide-area connectivity.Finally, we suggest that the type of measures used in this studywhen applied to earlier periods in development will have the po-tential to provide diagnostic tools that can be used to define therisk of autism in infant and toddler populations, severity of neuro-biological dysfunction and, hence, measures of treatment efficacy.
Acknowledgements
This work was supported by the National Institutes of Health[Grant No. NINDS 5K25NS052230], Cure Autism Now/AutismSpeaks, the Nancy Lurie Marks Family Foundation, the NationalAlliance for Autism Research, and The Commonwealth Fund. Theauthors thank Professor Jerome Kagan of Harvard University, Dr.Charles Schroeder of Columbia University and the Nathan KlineInstitute, and Dr. Michael Meyers and Dr. Amanda Tarullo ofColumbia University for helpful comments.
References
Amaral DG, Schumann CM, Nordahl CW. Neuroanatomy of autism. Trends Neurosci2008;31(3):137–45.
Association, AP. Diagnostic and Statistical Manual of Mental Disorders, 4th ed.;1994.
Belmonte MK, Cook Jr EH, Anderson GM, Rubenstein JL, Greenough WT, Beckel-Mitchener A, et al. Autism as a disorder of neural information processing:directions for research and targets for therapy. Mol Psychiatry2004;9(7):646–63.
Belmonte MK, Yurgelun-Todd DA. Functional anatomy of impaired selectiveattention and compensatory processing in autism. Brain Res Cogn Brain Res2003;17(3):651–64.
Bendat JS, Piersol AG. Random data: analysis and measurement procedures. 3rded. New York: Wiley; 2000.
Berument SK, Rutter M, Lord C, Pickles A, Bailey A. Autism screening questionnaire:diagnostic validity. Br J Psychiatry 1999;175:444–51.
Brigell M, Bach M, Barber C, Kawasaki K, Kooilman A. Guidelines for calibration ofstimulus and recording parameters used in clinical electrophysiology of vision.Doc Ophthalmol 1998;95:1–14.
Buschman TJ, Miller EK. Top-down versus bottom-up control of attention in theprefrontal and posterior parietal cortices. Science 2007;315(5820):1860–2.
Buzsaki G, Draguhn A. Neuronal oscillations in cortical networks. Science2004;304(5679):1926–9.
Carter GC, Knapp CH, Nuttall AH. Statistics of estimate of magnitude-coherencefunction. IEEE Trans Acoust Speech 1973;21(4):388–9.
Cherkassky VL, Kana RK, Keller TA, Just MA. Functional connectivity in a baselineresting-state network in autism. Neuroreport 2006;17(16):1687–90.
Clemens B, Menes A, Piros P, Bessenyei M, Altmann A, Jerney J, et al. QuantitativeEEG effects of carbamazepine, oxcarbazepine, valproate, lamotrigine, andpossible clinical relevance of the findings. Epilepsy Res 2006;70(2–3):190–9.
Coben R, Clarke AR, Hudspeth W, Barry RJ. EEG power and coherence in autisticspectrum disorder. Clin Neurophysiol 2008;119(5):1002–9.
Courchesne E, Karns CM, Davis HR, Ziccardi R, Carper RA, Tigue ZD, et al. Unusualbrain growth patterns in early life in patients with autistic disorder: an MRIstudy. Neurology 2001;57(2):245–54.
Dunn W. Sensory profile. Pearson educational; 1999.Gomot M, Belmonte MK, Bullmore ET, Bernard FA, Baron-Cohen S. Brain hyper-
reactivity to auditory novel targets in children with high-functioning autism.Brain 2008;131(Pt 9):2479–88.
Gray CM, Konig P, Engel AK, Singer W. Oscillatory responses in cat visual cortexexhibit inter-columnar synchronization which reflects global stimulusproperties. Nature 1989;338(6213):334–7.
Happe F, Frith U. The weak coherence account: detail-focused cognitive style inautism spectrum disorders. J Autism Dev Disord 2006;36(1):5–25.

J.R. Isler et al. / Clinical Neurophysiology 121 (2010) 2035–2043 2043
Herbert MR, Ziegler DA, Deutsch CK, O’Brien LM, Lange N, Bakardjiev A, et al.Dissociations of cerebral cortex, subcortical and cerebral white matter volumesin autistic boys. Brain 2003;126(Pt 5):1182–92.
Herbert MR, Ziegler DA, Makris N, Filipek PA, Kemper TL, Normandin JJ, et al.Localization of white matter volume increase in autism and developmentallanguage disorder. Ann Neurol 2004;55(4):530–40.
Just MA, Cherkassky VL, Keller TA, Kana RK, Minshew NJ. Functional and anatomicalcortical underconnectivity in autism: evidence from an FMRI study of anexecutive function task and corpus callosum morphometry. Cereb Cortex2007;17(4):951–61.
Just MA, Cherkassky VL, Keller TA, Minshew NJ. Cortical activation andsynchronization during sentence comprehension in high-functioning autism:evidence of underconnectivity. Brain 2004;127(Pt 8):1811–21.
Lakatos P, Karmos G, Mehta AD, Ulbert I, Schroeder CE. Entrainment of neuronaloscillations as a mechanism of attentional selection. Science2008;320(5872):110–3.
Lazarev VV, Pontes A, deAzevedo LC. EEG photic driving: right-hemispherereactivity deficit in childhood autism. A pilot study. Int J Psychophysiol2009;71(2):177–83.
Lazarev VV, Pontes A, Mitrofanov AA, Deazevedo LC. Interhemispheric asymmetryin EEG photic driving coherence in childhood autism. Clin Neurophysiol2010;121(2):145–52.
Lord C, Risi S, Lambrecht L, Cook Jr EH, Leventhal BL, DiLavore PC, et al. The autismdiagnostic observation schedule-generic: a standard measure of social andcommunication deficits associated with the spectrum of autism. J Autism DevDisord 2000;30(3):205–23.
Lord C, Rutter M, Le Couteur A. Autism diagnostic interview-revised: a revisedversion of a diagnostic interview for caregivers of individuals with possiblepervasive developmental disorders. J Autism Dev Disord 1994;24(5):659–85.
Milne E, Scope A, Pascalis O, Buckley D, Makeig S. Independent component analysisreveals atypical electroencephalographic activity during visual perception inindividuals with autism. Biol Psychiatry 2009;65(1):22–30.
Mima T, Oluwatimilehin T, Hiraoka T, Hallett M. Transient interhemisphericneuronal synchrony correlates with object recognition. J Neurosci2001;21(11):3942–8.
Mizuno A, Villalobos ME, Davies MM, Dahl BC, Muller RA. Partially enhancedthalamocortical functional connectivity in autism. Brain Res 2006;1104(1):160–74.
Mottron L, Dawson M, Soulieres I. Enhanced perception in savant syndrome:patterns, structure and creativity. Philos Trans R Soc London B Biol Sci2009;364(1522):1385–91.
Murias M, Webb SJ, Greenson J, Dawson G. Resting state cortical connectivityreflected in EEG coherence in individuals with autism. Biol Psychiatry2007;62(3):270–3.
Nikouline VV, Linkenkaer-Hansen K, Huttunen J, Ilmoniemi RJ. Interhemisphericphase synchrony and amplitude correlation of spontaneous beta oscillations in
human subjects: a magnetoencephalographic study. Neuroreport2001;12(11):2487–91.
Nolte G, Bai O, Wheaton L, Mari Z, Vorbach S, Hallett M. Identifying true braininteraction from EEG data using the imaginary part of coherency. ClinNeurophysiol 2004;115(10):2292–307.
Nunez PL, Srinivasan R, Westdorp AF, Wijesinghe RS, Tucker DM, Silberstein RB,et al. EEG coherency. I: Statistics, reference electrode, volume conduction,Laplacians, cortical imaging, and interpretation at multiple scales. ElectroenClin Neurophysiol 1997;103(5):499–515.
Orekhova EV, Stroganova TA, Nygren G, Tsetlin MM, Posikera IN, Gillberg C, et al.Excess of high frequency electroencephalogram oscillations in boys withautism. Biol Psychiatry 2007;62(9):1022–9.
Ozerdem A, Guntekin B, Tunca Z, Basar E. Brain oscillatory responses in patientswith bipolar disorder manic episode before and after valproate treatment. BrainRes 2008;1235:98–108.
Pardo CA, Eberhart CG. The neurobiology of autism. Brain Pathol 2007;17(4):434–47.
Pearson Education, I. BASC-2: behavior assessment system for children, 2nd ed.;2008.
Pfurtscheller G, Flotzinger D, Neuper C. Differentiation between finger, toe andtongue movement in man based on 40 Hz EEG. Electroen Clin Neurophysiol1994;90(6):456–60.
Rodriguez E, George N, Lachaux JP, Martinerie J, Renault B, Varela FJ. Perception’sshadow: long-distance synchronization of human brain activity. Nature1999;397(6718):430–3.
Sederberg PB, Kahana MJ, Howard MW, Donner EJ, Madsen JR. Theta and gammaoscillations during encoding predict subsequent recall. J Neurosci2003;23(34):10809–14.
Sporns O, Tononi G, Edelman GM. Theoretical neuroanatomy: relating anatomicaland functional connectivity in graphs and cortical connection matrices. CerebCortex 2000;10(2):127–41.
Tallon-Baudry C, Bertrand O, Delpuech C, Pernier J. Stimulus specificity of phase-locked and non-phase-locked 40 Hz visual responses in human. J Neurosci1996;16(13):4240–9.
Torrence C, Compo GP. A practical guide to wavelet analysis. Bull Am Meteorol Soc1998;79:61–78.
Varela F, Lachaux JP, Rodriguez E, Martinerie J. The brainweb: phasesynchronization and large-scale integration. Nat Rev 2001;2(4):229–39.
Villalobos ME, Mizuno A, Dahl BC, Kemmotsu N, Muller RA. Reduced functionalconnectivity between V1 and inferior frontal cortex associated with visuomotorperformance in autism. NeuroImage 2005;25(3):916–25.
von Stein A, Chiang C, Konig P. Top-down processing mediated by interarealsynchronization. Proc Natl Acad Sci USA 2000;97(26):14748–53.
Yuval-Greenberg S, Tomer O, Keren AS, Nelken I, Deouell LY. Transient inducedgamma-band response in EEG as a manifestation of miniature saccades. Neuron2008;58(3):429–41.
Related Documents