Redeposition of amorphous hydrogenated carbon films during thermal decomposition E. Salanc ßon 1 , T. Dürbeck, T. Schwarz-Selinger, F. Genoese, W. Jacob * Max-Planck-Institut für Plasmaphysik, EURATOM Association, Boltzmannstrasse 2, 85748 Garching, Germany article info Article history: Received 2 August 2007 PACS: 52.40.Hf 68.60.Dv 81.70.Pg 28.52.Fa abstract Thermally induced decomposition of hard and soft amorphous hydrocarbon films was investigated by ther- mal effusion spectroscopy. Released species were detected by a sensitive quadrupole mass spectrometer using two different experimental setups for thermal effusion. Species released in a molecular beam setup were detected in direct line of sight to the sample surface, while species released in a remote UHV oven had no direct line of sight to the mass spectrometer. Soft, hydrogen-rich carbon films exhibit a desorption maximum at T 740 K while hard films with a low hydrogen content have their maximum at T 870 K. Additionally, the spectrum of released species differs dramatically between hard and soft films. We found a significant redeposition of species released from soft films. From the redeposited fraction of material we estimated an average redeposition probability of about 50% for species released from soft films. Ó 2008 Elsevier B.V. All rights reserved. 1. Introduction Plasma-facing components in thermonuclear fusion devices have been mainly made of carbonaceous materials in the last years. In the present design for ITER it is also foreseen to build parts of the diver- tor – the strike zone – from CFC (carbon fiber composites) material [1,2]. These surfaces are exposed to a substantial incoming flux of ions and neutrals from the main plasma which leads to erosion of the divertor tiles emitting carbon and hydrocarbon compounds into the boundary plasma. Most of these species released in the divertor will redeposit in relative close proximity to their place of origin and this balance between erosion and deposition is crucial for the perfor- mance of a divertor. However, the small fraction of carbon and hydrocarbon species that is not redeposited in the divertor may es- cape from the divertor and also from the boundary plasma and cause deposition of hydrocarbon layers (often called co-deposited or rede- posited layers) on surfaces not in direct contact with plasma. A number of investigations conducted in fusion plasma devices as well as in laboratory experiments have been devoted to study the deposition of such redeposited layers [3–11]. Redeposited lay- ers growing in remote areas without direct plasma contact are soft hydrocarbon films with high hydrogen content and it seems that hydrocarbon species with a relatively high sticking coefficient con- tribute dominantly to deposition [12]. A major concern for future fusion devices such as ITER is the large amount of hydrogen iso- topes trapped in these redeposited films because then this trapped hydrogen will partly be tritium [1,11]. Techniques to remove hydrogen isotopes from fusion devices were recently reviewed by Counsell et al. [11]. Among others, heating of redeposited films in vacuum either with a rapidly scanning laser beam [13,14] or with a flash lamp [15,16] was proposed as a possible method to ther- mally desorb tritium. One problem of this method is that little is known about the product spectrum of the released hydrocarbon species. For example, it is a priori not clear whether all of the re- leased products are stable, non-sticking species which can be trans- ported to the pumps and such finally be removed from the vacuum vessel. This was already briefly discussed by Gibson et al. [15]. Spe- cies with a high sticking coefficient may be volatilized at one place, but may redeposit somewhere else on the wall before reaching the pump so that they are not removed from the vacuum vessel. In this article, we present thermal effusion spectra of two differ- ent types of amorphous hydrocarbon films deposited in low-tem- perature laboratory plasmas. These films are a model system for redeposited carbon layers in fusion devices. We determine the desorption temperatures, the spectrum of released species and the amount of redeposited material for both types of films. 2. Experimental 2.1. Thermal effusion measurements Thermal effusion spectra are measured in the experimental device thermal effusion spectroscopy setup (TESS) specifically 0022-3115/$ - see front matter Ó 2008 Elsevier B.V. All rights reserved. doi:10.1016/j.jnucmat.2008.02.070 * Corresponding author. Tel.: +49 89 3299 2618; fax: +49 89 3299 1504. E-mail address: [email protected] (W. Jacob). 1 Present address: Physique des Interactions Ioniques et Moléculaires, CNRS and Université de Provence (UMR 6633), Campus Universitaire de St Jérôme, Service 241, 13397 Marseille cedex 20, France. Journal of Nuclear Materials 376 (2008) 160–168 Contents lists available at ScienceDirect Journal of Nuclear Materials journal homepage: www.elsevier.com/locate/jnucmat

Welcome message from author
This document is posted to help you gain knowledge. Please leave a comment to let me know what you think about it! Share it to your friends and learn new things together.
Transcript

Journal of Nuclear Materials 376 (2008) 160–168
Contents lists available at ScienceDirect
Journal of Nuclear Materials
journal homepage: www.elsevier .com/locate / jnucmat
Redeposition of amorphous hydrogenated carbon films duringthermal decomposition
E. Salanc�on 1, T. Dürbeck, T. Schwarz-Selinger, F. Genoese, W. Jacob *
Max-Planck-Institut für Plasmaphysik, EURATOM Association, Boltzmannstrasse 2, 85748 Garching, Germany
a r t i c l e i n f o
Article history:Received 2 August 2007
PACS:52.40.Hf68.60.Dv81.70.Pg28.52.Fa
0022-3115/$ - see front matter � 2008 Elsevier B.V. Adoi:10.1016/j.jnucmat.2008.02.070
* Corresponding author. Tel.: +49 89 3299 2618; faE-mail address: [email protected] (W. J
1 Present address: Physique des Interactions IoniquUniversité de Provence (UMR 6633), Campus Universit13397 Marseille cedex 20, France.
a b s t r a c t
Thermally induced decomposition of hard and soft amorphous hydrocarbon films was investigated by ther-mal effusion spectroscopy. Released species were detected by a sensitive quadrupole mass spectrometerusing two different experimental setups for thermal effusion. Species released in a molecular beam setupwere detected in direct line of sight to the sample surface, while species released in a remote UHV ovenhad no direct line of sight to the mass spectrometer. Soft, hydrogen-rich carbon films exhibit a desorptionmaximum at T � 740 K while hard films with a low hydrogen content have their maximum at T � 870 K.Additionally, the spectrum of released species differs dramatically between hard and soft films. We founda significant redeposition of species released from soft films. From the redeposited fraction of material weestimated an average redeposition probability of about 50% for species released from soft films.
� 2008 Elsevier B.V. All rights reserved.
1. Introduction
Plasma-facing components in thermonuclear fusion devices havebeen mainly made of carbonaceous materials in the last years. In thepresent design for ITER it is also foreseen to build parts of the diver-tor – the strike zone – from CFC (carbon fiber composites) material[1,2]. These surfaces are exposed to a substantial incoming flux ofions and neutrals from the main plasma which leads to erosion ofthe divertor tiles emitting carbon and hydrocarbon compounds intothe boundary plasma. Most of these species released in the divertorwill redeposit in relative close proximity to their place of origin andthis balance between erosion and deposition is crucial for the perfor-mance of a divertor. However, the small fraction of carbon andhydrocarbon species that is not redeposited in the divertor may es-cape from the divertor and also from the boundary plasma and causedeposition of hydrocarbon layers (often called co-deposited or rede-posited layers) on surfaces not in direct contact with plasma.
A number of investigations conducted in fusion plasma devicesas well as in laboratory experiments have been devoted to studythe deposition of such redeposited layers [3–11]. Redeposited lay-ers growing in remote areas without direct plasma contact are softhydrocarbon films with high hydrogen content and it seems thathydrocarbon species with a relatively high sticking coefficient con-tribute dominantly to deposition [12]. A major concern for future
ll rights reserved.
x: +49 89 3299 1504.acob).es et Moléculaires, CNRS andaire de St Jérôme, Service 241,
fusion devices such as ITER is the large amount of hydrogen iso-topes trapped in these redeposited films because then this trappedhydrogen will partly be tritium [1,11]. Techniques to removehydrogen isotopes from fusion devices were recently reviewed byCounsell et al. [11]. Among others, heating of redeposited films invacuum either with a rapidly scanning laser beam [13,14] or witha flash lamp [15,16] was proposed as a possible method to ther-mally desorb tritium. One problem of this method is that little isknown about the product spectrum of the released hydrocarbonspecies. For example, it is a priori not clear whether all of the re-leased products are stable, non-sticking species which can be trans-ported to the pumps and such finally be removed from the vacuumvessel. This was already briefly discussed by Gibson et al. [15]. Spe-cies with a high sticking coefficient may be volatilized at one place,but may redeposit somewhere else on the wall before reaching thepump so that they are not removed from the vacuum vessel.
In this article, we present thermal effusion spectra of two differ-ent types of amorphous hydrocarbon films deposited in low-tem-perature laboratory plasmas. These films are a model system forredeposited carbon layers in fusion devices. We determine thedesorption temperatures, the spectrum of released species andthe amount of redeposited material for both types of films.
2. Experimental
2.1. Thermal effusion measurements
Thermal effusion spectra are measured in the experimentaldevice thermal effusion spectroscopy setup (TESS) specifically

Fig. 2. Mass spectra in the range from 1 to 100 amu/e measured during a TE run.The spectrum at T = 660 K is comparable to the residual background. The spectrumat T = 870 K corresponds to the maximum of the effusion flux. The temperature riseduring one mass scan is less than 20 K.
E. Salanc�on et al. / Journal of Nuclear Materials 376 (2008) 160–168 161
designed to allow sensitive thermal effusion studies of thin filmsand surface layers. A schematic drawing of the experimental setupis shown in Fig. 1. TESS is an ultrahigh vacuum (UHV) experimentequipped with a cryopump to provide high pumping speed and asensitive quadrupole mass spectrometer (QMS).
Additionally, the main chamber is equipped with a liquid nitro-gen trap located below the sample holder (see Fig. 1) to reduce thepressure of recycling species during thermal effusion experiments.A cold cathode gauge was used during thermal effusion runs to re-cord the total pressure in the system. We checked that the opera-tion of the cold cathode gauge produces no additional species inthe mass spectra. The base pressure of TESS is in the upper10�9 Pa range.
The quadrupole mass spectrometer is a Pfeiffer/Inficon DMM422 equipped with a cross-beam ion source. The quadrupole deviceis contained in a water-cooled housing to minimize the influenceof heating onto the QMS system during effusion runs. The wholesetup is designed such that species desorbing from the samplereach the ionizer of the mass spectrometer in direct line of sight.With other words, desorbing species are detected in a molecularbeam geometry (MBMS = molecular beam mass spectrometry)which allows to measure reactive and non-reactive species withcomparable sensitivity. The QMS housing is not differentiallypumped so that in addition to the species in the molecular beamspecies recycling at the chamber walls can also reach the ionizerand thus contribute to the signal.
Thermal effusion spectra were measured in two complimentarymodes. To obtain an overview over the diversity of released specieswe recorded quasi continuous mass spectra (16 steps per amu) inthe range from 1 to 100 amu while the temperature of the samplewas ramped. An example of such data is shown in Fig. 2. It showsthe measured QMS intensity in a mass range from 1 to 100 amu attwo selected temperatures during a thermal effusion run (TE run)of a hard a-C:D film. The spectrum measured at T = 660 K is slightlyhigher but still comparable with a background spectrum prior tostarting the temperature ramp. At this temperature, thermal effu-sion has not yet started. The spectrum measured at T = 870 K cor-responds to the maximum of the effusion flux. We find a strongincrease of the QMS signal for almost all mass channels. Prominentpeaks are 20, 32, 44, 84, and 98 amu. The interpretation of thesedata is discussed further below. This mode yields the completeinformation about released species results, however, in a low timerespectively temperature resolution. For the spectra shown in
10
quartztube
external tubular oven (moveable)
sample repository (up to 14 samples)
loadingdoor
magnetictransfer rod
valve
gatevalve
heatablesampleholder
w
sa
QMSw
ho(abo
Fig. 1. Sketch of the experimental setup for thermal effusion measurements (TESS). Thespectrometry (MBMS) setup in the UHV chamber.
Fig. 2 the temperature rise during one complete mass spectrum,i.e., the temperature resolution, is about 20 K. Alternatively, up to64 mass channels were measured as a function of time while thesample temperature was ramped up. After the experiment themeasured temperatures were calibrated and converted to the truesample temperature as described further below. This allowed us toconvert the time axis into a temperature axis. This procedure yieldsthe thermal effusion spectra as a function of temperature shown inthis article. The temperature resolution in this mode is of the orderof 2–3 K (depending on number of mass channels measured andexperimental settings), that means it is about an order of magni-tude better than in the other mode.
Samples are introduced into the main chamber via a load lock.In the load lock we have a sample magazine which can store upto 14 samples, so that, on the one hand, we are able to store sam-ples in vacuum and, on the other hand, we do not have to open theload lock for each sample transfer. This assures that the base vac-uum in the main chamber after sample transfer is not seriouslyimpaired.
Samples are placed on a molybdenum sample holder in themain chamber with a wobble stick. Prior to a thermal effusion
cm
obble stickfor
mple transfer
UHVchamber
current and thermocouplefeedhrough
calibrationgas inlet
ater-cooledusing of QMS
ve sample plane) water-cooledhousingof QMS
cross-beamion source
beamaperture 1
sample
heatablesample holder
LN2trap
housingapertures
beamaperture 2
cryo pump
cross section off MBMS setup
figure on the right-hand side shows a cross section of the molecular-beam-mass-

162 E. Salanc�on et al. / Journal of Nuclear Materials 376 (2008) 160–168
experiment the sample holder is cleaned by heating it up to 1300 Kfor 1 h to minimize background contributions from the heater andthe surrounding surfaces. The sample holder is heated from thebackside by radiation from a resistively heated tantalum filament.It is shielded by a stack of heat shields to reduce heating of the sur-rounding surfaces. The temperature of the molybdenum block ismeasured by a Chromel/Alumel (Ni/NiCr) thermocouple. It allowsgenerating a linear temperature ramp controlled by a PID control-ler (Eurotherm 902P). The temperature ramp used in the experi-ments presented here is 15 K/min. Since the samples are putonto the heater plate without additional clamping, the thermalcontact between sample and heater plate is low. Specific measureswhich have been taken to determine the true surface temperatureof the samples are described further below.
In addition to this MBMS setup, TESS comprises a remote UHVoven. Released species are detected with the very same QMS asin the MBMS setup which allows a quantitative comparison ofthe measured mass spectra. The oven consists of a long quartz glasstube inserted into an external tubular oven. The heated volume ofthe oven is 4 cm in diameter and 40 cm in length. The externaloven is mounted on a rail system and can be moved over the entirelength of the quartz tube. It can also be removed completely fromthe quartz tube. The length of this quartz glass tube is 45 cm andits inner diameter is 2.0 cm (outer diameter = 2.54 cm). The glasstube is connected to the main chamber via a gate valve. Sampleloading is done by removing the tube. Several samples can bestored in the glass tube. After mounting the glass tube back tothe vacuum system, it is pumped via a second gate valve throughthe load lock to a sufficiently low pressure (better than 10�4 Pa).Only for measurement of effusion spectra the gate valve to themain chamber is opened. The background pressure in the mainchamber during a measurement with the oven setup is in general2 � 10�8 Pa. Samples are stored at the end of the glass tube whichis connected to the main chamber. They can be manipulated in vac-uum with a piece of nickel inside the tube which in turn is manip-ulated by a magnet outside the tube. For an effusion measurementthe desired sample is moved to a position about 10 mm from theclosed end of the tube and the external oven is centered aroundthis location. The distance between the measurement positionand the storage position is about 40 cm. This means that the dis-tance of the samples in the storage position from the end of thehot zone is about 15–20 cm. Due to the low heat conductivity ofquartz, the wall temperature of the quartz tube falls to room tem-perature within less than 1 cm outside the oven region, so that thesamples in storage position always stay at room temperature. Priorto an experiment in the oven, the measurement region is heated to1300 K for 1 h to thoroughly clean the glass tube and to reducebackground contributions from the walls of the glass tube duringthe measurement. The sample is transferred from the storage posi-tion to the measurement position after the tube has cooled toabout room temperature and then the measurement is immedi-ately started.
Species released in this quartz glass oven reach the ionizer ofthe QMS only after many collisions with the walls of the quartztube and the main vacuum chamber, so that reactive species whichare lost in wall collisions, cannot reach the ionizer. With this setuponly stable, non-reactive species can be detected. From a compar-ison of experiments performed in the MBMS and quartz glass ovensetups information on the fraction of released reactive (‘sticking’)species can be extracted.
2.2. Temperature calibration
2.2.1. Oven setupThe oven temperature is controlled by an external temperature
controller (Eurotherm 902P). It can provide heating rates of up to
30 K/min, but in the experiments presented here we used a tem-perature ramp of 15 K/min.
The temperature profile around the sample position for theusual experimental configuration was measured by fixing a ther-mocouple to a test sample which was placed at the sample positioninside the quartz glass tube. For a set temperature of 1275 K, theresulting true sample temperature is 1211 K. The differencebetween the set temperature and the true sample temperaturedepends on the applied heating rate. We carefully measuredcalibration curves for the sample temperature as a function ofthe oven temperature and checked the reproducibility of thisprocedure regularly. The reproducibility is excellent and theuncertainty of the temperature determination in this setup isestimated to ±5 K. A big advantage of the quartz oven setup is thatthe samples are embedded in a homogeneous radiation field whichcan be very well controlled. This guarantees identical heating ratesand temperatures in different experimental runs using the sameexperimental settings.
2.2.2. MBMS setupThe precise determination of the sample surface temperature in
the MBMS setup is challenging because, in contrast to the quartzglass oven, the sample is not in a homogeneous radiation field.What is controlled during the experiment is the temperature ofthe molybdenum substrate holder. At low-temperature, the heattransfer is dominantly due to thermal conduction. But the thermalcontact between holder and sample is not well defined so that thetemperature of the sample is in principal not well known. At hightemperature, heat transfer is dominated by radiation and the ther-mal contact to the heater surface is less important. We followedtwo complementary strategies to determine the real sampletemperatures.
First, we used a pyrometer specifically designed for the use withsilicon (Impac IS 10 Si) to measure the sample temperature. Thisdevice uses a small-band infrared filter with a measurement rangeof about 0.95 ± 0.03 lm. In this wavelength range the emissivity ofsilicon shows no pronounced temperature dependence and re-mains relatively constant at 0.67. The operating range of thispyrometer is 650–1600 K. The measurement area as defined bythe beam optics is about 3–4 mm in diameter. The pyrometer is di-rected from above onto the sample surface under an angle of about70�.
The samples we are interested in are in general coated with athin hydrocarbon film. Properties of this surface layer change asa function of annealing temperature. Consequently, the emissivityof this surface layer also changes as a function of temperature, sothat measured temperatures are rather uncertain. We made anumber of test experiments using coated and uncoated siliconsamples to determine the sample temperature as a function of hea-ter temperature. As carbon coated sample we used a hard a-C:Dfilm that was heated in a normal TE run to a maximum substrateholder temperature of 1300 K and held there for 30 min. As we willsee later, hydrogen is released and most of the carbon remains onthe sample. This carbon layer does not change in consecutiveannealing cycles. The emissivity of this carbon coated samplewas determined by comparing the temperature evolution of ablank silicon sample with that of a carbon coated sample. From thiscomparison, we estimated an emissivity of 0.73 for the carboncoated sample. At high temperature (>1300 K) the difference be-tween the true sample temperature and the heater temperaturecan reach 350 K.
These calibration measurements allow to determine the truesample temperature during normal TE runs. The uncertainty ofthe so-determined true sample temperature is estimated to be±15 K at about 1100 K. This is inferior to the temperature determi-nation in the glass oven. The reproducibility of the temperature

Table 1Physical properties of a-C:D films used in this publication
Sample Film thickness(nm)
n k Deuterium contentD/(D + C)
Density(g cm�3)
Hard a-C:D 250 2.04 0.06 0.35 1.95Soft a-C:D 180 1.55 0.001 �0.50 �1.0
The deuterium content of the hard film was measured by ion-beam analysis; itsdensity was calculated from the ion-beam data and the sample thickness. Thedeuterium content and density of the soft film were estimated based on publishedvalues [17,18].n and k are the real and imaginary part of the complex refractive index ðn̂ ¼ n� ikÞas measured by ellipsometry at 632.8 nm.
E. Salanc�on et al. / Journal of Nuclear Materials 376 (2008) 160–168 163
calibration by this procedure is in general satisfactory. As a conse-quence of the slower heating of the sample compared with theheater, the real heating rate of the sample at higher temperatureis about 10–20% lower than the experimentally set value. Conse-quently, the heating rates of the MBMS and oven setups are slightlydifferent in the experiments reported here. This leads also to differ-ences in the measured QMS intensities and complicates a quantita-tive comparison between QMS intensities measured in the MBMSand quartz oven setups.
The second strategy to determine the true sample temperaturein the MBMS setup is to measure thermal effusion spectra for iden-tical samples in the MBMS and quartz oven setups. In this case, wecan use the temperature scale from the quartz oven spectra todetermine the temperature of spectral features in the MBMS spec-tra. This allows an independent determination of the temperaturescale in the MBMS setup. It is clear, that for a comparison of ovenand MBMS spectra only data of non-reactive, recycling species canbe used. In general the agreement of both methods was verysatisfying.
2.3. Investigation of redeposition
The sticking of released species was investigated by thermo-desorption of the material redeposited along the glass tube. Thiswas done by a systematic displacement of the oven after a normalTE run. First, the walls of the quartz glass tube were thoroughlycleaned by heating them to 1300 K for more than 90 min. To dothis, the oven was first heated to 1300 K in the normal measure-ment position (centered around the closed end of the tube) andthen moved in several steps towards the open end of the tube untilthe whole wall area that will be investigated later on was thor-oughly annealed and cleaned. Then, after cooling down the oven,an a-C:D film was placed at the measurement position and a nor-mal thermal effusion run up to the desired final temperature (inmost cases 930 K) was performed. After that, the oven temperaturewas held at that temperature until the pressure and the mass sig-nal had sufficiently decreased (p < 5 � 10�8 Pa). In the following,the oven was moved by a defined distance (in most cases 1 or2 cm) towards the open end of the tube, so that a region that hasbeen at room temperature during the effusion run was heated. Thiscaused a strong increase of the chamber pressure due to release ofredeposited material. After the pressure had again sufficiently de-creased the oven was moved by another step. This procedure wasrepeated until the oven was moved by 12 cm from its originalposition.
2.4. Sample preparation
Amorphous deuterated carbon films (a-C:D) were produced in acapacitively coupled RF plasma setup using deuterated methane(CD4) as working gas. The plasma chamber consists of a stainlesssteel vessel and was pumped to a base pressure in the 10�4 Parange by a turbomolecular pump. Prior to deposition the substratesurfaces were cleaned by sputtering in an oxygen plasma followedby a hydrogen plasma (bias voltage �300 V, 30 min each). The totalmethane (CD4) pressure is kept at 2 Pa and the gas flow is adjustedby a mass flow meter at 20 sccm (standard cm3/min).
It is well known that the structure and physical properties of a-C:H respectively a-C:D films depend sensitively on the depositionconditions [18,19]. The properties of a-C:H films deposited fromCH4 is by and large identical to those of a-C:D films deposited fromCD4. The most important deposition parameter is the energy ofions impinging on the growing film surface during deposition[20,17–19]. At low ion energies (<30 eV), soft, polymer-like filmswith high hydrogen content grow, while at higher ion energieshard and dense hydrocarbon films are deposited. The change of
the physical properties of the films is a monotonic function ofthe ion energy. Typical hard, diamond-like amorphous carbon filmswith a hydrogen content of H/(H + C) � 0.3 are produced at ionenergies higher than 100 eV [17,18]. In order to deposit hard a-C:D films the silicon substrate is directly placed on the driven RFelectrode which reached a self-bias voltage of �300 V. A secondsample holder connected to ground potential is placed oppositeto this electrode in a distance of 10 cm to deposit soft a-C:D films.Hard and soft films were deposited in the same deposition run onsilicon wafers 100 mm in diameter. The film homogeneity acrossthe wafer is better than 5%. All samples used for thermal effusionmeasurements had the identical size of 10 mm by 10 mm (=coatedarea) and were cut from the identical wafer. Thus we can be surethat samples used in different TE runs are comparable.
To determine the optical properties and the sample thickness, apiece of sample was eroded in an oxygen plasma in an ElectronCyclotron Resonance (ECR) discharge measuring the film thicknesschange with an in situ ellipsometer [17]. In addition, representa-tive samples from the batch used for this study were investigatedby ion-beam analysis to determine the D and C content of the sam-ples. Details of the ion-beam analysis are described in [17]. Thestoichiometry and optical properties of comparable a-C:H sampleshas been measured in the past [17]. The physical properties of thefilms used in this study are given in Table 1. They are in goodagreement with previous results [17,18].
3. Results
3.1. Comparison of thermal effusion spectra of hard and soft a-C:Dfilms
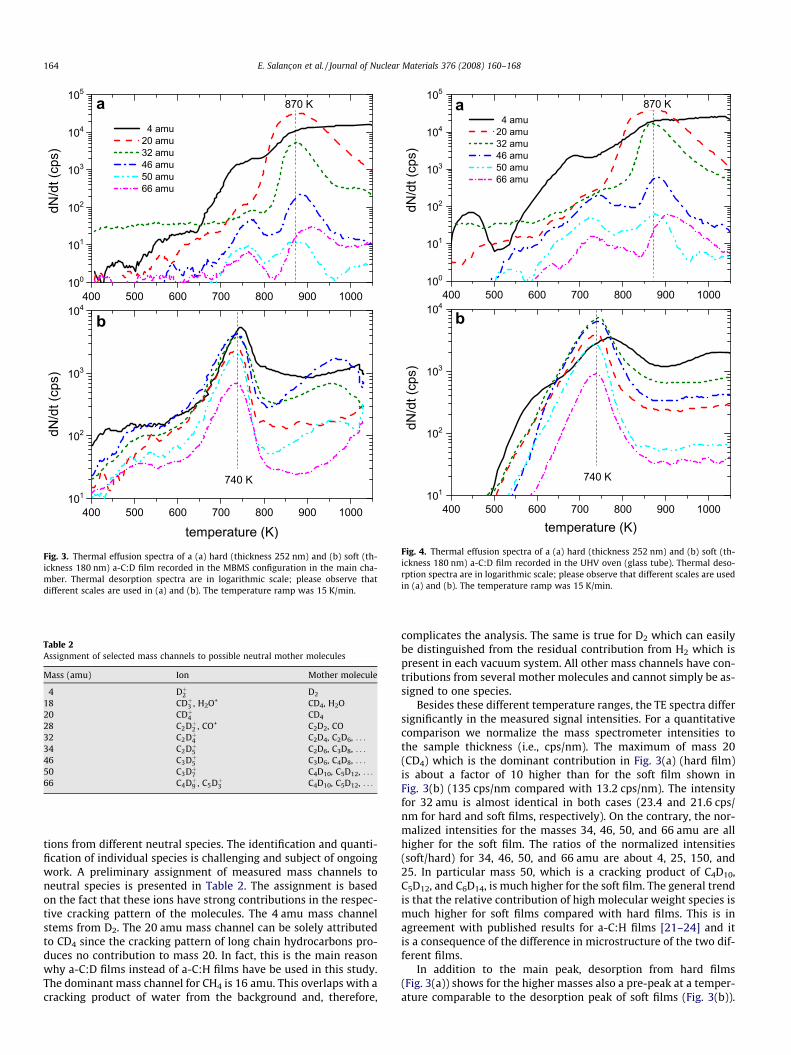
Fig. 3 presents thermal effusion spectra (TE spectra) of a hardand a soft a-C:D film recorded in the MBMS configuration. Shownare mass signals of a number of representative masses as a func-tion of temperature. The thickness of the hard a-C:D film was about250 nm and that of the soft film 180 nm (see Table 1). For the fol-lowing comparison we should keep in mind that the total numberof deuterium atoms in the samples is about the same while the to-tal number of carbon atoms in the soft films is about half of that ofthe hard films. The TE spectra of the two films show significant dif-ferences. Firstly, effusion in the case of hard films starts at about700 K and ends at 950–1000 K (with the exception of the mass 4signal) whereas, for soft films it starts at 600 K and ends at800 K. Secondly, the peak maxima occur at 870 K and 740 K forthe hard and soft film, respectively. These two differences clearlyshow the lower thermal stability of soft films compared with hardfilms.
The assignment of the measured mass channels to specificneutral hydrocarbon molecules is complicated by the fact thatthe cracking patterns for the long chain hydrocarbons becomeincreasingly complex and many mass channels can have contribu-
a
b
Fig. 3. Thermal effusion spectra of a (a) hard (thickness 252 nm) and (b) soft (th-ickness 180 nm) a-C:D film recorded in the MBMS configuration in the main cha-mber. Thermal desorption spectra are in logarithmic scale; please observe thatdifferent scales are used in (a) and (b). The temperature ramp was 15 K/min.
Table 2Assignment of selected mass channels to possible neutral mother molecules
Mass (amu) Ion Mother molecule
4 Dþ2 D2
18 CDþ3 , H2O+ CD4, H2O20 CDþ4 CD4
28 C2Dþ2 , CO+ C2D2, CO32 C2Dþ4 C2D4, C2D6, . . .
34 C2Dþ5 C2D6, C3D8, . . .
46 C3Dþ5 C3D6, C4D8, . . .
50 C3Dþ7 C4D10, C5D12, . . .
66 C4Dþ9 , C5Dþ3 C4D10, C5D12, . . .
a
b
Fig. 4. Thermal effusion spectra of a (a) hard (thickness 252 nm) and (b) soft (th-ickness 180 nm) a-C:D film recorded in the UHV oven (glass tube). Thermal deso-rption spectra are in logarithmic scale; please observe that different scales are usedin (a) and (b). The temperature ramp was 15 K/min.
164 E. Salanc�on et al. / Journal of Nuclear Materials 376 (2008) 160–168
tions from different neutral species. The identification and quanti-fication of individual species is challenging and subject of ongoingwork. A preliminary assignment of measured mass channels toneutral species is presented in Table 2. The assignment is basedon the fact that these ions have strong contributions in the respec-tive cracking pattern of the molecules. The 4 amu mass channelstems from D2. The 20 amu mass channel can be solely attributedto CD4 since the cracking pattern of long chain hydrocarbons pro-duces no contribution to mass 20. In fact, this is the main reasonwhy a-C:D films instead of a-C:H films have be used in this study.The dominant mass channel for CH4 is 16 amu. This overlaps with acracking product of water from the background and, therefore,
complicates the analysis. The same is true for D2 which can easilybe distinguished from the residual contribution from H2 which ispresent in each vacuum system. All other mass channels have con-tributions from several mother molecules and cannot simply be as-signed to one species.
Besides these different temperature ranges, the TE spectra differsignificantly in the measured signal intensities. For a quantitativecomparison we normalize the mass spectrometer intensities tothe sample thickness (i.e., cps/nm). The maximum of mass 20(CD4) which is the dominant contribution in Fig. 3(a) (hard film)is about a factor of 10 higher than for the soft film shown inFig. 3(b) (135 cps/nm compared with 13.2 cps/nm). The intensityfor 32 amu is almost identical in both cases (23.4 and 21.6 cps/nm for hard and soft films, respectively). On the contrary, the nor-malized intensities for the masses 34, 46, 50, and 66 amu are allhigher for the soft film. The ratios of the normalized intensities(soft/hard) for 34, 46, 50, and 66 amu are about 4, 25, 150, and25. In particular mass 50, which is a cracking product of C4D10,C5D12, and C6D14, is much higher for the soft film. The general trendis that the relative contribution of high molecular weight species ismuch higher for soft films compared with hard films. This is inagreement with published results for a-C:H films [21–24] and itis a consequence of the difference in microstructure of the two dif-ferent films.
In addition to the main peak, desorption from hard films(Fig. 3(a)) shows for the higher masses also a pre-peak at a temper-ature comparable to the desorption peak of soft films (Fig. 3(b)).

E. Salanc�on et al. / Journal of Nuclear Materials 376 (2008) 160–168 165
This pre-peak has a much lower intensity than the main peak, butis clearly visible as a separate peak. For the soft film, we find a sec-ond broad desorption structure for the higher masses with a max-imum at around 950 K. This structure is attributed to an artefact ofthe measurement. High mass species desorbed from the samplemay become redeposited on surrounding surfaces of the heaterthat are below the desorption temperature. With increasing heat-ing time and increasing heater temperatures, these surfaces mayreach desorption temperature and desorb the previously adsorbedspecies thus causing the second peak at high temperature. Thisinterpretation is corroborated by the fact that this second peakfor soft films is not observed in the oven setup (see Fig. 4(b)).
Similar measurements as those in Fig. 3 for the MBMS setup areshown in Fig. 4 for the oven setup. Qualitatively, the results mea-sured in both setups are very similar. In particular, the temperatureranges and peak shapes of the TE spectra for the two different filmsare in very good agreement. But significant quantitative differencesare observed. The differences to the MBMS setup occur with re-spect to the relative contributions of different masses. Althoughthe QMS is the identical instrument in both cases, QMS intensitiesmeasured in the oven and MBMS setup cannot directly be com-pared (as discussed in Section 2.2.2). But, we can compare at leastrelative intensities. For this comparison, we relate the measuredQMS intensities to the mass 20 signal of each spectrum. For theexperiments in the MBMS setup, the relative signal of the highmass species (P34 amu) is smaller than 0.02 for the hard film,while it is of the order of 1 for the soft film, so that the ratios ofthe normalized intensities between soft and hard films range from44 to 1500. However, for the experiments in the oven setup, theseratios are only between 16 and 500, i.e., they are about a factor of2–3 lower than in the MBMS setup.
Fig. 5 shows for two identical, soft a-C:D samples relative inten-sities of 4 different masses measured in the MBMS and oven setup,respectively. Here, for normalization we integrated the desorptionpeaks in the range from 600 to 850 K and set the integral of the20 amu signal to 1. All other peak integrals for the same setup arenormalized relative to this 20 amu signal. Because the heating ratesin both setups are not fully identical and for the MBMS setup notcompletely linear (see Section 2.2.2) we performed the integrationon the experimental time scale and not on the temperature scale. Asa consequence, the areas under the two 20 amu curves are not iden-tical if plotted on the temperature scale (as in Fig. 5), but this doesnot influence the general conclusions. The peak shape and positionof the 20 amu (CD4) peaks are almost identical in both cases(Fig. 5(a)). The difference between the signal of the MBMS and ovenmeasurement becomes larger with increasing molecular weight ofthe species (masses 66, 86, and 98 amu in Fig. 5(b)–(d)). A quanti-tative comparison of the difference in measured relative signalintensities is presented in Table 3 for eight representative masses.In addition, the ratio between the relative signal intensities isshown.
3.2. Redeposition of thermally released products
Redeposition was measured by moving the oven to a new posi-tion after a normal TE run as described in Section 2.3. Fig. 6 showsthe CD4 signal measured with the mass spectrometer and the pres-sure gauge reading in the main chamber as a function of time dur-ing two separate experiments in the oven using a hard and a softfilm, respectively. In each experiment first a normal TE run wasperformed and then the oven was shifted in steps of 2 cm. Identicalsamples as for the TE runs shown in Figs. 3 and 4 were used. Thefirst peak in Fig. 6 corresponds to desorption from the sample fora heating rate of 15 K/min up to 930 K (i.e., this is the normal effu-sion peak). After reaching the temperature of 930 K the oven washeld constant at that temperature. The second peak corresponds
to desorption from the walls of the glass tube after the first dis-placement by 2 cm, and the following peaks to the consecutive dis-placements of the oven. In the following we will denominate thefirst peak as primary peak and the following desorption peaksmeasured after each displacement step as secondary peaks.
The inset in Fig. 6 shows the reading of the cold cathode gaugein the main vacuum chamber. This reading is correlated with thetotal pressure, but due to the contribution of many different spe-cies with largely varying sensitivity factors this value cannot easilybe converted to the total pressure. For the first peak we find amuch higher signal for the hard film than for the soft film. This isin accordance with the results of the mass resolved spectra pre-sented in Figs. 3 and 4. In contrast, the signals from the secondarypeaks are much higher for the soft film. This clearly proves that theredeposition fraction is much higher for soft films than for hardfilms. In the case of the hard film the integrated area under allsix secondary peaks of the pressure reading corresponds to about6% of the area of the primary peak and to 42% in the case of the softfilm.
The difference between soft and hard films is even larger if theCD4 (20 amu) signal is considered. Although the peak maximum ofthe hard film is about a factor of 20 higher than that of the soft film,the secondary peaks of the hard film are about a factor of twosmaller than those of the soft film. For the hard film, the integratedarea under all six secondary peaks corresponds to about 0.2% of thearea of the primary peak and to 70% for the soft film. This strongdifference between the total pressure and mass 20 is again an indi-cation that other species have to contribute dominantly to the re-leased species flux.
Similar data as for mass 20 in Fig. 6 are shown for mass 46 inFig. 7. In contrast to mass 20 (Fig. 6), the peak maximum of the pri-mary peak of the hard film is smaller than that of the soft film. Thedouble peak structure of the hard film are the pre- and main peaksthat were already shown in Figs. 3 and 4(a). The pre-peak for thehard film is particularly strong for mass 46. Also in striking con-trast to mass 20, the ratio of the integrated area under all six sec-ondary peaks to the primary peak is comparable for mass 46. Thearea under the secondary peaks corresponds to 26% for the hardfilm and to 35% for the soft film.
4. Discussion
Comparing TE spectra measured in the MBMS (Fig. 3) and oven(Fig. 4) setup we found significant quantitative differences. For themeasurements in the oven setup the relative contribution of thehigh mass species is about a factor of 2–3 lower than in the MBMSsetup. We interpret this as a significantly lower probability for thehigh molecular weight species to reach the mass spectrometer ifreleased in the oven as compared with the MBMS setup. We as-sume that this is due to an increased probability to stick to thewalls. This is a plausible explanation, because the species releasedin the oven setup have to survive many wall collisions before theycan reach the ionizer of the mass spectrometer. This is also inagreement with the investigations regarding redeposition whichwere presented in Section 3.2.
The large difference between hard and soft films can be under-stood on the basis of prior knowledge on the microstructure of a-C:H films. It is, for example, well known that they contain differentamounts of hydrogen [20,17–19,24]. While hard films have typicalhydrogen concentrations of 30%, soft films exhibit hydrogen con-centrations of 50% and more. More hydrogen in the films leads tomore terminal hydrocarbon groups which have only one remainingbond to the carbon network. These terminal groups can be releasedduring thermal decomposition. With further increasing hydrogencontent these terminal groups may get longer thus leading to a

a b
c d
Fig. 5. Comparison of thermal effusion spectra of soft a-C:D films measured in the MBMS and UHV oven (glass tube) setups. The following masses are shown: (a) 20 amu, (b)66 amu, (c) 86 amu, and (d) 98 amu. The data are normalized to the respective integral over the 20 amu peak as described in the text. The data are plotted in arbitrary units,but on a common scale for all four figures, so that the relative intensities can be compared. Please observe that the scale in (b)–(d) is slightly enlarged. The peak shape andposition of the normalized 20 amu peak (a) is in excellent agreement for both measuring setups. The peaks for 86 and 98 amu are shifted towards higher temperatures for themeasurements in the oven setup.
Table 3Normalized (to mass 20) peak integrals (integration range 600–850 K) of selectedmasses measured for soft a-C:D films in the MBMS and oven setup
Mass (amu) Oven (rel. int.) MBMS (rel. int.) Ratio (oven/MBMS)
20 1.00 1.00 1.0034 0.74 0.83 0.8946 1.67 1.83 0.9150 0.63 0.73 0.8566 0.21 0.30 0.6974 0.41 0.50 0.8282 0.23 0.38 0.6086 0.25 0.42 0.6098 0.32 0.55 0.58
166 E. Salanc�on et al. / Journal of Nuclear Materials 376 (2008) 160–168
larger fraction of long chain, i.e., high molecular weight, hydrocar-bon species. Although this is a reasonable explanation, it has to bekept in mind that only little is known about these processes andfrom the available data no conclusions can be drawn about the ba-sic release mechanisms.
In Fig. 5 we compared the peak shapes of normalized TE spectrameasured in both setups and compiled a quantitative comparisonof the normalized peak integrals in Table 3. For all masses otherthan 20 amu (which was used for normalization) the peak integralof the oven measurement is lower than that of the MBMS measure-
ment. For masses 34, 46, 50, and 74 the ratio varies between 0.82and 0.91 which means that about 10–20% of the species released inthe oven are not detected by the mass spectrometer. The differenceis even larger for masses 66, 82, 86, and 98. For these species theloss of intensity lies between 30% and 40%. For 86 and 98 amunot only the peak integral is about 40% lower but also the peak isshifted to higher temperature in the oven measurement. We as-sume that both effects can be explained by an enhanced stickingof some of the high molecular weight species to the wall of theglass tube. Some of these species are permanently lost at the walland are responsible for the loss of intensity. Others reach the massspectrometer with some delay due to many adsorption desorptionsteps experienced during transport to the mass spectrometer.
To test the hypothesis of sticking to the walls of the quartz glasstube, we investigated the amount of redeposited material directly(see Section 3.2). TE spectra for 20 and 46 amu and the total pres-sure in the main chamber are presented in Figs. 6 and 7. Eachmovement of the oven gives rise to an increase of the total pres-sure. The only possible interpretation for this is, that species re-leased from the sample redeposit on the non heated parts of thequartz glass tube. The fact that a CD4 signal is observed in the sec-ondary peaks of Fig. 6 is remarkable. CD4 is a stable molecule anddoes not adsorb on the quartz glass surface at 300 K. This is inagreement with results for the hard film. Mass 20, which is solely

Fig. 6. TE spectra for mass 20 of a soft and hard film measured in the oven setup inthe usual measurement position (primary peak) and after consecutive shifts of theoven by 2 cm (secondary peaks). The inset shows the cold cathode gauge reading forthe identical experiment. Because the time scales of the two experiments are notidentical, the positions of the secondary peaks have been shifted accordingly toallow a comparison of the intensities of the peaks. These shifts are indicated by thearrows in the figure.
Fig. 7. Same as Fig. 6 but for 46 amu.
E. Salanc�on et al. / Journal of Nuclear Materials 376 (2008) 160–168 167
attributed to CD4, constitutes the dominant TE peak for hard films(Figs. 3 and 4(a)) and the total redeposition is only about 0.2%(Fig. 6). So we have to conclude that CD4 measured in the second-ary peaks is not deposited as a CD4 molecule, but is a reaction prod-uct generated during the following desorption step. This indicatesthat the released species spectrum is not identical to the adsorbedspecies spectrum. Hence, we have to conclude that in each desorp-tion step new species are produced from the adsorbed species. Thisis a question that has to be studied in more detail in future inves-tigations. Furthermore, this effect rules out any attempt to quantifyredeposition of individual species, e.g., determining the stickingcoefficient, from such kind of measurements. We only can comparerelative signals measured in the MBMS and oven setups as shownin the previous section (Fig. 5).
A further interesting detail of the oven displacement measure-ments is the observed behavior of the maximum value of each sec-ondary peak. Assuming a thickness profile of the redeposited filmthat decays monotonously with increasing distance from the endof the hot zone, we would anticipate that the maximum value ofthe secondary peaks decreases monotonically. This is, however,
not what is observed. The maximum of the first three secondarypeaks increases and then for the following displacements it de-creases again. This behavior, which is also observed for the integralover the secondary peaks, is not yet understood, but we assumethat it is due to a non-monotonic thickness profile. A possibleexplanation for that could be a slight heating of the inner surfaceof the quartz glass tube due to thermal radiation from the ovenwhich could lead to a lower deposition close to the oven. An expla-nation of this effect requires further investigations.
Redeposition plays a measurable but small role for hard a-C:Dfilms, but it is of paramount importance for soft films. It shouldbe emphasized that the value of 42% for redeposition from softfilms deduced from the analysis of the total pressure correspondsto the first 12 cm of the quartz glass tube only. A substantial frac-tion of the released material will be redeposited on the following17 cm of the glass tube and 35 cm of the stainless steel pipe be-tween main chamber and glass tube. We further have to assumethat a measurable fraction of the species reaching the main cham-ber may deposit on the main chamber walls. This means that in ourexperimental geometry the total redeposition of species releasedin the oven setup from soft films can easily exceed 50%. With otherwords, this means that less than 50% of the species released fromthe sample have the chance to reach the QMS. Naturally, the rede-position fraction will strongly depend on the sticking probability ofthe individual species. As the preceding discussion is mainly basedon the CD4 signal and the measurement of the pressure which areboth dominantly due to recycling species, we conclude that theaverage redeposition probability for reactive species is much high-er than 50%. So we conclude that the redeposition of material onthe walls of the quartz glass tube is the main reason for the muchlower signal measured in the oven setup compared with the MBMSsetup.
5. Conclusions
Thermally induced decomposition of hard and soft amorphoushydrocarbon films was investigated by thermal effusion spectros-copy in the experimental setup TESS.
Thermal decomposition of a-C:D films leads to release of molec-ular hydrogen and a large variety of hydrocarbon molecules. Thespectrum of released species depends strongly on the physicalproperties of the used a-C:H(D) films, in particular on the hydrogencontent. Comparable results have been found for a-C:H films [21–24] so that we can assume that the thermal decomposition is notsignificantly influenced by type of hydrogen isotope in the film.In this study, two archetypes of a-C:D films were used. A typicalhard film with a hydrogen content of about 30% and a soft filmwith 50%. Soft a-C:D films exhibit a desorption maximum atT � 740 K while hard films have their maximum at T � 870 K. Forhard films the dominantly released species are D2 and CD4. Onthe contrary, the product spectrum of soft films is dominated bylong chain hydrocarbons. C2Dy and C3Dy dominate, but significantcontributions of C4Dy and C5Dy were also found.
The higher thermal stability and the different product spectrumof hard films can be understood on the basis of prior knowledge ofthe films microstructure. More hydrogen in the films leads to moreterminal hydrocarbon groups. These terminal groups can be re-leased during thermal decomposition. With further increasinghydrogen content these terminal groups may get longer thus lead-ing to a larger fraction of long chain hydrocarbon species.
Comparing spectra recorded in a molecular-beam-mass-spec-trometry setup with spectra recorded by the same mass spectrom-eter but from an UHV oven in a remote location, we found thatreleased species have a certain probability to stick to the chamberwalls. Redeposition plays a small role for hard a-C:D films, but it is

168 E. Salanc�on et al. / Journal of Nuclear Materials 376 (2008) 160–168
of paramount importance for soft films. This redeposition wasstudied qualitatively in a dedicated experiment by investigatingthe re-desorption of redeposited material. We conclude that rede-position is mainly due to sticking of high molecular weight species.An interesting aspect is the fact that obviously new species areformed during re-desorption of redeposited material. From theredeposited fraction of material we estimated a total redepositionprobability of more than 50% for species released from soft filmsfor our experimental conditions.
This strong tendency for redeposition limits the applicability ofthermal methods for hydrogen removal from fusion devices. Ther-mal methods are applicable to hard a-C:H(D) films, because thespectrum of released species is dominated by the stable productsH2 and CH4 (or comparable species formed with other hydrogenisotopes) which do not redeposit on cooler wall areas. Soft, hydro-gen-rich films decompose into a rich spectrum of species whichpartially tend to stick to cooler wall areas. As a consequence, localheating will remove such films from the heated area, but the mate-rial will not be transported to the vacuum pumps but redepositsomewhere else in the vacuum vessel. Therefore, to demonstratethe feasibility of thermal methods it is not sufficient to demon-strate local removal, but to prove that the mobilized inventorycan be really removed from the vacuum vessel.
Acknowledgement
One of us (E.S.) would like to thank EURATOM Association forfunding the stay at IPP Garching.
References
[1] G. Federici, P. Andrew, P. Barabaschi, J. Brooks, R. Doerner, A. Geier, A.Herrmann, G. Janeschitz, K. Krieger, A. Kukushkin, A. Loarte, R. Neu, G. Saibene,M. Shimada, G. Strohmayer, M. Sugihara, J. Nucl. Mater. 313–316 (2003) 11.
[2] J. Paméla, G. Matthews, V. Philipps, R. Kamendje, J. Nucl. Mater. 363–365(2007) 1.
[3] A. von Keudell, C. Hopf, T. Schwarz-Selinger, W. Jacob, Nucl. Fusion 39 (1999)1451.
[4] C. Hopf, K. Letourneur, W. Jacob, T. Schwarz-Selinger, A. von Keudell, Appl.Phys. Lett. 74 (1999) 3800.
[5] C. Hopf, T. Schwarz-Selinger, W. Jacob, A. von Keudell, J. Appl. Phys. 87 (2000)2719.
[6] J.P. Coad, N. Bekris, J.D. Elder, S. Erents, D. Hole, K. Lawson, G. Matthews, R.Penzhorn, P. Stangeby, J. Nucl. Mater. 290–293 (2001) 224.
[7] M. Rubel, J.P. Coad, N. Bekris, S. Erents, D. Hole, G. Matthews, R. Penzhorn,J. Nucl. Mater. 313–316 (2003) 321.
[8] M. Mayer, V. Rohde, A. von Keudell, J. Nucl. Mater. 313–316 (2003) 429.[9] M. Mayer, A. von Keudell, V. Rohde, P. Coad, JET–EFDA contributors, in: R. Koch,
S. Lebedev (Eds.), Proceedings of the 30th EPS Conference, vol. 27A of EuropeanConference Abstracts, European Physical Society, 2003..
[10] V. Rohde, M. Mayer, J. Likonen, R. Neu, T. Pütterich, E. Vainonen-Ahlgren,J. Nucl. Mater. 337–339 (2005) 847.
[11] G. Counsell, P. Coad, C. Grisolia, C. Hopf, W. Jacob, A. Kirschner, A. Kreter, K.Krieger, J. Likonen, V. Philipps, J. Roth, M. Rubel, E. Salancon, A. Semerok, F.Tabares, A. Widdowson, Plasma Phys. Control. Fusion 48 (2006) B189.
[12] W. Jacob, J. Nucl. Mater. 337–339 (2005) 839.[13] C. Skinner, N. Bekris, J.P. Coad, C. Gentile, M. Glugla, J. Nucl. Mater. 313–316
(2003) 496.[14] N. Bekris, J. Coad, C. Skinner, C. Gentile, E. Damm, W. Nägele, J. Nucl. Mater
367–370 (2007) 1254.[15] K. Gibson, G. Counsell, C. Curran, M. Forrest, M. Kay, K. Watkins, J. Nucl. Mater.
337–339 (2005) 565.[16] A. Widdowson, J. Coad, N. Bekris, G. Counsell, M. Forrest, K. Gibson, D. Hole, J.
Likonen, W. Parsons, T. Renvall, M. Rubel, J. Nucl. Mater. 363–365 (2007)341.
[17] T. Schwarz-Selinger, A. von Keudell, W. Jacob, J. Appl. Phys. 86 (1999) 3988.[18] W. Jacob, Thin Solid Films 326 (1998) 1.[19] J. Robertson, Mat. Sci. Eng. Rep. 37 (2002) 129.[20] M. Weiler, S. Sattel, T. Giessen, K. Jung, H. Ehrhardt, V.S. Veerasamy, J.
Robertson, Phys. Rev. B 53 (1996) 1594.[21] C. Wild, P. Koidl, Appl. Phys. Lett. 51 (1987) 1506.[22] J. Ristein, R.T. Stief, L. Ley, W. Beyer, J. Appl. Phys. 84 (1998) 3836.[23] W. Jacob, C. Hopf, A. von Keudell, T. Schwarz-Selinger, Hydrogen Recycling at
Plasma Facing Materials, Kluwer Academic Publishers, Dordrecht, 2000.[24] T. Som, M. Malhotra, V. Kulkarni, S. Kumar, Physica B 355 (2005) 72.
Related Documents


