Redcentric plc Half year results for the six months ended 30 September 2020 (unaudited) Contents Page Responsibility statement 1 Interim management report 2 Condensed consolidated Statement of Comprehensive Income 14 Condensed consolidated Statement of Financial Position 15 Condensed consolidated Statement of Changes in Equity 16 Condensed consolidated Statement of Cash Flows 17 Notes to the condensed set of financial statements 18

Welcome message from author
This document is posted to help you gain knowledge. Please leave a comment to let me know what you think about it! Share it to your friends and learn new things together.
Transcript

Redcentric plc
Half year results for the six months ended 30 September 2020 (unaudited)
Contents Page
Responsibility statement 1
Interim management report 2
Condensed consolidated Statement of Comprehensive Income 14
Condensed consolidated Statement of Financial Position 15
Condensed consolidated Statement of Changes in Equity 16
Condensed consolidated Statement of Cash Flows 17
Notes to the condensed set of financial statements 18
1
Redcentric plc
Responsibility statement
We confirm that to the best of our knowledge the condensed set of financial statements has been prepared in accordance
with IAS 34 ‘Interim Financial Reporting’
By order of the board of directors (the “Board”) of Redcentric plc (“Redcentric” or “Company”),
Chief Executive Officer Chief Financial Officer
Peter Brotherton David Senior
11th November 2020 11th November 2020

2
Redcentric plc
Interim management report
To the members of the Redcentric plc group of companies (the “Group”)
This interim management report (“IMR”) has been prepared solely to provide additional information to shareholders to
assess the Group’s strategies and the potential for those strategies to succeed. The IMR should not be relied on by any
other party or for any other purpose.
The IMR contains certain forward-looking statements. These statements are made by the directors in good faith based
on the information available to them up to the time of their approval of this report but such statements should be treated
with caution due to the inherent uncertainties, including both economic and business risk factors, underlying such
forward-looking information.
This IMR has been prepared for the Group as a whole and therefore gives greater emphasis to those matters which are
significant.
Chief Executive Officer’s review
Overview
The business has performed extremely well over the six months to 30 September 2020 (“H1-21”) and the results reflect
the strategic decisions, positive management actions and hard work undertaken over the last two years. With revenues
growing (+7%), profit margins increasing (EBITDA margins up 3% to 27% ) and continued good cash generation (net debt
reduced by £17.5m), these results reflect considerable progress and position the business well for the future and the next
stage of its development.
The key features of these results are a return to revenue growth, the completion of the network and data centre
rationalisation programme, continued excellent cash generation and the resolution of the Financial Conduct Authority
(“FCA”) investigation into historical accounting misstatements (“FCA Investigation”).
Business performance
Revenues
Revenues for the first half of the year are up 7% on last year, with recurring revenues accounting for 89% of total revenues
and increasing by 6% on H1 of the financial year ending 31 March 2020 (“FY20”). The increase in recurring revenues
reflects growth in the public sector. All of the Health and Social Care Network (“HSCN”) contract wins are now fully
deployed and generating revenue and our good performance in rolling out these networks has given us a significantly
increased profile within both the public and private health sectors. As a result of this, we have won a significant number
of new logo contract wins as well as cross selling additional products into the HSCN contract base. 34% of H1 revenues
were derived from public and private health sector clients.
Whilst the public sector has been the driver for growth, the private sector continues to account for most of the business’
revenue. 82% of total recurring revenues were derived from the private sector and 18% from the public sector. Whilst
we have a loyal customer base that continues to buy more and additional products from us, we have struggled over the
last four years to attract new logos into the business. We believe that the FCA Investigation over this period has been a
significant reason for the reluctance of organisations to move their mission critical IT infrastructure over to Redcentric.
With the FCA Investigation now concluded, this barrier has been removed and we will deploy additional sales resource in
the second half of the financial year ending 31 March 2021 (“FY21”) to attract new private sector logo business. Sales
timelines are typically six months, with installations taking three months, so our renewed efforts in this area are unlikely
to materialise in to increased revenue until the financial year ending 31 March 2022 (“FY22”).
Operational efficiencies
During the period, the network and data centre efficiency programme was completed, achieving final annualised costs
savings of approximately £4.0m, significantly ahead of the Company’s expectations of £2.8m when the programme was
launched. As part of this exercise, three third party data centres in London have been vacated, three network platforms

3
have been merged in to one and our entire tail circuit estate has been validated. All this was done without incident and
with minimal disruption to customers.
On 5th October 2020 the Finance and Operations modules of Microsoft Dynamics 365 (“D365”) went live, adding to the
sales module that was launched during the previous financial year. This new enterprise resource planning (“ERP”) system
replaces five legacy systems and will ensure that there is consistent and more accurate data across the organisation. In
addition, we will be able to provide a better customer experience through the implementation of significantly improved
customer portals and will use the system to drive further efficiencies.
Immediately post the launch of D365, work has commenced on implementing workflow software in the delivery function.
The first phase of this programme is expected to be complete by the end of the financial year and to reduce annualised
employment costs by £0.4m as a result. Workflow software, process improvements and automated systems will be a key
focus in the Company’s constant drive for efficiencies.
Network and product platforms
The national network was upgraded to a 100Gb core and 10Gb connectivity was enabled at the end of FY20. Post the
network and data centre efficiency programme, we now have just one physical network and one network platform, both
of which are completely up-to-date and thus require a minimal amount of capital expenditure in the medium term. Unlike
some competitors, the Company has decided not to invest in local loop unbundling as we have been able to achieve
competitive pricing from wholesalers who are themselves fully unbundled. This means that our levels of network capital
expenditure are considerably less than some of the business’ competitors.
The new cloud platform has been fully operational for nine months now and all customers have been migrated off the
old platform. Investment in data centres has continued, with significant upgrades to the Shoreditch data centre electrical
systems and new cooling units installed in the Harrogate data centre.
The business’ voice platforms are fully up-to-date and other than some equipment upgrades, minimal capital expenditure
is required over the medium term.
Cash flows
Good cash flow has been a consistent feature of the business over the last four years. During the half year and despite
growth in the business, we achieved positive working capital movements and generated adjusted operating cash flow of
£12.9m. The Company’s aged trade debtor book is the best it has ever been with just £32k of debt over 3 months old and
average debtor days of 33 days.
The Company’s accounting policies in respect of the capitalisation of costs are considerably more prudent than some
competitors. No implementation costs, product development costs or research and development costs are capitalised
and this, along with a prudent view on what constitutes an IFRS16 lease, means that the Company’s capital expenditure
levels are considerably lower than most of its competitors. We believe that our adjusted EBITDA less capital expenditure
margins are sector leading and that adjusted EBITDA less capital expenditure is the best measure on which to appraise
the Company’s financial performance.
Dividend policy and share buy back
Further to the business’ good trading performance throughout the COVID-19 pandemic, the closure of the restitution
scheme, as detailed below, and the low levels of net debt, the Board has decided to reinstate dividend payments and
with these results announces an interim dividend of 1.2p per share which will be paid on 31 December 2020 to
shareholders on the register at the close of business on 20 November 2020. As part of its review of strategy going forward,
the Board will consider its final dividend policy and will make its recommendation at the time of release of the Company’s
preliminary results for FY21.
In addition to restoring dividend payments, the Board will also reinstate the share buyback programme, with a view to
selectively purchasing shares on market when it believes the shares are trading at a discount to the Company’s fair
valuation.
Closure of the FCA Investigation
In June 2020, the Company announced that it had reached a settlement with the FCA in respect of historical accounting
misstatements. As part of this settlement, the Company launched a restitution scheme to compensate any net purchasers
4
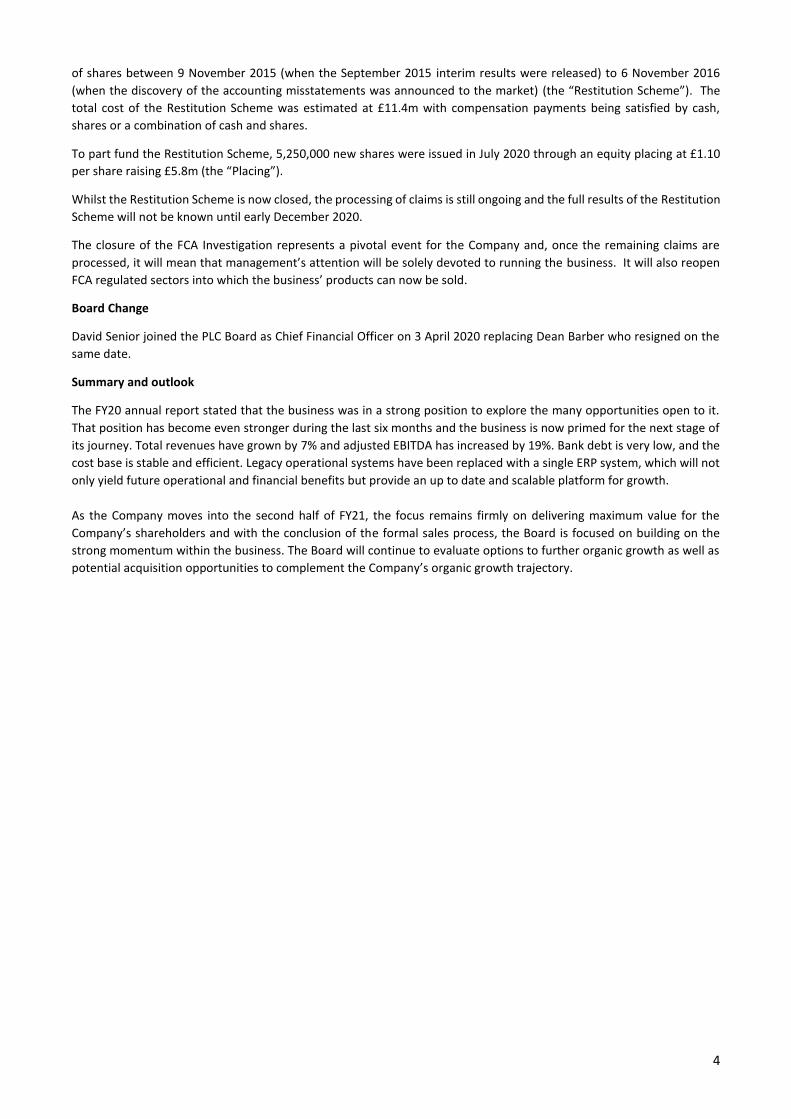
of shares between 9 November 2015 (when the September 2015 interim results were released) to 6 November 2016
(when the discovery of the accounting misstatements was announced to the market) (the “Restitution Scheme”). The
total cost of the Restitution Scheme was estimated at £11.4m with compensation payments being satisfied by cash,
shares or a combination of cash and shares.
To part fund the Restitution Scheme, 5,250,000 new shares were issued in July 2020 through an equity placing at £1.10
per share raising £5.8m (the “Placing”).
Whilst the Restitution Scheme is now closed, the processing of claims is still ongoing and the full results of the Restitution
Scheme will not be known until early December 2020.
The closure of the FCA Investigation represents a pivotal event for the Company and, once the remaining claims are
processed, it will mean that management’s attention will be solely devoted to running the business. It will also reopen
FCA regulated sectors into which the business’ products can now be sold.
Board Change
David Senior joined the PLC Board as Chief Financial Officer on 3 April 2020 replacing Dean Barber who resigned on the
same date.
Summary and outlook
The FY20 annual report stated that the business was in a strong position to explore the many opportunities open to it.
That position has become even stronger during the last six months and the business is now primed for the next stage of
its journey. Total revenues have grown by 7% and adjusted EBITDA has increased by 19%. Bank debt is very low, and the
cost base is stable and efficient. Legacy operational systems have been replaced with a single ERP system, which will not
only yield future operational and financial benefits but provide an up to date and scalable platform for growth.
As the Company moves into the second half of FY21, the focus remains firmly on delivering maximum value for the
Company’s shareholders and with the conclusion of the formal sales process, the Board is focused on building on the
strong momentum within the business. The Board will continue to evaluate options to further organic growth as well as
potential acquisition opportunities to complement the Company’s organic growth trajectory.

5
Key performance indicators
As set out in the Company’s most recent annual report, we monitor our performance against our strategy with reference
to key performance indicators (“KPIs”). These KPIs are applied on a Group wide basis. Our headline financial results in the
six months to 30 September 2020 are set out in the table below, together with the prior year comparatives. Further
information on alternative performance measures can be found on page 7.
Six months to 30 Sept 2020 (H1-21)
Six months to 30 Sept 2019 (H1-20) Change
Total revenue £46.2m £43.2m +7% Recurring monthly revenue (RMR) 1 £41.0m £38.8m +6% Adjusted EBITDA1 £12.3m £10.3m +19% Adjusted operating profit1` £7.6m £5.5m +38% Reported operating profit £3.1m £1.9m +63% Adjusted cash generated from operations1 £12.9m £10.3m +26% Reported cash generated from operations £10.4m £9.8m +6% Adjusted EBITDA less reported capital expenditure £10.0m £5.6m +79% (Net debt) / Cash £(17.0m) £(40.0m) -58% Adjusted basic earnings per share1 3.61p 2.41p +50%
1 This report contains certain financial measures alternative performance measures (“APMs”) that are not defined or recognised under IFRS but are
presented to provide readers with additional financial information that is evaluated by management and investors in assessing the performance of the
Group.
This additional information presented is not uniformly defined by all companies and may not be comparable with similarly titled measures and
disclosures from other companies. These measures are unaudited and should not be viewed in isolation or as an alternative to those measures that are
derived in accordance with IFRS.
For an explanation of the APMs used in this report and reconciliations to their most directly related GAAP measure, please refer to page 7.
Financial Highlights
• Total revenue increased by 7% to £46.2m reflecting strong recurring revenues which now represent 89% of total
revenue (H1-20: 90%). Recurring revenue has increased to £41.0m, a 6% increase on the equivalent period last
year. The growth has been delivered by a combination of successful HSCN implementations, and the installation
of COVID-19 related services, which tend to have a shorter order to installation time lag.
• Adjusted operating expenditure reduced by £1.1m (6.3%) to £16.4m reflecting the impact of cost benefits
realised through the operational efficiencies delivered in H2-20.
• Adjusted EBITDA increased by 19% to £12.3m (H1-20: £10.3m) with margins improving to 26.5% (H1-20: 23.9%)
reflecting 62.5% adjusted EBITDA flowthrough on incremental sales of £3.1m.
• Adjusted EBITDA less reported capital expenditure increased by 80% to £10.1m due to increased levels of
profitability and reduced capital expenditure.
• Adjusted operating profit increased by 38.1% to £7.6m (H1-20: £5.5m) with operating margin improving to 16.4%
(H1-20: 12.6%).
• Cash flows continue to be very strong with £12.9m of adjusted operating cash flow in the period (H1-20: £10.3m)
reflecting 105% cash conversion (H1-20: 100%)
• Net debt reduced by £17.5m since 31 March 2020 to £17.0m, and excluding leases previously classified as
operating leases under IAS17 was £1.1m (31 March 2020: £13.5m)

6
Operational Highlights
• Revenue continues to grow with recurring revenues, excluding the loss of public sector contracts to Crown
Hosting (“Crown Hosting Contracts”), growing in each of the last five quarters.
• The data centre and network restructuring programme has been successfully completed and, as a result, the
Company will benefit from annualised cost savings of approximately £4.0m.
• A new ERP system has successfully launched replacing five legacy operational systems which provides the
Company with a single, scalable integrated platform yielding significant benefits in the future.
Ian Johnson, Non-Executive Chairman commented:
“I am pleased to report that the business is performing very well with revenues growing, strong profit margins and
excellent cash generation.
Our very significant presence in the public and private healthcare sectors, highly relevant products and high levels of
recurring revenues combine to put us in an excellent position to withstand the current challenges associated with COVID-
19 and the downturn in the wider economy. The outlook for the remainder of the year remains positive, although the
Board remains cautious in respect of the longer-term economic uncertainty posed by a prolonged COVID-19 pandemic.
We also announced today the termination of the formal sales process that commenced earlier in the year. With the FCA
Investigation now firmly behind us, the business performing well and low levels of net debt, we are in a strong position
to consider a number of other strategic options for improving shareholder value, including appropriate acquisitions to
add scale and capability.
With these results, the Board also announces the reinstatement of a dividend and the share buyback programme. Full
details of the Board’s recommended dividend policy will be communicated when the Company announces its preliminary
results for FY21 and will reflect the conclusion of the Board’s ongoing strategic review.
Unless there are opportunities to re-invest at attractive rates of return including appropriate acquisitions, the Company
will seek to return its free cash flow annually to shareholders via dividends and / or share buybacks.”

7
Chief Financial Officer’s Review
Alternative performance measures
This interim report contains certain APMs that are not defined or recognised under IFRS but are presented to provide
readers with additional financial information that is evaluated by management and investors in assessing the
performance of the Group.
This additional information presented is not uniformly defined by all companies and may not be comparable with similarly
titled measures and disclosures by other companies. These measures are unaudited and should not be viewed in isolation
or as an alternative to those measures that are derived in accordance with IFRS.
Recurring monthly revenue
Recurring revenue is the revenue that annually repeats either under contractual arrangement or by predictable customer
habit. It highlights how much of the Group’s total revenue is secured and anticipated to repeat in future periods, providing
a measure of the financial strength of the business. It is a measure that is well understood by the Group’s investor and
analyst community and is used for internal performance reporting.
Six months to 30 Sept
2020 Unaudited
Six months to 30 Sept
2019 Unaudited
Year ended 31 March
2020 Audited
£’000 £’000 £’000 Reported revenue 46,241 43,152 87,485
Non-recurring revenue (5,194) (4,342) (9,868) Recurring revenue 41,047 38,810 77,617
Total revenue increased by 7% to £46.2m (H1-20: £43.2m) reflecting strong recurring revenue growth of 6%, increasing
to £41.0m (H1-20: £38.8m). Recurring revenue makes up 89% of total revenue (H1-20: 90%), reflecting the comparable
strong growth in non-recurring revenue.
Recurring revenues derived from the combined public and private health sectors in H1 are 34%, a significant increase on
(H1-20: 27%), reflecting the Company’s success in this growing sector.
Non-recurring revenue has increased to £5.2m (H1-20: £4.3m) driven by a strong start to the year particularly in the
public healthcare sector. The volatility of non-recurring revenue has increased since the announcement of Brexit and
more latterly COVID-19, both of which are causing customers to reconsider the timing of largescale IT investment
decisions.
Underlying recurring revenue run rate has increased in each of the last seven months, demonstrating a sustainable
growth trend underpinning future revenue forecasts.
Crown Hosting Contracts revenue included within recurring revenue totals £0.6m (H1-20: 1.8m), reflecting the ongoing
run rate. Excluding the impact of the loss of Crown Hosting Contracts, recurring revenue has increased by 9.4% and has
grown for five consecutive quarters.

8
Recurring gross profit
Recurring gross profit is the gross profit that annually repeats either under contractual arrangement or by predictable
customer habit. It highlights how much of the Group’s total gross profit is secured and anticipated to repeat in future
periods.
Six months to 30 Sept
2020 Unaudited
Six months to 30 Sept
2019 Unaudited
Year ended 31 March
2020 Unaudited
£’000 £’000 £’000 Reported gross profit 28,653 27,833 55,188
Non-recurring gross profit (1,643) (1,830) (3,663)
Recurring gross profit 27,010 26,003 51,526
Total gross profit increased by 3% to £28.7m (H1-20: £27.8m) reflecting recurring gross profit growth of 4% increasing to
£27.0m (H1-20: £26.0m), driven by volume flowthrough from revenue growth.
Total gross margin has declined from 64.5% in H1-20 to 62.0% in H1-21. Of the 2.5% movement, 1.1% is caused by the
decline in the high margin Crown Hosting Contract revenues and 1.3% by a higher proportion of lower margin non-
recurring sales. Benefits realised in cost of sales through operational efficiencies have largely mitigated slightly lower
margins on services installed and churn on renewals.
Non-recurring gross margins have reduced to 31.6% (H1-20: 42.2%) reflecting a change in mix towards a higher proportion
of lower margin product sales, which impacts total gross margin by a further 1.3%.
Adjusted EBITDA
Adjusted EBITDA is EBITDA excluding exceptional items (as set out in note 6), share-based payments and associated
national insurance. Items are only classified as exceptional due to their nature or size, and the Board considers that this
metric provides the best measure of assessing underlying trading performance.
Six months to 30 Sept
2020 Unaudited
Six months to 30 Sept
2019 Unaudited
Year ended 31 March
2020 Audited
£’000 £’000 £’000 Reported operating profit/(loss) 3,080 1,904 (8,737) Amortisation of intangible assets arising on business combinations 3,126 3,126 6,252 Amortisation of other intangible assets 541 604 1,197 Depreciation 4,125 4,274 8,814 EBITDA 10,872 9,908 7,526 Exceptional items 1,095 169 12,516 Share-based payments 294 253 562 Adjusted EBITDA 12,261 10,330 20,604
Adjusted EBITDA increased by 19% to £12.3m (H1-20: £10.3m) reflecting growth in revenues and the flow through of cost
benefits realised through the operational efficiencies delivered in H2-20.

9
Adjusted cash from operations
Adjusted cash from operations is cash from operations excluding the cash cost of exceptional items
Six months to 30 Sept
2020 Unaudited
Six months to 30 Sept
2019 Unaudited
Year ended 31 March
2020 Audited
£’000 £’000 £’000 Reported cash from operations 10,445 9,804 18,817 Cash costs of exceptional items 2,452 444 817 Adjusted cash from operations 12,897 10,248 19,634
Maintenance capital expenditure
Maintenance capital expenditure is the capital expenditure that is incurred in support of the Group’s underlying
infrastructure rather than in support of specific customer contracts.
Six months to 30 Sept
2020 Unaudited
Six months to 30 Sept
2019 Unaudited
Year ended 31 March
2020 Audited
£’000 £’000 £’000 Reported capital expenditure 2,216 4,753 6,922 Customer capital expenditure (1,601) (1,240) (2,470) Maintenance capital expenditure 615 3,513 4,452
Following the completion of network and platform upgrades in FY20 maintenance capital expenditure has reduced
significantly. We will continue to monitor the businesses capital requirements and invest in the business when
appropriate.
Customer capital expenditure has increased to £1.6m (H1-20: 1.2m) in line with the increased demand seen in the
revenue numbers.
Adjusted operating profit and adjusted earnings per share
Adjusted operating profit is operating profit excluding amortisation on acquired intangibles, exceptional items and share-
based payments. The same adjustments are also made in determining the adjusted operating profit margin and in
determining adjusted earnings per share (“EPS”). The Board considers this adjusted measure of operating profit to
provide the best metric of assessing underlying performance as it excludes exceptional items and the amortisation of
acquired intangibles arising from business combinations which varies year on year dependent on the timing and size of
any acquisitions.
Six months to 30 Sept
2020 Unaudited
Six months to 30 Sept
2019 Unaudited
Year ended 31 March
2020 Audited
£’000 £’000 £’000 Reported operating profit/(loss) 3,080 1,904 (8,737) Amortisation of intangible assets arising on business combinations 3,126 3,126 6,252 Exceptional items 1,095 169 12,516 Share-based payments 294 253 562 Adjusted operating profit 7,595 5,452 10,593
The EPS calculation further adjusts for the tax impact of the operating profit adjustments, presented in note 9.

10
Adjusted operating costs
Adjusted operating costs are operating costs less depreciation, amortisation, exceptional items and share-based
payments.
Six months to 30 Sept
2020 Unaudited
Six months to 30 Sept
2019 Unaudited
Year ended 31 March
2020 Audited
£’000 £’000 £’000 Reported operating expenditure 25,573 25,929 63,925 Depreciation (4,125) (4,274) (8,814) Amortisation of intangibles arising on business combinations (3,126) (3,126) (6,252) Amortisation of other intangible assets (541) (604) (1,197) Exceptional items (1,095) (169) (12,516) Share-based payments (294) (253) (562) Adjusted operating expenditure 16,392 17,503 34,584
Adjusted operating expenditure has reduced by 6% to £16.4m (H1-FY20: £17.5m) primarily driven by:
• UK employee costs down £0.1m, driven by lower headcount. The Company employed 292 UK employees at 30
September 2020 with an average headcount of 295 (H1-20: 314). Offshore costs were also £0.2m lower than
prior year, reflecting a lower average headcount of 135 (H1-20: 150);
• the exit of third-party data centres that were not treated as leases under IFRS16 generating £0.4m of savings;
and
• other sales, general and administration costs down £0.2m due to COVID-19 related restrictions on travel and
office working
Adjusted net debt
Adjusted net debt is net debt excluding leases that would have been classified as operating leases under IAS 17.
Six months to 30 Sept
2020 Unaudited
Six months to 30 Sept
2019 Unaudited
Year ended 31 March
2020 Audited
£’000 £’000 £’000 Reported net debt (17,010) (40,032) (34,549) Lease liabilities that would have been classified as operating leases
under IAS 17
15,877 23,506 21,057
Adjusted net debt (1,133) (16,526) (13,492)
Profitability, dividend policy and share buyback
Adjusted EBITDA (£12.3m) and adjusted operating profit (£7.6m) were up 19% and 39% respectively, with an adjusted
EBITDA margin of 26.5% (H1-20: 22.4%) and adjusted operating margin of 16.4% (H1-20: 12.6%).
After accounting for exceptional items of £1.1m (H1-20: £0.2m) and share-based payment costs of £0.3m (H1-20: £0.3m),
reported operating profit was higher at £3.1m (H1-20: £1.9m).
Net finance costs for the period were £0.8m (H1:20: £1.0m) including £0.6m (H1-20: £0.6m) of IFRS 16 finance charges.
Adjusted basic and diluted EPS increased by 50% and 49% to 3.61p and 3.54p respectively (H1-20: 2.41p and 2.38p
respectively). The reported basic and diluted EPS were also higher at 1.39p and 1.36p (H1-20: 0.34p and 0.34p
respectively).
The Board has reviewed the financial performance of the business and has decided to reinstate an interim dividend
payment of 1.2p per share, which will be paid on 31 December 2020 to shareholders on the register at the close of
business on 20 November 2020.
During FY20, the Company implemented a share buyback programme under which 822,427 shares were purchased by
the Company at a weighted average price of 88p per share. Since the year end, following notices of exercise in relation

11
to employee share options, 727,716 shares previously held in Treasury were transferred to satisfy these exercises, leaving
94,711 remaining in Treasury as at today’s date.
Cash flow and net debt
The principal movements in net debt are set out in the table below.
Six months to
30 September 2020
Unaudited
Six months to 30 September
2019 Unaudited
Year ended 31 March
2020 Audited
£’000 £’000 £’000 Adjusted EBITDA 12,261 10,330 20,604 Effect of exchange rates 18 39 13 Working capital movements 636 (82) (970)
Adjusted cash generated from operations 12,915 10,287 19,647 Cash conversion 105% 100% 95% Capital expenditure – cash purchases (1,235) (2,267) (4,233) Capital expenditure – finance lease purchases (981) (2,484) (2,402)
Net capital expenditure (2,216) (4,751) (6,635) Corporation tax 149 (248) (660) Interest paid (261) (440) (1,825) Loan arrangement fees/fee amortisation 41 (4) (51) Finance lease/term loan interest (634) (597) (2,117) Effect of exchange rates 1 (21) (13)
Other movements in net debt (704) (1,310) (4,666)
Normalised net debt movement 9,995 4,226 8,346
Lease liabilities adopted under IFRS 16 - (24,479) (21,058) Cash costs of exceptional items (2,452) (444) (817) Remeasurement related to lease modification 4,221 - - Share issues 5,775 - - Share buy-back - (278) (724) Dividends - (1,491) (2,731)
7,544 (26,692) (25,330) Decrease/(increase) in net debt 17,539 (22,466) (16,984) Net debt at the beginning of the period (34,549) (17,565) (17,565)
Net debt at the end of the period (17,010) (40,031) (34,549)
Net debt reduced by £17.5m in the period to £17.0m and consists of total borrowings of £8.1m (FY-20: £17.2m) and
leases previously classified as operating leases under IAS17 of £15.9m (FY-20: 21.0m) less cash balances of £6.9m (FY-20:
£3.7m).
Capital expenditure of £2.2m (H1-20: £4.8m) has returned to normal levels following the completion of network and
platform upgrades.
During H1-21 there has been £4.2m of net cash benefit as a result of the Placing to part fund the Restitution Scheme. To
date, the net proceeds of the Placing have exceeded the amount of claims submitted under the Restitution Scheme and
advisory costs paid out, although this benefit is expected to reduce in H2 as claims could be submitted under the scheme
until 30 October 2020 and processing of the final claims has not yet been completed.
On 27 August 2020 a modification to the London site lease was agreed with the landlord, incorporating a one-way break
clause at March 2030, with the lease expiry date remaining unchanged at March 2040. The inclusion of this clause triggers
a revision to the lease liability and right of use asset under IFRS 16. The impact of the modification on the financial
statements is to reduce both the lease liability and right of use asset by £4.2m and £4.9m respectively with a £0.6m
exceptional charge in the period.

12
At 30 September 2020, the Company had committed a revolving credit facility (“RCF”) of £17.5m, an overdraft facility of
£5.0m and a £5.0m asset financing facility. In addition, the Company has access to a £20.0m accordion facility. At 30
September 2020, £15.0m of the RCF and £5.0m of the overdraft was undrawn.
Events after the reporting period
The final day for claims to be submitted in relation to the Restitution Scheme was 30 October 2020. The total number of
claims received increased considerably in October and is estimated to be approximately 75% of the total net share
purchases made in the relevant period. As noted above, whilst the Restitution Scheme is now closed, the processing of
claims is still ongoing, and the full results will not be known until early December 2020.
Related party transactions
There have been no material changes in the related party transactions described in the last annual report and accounts
of the Company.

13
Principal risks and uncertainties
COVID-19
The COVID-19 pandemic has created an unprecedented and constantly changing challenge to all businesses. Indeed, as
the country enters a national lockdown for the second time there is still no clear end point to both the social and economic
disruption. The Group’s relatively low risk, high visibility business model has served it well over duration of the pandemic
so far and the business has performed strongly. However, as the social and economic restrictions continue, an
unquantifiable risk remains around our customers’ ability to continue to trade or roll out large scale IT projects. The
business’ customer base is continually reviewed and whilst there is a some exposure to the retail and leisure sectors, the
Board’s view is that the broad customer base is well capitalised to withstand the medium term impacts and the Group
remains well placed to withstand the ongoing challenges and risks.
The Company continues to monitor government recommendations relating to COVID-19 in both the UK and India and is
taking all safety precautions necessary to ensure the continued wellbeing of its customers and employees. Most
employees continue to work remotely, and no employees have been furloughed to date.
Going concern
As stated in note 2 to the financial statements, the Board is satisfied that the Group has sufficient resources to continue
in operation for the foreseeable future, a period of not less than 12 months from the date of this report. Accordingly,
they continue to adopt the going concern basis in preparing the condensed financial statements.
By order of the Board,
Chief Executive Officer Chief Financial Officer
Peter Brotherton David Senior
11th November 2020 11th November 2020

14
Redcentric plc
Condensed consolidated statement of comprehensive income for the six months ended 30 September 2020
Six months to 30 September
2020 Unaudited
Six months to 30 September
2019 Unaudited
Year ended 31 March
2020 Audited
Note £’000 £’000 £’000 Revenue 5 46,241 43,152 87,485 Cost of sales (17,588) (15,319) (32,297)
Gross Profit 28,653 27,833 55,188 Operating expenditure (25,573) (25,929) (63,925)
Adjusted EBITDA1 12,261 10,330 20,604
Depreciation (4,125) (4,274) (8,814) Amortisation of intangibles (3,667) (3,730) (7,449) Exceptional items 6 (1,095) (169) (12,516) Share-based payments (294) (253) (562)
Operating profit / (loss) 3,080 1,904 (8,737) Finance income 7 - - 5 Finance costs 7 (828) (1,017) (1,881)
Profit / (loss) on ordinary activities before taxation 2,252 887 (10,613) Income tax (expense)/income 8 (146) (381) 13
Profit / (loss) for the period attributable to owners of the parent 2,106 506 (10,600)
Other comprehensive income Items that may be classified to profit or loss: Currency translation differences 18 39 13
Total comprehensive income / (loss) for the period 2,124 545 (10,587)
Earnings per share Basic earnings/(loss) per share 9 1.39p 0.34p (7.14) Diluted earnings/(loss) per share 9 1.36p 0.34p (7.14)
1 For an explanation of the alternative performance measures used in this report, please refer to page 7.

15
Redcentric plc
Condensed consolidated statement of financial position as at 30 September 2020
30 Sept 2020
Unaudited
30 Sept 2019
Unaudited
31 March 2020
Audited
Note £’000 £’000 £’000 Non-Current Assets Intangible assets 65,697 72,354 68,867 Property, plant and equipment 15,826 19,438 15,736 Right-of-use assets 15,694 21,079 22,731 Deferred tax asset 2,098 307 1,482
99,315 113,178 108,816
Current Assets Inventories 134 302 891 Trade and other receivables 10 17,899 19,521 23,261 Corporation tax receivable - - 346 Cash and short-term deposits 6,946 2,183 3,710
24,979 22,006 28,208
Total assets 124,294 135,184 137,024
Current Liabilities Trade and other payables 11 (18,605) (19,622) (24,311) Corporation tax payable (579) (104) - Loans and borrowings 12 (4,096) (4,639) (16,126) Provisions 13 (8,572) (150) (12,122)
(31,852) (24,515) (52,559)
Non-current liabilities Loans and borrowings 12 (19,861) (37,574) (22,133) Provisions 13 (2,806) (893) (2,531)
(22,667) (38,467) (24,664)
Total liabilities (54,519) (62,982) (77,223)
Net assets 69,775 72,202 59,801
Equity Called up share capital 14 156 149 149 Share premium account 14 72,931 65,736 65,734 Capital redemption reserve (9,454) (9,454) (9,454) Own shares held in treasury 14 (180) (278) (724) Retained earnings 6,322 16,049 4,096
Total Equity 69,775 72,202 59,801

16
Redcentric plc
Condensed consolidated statement of changes in equity as at 30 September 2020
Share Capital
Share Premium
Capital Redemption
Reserve
Own Shares Held in
Treasury
Retained Earnings
Total Equity
£’000 £’000 £’000 £’000 £’000 £’000
At 1 April 2019 149 65,588 (9,454) - 19,362 75,645 Adjustment on initial application of IFRS 16 - - - - (2,429) (2,429)
Adjusted as at 1 April 2019 149 65,588 (9,454) - 16,933 73,216 Profit for the period - - - - 506 506 Transactions with owners Share-based payments - - - - 62 62 Share buyback (278) - (278) Issue of new shares - 148 - - - 148 Dividends paid - - - - (1,491) (1,491) Other comprehensive income Currency translation differences - - - - 39 39
At 30 September 2019 149 65,736 (9,454) (278) 16,049 72,202 Adjustment to initial application of IFRS 16 - - - - 169 169
Adjusted as at 149 65,736 (9,454) (278) 16,218 72,371 Loss for the period - - - - (11,106) (11,106) Transactions with owners Share-based payments - - - - 422 422 Share buyback - - - (446) - (446) Issue of new shares - (2) - (146) (148) Dividends paid - - - - (1,240) (1,240) Other comprehensive income Currency translation differences - - - - (52) (52)
At 31 March 2020 149 65,734 (9,454) (724) 4,096 59,801 Profit for the period - - - - 2,106 2,106 Transactions with owners Share-based payments - - - - 257 257 Issue of new shares 7 7,197 - - - 7,204 Share options exercised - - - 544 (155) 389 Other comprehensive income Currency translation differences - - - - 18 18
At 30 September 2020 156 72,931 (9,454) (180) 6,322 69,775
17
Redcentric plc
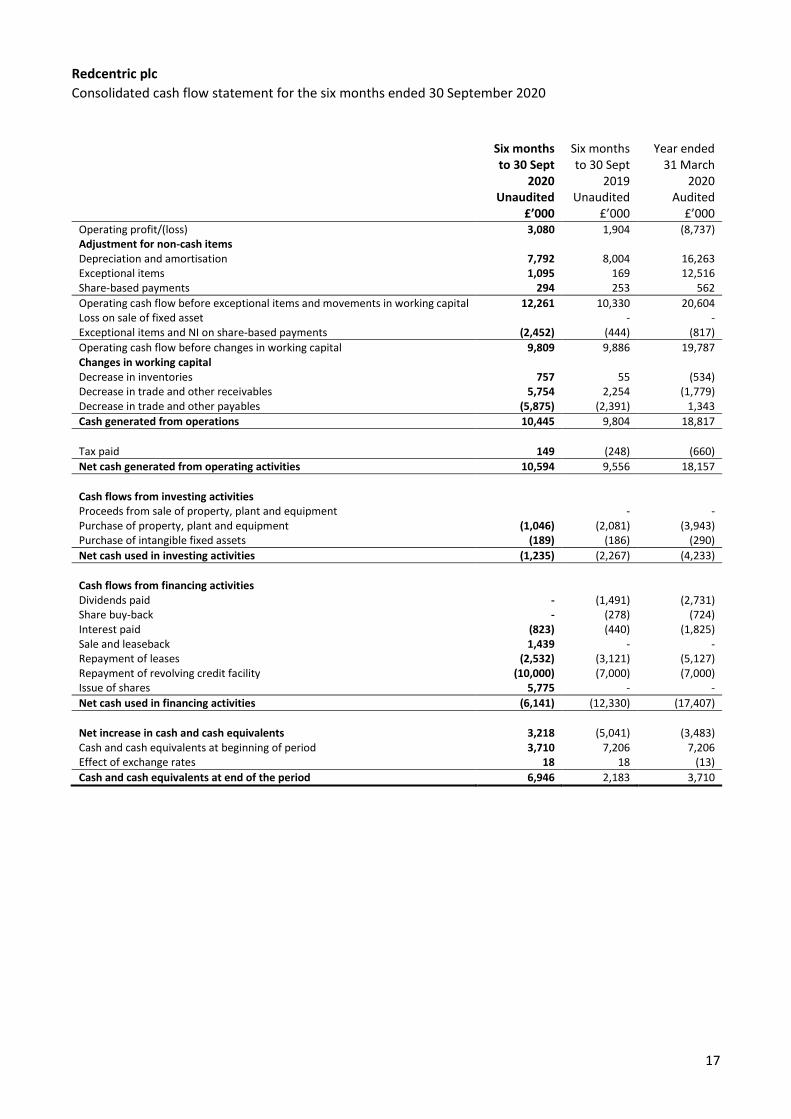
Consolidated cash flow statement for the six months ended 30 September 2020
Six months to 30 Sept
2020 Unaudited
Six months to 30 Sept
2019 Unaudited
Year ended 31 March
2020 Audited
£’000 £’000 £’000 Operating profit/(loss) 3,080 1,904 (8,737) Adjustment for non-cash items Depreciation and amortisation 7,792 8,004 16,263 Exceptional items 1,095 169 12,516 Share-based payments 294 253 562
Operating cash flow before exceptional items and movements in working capital 12,261 10,330 20,604 Loss on sale of fixed asset - - Exceptional items and NI on share-based payments (2,452) (444) (817)
Operating cash flow before changes in working capital 9,809 9,886 19,787 Changes in working capital Decrease in inventories 757 55 (534) Decrease in trade and other receivables 5,754 2,254 (1,779) Decrease in trade and other payables (5,875) (2,391) 1,343
Cash generated from operations 10,445 9,804 18,817
Tax paid 149 (248) (660)
Net cash generated from operating activities 10,594 9,556 18,157
Cash flows from investing activities Proceeds from sale of property, plant and equipment - - Purchase of property, plant and equipment (1,046) (2,081) (3,943) Purchase of intangible fixed assets (189) (186) (290)
Net cash used in investing activities (1,235) (2,267) (4,233)
Cash flows from financing activities Dividends paid - (1,491) (2,731) Share buy-back - (278) (724) Interest paid (823) (440) (1,825) Sale and leaseback 1,439 - - Repayment of leases (2,532) (3,121) (5,127) Repayment of revolving credit facility (10,000) (7,000) (7,000) Issue of shares 5,775 - -
Net cash used in financing activities (6,141) (12,330) (17,407)
Net increase in cash and cash equivalents 3,218 (5,041) (3,483) Cash and cash equivalents at beginning of period 3,710 7,206 7,206 Effect of exchange rates 18 18 (13)
Cash and cash equivalents at end of the period 6,946 2,183 3,710

18
Redcentric plc
Notes to the condensed set of financial statements for the six months ended 30 September 2020
1. General information
The financial statements for the six months ended 30 September 2020 and the six months ended 30 September 2019 do
not constitute statutory accounts within the meaning of Section 434 of the Companies Act 2006. Statutory accounts for
the year ended 31 March 2020 were approved by the Board on 21 July 2020 and delivered to the Registrar of Companies.
The auditor’s report on those accounts was unqualified, did not contain an emphasis of matter paragraph and did not
contain any statement under Section 498 (2) or (3) of the Companies Act 2006.
These condensed half year financial statements were approved for issue by the Board of Directors on 11 November 2020.
Redcentric plc is a company domiciled in England and Wales. These condensed half year financial statements comprise
the Company and its subsidiaries (together referred to as ‘the Company’ or ‘the Group’). The principa l activity of the
Company is the supply of IT managed services.
2. Accounting policies
Basis of preparation
These condensed half year financial statements for the half year ended 30 September 2020 have been prepared in
accordance with the AIM Rules for Companies, comply with IAS 34 Interim Financial Reporting as adopted by the
European Union and should be read in conjunction with the annual financial statements for the year ended 31 March
2020, which have been prepared in accordance with International Financial Reporting Standards (IFRS) as adopted by the
European Union.
Going concern
As at 30 September 2020 the Company had committed a revolving credit facility (“RCF”) of £17.5m, an overdraft facility
of £5.0m and a £5.0m asset financing facility. In addition, the Company has access to a £20.0m accordion facility. At 30
September 2020 £15.0m of the RCF and £5.0m of the overdraft was undrawn. During the period, the Group’s banking
facilities were extended to 30 June 2022, with all terms and covenants remaining the same until this date. On 17 July
certain amendments were made to the Company’s facilities agreement to allow for the impact of the Restitution Scheme.
The Board has reviewed a detailed trading and cash flow forecast for a period which covers at least 12 months after the
date of approval of these condensed half year financial statements. There is a high and continuing level of recurring
revenue and high cash conversion is anticipated for the foreseeable future.
Whilst the Group’s trading and cash flow forecasts have been prepared using current trading assumptions, the operating
environment presents several challenges which could negatively impact the actual performance achieved. These risks
include, but are not limited to, achieving forecast levels of order intake, the impact on customer confidence because of
general economic conditions and Brexit. If future trading performance significantly under-performs the Group’s forecasts,
this could impact the ability of the Group to comply with its covenant tests over the period of the forecasts.
The uncertainty as to the future impact on the Group of the COVID-19 pandemic has been separately considered as part
of the Board’s consideration of the going concern basis of preparation. Thus far, the Group has not observed any material
negative impact in trading performance due to COVID-19. However, due to the continuing uncertainty over the duration
and extent of the impact of COVID-19, the Board has modelled a severe but plausible downside scenario when preparing
the forecasts, where the impact of COVID-19 is forecast to continue until March 2021, after which point the impact will
begin to reduce. Over this period, recurring monthly order intake is forecast to reduce by 90% compared to H2 FY20 and
H1 FY21, product and services revenues reduce by 85% compared to H2 FY20 and H1 FY21 and customer loss through
insolvency increases (particularly in the retail, hospitality and leisure sectors). Certain limited mitigating actions are
forecast to be implemented to control discretionary cost spend in areas such as travel, entertaining and marketing. It is
difficult to predict the overall outcome and impact of COVID-19 and the duration of disruption could be longer than
anticipated, but under the downside scenario modelled and in the case that recovery is more gradual than expected, the
forecasts demonstrate that Group is expected to maintain sufficient liquidity and remain in compliance with covenants
throughout the period under review whilst still maintaining adequate headroom against overall facilities, including full
repayment of the revolving credit facility by 30 September 2021.

19
The Board therefore remains confident that the Group has adequate resources to continue to meet its liabilities as and
when they fall due within the period of 12 months from the date of approval of these financial statements. Accordingly,
the financial statements have been prepared on a going concern basis.
The financial information is presented in sterling, which is the functional currency of the Company. All financial
information presented has been rounded to the nearest thousand.
3. Critical accounting judgements and key sources of estimation uncertainty
Trade debtors impairment provision
The key source of estimation uncertainty that carries a significant risk of material change to the carrying value of assets
liabilities within the next year is with regard to credit note provisioning, where provision is made for the value of credit
notes that the Company expects to subsequently issue to correct for estimated inaccurate invoices issued to date.
Following the FY20 year end the basis for provision was reviewed considering the level of historical credit notes raised,
and accordingly, the provision was reduced to 1.0% of recurring revenue from (previously 1.25%).
Restitution Scheme
During the period, the Company has utilised £3.2m of the £11.4m provision that was recorded in the FY20 accounts. On
calculating the initial provision, the company used information that contained elements of estimation which were
detailed in the FY20 report and accounts. Subsequently the company has been able to further confirm some of the
estimations made at the time:
• the number of net share purchases (“NSP”) has been validated at 60,747,836 (FY-20: 62,500,000) and the basic
entitlement per NSP is 16.96p resulting in a £0.3m reduction in provision. (1,752,164 * 16.96p)
• the costs of the Restitution Scheme were estimated at £0.8m. The latest estimate is £0.7m, a further £0.1m
reduction to the provision;
The Restitution Scheme opened on 13 July 2020 and in the period to 30 September claims for 12,432,272 (20%) NSPs
have been received, validated, and settled in cash or by share issue. The utilisation of the provision because of these
claims is £2.1m and a further £0.7m of the provision has been utilised by costs of the Restitution Scheme.
• Where claims under the Restitution Scheme have been settled in shares, the value attributed to the
compensation paid to a claimant is based on the share price on the date of issue. Any difference to the share
price set out in the Restitution Scheme circular is treated as an exceptional cost. At 30 September, 6,953,101
NSPs were settled in shares resulting in an exceptional cost of £0.3m.
The Restitution Scheme remained open until 30 October and the remaining provision of £8.2m reflects potential claims
still to be received until that date. Based on claims received at the date of this report it is estimated that a further £6m
of the remaining provision will be utilised. Work is still ongoing to validate claims received in October and a final position
will not be known until early December 2020.
4. Segmental reporting
IFRS 8 requires operating segments to be identified based on internal financial information reported to the chief operating decision-maker for decision-making purposes. The Group considers that this role is performed by the Board. The Board believes that the Group continues to comprise a single reporting segment, being the provision of managed services to customers.
20
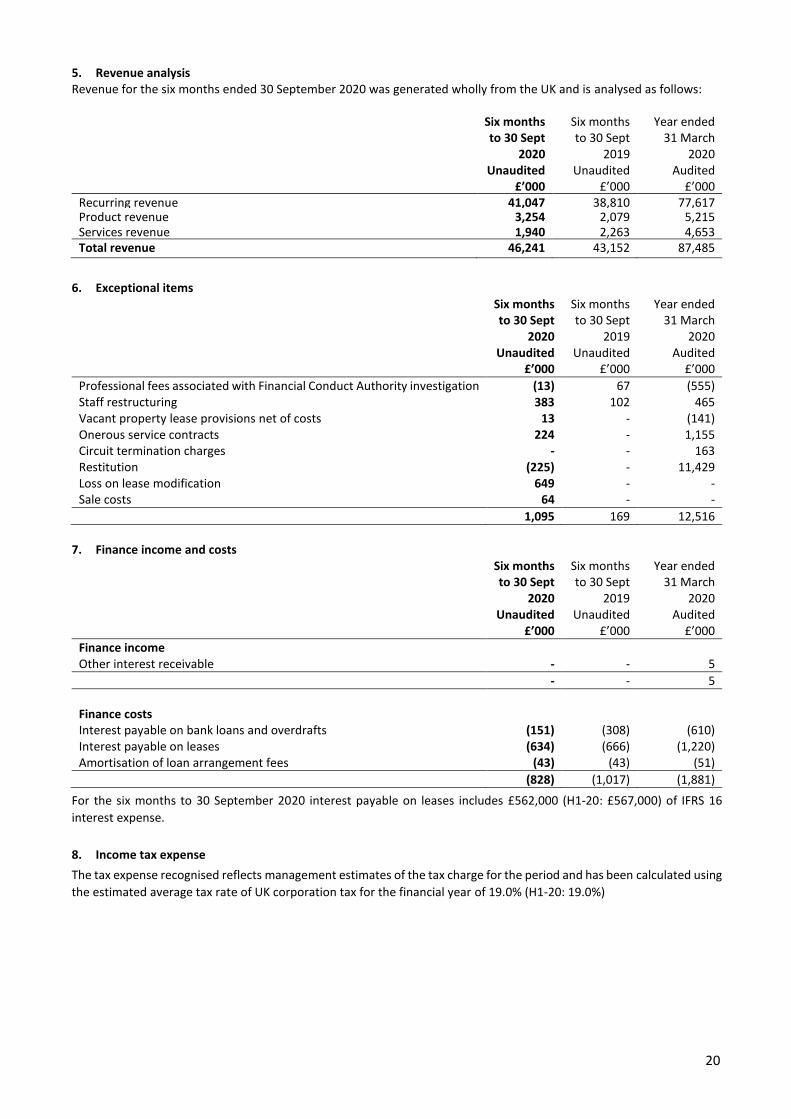
5. Revenue analysis Revenue for the six months ended 30 September 2020 was generated wholly from the UK and is analysed as follows:
Six months to 30 Sept
2020 Unaudited
Six months to 30 Sept
2019 Unaudited
Year ended 31 March
2020 Audited
£’000 £’000 £’000 Recurring revenue 41,047 38,810 77,617 Product revenue 3,254 2,079 5,215 Services revenue 1,940 2,263 4,653 Total revenue 46,241 43,152 87,485
6. Exceptional items Six months
to 30 Sept 2020
Unaudited
Six months to 30 Sept
2019 Unaudited
Year ended 31 March
2020 Audited
£’000 £’000 £’000
Professional fees associated with Financial Conduct Authority investigation (13) 67 (555) Staff restructuring 383 102 465 Vacant property lease provisions net of costs 13 - (141) Onerous service contracts 224 - 1,155 Circuit termination charges - - 163 Restitution (225) - 11,429 Loss on lease modification 649 - - Sale costs 64 - -
1,095 169 12,516
7. Finance income and costs
Six months to 30 Sept
2020 Unaudited
Six months to 30 Sept
2019 Unaudited
Year ended 31 March
2020 Audited
£’000 £’000 £’000
Finance income Other interest receivable - - 5
- - 5
Finance costs Interest payable on bank loans and overdrafts (151) (308) (610) Interest payable on leases (634) (666) (1,220) Amortisation of loan arrangement fees (43) (43) (51)
(828) (1,017) (1,881)
For the six months to 30 September 2020 interest payable on leases includes £562,000 (H1-20: £567,000) of IFRS 16
interest expense.
8. Income tax expense
The tax expense recognised reflects management estimates of the tax charge for the period and has been calculated using
the estimated average tax rate of UK corporation tax for the financial year of 19.0% (H1-20: 19.0%)

21
9. Earnings per share (EPS) The calculation of basic and diluted EPS is based on the following earnings and number of shares.
Six months to 30 Sept
2020 Unaudited
Six months to 30 Sept
2019 Unaudited
Year ended 31 March
2020 Audited
Earnings £’000 £’000 £’000
Statutory earnings 2,106 506 (10,600) Tax charge/(credit) 146 381 (13) Amortisation of acquired intangibles 3,126 3,126 6,252 Share-based payments 294 253 562 Exceptional items 1,095 169 12,516
Adjusted earnings before tax 6,767 4,435 8,717 Notional tax charge at standard rate (1,286) (843) (1,656)
Adjusted earnings 5,481 3,592 7,061
Weighted average number of ordinary shares
Number ‘000
Number ‘000
Number ‘000
Total shares in issue 151,932 149,311 149,311 Shares held in treasury (204) (327) (822)
For basic EPS calculations 151,728 148,984 148,489 Effect of potentially dilutive share options 2,982 1,915 2,314
For diluted EPS calculations 154,710 150,899 150,803
EPS Pence Pence Pence
Basic 1.39p 0.34p (7.14)p Adjusted 3.61p 2.41p 4.76p Basic diluted 1.36p 0.34p (7.14)p Adjusted diluted 3.54p 2.38p 4.68p

22
10. Trade and other receivables
Six months to 30 Sept
2020 Unaudited
Six months to 30 Sept
2019 Unaudited
Year ended 31 March
2020 Audited
£’000 £’000 £’000
Trade Receivables 8,414 10,345 13,813 Less: credit note provision (1,145) (1,356) (1,438)
Trade receivables – net 7,269 8,989 12,375 Other receivables 619 233 664 Prepayments 5,739 5,814 5,639 Commission contract asset 2,566 2,438 2,734 Accrued income 1,706 2,047 1,849
Total 17,899 19,521 23,261
Trade debtor days were 33 at 30 September 2020 (30 September 2019: 40). The ageing of trade receivables is shown
below:
Six months to 30 Sept
2020 Unaudited
Six months to 30 Sept
2019 Unaudited
Year ended 31 March
2020 Audited
£’000 £’000 £’000
Current 7,017 7,484 10,993 1 to 30 days overdue 907 1,777 1,656 31 to 60 days overdue 530 586 593 61 to 90 days overdue (74) 217 220 91 to 180 days overdue 46 138 288 > 180 days overdue (12) 143 63
Gross trade debtors 8,414 10,345 13,813 Credit note provision (1,145) (1,356) (1,438)
Net trade debtors 7,269 8,989 12,375
11. Trade and other payables
Six months to 30 Sept
2020 Unaudited
Six months to 30 Sept
2019 Unaudited
Year ended 31 March
2020 Audited
£’000 £’000 £’000
Trade Payables 6,454 5,989 7,661 Other Payables 349 391 198 Taxation and Social Security 2,021 2,281 2,596 Accruals 2,444 2,849 4,171 Deferred Income 7,337 8,112 9,685
Total 18,605 19,622 24,311
Trade creditor days were 36 at 30 September 2020 (30 September 2019: 44).

23
12. Borrowings Six months
to 30 Sept 2020
Unaudited
Six months to 30 Sept
2019 Unaudited
Year ended 31 March
2020 Audited
£’000 £’000 £’000
Current Lease liabilities 4,030 4,512 3,528 Term loans 101 187 115 Bank loans - - 12,500 Unamortised loan arrangement fees (35) (60) (17)
Total 4,096 4,639 16,126
Non-current Lease liabilities 17,151 25,009 22,097 Term Loans 233 69 36 Bank Loans 2,500 12,500 - Unamortised loan arrangement fees (23) (4) -
Total 19,861 37,574 22,133
13. Provisions
Restitution
provision
Dilapidations
provision
Vacant property provision
Total
provision £’000 £’000 £’000 £’000
At 1 April 2019 - 496 534 1,030 Additional provisions created during the period - 60 - 60
Utilised during the period - - (47) (47)
At 30 September 2019 - 556 487 1,043
Additional provisions created during the period 11,429 1,970 833 14,232 Released during the period - - (156) (156) Utilised during the period - - (466) (466)
At 31 March 2020 11,429 2,526 698 14,653 Additional provisions created during the period 130 280 - 410 Released during the period (598) - - (598) Utilised during the period (2,761) - (326) (3,087)
At 30 September 2020 8,200 2,806 372 11,378
Analysed as: Current 8,200 - 372 8,572 Non-current - 2,806 - 2,806
At 30 September 2020 8,200 2,806 372 11,378
14. Share capital and share premium
Ordinary shares of 0.1p each Share premium
Number £’000 £’000
At 1 April 2019 149,135,316 149 65,588 New shares issued 175,397 - 148
At 30 September 2019 and 31 March 2020 149,310,713 149 65,736
New shares issued 6,332,793 7 7,195
155,643,506 156 72,931
At the start of the period the Company held in Treasury 822,427 of its ordinary share capital at a weighted average price
of 88p per share. During the period, following a notice of exercise in relation to employee share options, 618,836 shares
previously held in Treasury were transferred to satisfy the exercise. At 30 September, the Company’s issued share capital
consists of 155,643,506 ordinary shares of which 203,591 which remain in Treasury.
Related Documents