No. 2] Proc. Jpn. Acad., Ser. B 86 (2010) 103 Review Recent advances in rice genome and chromosome structure research by uorescence in situ hybridization (FISH) By Nobuko OHMIDO, 1 Kiichi FUKUI 2 and Toshiro KINOSHITA 3,† (Communicated by Koichiro TSUNEWAKI, M.J.A.) Abstract: Fluorescence in situ hybridization (FISH) is an eective method for the physical mapping of genes and repetitive DNA sequences on chromosomes. Physical mapping of unique nucleotide sequences on specic rice chromosome regions was performed using a combination of chromosome identication and highly sensitive FISH. Increases in the detection sensitivity of smaller DNA sequences and improvements in spatial resolution have ushered in a new phase in FISH technology. Thus, it is now possible to perform in situ hybridization on somatic chromo- somes, pachytene chromosomes, and even on extended DNA bers (EDFs). Pachytene-FISH allows the integration of genetic linkage maps and quantitative chromosome maps. Visualization methods using FISH can reveal the spatial organization of the centromere, heterochromatin/ euchromatin, and the terminal structures of rice chromosomes. Furthermore, EDF-FISH and the DNA combing technique can resolve a spatial distance of 1 kb between adjacent DNA sequences, and the detection of even a 300-bp target is now feasible. The copy numbers of various repetitive sequences and the sizes of various DNA molecules were quantitatively measured using the mole- cular combing technique. This review describes the signicance of these advances in molecular cytology in rice and discusses future applications in plant studies using visualization techniques. Keywords: Oryza sativa L., chromosome, uorescence in situ hybridization (FISH), extended DNA bers (EDFs), genomic in situ hybridization (GISH) Introduction In situ hybridization (ISH) is a useful method to visualize the localization of nucleotide sequences on chromosomes, nuclei, and tissues. The principle of ISH is to hybridize labeled nucleotide sequences (or probes) as reporter molecules directly onto comple- mentary DNA or RNA sequences on slide glass. Fol- lowing hybridization, the reporter molecule in the hybridized DNA is detected by antibodies or afnity chemicals labeled with uorescent molecules, to be visualized under a microscope, for example. This ISH using uorescence to detect DNA probes is referred to as uorescence in situ hybridization (FISH). Technical details on using this technique in both animals and plants have been published in many good manuals. 1),2) The visualization of DNA probes using various techniques has been performed in recent decades and has been applied in the study of many plants of agricultural importance as well as in plant genome research. FISH has been extensively used in important members of the plant kingdom, such as rice, wheat, maize, tomato, Brassica, and Arabidopsis. 3)–8) Technical advances in cytology and FISH applications, such as DNA mapping on chro- mosomes, nuclei, and DNA bers, have dramatically progressed to allow the detection of DNA sequences of fewer than a few kilobase pairs. FISH mapping of single genes enables a direct comparison of the phys- ical location of a gene and its position on the linkage map. 9) Currently, the functional aspects of histone protein modications are being analyzed. Histone modications, such as methylation and acetylation, are known to be involved in the epigenetic regulation of gene expression and are thus related to functional regions of chromosomes, aiding in the dierentiation 1 Graduate School of Human Development and Environment, Kobe University, Kobe, Japan. 2 Department of Biotechnology, Graduate School of Engi- neering, Osaka University, Suita, Japan. 3 Professor Emeritus, Hokkaido University, Sapporo, Japan. † Correspondence should be addressed: T. Kinoshita (Contact to [email protected]). doi: 10.2183/pjab.86.103 62010 The Japan Academy

Welcome message from author
This document is posted to help you gain knowledge. Please leave a comment to let me know what you think about it! Share it to your friends and learn new things together.
Transcript

No. 2] Proc. Jpn. Acad., Ser. B 86 (2010) 103
Review
Recent advances in rice genome and chromosome structure research by
�uorescence in situ hybridization (FISH)
By Nobuko OHMIDO,�1 Kiichi FUKUI�2 and Toshiro KINOSHITA�3,†
(Communicated by Koichiro TSUNEWAKI, M.J.A.)
Abstract: Fluorescence in situ hybridization (FISH) is an e�ective method for the physical
mapping of genes and repetitive DNA sequences on chromosomes. Physical mapping of uniquenucleotide sequences on speci�c rice chromosome regions was performed using a combination of
chromosome identi�cation and highly sensitive FISH. Increases in the detection sensitivity ofsmaller DNA sequences and improvements in spatial resolution have ushered in a new phase in
FISH technology. Thus, it is now possible to perform in situ hybridization on somatic chromo-
somes, pachytene chromosomes, and even on extended DNA �bers (EDFs). Pachytene-FISHallows the integration of genetic linkage maps and quantitative chromosome maps. Visualization
methods using FISH can reveal the spatial organization of the centromere, heterochromatin/
euchromatin, and the terminal structures of rice chromosomes. Furthermore, EDF-FISH and theDNA combing technique can resolve a spatial distance of 1 kb between adjacent DNA sequences,
and the detection of even a 300-bp target is now feasible. The copy numbers of various repetitive
sequences and the sizes of various DNA molecules were quantitatively measured using the mole-cular combing technique. This review describes the signi�cance of these advances in molecular
cytology in rice and discusses future applications in plant studies using visualization techniques.
Keywords: Oryza sativa L., chromosome, �uorescence in situ hybridization (FISH),
extended DNA �bers (EDFs), genomic in situ hybridization (GISH)
Introduction
In situ hybridization (ISH) is a useful method to
visualize the localization of nucleotide sequences on
chromosomes, nuclei, and tissues. The principle ofISH is to hybridize labeled nucleotide sequences (or
probes) as reporter molecules directly onto comple-
mentary DNA or RNA sequences on slide glass. Fol-lowing hybridization, the reporter molecule in the
hybridized DNA is detected by antibodies or af�nity
chemicals labeled with �uorescent molecules, to bevisualized under a microscope, for example. This
ISH using �uorescence to detect DNA probes is
referred to as �uorescence in situ hybridization(FISH). Technical details on using this technique in
both animals and plants have been published in
many good manuals.1),2) The visualization of DNAprobes using various techniques has been performed
in recent decades and has been applied in the study
of many plants of agricultural importance as well asin plant genome research. FISH has been extensively
used in important members of the plant kingdom,
such as rice, wheat, maize, tomato, Brassica, andArabidopsis.3)–8) Technical advances in cytology and
FISH applications, such as DNA mapping on chro-
mosomes, nuclei, and DNA �bers, have dramaticallyprogressed to allow the detection of DNA sequences
of fewer than a few kilobase pairs. FISH mapping of
single genes enables a direct comparison of the phys-ical location of a gene and its position on the linkage
map.9) Currently, the functional aspects of histone
protein modi�cations are being analyzed. Histonemodi�cations, such as methylation and acetylation,
are known to be involved in the epigenetic regulation
of gene expression and are thus related to functionalregions of chromosomes, aiding in the di�erentiation
�1 Graduate School of Human Development and Environment,Kobe University, Kobe, Japan.�2 Department of Biotechnology, Graduate School of Engi-
neering, Osaka University, Suita, Japan.�3 Professor Emeritus, Hokkaido University, Sapporo, Japan.† Correspondence should be addressed: T. Kinoshita (Contact
to [email protected]).
doi: 10.2183/pjab.86.103
62010 The Japan Academy
of heterochromatin and euchromatin. Technological
advancements have been utilized in the developmentof a number of genetic methods, each with advan-
tages and drawbacks. In this review, we discuss the
e�ects and versatility of these methods in plant re-search, as the development of visualization methods
is considered a signi�cant milestone in molecular
cytology.
Detection of ribosomal RNA genes by
in situ hybridization
E�orts to visualize speci�c DNA sequences di-
rectly on chromosomes had been pursued for years,
but good methods for identifying chromosomes or de-tecting genes on a chromosome �rst became available
at the beginning of the 1980s. The �rst reproducible
result was the success of Fukui in physically locating18S-5.8S-25S ribosomal RNA gene (45S rDNA) loci
at the end of a pair of chromosomes using 125iodine-
labeled rRNA probes.9) Following hybridization witha radioactive ribosomal RNA probe, the radioactive
hybridizing signals were detected using a photo-
graphic emulsion layered over the surface of the sam-ples. Ten years later, ISH using haptenes such as
biotin for a reporter molecule was developed, and
soon it was found that these methods had many ad-vantages over the earlier radioactive methods. One of
several remarkable achievements that employed non-
radioactive labeling systems, such as a colorimetricprocedure using an enzymatic reaction, was the de-
tection of 45S rDNA sites on rice chromosomes.10)
Although the stability and safety of the detectionprocedures were high, the low spatial resolution, the
probe size limitation, and the limited number of
probes that could be used in single ISH experimentremained problems.
Based on these technological achievements, �uo-
rescence in situ hybridization (FISH) technology wasdeveloped. The FISH technique for human chromo-
somes was developed �rst,11),12) followed by a method
for the wheat genome.13),14) The signi�cant advan-tages of FISH included good sensitivity and high
spatial resolution, the ability to simultaneously de-
tect several probes using di�erent �uorochrome/colorcombinations, and versatility in three-dimensional
analyses. The development of the FISH methodology
allowed dramatic advances in molecular cytologicalstudies even in rice, which has very small chromo-
somes. For example, 45S rDNA loci were detected indi�erent rice species, and variability in the number of
45S rDNA loci among several rice species was dem-
onstrated.15) A FISH study was also performed usingtwo-color �uorescence to simultaneously detect 5S
and 45S rDNAs loci.16) Both rDNA loci were visual-
ized on the chromosomes of six species of the genusOryza, and the rice chromosomes harboring the
rDNA loci were identi�ed based on their condensa-
tion patterns.10) The positions of the rDNAs wereshown to be di�erent in the di�erent rice species.17)
The 45S rDNA locus of japonica rice is localized on
chromosome 9. Indica rice has the two loci on chro-mosomes 9 and 10. O. of�cinalis and O. eichingeri
both have the three loci on chromosomes 4, 7, and
11 (Fig. 1, Table 1). Recent studies have demon-strated that the number of rDNA loci varies from
one to eight among wild rice species.18) This variabil-ity is likely caused by either chromosome exchange
or translocation and/or by a ribosomal RNA gene
during the evolution of rice wild species. Variationsin the location of the rDNA loci might indicate the
transpositional nature of the rDNAs, as has been
suggested in the genera Triticeae and Allium.19),20)
Recently, �ow cytometry and sorting studies of plant
chromosomes have been carried out using suspen-
sions of intact chromosomes, and individual chromo-somes have been discriminated in cereals.21),22) 5S
rDNA, 17S rDNA, and centromeric DNA have been
used as probes in FISH for rye and barley chromo-somes in suspension to label the speci�c chromo-
somes. Bright signals were detected at the speci�c
regions of interest on the chromosomes. These resultsindicate that this method would be useful for the
selection and sorting of plant chromosomes.
Variability of chromosomal construction by
repetitive sequences in Oryza species
Tandem repeat sequences and retroelements
constitute a large fraction of the genomic DNA ofplants. Rice, 2n ¼ 24 with a genome size of 390
Mbp, has the smallest genome size among the major
cereals,23) smaller than the other important cerealssuch as sorghum, maize, barley, and wheat (with
genome sizes of 735, 2,600, 5,400, and 16,900 Mbp,
respectively). The rice genome is an important refer-ence point for all cereal genomes because it shows co-
linearity with other agriculturally important crops.24)
The rice genome contains 28,000 genes,25) and it alsocontains abundant repeated sequences. In plant ge-
nomes, repetitive DNAs are known to contributeconsiderably to the chromosome structure, including
104 N. OHMIDO, K. FUKUI and T. KINOSHITA [Vol. 86,

the heterochromatin, centromere, and telomere. FISH
is very useful in identifying the genome-wide dis-
tribution pattern of di�erent types of repetitive se-quences in rice.
TrsA26) and Os4827) were the �rst tandem re-
peat sequences identi�ed in rice. TrsA repeats have
a 355-bp unit length and are present at 2,000{6,000
copies in japonica rice with the A genome. TrsA re-
peats occupy at least 10% of the total genome inindica rice. TrsA was localized to the short arm of
chromosome 6 (6S) and the long arm of chromosome
12 (12L) (Fig. 1, Table 1). TrsA sites have also been
Fig. 1. Distribution patterns of the genome-speci�c repetitive sequence TrsA and rDNA sites on a rice chromosome idiogram.Black and gray boxes: heavily and moderately condensed regions, respectively, based on the condensation patterns determinedby CHIAS3. Doublet circles: Trs sites|two in O. sativa ssp. japonica (red), six in O. sativa ssp. indica (yellow), three inO. glaberrima (blue) and 12 in O. meridionalis (green). Most of those sites are located on the distal ends of long arms. Arrow-head: rDNA site|one in O. sativa ssp. japonica (red), two in O. sativa ssp. indica (yellow) and three each in O. of�cinalis andO. eichingeri (orange).
Table 1. Chromosomal locations of 45S rDNA, 5S rDNA and TrsA of rice species
Respective chromosomes
Genome Species45SrDNA
Ribosomal RNAgene
5SrDNARibosomal RNA
gene
TrsATandem repeat A
AA O. sativa ssp. japonica 9 11 6, 12
AA O. sativa ssp. indica 9, 10 11 5, 7, 8, 9, 10, 11
AA O. glaberrima 9 5, 6, 7
AA O. meridionalis 1, 2, 3, 4, 5, 6, 7, 8, 9, 10, 11
BB O. punctata, diploid� 9 11
CC O. of�cinalis 4, 7, 11 11
CC O. eichingeri 4, 7, 11 11
EE O. australinensis 9 7
FF O. brachyantha 9 7
� Oryza punctata (diploid) has BB genome, while the tetraploid form of this species possesses the genome formula,
BBCC.86)
105Rice genome and chromosome structure research by FISHNo. 2]
detected in the subtelomeric regions in both japonica
and indica rice chromosomes.28) TrsA copies arelocated at the distal end of chromosomes 6 and 12
in japonica rice and chromosomes 5, 7, 8, 9, 10, and
11 in indica rice.29) Although two pairs of TrsA werevisually detected in japonica rice by FISH, six chro-
mosome ends (3L, 5L, 6S, 8L, 9L, 12L) have been
reported to contain TrsA.30) This suggests that fourof the chromosomal ends (3L, 5L, 8L, 9L) are low-
copy sites of TrsA that are undetectable by FISH.
Wild rice species with the A genome shows variablenumbers of TrsA copies and chromosomal positions;
for example, chromosomes 5, 6, and 7 in O. glaber-
rima and all chromosomes but chromosome 12 in O.
meridionalis contain TrsA copies (Table 1). Hetero-
chromatic chromomere regions at the distal ends ofO. meridionalis chromosomes consist of TrsA copies.
Thus, TrsA likely contributes to the chromosome
terminal structures and genome sizes of various ricespecies.31)
FISH studies have revealed di�erent classes of
retrotransposons that contribute to the chromosomalorganization. The retrotransposable elements named
LTR (long terminal repeats), such as Ty-1 copia-
type and Ty-3 gypsy-type, are widespread in plantgenomes.32) These elements also contribute to the
large variations in genome size among diploid rice
species.33) For example, O. australiensis (E genome)has the largest and O. brachyantha (F genome) the
smallest genome size in rice. O. sativa (A genome),
including all cultivated species, has an intermediategenome size. O. brachyantha, with a genome size of
346 Mb/1C, has a limited number of repetitive DNA
sequences speci�c to the F genome.34) In comparison,O. australiensis, with a genome size of 946 Mb/1C,
shows an overall ampli�cation of the genome-speci�c
DNA sequence RIRE1 throughout its chromosomes.RIRE1, a Ty-1copia-type retroelement, is detected
throughout the chromosomes of O. australiensis ex-
cept the nucleolar organizing region (NOR) and cen-tromeric regions. Other plant retroelements, such
as BARE1 of barley, have high homology to RIRE1
and have been reported to show a chromosomaldistribution pattern similar to that of RIRE1.35) The
ampli�cation of such copia-type retroelements causes
variations in chromosome morphology and genomesize among species, even within the same genus. The
genetic markers of the wild-type rice O. punctata
(BB genome) and O. of�cinalis (CC genome) havesynthetic arrangements similar to the corresponding
chromosomes of O. sativa.36) The positions of indi-
vidual markers on the corresponding chromosomesamong the three di�erent rice species with A, B, and
C genomes were quite similar.
In plant genomes, centromeres contain severalkinds of retrotransposons and satellite repeats with
100{200 bp units of the short motif. The centromeric
satellite sequences are the most rapidly evolved inthe genome. The Ty-1 copia-type transposable ele-
ment is considered the main tandem array that
composes the pericentromeric regions in Arabidopsis
thaliana.37) Moreover, the maize centromere is com-
posed of fragments of the Ty-3 gypsy-type retrotrans-
posons; CentA (a 156-bp satellite repeat) and CentC(a 156-bp repeat) are present in the centromeric re-
gions.38) An RIRE7 with a tandem repeat sequence,named TrsD, is homologous to the tandem repeat
sequences RCS2 and CentC, which were previously
identi�ed in the centromeric regions of rice andmaize chromosomes, respectively.38)–40) Interestingly,
the RIRE7 sequence is homologous to several DNA
segments present in the centromeric regions of cerealchromosomes. FISH analysis using a BAC clone
containing both RIRE7 and TrsD sequences also re-
vealed their presence in the pericentromeric regionsof the pachytene chromosomes in O. sativa cv. Nip-
ponbare. High copy numbers of Ty-3gypsy-type have
been con�rmed in many plant species, including rice,Arabidopsis, maize, barley, and wheat.37),38),41)–43)
The gag-polymerase region of the Ty-3gypsy-type
retrotransposon, appearing as RIRE7, CRM, andLjRE2 repeats in rice, maize, and Lotus, respectively,
has been detected in the pericentromeric regions of
pachytene chromosomes by FISH.38)–41),43)–45) Thecentromeric sequences and structures are well under-
stood in rice.45)–47)
The relationship between chromosomal functionand repeat sequences in the centromere has been
demonstrated by the concentration of histone var-
iants. CentO, which is the sequence correspondingto the spindle-binding region of the kinetocore, pro-
vides evidence to con�rm the relationship between
chromosome function and the DNA sequence.48) Ty-3gypsy-type centromere speci�c retrotransposons
containing CentO are highly enriched in chromosome
domains containing the centromere-speci�c histoneH3 variant (CENH3).48) The CENH3 binding regions
are thought to be the functional regions of the cen-
tromere. CENH3 genes have been found in all eukar-yotes investigated, including humans (CENP-A)49)
106 N. OHMIDO, K. FUKUI and T. KINOSHITA [Vol. 86,
and A. thaliana (HTR12).50) Nagaki et al. have de-
termined that centromeric sequences of approxi-mately 750 kb bind to the rice CENH3.51) In the
case of rice with 390 Mb genome size, which has no
distinct heterochromatic chromocenters like Arabi-
dopsis in nuclei,52) but has conspicuous heterochro-
matic regions in pachytene chromosomes, the signals
of histone H3K9me2 were dispersed all over the nu-clei with strong spot-like signals and enriched at het-
erochromatic regions in pachytene chromosomes.53)
It is also worth noticing that histone H3K9me2 espe-cially marked condensed regions within each chromo-
mere. Pericentromeric regions composed of highly
condensed chromomeres showed stronger and largersignals, that suggests chromatin condensation might
directly or indirectly correlate with histone H3K9me2in rice, too. In the centromeric regions responsible
for kinetochore assembly and microtubule attach-
ment, where a specialized histone H3 variant calledCENH3 (CENP-A) replaces the canonical histone,52)
H3K9me2 was not detected. We suppose that rice
histone H3K9me2 can occur at condensed regionswithin each chromomere in varying degrees, and the
degree of H3K9me2 is proportional to the degree of
chromatin condensation. Moreover, it can be saidthat the pattern of H3K9me2 in rice pachytene chro-
mosome might be consistent with uneven transcrip-
tional activity along chromosomes.
Physical mapping of agricultural important
genes on rice chromosomes
Molecular cytology techniques enabled the de-tection of unique rice genomic DNA sequences re-
lated to important agricultural traits. A yeast arti�-
cial chromosome (YAC) covering the gall midgeresistance gene (Gm2) was mapped to chromosome 1
of the resistant variety of rice.54),55) Jiang et al.56)
and Nakamura et al.54),57) visualized bacterial arti�-cial chromosome (BAC) clones closely linked to a
rice bacterial blight resistance locus, Xa21, and to
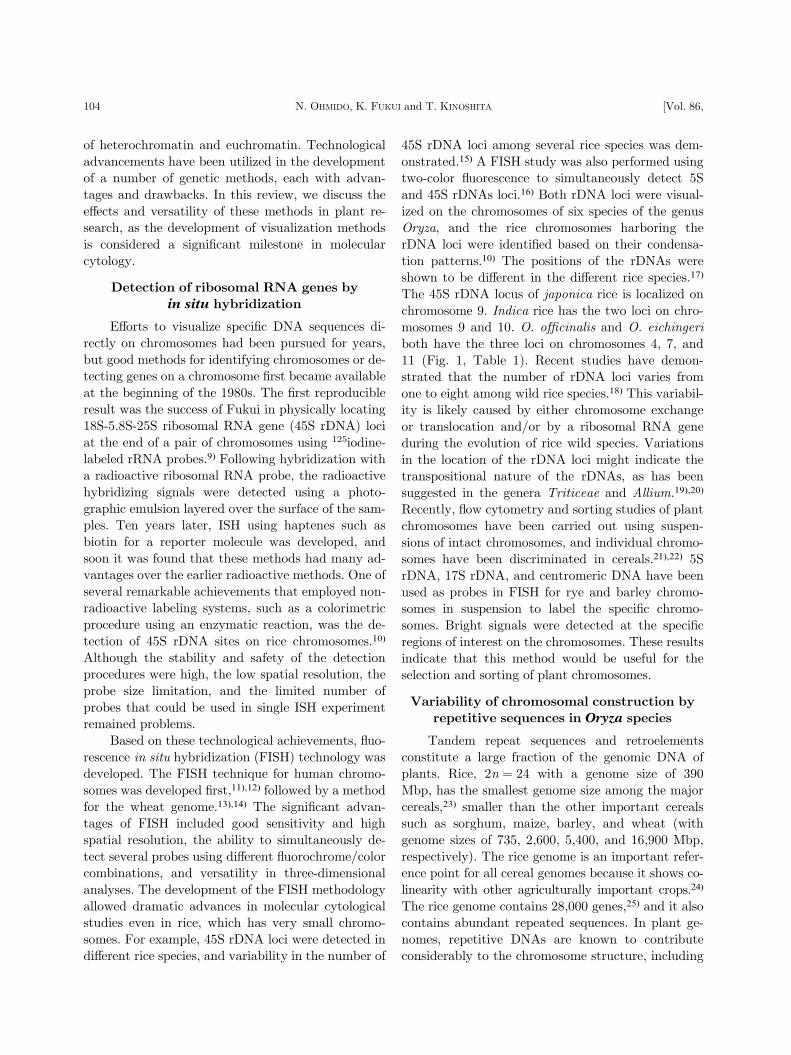
the rice blast resistance gene Pi-b, respectively, bothon chromosome 2 (Fig. 2). Finally, the improved
detection sensitivity enabled the visualization of a
small RFLP marker of only 1.29 kb.54) A singleRFLP marker of 1.29 kb in size was mapped to the
distal end of the long arm of rice chromosome 4
(chromosomal address: 4q2.1). Image analysis of theFISH results allowed the re�nement of the localiza-
tion of the molecular markers on the quantitativerice chromosome map. The combination of chromo-
some identi�cation, physical mapping, and image
analysis gives the most accurate physical mapping of
genes. For example, a 180 kb BAC clone was FISH-mapped at 96.2% distance from the end of the short
arm of chromosome 2 (Fig. 2g). The position of this
BAC clone was localized at 98.7% (190.4 cM) fromthe end of the same chromosome arm on the genetic
map.54) Thus, only a small di�erence was found be-
tween the estimated positions of this BAC clone onthe physical and genetic map.
High resolution analysis for the integration
of genetic, physical and cytological
chromosome maps
Genetic linkage maps and physical maps areboth bene�cial to determine the positions of genes
and speci�c DNA sequences in plant genomes. How-
ever, linkage maps based on recombination frequen-cies do not directly re�ect physical distances, because
genetic recombination does not occur at random
along chromosomes. Therefore, the integration oflinkage maps and physical maps is essential for the
accurate positioning of genes and speci�c DNA se-
quences.58)–60) A standardized rice karyotype wasconstructed using pachytene chromosomes of O.
sativa to facilitate rice chromosome identi�cation.61)
This karyotype consists of landmarks in cultivatedand wild rice species by FISH using centromere spe-
ci�c and chromosomal arm speci�c BAC clones.62),63)
Further integration among the linkage map,somatic prometaphase map, and pachytene map,
based on the positions of common BAC/PAC clonesby FISH,53) was demonstrated. An idiogram depict-
ing the distribution of heterochromatin in the rice
pachytene chromosome was developed based on thepatterns of 4’,6-diamidino-2-phenylindole (DAPI)
and propidium iodide (PI) staining. In comparing
the three maps, discrepancies between the positionsof DNA markers on the linkage map and the FISH
signal positions on pachytene chromosomes map
were detected.64) In addition, a di�erence among thethree maps in the position of NOR on chromosome
9 was shown. In the linkage map, NOR was not
mapped, suggesting that the NOR region has noe�ective genetic marker. As previous studies demon-
strated on chromosome 4, consistencies were found
between the condensation patterns of somatic pro-metaphase chromosomes and the chromomeric char-
acters in pachytene chromosomes. This result suggests
that chromosomes might condense during mitosis andmeiosis through the same mechanism.65)
107Rice genome and chromosome structure research by FISHNo. 2]
Fig. 2. Figure legend is on the next page.
Fig. 3. Figure legend is on the next page.
108 N. OHMIDO, K. FUKUI and T. KINOSHITA [Vol. 86,

Characterization of genome organization of
hybrids and polyploids by GISH
Chromosome painting by genomic in situ hy-
bridization (GISH), a modi�ed version of FISH tech-nology, is also versatile tool in the �eld of plant
cytology and cytogenetics.66) GISH allows the visual-
ization and comparison of chromosomes and genomesof di�erent materials, enabling one to characterize
them as polyploids, F1 hybrids and their progenies,
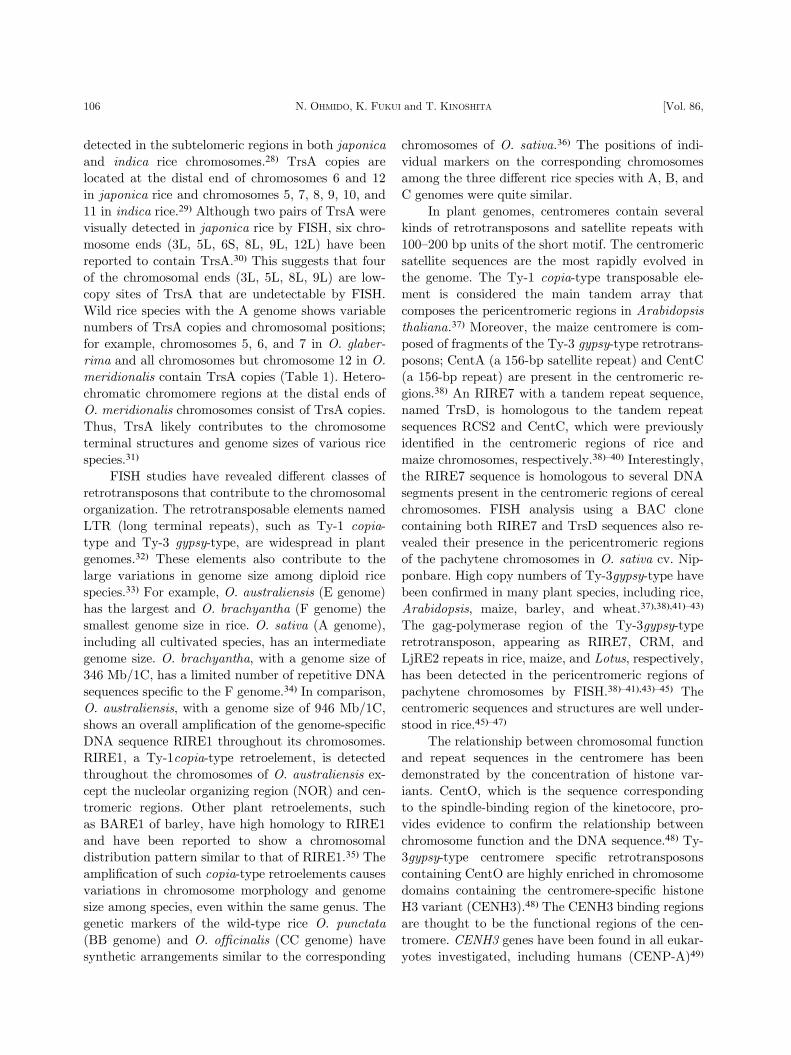
partial allopolyploids, polyhaploids, or recombinantlines.67)–71) Fig. 3 shows the distinction between two
kinds of genomes in two wild tetraploids, O. minuta
(BBCC, Fig. 3a and b) and O. latifolia (CCDD, Fig.3c and d). The genetic distances among the three
genomes in the two species can be resolved (Fig. 3e).Using the C genome as a pivotal genome by GISH,
the genetic distance of the B genome from C is larger
than that of the D genome from C. Recombinationevents can be diagnosed using GISH, which allows
new insights into chromosome structure di�erentia-
tion between the three genomes.Shishido et al.69) have shown the introgression of
chromosome fragments among di�erent genomes in
somatic hybrids of rice species. Somatic hybrids be-tween O. sativa (AA, 2n ¼ 24) and O. punctata
tetraploid (BBCC, 2n ¼ 48) were produced by soma-
tic cell fusion. Multicolor GISH (McGISH) with twogenomic probes, one for the A genome and the other
for the C genome, and DAPI staining of DNA were
performed. Although the expected hexaploid somatichybrid (2n ¼ 6x ¼ 72) should have the A, B, and C
genomes with 72 chromosomes, the somatic hybrids
showed aneuploidy with 65{72 chromosomes (Fig.
4). GISH revealed that A genome chromosomes
were never eliminated, whereas frequent loss of Bgenome chromosomes and an occasional loss of C
genome chromosomes were observed (Fig. 4a, 4b, 4f,
4g). GISH revealed the chromosome constitution ofall aneuploids, demonstrating its important role as a
tool for genome monitoring in plant breeding. Shi-
shido et al.72) have reported highly reproducible,complete protocols for chromosome painting by GISH
in rice chromosomes. GISH is also an e�ective method
for basic genetic research and practical breeding intomato and eggplant species.73),74) However, the fea-
sibility of chromosome painting by GISH for hybrids
consisting of di�erent genomes depends on the diver-sity of the di�erent contributor genomes. For exam-
ple, the use of GISH in Brassica allopolyploids con-sisting of a combination of the A, B, and C genomes
could not discriminate the three genomes because the
repeated sequences are highly homologous among thethree genomes.75) However, recently, total genomic
DNA from B. oleracea (CC genome, 2n ¼ 18) was
hybridized to mitotic or meiotic chromosomes of B.
napus (AACC, 2n ¼ 38) in the presence of blocking
DNA from B. rapa (AA, 2n ¼ 20), and nine pairs of
the C genome chromosomes were clearly detected.76)
High spatial resolution for visualizing
DNA domains and sequences using
extended DNA �ber FISH
In plants, FISH resolution is 5{10 Mb using
well-spread metaphase spread chromosomes, 1.2 Mb
in pachytene chromosomes, and 100 kb for inter-phase nuclei.77) These values depend on the degree
of chromatin compactness and also on the genome
Fig. 2. Physical mapping by FISH of a YAC clone (400 kb) carrying the gall midge resistance gene, Gm2, and a BAC clone(180 kb) containing a rice blast resistance gene, Pi-b, on rice haploid chromosomes.54) a{d: Mapping of the Gm2 carryingYAC clone that appeared as green �uorescent doublets on the probed chromosome 1. e{h: Mapping of the Pi-b carryingBAC clone that appeared as the green �uorescent doublets on the probed chromosome 2. a and e: An entire somatic haploidmetaphase plate with 12 chromosomes, of which probed chromosome is indicated by a white arrowhead. b and f: Enlarged im-age of the respective signal-tagged chromosome, of which centromere is shown by red arrowhead. c and g: Cytological maps ofchromosome 1 and 2, carrying Gm2 and Pi-b gene, respectively. Green doublet circles show the site of the probed YAC orBAC clone. d and h: Genetic maps of chromosome 1 and 2, of which centromeric regions are indicated by red boxes, and thesites of probed YAC and BAC clones by red arrows.
Fig. 3. Genomic in situ hybridization (GISH) of two amphidiploids, O. minuta (BBCC, 2n ¼ 48) and O. latifolia (CCDD,2n ¼ 48).68) a and b: Chromosomes of O. minuta. (a) Counterstained with propidium iodide, and (b) composite chromosomeimages of the counterstaining (red) and C genome signal image (yellow). c and d: GISH of O. latifolia (CCDD, 2n ¼ 48) chro-mosomes. (c) Giemsa stained chromosomes before GISH and (d) a composite chromosome image of counterstaining (red) andsignal image (yellow). e: Schematic representation of the genetic relationships between the B, C, and D genomes. Distancesbetween the genomes are in arbitrary units. Bar indicates 10 mm.
109Rice genome and chromosome structure research by FISHNo. 2]

Fig. 4. Multicolor genomic in situ hybridization (McGISH) of somatic hybrids having the A, B, and C genomes with thedi�erent combinations of the genomic probes.69) Upper panel: McFISH results with two probes of A (red) and B (green)genomes with the counterstained C genome (blue) with 4’,6-diamidino-2-phenylindole (DAPI). Lower panel: McFISH resultswith two probes of A (red) and C (green) genomes with the counterstaining B genome with DAPI (blue). a and f: McGISH ofthe whole nucleus, in which A genome is colored in red, B genome in green or blue, and C genome in blue or green. b andg: Identi�cation of the chromosomes of three genomes by their �uorescent color, those of the A, B and C genome chromosomesbeing identi�ed with red, green or blue, and blue or green �uorescence, respectively. c and h: Identi�cation of the A genomechromosomes with red �uorescence. d and i: Identi�cation of the B and C genome chromosomes with green �uorescence. e andj: Insertion of the B genome chromosome fragments to the C genome chromosomes and that of the A genome chromosomefragments to the B genome chromosomes, respectively. Bar indicates 5 mm.
Fig. 5. High resolution FISH of rice somatic chromosomes, pachytene chromosomes, the nucleus, and extended DNA �bers.Upper left: DAPI- stained mitotic prometaphase chromosome 12 with telomere signals (green) and the subtelomeric tandemrepeat TrsA (red). Upper middle: A pachytene bivalent of the same chromosomes with TrsA (red), in which heterochromatinand euchromatin are well di�erentiated. Upper right: Interphase nucleus, in which telomere sequences, TTTAGGGs andTrsA are colored in green and red, respectively. Bottom: Extended DNA �bers (EDFs) measuring 74 mm with 242 kb TrsA’s(red) and telomere sequence (green). EDFs resemble ‘‘beads-on-a-string’’. All �gures are at the same magni�cation. Barindicates 5 mm.
110 N. OHMIDO, K. FUKUI and T. KINOSHITA [Vol. 86,
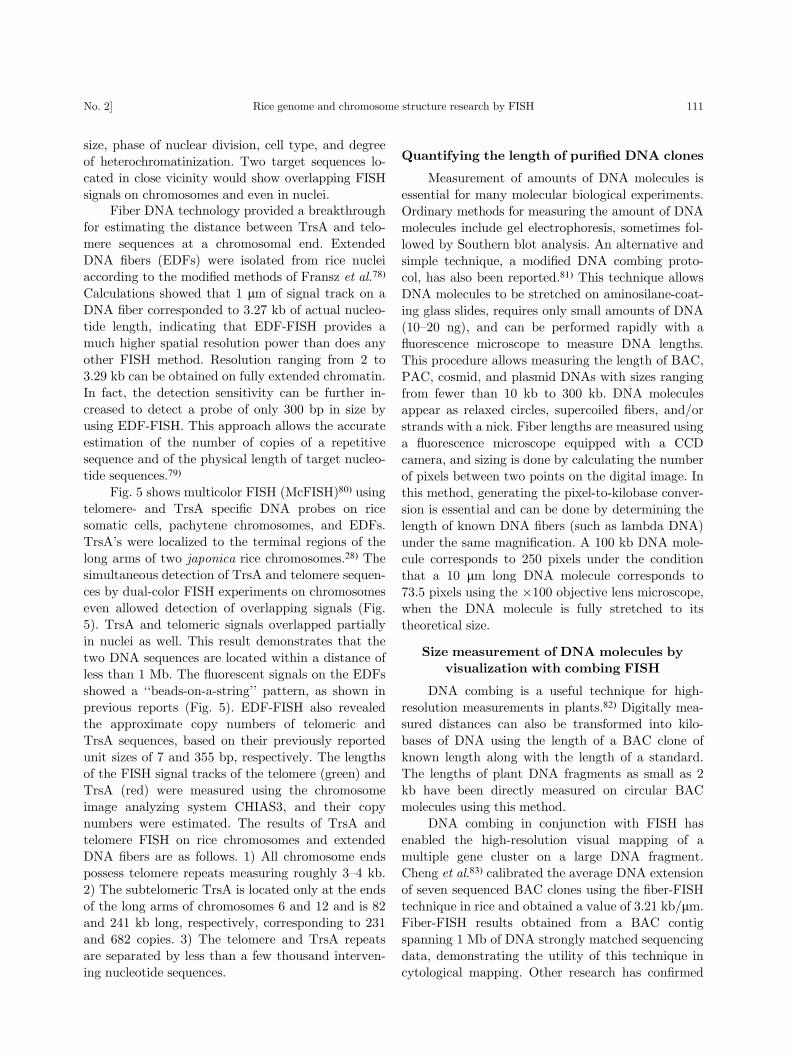
size, phase of nuclear division, cell type, and degree
of heterochromatinization. Two target sequences lo-cated in close vicinity would show overlapping FISH
signals on chromosomes and even in nuclei.Fiber DNA technology provided a breakthrough
for estimating the distance between TrsA and telo-
mere sequences at a chromosomal end. Extended
DNA �bers (EDFs) were isolated from rice nucleiaccording to the modi�ed methods of Fransz et al.78)
Calculations showed that 1 mm of signal track on a
DNA �ber corresponded to 3.27 kb of actual nucleo-tide length, indicating that EDF-FISH provides a
much higher spatial resolution power than does any
other FISH method. Resolution ranging from 2 to3.29 kb can be obtained on fully extended chromatin.
In fact, the detection sensitivity can be further in-
creased to detect a probe of only 300 bp in size byusing EDF-FISH. This approach allows the accurate
estimation of the number of copies of a repetitive
sequence and of the physical length of target nucleo-tide sequences.79)
Fig. 5 shows multicolor FISH (McFISH)80) using
telomere- and TrsA speci�c DNA probes on ricesomatic cells, pachytene chromosomes, and EDFs.
TrsA’s were localized to the terminal regions of the
long arms of two japonica rice chromosomes.28) Thesimultaneous detection of TrsA and telomere sequen-
ces by dual-color FISH experiments on chromosomes
even allowed detection of overlapping signals (Fig.5). TrsA and telomeric signals overlapped partially
in nuclei as well. This result demonstrates that the
two DNA sequences are located within a distance ofless than 1 Mb. The �uorescent signals on the EDFs
showed a ‘‘beads-on-a-string’’ pattern, as shown in
previous reports (Fig. 5). EDF-FISH also revealedthe approximate copy numbers of telomeric and
TrsA sequences, based on their previously reported
unit sizes of 7 and 355 bp, respectively. The lengthsof the FISH signal tracks of the telomere (green) and
TrsA (red) were measured using the chromosome
image analyzing system CHIAS3, and their copynumbers were estimated. The results of TrsA and
telomere FISH on rice chromosomes and extended
DNA �bers are as follows. 1) All chromosome endspossess telomere repeats measuring roughly 3{4 kb.
2) The subtelomeric TrsA is located only at the ends
of the long arms of chromosomes 6 and 12 and is 82and 241 kb long, respectively, corresponding to 231
and 682 copies. 3) The telomere and TrsA repeatsare separated by less than a few thousand interven-
ing nucleotide sequences.
Quantifying the length of puri�ed DNA clones
Measurement of amounts of DNA molecules is
essential for many molecular biological experiments.
Ordinary methods for measuring the amount of DNAmolecules include gel electrophoresis, sometimes fol-
lowed by Southern blot analysis. An alternative and
simple technique, a modi�ed DNA combing proto-col, has also been reported.81) This technique allows
DNA molecules to be stretched on aminosilane-coat-
ing glass slides, requires only small amounts of DNA(10{20 ng), and can be performed rapidly with a
�uorescence microscope to measure DNA lengths.
This procedure allows measuring the length of BAC,PAC, cosmid, and plasmid DNAs with sizes ranging
from fewer than 10 kb to 300 kb. DNA moleculesappear as relaxed circles, supercoiled �bers, and/or
strands with a nick. Fiber lengths are measured using
a �uorescence microscope equipped with a CCDcamera, and sizing is done by calculating the number
of pixels between two points on the digital image. In
this method, generating the pixel-to-kilobase conver-sion is essential and can be done by determining the
length of known DNA �bers (such as lambda DNA)
under the same magni�cation. A 100 kb DNA mole-cule corresponds to 250 pixels under the condition
that a 10 mm long DNA molecule corresponds to
73.5 pixels using the �100 objective lens microscope,when the DNA molecule is fully stretched to its
theoretical size.
Size measurement of DNA molecules by
visualization with combing FISH
DNA combing is a useful technique for high-
resolution measurements in plants.82) Digitally mea-sured distances can also be transformed into kilo-
bases of DNA using the length of a BAC clone of
known length along with the length of a standard.The lengths of plant DNA fragments as small as 2
kb have been directly measured on circular BAC
molecules using this method.DNA combing in conjunction with FISH has
enabled the high-resolution visual mapping of a
multiple gene cluster on a large DNA fragment.Cheng et al.83) calibrated the average DNA extension
of seven sequenced BAC clones using the �ber-FISH
technique in rice and obtained a value of 3.21 kb/mm.Fiber-FISH results obtained from a BAC contig
spanning 1 Mb of DNA strongly matched sequencingdata, demonstrating the utility of this technique in
cytological mapping. Other research has con�rmed
111Rice genome and chromosome structure research by FISHNo. 2]

the insertion of organellar DNA on the long arm of
rice chromosome 10.84) Sequence of the insertedchloroplast DNA is nearly identical to regions of the
rice chloroplast genome sequence, suggesting that
the chloroplast DNA was transferred recently. InBrassica species, self-incompatibility is regulated by
a single S locus with multiple alleles that span
several hundreds of kilobases and contain severalgenes, including SLG and SRK.85) A 76-kb fragment
in a P1-derived arti�cial chromosome (PAC) clone
containing the SLG 9 and SRK 9 genes was used todirectly visualize the S locus. Using DNA combing
and FISH, Suzuki et al. demonstrated that the posi-
tions of the �uorescent signals of SLG 9 and SRK 9 onthe clone are consistent with their positions on the
restriction map.85) Combing-FISH has superior re-solving power and can be used to determine the pre-
cise lengths of repetitive sequences. Genes mapping
performed visually by high-resolution FISH is an im-portant technique in genome research.
Conclusions
Rice genetics and chromosome research has along history.86),87) FISH has much been improved
since its �rst development some 20 years ago. FISH
is currently one of the major techniques in plant cy-tology and biology. The increased sensitivity of the
technique and its ability to detect gene locations pro-
vide a powerful research tool in genetic studies. Thedetection sensitivities of FISH are well improved that
>10 kb DNA detection on the chromosome and >0.3
kb on the extended DNA �bers. Gene mapping ofrice genomes is becoming ever more important in
rice genetics and breeding. The accumulation of se-
quence data and gene functional data would furthersupport rice breeding e�orts.
The improved sensitivity of FISH is leading
FISH technology to the next step, detecting DNA-protein interactions with the use of chromatin im-
munoprecipitation (ChIP) and immunostaining. His-
tone acetylation occurs at N-terminal lysines of H3and H4. Three-dimensional observation revealed that
barley shows typical heterochromatin con�guration
in interphase nucleus.88) These techniques shouldgreatly aid in studies of genetics and also epigenetics.
Fluorescence techniques using green and/or red �uo-
rescence protein, like GFP and DsRed, respectively,could also be applied to study living cell dynamics in
plants.89)
Acknowledgements
The authors thank Prof. Dr. Hans J. de Jong,
Wageningen University, for his invaluable technical
advice and suggestions in the course of these studies.
References
1) Gill, B.S. and Friebe, B. (1998) Plant cytogenetics atthe dawn of the 21st century. Curr. Opin. PlantBiol. 1, 109{115.
2) Mukai, Y. (1996) In situ hybridization. In PlantChromosomes Laboratory Methods (eds. Fukui, K.and Nakayama, S.). CRC Press, New York, pp.155{170.
3) Mukai, Y. (2005) Perspectives in molecular cyto-genetics of wheat. Frontiers of Wheat Bioscience.Memorial Issue, Wheat Inf. Serv. 100, 17{31.
4) de Jong, H. (2003) Visualizing DNA domains andsequences by microscopy: a �fty-year history ofmolecular cytogenetics. Genome 46, 943{946.
5) Lysak, M.A., Pecinka, A. and Schubert, I. (2003) Re-cent progress in chromosome painting of Arabi-dopsis and related species. Chromosome Res. 11,195{204.
6) Jiang, J. and Gill, B.S. (2006) Current status and thefuture of �uorescence in situ hybridization (FISH)in plant genome research. Genome 49, 1057{1068.
7) Lysak, M., Fransz, P. and Schubert, I. (2006) Cytoge-netic analyses of Arabidopsis. Methods Mol. Biol.323, 173{186.
8) Harper, L.C. and Cande, W.Z. (2000) Mapping a newfrontier: development of integrated cytogeneticmaps in plants. Funct. Integr. Genomics 1, 89{98.
9) Fukui, K. (1990) Localization of rRNA genes on ricechromosomes. Rice Biotech. Quart. 1, 18{19.
10) Fukui, K. and Iijima, K. (1991) Somatic chromosomemap of rice by imaging methods. Theor. Appl.Genet. 81, 589{596.
11) Langer, P.R., Waldrop, A.A. and Ward, D.C. (1981)Enzymatic synthesis of biotin-labeled polynucleo-tides: novel nucleic acid af�nity probes. Proc. Natl.Acad. Sci. USA 78, 6633{6637.
12) Pardue, M.L. and Gall, J.G. (1970) Chromosomallocalization of mouse satellite DNA. Science 168,1356{1358.
13) Schwarzacher, T., Leitch, A.R., Bennett, M.D. andHeslop-Harrison, J.S. (1989) In situ hybridizationof parental genomes in a wide hybrid. Ann. Bot.(London) 64, 315{324.
14) Yamamoto, M. and Mukai, Y. (1989) Application of�uorescence in situ hybridization to molecular cy-togenetics of wheat. Wheat Inf. Serv. 69, 30{32.
15) Fukui, K., Ohmido, N. and Khush, G.S. (1994) Vari-ability in rDNA loci in genus Oryza detectedthrough �uorescence in situ hybridization. Theor.Appl. Genet. 87, 893{899.
16) Ohmido, N. and Fukui, K. (1995) Cytological studiesof African cultivated rice, Oryza glaberrima. Theor.Appl. Genet. 91, 212{217.
112 N. OHMIDO, K. FUKUI and T. KINOSHITA [Vol. 86,

17) Shishido, R., Sano, Y. and Fukui, K. (2000) Riboso-mal DNAs: an exception to the conservation ofgene order in rice genomes. Mol. Gen. Genet. 263,586{591.
18) Chung, M.C., Lee, Y.I., Cheng, Y.Y., Chou, Y.J. andLu, C.F. (2008) Chromosomal polymorphism ofribosomal genes in the genus Oryza. Theor. Appl.Genet. 116, 745{753.
19) Dubcovsky, J. and Dvor�ak, J. (1995) Ribosomal RNAmultigene loci: nomads of the Triticeae genomes.Genetics 140, 1367{1377.
20) Schubert, I. and Wobus, U. (1985) In situ hybridiza-tion con�rms jumping nucleolus organizing regionsin Allium. Chromosoma 92, 143{148.
21) Dolezel, J., Kubal�akov�a, M., Bartos, J. and Macas, J.(2004) Flow cytogenetics and plant genome map-ping. Chromosome Res. 12, 77{91.
22) Ma, Y., Lee, J.H., Li, L.C., Uchiyama, S., Ohmido, N.and Fukui, K. (2005) Fluorescent labeling of plantchromosomes in suspension by FISH. Genes Genet.Syst. 80, 35{39.
23) International Rice Genome Sequence Project: http://rgp.dna.a�rc.go.jp/E/IRGSP/index.html
24) Moore, G., Foote, T., Helentjaris, T., Devos, K.,Kurata, N. and Gale, M. (1995) Was there a singleancestral cereal chromosome? Trends Genet. 11,81{82.
25) National Institute of Agribiological Sciences RiceFull-Length cDNA Project Team (2003) Collec-tion, mapping, and annotation of over 28,000cDNA clones from japonica rice. Science 301,376{379.
26) Ohtsubo, H., Umeda, M. and Ohtsubo, E. (1991)Organization of DNA sequences highly repeatedin tandem in rice genomes. Jpn. J. Genet. 66,241{254.
27) Wu, H.K., Chung, M.C., Wu, T.Y., Ning, C.N. andWu, R. (1991) Localization of speci�c repetitiveDNA sequences in individual rice chromosomes.Chromosoma 100, 330{338.
28) Ohmido, N. and Fukui, K. (1997) Visual veri�cationof close disposition between a rice A genome-speci�c DNA sequence (TrsA) and the telomeresequences. Plant Mol. Biol. 35, 963{968.
29) Ohmido, N., Kijima, K., Ashikawa, I., de Jong, H.J.and Fukui, K. (2001) Visualization of the terminalstructure of rice chromosomes 6 and 12 using mul-ticolor FISH to chromosomes and extended DNA�bers. Plant Mol. Biol. 47, 413{421.
30) Mizuno, H., Wu, J., Kanamori, H., Fujisawa, M.,Namiki, N., Saji, S. et al. (2006) Sequencing andcharacterization of telomere and subtelomere re-gions on rice chromosomes 1S, 2S, 2L, 6L, 7S, 7L,and 8S. Plant J. 46, 206{217.
31) Ohmido, N. and Fukui, K. (2004) Recent advances inFISH analysis of plant chromosomes. Recent Res.Devel. Biochem. 5, 267{279.
32) Heslop-Harrison, J.S., Brandes, A., Taketa, S.,Schmidt, T., Vershinin, A.V., Alkhimova, E.G.et al. (1997) The chromosomal distributions ofTy1-copia group retrotransposable elements inhigher plants and their implications for genomeevolution. Genetica 100, 197{204.
33) Nakajima, R., Noma, K., Ohtsubo, H. and Ohtsubo,E. (1996) Identi�cation and characterization oftwo tandem repeat sequences (TrsB and TrsC)and a retrotransposon (RIRE1) as genome-generalsequences in rice. Genes Genet. Syst. 71, 373{382.
34) Uozu, S., Ikehashi, H., Ohmido, N., Ohtsubo, H.,Ohtsubo, E. and Fukui, K. (1997) Repetitive se-quences: cause for variation in genome size andchromosome morphology in the genus Oryza. PlantMol. Biol. 35, 791{799.
35) Suoniemi, A., Anamthawat-J�onsson, K., Arna, T.and Schulman, A.H. (1996) Retrotransposon BARE-1 is a major, dispersed component of the barley(Hordeum vulgare L.) genome. Plant Mol. Biol.30, 1321{1329.
36) Tang, X., Bao, W., Zhang, W. and Cheng, Z. (2007)Identi�cation of chromosomes from multiple ricegenomes using a universal molecular cytogeneticsystem. J. Integr. Plant Biol. 49, 953{960.
37) Heslop-Harrison, J.S., Brandes, A. and Schwarzacher,T. (2003) Tandemly repeated DNA sequences andcentromeric chromosomal regions of Arabidopsisspecies. Chromosome Res. 11, 241{253.
38) Ananiev, E.V., Phillips, R.L. and Rines, H.W. (1998)Chromosome-speci�c molecular organization ofmaize (Zea mays L.) centromeric regions. Proc.Natl. Acad. Sci. USA 95, 13073{13078.
39) Dong, F., Miller, J.T., Jackson, S.A., Wang, G.L.,Ronald, P.C. and Jiang, J. (1998) Rice (Oryzasativa) centromeric regions consist of complexDNA. Proc. Natl. Acad. Sci. USA 95, 8135{8140.
40) Kumekawa, N., Ohmido, N., Fukui, K., Ohtsubo, E.and Ohtsubo, H. (2001) A new gypsy-type retro-transposon, RIRE7 : preferential insertion into thetandem repeat sequence TrsD in pericentromericheterochromatin regions of rice chromosomes. Mol.Gen. Genomics 265, 480{488.
41) Ma, J., Wing, R.A., Bennetzen, J.L. and Jackson,S.A. (2007) Plant centromere organization: a dy-namic structure with conserved functions. TrendsGenet. 23, 134{139.
42) Fukui, K.N., Suzuki, G., Lagudah, E.S., Rahman, R.,Appels, R., Yamamoto, M. and Mukai, Y. (2001)Physical arrangement of retrotransposon-relatedrepeats in centromeric regions of wheat. Plant CellPhysiol. 42, 189{196.
43) Cheng, Z.J. and Murata, M. (2003) A centromerictandem repeat family originating from a part ofTy3/gypsy-retroelement in wheat and its relatives.Genetics 164, 665{672.
44) Ohmido, N., Ishimaru, A., Kato, S., Sato, S., TabataS. and Fukui, K. (2009) Integration of cytogeneticand genetic linkage maps of Lotus japonicus, a modelplant for legumes. Chromosome Res. (in press)
45) Zhang, Y., Huang, Y., Zhang, L., Li, Y., Lu, T., Lu,Y. et al. (2004) Structural features of the rice chro-mosome 4 centromere. Nucleic Acids Res. 32,2023{2030.
46) Cheng, Z., Dong, F., Langdon, T., Ouyang, S., Buell,C.R., Gu, M. et al. (2002) Functional rice centro-meres are marked by a satellite repeat and a cen-tromere-speci�c retrotransposon. Plant Cell 14,1691{1704.
113Rice genome and chromosome structure research by FISHNo. 2]
47) Zhang, W., Yi, C., Bao, W., Liu, B., Cui, J., Yu, H. etal. (2005) The transcribed 165-bp CentO satelliteis the major functional centromeric element in thewild rice species Oryza punctata. Plant Physiol.139, 306{315.
48) Jiang, J., Birchle, J.A., Parrott, W.A. and Dawe,R.K. (2003) A molecular view of plant centro-meres. Trends Plant Sci. 8, 570{575.
49) Palmer, D.K., O’Day, K., Trong, H.L., Charbonneau,H. and Margolis, R.L. (1991) Puri�cation of thecentromere-speci�c protein CENP-A and demon-stration that it is a distinctive histone. Proc. Natl.Acad. Sci. USA 88, 3734{3738.
50) Talbert, P.B., Masuelli, R., Tyagi, A.P., Comai, L.and Heniko�, S. (2002) Centromeric localizationand adaptive evolution of an Arabidopsis histoneH3 variant. Plant Cell 14, 1053{1066.
51) Nagaki, K., Neumann, P., Zhang, D., Ouyang, S.,Buell, C.R., Cheng, Z. et al. (2005) Structure, di-vergence, and distribution of the CRR centromericretrotransposon family in rice. Mol. Biol. Evol. 22,845{855.
52) Houben, A., Demidov, D., Gernand, D., Meister, A.,Leach, C.R. and Schubert, I. (2003) Methylationof histone H3 in euchromatin of plant chromosomesdepends on basic nuclear DNA content. Plant J.33, 967{973.
53) Iwata, I. (2008) Cytological research of rice chromo-somes. Kobe University Graduation thesis, pp.1{51.
54) Ohmido, N., Akiyama, Y. and Fukui, K. (1998) Phys-ical mapping of unique nucleotide sequences onidenti�ed rice chromosomes. Plant Mol. Biol. 38,1043{1052.
55) Rajyashiri, K.R., Nair, S., Ohmido, N., Fukui, K.,Kurata, N., Sasaki, T. et al. (1998) Isolation andFISH mapping of Yeast Arti�cial Chromosomes(YACs) encompassing an allele of the Gm2 genefor gall midge resistance in rice. Theor. Appl.Genet. 97, 507{514.
56) Jiang, J., Gill, B.S., Wang, G.L., Ronald, P.C. andWard, D.C. (1995) Metaphase and interphase�uorescence in situ hybridization mapping of therice genome with bacterial arti�cial chromosomes.Proc. Natl. Acad. Sci. USA 92, 4487{4491.
57) Nakamura, S., Asakawa, S., Ohmido, N., Fukui, K.,Shimizu, N. and Kawasaki, S. (1997) Constitutionof an 800-kb contig in the near-centromeric regionof the rice blast resistance gene Pi-ta2 using ahighly representative rice BAC library. Mol. Gen.Genet. 254, 611{620.
58) Szinay, D., Chang, S.B., Khrustaleva, L., Peters, S.,Schijlen, E., Bai, Y. et al. (2008) High-resolutionchromosome mapping of BACs using multi-colourFISH and pooled-BAC FISH as a backbone forsequencing tomato chromosome 6. Plant J. 56,627{637.
59) Wang, C.J., Harper, L. and Cande, W.Z. (2006)High-resolution single-copy �uorescence in situhybridization and its use in the construction of acytogenetic map of maize chromosome 9. PlantCell 18, 529{544.
60) Cheng, Z., Buell, C.R., Wing, R.A., Gu, M. andJiang, J. (2001) Toward a cytological charac-terization of the rice genome. Genome Res. 11,2133{2141.
61) Tang, X., Bao, W., Zhang, W. and Cheng, Z. (2007)Identi�cation of chromosomes from multiple ricegenomes using a universal molecular cytogeneticmarker system. J. Integr. Plant Biol. 49, 953{960.
62) Wu, J., Mizuno, H., Hayashi-Tsugane, M., Ito, Y.,Chiden, Y., Fujisawa, M. et al. (2003) Physicalmaps and recombination frequency of six rice chro-mosomes. Plant J. 36, 720{730.
63) Kato, S., Ohmido, N. and Fukui, K. (2003) Develop-ment of a quantitative pachytene chromosome mapin Oryza sativa by imaging methods. Genes Genet.Syst. 78, 155{161.
64) Feng, Q., Zhang, Y., Hao, P., Wang, S., Fu, G.,Huang, Y. et al. (2002) Sequence and analysis ofrice chromosome 4. Nature 420, 316{320.
65) Schubert, I., Fransz, P.F., Fuchs, J. and de Jong,J.H. (2001) Chromosome painting in plants. Meth-ods Cell Sci. 23, 57{69.
66) Mukai, Y. and Gill, B.S. (1991) Detection of barleychromatin added to wheat by genomic in situ hy-bridization. Genome 34, 448{452.
67) Mukai, Y., Nakahara, Y. and Yamamoto, M. (1993)Simultaneous discrimination on the three genomesin hexaploid wheat by multicolor �uorescence insitu hybridization using total genomic and highlyrepeated DNA probes. Genome 36, 489{494.
68) Fukui, K., Shishido, R. and Kinoshita, T. (1997)Identi�cation of the rice D-genome chromosomesby genomic in situ hybridization. Theor. Appl.Genet. 95, 1239{1245.
69) Shishido, R., Apisitwanich, S., Ohmido, N., Okinaka,Y., Mori, K. and Fukui, K. (1998) Detection ofspeci�c chromosome reduction in rice somatic hy-brids with the A, B, and C genomes by multi-colorgenomic in situ hybridization. Theor. Appl. Genet.97, 1013{1018.
70) Tan, G., Jin, H., Li, G., He, R., Zhu, L. and He,G. (2005) Production and characterization of acomplete set of individual chromosome additionsfrom Oryza of�cinalis to Oryza sativa using RFLPand GISH analyses. Theor. Appl. Genet. 111,1585{1595.
71) Yan, H., Liu, G., Cheng, Z., Min, S. and Zhu, L.(2001) Characterization of euploid backcross pro-genies derived from interspeci�c hybrids betweenOryza sativa and O. eichingeri by restriction frag-ment length polymorphism (RFLP) analysis andgenomic in situ hybridization (GISH). Genome 44,86{95.
72) Shishido, R., Ohmido, N. and Fukui, K. (2001) Chro-mosome painting as a tool for rice genetics andbreeding. Methods Cell Sci. 23, 125{132.
73) Escalante, A., Imanishi, S., Hossain, M., Ohmido, N.and Fukui, K. (1998) RFLP analysis and genomicin situ hybridization (GISH) in somatic hybridsand their progenies between Lycopersicon esculen-tum and Solanum lycopersicoides. Theor. Appl.Genet. 96, 719{726.
114 N. OHMIDO, K. FUKUI and T. KINOSHITA [Vol. 86,

74) Iwamoto, Y., Hirai, M., Ohmido, N., Fukui, K. andEzura, H. (2007) Fertile somatic hybrids betweenSolanum integrifolium and S. sanitwongsei (syn. S.kurzii) as candidates for bacterial wilt-resistantrootstock of eggplant. Plant Biotech. 24, 179{184.
75) Snowdon, R.J., Kohler, W., Friedt, W. and Kohler,A. (1997) Genomic in situ hybridization in Bras-sica amphidiploids and interspeci�c hybrids. Theor.Appl. Genet. 95, 1320{1324.
76) Howell, E.C., Kearsey, M.J., Jones, G.H., King, G.J.and Armstrong, S.J. (2008) A and C genome dis-tinction and chromosome identi�cation in Brassicanapus by sequential �uorescence in situ hybridiza-tion and genomic in situ hybridization. Genetics180, 1849{1857.
77) de Jong, H.J., Fransz, P. and Zabel, P. (1999) High-Resolution FISH in plants: techniques and applica-tions. Trends Plant Sci. 4, 258{263.
78) Fransz, P., Alonso-Blanco, C., Liharska, T., Peeters,A.J.M., Zabel, P. and de Jong, J.H. (1996) High-resolution physical mapping in Arabidopsis tha-liana and tomato by �uorescence in situ hybridiza-tion to extended DNA �bers. Plant J. 9, 421{430.
79) Ohmido, N., Kijima, K., Akiyama, Y., de Jong, J.H.and Fukui, K. (2000) Quanti�cation of total ge-nomic DNA and selected repetitive sequences re-veals concurrent changes in di�erent DNA familiesin indica and japonica rice. Mol. Gen. Genet. 263,388{394.
80) Mukai, Y. (1996) Multicolor �uorescence in situhybridization: a new tool for genome analysis. InMethods of Genome Analysis in Plants (ed. JauharP.P.). CRC Press, New York, pp. 181{192.
81) Henegariu, O., Grober, L., Haskins, W., Bowers,P.N., State, M.W., Ohmido, N. et al. (2001) RapidDNA �ber technique for size measurements oflinear and circular DNA probes. Biotechniques 31,246{250.
82) Jackson, S.A., Wang, M.L., Goodman, H.M. and
Jiang, J. (1998) Application of �ber-FISH in physi-cal mapping of Arabidopsis thaliana. Genome 41,566{572.
83) Cheng, Z., Buell, C.R., Wing, R.A. and Jiang, J.(2002) Resolution of �uorescence in-situ hybridiza-tion mapping on rice mitotic prometaphase chro-mosomes, meiotic pachytene chromosomes, and ex-tended DNA �bers. Chromosome Res. 10, 379{387.
84) Yuan, Q., Hill, J., Hsiao, J., Mo�at, K., Ouyang, S.,Cheng, Z. et al. (2002) Genome sequencing of a239-kb region of rice chromosome 10L reveals ahigh frequency of gene duplication and a largechloroplast DNA insertion. Mol. Genet. Genomics267, 713{720.
85) Suzuki, G., Kai, N., Hirose, T., Fukui, K., Nishio, T.,Takayama, S. et al. (1999) Genomic organizationof the S locus: identi�cation and characterizationof genes in SLG/SRK region of S9 haplotype ofBrassica campestris (syn. rapa). Genetics 153,391{400.
86) Morishima, H. (1984) Wild plants and domestication.In Biology of Rice (eds. Tsunoda, S. and Takaha-shi, N.). Japan Sci. Soc. Press, Amsterdam, pp.3{30.
87) Ohmido, N., Fukui, K. and Kinoshita, T. (2005) Ad-vances in rice chromosomes research. Proc. Jpn.Acad., Ser. B 81, 382{392.
88) Wako, T., Fukuda, M., Furushima-Shimogawara,R., Belyaev, N.D. and Fukui, K. (2002) Cell cycle-dependent and lysine residue-speci�c dynamicchanges of histone H4 acetylation in barley. PlantMol. Biol. 49, 645{653.
89) Ohmido, N., Wako, T. and Fukui, K. (2008) Nuclearorganization analyzed by visualization. The Nu-cleus 50, 473{489.
(Received Nov. 17, 2009; accepted Jan. 4, 2010)
115Rice genome and chromosome structure research by FISHNo. 2]

Pro�le
Nobuko Ohmido graduated the master degree of Agriculture at Kobe University
in 1989 and took a doctor degree of Agriculture supervised by Professor Emeritus
Toshiro Kinoshita at Hokkaido University in 1994. She started research career in the
�eld of plant breeding technology in 1991 at Hokuriku National Agricultural Expe-
riment Station, Ministry of Agriculture, Forestry and Fishers. She performed the
pioneer of rice and other crops chromosome researches using �uorescence in situ
hybridization. Cause of these performances, she received the following awards; the
Society of Chromosome Research Award from The society of chromosome research
in 2001, Young Scientist Award from The society of Japanese Science of Breeding in
2002, Technology Award from Japanese Society of Plant Cell and Molecular Biology
in 2007. She moved to Faculty of Human Development (present name; Graduate
School of Human Development and Environment), Kobe University as an associate professor in 2004. The
research is ‘‘Analysis and usage of genome and chromosome in plant science’’. Current studies are the genome
and chromosome researches of rice, bean, vegetable, forage crops, and a new bio-fuel plant for the co-existence
and co-prosperity with food production and environment of plants. The research purpose is to develop new plant
science technologies to resolve dif�culties of environmental programs and to e�ectively utilize the plant’s speci�c
functions for the facilitation of human life.
116 N. OHMIDO, K. FUKUI and T. KINOSHITA [Vol. 86,
Related Documents