Red and black tides: Quantitative analysis of water-leaving radiance and perceived color for phytoplankton, colored dissolved organic matter, and suspended sediments Heidi M. Dierssen 1 Department of Marine Science, University of Connecticut, 1080 Shennecossett Road, Groton, Connecticut 06340 Raphael M. Kudela Ocean Sciences Department, University of California, Santa Cruz, California 95064 John P. Ryan Monterey Bay Aquarium Research Institute, 7700 Sandholdt Road, Moss Landing, California 95039 Richard C. Zimmerman Department of Ocean, Earth, and Atmospheric Sciences, 4600 Elkhorn Avenue, Old Dominion University, Norfolk, Virginia 23529 Abstract Using field measurements and quantitative modeling, we demonstrate that red coloration of the sea surface is not associated with any particular group of phytoplankton and is strongly dependent on the physiology of the human visual system. Red or brown surface waters can be produced by high concentrations of most types of algae, colored dissolved organic matter, or suspended sediment. Even though light reflected by red tides commonly peaks in the yellow spectral region (570–580 nm), human color perception requires consideration of the entire spectrum of light relative to receptors within the human eye. The color shift from green to red is not due to any special optical properties of the algae but results from an overlap in spectral response of the eye’s red and green cones (centered at 564 and 534 nm, respectively). The spectral peak in light reflected from dense algal blooms coincides with a critical hinge point in color vision (570–580 nm), where fine-scale shifts in the spectral shape of water-leaving radiance due to algal absorption and backscattering properties lead to pronounced variations in the observed color. Of the taxa considered, only Chlorophytes and Prochlorophytes lacked sufficient accessory pigments to produce a red tide. Chlorophyll fluorescence and enhanced near-infrared reflectance (the ‘‘red edge’’) contribute negligibly to the perceived color. Black water events are produced when water is highly absorbing but lacks backscattering constituents. The first of the 10 plagues of Egypt may be one of the earliest recorded instances of a red tide: ‘‘and all the waters that were in the river turned to blood. And the fish that were in the river died, and the water stank’’ (The Bible, Exodus 7:20–21). Red tides have been known to occur throughout human history; however, human activities and population increases have contributed to a greater abundance of toxic and noxious algal blooms in coastal regions worldwide (Hallegraeff 2003; Glibert et al. 2005). Dense algal blooms are often called red tides because the sea surface becomes discolored red or ruddy brown. In addition, red tide is often used synonymously with harmful algal blooms (HAB), the term used by the scien- tific community to characterize all plankton events that have deleterious impacts. However, not all algal blooms that produce red or brown colored water are toxic. Conversely, not all harmful algal blooms are associated with red-colored waters (Anderson 1994), nor are they tidally driven. Despite these discrepancies, the term red tide has been widely adopted by the popular media and is commonly used to refer to intense algal blooms worldwide. Water color has long been used to define water masses since the introduction of the Forel-Ule color scale in the late 1800s (Hutchinson 1975; Arnone et al. 2004). Color No. 21 on this scale has a reddish-brown hue that could be associated with a red tide event. However, the reason for red coloration of intense algal blooms is often misunder- stood. The Encyclopedia Britannica (2004) describes red tides as ‘‘a discoloration of sea water caused by dino- flagellates (phylum Protozoa) during periodic blooms (or population increases).’’ The underlying assumption is that red tide–forming phytoplankton contain a unique suite of 1 Corresponding author ([email protected]). Acknowledgments We thank Dariusz Stramski for generously providing phyto- plankton absorption and scattering spectra and Grace Chang for permission to use her spectrum and photograph of a natural red tide. Collin Roesler and the anonymous reviewers provided numerous helpful comments that greatly improved this manu- script. Funding was provided by the David and Lucile Packard Foundation, NASA Ocean Biology and Biogeochemistry, Office of Naval Research Environmental Optics, and the NOAA Coastal Technology System (COTS, http://www.csc.noaa.gov/cots) under a partnership with the Center for Integrated Coastal Observation, Research and Education (CICORE) and Center for Integrated Marine Technology (CIMT). Limnol. Oceanogr., 51(6), 2006, 2646–2659 E 2006, by the American Society of Limnology and Oceanography, Inc. 2646

Red and Black tides
Feb 18, 2016
Red and Black tides
Welcome message from author
This document is posted to help you gain knowledge. Please leave a comment to let me know what you think about it! Share it to your friends and learn new things together.
Transcript
Red and black tides: Quantitative analysis of water-leaving radiance and perceived color
for phytoplankton, colored dissolved organic matter, and suspended sediments
Heidi M. Dierssen1
Department of Marine Science, University of Connecticut, 1080 Shennecossett Road, Groton, Connecticut 06340
Raphael M. KudelaOcean Sciences Department, University of California, Santa Cruz, California 95064
John P. RyanMonterey Bay Aquarium Research Institute, 7700 Sandholdt Road, Moss Landing, California 95039
Richard C. ZimmermanDepartment of Ocean, Earth, and Atmospheric Sciences, 4600 Elkhorn Avenue, Old Dominion University, Norfolk,Virginia 23529
Abstract
Using field measurements and quantitative modeling, we demonstrate that red coloration of the sea surface isnot associated with any particular group of phytoplankton and is strongly dependent on the physiology of thehuman visual system. Red or brown surface waters can be produced by high concentrations of most types ofalgae, colored dissolved organic matter, or suspended sediment. Even though light reflected by red tidescommonly peaks in the yellow spectral region (570–580 nm), human color perception requires consideration ofthe entire spectrum of light relative to receptors within the human eye. The color shift from green to red is not dueto any special optical properties of the algae but results from an overlap in spectral response of the eye’s red andgreen cones (centered at 564 and 534 nm, respectively). The spectral peak in light reflected from dense algalblooms coincides with a critical hinge point in color vision (570–580 nm), where fine-scale shifts in the spectralshape of water-leaving radiance due to algal absorption and backscattering properties lead to pronouncedvariations in the observed color. Of the taxa considered, only Chlorophytes and Prochlorophytes lacked sufficientaccessory pigments to produce a red tide. Chlorophyll fluorescence and enhanced near-infrared reflectance (the‘‘red edge’’) contribute negligibly to the perceived color. Black water events are produced when water is highlyabsorbing but lacks backscattering constituents.
The first of the 10 plagues of Egypt may be one of theearliest recorded instances of a red tide: ‘‘and all the watersthat were in the river turned to blood. And the fish thatwere in the river died, and the water stank’’ (The Bible,Exodus 7:20–21). Red tides have been known to occurthroughout human history; however, human activitiesand population increases have contributed to a greaterabundance of toxic and noxious algal blooms in coastalregions worldwide (Hallegraeff 2003; Glibert et al. 2005).
Dense algal blooms are often called red tides becausethe sea surface becomes discolored red or ruddy brown.In addition, red tide is often used synonymously withharmful algal blooms (HAB), the term used by the scien-tific community to characterize all plankton eventsthat have deleterious impacts. However, not all algalblooms that produce red or brown colored water are toxic.Conversely, not all harmful algal blooms are associatedwith red-colored waters (Anderson 1994), nor are theytidally driven. Despite these discrepancies, the term redtide has been widely adopted by the popular media andis commonly used to refer to intense algal bloomsworldwide.
Water color has long been used to define water massessince the introduction of the Forel-Ule color scale in thelate 1800s (Hutchinson 1975; Arnone et al. 2004). ColorNo. 21 on this scale has a reddish-brown hue that could beassociated with a red tide event. However, the reason forred coloration of intense algal blooms is often misunder-stood. The Encyclopedia Britannica (2004) describes redtides as ‘‘a discoloration of sea water caused by dino-flagellates (phylum Protozoa) during periodic blooms (orpopulation increases).’’ The underlying assumption is thatred tide–forming phytoplankton contain a unique suite of
1 Corresponding author ([email protected]).
AcknowledgmentsWe thank Dariusz Stramski for generously providing phyto-
plankton absorption and scattering spectra and Grace Chang forpermission to use her spectrum and photograph of a natural redtide. Collin Roesler and the anonymous reviewers providednumerous helpful comments that greatly improved this manu-script.
Funding was provided by the David and Lucile PackardFoundation, NASA Ocean Biology and Biogeochemistry, Officeof Naval Research Environmental Optics, and the NOAA CoastalTechnology System (COTS, http://www.csc.noaa.gov/cots) undera partnership with the Center for Integrated Coastal Observation,Research and Education (CICORE) and Center for IntegratedMarine Technology (CIMT).
Limnol. Oceanogr., 51(6), 2006, 2646–2659
E 2006, by the American Society of Limnology and Oceanography, Inc.
2646

light-absorbing pigments that make them reddish in color.However, absorption properties of red tide–formingphytoplankton are not generally unique from otherphytoplankton, and hence reddish pigments cannot solelybe responsible for the color of red tides (Millie et al. 1997;Schofield et al. 1999; Roesler et al. 2003). In addition topigmentation, algal scattering, particularly backscattering,is influenced by the cell size and potential growth phase ofthe phytoplankton (McLeroy-Etheridge and Roesler un-publ. data) and is an important optical property de-termining the magnitude and spectral shape of theemergent light field.
A comprehensive analysis of the optics of red tides hasbeen hampered by the use of radiometers incapable of fullyresolving the visible spectrum (i.e., from 400 to 700 nm).Most in-water optical sensors launched over the last fewdecades measure light in only six or seven visible channelsthat match those measured from most space-borne oceancolor sensors (Yoder 2000). These channels are not evenlyspaced throughout the visible spectrum and are concen-trated in blue and green wavelengths between 412 and555 nm. Consequently, a large spectral gap occurs betweenthe green channel at 555 nm and the red channel around665 nm. Light reflected from red tides commonly peaksfrom 570–580 nm, a part of the visible spectrum that is notgenerally quantified by these multispectral sensors. More-over, the region between 555 and 665 nm is critical foraccurately modeling the color perceived by the human eye.The development of a new class of hyperspectral sensorsthat provide continuous spectral coverage over the entirevisible spectrum (Chang et al. 2004) has allowed us toquantify the spectrum of light incident upon the humaneye.
Following on past research (Morel and Prieur 1977;Carder and Steward 1985; Roesler et al. 2003), we useradiative transfer modeling to estimate the water-leavingradiance from sea surface expressions of different concen-trations and types of phytoplankton, colored dissolvedorganic matter (CDOM), and minerals. The color ofthe water perceived by a human eye is estimated foreach spectrum using the color matching functionsdefined by the Commission Internationale de l’Eclairage(CIE 1991). The perceived color assumes that the individualis looking directly down at a relatively calm sea surfacewith no contrasting skylight or sea surface glint. Colorshifts from blue to green to brown and red can bequantitatively modeled from typical absorption and back-scattering properties of phytoplankton, CDOM, and/orminerals.
Methods
Phytoplankton absorption and chlorophyll—Absorptioncoefficients for particulate material were determined usinga Cary 50 dual-beam spectrophotometer. Water samples(25 mL) were filtered onto Whatman GF/F filters. Phyto-plankton (aph) spectra were determined by subtraction ofdetrital absorption (Tassan and Ferrari 1995) fromparticulate absorption and correction for multiple scatter-ing caused by the filter material (Cleveland and Weide-
mann 1993). Published absorption spectra were also used(Stramski et al. 2001). Phytoplankton absorption coeffi-cients were normalized to the corresponding chlorophylla (Chl a) concentration. Chl a was determined fluorome-trically by filtration onto Whatman GF/F filters andextraction in acetone at 220uC for 24–48 h (Smith et al.1981) using pure Chl a (Sigma) as a calibration reference.
Hyperspectral reflectance measurements—Two differentfield methods were employed to measure remote sensingreflectance, Rrs, defined as water-leaving radiance, Lw,normalized to incident irradiance. In-water measurementswere made with hyperspectral radiometers, HyperspectralTethered Spectroradiometer Buoy (HTSRB, Satantic, Inc.)and HyperPro II (Satlantic Inc.). The radiative transfermodel, Hydrolight, was parameterized with coincident ac-9measurements (WET Labs) and relevant ancillary data(e.g., latitude, longitude, day of the year, time) to developsite-specific spectral coefficients from the ratio of modeledwater-leaving radiance and radiance modeled at the depthof the upwelling radiance sensors of the HTSRB andHyperPro radiometers (0.6 and 0.2 m, respectively). Thesecoefficients were applied to the original hyperspectralupwelling radiance measurements to correct for absorptionand scattering processes in the upper layer of water andextrapolate values across the air–sea interface. Above-surface radiances were measured with a Field Spec ProVNIR-NIR1 portable spectrometer system (AnalyticalSpectral Devices) along Monterey Bay and the Californiacoast in conjunction with Center for Integrative CoastalObservation, Research, and Education (CICORE), Cali-fornia State University. Measurements were made with an8u foreoptic focused at a 40–45u angle sequentially on a grayplaque, sea surface, and diffuse sky. Residual reflected skyradiance was removed from the calculated Rrs assumingthat the mean reflectance from 750–800 nm was zero(Mobley 1999).
Reflectance of dense cultures of phytoplankton taxa wasalso measured in the laboratory using the Field Spec ProVNIR-NIR1 portable spectrometer system (AnalyticalSpectral Devices) and integrating sphere attachmentcalibrated for baseline reflectance using a Spectralonplaque. Dense, log-phase cultures of the microalgaeThalassiosira sp., Coccolithophora sp., Porphyridium sp.,and Amphidinium sp. were obtained from Wards NaturalScience, Inc. Cells were captured onto Whatman GF/Ffilters using a gentle vacuum and immediately placed intothe reflectance port of the integrating sphere. Thesemeasurements are relative reflectance spectra and havenot been corrected for filter effects (Balch and Kilpatrick1992).
Modeling water-leaving radiance—The radiative transfermodel Hydrolight was employed to estimate the radianceleaving the water column composed of varying amounts ofphytoplankton (Mobley 1994). Water-leaving radiance, Lw,was modeled assuming dense accumulations of algae at thesea surface (2–50 mg Chl a m23). Optical variability due todepth-dependent layers of algae was not considered here.Inputs to the model included: taxon-specific chlorophyll-
Optics of red and black tides 2647

normalized absorption (see Methods), chlorophyll-specificscattering coefficients (Stramski et al. 2001), and a semi-empirical sky model with a solar zenith angle of 55u,wind speed of 5 m s21, and an infinitely deep water columnthat included Raman scattering and chlorophyll fluores-cence (Mobley 1994). For the average case, a Fournier-Forand particle phase function (Fournier and Forand1994) was used with a particulate backscattering ratio of0.012 (Ulloa et al. 1994). This is within the range ofbackscattering ratios found in oceanic waters throughoutthe world (Twardowski et al. 2001; Sullivan et al. 2005) andwas found to be an average value for achieving opticalclosure with Hydrolight in coastal waters sampled inconjunction with the CICORE program (0.7 to 50 mgChl a m23). In the sensitivity analysis, the particulatebackscattering ratio varied from 0.006 to 0.02. For thephytoplankton simulations, CDOM was set to be pro-portional to Chl a at 440 nm (Mobley 1994), althoughthis is not necessarily the case in more optically complexwaters. The absorption by CDOM in all simulations wasmuch lower than either the absorption by phytoplankton orthat needed to induce a red tide from CDOM alone (seefollowing).
Hydrolight was also used to estimate water-leavingradiance due to increasing amounts of CDOM andminerals, respectively. A single exponential CDOM modelwas used with a spectral slope of 0.015 (Twardowski et al.2004) and soluble absorption coefficients, a �g (412), rangingfrom 0.1 to 15 m21. The model was also run withincreasing amounts of four different types of minerals:brown earth, red clay, yellow clay, and calcareous sand.Mass-specific absorption and scattering coefficients wereobtained from Ahn (1990), as supplied with the Hydrolightmodel (Mobley 1994). The absorption coefficients fallwithin the range of recent measurements from a variety ofmineral particles (Babin and Stramski 2004). A Fournier-Forand particle phase function of 0.025 was used for themineral simulations (Fournier and Forand 1994; Twar-dowski et al. 2001; Sullivan et al. 2005).
Color modeling—The Commission Internationale del’Eclairage (CIE) developed a universally recognizedobjective system of colorimetry whereby the spectraldistribution of light can be used to derive Y, the luminanceor brightness, and two chromaticity parameters, x and y,representing the hue and saturation (Williamson andCummins 1983). This system is based on color matchingfunctions (tristimulus functions) that have been derived forthe average human subject and are considered to bereasonably accurate and reproducible. However, theapparent color is not only a function of the light that fallson the localized region of the retina, but can also depend onthe surrounding field or background colors. Contrastphenomena that can alter the apparent color (e.g., brightsky vs. dark water) are not considered here. We assume thehuman observer is looking directly down at the sea surfacewith no sun glint or bright sky for contrast.
The water-leaving radiance spectra were converted intocolor using the three tristimulus functions for a 10u field ofview (x,y,z) (CIE 1991). The CIE color components were
estimated as the products of the radiance spectrum andthree tristimulus functions integrated over the visiblespectrum (400–700 nm), such that
X ~ Km
ð700
400
Lw lð Þ�xx lð Þdl ð1Þ
Y ~ Km
ð700
400
Lw lð Þ�yy lð Þdl ð2Þ
Z ~ Km
ð700
400
Lw lð Þ�zz lð Þdl ð3Þ
In calculation of the CIE chromaticity coordinates (x, y),
the conversion factor Km cancels out of the equation and
x,yð Þ~ X
X z Y z Zð Þ ,Y
X z Y z Zð Þ
� �ð4Þ
However, the magnitude of Km is important for de-termining the perceived brightness or luminance ofa spectrum and for converting from CIE coordinates intocomputer-based red–green–blue (RGB) coordinates. Todetermine whether the radiance spectrum is too low forhuman vision and the water appears dark or black, Km isset to the maximum luminous efficacy for photopic(daylight) vision of 638 lumen (lm) W21 (Mobley 1994).The water is determined to be black when the calculatedluminance, Y, falls below 3 lm m22 per steradian (sr21),which is the luminance for a twilight sky (Mobley 1994).
To determine the RGB color of a spectrum given itsrelative spectral shape, the conversion factor, Km, must benormalized to the luminance, Y, where
Km ~0:4
Ð700
400
Lw lð Þ�yy lð Þdl
ð5Þ
The empirical factor 0.4 produces colors in the midpoint of
the brightness range for the RGB color system and
adequately simulates seawater color. The CIE X, Y, and
Z values are transformed into RGB primaries using
a matrix transform based on the chromaticity coordinates
and reference white of a standard computer monitor (ITU-
R 2002), such that
R
G
B
264
375~
3:240479 {1:537150 {0:498535
{0:969256 1:875992 0:041556
0:055648 {0:204043 1:057311
264
375|
X
Y
Z
264
375 ð6Þ
The resulting RGB coordinates range from 0 to 1 and
represent the fractional amount of each primary needed to
display a particular color on a computer monitor. Values
calculated to be less than 0 were set to 0 and values greater
2648 Dierssen et al.

than 1 were set to 1. The MATLAB code for determining
the RGB color of a spectrum is posted on the web (Dierssen
2006).
Results and discussion
The role of absorption—Phytoplankton contain pigmentsthat absorb light of different wavelengths. Chlorophyll a,the dominant pigment found in all oxygenic photosyntheticorganisms, absorbs light broadly in the Soret, or blue (400to 470 nm), region and narrowly in the red (660 nm) part ofthe electromagnetic spectrum (Fig. 1A). The green color ofmost plants, therefore, is due to reflected green light that isnot absorbed by Chl a. However, other accessory pigmentsfound in phytoplankton—such as chlorophylls b and c,
phycobiliproteins, and carotenoids—allow organisms toharvest more of the incident blue and green light.Phytoplankton from different taxa generally have uniquesets of accessory pigments that differentiate them from oneanother (Sathyendranath et al. 1987; Cullen et al. 1997).Even so, the overall absorption spectra from many differentphytoplankton taxa are generally not distinguishable(Fig. 1B). Larger phytoplankton tend to have lowerabsorption per mass of Chl a than smaller phytoplanktonbecause of packaging of the pigments within the cells(Bricaud et al. 1995; Ciotti et al. 2002). As noted in Fig. 1B,small cells (e.g., Prochlorophytes) tend to have higherspecific absorption than the larger cells (e.g., Bacillario-phyceae or diatoms). Furthermore, algal absorptionproperties for each taxon will be influenced by the lightenvironment in which it is grown (see Kirk 1994).
Dinoflagellates contain the carotenoid peridinin, whichis considered to be reddish orange in color. The peridinin–chlorophyll–protein (PCP) complex broadens the blueabsorption band from 470 to 555 nm (Fig. 1A). If peridininwere the cause of red tides, then the absorption spectrumfor dinoflagellates containing peridinin should be signifi-cantly different from other phytoplankton taxa and shouldbe shifted much further into the green region of thespectrum. However, absorption spectra from a variety ofdinoflagellates are similar to other types of algae includingdiatoms, Bacillariophyceae (Fig. 1). Additionally, averageabsorption spectra from a variety of taxa show that mostphytoplankton groups have accessory pigments thatbroaden the blue absorption band out to 550 nm (Stramskiet al. 2001). Of the taxa considered, green algae (Chloro-phyceae) absorb the least amount of green light, while redalgae (Rhodophyceae) and Synechococcus absorb the most.
When observed under magnification, individual phyto-plankton cells most frequently appear green, yellowishgreen, or golden in color and are generally not the ruddycolor of red tides. Although accessory pigment concentra-tions can alter the color of individual cells enough to makethem distinctly red or even violet, this is not a necessarycondition for formation of a red tide. The color ofindividual cells does not necessarily represent the color ofthe cells when suspended in a solution or when highlyconcentrated. For example, yellow food coloring canappear orange or red at high concentrations. As quantifiedhere, red tides can be formed from cells that are notthemselves red.
The absorption spectra in Fig. 1 represent averageconditions. Spectral deviations in absorption will beobserved in response to environmental conditions, espe-cially irradiance. Absorption could potentially also deviatefrom the normal when the cells are growing rapidly, as isrequired for an intense algal bloom. However, significantchanges in the shapes of absorption spectra have not beenobserved for most harmful algal species measured duringstationary and exponential growth phases (Harding 1998;McLeroy-Etheridge and Roesler unpubl. data). No specialabsorption properties appear to be associated withphytoplankton known to form red tides, and manydifferent algal taxa have sufficient accessory pigments toproduce red coloration when concentrated.
Fig. 1. (A) Absorption coefficient normalized to Chl a, a �ph,for different species of diatoms, Bacillariophyceae, and dino-flagellates, Dinophyceae. Green dashed line is an absorptionspectrum for Chl a extracted in methanol and red dashed line isfor the peridinin–chlorophyll–protein complex (scaled for figure)to illustrate the absorption due to accessory pigments. (B) Medianabsorption spectra normalized to Chl a for different phytoplank-ton communities (Stramski et al. 2001).
Optics of red and black tides 2649

The role of backscattering—The quantity and spectralquality of light reflected from the sea surface is not relatedjust to the unabsorbed photons in the water column, but isalso proportional to the amount of photons that arescattered in the backward direction out of the water column(i.e., backscattering). The reflectance of light at the seasurface (R) is governed by the ratio of backscattering (bb) toabsorption (a) (Gordon and Morel 1983), such that
R !bb
a z bb
ð7Þ
The amount and type of suspended materials (e.g.,phytoplankton, sediment, minerals, etc.) will determinethe magnitude and spectral shape of particulate backscat-tering (Stramski and Kiefer 1991). Backscattering proper-ties of phytoplankton can vary with cell size, growth rate,and species composition. The phytoplankton taxa consid-ered here have backscattering properties that vary spec-trally (Stramski et al. 2001). As shown in Fig. 2A, smallphytoplankton, like Synechococcus and Prochlorococcus,have enhanced backscattering of blue photons and the
spectral shape is negatively sloping. Larger phytoplanktonhave backscattering spectra that are nearly constant withwavelength or positively sloping (higher in the red). Oursimulations used chlorophyll-normalized particulate back-scattering coefficients (b �p), such that particulate backscat-
tering increased linearly with increasing Chl a. This hasbeen shown both theoretically (Morel 1988; Stramski andKiefer 1991) and experimentally from a large database of insitu backscattering measurements with Chl a concentrationsranging over 100 mg m23 (Sullivan et al. 2005).
In order for the sea surface to appear red, more red lightmust be backscattered out of the water than other colors oflight. The definition of red light is generally considered tobe light at wavelengths greater than 600 nm. Hyperspectralreflectance measurements made of the sea surface duringred tides, however, typically show maximum spectralreflectance at wavelengths less than 600 nm (Fig. 2B;Carder and Steward 1985). Similar spectra are also derivedfrom our modeling efforts (Fig. 2C,D). For many of thephytoplankton taxa considered, including the diatoms anddinoflagellates, our simulations showed a maximum spec-
Fig. 2. (A) Backscattering estimated for phytoplankton concentrations of 30 mg Chl a m23
for each taxon (Stramski et al. 2001), as defined in Fig. 1. (B) Remote sensing reflectance, Rrs,measured from a variety of dinoflagellate red tides along the California coast. Lingulodiniumpolyedra spectrum provided courtesy of G. Chang. (C) Water-leaving radiance, Lw, modeled fordense phytoplankton bloom conditions (30 mg Chl a m23) from a variety of phytoplankton taxa.(D) Data from panel (C) shown as Rrs.
2650 Dierssen et al.

tral peak in both reflectance and water-leaving radiance at570–580 nm, a region of the visible spectrum usuallycharacterized as yellow light (Fig. 2C,D). The width andpeak of the Rrs and Lw spectra, however, do vary by taxa.The spectral peak in reflectance for both Rhodophyceae andSynechococcus are shifted further into the red near 600 nm,while the spectrum for Chlorophyceae is less peaked andcentered at 550 nm. A lesser peak in reflectance caused bysolar-stimulated chlorophyll fluorescence is visible at683 nm (Smith and Baker 1978), but this peak is generallylower in magnitude than the primary peak and notinfluential to the color perceived by the human eye (seefollowing). Extremely dense algal blooms (.100 mg Chla m23) can peak at or beyond 600 nm (Roesler and Boss2003), but this is not required for the water to appear red.Color perception, however, involves more than just the peakspectral reflectance and requires consideration of the entirespectrum of light relative to receptors within the human eye.
The role of human color vision—Understanding theperception of sea surface color requires a consideration ofthe physiological characteristics of the human eye. Humanvision involves three different cone receptors and a fourthtype of photoreceptor cell referred to as a rod. Rods areeffective only in low light levels (referred to as night vision)and are not important for interpreting sea surface color.The three cone receptors in the eye, referred to as long-,middle-, and short-wavelength cones, are responsible forour color vision (Fig. 3). Each cone contains uniquepigments that respond to a different range of visiblewavelengths (Williamson and Cummins 1983). These conesare sometimes called red, green, and blue cones, althoughthe red wavelength cone response is actually centered in theyellow region of the visible spectrum. The red cone pigmentevolved 30–40 million years ago by a minor mutation in the
green cone pigment that shifted the absorption peak about30 nm to the red and is absent in individuals who are red/green colorblind (Livingstone 2002). The color perceived bythe human visual system depends on the total light orradiance incident upon each type of cone and thecomparative response (i.e., contrast) between the threecone classes.
When phytoplankton become densely concentrated atthe sea surface, blue/blue-green light is absorbed propor-tionally to the amount of Chl a (Fig. 4A), and the reflectedlight or water-leaving radiance incrementally shifts tolonger wavelengths (Fig. 4B). Absorption by water risessteeply beyond 570 nm (Smith and Baker 1981; Pope andFry 1997) and results in a maximum Lw peak between 570and 600 nm. In addition, increasing phytoplankton con-centrations typically result in increased Lw from 550 to700 nm due to enhanced backscattering (Fig. 4B). Whennormalized to the peak radiance (Fig. 4C), changes in theshape of the radiance spectra are evident with increasingChl a. The radiance distribution appears relatively similarin peak width as Chl a increases from 10 to 50 mg m23,but the entire spectrum swings like a bell toward the redas more blue light is absorbed and more red light isbackscattered.
Perceived color was modeled from water-leaving radi-ance spectra using an empirically derived color coordinatesystem (CIE 1991). When the color is a red hue, the totallight absorbed by the eye’s red cones is greater than thatabsorbed by the green and blue cones. Brown colorationcan be considered a dull red and occurs when all threecones are stimulated, but with the greatest activation of thered cones. We modeled water-leaving radiance as a functionof average absorption and backscattering properties forincreasing concentrations of different phytoplankton taxaconcentrated at the sea surface. As phytoplankton con-centrations increased, more blue/green light was absorbedand more red light was backscattered out of the water.Perceived color progressed from blue, to green, and finallyto red or red/brown for the majority of phytoplankton taxa(Fig. 5A). These results are also represented on a chroma-ticity diagram (Kelly 1943) for three representative taxa:Chlorophyceae, Bacillariophyceae, and Rhodophyceae(Fig. 5B). The x, y coordinates represent the fraction ofthe spectra intercepted by the red and green cones,respectively, and the residual from unity is the fractionintercepted by the blue cones (z). For example, light at520 nm is represented by 10% red (x), 80% green (y), andby derivation 10% blue (z). Of the phytoplanktonconsidered, only Prochlorococcus and certain species ofChlorophyceae (Cunaliella bioculata) did not produce redor brown coloration at high concentrations.
At a modeled threshold concentration near 15 mg Chla m23 for most phytoplankton taxa, the eye’s red cones(centered at 564 nm) are activated more than the greencones (centered at 534 nm) and the water appears reddishbrown. This shift in color is not due to any specialabsorption or backscattering properties of the algae but isdue to the human visual system. The peak in the water-leaving radiance spectra from dense algal blooms coincideswith a critical visual hinge point where the green and red
Fig. 3. Response of the three cone classes (short, middle, andlong) in the human eye to different wavelengths of light (scaled tothe same range, Livingstone 2002). The bottom color spectrumindicates the color associated with individual wavelengths of light.The gray bars represent the wavelengths used by the ModerateResolution Imaging Spectroradiometer (MODIS) oceancolor sensor.
Optics of red and black tides 2651

cones are nearly equally stimulated (570 nm). Subtlespectral changes in Lw about this critical hinge pointproduce large shifts in the observed color from green to red.
Sensitivity analysis—To address uncertainties in ourmodeling assumptions, we conducted a sensitivity analysisvarying the particulate backscattering and absorptionproperties of the water, as well as the incident light field.These simulations used the total upward radiance from thesea surface (Lu), which includes water-leaving radiance (Lw)plus the downwelling irradiance reflected off the seasurface. The simulations for scenario 1 used a fixedabsorption coefficient (Dinophyceae) at 30 mg m23
(Fig. 6A) and variable particulate backscattering ratiosranging from 0.6% to 2% (Fig. 6B). The resulting Lu wascharacterized by a distinct peak at 570 nm regardless of thebackscattering spectrum used in the model (Fig. 6C). Thisis because peak reflectance is largely determined by thecombined absorption properties of pure water and phyto-plankton. In addition, Lu spectra increase monotonicallywith increasing backscattering (Fig. 6C). When normalizedto peak Lu, however, all cases had nearly identical spectralshapes resulting in a similar greenish-brown color(Fig. 6D). Changes in the magnitude of backscattering,without corresponding changes to the spectral shape ofbackscattering, will alter the perceived brightness orluminance of the water, but these changes have littleimpact on the color.
In scenario 2, three different backscattering spectra wereused to illustrate how subtle variations in the radiancespectra about the 570 nm hinge point produce largechanges in the perceived color of the sea surface(Fig. 6E–H). As shown in Fig. 6F, backscattering spectralshapes varied from (1) negatively sloped backscattering(greater in the blue than the red), (2) spectrally flatbackscattering, and (3) positively sloped backscattering(greater in the red than the blue). The positively slopedsimulation had the highest backscattering from 500 to700 nm and resulted in the largest Lu peak (Fig. 6G). Thethree cases also produced significant differences in thespectral shape of Lu that resulted in widely differing colors.Even though the peak reflectance was the same for allcases, negatively sloped backscattering enhanced the bluereflectance and resulted in a greenish hue. In contrast,positively sloped backscattering enhanced red reflectanceand resulted in a reddish-brown hue.
These results were not duplicated, however, in scenario 3where green algae (Chlorophyceae) were the predominantphytoplankton (Fig. 6I–L). Lacking sufficient green-ab-sorbing accessory pigments (Fig. 6I), these phytoplanktonproduced a broad and rounder radiance peak spanning theentire 500–600 nm region. Distinct spectral shapes were
Fig. 4. (A) Particulate absorption coefficient for a diatomshowing the increase in absorption with increasing concentration.The wavelength at which absorption due to phytoplankton andthat due to pure water (Pope and Fry 1997) intersect representsthe minimum in absorption and the maximum or peak reflectance.(B) Spectral variability in water-leaving radiance (Lw) modeled for
r
a diatom bloom with increasing Chl a concentrations (2, 5, 10, 15,20, 30, 40, 50 mg m23). Dotted line shows the peak wavelengths.(C) Spectra from panel (B) normalized to peak water-leavingradiance. The corresponding color associated with each spectrumis shown in the results for Bacillariophyceae in Fig. 5A.
2652 Dierssen et al.

observed with the different backscattering shapes, but theresulting sea surface color was a similar shade of green forall simulations (Fig. 6L).
Scenario 4 explored variations in the incoming down-welling irradiance field on perceived water color (Fig. 6M–
P). The simulations covered a range of solar zenith angles(SZA) from nearly overhead (10u) to nearly at the horizon(80u). The highest Lu occurred when the sun was nearlyoverhead (SZA 10u) because of the greater amount of lightreaching the sea surface (Fig. 6O; note axis is four times
Fig. 5. (A) Color of the sea surface as a function of surface biomass concentration (Chla used as a proxy) for different phytoplankton taxa. Color was modeled from water-leavingradiance using the CIE color matching functions and mean absorption and backscatteringproperties for each taxa. (B) The chromaticity coordinates for a selection of three algal taxa areshown on a CIE chromaticity diagram (Kelly 1943) as Chl a increases from 2 mg m23 (lower leftpoints) to 50 mg m23 (upper right points). For clarity, the color of each symbol corresponds tothe color presented for that algal group in panel (A).
Optics of red and black tides 2653
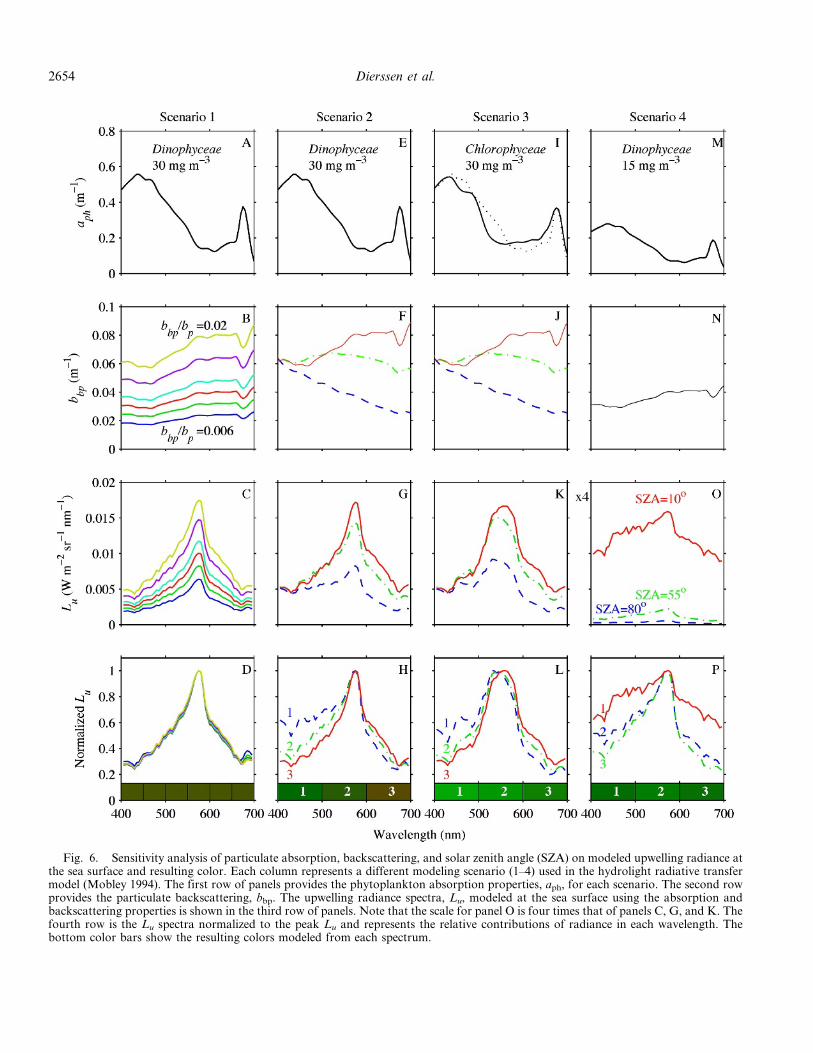
Fig. 6. Sensitivity analysis of particulate absorption, backscattering, and solar zenith angle (SZA) on modeled upwelling radiance atthe sea surface and resulting color. Each column represents a different modeling scenario (1–4) used in the hydrolight radiative transfermodel (Mobley 1994). The first row of panels provides the phytoplankton absorption properties, aph, for each scenario. The second rowprovides the particulate backscattering, bbp. The upwelling radiance spectra, Lu, modeled at the sea surface using the absorption andbackscattering properties is shown in the third row of panels. Note that the scale for panel O is four times that of panels C, G, and K. Thefourth row is the Lu spectra normalized to the peak Lu and represents the relative contributions of radiance in each wavelength. Thebottom color bars show the resulting colors modeled from each spectrum.
2654 Dierssen et al.

higher than the other plots). When normalized to peakradiance, the case with 10u SZA showed elevated radianceacross the whole spectrum (both the blue and redwavelengths). This is largely due to reflected skylight,which represents photons that are scattered by the seasurface without penetrating the water column. The result-ing spectral whitening produced more luminance but didnot significantly change the perceived color of the water(Fig. 6P).
Thus, the production of reddish water requires phyto-plankton with sufficient accessory pigments to shift theradiance spectrum toward the critical visual hinge point(570 nm). Simply amplifying the amount of backscattering,without changing the spectral backscattering shape orsimultaneously increasing absorption, does not change thespectral shape of Lu or the resulting color of the water.Phytoplankton with higher backscattering in the redproduce brown/red–colored water at lower overall phyto-plankton concentrations than those that backscatter moreblue photons. A low sun angle can produce a moreluminous spectrum because of reflected photons but is notresponsible for brown/red–colored water. In general, algalabsorption properties determine whether dense concentra-tions of a particular phytoplankton group can potentiallycause red-colored water, but taxon-specific backscatteringproperties can influence the amount of phytoplanktonnecessary to produce red coloration.
Fluorescence and the red edge—Measured reflectancespectra from a variety of dinoflagellate red tides showa prominent secondary peak in the far-red region of thespectrum (Fig. 2A). At first glance, these peaks appear tobe associated with chlorophyll fluorescence, an importantpathway for the dissipation of light energy (Smith andBaker 1978). However, the peak wavelengths are notalways centered at the chlorophyll fluorescence peak of683 nm but can be shifted further into the near infrared(NIR) (.700 nm). For example, the reflectance spectrumfrom the dinoflagellate L. polyedra (Fig. 2A) has a peak at710 nm. This is not from fluorescence alone, but appears tobe caused by what the terrestrial remote sensing communitycalls the red edge.
Terrestrial vegetation and submerged macrophytes (seagrasses and seaweeds) exhibit strong reflectance in the NIRportion of the spectrum (700–1,600 nm, Hall 1994). ThisNIR reflectance is commonly attributed to scattering fromcell and leaf structures (cell walls and membranes,organelles, air spaces, etc.) and forms the basis of theterrestrial biomass parameter normalized difference vege-tation index (NDVI, Hall 1994). However, plant cellstructures are capable of scattering visible, as well asNIR, radiation. In fact, reflectance from unpigmentedwhite leaves lacks a red edge because light is reflectedsimilarly across both the visible and NIR portions of thespectrum (Gitelson and Merzlyak 1994; Zimmermanunpubl. data). Thus, photosynthetic pigments produce thered edge signature by absorbing visible, but not NIR,radiation. NIR reflectance is generally ignored for dilutesuspensions of microscopic phytoplankton because waterstrongly absorbs these photons. For most natural popula-
tions of phytoplankton, the peak reflectance observed inthe far-red region can be assigned to fluorescence.However, pigmented microalgae also reflect NIR light withmuch higher efficiency than visible light (Fig. 7). For densesuspensions of algal cells at the sea surface (i.e., red tides),the infrared reflectance signal can be strong enough that itis not fully attenuated by the water, producing peaks in thereflectance spectra that are red-shifted relative to thoseproduced by chlorophyll fluorescence (Vasilkov andKopelevich 1982; Gitelson 1992).
While it is an important feature of red tide spectra,enhanced reflectance due to fluorescence and the red edgehas little impact on the perceived color of the sea surface.The response of the human red cone, which is tuned to564 nm, is very low at wavelengths greater than 650 nm(Fig. 3). Light at longer red wavelengths can be perceivedwhen it originates from a concentrated source (i.e., a laser),but the low levels produced by chlorophyll fluorescence orred edge reflectance are simply not perceptible under mostnatural light conditions. Thus, the perceived sea surfacecolor modeled for different phytoplankton (Fig. 5) did notchange when reflectance greater than 650 nm was excludedfrom the analysis and is largely independent of chlorophyllfluorescence and the red edge. Enhanced radiance in theNIR is not important for color vision but has significantimplications for understanding algal backscattering, forunderstanding atmospheric correction of remotely sensedimagery, and for developing new methods for remotesensing of red tides.
Red and black tides caused by CDOM and sediments—Our modeling indicates that optical properties of manydifferent phytoplankton taxa can produce red coloration ifcells are sufficiently concentrated at the sea surface. A red
Fig. 7. Relative reflectance of unicellular algal culturescaptured onto GF/F filters increases strongly from 680 to710 nm, producing a red edge typical of photosynthetic tissues.The reflectance spectrum from a terrestrial aspen leaf (Hall et al.1991) is shown for comparison. Spectra are normalized toreflectance at 800 nm and do not contain a solar-stimulatedfluorescence peak centered at 683 nm.
Optics of red and black tides 2655

coloration can also result from nearly any constituent thatis a blue/green absorber provided enough light is back-scattered out of the water column. CDOM is a commoncomponent of coastal water that absorbs light in the blueregion of the spectrum (Fig. 8A; Kirk 1976). The CDOMabsorption spectrum decreases exponentially from blue tored. Suspended sediments also absorb light predominantlyin the blue region of the spectrum (Fig. 8A), but thespectral shape depends on the suite of minerals present(Morel and Prieur 1977; Ahn 1990; Babin and Stramski2004). Unlike CDOM, minerals have a large refractiveindex and high backscattering coefficients (Fig. 8B).Minerals suspended in water can produce reflectancespectra that are several orders of magnitude greater thanwater with CDOM, or even phytoplankton, alone. Asoriginally noted by Morel and Prieur (1977) in their earlydelineation of Case 2 waters, waters dominated bysediments and CDOM have flatter and broader reflectancespectra from 600 to 650 nm (Fig. 8C,D) compared to waterwith dense phytoplankton concentrations. This is becausethe absorption coefficient for these constituents mono-tonically decreases with increasing wavelength, unlike
phytoplankton pigments, which absorb both blue and redlight.
Here, we modeled sea surface color as a function ofincreasing CDOM and suspended sediments or minerals(Fig. 9). Because CDOM does not scatter light, waters thatare highly concentrated in CDOM alone are so dark thatthey appear black in color (Acker and Kempler 2004;Fig. 9A). An example of a black river that has high CDOMconcentrations can be found in the Rio Negro, Brazil(Fig. 9C). Black water can also occur during intensephytoplankton blooms that have low backscattering(Carder and Steward 1985; Hu et al. 2004). Highconcentrations of CDOM will produce a red/browncoloration of the sea surface, however, when suspendedmaterials that can scatter light out of the water column arealso present in the water. Optically shallow water systemswith a highly reflective bottom can also appear red/brownin the presence of high CDOM concentrations (Fig. 9D).Such high CDOM concentrations are seldom observed inthe open ocean but are most likely to be found in estuarinewaters where the terrestrial sources of CDOM are greatest(Kirk 1976; Twardowski et al. 2004).
Fig. 8. (A) Mass-specific particulate absorption coefficients and (B) scattering coefficientsfor various mineral types (Ahn 1990). (C) Remote sensing reflectance spectra, Rrs, and (D) water-leaving radiance spectra, Lw, modeled using the optical properties for a mineral concentration of20 g m23. Absorption and reflectance spectra for waters dominated by colored dissolved organicmatter (CDOM) are shown for comparison (scaled to fit).
2656 Dierssen et al.

Waters with high mineral content (.10–15 g m23) alsoproduced red or brown colored water (Fig. 9B). Fromthe limited set of minerals considered here, brown earthand red clay have the greatest absorption coefficientper mass and created red-colored water. Yellow clay andcalcareous sand absorbed less of the blue/green lightand produced a brownish hue when concentrated. Miner-al particles with significant amounts of iron absorbmore of the blue-green light (Babin and Stramski 2004)and would create even redder coloration at lower concen-trations.
Remote detection of red tides—The radiance spectramodeled for water dominated by surface layers of different
phytoplankton, CDOM, and minerals have unique spectralsignatures that may allow us to discriminate theseconstituents remotely from satellites or aircraft. As shownin Fig. 2C, high concentrations of cryptophytes can resultin a double peaked reflectance spectrum. Dense concentra-tions of red algae produce an asymmetric spectral peak thatis shifted toward the red region of the spectrum. Greenalgae are distinguished by a broad spectral maximumcentered at 540 nm. Unfortunately, the two most commonred tide–forming phytoplankton in the coastal ocean,dinoflagellates and diatoms (Sournia 1995), have similarabsorption characteristics and will be the most difficult todifferentiate based solely on optical signatures (Schofield etal. 1999; Roesler et al. 2003). Waters dominated by CDOM
Fig. 9. Color of the sea surface as a function of increasing concentrations of (A) coloreddissolved organic matter (CDOM), shown as absorption at 412 nm, and CDOM with theaddition of nonabsorbing backscattering matter, and (B) four different types of minerals. (C)Satellite image of the confluence of the black waters of the Rio Negro in the north and thesediment-laden Rio Solimoes to the southeast in Manuas, Brazil. Multi-angle imagingspectroradiometer (MISR) image obtained from the NASA Goddard Earth Sciences Data andInformation Services Center Web site (Acker and Kempler 2004). (D) Photo showing the watercolor of a shallow inlet in Western Australia containing high CDOM concentrations (courtesy ofG. Chang). White kayak paddle is shown for perspective.
Optics of red and black tides 2657

and sediments produce broader reflectance spectra com-pared to phytoplankton-dominated waters.
Current space-borne ocean color sensors can view densealgal blooms (Kahru et al. 2004) and sediment plumes buthave limited spectral capabilities. These sensors provide noinformation in the region of the spectrum where red tidespeak and where most of the taxon-specific differences occurin water-leaving radiance (570–610 nm). Several airbornehyperspectral sensors can provide the spectral informationneeded to detect taxon-specific differences from ocean color(Chang et al. 2004; Ryan et al. 2005), and their use will becritical for monitoring red tide formation and remotelydetecting phytoplankton composition in many coastalregions. Enhanced reflectance in the NIR due to fluores-cence and the red edge may also be critical for remotelydetecting surface blooms of algae.
Understanding the nuances of the color produced byincreasing concentrations of different groups of algae orother water column constituents across the whole visibleand NIR spectrum can lead to better remote monitoringand forecasting of dense algal blooms that may haveharmful consequences. By combining hyperspectral imag-ery with a variety of monitoring platforms and parameters,it may be possible to develop probabilistic models of toxicalgal blooms, or ecological algorithms (Schofield et al.1999; Stumpf et al. 2003; Etheridge and Roesler 2004;Babin et al. 2005; Kudela et al. 2005). Future research mayallow us to predict the probability of harmful algal bloomdevelopment, monitor the extent and longevity of thebloom, and forecast the coastal region to be affected by thebloom. Our research shows that the visual identification ofred water is strongly affected by human physiology, inaddition to the absorbing and scattering components ofnatural waters. Moreover, the presence of red water doesnot necessarily indicate a dense or harmful algal bloom, butcan result from various combinations of phytoplankton,CDOM, and minerals.
References
ACKER, J., AND S. KEMPLER. 2004. Oh black waters, keep onrollin’. Science Focus [Internet]. Washington (DC): NationalAeronautics and Space Administration, Available fromhttp://daac.gsfc.nasa.gov/oceancolor/scifocus/oceanColor/black_water.shtml. Accessed 1 May 2005.
AHN, Y. H. 1990. Optical properties of biogenous and numericalparticles in the ocean; application: Inversion of reflectance.Ph.D. thesis, Univ. Pierre et Marie Curie. QC/425/YB/1990 [inFrench].
ANDERSON, D. M. 1994. Red tides. Sci. Am. 271: 52–58.ARNONE, R. A., A. M. WOOD, AND R. W. GOULD. 2004. The
evolution of optical water mass classification. Oceanography17: 14–15.
BABIN, M., AND D. STRAMSKI. 2004. Variations in the mass-specificabsorption coefficient of mineral particles in sea water.Limnol. Oceanogr. 49: 756–767.
———, AND oTHERS. 2005. New approaches and technologiesfor observing harmful algal blooms. Oceanography 18:210–227.
BALCH, W. M., AND K. A. KILPATRICK. 1992. Particulate reflectancemeasurements of phytoplankton. J. Plankton Res. 14: 721–735.
THE BIBLE. Exodus 7: 20–21.
BRICAUD, A., M. BABIN, A. MOREL, AND H. CLAUSTRE. 1995.Variability in the chlorophyll-specific absorption coefficientsof natural phytoplankton: Analysis and parameterization. J.Geophys. Res. 100: 13,321–13,332.
CARDER, K. L., AND R. G. STEWARD. 1985. A remote-sensingreflectance model of a red-tide dinoflagellate off west Florida.Limnol. Oceanogr. 30: 286–298.
CHANG, G., AND oTHERS. 2004. The new age of hyperspectraloceanography. Oceanography 17: 16–23.
[CIE] COMMISSION INTERNATIONALE DE L’ECLAIRAGE. 1991. Colori-metric observers. ISO/CIE 10527.
CIOTTI, A. M., J. J. CULLEN, AND M. R. LEWIS. 2002. Assess-ment of the relationships between dominant cell sizein natural phytoplankton communities and the spectralshape of the absorption coefficient. Limnol. Oceanogr. 47:404–417.
CLEVELAND, J. S., AND A. D. W. WEIDEMANN. 1993. Quantifyingabsorption by aquatic particles: A multiple scatteringcorrection for glass-fiber filters. Limnol. Oceanogr. 38:1321–1327.
CULLEN, J. J., A. M. CIOTTI, R. F. DAVIS, AND M. R. LEWIS. 1997.Optical detection and assessment of algal blooms. Limnol.Oceanogr. 42: 1223–1239.
DIERSSEN, H. M. 2006. MATLAB code for determining RGBcolors from a radiance spectrum. Available from http://colors.uconn.edu/.
ENCYCLOPEDIA BRITANNICA. 2004. Red tide [Internet]. Encyclope-dia Britannica [accessed 2004 September 10]. Available fromhttp://www.britannica.com/eb/article?tocId59376627.
ETHERIDGE, S., AND C. S. ROESLER. 2004. Temporal variations inphytoplankton, particulate, and colored dissolved organicmaterial based on optical properties during a Long Islandbrown tide compared to an adjacent embayment. HarmfulAlgae 3: 331–342.
FOURNIER, G. R., AND J. L. FORAND. 1994. Analytic phase functionfor ocean water. Ocean Optics VII. Proceedings of theInternational Society for Optical Engineering (SPIE) 2258:194–201.
GITELSON, A. 1992. The peak near 700 nm on radiance spectra ofalgae and water: Relationships of its magnitude and positionwith chlorophyll concentration. Int. J. Remote Sens. 13:3367–3373.
———, AND M. N. MERZLYAK. 1994. Spectral reflectance changesassociated with Autumn senescence of Aesculus hippocasta-num L. and Acer platanoides L. leaves. J. Plant Physiol. 143:286–292.
GLIBERT, P. M., D. M. ANDERSON, P. GENTIEN, E. GRANELI, AND
K. G. SELLNER. 2005. The global, complex phenomena ofharmful algal blooms. Oceanography 18: 136–147.
GORDON, H. R., AND A. Y. MOREL. 1983. Remote assessment ofocean color for interpretation of satellite visible imagery: Areview. Springer-Verlag.
HALL, F. G. 1994. Adaptation of NASA remote sensingtechnology for regional-level analysis of forested ecosystems.In V. A. Sample [ed.], Remote sensing and GIS in ecosystemmanagement. Island Press..
———, D. B. BOTKIN, D. E. STREBEL, K. D. WOODS, AND S. J.GOETZ. 1991. Large-scale patterns of forest succession asdetermined by remote sensing. Ecology 72: 628–640.
HALLEGRAEFF, G. M. 2003. In G. M. Hallegraeff, D. M.Anderson, and A. D. Cembella [eds.], Manual on harmfulmarine microalgae. UNESCO..
HARDING, L. W. 1998. The time-course of photoadaptation tolow-light in Prorocentrum mariae lebouriae (Dinophyceae). J.Phycol. 24: 274–281.
2658 Dierssen et al.

HU, C., F. E. MULLER-KARGER, G. A. VARGO, M. B. NEELY, AND E.JOHNS. 2004. Linkages between coastal runoff and the FloridaKeys ecosystem: A study of a dark plume event. Geophys. Res.Lett. 31, L15307. [doi: 10.1029/2004GL020382].
HUTCHINSON, G. E. 1975. A treatise on limnology. Geography andphysics of lakes. Wiley.
[ITU-R] INTERNATIONAL TELECOMMUNICATION UNION—RADIOCOM-
MUNICATION. 2002. Parameter values for the HDTV* stan-dards for production and international programme exchange,Rec. BT. 709-5. ITU-R.
KAHRU, M., B. G. MITCHELL, A. DIAZ, AND M. MIURA. 2004.MODIS detects a devastating algal bloom in Paracas Bay,Peru. EOS Trans. Am. Geophys. Union 85: 465–472.
KELLY, K. L. 1943. Color designation for lights. J. Opt. Soc. Am.33: 627–632.
KIRK, J. T. O. 1976. Yellow substance (gelbstoff ) and itscontribution to the attenuation of photosynthetically activeradiation in some inland and coastal southeastern Australianwaters. Aus. J. Mar. Freshw. Res. 27: 61–71.
———. 1994. Light and photosynthesis in aquatic ecosystems,2nd ed. Cambridge Univ. Press.
KUDELA, R. M., G. PITCHER, T. PROBYN, F. FIGUERIAS, T. MOITA,AND V. TRAINER. 2005. Harmful algal blooms in coastalupwelling systems. Oceanography 18: 184–197.
LIVINGSTONE, M. 2002. Vision and art: The biology of seeing.Harry N. Abrams.
MILLIE, D. F., O. SCHOFIELD, G. J. KIRKPATRICK, G. JOHNSEN, P.TESTER, AND B. VINYARD. 1997. Detection of harmful algalblooms using photopigments and absorption signatures: Acase study of the Florida red-tide dinoflagellate, Gymnodiniumbreve. Limnol. Oceanogr. 42: 1240–1251.
MOBLEY, C. D. 1994. Light and water: Radiative transfer innatural waters. Academic.
———. 1999. Estimation of the remote sensing reflectance fromabove-surface measurements. Appl. Opt. 38: 7442–7455.
MOREL, A. 1988. Optical modeling of the upper ocean in relationto its biogenous matter content (Case I waters). J. Geophys.Res. 93: 10,749–10,768.
———, AND L. PRIEUR. 1977. Analysis of variations in oceancolor. Limnol. Oceanogr. 22: 709–722.
POPE, R., AND E. FRY. 1997. Absorption spectrum of pure water:2. Integrating cavity measurements. Appl. Opt. 36: 8710–8723.
ROESLER, C. S., AND E. BOSS. 2003. Spectral beam attenuationcoefficient retrieved from ocean color inversion. Geophys.Res. Lett. 30, 1468 [doi: 10.1029/2002GL016185].
———, S. M. ETHERIDGE, AND G. C. PITCHER. 2003. Applicationof an ocean color algal taxa detection model to red tides in theSouthern Benguela. In K. A. Steidinger, J. H. Lansdberg, C.R. Toma and G. A. Vargo [eds.], Proceedings of the XthInternational Conference on Harmful Algae. Florida Fish andWildlife Conservation Commission and IntergovernmentalOceanographic Commission of UNESCO.
RYAN, J., AND oTHERS. 2005. Coastal ocean physics and red tides:An example from Monterey Bay, California. Oceanography18: 246–255.
SATHYENDRANATH, S., L. LAZZARA, AND L. PRIEUR. 1987. Varia-tions in the spectral values of specific absorption ofphytoplankton. Limnol. Oceanogr. 32: 403–415.
SCHOFIELD, O., J. GRYZMSKI, W. P. BISSETT, G. J. KIRKPATRICK, D.F. MILLIE, M. MOLINE, AND C. S. ROESLER. 1999. Opticalmonitoring and forecasting systems for harmful algal blooms:Possibility or pipe dream? J. Phycol. 35: 1477–1496.
SMITH, R. C., AND K. S. BAKER. 1978. Optical classification ofnatural waters. Limnol. Oceanogr. 23: 260–267.
———, AND ———. 1981. Optical properties of the clearestnatural waters. Appl. Opt. 20: 177–184.
———, ———, AND P. DUSTAN. 1981. Fluorometric techniquesfor the measurement of oceanic chlorophyll in the support ofremote sensing. SIO Ref. 81–17. Visibility Laboratory,Scripps Institution of Oceanography, Univ. of California,San Diego.
SOURNIA, A. 1995. Red-tide and toxic marine phytoplankton ofthe world ocean: An inquiry into biodiversity, p. 103–112. InHarmful Algal Blooms, Proceedings of the Sixth InternationalConference on Toxic Marine Phytoplankton, October 1993,Nantes, France. Lavoisier.
STRAMSKI, D., A. BRICAUD, AND A. MOREL. 2001. Modeling theinherent optical properties of the ocean based on the detailedcomposition of the planktonic community. Appl. Opt. 40:2929–2945.
———, AND D. A. KIEFER. 1991. Light scattering by microorgan-isms in the open ocean. Prog. Oceanogr. 28: 343–393.
STUMPF, R. P., AND oTHERS. 2003. Monitoring Karenia brevisblooms in the Gulf of Mexico using satellite ocean colorimagery and other data. Harmful Algae 2: 147–160.
SULLIVAN, J. M., M. S. TWARDOWSKI, P. L. DONAGHAY, AND
S. A. FREEMAN. 2005. Use of optical scattering to discrim-inate particle types in coastal waters. Appl. Opt. 44:1667–1680.
TASSAN, S., AND G. M. FERRARI. 1995. An alternative approach toabsorption measurements of aquatic particles retained onfilters. Limnol. Oceanogr. 40: 1358–1368.
TWARDOWSKI, M. S., E. BOSS, J. B. MACDONALD, W. S. PEGAU, A.H. BARNARD, AND J. R. V. ZANEVELD. 2001. A model forestimating bulk refractive index from the optical backscatter-ing ratio and the implications for understanding particlecomposition in case I and case II waters. J. Geophys. Res.105: 14,129–14,142.
———, ———, J. M. SULLIVAN, AND P. L. DONAGHAY. 2004.Modeling the spectral shape of absorption by chromophoricdissolved organic matter. Mar. Chem. 89: 69–88.
ULLOA, O., S. SATHYENDRANATH, AND T. PLATT. 1994. Effect of theparticle-size distribution on the backscattering ratio inseawater. Appl. Opt. 33: 7070–7077.
VASILKOV, A., AND O. KOPELEVICH. 1982. The reasons of maximumat about 700 nm on radiance spectra of the sea. Oceanology22: 945–950.
WILLIAMSON, S. J., AND H. Z. CUMMINS. 1983. Light and color innature and art. Wiley.
YODER, J. A. 2000. Terra’s view of the sea. Science 288:1978–1980.
Received: 16 August 2005Accepted: 10 May 2006Amended: 12 June 2006
Optics of red and black tides 2659
Related Documents