Resources 2014, 3, 291-318; doi:10.3390/resources3010291 resources ISSN 2079-9276 www.mdpi.com/journal/resources Article Recycling Potentials of Critical Metals-Analyzing Secondary Flows from Selected Applications Till Zimmermann 1,2, * and Stefan Gößling-Reisemann 1,2 1 Department of Technological Design and Development, Faculty of Production Engineering, University of Bremen, Bremen D-28359, Germany; E-Mail: [email protected] 2 ARTEC–Research Center for Sustainability Studies, Bremen D-28359, Germany * Author to whom correspondence should be addressed; E-Mail: [email protected]; Tel./Fax: +49-421-218-64893. Received: 4 January 2014; in revised form: 17 February 2014 / Accepted: 24 February 2014 / Published: 14 March 2014 Abstract: Metal mobilization in general, as well as the number of metals used in products to increase performance and provide sometimes unique functionalities, has increased steadily in the past decades. Materials, such as indium, gallium, platinum group metals (PGM), and rare earths (RE), are used ever more frequently in high-tech applications and their criticality as a function of economic importance and supply risks has been highlighted in various studies. Nevertheless, recycling rates are often below one percent. Against this background, secondary flows of critical metals from three different end-of-life products up to 2020 are modeled and losses along the products’ end-of-life (EOL) chain are identified. Two established applications of PGM and RE–industrial catalysts and thermal barrier coatings–and CIGS photovoltaic cells as a relatively new product have been analyzed. In addition to a quantification of future EOL flows, the analysis showed that a relatively well working recycling system exists for PGM-bearing catalysts, while a complete loss of critical metals occurs for the other applications. The reasons include a lack of economic incentives, technologically caused material dissipation and other technological challenges. Keywords: critical metals; recycling; secondary material flows; material flow analysis; industrial catalysts; CIGS photovoltaic cells; thermal barrier coatings (TBC); industrial ecology OPEN ACCESS

Welcome message from author
This document is posted to help you gain knowledge. Please leave a comment to let me know what you think about it! Share it to your friends and learn new things together.
Transcript
Resources 2014, 3, 291-318; doi:10.3390/resources3010291
resources ISSN 2079-9276
www.mdpi.com/journal/resources
Article
Recycling Potentials of Critical Metals-Analyzing Secondary Flows from Selected Applications
Till Zimmermann 1,2,* and Stefan Gößling-Reisemann 1,2
1 Department of Technological Design and Development, Faculty of Production Engineering,
University of Bremen, Bremen D-28359, Germany; E-Mail: [email protected] 2 ARTEC–Research Center for Sustainability Studies, Bremen D-28359, Germany
* Author to whom correspondence should be addressed; E-Mail: [email protected];
Tel./Fax: +49-421-218-64893.
Received: 4 January 2014; in revised form: 17 February 2014 / Accepted: 24 February 2014 /
Published: 14 March 2014
Abstract: Metal mobilization in general, as well as the number of metals used in products
to increase performance and provide sometimes unique functionalities, has increased steadily
in the past decades. Materials, such as indium, gallium, platinum group metals (PGM), and
rare earths (RE), are used ever more frequently in high-tech applications and their
criticality as a function of economic importance and supply risks has been highlighted in
various studies. Nevertheless, recycling rates are often below one percent. Against this
background, secondary flows of critical metals from three different end-of-life products up
to 2020 are modeled and losses along the products’ end-of-life (EOL) chain are identified.
Two established applications of PGM and RE–industrial catalysts and thermal barrier
coatings–and CIGS photovoltaic cells as a relatively new product have been analyzed. In
addition to a quantification of future EOL flows, the analysis showed that a relatively well
working recycling system exists for PGM-bearing catalysts, while a complete loss of
critical metals occurs for the other applications. The reasons include a lack of economic
incentives, technologically caused material dissipation and other technological challenges.
Keywords: critical metals; recycling; secondary material flows; material flow analysis;
industrial catalysts; CIGS photovoltaic cells; thermal barrier coatings (TBC);
industrial ecology
OPEN ACCESS
Resources 2014, 3 292
1. Introduction
The conservation and considerate use of non-renewable resources is an important element of
sustainability goals and strategies in Germany [1] and the EU [2]. These strategies aim at improving
material efficiency, at substituting scarce resources with more abundant or renewable resources, and at
significantly improving material recycling, which is an essential aspect of a sustainable management of
materials (e.g., [3]).
The issue of material recycling is of particular importance, especially given the fact that global
metals mobilization is significantly increasing [4] and an increasing number of elements from the
periodic table are being used in products [5]. In various products, especially the so-called critical
metals, provide a variety of new functionalities, increase efficiency of established applications, or
enable miniaturization of products.
The issue of material criticality as the combination of a materials economic importance and its
supply risks has already been discussed frequently (see e.g., [4,6]) and various criticality assessments
have been carried out (e.g., [7–9]) for varying technological scopes and geographic areas, including the
EU [10] and Germany [11]. An outline of the criticality assessment used in this study is given in the
supplementary information. Metals, such as indium, gallium, germanium, platinum group metals
(PGM), and rare earths (RE), are commonly among the materials labeled as critical. With the PGM as
an exception, these critical metals share the same insufficiencies in their products’ life cycles: a high
scale of dissipative losses along the life cycle [12] and barely any recycling at end-of-life [13].
Against this background, this article discusses several aspects of the situation described. First, three
exemplary applications of critical metals are analyzed regarding the amounts of critical metals embodied
in end-of-life products in 2020, with a regional focus on Germany. Knowledge about these stocks and
flows is crucial for a development towards sustainable materials management. It is required for
building up a recycling infrastructure to avoid the materials’ dissipation, as well as for urban mining
activities. Then, for the three applications, the end-of-life chains in Germany are explored, identifying
magnitude and location of material losses.
In addition to two established applications of PGM and RE–industrial catalysts and thermal barrier
coatings, that have so far received only little attention in material flow analysis (MFA) and related
studies, copper-indium-gallium-(di)selenide (CIGS) photovoltaic cells have been analyzed as a relatively
new product, i.e., with currently no significant recycling activities.
2. Description of Methods
2.1. Modeling of End-of-Life Flows
To quantify the amounts of critical metals from the assessed end-of-life products, a product-centric
approach has been chosen. The study focuses on Germany and the time horizon is 2020.
The applied approach as shown in Figure 1 focuses on the use phase and is determined by mainly
three parameters: the amount of products entering the use phase per year (P), the concentration of
critical metals per product (c), and the probability distribution for time spent in the use phase (V(t)),
also called lifespan distribution. Additionally, exports from the use phase (E) have been considered but
did not show any relevance for the three assessed products. Based on these parameters the amount of

Resources 2014, 3 293
secondary materials embodied in EOL products (A) has been determined. Details on the parameters for
each product are given in the respective sections.
Figure 1. Modeling approach and system boundaries.
As the analysis as well as the analyzed system is dynamic, the time spent in the use phase is a
particularly important parameter. As highlighted by Murakami [14], various differing definitions of
lifespan are used in science and literature. In this study, lifespan is understood as the time span from
entering the use phase to leaving the use phase. This complies with the “domestic service lifespan”
described by Murakami [14]. Instead of using average values, a life span probability distribution is
used in the model. From the many plausible distributions functions, the Weibull distribution has been
chosen as most suitable. The suitability of the Weibull distribution function for modeling product
lifespans has been described in multiple studies (e.g., [15–18]). Examples for using the Weibull
distribution to model end-of-life material flows are still very limited but can for example be found
in [19] for wind energy converters or in [20,21], and [22], for photovoltaic cells.
The Weibull probability density function (WPDF) can be defined as: ( , λ, ) = λ (λ ) (λ ) (1)
where t is the time in years and k and λ are the shape and scale parameters, respectively. V(t, λ, k) is
then the probability that a product has a lifespan of t years. Further details on the application of the
Weibull function and related functions are given elsewhere (e.g., [15,23–27]) and will not be explained
in detail here.
For a given point in time T (e.g., the year 2020), the amount ( )of end-of-life products is
dependent on the amounts of products being sold in the past and their respective lifespan distribution.
Here, we assume that the lifespan distribution does not change with time. Since the sales data is only
available per full year, the amount of sold products and the amount of metals in end-of-life products
can only be calculated on a per-year basis. With exports showing no particular relevance for the
analyzed products (i.e., E = 0) the amount of strategic metals in end-of-life products in year T can be
calculated from P, V and c as follows:

Resources 2014, 3 294
( ) = ∑ ( − ) ( ), , ,… (2)
with
( ) = ( ) = (λ( )) − (λ ) (3)
( ) is, thus, the cumulated probability that a product has a lifespan between ( − 1) and
years. Equation (2) represents a delay model (cf. [14]), and time series of past P flows are required for
the calculation of A(t). Regarding the metal concentration c and the average lifespan, which is needed
to specify the Weibull Function, it has to be noted that they are in fact dynamic parameters which vary
over time. This fact could not be accounted for in the modeling approach due to data availability and
reliability. Even though there was some data available referring to different years, this did not allow
any conclusions on the development of metal concentration and average lifespan over time. To account
for this, ranges have been used in the model where appropriate. Regarding the shape parameter k of the
WPDF different references as described in Sections 3.1.3 and 3.2.3 have been used.
2.2. Analysis of Material Losses along Recycling/End-of-Life Chain
For the analysis of the material losses along the end-of-life chain, the idealized end-of-life chain
comprising collection, sorting, pre-processing, and the final step of metal recovery is analyzed (see
Figure 2). Similar approaches for the analysis of the efficiency of end-of-life chains can for example be
found in [28–32]. Depending on the characteristics of the respective products, steps of the EOL chain
are sometimes aggregated to streamline the analysis.
Figure 2. Idealized end-of-life chain.
While for some of the analyzed metals (i.e., indium, gallium, and rare earth metals) it is well known
that EOL recycling rates are below one percent, the chosen approach provides additional information
about where the losses occur and what the aim of potential measures should be.
Collection Sorting Pre-processing Metal recovery
Material losses
Material losses
Resources 2014, 3 295
3. Exemplary Product Analyses
3.1. Thermal Barrier Coatings
Thermal barrier coatings (TBC) are used in stationary gas turbines and aircraft engines to isolate
turbine components from the hot gas stream whose temperatures can go up to 1400 °C [33–35].
Commonly, yttria stabilized zirconia (YSZ) is used in these applications. While the purpose of TBC in
stationary gas turbines and aircraft engines is practically identical, the two applications differ in
parameters, such as thickness and service life of the coating, as well as yttrium concentration.
3.1.1. Metal Concentration
The amount of yttrium in the TBC per final product (i.e., per megawatt for stationary gas
turbines and per engine for aircrafts) has been analyzed by literature research and consultation of
experts. Based on this and additional information from experts, the amount of strategic metal in the
final product is determined.
For stationary gas turbines the majority of data indicates an Y2O3 content of 7–8 wt% that has also
been confirmed by manufacturers [34–45]. The density of YSZ is about 6 g/cm3. Layer thickness
varies between 0.4 mm and 1.5 mm with an average of about 0.85 mm, the coated surface area ranges
from 0.16 to 0.53 m2/MW (average 0.29 m2/MW) [42,46].
Based on this, a specific yttrium concentration of 71 to 165 g per megawatt has been determined. An
average value of 118 gram per megawatt is used in the baseline scenario.
For aircraft engines, the Y2O3 content varies between 7 and 8 mol-% (about 13.7 wt%) [47–51].
The thickness of the coating is in the range of 50 and 250 µm (average 150 µm) [46,51–54]. Due to
limited data availability, the density of YSZ has been assumed to be about 6 g/cm3 analogously to the
YSZ used in stationary gas turbines. The size of the coated surface per engine can range from about 3
to 8 m2. Based on this and additional literature and expert information [41,47,51,55], the yttrium
amount per engine can be estimated to be 411 to 959 g. Further details are given in the supplementary
information (see Tables S1 and S2). For the baseline scenario a specific concentration of 685 g per
engine is used.
3.1.2. Products Placed on the Market and Lifespan
In both analyzed applications TBC are only part of a component of the actual product (central and
decentral power plants and aircrafts or their turbines, respectively). The amount of TBC placed on the
market is assessed based on the stock (-development) of the main products. It is composed of products
newly put on the market and replacements within the stock. The former parameter can be determined
based on the amount of (main) products newly put on the market per year using the specific metal
concentration described above. For the latter, we distinguished between the stock in 2012 and TBC
added to the stock through newly installed gas turbines (or aircrafts put into operation, respectively)
from 2013 on. For the stock of TBC in 2012, due to lack of data, the replacements in the following
years have been modeled assuming a simultaneous exit (SE) function and a homogeneous age
distribution within the stock of TBC in 2012. For new installations from 2012 on, replacements have

Resources 2014, 3 296
been modeled assuming a Weibull distribution, i.e., the flows into use are calculated using the
following equation:
= ( 2012 − )+ ( ℎ ℎ 2012)+ ( ℎ 2012)
SE-function
P(t)*c
Weibull
(4)
Regarding stationary gas turbines, one has to distinguish between smaller decentralized
industrial applications and bigger power plants. For the latter, the lifespan of the TBC is estimated to
be four years, while for decentralized turbines five years are assumed (based on data and information
from [35,37,38,40,41,46,56–61]).
Data regarding the historic and future stock development of gas turbines has been taken from
statistics and technology forecasts [62–65] and is compiled in Table 1 including the resulting amount
of yttrium for the years 2012 to 2020.
Table 1. Yttrium flows into use-stationary gas turbines.
Year Installed
capacity–decentralized gas turbines [MW]
Resulting Y flows into use [kg]
(baseline scenario)
Installed capacity–centralized power plants [MW]
Resulting Y flows into use [kg]
(baseline scenario)
2006 7,480 – 17,760 – 2007 – – 18,317 – 2008 – – 19,761 – 2009 – – 20,469 – 2010 8,200 – 20,916 – 2011 8,500 – 23,302 – 2012 8,800 238 24,796 812 2013 9,100 242 25,077 713 2014 9,400 248 25,997 820 2015 9,700 254 26,530 802 2016 10,000 261 26,530 760 2017 10,300 268 29,030 1,067 2018 10,600 275 29,630 874 2019 10,900 283 30,830 666 2020 11,200 290 30,830 837
When it comes to TBC in aircraft engines, the geographic focus on Germany is not strictly
applicable. Therefore, to analyze the amount of products placed on the market we have focused on
German airlines (Lufthansa German Airlines, Air Berlin, German wings, TUI fly and Condor Flugdienst).
Stock and planned expansion of their aircraft fleets have been taken into account [66–73]. The lifespan
of the coating differs between short- and mid-/long-distance planes. While both have an equal average
number of flight hours per year of about 4000 h, due to the higher numbers of take-offs and landings,
short-distance planes have a higher frequency of service intervals. Hence for short-distance planes a
lifetime of the coating of about 2.25 years and for mid-/long-distance planes of about 5.5 years was
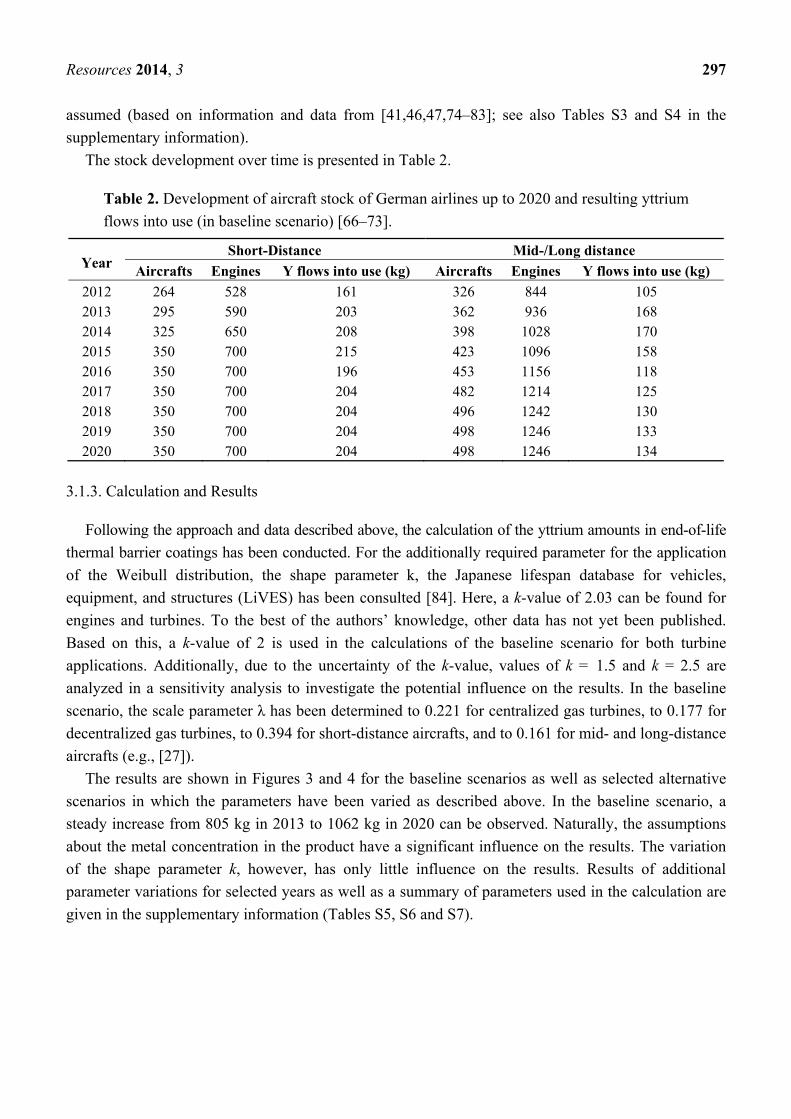
Resources 2014, 3 297
assumed (based on information and data from [41,46,47,74–83]; see also Tables S3 and S4 in the
supplementary information).
The stock development over time is presented in Table 2.
Table 2. Development of aircraft stock of German airlines up to 2020 and resulting yttrium
flows into use (in baseline scenario) [66–73].
Year Short-Distance Mid-/Long distance
Aircrafts Engines Y flows into use (kg) Aircrafts Engines Y flows into use (kg)
2012 264 528 161 326 844 105 2013 295 590 203 362 936 168 2014 325 650 208 398 1028 170 2015 350 700 215 423 1096 158 2016 350 700 196 453 1156 118 2017 350 700 204 482 1214 125 2018 350 700 204 496 1242 130 2019 350 700 204 498 1246 133 2020 350 700 204 498 1246 134
3.1.3. Calculation and Results
Following the approach and data described above, the calculation of the yttrium amounts in end-of-life
thermal barrier coatings has been conducted. For the additionally required parameter for the application
of the Weibull distribution, the shape parameter k, the Japanese lifespan database for vehicles,
equipment, and structures (LiVES) has been consulted [84]. Here, a k-value of 2.03 can be found for
engines and turbines. To the best of the authors’ knowledge, other data has not yet been published.
Based on this, a k-value of 2 is used in the calculations of the baseline scenario for both turbine
applications. Additionally, due to the uncertainty of the k-value, values of k = 1.5 and k = 2.5 are
analyzed in a sensitivity analysis to investigate the potential influence on the results. In the baseline
scenario, the scale parameter λ has been determined to 0.221 for centralized gas turbines, to 0.177 for
decentralized gas turbines, to 0.394 for short-distance aircrafts, and to 0.161 for mid- and long-distance
aircrafts (e.g., [27]).
The results are shown in Figures 3 and 4 for the baseline scenarios as well as selected alternative
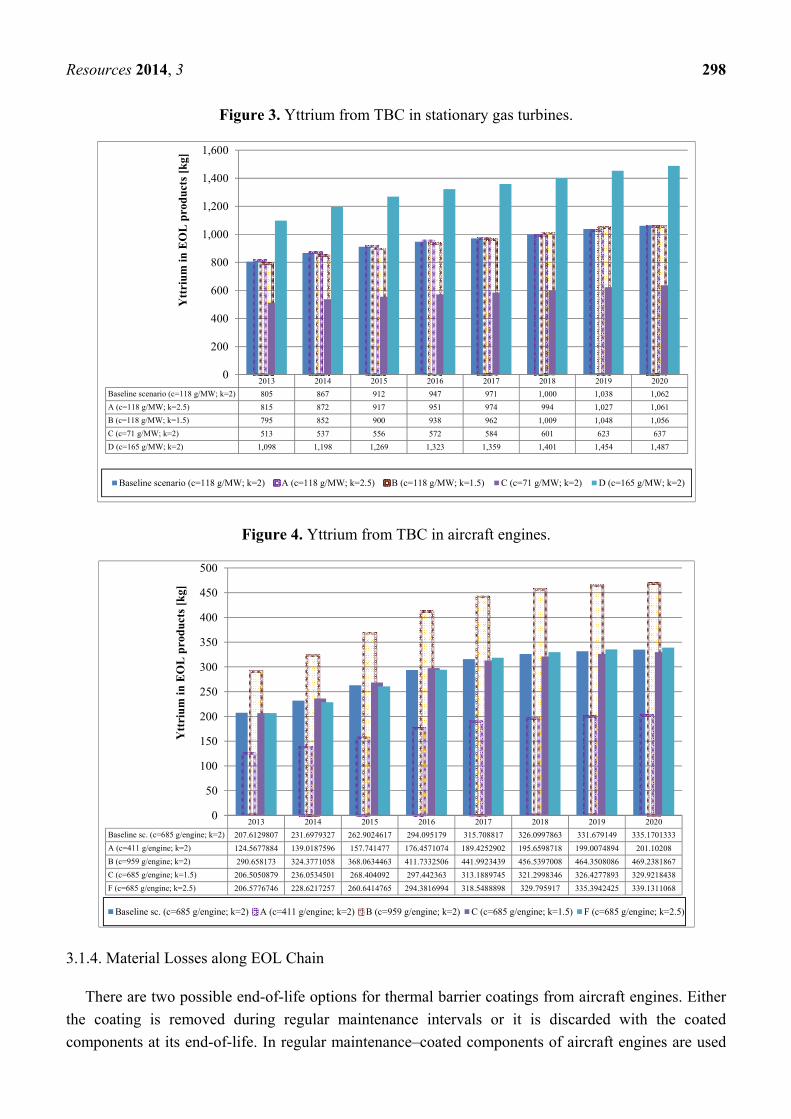
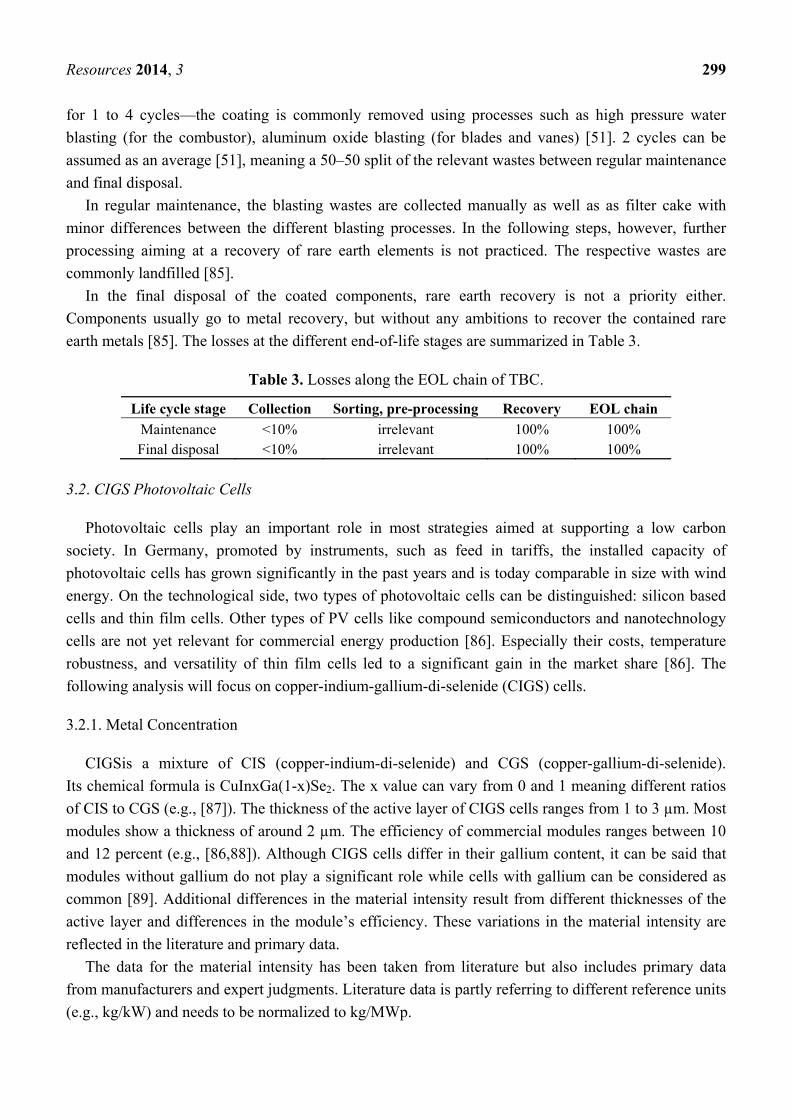
scenarios in which the parameters have been varied as described above. In the baseline scenario, a
steady increase from 805 kg in 2013 to 1062 kg in 2020 can be observed. Naturally, the assumptions
about the metal concentration in the product have a significant influence on the results. The variation
of the shape parameter k, however, has only little influence on the results. Results of additional
parameter variations for selected years as well as a summary of parameters used in the calculation are
given in the supplementary information (Tables S5, S6 and S7).
Resources 2014, 3 298
Figure 3. Yttrium from TBC in stationary gas turbines.
Figure 4. Yttrium from TBC in aircraft engines.
3.1.4. Material Losses along EOL Chain
There are two possible end-of-life options for thermal barrier coatings from aircraft engines. Either
the coating is removed during regular maintenance intervals or it is discarded with the coated
components at its end-of-life. In regular maintenance–coated components of aircraft engines are used
2013 2014 2015 2016 2017 2018 2019 2020
Baseline scenario (c=118 g/MW; k=2) 805 867 912 947 971 1,000 1,038 1,062
A (c=118 g/MW; k=2.5) 815 872 917 951 974 994 1,027 1,061
B (c=118 g/MW; k=1.5) 795 852 900 938 962 1,009 1,048 1,056
C (c=71 g/MW; k=2) 513 537 556 572 584 601 623 637
D (c=165 g/MW; k=2) 1,098 1,198 1,269 1,323 1,359 1,401 1,454 1,487
0
200
400
600
800
1,000
1,200
1,400
1,600
Ytt
riu
m in
EO
L p
rod
uct
s [k
g]
Baseline scenario (c=118 g/MW; k=2) A (c=118 g/MW; k=2.5) B (c=118 g/MW; k=1.5) C (c=71 g/MW; k=2) D (c=165 g/MW; k=2)
2013 2014 2015 2016 2017 2018 2019 2020
Baseline sc. (c=685 g/engine; k=2) 207.6129807 231.6979327 262.9024617 294.095179 315.708817 326.0997863 331.679149 335.1701333
A (c=411 g/engine; k=2) 124.5677884 139.0187596 157.741477 176.4571074 189.4252902 195.6598718 199.0074894 201.10208
B (c=959 g/engine; k=2) 290.658173 324.3771058 368.0634463 411.7332506 441.9923439 456.5397008 464.3508086 469.2381867
C (c=685 g/engine; k=1.5) 206.5050879 236.0534501 268.404092 297.442363 313.1889745 321.2998346 326.4277893 329.9218438
F (c=685 g/engine; k=2.5) 206.5776746 228.6217257 260.6414765 294.3816994 318.5488898 329.795917 335.3942425 339.1311068
0
50
100
150
200
250
300
350
400
450
500
Ytt
riu
m in
EO
L p
rod
ucts
[k
g]
Baseline sc. (c=685 g/engine; k=2) A (c=411 g/engine; k=2) B (c=959 g/engine; k=2) C (c=685 g/engine; k=1.5) F (c=685 g/engine; k=2.5)
Resources 2014, 3 299
for 1 to 4 cycles—the coating is commonly removed using processes such as high pressure water
blasting (for the combustor), aluminum oxide blasting (for blades and vanes) [51]. 2 cycles can be
assumed as an average [51], meaning a 50–50 split of the relevant wastes between regular maintenance
and final disposal.
In regular maintenance, the blasting wastes are collected manually as well as as filter cake with
minor differences between the different blasting processes. In the following steps, however, further
processing aiming at a recovery of rare earth elements is not practiced. The respective wastes are
commonly landfilled [85].
In the final disposal of the coated components, rare earth recovery is not a priority either.
Components usually go to metal recovery, but without any ambitions to recover the contained rare
earth metals [85]. The losses at the different end-of-life stages are summarized in Table 3.
Table 3. Losses along the EOL chain of TBC.
Life cycle stage Collection Sorting, pre-processing Recovery EOL chain
Maintenance <10% irrelevant 100% 100% Final disposal <10% irrelevant 100% 100%
3.2. CIGS Photovoltaic Cells
Photovoltaic cells play an important role in most strategies aimed at supporting a low carbon
society. In Germany, promoted by instruments, such as feed in tariffs, the installed capacity of
photovoltaic cells has grown significantly in the past years and is today comparable in size with wind
energy. On the technological side, two types of photovoltaic cells can be distinguished: silicon based
cells and thin film cells. Other types of PV cells like compound semiconductors and nanotechnology
cells are not yet relevant for commercial energy production [86]. Especially their costs, temperature
robustness, and versatility of thin film cells led to a significant gain in the market share [86]. The
following analysis will focus on copper-indium-gallium-di-selenide (CIGS) cells.
3.2.1. Metal Concentration
CIGSis a mixture of CIS (copper-indium-di-selenide) and CGS (copper-gallium-di-selenide).
Its chemical formula is CuInxGa(1-x)Se2. The x value can vary from 0 and 1 meaning different ratios
of CIS to CGS (e.g., [87]). The thickness of the active layer of CIGS cells ranges from 1 to 3 µm. Most
modules show a thickness of around 2 µm. The efficiency of commercial modules ranges between 10
and 12 percent (e.g., [86,88]). Although CIGS cells differ in their gallium content, it can be said that
modules without gallium do not play a significant role while cells with gallium can be considered as
common [89]. Additional differences in the material intensity result from different thicknesses of the
active layer and differences in the module’s efficiency. These variations in the material intensity are
reflected in the literature and primary data.
The data for the material intensity has been taken from literature but also includes primary data
from manufacturers and expert judgments. Literature data is partly referring to different reference units
(e.g., kg/kW) and needs to be normalized to kg/MWp.
Resources 2014, 3 300
In addition to literature data [21,22,88–96] primary data from two manufacturers (a German and a
Japanese manufacturer) could be obtained and expert judgments (from “Helmholtz-Zentrum Berlin für
Materialien und Energie GmbH” and “German Solar Industry Association–BSW Solar”) for
complementing and validating the collected data have been included. Original data, excluded data and
harmonized data as well as details on how the data have been harmonized and compiled are given in
the supplementary information (see Tables S8 and S9). The resulting compiled data is presented in
Table 4.
Table 4. Material intensity of copper-indium-gallium-di-selenide (CIGS) photovoltaic
cells. Data from literature, experts, and manufacturers.
Metal Material intensity (kg/MW)
Lower bound Mean value–baseline scenario Upper bound
Indium 9.8 16.5 23.1 Gallium 2.3 11.0 19.7
The relatively great spread in the data could not be explained by its age, technological development,
trends, or other factors, but is supposed to be caused by differences in the design between different
producers, such as a variation in the gallium-indium ratio as described above.
3.2.2. Products Placed on the Market
CIGS photovoltaic cells are a relatively young technology and thus empiric data on the service life
span of the modules is rare. Commonly, a lifespan of between 20 and 30 years is assumed for all kinds
of photovoltaic cells (e.g., [22,96–103]). In addition, in some studies it is indicated that the lifespan of
thin film modules is more than 25 years [96,104].
In some of the few studies dealing with life span observations of PV-modules lifespans
of 29.6 years [105], 27.7, and 28 years [106] are reported.
Against this background, a lifespan of 25 years is assumed in the baseline scenario and a lifespan of
30 years is analyzed in a sensitivity analysis.
The amount of products placed on the market is available from statistics [107] and forecasts [108]
providing information about photovoltaic installations in general. For the shares of the different
photovoltaic technologies data from [109] and [92] has been used.
Based on this, CIGS installations and resulting metal flows could be determined as shown in
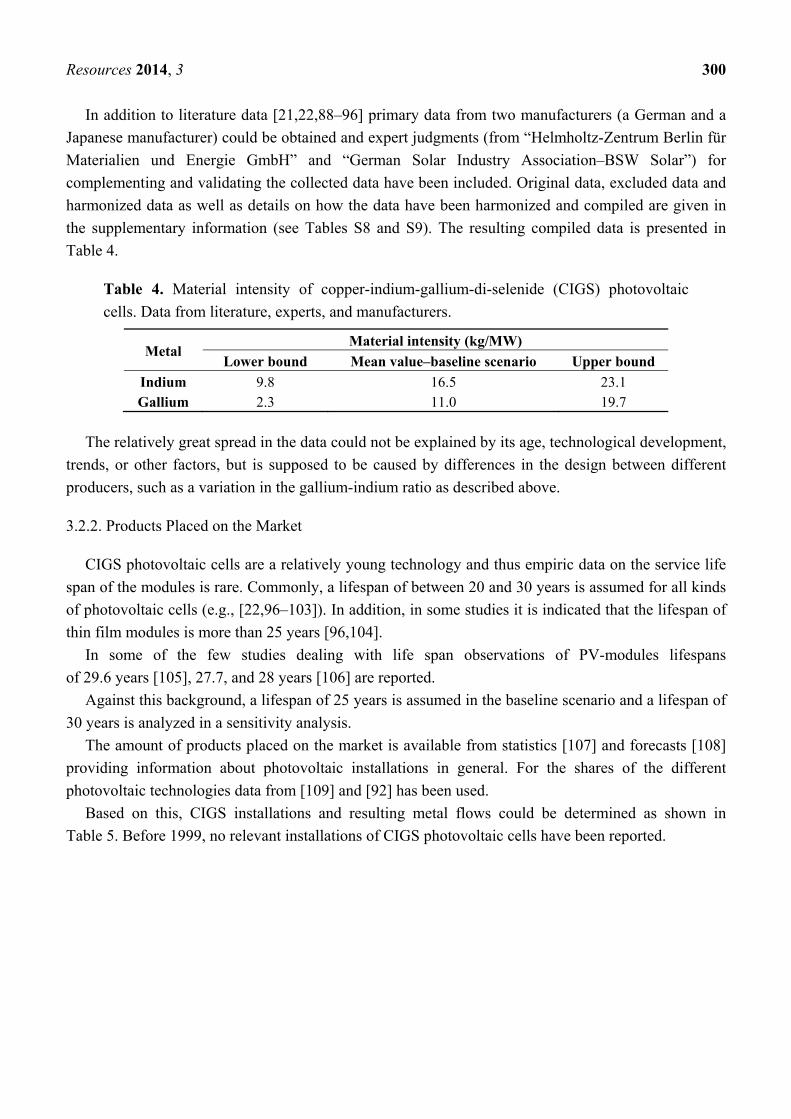
Table 5. Before 1999, no relevant installations of CIGS photovoltaic cells have been reported.
Resources 2014, 3 301
Table 5. CIGS installations and metal flows into use.
Year CIGS
installations (MW)
Metal flows into use (kg)–baseline
scenario Year
CIGS installations
(MW)
Metal flows into use (kg)–baseline
scenario
In Ga In Ga
1999 0.009 0.15 0.10 2010 111.8 1844.83 1229.89 2000 0.066 1.09 0.73 2011 179.6 2964.06 1976.04 2001 0.22 3.63 2.42 2012 101.6 1677.06 1118.04 2002 0.22 3.63 2.42 2013 101.2 1670.04 1113.36 2003 0.83 13.76 9.17 2014 104.5 1724.26 1149.51 2004 2.7 44.22 29.48 2015 110.2 1817.49 1211.66 2005 1.9 31.38 20.92 2016 115.7 1908.71 1272.47 2006 1.7 27.82 18.55 2017 123.9 2043.95 1362.64 2007 6.4 104.86 69.91 2018 132.4 2184.62 1456.41 2008 19.5 321.75 214.50 2019 141.1 2327.34 1551.56 2009 75.6 1247.10 831.40 2020 149.6 2467.58 1645.05
3.2.3. Calculation and Results
Based on the approach and parameters described above, the flows of indium and gallium in
end-of-life CIGS modules have been calculated.
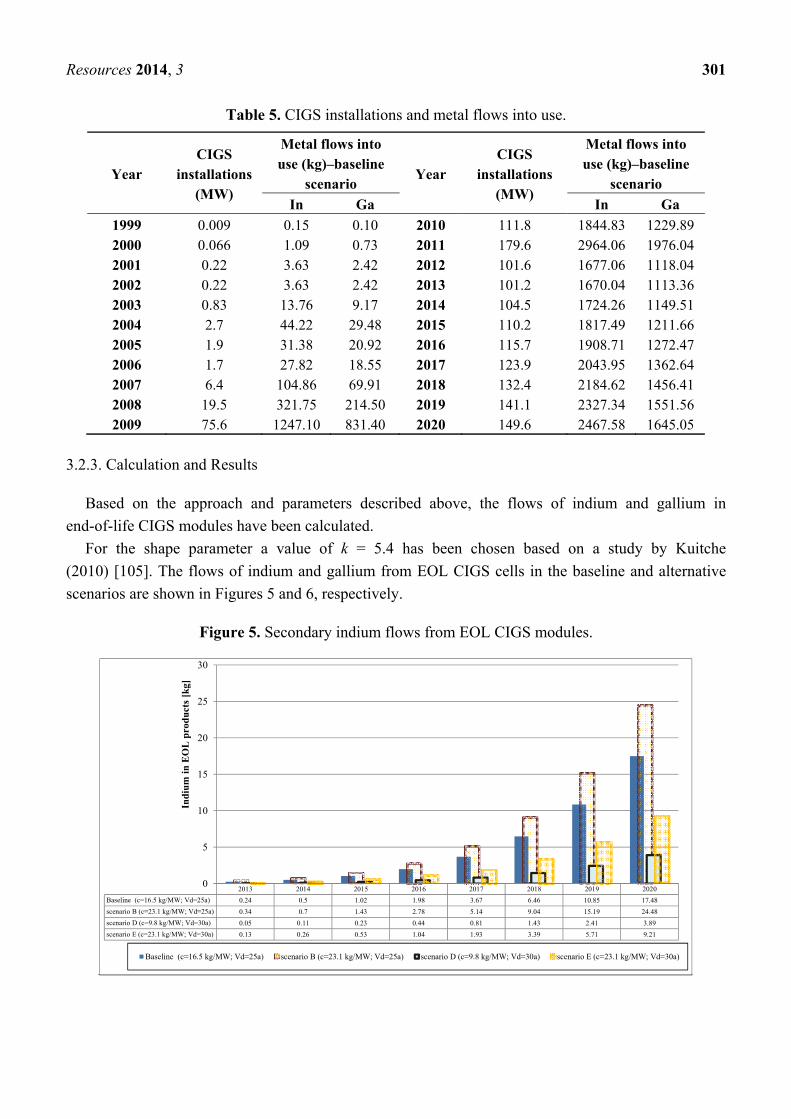
For the shape parameter a value of k = 5.4 has been chosen based on a study by Kuitche
(2010) [105]. The flows of indium and gallium from EOL CIGS cells in the baseline and alternative
scenarios are shown in Figures 5 and 6, respectively.
Figure 5. Secondary indium flows from EOL CIGS modules.
2013 2014 2015 2016 2017 2018 2019 2020
Baseline (c=16.5 kg/MW; Vd=25a) 0.24 0.5 1.02 1.98 3.67 6.46 10.85 17.48
scenario B (c=23.1 kg/MW; Vd=25a) 0.34 0.7 1.43 2.78 5.14 9.04 15.19 24.48
scenario D (c=9.8 kg/MW; Vd=30a) 0.05 0.11 0.23 0.44 0.81 1.43 2.41 3.89
scenario E (c=23.1 kg/MW; Vd=30a) 0.13 0.26 0.53 1.04 1.93 3.39 5.71 9.21
0
5
10
15
20
25
30
Indi
um i
n E
OL
pro
duc
ts [
kg]
Baseline (c=16.5 kg/MW; Vd=25a) scenario B (c=23.1 kg/MW; Vd=25a) scenario D (c=9.8 kg/MW; Vd=30a) scenario E (c=23.1 kg/MW; Vd=30a)

Resources 2014, 3 302
Figure 6. Secondary gallium flows from EOL CIGS modules.
3.2.4. Material Losses along EOL Chain
On 14 August, 2013, the new WEEE (Waste Electrical and Electronic Equipment) directive became
effective. Until February 2014 it needs to be adapted to national laws, e.g., in Germany through an
adaption of the ElektroG. How exactly this adaptation will look and what implications it will bring for
photovoltaic cells remains to be seen. A quota for the collection of 85% of the total amount of waste
modules is being discussed [110]. Apart from that, it has to be noted that there are already different
systems for the taking-back and recycling of photovoltaic modules, e.g., PV cycle, the E-Bell recycling
system or the First Solar recycling system (see [111–114]) providing an infrastructure that makes a
high collection rate of EOL PV modules likely. Against this background, a collection rate of at least
85% can be assumed which is also in accordance with similar studies [115].
In the following steps–sorting, processing, and recycling–there is so far only very little experience
regarding the treatment of thin-film modules and the little amounts of thin-film modules do not allow
for an economical feasible recovery of semiconductor materials. Nevertheless, higher amounts can be
expected soon and different recycling processes are currently being developed by different German
companies, such as Loser Chemie, Solarcycle, Lobbe, and Saperatec [111,113,116–118]. Recovery
rates for indium and gallium in the different processes can be quantified to 70% to 90% [119].
The material losses along the end-of-life chain of CIGS photovoltaic cells can be summed up as
shown in Table 6. The table shows the present situation (no recycling of semiconductor materials) as
well as an outlook based on processes currently under development on how the future EOL situation
might look like.
Table 6. Material losses along the end-of-life (EOL) chain of CIGS photovoltaic cells.
Scenario Collection Sorting, pre-processing, recovery EOL chain
Today <15% 100% In, Ga 100% In Outlook <15% 10%–30% In, Ga 24%–41% In, Ga
2013 2014 2015 2016 2017 2018 2019 2020
Baseline scenario (c=11 kg/MW; Vd=25a) 0.16 0.33 0.68 1.32 2.45 4.31 7.23 11.66
scenario B (c=19.7 kg/MW; Vd=25a) 0.29 0.6 1.21 2.36 4.38 7.7 12.94 20.85
scenario D (c=2.3 kg/MW; Vd=30a) 0.03 0.07 0.14 0.28 0.52 0.92 1.54 2.48
scenario E (c=19.7 kg/MW; Vd=30a) 0.13 0.26 0.53 1.04 1.93 3.39 5.71 9.21
0
5
10
15
20
25
Gal
liu
m in
EO
L p
rodu
cts
[kg]
Baseline scenario (c=11 kg/MW; Vd=25a) scenario B (c=19.7 kg/MW; Vd=25a) scenario D (c=2.3 kg/MW; Vd=30a) scenario E (c=19.7 kg/MW; Vd=30a)
Resources 2014, 3 303
3.3. Industrial Catalysts
Catalysts are of great importance in various industries where they are a key factor for production
efficiency. In the chemical industry over 90% of all products are produced using catalysts [120,121].
The industrial fields of application of catalysts can be divided into polymerization, pollution
control/environment protection, and chemical industry [121]. From a material point of view, another
distinction can be made between PGM, rare earth and germanium bearing catalysts. The following
analysis will follow this distinction and PGM-, rare earth- and germanium bearing catalysts will be
analyzed in separate sections.
Contrary to the other analyzed applications, catalysts have a relatively short lifespan of often
below one year. Because of that, the application of the Weibull distribution is not feasible for
catalysts. Instead, the amount of products placed on the market can function as a proxy for the amount
of end-of-life products and metals, respectively. In addition, it has to be noted that in most fields of
applications the amount of catalysts placed on the market is constant over time disregarding minor
annual fluctuation.
3.4. PGM Bearing Catalysts
For PGM bearing catalysts (and other PGM applications in Germany) a detailed study
has been published by Hagelüken and colleagues [122]. Additional information was available
from [32,120,122–125]. From these studies, information about material flows including secondary
material flows was already available as well as forecasts about the future development up to 2020.
Therefore parameters such as the metal concentration and the amount of products placed on the market
did not need to be investigated further.
3.4.1. Calculation and Results
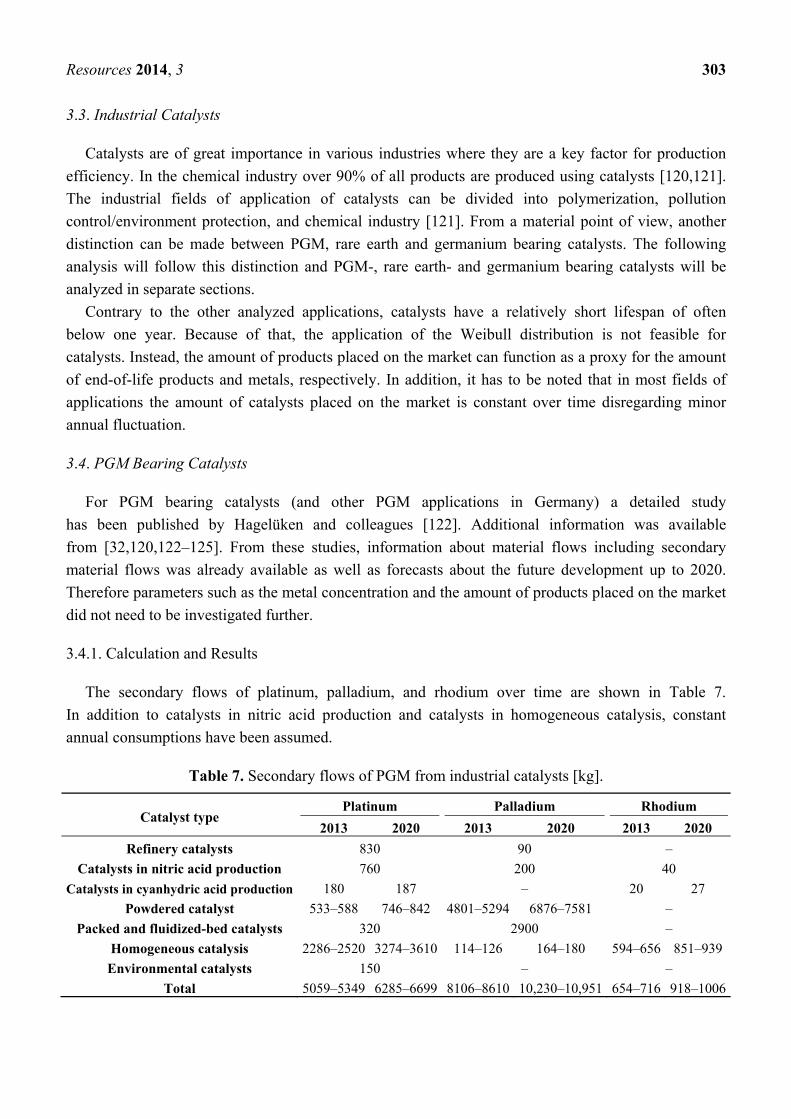
The secondary flows of platinum, palladium, and rhodium over time are shown in Table 7.
In addition to catalysts in nitric acid production and catalysts in homogeneous catalysis, constant
annual consumptions have been assumed.
Table 7. Secondary flows of PGM from industrial catalysts [kg].
Catalyst type Platinum Palladium Rhodium
2013 2020 2013 2020 2013 2020
Refinery catalysts 830 90 –
Catalysts in nitric acid production 760 200 40
Catalysts in cyanhydric acid production 180 187 – 20 27
Powdered catalyst 533–588 746–842 4801–5294 6876–7581 –
Packed and fluidized-bed catalysts 320 2900 –
Homogeneous catalysis 2286–2520 3274–3610 114–126 164–180 594–656 851–939
Environmental catalysts 150 – –
Total 5059–5349 6285–6699 8106–8610 10,230–10,951 654–716 918–1006

Resources 2014, 3 304
3.4.2. Material Losses along EOL Chain
Generally, a rather well-functioning recycling system for industrial catalysts exists; high recovery
rates of platinum group metals from PGM bearing industrial catalysts are achieved (e.g., [123,126,127]).
This well-working system has existed for some time now and already in 2001 generally low losses of
precious metals in the end-of-life treatment of industrial catalysts have been identified [120]. In a
subsequent study in 2003 the European recycling infrastructure for the recycling of precious metals
from industrial catalysts was found to be functioning and sufficient [125].
A summary of the losses in the end-of-life treatment of different catalyst types along the end-of-life
chain is shown in Table 8. Losses are generally below five percent, environmental catalysts being one
exception of minor relevance in terms of mass. Reasons for this well-working recycling system are
described in detail in [123]. The high concentration of PGM in the catalysts compared to its concentration
in ore, its economic value, the availability of suitable processes and well-functioning co-operations
between users and manufacturers/recyclers can be named as the main reasons.
Table 8. Losses of critical metals along EOL chain of PGM bearing catalysts (calculated
based on data from [123]).
Catalyst type Collection and
sorting Pre-processing and recovery
EOL chain
Refinery catalysts irrelevant 1.5% (Pt und Pd) 1.5% Cat. in nitric acid production irrelevant irrelevant irrelevant
Cat. in cyanhydric acid production irrelevant irrelevant irrelevant Chemical industry: powdered catalyst
irrelevant 2% 2%
Chemical industry: packed and fluidized-bed catalysts
irrelevant irrelevant <4.5%
Chemical industry: homogeneous catalysis
Irrelevant for Pt, Rh 48% Pd
3.3% Pt; 4.4% Rh; 3.8% Pd
3.3% Pt; 4.4% Rh; 50% Pd
Environmental catalysts 80%–90% <10% 82%–91%
3.5. Rare Earth Bearing Catalysts
In petroleum refining, catalysts bearing cerium and lanthanum are used for fluid-catalytic-cracking
(FCC) [90,120,128,129]. Cerium and lanthanum increase the gasoline yield and reduce air emissions
from the oil refining process [91].
3.5.1. Metal Concentration
The rare earth element mainly used in FCC catalysts is lanthanum; cerium is of minor
importance [91]. Data regarding the metal content in the catalyst is to a large extent in the same region
and ranges from 2 to 6 mass percent [91,128,130–134] with the vast majority of values between 2
and 3 mass percent.
Based on this, a rare earth content of 2.5 wt% is assumed for the baseline scenario; values
of 2 and 3 wt% are assessed in a sensitivity analysis.

Resources 2014, 3 305
Additionally, it has to be noted that in fluid catalytic cracking there are no special requirements
regarding the purity of the rare earths and up to 20% other rare earth elements like cerium,
neodymium, praseodymium, and samarium can be added [135].
3.5.2. Products Placed on the Market and Lifespan
Statistical or other data on the consumption of FCC catalysts in Germany has not been available.
Therefore, the catalyst consumption has been estimated based on the production output of FCC-processes.
Germany has a FCC capacity of about 350,000 barrels-per-day. Catalysts are replaced continuously
and about 0.2 lb (about 91 g) catalysts are consumed per barrel [90,131]. In the past years, the capacity
utilization of refineries in Germany varied between 78 and 95% [136], but general trends towards an
increase or decrease of the total capacity and capacity utilization cannot be identified. Therefore, the
average capacity utilization rate of the years 1990 to 2012 of 81.3% is used as baseline scenario for the
years 2013 to 2020 [137]; in addition 78% and 95% values are assessed in a sensitivity analysis.
3.5.3. Calculations and Results
Based on the parameters described above the annual amounts of rare earths in FCC-catalysts
reaching their end-of-life have been calculated. The results are shown in Table 9. For the baseline
scenario, an amount of 235 tons has been calculated. Considering possible deviations of the metal
concentration and the capacity utilization the results can vary from 181 to 330 tons.
Table 9. Rare earths in EOL FCC catalysts.
Rare earths in EOL FCC catalysts, 2013 to 2020 (t)
Capacity utilization rate 81.3% 78% 95%
Metal concentration
2.5% 235 226 275 2% 188 181 220 3% 282 271 330
3.5.3. Material Losses along End-of-Life Chain
Contrary to PGM in industrial catalysts, rare earths from FCC catalysts are commonly not
recovered [132]. After their collection they are usually landfilled, or, due to the material properties of
the substrate, used as filling material in the construction industry or cement production [120,128,132].
Based on this, a complete loss of critical metals along the end-of-life chain can be assumed as shown
in Table 10.
Table 10. Losses of critical metals along EOL chain of FCC catalysts.
Application Collection, sorting Pre-processing and recovery EOL chain
FCC-catalysts <10% (RE*) 100% (RE*) 100% (RE*)
*La, Ce, Nd, Pr, Sm

Resources 2014, 3 306
3.6. Ge Bearing Catalysts
In PET production, GeO2 is used as polymerization catalyst. PET manufactured using GeO2
catalysts is mainly used for drink bottles and shows particularly good properties in terms of brightness
and shine [128]. Antimony and titanium are alternative catalysts in PET manufacturing and account for
the majority of the market, i.e., about 90% of all PET is produced using antimony catalysts [138,139];
while titanium and germanium account for the balance.
In PET manufacturing, GeO2 from polymerization catalysts dissipates completely into the product
and is not recovered [120,125,128,140]. Therefore, the potential secondary flows are not quantified
based on the number of polymerization catalysts but on the number of PET bottles placed on the market.
3.6.1. Metal Concentration
The germanium content in GeO2 catalysts is about 69%. As mentioned above, the catalyst dissipates
entirely into the product. Data regarding the GeO2 concentration ranges from 1:10,000 [125] to
1:100,000 to 7:100,000 [128] or 10 to 70 mg/kg, respectively. As it is more up-to-date, the
OakdeneHollins data (1:100,000 to 7:100,000 with an average of 1:25,000) is used in the following.
In combination with data on the weight of PET bottles of different sizes [141,142] a specific GeO2
concentration per 1l-bottles can be calculated. Assuming an average GeO2 concentration in the PET of
1:25,000, the specific concentration is 0.88 to 1.22 mg/1l-bottle for one-way, and 2.48 to 2.83 mg/1l-bottle
for returnable bottles.
3.6.2. Products Placed on the Market
The amount of products placed on the market, i.e., the number of PET bottles on the market, is
analyzed based on the beverage consumption [143] and statistics regarding the shares of different types
of packaging [141,143,144] (see supplementary information for further details; Tables S10, S11 and
S12). The statistics show that the beverage consumption remained relatively constant for the majority
of beverages and no significant changes in the total beverage consumption are expected for the future.
Following this, the average beverage consumption of the years 2004 to 2009 has been used for
calculating the baseline scenario. Additionally, fluctuations of ±10% have been analyzed in a
sensitivity analysis. Regarding the share of different packaging types, different scenarios regarding the
future development have been analyzed (see Table 11).
Table 11. Share of PET bottles for different beverage types.
Beverage type Year Returnable PET bottles One-way PET Bottles
Beer and shandy 2010–2020 – 6%/7%/8% Water 2010–2020 15%/20% 50%/56.1%/70%
Soft drinks 2010–2020 15%/25% 50%/60.5%/70%
3.6.3. Calculation and Results
As stated above, constant beverage consumption and probable fluctuations of ±10% have been
assumed. Therefore, no strict distinction is being made between the years 2013 to 2020 but a probable
Resources 2014, 3 307
range valid for the entire period is calculated. Besides the fluctuations of the beverage consumption,
the described ranges of the specific GeO2 concentration have been considered.
Following this, a germanium amount in EOL PET bottles of 837 to 1835 kg (1336 kg in the
baseline scenario) has been calculated.
3.6.4. Material Losses along End-of-Life Chain
Since the germanium dissipates completely into the PET, the PET bottles have to be considered the
relevant product for analyzing the end-of-life chain. Within the current end-of-life treatment of PET
bottles, the recovery of germanium is not an issue in any form and a complete loss has to be noted. To
the authors’ knowledge, no findings exist regarding potential options to recover germanium from PET.
According to OakdeneHollins [128] the feasibility of a recovery has to be questioned owing to the low
concentration in the product. Additional problems result from the mixing with bottles manufactured
with alternative catalysts and further dissipation in the subsequent applications of the recycled
material, e.g., fleece clothing.
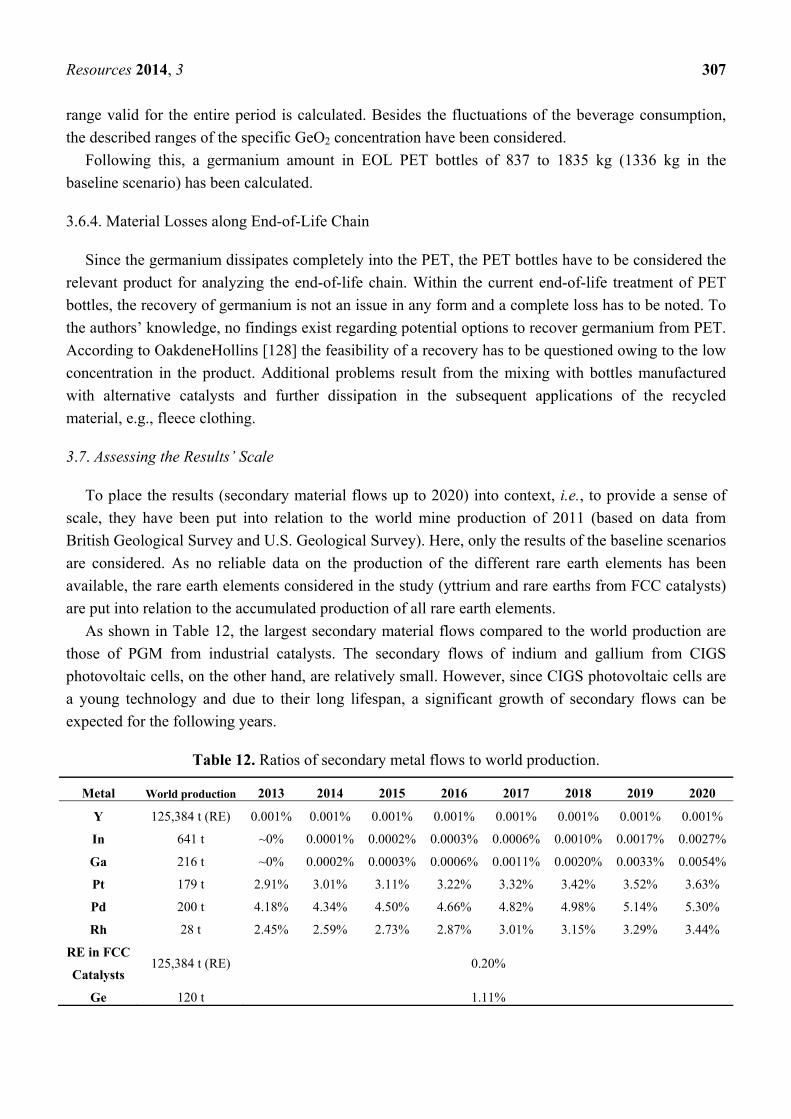
3.7. Assessing the Results’ Scale
To place the results (secondary material flows up to 2020) into context, i.e., to provide a sense of
scale, they have been put into relation to the world mine production of 2011 (based on data from
British Geological Survey and U.S. Geological Survey). Here, only the results of the baseline scenarios
are considered. As no reliable data on the production of the different rare earth elements has been
available, the rare earth elements considered in the study (yttrium and rare earths from FCC catalysts)
are put into relation to the accumulated production of all rare earth elements.
As shown in Table 12, the largest secondary material flows compared to the world production are
those of PGM from industrial catalysts. The secondary flows of indium and gallium from CIGS
photovoltaic cells, on the other hand, are relatively small. However, since CIGS photovoltaic cells are
a young technology and due to their long lifespan, a significant growth of secondary flows can be
expected for the following years.
Table 12. Ratios of secondary metal flows to world production.
Metal World production 2013 2014 2015 2016 2017 2018 2019 2020
Y 125,384 t (RE) 0.001% 0.001% 0.001% 0.001% 0.001% 0.001% 0.001% 0.001%
In 641 t ~0% 0.0001% 0.0002% 0.0003% 0.0006% 0.0010% 0.0017% 0.0027%
Ga 216 t ~0% 0.0002% 0.0003% 0.0006% 0.0011% 0.0020% 0.0033% 0.0054%
Pt 179 t 2.91% 3.01% 3.11% 3.22% 3.32% 3.42% 3.52% 3.63%
Pd 200 t 4.18% 4.34% 4.50% 4.66% 4.82% 4.98% 5.14% 5.30%
Rh 28 t 2.45% 2.59% 2.73% 2.87% 3.01% 3.15% 3.29% 3.44%
RE in FCC
Catalysts 125,384 t (RE) 0.20%
Ge 120 t 1.11%

Resources 2014, 3 308
The total secondary flows of rare earth metals from the analyzed applications (thermal barrier coatings
and FCC catalysts) are located somewhere between the two, if looked at together. Comparing them to
the world production of the respective rare earth element would probably result in somewhat higher
values. However, this step could not be performed due to data availability.
4. Discussion and Conclusions
In this study, the flows of selected critical metals at the end-of-life of three different applications
have been quantified and the respective end-of-life chains have been analyzed. Besides for the
products with relatively short lifespans (i.e., around one year or less) or constant stocks, for which a
simplified approach has been followed, the Weibull function has been used to model the secondary
material flows of the analyzed products. Especially for products with high growth rates such as
photovoltaic cells or otherwise volatile markets, the Weibull distribution has to be considered preferable
compared to a simultaneous exit functionas different studies indicate (see e.g., [15–19]).
Even though the chosen methodological approach is connected with some uncertainties regarding
parameters such as metal concentration in the product, average lifespan, and the future market
development of the products, it provides valuable knowledge that is required for any measures
contributing to more sustainable materials management. Especially for building up a recycling
infrastructure aiming at an improved recovery of critical metals and for urban mining activities,
knowledge about stocks and flows is essential.
While for PGM bearing catalysts–just like for most other PGM applications–a relatively
well-functioning recycling system exists, there is quite a lot of room for improvements regarding the
other analyzed products. In the analyzed rare earth applications–thermal barrier coatings and catalysts
for fluid catalytic cracking–a well-functioning collection system already exists. Still, due to their
historically particularly low prices, the recovery of the rare earths does not play a role in the
subsequent steps of the end-of-life chain even though a significant potential for improvements of the
recycling situation can be identified. Considering their criticality [6–11], i.e., their economic
importance and high supply risks, and past events like the Chinese export restrictions, such improvements
should get a much higher attention in the future.
Contrary to the relatively well established applications FCC catalysts and TBC, recycling of critical
metals from CIGS photovoltaic cells has already gained considerable attention; even though
end-of-life flows will probably not reach a significant scale for at least the next 8 to 15 years. In part,
this is triggered by the higher economic value of indium and gallium compared to lanthanum or
cerium, but existing and planned legislation as well as research funding contributed to this
development as well.
The last analyzed product–germanium bearing polymerization catalysts–does not show any
recycling potential since the metals dissipate completely into the product. Recycling of germanium
from PET is–as described above–unfeasible, but in-process recovery in the PET production is
apparently also economically unfeasible. Disregarding the apparent lack of economic incentives and
considering the fact that polymerization accounts for 37% of the total germanium consumption, a
highly significant potential for optimizations in terms of a sustainable metals management can be
identified here.
Resources 2014, 3 309
Comparing the three different products, we can also identify specific reasons for the failing
recycling of metals. In the cases analyzed here, it is not the interfaces between elements of the recycling
chain that are ineffective, as is typically the case for automotive catalysts or some WEEE wastes. The
reasons here are either economic (low prices for target metal), or technical (low concentration of metal
contained in low-value/high-volume waste streams), or both. Early consideration of the (potential)
criticality of metals, as in the case of PV modules, helps in avoiding such threats to a closed loop metal
economy and maintains options for a future metals management that is resilient against supply disruptions.
Acknowledgments
The presented results originate from an ongoing research project carried out on behalf of the
German Federal Environmental Agency (UBA) under the Environmental Research Plan-funding
reference number 371193 339–and is funded by the German Federal Ministry for the Environment,
Nature Conservation and Nuclear Safety (BMU). The responsibility for the content of the publication
lies with the authors.
We thank Anna Schaffner, Uwe Schulz, Jörg Sopka, O. Görke, Jürgen Lemke, Thilo Seitz,
Ralf Burmeister, Philipp Döbber, Renate Gülzow, Max Seier, Viktor Knobloch, Jan Kosmol, the
journal editor and two anonymous reviewers for providing feedback, support, expertise and/or
helpful comments.
Author Contribution
Till Zimmermann and Stefan Gößling-Reisemann designed the research and the methodological
framework. Till Zimmermann performed the research and analyzed the data. Both co-authors wrote
the paper.
Conflicts of Interest
The authors declare no conflict of interest.
References
1. Deutsches Ressourceneffizienzprogramms (ProgRess)—Programm zur Nachhaltigen Nutzung
und zum Schutz natürlicher Ressourcen; Bundesministerium für Umwelt, Naturschutz und
Reaktorsicherheit (BMU; German Federal Ministry for the Environment, Nature Convervation,
and Nuclear Safety): Berlin, Germany, 2012 (in German).
2. European Commission. Mitteilung der Kommission an das europäische Parlament, den Rat, den
europäischen Wirtschafts- und Sozialausschuss und den Ausschuss der Regionen: Fahrplan für
ein ressourcenschonendes Europa, Kom (2011) 571; Communication from the Commission to
the European Parliament. Europeam Commission: Brussels, Belgium, 2011 (in German).
3. Von Gleich, A. Outlines of a Sustainable Metals Industry. In Sustainable Metals Management:
Securing Our Future-Steps towards a Closed Loop Economy; von Gleich, A., Ayres, R.U.,
Gößling-Reisemann, S., Eds.; Springer: Berlin, Germany, 2006; pp. 3–39.
Resources 2014, 3 310
4. Graedel, T.E.; Barr, R.; Chandler, C.; Chase, T.; Choi, J.; Christoffersen, L.; Friedlander, E.;
Henly, C.; Jun, C.; Nassar, N.T.; et al. Methodology of metal criticality determination.
Environ. Sci. Technol. 2012, 46, 1063–1070.
5. Reuter, M.; Hudson, C.; Hagelüken, C.; Heiskanen, K.; Meskers, C.; van Schaik, A. Metal
Recycling: Opportunities, Limits, Infrastructure; UNEP Report; United Nations Environment
Programme: Paris, France, 2013.
6. Erdmann, L.; Graedel, T.E. Criticality of non-fuel minerals: A review of major approaches and
analyses. Environ. Sci. Technol. 2011, 45, 7620–7630.
7. American Physical Society. Materials Research Society. Energy Critical Elements: Securing
Materials for Emerging Technologies; A Report by the APS Panel on Public Affairs & the
Materials Research Society: Washington, DC, USA, 2011.
8. Buchert, M.; Schüler, D.; Bleher, D. Critical Metals for Future Sustainable Technologies and
their Recycling Potential; UNEP Report, Darmstadt, Germany, July 2009.
9. Reller, A. Rohstoffsituation Bayern: Keine Zukunft ohne Rohstoffe: Strategien und
Handlungsoptionen; vbw Bayern, IW Consult GmbH: Munich, Germany, 2009.
10. European Commission. Critical Raw Materials for the EU; Report of the Ad-hoc Working Group
on Defining Critical Raw Materials; European Commission: Brussels, Belgium, 2010.
11. Erdmann, L.; Behrendt, S. Kritische Rohstoffe für Deutschland: Identifikation aus Sicht
Deutscher Unternehmen Wirtschaftlich Bedeutsamer Mineralischer Rohstoffe, Deren
Versorgungslage sich Mittel- bis Langfristig als Kritisch Erweisen Könnte; Final Report; kfw
Bankengruppe: Berlin, Germany, 2011 (in German).
12. Zimmermann, T.; Gößling-Reisemann, S. Critical materials and dissipative losses: A screening
study. Sci. Total Environ. 2013, 461–462, 774–780.
13. Graedel, T.E.; Allwood, J.; Birat, J.-P.; Buchert, M.; Hagelüken, C.; Reck, B.K.; Sibley, S.F.;
Sonnemann, G. What do we know about metal recycling rates? J. Ind. Ecol. 2011, 15, 355–366.
14. Murakami, S.; Oguchi, M.; Tasaki, T.; Daigo, I.; Hashimoto, S. Lifespan of commodities, part I.
J. Ind. Ecol. 2010, 14, 598–612.
15. Cullen, A.C.; Frey, H.C. Probabilistic Techniques in Exposure Assessment: A Handbook for
Dealing with Variability and Uncertainty in Models and Inputs; Plenum Press: New York, NY,
USA, 1999.
16. Tasaki, T.; Takasuga, T.; Osako, M.; Sakai, S.-I. Substance flow analysis of brominated flame
retardants and related compounds in waste TV sets in Japan. Waste Manag. 2004, 24, 571–580.
17. Kagawa, S.; Tasaki, T.; Moriguchi, Y. The environmental and economic consequences of
product lifetime extension: Empirical analysis for automobile use. Ecol. Econ. 2006, 58, 108–118.
18. Oguchi, M.; Kameya, T.; Yagi, S.; Urano, K. Product flow analysis of various consumer durables
in Japan. Resour. Conserv. Recycl. 2008, 52, 463–480.
19. Zimmermann, T.; Rehberger, M.; Gößling-Reisemann, S. Material flows resulting from large
scale deployment of wind energy in Germany. Resources 2013, 2, 303–334.
20. Marwede, M.; Reller, A. Future recycling flows of tellurium from cadmium telluride
photovoltaic waste. Resour. Conserv. Recycl. 2012, 69, 35–49.
Resources 2014, 3 311
21. Zimmermann, T. Historic and Future Flows of Critical Materials Resulting from Deployment of
Photovoltaics. In Proceedings of the 6th International Conference on Life Cycle Management
(LCM 2013), Gothenburg, Sweden, 25–28 August 2013.
22. Zimmermann, T. Dynamic Material Flow Analysis of Critical Metals Embodied in Thin-Film
Photovoltaic Cells. Available online: http://www.uni-bremen.de/fileadmin/user_upload/
single_sites/artec/artec_Dokumente/artec-paper/194_paper.pdf (accessed on 4 January 2013).
23. Wilker, H. Leitfaden zur Zuverlässigkeitsermittlung technischer Komponenten: Mit 86 Tabellen,
86 Beispielen, 2nd ed; BoD (Books on demand): Norderstedt, Germany, 2010 (in German).
24. Qiu, S.-L.; Vuorinen, M. Special Functions in Geometric Function Theory. In Handbook of
Complex Analysis: Geometric Function Theory, 1st ed.; Kühnau, R., Ed.; Elsevier North
Holland: Amsterdam, The Netherlands, 2005.
25. Abramowitz, M.; Stegun, I.A. Handbook of Mathematical Functions with Formulas, Graphs,
and Mathematical Tables, 7th ed.; Dover Publications: New York, NY, USA, 1972.
26. Lehman, E.H. Shapes, moments and estimators of the weibull distribution. IEEE Trans. Reliab.
1963, 12, 32–38.
27. Nomura, K. Duration of Assets: Examination of Directly Observed Discard Data in Japan;
KEO Discussion Paper No. 99; Keio Economic Observatory, Keio University: Tokyo, Japan, 2005.
28. Chancerel, P. Substance Flow Analysis of the Recycling of Small Waste Electrical and
Electronic Equipment: An Assessment of the Recovery of Gold and Palladium. Ph.D. Thesis,
Technische Universität Berlin, Berlin, Germany, 2010.
29. Chancerel, P.; Meskers, C.E.; Hagelüken, C.; Rotter, V.S. Assessment of precious metal flows
during preprocessing of waste electrical and electronic equipment. J. Ind. Ecol. 2009, 13, 791–810.
30. Chancerel, P.; Rotter, S. Edelmetallrückgewinnung aus Elektro- und Elektronikaltgeräten durch
Aufbereitung. Müll Abfall 2009, 2, 78–82 (in German).
31. Buchert, M.; Manhart, A.; Bleher, D.; Pingel, D. Recycling Critical Raw Material from Waste
Electronic Equipment; Oeko-Institut e.V.: Freiburg, Darmstadt, Germany, 2012.
32. Hagelüken, C. Edelmetallrecycling-Status und Entwicklungen. In Sondermetalle und
Edelmetalle: Vorträge beim 44. Metallurgischen Seminar des Fachausschusses für
Metallurgische Aus- und Weiterbildung der GDMB vom 03.02. bis 05.02.2010 in Hanau;
Harre, J., Ed.; GDMB-Info GmbH: Clausthal-Zellerfeld, 2010; Volume 121 (in German).
33. Batista, C. Laser-Glazing of Plasma-Sprayed Thermal Barrier Coatings-Experimental and
Computational Studies. Master Thesis, Universidade do Minho, Braga, Portugal, 2007.
34. Schweda, M.E. Optimierung von APS-ZrO2-Wärmedämmschichten durch Variation der
Kriechfestigkeit und der Grenzflächenrauhigkeit. Ph.D. Thesis, RWTH Aachen, Aachen,
Germany, 2010 (in German).
35. Clarke, D.R.; Oechsner, M.; Padture, N.P. Thermal-barrier coatings for more efficient
gas-turbine engines. MRS Bull. 2012, 37, 891–898.
36. Batista, C. Thermal barrier coatings (TBCs)-State of the art. In Laser-Glazing of Plasma-Sprayed
Thermal Barrier Coatings-Experimental and Computational Studies; Universidade do Minho:
Braga, Portugal, 2007.
37. Nelson, W.A.; Orenstein, R.M. TBC experience in land-based gas turbines. J. Therm. Spray
Technol. 1997, 6, 176–180.
Resources 2014, 3 312
38. Subanovic, M. Einfluss der Bondcoatzusammensetzung und Herstellungsparameter auf die
Lebensdauer von Wärmedämmschichten bei zyklischer Temperaturbelastung. In Schriften des
Forschungszentrum Jülich; Forschungszentrum Jülich: Jülich, Germany, 2009 (in German).
39. Vaßen, R.; Jarligo, M.O.; Steinke, T.; Mack, D.E.; Stöver, D. Overview on advanced thermal
barriercoatings. Surf. Coat. Technol. 2010, 205, 938–942.
40. Czech, N. Korrosion und Beschichtung. In Stationäre Gasturbinen; Lechner, C., Seume, J., Eds.;
Springer-Verlag Berlin Heidelberg: Berlin, Germany, 2010 (in German).
41. Schulz, U. Head of Department, Hochtemperatur-und Funktionsschichten, DLR (Deutsches
Zentrum für Luft- und Raumfahrt), Köln, Germany. Personal Communication, January 2013.
42. Sopka, J. Technology/Development, ALSTOM Power GmbH, Mannheim, Germany. Personal
Communication, October 2012.
43. Bacos, M.-P.; Dorvaux, J.-M.; Landais, S.; Lavigne, O.; Mévrel, R.; Poulain, M.; Rio, C.;
Vidal-Sétif, M.-H. 10 years-activities at onera on advanced thermal barrier coatings. J. Aerosp.
Lab. 2011, 3, 1–14.
44. Trunova, O.; Beck, T.; Herzog, R.; Steinbrech, R.; Singheiser, L. Damage mechanisms and
lifetime behavior of plasma sprayed thermal barrier coating systems for gas turbines—Part I:
Experiments. Surf. Coat. Technol. 2008, 202, 5027–5032.
45. Görke, O. Institut für Werkstoffwissenschaften, FG Keramische Werkstoffe, TU Berlin, Berlin,
Germany. Personal Communication, November 2012.
46. Lemke, J. ALD Vacuum Technologies GmbH, Mannheim, Germany. Personal Communication,
January 2013.
47. Seitz, T. Director Propulsion Systems Engineering, Lufthansa Technik AG, Hamburg, Germany.
Personal Communication, 2013.
48. SulzerMetco. 8% Yttria Stabilized Zirconia Agglomerated and HOSP Thermal Spray Powders:
Material Product Data Sheet; 2012. Available online: http://www.sulzer.com/en/-
/media/Documents/ProductsAndServices/Coating_Materials/Thermal_Spray/ProductInformation
/Ceramics_Zirconium_Oxide/DSMTS_0001_2_8YOZrOHOSP.pdf (Accessed on 2 January 2013)
49. SulzerMetco. 8% Yttria Stabilized Zirconia Agglomerated and Sintered Thermal Spray Powders,
Material Product Data Sheet; 2012. Available online: http://www.sulzer.com/en/-/media/
Documents/ProductsAndServices/Coating_Materials/Thermal_Spray/ProductInformation/Cerami
cs_Zirconium_Oxide/DSMTS_0047_1_8YOZrOaggsint.pdf (accessed on 2 January 2013).
50. SulzerMetco. Ceria-Yttria Stabilized Zirconium Oxide HOSP Powder: Material Product Data
Sheet; 2012. Available online: http://www.sulzer.com/en/-/media/Documents/
ProductsAndServices/Coating_Materials/Thermal_Spray/ProductInformation/Ceramics_Zirconiu
m_Oxide/DSMTS_0038_0_CeZrO.pdf? (Accessed on 02 January 2013)
51. Burmeister, R.; Döbber, P. MTU Maintenance Hannover GmbH, Hannover, Germany. Personal
Communication, 2013.
52. Strangman, T.E. Thermal barrier coatings for turbine airfoils. Thin Solid Films 1985, 127,
93–106.
53. Nissley, D.M. Thermal barrier coating life modeling in aircraft gas turbine engines. JTST 1997,
6, 91–98.
Resources 2014, 3 313
54. Rolls-Royce. Journey through a Jet Engine, 2011. Available online: http://www.rolls-royce.com/
interactive_games/journey03/index.html (accessed on 15 January 2013).
55. Parsons, D.; Chatterton, J. Ceramic Coatings for Jet Engine Turbine Blades; Carbon Brainprint
Case Study, Center for Environmental Risks and Futures, Cranfield University: Cranfield, UK, 2011.
56. Padture, N.P. Thermal barrier coatings for gas-turbine engine applications. Science 2002, 296,
280–284.
57. Heinloth, K. Die Energiefrage: Bedarf und Potentiale, Nutzen, Risiken und Kosten, 2nd ed;
Vieweg: Braunschweig, Germany, 2003 (in German).
58. Wenk, E. Neue Turbine, Neue Computer; 2011. Available online: http://www.pnn.de/
potsdam/554325/ (accessed on 2 January 2013).
59. Stadtwerke Leipzig. Turbinentausch im Leipziger Kraftwerk, 2012. Available online:
http://www.swl.de/web/swl/DE/Unternehmen/presse/Pressemeldungen/2012/turbinentausch.htm
(accessed on 2 January 2013).
60. Lechner, C.; Seume, J. Stationäre Gasturbinen; Springer-Verlag: Berlin, Germany, 2010 (in
German).
61. Babar, F.-U.-R. Gas Turbines Maintenance Inspections and Calculations for Equivalent
Operating Hours, 2013. Available online: http://de.scribd.com/doc/37753088/Gas-Turbine-
Equivalent-Op-Hours-for-Maintenance (accessed on 4 February 2013).
62. ASUE. Gasturbinen-Kenndaten-Referenzen; Arbeitsgemeinschaft für Sparsamen und
Umweltfreundlichen Energieverbrauch e.V.: Kaiserslautern, Germany, 2006 (in German).
63. ASUE. Hocheffiziente Kraft-Wärme-Kopplung mit Gasturbinen: Gesetzliche
Rahmenbedingungen, Aktuelle Entwicklungen, Betriebserfahrungen. In Proceedings of ASUE-
Fachtagung, Berlin, Germany, 29–30 September 2009; Arbeitsgemeinschaft für Sparsamen und
umweltfreundlichen Energieverbrauch e.V.: Berlin, Germany, 2009 (in German).
64. Bundesverband der Energie- und Wasserwirtschaft e.V. (BDEW). 69 Kraftwerke bis 2020
geplant, Anlage zur Presseinformation “Trotz Milliardeninvestition keine Entwarnung beim
Kraftwerksbau”, 2012. (in German) Available online: http://bdew.de/internet.nsf/id/
91C0FC9A8D7AD3EEC12579E9002F8CBF/$file/120424%20Anlage%20zur%20PM%20Hann
over_Kraftwerksliste%20aktuell.pdf (accessed on 3 January 2013).
65. Umweltbundesamt. Kraftwerke in Deutschland, 2012 (in German). Available online:
http://www.umweltbundesamt.de/energie/archiv/kraftwerke_in_deutschland_datenbank.xls
(accessed on 4 February 2013).
66. AirBerlin. Airberlin IR–Die Flotte, 2013 (in German). Available online:
http://ir.airberlin.com/de/ir/fakten-zur-gruppe/die-flotte (accessed on 8 February 2013).
67. AirBerlin. UnsereFlotte, 2013 (in German). Available online: http://www.airberlin.com/de-
DE/site/flotte.php (accessed on 7 February 2013).
68. Condor. Condor-Unternehmen|Unsere Geschichte, 2012 (in German). Available online:
http://www.condor.com/de/unternehmen/unsere-geschichte.jsp (accessed on 8 February 2013).
69. Condor. Unsere Flotte, 2013 (in German). Available online: http://www.condor.com/de/
unternehmen/unsere-flotte.jsp (accessed on 7 February 2013).

Resources 2014, 3 314
70. TAI. World of TUI als verborgener Airline-Riese, 2012 (in German). Available online:
http://www.tai.at/index.php?option=com_content&view=article&id=2719:world-of-tui-als-
verborgener-airline-riese&catid=9&Itemid=4&lang=de (accessed on 8 February 2013).
71. TUIfly. Über TUIfly–Das Unternehmen|TUIfly (in German). Available online:
http://www.tuifly.com/de/unternehmen_tuifly/index.html (accessed on 7 February 2013).
72. Lufthansa, A.G. Geschäftsbericht 2011 (in German). Available online: http://investor-relations.
lufthansa.com/fileadmin/downloads/de/finanzberichte/geschaeftsberichte/LH-GB-2011-d.pdf
(accessed on 8 February 2013).
73. Lufthansa, A.G. Lufthansa-Flotte (in German). Available online: http://konzern.lufthansa.com/
flotte.html (accessed on 7 Februar 2013).
74. Steinke, S. Luftfahrt-Nachrichten und –Community (in German). Available online:
http://www.aero.de/news-14328/Lufthansa-mustert-ihre-erste-Boeing-747–400-aus.html
(accessed on 15 January 2013).
75. Pandit, P.N. Tenets of MRO Strategy for Airlines. Available online: http://www.infosys.com/
industries/airlines/white-papers/Documents/tenets-MRO-strategy.pdf (accessed on 7 February 2013).
76. Aircraft-commerce. Aircraft Owner’s and Operator’s Guide: 747-200/-300; 2005. Available
online: http://www.aircraft-commerce.com/sample_articles/sample_articles/owners_guide.pdf
(accessed on 7 February 2013).
77. Heermann, J. Warum sie oben bleiben-FAQ vom Autor, 2011 (in German). Available online:
http://www.flugingenieur.de/faq/faq_vom_autor.htm (accessed on 15 January 2013).
78. Aviation Broker GmbH. Fragen rund ums Fliegen, 2012 (in German). Available online:
http://www.aviation-broker.com/flugzeuge/technik.html (accessed on 7 February 2013).
79. China Economic Net. In China entwickelter Passagierjet Comac C919 Soll im Jahr 2014 starten,
2012 (in German). Available online: http://de.ce.cn/ga/un/unternehmen/201209/18/
t20120918_581146.shtml (accessed on 7 February 2013).
80. Krummheuer, E. Verlängertes Leben: Airbus macht Jets fit, 2008 (in German). Available online:
http://www.handelsblatt.com/unternehmen/industrie/verlaengertes-leben-airbus-macht-jets-fit/
2910418.html;%20https://www.bit-ag.com/downloads/drpeters_vpinfo_08_2008_lebenszyklusa320.
pdf (accessed on 7 February 2013).
81. Stadt Cuxhaven. Stadt Cuxhaven-Flugzeuge, n.d. (in German). Available online: http://www.
cuxhaven.de/staticsite/staticsite.php?menuid=66&topmenu=13 (accessed on 7 February 2013).
82. Flugzeugforum. durchschnittliche Flugleistung? n.d. (in German). Available online: http://www.
flugzeugforum.de/durchschnittliche-flugleistung-47174.html (accessed on 7 February 2013).
83. Flugzeugforum. Lebensdauer von Flugzeugen, n.d. (in German). Available online:
http://www.flugzeugforum.de/lebensdauer-flugzeugen-37810.html (accessed on 7 February 2013).
84. NIES. Lifespan database for Vehicles, Equipment, and Structures: LiVES, 2010. Available
online: http://www.nies.go.jp/lifespan/index-e.html (accessed on 30 January 2013).
85. Gülzow, R. Umweltmanagement, Abfallentsorgung, Lufthansa Technik GmbH, Hamburg,
Germany. Personal Communication, 2013.
86. El Chaar, L.; lamont, L.; El Zein, N. Review of photovoltaic technologies. Renew. Sustain.
Energy Rev. 2011, 15, 2165–2175.

Resources 2014, 3 315
87. Speirs, J.; Gross, R.; Candelise, C.; Gross, B. Materials Availability: Potential Constraints to the
Future Low-Carbon Economy; Working Paper, Imperial College: London, UK, 2011.
88. Fthenakis, V. Sustainability of photovoltaics: The case for thin-film solar cells. Renew. Sustain.
Energy Rev. 2009, 13, 2746–2750.
89. Sander, K.; Schilling, S.; Wambach, K.; Schlenker, S.; Müller, A.; Springer, J.; Fouquet, D.;
Jelitte, A.; Stryi-Hipp, G.; Chrometzka, T. Studie zur Entwicklung eines Rücknahme- und
Verwertungssystems für photovoltaische Produkte; Ökopol: Hamburg, Germany, 2007 (in German).
90. Critical Materials Strategy; US DOE Report, U.S. Department of Energy: Washington, DC,
USA, 2010.
91. Critical Materials Strategy; US DOE Report, U.S. Department of Energy: Washington, DC,
USA, 2011.
92. Moss, R.L.; Tzimas, E.; Kara, H.; Kooroshy, J. Critical Metals in Strategic Energy Technologies:
Assessing Rare Metals as Supply-Chain Bottlenecks in Low-Carbon Energy Technologies; JRC
Scientific and Technical Reports, Joint Research Center, European Commission: Petten,
Netherlands, 2011.
93. Andersson, B.A. Materials availability for large-scale thin-film photovoltaics. Progr. Photov.
Res. Appl. 2000, 8, 61–76.
94. Jungbluth, N.; Tuchschmid, M. Photovoltaics. In Sachbilanzen von Energiesystemen:
Grundlagen für den ökologischen Vergleich von Energiesystemen und den Einbezug von
Energiesystemen in Ökobilanzen für die Schweiz; Dones, R., Ed.; Paul Scherrer Institute
Villigen, Swiss Centre for Life Cycle Inventories: Dübendorf, Switzerland, 2007.
95. Bleiwas, D.I. Byproduct Mineral Commodities Used for the Production of Photovoltaic Cells.
Circular 1365; 2010. Available online: http://pubs.usgs.gov/circ/1365/Circ1365.pdf (accessed on
19 July 2012).
96. Berger, W.; Simon, F.-G.; Weimann, K.; Alsema, E.A. A novel approach for the recycling of thin
film photovoltaic modules. Resourc. Conserv. Recycl. 2010, 54, 711–718.
97. Sherwani, A.F.; Usmani, J.A.; Varun. Life cycle assessment of solar PV based electricity
generation systems: A review. Renew. Sustain. Energy Rev. 2010, 14, 540–544.
98. García-Valverde, R.; Miguel, C.; Martínez-Béjar, R.; Urbina, A. Life cycle assessment study of a
4.2 kWp stand-alone photovoltaic system. Solar Energy 2009, 83, 1434–1445.
99. Stoppato, A. Life cycle assessment of photovoltaic electricity generation. Energy 2008, 33,
224–232.
100. Briem, S.; Blesl, M.; Fahl, U.; Ohl, M.; Moerschner, J.; Eltrop, L.; Voß, A.; Viebahn, P.;
Krewitt, W.; Gürzenich, D.; et al. Lebenszyklusanalysen Ausgewählter zuküNftiger
Stromerzeugungstechnologien. Forschungsvorhaben mit Finanzieller Unterstützung des
Bundesministeriums für Wirtschaft und Arbeit; University of Stuttgart: Stuttgart, Germany, 2004
(in German).
101. Azzopardi, B.; Mutale, J. Life cycle analysis for future photovoltaic systems using hybrid solar
cells. Renew. Sustain. Energy Rev. 2010, 14, 1130–1134.
102. Held, M.; Ilg, R. Update of environmental indicators and energy payback time of CdTe PV
systems in Europe. Progr. Photovolt Res. Appl. 2011, 19, 614–626.

Resources 2014, 3 316
103. Raugei, M.; Fthenakis, V. Cadmium flows and emissions from CdTe PV: Future expectations.
Energy Policy 2010, 38, 5223–5228.
104. European Photovoltaic Industry Association (EPIA). Solar Generation 6: Solar Photovoltaic
Electricity Empowering the World; EPIA: Brussels, Belgium, 2011.
105. Kuitche, J.M. Statistical Lifetime Predictions for PV Modules; 2010. Available online:
http://www1.eere.energy.gov/solar/pdfs/pvrw2010_kuitche.pdf (accessed on 12 March 2013).
106. Kumar, S.; Sarkan, B. Design for reliability with weibull analysis for photovoltaic modules.
Int. J. Curr. Eng. Technol. 2013, 3, 129–134.
107. Bundesministerium für Umwelt, Naturschutz und Reaktorsicherheit (BMU). Erneuerbare Energien-
Zeitreihen zur Entwickung der erneuerbaren Energien in Deutschland; 2012. Available online:
http://www.erneuerbare-energien.de/erneuerbare_energien/datenservice/zeitreihen/doc/45919.php
(accessed on 15 October 2012).
108. Bundesministerium für Umwelt, Naturschutz und Reaktorsicherheit (BMU). Langfristszenarien
und Strategien für den Ausbau der erneuerbaren Energien in Deutschland bei Berücksichtigung
der Entwicklung in Europa und Global. Schlussbericht-BMU-FKZ 03MAP146, 2012 (in
German). Available online: http://www.fvee.de/fileadmin/publikationen/
Politische_Papiere_anderer/12.03.29.BMU_Leitstudie2011/BMU_Leitstudie2011.pdf (accessed
on 16 October 2012).
109. PHOTON. Das Solarstrommagazin: April 2012-Anteile der verschiedenen Zelltechnologien,
weltweite Solarzellenproduktion 1999 bis 2011. Photon Das Solarstrom Mag. 2012, 4, 43–53.
110. Wambach, K. Erfassung von Solarmodulen-Zukünftige Entsorgungsmengen, Proceedings of Urban
Mining Kongress 2013; Iserlohn, Germany, 12–13 June 2013. Available online: http://urban-mining-
kongress.de/fileadmin/pdfs/vortraege_2013/Wambach_Urbanmining12062013.pdf (accessed on 10
October 2013)
111. PV Cycle. PV CYCLE, Rücknahme und Recycling von PV-Altmodulen; 2013 (in German).
Available online: http://www.pvcycle.org/de/ (accessed on 30 May 2013).
112. Wambach, K.; Wade, A. Rückführungskonzepte und Aufbereitungsverfahren für
Photovoltaikmodule-Stand der Technik und rechtliche Rahmenbedingungen. First Solar,
Wambach Consulting; Urban Mining Kongress: Iserlohn, Germany, 2013 (in German).
113. Beckmann, J. Wieso Abfall? Entsorgung von photovoltaik-anlagen. Installateur 2012, 2, 28–31.
114. Landbell AG. Neues Rücknahmesystem für ausgediente Solarmodule, 2013 (in German).
Available online: http://www.landbell.de/news/102-neues-ruecknahmesystem-fuer-ausgediente-
solarmodule.html (accessed on 17 July 2013).
115. Sinha, P.; Cossette, M.; Ménard, J.-F. End-of-life CdTe PV recycling with semiconductor
refining. In 27th European Photovoltaic Solar Energy Conference and Exhibition, Proceedings of
the International Conference, Frankfurt, Germany, 24–28 September 2012; Nowak, S.,
Jäger-Waldau, A., Helm, P., Eds.; European Photovoltaic Solar Energy Conference and
Exhibition (EU PVSEC): München, Germany, 2012, pp. 4653–4656.
116. Palitzsch, W. PV Recyclingstrategien der Loser Chemie GmbH; Loser Chemie GmbH:
Langenweißbach, Germany (in German).
117. Lobbe. Recycling von PV-Modulen; 2012 (in German). Available online: http://www.lobbe.de/
fileadmin/Lobbe_Downloads/TatSachen/Tat39_web.pdf (accessed on 17 July 2013).
Resources 2014, 3 317
118. Betrieb einer Recyclinganlage für Photovoltaik-Module, 2013 (in German). Available online:
http://www.saperatec.de/index.php/technologie/referenzen (accessed on 17 July 2013).
119. Marwede, M. TU Berlin, Fraunhofer IZM, Berlin, Germany. Personal Communication, 2013.
120. Hassan, A. Rohstoffeinsparung durch Kreislaufführung von verbrauchten Katalysatoren aus der
chemischen Industrie. Forschungsbericht 299 93 301, UBA-FB 000139; Umweltbundesamt:
Berlin, Germany, 2001 (in German).
121. Weitkamp, J.; Gläser, R. Katalyse. In Chemische Technik: Prozesse und Produkte, 5th ed.;
Dittmeyer, R., Keim, W., Kreysa, G., Oberholz, A., Eds.; Wiley-VCH: Weinheim, Germany,
2004–2006, (in German).
122. Hagelüken, C.; Buchert, M.; Stahl, H. Stoffströme der Platingruppenmetalle: Systemanalyse und
Massnahmen für eine nachhaltige Optimierung der Stoffströme der Platingruppenmetalle;
Endbericht; GDMB-Medienverl.: Clausthal-Zellerfeld, Germany, 2005 (in German).
123. Hagelüken, C. Material Flows of Platinum Group Metals in Germany. Presentation at GFMS
Precious & Base Metals Seminar; 2005. Available online: http://www.gfms.co.uk/Market%
20Commentary/Materials%20Flow%20of%20PGMs%20in%20Germany.pdf (accessed on 17
March 2011).
124. Hagelüken, C.; Meskers, C. Technology challenges to recover precious and special metals from
complex products, 2009. Available online: http://ewasteguide.info/files/Hageluecken_2009
_R09.pdf (accessed on 28 January 2014).
125. Hassan, A. Stand der Verwertung von verbrauchten Katalysatoren aus der chemischen Industrie
sowie Einflussfaktoren zur Verbesserung der Kreislaufführung. Forschungsbericht 363 01 046,
UBA-FB 000443; Umweltbundesamt: Berlin, Germany, 2003 (in German).
126. Hagelüken, C. Director EU Governmental Affairs, Umicore Precious Metals Refining. Hanau,
Germany. Personal Communication, 2013.
127. Zimmer, H.-O. Managing director Zimmer Katalysatoren-Recycling; GmbH & Co. KG. Hürth,
Germany. Personal Communication, 2012.
128. Oakdene Hollins. Study into the Feasibility of Protecting and Recovering Critical Raw Materials
through Infrastructure Development in the South East of England; Final Report; Oakdene
Hollins (Ed.), European Pathway to Zero Waste Environment Agency: Reading, Berkshire,
UK, 2011.
129. Yang, W.-C. Handbook of Fluidization and Fluid-Particle Systems; Marcel Dekker: New York,
NY, USA, 2003.
130. Schüler, D.; Buchert, M.; Liu, R.; Dittrich, S.; Merz, C. Study on Rare Earths and Their
Recycling; Final Report for The Greens/EFA Group in the European Parliament: Darmstadt,
Germany, 2011.
131. Campagna, R. FCC Network Editor, Refining Process Servicesn.C. Personal Communication,
10 December 2012.
132. Goonan, T.G. Rare Earth Elements-End use and Reyclability; Scientific Investigations Report
2011–5094; U.S. Geological Survey; U.S. Department of the Interior: Reston, VA, USA, 2011.
133. Ismall, S. Fluid Catalytic Cracking (FCC) Catalyst Optimization to Cope with High Rare Earth
Oxide Price Environment; Technical Note; BASF: Middlesex/Essex, UK, 2011.
Resources 2014, 3 318
134.Young, G.H.; Cowfer, J.A.; Johnston, V.J. Katalysator und Verfahren zu Oxychlorierung von
Ethylen in Dichlorethan; EP0582165 B1,21 May 1997 (in German).
135. Auer, A. Treibacher Industrie AG, Althofen, Austria. Personal Communication, 13 December 2012.
136. EID. EID Daten und Fakten Energiepreise und Statistiken zum Download|Energie
Informationsdienst; 2012 (in German). Available online: http://www.eid-aktuell.de/inhalt/
statistiken/raffineriedurchsatz/ (accessed on 18 December 2012).
137. Jahresbericht Mineralöl-Zahlen 2011; Mineralölwirtschaftsverband e.V.: Berlin, German, 2012
(in German).
138. Shotyk, W.; Krachler, M. Contamination of bottled waters with antimony leaching from
polyethylene terephthalate (PET) Increases upon storage. Environ. Sci. Technol. 2007, 41,
1560–1563.
139. Thiele, U. Quo vadis polyester catalyst? Chem. Fibers Int. 2004, 54, 162–163.
140. Landesanstalt für Umwelt, M.u.N.B.-W.(Abfallsteckbriefe-1608 Gebrauchte Katalysatoren,
Informationsportal zur Abfallbewertung–IPA; 2012 (in German). Available online:
http://www.abfallbewertung.org/repgen.php?report=ipa&char_id=1608_Kat&lang_id=de&avv=
&synon=&kapitel=2 (accessed on 10 April 2013).
141. Kauertz, B.; Wellenreuther, F.; Busch, S.; Krüger, M.; Detzel, A. Ökobilanz der Glas- und
PET-Mehrwegflaschen der GDB im Vergleich zu PET-Einwegflaschen. Studie im Auftrag der
Genossenschaft Deutscher Brunnen eG; PGenossenschaft Deutscher Brunnen eG: Heidelberg,
Germany, 2008 (in German).
142. Kauertz, B.; Döhner, A.; Detzel, A. Ökobilanz von Getränkeverpackungen in Österreich
Sachstand 2010; IFEU-Institut: Heidelberg, Germany, 2011 (in German).
143. Heinisch, J. Verbrauch von Getränken in Einweg- und Mehrweg-Verpackungen: Berichtsjahr
2009; UBA-Texte 37/2011, Umweltbundesamt: Dessau-Roßlau, Germany, 2011 (in German).
144. Umweltbundesamt. Trend zu Einwegflaschen aus Kunststoff Ungebrochen; Presse-Information
031/2011, Umweltbundesamt: Dessau-Roßlau, Germany, 2011 (in German).
© 2014 by the authors; licensee MDPI, Basel, Switzerland. This article is an open access article
distributed under the terms and conditions of the Creative Commons Attribution license
(http://creativecommons.org/licenses/by/3.0/).
Related Documents


![On Analyzing Numerical solution of time- Independent ... · Schrodinger wave equation using Numerov algorithm for the square well, harmonic and linear potentials [8], time-independent](https://static.cupdf.com/doc/110x72/5ec3b1c0a73ebe0f7a410151/on-analyzing-numerical-solution-of-time-independent-schrodinger-wave-equation.jpg)


