Sustainability 2010, 2, 1204-1225; doi:10.3390/su2051204 sustainability ISSN 2071-1050 www.mdpi.com/journal/sustainability Article Recycled Concrete as Aggregate for Structural Concrete Production Mirjana Malešev 1 , Vlastimir Radonjanin 1 and Snežana Marinković 2, * 1 Department for Civil Engineering, Faculty of Technical Sciences, Trg Dositeja Obradovica 6, 21000 Novi Sad, Serbia; E-Mails: [email protected] (M.M.); [email protected] (V.R.) 2 Faculty of Civil Engineering, University of Belgrade, Bul. kralja Aleksandra 73, 11000 Belgrade, Serbia * Author to whom correspondence should be addressed; E-Mail: [email protected]; Tel.: +381-11-3370-102; Fax: +381-11-3370-223. Received: 5 March 2010; in revised form: 16 March 2010 / Accepted: 22 April 2010 / Published: 30 April 2010 Abstract: A comparative analysis of the experimental results of the properties of fresh and hardened concrete with different replacement ratios of natural with recycled coarse aggregate is presented in the paper. Recycled aggregate was made by crushing the waste concrete of laboratory test cubes and precast concrete columns. Three types of concrete mixtures were tested: concrete made entirely with natural aggregate (NAC) as a control concrete and two types of concrete made with natural fine and recycled coarse aggregate (50% and 100% replacement of coarse recycled aggregate). Ninety-nine specimens were made for the testing of the basic properties of hardened concrete. Load testing of reinforced concrete beams made of the investigated concrete types is also presented in the paper. Regardless of the replacement ratio, recycled aggregate concrete (RAC) had a satisfactory performance, which did not differ significantly from the performance of control concrete in this experimental research. However, for this to be fulfilled, it is necessary to use quality recycled concrete coarse aggregate and to follow the specific rules for design and production of this new concrete type. Keywords: recycled aggregate; recycled aggregate concrete; mechanical properties; load test; structural concrete OPEN ACCESS

Welcome message from author
This document is posted to help you gain knowledge. Please leave a comment to let me know what you think about it! Share it to your friends and learn new things together.
Transcript
Sustainability 2010, 2, 1204-1225; doi:10.3390/su2051204
sustainability ISSN 2071-1050
www.mdpi.com/journal/sustainability
Article
Recycled Concrete as Aggregate for Structural Concrete
Production
Mirjana Malešev 1, Vlastimir Radonjanin
1 and Snežana Marinković
2,*
1 Department for Civil Engineering, Faculty of Technical Sciences, Trg Dositeja Obradovica 6,
21000 Novi Sad, Serbia; E-Mails: [email protected] (M.M.); [email protected] (V.R.) 2
Faculty of Civil Engineering, University of Belgrade, Bul. kralja Aleksandra 73,
11000 Belgrade, Serbia
* Author to whom correspondence should be addressed; E-Mail: [email protected];
Tel.: +381-11-3370-102; Fax: +381-11-3370-223.
Received: 5 March 2010; in revised form: 16 March 2010 / Accepted: 22 April 2010 /
Published: 30 April 2010
Abstract: A comparative analysis of the experimental results of the properties of fresh and
hardened concrete with different replacement ratios of natural with recycled coarse
aggregate is presented in the paper. Recycled aggregate was made by crushing the waste
concrete of laboratory test cubes and precast concrete columns. Three types of concrete
mixtures were tested: concrete made entirely with natural aggregate (NAC) as a control
concrete and two types of concrete made with natural fine and recycled coarse
aggregate (50% and 100% replacement of coarse recycled aggregate). Ninety-nine
specimens were made for the testing of the basic properties of hardened concrete. Load
testing of reinforced concrete beams made of the investigated concrete types is also
presented in the paper. Regardless of the replacement ratio, recycled aggregate concrete
(RAC) had a satisfactory performance, which did not differ significantly from the
performance of control concrete in this experimental research. However, for this to be
fulfilled, it is necessary to use quality recycled concrete coarse aggregate and to follow the
specific rules for design and production of this new concrete type.
Keywords: recycled aggregate; recycled aggregate concrete; mechanical properties; load
test; structural concrete
OPEN ACCESS

Sustainability 2010, 2
1205
1. Introduction
Demolition of old and deteriorated buildings and traffic infrastructure, and their substitution with
new ones, is a frequent phenomenon today in a large part of the world. The main reasons for this
situation are changes of purpose, structural deterioration, rearrangement of a city, expansion of traffic
directions and increasing traffic load, natural disasters (earthquake, fire and flood), etc. For example,
about 850 millions tones of construction and demolition waste are generated in the EU per year, which
represent 31% of the total waste generation [1]. In the USA, the construction waste produced from
building demolition alone is estimated to be 123 million tons per year [2]. The most common method
of managing this material has been through its disposal in landfills. In this way, huge deposits of
construction waste are created, consequently becoming a special problem of human environment
pollution. For this reason, in developed countries, laws have been brought into practice to restrict this
waste: in the form of prohibitions or special taxes existing for creating waste areas.
On the other hand, production and utilization of concrete is rapidly increasing, which results in
increased consumption of natural aggregate as the largest concrete component. For example, two
billion tons of aggregate are produced each year in the United States. Production is expected to
increase to more than 2.5 billion tons per year by the year 2020 [2]. This situation leads to a question
about the preservation of natural aggregates sources; many European countries have placed taxes on
the use of virgin aggregates.
A possible solution to these problems is to recycle demolished concrete and produce an alternative
aggregate for structural concrete in this way. Recycled concrete aggregate (RCA) is generally
produced by two-stage crushing of demolished concrete, and screening and removal of contaminants
such as reinforcement, paper, wood, plastics and gypsum. Concrete made with such recycled concrete
aggregate is called recycled aggregate concrete (RAC). The main purpose of this work is to determine
the basic properties of RAC depending on the coarse recycled aggregate content, and to compare them
to the properties of concrete made with natural aggregate (NAC)—control concrete. Fine recycled
aggregate was not considered for RAC production because its application in structural concrete is
generally not recommended [3-6].
2. Basic Properties of Concrete with Recycled Concrete Aggregate
Based on available experimental evidence, the most important properties of recycled concrete
aggregate (RCA) and concrete made with recycled aggregate (RAC) are briefly presented in this
chapter. Recommendations for production of RAC are also presented.
When demolished concrete is crushed, a certain amount of mortar and cement paste from the
original concrete remains attached to stone particles in recycled aggregate. This attached mortar is the
main reason for the lower quality of RCA compared to natural aggregate (NA).
RCA compared to NA has following properties:
- increased water absorption [7-9],
- decreased bulk density [3,10],
- decreased specific gravity [3],
- increased abrasion loss [3,11,12],
Sustainability 2010, 2
1206
- increased crushability [3],
- increased quantity of dust particles [3],
- increased quantity of organic impurities if concrete is mixed with earth during building
demolition [3], and
- possible content of chemically harmful substances, depending on service conditions in
building from which the demolition and crushing recycled aggregate is obtained [3].
Available test results of recycled aggregate concrete vary in wide limits, sometimes are even
opposite, but general conclusions about the properties of concrete with recycled coarse aggregate
compared to concrete with natural aggregate are:
- increased drying shrinkage up to 50% [13,14],
- increased creep up to 50% [13,15],
- water absorption increased up to 50% [3,16],
- decreased compressive strength up to 25% [3,7,8,10,17],
- decreased splitting and flexural tensile strength up to 10% [3,8,17],
- decreased modulus of elasticity up to 45% [7,8,17],
- same or decreased frost resistance [3,18,19].
Technology of RAC production is different from the production procedure for concrete with natural
aggregate. Because of the attached mortar, recycled aggregate has significantly higher water
absorption than natural aggregate. Therefore, to obtain the desired workability of RAC it is necessary
to add a certain amount of water to saturate recycled aggregate before or during mixing, if no
water-reducing admixture is applied. One option is to first saturate recycled aggregate to the condition
―water saturated surface dry‖, and the other is to use dried recycled aggregate and to add the additional
water quantity during mixing. The additional water quantity is calculated on the basis of recycled
aggregate water absorption in prescribed time.
3. Experimental Investigation
The aim of this investigation is to compare the basic properties of control concrete (concrete
made with natural aggregate) and the properties of concrete made with different contents of
recycled aggregate.
Three concrete types were tested within the research program [20]. Mixture proportions of the
tested concrete types were determined in accordance to the following conditions:
- same cement content,
- same workability after 30 min,
- same maximum grain size (32 mm),
- same grain size distribution for aggregate mixture,
- same type and quantity of fine aggregate,
- variable type and quantity of coarse aggregate.

Sustainability 2010, 2
1207
The type and quantity of coarse aggregate were varied in the following way:
- the first concrete mix had 100% of natural river coarse aggregate (R0), control mixture,
- the second concrete mix had 50% of natural river coarse aggregate and 50% of recycled
coarse aggregate (R50),
- the third concrete mix had 100% of recycled coarse aggregate (R100).
As all the other variables were kept constant, this research enabled us to determine the influence of
the coarse recycled aggregate amount (0%, 50% and 100%) on tested concrete properties. The
following properties of concrete were selected for testing:
- workability (slump test) immediately after mixing and 30 minutes after mixing,
- bulk density of fresh concrete,
- air content,
- bulk density of hardened concrete,
- water absorption (at age of 28 days),
- wear resistance (at age of 28 days),
- compressive strength fc (at age of 2, 7 and 28 days),
- splitting tensile strength (at age of 28 days),
- flexural strength (at age of 28 days),
- modulus of elasticity (at age of 28 days),
- drying shrinkage (at age of 3, 4, 7, 14, 21 and 28 days),
- bond between ribbed and mild reinforcement and concrete.
Ninety nine specimens were made for testing of the listed properties of hardened concrete.
3.1. Component Materials
Component materials for concrete mixtures were:
- Portland-composite cement CEM II/A-M(S-L) 42.5R, (Lafarge-BFC),
- fine aggregate (river aggregate, separation Luka Leget, grain size 0/4 mm),
- two types of coarse aggregate: river aggregate, separation Luka Leget, and recycled
concrete aggregate, grain sizes 4/8, 8/16 and 16/31.5 mm,
- water.
Fine and coarse natural aggregates were derived from River Sava and dominantly consist of
quartz grains.
Recycled concrete aggregate was produced by crushing of ―old‖ concrete cubes used for
compressive strength testing and one precast reinforced concrete column, which had inappropriate
dimensions (Figure 1). The strength class of old concrete cubes was C30/37 and the corresponding
value of compressive strength for precast column was C40/50, nomenclature according to
Eurocode 2 [21]. The primary crushing was done with a pneumatic hammer (Figure 1) and the
Sustainability 2010, 2
1208
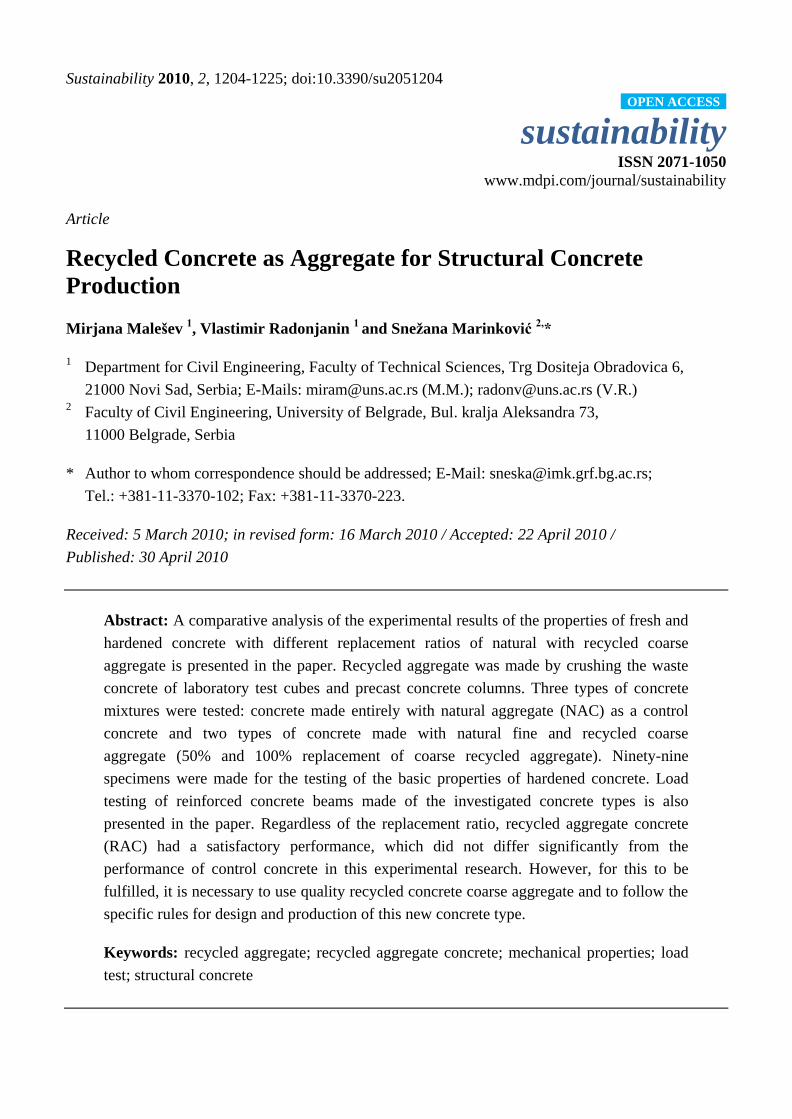
secondary crushing was performed in a rotating crusher. The obtained material after the primary and
secondary crushing is shown in Figure 2.
Figure 1. Waste concrete for recycling: concrete cubes and precast column.
Figure 2. Recycled material after (a) primary and (b) secondary crushing.
ba
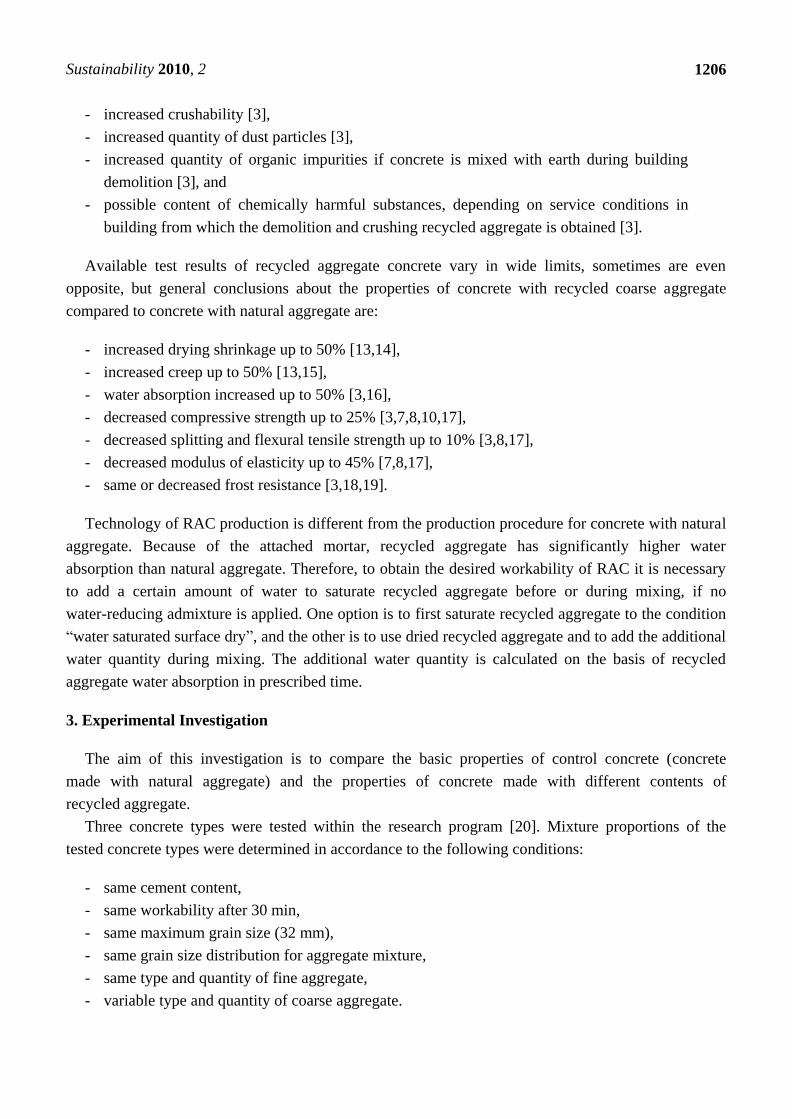
Crushed concrete particles were separated into standard fractions of coarse aggregate (4–8 mm,
8–16 mm and 16–31.5 mm), as seen in Figure 3.
Figure 3. Recycled concrete aggregate fractions. From left to right; 4–8 mm, 8–16 mm
and 16–31.5 mm coarse aggregates.
All component materials were tested prior to mix proportion design. The results of natural
aggregate testing are shown in Table 1 and grading curves are shown in Figure 4.

Sustainability 2010, 2
1209
Table 1. Results of natural aggregate testing.
Tested property Measured
value
Grain size Quality
requirement
0/4 4/8 8/16 16/32
Crushing resistance
(in cylinder)
mass loss (%) - 14.0 18.6 23.8 30
Freezing resistance test mass loss (%) 1.8 1.6 1.4 1.5 12
Content of weak grains (%) - 0 0 0 3 (4)
Crushing resistance
(Los Angeles test)
mass loss (%) - 26.3 29.0 29.2 30
Water absorption after
30 minutes
(%) 0.7 0.4 0.4 0.3 -
Fines content (%) 1.6 0.23 0.15 0.12 5 (<1)
Specific gravity kg/m3 2,655 2,666 2,669 2,671 2,000–3,000
Bulk density, uncompacted kg/m3 1,611 1,490 1,470 1,460 -
Bulk density, compacted kg/m3 1,729 1,590 1,570 1,560 -
Figure 4. Grading curves of natural aggregate.
0 0.125 0.25 0.5 1 2 4 8 16 31.5 63
Siev e size, (mm)
0
10
20
30
40
50
60
70
80
90
100
Sie
ve p
assin
g,
(%)
0/4
4/8
8/16
16/31.5
The results of recycled concrete aggregate testing are shown in Table 2 and grading curves in
Figure 5.
Properties of natural and recycled concrete aggregate were tested according to Serbian standards for
natural aggregates and quality requirements given in Tables 1 and 2 are also according to Serbian
standard for natural aggregates: SRPS B.B2.010:1986 [22]. As it can be seen from Table 2, recycled
aggregate with grain sizes of 8/16 and 16/32 don’t satisfy the weak grains content and crushing
resistance quality requirements for natural aggregates. This was expected because of the mortar and
cement paste attached to the stone particles in the recycled aggregate.

Sustainability 2010, 2
1210
Table 2. Results of recycled concrete aggregate testing.
Tested property
Measured value Grain size Quality
requirement
4/8 8/16 16/32
Crushing resistance
(in cylinder)
mass loss (%) 18.3 26.7 30.7 30
Freezing resistance test mass loss (%) 2.0 1.4 1.0 12
Chemical testing (mortar part
of recycled aggregate)
chloride content 0 0 0 0.1
sulfate content in traces in traces in traces 1.0
pH 9.85 9.85 9.85 -
Content of weak grains (%) 0 3.7 7.1 3 (4)
Crushing resistance
(Los Angeles test)
mass loss (%) 29.6 33.7 34.0 30
Water absorption after
30 minutes
(%) 4.59 2.87 2.44 -
Fines content (%) 0.45 0.23 0.36 1.0
Specific gravity kg/m3 2,346 2,458 2,489 2,000–3,000
Bulk density, uncompacted kg/m3 1,275 1,239 1,236 -
Bulk density, compacted kg/m3 1,388 1,323 1,325 -
Figure 5. Grading curves of recycled concrete aggregate.
0 0.125 0.25 0.5 1 2 4 8 16 31.5 63
Siev e size, (mm)
0
10
20
30
40
50
60
70
80
90
100
Sie
ve p
assin
g,
(%)
4/8 8/16 16/31.5
According to test results, natural river aggregate satisfies quality requirements given in [22] and
cement satisfies prescribed quality requirements given in EN 197-1:2,000 [23].
3.2. Mix Proportion Design
Concrete mix proportions were calculated according to above listed conditions and are shown in
Table 3. Dried recycled aggregate, basic water content and additional water quantity were used to
achieve the required workability of RAC.

Sustainability 2010, 2
1211
Table 3. Design quantities of component materials.
Concrete
mixture
Cement
(kg/m³)
Effective
water
(kg/m³)
Aggregate
(kg/m³)
Additional
water
(kg/m³)
Effective
water-
cement
ratio
Total
water-
cement
ratio
Bulk
density
(kg/m³)
R0 350 180 1857 0 0.514 0.514 2,387
R50 350 180 1816 19 0.514 0.569 2,365
R100 350 180 1776 37 0.514 0.620 2,343
Water absorption of recycled aggregates was studied in time intervals for a total of 24 hours. By
analyzing the results, it was found that the major changes in the quantity of absorbed water occur in
the first 30 minutes. On the other hand, it is known that the major change in the consistency of
―ordinary concrete‖ (without chemical admixtures) occurs in the first 20–30 minutes. Also,
after production, concrete must be transported to the site. Taking into account the underlying
attitudes, 30 minutes from the moment of adding water to the concrete mixer was adopted as the
reference time for the required workability.
Additional water quantity was calculated on the basis of water absorption of recycled aggregate
after 30 minutes, Table 2.
The substitution of natural coarse aggregate with recycled aggregate is made by weight, provided
that all mixtures have the same granulometric composition, corresponding to the Fuller’s curve
(Dmax = 31.5 mm). Percentage participation of each aggregate fraction in aggregate mixture is given
in Table 4 and corresponding quantity of each aggregate fraction is given in Table 5.
Table 4. Percentage participation of each aggregate fraction in aggregate mixture.
Concrete
type
Natural river aggregate Recycled concrete aggregate
0/4 4/8 8/16 16/32 4/8 8/16 16/32
R0 33 16 21 30 0 0 0
R50 33 8 10.5 15 6.5 7.5 19.5
R100 33 0 0 0 13 15 39
Table 5. Design amounts of different aggregate fractions.
Concrete
mixture
Content of natural river aggregate (kg/m³) Content of recycled aggregate (kg/m³)
0/4 4/8 8/16 16/32 4/8 8/16 16/32
R0 612 298 390 556 0 0 0
R50 600 145 191 272 118 136 354
R100 586 0 0 0 231 266 693
3.3. Results of Fresh Concrete Testing
Calculated real amounts of component materials and test results of workability (Figure 6), air
content and bulk density for all three concrete types are presented in Table 6.

Sustainability 2010, 2
1212
Figure 6. Slump test (a) after mixing and (b) after 30 minutes.
R0 R50 R100
R100R50R0
a a a
b b b
Table 6. Results of fresh concrete testing.
Concrete
mixture
Cement
(kg/m³)
Total
water
(kg/m³)
Aggregate
(kg/m³)
Water/
cement ratio1
Aggregate/
cement
ratio
Slump2
(cm)
Slump3
(cm)
Air
content
(%)
Bulk
density
(kg/m³)
R0 352 181 1866 0.514 5.306 16 10 1.5 2,399
R50 352 200 1826 0.568 5.188 14.5 8.5 1.4 2,378
R100 348 216 1765 0.620 5.074 11 9 1.3 2,329 1total water to cement ratio, including additional water content for workability. 2measured slump immediately after mixing. 3measured slump after 30 minutes.
By analyzing the results of fresh concrete, shown in Table 6, it was concluded that:
- Approximately the same workability after 30 minutes was achieved for all three concrete
types using the additional water for concrete R50 and R100 (Figure 6b).
- Concrete mixture R50 requires about 10% more total water quantity in comparison to
mixture R0, and the corresponding value for concrete mixture R100 is about 20%.
- Differences in air content (p) are insignificant. Air content in fresh concrete was
determined by standard test method that is based on Boyle-Mariotte’s Law. In [26] was
concluded that the air content of the RAC is higher than concrete made with NA at 100%
replacement. However, the author used a gravimetric method for calculation of total air
content, including aggregate porosity.
- Bulk density of concrete depends on aggregate type and quantity. The highest bulk density
has concrete with natural aggregate (R0) and the lowest concrete with maximum content of
recycled aggregate (R100). The bulk density decrease is about 3%.

Sustainability 2010, 2
1213
3.4. Results of Hardened Concrete Testing
Measured compressive strengths of concrete R0, R50 and R100 at age of 2, 7 and 28 days [24], are
shown in Table 7 and they represent average values. For each concrete type the following number
of specimens (15 cm cubes) were used: three specimens/age 2 days, three specimens/age 7 days and
six specimens/age 28 days. Standard deviation for the compressive strength results at age of 28 days is
also shown in Table 7.
Table 7. Concrete compressive strength and relative compressive strength at different ages.
Concrete type Concrete age (days) Standard deviation
(MPa) 2 7 28
R0 (MPa) 27.55 35.23 43.44 1.5769
R50 (MPa) 25.74 37.14 45.22 1.2089
R100 (MPa) 25.48 37.05 45.66 3.5016
R50/R0 (%) 93 105 104
R100/R0 (%) 92 105 105
Measured values of drying shrinkage of concrete R0, R50 and R100 are shown in Table 8. The
specimens were three prisms (10 × 10 × 40 cm) for each concrete type. An extensometer with 25 cm
base was used for measuring.
Table 8. Drying shrinkage at different concrete ages.
Concrete
type
4 days
(mm/m)
7 days
(mm/m)
14 days
(mm/m)
21 days
(mm/m)
28 days
(mm/m)
Relative drying
shrinkage*, %
R0 0.017 0.124 0.203 0.277 0.339 100
R50 0.036 0.086 0.176 0.254 0.306 90
R100 0.091 0.204 0.251 0.335 0.407 120
*shrinkage value at the age of 28 days in relation to shrinkage of referent concrete R0.
Results of the testing of other properties of the hardened concrete are presented in Table 9. Each
property of hardened concrete was tested on a group of three appropriate specimens at the age of 28
days. Water absorption of concretes R0, R50 and R100 was tested on 15 cm cubes. Splitting tensile
strength of concrete was tested on 15 cm cubes, and flexural strength on 10 × 10 × 40 cm prisms. All
tests were performed according to Serbian standards for testing the hardened natural aggregate
concrete properties.
Cylindrical specimens with a diameter of 10 cm and height of 15 cm and with embedded ribbed and
mild reinforcement (12 mm diameter) were used for testing the bond between reinforcement and
concrete R0, R50 and R100. The length of the embedded part of reinforcement was 15 cm. For this
testing, an axial tension procedure and tearing device were used (Figure 7).

Sustainability 2010, 2
1214
Table 9. Other properties of hardened concrete at age of 28 days.
Concrete type R0 R50 R100
Water absorption, (%) 5.61 6.87 8.05
Splitting tensile strength, (MPa) 2.66 3.20 2.78
Flexural strength, (MPa) 5.4 5.7 5.2
Wear resistance, (cm³/50 cm) 13.40 15.58 17.18
Modulus of elasticity (GPa) 35.55 32.25 29.10
Bond between mild reinforcement and concrete, MPa 6.48 5.87 6.76
Bond between ribbed reinforcement and concrete, MPa 8.22 7.50 7.75
Figure 7. Testing of bond between concrete and reinforcement.
supporting
plate
reinforcement bar
10 cm
15
cmconcrete
cylinder
Z
Relative values R50/R0 and R100/R0 for properties presented in Table 9 are shown graphically in
Figure 8.
Figure 8. Relative values R50/R0 and R100/R0 for properties of hardened concrete.
Water absorptio
n
Splitting stre
ngth
Flexural stre
ngth
Wear resistance
Modulus of elastic
ity
Bond /mild
reinforcement
Bond/ribbed re
inforcement
R0
R50
R1000
20
40
60
80
100
120
140
160
Rela
tive v
alu
e, %
R0
R50
R100

Sustainability 2010, 2
1215
3.5. Discussion of Hardened Concrete Properties
To describe the development of concrete compressive strength fc with time (t), a fraction
Function (1) was adopted:
bt
ta(t)cf
(1)
Calculated parameters of this functional relation (―a‖ and ―b‖) for concrete R0, R50 and R100,
together with correlation coefficient (―r‖), are presented in Table 10. Values of correlation coefficients
point to the fact that the chosen fraction function realistically represents the development of
compressive strength with time for all three tested concrete types.
Table 10. Parameters of functional relationship between the compressive strength and age
of the concrete.
Concrete type a b r
R0 44.242 1.320 0.976
R50 47.556 1.761 0.997
R100 48.116 1.856 0.996
The test results of concrete compressive strength at age of 2, 7 and 28 days (Table 7) and
established functional relations fc(t) for concrete R0, R50 and R100 are illustrated in Figure 9.
Figure 9. The compressive strength of concrete at various ages.
0
5
10
15
20
25
30
35
40
45
50
Age (t), days
Co
ncr
ete
com
pre
ssiv
e st
ren
gth
, fc
, M
Pa
R0(t) R50(t) R100(t) R0 R50 R100
1 2 3 4 5 6 7 8 9 10 11 12 13 14 15 16 17 18 19 20 21 22 23 24 25 26 27 28 29 30 31
R0R50
R100
fc(t)=(a x t)/(t + b)
Analysis of the concrete compressive strength values points to the following:
- all three concrete types have approximately the same compressive strength development
with time,
- all three concrete types have 28-day compressive strength that is larger than 40 MPa,

Sustainability 2010, 2
1216
- differences between compressive strengths of concrete R0, R50 and R100 are negligible
for the same concrete age.
To find out if differences between obtained compressive strengths of concrete R0, R50 and R100 at
age of 28 days are significant or not, differences between their mean values were statistically tested
according to method in [25]. For that purpose, pairs of corresponding 28-day strength were formed
(R0–R50, R0–R100 and R50–R100). Tested value is defined with expression:
21
2,av1,av0
n
1
n
1s
xxt
(2)
2nn
)1n()1n(s
21
222
211
(3)
criterion: t0 t (4)
where:
t0 = quintile of Student distribution for number of degree of freedom = n1 + n2 − 2
xav,1 = average value (set I)
xav,2 = average value (set II)
n1 = number of test results (set I)
n2 = number of test results (set II)
t = critical value of Student distribution for number of degree of freedom = n1 + n2 − 2
1 = standard deviation (set I)
2 = standard deviation (set II)
Results of this statistical test are shown in Table 11.
Table 11. Testing of difference significance for concrete compressive strength.
Test pairs n1 n2 s t0 t, for
= 0.05
(R0 and R50) 6 6 1.406523 2.189924
2.2281 (R0 and R100) 6 6 2.7163 1.417718
(R50 and R100) 6 6 2.61943 0.29425
On the basis of the results presented in Table 11 and Criterion (4), it was concluded that differences
between measured compressive strengths of concrete R0, R50 and R100 are insignificant (all results
belong to the same set of results). This conclusion led to the fact that coarse aggregate type didn’t
influence the concrete compressive strength value in this experimental research. This conclusion is
opposite to results of other authors [8,31,33], who found that compressive strength decreases with
increasing quantity of recycled aggregates in concrete with the same effective water-cement ratio.
However, in these experiments, recycled aggregate was obtained from demolished concrete structures
of unknown compressive strength. Hansen [3] find out that substitution of natural aggregate with
recycled concrete aggregate up to 30% has no significant influence on concrete compressive strength.
Sustainability 2010, 2
1217
Our results confirm the statement that compressive strength of RAC depends more on the quality of
recycled aggregate than on the quantity.
According to the analysis of the 28-day drying shrinkage values (Table 8), it is concluded that:
- the lowest shrinkage rate was for concrete R50 (0.3 mm/m), and the highest for R100
(0.4 mm/m),
- drying shrinkage of concrete R100 is 20% higher than shrinkage of concrete R0,
- difference between 28-day shrinkage of concrete R0 and R50 is less than 10%.
The obtained results for drying shrinkage of RAC correspond to results of other authors, who found
larger or smaller values for drying shrinkage compared to NAC [10,14,29].
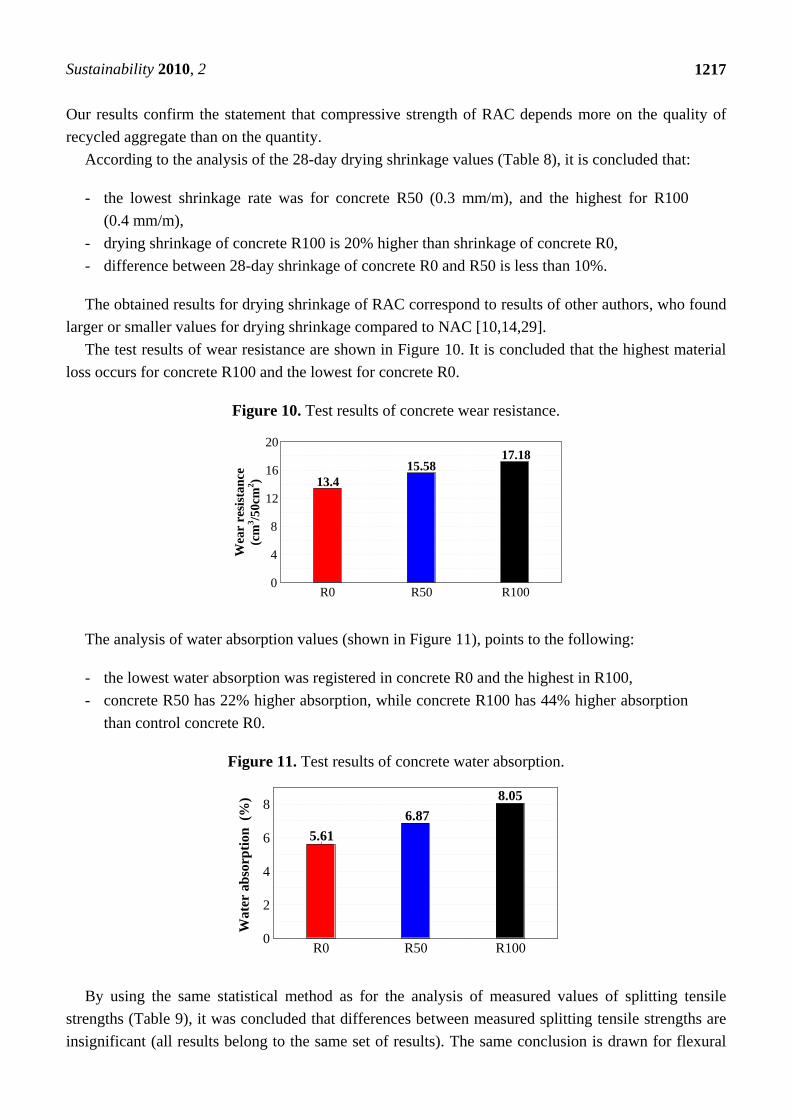
The test results of wear resistance are shown in Figure 10. It is concluded that the highest material
loss occurs for concrete R100 and the lowest for concrete R0.
Figure 10. Test results of concrete wear resistance.
13.4
15.5817.18
R0 R50 R1000
4
8
12
16
20
Wea
r re
sist
an
ce
(cm
3/5
0cm
2)
The analysis of water absorption values (shown in Figure 11), points to the following:
- the lowest water absorption was registered in concrete R0 and the highest in R100,
- concrete R50 has 22% higher absorption, while concrete R100 has 44% higher absorption
than control concrete R0.
Figure 11. Test results of concrete water absorption.
5.61
6.87
8.05
R0 R50 R1000
2
4
6
8
Wate
r ab
sorp
tion
(%
)
By using the same statistical method as for the analysis of measured values of splitting tensile
strengths (Table 9), it was concluded that differences between measured splitting tensile strengths are
insignificant (all results belong to the same set of results). The same conclusion is drawn for flexural

Sustainability 2010, 2
1218
strength results (Table 9). Hansen [3] states that both tensile strengths of RAC are maximum 10% less
than the tensile strength of NAC. Other papers [27,28] and [29] also confirmed that RAC tensile
strength is not significantly affected by the amount of recycled coarse aggregate.
Our analysis of the obtained values of bond between mild and ribbed reinforcement and concrete
R0, R50 and R100 (Table 9) shows that:
- difference between lowest and highest bond for both reinforcement types is about 10%,
- bond between tested concretes and ribbed reinforcement is higher at least 15% than bond
between tested concretes and mild reinforcement.
Although all three concrete types have similar compressive strength, the modulus of elasticity is
lower for the concrete with recycled aggregate, Table 9. This decrease depends on the content of the
recycled aggregate and maximum decrease is for the concrete with maximum recycled aggregate
content. The modulus of elasticity of concrete R100 is lower than the modulus of elasticity of
control concrete R0 by about 18%. The same decreasing of modulus of elasticity was found in
research [14].
3.6. Load Testing of Reinforced Concrete (RC) Beams
Tested concrete types (R0, R50 and R100) were used for producing RC beams (beams ―R0‖, ―R50‖
and ―R100‖). Three beams with a length of 3.0 m and rectangular cross section of 15/25 cm were
prepared for flexural testing. Beams were reinforced with ribbed reinforcement 3R12 in the lower
zone, 2R10 in the upper zone and with stirrups 6/20 (Figure 12).
Figure 12. Characteristic dimensions of RC beams and arrangement of reinforcement.
UØ6/20 2RØ12
3RØ12
Details of the production of the beams for experimental testing is shown in Figures 13 and 14.
Figure 13. Moulds with placed reinforcement.

Sustainability 2010, 2
1219
Figure 14. Finishing of the beams concrete surface.
The maximum (failure) load was calculated for the ―RO‖ beam. Stresses in concrete and
reinforcement, deflections and characteristic cracks width were calculated using the program CREEP
(authors M. Tatomirovic, P. Pavlovic). Calculated values for the beam with referent concrete
R0—beam ―R0‖ are shown in Table 12.
Table 12. Calculated values for cross-section in the middle of the span (beam ―R0‖).
Phase Load
(kN)
Beam
edge
Stress in
concrete
(MPa)
Stress in
reinforcement
(MPa)
Deflection
(mm)
Crack width
(mm)
I 5 upper 4.075
0.46 0.017 lower 65.569
II 10 upper 7.278
1.54 0.062 lower 117.092
III 20 upper 13.683
3.87 0.137 lower 220.139
IV 30 upper 20.087
6.10 0.207 lower 323.186
V 40 upper 26.492 8.33 0.276
lower 426.233
VI 50 upper 32.897 failure
lower 529.279
At the age of 28 days, the beams were subjected to load testing (bending with concentrated force in
the middle of the span). The arrangement of measuring spots for registering deflections and strains in
the concrete and reinforcement is shown in Figure 15. The load was increased in six phases until
failure of the beams. During load testing, the following data were registered: deflections,
reinforcement strains, concrete strains, arrangement and width and length of cracks.

Sustainability 2010, 2
1220
Figure 15. Arrangement of measuring spots throughout the beam. (U—deflection; T—strain
in reinforcement; D—strain in concrete).
U2U1
l=2.8m
I/2=1.4m
D1
U3
I/4=0.7m
U4 U5
A B
T1
An example of the appearance and development of cracks during the load testing of beam R50 is
presented graphically in Figure 16. The photo of a crack pattern in the middle part of the span, after
failure, is shown in Figure 17.
Figure 16. Development of cracks during load testing of beam R50.
3.0m
2.8m
0.1
0.2 0.1 0.10.10.1
1
124 53
10 20 30 40 50 60 70 80 90 100 110 120 130102030405060708090100110120130
10 20 30 40 50 60 70 80 90 100 110 120 130102030405060708090100110120130
0.4 0.2 0.10.20.1
124 53
10 20 30 40 50 60 70 80 90 100 110 120 130102030405060708090100110120130
0.1 0.1 0.10.1
7 8 9 106111213
0.10.1 0.1 0.1
0.5 0.10.20.1
124 53
10 20 30 40 50 60 70 80 90 100 110 120 130102030405060708090100110120130
0.1 0.1 0.10.1
7 8 9 106111213
0.10.1 0.1 0.1 2.0 1.0
14
R50
PHASE III
PHASE IV
PHASE V
PHASE VI
25
cm
25
cm
25
cm
25
cm
5
10
15
20
5
10
15
20
5
10
15
20
5
10
15
20
Figure 17. Crack pattern after collapse of beam R50.

Sustainability 2010, 2
1221
By analysis of registered cracks on all tested RC beams, it was concluded:
- First crack appears in the middle of the span in the third load phase (P = 20 kN).
- The maximum width of cracks after collapse is between 2.0 and 2.7 mm.
- Similar disposition and width of cracks was registered on all tested RC beams.
The measured deflections and stresses in concrete in the middle of the span are presented in
Table 13. Measured stresses in the concrete are based on measured concrete strains.
Table 13. Measured deflections and stresses in concrete in the middle of the span.
Phase Load
kN
Deflection, (mm) Concrete compressive stress, (MPa)
R0 R50 R100 R0 R50 R100
I 5 0.55 0.67 0.73 - - -
II 10 0.89 1.21 1.37 1.32 2.64 3.04
III 20 2.68 2.78 2.94 7.00 8.05 8.71
IV 30 4.66 5.97 6.89 12.80 10.96 14.78
V 40 7.43 10.52 11.78 20.20 21.12 24.02
VI 50 failure
For the purpose of comparing beam behavior during loading, the calculated deflections of beam
―R0‖ and measured deflections of all three beam types are presented in Figure 18.
Figure 18. Calculated and measured values of deflection of all tested beams.
0
0,55
00
11,78
0
0,89
2,68
7,43
4,66
1,21
2,78
5,97
10,52
0,67
1,37
2,94
6,89
0,73
1,54
3,87
8,33
6,1
0,46
0
5
10
15
20
25
30
35
40
45
0 2 4 6 8 10 12 14
U (mm)
P (
kN
)
R0 R50R100
Calculated values
In the elastic area all tested beams have similar deflection, which means that for appropriate load
level the quantity of coarse recycled concrete aggregate has no significant influence on the beam
behavior. Fanthifazl [34] had the similar conclusion in regard to the behavior of beams exposed
to bending.
At the higher values of the test load, deflection depends on the type and quantity of used aggregate
(with increasing quantity of recycled aggregate, the deflection value is increasing also). The different

Sustainability 2010, 2
1222
values of modulus of elasticity of used concrete types are the main cause for recorded behavior of
tested beams in the post elastic area.
According to these test results, concrete compressive stresses depend on the type and quantity of
used aggregate. With increasing of recycled aggregate content up to 100%, concrete compressive
strength is increasing up to 25%.
4. Conclusions
On the basis of our comparative analysis of test results of the basic properties of concrete with three
different percentages of coarse recycled aggregate content (0%, 50% and 100%), the following
conclusions are made.
The way of preparing recycled aggregate for concrete mixtures influences the concrete workability:
workability of concrete with natural and recycled aggregate is almost the same if ―water
saturated—surface dry‖ recycled aggregate is used. Also, if dried recycled aggregate is used and
additional water quantity is added during mixing, the same workability can be achieved after a
prescribed time. Additional water quantity depends on the time for which the same workability has to
be achieved. It is determined as water quantity for which the recycled aggregate absorbs for the same
period of time.
Bulk density of fresh concrete is slightly decreased with increasing quantity of recycled aggregate.
The type of coarse aggregate has no influence on the air content in concrete.
Concrete compressive strength mainly depends on the quality of recycled aggregate. If good quality
aggregate (obtained by crushing higher strength class concrete as in this case) is used for the
production of new concrete, the recycled aggregate has no influence on the compressive strength,
regardless of the replacement ratio of natural coarse aggregate with recycled aggregate. The same
conclusion is valid for concrete tensile strength (splitting and flexural).
The water absorption of concrete depends on the quantity of recycled aggregate. The amount of
absorbed water is proportionally increased with increasing recycled aggregate content. Water
absorption depends on the porosity of cement matrix in the new concrete and porosity of cement
matrix of the recycled concrete: if recycled aggregate is produced from low porosity waste concrete,
water absorption of the new concrete depends on the achieved structure of the new cement matrix.
Wear resistance of the concrete depends on the amount of recycled aggregate. Concrete wear
resistance decreases with increasing recycled aggregate content, due to the increased quantity of
hardened cement paste, which wears easier than grains of natural aggregate.
The modulus of elasticity of concrete also decreases with increasing recycled aggregate content as a
consequence of lower modulus of elasticity of recycled aggregate compared to natural aggregate.
Shrinkage of concrete depends on the amount of recycled concrete aggregate. Concrete with more
than 50% of recycled coarse aggregate has significantly more shrinkage compared to concrete with
natural aggregate. Increased shrinkage is a result of the attached mortar and cement paste in the
recycled aggregate grains.
The bond between recycled aggregate concrete and reinforcement is not significantly influenced by
recycled concrete aggregate, because it is realized through new cement paste.

Sustainability 2010, 2
1223
According to these test results, the performance of recycled aggregate concrete, even with the total
replacement of coarse natural with coarse recycled aggregate, is mainly satisfactory, not only in terms
of the mechanical properties, but also the other requirements related to mixture proportion design and
production of this concrete type. The only two properties those are lower than for the natural aggregate
concrete properties are the modulus of elasticity and shrinkage deformation. Because of that, it is not
recommended to apply this type of concrete for structural elements for which large deformations can
be expected. Also, this type of concrete shouldn’t be used for structures exposed to aggressive
environment conditions without appropriate previous testing, as there are opposing conclusions about
durability-related properties of RAC in existing literature [3,16,30,32].
Based on the results of the load tests on the reinforced concrete beams, it is concluded that used
coarse aggregate type and quantity has no significant influence on the pattern and width of cracks.
First, crack appears in the middle of the span at a load level equal to about one third of the ultimate
load regardless of the concrete type. The measured crack widths were approximately the same for all
three tested beams.
On the other hand, concrete compressive stresses depend on the quantity of recycled concrete
aggregate for all load phases. Increasing the quantity of coarse RCA up to 100% increased the concrete
compressive stress up to 25% in these tests.
Deflections of tested beams do not depend on the type and quantity of used aggregate in the elastic
area—similar deflections were registered regardless of the concrete type. However, in the post elastic
area, with increasing quantity of coarse recycled aggregate the deflection value increased. The
deflection increase compared to deflection of the ―R0‖ beam is 4% for the ―R50‖ beam and 10% for
the ―R100‖ beam for the service load level. The main reason for such behavior of the tested beams is a
lower modulus of elasticity of concrete types R100 and R50 in comparison to referent concrete R0.
All the conclusions made in this work about the tested properties of fresh and hardened concrete
and consequently, about the behavior of beams subjected to bending, are valid for recycled aggregate
concrete produced with quality recycled aggregate, obtained from demolished concrete with good
mechanical properties, as it was the case in this experimental research.
Acknowledgements
The work reported in this paper is a part of the investigation within the research project
TR 16004—Utilization of recycled aggregate concrete in reinforced concrete structures, supported by
the Ministry for Science and Technology, Republic of Serbia.
References and Notes
1. Fisher, C.; Werge, M. EU as a Recycling Society; ETC/SCP Working Paper 2/2009;
Available online: http://scp.eionet.europa.eu.int (accessed on 14 August 2009).
2. Transportation Applications of Recycled Concrete Aggregate—FHWA State of the Practice
National Review 2004; U.S. Department of Transportation Federal Highway Administration:
Washington, DC, USA, 2004; pp. 1-47.
3. Recycling of Demolished Concrete and Masonry; Hansen, T.C., Ed.; Taylor and Francis:
Oxfordshire, UK, 1992; p. 316.

Sustainability 2010, 2
1224
4. RILEM Recommendation: Specifications for concrete with recycled aggregates. Mater. Struct.
1994, 27, 557-559.
5. Aggregates for Mortar and Concrete—Part 100: Recycled Aggregates; Deutsches Institut Fur
Standardization: Berlin, Germany, 2002; p. 18.
6. Concrete—Complementary British Standard to BS EN 206-1—Part 2: Specification for
Constituent Materials and Concrete; British Standards Institute (BSI): London, UK, 2006; p. 38.
7. Rahal, K. Mechanical properties of concrete with recycled coarse aggregate. Build. Environ. 2007,
1, 407-415.
8. Yang, K.H.; Chung, H.S.; Ashour, A. Influence of type and replacement level of recycled
aggregates on concrete properties. ACI Mater. J. 2008, 3, 289-296.
9. Evangelista, L.; Brito, J. Mechanical behavior of concrete made with fine recycled concrete
aggregate. Cem. Concr. Compos. 2007, 5, 397-401.
10. Sanchez de Juan, M.; Gutierrez, P.A. Influence of recycled aggregate quality on concrete
properties. In Proceeding of the International RILEM Conference: The Use of Recycled Materials
in Building and Structures, Barcelona, Spain, 8–11 November 2004; pp. 545-553.
11. Poon, C.S.; Azhar, S.; Kou, S.C. Recycled aggregates for concrete applications. In Proceeding of
the Materials Science and Technology in Engineering Conference—Now, New and Next, Hong
Kong, China, 15–17 January 2003; p. 16.
12. López-Gayarre, F.; Serna, P.; Domingo-Cabo, A.; Serrano-López, M.A.; López-Colina, C.
Influence of recycled aggregate quality and proportioning criteria on recycled concrete properties.
Waste Manag. 2009, 12, 3022-3028.
13. Domingo-Cabo, A.; Lázaro, C.; López-Gayarre, F.; Serrano-López, M.A.; Serna, P.;
Castaño-Tabares, J.O. Creep and shrinkage of recycled aggregate concrete. Constr. Build. Mater.
2009, 7, 2545-2553.
14. Gómez-Soberón, J.M.V. Shrinkage of concrete with replacement of aggregate with recycled
concrete aggregate. ACI Spec. Publ. 2002, 209, 475-496.
15. Gómez-Soberón, J.M.V. Creep of concrete with substitution of normal aggregate by recycled
concrete aggregate. ACI Spec. Publ. 2002, 209, 461-474.
16. Li, X. Recycling and reuse of waste concrete in China: Part I. Material behavior of recycled
aggregate concrete. Resour. Conserv. Recycl. 2008, 1-2, 36-44.
17. Ajdukiewicz, A.; Kliszczewicz, A. Influence of recycled aggregates on mechanical properties of
HS/HPC. Cem. Concr. Compos. 2002, 2, 269-279.
18. Salem, R.M.; Burdette, E.G.; Jackson, N.M. Resistance to freezing and thawing of recycled
aggregate concrete. ACI Mater. J. 2003, 100, 216-221.
19. Zaharieva, R.; Buyle-Bodin, F.; Wirguin, E. Frost resistance of recycled aggregate concrete.
Cem. Concr. Res. 2004, 10, 1927-1932.
20. Malešev, M.; Radonjanin, V.; Dimča, M. Research of possibility of application of recycled
concrete as aggregate for new concrete—Part I. In Proceeding of 4th International Science
Meeting, INDIS 2006 (Planning, Design, Construction and Renewal in the Construction Industry),
Novi Sad, Serbia, 22–24 November 2006; pp. 495-504.
21. Eurocode 2: Design of Concrete Structures—Part 1-1: General Rules and Rules for Buildings
(EN 1992-1-1); European Committee for Standardization (CEN): Brussels, Belgium, 2004.

Sustainability 2010, 2
1225
22. Aggregate for concrete. In Technical Requirements; Serbian Institution for Standardization (SIS):
Belgrade, Serbia, 1986.
23. Composition, Specification and Conformity Criteria for Common Cements; European Committee
for Standardization (CEN): Brussels, Belgium, 2000.
24. Radonjanin, V.; Malešev, M.; Dimča, M. Research of possibility of application of recycled
concrete as aggregate for new concrete—Part II. In Proceeding of 4th International Science
Meeting, INDIS 2006 (Planning, Design, Construction and Renewal in the Construction Industry),
Novi Sad, Serbia, 22–24 November 2006; pp. 505-516.
25. Flašar, A. Control of Quality in Construction; Faculty of Technical Sciences-Institute of Civil
Engineering (FTN-NOIIG): Novi Sad, Serbia, 1984.
26. Katz, A. Properties of concrete made with recycled aggregate from partially hydrated old
concrete. Cem. Concr. Res. 2003, 33, 703-711.
27. Gonzales-Fonteboa, B.; Martinez-Abella, F. Concretes with aggregates from demolition waste and
silica fume. Materials and mechanical properties. Build. Environ. 2008, 43, 429-437.
28. Poon, C.S.; Lam, C.S. The effect of aggregate-to-cement ratio and types of aggregates on
properties of precast concrete blocks. Cem. Concr. Compos. 2008, 30, 283-289.
29. Sagoe-Crentsil, K.K.; Brown, T.; Taylor, A.H. Performance of concrete made with commercially
produced coarse recycled concrete aggregate. Cem. Concr. Res. 2001, 31, 707-712.
30. Levy, S.M.; Helene, P. Durability of recycled aggregates concrete: A safe way to sustainable
development. Cem. Concr. Res. 2004, 34, 1975-1980.
31. Xiao, J.; Li, J.; Zhang, C. Mechanical properties of recycled aggregate concrete under uniaxial
loading. Cem. Concr. Res. 2005, 35, 1187-1194.
32. Limbachiya, M.C.; Koulouris, A.; Roberts, J.J.; Fried, A.N. Performance of recycled aggregate
concrete. In Proceeding of RILEM International Symposium on Environment-Conscious
Materials and Systems for Sustainable Development, Koriyama, Japan, 6–7 September 2004;
pp. 127-136
33. Poon, C.S.; Shui, Z.H.; Lam, C.S.; Fok, H.; Kou, S.C. Influence of moisture states of natural and
recycled aggregates on the slump and compressive strength of concrete. Cem. Concr. Res. 2004,
34, 31-36.
34. Fathifazl, G. Structural Performance of Steel Reinforced Recycled Concrete Members; Ph.D.
Thesis; Carleton University: Ottawa, ON, Canada, 2008; p. 465.
© 2010 by the authors; licensee MDPI, Basel, Switzerland. This article is an open-access article
distributed under the terms and conditions of the Creative Commons Attribution license
(http://creativecommons.org/licenses/by/3.0/).
Related Documents