Recursive Trace Line Method for Detecting Myelinated Bundles: a Comparison Study with Pyramidal Cell Arrays Manuel F. Casanova, M.D. * , Anouar I. Konkachbaev, Ph.D. *,† , Andrew E. Switala * , and Adel S. Elmaghraby, Ph.D. # * Department of Psychiatry and Behavioral Sciences, University of Louisville, 500 S Preston St Bldg 55-A Ste 217, Louisville, Kentucky 40292 # Department of Computer Engineering and Computer Science, University of Louisville, J.B. Speed Bldg Rm 123, Louisville, Kentucky 40292 † Present affiliation: Argonne National Laboratory, Argonne, Illinois 60439 Abstract Minicolumns are thought to be the smallest cortical modules within the hierarchical organization of the isocortex. Several reports suggest alterations in minicolumnar morphometry may be involved in psychiatric disorders such as autism, dyslexia, and schizophrenia. Thus far anatomical studies of minicolumns have primarily relied on measurements of pyramidal cell arrays. This study expands on a recursive trace line segmentation method used to define morphometric measures for myelinated axon bundles. The results were compared against those of pyramidal cell arrays derived from immediately adjacent serial sections. Width estimates based on cell somas and myelinated axon bundles were highly correlated (r = 0.9888). Histograms of signal intensity using the recursive trace line method produced expected features of myeloarchitectonics; that is, bundles of Meynert and intervening interradiary plexus. The close correspondence of derived values for myelinated axon bundles and pyramidal cell arrays suggests their participation and interaction within the same modular arrangement of the isocortex. Keywords Computerized image analysis; Minicolumns; Myelin; Neocortex; Pyramidal cells Introduction Morphological studies spanning the last 150 years have helped define the remarkable topographical organization of the brain’s isocortex. Early studies by Campbell, Brodmann, and von Economo and Koskinas focused on the distribution and arrangement of individual cells (cytoarchitectonics) (Campbell 1905; Brodmann 1909; Von Economo and Koskinas 1925). However, the complexity of cellular arrangements prompted some investigators to question the distinctive cytoarchitectonic nature of previously described homogeneous areas. After extensive parcellation studies in several species Bailey and von Bonin concluded that vast areas Address correspondence to: Manuel F. Casanova, M.D., Department of Psychiatry, University of Louisville, 500 South Preston Street, Bldg 55A, Ste 210, Louisville, KY 40292, Tel: (502)852-4077, Fax: (502)852-4078, E-mail: [email protected]. Publisher's Disclaimer: This is a PDF file of an unedited manuscript that has been accepted for publication. As a service to our customers we are providing this early version of the manuscript. The manuscript will undergo copyediting, typesetting, and review of the resulting proof before it is published in its final citable form. Please note that during the production process errors may be discovered which could affect the content, and all legal disclaimers that apply to the journal pertain. NIH Public Access Author Manuscript J Neurosci Methods. Author manuscript; available in PMC 2009 March 15. Published in final edited form as: J Neurosci Methods. 2008 March 15; 168(2): 367–372. NIH-PA Author Manuscript NIH-PA Author Manuscript NIH-PA Author Manuscript

Welcome message from author
This document is posted to help you gain knowledge. Please leave a comment to let me know what you think about it! Share it to your friends and learn new things together.
Transcript
Recursive Trace Line Method for Detecting Myelinated Bundles: aComparison Study with Pyramidal Cell Arrays
Manuel F. Casanova, M.D.*, Anouar I. Konkachbaev, Ph.D.*,†, Andrew E. Switala*, and AdelS. Elmaghraby, Ph.D.#* Department of Psychiatry and Behavioral Sciences, University of Louisville, 500 S Preston St Bldg 55-ASte 217, Louisville, Kentucky 40292
# Department of Computer Engineering and Computer Science, University of Louisville, J.B. Speed Bldg Rm123, Louisville, Kentucky 40292
† Present affiliation: Argonne National Laboratory, Argonne, Illinois 60439
AbstractMinicolumns are thought to be the smallest cortical modules within the hierarchical organization ofthe isocortex. Several reports suggest alterations in minicolumnar morphometry may be involved inpsychiatric disorders such as autism, dyslexia, and schizophrenia. Thus far anatomical studies ofminicolumns have primarily relied on measurements of pyramidal cell arrays. This study expandson a recursive trace line segmentation method used to define morphometric measures for myelinatedaxon bundles. The results were compared against those of pyramidal cell arrays derived fromimmediately adjacent serial sections. Width estimates based on cell somas and myelinated axonbundles were highly correlated (r = 0.9888). Histograms of signal intensity using the recursive traceline method produced expected features of myeloarchitectonics; that is, bundles of Meynert andintervening interradiary plexus. The close correspondence of derived values for myelinated axonbundles and pyramidal cell arrays suggests their participation and interaction within the samemodular arrangement of the isocortex.
KeywordsComputerized image analysis; Minicolumns; Myelin; Neocortex; Pyramidal cells
IntroductionMorphological studies spanning the last 150 years have helped define the remarkabletopographical organization of the brain’s isocortex. Early studies by Campbell, Brodmann, andvon Economo and Koskinas focused on the distribution and arrangement of individual cells(cytoarchitectonics) (Campbell 1905; Brodmann 1909; Von Economo and Koskinas 1925).However, the complexity of cellular arrangements prompted some investigators to questionthe distinctive cytoarchitectonic nature of previously described homogeneous areas. Afterextensive parcellation studies in several species Bailey and von Bonin concluded that vast areas
Address correspondence to: Manuel F. Casanova, M.D., Department of Psychiatry, University of Louisville, 500 South Preston Street,Bldg 55A, Ste 210, Louisville, KY 40292, Tel: (502)852-4077, Fax: (502)852-4078, E-mail: [email protected]'s Disclaimer: This is a PDF file of an unedited manuscript that has been accepted for publication. As a service to our customerswe are providing this early version of the manuscript. The manuscript will undergo copyediting, typesetting, and review of the resultingproof before it is published in its final citable form. Please note that during the production process errors may be discovered which couldaffect the content, and all legal disclaimers that apply to the journal pertain.
NIH Public AccessAuthor ManuscriptJ Neurosci Methods. Author manuscript; available in PMC 2009 March 15.
Published in final edited form as:J Neurosci Methods. 2008 March 15; 168(2): 367–372.
NIH
-PA Author Manuscript
NIH
-PA Author Manuscript
NIH
-PA Author Manuscript
of isocortex were so closely similar that any attempts at subdividing the same were unprofitable,if not impossible (Bailey and von Bonin 1951). Similarly, independent cytoarchitecturalparcellation studies by Lashley and Clark in the brain of two spider monkeys bore littleagreement to each other (Lashley and Clark 1946). There was a large amount of individualvariability among different brain regions and areas of the brain apparent in one specimen werenot evident in the other specimen. Lashley and Clark emphasized the need to corroboratecytoarchitectural fields with other methods, notably those based on fiber connectivity (Lashleyand Clark 1946). The subjective approach of these early investigators is now incorporated intomultiple parcellation schemes comprising networks of hundreds of different brain regions.According to Daly, “For the moment, (cyto)architectural classification leaves many unresolvedproblems. Some inevitably result from distortions brought on living cells by fixation andstaining. Others result from the subjectivity of the observer’s eye in trying to classify cellularpatterns, a problem that may yield to the use of computerized techniques of patternrecognition” (Daly 1976).
Recent applications of computer imaging methods has allowed us to analyze a component ofisocortical anatomy, more specifically, radially oriented pyramidal cell arrays. Thesestructures, together with bundles of efferent myelinated axons, apical dendrites, and doublebouquet cells, are found in a broad range of mammalian species (Douglas and Martin 2004;Buxhoeveden and Casanova 2005). This composite cell and fiber structure, termed the corticalcell minicolumn by Mountcastle has been proposed as the elemental functional microcircuitof neocortex (Mountcastle 1978). Each of its constituent components has been shown to exhibitminicolumnar-scale periodicity in various species and cortical areas (von Bonin and Mehler1971; Seldon 1981; Seldon 1981; DeFelipe, Hendry et al. 1990; Ong and Garey 1990; Petersand Sethares 1991; Peters and Sethares 1991; del Rio and DeFelipe 1997; Peters, Cifuentes etal. 1997). This suggests that they are part of a general organizing motif of the isocortex inprimates.
The present study provides computerized image analysis of myelinated axon bundles whichaddresses the biases and limitations of cytoarchitectural techniques. Myelinated axon bundles,and the space between them, frame columns of cells and all of the afferent, efferent andinterneuronal fiber systems of the minicolumn. Myelin staining techniques label axonal fibersin a consistent and reproducible manner which is not subject to post-agonal and processingartifacts affecting other labeling methods (Chan and Lowe 2002). An additional advantage ofthe method is that myelinated axon bundles do not bifurcate. All fibers within a given bundlearise from cells in their associated pyramidal cell column thus providing a one-to-onecorrespondence between these cytoarchitectural features. In contrast, apical dendritesoccasionally branch and aggregate into bundles arising from several neighboring cell columns(Rockland 2002).
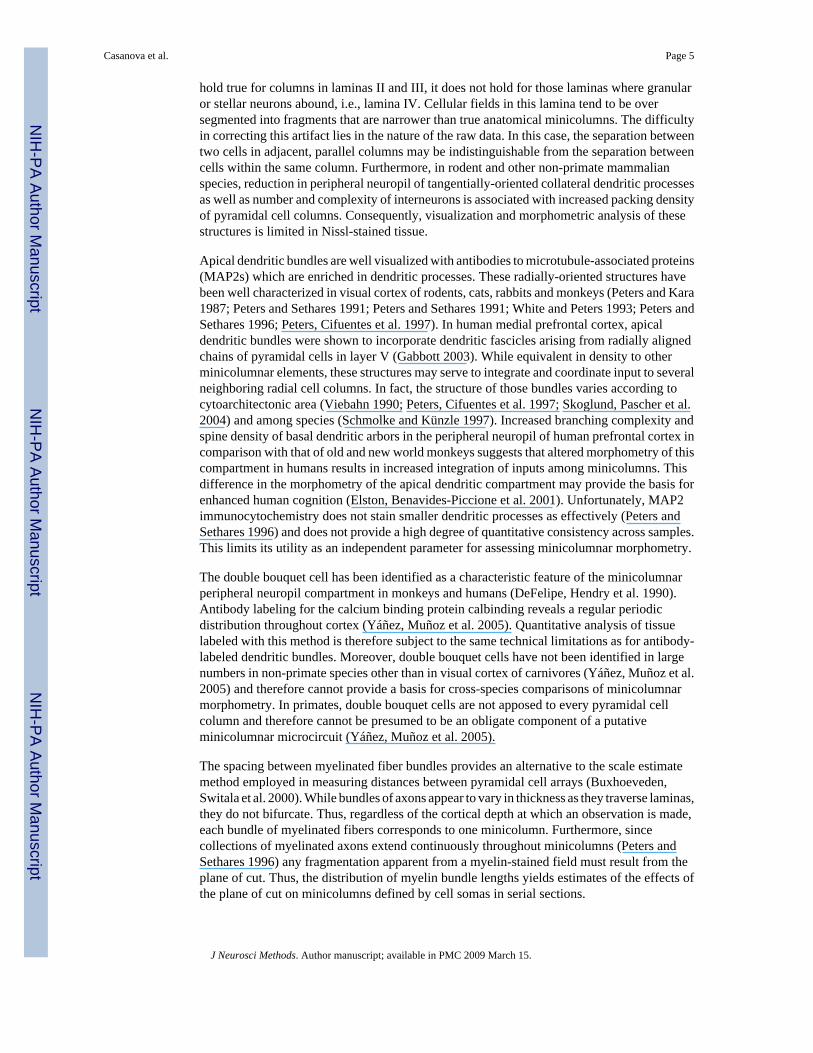
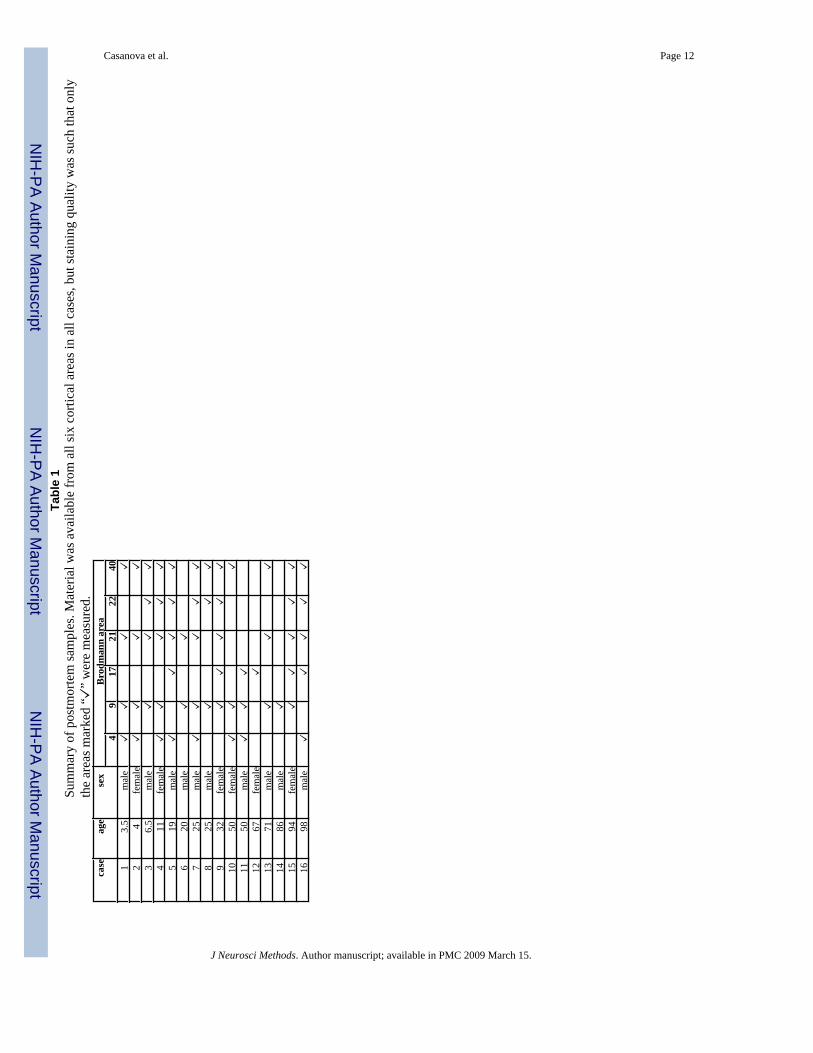
Materials and methodsWe examined 58 pairs of serial sections from several brain regions in a postmortem sample of16 human patients (Table 1). All patients belonged to a normative aging series and were freefrom neuropathological changes. Tissue was stored at the Yakovlev-Haleem collection, ArmedForces Institute of Pathology, Washington, D.C. Each brain was celloidin-embedded and cutinto 35 μm sections. One section out of every 10 to 25 slices was stained using the Loyeztechnique, and the section immediately following was stained with cresyl violet (Figure 1).
Photomicrographs of corresponding locations in serial sections were obtained using a NikonE1000M microscope with 4× objective and a DXM1200 digital camera, for an effectivesampling frequency of 1.175 pixels per μm. Images were corrected for uneven illuminationprior to analysis. In each photomicrograph of Nissl-stained tissue, lamina V was outlined by
Casanova et al. Page 2
J Neurosci Methods. Author manuscript; available in PMC 2009 March 15.
NIH
-PA Author Manuscript
NIH
-PA Author Manuscript
NIH
-PA Author Manuscript
hand, and minicolumnar width CW was estimated in this region of interest using establishedmethods (Casanova and Switala 2005). Minicolumnar width was also estimated in the adjacentLoyez-stained section using the methods described below.
An image I of Loyez stained tissue can be segmented into roughly four classes: the white matterW, blood vessels V, myelinated axons A extending through the grey matter, and backgroundG, i.e.
The first two classes have nearly identical grey level histograms and thus can not bedistinguished with simple thresholding. The first step is to separate myelinated axons (andbackground) from the rest of an image using Otsu’s (1979) algorithm (Otsu 1979). The resultingset of pixels I1 includes parts of blood vessels, whose boundaries are smoother than those ofaxons.
Applying Otsu’s method a second time to the set I1 removes the pixels in V, leaving
all other pixels being set to zero.
Spacing between bundles of myelinated axons is measured on profiles of I2, parallel to thewhite matter border, roughly perpendicular to the orientation of axon bundles. The white matterW belongs to the complement of I2, and can be easily identified as the largest connected subsetthereof (Figure 2). The boundary ∂W of W thus identified may be quite irregular. This is dealtwith in one of two ways depending on whether the cortex in the region of interest is convex(gyral) or concave (sulcal) (Figure 3). In either case morphological opening with a circularstructuring element approximately 20 μm in diameter smooths the boundary somewhat. Thenin the gyral case, the convext hull of the smoothed boundary is taken to represent the whitematter surface. In the sulcal case, the white matter surface is a cubic curve, least-squares fit tothe smoothed boundary.
Profiles of I2 are then made along level sets of the Euclidean distance map of the computedwhite matter boundary. These are the point sets L(r) such that
where d(a,b) is the Euclidean distance. Profiles are smoothed using a kernel function with thebandwidth chosen to satisfy the GCV criterion (Craven and Wahba 1979). The spacing betweenpeaks in the resulting curve provides an estimate of the width of minicolumns as identified bythe bundles of myelinated axons through their cores.
ResultsWidth estimates based on cell somata (CWS) and myelinated axon bundles (CWA) are highlycorrelated with r = 0.9888 (Figure 4); this is significant with a lower 95 % confidence limit r> 0.985. The linear relationship between the two measurements was estimated as CWA = 0.988CWS + 0.040 μm, using orthogonal distance regression. Bootstrap confidence intervals on theslope m and intercept b were 0.9459 < m < 1.0353 and 0.1410μm < b < 0.2184 μm, respectively.
CWA and CWS varied with respect to cortical area as revealed by multivariate, repeatedmeasures ANOVA (F10,72 = 2.09; P = 0.0363). Predicted mean widths ranged from CWA =
Casanova et al. Page 3
J Neurosci Methods. Author manuscript; available in PMC 2009 March 15.
NIH
-PA Author Manuscript
NIH
-PA Author Manuscript
NIH
-PA Author Manuscript
23.0 μm for area 21 to CWA = 28.3 μm for area 9. The standard deviation in CWA pooled acrossall cortical areas was 3.33 μm. Results for CWS are essentially the same.
DiscussionHistograms of signal intensity using the recursive trace line method defined expected featuresof myeloarchitectonics: long streams of vertical radiations denoted as bundles of Meynert(Campbell 1905) and the intervening interradiary plexus described by Edinger (Jones 1984).Furthermore, our results show correspondence for distances between myelinated bundles andthose for pyramidal cell arrays. The findings recapitulate previous observations that “the radialarrangement of the myeloarchitecture in many cortical regions often mirrors the suggestion ofcolumnar arrangements better than Nissl preparations” (von Bonin and Mehler 1971).
The recursive line trace algorithm employed in this study is a novel method for quantifyingneocortical radial morphometry. Our results are consistent with and complementary to thoseobtained by previously-employed techniques for imaging pyramidal cell arrays. The closecorrespondence between measures of myelinated axon bundles and pyramidal cell arrayssuggests their presence and interaction within a unifying anatomical structure of verticalcylinders which Lorente de No (1938) designated as an elementary unit of cortical organization(de No 1938). The presence of these closely interacting vertical components lends credence tothe supposition of the minicolumn as a canonical architectonic feature of the neocortex.
Pyramidal cell arrays, myelinated axon bundles, dendritic bundles, and double bouquet cellsoffer complementary information regarding the compartmentalization of the minicolumn(DeFelipe, Hendry et al. 1990; Lohmann and Koppen 1995; Casanova and Switala 2005) andhelp define the radial organization of the neocortex. Differences in the characteristics of theseconstituent minicolumnar compartments are exhibited across species (Schmolke and Künzle1997; Hof, Duan et al. 2002; Yáñez, Muñoz et al. 2005) and cytoarchitectonic areas (Skoglund,Pascher et al. 1996; Peters, Cifuentes et al. 1997; Yáñez, Muñoz et al. 2005; DeFelipe,Ballesteros-Yanez et al. 2006).
Peters and Sethares were the first to characterize the spatial relation of pyramidal cells in layersIII and V with the radially oriented translaminar dendritic bundles arising from them (Petersand Sethares 1996). They named these assemblages “pyramidal cell modules.” Lohmann andKoppen further demonstrated in rat visual cortex that apical dendritic and myelinated axonbundles project in register with each other at minicolumnar-scale intervals (52.6 μm and 50.1μm, respectively) (Lohmann and Koppen 1995) . The reported scale dimensions are consistentwith other studies (Buxhoeveden and Casanova 2002). Double-bouquet axons in peripheralneuropil similarly were found to align with myelinated axon bundles. This pattern of alignmentand of double-bouquet synaptic contacts with pyramidal cells was found to be similar in humantemporal and macaque visual cortex (del Rio and DeFelipe 1997). A close association hastherefore been demonstrated for all four constituent anatomical elements, the spacing of eachproviding equivalent information concerning minicolumnar width. However, methodologicallimitations (see below) have prevented the widespread use of pyramidal cell arrays, apicaldendritic bundles and double bouquet cells in studies of cortical modularity.
Among the different features establishing the radial organization of the isocortex, pyramidalcell arrays are probably the most difficult to validate anatomically. Pyramidal cells areintermixed with smaller neurons many of which lack a primary longitudinal axis. Similarly,cell arrays are derived from the ontogenetic minicolumn and are therefore one cell-wide(Casanova, Trippe et al. 2007). Previous column detection routines used this assumption andtook the separation between minicolumns as being of the same order of magnitude as theseparation between cell soma (Buxhoeveden, Switala et al. 2000). While this assumption may
Casanova et al. Page 4
J Neurosci Methods. Author manuscript; available in PMC 2009 March 15.
NIH
-PA Author Manuscript
NIH
-PA Author Manuscript
NIH
-PA Author Manuscript
hold true for columns in laminas II and III, it does not hold for those laminas where granularor stellar neurons abound, i.e., lamina IV. Cellular fields in this lamina tend to be oversegmented into fragments that are narrower than true anatomical minicolumns. The difficultyin correcting this artifact lies in the nature of the raw data. In this case, the separation betweentwo cells in adjacent, parallel columns may be indistinguishable from the separation betweencells within the same column. Furthermore, in rodent and other non-primate mammalianspecies, reduction in peripheral neuropil of tangentially-oriented collateral dendritic processesas well as number and complexity of interneurons is associated with increased packing densityof pyramidal cell columns. Consequently, visualization and morphometric analysis of thesestructures is limited in Nissl-stained tissue.
Apical dendritic bundles are well visualized with antibodies to microtubule-associated proteins(MAP2s) which are enriched in dendritic processes. These radially-oriented structures havebeen well characterized in visual cortex of rodents, cats, rabbits and monkeys (Peters and Kara1987; Peters and Sethares 1991; Peters and Sethares 1991; White and Peters 1993; Peters andSethares 1996; Peters, Cifuentes et al. 1997). In human medial prefrontal cortex, apicaldendritic bundles were shown to incorporate dendritic fascicles arising from radially alignedchains of pyramidal cells in layer V (Gabbott 2003). While equivalent in density to otherminicolumnar elements, these structures may serve to integrate and coordinate input to severalneighboring radial cell columns. In fact, the structure of those bundles varies according tocytoarchitectonic area (Viebahn 1990; Peters, Cifuentes et al. 1997; Skoglund, Pascher et al.2004) and among species (Schmolke and Künzle 1997). Increased branching complexity andspine density of basal dendritic arbors in the peripheral neuropil of human prefrontal cortex incomparison with that of old and new world monkeys suggests that altered morphometry of thiscompartment in humans results in increased integration of inputs among minicolumns. Thisdifference in the morphometry of the apical dendritic compartment may provide the basis forenhanced human cognition (Elston, Benavides-Piccione et al. 2001). Unfortunately, MAP2immunocytochemistry does not stain smaller dendritic processes as effectively (Peters andSethares 1996) and does not provide a high degree of quantitative consistency across samples.This limits its utility as an independent parameter for assessing minicolumnar morphometry.
The double bouquet cell has been identified as a characteristic feature of the minicolumnarperipheral neuropil compartment in monkeys and humans (DeFelipe, Hendry et al. 1990).Antibody labeling for the calcium binding protein calbinding reveals a regular periodicdistribution throughout cortex (Yáñez, Muñoz et al. 2005). Quantitative analysis of tissuelabeled with this method is therefore subject to the same technical limitations as for antibody-labeled dendritic bundles. Moreover, double bouquet cells have not been identified in largenumbers in non-primate species other than in visual cortex of carnivores (Yáñez, Muñoz et al.2005) and therefore cannot provide a basis for cross-species comparisons of minicolumnarmorphometry. In primates, double bouquet cells are not apposed to every pyramidal cellcolumn and therefore cannot be presumed to be an obligate component of a putativeminicolumnar microcircuit (Yáñez, Muñoz et al. 2005).
The spacing between myelinated fiber bundles provides an alternative to the scale estimatemethod employed in measuring distances between pyramidal cell arrays (Buxhoeveden,Switala et al. 2000). While bundles of axons appear to vary in thickness as they traverse laminas,they do not bifurcate. Thus, regardless of the cortical depth at which an observation is made,each bundle of myelinated fibers corresponds to one minicolumn. Furthermore, sincecollections of myelinated axons extend continuously throughout minicolumns (Peters andSethares 1996) any fragmentation apparent from a myelin-stained field must result from theplane of cut. Thus, the distribution of myelin bundle lengths yields estimates of the effects ofthe plane of cut on minicolumns defined by cell somas in serial sections.
Casanova et al. Page 5
J Neurosci Methods. Author manuscript; available in PMC 2009 March 15.
NIH
-PA Author Manuscript
NIH
-PA Author Manuscript
NIH
-PA Author Manuscript
Acknowledgements
This article is based upon work supported by the National Alliance for Autism Research (NAAR), and NIMH grantsMH62654, and MH69991.
ReferencesBailey, P.; von Bonin, G. The Neocortex of Man. Urbana, IL: University of Illinois Press; 1951.Brodmann, K. Vergleichende Lokalisationslehre der GroBhirnrinde. Leipzig: 1909.Buxhoeveden D, Switala A, et al. Quantitative analysis of cell columns in the cerebral cortex. J Neurosci
Methods 2000;97(1):7–17. [PubMed: 10771070]Buxhoeveden DP, Casanova MF. The minicolumn hypothesis in neuroscience. Brain 2002;125(5):935–
951. [PubMed: 11960884]Buxhoeveden, DP.; Casanova, MF. The cell column in comparative anatomy. New York, NY: Nova
Science Publishers, Inc; 2005.Campbell, AW. Histological Studies on teh Localization of Cerebral Function. Cambridge: Cambridge
University Press; 1905.Casanova, M.; Switala, AE. Minicolumnar Morphometry: Computerized Image Analysis. In: Casanova,
MF., editor. Neocortical Modularity and the Cell Minicolumns. New York, NY: Nova SciencePublishers, Inc; 2005. p. 161-180.
Casanova MF, Trippe J II, et al. A Temporal Continuity to the Vertical Organization of the HumanNeocortex. Cereb Cortex 2007;17(1):130–137. [PubMed: 16452639]
Chan, KK.; Lowe, J. Techniques in Neuropathology. In: Bancroft, JD.; Gamble, M., editors. Theory andPractice of Histological Techniques. London: Churchill Livingstone; 2002. p. 371-414.
Craven P, Wahba G. Smoothing noisy data with spline functions:estimated the correct degree ofsmoothing by method of generalized cross-validation. Numerische Mathematik 1979;31:377–403.
Daly, D. Cerebral Localization. In: Baker, AB.; Baker, LH., editors. Clinical Neurology. New York:Harper and Row; 1976.
de No, L. The cerebral cortex: architecture, intracortical connections, and motor projections. In: Fulton,JF., editor. Physiology of the nervous system. London: Oxford University Press; 1938. p. 291-339.
DeFelipe, J.; Ballesteros-Yanez, I., et al. Progress in Brain Research. 154. Elsevier; 2006. Double-bouquetcells in the monkey and human cerebral cortex with special reference to areas 17 and 18. Part 1:15
DeFelipe J, Hendry SHC, et al. A microcolumnar structure of monkey cerebral cortex revealed byimmunocytochemical studies of double bouquet cell axons. Neuroscience 1990;37(3):655. [PubMed:1701039]
del Rio MR, DeFelipe J. Double bouquet cell axons in the human temporal neocortex: relationship tobundles of myelinated axons and colocalization of calretinin and calbindin D-28kimmunoreactivities. Journal of Chemical Neuroanatomy 1997;13(4):243. [PubMed: 9412906]
Douglas RJ, Martin KAC. NEURONAL CIRCUITS OF THE NEOCORTEX. Annual Review ofNeuroscience 2004;27(1):419–451.
Elston GN, Benavides-Piccione R, et al. The Pyramidal Cell in Cognition: A Comparative Study inHuman and Monkey. J Neurosci 2001;21(17):163RC.
Gabbott PLA. Radial organisation of neurons and dendrites in human cortical areas 25, 32, and 32'. BrainResearch 2003;992(2):298. [PubMed: 14625070]
Hof PR, Duan H, et al. Age-related changes in GluR2 and NMDAR1 glutamate receptor subunit proteinimmunoreactivity in corticocortically projecting neurons in macaque and patas monkeys. BrainResearch 2002;928(1–2):175. [PubMed: 11844485]
Jones, EG. History of Cortical Cytology. In: Peters, A.; Jones, EG., editors. Cellular Components of theCerebral Cortex. 1. New York: Plenum Press; 1984. p. 1-32.
Lashley KS, Clark G. The cytoarchitecture of the cerebral cortex of Ateles: A critical examination ofarchitectonic studies. J Comp Neurol 1946;85:223–305.
Lohmann H, Koppen HJ. Postnatal development of pyramidal dendritic and axonal bundles in the visualcortex of the rat. J Hirnforsch 1995;36(1):101–111. [PubMed: 7751601]
Casanova et al. Page 6
J Neurosci Methods. Author manuscript; available in PMC 2009 March 15.
NIH
-PA Author Manuscript
NIH
-PA Author Manuscript
NIH
-PA Author Manuscript
Mountcastle VB. Brain mechanisms for directed attention. J R Soc Med 1978;71(1):14–28. [PubMed:416210]
Ong WY, Garey LJ. Neuronal architecture of the human temporal cortex. Anat Embryol (Berl) 1990;181(4):351–64. [PubMed: 2346228]
Otsu N. A threshold selection method from gray-level histograms. IEEE transactions on systems, man,and cybernetics 1979;9:377–393.
Peters A, Cifuentes JM, et al. The organization of pyramidal cells in area 18 of the rhesus monkey. CerebCortex 1997;7(5):405–421. [PubMed: 9261571]
Peters A, Kara DA. The neuronal composition of area 17 of rat visual cortex. IV. The organization ofpyramidal cells. J Comp Neurol 1987;260(4):573–90. [PubMed: 3611411]
Peters A, Sethares C. Layer IVA of Rhesus Monkey Primary Visual Cortex. Cereb Cortex 1991;1(6):445–462. [PubMed: 1726607]
Peters A, Sethares C. Organization of pyramidal neurons in area 17 of monkey visual cortex. J CompNeurol 1991;306(1):1–23. [PubMed: 1710236]
Peters A, Sethares C. Myelinated axons and the pyramidal cell modules in monkey primary visual cortex.J Comp Neurol 1996;365(2):232–55. [PubMed: 8822167]
Rockland KS. Visual cortical organization at the single axon level: a beginning. Neuroscience Research2002;42(3):155. [PubMed: 11900825]
Schmolke C, Künzle H. On the presence of dendrite bundles in the cerebral cortex of the Madagascanlesser hedgehog tenrec and the red-eared pond turtle. Anatomy and Embryology 1997;196(3):195.[PubMed: 9310312]
Seldon HL. Structure of human auditory cortex. I. Cytoarchitectonics and dendritic distributions. BrainResearch 1981;229(2):277. [PubMed: 7306814]
Seldon HL. Structure of human auditory cortex. II. Axon distributions and morphological correlates ofspeech perception. Brain Research 1981;229(2):295. [PubMed: 7306815]
Skoglund TS, Pascher R, et al. Aspects of the quantitative analysis of neurons in the cerebral cortex.Journal of Neuroscience Methods 1996;70(2):201. [PubMed: 9007760]
Skoglund TS, Pascher R, et al. Aspects of the organization of neurons and dendritic bundles in primarysomatosensory cortex of the rat. Neuroscience Research 2004;50(2):189. [PubMed: 15380326]
Viebahn C. Correlation between differences in the structure of dendrite bundles and cytoarchitectonicpatterns in the cerebral cortex of the rabbit. J Hirnforsch 1990;31(5):645–52. [PubMed: 1707078]
von Bonin G, Mehler W. On columnar arrangement of nerve cells in cerebral cortex. Brain Res 1971;27(1):1–9. [PubMed: 4101826]
Von Economo, CF.; Koskinas, GN. Die Cytoarchitektonic der Hirnrinde des erwachsenen Menschen.Wien: Springer; 1925.
White EL, Peters A. Cortical modules in the posteromedial barrel subfield (Sml) of the mouse. J CompNeurol 1993;334(1):86–96. [PubMed: 8408761]
Yáñez IB, Muñoz A, et al. Double bouquet cell in the human cerebral cortex and a comparison with othermammals. The Journal of Comparative Neurology 2005;486(4):344–360. [PubMed: 15846784]
Casanova et al. Page 7
J Neurosci Methods. Author manuscript; available in PMC 2009 March 15.
NIH
-PA Author Manuscript
NIH
-PA Author Manuscript
NIH
-PA Author Manuscript
Figure 1.Serial 35 μm sections from human cortical area 22, left hemisphere, stained with silver (left)and cresyl violet (right). The scale bar measures 400 μm.
Casanova et al. Page 8
J Neurosci Methods. Author manuscript; available in PMC 2009 March 15.
NIH
-PA Author Manuscript
NIH
-PA Author Manuscript
NIH
-PA Author Manuscript
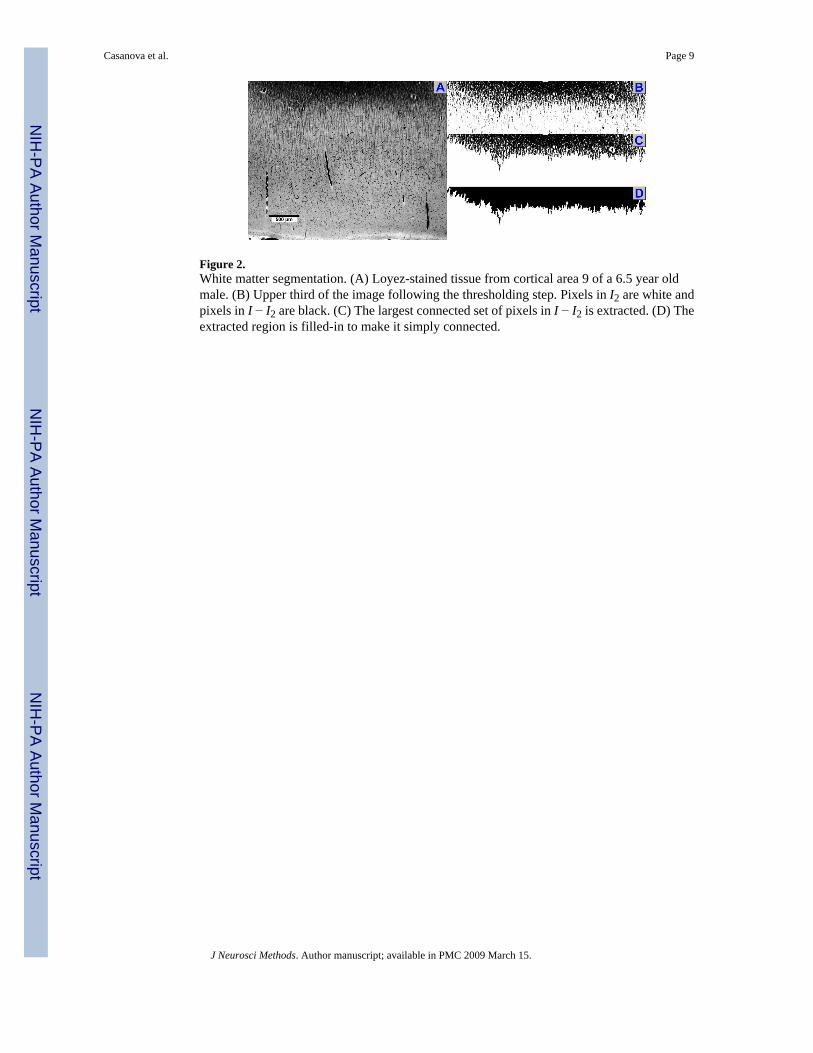
Figure 2.White matter segmentation. (A) Loyez-stained tissue from cortical area 9 of a 6.5 year oldmale. (B) Upper third of the image following the thresholding step. Pixels in I2 are white andpixels in I − I2 are black. (C) The largest connected set of pixels in I − I2 is extracted. (D) Theextracted region is filled-in to make it simply connected.
Casanova et al. Page 9
J Neurosci Methods. Author manuscript; available in PMC 2009 March 15.
NIH
-PA Author Manuscript
NIH
-PA Author Manuscript
NIH
-PA Author Manuscript
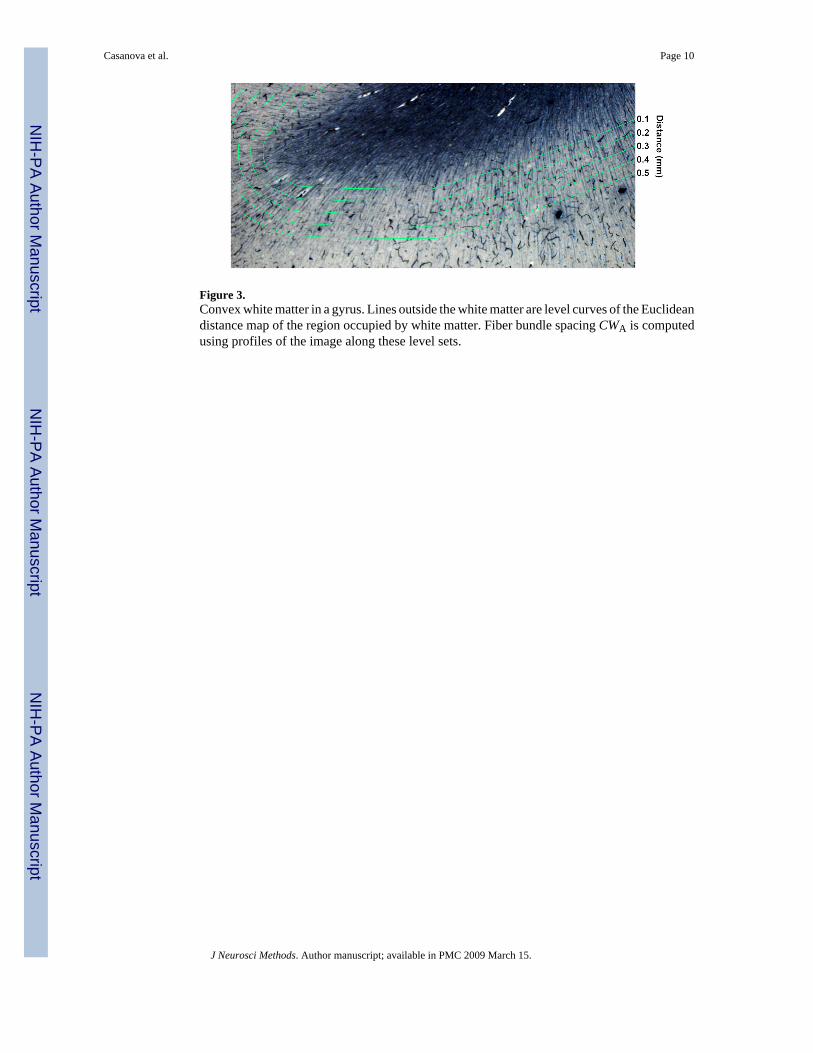
Figure 3.Convex white matter in a gyrus. Lines outside the white matter are level curves of the Euclideandistance map of the region occupied by white matter. Fiber bundle spacing CWA is computedusing profiles of the image along these level sets.
Casanova et al. Page 10
J Neurosci Methods. Author manuscript; available in PMC 2009 March 15.
NIH
-PA Author Manuscript
NIH
-PA Author Manuscript
NIH
-PA Author Manuscript
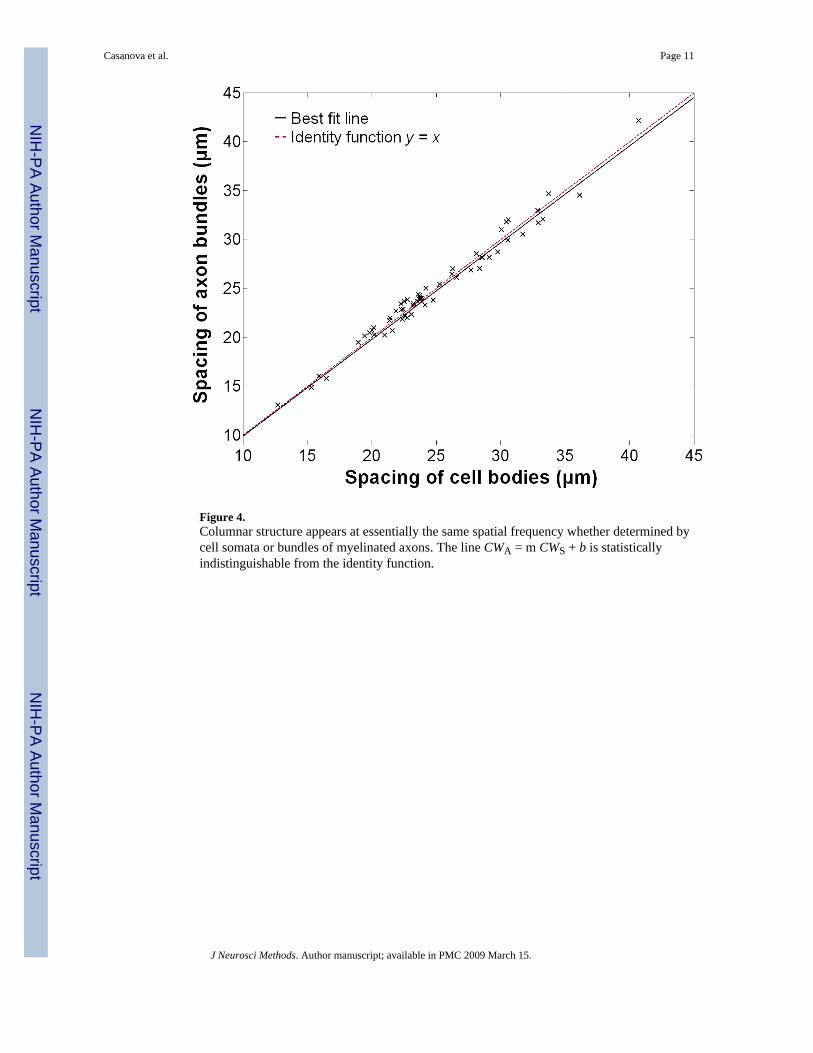
Figure 4.Columnar structure appears at essentially the same spatial frequency whether determined bycell somata or bundles of myelinated axons. The line CWA = m CWS + b is statisticallyindistinguishable from the identity function.
Casanova et al. Page 11
J Neurosci Methods. Author manuscript; available in PMC 2009 March 15.
NIH
-PA Author Manuscript
NIH
-PA Author Manuscript
NIH
-PA Author Manuscript
NIH
-PA Author Manuscript
NIH
-PA Author Manuscript
NIH
-PA Author Manuscript
Casanova et al. Page 12Ta
ble
1Su
mm
ary
of p
ostm
orte
m sa
mpl
es. M
ater
ial w
as a
vaila
ble
from
all
six
corti
cal a
reas
in a
ll ca
ses,
but s
tain
ing
qual
ity w
as su
ch th
at o
nly
the
area
s mar
ked
“✓”
wer
e m
easu
red.
case
age
sex
Bro
dman
n ar
ea4
917
2122
401
3.5
mal
e✓
✓✓
✓2
4fe
mal
e✓
✓✓
✓3
6.5
mal
e✓
✓✓
✓4
11fe
mal
e✓
✓✓
✓✓
519
mal
e✓
✓✓
✓✓
620
mal
e✓
✓7
25m
ale
✓✓
✓✓
✓8
25m
ale
✓✓
✓9
32fe
mal
e✓
✓✓
✓✓
1050
fem
ale
✓✓
✓11
50m
ale
✓✓
✓12
67fe
mal
e✓
1371
mal
e✓
✓✓
1486
mal
e✓
1594
fem
ale
✓✓
✓✓
✓16
98m
ale
✓✓
✓✓
✓
J Neurosci Methods. Author manuscript; available in PMC 2009 March 15.

NIH
-PA Author Manuscript
NIH
-PA Author Manuscript
NIH
-PA Author Manuscript
Casanova et al. Page 13
Table 2Per-area means and standard deviations for each columnar width measurement, in μm.
Cortical area CWA CWSmean s.d. mean s.d.
4 24.8 4.9 24.7 4.99 28.7 5.6 28.4 5.617 23.2 1.9 22.8 2.021 22.2 5.0 22.4 5.522 24.0 4.1 24.0 4.240 24.8 5.6 25.1 5.6
J Neurosci Methods. Author manuscript; available in PMC 2009 March 15.
Related Documents


