ERDC/EL TR-08-42 Recreation Management Support Program Recreation Visitor Survey Analysis — South Atlantic Division Julie B. Marcy, LiChu Lee, and Christine Wibowo December 2008 Environmental Laboratory Approved for public release; distribution is unlimited.

Welcome message from author
This document is posted to help you gain knowledge. Please leave a comment to let me know what you think about it! Share it to your friends and learn new things together.
Transcript

ERD
C/EL
TR-
08-4
2
Recreation Management Support Program
Recreation Visitor Survey Analysis — South Atlantic Division
Julie B. Marcy, LiChu Lee, and Christine Wibowo December 2008
Envi
ronm
enta
l Lab
orat
ory
Approved for public release; distribution is unlimited.

Recreation Management Support Program ERDC/EL TR-08-42 December 2008
Recreation Visitor Survey Analysis — South Atlantic Division
Julie B. Marcy, LiChu Lee, and Christine Wibowo Environmental Laboratory U.S. Army Engineer Research and Development Center 3909 Halls Ferry Road Vicksburg, MS 39180-6199
Final report Approved for public release; distribution is unlimited.
Prepared for U.S. Army Corps of Engineers Washington, DC 20314-1000

ERDC/EL TR-08-42 ii
Abstract: This report documents a multi-year analysis (2004–partial 2007) of recreation visitor satisfaction results and comments for the South Atlantic Division of the U.S. Army Corps of Engineers. Information concerning socio-demographics, recreation area satisfaction, visitor center satisfaction and importance, and general comments were analyzed. This report conveys the findings and potential management implications thereof.
DISCLAIMER: The contents of this report are not to be used for advertising, publication, or promotional purposes. Citation of trade names does not constitute an official endorsement or approval of the use of such commercial products. All product names and trademarks cited are the property of their respective owners. The findings of this report are not to be construed as an official Department of the Army position unless so designated by other authorized documents. DESTROY THIS REPORT WHEN NO LONGER NEEDED. DO NOT RETURN IT TO THE ORIGINATOR.

ERDC/EL TR-08-42 iii
Contents Figures and Tables.................................................................................................................................iv
Preface....................................................................................................................................................vi
Foreword ................................................................................................................................................vii
1 Introduction..................................................................................................................................... 1 Background .............................................................................................................................. 1 Data analysis ............................................................................................................................ 2 Socio-demographics................................................................................................................. 2
2 Recreation Area Comment Card Survey...................................................................................... 6
3 Visitor Center Comment Card Survey........................................................................................... 8
4 Results............................................................................................................................................. 9 Respondent profiles (socio-demographic characteristics)..................................................... 9
Ethnic and racial affiliation.......................................................................................................... 9 Management implications .........................................................................................................10 Repeat visitation ........................................................................................................................12 Management implications .........................................................................................................12
Federal agency visitor age distribution comparison.............................................................12 Recreation area satisfaction..................................................................................................13
Overall project visitor recreation area satisfaction mean........................................................15 Management implications .........................................................................................................16
Federal agency recreation area satisfaction comparisons..................................................16 Visitor center visitor satisfaction and importance................................................................ 17 Federal agency visitor center satisfaction comparison........................................................22 Recreation area visitor comment analysis............................................................................22 Federal agency recreation area improvement priority comparison.....................................25 Visitor center comment analysis ...........................................................................................26 Federal agency visitor center improvement comment comparison ....................................29
5 Study Limitations and Error.........................................................................................................30
6 Summary and Discussion............................................................................................................32
References............................................................................................................................................34
Appendix A: Recreation Area Visitor Comment Card – 2006 to Present......................................36
Appendix B: Visitor Center Comment Card.......................................................................................38
Report Documentation Page

ERDC/EL TR-08-42 iv
Figures and Tables
Figures
Figure 1. South Atlantic Division boundary and major recreation projects. ......................................... 1 Figure 2. 2006 USACE American Customer Satisfaction Index mode.................................................. 4 Figure 3. 2006 day use respondent racial affiliation. .......................................................................... 10 Figure 4. 2006 camping respondent racial affiliation.......................................................................... 10 Figure 5. 2006 recreation area facility satisfaction ratings................................................................. 14 Figure 6. 2006 recreation area employee satisfaction ratings ........................................................... 14 Figure 7. 2006 recreation area environmental setting satisfaction ratings. ...................................... 14 Figure 8. 2006 recreation area overall satisfaction ratings................................................................. 14 Figure 9. 2006 visitor center visitor facilities satisfaction ratings.......................................................18 Figure 10. 2006 visitor center visitor programs and services satisfaction ratings............................18 Figure 11. 2006 visitor center visitor overall satisfaction ratings. ......................................................19 Figure 12. 2006 visitor center visitor facilities importance ratings.....................................................19 Figure 13. 2006 visitor center visitor programs and services importance ratings............................19 Figure 14. 2006 visitor center visitor overall importance ratings........................................................20 Figure 15. 2006 visitor center visitor top three reasons for visiting center........................................20 Figure 16. 2006 visitor center survey management implications. ..................................................... 21 Figure 17. 2007 visitor center survey management implications. ...................................................... 21 Figure 18. Recreation area most-liked features comment categories and percentage of respondents..............................................................................................................................................23 Figure 19. Recreation area suggested improvement comment categories and percentage of respondents. ........................................................................................................................................ 24 Figure 20. Visitor center most-liked facility comment categories and percentage of respondents.............................................................................................................................................. 27 Figure 21. Visitor center suggested improvement comment categories and percentage of respondents.............................................................................................................................................. 27 Figure 22. Visitor center primary reason for visiting and percentage of respondents. .....................28

ERDC/EL TR-08-42 v
Tables
Table 1. Overall SAD project visitor satisfaction compared to national scores. ................................... 3 Table 2. American Customer Satisfaction Index Corps recreation drivers of satisfaction. ................. 4 Table 3. SAD visitor center satisfaction scores compared to national scores...................................... 5 Table 4. 2006 American Community Survey results, ethnic and racial composition, SAD...............11 Table 5. Overall visitor satisfaction mean. .............................................................................................15 Table 6. General comparison of overall satisfaction with other Federal agencies. ........................... 16 Table 7. Overall SAD visitor center visitor satisfaction mean ............................................................... 17 Table 8. Federal agency visitor center satisfaction ratings comparison. ............................................22

ERDC/EL TR-08-42 vi
Preface
The work reported herein was undertaken via a request from the South Atlantic Division, U.S. Army Corps of Engineers.
This report was prepared by Julie Marcy, Environmental Laboratory (EL), U.S. Army Engineer Research and Development Center (ERDC). Dr. LiChu Lee, EL, ERDC, and Christine Wibowo, EL, ERDC, conducted preliminary data analyses. Richard Kasul, EL, ERDC, provided additional assistance and formulated the Customer Comment procedures with assistance from Dr. Wen-Huei Chang, ERDC. This work was conducted under the general supervision of Antisa Webb, Chief, Ecological Resources Branch (ERB), EL; Dr. David Tazik, Chief, Ecosystem Evaluation and Engineering Division (EEED), EL; and Dr. Elizabeth Fleming, Director, EL.
Peer reviewers of this report were Brad Keshlear, South Atlantic Division (SAD) Recreation Program Manager (reemployed annuitant) and Kathleen Perales, EL, ERDC. Additional coordination occurred with Susan Whittington, Acting Chief, Operations and Regulatory CoP, SAD, and Scott Strotman, SAD Natural Resources Program Manager.
COL Gary E. Johnston was Commander and Executive Director of ERDC. Dr. James R. Houston was Director.

ERDC/EL TR-08-42 vii
Foreword
The U.S. Army Corps of Engineers initiated a customer comment card program in 1994 in response to Executive Order 12862 (The White House 1993) issued on 11 September 1993 for monitoring visitor satisfaction at Corps lakes and projects. The methodology has evolved over time to include administering standardized surveys at most Corps projects in 2004, and adding survey tools and procedures for conducting satisfaction surveys at visitor centers in 2005 with routine VC monitoring beginning in 2006. In September 2007, SAD requested that ERDC provide a more in-depth analysis of this data to identify trends and management implications.
South Atlantic District (SAD) recreation projects studied for 2004 were:
• Mobile District – Black Warrior and Tombigbee Rivers, Buford Dam/Lake Sidney Lanier, Carters Lake, Claiborne Lake/Alabama and Coosa Rivers, Jim Woodruff Lock & Dam/Lake Seminole, Millers Ferry Lock/Alabama and Coosa Rivers, Okatibbee Lake, Robert F. Henry Lock/Jones Bluff, Alabama and Coosa Rivers, Tennessee Tombigbee Waterway, Walter F. George Lock & Dam, West Point Lake
• Savannah District – Hartwell Dam & Lake • Wilmington District – B. Everett Jordan Dam & Lake, Philpott Lake,
W. Kerr Scott Dam & Reservoir
SAD recreation projects studied for 2005 were:
• Mobile District – Allatoona Lake, Black Warrior and Tombigbee Rivers, Buford Dam/Lake Sidney Lanier, Carters Lake, Claiborne Lake/Alabama and Coosa Rivers, Jim Woodruff Lock & Dam/Lake Seminole, Millers Ferry Lock/Alabama and Coosa Rivers, Okatibbee Lake, Robert F. Henry Lock/Jones Bluff, Alabama and Coosa Rivers, Tennessee Tombigbee Waterway, Walter F. George Lock & Dam, West Point Lake
• Savannah District – Hartwell Dam & Lake, J. Strom Thurmond Dam & Lake
• Wilmington District – B. Everett Jordan Dam & Lake, John H. Kerr Dam, Philpott Lake, W. Kerr Scott Dam & Reservoir

ERDC/EL TR-08-42 viii
SAD recreation projects studied for 2006 were:
• Mobile District – Allatoona Lake, Black Warrior and Tombigbee Rivers, Buford Dam/Lake Sidney Lanier, Carters Lake, Claiborne Lake/Alabama and Coosa Rivers, Jim Woodruff Lock & Dam/Lake Seminole, Millers Ferry Lock/Alabama and Coosa Rivers, Okatibbee Lake, Robert F. Henry Lock/Jones Bluff, Alabama and Coosa Rivers, Tennessee Tombigbee Waterway, Walter F. George Lock & Dam, West Point Lake
• Savannah District – Hartwell Dam & Lake, J. Strom Thurmond Dam & Lake
• Wilmington District – B. Everett Jordan Dam & Lake, Falls Lake, John H. Kerr Dam, Philpott Lake, W. Kerr Scott Dam & Reservoir
SAD recreation projects studied for 2007 (partial year data) were:
• Mobile District – Alabama River Lakes (Dannelly, Woodruff, Clairborne), Allatoona Lake, Black Warrior and Tombigbee Rivers, Buford Dam/Lake Sidney Lanier, Jim Woodruff Lock & Dam/Lake Seminole, Tennessee Tombigbee Waterway
• Wilmington District – W. Kerr Scott Dam & Reservoir
SAD Visitor Centers studied for 2006 were:
• Mobile District – Alabama River Lakes Site, Allatoona Lake Operations Managers Office, Black Warrior and Tombigbee Rivers, Carters Lake, Lake Sidney Lanier, Millers Ferry Resource Office, Okatibbee Lake Project Office, Tom Bevill Visitor Center, West Point Lake
• Savannah District – Hartwell Lake • Wilmington District – B. Everett Jordan Lake Visitor Center, John H.
Kerr Reservoir, Philpott Lake Visitor Assistance, W. Kerr Scott Reservoir
SAD Visitor Centers studied for 2007 (partial year data) were:
• Mobile District – Allatoona Lake Operations Managers Office, Carters Lake, Jamie L. Whitten Visitor Center, Tom Bevill Visitor Center, West Point Visitor Center
• Wilmington District - B. Everett Jordan Lake Visitor Center, W. Kerr Scott Reservoir

ERDC/EL TR-08-42 1
1 Introduction Background
This report documents a multi-year analysis (2004- partial 2007) of recre-ation visitor satisfaction results and comments for the South Atlantic Divi-sion (SAD) of the U.S. Army Corps of Engineers (Corps, USACE). SAD is one of eight regional offices of the Corps, with responsibility for planning, design, construction, and operation of a wide variety of military and water resources projects. The Division provides services to soldiers, airmen, and civilians in eight southeastern states (Tennessee for military projects only), from Virginia to Mississippi (Figure 1).
Figure 1. South Atlantic Division boundary and major recreation projects.

ERDC/EL TR-08-42 2
Recreation resources at SAD include: annual visitation of approximately 65,000,000 visits, 833 recreation areas, 13,644 campsites, 584 miles of trail, 260 swimming beaches, and 56 marinas (USACE 2008a, 2008c). This results in $704 million in value-added economic impact (USACE 2006). SAD is one of eight regional offices of the Corps, with responsibility for planning, design, construction, and operation of a wide variety of military and water resources projects. This study is limited to Civil Works water resources lakes in SAD.
Data analysis
Data originated from customer comment surveys administered at each recreation project and reported on the Natural Resources Management Gateway (USACE 2008b, and procedural details in Section 2 of this report). Visitors surveyed included those at day use areas, campgrounds, recreation areas with both camping and day use, and visitor centers (VC). Standardized customer comment cards (Appendices A and B) were administered by SAD project personnel via an established methodology (USACE 2008a).
Analyses were performed on respondent socio-demographics, satisfaction and importance levels, and general visitor comments with the findings and potential management implications reported herein. Further preliminary analysis was performed on visitor satisfaction and importance ratings, respondent demographics, home Zip code, state, and country using Access database and Crystal Reports Presentation. Additional analysis was per-formed on visitor satisfaction and comment analyses using Statistical Analysis Software (SAS), SAS BASE, SPSS Base, and SPSS Text Analysis. Comment Cards from 15 projects were analyzed for 2004, 18 for 2005, 20 for 2006, and 9 for partial 2007. Comment cards from 14 visitor centers in 2006 and 7 in 2007 were also assessed. Results were compared to annual surveys of the American Customer Satisfaction Index (ACSI) for the Corps Recreation Program (ACSI 2006, Figure 2 and Table 1). Comparison recreation visitor feedback information for other federal agencies is provided for some analysis categories, where appropriate.
Socio-demographics
Visitors were predominantly from Georgia, Alabama, North Carolina, Mississippi, Florida, South Carolina, and Virginia, with Georgia and Alabama providing the most visitors. Approximately 56 percent of visitors

ERDC/EL TR-08-42 3
surveyed were men, and 38 percent women (remaining undeclared). An assessment of 2006 data by Day Use and Camping revealed that Day Use visitors were 71 percent non-Hispanic, 6 percent Hispanic, and 23 percent undeclared plus 76 percent Caucasian, 12 percent African American, 1 percent each of Asian, American Indian, and bi/multi-racial (remaining undeclared). Camping visitors were 71 percent non-Hispanic, 1 percent Hispanic, and 28 percent undeclared plus 94 percent Caucasian, 1 percent each of African American, American Indian, and bi-/multi-racial (remain-ing undeclared). Of these visitors, the majority were repeat visitors (67–87 percent). This representation appeared to generally apply to the other sampling years as well.
Recreation area satisfaction indicated that visitors surveyed at SAD projects consistently meet, and often exceed, Corps National recreation mean satisfaction scores indicating that visitors are highly satisfied with their recreation experience for those topics included in the survey. Overall SAD project visitor satisfaction scores shown in Table 1 were based on a 5-point scale (very good = 5, good = 4, not poor/not good = 3, poor = 2, and very poor = 1) and combining ratings of good and very good. Note that there was some variation in the survey instrument between 2004 and 2007.
Table 1. Overall SAD project visitor satisfaction compared to national scores.
Year SAD Mean National Mean
2004 4.6 4.4
2005 4.7 4.6
2006 4.7 4.6
Partial 2007 4.7 4.7
Recurring trends for recreation elements the visitors liked most in recre-ation areas included: quality of natural resources, quiet setting, and clean facilities. Recurring trends for recreation elements visitors would like to see improved included: adding/improving utility hook-ups, adding showers or restrooms, and improving lighting. These findings correspond with the annual American Customer Satisfaction Index results (Figure 2 and Table 2) that show facilities, quality lands and waters, and the avail-ability of information and visitor services as major drivers of satisfaction for Corps recreation visitors (ACSI 2006). The ACSI is a weighted average of three questions: Q11, Q12, and Q13. The questions are answered on 1-10 scales, but the weighted average is transposed and reported as an index on a 0-100 scale. The three questions measure: Overall satisfaction (Q11); Fallen short of or exceeded expectations (Q12); and Comparison to an ideal (Q13).

ERDC/EL TR-08-42 4
Figure 2. 2006 USACE American Customer Satisfaction Index model (scale 0–100).
Table 2. American Customer Satisfaction Index Corps recreation drivers of satisfaction.
Activities That Drive Satisfaction 2006 2005 2004 2003 2002 2001 Facilities 76 77 77 79 77 73 Land & Waters 81 80 82 84 81 79 Information 76 76 74 75 76 71 Visitor Services 72 71 71 72 71 66 Major Drivers of Satisfaction Perceived Value 80 81 80 81 80 NM Customer Expectations (Quality Anticipated)
72 73 75 73 72 69
Perceived Quality (Quality Experienced)
78 79 79 80 79 76
Visitor Center satisfaction and importance ratings showed that scores met or exceeded the National mean scores for Visitor Centers. Overall VC satisfaction scores (Table 3) were based on a 5-point scale and combining ratings of good and very good:

ERDC/EL TR-08-42 5
The helpfulness and availability of VC staff, restroom acceptability, conven-ient parking and brochures garnered the highest satisfaction scores while guided tour quality and exhibits for children received the lowest satisfac-tion scores. Available staff, restroom quality, convenient parking and brochures received the highest impor-tance scores, while guided tours and bookstores received the lowest importance scores.
Table 3. SAD visitor center satisfaction scores compared to national scores.
Year SAD Mean National Mean
2006 4.8 4.7
Partial 2007 4.7 4.7
Visitor Center customers reported viewing exhibits and obtaining infor-mation as their primary reasons for visiting VC’s. VC elements that visi-tors like most included helpful attendants and attractive facilities. VC elements that visitors would like to see improved included: improving or expanding exhibits/displays, and adding vending machines.
Management implications derived from the SAD visitor comment analysis include insights into populations that may not be participating in Corps recreation, potential perception and expectation differences between first time and repeat visitors, satisfaction rating differences between projects, and potential emphasis areas based on combining satisfaction and impor-tance ratings. As recreation area availability and visitor travel costs change in the future, the information contained in this report may serve as a baseline reference.

ERDC/EL TR-08-42 6
2 Recreation Area Comment Card Survey
Executive Order 12862 (The White House 1993) issued on 11 September 1993 was the impetus for a Corps recreation customer comment card program. The program initiated in 1994 at recreation areas in order to monitor visitor satisfaction at Corps lakes and projects. The methodology evolved over time to include administering standardized surveys at most Corps projects in 2004. Richard Kasul and Dr. Wen-Huei Chang, ERDC, developed the Comment Card data collection procedures that include the Survey Schedule Generator, and Christine Wibowo, ERDC, provides technical support to project personnel conducting the surveys (USACE 2008a). An archived history of survey instruments and methodologies used may also be found at the referenced site.
The automated Survey Schedule Generator is used by field personnel to develop a sampling schedule(s) that lists the locations (recreation areas) and times (dates) on a Project at which a fixed quota of comment cards will be administered to visitors. Most Projects generate two different sam-pling schedules - one for day use visitors and another for camping visitors with customizations available for recreation seasons and holidays. This generally results in 20 sampling periods for each day of day use and camp-ing and the collection of 8 samples/cards per sampling period. Current surveys include 160 day use and 160 camping surveys per project, along with 20 VC surveys per week for an 8-week period. The survey forms (Figures A1 and B1) are available in both English and Spanish versions. For the Fiscal Year 07/08 survey, the survey was optional for projects that received a recreation business area budget of less than $50,000 the pre-vious year. Beginning with the Fiscal Year 08/09 survey, annual surveys will be optional, with national surveys conducted every three years. Result-ing survey data are collected on the Natural Resources Management Gateway Customer Comment Surveys database where comparisons are made by project, district, division, and nationally (USACE 2008b).
Surveyed recreation area visitors were asked to comment on: whether or not they are a first-time visitor, the park facilities they used, fees paid, socio-demographic information, their level of satisfaction with facilities, employees, environmental setting, and an overall satisfaction rating. A five-point scale ranging from Very Good to Very Poor was used to gauge

ERDC/EL TR-08-42 7
satisfaction. Finally, visitors were asked to describe what they liked most about the area, and what improvements they would like to see in the area.

ERDC/EL TR-08-42 8
3 Visitor Center Comment Card Survey
Procedures for conducting satisfaction surveys at Corps visitor centers (VC) were tested in 2005 with routine VC monitoring beginning in 2006 (Appendix B). The automated survey planning tool produces a sampling schedule showing the number of comment cards and time of the day that cards should be administered during each day of an eight-week primary sampling season (20 VC surveys per week during the 8 weeks). A sampling schedule can also be produced for VC’s that elect to survey an optional secondary sampling season.
Surveyed VC visitors were asked to comment on: whether or not they are a first-time visitor, their primary reason for visiting the center, whether or not children accompanied them, and socio-demographic information. They were also asked to score the importance of and satisfaction with features such as Facilities, Programs and Services, and overall satisfaction. A five-point scale ranging from Very Good to Very Poor was used to gauge satisfaction, and a four-point scale ranging from Very Important to Not Important was used to gauge importance. Finally, visitors were asked to describe what they liked most about the visitor center, and what improve-ments they would like to see.
ERDC/EL TR-08-42 9
4 Results
Results are provided in the following nine topic areas:
• Respondent profiles (socio-demographic characteristics) • Federal agency visitor age distribution comparison • Recreation area satisfaction • Federal agency recreation area satisfaction comparisons • Visitor center satisfaction and importance • Federal agency visitor center satisfaction comparisons • Recreation area visitor comment analysis • Federal agency visitor comment comparisons • Visitor center visitor comment analysis.
Corresponding management considerations are also provided for each primary topic area.
Respondent profiles (socio-demographic characteristics)
For both recreation area and visitor center visitors, the majority of respondents were from Georgia, Alabama, North Carolina, Mississippi, Florida, and South Carolina with Virginia, Georgia and Alabama providing the most visitors. Of these, approximately 56 percent of those surveyed were male, and 38 percent female.
Ethnic and racial affiliation
Affiliation was examined for 2006 by camping and day use. For day use, 71 percent of respondents were non-Hispanic, 6 percent Hispanic, and 23 percent undeclared. For camping, 71 percent of respondents were non-Hispanic, 1 percent Hispanic, and 28 percent undeclared. For day use, racial affiliation was 76 percent Caucasian, 12 percent Black, and 1 percent each of Asian, American Indian, and Bi-/Multi-Racial (remaining unde-clared, Figure 3). For camping, racial affiliation was 94 percent Caucasian, and 1 percent each of Black, American Indian, and Bi-/Multi-Racial (remaining undeclared, Figure 4).

ERDC/EL TR-08-42 10
Results of the 2006 American Community Survey (U.S. Cen-sus Bureau 2008) are summa-rized in Table 4, which shows ethnic and racial composition for the primary states in the South Atlantic Division that differs from the respondent composition. Note that the totals may not equal 100 per-cent in that the separate census for ethnic and racial groups is hereby combined:
Management implications
The ethnic and racial affiliation of surveyed project visitors may not be proportionate to county or state norms in that minorities (Black, Hispanic, Asian (BHA)) appear to be under-represented. Note that the choice of which visitors in the recreation area and camping surveys received the questionnaire with respect to age, gender, ethnicity and other factors, was not controlled and may influence the results. If increasing visitation or having project visitors ethnically and racially mirror the surrounding population were desired, then this could be addressed. There are many possible reasons for the current apparent variation including: BHA visi-tors being under-represented in surveys; regional variations in the distri-bution of ethnic groups; a decrease in all visitors to outdoor recreation sites; lack of available transportation to the lakes, BHA visitors seeking different facilities than those offered by the Corps, and survey data limita-tions as described in the Study Limitations and Error section of this report.
Caucasian -76%
Black - 12%
Bi/Multi-Racial - 1%
Asian - 1%
AmericanIndian - 1%
Figure 3. 2006 day use respondent racial affiliation.
Caucasian -94%
Black - 1%
Bi/Multi-Racial - 1%
AmericanIndian 1%
Figure 4. 2006 camping respondent racial affiliation.

ERDC/EL TR-08-42 11
Table 4. 2006 American Community Survey results, ethnic and racial composition, SAD.
State Percent Caucasian
Percent Black
Percent Hispanic
Percent Asian
Percent American Indian/Alaska Native
Alabama 69 29 2.4 1 0.4
Georgia 62 30 7.4 3 0.2
Mississippi 59 38 1.6 0.8 0.4
North Carolina 70 22 6.8 1.9 1.1
Virginia 71 20 6.2 4.8 0.2
Focus group research performed by Bob Dunn, USACE indicated that Black visitors often preferred large, day use group shelters to accommo-date family and community groups; that Hispanic visitors preferred both day use and camping facilities that accommodate large family groups as well as grassy fields for sports like soccer; and that Asian visitors were interested in day use facilities that accommodate large family groups, along with interpretive or educational programs (Dunn and Quebedeaux 1999). More recent research on Hispanic visitors by the U.S. Forest Service (USFS) also indicated a preference for larger-sized picnic tables, grouping of tables, trash cans near picnic sites, nearby barbeques, increased parking and flush toilets in restrooms (U.S. Department of Agriculture (USDA) 2007). Additional research by the U.S. Forest Service (National Visitor Use Monitoring Program) has found that Blacks account for only 0.7 percent of visits to national forests across the country, and no more than 5 percent of visits to any national forest across the South, yet represent 12 percent of the U.S. population (USDA 2007).
Additional insight may be gained from a National Park Service survey of over 3,500 households (visitors and non-visitors) on ethnic and racial diversity that showed: Hispanic and African Americans felt they lacked information about what to do inside a park, and that the costs of hotels and food were too high. Hispanics also noted concern with having to make reservations too far in advance and safety in parks (Solop et al. 2003). In addition, African Americans were more than three times as likely as whites to believe that park employees gave poor service to visitors, and that parks were uncomfortable places to be for people similar to themselves. Another NPS study (Gramann 2003) found that “the fastest growing segment of the U.S. population is made up of people who are under-represented in visits to national parks – Latinos and other peoples of color.”

ERDC/EL TR-08-42 12
Repeat visitation
The 2006 Corps survey data were examined for the percentage of visitors who visited previously, revealing that the majority of visitors surveyed were repeat visitors. This ranged from 67 to 87 percent repeat visitors, depending on the project examined. One comparison is a USFWS study in which 44 percent of surveyed visitors indicated they were visiting a refuge for the first time, and 87 percent indicating they were likely to visit a refuge again in the next 2 years (Pacific Consulting Group 2005).
Management implications
Having a high percentage of repeat visitors is advantageous, since it represents a loyal customer base. But, repeat visitors may also be more demanding when it comes to level of service or facility modernization. This would appear to correspond with visitor comments received concerning desired facility upgrades. If a visitation increase is desired, then marketing efforts could be targeted at visitor populations who are not currently being served. In the 2006 American Customer Satisfaction Index survey (ACSI 2006), the top reasons visitors gave for returning to Corps sites were: convenient/accessible, offers many types of recreation, well cared for/ clean, beautiful scenery, enjoyment, and value for price. It is also impor-tant to view evaluations from first-time visitors since they are a likely source of future visitation if they like what is being offered. If they don’t, they are unlikely to return. Therefore, knowing how first-time visitors react to Corps facilities, services, and environmental settings helps to gauge what future visitors may expect. Knowing who first-time visitors are likely to be will also help direct marketing efforts, modernization efforts, and other activities designed to bring in and retain new visitors.
Federal agency visitor age distribution comparison
Comparing the age distribution of surveyed SAD visitors on Corps projects to the age distribution of visitors to other federal lands provides a broader perspective of the recreating public. It should be noted that this is a general comparison due to variations in survey methodology, facilities, and visitors and that not all totals will equal 100 percent.
A representative excerpt from 2006 found the following age representa-tion among SAD Corps visitors surveyed:

ERDC/EL TR-08-42 13
• Under 25 – 11% • 25 to 44 – 39% • 45 to 61 – 27% • 62 and above – 20%
A U.S. Forest Service study of national visitors January 2000 through September 2003 found the following age distribution (USDA 2005):
• Under 20 – 22% • 20 to 49 – 53% • 50 to 59 – 14% • Over 60 – 11%
A U.S. Fish and Wildlife Service (USFWS) National Wildlife Refuge visitor satisfaction survey had the following age distribution (USFWS 2005):
• 18 to 21 – 5% • 22 to 40 – 23% • 41 to 60 – 47% • Over 61 – 25%
A National Park Service analysis of visitors during the period 1997 to 1999 revealed (Forist et al. 2003):
• Under 31 – 14% • 31 to 40 – 22% • 41 to 60 – 47% • Over 61 – 16%
A National Park Service analysis of visitors during the period 1992 to 2005 shows (Le et al. 2006):
• Under 18 – average 20% • Over 64 – average 11%
Recreation area satisfaction
In general, surveyed SAD projects consistently meet Corps national recre-ation area mean satisfaction scores indicating that surveyed visitors are highly satisfied with their recreation experience for those topics included in the survey. Visitors who respond “Good” or “Very Good” to a question
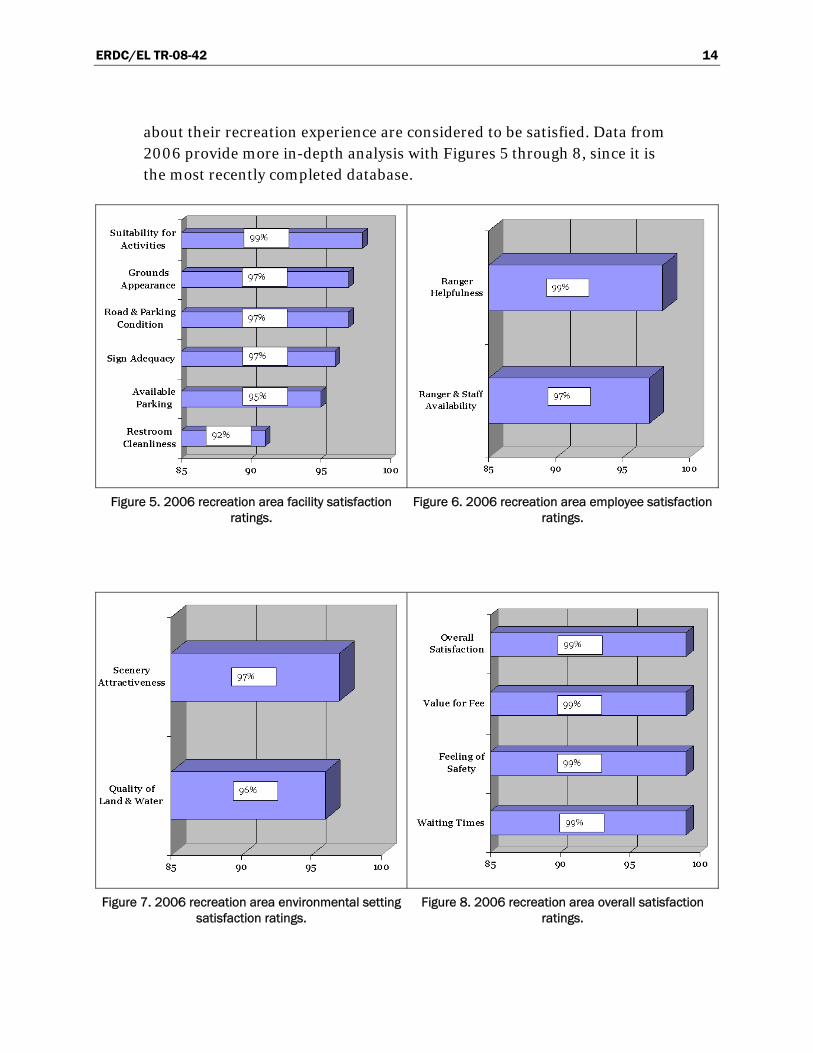
ERDC/EL TR-08-42 14
about their recreation experience are considered to be satisfied. Data from 2006 provide more in-depth analysis with Figures 5 through 8, since it is the most recently completed database.
Figure 5. 2006 recreation area facility satisfaction ratings.
Figure 6. 2006 recreation area employee satisfaction ratings.
Figure 7. 2006 recreation area environmental setting satisfaction ratings.
Figure 8. 2006 recreation area overall satisfaction ratings.

ERDC/EL TR-08-42 15
Overall project visitor recreation area satisfaction mean
SAD recreation visitor satisfaction met overall satisfaction means for all sampled Corps recreation areas based on a 5-point scale (very good = 5, good = 4, not poor/not good = 3, poor = 2 and very poor = 1) and combining ratings of Good and Very Good where scores of Good and Very Good are combined to equate to satisfaction (Table 5).
Table 5. Overall visitor satisfaction mean.
2004 SAD Mean - 4.6 National Mean – 4.4 2005 SAD Mean - 4.7 National Mean – 4.6 2006 SAD Mean - 4.7 National Mean – 4.6 Partial 2007 SAD Mean - 4.7 Partial National Mean – 4.7
Overall recreation area satisfaction scores were as follows: (response of good or very good combined to equate to satisfaction; 0–100 scale designating percentage of responses pertaining to topic area):
• 2004 – Overall Satisfaction – 96% • 2005 – Overall Satisfaction – 99% • 2006 – Overall Satisfaction – 99% • 2007 Partial – Overall Satisfaction – 98%
Highest Recreation Area Satisfaction Scores: (0-100 scale designating percentage of responses pertaining to topic area)
• 2004 – Safety and Security of the Recreation Area – 96% • 2005 – Facility Suitability for Activities – 98% • 2006 – 99-percent rating for Feeling of Safety, Overall, Employee
Helpfulness, Overall Value for Fee Paid, Waiting Time, and Facility Suitability for Activities
• 2007 Partial – 98 percent for Facility Suitability for Activities, Value for Fee Paid, Safety, Facility Grounds, and Attractive Environment
Lowest Recreation Area Satisfaction Scores: While representing good scores, the following areas received the lowest scores of combined ratings for very good and good and represent possible areas for manage-ment emphasis:

ERDC/EL TR-08-42 16
• 2004 – Restroom Cleanliness – 87% • 2005 – Restroom Cleanliness – 91% • 2006 – Restroom Cleanliness – 92% • 2007 Partial – Restroom Cleanliness – 91%
Management implications
The overall SAD annual visitor recreation area satisfaction level ranged from 4.4 to 4.7 on a 5-point scale, which is equal to the national Corps annual visitor satisfaction level for the same period. Visitors were most satisfied with facility suitability for recreation activities and a feeling of safety. Although still scoring relatively high, restroom cleanliness tended to receive lower scores overall. This corresponds with information generated in the annual ACSI survey (ASCI 2006) “In particular, cleanliness of the facilities scores the lowest … and would make a good focal point for improvement that would lead to a better perceived overall quality of the sites.”
Federal agency recreation area satisfaction comparisons
Recreation Area Visitor Satisfaction: Comparing survey results for Corps projects to visitor survey results for other federal agencies provides some insight into satisfaction levels for a broader base of recreation customers (Table 6). It should be noted that this is a general comparison due to variations in survey methodology, facilities, and visitors.
Table 6. General comparison of overall satisfaction with other Federal agencies.
Year SAD Percent Satisfied Agency Percent Satisfied 2004 96 USFWS 1 95 2005 99 - - 2006 99 NPS2 96 2006 99 BLM3 96 2006 99 USFS4 85 1 Rated 4 or 5 satisfied with US Fish & Wildlife Service (USFWS) wildlife refuge experience
from interview questionnaires (Pacific Consulting Group 2005). 2 Good/Very Good National Park Service (NPS) overall visitor satisfaction rating from
comment card surveys (Le et al. 2007). 3 Good/Very Good rating for Bureau of Land Management (BLM) recreation visitors satisfied
with the quality of their recreation experience from questionnaire (BLM 2007). 4 Good/Very Good overall aggregate satisfaction for U.S. Forest Service (USFS) recreation
customers satisfied with “outdoor recreation services and facilities provided in a sustainably managed natural setting” from interviews (USFS 2007).

ERDC/EL TR-08-42 17
Agency Visitor Characteristics: A study undertaken by The Recre-ation Roundtable in January 2004 noted some interesting comparisons for recreation visitors to federal agency sites (RoperASW 2004). This included: families being over-represented among visitors to Corps, USFS, and NPS sites; younger adults (ages 18-29) being over-represented among visitors to national forests and national parks; families with incomes of $50K – $75K being over-represented among visitors at each of Corps, USFS, NPS, USFWS, and BLM sites; and visitors at federal sites being above average in computer ownership and Internet access at home.
Management Implications: The satisfaction ratings of Corps visitors in SAD generally compare favorably with satisfaction ratings expressed by recreation visitors to other federal lands. An awareness of visitor socio-demographic characteristics can assist in identifying age groups or income levels that are not currently represented, and in targeting key message communication mediums such as the Internet for “computer-savvy” visitors.
Visitor center visitor satisfaction and importance
Visitor Center Satisfaction: Visitor center surveys began in 2006. Satisfaction with SAD visitor centers met or exceeded means for overall satisfaction at all sampled Corps visitor centers (Table 7). Data from 2006 provides more in-depth analysis beginning with Figure 11 since it is the most recently completed database.
Table 7. Overall SAD visitor center visitor satisfaction mean
2006 SAD Mean - 4.8 National Mean – 4.7 Partial 2007 SAD Mean - 4.7 Partial National Mean – 4.7
Highest SAD Visitor Center Satisfaction Scores (response of good or very good combined):
• 2006 – 99-percent ratings for Visitor Center Staff Availability and Overall Satisfaction, and 98-percent rating for Visitor Center Staff Helpfulness, Convenient Parking, Restroom Quality, and Brochures.
• 2007 Partial – 98-percent rating for Restroom Acceptability and Visitor Center Staff Availability, 97-percent rating for Visitor Center Staff Helpfulness.

ERDC/EL TR-08-42 18
Lowest SAD Visitor Center Satisfaction Scores: While representing favorable scores, the following areas received the lowest scores of com-bined ratings for very good and good and represent possible areas for management emphasis (Figures 9, 10, and 11):
• 2006 – 93-percent ratings for each of Guided Tour Quality, Bookstore Items, and Exhibits for Children
• 2007 Partial – 98-percent rating for Restroom Cleanliness, and 91 percent for Childrens’ Activities and Guided Tour Quality
Highest SAD Visitor Center Importance Scores: Visitors were also asked to rate key Visitor Center elements on importance. The highest scoring items were (combined response of Important or Very Important):
• 2006 – 93-percent rating for Visitor Center Staff Availability and 89-percent ratings for Convenient Parking, Restrooms, and Brochures
• 2007 Partial – 94-percent rating for Restroom Quality and 93-per-cent rating for Staff Availability, Exhibits, and Learning Opportunities
Figure 9. 2006 visitor center visitor facilities satisfaction ratings.
Figure 10. 2006 visitor center visitor programs and services satisfaction ratings.
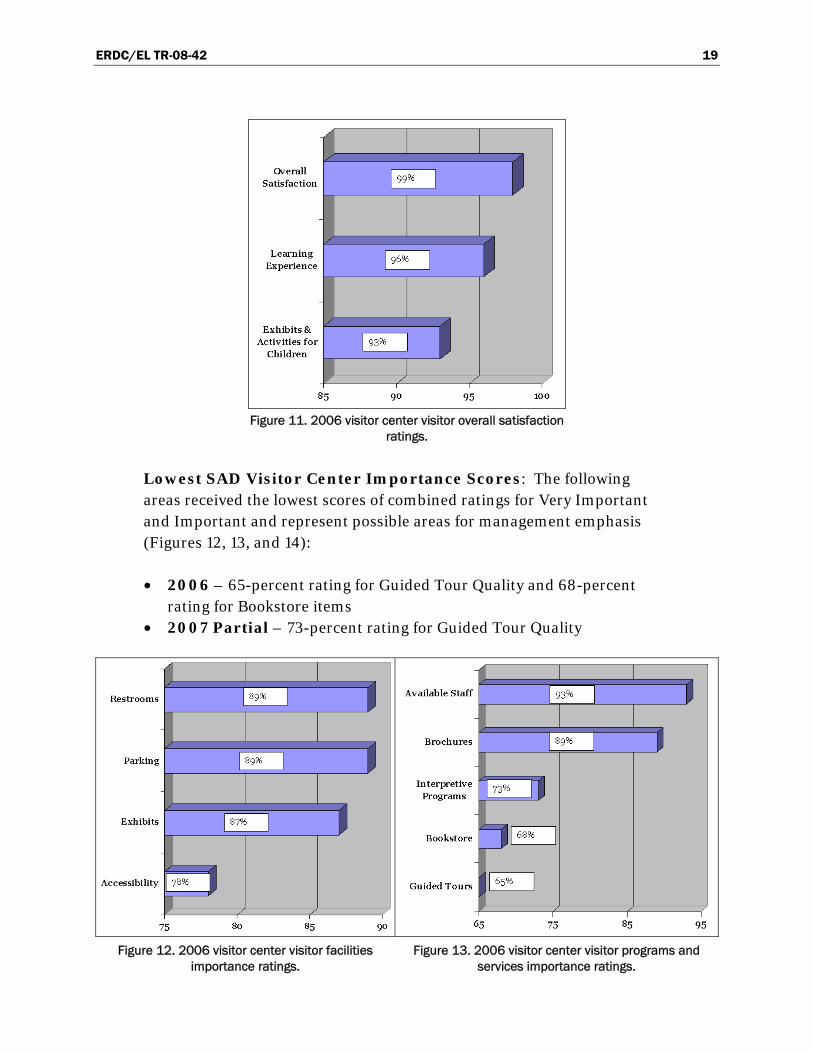
ERDC/EL TR-08-42 19
Figure 11. 2006 visitor center visitor overall satisfaction
ratings.
Lowest SAD Visitor Center Importance Scores: The following areas received the lowest scores of combined ratings for Very Important and Important and represent possible areas for management emphasis (Figures 12, 13, and 14):
• 2006 – 65-percent rating for Guided Tour Quality and 68-percent rating for Bookstore items
• 2007 Partial – 73-percent rating for Guided Tour Quality
Figure 12. 2006 visitor center visitor facilities importance ratings.
Figure 13. 2006 visitor center visitor programs and services importance ratings.

ERDC/EL TR-08-42 20
Figure 14. 2006 visitor center visitor overall
importance ratings.
Primary Reason for Coming to Visitor Center: When asked their primary reasons for coming to the Visitor Center, respondents indicated that the top three reasons were viewing exhibits, obtaining information or brochures, and purchasing a recreation area pass (Figure 15). Note that the totals do not equal 100 percent since only the most frequently mentioned items are listed.
Figure 15. 2006 visitor center visitor top three reasons
for visiting center.

ERDC/EL TR-08-42 21
Management Implications: Visitor center satisfaction ratings are gen-erally high. Recommended emphasis areas may be identified by combining satisfaction and importance ratings. For example, areas that respondents score very important and are satisfied with (Exhibits, Staff Availability, etc.) should be a focus of maintained emphasis, whereas items scored of high importance and low satisfaction (learning opportunities, children’s activities, and accessible facilities) should be considered for more emphasis (Figures 16 and 17).
SAD 2006 Visitor Center Survey Management Implication
Guided Tours
BookstoreInterp Prg
Acc FacChildren Act
Learn Opp
ExhibitsBrochures
Parking RestroomAv Staff
4.24.34.44.54.64.74.84.9
5
2.6 2.7 2.8 2.9 3 3.1 3.2 3.3 3.4 3.5 3.6 3.7
Importance
Satis
fact
ion
High Emphasis Low Emphasis
Reduce Emphasis Maintain Emphasis
Figure 16. 2006 visitor center survey management implications.
SAD 2007 Visitor Center Survey Management Implication
RestroomAv Staff
ParkingExhibits
Learn OppAcc FacBrochures
Children ActInterp Prg
Bookstore
Guided Tours
4.2
4.34.4
4.54.6
4.74.8
4.95
2.6 2.7 2.8 2.9 3 3.1 3.2 3.3 3.4 3.5 3.6 3.7
Importance
Satis
fact
ion
Reduce Emphasis Maintain Emphasis
Low Emphasis High Emphasis
Figure 17. 2007 visitor center survey management implications.

ERDC/EL TR-08-42 22
Federal agency visitor center satisfaction comparison
Visitor Center Visitor Satisfaction: Comparing survey results for Corps SAD projects to visitor survey results for other federal agencies provides some insight into satisfaction levels for a broader base of recre-ation customers. It should be noted that this is a general comparison due to variations in survey methodology, facilities, and visitors. Corps survey data are compared to NPS data (Le et al. 2007) in Table 8.
Table 8. Federal agency visitor center satisfaction ratings comparison.
Visitor Center Rating Element
Corps SAD Percent Satisfied
NPS 2006 Percent Satisfied
Restrooms 98 77 (included all restrooms)
Brochures 98 86 Exhibits 97 83 Interpretive Programs 94 89 Overall VC Satisfaction 99 89
Recreation area visitor comment analysis
Comment Analysis: The recreation area visitor comment cards provide an opportunity for visitors to give general comments on topics such as features they liked most and improvements they would like to see. Original comments were grouped into categories for frequency analysis.
Suggested Recreation Area Improvements for 2004: Categories receiving the highest number of comments were:
• Camping/Picnic Sites – 18 percent of respondents, with hook-up expansion receiving the most comments.
• Other Facilities – 12 percent of respondents, with improving lighting receiving the most comments.
• Building/Restroom/Showerhouses – 9 percent of respondents, with adding restrooms/showerhouses receiving the most comments.
• Sample Comments – Provide “sewer on at least some sites”; provide “a few street lights throughout park”; and “add bathhouse to waterfront area.”

ERDC/EL TR-08-42 23
Recreation Area Comments for Most Liked Features: A multi-year analysis of categories and their associated percentage of comments with day use and camping combined are presented in Figure 18. For exam-ple in 2005, 25 percent of the respondents rated the quality of natural resources as the feature they liked most, as compared to 21 percent in 2006, and 25 percent in 2007. Note that Figure 18 totals do not equal 100 percent since only the most frequently mentioned items are listed. Sample comments received include:
• “It’s on the water and beautiful” • “The lake is very clean and easy to access” • “We have been visiting for 30 years, so we like everything” • “Close to home” • “Not crowded,” “Peaceful” • “Clean, family atmosphere” • “Campsites close enough that an entire club can camp together” • “Quiet and shady campsites near the water” • “Seeing God’s nature and being able to relax”
Figure 18. Recreation area most-liked features comment
categories and percentage of respondents.
Recreation Area Improvement Comments: A multi-year analysis of categories and their associated percentage of respondent comments for suggested improvements in day use and camping areas combined are presented in Figure 19. Sample comments received include:

ERDC/EL TR-08-42 24
• “More bathhouses and sewer at campsites” • “Fish cleaning house needs better lighting” • “Need floating piers to help the elder people get on and off boats” • “More parking for boat trailers” • “Air condition the laundry room” • “More full hook-ups on water” • “Wife wants update in bathrooms” • “A swimming pool, arcade and gift shop” • “Kill weeds in the lake and fire ants”
Figure 19. Recreation area suggested improvement
comment categories and percentage of respondents.
Management Implications: General recreation area comments allow visitors to provide feedback on a wider range of topic areas and can pro-vide immediate feedback to recreation area managers on topics of greatest concern to the visitors. Managers would commonly want to continue providing those elements visitors liked most and consider making sug-gested improvements depending on frequency/demand. More specific information includes:
• Most-Liked Features – A multi-year trend was apparent for the follow-ing in terms of what surveyed visitors like most about Corps projects

ERDC/EL TR-08-42 25
they visited: attractive/high quality natural resources; having a quiet/relaxing/private area to recreate in; and having clean restrooms.
• Improvement – A multi-year trend was also apparent for the following in terms of visitor-suggested improvements: improving/expanding hook-ups in campgrounds (electric, sewer, etc.); improving lighting; adding restrooms/showerhouses; and adding more general facilities such as campsites, picnic sites, and docks.
• General – These findings corresponded with ACSI results, indicating that facilities and land and water quality drive visitor satisfaction. Of particular note are the references to quality natural resources and quiet settings. Although the surveyed visitors expressed interest in providing more traditional facilities (camping and picnic sites) with hook-ups, they also wanted to retain environmental quality and a peaceful, quiet setting. This would suggest a need to balance development with environmental quality.
Federal agency recreation area improvement priority comparison
Recreation Area Suggested Improvements: Comparing visitor survey results at Corps SAD projects to results for other federal agencies provides some insight into satisfaction levels for a broader base of recre-ation customers. It should be noted that this is a general comparison due to variations in survey methodology, facilities, and visitors. A comparison of Corps survey data to USFWS data (Pacific Consulting Group 2005) revealed the following:
• Corps SAD Suggested Improvements: As previously stated, the most frequent improvement suggestions dealt with Camping/Picnic Sites with hook-up expansion receiving the most common response; Boat Ramps/Courtesy Docks with improving parking; Other Facilities with improving lighting; and Buildings/Restrooms with adding restrooms/ showerhouses.
• USFWS Suggested Improvements: Suggested improvements dealt with Adequate Activities and Opportunities with providing more access to facilities the most common response; Visitor Center and Contact Stations with having adequate staffing; and Road and Transportation Systems with improving maintenance of trails and bridges and pro-viding better tram service.

ERDC/EL TR-08-42 26
Visitor center comment analysis
Comment Analysis: The visitor center comment cards provide an opportunity for visitors to give general comments on topics such as fea-tures they liked most and improvements they would like to see. Original comments were grouped into categories for frequency analysis.
Visitor Center Most Liked Features Comments: A 2-year analysis of categories and their associated percentage of comments are presented in Figure 20. For example, in 2006, 38 percent of the respondents rated exhibits and information as the feature they liked most as compared to 19 percent in the 2007 data. Sample comments received include:
• “Great learning experience for children” • “The center has a great view of the lake” • “Nice back porch” • “The tour guide was the best, very friendly and informative” • “Animal displays and interactive exhibits” • “Seeing yachts go by” • “Exhibits are very informative” • “Beautiful building and grounds” • “Friendly and helpful staff” • “I did not know this was here – I was looking for info useful to my
high school classroom. I was impressed with your facility”
Visitor Center Improvement Comments: A 2-year analysis of categories and their associated percentage of comments are presented in Figure 21. Sample comments received include:
• “Need a few more rocking chairs” • “Environmental education center and hands on area for kids” • “More picnic tables near visitor center to enjoy the view” • “Would like to take tour of the dam” • “Up to date displays” • “Vending machines” • “Need navigational maps of the lake” • “More snakes” • “More native/original history” • “More computer games for children”

ERDC/EL TR-08-42 27
Figure 20. Visitor center most-liked facility comment
categories and percentage of respondents.
Figure 21. Visitor center suggested improvement comment
categories and percentage of respondents.

ERDC/EL TR-08-42 28
Primary Reason for Visiting Visitor Center: A 2-year analysis of the primary reason Corps SAD visitors elected to stop at a visitor center is presented in Figure 22:
Figure 22. Visitor center primary reason for visiting and
percentage of respondents.
Management Implications: General recreation area comments allow visitors to provide feedback on a wider range of topic areas and can pro-vide immediate feedback to visitor center managers on topics of greatest concern to the visitors. Managers would commonly want to continue providing those elements visitors liked most and consider making sug-gested improvements. More specific information includes:
• Most-liked features – Friendly and helpful attendants, attractive facilities, scenic views, and informative exhibits and information are aspects surveyed visitors liked most.
• Improvement – Improving/updating exhibits and adding facilities such as vending machines, adding dam tours and more children’s activities were deemed most important by surveyed visitors. A request to improve and update exhibits also corresponds with having a majority of repeat visitors who wish to view new information.
• Primary reason for visiting – Viewing exhibits about the area, obtain-ing information, purchasing recreation passes, and using restrooms were the primary reasons given for visiting visitor centers.

ERDC/EL TR-08-42 29
• General – These findings also correspond with American Customer Satisfaction Index results (ACSI 2006) indicating that facilities, infor-mation and visitor services are key drivers of visitor satisfaction. Sample comments received when national visitors were surveyed as to why they return to Corps recreation sites include: o “I promised my father we would go down every year after he passed
away – family tradition.” o “It is easy to get around in the Army parks in my wheelchair.” o “There aren’t that many hills and woods…it is one place that has
woods and no housing developments.”
Federal agency visitor center improvement comment comparison
Visitor Center Suggested Improvements: Comparing visitor survey results for Corps SAD projects to results for other federal agencies provides some insight into satisfaction levels for a broader base of recreation customers. It should be noted that this is a general comparison due to variations in survey methodology, facilities, and visitors. A comparison of Corps survey data to NPS data (Gramann 2003) revealed the following:
• Corps SAD Suggested Improvements: Surveyed visitors indicated a desire for current, informative exhibits; convenience elements such as vending machines; dam tours; and more children’s activities. Note that dam tours were eliminated or greatly reduced following 9-11 for security concerns.
• NPS Suggested Improvements: In a study of demographic and information-technology trends affecting visitor center use, the NPS learned that an “ideal” visitor center would have: traditional elements such as restrooms, information, attendants, a safe and modern facility, and interesting things to buy. It would also incorporate diverse needs and technology by: providing affordable/personable/customizable information; having current theme information delivered with both low- and high-tech methods; being multi-lingual and physically accessible; creating a dynamic and interactive experience across age groups; and providing an interactive decision tree to help plan visitor stays.

ERDC/EL TR-08-42 30
5 Study Limitations and Error
The Corps has elected to use a simplified customer comment card process that utilizes a Survey Schedule Generator, 20 sampling dates, and 10 sampling cards per day (USACE 2008c). This produces approx-imately 160 comment cards (total for both camping and day use) per sampled project. Projects conducting visitor center surveys generate an additional 160 comment cards or approximately 20 interviews per week during the peak 2 months of visitation. While these finite sample sizes significantly decrease the burden on field personnel for conduct-ing surveys, it reduces the survey accuracy. Evaluation of sample size versus precision in earlier surveys at 20 projects led to selection of n = 240 per project to achieve an anticipated 80-percent confidence interval of plus or minus 0.2 in rating item scores. This suggests a detection level of score differences between projects greater than approximately 0.4 for individual satisfaction measures.
Since that time, the comment card program was expanded to produce separate information for campers, day-users, and visitor center patrons, and use of the data shifted from quantitative comparison of rating scores to qualitative comparisons of visitor suggestions. Use was also shifted away from quantitative rating scores towards visitor com-ments and suggestions. The increased sampling burden on visitors and project personnel and the shift from primarily quantitative to qualita-tive use of data motivated a reduction in sample size. Therefore preci-sion of rating item means at the project level might be less for project-level results, but would increase for summaries at progressively higher administrative levels.
During the period covered by this analysis, the survey was adjusted to accommodate changes in program objectives from year to year as determined by the Recreation Leadership Advisory Team. These adjustments included changes in the survey questionnaire, target pop-ulations, and corresponding changes in survey procedures. These changes may produce some discrepancies between the surveyed popu-lation and the overall project visitor population. In its present form, the comment card survey is intended to produce separate satisfaction estimates for day-users, campers, and visitor center patrons at each

ERDC/EL TR-08-42 31
project, with a similar level of precision for each group. Summaries across these three groups of visitors and summaries at administrative levels other than the project may also introduce discrepancies. This is particularly true if unweighted pooling of data for campers, day-users, and visitor centers, as well as different projects, occurs. It should also be noted that dissatisfied campers who ended their stay earlier than scheduled may have been missed in these surveys.

ERDC/EL TR-08-42 32
6 Summary and Discussion
The 22 Corps lakes in the South Atlantic region provide social, economic, and environmental benefits for all Americans. By providing opportunities for active recreation, Corps lakes help combat one of the most significant national health problems – lack of physical activity. Recreation activities also help strengthen family ties and friendships; provide opportunities for children to develop personal skills, social values and self-esteem; and increase water safety. In 2006, it is estimated that 65 million visits or person-trips occurred in SAD by individuals who participated in activities like picnicking, camping, swimming, water-skiing, boating, sightseeing, fishing, and hunting (USACE 2008d).
Money spent by visitors to Corps lakes on trips adds to the local and national economies by supporting jobs and generating income and is vital for local communities. The 2006 SAD visits generated $1.5 million in spending within 30 miles of Corps lakes, with 57 percent captured by the local economy as direct sales effects. With multiplier effects, it resulted in $704 million in value added (wages and salaries, profits and rents, etc.) and supported 18,657 jobs in area communities (USACE 2008d).
Recreation experiences can also increase the motivation to learn more about the environment; understanding and awareness of environmental issues; and sensitivity to the environment. The 22 SAD lakes reached nearly 271,000 individuals with environmental education contacts in 2006 (USACE 2008d).
In light of these important benefits, it is beneficial to conduct periodic surveys of recreation visitors to determine:
• Visitor socio-demographic characteristics, particularly when the sampling is statistically controlled
• The types of features and activities visitors desire most at both recreation areas and visitor centers
• Visitor thoughts on potential improvements
With this information, it is possible to identify from the SAD recreation visitor analysis:

ERDC/EL TR-08-42 33
• Apparent under-representation of some ethnic and racial groups in the surveyed population
• Majority of visitors are well-satisfied with both recreation areas and visitor centers
• Recreation area features that visitors liked most were: the quality of natural resources, a quiet setting, and clean facilities
• Recreation area features that visitors would like improvement of were: adding/improving utility hook-ups at campsites, adding showers or restrooms, and adding/improving lighting
• Visitor Center features that visitors liked most were helpful attendants, attractive facilities, scenic views and information
• Visitor Center features that visitors would like improvement on were: improving or expanding exhibits, adding vending machines and more activities for children
• Visitor Center visitors come to the centers primarily to view exhibits, obtain information, purchase recreation area passes, and use restrooms
This knowledge serves recreation managers by:
• Identifying what area populations may need to be targeted to encourage visitation
• Learning what the staff is doing well and what they could improve upon from the viewpoint of their visitors when making management and investment decisions
• Discovering potential perception and expectation differences between first-time and repeat visitors
• Giving insights into levels of sustainable recreation development that protect natural resources valued by visitors
• Providing a much better overall understanding of the visiting recreation public being served.
• As recreation area availability and visitor travel costs change in the future, the information contained in this report may serve as a baseline reference.

ERDC/EL TR-08-42 34
References American Customer Satisfaction Index. 2006. Recreational visitors, U.S. Army Corps of
Engineers customer satisfaction study. National Quality Research Center, Ross School of Business at the University of Michigan, CFI Group, and the Federal Consulting Group, December 2006.
Bureau of Land Management Recreation Area Assessment. 2007. ExpectMore.gov. http://www.whitehouse.gov/omb/expectmore/detail/10001087.2003.html. (accessed March 13, 2008).
Dunn, R. A., and D. Quebedeaux. 1999. Methodology for recreation data acquisition and evaluation for ethnic minority visitors to Corps of Engineers projects. ERDC/EL TR-99-1. Vicksburg, MS: U.S. Army Engineer Research and Development Center.
Forist, B. E., M. Littlejohn, R. Baxter, G. E. Maclis, and J. Gramann. 2003. Visitor use and evaluation of interpretive media, September 2003. Washington, DC: National Park Service Visitor Services Project,
Gramann, J. H. 2003. Trends in demographics and information technology affecting visitor center use: Focus group report. Contract report prepared for Park Planning and Special Studies Program. Washington, DC: National Park Service, National Park Service Social Science Program, July 2003.
Le, Y., M. Littlejohn, J. Hoger, S. J. Hollenhorst, and J. Gramann. 2006. Serving the visitor 2005– A report on visitors to the National Park System. Park Studies Unit, University of Idaho.
Le, Y., M. Littlejohn, J. H. Russell, S. J. Hollenhorst, and J. Gramann, J. 2007. Serving the visitor 2006 – A report on visitors to the National Park System. Park Studies Unit, University of Idaho.
Pacific Consulting Group. 2005. U.S. Fish and Wildlife Service National Wildlife Refuge Visitor Satisfaction Survey. Issued January 2005. http://www.fws.gov/refuges/generalInterest/PCGReportFWS.ppt
RoperASW. 2004. Outdoor recreation in America 2003: Recreation’s benefits to society challenged by trends. Prepared for The Recreation Roundtable, January 2004. http://www.funoutdoors.com/files/ROPER%20REPORT%202004_0.pdf
Solop, F. I, K. K. Hagen, and D. Ostergren. 2003. Ethnic and racial diversity of National Park Service visitors and non-visitors. Technical Report, Comprehensive Survey of the American Public. December 2003. The National Park Service Social Science Program and the Northern Arizona University Social Research Laboratory.
The White House. 1993. Executive Order 12862, Setting Customer Service Standards. http://govinfo.library.unt.edu/npr/library/direct/orders/2222.html. September 1993 (accessed June 23, 2008).

ERDC/EL TR-08-42 35
U.S. Army Corps of Engineers. 2006. Economic Impact Analysis. Natural Resources Management Gateway, Wen-Huei Chang, Subject Matter Expert, CEERD-EE-E, http://corpslakes.usace.army.mil/employees/economic/economic.html. (accessed February 25, 2008).
______. 2008a. South Atlantic Division, Lakeside Recreation. http://www.sad.usace.army.mil/Lakeside%20Recreation.htm. (accessed February 25, 2008).
______. 2008b. Comment Card Surveys. Natural Resources Management Gateway, Wen-Huei Chang and Ginny Dickerson, Subject Matter Experts, CEERD-EE-E. https://wwwel.wes.army.mil/nrm/commentcard/submitted.cfm?Step=1. (accessed February 25, 2008).
______. 2008c. Customer Comment Card Program. Natural Resources Management Gateway, Dick Kasul, Subject Matter Expert, CEERD-EE-E, http://corpslakes.usace.army.mil/employees/commentcard/commentcard.html. (accessed February 25, 2008).
______. 2008d. Value to the Nation Fast Facts. http://www.vtn.iwr.usace.army.mil/recreation/reports/divisionreport.asp?DIVID=6 (accessed February 25, 2008).
U.S. Census Bureau. 2008. 2006 American Community Survey. http://factfinder.census.gov/home/saff/main.html?_lang=en (accessed February 25, 2008).
U.S. Department of Agriculture (USDA). 2005. Forest Service. National Forest Visitor Use Monitoring Program-National Project Results—January 2000 through September 2003. http://www.fs.fed.us/recreation/programs/nvum/national_report_final_draft.pdf. (accessed March 13, 2008).
______. 2007. Proceedings: National Workshop on Recreation Research and Management. General Technical Report, PNW-GTR-698, June 2007.
U.S. Fish & Wildlife Service (USFWS). 2005. National Wildlife Refuge Visitor Satisfaction Survey. January 2005.
U.S. Forest Service. 2007. Recreation Assessment, 2007. ExpectMore.gov. http://www.whitehouse.gov/omb/expectmore/detail/10003014.2005.html (accessed March 13, 2008).

ERDC/EL TR-08-42 36
Appendix A: Recreation Area Visitor Comment Card – 2006 to Present

ERDC/EL TR-08-42 37

ERDC/EL TR-08-42 38
Appendix B: Visitor Center Comment Card

ERDC/EL TR-08-42 39

REPORT DOCUMENTATION PAGE Form Approved
OMB No. 0704-0188 Public reporting burden for this collection of information is estimated to average 1 hour per response, including the time for reviewing instructions, searching existing data sources, gathering and maintaining the data needed, and completing and reviewing this collection of information. Send comments regarding this burden estimate or any other aspect of this collection of information, including suggestions for reducing this burden to Department of Defense, Washington Headquarters Services, Directorate for Information Operations and Reports (0704-0188), 1215 Jefferson Davis Highway, Suite 1204, Arlington, VA 22202-4302. Respondents should be aware that notwithstanding any other provision of law, no person shall be subject to any penalty for failing to comply with a collection of information if it does not display a currently valid OMB control number. PLEASE DO NOT RETURN YOUR FORM TO THE ABOVE ADDRESS.
1. REPORT DATE (DD-MM-YYYY) December 2008
2. REPORT TYPE Final report
3. DATES COVERED (From - To)
5a. CONTRACT NUMBER
5b. GRANT NUMBER
4. TITLE AND SUBTITLE
Recreation Visitor Survey Analysis – South Atlantic Division
5c. PROGRAM ELEMENT NUMBER
5d. PROJECT NUMBER
5e. TASK NUMBER
6. AUTHOR(S)
Julie B. Marcy, LiChu Lee, and Christine Wibowo
5f. WORK UNIT NUMBER
7. PERFORMING ORGANIZATION NAME(S) AND ADDRESS(ES) 8. PERFORMING ORGANIZATION REPORT NUMBER
U.S. Army Engineer Research and Development Center Environmental Laboratory 3909 Halls Ferry Road Vicksburg, MS 39180-6199
ERDC/EL TR-08-42
9. SPONSORING / MONITORING AGENCY NAME(S) AND ADDRESS(ES) 10. SPONSOR/MONITOR’S ACRONYM(S)
11. SPONSOR/MONITOR’S REPORT NUMBER(S)
U.S. Army Corps of Engineers Washington, DC 20314-1000
12. DISTRIBUTION / AVAILABILITY STATEMENT
Approved for public release; distribution is unlimited.
13. SUPPLEMENTARY NOTES
14. ABSTRACT
This report documents a multi-year analysis (2004–partial 2007) of recreation visitor satisfaction results and comments for the South Atlantic Division of the U.S. Army Corps of Engineers. Information concerning socio-demographics, recreation area satisfaction, visitor center satisfaction and importance, and general comments were analyzed. This report conveys the findings and potential management implications thereof.
15. SUBJECT TERMS Recreation area satisfaction Recreation visitor survey
Socio-demographics South Atlantic Division
Visitor center satisfaction
16. SECURITY CLASSIFICATION OF: 17. LIMITATION OF ABSTRACT
18. NUMBER OF PAGES
19a. NAME OF RESPONSIBLE PERSON
a. REPORT
UNCLASSIFIED
b. ABSTRACT
UNCLASSIFIED
c. THIS PAGE
UNCLASSIFIED 48 19b. TELEPHONE NUMBER (include area code)
Standard Form 298 (Re . 8-98) vPrescribed by ANSI Std. 239.18
Related Documents