RECREATE REinforce Competitiveness of REgionAl Transport SMEs PGI05275 Transport SME Competitiveness Report Report elaborated by: R. Jabanda Coventry University Enterprises Ltd UK G. D’Angelo Campania Region IT C. Cotrone Campania Region IT A. Kyriakou Development Agency of South Aegean Region - READ S.A. EL I. Tamiakis Development Agency of South Aegean Region - READ S.A. EL I. Tinfavičienė Lithuanian Innovation Centre LT G. Junevičius Lithuanian Innovation Centre LT E. Nagulevičius Lithuanian Innovation Centre LT P. Bacevičius Lithuanian Innovation Centre LT M. Bogheanu Regional Development Agency South-West Oltenia RO S. Cosmulescu Regional Development Agency South-West Oltenia RO M. Lungu Regional Development Agency South-West Oltenia RO M. Alecu Regional Development Agency South-West Oltenia RO

Welcome message from author
This document is posted to help you gain knowledge. Please leave a comment to let me know what you think about it! Share it to your friends and learn new things together.
Transcript
RECREATE
REinforce Competitiveness of REgionAl
Transport SMEs
PGI05275
Transport SME Competitiveness Report
Report elaborated by:
R. Jabanda Coventry University Enterprises Ltd UK G. D’Angelo Campania Region IT C. Cotrone Campania Region IT A. Kyriakou Development Agency of South Aegean Region - READ S.A. EL I. Tamiakis Development Agency of South Aegean Region - READ S.A. EL I. Tinfavičienė Lithuanian Innovation Centre LT G. Junevičius Lithuanian Innovation Centre LT E. Nagulevičius Lithuanian Innovation Centre LT P. Bacevičius Lithuanian Innovation Centre LT M. Bogheanu Regional Development Agency South-West Oltenia RO S. Cosmulescu Regional Development Agency South-West Oltenia RO M. Lungu Regional Development Agency South-West Oltenia RO M. Alecu Regional Development Agency South-West Oltenia RO
2 | P a g e
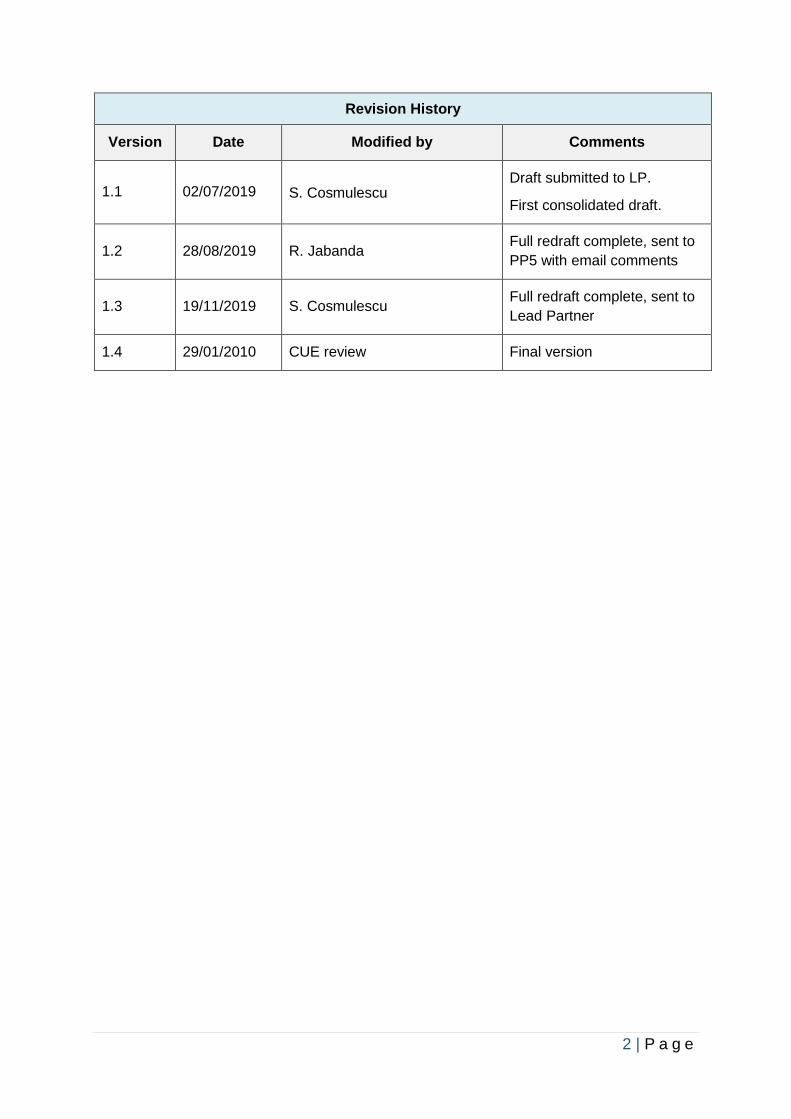
Revision History
Version Date Modified by Comments
1.1 02/07/2019 S. Cosmulescu Draft submitted to LP.
First consolidated draft.
1.2 28/08/2019 R. Jabanda Full redraft complete, sent to
PP5 with email comments
1.3 19/11/2019 S. Cosmulescu Full redraft complete, sent to
Lead Partner
1.4 29/01/2010 CUE review Final version
3 | P a g e
Table of Contents
List of Figures / Tables .......................................................................................................... 4
Abbreviations ........................................................................................................................ 8
Executive Summary .............................................................................................................. 9
1. Introduction ......................................................................................................................12
2. General Information ..........................................................................................................13
3. Framework .......................................................................................................................14
3.1 Database of Each Region ...........................................................................................14
3.1.1 Geography & Governance .................................................................................14
West Midlands (UK) ............................................................................................................................................... 14
Campania (Italy) .................................................................................................................................................... 19
South Aegean (Greece) ......................................................................................................................................... 20
Lithuania ................................................................................................................................................................ 22
South-West Oltenia (Romania) .............................................................................................................................. 23
3.1.2 Major Towns & Accessibility ..............................................................................26
West Midlands (UK) ............................................................................................................................................... 26
Campania (Italy) .................................................................................................................................................... 31
South Aegean (Greece) ......................................................................................................................................... 33
Lithuania ................................................................................................................................................................ 34
South-West Oltenia (Romania) .............................................................................................................................. 35
3.1.3 Labour Market & Economy ................................................................................37
West Midlands (UK) ............................................................................................................................................... 37
Campania (Italy) .................................................................................................................................................... 38
South Aegean (Greece) ......................................................................................................................................... 40
Lithuania ................................................................................................................................................................ 42
South-West Oltenia (Romania) .............................................................................................................................. 47
3.1.4 Transport Infrastructure by Mode .......................................................................53
West Midlands (UK) ............................................................................................................................................... 53
Campania (Italy) .................................................................................................................................................... 60
South Aegean (Greece) ......................................................................................................................................... 66
Lithuania ................................................................................................................................................................ 71
South-West Oltenia (Romania) .............................................................................................................................. 76
3.2 Stakeholders ..............................................................................................................97
West Midlands (UK) ............................................................................................................................................... 97
Campania (Italy) .................................................................................................................................................. 106
South Aegean (Greece) ....................................................................................................................................... 110
Lithuania .............................................................................................................................................................. 115
South-West Oltenia (Romania) ............................................................................................................................ 119
3.3 Regional Policy ......................................................................................................... 138
West Midlands (UK) ............................................................................................................................................. 138
Campania (Italy) .................................................................................................................................................. 143
South Aegean (Greece) ....................................................................................................................................... 147
Lithuania .............................................................................................................................................................. 153
South-West Oltenia (Romania) ............................................................................................................................ 157
3.4 Challenges for Transport SMEs to Develop & Commercialise their Products ............ 169
4 | P a g e
West Midlands (UK) ............................................................................................................................................. 169
Campania (Italy) .................................................................................................................................................. 176
South Aegean (Greece) ....................................................................................................................................... 180
Lithuania .............................................................................................................................................................. 181
South-West Oltenia (Romania) ............................................................................................................................ 183
3.5 Opportunities & Obstacles for Transport SMEs, Megatrends & Future Concepts ...... 186
West Midlands (UK) ............................................................................................................................................. 186
Campania (Italy) .................................................................................................................................................. 197
South Aegean (Greece) ....................................................................................................................................... 201
Lithuania .............................................................................................................................................................. 203
South-West Oltenia (Romania) ............................................................................................................................ 207
3.6 How are Transport SMEs Innovation/Products Financed? ........................................ 240
West Midlands (UK) ............................................................................................................................................. 240
Campania (Italy) .................................................................................................................................................. 251
South Aegean (Greece) ....................................................................................................................................... 253
Lithuania .............................................................................................................................................................. 254
South-West Oltenia (Romania) ............................................................................................................................ 256
3.7 SWOT Analysis ........................................................................................................ 259
West Midlands (UK) ............................................................................................................................................. 259
Campania (Italy) .................................................................................................................................................. 261
South Aegean (Greece) ....................................................................................................................................... 262
Lithuania .............................................................................................................................................................. 266
South-West Oltenia (Romania) ............................................................................................................................ 268
Results ........................................................................................................................... 277
West Midlands (UK) ............................................................................................................................................. 277
Campania (Italy) .................................................................................................................................................. 278
South Aegean (Greece) ....................................................................................................................................... 279
Lithuania .............................................................................................................................................................. 280
South-West Oltenia (Romania) ............................................................................................................................ 281
Conclusions .................................................................................................................... 284
West Midlands (UK) ............................................................................................................................................. 284
Campania (Italy) .................................................................................................................................................. 286
South Aegean (Greece) ....................................................................................................................................... 287
Lithuania .............................................................................................................................................................. 288
South-West Oltenia (Romania) ............................................................................................................................ 290
References ..................................................................................................................... 302
List of Figures
Fig. 1 - Geographic location of RECREATE Project Partners 12 Fig. 2 - EU Member States 14 Fig. 3 - Major Cities of UK 14 Fig. 4 - Physical Landscape of England 15 Fig. 5 - Official Regions of England 16 Fig. 6 - West Midlands Green Belt 16 Fig. 7 - West Midlands County and Boroughs 17 Fig. 8 - West Midlands Built-Up Area, Urban Area, or Conurbation 18 Fig. 9 - Districts of Warwickshire 18 Fig 10 - Regions of Italy 19
5 | P a g e
Fig 11 - Campania region map 19 Fig. 12 - Administrative Divisions of Greece, Location of South Aegean 21 Fig 13 - Lithuania in the Baltics & Map of Lithuania 23 Fig. 14 - Location of Romania in EU 23 Fig. 15 - Satellite Map of Romania 23 Fig. 16 - Development Regions of Romania 24 Fig. 17 - Counties in the South-West Oltenia region 24 Fig. 18 - Physical Landscape of Romania 24 Fig 19 - Southern Regions of Italy - GDP trend 39 Fig 20 - Southern Regions of Italy - unemployment 39 Fig 21 - Southern Regions of Italy – SMEs 40 Fig 22 - GDP growth dynamics in Lithuania 42 Fig 23 - Transport and storage share of GDP, % - Lithuania 43 Fig 24 - Transport sector share of GDP, %, 2017 43 Fig 25 - Share of transport sector added value in Lithuania, % 44 Fig 26 - Economic sectors, highest share of added value in Lithuania, %, 2017 44 Fig 27 - Economic entities in transport and storage sector, units - Lithuania 45 Fig 28 - Number of employees in transport and storage sector, thous. - Lithuania 45 Fig. 29 - Analysis of GDP Dynamics - SWO Region 50 Fig. 30 - GDP Dynamics by Development Regions in Romania 2010-18 52 Fig. 31 - Dynamic Comparison of Regional/National GDP Romania 2005-2010 52 Fig. 32 - Number of SMEs in Romania and SMEs in SWO region 52 Fig. 33 - Railway network in Campania region 61 Fig. 34 - Port of Naples and Port of Salerno 61 Fig. 35 - Nola Interport 62 Fig. 36 - Naples Airport 63 Fig. 37 - Naples Airport - traffic volumes 63 Fig. 38 - Naples public transport service bus 63 Fig. 39 - Campania region public transport map 64 Fig. 40 - Campania region public transport train 64 Fig. 41 - Port of Naples - maritime services 64 Fig. 42 - Campania region - automotive industry 65 Fig. 43 - Campania region - aeronautical / aerospace industry 65 Fig. 44 - Campania region - aeronautical / aerospace industry 66 Fig. 45 - Main Roads in Lithuania 72 Fig. 46 - Road passenger transport (buses, trolleybuses), million - Lithuania 72 Fig. 47 - Freight transportation by road vehicles, million tons - Lithuania 73 Fig. 48 - Freight transportation by water and inside waters, million tons - Lithuania 73 Fig. 49 - Passengers transportation by water and inside waters, million - Lithuania 73 Fig. 50 - Freight transportation by railways, million tons - Lithuania 74 Fig. 51 - Passengers transportation by railways, million - Lithuania 74 Fig. 52 - Freight Transportation Geography / Railway Network in Lithuania 75 Fig. 53 - Freight transportation by air, million tons - Lithuania 75 Fig. 54 - Passengers transportation by air, million - Lithuania 75 Fig. 55 - Frequency of Railway Services in Lithuania 76 Fig. 56 - Road Cover Categories per SWO County 2015 77 Fig. 57 - Road Overpass in Craiova 78 Fig. 58 - Underground Road Pass in Craiova 78 Fig. 59 - Total Length of Rail / Electrified Network in Each SWO County 78 Fig. 60 - Railway Network – SWO Region 79 Fig. 61 - Modernised Craiova Railway Station 79 Fig. 62 - Orşova Port at Danube River 81 Fig. 63 - Drobeta-Turnu Severin Port at Danube River 82 Fig. 64 - Bechet Port at Danube River 83 Fig. 65 - Calafat Port at Danube River 84
6 | P a g e
Fig. 66 - Corabia Port at Danube River 84 Fig. 67 - Comprehensive & Core Networks: Inland Waterways/Ports (RO) 85 Fig. 68 - Public Transport Network Operated by R.A.T. Craiova 87 Fig. 69 - Public Transport Routes and Stations - Târgu-Jiu Municipality 91 Fig. 70 - Public Transport Network / Service Areas – Slatina 92 Fig. 71 - Location of Craiova Int’l Airport 96 Fig. 72 - Craiova Airport Exterior 96 Fig. 73 - Flying Routes – Craiova Int’l Airport 96 Fig. 74 - Absorption rate of EU funding by Craiova city in SWO 168 Fig. 75 - Innovation expenditure as a percentage of total turnover in transport sector 182 Fig. 76 - Enterprises by sector, which implemented innovations, %, 2014-2016 182 Fig. 77- Challenge factors for Transport SMEs 186 Fig. 78 - Value Chains Diagram 210 Fig. 79 - Autonomous Vehicles 228 Fig. 80 - On-Demand Mobility 228 Fig. 81 - Intelligent Transport Systems (ITS) 229 Fig. 82 - Electric Bus & Mini-Bus 230 Fig. 83 - Smart Transport Systems 233 Fig. 84 - High-Speed Train 233 Fig. 85 - Banking Referral Scheme UK 245
List of Tables
Table 1 - NUTS Classification Levels 1-3 for WM Region 15 Table 2 - Province classification for Campania region 20 Table 3 - Priorities of Regional Operational Programme - South Aegean Region 21 Table 4 - Population Data related to WM Region 27 Table 5 - Major Conurbations and Accessibility in the WM Region 31 Table 6 - Major towns in Campania region 31 Table 7 - Mobility factors in Campania region 33 Table 8 - Major towns in South Aegean Region 33 Table 9 - Major Cities in Lithuania 34 Table 10 - Major Cities/Towns in South-West Oltenia 35 Table 11 - Major Cities/Towns Accessibility in South-West Oltenia 36 Table 12 - Labour Market in the WM Region 37 Table 13 - SME enterprises in Local Authority Districts in the WM Region 37 Table 14 - Labour Market in Transport Related Sectors in South Aegean Region 41 Table 15 - Lithuania GDP 2014-2018 42 Table 16 - Lithuania and Baltic States GDP Comparison 2017 43 Table 17 - Transport & Storage Sector GDP / Export Value in Lithuania 43 Table 18 - Business Entities According to Economic Activities in Lithuania 44 Table 19 - Unemployment Rate in Lithuania 2014-2018 45 Table 20 - NETO Migration in Lithuania & Major Counties 2014-2017 46 Table 21 - Amount of Labour Force in Lithuania 2014-2018 46 Table 22 - Top 5 Economic Activities by Vacant Jobs 2014-2018 46 Table 23 - Population by Location SWO Region 47 Table 24 - Population by Age Group SWO Region 47 Table 25 - Population by Gender SWO Region 47 Table 26 - Active Population SWO Region 2010-2016 50 Table 27 - Active Population Romania 2010-2016 50 Table 28 - Analysis of GDP Dynamics - SWO Region 50 Table 29 - GDP Dynamics 2010-18 by Development Regions in Romania 51 Table 30 - No of SMEs - SWO Region - 2017 53 Table 31 - No of SMEs SWO Region - 2018 (est.) 53 Table 32 - Freight and passengers - in major ports of Campania region 62
7 | P a g e
Table 33 - Status of Transport System - 2017 - Greece National Level 67 Table 34 - Transport & Logistics Turnover in Greece 67 Table 35 - Transport & Logistics Turnover in Region South Aegean 67 Table 36 - Type of transport companies in RSA 68 Table 37 - Motor Vehicles in Circulation, by Category, Use, Region – Greece 68 Table 38 - Greek airlines operating in the RSA and their company status 69 Table 39 - Domestic & International Air Traffic, 2016 69 Table 40 - Domestic & International Air Traffic, By Airport 69 Table 41 - Maritime transport companies operating in South Aegean Region 70 Table 42 - Departures / Arrivals at Maritime Ports in RSA 2016-2018 71 Table 43 - Level of Road Modernisation per SWO County as of 2018 in km’s 77 Table 44 - Public Railway Lines in Service per SWO County as of Dec 2018 80 Table 45 - Situation of Five Larger Ports to Danube River in SWO Region 86 Table 46 - Public Transport Network Performance Indicators - Craiova 88 Table 47 - R.A.T. (Craiova Public Transport Company) Revenues 89 Table 48 - Operational Expenses of R.A.T. Craiova 89 Table 49 - Main Characteristics of Public Transport System in Drobeta-Turnu Severin 90 Table 50 - Characteristics of Public Transport in Târgu-Jiu 91 Table 51 - Line Length per Mode of Transport, each Region/County (RO) -km- 2018 93 Table 52 - No of Vehicles Inventory, per Region/County (RO) 2018 94 Table 53 - Passengers Transported - Thousands - per Region/County (RO) 2018 95 Table 54 - Regular Flights - Craiova Airport 96 Table 55 - Main Universities in WM 98 Table 56 - Business Support Organisations in WM 99 Table 57 - Combined Authority Membership in WM 99 Table 58 - State Transport Institutions, Departments & Innovation Poles (WM) 102 Table 59 - Innovation Clusters in WM 104 Table 60 - Transport Associations in WM / UK 105 Table 61 - Network Operators in WM / UK 106 Table 62 - National & Regional Stakeholders related to RSA Transport sector 111 Table 63 - Private actors of the transport sector RSA 112 Table 64 - Contact details of local stakeholders RSA 114 Table 65 - National & Regional Stakeholders related to Lithuania 119 Table 66 - Industrial parks in SWO Region 126 Table 67 - Overall Size of Locations - Industrial Parks in SWO Region 127 Table 68 - Transport-Related Sectors in General (Automotive, Rail, Shipbuilding, Air) 127 Table 69 - Automotive Sector Representation in the SWO Region 128 Table 70 - Rail Sector Representation in the SWO Region 128 Table 71 - Air Sector Representation in the SWO Region 128 Table 72 - Shipping Sector Representation in the SWO Region 128 Table 73 - NACE Identification Codes Applying to Transportation Sector - SWO 130 Table 74 - Stakeholders Involved in Transport SMEs Activity Chain - SWO Region 137 Table 75 - Priority Sectors in LEP Areas (WM) 139 Table 76 - Priorities and Funding of OP South Aegean 2007-2013 147 Table 77 - RSA’s OP objectives 2014-2020 148 Table 78 - Transport-related objective of RSA’s OP (1) 148 Table 79 - Transport-related objective of RSA’s OP (2) 149 Table 80 - Transport-related objective of RSA’s OP (3) 149 Table 81 - Transport-related objective of RSA’s OP (4) 149 Table 82 - Objectives and Sub-Objectives (Sustainable Transport) in RSA 152 Table 83 - Objectives and Sub-Objectives (Multimodal Transport) in RSA 152 Table 84 - Objectives and Sub-Objectives (Connectivity / Safety) in RSA 152 Table 85 - Objectives and Sub-Objectives (Road Network / Infrastructure) in RSA 152 Table 86 - Priority sectors of intervention for research and industry - Campania region 177 Table 87 - Technological areas and trajectories in Campania region 177
8 | P a g e
Table 88 - Challenges and areas of innovative intervention in Campania region 179 Table 89 - Technological trajectories of project consultation process Campania region 179 Table 90 - R&D personnel in transport sector Lithuania 181 Table 91 - Transport sector expenditure on R&D activities Lithuania 182 Table 92 - ‘Electroputere’ Electric Vehicle Technical Details 218 Table 93 - Hyperion Train - Technical / Functional Features 219 Table 94 - SWOT Analysis, WM 261 Table 95 - SWOT Analysis, Campania region 262 Table 96 - SWOT analysis for transportation sector in South Aegean Region 265 Table 97 - SWOT Analysis, Lithuania 268 Table 98 - Strengths & Weaknesses by Transport Mode, SWO 270 Table 99 - Opportunities & Threats by Transport Mode, SWO 272 Table 100 - SWOT for Transport SME Status Quo, SWO 276
Abbreviations
ACAROM Automobile Manufacturers Association of Romania AONB Area of Natural Beauty (UK) A.P.I.A. Automotive Manufacturers and Importers Association (RO) CC County Council (RO / UK) CCC Coventry City Council (UK) CNIPMMR National Council of SMEs in Romania (RO) DFT Department for Transport (UK) EC European Commission EEA European Economic Area ERDF European Regional Development Fund ESIF European Structural & Investment Funds ETC European Territorial Cooperation (Interreg or Interregional Cooperation) EU European Union GB Great Britain H2020 Horizon 2020 - EU Research and Innovation programme HEI Higher Education Institution HSR High Speed Rail HS2 High Speed Rail project (UK) ITS Intelligent Transportation System LA Local Authority / Local Highway Authorities (UK) LEP Local Enterprise Partnership (UK) LEV Light Electric Vehicles RIS3 Regional Smart Specialisation Strategies RSA Region of South Aegean UNECE United Nations Economic Commission for Europe NACE Statistical Classification of Economic Activities in the European Community NSI National Statistical Institute (RO) NUTS Eurostat Nomenclature of Territorial Units for Statistics PP Project Partner ROP Regional Operational Programme SME Small to Medium Enterprise SUMP Sustainable Urban Mobility Plan SWO South-West Oltenia TEN-T Trans-European Transport Networks TFWM Transport for WM UK United Kingdom of Great Britain and Northern Ireland WM West Midlands WMCA West Midlands Combined Authority
9 | P a g e
Executive Summary
As part of the RECREATE project co-financed by ERDF and implemented under the Interreg Europe programme, competitiveness of Transport-related SMEs has been analysed in five partner regions:
West Midlands Campania
Region South Aegean
Region Lithuania South-West Oltenia
United Kingdom Italy Greece Lithuania Romania
The participating regions in the project were strategically selected based on two main criteria:
1. Transport SME presence and potential 2. Relevance of RECREATE's scope with their ROPs.
They are representing (in terms of transport innovation):
Strong Innovators
West Midlands with strong automotive base, clusters and SME support schemes. Strong innovation ecosystem specific to this sector, especially in Low Emission and Connected & Autonomous Vehicles from Coventry, Warwick and Birmingham Universities. Manufacturing Technology Centre, Quinton Rail Innovation Centre and UKBIC. Presence of JLR, Aston Martin, BMW and their Innovative Supply Chains.
Modest Innovators
South-West Oltenia although a modest innovation overall, the transport sector and specifically the automotive sector has the biggest developing potential in the region, having over 27 local units working in this field, the most important one being Ford. One remarkable feat of Romania’s national transport research is the high involvement of SMEs.
Lithuania’s transport innovation and SME schemes are relatively low but transport & logistics is one of their priorities for smart specialisation and thus heavy investment is expected.
Moderate Innovators
South Aegean's innovation is low but with a high presence of transport SMEs especially in the maritime and logistics sector.
Campania although a moderate innovator, recent investments made by large industrial groups such as FIAT (automotive) and Finmeccanica (aerospace and defence) have contributed to higher growth.
West Midlands Overall, the landscape for SMEs in the transport sector and related fields is positive and on an upward trajectory, boosted heavily by the success of its original equipment manufacturers in growing international markets. These sectors are highly dependent on international markets, pan-Europe supply chains and therefore will be affected by international macroeconomic trends. There is room for improvement, however the region boasts strong industry partnerships, an innovative outlook, a supportive business climate, and an internationalisation
10 | P a g e
approach. Coupled with successful case studies and building upon a strong legacy for industry, manufacturing, engineering and automotive, the West Midlands / Warwickshire (and wider Midlands region) continues to be a strong place to attract, incubate and cultivate innovation and transport related industry. Campania Region This report attempts to make an exhaustive analysis of SMEs in Campania working in Transport sector. We have examined road, railway, port, airport and interport infrastructures, as well as public and private transport services providing means of transport or components for automotive, aeronautics/aerospace, vehicles, rail transport systems and port and airport logistics sector. The aim is to reopen SMEs participation and identify their needs, in line with RIS3 (1), verifying how innovation challenges have been addressed and with what results. South Aegean The project REinforce Competitiveness of REgionAl Transport SMEs will map transport SME support measures and assess their effectiveness while the integrated approach adopted by the RECREATE project will drive the identification and further development of support mechanisms in the transport SME sector. The following report is focused on the Region of South Aegean which consists only of islands and geographical challenges arise especially in the transportation sector. Moreover, the report includes general findings as they have been identified through literature review, questionnaires with relevant local and regional stakeholders, as well as analysis of the collected data. The Region of South Aegean is highly touristic but due to numerous factors, research and innovation is considered low compared to the national average and the European average, as well. The overview of the situation throughout the region in terms of the sociodemographic and economic background along with discussions held with relevant actors and stakeholders depict the weaknesses of the region, especially in the transportation sector and the SWOT analysis included herein concludes further needs for future research and additional improvement and development. This report will outline the landscape of competitiveness in transport for the SMEs of the South Aegean Region. More specifically it will identify the innovation process of the regional transport SMEs, as well as their respective position. This includes analysis of general statistical data at regional level as well as the geographical representation, major cities and their respective demographics, employment statistics and additional economical characteristics, etc. Furthermore, regional statistical data regarding the transport sector will be collected, presented and described along with the transport SMEs competitiveness in the fields of road, maritime and air transport. This analysis will be finalised and concluded by the regional innovation potential of the Region. Lithuania Lithuania is a small country where all OP policies are managed at a national level. Although transport is a big contributor to the country's economy and there is a large number of Transport SMEs, the OP does not have a specific focus on transport SMEs yet. The report will help to identify and design approaches that embed new management practices, to identify a set of evaluating criteria for business related elements in Transport-SME sector, in understanding the mechanism to raise competitiveness level of Transport-SME. The specific barriers are identified in Lithuania to help developing relevant Transport-SME support measures to further boost the country's Transport-SMEs’competitiveness. South-West Oltenia The present report contains findings of competitiveness indicators, which are based on the assessment of more than 300 Transport SMEs in South-West Oltenia region. SMEs have not yet succeeded in transforming comparatively good opportunities and conditions into a clear competitive advantage. SMEs see themselves disadvantaged by unfavourable location conditions such as inadequate infrastructure. But the SMEs in SW Oltenia region are making efforts to significantly improve their international competitiveness.

11 | P a g e
An important step to improve international competitiveness is to increase innovation process and energy efficiency. Transport-related SMEs are making efforts to improve in this respect. SMEs have to implement specific measures with further efforts to become competitive in the near future and achieve sector-specific targets. From the perspective of Transport-SMEs, support schemes and measures are essential for increasing their level of competitiveness and stimulate their strong motivation to become winners on the market. A range of barriers can affect the competitiveness of Transport-SMEs. Urgent measures have to be issued and applied. Beside the lack of profitability, a shortage of financial or human resources is a major barrier for many Transport-SMEs.
12 | P a g e
1. Introduction
1.1 RECREATE Project The RECREATE project is under implementation within the third call for proposals of the Interreg Europe 2014-2020 Programme, under the thematic policy topic ‘Improving SMEs Competitiveness’.1
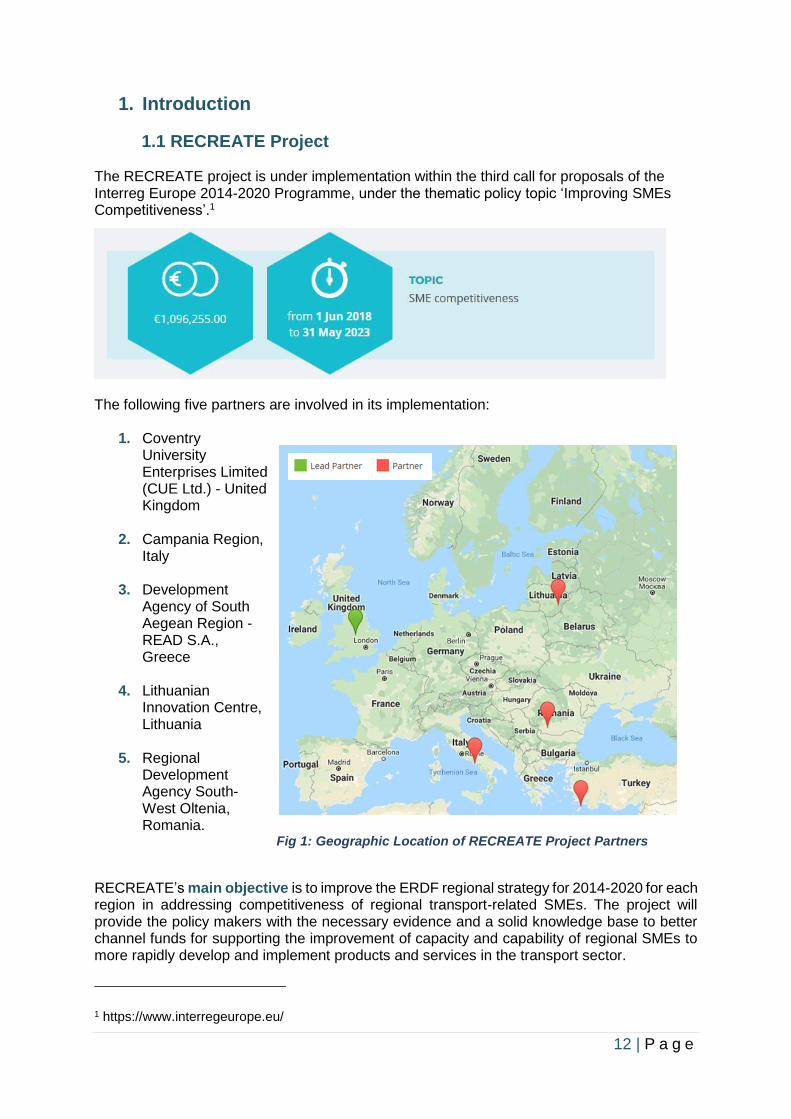
The following five partners are involved in its implementation:
1. Coventry University Enterprises Limited (CUE Ltd.) - United Kingdom
2. Campania Region, Italy
3. Development
Agency of South Aegean Region - READ S.A., Greece
4. Lithuanian
Innovation Centre, Lithuania
5. Regional
Development Agency South-West Oltenia, Romania. Fig 1: Geographic Location of RECREATE Project Partners
RECREATE’s main objective is to improve the ERDF regional strategy for 2014-2020 for each region in addressing competitiveness of regional transport-related SMEs. The project will provide the policy makers with the necessary evidence and a solid knowledge base to better channel funds for supporting the improvement of capacity and capability of regional SMEs to more rapidly develop and implement products and services in the transport sector.
1 https://www.interregeurope.eu/
13 | P a g e
2. General Information
2.1 Purpose of Report The purpose of the Transport SMEs Competitiveness Report is to collect information available at regional (and local) level in the field of SMEs competitiveness in the transport-related sector in these partner regions:
1. West Midlands (UK)
2. Campania (Italy)
3. South Aegean (Greece)
4. Lithuania
5. South-West Oltenia (Romania). Based on the information collected, the Transport SMEs Competitiveness Report for partner regions will be drafted. Using the same approach by all RECREATE project partners, it will facilitate the integration of the findings from the partner regions in a consolidated version of the Transport SMEs Competitiveness Report having an overall image on the status of capacity and capability of Transport-related SMEs sector in the involved regions. Methodology: Each partner conducted interviews and administered questionnaires in their local regions with business support organisations and SMEs in the transport sector. Where relevant, the findings and outcomes of these conversations and collected data will be reported in the appropriate sections.
2.2 Object of Investigation
2.2.1 Main Objective
To identify the innovation process of transport SMEs in the partner regions.
2.2.2 Specific Objectives
The positions of Transport SMEs in the partner regions.
2.2.3 Transport SMEs status quo in each region
Regional analysis in Transport-related areas / sectors in the regions.
2.2.4 Capacity & Capability of Regional Transport SMEs
To further develop and grow.
14 | P a g e
3. Framework
3.1 Database of the Regions
3.1.1 Geography & Governance
West Midlands
United Kingdom
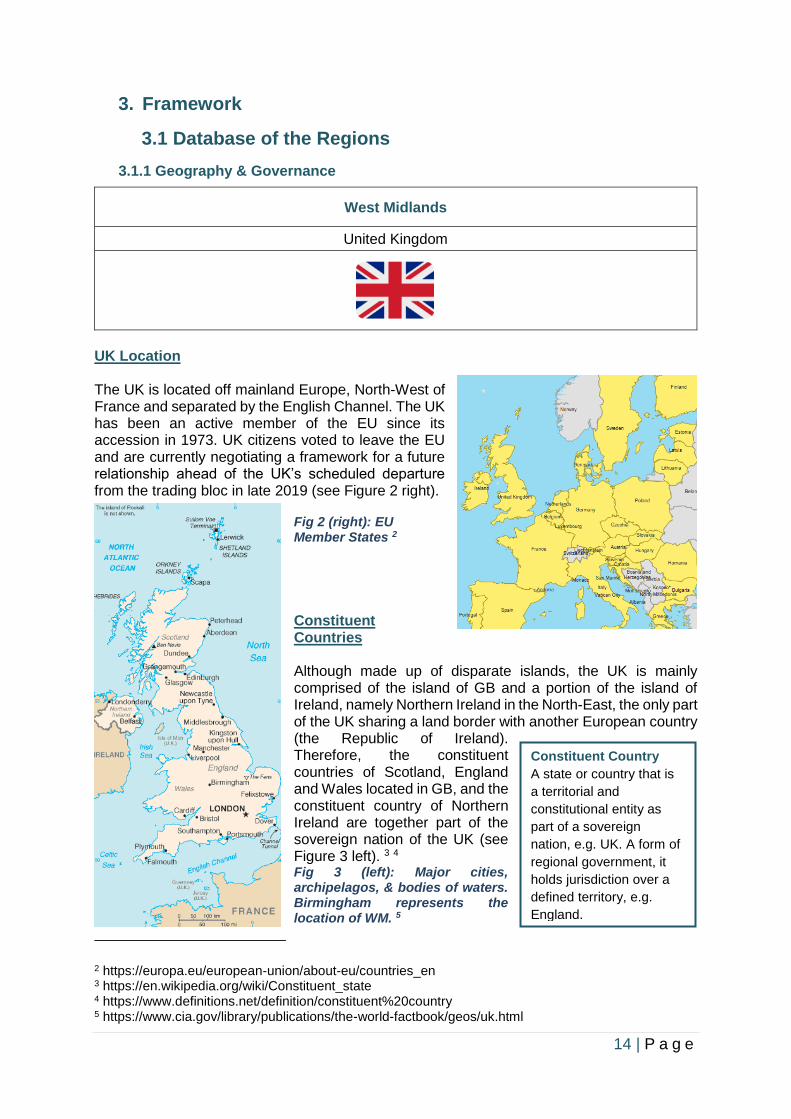
UK Location The UK is located off mainland Europe, North-West of France and separated by the English Channel. The UK has been an active member of the EU since its accession in 1973. UK citizens voted to leave the EU and are currently negotiating a framework for a future relationship ahead of the UK’s scheduled departure from the trading bloc in late 2019 (see Figure 2 right).
Fig 2 (right): EU Member States 2
Constituent Countries Although made up of disparate islands, the UK is mainly comprised of the island of GB and a portion of the island of Ireland, namely Northern Ireland in the North-East, the only part of the UK sharing a land border with another European country (the Republic of Ireland). Therefore, the constituent countries of Scotland, England and Wales located in GB, and the constituent country of Northern Ireland are together part of the sovereign nation of the UK (see Figure 3 left). 3 4 Fig 3 (left): Major cities, archipelagos, & bodies of waters. Birmingham represents the location of WM. 5
2 https://europa.eu/european-union/about-eu/countries_en 3 https://en.wikipedia.org/wiki/Constituent_state 4 https://www.definitions.net/definition/constituent%20country 5 https://www.cia.gov/library/publications/the-world-factbook/geos/uk.html
Constituent Country
A state or country that is
a territorial and
constitutional entity as
part of a sovereign
nation, e.g. UK. A form of
regional government, it
holds jurisdiction over a
defined territory, e.g.
England.
15 | P a g e
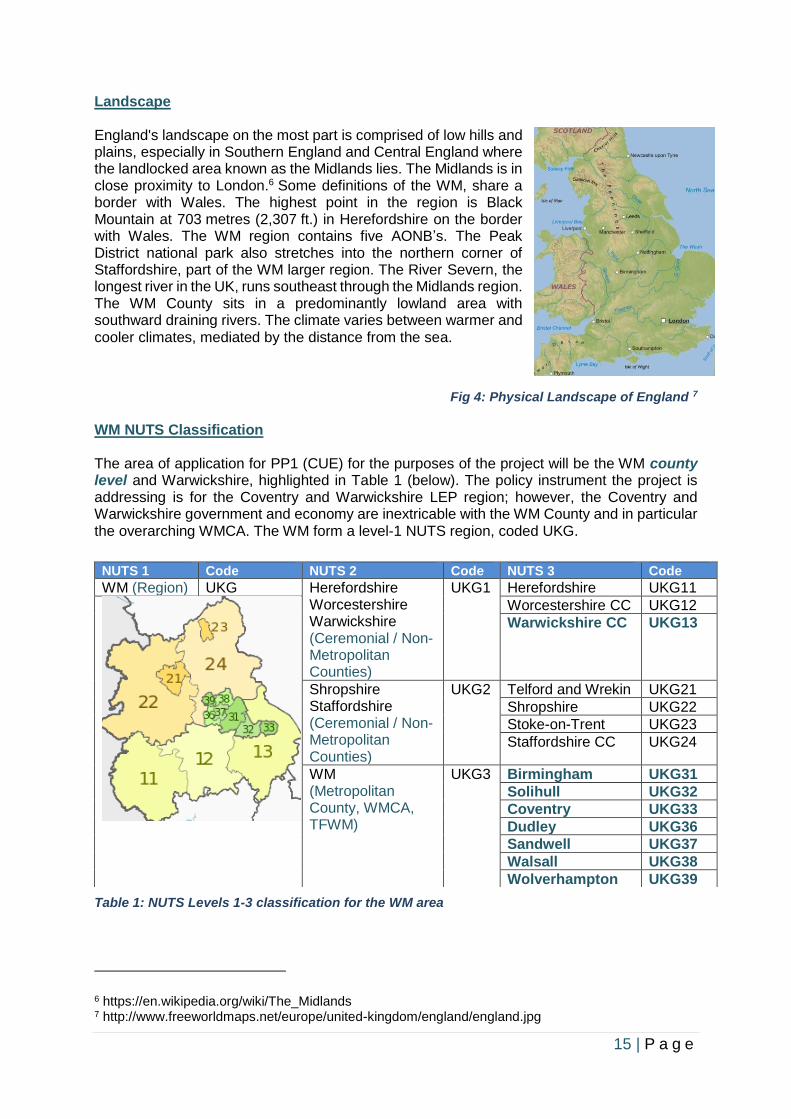
Landscape England's landscape on the most part is comprised of low hills and plains, especially in Southern England and Central England where the landlocked area known as the Midlands lies. The Midlands is in close proximity to London.6 Some definitions of the WM, share a border with Wales. The highest point in the region is Black Mountain at 703 metres (2,307 ft.) in Herefordshire on the border with Wales. The WM region contains five AONB’s. The Peak District national park also stretches into the northern corner of Staffordshire, part of the WM larger region. The River Severn, the longest river in the UK, runs southeast through the Midlands region. The WM County sits in a predominantly lowland area with southward draining rivers. The climate varies between warmer and cooler climates, mediated by the distance from the sea.
Fig 4: Physical Landscape of England 7
WM NUTS Classification
The area of application for PP1 (CUE) for the purposes of the project will be the WM county level and Warwickshire, highlighted in Table 1 (below). The policy instrument the project is addressing is for the Coventry and Warwickshire LEP region; however, the Coventry and Warwickshire government and economy are inextricable with the WM County and in particular the overarching WMCA. The WM form a level-1 NUTS region, coded UKG.
Table 1: NUTS Levels 1-3 classification for the WM area
6 https://en.wikipedia.org/wiki/The_Midlands 7 http://www.freeworldmaps.net/europe/united-kingdom/england/england.jpg
NUTS 1 Code NUTS 2 Code NUTS 3 Code
WM (Region) UKG Herefordshire Worcestershire Warwickshire (Ceremonial / Non-Metropolitan Counties)
UKG1 Herefordshire UKG11
Worcestershire CC UKG12
Warwickshire CC UKG13
Shropshire Staffordshire (Ceremonial / Non-Metropolitan Counties)
UKG2 Telford and Wrekin UKG21
Shropshire UKG22
Stoke-on-Trent UKG23
Staffordshire CC UKG24
WM (Metropolitan County, WMCA, TFWM)
UKG3 Birmingham UKG31
Solihull UKG32
Coventry UKG33
Dudley UKG36
Sandwell UKG37
Walsall UKG38
Wolverhampton UKG39
16 | P a g e
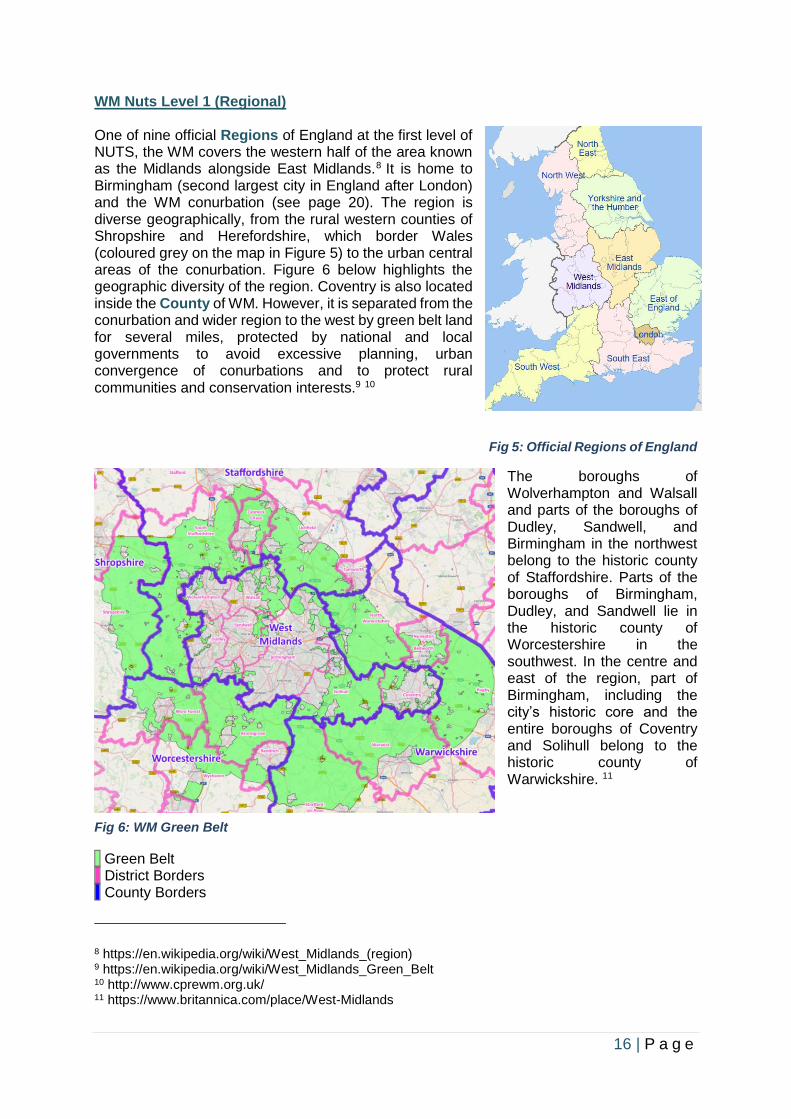
WM Nuts Level 1 (Regional) One of nine official Regions of England at the first level of NUTS, the WM covers the western half of the area known as the Midlands alongside East Midlands.8 It is home to Birmingham (second largest city in England after London) and the WM conurbation (see page 20). The region is diverse geographically, from the rural western counties of Shropshire and Herefordshire, which border Wales (coloured grey on the map in Figure 5) to the urban central areas of the conurbation. Figure 6 below highlights the geographic diversity of the region. Coventry is also located inside the County of WM. However, it is separated from the conurbation and wider region to the west by green belt land for several miles, protected by national and local governments to avoid excessive planning, urban convergence of conurbations and to protect rural communities and conservation interests.9 10
Fig 5: Official Regions of England
The boroughs of Wolverhampton and Walsall and parts of the boroughs of Dudley, Sandwell, and Birmingham in the northwest belong to the historic county of Staffordshire. Parts of the boroughs of Birmingham, Dudley, and Sandwell lie in the historic county of Worcestershire in the southwest. In the centre and east of the region, part of Birmingham, including the city’s historic core and the entire boroughs of Coventry and Solihull belong to the historic county of Warwickshire. 11
Fig 6: WM Green Belt
Green Belt District Borders County Borders
8 https://en.wikipedia.org/wiki/West_Midlands_(region) 9 https://en.wikipedia.org/wiki/West_Midlands_Green_Belt 10 http://www.cprewm.org.uk/ 11 https://www.britannica.com/place/West-Midlands
17 | P a g e
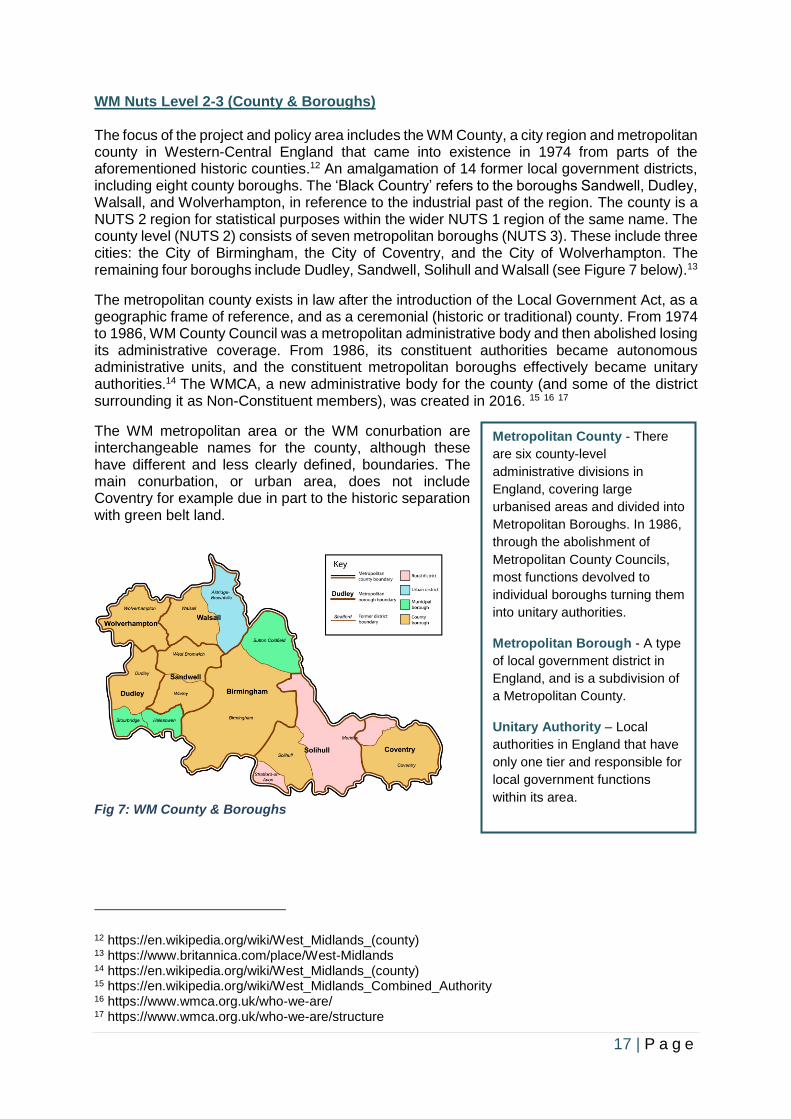
WM Nuts Level 2-3 (County & Boroughs) The focus of the project and policy area includes the WM County, a city region and metropolitan county in Western-Central England that came into existence in 1974 from parts of the aforementioned historic counties.12 An amalgamation of 14 former local government districts, including eight county boroughs. The ‘Black Country’ refers to the boroughs Sandwell, Dudley, Walsall, and Wolverhampton, in reference to the industrial past of the region. The county is a NUTS 2 region for statistical purposes within the wider NUTS 1 region of the same name. The county level (NUTS 2) consists of seven metropolitan boroughs (NUTS 3). These include three cities: the City of Birmingham, the City of Coventry, and the City of Wolverhampton. The remaining four boroughs include Dudley, Sandwell, Solihull and Walsall (see Figure 7 below).13
The metropolitan county exists in law after the introduction of the Local Government Act, as a geographic frame of reference, and as a ceremonial (historic or traditional) county. From 1974 to 1986, WM County Council was a metropolitan administrative body and then abolished losing its administrative coverage. From 1986, its constituent authorities became autonomous administrative units, and the constituent metropolitan boroughs effectively became unitary authorities.14 The WMCA, a new administrative body for the county (and some of the district surrounding it as Non-Constituent members), was created in 2016. 15 16 17
The WM metropolitan area or the WM conurbation are interchangeable names for the county, although these have different and less clearly defined, boundaries. The main conurbation, or urban area, does not include Coventry for example due in part to the historic separation with green belt land.
Fig 7: WM County & Boroughs
12 https://en.wikipedia.org/wiki/West_Midlands_(county) 13 https://www.britannica.com/place/West-Midlands 14 https://en.wikipedia.org/wiki/West_Midlands_(county) 15 https://en.wikipedia.org/wiki/West_Midlands_Combined_Authority 16 https://www.wmca.org.uk/who-we-are/ 17 https://www.wmca.org.uk/who-we-are/structure
Metropolitan County - There
are six county-level
administrative divisions in
England, covering large
urbanised areas and divided into
Metropolitan Boroughs. In 1986,
through the abolishment of
Metropolitan County Councils,
most functions devolved to
individual boroughs turning them
into unitary authorities.
Metropolitan Borough - A type
of local government district in
England, and is a subdivision of
a Metropolitan County.
Unitary Authority – Local
authorities in England that have
only one tier and responsible for
local government functions
within its area.
18 | P a g e
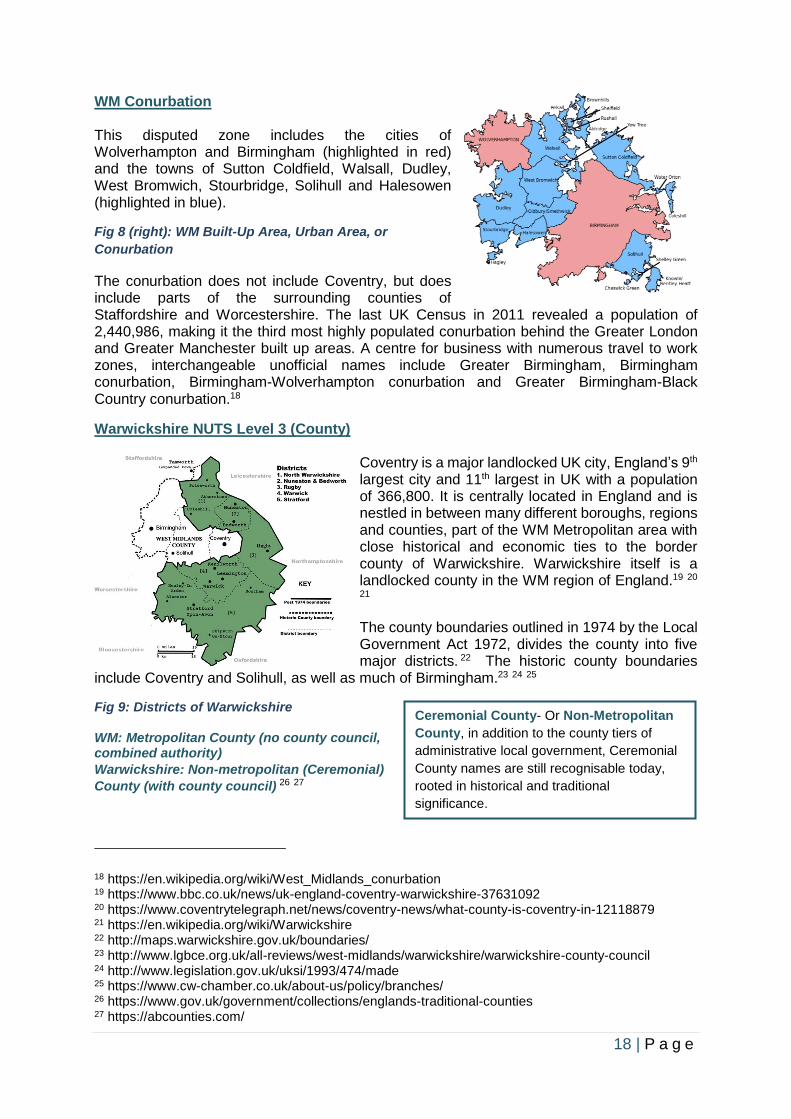
WM Conurbation
This disputed zone includes the cities of Wolverhampton and Birmingham (highlighted in red) and the towns of Sutton Coldfield, Walsall, Dudley, West Bromwich, Stourbridge, Solihull and Halesowen (highlighted in blue).
Fig 8 (right): WM Built-Up Area, Urban Area, or
Conurbation
The conurbation does not include Coventry, but does include parts of the surrounding counties of Staffordshire and Worcestershire. The last UK Census in 2011 revealed a population of 2,440,986, making it the third most highly populated conurbation behind the Greater London and Greater Manchester built up areas. A centre for business with numerous travel to work zones, interchangeable unofficial names include Greater Birmingham, Birmingham conurbation, Birmingham-Wolverhampton conurbation and Greater Birmingham-Black Country conurbation.18
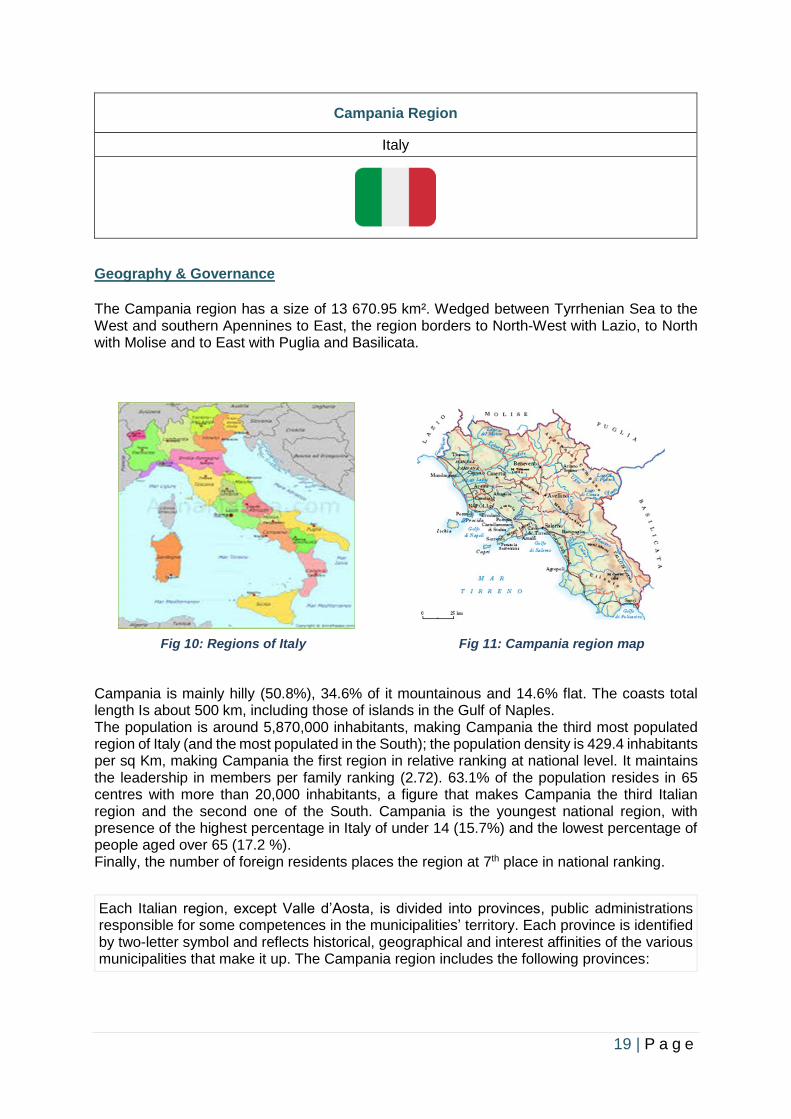
Warwickshire NUTS Level 3 (County)
Coventry is a major landlocked UK city, England’s 9th largest city and 11th largest in UK with a population of 366,800. It is centrally located in England and is nestled in between many different boroughs, regions and counties, part of the WM Metropolitan area with close historical and economic ties to the border county of Warwickshire. Warwickshire itself is a landlocked county in the WM region of England.19 20 21
The county boundaries outlined in 1974 by the Local Government Act 1972, divides the county into five major districts. 22 The historic county boundaries
include Coventry and Solihull, as well as much of Birmingham.23 24 25
Fig 9: Districts of Warwickshire WM: Metropolitan County (no county council, combined authority)
Warwickshire: Non-metropolitan (Ceremonial)
County (with county council) 26 27
18 https://en.wikipedia.org/wiki/West_Midlands_conurbation 19 https://www.bbc.co.uk/news/uk-england-coventry-warwickshire-37631092 20 https://www.coventrytelegraph.net/news/coventry-news/what-county-is-coventry-in-12118879 21 https://en.wikipedia.org/wiki/Warwickshire 22 http://maps.warwickshire.gov.uk/boundaries/ 23 http://www.lgbce.org.uk/all-reviews/west-midlands/warwickshire/warwickshire-county-council 24 http://www.legislation.gov.uk/uksi/1993/474/made 25 https://www.cw-chamber.co.uk/about-us/policy/branches/ 26 https://www.gov.uk/government/collections/englands-traditional-counties 27 https://abcounties.com/
Ceremonial County- Or Non-Metropolitan
County, in addition to the county tiers of
administrative local government, Ceremonial
County names are still recognisable today,
rooted in historical and traditional
significance.
19 | P a g e
Campania Region
Italy
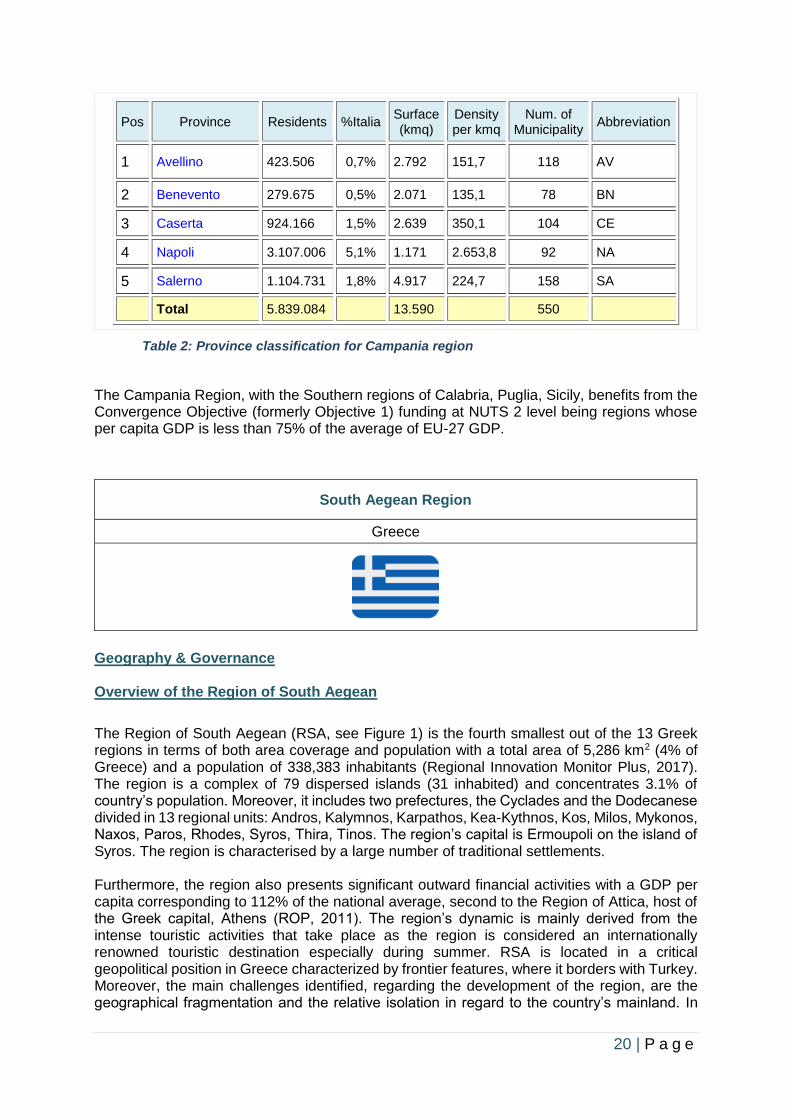
Geography & Governance
The Campania region has a size of 13 670.95 km². Wedged between Tyrrhenian Sea to the West and southern Apennines to East, the region borders to North-West with Lazio, to North with Molise and to East with Puglia and Basilicata.
Fig 10: Regions of Italy Fig 11: Campania region map
Campania is mainly hilly (50.8%), 34.6% of it mountainous and 14.6% flat. The coasts total length Is about 500 km, including those of islands in the Gulf of Naples. The population is around 5,870,000 inhabitants, making Campania the third most populated region of Italy (and the most populated in the South); the population density is 429.4 inhabitants per sq Km, making Campania the first region in relative ranking at national level. It maintains the leadership in members per family ranking (2.72). 63.1% of the population resides in 65 centres with more than 20,000 inhabitants, a figure that makes Campania the third Italian region and the second one of the South. Campania is the youngest national region, with presence of the highest percentage in Italy of under 14 (15.7%) and the lowest percentage of people aged over 65 (17.2 %). Finally, the number of foreign residents places the region at 7th place in national ranking.
Each Italian region, except Valle d’Aosta, is divided into provinces, public administrations responsible for some competences in the municipalities’ territory. Each province is identified by two-letter symbol and reflects historical, geographical and interest affinities of the various municipalities that make it up. The Campania region includes the following provinces:
20 | P a g e
Pos Province Residents %Italia Surface (kmq)
Density per kmq
Num. of Municipality
Abbreviation
1 Avellino 423.506 0,7% 2.792 151,7 118 AV
2 Benevento 279.675 0,5% 2.071 135,1 78 BN
3 Caserta 924.166 1,5% 2.639 350,1 104 CE
4 Napoli 3.107.006 5,1% 1.171 2.653,8 92 NA
5 Salerno 1.104.731 1,8% 4.917 224,7 158 SA
Total 5.839.084 13.590 550
Table 2: Province classification for Campania region
The Campania Region, with the Southern regions of Calabria, Puglia, Sicily, benefits from the Convergence Objective (formerly Objective 1) funding at NUTS 2 level being regions whose per capita GDP is less than 75% of the average of EU-27 GDP.
South Aegean Region
Greece
Geography & Governance Overview of the Region of South Aegean
The Region of South Aegean (RSA, see Figure 1) is the fourth smallest out of the 13 Greek regions in terms of both area coverage and population with a total area of 5,286 km2 (4% of Greece) and a population of 338,383 inhabitants (Regional Innovation Monitor Plus, 2017). The region is a complex of 79 dispersed islands (31 inhabited) and concentrates 3.1% of country’s population. Moreover, it includes two prefectures, the Cyclades and the Dodecanese divided in 13 regional units: Andros, Kalymnos, Karpathos, Kea-Kythnos, Kos, Milos, Mykonos, Naxos, Paros, Rhodes, Syros, Thira, Tinos. The region’s capital is Ermoupoli on the island of Syros. The region is characterised by a large number of traditional settlements. Furthermore, the region also presents significant outward financial activities with a GDP per capita corresponding to 112% of the national average, second to the Region of Attica, host of the Greek capital, Athens (ROP, 2011). The region’s dynamic is mainly derived from the intense touristic activities that take place as the region is considered an internationally renowned touristic destination especially during summer. RSA is located in a critical geopolitical position in Greece characterized by frontier features, where it borders with Turkey. Moreover, the main challenges identified, regarding the development of the region, are the geographical fragmentation and the relative isolation in regard to the country’s mainland. In
21 | P a g e
addition, eventhough the region is endowed with a rich cultural and natural environment, it lacks conventional energy resources.
However, these obstacles are gradually fading due to investments in tourism and infrastructures, including research and innovation, and a growing service sector (RIS3 Regional Assessment: South Aegean, 2012). The table 1 below gives an overview of the priorities set by the RSA itself in order to enhance development.
Priority Name Description
Agrifood and nutrition/quality-of-life
Emphasis will be given on traditional often unique varieties, biodiversity, branding, certification, product differentiation, eco-tourism and gastro-tourism, cluster promotion, eco-agriculture, outward-orientation.
Tourism, culture and 'experience' industry
Emphasis will be given on expanding the value chain (links with agrifood, culture, and crafts industries), product differentiation and 'experience' tourism, infrastructures and logistics, natural and cultural capital, branding and targeted activity tourism, use of ICTs and green technologies.
Fisheries and aquaculture
Emphasis will be placed on product differentiation, biotechnological applications, links with tourism, biodiversity, quality and certification management, logistics, new methods of processing and preservation (non-thermal), networks and marketing.
Green technologies and renewables
Emphasis will be placed on environmental sustainability, especially on coastal areas, green technology diffusion, energy efficiency and increasing the share of renewables as sources of energy.
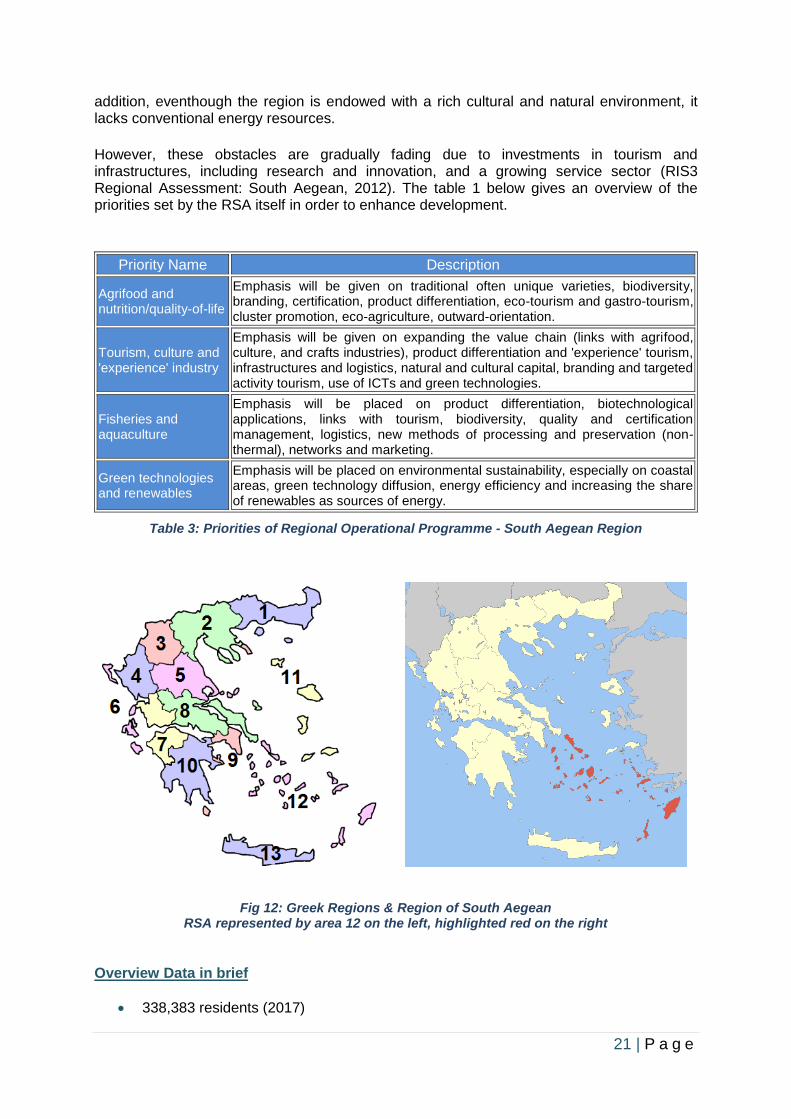
Table 3: Priorities of Regional Operational Programme - South Aegean Region
Fig 12: Greek Regions & Region of South Aegean RSA represented by area 12 on the left, highlighted red on the right
Overview Data in brief
• 338,383 residents (2017)
22 | P a g e
• Capital: Ermoupoli, Syros
• 13 regional units (previously prefectures)
• 5,285,99 km2
• Density: 58/ km2 Governance The Regional Operational Programme of South Aegean includes actions and measures funded by the European Regional Development Fund (ERDF) and the European Social Fund (ESF). The design and implementation of the current programming period (2014-2020) in relation to ROP funds, is the RSA’s responsibility in close collaboration with the Special Managing Authority for the Operational Programme of South Aegean. Additionally, financial control is the responsibility of the Regional Development Fund of South Aegean.
Lithuania
Lithuania
Geography & Governance
Location & Landscape
The Republic of Lithuania referred to herein as Lithuania, is located in the North-Eastern part of Europe forming part of the Baltic Rim region of countries (those sharing a border with the Baltic Sea, also known as the Baltic States). Lithuania covers an area of around 65,300 sq. km. Lithuania is glacially flat, except for morainic hills in the western upland and eastern highlands no higher than 300 metres. It has approximately 99 km of sandy coastline, of which 38 km face the open Baltic Sea. Lithuania includes 10 counties and 60 municipalities:
1. Vilnius 2. Kaunas 3. Klaipėda 4. Šiauliai 5. Panevėžys 6. Alytus 7. Marijampolė 8. Tauragė 9. Telšiai 10. Utena
The country is a higher administrative unit and is formed of the territories of the municipalities. Based on the latest data, there are 103 cities and towns in the country. Even though the Lithuanian market is relatively small, transport SMEs can operate in a single EU market, which includes a population of around half a billion, without many restrictions since 2004 when it
23 | P a g e
joined this community. In the East, there are also other major markets; however, accessibility to them is more difficult. Lithuania has a wide range of different markets to operate in.
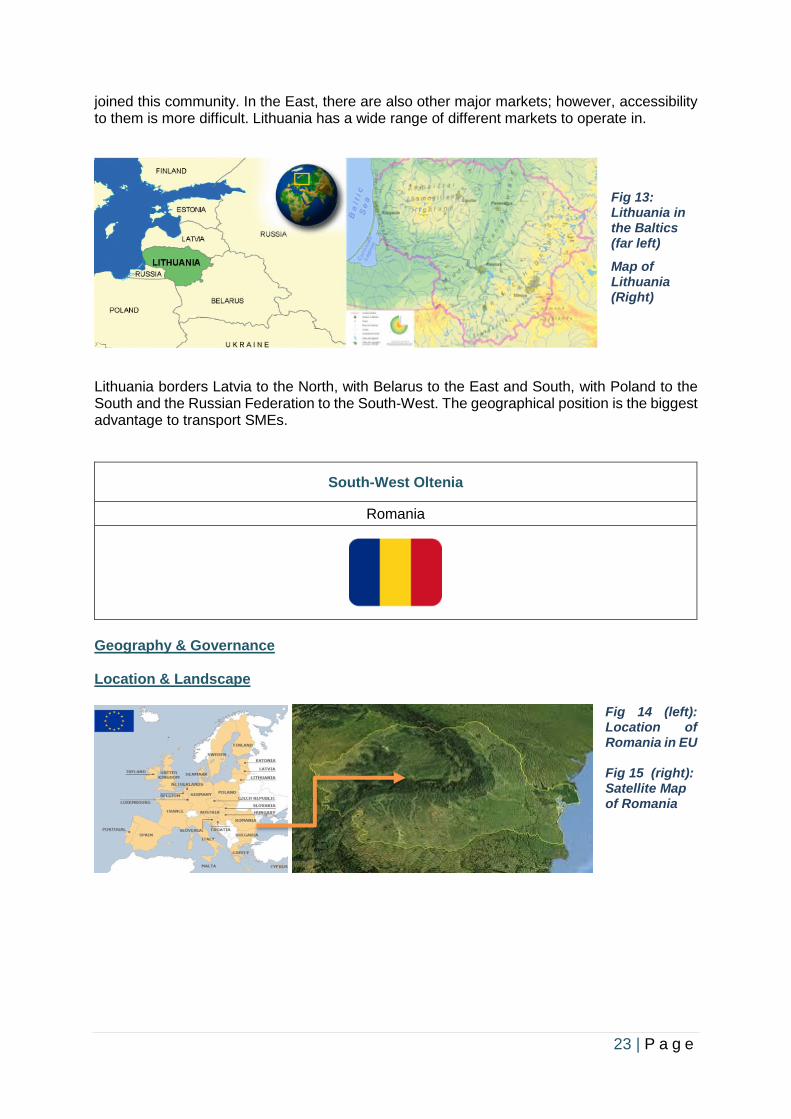
Fig 13: Lithuania in the Baltics (far left)
Map of Lithuania (Right)
Lithuania borders Latvia to the North, with Belarus to the East and South, with Poland to the South and the Russian Federation to the South-West. The geographical position is the biggest advantage to transport SMEs.
South-West Oltenia
Romania
Geography & Governance Location & Landscape
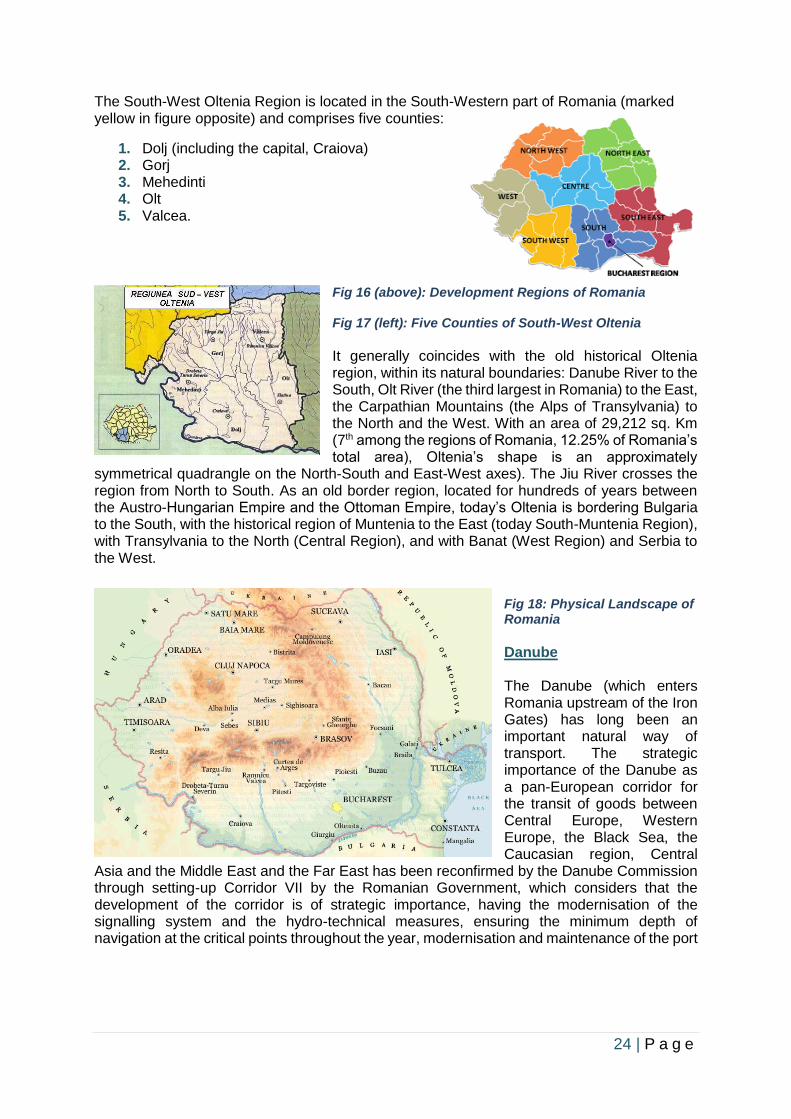
Fig 14 (left): Location of Romania in EU Fig 15 (right): Satellite Map of Romania
24 | P a g e
The South-West Oltenia Region is located in the South-Western part of Romania (marked yellow in figure opposite) and comprises five counties:
1. Dolj (including the capital, Craiova) 2. Gorj 3. Mehedinti 4. Olt 5. Valcea.
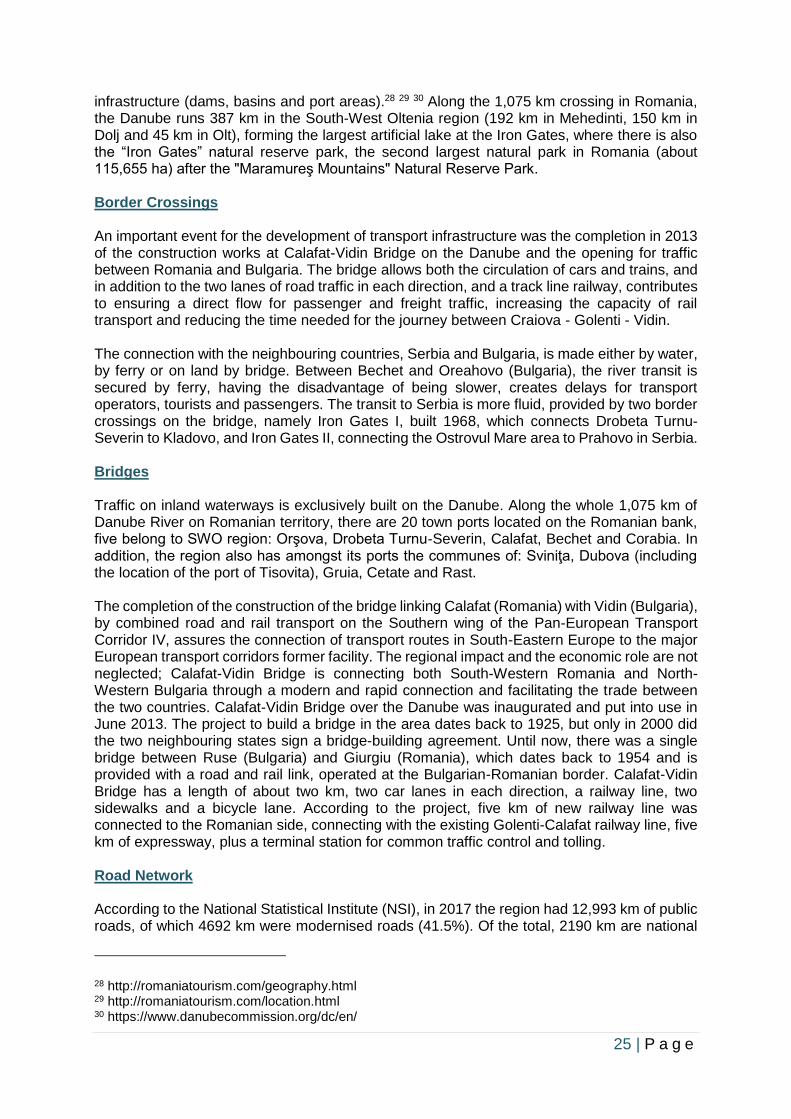
Fig 16 (above): Development Regions of Romania Fig 17 (left): Five Counties of South-West Oltenia
It generally coincides with the old historical Oltenia region, within its natural boundaries: Danube River to the South, Olt River (the third largest in Romania) to the East, the Carpathian Mountains (the Alps of Transylvania) to the North and the West. With an area of 29,212 sq. Km (7th among the regions of Romania, 12.25% of Romania’s total area), Oltenia’s shape is an approximately
symmetrical quadrangle on the North-South and East-West axes). The Jiu River crosses the region from North to South. As an old border region, located for hundreds of years between the Austro-Hungarian Empire and the Ottoman Empire, today’s Oltenia is bordering Bulgaria to the South, with the historical region of Muntenia to the East (today South-Muntenia Region), with Transylvania to the North (Central Region), and with Banat (West Region) and Serbia to the West.
Fig 18: Physical Landscape of Romania Danube The Danube (which enters Romania upstream of the Iron Gates) has long been an important natural way of transport. The strategic importance of the Danube as a pan-European corridor for the transit of goods between Central Europe, Western Europe, the Black Sea, the Caucasian region, Central
Asia and the Middle East and the Far East has been reconfirmed by the Danube Commission through setting-up Corridor VII by the Romanian Government, which considers that the development of the corridor is of strategic importance, having the modernisation of the signalling system and the hydro-technical measures, ensuring the minimum depth of navigation at the critical points throughout the year, modernisation and maintenance of the port
25 | P a g e
infrastructure (dams, basins and port areas).28 29 30 Along the 1,075 km crossing in Romania, the Danube runs 387 km in the South-West Oltenia region (192 km in Mehedinti, 150 km in Dolj and 45 km in Olt), forming the largest artificial lake at the Iron Gates, where there is also the “Iron Gates” natural reserve park, the second largest natural park in Romania (about 115,655 ha) after the "Maramureş Mountains" Natural Reserve Park. Border Crossings An important event for the development of transport infrastructure was the completion in 2013 of the construction works at Calafat-Vidin Bridge on the Danube and the opening for traffic between Romania and Bulgaria. The bridge allows both the circulation of cars and trains, and in addition to the two lanes of road traffic in each direction, and a track line railway, contributes to ensuring a direct flow for passenger and freight traffic, increasing the capacity of rail transport and reducing the time needed for the journey between Craiova - Golenti - Vidin. The connection with the neighbouring countries, Serbia and Bulgaria, is made either by water, by ferry or on land by bridge. Between Bechet and Oreahovo (Bulgaria), the river transit is secured by ferry, having the disadvantage of being slower, creates delays for transport operators, tourists and passengers. The transit to Serbia is more fluid, provided by two border crossings on the bridge, namely Iron Gates I, built 1968, which connects Drobeta Turnu-Severin to Kladovo, and Iron Gates II, connecting the Ostrovul Mare area to Prahovo in Serbia. Bridges Traffic on inland waterways is exclusively built on the Danube. Along the whole 1,075 km of Danube River on Romanian territory, there are 20 town ports located on the Romanian bank, five belong to SWO region: Orşova, Drobeta Turnu-Severin, Calafat, Bechet and Corabia. In addition, the region also has amongst its ports the communes of: Sviniţa, Dubova (including the location of the port of Tisovita), Gruia, Cetate and Rast. The completion of the construction of the bridge linking Calafat (Romania) with Vidin (Bulgaria), by combined road and rail transport on the Southern wing of the Pan-European Transport Corridor IV, assures the connection of transport routes in South-Eastern Europe to the major European transport corridors former facility. The regional impact and the economic role are not neglected; Calafat-Vidin Bridge is connecting both South-Western Romania and North-Western Bulgaria through a modern and rapid connection and facilitating the trade between the two countries. Calafat-Vidin Bridge over the Danube was inaugurated and put into use in June 2013. The project to build a bridge in the area dates back to 1925, but only in 2000 did the two neighbouring states sign a bridge-building agreement. Until now, there was a single bridge between Ruse (Bulgaria) and Giurgiu (Romania), which dates back to 1954 and is provided with a road and rail link, operated at the Bulgarian-Romanian border. Calafat-Vidin Bridge has a length of about two km, two car lanes in each direction, a railway line, two sidewalks and a bicycle lane. According to the project, five km of new railway line was connected to the Romanian side, connecting with the existing Golenti-Calafat railway line, five km of expressway, plus a terminal station for common traffic control and tolling. Road Network According to the National Statistical Institute (NSI), in 2017 the region had 12,993 km of public roads, of which 4692 km were modernised roads (41.5%). Of the total, 2190 km are national
28 http://romaniatourism.com/geography.html 29 http://romaniatourism.com/location.html 30 https://www.danubecommission.org/dc/en/
26 | P a g e
roads, 4650 km are county roads and 4453 km are communal roads. The national roads in the region are upgraded to 90% (1976 km), county roads in proportion of 35% (1597 km), and the communal roads in proportion of 25% (1119 km). There are no motorways in the SWO Region. The network of city streets in SWO was 3,014 km in 2016 (according to the last statistical data available), representing 9.7% of the national total. A number of 2,052 km are upgraded, representing 68% of the total regional. The main means of road transport are buses and minibuses, in all the counties of the region. In Dolj, in Craiova, there is also the transportation with trams, and trolleybus transport in Gorj, Târgu Jiu. Railway Network According to NSI, in 2017 the railway network in service in the SWO Region equalled 990 km, representing 9.2% of the national total. 31 The electrified lines have a length of 507 km, representing 51.2% of the length of the railways crossing the region (above the national average of 37.4%) and 12.6% of the total national electrified routes. The main railway node is Craiova having links to localities in the region and country. An important feature of the rail transport infrastructure in the region is determined by the presence of the Railway Corridor IV on the Sofia-Thessaloniki branch, Sofia-Istanbul, which connects Arad, Timisoara, Craiova and Calafat. This section is part of the project priority TEN-T 22: Athens - Sofia - Budapest - Vienna - Prague - Nürnberg / Dresden. Air Traffic Air traffic is provided by Craiova International Airport, the maximum objective importance in the development of the southwest of the country, as stated in the strategic regional documents. The airport serves the whole area of SWO, being the closest air carrier for the five counties. The inclusion of the airport in the Romanian Master Plan of Transport proved to be a major investment opportunity in infrastructure upgrading and growing its operating capability.
3.1.2 Major Towns & Accessibility
West Midlands
United Kingdom
Population of Major Towns
31 http://nsi.bg/en
Name Geography Population
United Kingdom Sovereign Nation Inc. Constituent Countries: England, Scotland, Wales, Northern Ireland
66,435,550
Great Britain Part of British Isles, Inc. England, Scotland, Wales only
64,553,909
England & Wales Constituent Countries 59,115,809
England Country 55,977,178
27 | P a g e
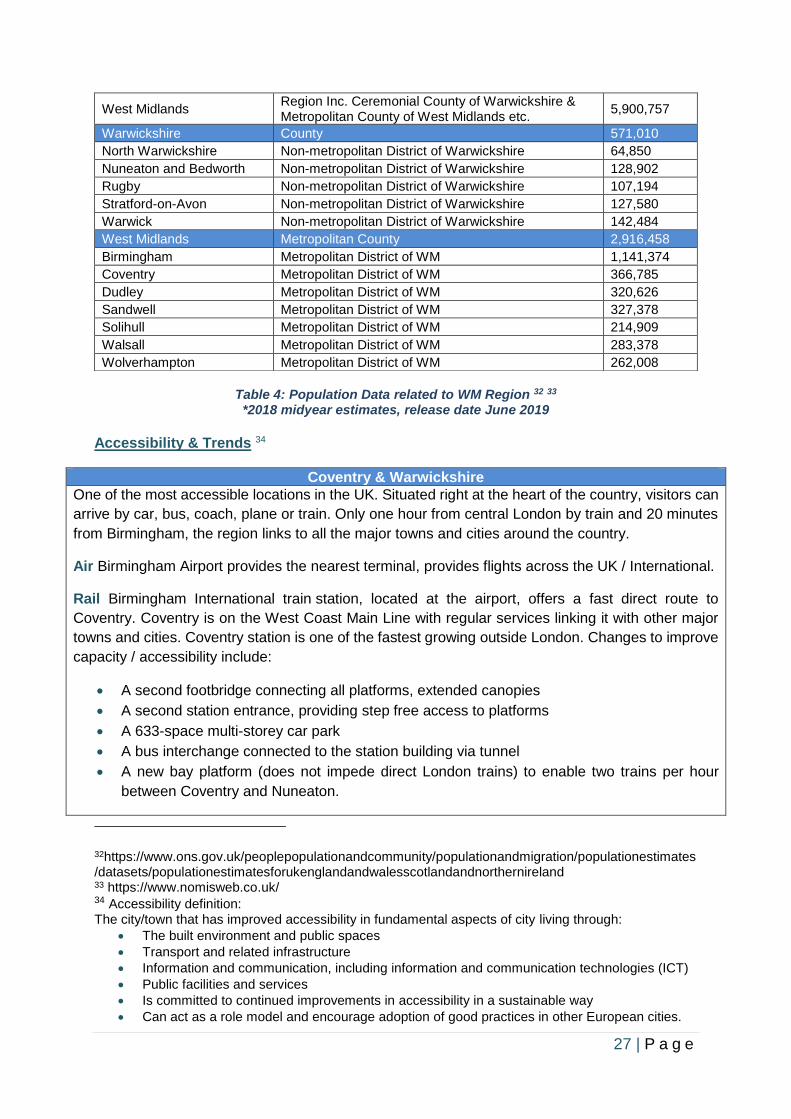
Table 4: Population Data related to WM Region 32 33
*2018 midyear estimates, release date June 2019
Accessibility & Trends 34
Coventry & Warwickshire
One of the most accessible locations in the UK. Situated right at the heart of the country, visitors can
arrive by car, bus, coach, plane or train. Only one hour from central London by train and 20 minutes
from Birmingham, the region links to all the major towns and cities around the country.
Air Birmingham Airport provides the nearest terminal, provides flights across the UK / International.
Rail Birmingham International train station, located at the airport, offers a fast direct route to
Coventry. Coventry is on the West Coast Main Line with regular services linking it with other major
towns and cities. Coventry station is one of the fastest growing outside London. Changes to improve
capacity / accessibility include:
• A second footbridge connecting all platforms, extended canopies
• A second station entrance, providing step free access to platforms
• A 633-space multi-storey car park
• A bus interchange connected to the station building via tunnel
• A new bay platform (does not impede direct London trains) to enable two trains per hour
between Coventry and Nuneaton.
32https://www.ons.gov.uk/peoplepopulationandcommunity/populationandmigration/populationestimates/datasets/populationestimatesforukenglandandwalesscotlandandnorthernireland 33 https://www.nomisweb.co.uk/ 34 Accessibility definition: The city/town that has improved accessibility in fundamental aspects of city living through:
• The built environment and public spaces
• Transport and related infrastructure
• Information and communication, including information and communication technologies (ICT)
• Public facilities and services
• Is committed to continued improvements in accessibility in a sustainable way
• Can act as a role model and encourage adoption of good practices in other European cities.
West Midlands Region Inc. Ceremonial County of Warwickshire & Metropolitan County of West Midlands etc.
5,900,757
Warwickshire County 571,010
North Warwickshire Non-metropolitan District of Warwickshire 64,850
Nuneaton and Bedworth Non-metropolitan District of Warwickshire 128,902
Rugby Non-metropolitan District of Warwickshire 107,194
Stratford-on-Avon Non-metropolitan District of Warwickshire 127,580
Warwick Non-metropolitan District of Warwickshire 142,484
West Midlands Metropolitan County 2,916,458
Birmingham Metropolitan District of WM 1,141,374
Coventry Metropolitan District of WM 366,785
Dudley Metropolitan District of WM 320,626
Sandwell Metropolitan District of WM 327,378
Solihull Metropolitan District of WM 214,909
Walsall Metropolitan District of WM 283,378
Wolverhampton Metropolitan District of WM 262,008
28 | P a g e
CCC, working in partnership with TFWM, Network Rail, Virgin Trains and other stakeholders, is
leading the scheme. Funded with grants from Coventry and Warwickshire Local Enterprise
Partnership Growth Deal, Department for Transport and WMCA. The completion date will be in time
for Coventry being the UK City of Culture in 2021.
Improvements have already taken place on the Coventry to Nuneaton rail line. Known locally as
Nuckle 1.1 it forms the first part of a vision for a direct rail link between Nuneaton and Leamington.
Two new stations are complete at Coventry (Ricoh) Arena and Bermuda park in Warwickshire. To
accommodate longer trains the platforms have been extended for users of Bedworth station. This
work was part funded by ERDF. Nuckle 1.2 will provide a new platform at Coventry station, allowing
the rail service to increase the frequency from one train per hour to two trains per hour. A new station
has opened in Kenilworth as part of the wider Nuckle programme.35
Road With easy access to the national motorway network. The M6, M6 Toll, M40, M42, M5, M69 and
the A45/A46 are the major routes out of and into the city of Coventry and regional Warwickshire, as
well as linking central Birmingham.
Cycling Coventry and its neighbouring towns have access for cyclists, with traffic free and cycle
friendly routes. 36
WM Metropolitan County
Road The WM sits at the heart of the national transport network. Three separate bodies manage the
roads through the region. Highways England operate, manage and maintain the motorways and
important trunk roads commonly referred to as the strategic road network. Midland Expressway
Limited privately operates the M6 Toll road, which bypasses the M6 in Birmingham. The seven local
highway authorities maintain the roads within the local authority boundaries amounting to over
9,000km. In November 2015, the WM LA’s commenced consultation on defining a Key Route
Network (KRN). With the aim to serve the main strategic demand flows for general traffic, bus and
freight operations across the conurbation. The network needed to support accessibility for businesses
and logistics, and accommodate movement of rapid transport and core bus services to ensure
journey time reliability and an enhanced role for Urban Traffic Control (UTC). In January 2016, the
LA’s and TFWM agreed the roads comprising the KRN (23 routes). The KRN comprises 7% of roads
within the local authority road network. The network is essential for:
• Serving the main strategic demand flows of people, goods and services;
• Serving large traffic volumes;
• Providing connections to the national strategic road network.
Close examination on the KRN shows that the worst performing sections are frequently those where
junctions provide access into the largest strategic centres. There are widespread link and junction
capacity issues across the whole of the KRN particularly in Birmingham, the Black Country and some
sections in Coventry. This is due mainly to the large volumes of traffic accessing urban centres in the
AM peak where many junctions are over capacity and network performance has been significantly
reduced. As a consequence, there is break down of flow leading to congestion.
35 https://www.coventry.gov.uk/stationmasterplan 36 https://www.visitcoventry.co.uk/travel
29 | P a g e
The KRN makes up only (7%) of roads across the WM road network by length, but carries half (50%)
of its traffic. Across the 605km of network, 3.05 billion miles were travelled in 2016. Traffic flows on
the KRN have increased steadily since 2013 despite some years of marginal decline. Based on the
latest DfT data, flows are returning to the level prior to the 2008 recession. In WM the M6, M5 and
M42 link to form the Birmingham Motorway Box joining routes of national economic importance and
providing connection routes across the region. Traffic data taken from one hour during inter-peak
time in 2011 shows a large proportion of motorists joining the network in the WM use the strategic
road network to make shorter journeys of one or two junctions.
The ability of the region’s businesses to make and receive deliveries of goods and raw materials
efficiently is crucial to the growth of all sectors of the WM economy. The predictability of delivery
times is critical to the productivity of manufacturing and retail businesses that rely upon being able to
deliver and receive the right goods at the right time.
The day to day operation of the WM KRN remains under the control of the individual local authorities,
with WMCA taking a strategic management and coordination role across the region. There are four
UTC centres across the WM metropolitan area. However, there are currently a number of challenges
relating to the urban traffic control systems which in many cases are not delivering the high level of
functionality required.
Public Transport
A consequence of increased traffic levels across the KRN is the impact this has on the travelling
public particularly bus passengers. Increased traffic congestion has seen the average speed of many
bus services reduced to single digit in the AM peak period (07:00 – 10:00). The WM traffic trends
follow national trends and have seen a decrease in average vehicle speed with particular congestion
locations along routes and junctions serving commuter centres. The bus in the WM remains the single
most important mode for achieving the ambition for reducing congestion and improving air quality
whilst moving the largest volume of people in a sustainable way. Across the 23 routes, there are over
500,000 daily traffic movements, but also in excess of 800,000 bus trips.
Cycling
Approximately 41% of journeys under two miles in the WM are made by car. There is scope for an
increased role for sustainable travel. Smarter choice initiatives have a role to play, as do
improvements to cycle-public transport integration to support longer journeys. The WM Cycling
Charter aims to influence higher standards of cycling infrastructure provision, including segregated
routes and improved canal towpath provision. The Strategic Cycle Network in the WM identifies the
major corridors of the movement of cyclists through the metropolitan area. These corridors were
identified using Propensity to Cycle data and movement patterns generated through key destinations
(including residential, employment and other sites). The Metropolitan Cycle Network includes the
strategic cycle network as well as the canal towpaths, greenways, National Cycle Network and other
local routes through the region. These cycling corridors play a vital role in facilitating safe movement
across the WM away from the busy and congested KRN. However, as the corridors are developed
there are important interactions with the KRN that may take place along the 23 routes, these include:
• Stourbridge to North of Wolverhampton – along the A449 Stafford Road
• Black Country Route – along the A454 Willenhall Road
• Birmingham to Stafford – A34
• Black Country to Birmingham – along the A41
30 | P a g e
• West of Birmingham – A456 Hagley Road
• Birmingham Cross City – along the A38, A435 and A5127
• Coventry to Birmingham – along the A45 Coventry Road
• East of Coventry Route
• North and South Country – A4114
• Kingswinford to Halesowen – A4101 As part of setting out the baseline position for the KRN a workshop was held with the Cycling Officers
from across the local highway authorities, the issues, challenges and existing provision along each
route has been identified and can be found within each of the route reports.
Incident Management on KRN
Recent incidents in the WM have shown that there is a greater need for improved coordination
between all stakeholders including LA’s, Highways England, operators of the M6 Toll, Network Rail,
utility companies, bus and train operators. There are significant benefits that can be realised by
greater coordination during incidents that impact both the KRN and the SRN. The development of
the KRN and the associated responsibilities and functions of the WM Mayor provides an opportunity
to drive changes to improve coordination between multiple agencies to provide better management
of the network. When large events like a demonstration or a major incident occurs such as the
discovery of an unexploded bomb in Birmingham in May 2017, the Police will invoke the Tactical Co-
ordination Group (TCG). This is the drawing together of all the Category 1 & 2 responders as well as
charitable agencies into a purpose-built control room at the WM Police training centre. However,
although there is a degree of shared knowledge and joint working, to a degree all organisations
remain working at arm’s length from each other and the function of the TCG is really limited to that of
an information sharing facility. The main stakeholders in the WM, including LA’s, TfWM, police and
emergency services, are currently developing a set of incident management protocols aimed at
improving the way incidents are managed on the local network.
Travel Trends
The WM KRN despite comprising 7% of the overall network carries 50% of all traffic. Substantial
volumes of traffic are represented by commuter trips into the largest strategic centres which
contribute to the overall congestion on the network. To understand how these journeys are
undertaken and the role the KRN plays in facilitating them, consideration has been given to the last
Census (2011) data regarding where people live in the metropolitan area and how they chose to
travel to work. There are limitations with the data shown as it does not include journeys by walking,
tram or cycling. In addition, there are a small number of trips into Dudley that aren’t included and the
decline in bus base public transport during the period since the Census should be considered. There
is no railway station in Dudley town centre and majority of resident’s commute by car. Data gathered
from past Census years has shown a modal shift in the behaviours of commuter’s journey choices to
work. Between 1981 and 2011 there has been a continued reduction in the use of buses and walking
to travel to work. Car use has increased year on year and the introduction of metro figures in 2001
has seen a slight rise in 2011.37
37 https://www.tfwm.org.uk/media/2873/west-midlands-key-route-network-evidence-report-2018.pdf
31 | P a g e
High Speed Rail 2 (HS2)
Two new stations will be opened in the region for HS2. Curzon Street station in central Birmingham
will be the first brand new intercity station built in Britain since 19th century, create a new landmark
for the city and boost opportunities for regeneration in the city. Opening with seven high speed
platforms in 2026, the new station will not only be for high speed rail passengers, it will be a brand-
new public space in Birmingham. It will be fully integrated into an extended tram network, as well as
offering pedestrian, cycle, taxi, bus and conventional rail connections to the rest of the city and the
wider WM.
Interchange station will be a new major gateway station for the region, part of a new public transport
interchange serving Solihull, the WM, Birmingham Airport and the NEC. The station will help deliver
longer term development and growth proposals, including new homes, business space and jobs.
Works are underway on 60 sites across the route.
Recent Developments
The latest segregated cycle route delivered as part of the Birmingham Cycle Revolution (BCR)
programme has been completed and is now open for use. The new A38 route from Selly Oak offers
a 4km two-way segregated cycle route for people cycling into the city centre from the south west of
the city. The route is highly visible with a blue aggregate surface to make it stand out to all road users.
This route has been funded through a combination of the DfT’s Cycle City Ambition Grant and the
Greater Birmingham and Solihull LEP’s Growth Fund.38
Table 5: Major Conurbations and Accessibility in the WM Region
Campania Region
Italy
Major Towns & Accessibility The city of Naples is capital of the Region, Salerno, Caserta, Benevento and Avellino are the other Provinces.
ISTAT
code
Capital
municipality and
province
abbreviation
Surface
Kmq
Total
population
Foreign
population FOR%
Density
(Inhab/Km2)
63049 Napoli (NA) 117,27 989.111 47.031 4,8 8.434,5
38 https://gbslep.co.uk/
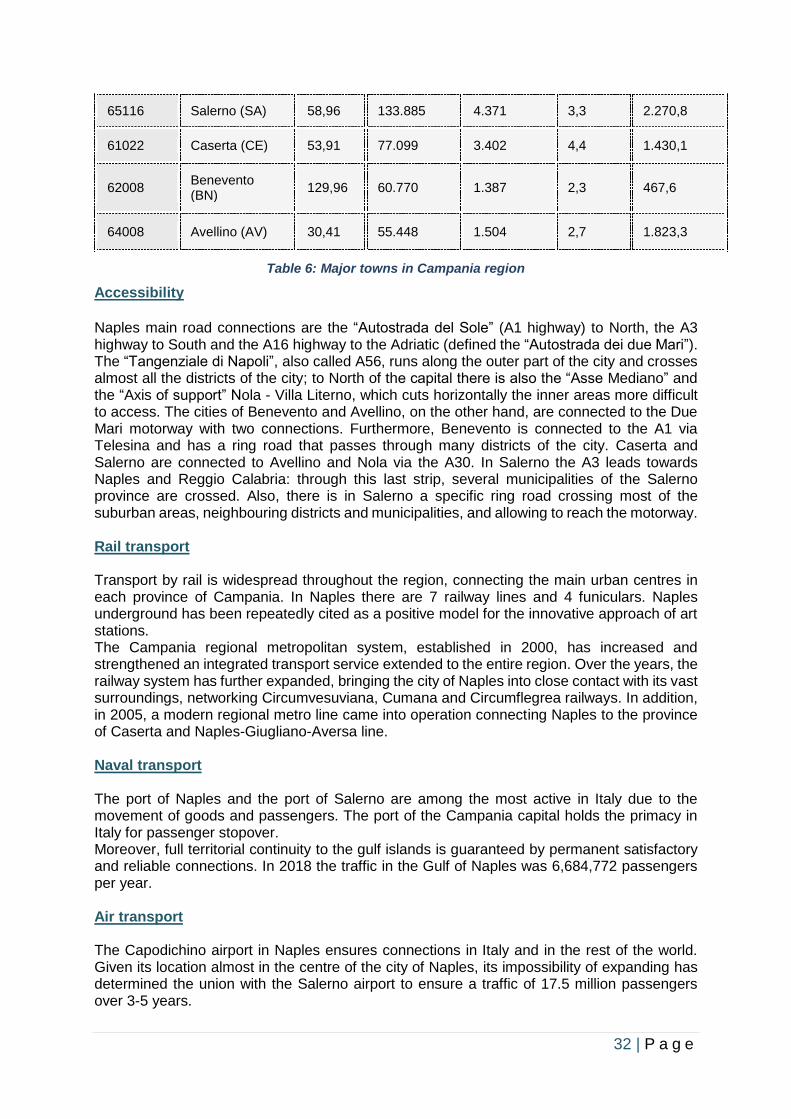
32 | P a g e
65116 Salerno (SA) 58,96 133.885 4.371 3,3 2.270,8
61022 Caserta (CE) 53,91 77.099 3.402 4,4 1.430,1
62008 Benevento (BN)
129,96 60.770 1.387 2,3 467,6
64008 Avellino (AV) 30,41 55.448 1.504 2,7 1.823,3
Table 6: Major towns in Campania region
Accessibility
Naples main road connections are the “Autostrada del Sole” (A1 highway) to North, the A3 highway to South and the A16 highway to the Adriatic (defined the “Autostrada dei due Mari”). The “Tangenziale di Napoli”, also called A56, runs along the outer part of the city and crosses almost all the districts of the city; to North of the capital there is also the “Asse Mediano” and the “Axis of support” Nola - Villa Literno, which cuts horizontally the inner areas more difficult to access. The cities of Benevento and Avellino, on the other hand, are connected to the Due Mari motorway with two connections. Furthermore, Benevento is connected to the A1 via Telesina and has a ring road that passes through many districts of the city. Caserta and Salerno are connected to Avellino and Nola via the A30. In Salerno the A3 leads towards Naples and Reggio Calabria: through this last strip, several municipalities of the Salerno province are crossed. Also, there is in Salerno a specific ring road crossing most of the suburban areas, neighbouring districts and municipalities, and allowing to reach the motorway. Rail transport Transport by rail is widespread throughout the region, connecting the main urban centres in each province of Campania. In Naples there are 7 railway lines and 4 funiculars. Naples underground has been repeatedly cited as a positive model for the innovative approach of art stations. The Campania regional metropolitan system, established in 2000, has increased and strengthened an integrated transport service extended to the entire region. Over the years, the railway system has further expanded, bringing the city of Naples into close contact with its vast surroundings, networking Circumvesuviana, Cumana and Circumflegrea railways. In addition, in 2005, a modern regional metro line came into operation connecting Naples to the province of Caserta and Naples-Giugliano-Aversa line. Naval transport The port of Naples and the port of Salerno are among the most active in Italy due to the movement of goods and passengers. The port of the Campania capital holds the primacy in Italy for passenger stopover. Moreover, full territorial continuity to the gulf islands is guaranteed by permanent satisfactory and reliable connections. In 2018 the traffic in the Gulf of Naples was 6,684,772 passengers per year. Air transport The Capodichino airport in Naples ensures connections in Italy and in the rest of the world. Given its location almost in the centre of the city of Naples, its impossibility of expanding has determined the union with the Salerno airport to ensure a traffic of 17.5 million passengers over 3-5 years.
33 | P a g e
Mobility For 2017, according to the statistics of Legambiente and Environment Italy (classification stipulated to decree the greenest city in Italy) the capitals of Campania, regarding Mobility, were in the following positions:
Benevento Avellino Salerno Napoli Caserta
Pedestrian areas 11 34 32 25 82
Road accidents 3 32 33 5 6
Annual distance per inhabitant 45 19 36 14 45
Cycle paths 32 90 91 89 94
Motorization rate 52 46 16 12 29
Public transport demand 45 13 26 11 45
Table 7: Mobility factors in Campania region Each element of the matrix highlights the position of the 5 capitals of Campania compared to the total 104 in Italy.
South Aegean Region
Greece
Major Towns & Accessibility Andros, Ermoúpoli, Ialysós, Kallithéa, Kálymnos, Kárpathos, Kos, Rhodes
Town Population
Andros 9,221
Ermoúpoli 14,000
Ialysós 11,331
Kallithéa 100,000
Kálymnos 16,179
Kárpathos 6,226
Kos 33,388
Rhodes 86,199
Table 8: Major towns in South Aegean Region
34 | P a g e
Lithuania
Lithuania
Major Towns & Accessibility Population
Area Geography County Municipality Population
Lithuania N/A N/A N/A 2.8 million
Vilnius (Capital)
East Vilnius County Vilnius City Municipality 549,389
Kaunas Central Kaunas County Kaunas City Municipality 287,655
Klaipėda Coastal Klaipėda County Klaipėda City Municipality 148,090
Šiauliai North Šiauliai County Šiauliai City Municipality 100,249
Panevėžys North-East Panevėžys County Panevėžys City Municipality 88,093
Alytus South Alytus County Alytus City Municipality 51,028
Mažeikiai North-West Telšiai County Mažeikiai District Municipality 35,588
Marijampolė South Marijampolė County
Marijampolė Municipality 35,400
Utena North-East Utena County Utena District Municipality 25,606
Telšiai West Telšiai County Telšiai District Municipality 22,763
Table 9: Major Cities in Lithuania
Accessibility With approximately 80% of freight that is transported through international transport corridors passing through Lithuania, the country has become the most important transport centre in the European Union, linking the EU with the East, according to the market research company Informa (previously known as Datamonitor).39 The North-South highway, the railway route connecting Scandinavia with Central Europe, and the East-West route that connects vast Eastern markets with the rest of Europe, all figure among the 10 principal freight routes in Europe. Sea motorways formed in the Baltic Sea to the north-south direction are among the strategic transport and economic interests of Lithuania.40 Accessibility between Lithuania cities is ensured by highly developed roads system. Lithuania has a network of four-lane highways connecting major Lithuania cities Vilnius, Kaunas, Klaipėda, Panevėžys an Palanga, while smaller towns are accessible by well-kept asphalt roads. Lithuania accessibility from outside by roads is highly developed. Six international road networks are going through major Lithuania cities. Other convenient ways to travel across the country are intercity buses and railroads. Each Lithuania city has a single bus station were the most buses leave from. Currently there are 51 bus stations in Lithuania. Busses between the main cities are very frequent, with Vilnius-Kaunas buses leaving each terminal station every 15 minutes. Bus routes connecting the main
39 https://informa.com/ 40 Invest Lithuania, Transport and Logistics in Lithuania: Alchemistry of crossroads
35 | P a g e
cities to regional towns are usually at least several a day. As a result, passenger road transport in Lithuania accounts for almost 98% of the total passenger’s transportation. According to statistics per capita, person on average has 103 travels by bus per year. On the other hand, Lithuanian railroads systems compared to busses lags behind. Not every Lithuanian city can be reached by train and only the biggest ones are connected with train lines: Vilnius-Kaunas, Vilnius-Klaipėda, Šiauliai-Klaipėda, Šiauliai-Panevėžys and Vilnius-Šiauliai. Additionally, three of the Lithuanian national parks have direct train access to Vilnius: Trakai, Aukštaitija and Dzūkija. Coming to Lithuania from outside by busses or railroads is also a viable option. Lithuania is integrated into international bus networks and there are various possibilities to travel to Eastern Europe (Minsk, Kyiv, Moscow, Saint Petesburg), Western Europe (Paris, Brussels, Amsterdam), Central Europe (Berlin, Warsaw, Prague) or Baltic States (Riga, Tallinn, Tartu) from major Lithuania cities and vice versa. Railroads from major Lithuanian towns are also highly integrated into both, eastern and western systems.
South-West Oltenia
Romania
Major Towns & Accessibility Population The population of SWO region is 2,225,108 inhabitants. The SWO Development Region includes five counties (Dolj, Gorj, Mehedinţi, Olt, and Vâlcea), with localities structured in 40 towns, out of which 11 municipalities, and 408 communes (which include 2070 villages) (2010).
City/Town Population Observ.
Craiova 302,000 Seat of Dolj County
Ramnicu-Valcea 106,000 Seat of Valcea County
Drobeta-Turnu Severin 105,000 Seat of Mehedinti County
Targu-Jiu 96,000 Seat of Gorj County
Slatina 86,000 Seat of Olt County
Table 10: Major Cities/Towns in South-West Oltenia Region
Accessibility The major towns in the SWO region should make efforts to cover accessibility in the everyday lives of residents and, to some extent, the accessibility of visitors and tourist offers.
City/Town Accessibility
Craiova Public transport in Craiova today consists of 3 tramlines and 17 bus lines. It is operated by Regia Autonomă de Transport Craiova (RAT Craiova), a corporation run by City Hall. There are 200 buses and 35 trams serving the city today. Craiova is also a major railway centre and is connected to all other major Romanian cities, as well as local destinations, through the national railway network. Direct trains to: Bucharest, Arad, Braşov, Cluj-Napoca, Constanţa, Deva, Drobeta Turnu Severin, Râmnicu Vâlcea, Piteşti, Ploieşti, Sibiu, Slatina, Târgu-Jiu and Timişoara.
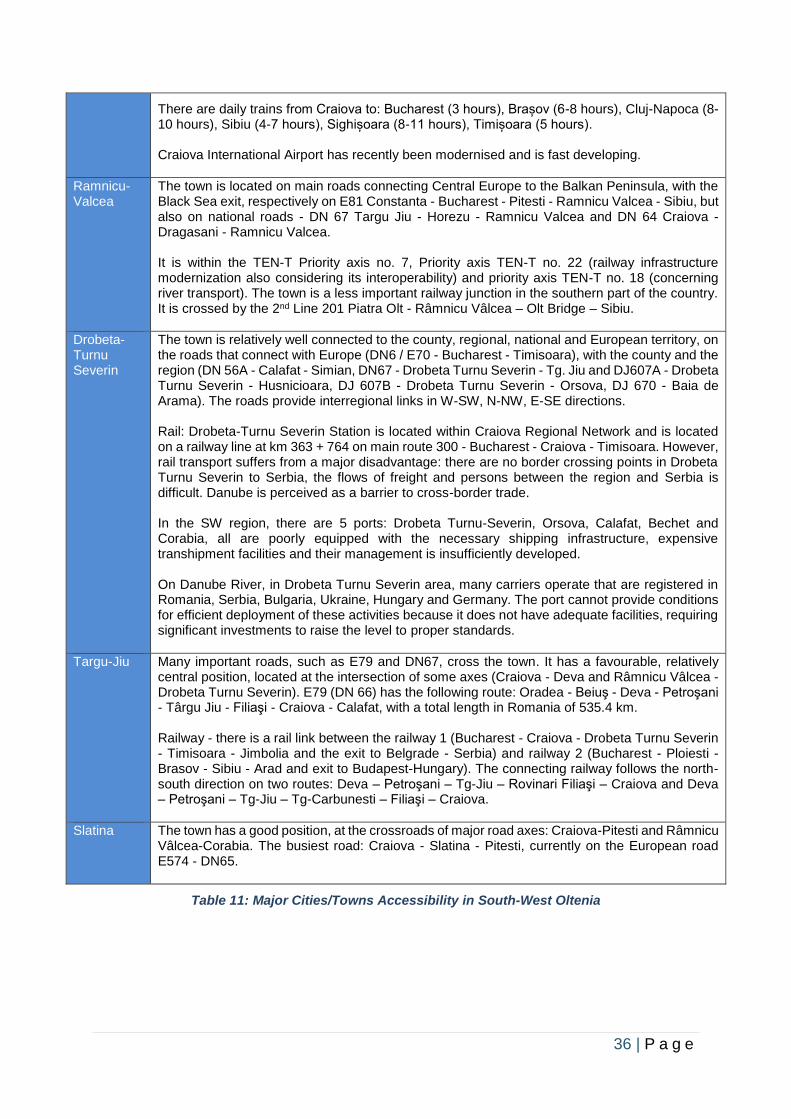
36 | P a g e
There are daily trains from Craiova to: Bucharest (3 hours), Brașov (6-8 hours), Cluj-Napoca (8-10 hours), Sibiu (4-7 hours), Sighișoara (8-11 hours), Timișoara (5 hours). Craiova International Airport has recently been modernised and is fast developing.
Ramnicu-Valcea
The town is located on main roads connecting Central Europe to the Balkan Peninsula, with the Black Sea exit, respectively on E81 Constanta - Bucharest - Pitesti - Ramnicu Valcea - Sibiu, but also on national roads - DN 67 Targu Jiu - Horezu - Ramnicu Valcea and DN 64 Craiova - Dragasani - Ramnicu Valcea. It is within the TEN-T Priority axis no. 7, Priority axis TEN-T no. 22 (railway infrastructure modernization also considering its interoperability) and priority axis TEN-T no. 18 (concerning river transport). The town is a less important railway junction in the southern part of the country. It is crossed by the 2nd Line 201 Piatra Olt - Râmnicu Vâlcea – Olt Bridge – Sibiu.
Drobeta-Turnu Severin
The town is relatively well connected to the county, regional, national and European territory, on the roads that connect with Europe (DN6 / E70 - Bucharest - Timisoara), with the county and the region (DN 56A - Calafat - Simian, DN67 - Drobeta Turnu Severin - Tg. Jiu and DJ607A - Drobeta Turnu Severin - Husnicioara, DJ 607B - Drobeta Turnu Severin - Orsova, DJ 670 - Baia de Arama). The roads provide interregional links in W-SW, N-NW, E-SE directions. Rail: Drobeta-Turnu Severin Station is located within Craiova Regional Network and is located on a railway line at km 363 + 764 on main route 300 - Bucharest - Craiova - Timisoara. However, rail transport suffers from a major disadvantage: there are no border crossing points in Drobeta Turnu Severin to Serbia, the flows of freight and persons between the region and Serbia is difficult. Danube is perceived as a barrier to cross-border trade. In the SW region, there are 5 ports: Drobeta Turnu-Severin, Orsova, Calafat, Bechet and Corabia, all are poorly equipped with the necessary shipping infrastructure, expensive transhipment facilities and their management is insufficiently developed. On Danube River, in Drobeta Turnu Severin area, many carriers operate that are registered in Romania, Serbia, Bulgaria, Ukraine, Hungary and Germany. The port cannot provide conditions for efficient deployment of these activities because it does not have adequate facilities, requiring significant investments to raise the level to proper standards.
Targu-Jiu Many important roads, such as E79 and DN67, cross the town. It has a favourable, relatively central position, located at the intersection of some axes (Craiova - Deva and Râmnicu Vâlcea - Drobeta Turnu Severin). E79 (DN 66) has the following route: Oradea - Beiuş - Deva - Petroşani - Târgu Jiu - Filiaşi - Craiova - Calafat, with a total length in Romania of 535.4 km. Railway - there is a rail link between the railway 1 (Bucharest - Craiova - Drobeta Turnu Severin - Timisoara - Jimbolia and the exit to Belgrade - Serbia) and railway 2 (Bucharest - Ploiesti - Brasov - Sibiu - Arad and exit to Budapest-Hungary). The connecting railway follows the north-south direction on two routes: Deva – Petroşani – Tg-Jiu – Rovinari Filiaşi – Craiova and Deva – Petroşani – Tg-Jiu – Tg-Carbunesti – Filiaşi – Craiova.
Slatina The town has a good position, at the crossroads of major road axes: Craiova-Pitesti and Râmnicu Vâlcea-Corabia. The busiest road: Craiova - Slatina - Pitesti, currently on the European road E574 - DN65.
Table 11: Major Cities/Towns Accessibility in South-West Oltenia
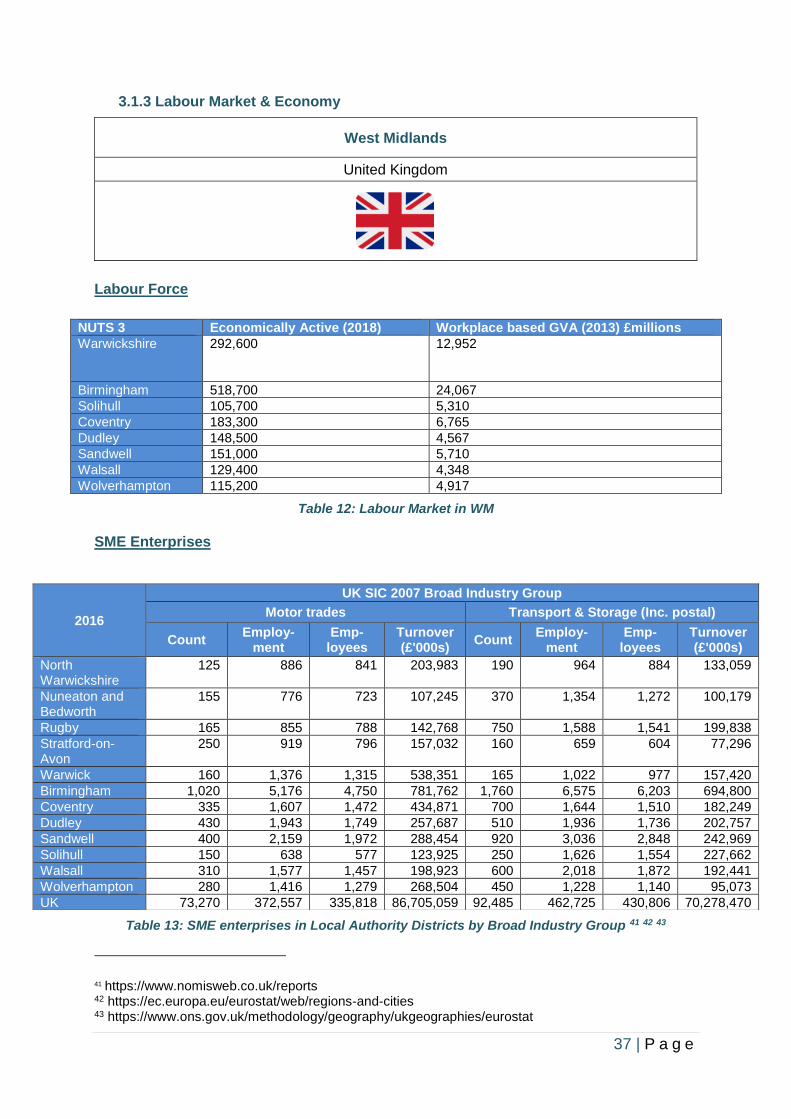
37 | P a g e
3.1.3 Labour Market & Economy
West Midlands
United Kingdom
Labour Force
NUTS 3 Economically Active (2018) Workplace based GVA (2013) £millions
Warwickshire 292,600 12,952
Birmingham 518,700 24,067
Solihull 105,700 5,310
Coventry 183,300 6,765
Dudley 148,500 4,567
Sandwell 151,000 5,710
Walsall 129,400 4,348
Wolverhampton 115,200 4,917
Table 12: Labour Market in WM
SME Enterprises
Table 13: SME enterprises in Local Authority Districts by Broad Industry Group 41 42 43
41 https://www.nomisweb.co.uk/reports 42 https://ec.europa.eu/eurostat/web/regions-and-cities 43 https://www.ons.gov.uk/methodology/geography/ukgeographies/eurostat
2016
UK SIC 2007 Broad Industry Group
Motor trades Transport & Storage (Inc. postal)
Count Employ-
ment Emp-
loyees Turnover (£'000s)
Count Employ-
ment Emp-
loyees Turnover (£'000s)
North Warwickshire
125 886 841 203,983 190 964 884 133,059
Nuneaton and Bedworth
155 776 723 107,245 370 1,354 1,272 100,179
Rugby 165 855 788 142,768 750 1,588 1,541 199,838
Stratford-on-Avon
250 919 796 157,032 160 659 604 77,296
Warwick 160 1,376 1,315 538,351 165 1,022 977 157,420
Birmingham 1,020 5,176 4,750 781,762 1,760 6,575 6,203 694,800
Coventry 335 1,607 1,472 434,871 700 1,644 1,510 182,249
Dudley 430 1,943 1,749 257,687 510 1,936 1,736 202,757
Sandwell 400 2,159 1,972 288,454 920 3,036 2,848 242,969
Solihull 150 638 577 123,925 250 1,626 1,554 227,662
Walsall 310 1,577 1,457 198,923 600 2,018 1,872 192,441
Wolverhampton 280 1,416 1,279 268,504 450 1,228 1,140 95,073
UK 73,270 372,557 335,818 86,705,059 92,485 462,725 430,806 70,278,470
38 | P a g e
Population & Unemployment Projections Mid-year population estimates for 2016 show the WM Metropolitan Area had a population of 2.8 million. This was 56,500 more compared with 2015 and an increase of 2%.
• The largest percentage increases were 4.6% in Coventry and 2.1% in Birmingham.
• Population density remains highest in Birmingham, with 42.1 people per hectare and lowest in Solihull with 11.9 people per hectare.
The WM Metropolitan Area population is projected to increase by 499,000 (17.8%) during the period 2014 to 2039. In common with the UK and most other countries, the WM has an ageing population.
• The proportion of people aged over 60 is projected to increase from 20.3% in 2014 to 23.8% by 2039.
• The younger population, with the proportion of people aged 0 to 19, is projected to drop slightly from 26.7% in 2014 to 26.1% in 2039.
Unemployment for the WM Metropolitan Area in 2016/17 stands at approximately 7.1%. Compared with 2015/16 there are now circa 8,700 fewer people unemployed in the WM.
• There have been decreases in Birmingham (5.4%), Dudley (18%), Walsall (25.6%) and Wolverhampton (44.8%).
• Coventry, Sandwell and Solihull are the only districts to experience a rise in unemployment during this period (by 3.3%, 23.7% and 52.3% respectively).
The trend is the same for the United Kingdom:
• With a 7.4% decrease in unemployment from 2015/16 to 2016/17.
• Over this period, the number of people unemployed in the United Kingdom has decreased to approximately 1.57 million from 1.69 million.
• The unemployment rate shows the percentage of people aged 16+ who are unemployed. The 2016/17 unemployment rate for the WM is 7.1% (7.9% in 2015/16).
• In comparison, the unemployment rate for the United Kingdom is 4.7% (5.2% in 2015/16).
• The 2016/17 unemployment rates for the districts are Birmingham 8.6%, Coventry 3.7%. 44
Campania Region
Italy
Labour Market & Economy
44 https://www.tfwm.org.uk/media/2857/wm-travel-trends-2017.pdf
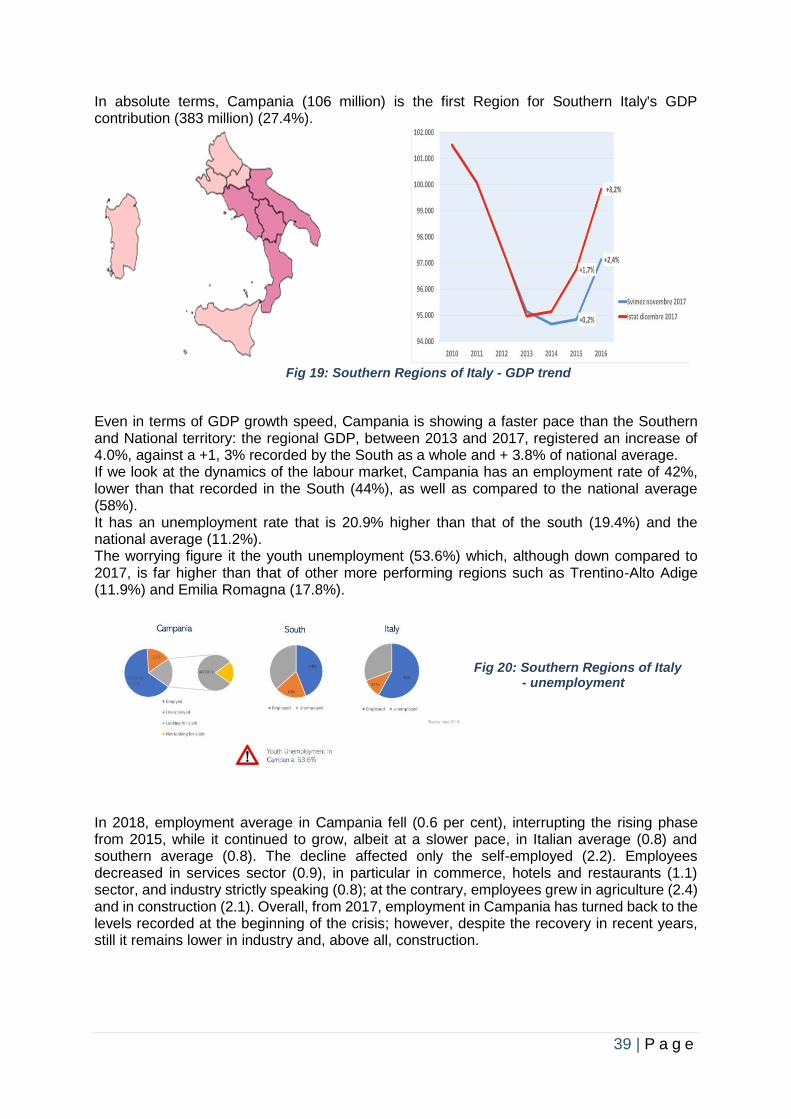
39 | P a g e
In absolute terms, Campania (106 million) is the first Region for Southern Italy's GDP contribution (383 million) (27.4%).
Fig 19: Southern Regions of Italy - GDP trend
Even in terms of GDP growth speed, Campania is showing a faster pace than the Southern and National territory: the regional GDP, between 2013 and 2017, registered an increase of 4.0%, against a +1, 3% recorded by the South as a whole and + 3.8% of national average. If we look at the dynamics of the labour market, Campania has an employment rate of 42%, lower than that recorded in the South (44%), as well as compared to the national average (58%). It has an unemployment rate that is 20.9% higher than that of the south (19.4%) and the national average (11.2%). The worrying figure it the youth unemployment (53.6%) which, although down compared to 2017, is far higher than that of other more performing regions such as Trentino-Alto Adige (11.9%) and Emilia Romagna (17.8%).
Fig 20: Southern Regions of Italy - unemployment
In 2018, employment average in Campania fell (0.6 per cent), interrupting the rising phase from 2015, while it continued to grow, albeit at a slower pace, in Italian average (0.8) and southern average (0.8). The decline affected only the self-employed (2.2). Employees decreased in services sector (0.9), in particular in commerce, hotels and restaurants (1.1) sector, and industry strictly speaking (0.8); at the contrary, employees grew in agriculture (2.4) and in construction (2.1). Overall, from 2017, employment in Campania has turned back to the levels recorded at the beginning of the crisis; however, despite the recovery in recent years, still it remains lower in industry and, above all, construction.
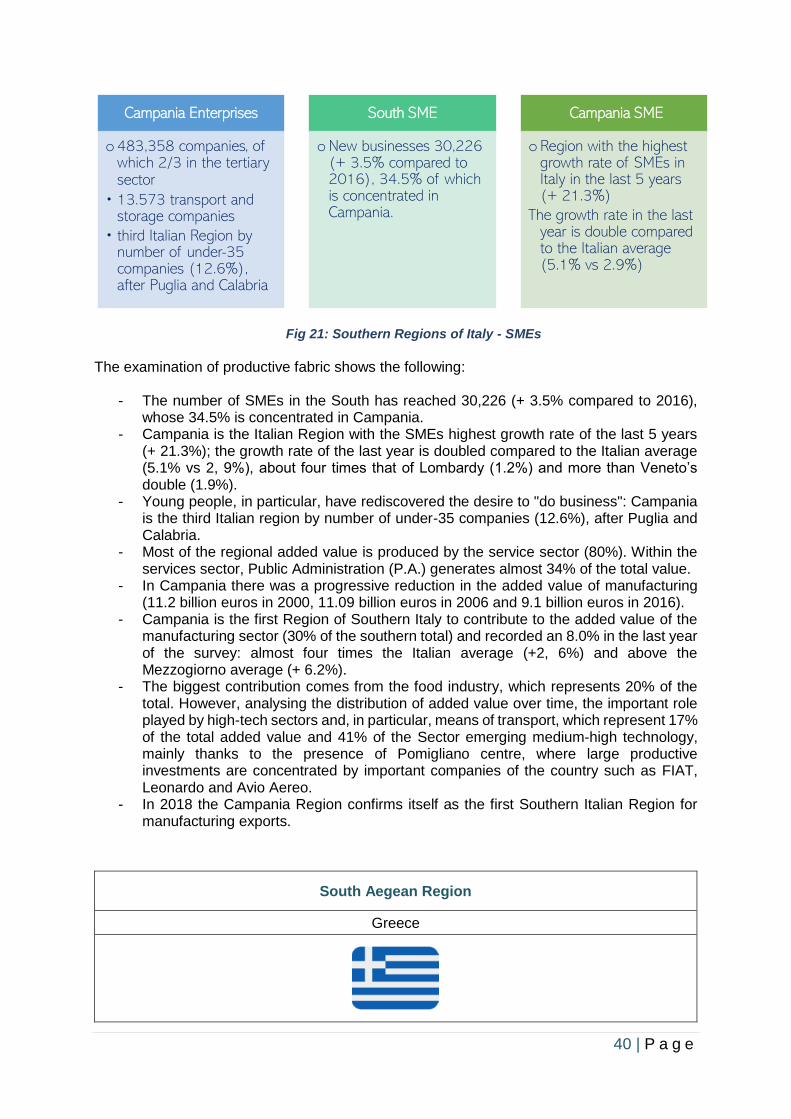
40 | P a g e
Fig 21: Southern Regions of Italy - SMEs The examination of productive fabric shows the following:
- The number of SMEs in the South has reached 30,226 (+ 3.5% compared to 2016), whose 34.5% is concentrated in Campania.
- Campania is the Italian Region with the SMEs highest growth rate of the last 5 years (+ 21.3%); the growth rate of the last year is doubled compared to the Italian average (5.1% vs 2, 9%), about four times that of Lombardy (1.2%) and more than Veneto’s double (1.9%).
- Young people, in particular, have rediscovered the desire to "do business": Campania is the third Italian region by number of under-35 companies (12.6%), after Puglia and Calabria.
- Most of the regional added value is produced by the service sector (80%). Within the services sector, Public Administration (P.A.) generates almost 34% of the total value.
- In Campania there was a progressive reduction in the added value of manufacturing (11.2 billion euros in 2000, 11.09 billion euros in 2006 and 9.1 billion euros in 2016).
- Campania is the first Region of Southern Italy to contribute to the added value of the manufacturing sector (30% of the southern total) and recorded an 8.0% in the last year of the survey: almost four times the Italian average (+2, 6%) and above the Mezzogiorno average (+ 6.2%).
- The biggest contribution comes from the food industry, which represents 20% of the total. However, analysing the distribution of added value over time, the important role played by high-tech sectors and, in particular, means of transport, which represent 17% of the total added value and 41% of the Sector emerging medium-high technology, mainly thanks to the presence of Pomigliano centre, where large productive investments are concentrated by important companies of the country such as FIAT, Leonardo and Avio Aereo.
- In 2018 the Campania Region confirms itself as the first Southern Italian Region for manufacturing exports.
South Aegean Region
Greece
Campania Enterprises
o483,358 companies, of which 2/3 in the tertiary sector
• 13.573 transport and storage companies
• third Italian Region by number of under-35 companies (12.6%), after Puglia and Calabria
South SME
oNew businesses 30,226 (+ 3.5% compared to 2016), 34.5% of which is concentrated in Campania.
Campania SME
oRegion with the highest growth rate of SMEs in Italy in the last 5 years (+ 21.3%)
The growth rate in the last year is double compared to the Italian average (5.1% vs 2.9%)
41 | P a g e
Labour Market & Economy Socio-economic profile The region accounts for 3.4% of the national gross domestic product that equals to €5.888m. Furthermore, in terms of GDP per capita it is placed second among the 13 Greek regions with a GDP/capita value of €21,300 (Eurostat, 2018). Production The tertiary sector dominates the regional economy and accounts for 87.3% of the regional gross value added (GVA), which totalled €4,687m in 2015, while the secondary sector share is 10% and that of the primary one is 2.7%. Employment In 2017, 3.4% of the country's workforce (127.600) was employed in the South Aegean Region, 82.0% of which in the tertiary sector, 13.1% in the secondary sector and 4.9% in the primary sector (Hellenic Statistical Authority, 2018). The economic crisis led the unemployment rate to 21.3% in 2013, far below the national average of that year (27.5%), mainly due to high seasonal employment during the summer. This figure has fluctuated in the last two years, being at 16.0% in 2017, which currently puts South Aegean in the best place among the Greek regions, below the national average (21.5%) still far above the EU average (7.6%) (Eurostat, 2018).
Transport Related Sectors Employment
EU27 Greece South Aegean
Air Transport 0.17 0.15 -
Maritime Transport 0.10 0.52 0.97
Land Transport & Transportation Through Pipelines 2.51 3.87 2.78
Manufacturing of Transportation Equipment 0.33 0.24 0.46
Manufacturing of Motorised Vehicles & Trailers 0.99 0.13 0.02
Table 14: Labour Market in Transport Related Sectors in South Aegean Region (Elstat, 2017)
Tourism The tourism sector is the most important for the regional economy since the region is a touristic hotspot, followed by trade, transportation services, real estate activities and the growing services segments of financial and insurance activities, education and creative activities, arts and entertainment activities. Regional Government and stakeholders consider tourism as core sector of South Aegean and all other sectors (transport, local products, services) depending and existing through tourism (RIS3). Moreover, tourism is highly affected by issues generated in the transportation sector, such as the frequency, cost and reliability, and more specifically of maritime and air transport modes. Manufacturing The manufacturing sector suffered a multi-year financial crisis that resulted into stability issues. Currently, the region has no advanced manufacturing while it is heavily dominated by related SMEs while the most important industries are food and beverages, textiles, manufacture of products of wood and cork and other non-metallic mineral products. These local industries however have not managed to exploit economies of scale and so far have found difficulties in utilising national and European funding for their modernisation and incorporation into national or international networks and value chains.
42 | P a g e
Lithuania
Lithuania
Labour Market & Economy Economy After the economic recession, Lithuania is one of the fastest growing economies in the EU. During 2015 Lithuania’s GDP grew by 2%, 2016 by 2.4%, 2017 by 4.1% and 2018 by 3.6%.
Year GDP
2014 36,568.30
2015 37,433.90
2016 38,849.40
2017 42,190.80
2018 45,190.80
Table 15: Lithuania GDP 2014-2018, thous.
Figure 22. GDP growth dynamics in Lithuania
Lithuania’s GDP growth at this pace is faster compared to the EU, which on average in 2016 was 1.96% while in 2017 at 2.4%. Despite this growth, economic forecasts about the future are not so optimistic. Considering global economic trends, slowdown in the EU economy and rising uncertainty, the growth of GDP is expected to slow and should peak around 2.5 – 3%. Even though GDP growth will be likely slowing down, overall Lithuania GDP is still highest across Baltic States, however GDP per capita is higher in Estonia (Table 15).
Country Overall GDP
Lithuania 42,190.8
Latvia 27,033.1
Estonia 23,615.1
Country GDP per capita
Lithuania 16,680
Latvia 15,594
Estonia 19,704
7.40%
11.10%
2.70%
-14.90%
1.70%
6%3.80% 3.50% 3.50%
2% 2.40%4.10% 3.60%
-20.00%
-15.00%
-10.00%
-5.00%
0.00%
5.00%
10.00%
15.00%
2006 2007 2008 2009 2010 2011 2012 2013 2014 2015 2016 2017 2018
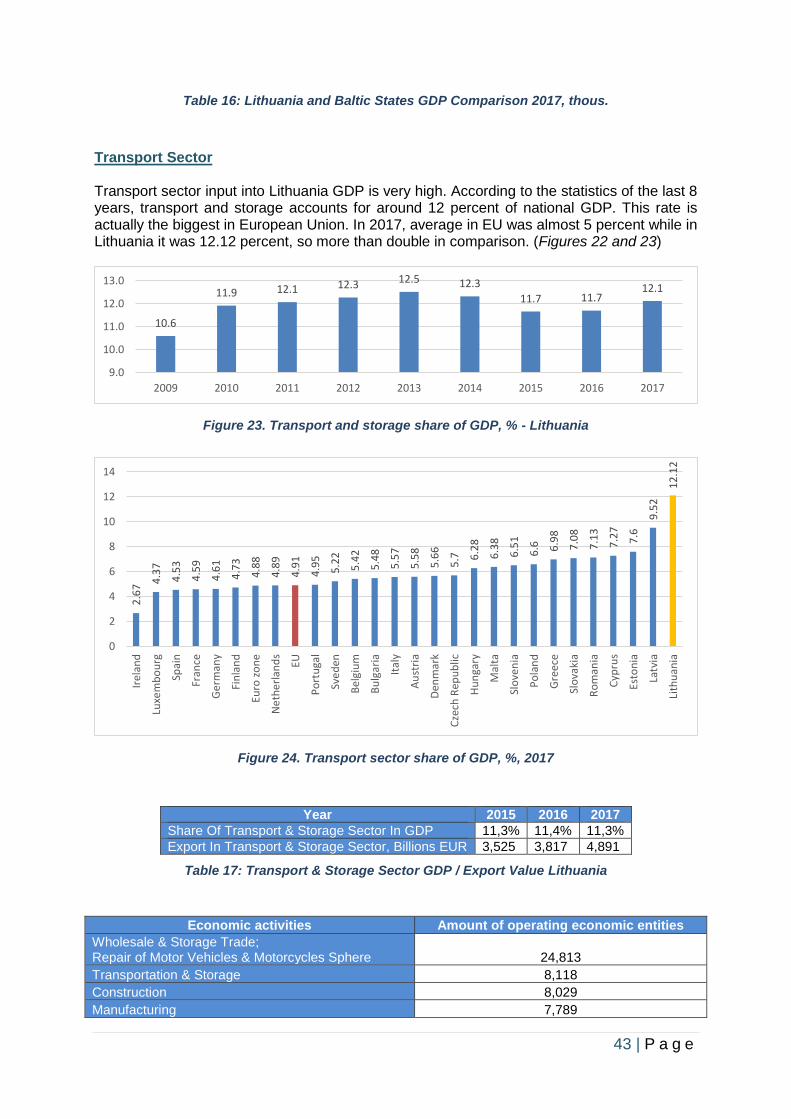
43 | P a g e
Table 16: Lithuania and Baltic States GDP Comparison 2017, thous.
Transport Sector Transport sector input into Lithuania GDP is very high. According to the statistics of the last 8 years, transport and storage accounts for around 12 percent of national GDP. This rate is actually the biggest in European Union. In 2017, average in EU was almost 5 percent while in Lithuania it was 12.12 percent, so more than double in comparison. (Figures 22 and 23)
Figure 23. Transport and storage share of GDP, % - Lithuania
Figure 24. Transport sector share of GDP, %, 2017
Year 2015 2016 2017
Share Of Transport & Storage Sector In GDP 11,3% 11,4% 11,3%
Export In Transport & Storage Sector, Billions EUR 3,525 3,817 4,891
Table 17: Transport & Storage Sector GDP / Export Value Lithuania
Economic activities Amount of operating economic entities
Wholesale & Storage Trade; Repair of Motor Vehicles & Motorcycles Sphere 24,813
Transportation & Storage 8,118
Construction 8,029
Manufacturing 7,789
10.6
11.9 12.1 12.3 12.5 12.3
11.7 11.712.1
9.0
10.0
11.0
12.0
13.0
2009 2010 2011 2012 2013 2014 2015 2016 2017
2.6
7
4.3
7
4.5
3
4.5
9
4.6
1
4.7
3
4.8
8
4.8
9
4.9
1
4.9
5
5.2
2
5.4
2
5.4
8
5.5
7
5.5
8
5.6
6
5.7 6
.28
6.3
8
6.5
1
6.6 6.9
8
7.0
8
7.1
3
7.2
7
7.6
9.5
2
12
.12
0
2
4
6
8
10
12
14
Irel
and
Luxe
mb
ou
rg
Spai
n
Fran
ce
Ge
rman
y
Fin
lan
d
Euro
zo
ne
Ne
the
rlan
ds
EU
Po
rtu
gal
Sve
den
Bel
giu
m
Bu
lgar
ia
Ital
y
Au
stri
a
Den
mar
k
Cze
ch R
epu
blic
Hu
nga
ry
Mal
ta
Slo
ven
ia
Po
lan
d
Gre
ece
Slo
vaki
a
Ro
man
ia
Cyp
rus
Esto
nia
Latv
ia
Lith
uan
ia
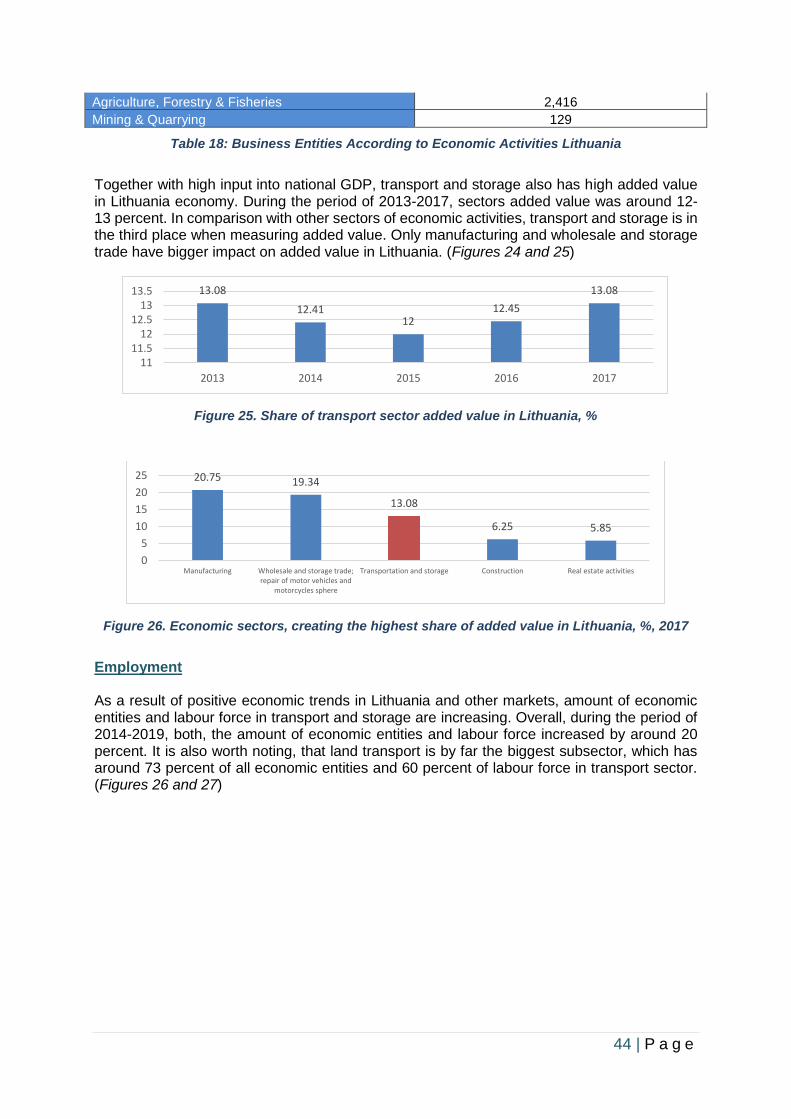
44 | P a g e
Agriculture, Forestry & Fisheries 2,416
Mining & Quarrying 129
Table 18: Business Entities According to Economic Activities Lithuania
Together with high input into national GDP, transport and storage also has high added value in Lithuania economy. During the period of 2013-2017, sectors added value was around 12-13 percent. In comparison with other sectors of economic activities, transport and storage is in the third place when measuring added value. Only manufacturing and wholesale and storage trade have bigger impact on added value in Lithuania. (Figures 24 and 25)
Figure 25. Share of transport sector added value in Lithuania, %
Figure 26. Economic sectors, creating the highest share of added value in Lithuania, %, 2017
Employment As a result of positive economic trends in Lithuania and other markets, amount of economic entities and labour force in transport and storage are increasing. Overall, during the period of 2014-2019, both, the amount of economic entities and labour force increased by around 20 percent. It is also worth noting, that land transport is by far the biggest subsector, which has around 73 percent of all economic entities and 60 percent of labour force in transport sector. (Figures 26 and 27)
13.08
12.4112
12.45
13.08
1111.5
1212.5
1313.5
2013 2014 2015 2016 2017
20.75 19.34
13.08
6.25 5.85
0
5
10
15
20
25
Manufacturing Wholesale and storage trade;repair of motor vehicles and
motorcycles sphere
Transportation and storage Construction Real estate activities
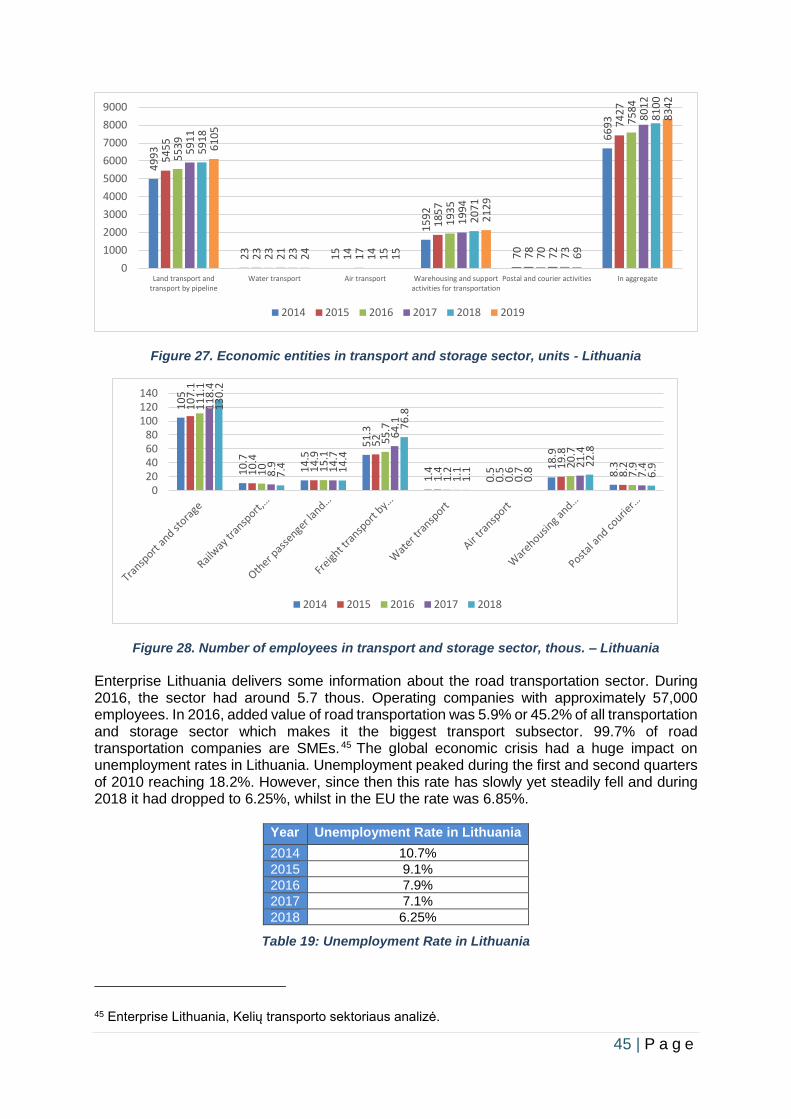
45 | P a g e
Figure 27. Economic entities in transport and storage sector, units - Lithuania
Figure 28. Number of employees in transport and storage sector, thous. – Lithuania
Enterprise Lithuania delivers some information about the road transportation sector. During 2016, the sector had around 5.7 thous. Operating companies with approximately 57,000 employees. In 2016, added value of road transportation was 5.9% or 45.2% of all transportation and storage sector which makes it the biggest transport subsector. 99.7% of road transportation companies are SMEs.45 The global economic crisis had a huge impact on unemployment rates in Lithuania. Unemployment peaked during the first and second quarters of 2010 reaching 18.2%. However, since then this rate has slowly yet steadily fell and during 2018 it had dropped to 6.25%, whilst in the EU the rate was 6.85%.
Year Unemployment Rate in Lithuania
2014 10.7%
2015 9.1%
2016 7.9%
2017 7.1%
2018 6.25%
Table 19: Unemployment Rate in Lithuania
45 Enterprise Lithuania, Kelių transporto sektoriaus analizė.
49
93
23
15
15
92
70
66
93
54
55
23
14
18
57
78
74
27
55
39
23
17
19
35
70
75
84
59
11
21
14
19
94
72
80
12
59
18
23
15
20
71
73
81
00
61
05
24
15
21
29
69
83
42
0
1000
2000
3000
4000
5000
6000
7000
8000
9000
Land transport andtransport by pipeline
Water transport Air transport Warehousing and supportactivities for transportation
Postal and courier activities In aggregate
2014 2015 2016 2017 2018 2019
10
5
10
.7
14
.5
51
.3
1.4
0.5
18
.9
8.3
10
7.1
10
.4
14
.9
52
1.4
0.5
19
.8
8.2
11
1.1
10 15
.1
55
.7
1.2
0.6
20
.7
7.9
11
8.4
8.9 14
.7
64
.1
1.1
0.7
21
.4
7.4
13
0.2
7.4 14
.4
76
.8
1.1
0.8
22
.8
6.9
020406080
100120140
2014 2015 2016 2017 2018
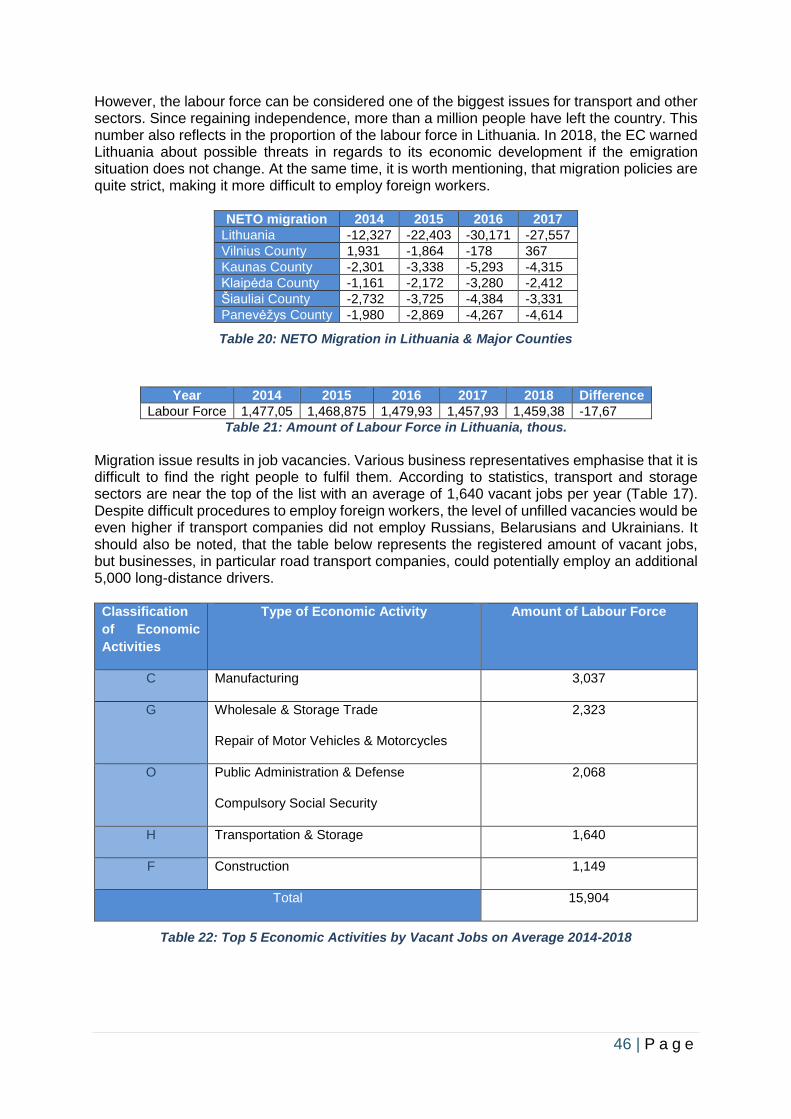
46 | P a g e
However, the labour force can be considered one of the biggest issues for transport and other sectors. Since regaining independence, more than a million people have left the country. This number also reflects in the proportion of the labour force in Lithuania. In 2018, the EC warned Lithuania about possible threats in regards to its economic development if the emigration situation does not change. At the same time, it is worth mentioning, that migration policies are quite strict, making it more difficult to employ foreign workers.
NETO migration 2014 2015 2016 2017
Lithuania -12,327 -22,403 -30,171 -27,557
Vilnius County 1,931 -1,864 -178 367
Kaunas County -2,301 -3,338 -5,293 -4,315
Klaipėda County -1,161 -2,172 -3,280 -2,412
Šiauliai County -2,732 -3,725 -4,384 -3,331
Panevėžys County -1,980 -2,869 -4,267 -4,614
Table 20: NETO Migration in Lithuania & Major Counties
Year 2014 2015 2016 2017 2018 Difference
Labour Force 1,477,05 1,468,875 1,479,93 1,457,93 1,459,38 -17,67
Table 21: Amount of Labour Force in Lithuania, thous.
Migration issue results in job vacancies. Various business representatives emphasise that it is difficult to find the right people to fulfil them. According to statistics, transport and storage sectors are near the top of the list with an average of 1,640 vacant jobs per year (Table 17). Despite difficult procedures to employ foreign workers, the level of unfilled vacancies would be even higher if transport companies did not employ Russians, Belarusians and Ukrainians. It should also be noted, that the table below represents the registered amount of vacant jobs, but businesses, in particular road transport companies, could potentially employ an additional 5,000 long-distance drivers.
Classification
of Economic
Activities
Type of Economic Activity Amount of Labour Force
C Manufacturing 3,037
G Wholesale & Storage Trade
Repair of Motor Vehicles & Motorcycles
2,323
O Public Administration & Defense
Compulsory Social Security
2,068
H Transportation & Storage 1,640
F Construction 1,149
Total 15,904
Table 22: Top 5 Economic Activities by Vacant Jobs on Average 2014-2018
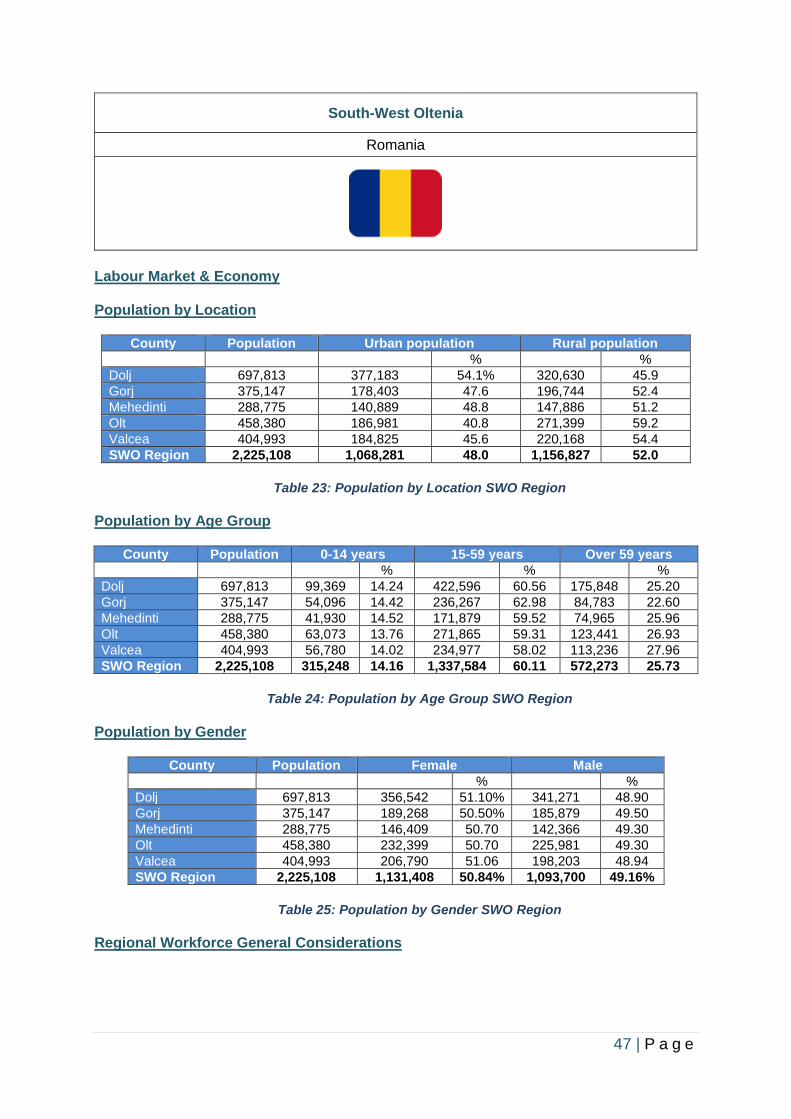
47 | P a g e
South-West Oltenia
Romania
Labour Market & Economy Population by Location
County Population Urban population Rural population
% %
Dolj 697,813 377,183 54.1% 320,630 45.9
Gorj 375,147 178,403 47.6 196,744 52.4
Mehedinti 288,775 140,889 48.8 147,886 51.2
Olt 458,380 186,981 40.8 271,399 59.2
Valcea 404,993 184,825 45.6 220,168 54.4
SWO Region 2,225,108 1,068,281 48.0 1,156,827 52.0
Table 23: Population by Location SWO Region
Population by Age Group
County Population 0-14 years 15-59 years Over 59 years
% % %
Dolj 697,813 99,369 14.24 422,596 60.56 175,848 25.20
Gorj 375,147 54,096 14.42 236,267 62.98 84,783 22.60
Mehedinti 288,775 41,930 14.52 171,879 59.52 74,965 25.96
Olt 458,380 63,073 13.76 271,865 59.31 123,441 26.93
Valcea 404,993 56,780 14.02 234,977 58.02 113,236 27.96
SWO Region 2,225,108 315,248 14.16 1,337,584 60.11 572,273 25.73
Table 24: Population by Age Group SWO Region
Population by Gender
County Population Female Male
% %
Dolj 697,813 356,542 51.10% 341,271 48.90
Gorj 375,147 189,268 50.50% 185,879 49.50
Mehedinti 288,775 146,409 50.70 142,366 49.30
Olt 458,380 232,399 50.70 225,981 49.30
Valcea 404,993 206,790 51.06 198,203 48.94
SWO Region 2,225,108 1,131,408 50.84% 1,093,700 49.16%
Table 25: Population by Gender SWO Region
Regional Workforce General Considerations
48 | P a g e
The evolution of the work force in the SWO Region has in the last few years been influenced by the same factors that have affected the whole economic and social life of Romania: 46
• Adopting a new structure of economic relations based on free/competitive market system;
• Restructuring of large and medium-sized enterprises that caused major losses for the economy;
• Lowering the level of training and qualification of employees;
• Decrease of the birth rate affecting the structure of the young working age population - an effect of lower living standards and insecurity about the future;
• Difficult integration of varying socio-professional employee groups that have lost their jobs.
Labour Force Demographics
• At the end of 2011 there was an increase in labour resources to 4.4 thousand persons as compared to the end of 2010 (1,441.3 thousand persons in 2011, compared to 1,436.9 thousand persons in the year 2010).
• The employed population in the SWO Region was 1,024. Of these, men had a weight of 54.5%, and the proportion of urban residents was 44.3%.
• The civilian employed population was 828.9 thousand persons in 2011 in the region (of which 395.0 thousand women), decreasing if compared to the previous year by 3.9 thousand persons (+ 7.2 thousand women).
• The share of men in the civilian employment was relatively high (52.4%), compared with that of women (47.6%).
• According to the Statistical Survey on the Household Workforce (AMIGO) in the SWO Development Region, in 2011 the employed population was 1,100 thousand people, as in the previous year. Of the total number of active persons, 55.4% were male and 54.4% were resident in rural areas.
• The employment rate of working age population (15-64 years) was 65.2% in 2011, higher for males (73.0% compared to 57.2% for women) and for rural areas (70.1% versus 60.8% for urban areas).
• The employment rate of the working age population (15-64 years) reached 60.3% in 2011 in the SWO Region (compared to 59.2% in the previous year). The employment rate of older workers was higher for men (66.5%) than for women (54.1%) and rural (66.3%) than in urban areas (54.9%).
Employment by Level of Education
• The distribution of employed population by the level of training in 2011 highlights the fact that the majority (49.4%) were graduates of high school education (including 1st high-school step/lower level of high school) and vocational.
• Of the male employees, most graduated from high schools and vocational schools, while among the females a significant share (57.5%) is held by high school graduates (including the first grade / the lower cycle of the high school) and gymnasium.
• In the total employed population, the persons with university studies held a weight of 14.7% and the graduates of post-high-school and technical education of foremen were 4.7%.
• Those with low level of education (gymnasium, primary, without graduated school) accounted for 31.2% of the total number of people employed; of these, 94.1% lived in rural areas and 56.1% were women.
46 http://www.insse.ro/
49 | P a g e
Employment by Sector
• Distribution by activity (NACE Rev.2) of civil employed population at the end of 2011 showed higher shares in agriculture, forestry and fishing (40.1%), industry (19.0%), wholesale trade retail; repair of motor vehicles and motorcycles (11.4%).
• The lowest shares are held by the following activities: real estate transactions (0.3%), entertainment, cultural and recreational activities (0.5%), information and communications (0.6%), financial intermediation and insurance 0.7%).
• Analysing the structure of the occupied population in terms of professional status, in 2011, the employees continue to hold the largest share (50.6%). Self-employed and unpaid family workers accounted for 48.7% of the employed population.
• The average number of employees in the SWO Development Region in 2011 was 361,744 persons, with 2064 persons less than in 2010.
• Most of the employees were in industry (32.1%), wholesale and retail trade; repair of motor vehicles and motorcycles (15.4%), education (9.9%), health and social assistance (9.0%), construction (7.7%), public administration and defence; social security in the public system (5.5%), transportation and storage (5.1%).
• As regards the economic activities in the primary and secondary sectors, the increase of average number of employees with 2,584 persons in the industry, with 1,436 persons in administrative services and support services, with 572 persons in professional activities, scientific and technical, with 399 people in real estate transactions, and with 111 people in agriculture, forestry and fishing.
Employment Rate in SWO Region
• The number of unemployed registered at the end of 2011 in the SWO region was 69,252 persons (compared to 84,595 persons in 2010), representing 7.7% of the civilian active population.47
• Of the total unemployed, at the end of 2011, 43.5% were female (41.8% in 2010). In 2011, 35.7% of the unemployed were beneficiaries of unemployment benefit (48.1% in 2010).
• Unemployed persons accounted for 64.3% of the total unemployed (51.9% in 2010).
• Among the unemployed registered by staff and level of training at the end of 2011, 68.1% had primary, secondary and vocational education (67.9% in 2010), 24.2% with high school and post-secondary education 23.9% in 2010) and 7.7% with university studies (8.2% in 2010).
• The unemployment rate registered in 2011 was 7.7% (7.1% for women) and 9.2% (8.4% for women) in 2010.
• In 2011, the vacancy rate was 0.43%, with higher levels in the branches: real estate transactions (4.21%), public administration and defence; social insurance in the public system (1.13%), performances and cultural activities (0.97%), transportation and storage (0.82%), health and social assistance (0.75%).
Active population
• From a statistical point of view, the active population represents that part of the population that falls within the legal age and health limits and which can potentially be employed at a certain time.
• Throughout the SWO development region, the economically active population evolved negatively between 2010 and 2018, decreasing continuously after 2008, when it
47 http://www.insse.ro/
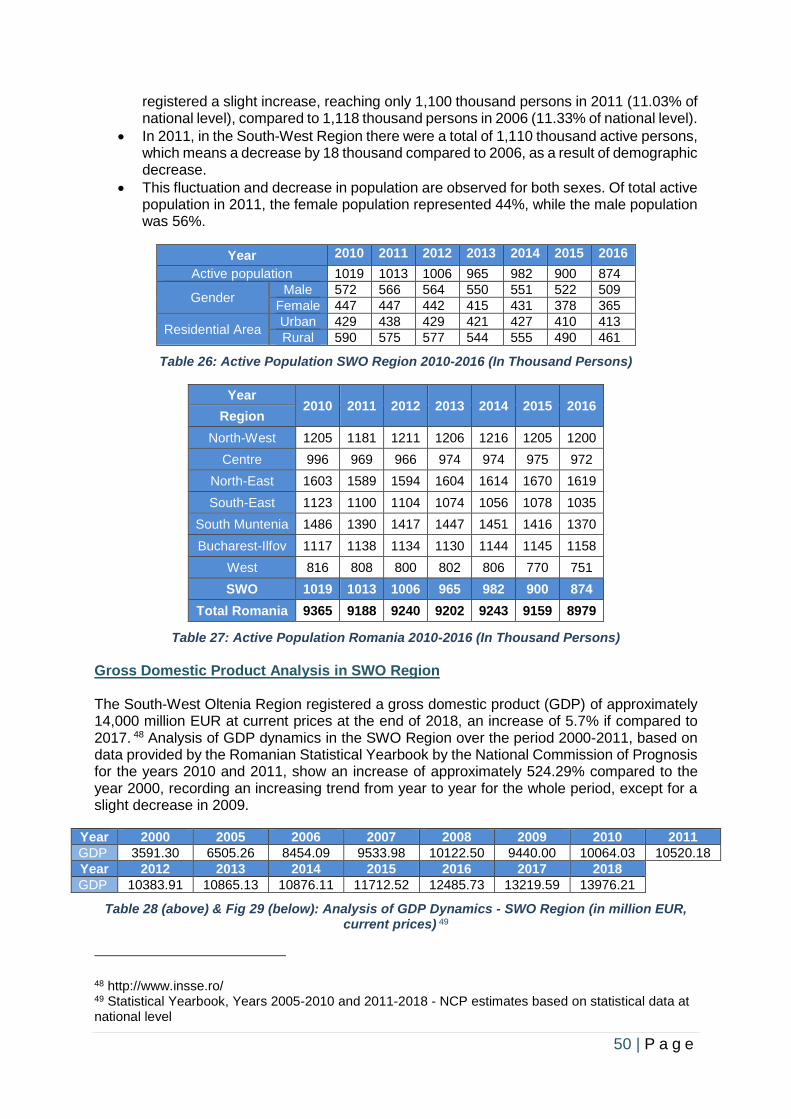
50 | P a g e
registered a slight increase, reaching only 1,100 thousand persons in 2011 (11.03% of national level), compared to 1,118 thousand persons in 2006 (11.33% of national level).
• In 2011, in the South-West Region there were a total of 1,110 thousand active persons, which means a decrease by 18 thousand compared to 2006, as a result of demographic decrease.
• This fluctuation and decrease in population are observed for both sexes. Of total active population in 2011, the female population represented 44%, while the male population was 56%.
Year 2010 2011 2012 2013 2014 2015 2016
Active population 1019 1013 1006 965 982 900 874
Gender Male 572 566 564 550 551 522 509
Female 447 447 442 415 431 378 365
Residential Area Urban 429 438 429 421 427 410 413
Rural 590 575 577 544 555 490 461
Table 26: Active Population SWO Region 2010-2016 (In Thousand Persons)
Year 2010 2011 2012 2013 2014 2015 2016
Region
North-West 1205 1181 1211 1206 1216 1205 1200
Centre 996 969 966 974 974 975 972
North-East 1603 1589 1594 1604 1614 1670 1619
South-East 1123 1100 1104 1074 1056 1078 1035
South Muntenia 1486 1390 1417 1447 1451 1416 1370
Bucharest-Ilfov 1117 1138 1134 1130 1144 1145 1158
West 816 808 800 802 806 770 751
SWO 1019 1013 1006 965 982 900 874
Total Romania 9365 9188 9240 9202 9243 9159 8979
Table 27: Active Population Romania 2010-2016 (In Thousand Persons)
Gross Domestic Product Analysis in SWO Region The South-West Oltenia Region registered a gross domestic product (GDP) of approximately 14,000 million EUR at current prices at the end of 2018, an increase of 5.7% if compared to 2017. 48 Analysis of GDP dynamics in the SWO Region over the period 2000-2011, based on data provided by the Romanian Statistical Yearbook by the National Commission of Prognosis for the years 2010 and 2011, show an increase of approximately 524.29% compared to the year 2000, recording an increasing trend from year to year for the whole period, except for a slight decrease in 2009.
Year 2000 2005 2006 2007 2008 2009 2010 2011
GDP 3591.30 6505.26 8454.09 9533.98 10122.50 9440.00 10064.03 10520.18
Year 2012 2013 2014 2015 2016 2017 2018
GDP 10383.91 10865.13 10876.11 11712.52 12485.73 13219.59 13976.21
Table 28 (above) & Fig 29 (below): Analysis of GDP Dynamics - SWO Region (in million EUR, current prices) 49
48 http://www.insse.ro/ 49 Statistical Yearbook, Years 2005-2010 and 2011-2018 - NCP estimates based on statistical data at national level
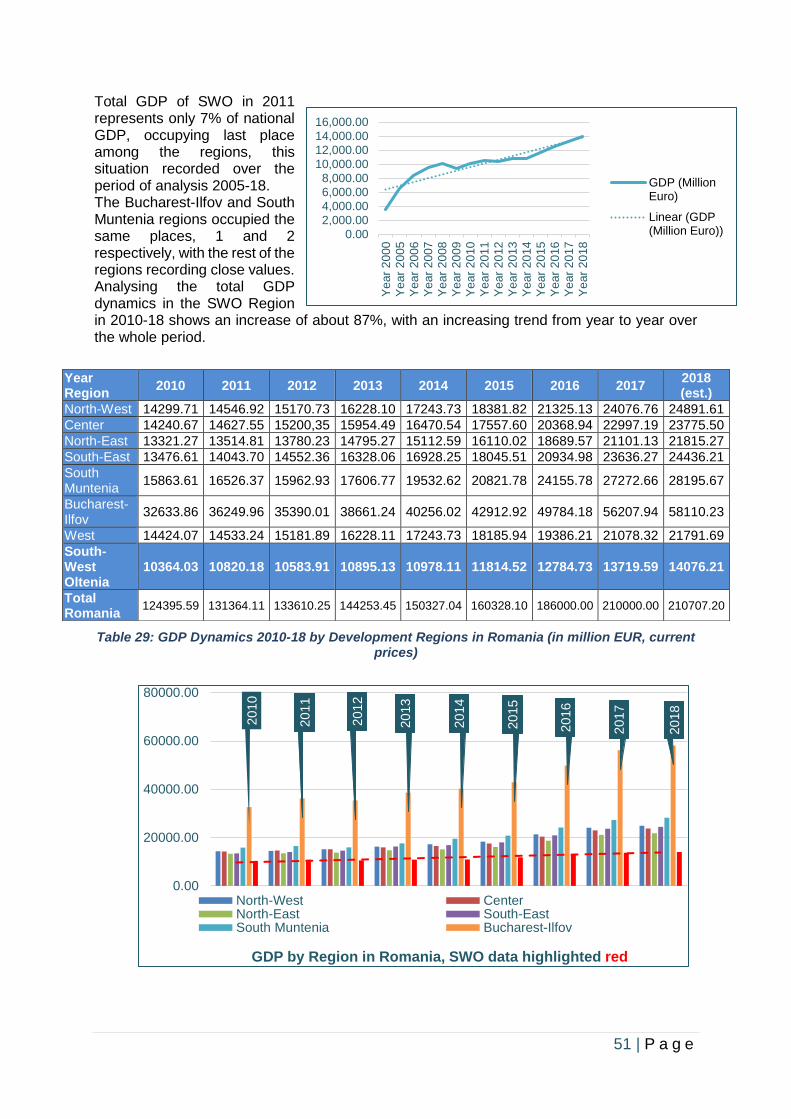
51 | P a g e
2010
2011
2012
2013
2014
2015
2016
2017
2018
0.00
20000.00
40000.00
60000.00
80000.00
GDP by Region in Romania, SWO data highlighted red
North-West CenterNorth-East South-EastSouth Muntenia Bucharest-Ilfov
Total GDP of SWO in 2011 represents only 7% of national GDP, occupying last place among the regions, this situation recorded over the period of analysis 2005-18. The Bucharest-Ilfov and South Muntenia regions occupied the same places, 1 and 2 respectively, with the rest of the regions recording close values. Analysing the total GDP dynamics in the SWO Region in 2010-18 shows an increase of about 87%, with an increasing trend from year to year over the whole period.
Table 29: GDP Dynamics 2010-18 by Development Regions in Romania (in million EUR, current prices)
Year Region
2010 2011 2012 2013 2014 2015 2016 2017 2018 (est.)
North-West 14299.71 14546.92 15170.73 16228.10 17243.73 18381.82 21325.13 24076.76 24891.61
Center 14240.67 14627.55 15200,35 15954.49 16470.54 17557.60 20368.94 22997.19 23775.50
North-East 13321.27 13514.81 13780.23 14795.27 15112.59 16110.02 18689.57 21101.13 21815.27
South-East 13476.61 14043.70 14552.36 16328.06 16928.25 18045.51 20934.98 23636.27 24436.21
South Muntenia
15863.61 16526.37 15962.93 17606.77 19532.62 20821.78 24155.78 27272.66 28195.67
Bucharest-Ilfov
32633.86 36249.96 35390.01 38661.24 40256.02 42912.92 49784.18 56207.94 58110.23
West 14424.07 14533.24 15181.89 16228.11 17243.73 18185.94 19386.21 21078.32 21791.69
South-West Oltenia
10364.03 10820.18 10583.91 10895.13 10978.11 11814.52 12784.73 13719.59 14076.21
Total Romania
124395.59 131364.11 133610.25 144253.45 150327.04 160328.10 186000.00 210000.00 210707.20
0.002,000.00
4,000.006,000.008,000.00
10,000.0012,000.0014,000.00
16,000.00
Ye
ar
20
00
Ye
ar
20
05
Ye
ar
20
06
Ye
ar
20
07
Ye
ar
20
08
Ye
ar
20
09
Ye
ar
20
10
Ye
ar
20
11
Ye
ar
20
12
Ye
ar
20
13
Ye
ar
20
14
Ye
ar
20
15
Ye
ar
20
16
Ye
ar
20
17
Ye
ar
20
18
GDP (MillionEuro)
Linear (GDP(Million Euro))
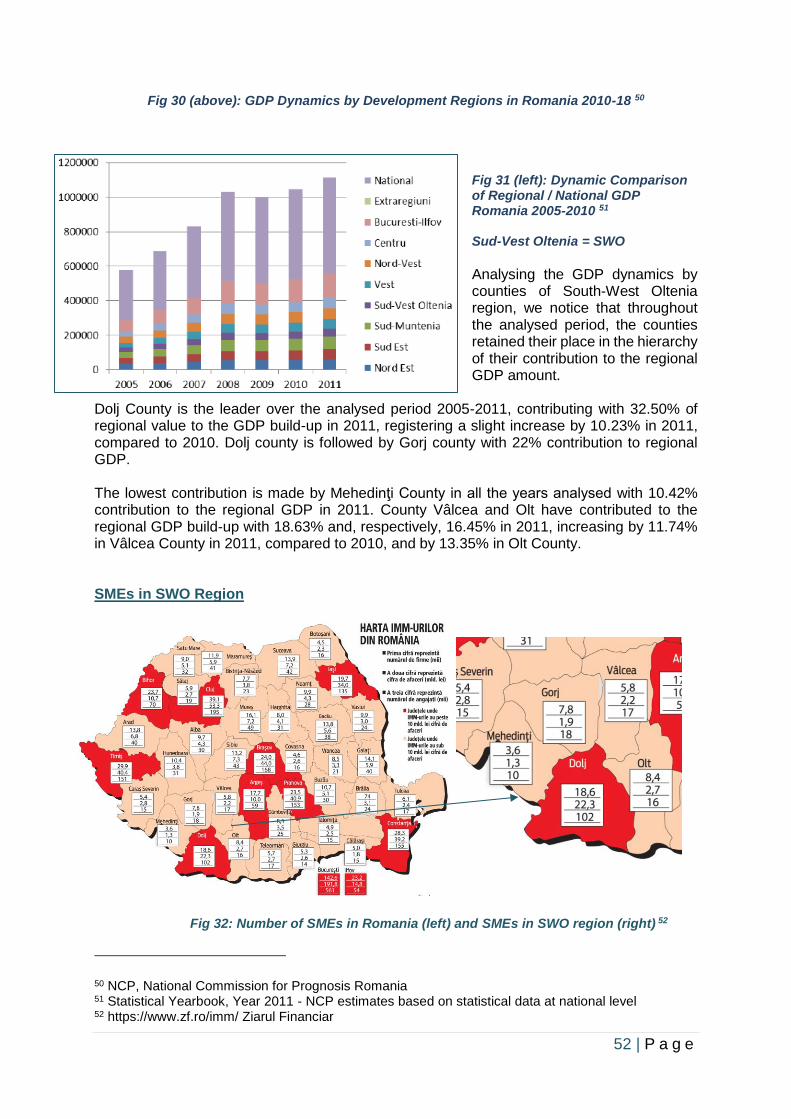
52 | P a g e
Fig 30 (above): GDP Dynamics by Development Regions in Romania 2010-18 50
Fig 31 (left): Dynamic Comparison of Regional / National GDP Romania 2005-2010 51 Sud-Vest Oltenia = SWO
Analysing the GDP dynamics by counties of South-West Oltenia region, we notice that throughout the analysed period, the counties retained their place in the hierarchy of their contribution to the regional GDP amount.
Dolj County is the leader over the analysed period 2005-2011, contributing with 32.50% of regional value to the GDP build-up in 2011, registering a slight increase by 10.23% in 2011, compared to 2010. Dolj county is followed by Gorj county with 22% contribution to regional GDP. The lowest contribution is made by Mehedinţi County in all the years analysed with 10.42% contribution to the regional GDP in 2011. County Vâlcea and Olt have contributed to the regional GDP build-up with 18.63% and, respectively, 16.45% in 2011, increasing by 11.74% in Vâlcea County in 2011, compared to 2010, and by 13.35% in Olt County. SMEs in SWO Region
Fig 32: Number of SMEs in Romania (left) and SMEs in SWO region (right) 52
50 NCP, National Commission for Prognosis Romania 51 Statistical Yearbook, Year 2011 - NCP estimates based on statistical data at national level 52 https://www.zf.ro/imm/ Ziarul Financiar
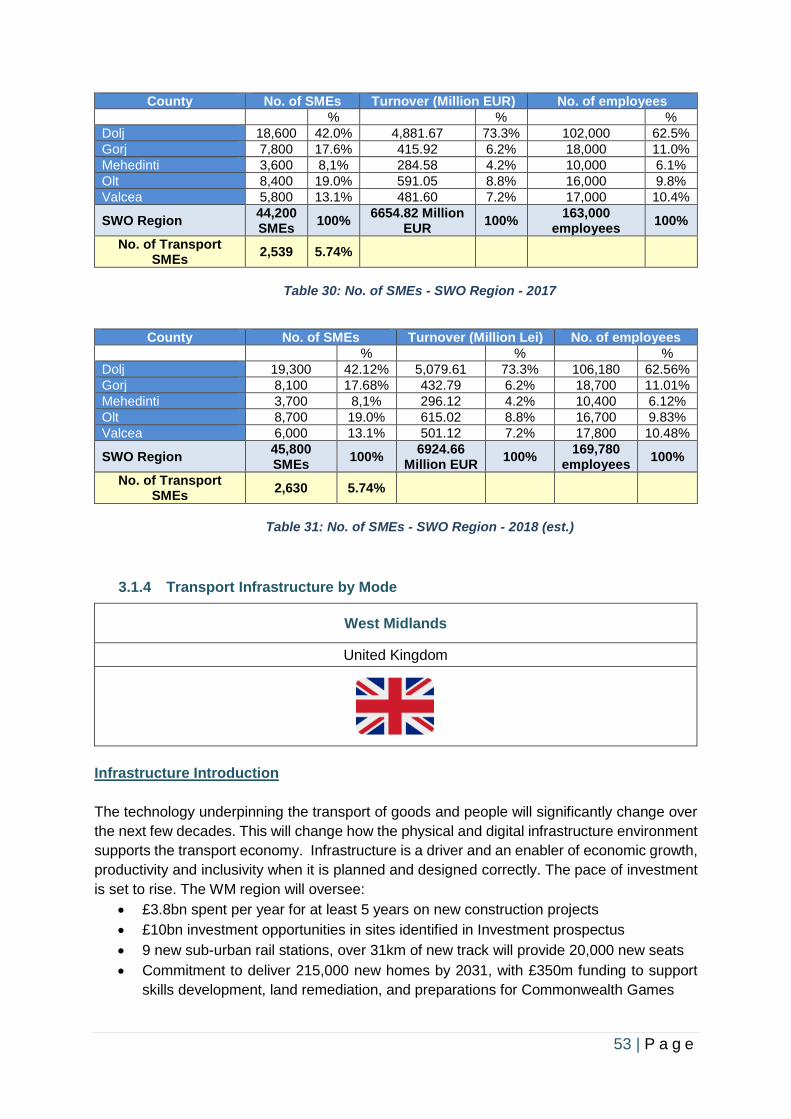
53 | P a g e
County No. of SMEs Turnover (Million EUR) No. of employees
% % %
Dolj 18,600 42.0% 4,881.67 73.3% 102,000 62.5%
Gorj 7,800 17.6% 415.92 6.2% 18,000 11.0%
Mehedinti 3,600 8,1% 284.58 4.2% 10,000 6.1%
Olt 8,400 19.0% 591.05 8.8% 16,000 9.8%
Valcea 5,800 13.1% 481.60 7.2% 17,000 10.4%
SWO Region 44,200 SMEs
100% 6654.82 Million
EUR 100%
163,000 employees
100%
No. of Transport SMEs
2,539 5.74%
Table 30: No. of SMEs - SWO Region - 2017
County No. of SMEs Turnover (Million Lei) No. of employees
% % %
Dolj 19,300 42.12% 5,079.61 73.3% 106,180 62.56%
Gorj 8,100 17.68% 432.79 6.2% 18,700 11.01%
Mehedinti 3,700 8,1% 296.12 4.2% 10,400 6.12%
Olt 8,700 19.0% 615.02 8.8% 16,700 9.83%
Valcea 6,000 13.1% 501.12 7.2% 17,800 10.48%
SWO Region 45,800 SMEs
100% 6924.66
Million EUR 100%
169,780 employees
100%
No. of Transport SMEs
2,630 5.74%
Table 31: No. of SMEs - SWO Region - 2018 (est.)
3.1.4 Transport Infrastructure by Mode
West Midlands
United Kingdom
Infrastructure Introduction
The technology underpinning the transport of goods and people will significantly change over
the next few decades. This will change how the physical and digital infrastructure environment
supports the transport economy. Infrastructure is a driver and an enabler of economic growth,
productivity and inclusivity when it is planned and designed correctly. The pace of investment
is set to rise. The WM region will oversee:
• £3.8bn spent per year for at least 5 years on new construction projects
• £10bn investment opportunities in sites identified in Investment prospectus
• 9 new sub-urban rail stations, over 31km of new track will provide 20,000 new seats
• Commitment to deliver 215,000 new homes by 2031, with £350m funding to support
skills development, land remediation, and preparations for Commonwealth Games
54 | P a g e
• HS2 – £4.4bn HS2 Growth Strategy - Curzon Masterplan, 20 transport schemes to
'plug-in' the new HS2 stations to local transport networks
• Metro extension – East-West Metro with Metro light rail extensions to Dudley/Brierley
Hill and through East Birmingham to North Solihull and the HS2 Interchange station
• Commonwealth Games 2022 – Athletes Village, investments to Alexander Stadium and
facilities across the city (Birmingham)
• City of Culture 2021 – City of Culture will unlock investments across the city in arts,
culture, visitor economy etc. (Coventry).
Highways & Road Network
The WM is at the heart of the road network which gives it a competitive advantage in terms of
attracting and retaining businesses, with freight playing a huge part in the regional economy.
As a fundamental element of the devolution plans, TfWM are investing in local infrastructure,
ready for the arrival of HS2 and to ensure that goods and people are able to move seamlessly.
The information in this section provides an overview of the Key Route Network (KRN), and
highlights recent trends in safety, condition, and traffic flow.
The identification and adoption of a designated WM KRN provides WMCA and its stakeholders
greater ability to work together to maximise flows, minimise congestion along the strategically
important parts of the network and improve customer experience. The KRN is a 605km network
of key highways representing approximately 7% of the non-trunk road network and it carries
approximately 50% of all car, public transport and freight journeys. The network serves the
main strategic demand flows of people, goods and services across the metropolitan area,
whilst also serving large local traffic flows and providing connections to the national Strategic
Road Network.
The KRN will enable an efficient and resilient transport system to underpin the future economic
success of the region by widening labour markets, unlocking development and supporting
regeneration. A further critical function of the KRN is encouraging healthy travel choices
through better integration across travel modes, including improving junctions where cycling
and walking routes cross a main road. Closer co-operation with Highways England (see
section 3.2 Stakeholders for more information) and neighbouring shire highway authorities will
ensure that roads on the KRN which cross administrative boundaries will have improved
collaborative planning. The day to day operations of the network remain under the control of
the seven Metropolitan Authorities. Strategic oversight and co-ordination is managed by TfWM.
In order to ensure local needs and issues are reflected the Network has been split into 23
routes to aide management and future investment decisions.
TfWM will be reporting on a number of metrics that concern the performance of the constituent
parts of the KRN in order to identify potential issues and opportunities that can be addressed
in order to improve performance whilst benchmarking the network against various criteria that
will help inform where future investment priorities should be considered. Recent years have
seen a steady increase in the Average Annual Daily Flow (AADF) of traffic on the network. It
is apparent from yearly data published by the Department for Transport (DfT) that this increase
has not been even across modes of transport. Car and taxi use as well as light goods vehicles
have increased by 6.3% and 36.6% respectively since 2000, though this effect was dampened
in the years immediately following the recession in 2008/09. Use of heavy goods vehicles did
not change significantly over this period, while bus traffic flow declined by 32%. It should be
55 | P a g e
noted that as these data do not include B roads and unclassified roads, the fall in bus traffic
may be overstated. This trend also reversed in 2015-16, with 5% growth, indicating that the
decline may have bottomed out.
Road safety data available from 2009 onwards indicate that this increase in traffic throughput
has not coincided with an increase in road casualties, which have declined by 21%, from a
peak of 10,099 in 2009 to 7950 last year. This includes a steep decline of 5% from 2015-2016,
a year in which there was overall traffic growth. Growth in vehicle throughput has not always
corresponded with increased congestion. Since 2007, vehicle speed through the main traffic
arteries of Birmingham city centre has remained fairly constant, including at peak times. There
has been a considerable improvement in recent years to scheduled road maintenance, with a
DfT data on principle and local roads maintained by the seven LA’s indicating a fall of 45% in
the number of roads considered in need of maintenance, since 2007.
However, there has been a steep decline in all-day average speed for bus traffic, falling 5.7%
from 11.5mph to 10.8mph in the last ten years. Traffic officers are to help combat congestion
on roads surrounding the M5 Oldbury viaduct as TfWM and Highways England join forces to
improve journeys. The two organisations have signed a partnership agreement that involves
closer communication and sharing working arrangements to provide better journeys and
reduce congestion. Meanwhile, Highways England traffic officers will, for the first time, provide
additional support to motorists that encounter vehicle breakdowns on key roads near the M5
as part of a 13-month pilot scheme. The service, which normally only patrols motorways and
key trunk roads, is working closely with Sandwell Council as well as WM Police to assist
motorists and clear obstructions from incidents to keep traffic flowing in and around Sandwell.
The Oldbury scheme, valued at more than £100 million, includes concrete repairs and
waterproofing on the ageing viaduct. It is the largest concrete repair project, by value, ever
carried out in Britain.
Rail
New Bromsgrove Station - TfWM’s joint project with Worcestershire County Council to build
the new station at Bromsgrove has been completed and the new station opened on 12 July
2016. This has delivered a large new four-platform, fully accessible station with booking office,
bus interchange and large new car park replacing the previous two-platform, unstaffed and
inaccessible station. Network Rail has also delivered new track and signalling around the
station and is currently working on the project to electrify the route from Barnt Green in order
to allow a major improvement in train service in 2018. TfWM has responsibility for managing
the station as Station Facility Owner, and has a contract with London Midland to provide the
day-to-day management of the station.
University Station - TfWM is leading the project to rebuild University (Birmingham) station
which is used by more than three million passengers a year and has inadequate facilities to
meet current and future rail demand. The station will form the heart of a wider area master
plan for the hospitals and university campus area. The scheme has been allocated £10m of
Local Growth Fund resources and is currently under development. Multiple project partners
are involved and there is strong support for the project among stakeholders.
Longbridge Connectivity - TfWM is actively taking forward the development of a multi-storey
car park at Longbridge which will provide a significant enhancement to the capacity available
for rail users wishing to drive to the station. This is being developed alongside other highway
56 | P a g e
and station projects at Longbridge which will transform the travel experience for users of the
station.
• Rail patronage in the WM has increased by 1.8% during 2016/17 to 54.7 million. In
2015/16 rail patronage was 53.7 million.
• Rail patronage per population remains the highest in Merseyside with 3.2 million
passenger journeys per 100,000 people, followed by the WM with 1.9 million.
Under the franchise agreement WM Trains will run local rail services in the WM from December
until March 2026. As well as increased frequencies, there will be major investment in new
trains with local services branded under a new WM Railway livery.
The 100 new carriages for the Cross City line, the busiest route on the WM network, will provide
increased space to carry more passengers and wider doors for quicker access.
The franchise covers services across the WM. For the first time passengers will be entitled to
25% compensation if their train is delayed by more than 15 minutes. They already receive 50%
back for delays of half an hour and full compensation if it is more than an hour.
Around £60m will be invested on station improvements across the franchise area delivering
1,000 new car park spaces, 2,500 cycle parking spaces, a cycle hire scheme, new and
refurbished waiting rooms and more seats at stations. There will also be improved access for
those requiring extra assistance, including disabled people.
Feasibility studies will be undertaken for the development of new stations in the WM and there
will be plans to limit the impact of delays caused by leaves on the line in the autumn, including
through the introduction of new, modern trains.
Cycling
Managing Short Trips (MST) is a £6.3m programme of infrastructure schemes that is delivering
31km of cycleway improvements to canal towpaths in the Black Country together with
associated physical highway improvements, such as footway widening, improved crossing
facilities and tactile paving. These improvements are all designed to create cycle friendly
corridors between existing cycle routes, residential areas and local centres. A second phase
of MST work has been proposed to complete the connectivity along the canal towpath between
Wolverhampton and Birmingham and an estimated £4m is being invested towards this.
Metro
Midland Metro is a light rail system in the WM between Birmingham and Wolverhampton. A
team of planning, design and construction specialists, the Midland Metro Alliance, is
responsible for building six new tram extensions over the coming decade on behalf of the
WMCA to help deliver a lasting legacy, aiding social and economic regeneration. Building on
lessons from past projects and best practice from across the world, the nine project partners
are fully committed to making the delivery a success and encouraging collaborative working.
With around £1.3bn planned to be invested in the programme, the new extensions will see the
tram network extended by over 32km across the region. As part of the Wolverhampton
Interchange Project, the line from the existing Midland Metro on Bilston Street will run along
57 | P a g e
Pipers Row and Railway Drive with new stops at the bus and railway stations. Utility diversion
works have already begun with a completion date planned for 2019.
The 0.85km Centenary Square extension will see the tram run from Grand Central station in
Birmingham City, up Pinfold Street to Victoria Square and Centenary Square. With enabling
works started, this extension will provide stops serving Paradise Circus and Arena Central
developments with a completion date of 2019. The 1.4km Edgbaston (Birmingham) extension
will continue from Centenary Square along Broad Street to Hagley Road. The two extensions
will be combined in terms of management, funding and delivery.
The 1.7km further extension of the Birmingham City Centre line to Eastside will serve the
proposed HS2 Curzon Station and onwards to Digbeth. Funding has been provisionally
allocated by the Government to the Greater Birmingham & Solihull Local Enterprise
Partnership and a Transport and Works Act Order application was submitted in October 2016.
The extension is pencilled to open in 2022/23. Still in development stage, the proposed 16.5km
extension from Digbeth to East Birmingham and Solihull will link growing residential areas and
communities (such as Heartlands Hospital) with new growth and development areas including
HS2, Birmingham City Centre, Arena Central, Brindley Place/Five Ways/ Edgbaston, the NEC
and Birmingham Airport.
The 11km Wednesbury to Brierley Hill extension will run from Wednesbury via Dudley town
centre and Waterfront/Merry Hill to Brierley Hill. Clearance of part of the overgrown disused
railway line began in January 2017 (funded by WMCA) so that full environmental and structural
surveys can be carried out to identify the scale of works. A business case was submitted in
June 2017 to secure major funding.
• Metro patronage has increased to 7.2 million in 2016/17.
• In 2016/17 rail fares increased by 1.9%, Metro by 2.8% and bus fares by 2.4%.
• In comparison, fuel price increases meant that motoring expenditure increased by
8.6%. RPI increased by 3.1%.
The Midland Metro has seen the biggest rise in passenger satisfaction in the country, a key
survey found. The study by Transport Focus – the independent public transport watchdog –
revealed overall satisfaction with the service rose from 81% in 2015 to 92% in 2016, the largest
of all the tram networks surveyed.
In a further boost to the Metro, patronage on the line between Birmingham and Wolverhampton
city centres is at an all-time high – 7.89 million passengers took the tram between June 2016
and May 2017.
Future expansion of the Metro includes an extension of the route from New Street Station to
Centenary Square, with services expected to start running in 2019. Nearly £60 million has also
been confirmed for the line to go further along Broad Street, past Five Ways and on to
Edgbaston by 2021.
Extensions are also planned through Digbeth in Birmingham, to the forthcoming HS2 high
speed rail station at Curzon Street. Works have begun in Wolverhampton on an extension
through the city centre to the bus and railway stations as part of the £51.8 million
Wolverhampton Interchange Programme. The line is expected to open in 2019. Meanwhile, a
business case is also being prepared to extend the Metro from Wednesbury to Brierley Hill.
58 | P a g e
Public Transport
Merry Hill Bus Station has benefited from a full redevelopment that has seen many
enhancements for the passengers that use the site. The bus station has been reconfigured to
a horseshoe arrangement of stands to improve the health and safety performance of the site
as well as traffic flow. Passengers have benefited from new stands with bus activated
automatic doors and these have greatly reduced the number of incidents of passengers
walking in the carriageway and have made the site a much safer location. There are now six
enclosed stands with new seating and passenger information enhancing the customer
experience. In addition to these six stands, there are two new cantilever shelters that benefit
from automatic doors and passenger information.
Dudley Bus Station introduced a Customer Service Excellence Programme in 2016/17 which
saw National Express and TfWM work together to provide an enhanced customer experience
through partnership working. As part of this initiative a Customer Satisfaction Survey was
undertaken and as a direct consequence of the results, the following customer enhancements
were completed on site. The bus station has been completely redecorated and all of the
passenger wayfinding signage reviewed and replaced to provide a better customer experience.
The exit to Portersfield was renewed with old granite kerbstones replaced with a new tarmac
exit. In addition, the site was completely re-line marked and repairs were carried out to
concrete bus boxes throughout the station to reduce ongoing maintenance costs and increase
the experience for drivers and customers.
Halesowen Bus Station and Stourbridge Interchange. New Swift readers were installed to
let passengers collect Swift purchases from the two sites. In addition, the sites were completely
re-line marked to reduce ongoing maintenance costs and increase the experience for drivers
and customers.
Bearwood Interchange. A mid-life refurbishment was completed in September 2016 in
partnership with Sandwell MBC. The refurbishment included the installation of new shelters,
Real Time Information, improved paving and redesign of public space, improvements to
information displays and the pavement levels to promote interchange with the services on
Hagley Road.
Walsall St Pauls Bus Station. TfWM successfully completed an automatic door project in
December 2016. Each departure stand from A to M now has an automatic bus loading door
which has significantly reduced the number of pedestrians in the main carriageway of the bus
station, creating a safer environment.
Bilston Bus Station. TfWM has made a number of enhancements including vital planned
maintenance and a full refresh of line markings on the carriageways.
Coventry Pool Meadow Bus Station. TfWM successfully completed an automatic door
project in August 2016, installing nine new automatic doors. All departure stands now have an
automatic bus loading door. TfWM has also relocated five cycle lockers to ensure they are
accessible and promoted.
Wolverhampton Bus Station. Coaches were relocated to Wolverhampton Bus Station in
June 2016. Due to the closure of Pipers Row when the Metro development works begin, TfWM
worked with Wolverhampton City Council and National Express to find an alternative for
59 | P a g e
coaches and customers in the city centre. Customers are now experiencing an enhanced multi-
modal facility. Customer benefits include high quality waiting facilities available 24 hours a day,
7 days a week, with CCTV and on-site security. Real Time Information is available at the main
entrances for services across all modes with National Express and TfWM staff being co-located
within the travel shop to provide tickets and customer assistance. The bus station delivers
improved accessibility, including a RADAR disabled toilet, a colour contrasted tactile paving
strip, tactile/braille map of the station and information at each stand. Passenger safety is also
enhanced by the designated coach stand and loading point with automatic doors that open
when alighting and boarding.
West Bromwich Bus Station. During 2016/17, a number of enhancements were made at
West Bromwich Bus Station. These include essential works on automatic doors to ensure they
are working correctly for the benefit of all users and installation of anti-perching spikes to deter
pigeons from settling throughout the loading bays and on top of infrastructure within the bus
station.
Travel Centres. TfWM operates two travel centres, one in Birmingham New Street and the
other in Wolverhampton Bus Station. In December 2016, retail sales posts were installed with
cameras and printers on every till point at both locations. This technology allows the retailing
of turnup-and-go Swift cards and has benefited customers by improving the speed at which
they can make purchases.
• The total number of passenger journeys in 2016/17 was 261 million.
• Concessionary travel in 2016/17 was 84.2 million and no concessionary travel was
176.8 million journeys.
• Comparing bus patronage across Passenger Transport Executives (PTE) shows that
bus patronage has fallen in all PTE areas apart from Tyne & Wear (North England).
• Bus patronage per head of population remains the highest in Tyne & Wear with 11.4
million passenger journeys per 100,000 people, followed by Merseyside with 10.5
million, the WM with 9.2 million and then South Yorkshire and Greater Manchester
with 7.3 million each.
• Bus boardings fell by 2% again in 2016/17, which is the long-term average rate of the
last 20 years. This reflects journeys lengthening, and alternatives to bus travel – from
cars and trains to taxis and smartphones – becoming more accessible and affordable,
at least outside of major centres and peak times.
• The decline is not being offset by population growth, since this largely reflects an ageing
population, and trips by older people are falling at twice the average rate. This is partly
because of tightening eligibility for free travel.
• Of the 261 million bus journeys made in 2016/17, 84.2 million journeys were made
under concessionary travel schemes (older person, disabled and children); this
represents 32% of all bus journeys.
• Passenger journeys made under the combined Senior Citizen and Blind and Disabled
scheme represent 23% of all bus journeys. There are approximately 479,000 free
passes on issue under the combined scheme.
• Take-up rate of the free Older Persons Concessionary Travel Pass was estimated
around 95% but due to changes in eligibility, it’s difficult to assess how many eligible
people there are at present. It would appear the take up rate amongst the 60-64 year-
olds who came into the free scheme in July 2005 continues to run at a significantly
60 | P a g e
lower level than those 65 or above. It is generally considered that 60-64 year-olds
undertake significantly less trips per year than has historically been the case, partly due
to many of the new pass holders being economically active and their trips are
commercial, not valid under some schemes if going to work in the morning peak.
Multimodal
Swift, the region’s travel smartcard, has seen another major rollout. With three million journeys
now being made every month with the card, access to it has been made even wider. TfWM
also introduced three new schemes:
• Rail passengers travelling into the metropolitan WM from stations in neighbouring non-
constituent local authorities were able to use Swift from July.
• A pilot scheme using Swift on buses in non-constituent member began in autumn.
• Self-service kiosks issuing Swift cards with the holders’ photograph being rolled out
across the region following a successful trial at Wolverhampton Interchange.
Swift can be used on rail by passengers paying by direct debit and who have an ‘add-on’ to
their ticket. 53
Campania Region
Italy
Transport Infrastructure by Mode
Railway network
53 https://www.tfwm.org.uk/media/2857/wm-travel-trends-2017.pdf
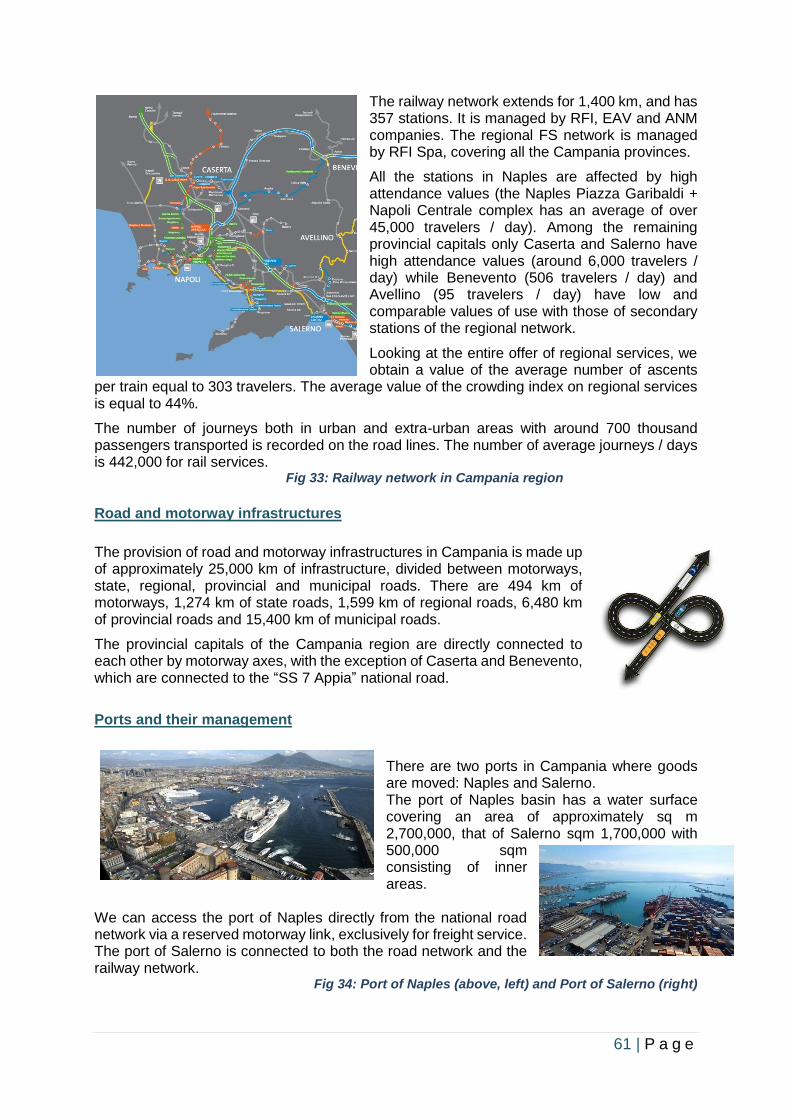
61 | P a g e
The railway network extends for 1,400 km, and has 357 stations. It is managed by RFI, EAV and ANM companies. The regional FS network is managed by RFI Spa, covering all the Campania provinces.
All the stations in Naples are affected by high attendance values (the Naples Piazza Garibaldi + Napoli Centrale complex has an average of over 45,000 travelers / day). Among the remaining provincial capitals only Caserta and Salerno have high attendance values (around 6,000 travelers / day) while Benevento (506 travelers / day) and Avellino (95 travelers / day) have low and comparable values of use with those of secondary stations of the regional network.
Looking at the entire offer of regional services, we obtain a value of the average number of ascents
per train equal to 303 travelers. The average value of the crowding index on regional services is equal to 44%.
The number of journeys both in urban and extra-urban areas with around 700 thousand passengers transported is recorded on the road lines. The number of average journeys / days is 442,000 for rail services.
Fig 33: Railway network in Campania region
Road and motorway infrastructures
The provision of road and motorway infrastructures in Campania is made up of approximately 25,000 km of infrastructure, divided between motorways, state, regional, provincial and municipal roads. There are 494 km of motorways, 1,274 km of state roads, 1,599 km of regional roads, 6,480 km of provincial roads and 15,400 km of municipal roads.
The provincial capitals of the Campania region are directly connected to each other by motorway axes, with the exception of Caserta and Benevento, which are connected to the “SS 7 Appia” national road.
Ports and their management
There are two ports in Campania where goods are moved: Naples and Salerno. The port of Naples basin has a water surface covering an area of approximately sq m 2,700,000, that of Salerno sqm 1,700,000 with 500,000 sqm consisting of inner areas.
We can access the port of Naples directly from the national road network via a reserved motorway link, exclusively for freight service. The port of Salerno is connected to both the road network and the railway network.
Fig 34: Port of Naples (above, left) and Port of Salerno (right)
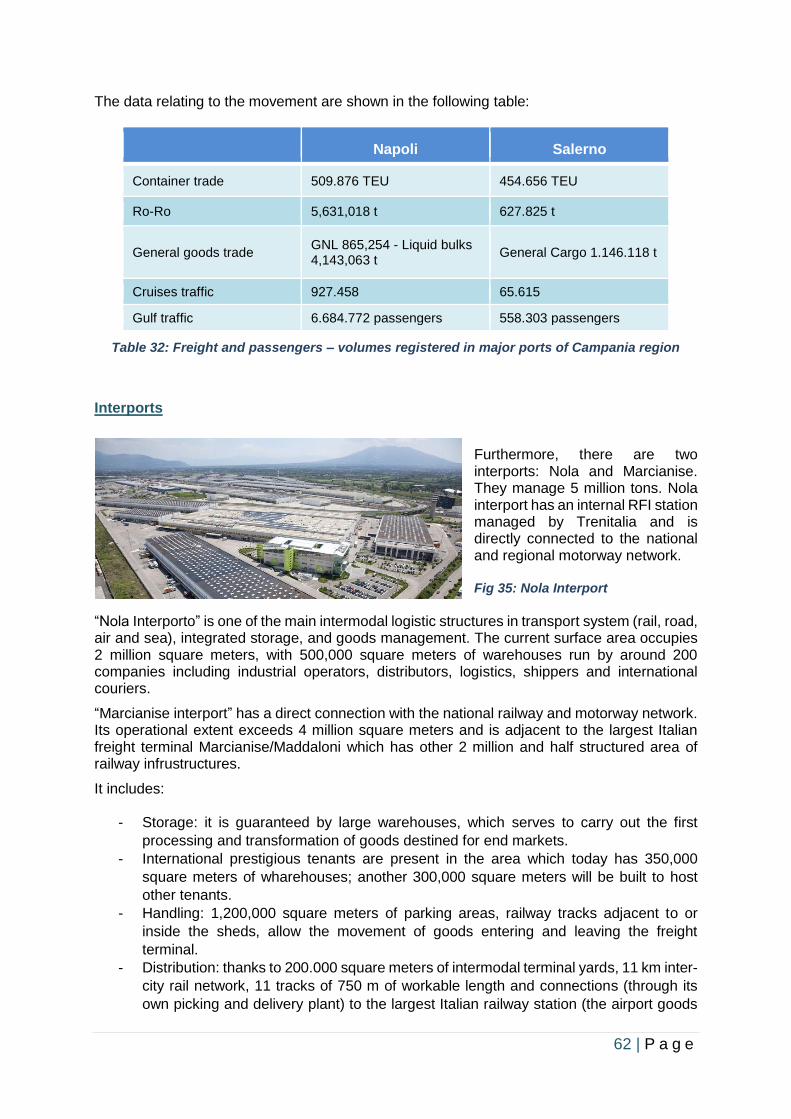
62 | P a g e
The data relating to the movement are shown in the following table:
Napoli Salerno
Container trade 509.876 TEU 454.656 TEU
Ro-Ro 5,631,018 t 627.825 t
General goods trade GNL 865,254 - Liquid bulks 4,143,063 t
General Cargo 1.146.118 t
Cruises traffic 927.458 65.615
Gulf traffic 6.684.772 passengers 558.303 passengers
Table 32: Freight and passengers – volumes registered in major ports of Campania region
Interports
Furthermore, there are two interports: Nola and Marcianise. They manage 5 million tons. Nola interport has an internal RFI station managed by Trenitalia and is directly connected to the national and regional motorway network.
Fig 35: Nola Interport
“Nola Interporto” is one of the main intermodal logistic structures in transport system (rail, road, air and sea), integrated storage, and goods management. The current surface area occupies 2 million square meters, with 500,000 square meters of warehouses run by around 200 companies including industrial operators, distributors, logistics, shippers and international couriers.
“Marcianise interport” has a direct connection with the national railway and motorway network. Its operational extent exceeds 4 million square meters and is adjacent to the largest Italian freight terminal Marcianise/Maddaloni which has other 2 million and half structured area of railway infrustructures.
It includes:
- Storage: it is guaranteed by large warehouses, which serves to carry out the first
processing and transformation of goods destined for end markets.
- International prestigious tenants are present in the area which today has 350,000
square meters of wharehouses; another 300,000 square meters will be built to host
other tenants.
- Handling: 1,200,000 square meters of parking areas, railway tracks adjacent to or
inside the sheds, allow the movement of goods entering and leaving the freight
terminal.
- Distribution: thanks to 200.000 square meters of intermodal terminal yards, 11 km inter-
city rail network, 11 tracks of 750 m of workable length and connections (through its
own picking and delivery plant) to the largest Italian railway station (the airport goods
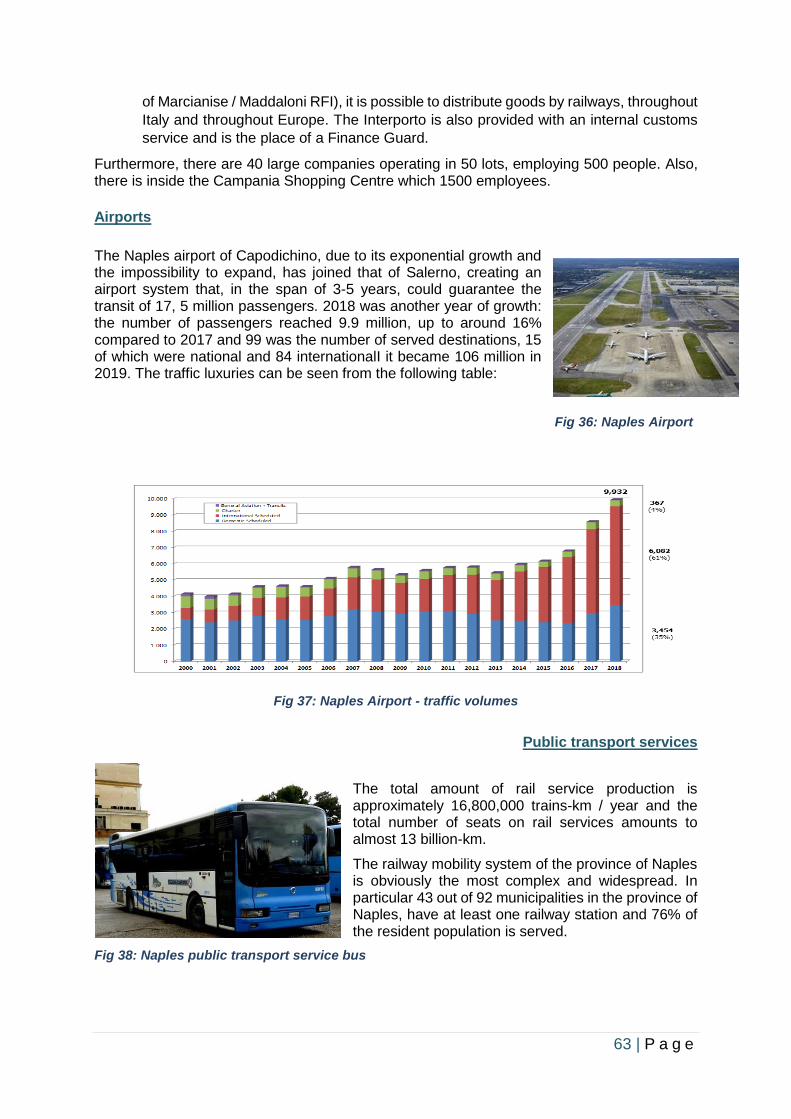
63 | P a g e
of Marcianise / Maddaloni RFI), it is possible to distribute goods by railways, throughout
Italy and throughout Europe. The Interporto is also provided with an internal customs
service and is the place of a Finance Guard.
Furthermore, there are 40 large companies operating in 50 lots, employing 500 people. Also, there is inside the Campania Shopping Centre which 1500 employees.
Airports
The Naples airport of Capodichino, due to its exponential growth and the impossibility to expand, has joined that of Salerno, creating an airport system that, in the span of 3-5 years, could guarantee the transit of 17, 5 million passengers. 2018 was another year of growth: the number of passengers reached 9.9 million, up to around 16% compared to 2017 and 99 was the number of served destinations, 15 of which were national and 84 internationalI it became 106 million in 2019. The traffic luxuries can be seen from the following table:
Fig 36: Naples Airport
Fig 37: Naples Airport - traffic volumes
Public transport services
The total amount of rail service production is approximately 16,800,000 trains-km / year and the total number of seats on rail services amounts to almost 13 billion-km.
The railway mobility system of the province of Naples is obviously the most complex and widespread. In particular 43 out of 92 municipalities in the province of Naples, have at least one railway station and 76% of the resident population is served.
Fig 38: Naples public transport service bus
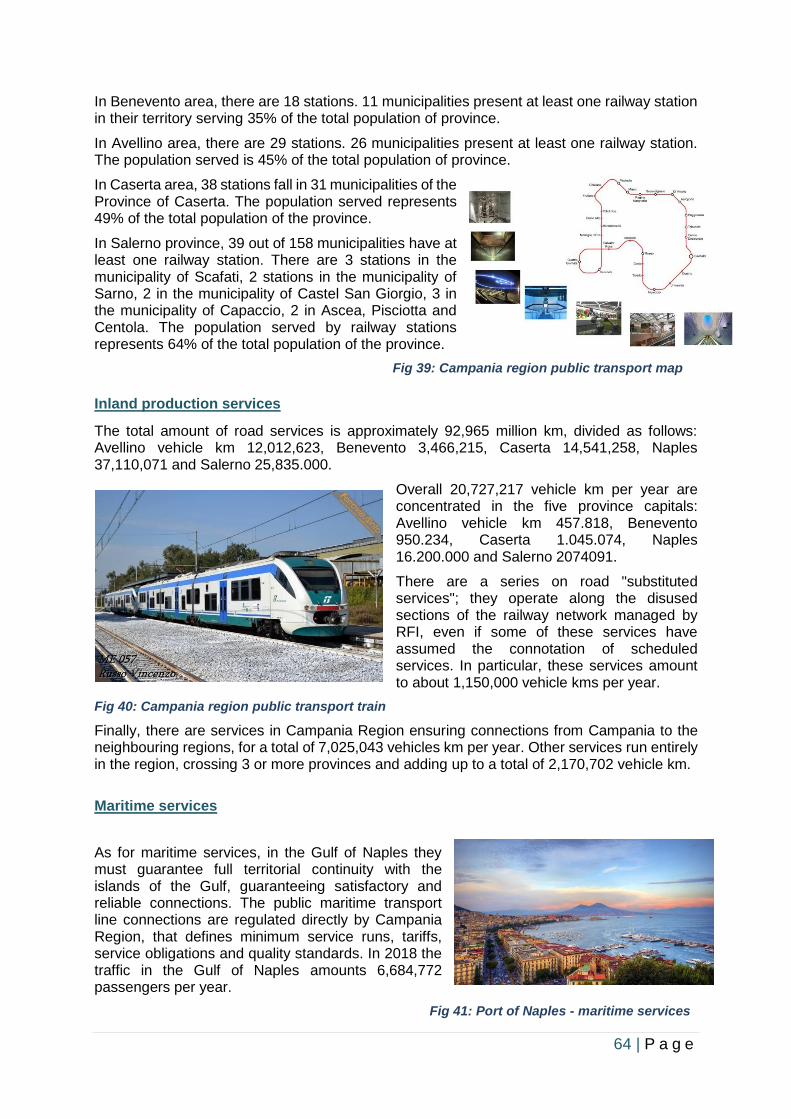
64 | P a g e
In Benevento area, there are 18 stations. 11 municipalities present at least one railway station in their territory serving 35% of the total population of province.
In Avellino area, there are 29 stations. 26 municipalities present at least one railway station. The population served is 45% of the total population of province.
In Caserta area, 38 stations fall in 31 municipalities of the Province of Caserta. The population served represents 49% of the total population of the province.
In Salerno province, 39 out of 158 municipalities have at least one railway station. There are 3 stations in the municipality of Scafati, 2 stations in the municipality of Sarno, 2 in the municipality of Castel San Giorgio, 3 in the municipality of Capaccio, 2 in Ascea, Pisciotta and Centola. The population served by railway stations represents 64% of the total population of the province.
Fig 39: Campania region public transport map
Inland production services
The total amount of road services is approximately 92,965 million km, divided as follows: Avellino vehicle km 12,012,623, Benevento 3,466,215, Caserta 14,541,258, Naples 37,110,071 and Salerno 25,835.000.
Overall 20,727,217 vehicle km per year are concentrated in the five province capitals: Avellino vehicle km 457.818, Benevento 950.234, Caserta 1.045.074, Naples 16.200.000 and Salerno 2074091.
There are a series on road "substituted services"; they operate along the disused sections of the railway network managed by RFI, even if some of these services have assumed the connotation of scheduled services. In particular, these services amount to about 1,150,000 vehicle kms per year.
Fig 40: Campania region public transport train
Finally, there are services in Campania Region ensuring connections from Campania to the neighbouring regions, for a total of 7,025,043 vehicles km per year. Other services run entirely in the region, crossing 3 or more provinces and adding up to a total of 2,170,702 vehicle km.
Maritime services
As for maritime services, in the Gulf of Naples they must guarantee full territorial continuity with the islands of the Gulf, guaranteeing satisfactory and reliable connections. The public maritime transport line connections are regulated directly by Campania Region, that defines minimum service runs, tariffs, service obligations and quality standards. In 2018 the traffic in the Gulf of Naples amounts 6,684,772 passengers per year.
Fig 41: Port of Naples - maritime services
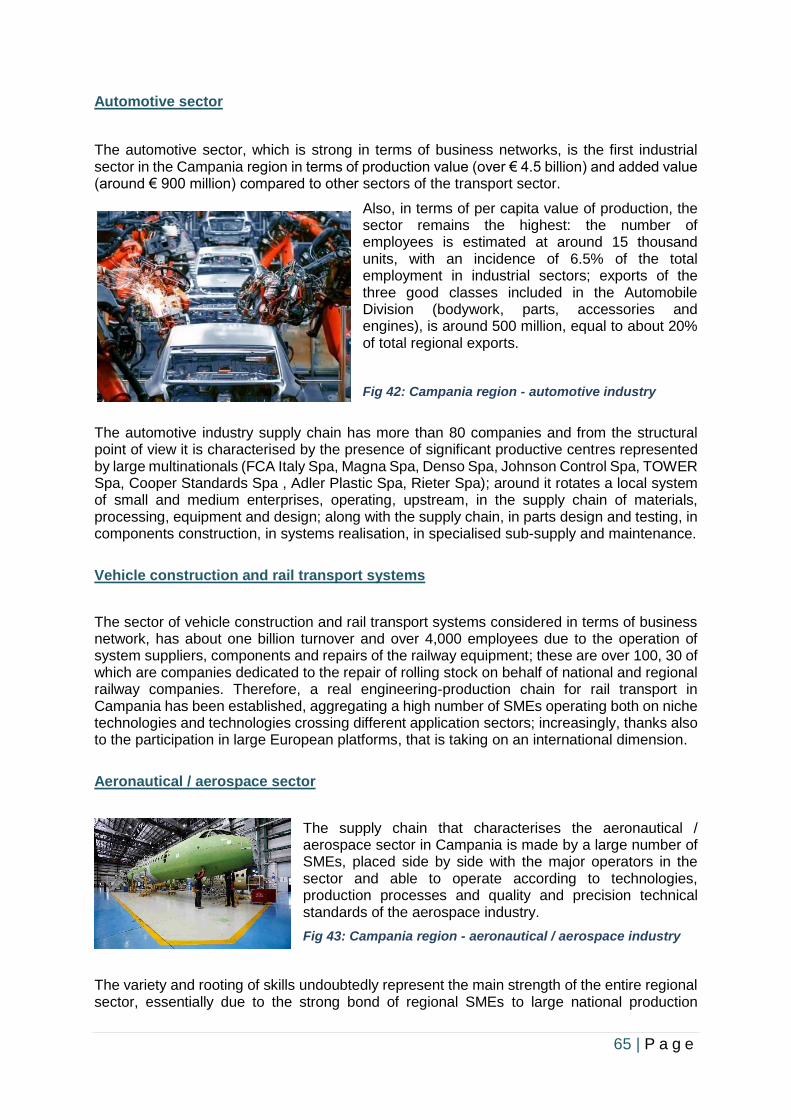
65 | P a g e
Automotive sector
The automotive sector, which is strong in terms of business networks, is the first industrial sector in the Campania region in terms of production value (over € 4.5 billion) and added value (around € 900 million) compared to other sectors of the transport sector.
Also, in terms of per capita value of production, the sector remains the highest: the number of employees is estimated at around 15 thousand units, with an incidence of 6.5% of the total employment in industrial sectors; exports of the three good classes included in the Automobile Division (bodywork, parts, accessories and engines), is around 500 million, equal to about 20% of total regional exports.
Fig 42: Campania region - automotive industry
The automotive industry supply chain has more than 80 companies and from the structural point of view it is characterised by the presence of significant productive centres represented by large multinationals (FCA Italy Spa, Magna Spa, Denso Spa, Johnson Control Spa, TOWER Spa, Cooper Standards Spa , Adler Plastic Spa, Rieter Spa); around it rotates a local system of small and medium enterprises, operating, upstream, in the supply chain of materials, processing, equipment and design; along with the supply chain, in parts design and testing, in components construction, in systems realisation, in specialised sub-supply and maintenance.
Vehicle construction and rail transport systems
The sector of vehicle construction and rail transport systems considered in terms of business network, has about one billion turnover and over 4,000 employees due to the operation of system suppliers, components and repairs of the railway equipment; these are over 100, 30 of which are companies dedicated to the repair of rolling stock on behalf of national and regional railway companies. Therefore, a real engineering-production chain for rail transport in Campania has been established, aggregating a high number of SMEs operating both on niche technologies and technologies crossing different application sectors; increasingly, thanks also to the participation in large European platforms, that is taking on an international dimension.
Aeronautical / aerospace sector
The supply chain that characterises the aeronautical / aerospace sector in Campania is made by a large number of SMEs, placed side by side with the major operators in the sector and able to operate according to technologies, production processes and quality and precision technical standards of the aerospace industry.
Fig 43: Campania region - aeronautical / aerospace industry
The variety and rooting of skills undoubtedly represent the main strength of the entire regional sector, essentially due to the strong bond of regional SMEs to large national production
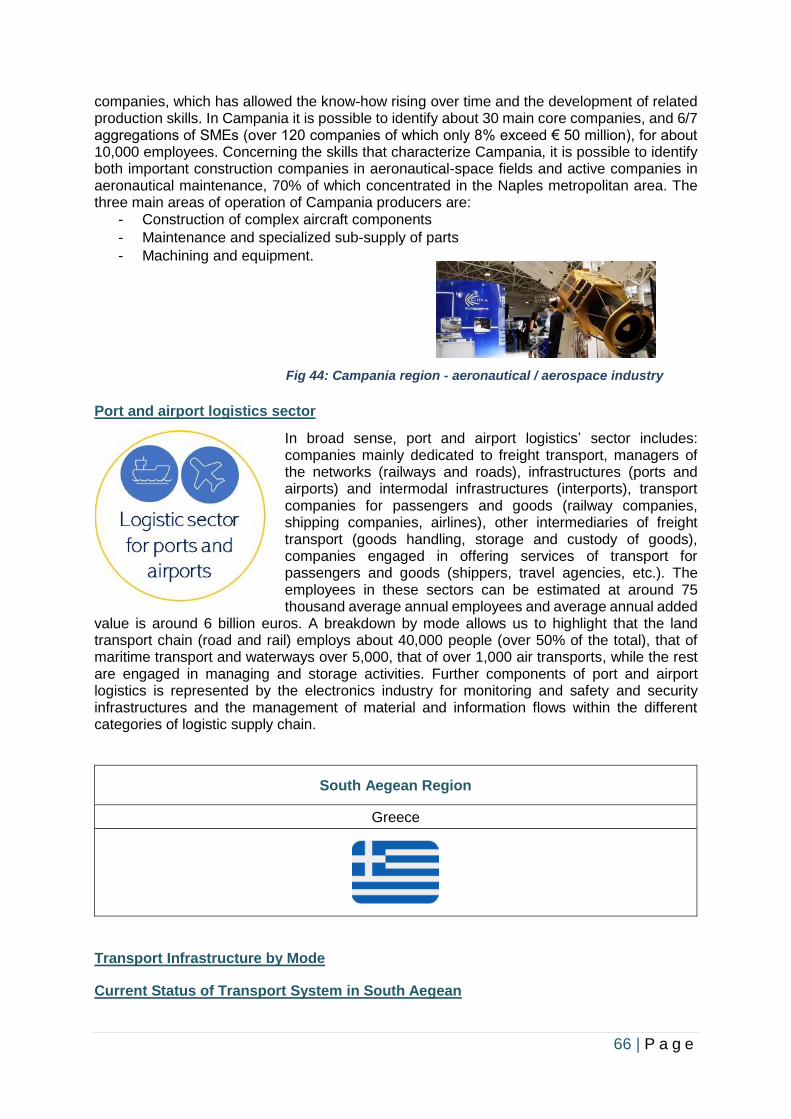
66 | P a g e
companies, which has allowed the know-how rising over time and the development of related production skills. In Campania it is possible to identify about 30 main core companies, and 6/7 aggregations of SMEs (over 120 companies of which only 8% exceed € 50 million), for about 10,000 employees. Concerning the skills that characterize Campania, it is possible to identify both important construction companies in aeronautical-space fields and active companies in aeronautical maintenance, 70% of which concentrated in the Naples metropolitan area. The three main areas of operation of Campania producers are:
- Construction of complex aircraft components
- Maintenance and specialized sub-supply of parts
- Machining and equipment.
Fig 44: Campania region - aeronautical / aerospace industry
Port and airport logistics sector
In broad sense, port and airport logistics’ sector includes: companies mainly dedicated to freight transport, managers of the networks (railways and roads), infrastructures (ports and airports) and intermodal infrastructures (interports), transport companies for passengers and goods (railway companies, shipping companies, airlines), other intermediaries of freight transport (goods handling, storage and custody of goods), companies engaged in offering services of transport for passengers and goods (shippers, travel agencies, etc.). The employees in these sectors can be estimated at around 75 thousand average annual employees and average annual added
value is around 6 billion euros. A breakdown by mode allows us to highlight that the land transport chain (road and rail) employs about 40,000 people (over 50% of the total), that of maritime transport and waterways over 5,000, that of over 1,000 air transports, while the rest are engaged in managing and storage activities. Further components of port and airport logistics is represented by the electronics industry for monitoring and safety and security infrastructures and the management of material and information flows within the different categories of logistic supply chain.
South Aegean Region
Greece
Transport Infrastructure by Mode
Current Status of Transport System in South Aegean
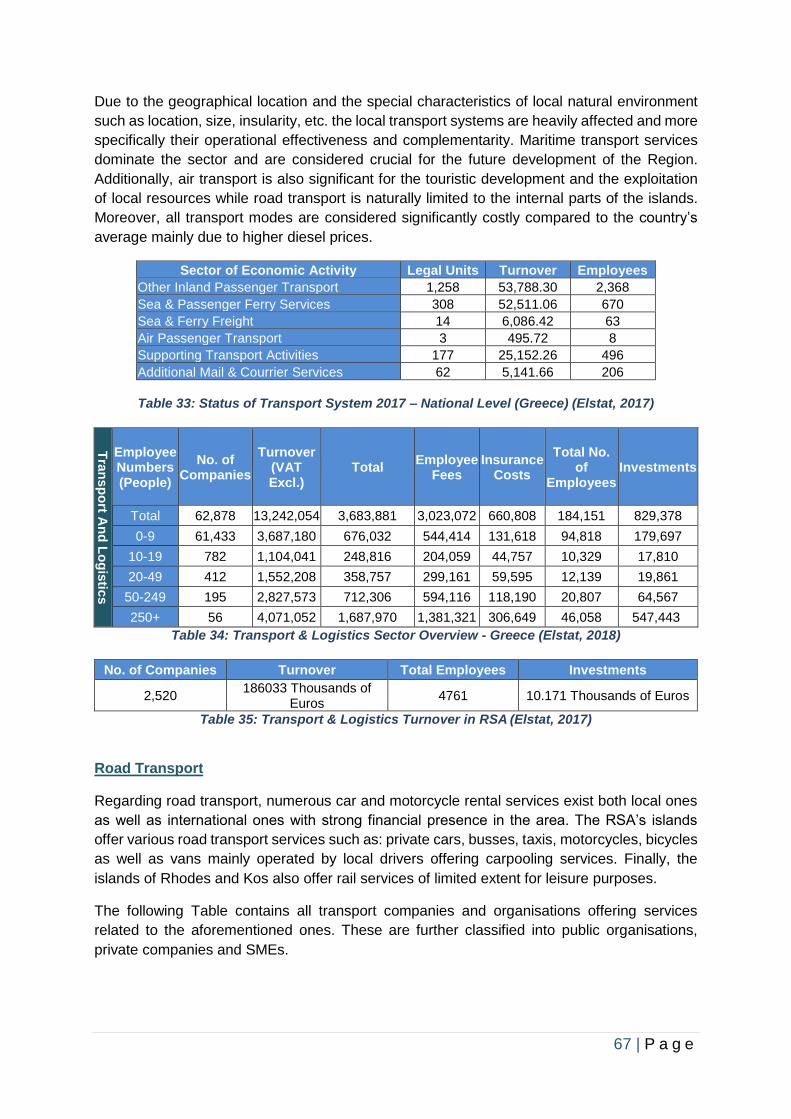
67 | P a g e
Due to the geographical location and the special characteristics of local natural environment
such as location, size, insularity, etc. the local transport systems are heavily affected and more
specifically their operational effectiveness and complementarity. Maritime transport services
dominate the sector and are considered crucial for the future development of the Region.
Additionally, air transport is also significant for the touristic development and the exploitation
of local resources while road transport is naturally limited to the internal parts of the islands.
Moreover, all transport modes are considered significantly costly compared to the country’s
average mainly due to higher diesel prices.
Sector of Economic Activity Legal Units Turnover Employees
Other Inland Passenger Transport 1,258 53,788.30 2,368
Sea & Passenger Ferry Services 308 52,511.06 670
Sea & Ferry Freight 14 6,086.42 63
Air Passenger Transport 3 495.72 8
Supporting Transport Activities 177 25,152.26 496
Additional Mail & Courrier Services 62 5,141.66 206
Table 33: Status of Transport System 2017 – National Level (Greece) (Elstat, 2017)
Tra
nsp
ort A
nd
Lo
gis
tics
Employee Numbers (People)
No. of Companies
Turnover (VAT Excl.)
Total Employee
Fees Insurance
Costs
Total No. of
Employees Investments
Total 62,878 13,242,054 3,683,881 3,023,072 660,808 184,151 829,378
0-9 61,433 3,687,180 676,032 544,414 131,618 94,818 179,697
10-19 782 1,104,041 248,816 204,059 44,757 10,329 17,810
20-49 412 1,552,208 358,757 299,161 59,595 12,139 19,861
50-249 195 2,827,573 712,306 594,116 118,190 20,807 64,567
250+ 56 4,071,052 1,687,970 1,381,321 306,649 46,058 547,443
Table 34: Transport & Logistics Sector Overview - Greece (Elstat, 2018)
No. of Companies Turnover Total Employees Investments
2,520 186033 Thousands of
Euros 4761 10.171 Thousands of Euros
Table 35: Transport & Logistics Turnover in RSA (Elstat, 2017)
Road Transport
Regarding road transport, numerous car and motorcycle rental services exist both local ones
as well as international ones with strong financial presence in the area. The RSA’s islands
offer various road transport services such as: private cars, busses, taxis, motorcycles, bicycles
as well as vans mainly operated by local drivers offering carpooling services. Finally, the
islands of Rhodes and Kos also offer rail services of limited extent for leisure purposes.
The following Table contains all transport companies and organisations offering services
related to the aforementioned ones. These are further classified into public organisations,
private companies and SMEs.
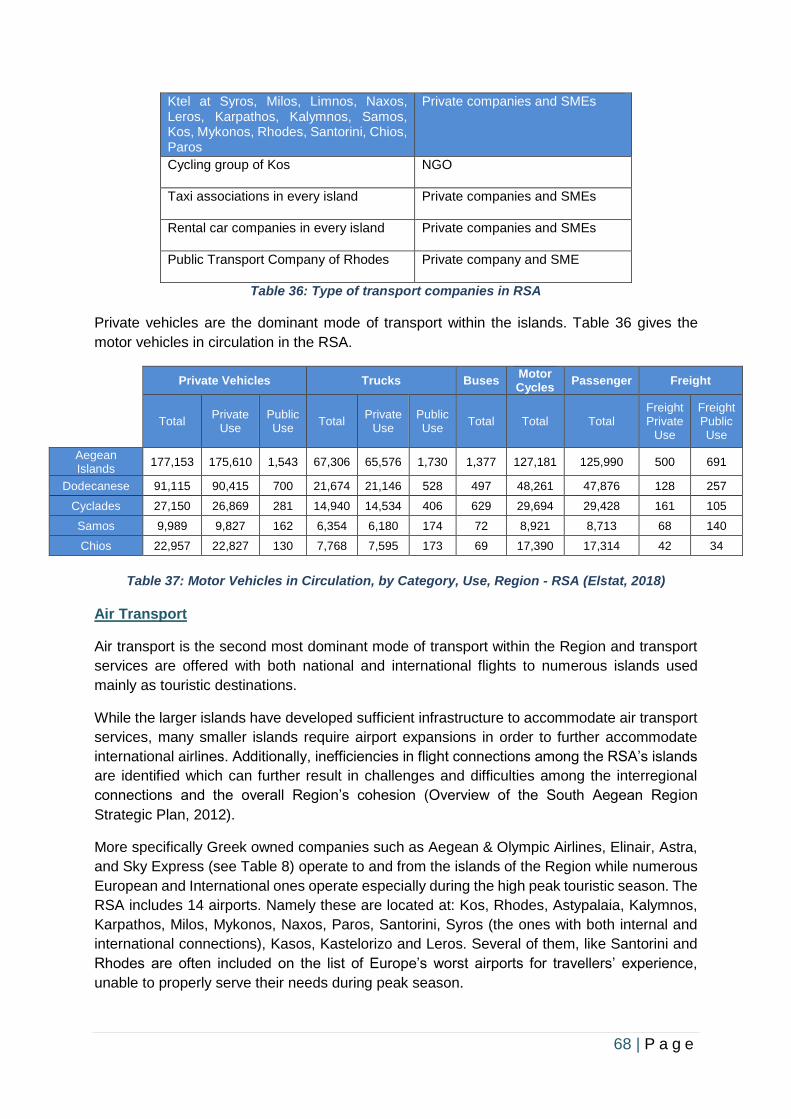
68 | P a g e
Ktel at Syros, Milos, Limnos, Naxos, Leros, Karpathos, Kalymnos, Samos, Kos, Mykonos, Rhodes, Santorini, Chios, Paros
Private companies and SMEs
Cycling group of Kos NGO
Taxi associations in every island Private companies and SMEs
Rental car companies in every island Private companies and SMEs
Public Transport Company of Rhodes Private company and SME
Table 36: Type of transport companies in RSA
Private vehicles are the dominant mode of transport within the islands. Table 36 gives the
motor vehicles in circulation in the RSA.
Private Vehicles Trucks Buses Motor Cycles
Passenger Freight
Total Private
Use Public Use
Total Private
Use Public Use
Total Total Total Freight Private
Use
Freight Public Use
Aegean Islands
177,153 175,610 1,543 67,306 65,576 1,730 1,377 127,181 125,990 500 691
Dodecanese 91,115 90,415 700 21,674 21,146 528 497 48,261 47,876 128 257
Cyclades 27,150 26,869 281 14,940 14,534 406 629 29,694 29,428 161 105
Samos 9,989 9,827 162 6,354 6,180 174 72 8,921 8,713 68 140
Chios 22,957 22,827 130 7,768 7,595 173 69 17,390 17,314 42 34
Table 37: Motor Vehicles in Circulation, by Category, Use, Region - RSA (Elstat, 2018)
Air Transport
Air transport is the second most dominant mode of transport within the Region and transport
services are offered with both national and international flights to numerous islands used
mainly as touristic destinations.
While the larger islands have developed sufficient infrastructure to accommodate air transport
services, many smaller islands require airport expansions in order to further accommodate
international airlines. Additionally, inefficiencies in flight connections among the RSA’s islands
are identified which can further result in challenges and difficulties among the interregional
connections and the overall Region’s cohesion (Overview of the South Aegean Region
Strategic Plan, 2012).
More specifically Greek owned companies such as Aegean & Olympic Airlines, Elinair, Astra,
and Sky Express (see Table 8) operate to and from the islands of the Region while numerous
European and International ones operate especially during the high peak touristic season. The
RSA includes 14 airports. Namely these are located at: Kos, Rhodes, Astypalaia, Kalymnos,
Karpathos, Milos, Mykonos, Naxos, Paros, Santorini, Syros (the ones with both internal and
international connections), Kasos, Kastelorizo and Leros. Several of them, like Santorini and
Rhodes are often included on the list of Europe’s worst airports for travellers’ experience,
unable to properly serve their needs during peak season.
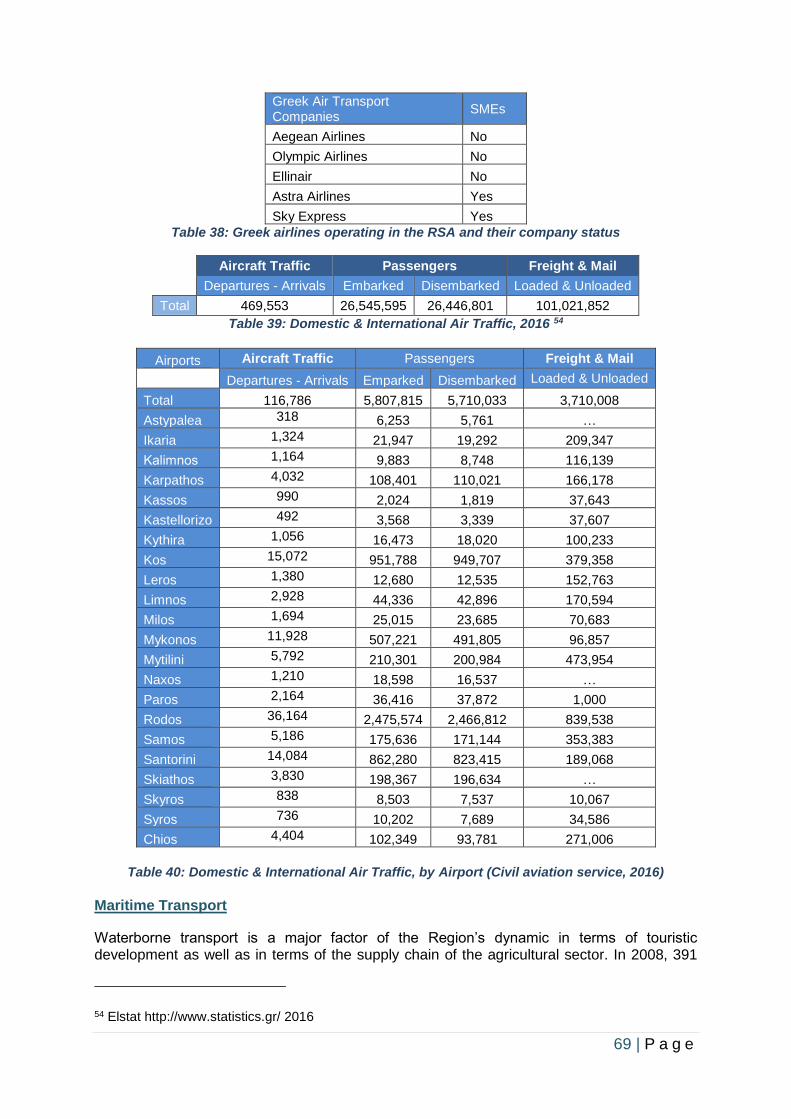
69 | P a g e
Greek Air Transport Companies
SMEs
Aegean Airlines No
Olympic Airlines No
Ellinair No
Astra Airlines Yes
Sky Express Yes
Table 38: Greek airlines operating in the RSA and their company status
Aircraft Traffic Passengers Freight & Mail
Departures - Arrivals Embarked Disembarked Loaded & Unloaded
Total 469,553 26,545,595 26,446,801 101,021,852
Table 39: Domestic & International Air Traffic, 2016 54
Airports Aircraft Traffic Passengers Freight & Mail
Departures - Arrivals Emparked Disembarked Loaded & Unloaded
Total 116,786 5,807,815 5,710,033 3,710,008
Astypalea 318 6,253 5,761 …
Ikaria 1,324 21,947 19,292 209,347
Κalimnos 1,164 9,883 8,748 116,139
Karpathos 4,032 108,401 110,021 166,178
Kassos 990 2,024 1,819 37,643
Kastellorizo 492 3,568 3,339 37,607
Kythira 1,056 16,473 18,020 100,233
Kos 15,072 951,788 949,707 379,358
Leros 1,380 12,680 12,535 152,763
Limnos 2,928 44,336 42,896 170,594
Milos 1,694 25,015 23,685 70,683
Mykonos 11,928 507,221 491,805 96,857
Mytilini 5,792 210,301 200,984 473,954
Naxos 1,210 18,598 16,537 …
Paros 2,164 36,416 37,872 1,000
Rodos 36,164 2,475,574 2,466,812 839,538
Samos 5,186 175,636 171,144 353,383
Santorini 14,084 862,280 823,415 189,068
Skiathos 3,830 198,367 196,634 …
Skyros 838 8,503 7,537 10,067
Syros 736 10,202 7,689 34,586
Chios 4,404 102,349 93,781 271,006
Table 40: Domestic & International Air Traffic, by Airport (Civil aviation service, 2016)
Maritime Transport
Waterborne transport is a major factor of the Region’s dynamic in terms of touristic development as well as in terms of the supply chain of the agricultural sector. In 2008, 391
54 Elstat http://www.statistics.gr/ 2016
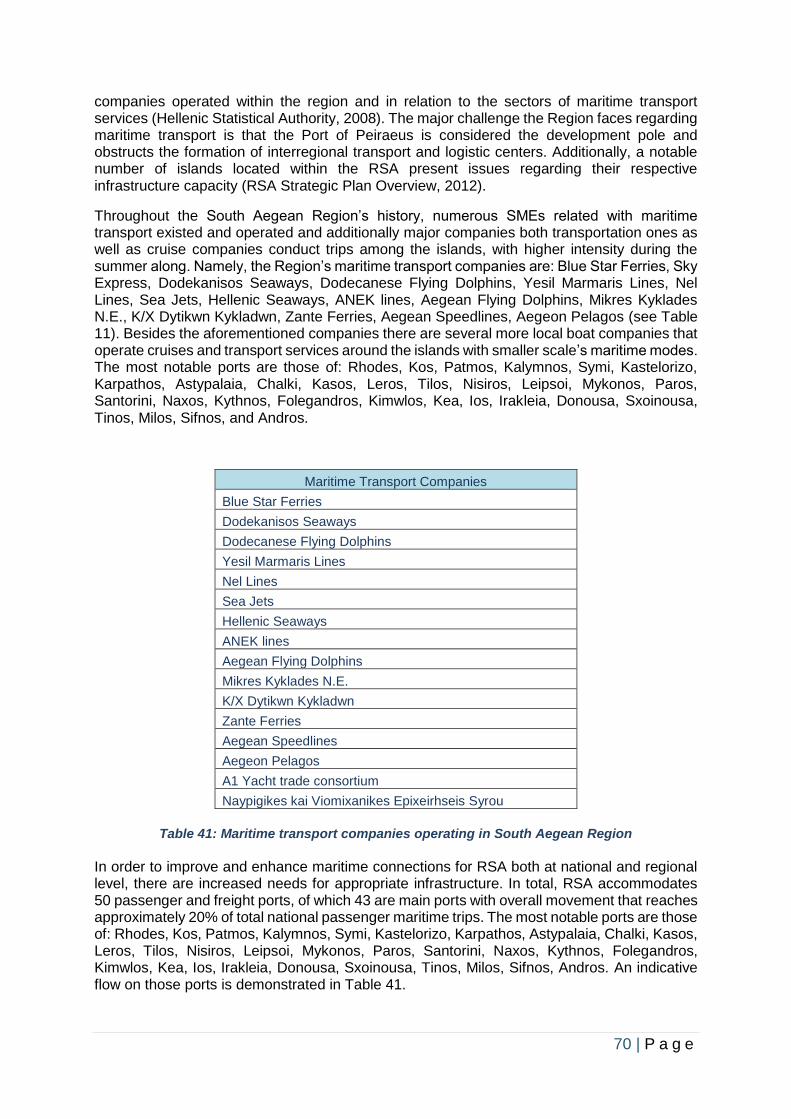
70 | P a g e
companies operated within the region and in relation to the sectors of maritime transport services (Hellenic Statistical Authority, 2008). The major challenge the Region faces regarding maritime transport is that the Port of Peiraeus is considered the development pole and obstructs the formation of interregional transport and logistic centers. Additionally, a notable number of islands located within the RSA present issues regarding their respective infrastructure capacity (RSA Strategic Plan Overview, 2012).
Throughout the South Aegean Region’s history, numerous SMEs related with maritime transport existed and operated and additionally major companies both transportation ones as well as cruise companies conduct trips among the islands, with higher intensity during the summer along. Namely, the Region’s maritime transport companies are: Blue Star Ferries, Sky Express, Dodekanisos Seaways, Dodecanese Flying Dolphins, Yesil Marmaris Lines, Nel Lines, Sea Jets, Hellenic Seaways, ANEK lines, Aegean Flying Dolphins, Mikres Kyklades N.E., K/X Dytikwn Kykladwn, Zante Ferries, Aegean Speedlines, Aegeon Pelagos (see Table 11). Besides the aforementioned companies there are several more local boat companies that operate cruises and transport services around the islands with smaller scale’s maritime modes. The most notable ports are those of: Rhodes, Kos, Patmos, Kalymnos, Symi, Kastelorizo, Karpathos, Astypalaia, Chalki, Kasos, Leros, Tilos, Nisiros, Leipsoi, Mykonos, Paros, Santorini, Naxos, Kythnos, Folegandros, Kimwlos, Kea, Ios, Irakleia, Donousa, Sxoinousa, Tinos, Milos, Sifnos, and Andros.
Maritime Transport Companies
Blue Star Ferries
Dodekanisos Seaways
Dodecanese Flying Dolphins
Yesil Marmaris Lines
Nel Lines
Sea Jets
Hellenic Seaways
ANEK lines
Aegean Flying Dolphins
Mikres Kyklades N.E.
K/X Dytikwn Kykladwn
Zante Ferries
Aegean Speedlines
Aegeon Pelagos
A1 Yacht trade consortium
Naypigikes kai Viomixanikes Epixeirhseis Syrou
Table 41: Maritime transport companies operating in South Aegean Region
In order to improve and enhance maritime connections for RSA both at national and regional level, there are increased needs for appropriate infrastructure. In total, RSA accommodates 50 passenger and freight ports, of which 43 are main ports with overall movement that reaches approximately 20% of total national passenger maritime trips. The most notable ports are those of: Rhodes, Kos, Patmos, Kalymnos, Symi, Kastelorizo, Karpathos, Astypalaia, Chalki, Kasos, Leros, Tilos, Nisiros, Leipsoi, Mykonos, Paros, Santorini, Naxos, Kythnos, Folegandros, Kimwlos, Kea, Ios, Irakleia, Donousa, Sxoinousa, Tinos, Milos, Sifnos, Andros. An indicative flow on those ports is demonstrated in Table 41.
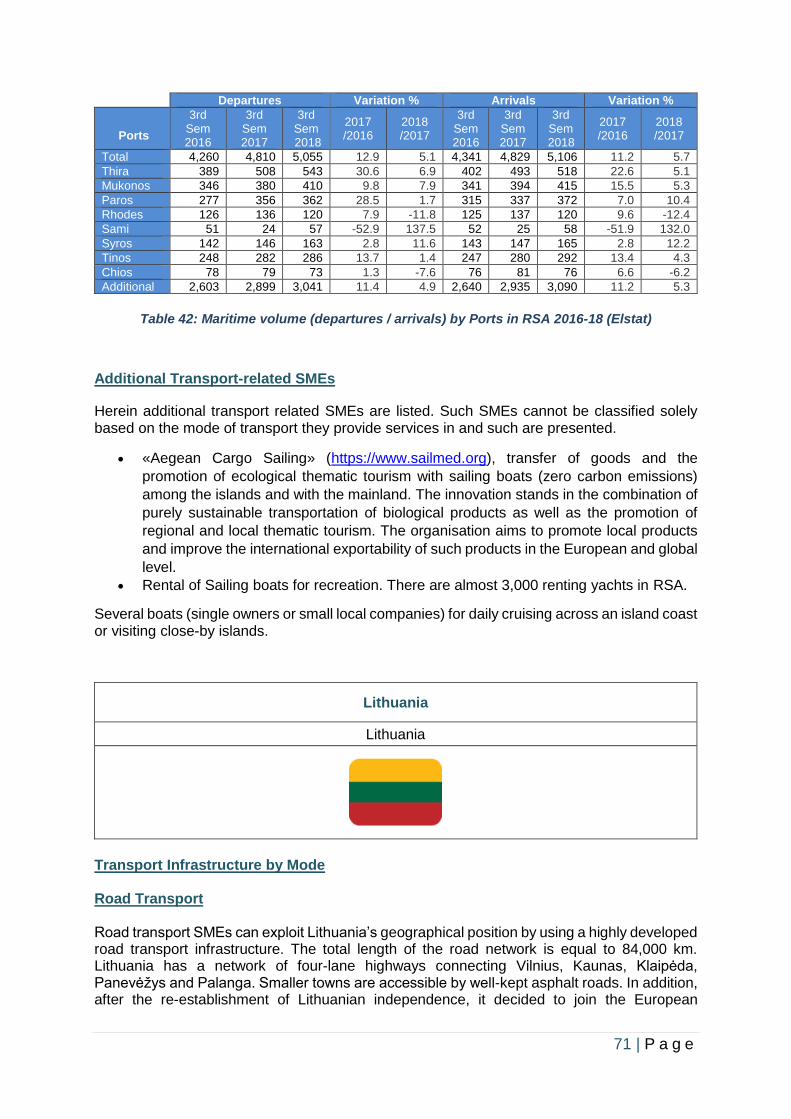
71 | P a g e
Departures Variation % Arrivals Variation %
Ports
3rd Sem 2016
3rd Sem 2017
3rd Sem 2018
2017 /2016
2018 /2017
3rd Sem 2016
3rd Sem 2017
3rd Sem
2018
2017 /2016
2018 /2017
Total 4,260 4,810 5,055 12.9 5.1 4,341 4,829 5,106 11.2 5.7
Thira 389 508 543 30.6 6.9 402 493 518 22.6 5.1
Mukonos 346 380 410 9.8 7.9 341 394 415 15.5 5.3
Paros 277 356 362 28.5 1.7 315 337 372 7.0 10.4
Rhodes 126 136 120 7.9 -11.8 125 137 120 9.6 -12.4
Sami 51 24 57 -52.9 137.5 52 25 58 -51.9 132.0
Syros 142 146 163 2.8 11.6 143 147 165 2.8 12.2
Tinos 248 282 286 13.7 1.4 247 280 292 13.4 4.3
Chios 78 79 73 1.3 -7.6 76 81 76 6.6 -6.2
Additional 2,603 2,899 3,041 11.4 4.9 2,640 2,935 3,090 11.2 5.3
Table 42: Maritime volume (departures / arrivals) by Ports in RSA 2016-18 (Elstat)
Additional Transport-related SMEs
Herein additional transport related SMEs are listed. Such SMEs cannot be classified solely based on the mode of transport they provide services in and such are presented.
• «Aegean Cargo Sailing» (https://www.sailmed.org), transfer of goods and the
promotion of ecological thematic tourism with sailing boats (zero carbon emissions)
among the islands and with the mainland. The innovation stands in the combination of
purely sustainable transportation of biological products as well as the promotion of
regional and local thematic tourism. The organisation aims to promote local products
and improve the international exportability of such products in the European and global
level.
• Rental of Sailing boats for recreation. There are almost 3,000 renting yachts in RSA.
Several boats (single owners or small local companies) for daily cruising across an island coast or visiting close-by islands.
Lithuania
Lithuania
Transport Infrastructure by Mode Road Transport Road transport SMEs can exploit Lithuania’s geographical position by using a highly developed road transport infrastructure. The total length of the road network is equal to 84,000 km. Lithuania has a network of four-lane highways connecting Vilnius, Kaunas, Klaipėda, Panevėžys and Palanga. Smaller towns are accessible by well-kept asphalt roads. In addition, after the re-establishment of Lithuanian independence, it decided to join the European
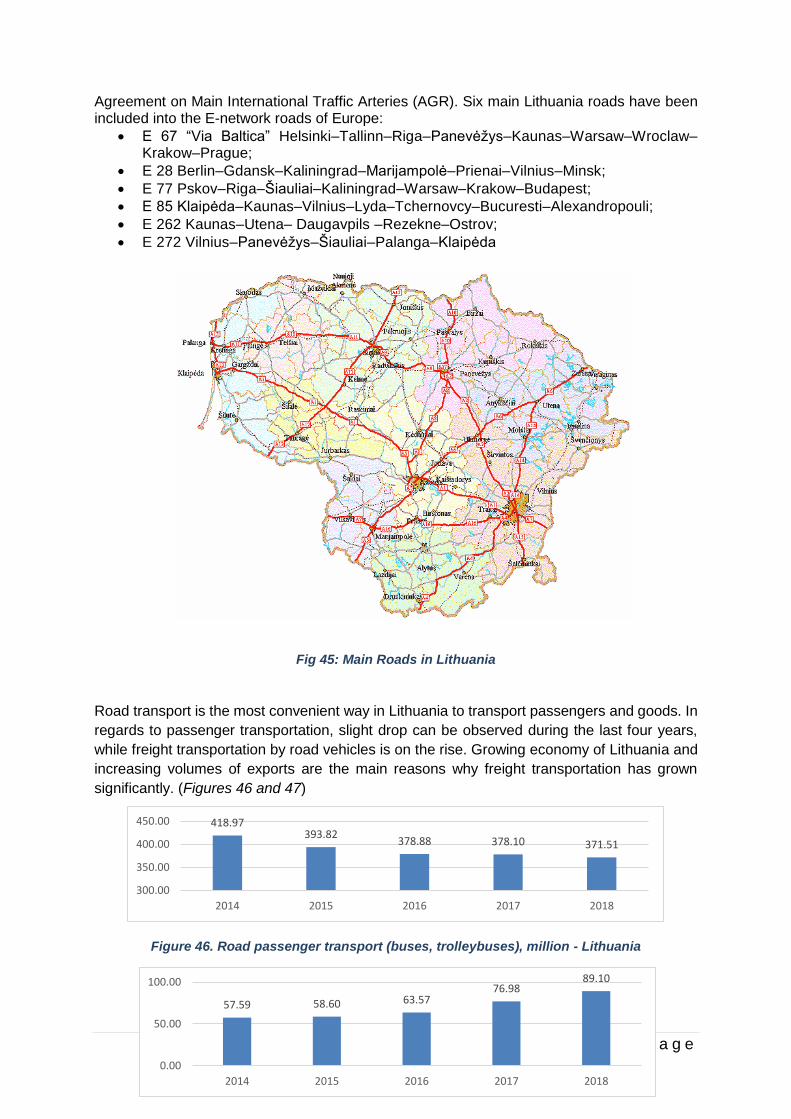
72 | P a g e
Agreement on Main International Traffic Arteries (AGR). Six main Lithuania roads have been included into the E-network roads of Europe:
• E 67 “Via Baltica” Helsinki–Tallinn–Riga–Panevėžys–Kaunas–Warsaw–Wroclaw–Krakow–Prague;
• E 28 Berlin–Gdansk–Kaliningrad–Marijampolė–Prienai–Vilnius–Minsk;
• E 77 Pskov–Riga–Šiauliai–Kaliningrad–Warsaw–Krakow–Budapest;
• E 85 Klaipėda–Kaunas–Vilnius–Lyda–Tchernovcy–Bucuresti–Alexandropouli;
• E 262 Kaunas–Utena– Daugavpils –Rezekne–Ostrov;
• E 272 Vilnius–Panevėžys–Šiauliai–Palanga–Klaipėda
Fig 45: Main Roads in Lithuania
Road transport is the most convenient way in Lithuania to transport passengers and goods. In
regards to passenger transportation, slight drop can be observed during the last four years,
while freight transportation by road vehicles is on the rise. Growing economy of Lithuania and
increasing volumes of exports are the main reasons why freight transportation has grown
significantly. (Figures 46 and 47)
Figure 46. Road passenger transport (buses, trolleybuses), million - Lithuania
418.97393.82
378.88 378.10 371.51
300.00
350.00
400.00
450.00
2014 2015 2016 2017 2018
57.59 58.60 63.5776.98
89.10
0.00
50.00
100.00
2014 2015 2016 2017 2018
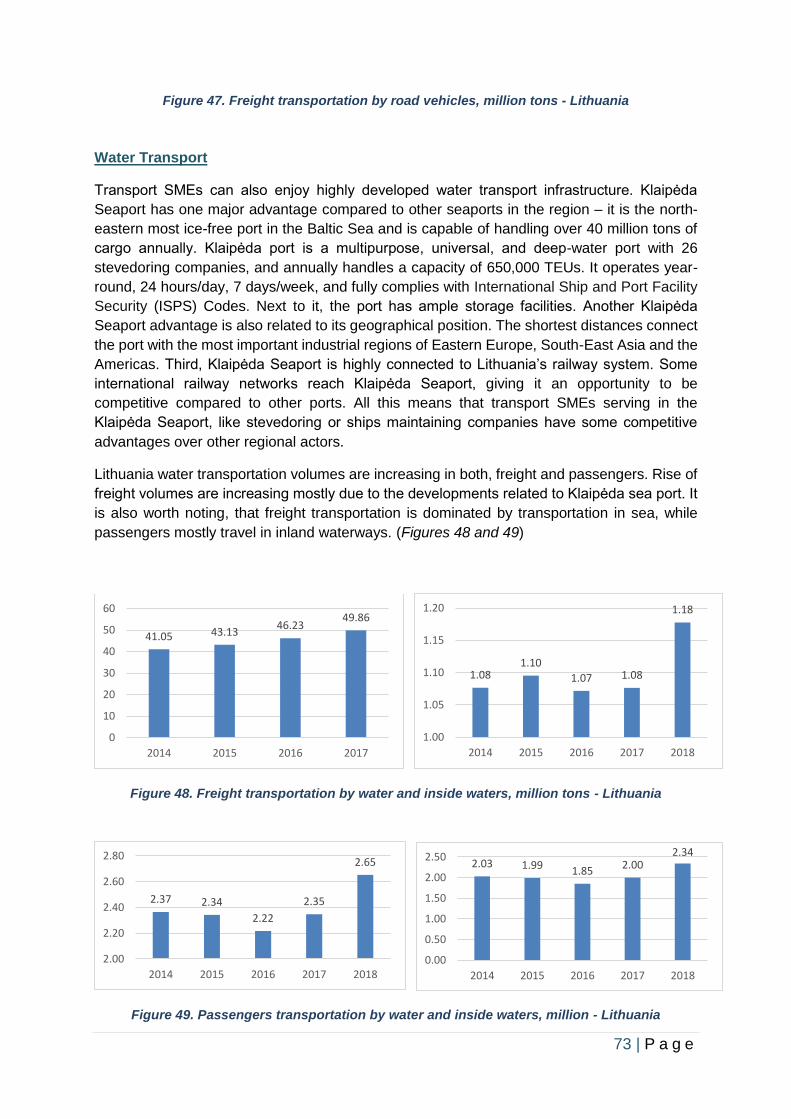
73 | P a g e
1.081.10
1.07 1.08
1.18
1.00
1.05
1.10
1.15
1.20
2014 2015 2016 2017 2018
2.03 1.99 1.852.00
2.34
0.00
0.50
1.00
1.50
2.00
2.50
2014 2015 2016 2017 2018
Figure 47. Freight transportation by road vehicles, million tons - Lithuania
Water Transport
Transport SMEs can also enjoy highly developed water transport infrastructure. Klaipėda
Seaport has one major advantage compared to other seaports in the region – it is the north-
eastern most ice-free port in the Baltic Sea and is capable of handling over 40 million tons of
cargo annually. Klaipėda port is a multipurpose, universal, and deep-water port with 26
stevedoring companies, and annually handles a capacity of 650,000 TEUs. It operates year-
round, 24 hours/day, 7 days/week, and fully complies with International Ship and Port Facility
Security (ISPS) Codes. Next to it, the port has ample storage facilities. Another Klaipėda
Seaport advantage is also related to its geographical position. The shortest distances connect
the port with the most important industrial regions of Eastern Europe, South-East Asia and the
Americas. Third, Klaipėda Seaport is highly connected to Lithuania’s railway system. Some
international railway networks reach Klaipėda Seaport, giving it an opportunity to be
competitive compared to other ports. All this means that transport SMEs serving in the
Klaipėda Seaport, like stevedoring or ships maintaining companies have some competitive
advantages over other regional actors.
Lithuania water transportation volumes are increasing in both, freight and passengers. Rise of
freight volumes are increasing mostly due to the developments related to Klaipėda sea port. It
is also worth noting, that freight transportation is dominated by transportation in sea, while
passengers mostly travel in inland waterways. (Figures 48 and 49)
Figure 48. Freight transportation by water and inside waters, million tons - Lithuania
Figure 49. Passengers transportation by water and inside waters, million - Lithuania
41.05 43.1346.23
49.86
0
10
20
30
40
50
60
2014 2015 2016 2017
2.37 2.34
2.22
2.35
2.65
2.00
2.20
2.40
2.60
2.80
2014 2015 2016 2017 2018
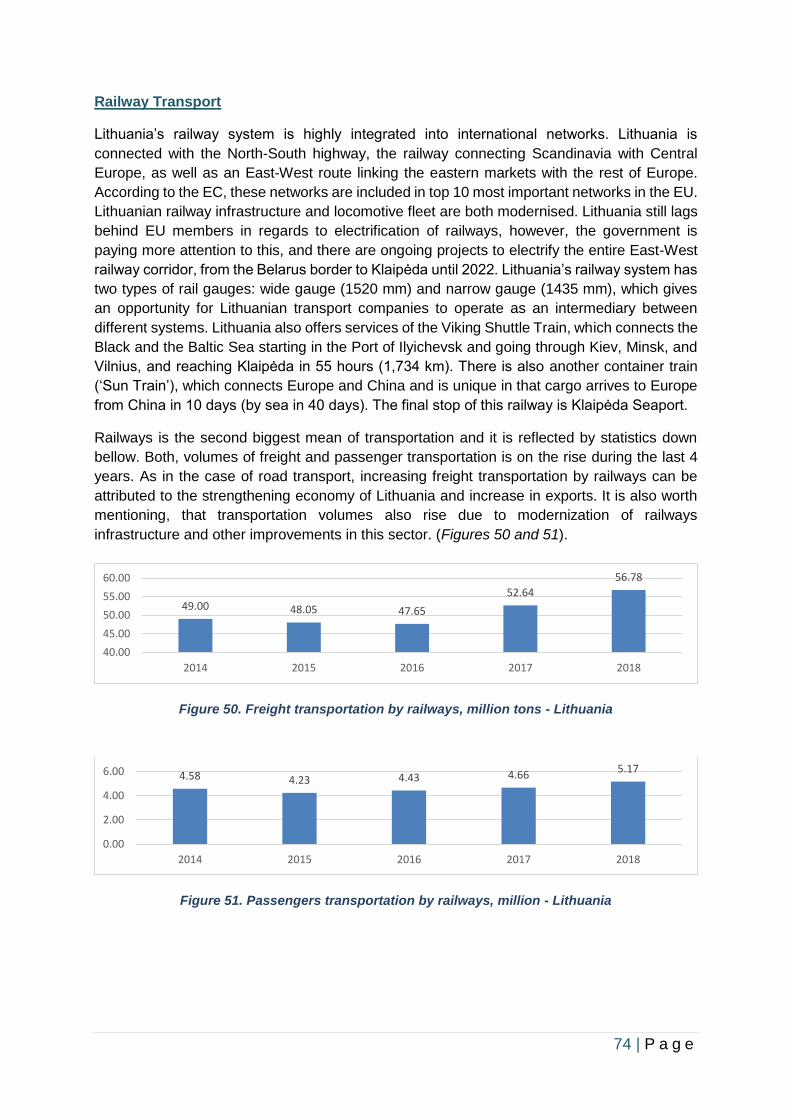
74 | P a g e
Railway Transport
Lithuania’s railway system is highly integrated into international networks. Lithuania is
connected with the North-South highway, the railway connecting Scandinavia with Central
Europe, as well as an East-West route linking the eastern markets with the rest of Europe.
According to the EC, these networks are included in top 10 most important networks in the EU.
Lithuanian railway infrastructure and locomotive fleet are both modernised. Lithuania still lags
behind EU members in regards to electrification of railways, however, the government is
paying more attention to this, and there are ongoing projects to electrify the entire East-West
railway corridor, from the Belarus border to Klaipėda until 2022. Lithuania’s railway system has
two types of rail gauges: wide gauge (1520 mm) and narrow gauge (1435 mm), which gives
an opportunity for Lithuanian transport companies to operate as an intermediary between
different systems. Lithuania also offers services of the Viking Shuttle Train, which connects the
Black and the Baltic Sea starting in the Port of Ilyichevsk and going through Kiev, Minsk, and
Vilnius, and reaching Klaipėda in 55 hours (1,734 km). There is also another container train
(‘Sun Train’), which connects Europe and China and is unique in that cargo arrives to Europe
from China in 10 days (by sea in 40 days). The final stop of this railway is Klaipėda Seaport.
Railways is the second biggest mean of transportation and it is reflected by statistics down
bellow. Both, volumes of freight and passenger transportation is on the rise during the last 4
years. As in the case of road transport, increasing freight transportation by railways can be
attributed to the strengthening economy of Lithuania and increase in exports. It is also worth
mentioning, that transportation volumes also rise due to modernization of railways
infrastructure and other improvements in this sector. (Figures 50 and 51).
Figure 50. Freight transportation by railways, million tons - Lithuania
Figure 51. Passengers transportation by railways, million - Lithuania
49.00 48.05 47.65
52.64
56.78
40.00
45.00
50.00
55.00
60.00
2014 2015 2016 2017 2018
4.58 4.23 4.43 4.665.17
0.00
2.00
4.00
6.00
2014 2015 2016 2017 2018
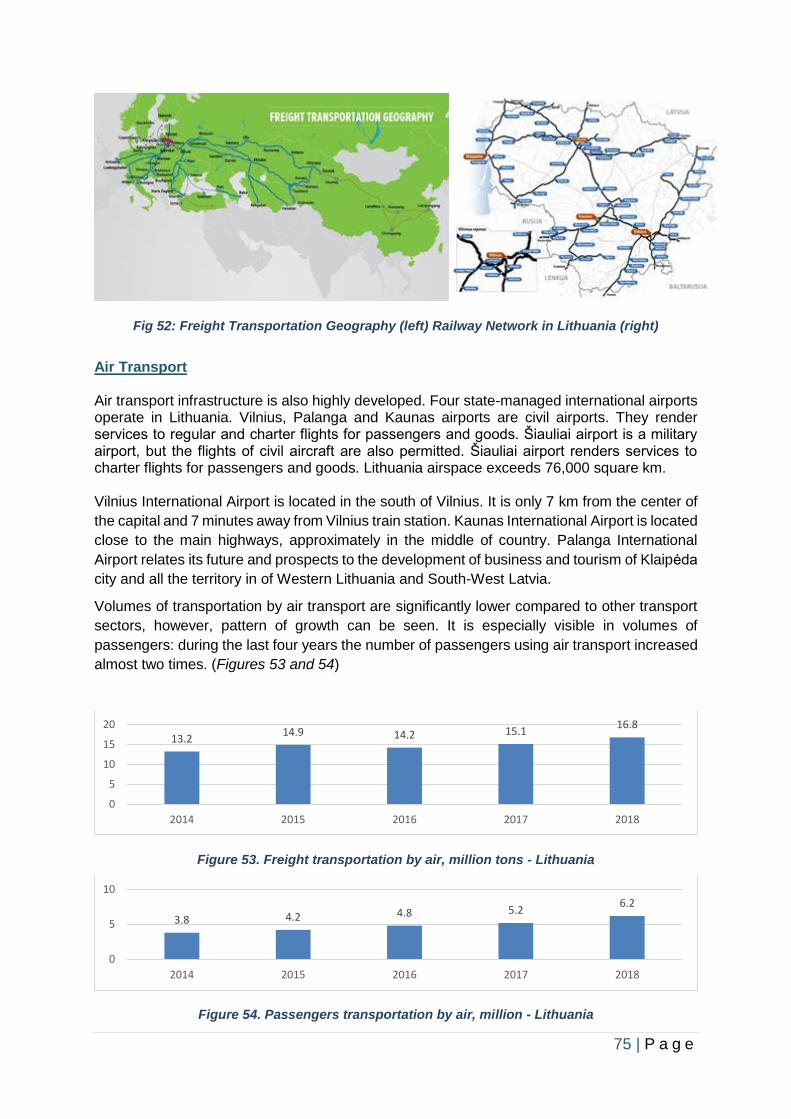
75 | P a g e
Fig 52: Freight Transportation Geography (left) Railway Network in Lithuania (right)
Air Transport Air transport infrastructure is also highly developed. Four state-managed international airports operate in Lithuania. Vilnius, Palanga and Kaunas airports are civil airports. They render services to regular and charter flights for passengers and goods. Šiauliai airport is a military airport, but the flights of civil aircraft are also permitted. Šiauliai airport renders services to charter flights for passengers and goods. Lithuania airspace exceeds 76,000 square km. Vilnius International Airport is located in the south of Vilnius. It is only 7 km from the center of
the capital and 7 minutes away from Vilnius train station. Kaunas International Airport is located
close to the main highways, approximately in the middle of country. Palanga International
Airport relates its future and prospects to the development of business and tourism of Klaipėda
city and all the territory in of Western Lithuania and South-West Latvia.
Volumes of transportation by air transport are significantly lower compared to other transport
sectors, however, pattern of growth can be seen. It is especially visible in volumes of
passengers: during the last four years the number of passengers using air transport increased
almost two times. (Figures 53 and 54)
Figure 53. Freight transportation by air, million tons - Lithuania
Figure 54. Passengers transportation by air, million - Lithuania
13.214.9 14.2 15.1
16.8
0
5
10
15
20
2014 2015 2016 2017 2018
3.8 4.2 4.8 5.26.2
0
5
10
2014 2015 2016 2017 2018
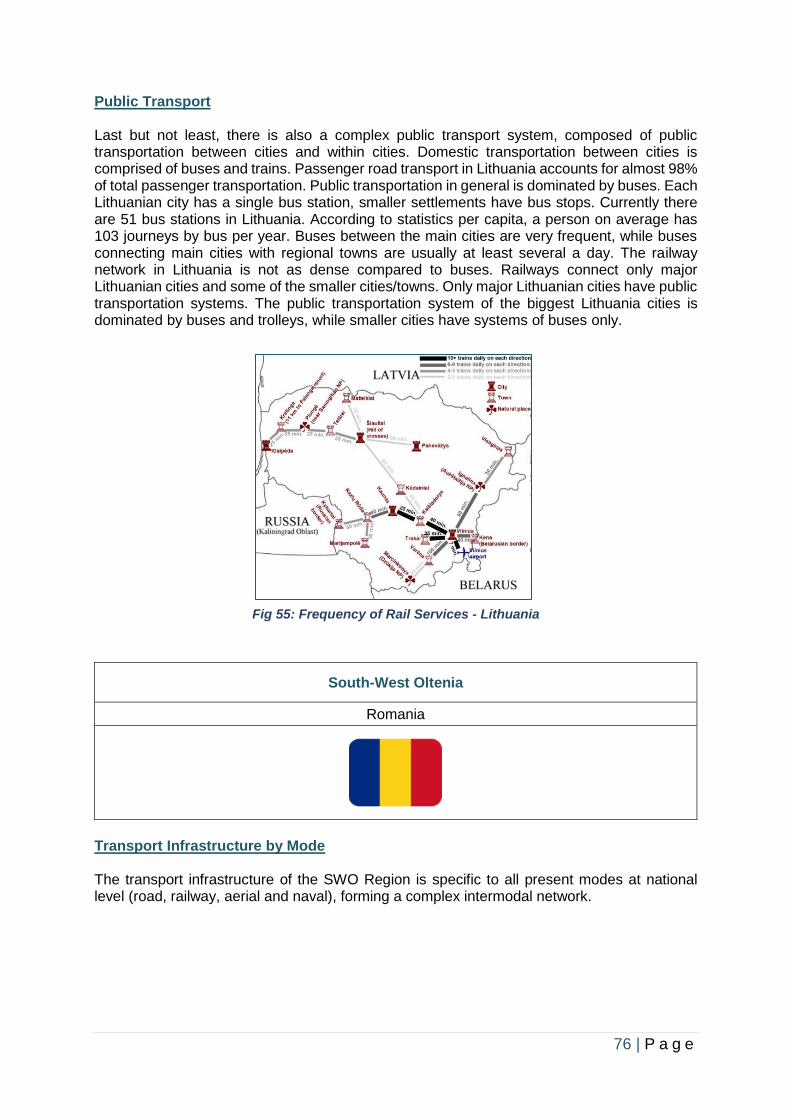
76 | P a g e
Public Transport Last but not least, there is also a complex public transport system, composed of public transportation between cities and within cities. Domestic transportation between cities is comprised of buses and trains. Passenger road transport in Lithuania accounts for almost 98% of total passenger transportation. Public transportation in general is dominated by buses. Each Lithuanian city has a single bus station, smaller settlements have bus stops. Currently there are 51 bus stations in Lithuania. According to statistics per capita, a person on average has 103 journeys by bus per year. Buses between the main cities are very frequent, while buses connecting main cities with regional towns are usually at least several a day. The railway network in Lithuania is not as dense compared to buses. Railways connect only major Lithuanian cities and some of the smaller cities/towns. Only major Lithuanian cities have public transportation systems. The public transportation system of the biggest Lithuania cities is dominated by buses and trolleys, while smaller cities have systems of buses only.
Fig 55: Frequency of Rail Services - Lithuania
South-West Oltenia
Romania
Transport Infrastructure by Mode The transport infrastructure of the SWO Region is specific to all present modes at national level (road, railway, aerial and naval), forming a complex intermodal network.
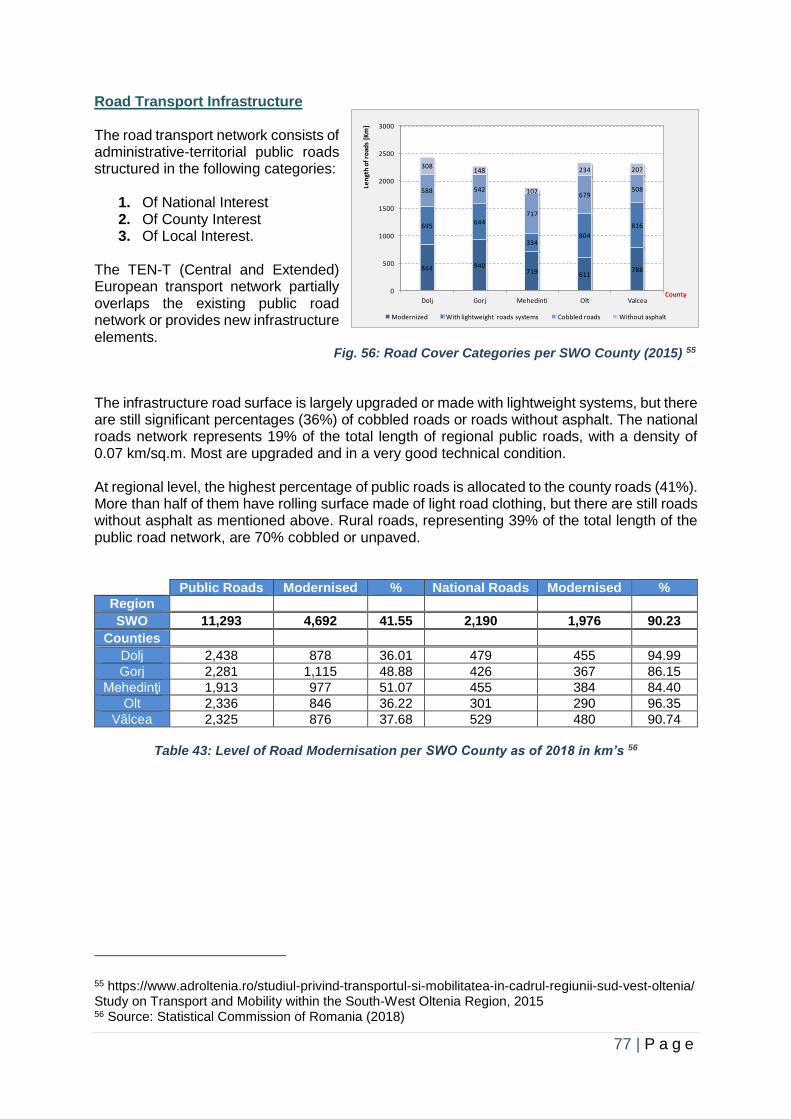
77 | P a g e
Road Transport Infrastructure The road transport network consists of administrative-territorial public roads structured in the following categories:
1. Of National Interest 2. Of County Interest 3. Of Local Interest.
The TEN-T (Central and Extended) European transport network partially overlaps the existing public road network or provides new infrastructure elements.
Fig. 56: Road Cover Categories per SWO County (2015) 55 The infrastructure road surface is largely upgraded or made with lightweight systems, but there are still significant percentages (36%) of cobbled roads or roads without asphalt. The national roads network represents 19% of the total length of regional public roads, with a density of 0.07 km/sq.m. Most are upgraded and in a very good technical condition. At regional level, the highest percentage of public roads is allocated to the county roads (41%). More than half of them have rolling surface made of light road clothing, but there are still roads without asphalt as mentioned above. Rural roads, representing 39% of the total length of the public road network, are 70% cobbled or unpaved.
Public Roads Modernised % National Roads Modernised %
Region
SWO 11,293 4,692 41.55 2,190 1,976 90.23
Counties
Dolj 2,438 878 36.01 479 455 94.99
Gorj 2,281 1,115 48.88 426 367 86.15
Mehedinţi 1,913 977 51.07 455 384 84.40
Olt 2,336 846 36.22 301 290 96.35
Vâlcea 2,325 876 37.68 529 480 90.74
Table 43: Level of Road Modernisation per SWO County as of 2018 in km’s 56
55 https://www.adroltenia.ro/studiul-privind-transportul-si-mobilitatea-in-cadrul-regiunii-sud-vest-oltenia/ Study on Transport and Mobility within the South-West Oltenia Region, 2015 56 Source: Statistical Commission of Romania (2018)
844 940719 611
788
695644
334804
816
588 542
717
679508
308148
102
234 207
0
500
1000
1500
2000
2500
3000
Dolj Gorj Mehedinti Olt Valcea
Len
gth
of
road
s [K
m]
County
Modernized With lightweight roads systems Cobbled roads Without asphalt
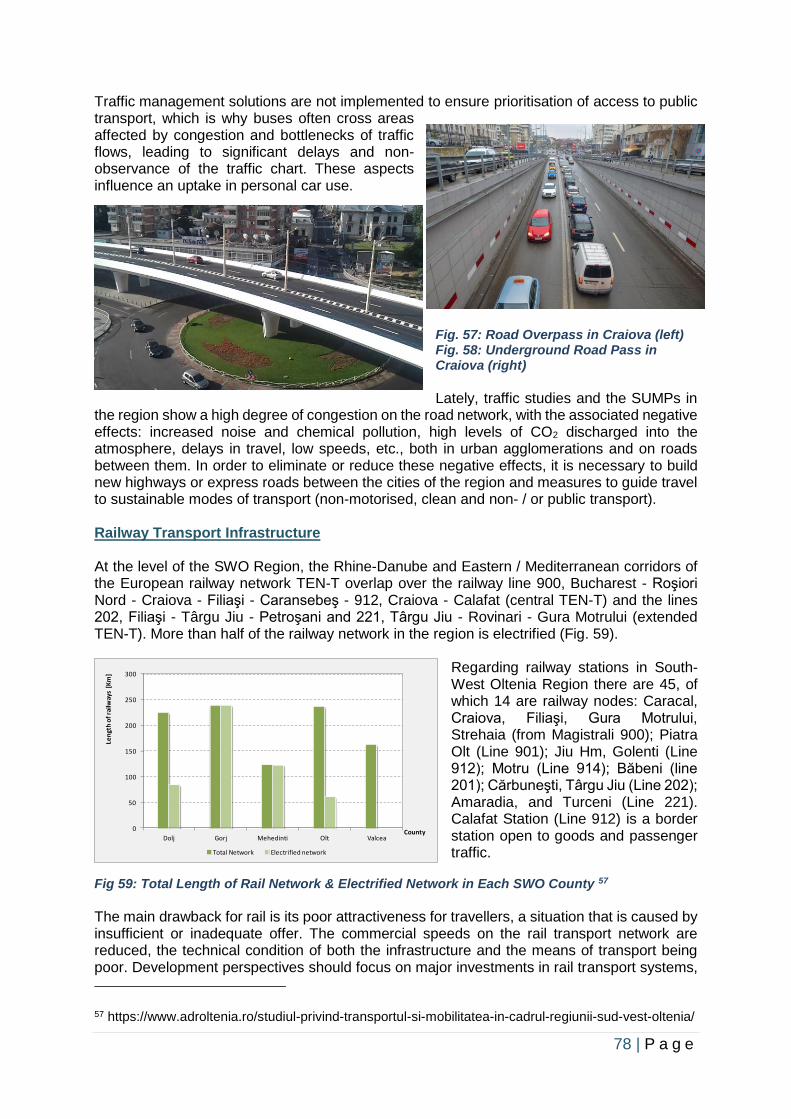
78 | P a g e
Traffic management solutions are not implemented to ensure prioritisation of access to public transport, which is why buses often cross areas affected by congestion and bottlenecks of traffic flows, leading to significant delays and non-observance of the traffic chart. These aspects influence an uptake in personal car use.
Fig. 57: Road Overpass in Craiova (left) Fig. 58: Underground Road Pass in Craiova (right)
Lately, traffic studies and the SUMPs in
the region show a high degree of congestion on the road network, with the associated negative effects: increased noise and chemical pollution, high levels of CO2 discharged into the atmosphere, delays in travel, low speeds, etc., both in urban agglomerations and on roads between them. In order to eliminate or reduce these negative effects, it is necessary to build new highways or express roads between the cities of the region and measures to guide travel to sustainable modes of transport (non-motorised, clean and non- / or public transport). Railway Transport Infrastructure At the level of the SWO Region, the Rhine-Danube and Eastern / Mediterranean corridors of the European railway network TEN-T overlap over the railway line 900, Bucharest - Roşiori Nord - Craiova - Filiaşi - Caransebeş - 912, Craiova - Calafat (central TEN-T) and the lines 202, Filiaşi - Târgu Jiu - Petroşani and 221, Târgu Jiu - Rovinari - Gura Motrului (extended TEN-T). More than half of the railway network in the region is electrified (Fig. 59).
Regarding railway stations in South-West Oltenia Region there are 45, of which 14 are railway nodes: Caracal, Craiova, Filiaşi, Gura Motrului, Strehaia (from Magistrali 900); Piatra Olt (Line 901); Jiu Hm, Golenti (Line 912); Motru (Line 914); Băbeni (line 201); Cărbuneşti, Târgu Jiu (Line 202); Amaradia, and Turceni (Line 221). Calafat Station (Line 912) is a border station open to goods and passenger traffic.
Fig 59: Total Length of Rail Network & Electrified Network in Each SWO County 57 The main drawback for rail is its poor attractiveness for travellers, a situation that is caused by insufficient or inadequate offer. The commercial speeds on the rail transport network are reduced, the technical condition of both the infrastructure and the means of transport being poor. Development perspectives should focus on major investments in rail transport systems,
57 https://www.adroltenia.ro/studiul-privind-transportul-si-mobilitatea-in-cadrul-regiunii-sud-vest-oltenia/
0
50
100
150
200
250
300
Dolj Gorj Mehedinti Olt Valcea
Len
gth
of
railw
ays
[Km
]
County
Total Network Electrified network
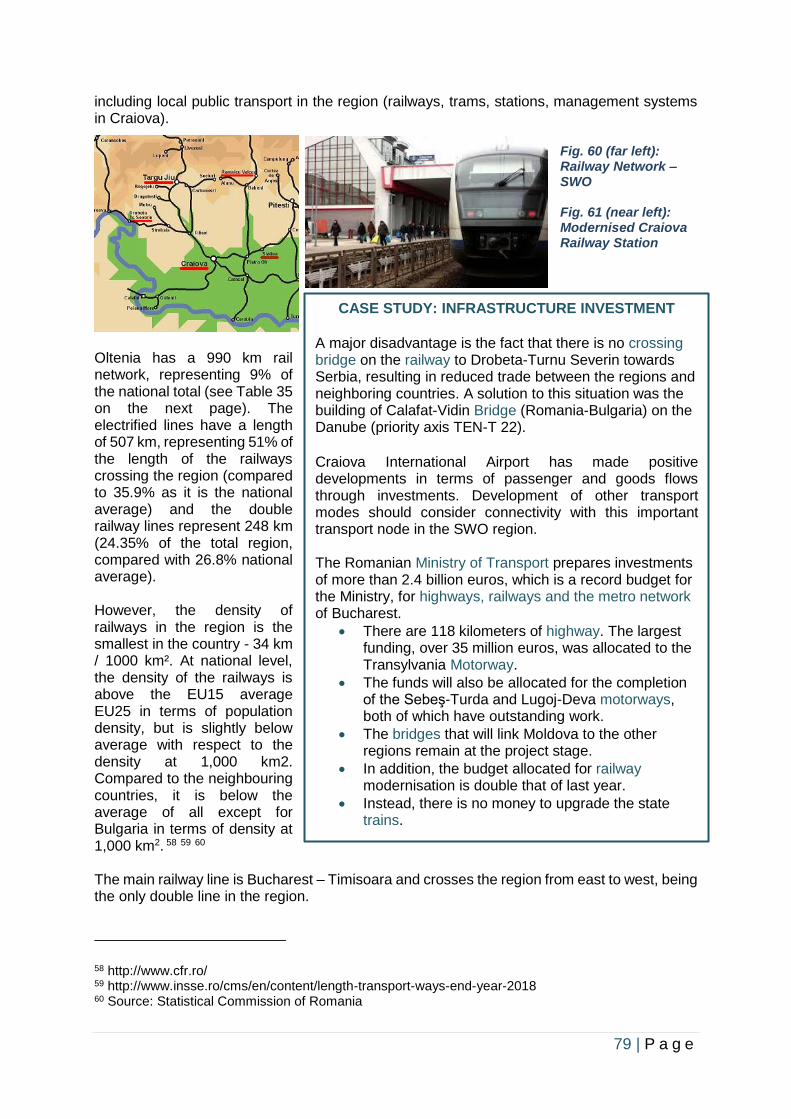
79 | P a g e
including local public transport in the region (railways, trams, stations, management systems in Craiova).
Fig. 60 (far left): Railway Network – SWO Fig. 61 (near left): Modernised Craiova Railway Station
Oltenia has a 990 km rail network, representing 9% of the national total (see Table 35 on the next page). The electrified lines have a length of 507 km, representing 51% of the length of the railways crossing the region (compared to 35.9% as it is the national average) and the double railway lines represent 248 km (24.35% of the total region, compared with 26.8% national average). However, the density of railways in the region is the smallest in the country - 34 km / 1000 km². At national level, the density of the railways is above the EU15 average EU25 in terms of population density, but is slightly below average with respect to the density at 1,000 km2. Compared to the neighbouring countries, it is below the average of all except for Bulgaria in terms of density at 1,000 km2. 58 59 60 The main railway line is Bucharest – Timisoara and crosses the region from east to west, being the only double line in the region.
58 http://www.cfr.ro/ 59 http://www.insse.ro/cms/en/content/length-transport-ways-end-year-2018 60 Source: Statistical Commission of Romania
CASE STUDY: INFRASTRUCTURE INVESTMENT A major disadvantage is the fact that there is no crossing bridge on the railway to Drobeta-Turnu Severin towards Serbia, resulting in reduced trade between the regions and neighboring countries. A solution to this situation was the building of Calafat-Vidin Bridge (Romania-Bulgaria) on the Danube (priority axis TEN-T 22). Craiova International Airport has made positive developments in terms of passenger and goods flows through investments. Development of other transport modes should consider connectivity with this important transport node in the SWO region. The Romanian Ministry of Transport prepares investments of more than 2.4 billion euros, which is a record budget for the Ministry, for highways, railways and the metro network of Bucharest.
• There are 118 kilometers of highway. The largest funding, over 35 million euros, was allocated to the Transylvania Motorway.
• The funds will also be allocated for the completion of the Sebeş-Turda and Lugoj-Deva motorways, both of which have outstanding work.
• The bridges that will link Moldova to the other regions remain at the project stage.
• In addition, the budget allocated for railway modernisation is double that of last year.
• Instead, there is no money to upgrade the state trains.
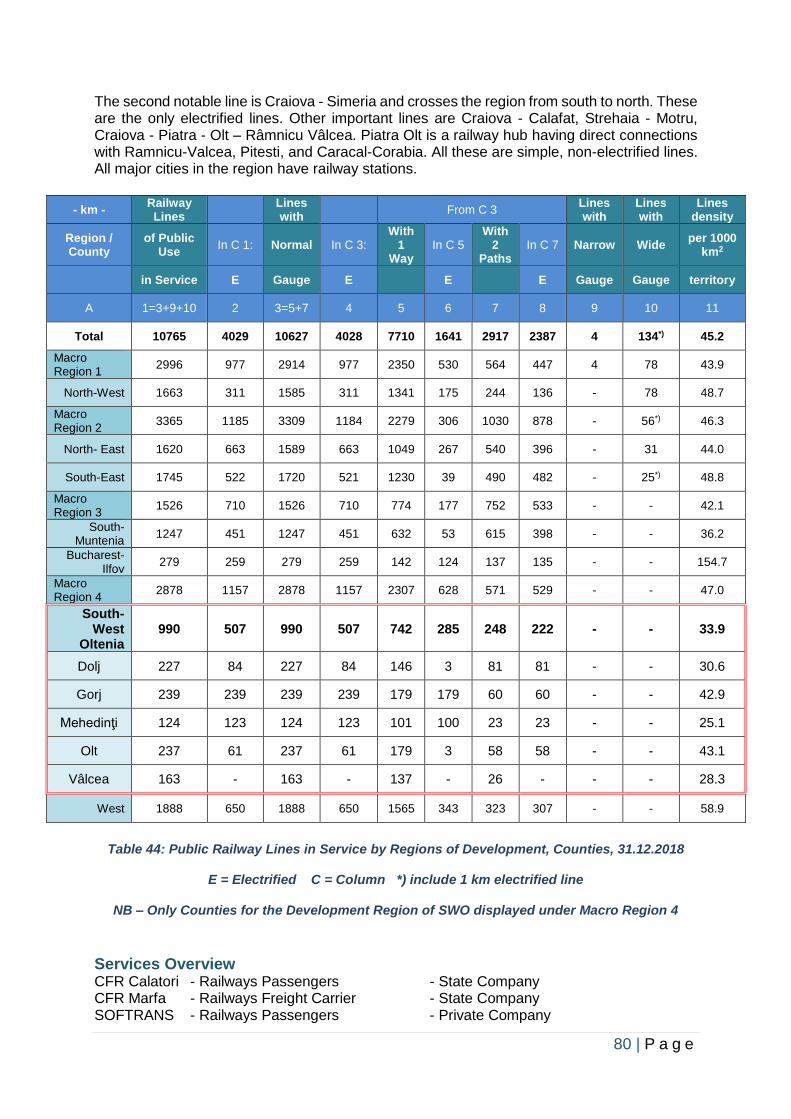
80 | P a g e
The second notable line is Craiova - Simeria and crosses the region from south to north. These are the only electrified lines. Other important lines are Craiova - Calafat, Strehaia - Motru, Craiova - Piatra - Olt – Râmnicu Vâlcea. Piatra Olt is a railway hub having direct connections with Ramnicu-Valcea, Pitesti, and Caracal-Corabia. All these are simple, non-electrified lines. All major cities in the region have railway stations.
- km - Railway Lines
Lines with
From C 3 Lines with
Lines with
Lines density
Region / County
of Public Use
In C 1: Normal In C 3: With
1 Way
In C 5 With
2 Paths
In C 7 Narrow Wide per 1000
km2
in Service E Gauge E E E Gauge Gauge territory
A 1=3+9+10 2 3=5+7 4 5 6 7 8 9 10 11
Total 10765 4029 10627 4028 7710 1641 2917 2387 4 134*) 45.2
Macro Region 1
2996 977 2914 977 2350 530 564 447 4 78 43.9
North-West 1663 311 1585 311 1341 175 244 136 - 78 48.7
Macro Region 2
3365 1185 3309 1184 2279 306 1030 878 - 56*) 46.3
North- East 1620 663 1589 663 1049 267 540 396 - 31 44.0
South-East 1745 522 1720 521 1230 39 490 482 - 25*) 48.8
Macro Region 3
1526 710 1526 710 774 177 752 533 - - 42.1
South-Muntenia
1247 451 1247 451 632 53 615 398 - - 36.2
Bucharest-Ilfov
279 259 279 259 142 124 137 135 - - 154.7
Macro Region 4
2878 1157 2878 1157 2307 628 571 529 - - 47.0
South-West
Oltenia 990 507 990 507 742 285 248 222 - - 33.9
Dolj 227 84 227 84 146 3 81 81 - - 30.6
Gorj 239 239 239 239 179 179 60 60 - - 42.9
Mehedinţi 124 123 124 123 101 100 23 23 - - 25.1
Olt 237 61 237 61 179 3 58 58 - - 43.1
Vâlcea 163 - 163 - 137 - 26 - - - 28.3
West 1888 650 1888 650 1565 343 323 307 - - 58.9
Table 44: Public Railway Lines in Service by Regions of Development, Counties, 31.12.2018
E = Electrified C = Column *) include 1 km electrified line
NB – Only Counties for the Development Region of SWO displayed under Macro Region 4
Services Overview CFR Calatori - Railways Passengers - State Company CFR Marfa - Railways Freight Carrier - State Company SOFTRANS - Railways Passengers - Private Company
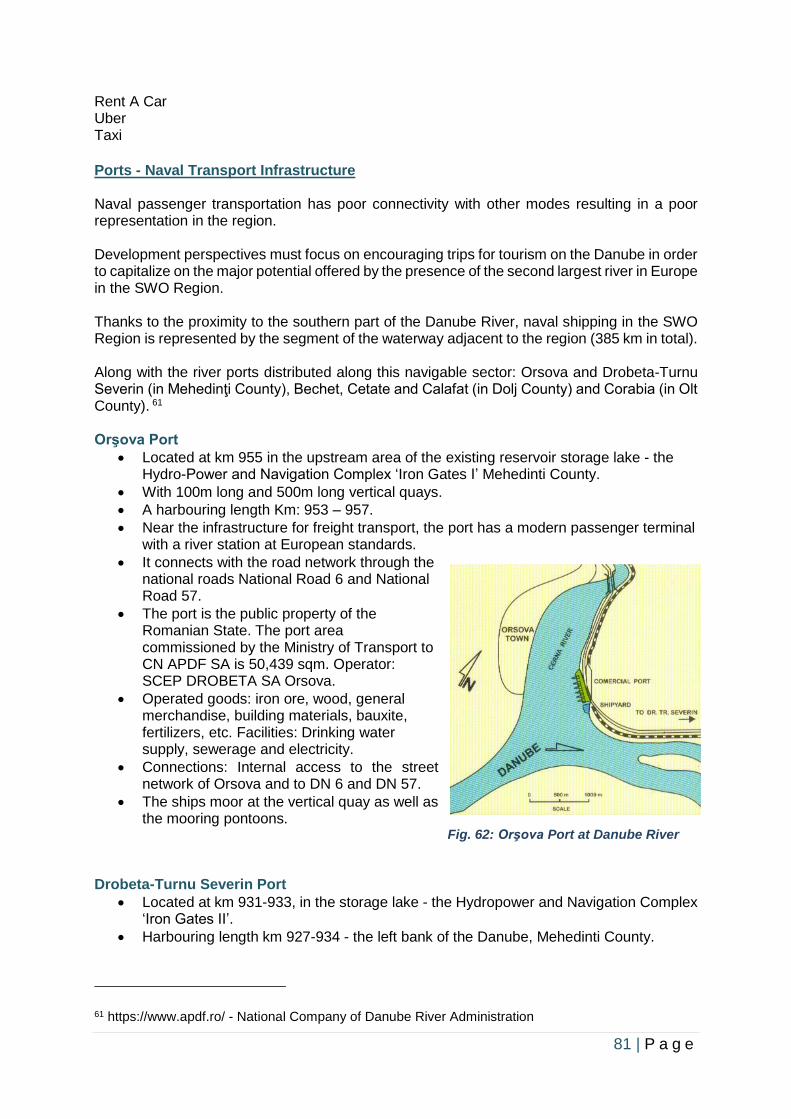
81 | P a g e
Rent A Car Uber Taxi
Ports - Naval Transport Infrastructure Naval passenger transportation has poor connectivity with other modes resulting in a poor representation in the region. Development perspectives must focus on encouraging trips for tourism on the Danube in order to capitalize on the major potential offered by the presence of the second largest river in Europe in the SWO Region. Thanks to the proximity to the southern part of the Danube River, naval shipping in the SWO Region is represented by the segment of the waterway adjacent to the region (385 km in total). Along with the river ports distributed along this navigable sector: Orsova and Drobeta-Turnu Severin (in Mehedinţi County), Bechet, Cetate and Calafat (in Dolj County) and Corabia (in Olt County). 61 Orşova Port
• Located at km 955 in the upstream area of the existing reservoir storage lake - the Hydro-Power and Navigation Complex ‘Iron Gates I’ Mehedinti County.
• With 100m long and 500m long vertical quays.
• A harbouring length Km: 953 – 957.
• Near the infrastructure for freight transport, the port has a modern passenger terminal with a river station at European standards.
• It connects with the road network through the national roads National Road 6 and National Road 57.
• The port is the public property of the Romanian State. The port area commissioned by the Ministry of Transport to CN APDF SA is 50,439 sqm. Operator: SCEP DROBETA SA Orsova.
• Operated goods: iron ore, wood, general merchandise, building materials, bauxite, fertilizers, etc. Facilities: Drinking water supply, sewerage and electricity.
• Connections: Internal access to the street network of Orsova and to DN 6 and DN 57.
• The ships moor at the vertical quay as well as the mooring pontoons.
Fig. 62: Orşova Port at Danube River Drobeta-Turnu Severin Port
• Located at km 931-933, in the storage lake - the Hydropower and Navigation Complex ‘Iron Gates II’.
• Harbouring length km 927-934 - the left bank of the Danube, Mehedinti County.
61 https://www.apdf.ro/ - National Company of Danube River Administration
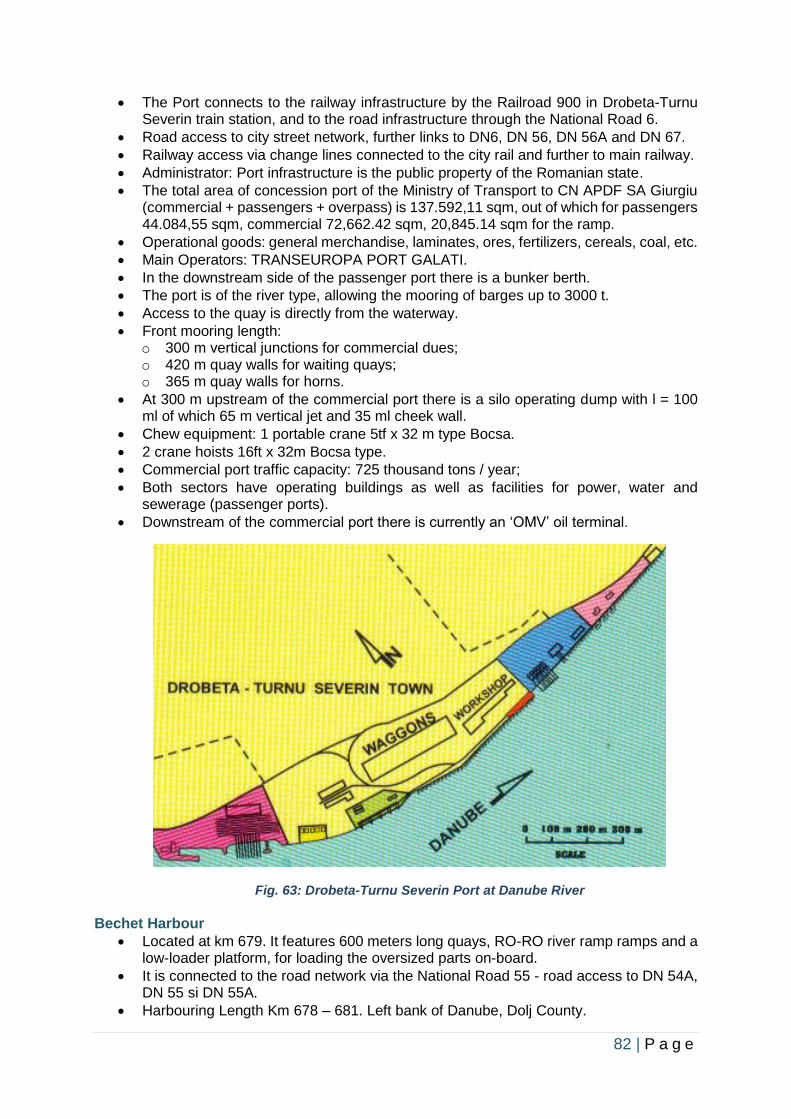
82 | P a g e
• The Port connects to the railway infrastructure by the Railroad 900 in Drobeta-Turnu Severin train station, and to the road infrastructure through the National Road 6.
• Road access to city street network, further links to DN6, DN 56, DN 56A and DN 67.
• Railway access via change lines connected to the city rail and further to main railway.
• Administrator: Port infrastructure is the public property of the Romanian state.
• The total area of concession port of the Ministry of Transport to CN APDF SA Giurgiu (commercial + passengers + overpass) is 137.592,11 sqm, out of which for passengers 44.084,55 sqm, commercial 72,662.42 sqm, 20,845.14 sqm for the ramp.
• Operational goods: general merchandise, laminates, ores, fertilizers, cereals, coal, etc.
• Main Operators: TRANSEUROPA PORT GALATI.
• In the downstream side of the passenger port there is a bunker berth.
• The port is of the river type, allowing the mooring of barges up to 3000 t.
• Access to the quay is directly from the waterway.
• Front mooring length: o 300 m vertical junctions for commercial dues; o 420 m quay walls for waiting quays; o 365 m quay walls for horns.
• At 300 m upstream of the commercial port there is a silo operating dump with l = 100 ml of which 65 m vertical jet and 35 ml cheek wall.
• Chew equipment: 1 portable crane 5tf x 32 m type Bocsa.
• 2 crane hoists 16ft x 32m Bocsa type.
• Commercial port traffic capacity: 725 thousand tons / year;
• Both sectors have operating buildings as well as facilities for power, water and sewerage (passenger ports).
• Downstream of the commercial port there is currently an ‘OMV’ oil terminal.
Fig. 63: Drobeta-Turnu Severin Port at Danube River
Bechet Harbour
• Located at km 679. It features 600 meters long quays, RO-RO river ramp ramps and a low-loader platform, for loading the oversized parts on-board.
• It is connected to the road network via the National Road 55 - road access to DN 54A, DN 55 si DN 55A.
• Harbouring Length Km 678 – 681. Left bank of Danube, Dolj County.
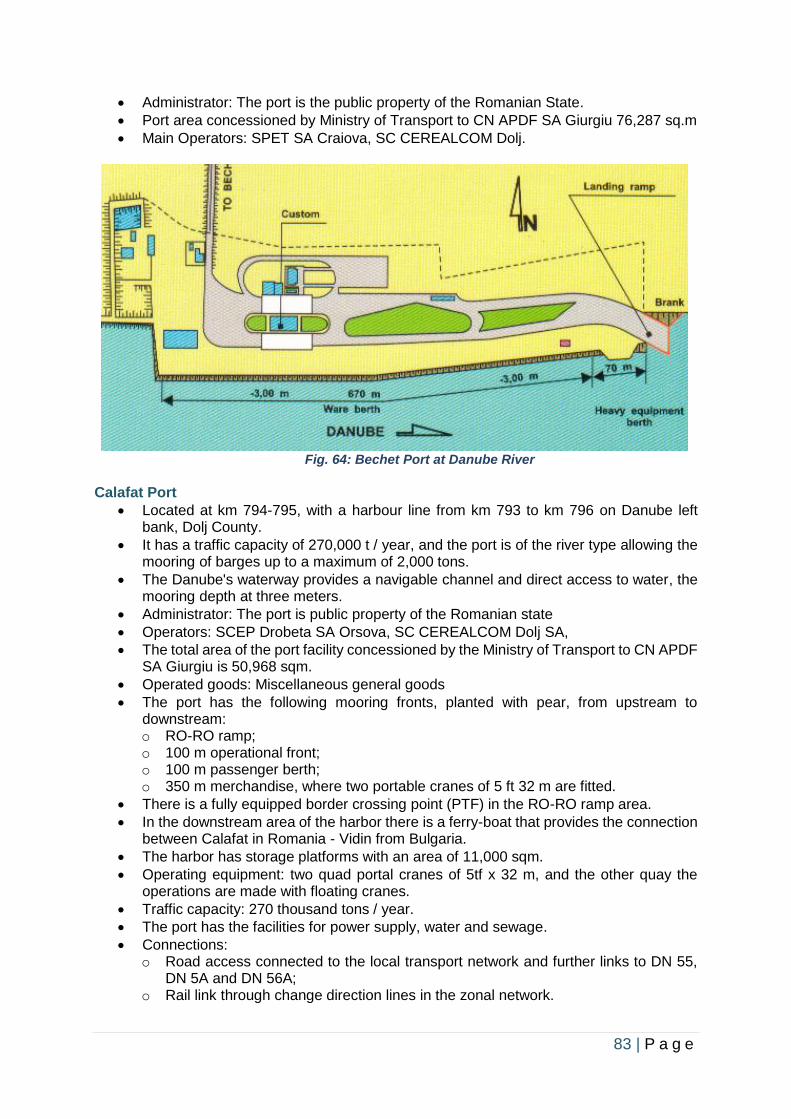
83 | P a g e
• Administrator: The port is the public property of the Romanian State.
• Port area concessioned by Ministry of Transport to CN APDF SA Giurgiu 76,287 sq.m
• Main Operators: SPET SA Craiova, SC CEREALCOM Dolj.
Fig. 64: Bechet Port at Danube River Calafat Port
• Located at km 794-795, with a harbour line from km 793 to km 796 on Danube left bank, Dolj County.
• It has a traffic capacity of 270,000 t / year, and the port is of the river type allowing the mooring of barges up to a maximum of 2,000 tons.
• The Danube's waterway provides a navigable channel and direct access to water, the mooring depth at three meters.
• Administrator: The port is public property of the Romanian state
• Operators: SCEP Drobeta SA Orsova, SC CEREALCOM Dolj SA,
• The total area of the port facility concessioned by the Ministry of Transport to CN APDF SA Giurgiu is 50,968 sqm.
• Operated goods: Miscellaneous general goods
• The port has the following mooring fronts, planted with pear, from upstream to downstream: o RO-RO ramp; o 100 m operational front; o 100 m passenger berth; o 350 m merchandise, where two portable cranes of 5 ft 32 m are fitted.
• There is a fully equipped border crossing point (PTF) in the RO-RO ramp area.
• In the downstream area of the harbor there is a ferry-boat that provides the connection between Calafat in Romania - Vidin from Bulgaria.
• The harbor has storage platforms with an area of 11,000 sqm.
• Operating equipment: two quad portal cranes of 5tf x 32 m, and the other quay the operations are made with floating cranes.
• Traffic capacity: 270 thousand tons / year.
• The port has the facilities for power supply, water and sewage.
• Connections: o Road access connected to the local transport network and further links to DN 55,
DN 5A and DN 56A; o Rail link through change direction lines in the zonal network.
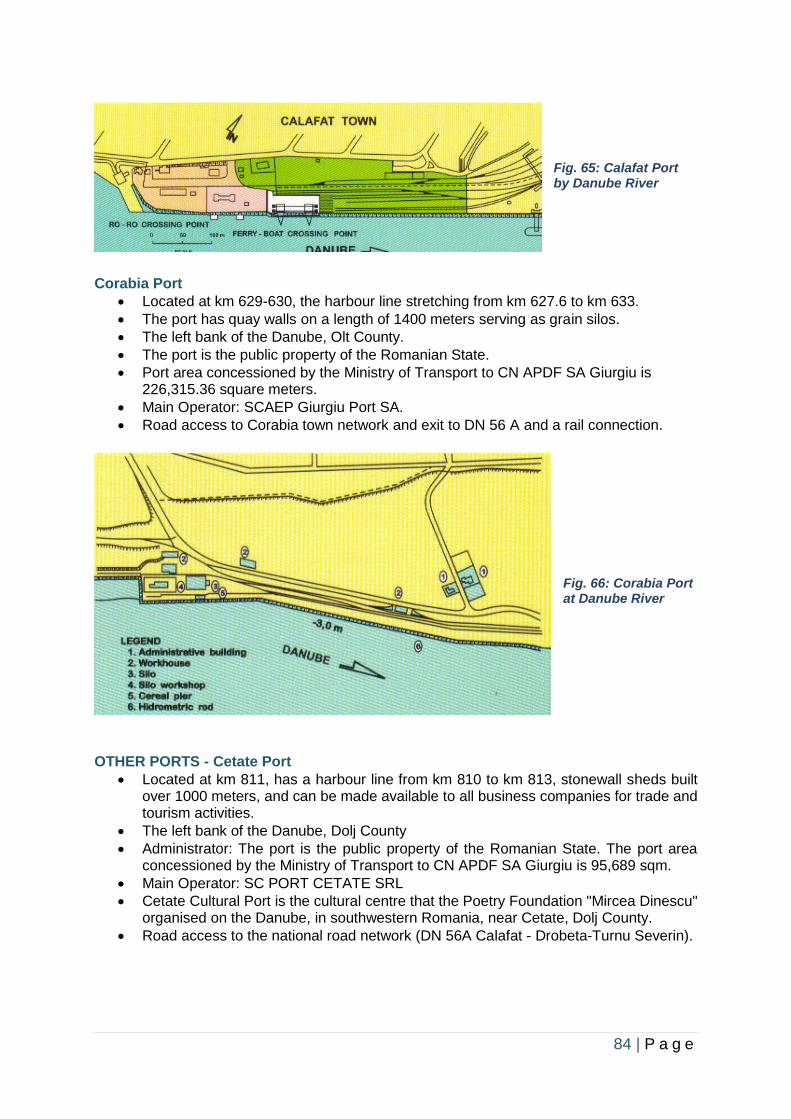
84 | P a g e
Fig. 65: Calafat Port by Danube River
Corabia Port
• Located at km 629-630, the harbour line stretching from km 627.6 to km 633.
• The port has quay walls on a length of 1400 meters serving as grain silos.
• The left bank of the Danube, Olt County.
• The port is the public property of the Romanian State.
• Port area concessioned by the Ministry of Transport to CN APDF SA Giurgiu is 226,315.36 square meters.
• Main Operator: SCAEP Giurgiu Port SA.
• Road access to Corabia town network and exit to DN 56 A and a rail connection.
Fig. 66: Corabia Port at Danube River
OTHER PORTS - Cetate Port
• Located at km 811, has a harbour line from km 810 to km 813, stonewall sheds built over 1000 meters, and can be made available to all business companies for trade and tourism activities.
• The left bank of the Danube, Dolj County
• Administrator: The port is the public property of the Romanian State. The port area concessioned by the Ministry of Transport to CN APDF SA Giurgiu is 95,689 sqm.
• Main Operator: SC PORT CETATE SRL
• Cetate Cultural Port is the cultural centre that the Poetry Foundation "Mircea Dinescu" organised on the Danube, in southwestern Romania, near Cetate, Dolj County.
• Road access to the national road network (DN 56A Calafat - Drobeta-Turnu Severin).
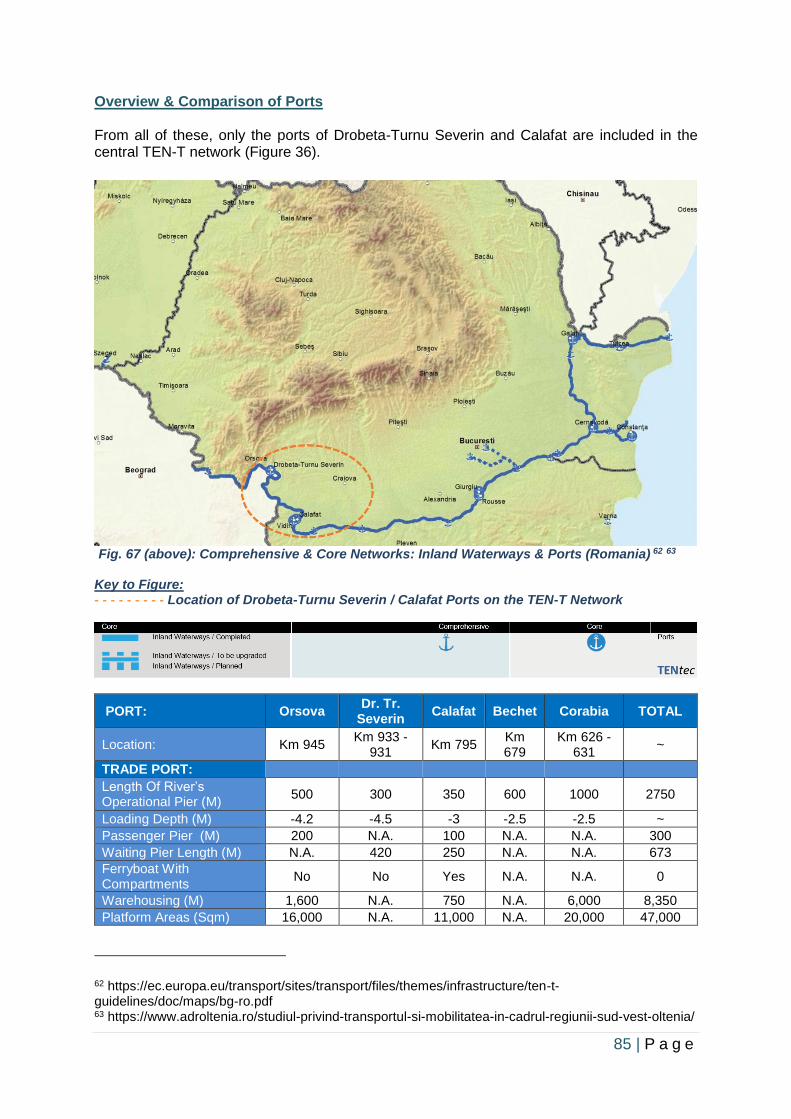
85 | P a g e
Overview & Comparison of Ports From all of these, only the ports of Drobeta-Turnu Severin and Calafat are included in the central TEN-T network (Figure 36).
Fig. 67 (above): Comprehensive & Core Networks: Inland Waterways & Ports (Romania) 62 63 Key to Figure: - - - - - - - - - Location of Drobeta-Turnu Severin / Calafat Ports on the TEN-T Network
PORT: Orsova Dr. Tr.
Severin Calafat Bechet Corabia TOTAL
Location: Km 945 Km 933 -
931 Km 795
Km 679
Km 626 - 631
~
TRADE PORT:
Length Of River’s Operational Pier (M)
500 300 350 600 1000 2750
Loading Depth (M) -4.2 -4.5 -3 -2.5 -2.5 ~
Passenger Pier (M) 200 N.A. 100 N.A. N.A. 300
Waiting Pier Length (M) N.A. 420 250 N.A. N.A. 673
Ferryboat With Compartments
No No Yes N.A. N.A. 0
Warehousing (M) 1,600 N.A. 750 N.A. 6,000 8,350
Platform Areas (Sqm) 16,000 N.A. 11,000 N.A. 20,000 47,000
62 https://ec.europa.eu/transport/sites/transport/files/themes/infrastructure/ten-t-guidelines/doc/maps/bg-ro.pdf 63 https://www.adroltenia.ro/studiul-privind-transportul-si-mobilitatea-in-cadrul-regiunii-sud-vest-oltenia/
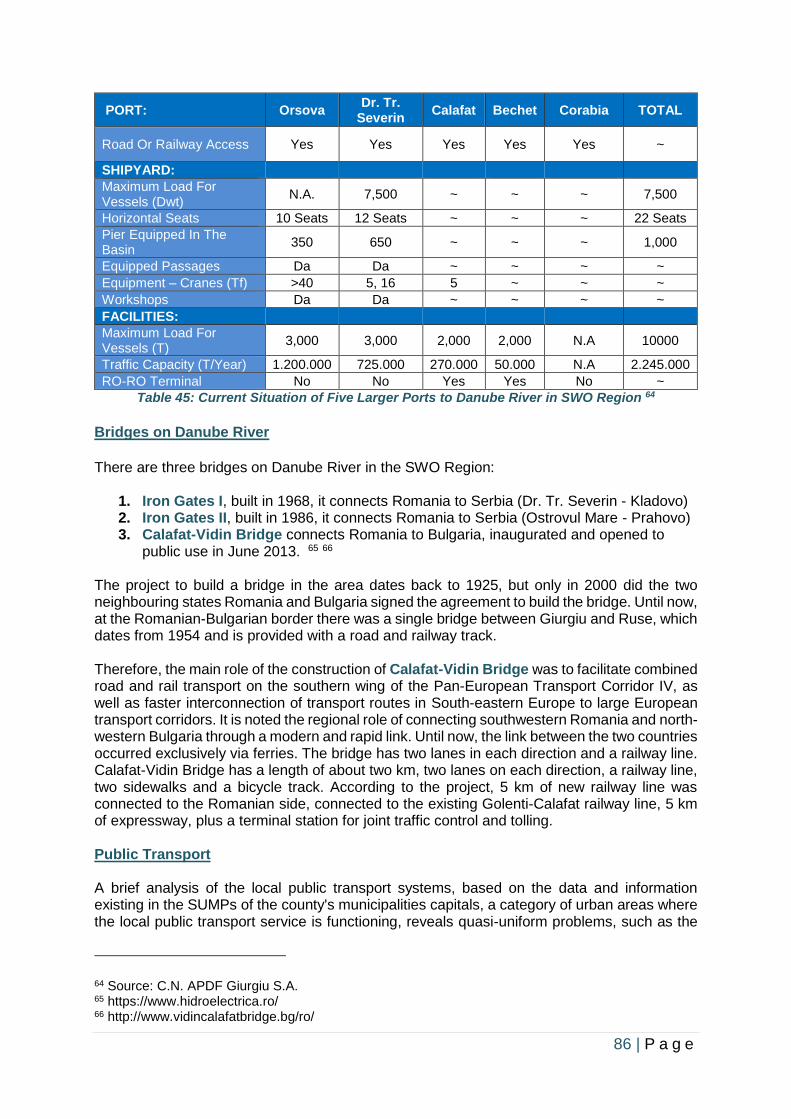
86 | P a g e
PORT: Orsova Dr. Tr.
Severin Calafat Bechet Corabia TOTAL
Road Or Railway Access Yes Yes Yes Yes Yes ~
SHIPYARD:
Maximum Load For Vessels (Dwt)
N.A. 7,500 ~ ~ ~ 7,500
Horizontal Seats 10 Seats 12 Seats ~ ~ ~ 22 Seats
Pier Equipped In The Basin
350 650 ~ ~ ~ 1,000
Equipped Passages Da Da ~ ~ ~ ~
Equipment – Cranes (Tf) >40 5, 16 5 ~ ~ ~
Workshops Da Da ~ ~ ~ ~
FACILITIES:
Maximum Load For Vessels (T)
3,000 3,000 2,000 2,000 N.A 10000
Traffic Capacity (T/Year) 1.200.000 725.000 270.000 50.000 N.A 2.245.000
RO-RO Terminal No No Yes Yes No ~
Table 45: Current Situation of Five Larger Ports to Danube River in SWO Region 64
Bridges on Danube River
There are three bridges on Danube River in the SWO Region:
1. Iron Gates I, built in 1968, it connects Romania to Serbia (Dr. Tr. Severin - Kladovo) 2. Iron Gates II, built in 1986, it connects Romania to Serbia (Ostrovul Mare - Prahovo) 3. Calafat-Vidin Bridge connects Romania to Bulgaria, inaugurated and opened to
public use in June 2013. 65 66 The project to build a bridge in the area dates back to 1925, but only in 2000 did the two neighbouring states Romania and Bulgaria signed the agreement to build the bridge. Until now, at the Romanian-Bulgarian border there was a single bridge between Giurgiu and Ruse, which dates from 1954 and is provided with a road and railway track. Therefore, the main role of the construction of Calafat-Vidin Bridge was to facilitate combined road and rail transport on the southern wing of the Pan-European Transport Corridor IV, as well as faster interconnection of transport routes in South-eastern Europe to large European transport corridors. It is noted the regional role of connecting southwestern Romania and north-western Bulgaria through a modern and rapid link. Until now, the link between the two countries occurred exclusively via ferries. The bridge has two lanes in each direction and a railway line. Calafat-Vidin Bridge has a length of about two km, two lanes on each direction, a railway line, two sidewalks and a bicycle track. According to the project, 5 km of new railway line was connected to the Romanian side, connected to the existing Golenti-Calafat railway line, 5 km of expressway, plus a terminal station for joint traffic control and tolling. Public Transport A brief analysis of the local public transport systems, based on the data and information existing in the SUMPs of the county's municipalities capitals, a category of urban areas where the local public transport service is functioning, reveals quasi-uniform problems, such as the
64 Source: C.N. APDF Giurgiu S.A. 65 https://www.hidroelectrica.ro/ 66 http://www.vidincalafatbridge.bg/ro/
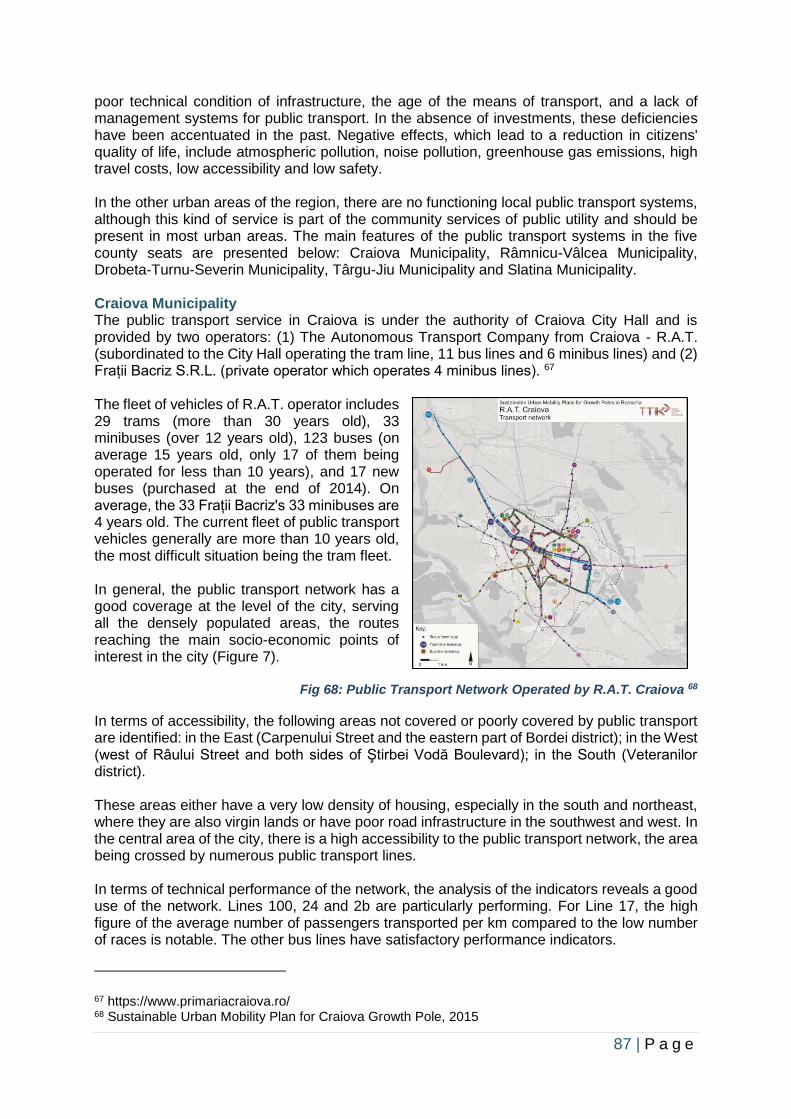
87 | P a g e
poor technical condition of infrastructure, the age of the means of transport, and a lack of management systems for public transport. In the absence of investments, these deficiencies have been accentuated in the past. Negative effects, which lead to a reduction in citizens' quality of life, include atmospheric pollution, noise pollution, greenhouse gas emissions, high travel costs, low accessibility and low safety. In the other urban areas of the region, there are no functioning local public transport systems, although this kind of service is part of the community services of public utility and should be present in most urban areas. The main features of the public transport systems in the five county seats are presented below: Craiova Municipality, Râmnicu-Vâlcea Municipality, Drobeta-Turnu-Severin Municipality, Târgu-Jiu Municipality and Slatina Municipality. Craiova Municipality The public transport service in Craiova is under the authority of Craiova City Hall and is provided by two operators: (1) The Autonomous Transport Company from Craiova - R.A.T. (subordinated to the City Hall operating the tram line, 11 bus lines and 6 minibus lines) and (2) Frații Bacriz S.R.L. (private operator which operates 4 minibus lines). 67 The fleet of vehicles of R.A.T. operator includes 29 trams (more than 30 years old), 33 minibuses (over 12 years old), 123 buses (on average 15 years old, only 17 of them being operated for less than 10 years), and 17 new buses (purchased at the end of 2014). On average, the 33 Frații Bacriz's 33 minibuses are 4 years old. The current fleet of public transport vehicles generally are more than 10 years old, the most difficult situation being the tram fleet. In general, the public transport network has a good coverage at the level of the city, serving all the densely populated areas, the routes reaching the main socio-economic points of interest in the city (Figure 7).
Fig 68: Public Transport Network Operated by R.A.T. Craiova 68
In terms of accessibility, the following areas not covered or poorly covered by public transport are identified: in the East (Carpenului Street and the eastern part of Bordei district); in the West (west of Râului Street and both sides of Ştirbei Vodă Boulevard); in the South (Veteranilor district). These areas either have a very low density of housing, especially in the south and northeast, where they are also virgin lands or have poor road infrastructure in the southwest and west. In the central area of the city, there is a high accessibility to the public transport network, the area being crossed by numerous public transport lines. In terms of technical performance of the network, the analysis of the indicators reveals a good use of the network. Lines 100, 24 and 2b are particularly performing. For Line 17, the high figure of the average number of passengers transported per km compared to the low number of races is notable. The other bus lines have satisfactory performance indicators.
67 https://www.primariacraiova.ro/ 68 Sustainable Urban Mobility Plan for Craiova Growth Pole, 2015
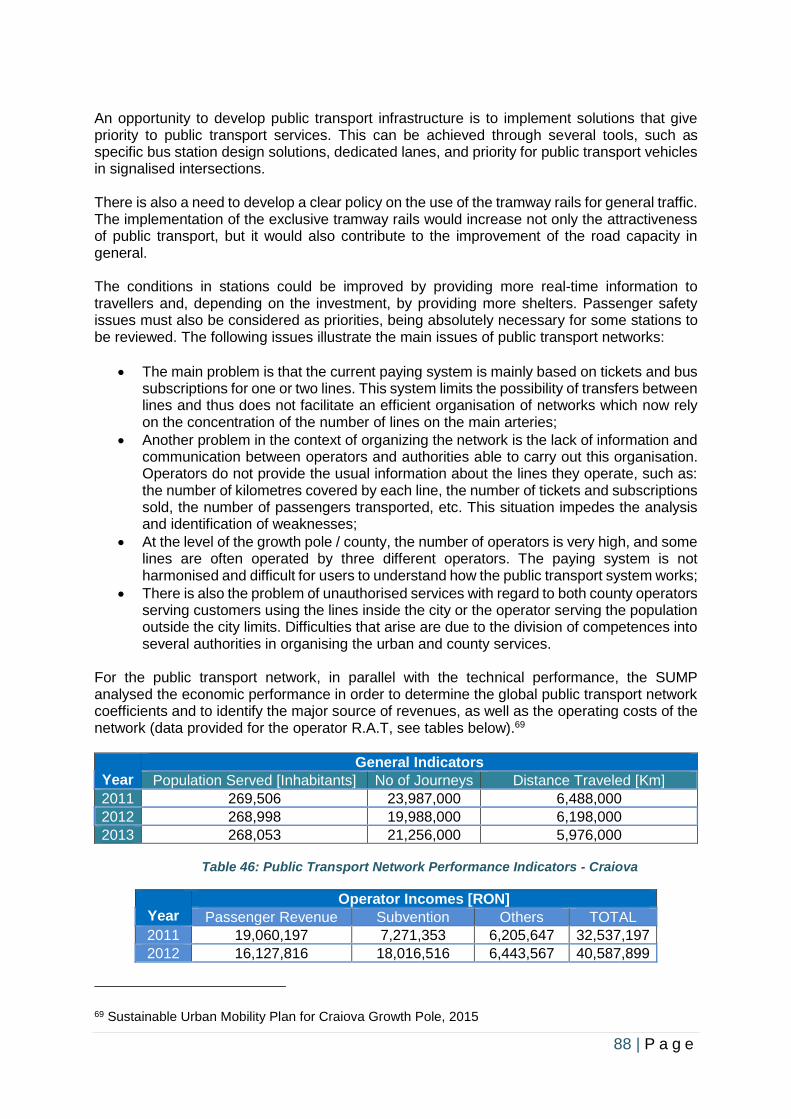
88 | P a g e
An opportunity to develop public transport infrastructure is to implement solutions that give priority to public transport services. This can be achieved through several tools, such as specific bus station design solutions, dedicated lanes, and priority for public transport vehicles in signalised intersections. There is also a need to develop a clear policy on the use of the tramway rails for general traffic. The implementation of the exclusive tramway rails would increase not only the attractiveness of public transport, but it would also contribute to the improvement of the road capacity in general. The conditions in stations could be improved by providing more real-time information to travellers and, depending on the investment, by providing more shelters. Passenger safety issues must also be considered as priorities, being absolutely necessary for some stations to be reviewed. The following issues illustrate the main issues of public transport networks:
• The main problem is that the current paying system is mainly based on tickets and bus subscriptions for one or two lines. This system limits the possibility of transfers between lines and thus does not facilitate an efficient organisation of networks which now rely on the concentration of the number of lines on the main arteries;
• Another problem in the context of organizing the network is the lack of information and communication between operators and authorities able to carry out this organisation. Operators do not provide the usual information about the lines they operate, such as: the number of kilometres covered by each line, the number of tickets and subscriptions sold, the number of passengers transported, etc. This situation impedes the analysis and identification of weaknesses;
• At the level of the growth pole / county, the number of operators is very high, and some lines are often operated by three different operators. The paying system is not harmonised and difficult for users to understand how the public transport system works;
• There is also the problem of unauthorised services with regard to both county operators serving customers using the lines inside the city or the operator serving the population outside the city limits. Difficulties that arise are due to the division of competences into several authorities in organising the urban and county services.
For the public transport network, in parallel with the technical performance, the SUMP analysed the economic performance in order to determine the global public transport network coefficients and to identify the major source of revenues, as well as the operating costs of the network (data provided for the operator R.A.T, see tables below).69
Year
General Indicators
Population Served [Inhabitants] No of Journeys Distance Traveled [Km]
2011 269,506 23,987,000 6,488,000
2012 268,998 19,988,000 6,198,000
2013 268,053 21,256,000 5,976,000
Table 46: Public Transport Network Performance Indicators - Craiova
Year
Operator Incomes [RON]
Passenger Revenue Subvention Others TOTAL
2011 19,060,197 7,271,353 6,205,647 32,537,197
2012 16,127,816 18,016,516 6,443,567 40,587,899
69 Sustainable Urban Mobility Plan for Craiova Growth Pole, 2015
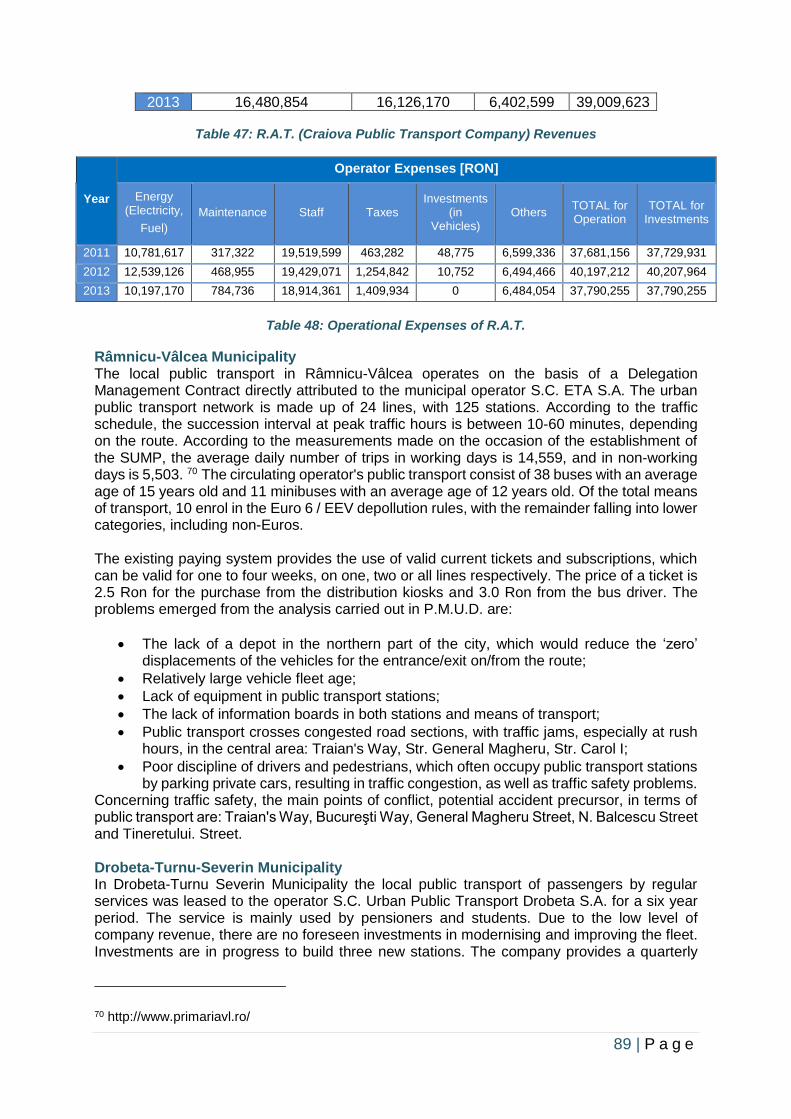
89 | P a g e
2013 16,480,854 16,126,170 6,402,599 39,009,623
Table 47: R.A.T. (Craiova Public Transport Company) Revenues
Year
Operator Expenses [RON]
Energy (Electricity,
Fuel)
Maintenance Staff Taxes Investments
(in Vehicles)
Others TOTAL for Operation
TOTAL for Investments
2011 10,781,617 317,322 19,519,599 463,282 48,775 6,599,336 37,681,156 37,729,931
2012 12,539,126 468,955 19,429,071 1,254,842 10,752 6,494,466 40,197,212 40,207,964
2013 10,197,170 784,736 18,914,361 1,409,934 0 6,484,054 37,790,255 37,790,255
Table 48: Operational Expenses of R.A.T.
Râmnicu-Vâlcea Municipality The local public transport in Râmnicu-Vâlcea operates on the basis of a Delegation Management Contract directly attributed to the municipal operator S.C. ETA S.A. The urban public transport network is made up of 24 lines, with 125 stations. According to the traffic schedule, the succession interval at peak traffic hours is between 10-60 minutes, depending on the route. According to the measurements made on the occasion of the establishment of the SUMP, the average daily number of trips in working days is 14,559, and in non-working days is 5,503. 70 The circulating operator's public transport consist of 38 buses with an average age of 15 years old and 11 minibuses with an average age of 12 years old. Of the total means of transport, 10 enrol in the Euro 6 / EEV depollution rules, with the remainder falling into lower categories, including non-Euros. The existing paying system provides the use of valid current tickets and subscriptions, which can be valid for one to four weeks, on one, two or all lines respectively. The price of a ticket is 2.5 Ron for the purchase from the distribution kiosks and 3.0 Ron from the bus driver. The problems emerged from the analysis carried out in P.M.U.D. are:
• The lack of a depot in the northern part of the city, which would reduce the ‘zero’ displacements of the vehicles for the entrance/exit on/from the route;
• Relatively large vehicle fleet age;
• Lack of equipment in public transport stations;
• The lack of information boards in both stations and means of transport;
• Public transport crosses congested road sections, with traffic jams, especially at rush hours, in the central area: Traian's Way, Str. General Magheru, Str. Carol I;
• Poor discipline of drivers and pedestrians, which often occupy public transport stations by parking private cars, resulting in traffic congestion, as well as traffic safety problems.
Concerning traffic safety, the main points of conflict, potential accident precursor, in terms of public transport are: Traian's Way, Bucureşti Way, General Magheru Street, N. Balcescu Street and Tineretului. Street. Drobeta-Turnu-Severin Municipality In Drobeta-Turnu Severin Municipality the local public transport of passengers by regular services was leased to the operator S.C. Urban Public Transport Drobeta S.A. for a six year period. The service is mainly used by pensioners and students. Due to the low level of company revenue, there are no foreseen investments in modernising and improving the fleet. Investments are in progress to build three new stations. The company provides a quarterly
70 http://www.primariavl.ro/
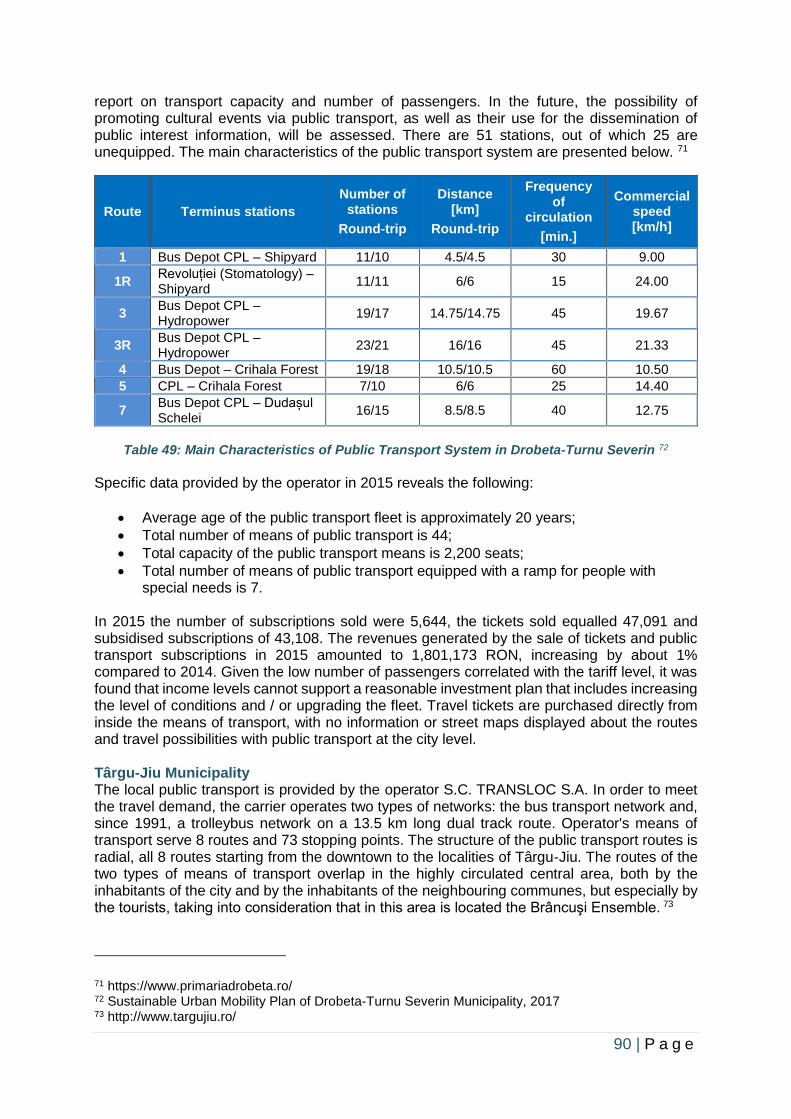
90 | P a g e
report on transport capacity and number of passengers. In the future, the possibility of promoting cultural events via public transport, as well as their use for the dissemination of public interest information, will be assessed. There are 51 stations, out of which 25 are unequipped. The main characteristics of the public transport system are presented below. 71
Route Terminus stations
Number of stations
Round-trip
Distance [km]
Round-trip
Frequency of
circulation
[min.]
Commercial speed [km/h]
1 Bus Depot CPL – Shipyard 11/10 4.5/4.5 30 9.00
1R Revoluției (Stomatology) – Shipyard
11/11 6/6 15 24.00
3 Bus Depot CPL – Hydropower
19/17 14.75/14.75 45 19.67
3R Bus Depot CPL – Hydropower
23/21 16/16 45 21.33
4 Bus Depot – Crihala Forest 19/18 10.5/10.5 60 10.50
5 CPL – Crihala Forest 7/10 6/6 25 14.40
7 Bus Depot CPL – Dudașul Schelei
16/15 8.5/8.5 40 12.75
Table 49: Main Characteristics of Public Transport System in Drobeta-Turnu Severin 72
Specific data provided by the operator in 2015 reveals the following:
• Average age of the public transport fleet is approximately 20 years;
• Total number of means of public transport is 44;
• Total capacity of the public transport means is 2,200 seats;
• Total number of means of public transport equipped with a ramp for people with special needs is 7.
In 2015 the number of subscriptions sold were 5,644, the tickets sold equalled 47,091 and subsidised subscriptions of 43,108. The revenues generated by the sale of tickets and public transport subscriptions in 2015 amounted to 1,801,173 RON, increasing by about 1% compared to 2014. Given the low number of passengers correlated with the tariff level, it was found that income levels cannot support a reasonable investment plan that includes increasing the level of conditions and / or upgrading the fleet. Travel tickets are purchased directly from inside the means of transport, with no information or street maps displayed about the routes and travel possibilities with public transport at the city level. Târgu-Jiu Municipality The local public transport is provided by the operator S.C. TRANSLOC S.A. In order to meet the travel demand, the carrier operates two types of networks: the bus transport network and, since 1991, a trolleybus network on a 13.5 km long dual track route. Operator's means of transport serve 8 routes and 73 stopping points. The structure of the public transport routes is radial, all 8 routes starting from the downtown to the localities of Târgu-Jiu. The routes of the two types of means of transport overlap in the highly circulated central area, both by the inhabitants of the city and by the inhabitants of the neighbouring communes, but especially by the tourists, taking into consideration that in this area is located the Brâncuşi Ensemble. 73
71 https://www.primariadrobeta.ro/ 72 Sustainable Urban Mobility Plan of Drobeta-Turnu Severin Municipality, 2017 73 http://www.targujiu.ro/
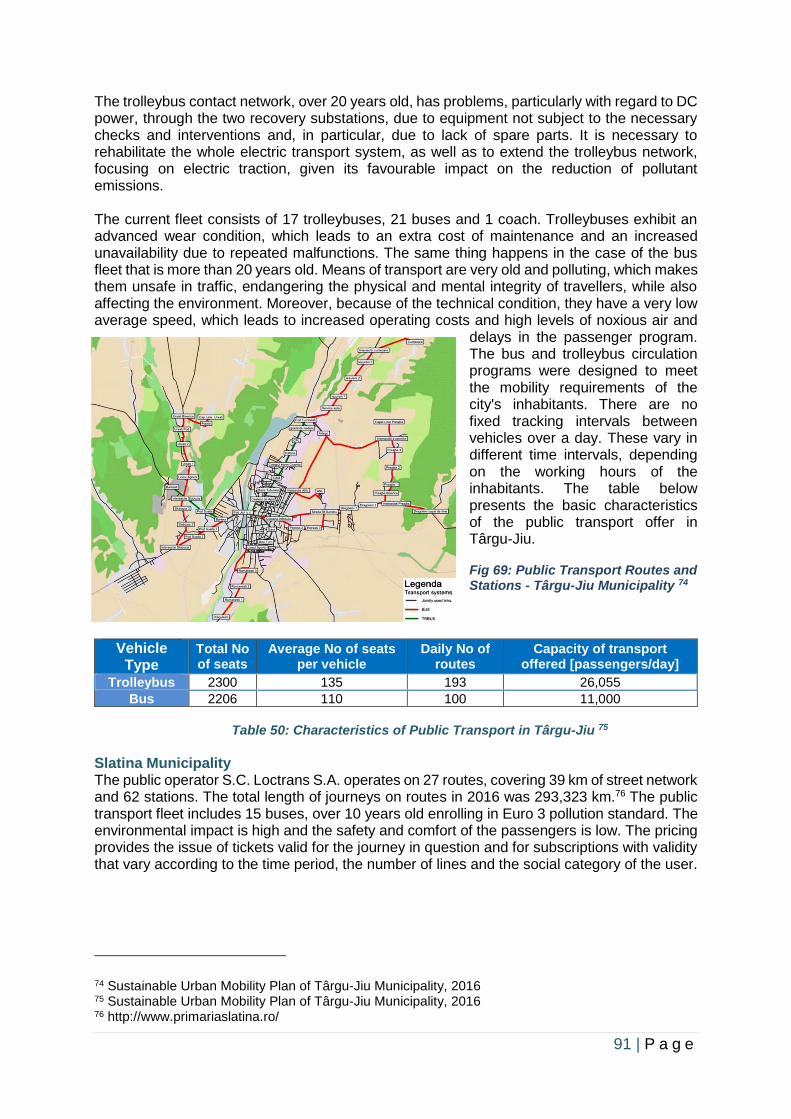
91 | P a g e
The trolleybus contact network, over 20 years old, has problems, particularly with regard to DC power, through the two recovery substations, due to equipment not subject to the necessary checks and interventions and, in particular, due to lack of spare parts. It is necessary to rehabilitate the whole electric transport system, as well as to extend the trolleybus network, focusing on electric traction, given its favourable impact on the reduction of pollutant emissions. The current fleet consists of 17 trolleybuses, 21 buses and 1 coach. Trolleybuses exhibit an advanced wear condition, which leads to an extra cost of maintenance and an increased unavailability due to repeated malfunctions. The same thing happens in the case of the bus fleet that is more than 20 years old. Means of transport are very old and polluting, which makes them unsafe in traffic, endangering the physical and mental integrity of travellers, while also affecting the environment. Moreover, because of the technical condition, they have a very low average speed, which leads to increased operating costs and high levels of noxious air and
delays in the passenger program. The bus and trolleybus circulation programs were designed to meet the mobility requirements of the city's inhabitants. There are no fixed tracking intervals between vehicles over a day. These vary in different time intervals, depending on the working hours of the inhabitants. The table below presents the basic characteristics of the public transport offer in Târgu-Jiu. Fig 69: Public Transport Routes and Stations - Târgu-Jiu Municipality 74
Vehicle Type
Total No of seats
Average No of seats per vehicle
Daily No of routes
Capacity of transport offered [passengers/day]
Trolleybus 2300 135 193 26,055
Bus 2206 110 100 11,000
Table 50: Characteristics of Public Transport in Târgu-Jiu 75
Slatina Municipality The public operator S.C. Loctrans S.A. operates on 27 routes, covering 39 km of street network and 62 stations. The total length of journeys on routes in 2016 was 293,323 km.76 The public transport fleet includes 15 buses, over 10 years old enrolling in Euro 3 pollution standard. The environmental impact is high and the safety and comfort of the passengers is low. The pricing provides the issue of tickets valid for the journey in question and for subscriptions with validity that vary according to the time period, the number of lines and the social category of the user.
74 Sustainable Urban Mobility Plan of Târgu-Jiu Municipality, 2016 75 Sustainable Urban Mobility Plan of Târgu-Jiu Municipality, 2016 76 http://www.primariaslatina.ro/
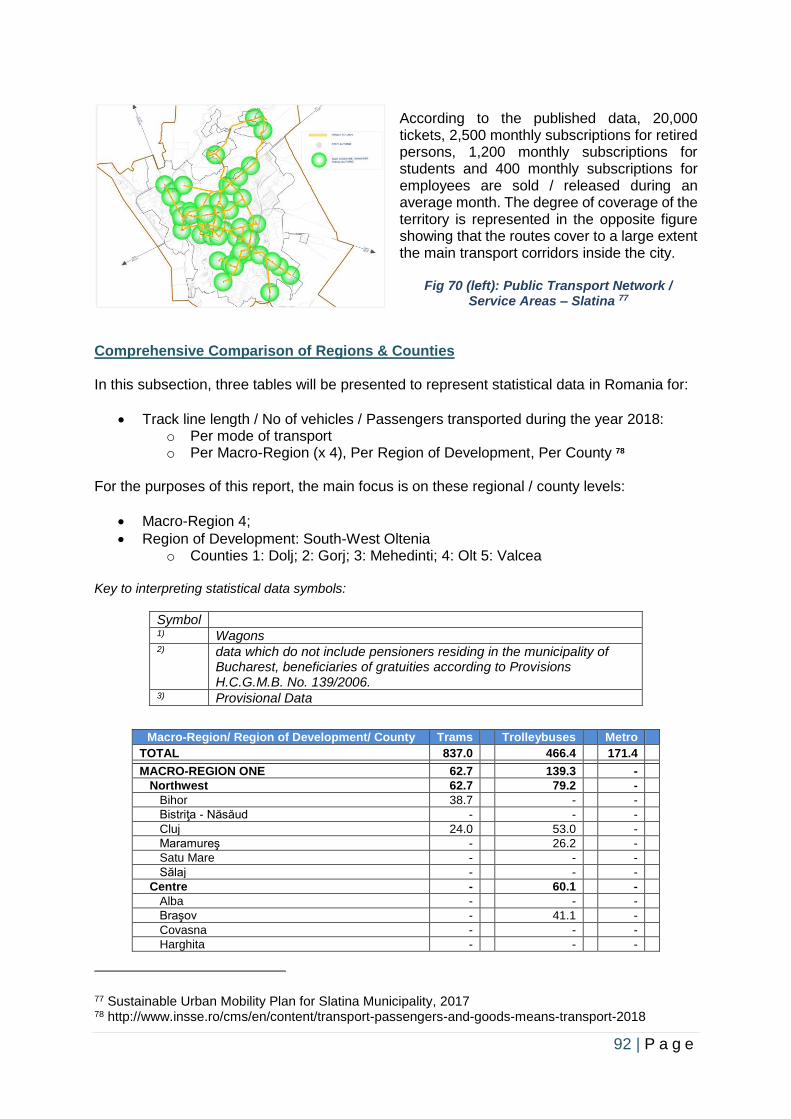
92 | P a g e
According to the published data, 20,000 tickets, 2,500 monthly subscriptions for retired persons, 1,200 monthly subscriptions for students and 400 monthly subscriptions for employees are sold / released during an average month. The degree of coverage of the territory is represented in the opposite figure showing that the routes cover to a large extent the main transport corridors inside the city.
Fig 70 (left): Public Transport Network / Service Areas – Slatina 77
Comprehensive Comparison of Regions & Counties In this subsection, three tables will be presented to represent statistical data in Romania for:
• Track line length / No of vehicles / Passengers transported during the year 2018: o Per mode of transport o Per Macro-Region (x 4), Per Region of Development, Per County 78
For the purposes of this report, the main focus is on these regional / county levels:
• Macro-Region 4;
• Region of Development: South-West Oltenia o Counties 1: Dolj; 2: Gorj; 3: Mehedinti; 4: Olt 5: Valcea
Key to interpreting statistical data symbols:
Symbol 1) Wagons 2) data which do not include pensioners residing in the municipality of
Bucharest, beneficiaries of gratuities according to Provisions H.C.G.M.B. No. 139/2006.
3) Provisional Data
Macro-Region/ Region of Development/ County Trams Trolleybuses Metro
TOTAL 837.0 466.4 171.4 MACRO-REGION ONE 62.7 139.3 - Northwest 62.7 79.2 - Bihor 38.7 - - Bistriţa - Năsăud - - - Cluj 24.0 53.0 - Maramureş - 26.2 - Satu Mare - - - Sălaj - - - Centre - 60.1 - Alba - - - Braşov - 41.1 - Covasna - - - Harghita - - -
77 Sustainable Urban Mobility Plan for Slatina Municipality, 2017 78 http://www.insse.ro/cms/en/content/transport-passengers-and-goods-means-transport-2018
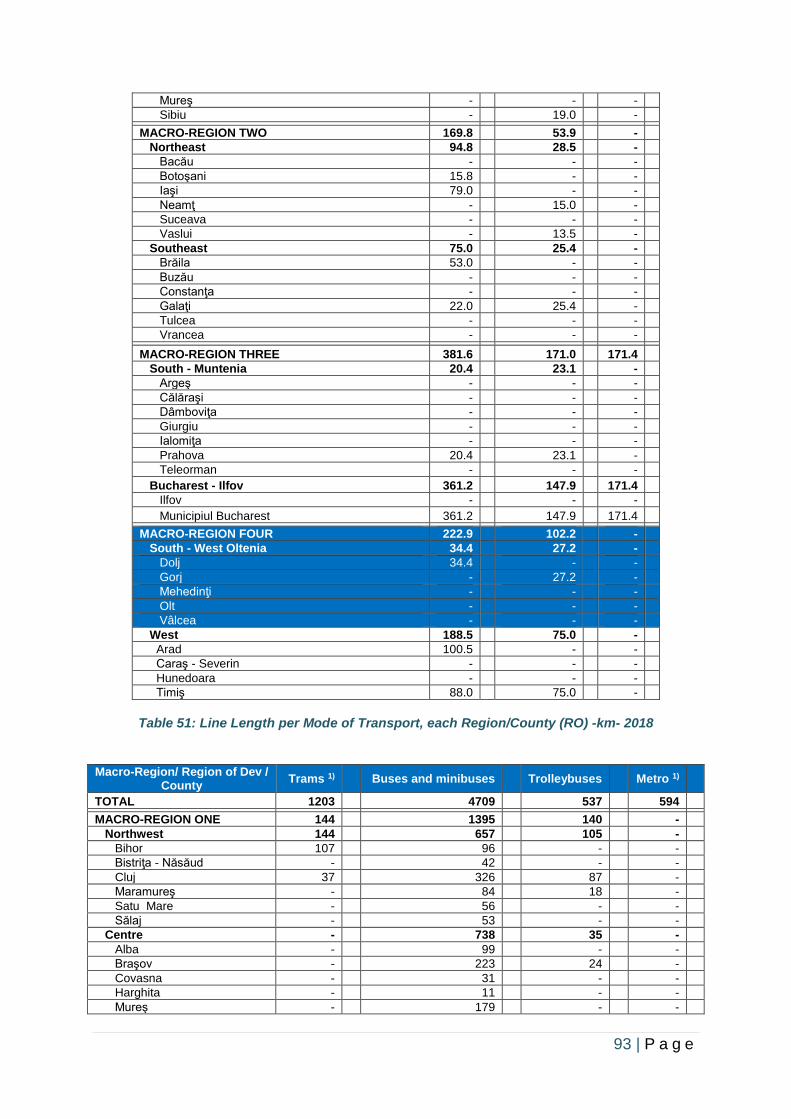
93 | P a g e
Mureş - - - Sibiu - 19.0 - MACRO-REGION TWO 169.8 53.9 - Northeast 94.8 28.5 - Bacău - - - Botoşani 15.8 - - Iaşi 79.0 - - Neamţ - 15.0 - Suceava - - - Vaslui - 13.5 - Southeast 75.0 25.4 - Brăila 53.0 - - Buzău - - - Constanţa - - - Galaţi 22.0 25.4 - Tulcea - - - Vrancea - - - MACRO-REGION THREE 381.6 171.0 171.4 South - Muntenia 20.4 23.1 - Argeş - - - Călăraşi - - - Dâmboviţa - - - Giurgiu - - - Ialomiţa - - - Prahova 20.4 23.1 - Teleorman - - - Bucharest - Ilfov 361.2 147.9 171.4 Ilfov - - - Municipiul Bucharest 361.2 147.9 171.4 MACRO-REGION FOUR 222.9 102.2 - South - West Oltenia 34.4 27.2 - Dolj 34.4 - - Gorj - 27.2 - Mehedinţi - - - Olt - - - Vâlcea - - - West 188.5 75.0 - Arad 100.5 - - Caraş - Severin - - - Hunedoara - - - Timiş 88.0 75.0 -
Table 51: Line Length per Mode of Transport, each Region/County (RO) -km- 2018
Macro-Region/ Region of Dev /
County Trams 1) Buses and minibuses Trolleybuses Metro 1)
TOTAL 1203 4709 537 594 MACRO-REGION ONE 144 1395 140 - Northwest 144 657 105 - Bihor 107 96 - - Bistriţa - Năsăud - 42 - - Cluj 37 326 87 - Maramureş - 84 18 - Satu Mare - 56 - - Sălaj - 53 - - Centre - 738 35 - Alba - 99 - - Braşov - 223 24 - Covasna - 31 - - Harghita - 11 - - Mureş - 179 - -
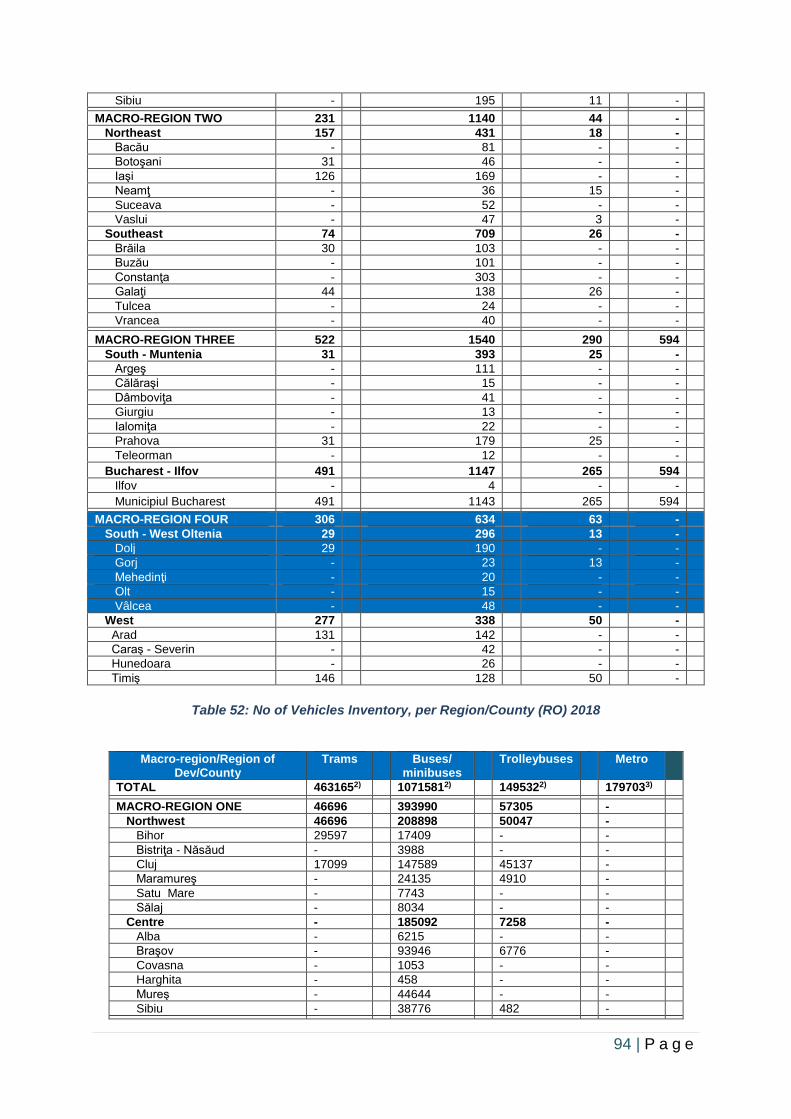
94 | P a g e
Sibiu - 195 11 - MACRO-REGION TWO 231 1140 44 - Northeast 157 431 18 - Bacău - 81 - - Botoşani 31 46 - - Iaşi 126 169 - - Neamţ - 36 15 - Suceava - 52 - - Vaslui - 47 3 - Southeast 74 709 26 - Brăila 30 103 - - Buzău - 101 - - Constanţa - 303 - - Galaţi 44 138 26 - Tulcea - 24 - - Vrancea - 40 - - MACRO-REGION THREE 522 1540 290 594 South - Muntenia 31 393 25 - Argeş - 111 - - Călăraşi - 15 - - Dâmboviţa - 41 - - Giurgiu - 13 - - Ialomiţa - 22 - - Prahova 31 179 25 - Teleorman - 12 - - Bucharest - Ilfov 491 1147 265 594 Ilfov - 4 - - Municipiul Bucharest 491 1143 265 594 MACRO-REGION FOUR 306 634 63 - South - West Oltenia 29 296 13 - Dolj 29 190 - - Gorj - 23 13 - Mehedinţi - 20 - - Olt - 15 - - Vâlcea - 48 - - West 277 338 50 - Arad 131 142 - - Caraş - Severin - 42 - - Hunedoara - 26 - - Timiş 146 128 50 -
Table 52: No of Vehicles Inventory, per Region/County (RO) 2018
Macro-region/Region of Dev/County
Trams Buses/ minibuses
Trolleybuses Metro
TOTAL 4631652)
10715812)
1495322)
1797033)
MACRO-REGION ONE 46696
393990
57305
-
Northwest 46696
208898
50047
-
Bihor 29597
17409
-
-
Bistriţa - Năsăud -
3988
-
-
Cluj 17099
147589
45137
-
Maramureş -
24135
4910
-
Satu Mare -
7743
-
-
Sălaj -
8034
-
-
Centre -
185092
7258
-
Alba -
6215
-
-
Braşov -
93946
6776
-
Covasna -
1053
-
-
Harghita -
458
-
-
Mureş -
44644
-
-
Sibiu -
38776
482
-
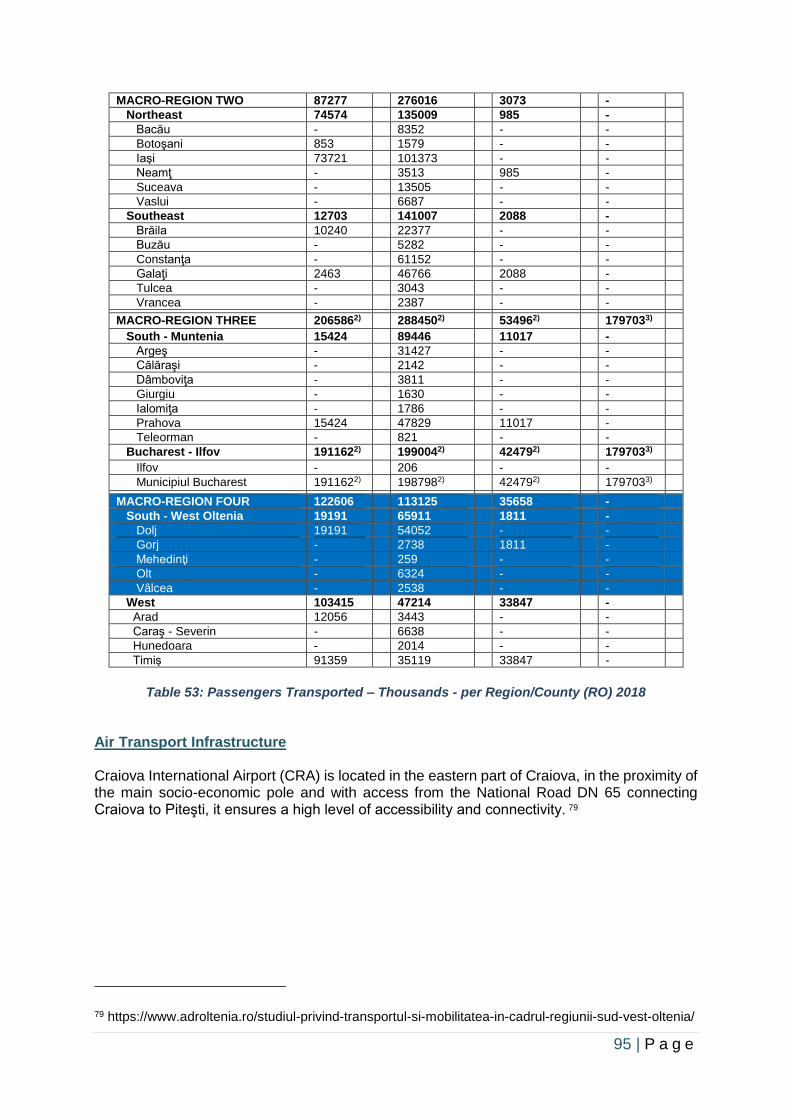
95 | P a g e
MACRO-REGION TWO 87277
276016
3073
-
Northeast 74574
135009
985
-
Bacău -
8352
-
-
Botoşani 853
1579
-
-
Iaşi 73721
101373
-
-
Neamţ -
3513
985
-
Suceava -
13505
-
-
Vaslui -
6687
-
-
Southeast 12703
141007
2088
-
Brăila 10240
22377
-
-
Buzău -
5282
-
-
Constanţa -
61152
-
-
Galaţi 2463
46766
2088
-
Tulcea -
3043
-
-
Vrancea -
2387
-
-
MACRO-REGION THREE 2065862)
2884502)
534962)
1797033)
South - Muntenia 15424
89446
11017
-
Argeş -
31427
-
-
Călăraşi -
2142
-
-
Dâmboviţa -
3811
-
-
Giurgiu -
1630
-
-
Ialomiţa -
1786
-
-
Prahova 15424
47829
11017
-
Teleorman -
821
-
-
Bucharest - Ilfov 1911622)
1990042)
424792)
1797033)
Ilfov -
206
-
-
Municipiul Bucharest 1911622)
1987982)
424792)
1797033)
MACRO-REGION FOUR 122606
113125
35658
-
South - West Oltenia 19191
65911
1811
-
Dolj 19191
54052
-
-
Gorj -
2738
1811
-
Mehedinţi -
259
-
-
Olt -
6324
-
-
Vâlcea -
2538
-
-
West 103415
47214
33847
-
Arad 12056
3443
-
-
Caraş - Severin -
6638
-
-
Hunedoara -
2014
-
-
Timiş 91359
35119
33847
-
Table 53: Passengers Transported – Thousands - per Region/County (RO) 2018
Air Transport Infrastructure Craiova International Airport (CRA) is located in the eastern part of Craiova, in the proximity of the main socio-economic pole and with access from the National Road DN 65 connecting Craiova to Piteşti, it ensures a high level of accessibility and connectivity. 79
79 https://www.adroltenia.ro/studiul-privind-transportul-si-mobilitatea-in-cadrul-regiunii-sud-vest-oltenia/
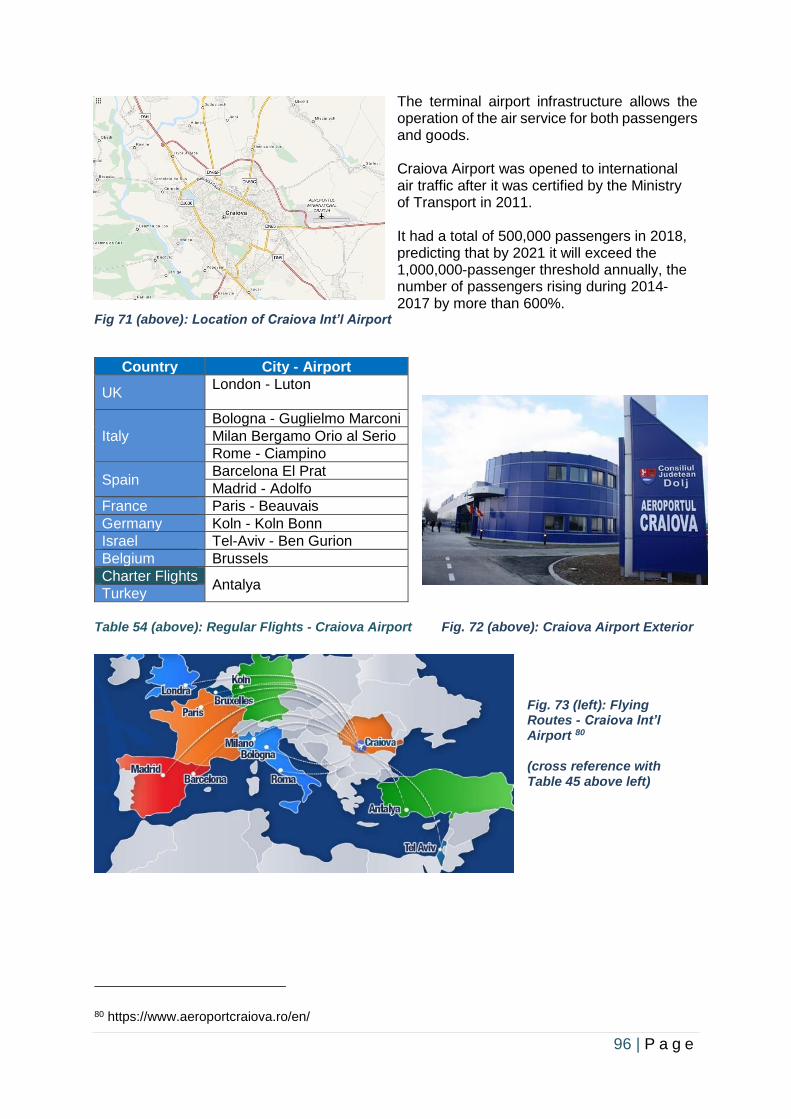
96 | P a g e
The terminal airport infrastructure allows the operation of the air service for both passengers and goods. Craiova Airport was opened to international air traffic after it was certified by the Ministry of Transport in 2011. It had a total of 500,000 passengers in 2018, predicting that by 2021 it will exceed the 1,000,000-passenger threshold annually, the number of passengers rising during 2014-2017 by more than 600%.
Fig 71 (above): Location of Craiova Int’l Airport
Country City - Airport
UK London - Luton
Italy
Bologna - Guglielmo Marconi
Milan Bergamo Orio al Serio
Rome - Ciampino
Spain Barcelona El Prat
Madrid - Adolfo
France Paris - Beauvais
Germany Koln - Koln Bonn
Israel Tel-Aviv - Ben Gurion
Belgium Brussels
Charter Flights Antalya
Turkey
Table 54 (above): Regular Flights - Craiova Airport Fig. 72 (above): Craiova Airport Exterior
Fig. 73 (left): Flying Routes - Craiova Int’l Airport 80 (cross reference with Table 45 above left)
80 https://www.aeroportcraiova.ro/en/
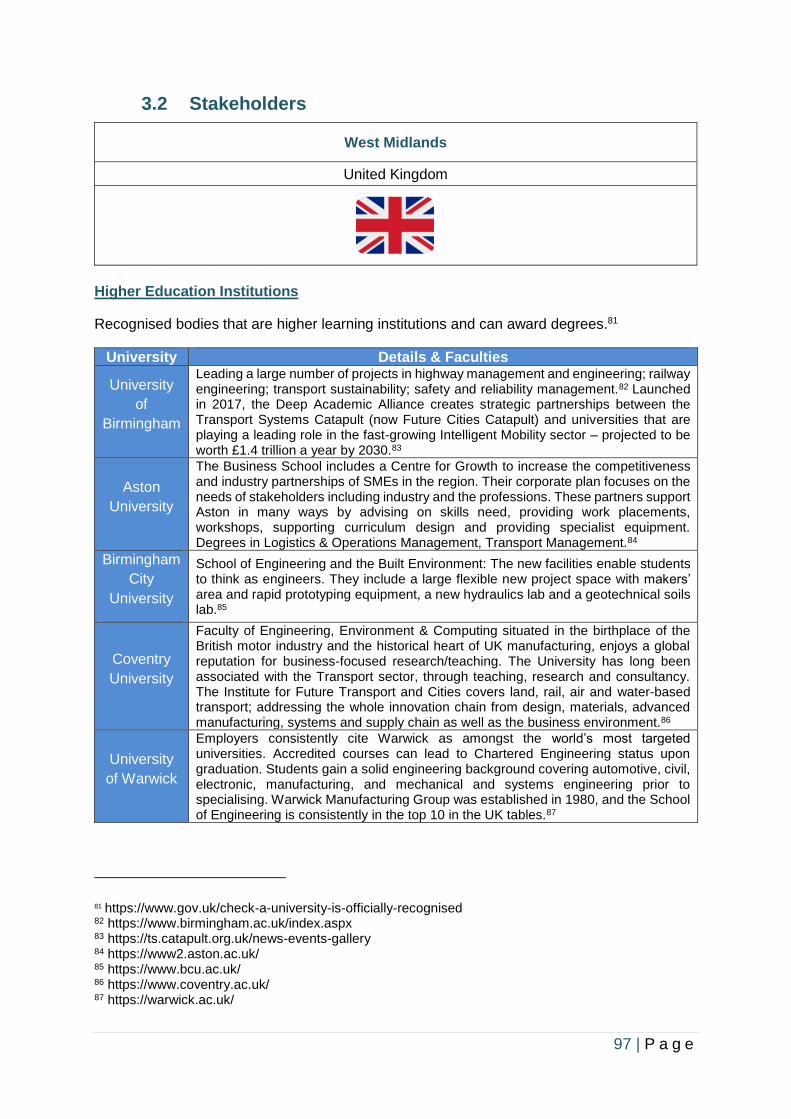
97 | P a g e
3.2 Stakeholders
West Midlands
United Kingdom
Higher Education Institutions
Recognised bodies that are higher learning institutions and can award degrees.81
University Details & Faculties
University
of
Birmingham
Leading a large number of projects in highway management and engineering; railway engineering; transport sustainability; safety and reliability management.82 Launched in 2017, the Deep Academic Alliance creates strategic partnerships between the Transport Systems Catapult (now Future Cities Catapult) and universities that are playing a leading role in the fast-growing Intelligent Mobility sector – projected to be worth £1.4 trillion a year by 2030.83
Aston
University
The Business School includes a Centre for Growth to increase the competitiveness and industry partnerships of SMEs in the region. Their corporate plan focuses on the needs of stakeholders including industry and the professions. These partners support Aston in many ways by advising on skills need, providing work placements, workshops, supporting curriculum design and providing specialist equipment. Degrees in Logistics & Operations Management, Transport Management.84
Birmingham
City
University
School of Engineering and the Built Environment: The new facilities enable students to think as engineers. They include a large flexible new project space with makers’ area and rapid prototyping equipment, a new hydraulics lab and a geotechnical soils lab.85
Coventry
University
Faculty of Engineering, Environment & Computing situated in the birthplace of the British motor industry and the historical heart of UK manufacturing, enjoys a global reputation for business-focused research/teaching. The University has long been associated with the Transport sector, through teaching, research and consultancy. The Institute for Future Transport and Cities covers land, rail, air and water-based transport; addressing the whole innovation chain from design, materials, advanced manufacturing, systems and supply chain as well as the business environment.86
University
of Warwick
Employers consistently cite Warwick as amongst the world’s most targeted universities. Accredited courses can lead to Chartered Engineering status upon graduation. Students gain a solid engineering background covering automotive, civil, electronic, manufacturing, and mechanical and systems engineering prior to specialising. Warwick Manufacturing Group was established in 1980, and the School of Engineering is consistently in the top 10 in the UK tables.87
81 https://www.gov.uk/check-a-university-is-officially-recognised 82 https://www.birmingham.ac.uk/index.aspx 83 https://ts.catapult.org.uk/news-events-gallery 84 https://www2.aston.ac.uk/ 85 https://www.bcu.ac.uk/ 86 https://www.coventry.ac.uk/ 87 https://warwick.ac.uk/
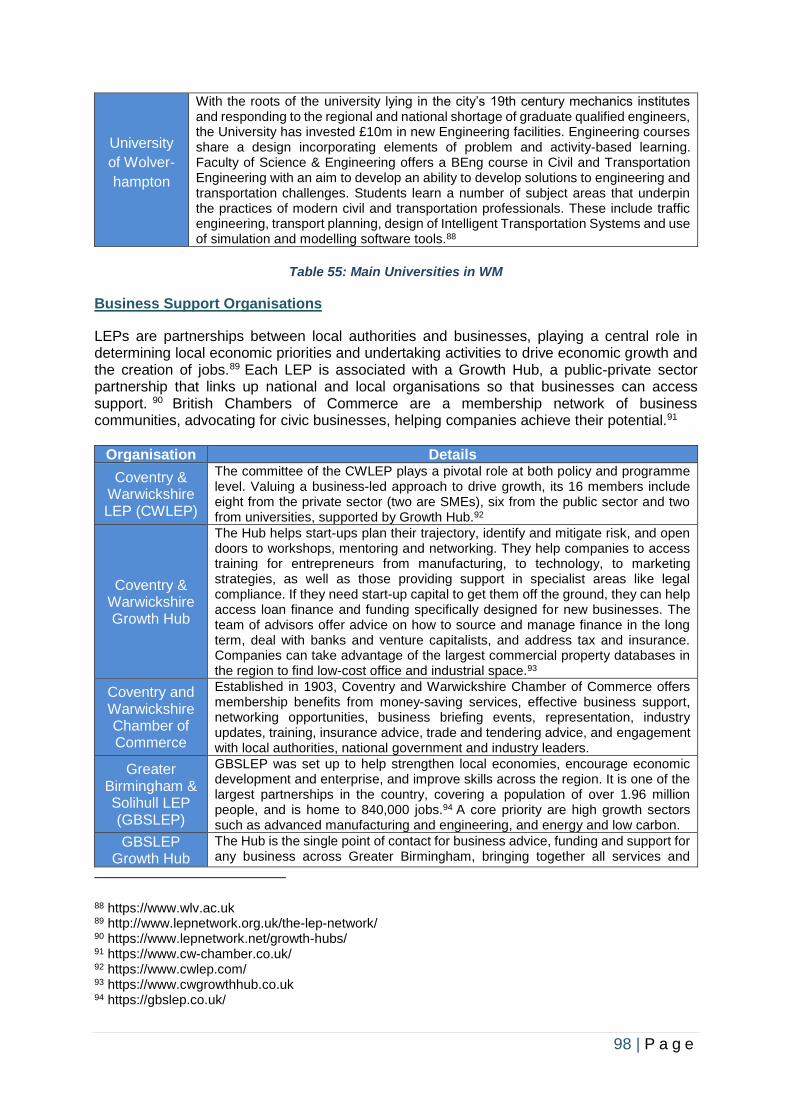
98 | P a g e
University
of Wolver-
hampton
With the roots of the university lying in the city’s 19th century mechanics institutes and responding to the regional and national shortage of graduate qualified engineers, the University has invested £10m in new Engineering facilities. Engineering courses share a design incorporating elements of problem and activity-based learning. Faculty of Science & Engineering offers a BEng course in Civil and Transportation Engineering with an aim to develop an ability to develop solutions to engineering and transportation challenges. Students learn a number of subject areas that underpin the practices of modern civil and transportation professionals. These include traffic engineering, transport planning, design of Intelligent Transportation Systems and use of simulation and modelling software tools.88
Table 55: Main Universities in WM
Business Support Organisations
LEPs are partnerships between local authorities and businesses, playing a central role in determining local economic priorities and undertaking activities to drive economic growth and the creation of jobs.89 Each LEP is associated with a Growth Hub, a public-private sector partnership that links up national and local organisations so that businesses can access support. 90 British Chambers of Commerce are a membership network of business communities, advocating for civic businesses, helping companies achieve their potential.91
Organisation Details
Coventry & Warwickshire LEP (CWLEP)
The committee of the CWLEP plays a pivotal role at both policy and programme level. Valuing a business-led approach to drive growth, its 16 members include eight from the private sector (two are SMEs), six from the public sector and two from universities, supported by Growth Hub.92
Coventry & Warwickshire Growth Hub
The Hub helps start-ups plan their trajectory, identify and mitigate risk, and open doors to workshops, mentoring and networking. They help companies to access training for entrepreneurs from manufacturing, to technology, to marketing strategies, as well as those providing support in specialist areas like legal compliance. If they need start-up capital to get them off the ground, they can help access loan finance and funding specifically designed for new businesses. The team of advisors offer advice on how to source and manage finance in the long term, deal with banks and venture capitalists, and address tax and insurance. Companies can take advantage of the largest commercial property databases in the region to find low-cost office and industrial space.93
Coventry and Warwickshire Chamber of Commerce
Established in 1903, Coventry and Warwickshire Chamber of Commerce offers membership benefits from money-saving services, effective business support, networking opportunities, business briefing events, representation, industry updates, training, insurance advice, trade and tendering advice, and engagement with local authorities, national government and industry leaders.
Greater Birmingham & Solihull LEP (GBSLEP)
GBSLEP was set up to help strengthen local economies, encourage economic development and enterprise, and improve skills across the region. It is one of the largest partnerships in the country, covering a population of over 1.96 million people, and is home to 840,000 jobs.94 A core priority are high growth sectors such as advanced manufacturing and engineering, and energy and low carbon.
GBSLEP Growth Hub
The Hub is the single point of contact for business advice, funding and support for any business across Greater Birmingham, bringing together all services and
88 https://www.wlv.ac.uk 89 http://www.lepnetwork.org.uk/the-lep-network/ 90 https://www.lepnetwork.net/growth-hubs/ 91 https://www.cw-chamber.co.uk/ 92 https://www.cwlep.com/ 93 https://www.cwgrowthhub.co.uk 94 https://gbslep.co.uk/
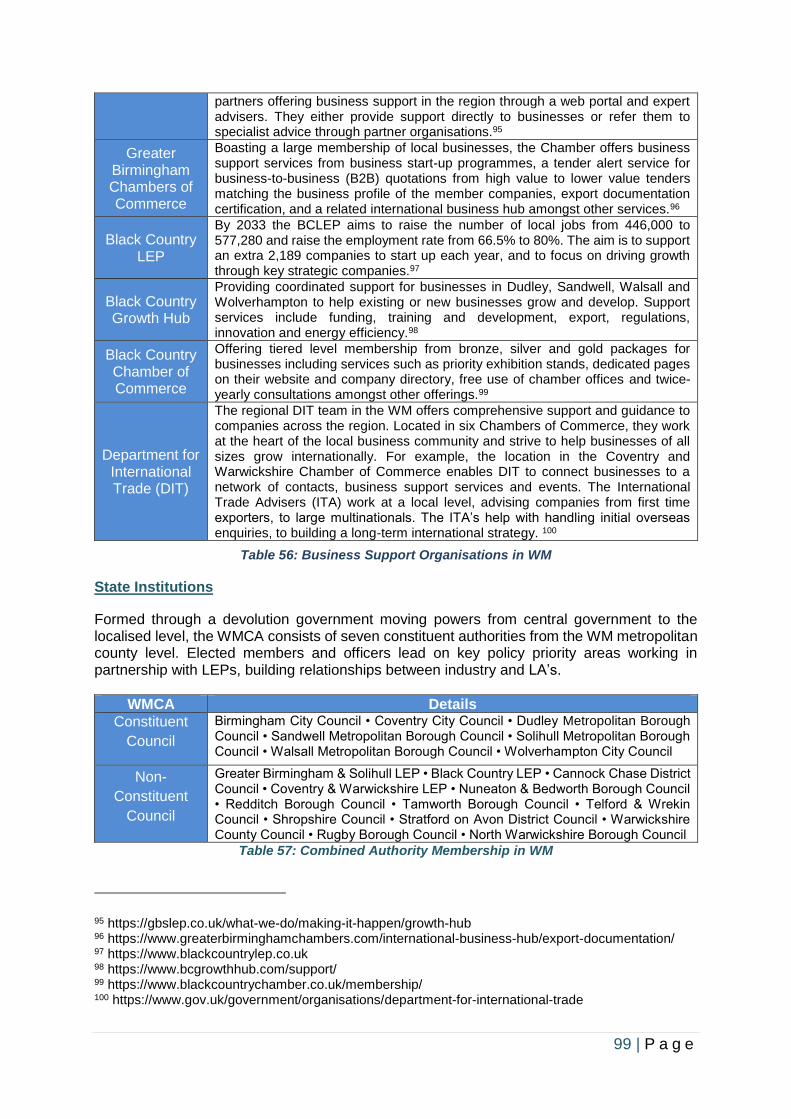
99 | P a g e
partners offering business support in the region through a web portal and expert advisers. They either provide support directly to businesses or refer them to specialist advice through partner organisations.95
Greater Birmingham Chambers of Commerce
Boasting a large membership of local businesses, the Chamber offers business support services from business start-up programmes, a tender alert service for business-to-business (B2B) quotations from high value to lower value tenders matching the business profile of the member companies, export documentation certification, and a related international business hub amongst other services.96
Black Country LEP
By 2033 the BCLEP aims to raise the number of local jobs from 446,000 to 577,280 and raise the employment rate from 66.5% to 80%. The aim is to support an extra 2,189 companies to start up each year, and to focus on driving growth through key strategic companies.97
Black Country Growth Hub
Providing coordinated support for businesses in Dudley, Sandwell, Walsall and Wolverhampton to help existing or new businesses grow and develop. Support services include funding, training and development, export, regulations, innovation and energy efficiency.98
Black Country Chamber of Commerce
Offering tiered level membership from bronze, silver and gold packages for businesses including services such as priority exhibition stands, dedicated pages on their website and company directory, free use of chamber offices and twice-yearly consultations amongst other offerings.99
Department for International Trade (DIT)
The regional DIT team in the WM offers comprehensive support and guidance to companies across the region. Located in six Chambers of Commerce, they work at the heart of the local business community and strive to help businesses of all sizes grow internationally. For example, the location in the Coventry and Warwickshire Chamber of Commerce enables DIT to connect businesses to a network of contacts, business support services and events. The International Trade Advisers (ITA) work at a local level, advising companies from first time exporters, to large multinationals. The ITA’s help with handling initial overseas enquiries, to building a long-term international strategy. 100
Table 56: Business Support Organisations in WM
State Institutions
Formed through a devolution government moving powers from central government to the localised level, the WMCA consists of seven constituent authorities from the WM metropolitan county level. Elected members and officers lead on key policy priority areas working in partnership with LEPs, building relationships between industry and LA’s.
WMCA Details
Constituent
Council
Birmingham City Council • Coventry City Council • Dudley Metropolitan Borough Council • Sandwell Metropolitan Borough Council • Solihull Metropolitan Borough Council • Walsall Metropolitan Borough Council • Wolverhampton City Council
Non-
Constituent
Council
Greater Birmingham & Solihull LEP • Black Country LEP • Cannock Chase District Council • Coventry & Warwickshire LEP • Nuneaton & Bedworth Borough Council • Redditch Borough Council • Tamworth Borough Council • Telford & Wrekin Council • Shropshire Council • Stratford on Avon District Council • Warwickshire County Council • Rugby Borough Council • North Warwickshire Borough Council
Table 57: Combined Authority Membership in WM
95 https://gbslep.co.uk/what-we-do/making-it-happen/growth-hub 96 https://www.greaterbirminghamchambers.com/international-business-hub/export-documentation/ 97 https://www.blackcountrylep.co.uk 98 https://www.bcgrowthhub.com/support/ 99 https://www.blackcountrychamber.co.uk/membership/ 100 https://www.gov.uk/government/organisations/department-for-international-trade
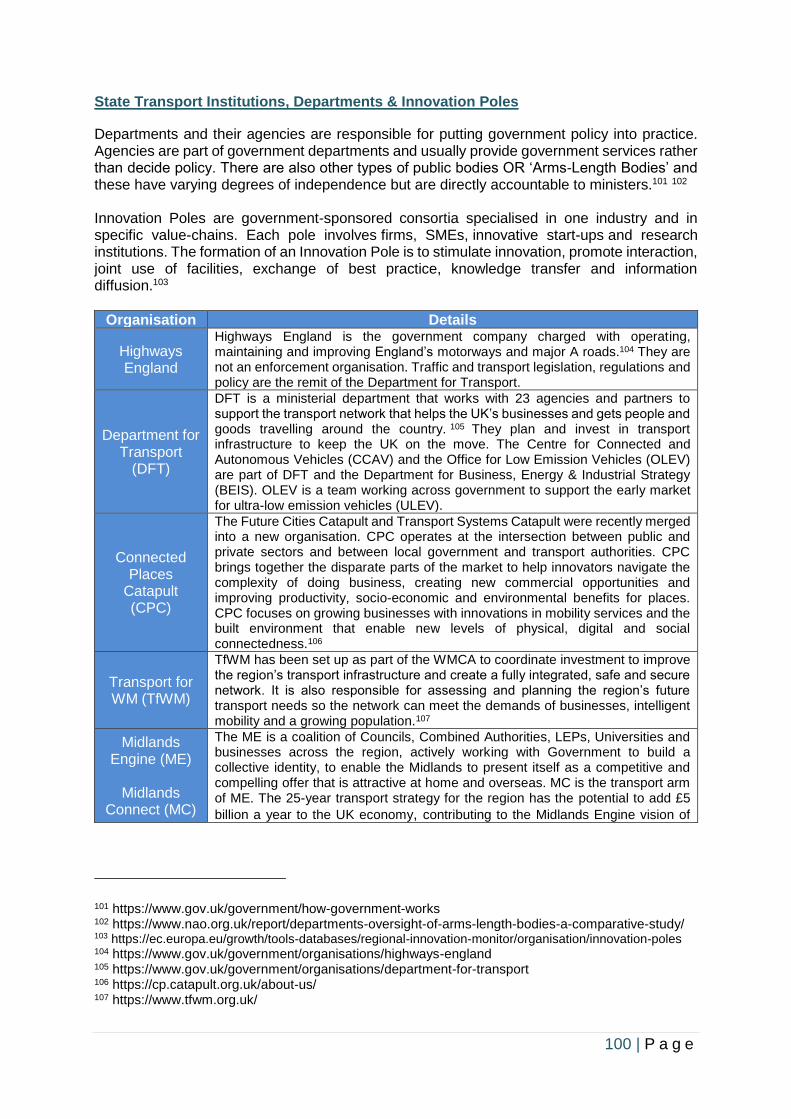
100 | P a g e
State Transport Institutions, Departments & Innovation Poles
Departments and their agencies are responsible for putting government policy into practice. Agencies are part of government departments and usually provide government services rather than decide policy. There are also other types of public bodies OR ‘Arms-Length Bodies’ and these have varying degrees of independence but are directly accountable to ministers.101 102 Innovation Poles are government-sponsored consortia specialised in one industry and in specific value-chains. Each pole involves firms, SMEs, innovative start-ups and research institutions. The formation of an Innovation Pole is to stimulate innovation, promote interaction, joint use of facilities, exchange of best practice, knowledge transfer and information diffusion.103
Organisation Details
Highways England
Highways England is the government company charged with operating, maintaining and improving England’s motorways and major A roads.104 They are not an enforcement organisation. Traffic and transport legislation, regulations and policy are the remit of the Department for Transport.
Department for Transport
(DFT)
DFT is a ministerial department that works with 23 agencies and partners to support the transport network that helps the UK’s businesses and gets people and goods travelling around the country. 105 They plan and invest in transport infrastructure to keep the UK on the move. The Centre for Connected and Autonomous Vehicles (CCAV) and the Office for Low Emission Vehicles (OLEV) are part of DFT and the Department for Business, Energy & Industrial Strategy (BEIS). OLEV is a team working across government to support the early market for ultra-low emission vehicles (ULEV).
Connected Places
Catapult (CPC)
The Future Cities Catapult and Transport Systems Catapult were recently merged into a new organisation. CPC operates at the intersection between public and private sectors and between local government and transport authorities. CPC brings together the disparate parts of the market to help innovators navigate the complexity of doing business, creating new commercial opportunities and improving productivity, socio-economic and environmental benefits for places. CPC focuses on growing businesses with innovations in mobility services and the built environment that enable new levels of physical, digital and social connectedness.106
Transport for WM (TfWM)
TfWM has been set up as part of the WMCA to coordinate investment to improve the region’s transport infrastructure and create a fully integrated, safe and secure network. It is also responsible for assessing and planning the region’s future transport needs so the network can meet the demands of businesses, intelligent mobility and a growing population.107
Midlands Engine (ME)
Midlands
Connect (MC)
The ME is a coalition of Councils, Combined Authorities, LEPs, Universities and businesses across the region, actively working with Government to build a collective identity, to enable the Midlands to present itself as a competitive and compelling offer that is attractive at home and overseas. MC is the transport arm of ME. The 25-year transport strategy for the region has the potential to add £5
billion a year to the UK economy, contributing to the Midlands Engine vision of
101 https://www.gov.uk/government/how-government-works 102 https://www.nao.org.uk/report/departments-oversight-of-arms-length-bodies-a-comparative-study/ 103 https://ec.europa.eu/growth/tools-databases/regional-innovation-monitor/organisation/innovation-poles 104 https://www.gov.uk/government/organisations/highways-england 105 https://www.gov.uk/government/organisations/department-for-transport 106 https://cp.catapult.org.uk/about-us/ 107 https://www.tfwm.org.uk/
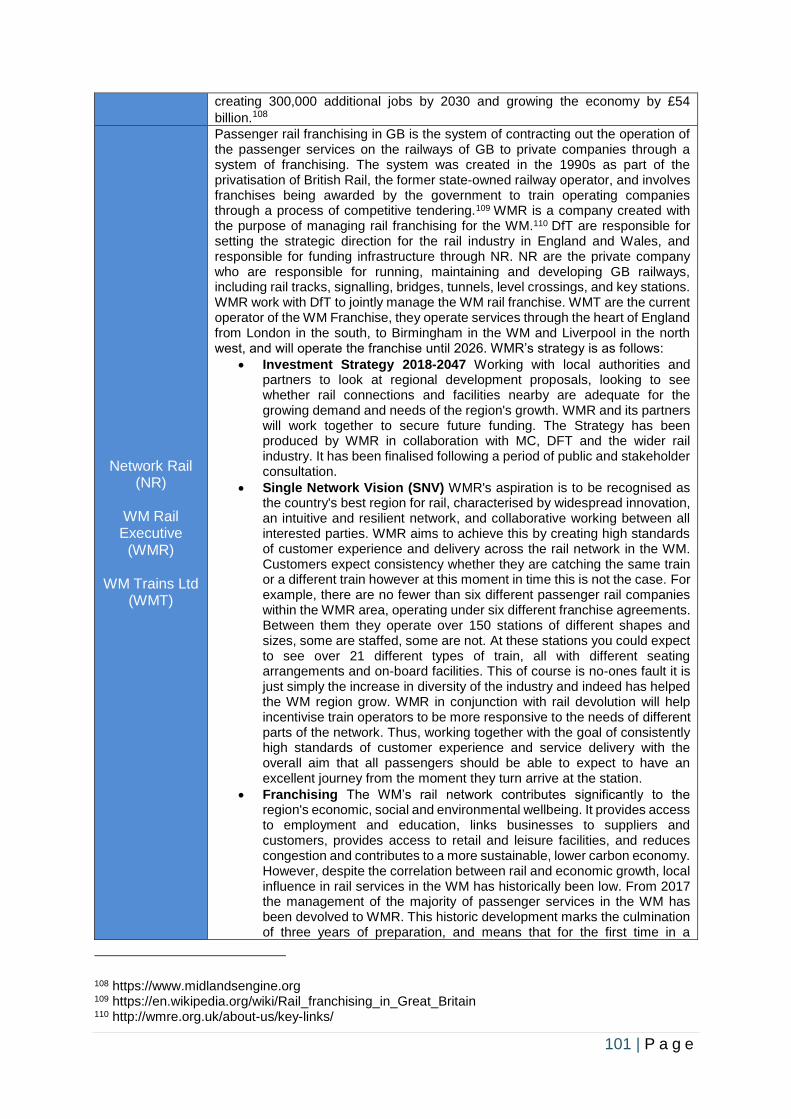
101 | P a g e
creating 300,000 additional jobs by 2030 and growing the economy by £54
billion.108
Network Rail (NR)
WM Rail Executive
(WMR)
WM Trains Ltd (WMT)
Passenger rail franchising in GB is the system of contracting out the operation of the passenger services on the railways of GB to private companies through a system of franchising. The system was created in the 1990s as part of the privatisation of British Rail, the former state-owned railway operator, and involves franchises being awarded by the government to train operating companies through a process of competitive tendering.109 WMR is a company created with the purpose of managing rail franchising for the WM.110 DfT are responsible for setting the strategic direction for the rail industry in England and Wales, and responsible for funding infrastructure through NR. NR are the private company who are responsible for running, maintaining and developing GB railways, including rail tracks, signalling, bridges, tunnels, level crossings, and key stations. WMR work with DfT to jointly manage the WM rail franchise. WMT are the current operator of the WM Franchise, they operate services through the heart of England from London in the south, to Birmingham in the WM and Liverpool in the north west, and will operate the franchise until 2026. WMR’s strategy is as follows:
• Investment Strategy 2018-2047 Working with local authorities and partners to look at regional development proposals, looking to see whether rail connections and facilities nearby are adequate for the growing demand and needs of the region's growth. WMR and its partners will work together to secure future funding. The Strategy has been produced by WMR in collaboration with MC, DFT and the wider rail industry. It has been finalised following a period of public and stakeholder consultation.
• Single Network Vision (SNV) WMR's aspiration is to be recognised as the country's best region for rail, characterised by widespread innovation, an intuitive and resilient network, and collaborative working between all interested parties. WMR aims to achieve this by creating high standards of customer experience and delivery across the rail network in the WM. Customers expect consistency whether they are catching the same train or a different train however at this moment in time this is not the case. For example, there are no fewer than six different passenger rail companies within the WMR area, operating under six different franchise agreements. Between them they operate over 150 stations of different shapes and sizes, some are staffed, some are not. At these stations you could expect to see over 21 different types of train, all with different seating arrangements and on-board facilities. This of course is no-ones fault it is just simply the increase in diversity of the industry and indeed has helped the WM region grow. WMR in conjunction with rail devolution will help incentivise train operators to be more responsive to the needs of different parts of the network. Thus, working together with the goal of consistently high standards of customer experience and service delivery with the overall aim that all passengers should be able to expect to have an excellent journey from the moment they turn arrive at the station.
• Franchising The WM’s rail network contributes significantly to the region's economic, social and environmental wellbeing. It provides access to employment and education, links businesses to suppliers and customers, provides access to retail and leisure facilities, and reduces congestion and contributes to a more sustainable, lower carbon economy. However, despite the correlation between rail and economic growth, local influence in rail services in the WM has historically been low. From 2017 the management of the majority of passenger services in the WM has been devolved to WMR. This historic development marks the culmination of three years of preparation, and means that for the first time in a
108 https://www.midlandsengine.org 109 https://en.wikipedia.org/wiki/Rail_franchising_in_Great_Britain 110 http://wmre.org.uk/about-us/key-links/
102 | P a g e
generation, local train services in the WM will be managed from the region, for the region. This has been made possible through WMR's involvement in the procurement of the latest WM Franchise. Most rail services in the UK are operated under Franchise Agreements let and managed by DFT. The WM Franchise is different as WMR have been involved from the very outset, helping to specify the contract, evaluate bids, and take over responsibility for overseeing delivery.
• WM Stations Alliance Will address issues of a lack of co-ordination between the various parties responsible for station assets and insufficient incentives to invest in significant station enhancements. The approach works within the industry's existing station ownership and contractual structures with partners working together to identify and secure funding to enable an agreed programme of station enhancements to be delivered. The WMSA ultimately aims to create a long term sustainable solution that delivers the SNV in respect of stations and aligns with the objectives set out in the Investment Strategy to transform stations into true community assets which provide quality gateways supporting the changing needs of passengers, residents and visitors.
Rail Supply Group (RSG)
Rail Delivery Group (RDG)
RSG is the leadership body for the sector, working in partnership with the RDG to set the direction for the industry. They provide leadership and guidance to industry and Government, and lead a programme of work on behalf of the UK supply chain. RSG focuses on four areas: driving growth; accelerating innovation; doubling exports and improving skills. There are also a number of crosscutting programmes such as the Industrial Strategy, Sector Deal, SMEs and Digital Railway. Supported by DFT, DIT, and BEIS. 111
UK Research and Innovation
(UKRI)
UKRI is an executive non-departmental public body and the national funding agency investing in science and research in the UK. Operating across the UK with a combined budget of more than £6 billion, UKRI brings together seven Research Councils, Innovate UK and Research England.112
Table 58: State Transport Institutions, Departments & Innovation Poles (WM)
Innovation Clusters
Clusters are groups of specialised enterprises – often SMEs – and other related supporting actors that cooperate in a particular location. In working together SMEs can be more innovative, create more jobs and register more international trademarks and patents than they would alone. 113 Innovation Clusters means groupings of independent undertakings — innovative start-ups, small, medium and large undertakings as well as research organisations. The cluster operates in a particular sector and region, designed to stimulate innovative activity by promoting intensive interactions, sharing of facilities and exchange of expertise, contributing effectively to technology transfer, networking and information dissemination. Preferably, the Member State should intend to create a proper balance of SMEs and large undertakings in the cluster, to achieve a certain critical mass, notably through specialisation in a certain area of research and considering existing clusters in the Member State and at Community-level.114
111 https://www.railsupplygroup.org 112 https://www.ukri.org/ 113 http://ec.europa.eu/growth/industry/policy/cluster_en 114 http://ec.europa.eu/competition/state_aid/legislation/horizontal.html
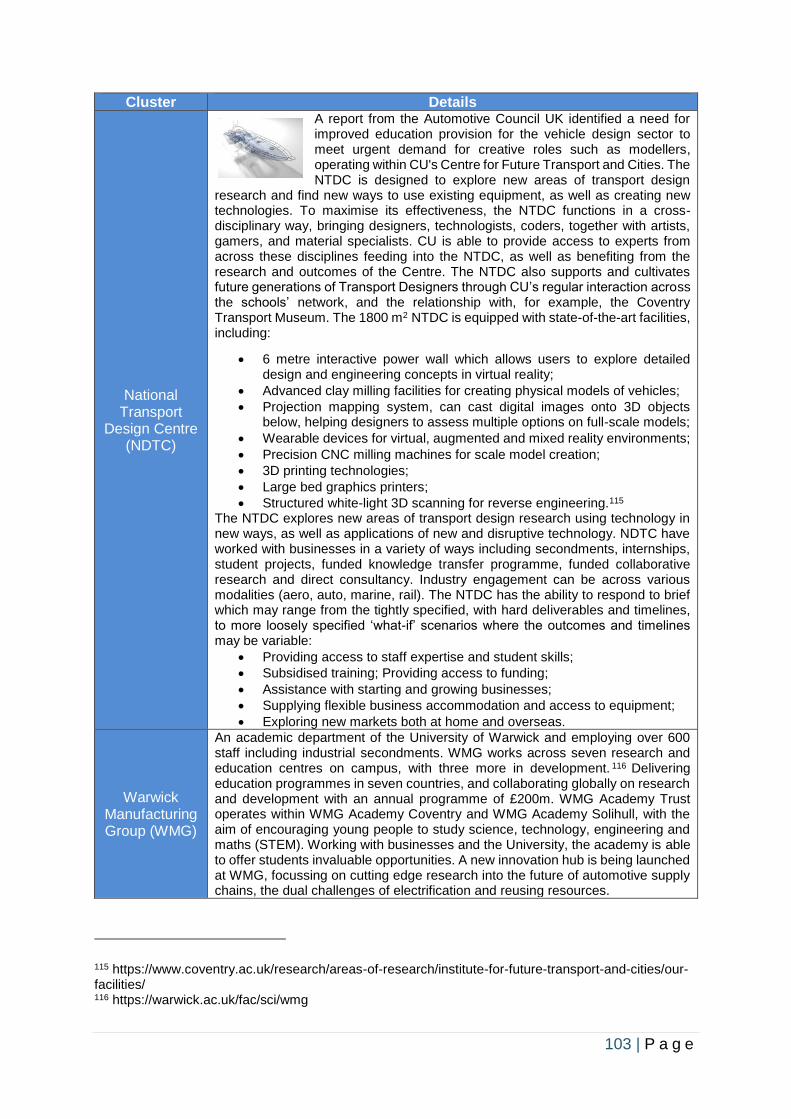
103 | P a g e
Cluster Details
National Transport
Design Centre (NDTC)
A report from the Automotive Council UK identified a need for improved education provision for the vehicle design sector to meet urgent demand for creative roles such as modellers, operating within CU's Centre for Future Transport and Cities. The NTDC is designed to explore new areas of transport design
research and find new ways to use existing equipment, as well as creating new technologies. To maximise its effectiveness, the NTDC functions in a cross-disciplinary way, bringing designers, technologists, coders, together with artists, gamers, and material specialists. CU is able to provide access to experts from across these disciplines feeding into the NTDC, as well as benefiting from the research and outcomes of the Centre. The NTDC also supports and cultivates future generations of Transport Designers through CU’s regular interaction across the schools’ network, and the relationship with, for example, the Coventry Transport Museum. The 1800 m2 NTDC is equipped with state-of-the-art facilities, including:
• 6 metre interactive power wall which allows users to explore detailed design and engineering concepts in virtual reality;
• Advanced clay milling facilities for creating physical models of vehicles;
• Projection mapping system, can cast digital images onto 3D objects below, helping designers to assess multiple options on full-scale models;
• Wearable devices for virtual, augmented and mixed reality environments;
• Precision CNC milling machines for scale model creation;
• 3D printing technologies;
• Large bed graphics printers;
• Structured white-light 3D scanning for reverse engineering.115 The NTDC explores new areas of transport design research using technology in new ways, as well as applications of new and disruptive technology. NDTC have worked with businesses in a variety of ways including secondments, internships, student projects, funded knowledge transfer programme, funded collaborative research and direct consultancy. Industry engagement can be across various modalities (aero, auto, marine, rail). The NTDC has the ability to respond to brief which may range from the tightly specified, with hard deliverables and timelines, to more loosely specified ‘what-if’ scenarios where the outcomes and timelines may be variable:
• Providing access to staff expertise and student skills;
• Subsidised training; Providing access to funding;
• Assistance with starting and growing businesses;
• Supplying flexible business accommodation and access to equipment;
• Exploring new markets both at home and overseas.
Warwick Manufacturing Group (WMG)
An academic department of the University of Warwick and employing over 600 staff including industrial secondments. WMG works across seven research and education centres on campus, with three more in development. 116 Delivering education programmes in seven countries, and collaborating globally on research and development with an annual programme of £200m. WMG Academy Trust operates within WMG Academy Coventry and WMG Academy Solihull, with the aim of encouraging young people to study science, technology, engineering and maths (STEM). Working with businesses and the University, the academy is able to offer students invaluable opportunities. A new innovation hub is being launched at WMG, focussing on cutting edge research into the future of automotive supply chains, the dual challenges of electrification and reusing resources.
115 https://www.coventry.ac.uk/research/areas-of-research/institute-for-future-transport-and-cities/our-facilities/ 116 https://warwick.ac.uk/fac/sci/wmg
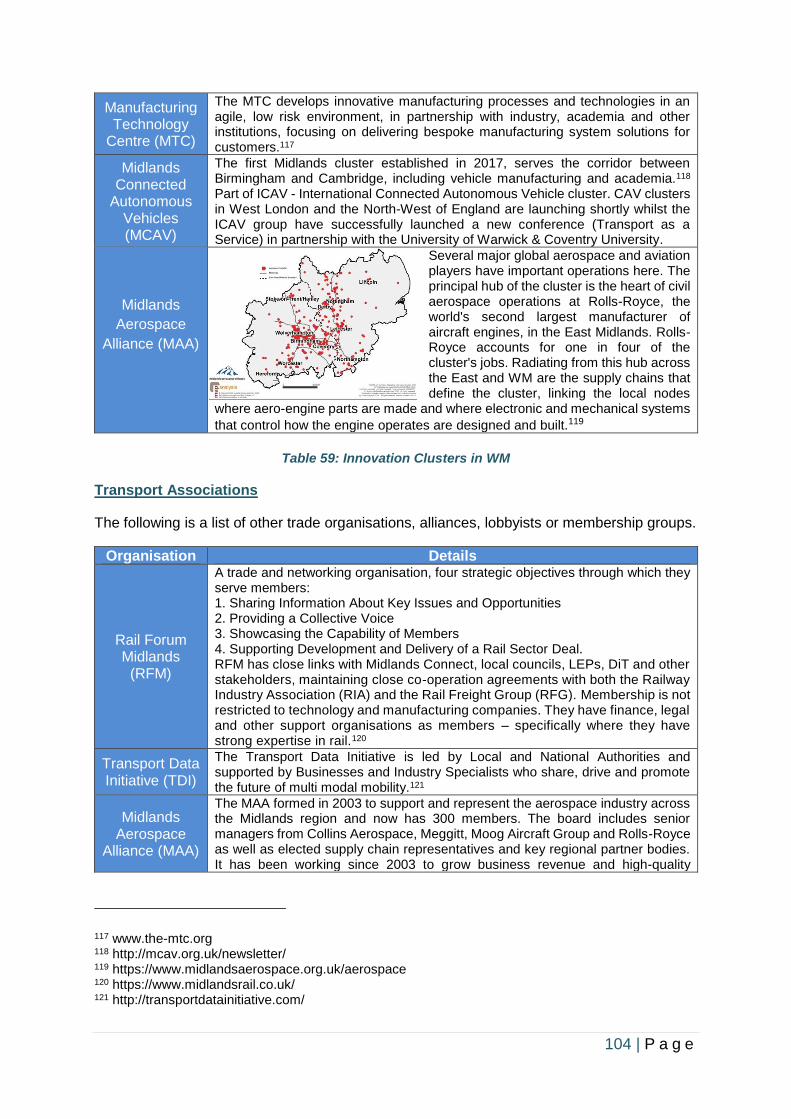
104 | P a g e
Manufacturing Technology
Centre (MTC)
The MTC develops innovative manufacturing processes and technologies in an agile, low risk environment, in partnership with industry, academia and other institutions, focusing on delivering bespoke manufacturing system solutions for customers.117
Midlands Connected
Autonomous Vehicles (MCAV)
The first Midlands cluster established in 2017, serves the corridor between Birmingham and Cambridge, including vehicle manufacturing and academia.118 Part of ICAV - International Connected Autonomous Vehicle cluster. CAV clusters in West London and the North-West of England are launching shortly whilst the ICAV group have successfully launched a new conference (Transport as a Service) in partnership with the University of Warwick & Coventry University.
Midlands
Aerospace
Alliance (MAA)
Several major global aerospace and aviation players have important operations here. The principal hub of the cluster is the heart of civil aerospace operations at Rolls-Royce, the world's second largest manufacturer of aircraft engines, in the East Midlands. Rolls-Royce accounts for one in four of the cluster's jobs. Radiating from this hub across the East and WM are the supply chains that define the cluster, linking the local nodes
where aero-engine parts are made and where electronic and mechanical systems
that control how the engine operates are designed and built.119
Table 59: Innovation Clusters in WM
Transport Associations
The following is a list of other trade organisations, alliances, lobbyists or membership groups.
Organisation Details
Rail Forum Midlands
(RFM)
A trade and networking organisation, four strategic objectives through which they serve members: 1. Sharing Information About Key Issues and Opportunities 2. Providing a Collective Voice 3. Showcasing the Capability of Members 4. Supporting Development and Delivery of a Rail Sector Deal. RFM has close links with Midlands Connect, local councils, LEPs, DiT and other stakeholders, maintaining close co-operation agreements with both the Railway Industry Association (RIA) and the Rail Freight Group (RFG). Membership is not restricted to technology and manufacturing companies. They have finance, legal and other support organisations as members – specifically where they have strong expertise in rail.120
Transport Data Initiative (TDI)
The Transport Data Initiative is led by Local and National Authorities and supported by Businesses and Industry Specialists who share, drive and promote the future of multi modal mobility.121
Midlands Aerospace
Alliance (MAA)
The MAA formed in 2003 to support and represent the aerospace industry across the Midlands region and now has 300 members. The board includes senior managers from Collins Aerospace, Meggitt, Moog Aircraft Group and Rolls-Royce as well as elected supply chain representatives and key regional partner bodies. It has been working since 2003 to grow business revenue and high-quality
117 www.the-mtc.org 118 http://mcav.org.uk/newsletter/ 119 https://www.midlandsaerospace.org.uk/aerospace 120 https://www.midlandsrail.co.uk/ 121 http://transportdatainitiative.com/
105 | P a g e
employment for companies and people involved in the aerospace industry across the Midlands. The mission of the Midlands Aerospace Alliance within the aerospace cluster is to promote and support cooperation between customers, suppliers, the public sector and other partners in the Midlands and globally in order to improve the competitiveness of all our Midlands companies in global aerospace markets, achieving things together which could not be achieved if they worked alone.122
ITS UK ITS UK, the UK association for the promotion of Intelligent Transport Systems (ITS), is a not-for-profit public/private sector association financed by members’ subscriptions, and provides a forum for ITS.123
Haulage & Freight
Associations
The Transport Association consists of 60 haulage companies, providing a nationwide network of 4,000 vehicles and 150 sites. 124 The Heavy Transport Association (HTA) is the only specialist Trade Association for the heavy/abnormal load industry in the UK. Meetings alternate between North of England and the Midlands.125 The Road Haulage Association (RHA) is the trade association of choice for road transport and freight logistics operators.
Society of Motor
Manufacturers and Traders
(SMMT)
SMMT is one of the largest and most influential trade associations in the UK. Its resources, reputation and unrivalled automotive data place it at the heart of the UK automotive industry. SMMT is the voice of the UK motor industry, supporting and promoting its members’ interests, at home and abroad, to government, stakeholders and the media. SMMT represents more than 800 automotive companies in the UK, providing them with a forum to voice their views on issues affecting the sector, helping to guide strategies and build positive relationships with government and regulatory authorities.
Institute of Engineering & Technology
(IET)
IET champion travel and transport for people by air, sea, rail and road, focussing on opportunities for engineering and technology. Bringing together experts from industry, academia and government, they deliver programmes of activity, inspired by issues of the day and innovation around transport from autonomous vehicles, mobility as a service, to integrated systems and beyond.126
Federation of Small
Businesses (FSB)
Offering not for profit small business advice, financial expertise, support and a powerful voice in UK government. For WM and Warwickshire FSB operates from three locations covering a large geographic area and offering networking and business support opportunities for SME’s in the area. They have a specific manifesto to support SMEs in the WM region. They are campaigning for HS2 (High Speed Rail) to benefit small businesses by including and recruiting them as part of the procurement process.127
Professional Memberships
The Institute of Highway Engineers is the institution for practitioners in highway and traffic engineering offering Engineering Council registration and professional development support. 128 The Chartered Institution of Highways & Transportation (CIHT) is a charity, learned society and membership body with 12 UK regions and a number of international groups. CIHT represents and qualify professionals who plan, design, build, manage and operate transport and infrastructure. CIHT WM branch has over 1000 members.129
Sustainability WM
A network of sustainability and energy management professionals based in the WM public sector sharing best practice and collaboration opportunities.130
Table 60: Transport Associations in WM / UK
122 https://www.midlandsaerospace.org.uk/ 123 https://its-uk.org.uk/ 124 https://www.transportassociation.co.uk/ 125 http://www.hta.uk.net/ 126 https://www.theiet.org/ 127 https://www.fsb.org.uk/ 128 https://www.theihe.org/ 129 https://www.ciht.org.uk/ 130 https://www.sustainabilitywestmidlands.org.uk/
106 | P a g e
Network Operators
Network Rail
An arm’s length body for DFT, Network Rail own, operate and develop Britain’s railway infrastructure including 20,000 miles of track, 30,000 bridges, tunnels and viaducts and thousands of signals, level crossings and stations. They manage and deliver thousands of projects every year that form part of the multi-billion pound Railway Upgrade Plan, to grow and expand the nation’s railway network to respond to the tremendous growth and demand the railway has experienced – a doubling of passenger journeys over the past 20 years.131
Network WM (NWM)
TfWM, working in partnership with bus operators, train operators and Midland Metro, delivers major public transport schemes and improvements to bus, rail and tram services. NWM is a public-private partnership between TfWM and the bus, train and tram operators to help passengers get around and access the information they need. TfWM does not operate bus, train or tram services, but it does run bus stations, provide bus shelters and subsidise socially necessary bus services. It also funds free travel for older and disabled people and half-price travel for the under 16s. Private companies operate bus, train and tram services in the WM. All these partners work together to provide better passenger information and improve services through NWM.132
Table 61: Network Operators in WM / UK
Campania Region
Italy
Stakeholders
Regarding the involvement of stakeholders in Campania, two authorities are active: - DAC for the Aerospace - DATTILO for Surface Transport and Logistics
For Aerospace in Campania, the birth of DAC represented an action towards the creation and management of an industrial network model that guarantees the design of competitive solutions to be presented to markets, both nationally and internationally, with the aim to consolidate and integrate industrial regional world, such as commercial aviation, general aviation, space and carriers, maintenance and transformation.
154 actors are involved in DAC for a total turnover of 9.8 billion euros: 12 large companies (including Leonardo, MBDA, Magnaghi Aeronautica, Atitech, DEMA, Telespazio, ALA, IDS), 12 research centres (including CIRA, CNR, ENEA, Formit and the 5 Universities of Campania with engineering courses) and 130 SMEs (many of which are grouped into 8 consortia). The Consortium has a share capital of 66.44% with private capital and 33.56% with public capital.
131 https://www.networkrail.co.uk/ 132 https://www.networkwestmidlands.com/
107 | P a g e
The DAC includes regional stakeholders operating in the Aerospace Research, Development and Training sectors divided into four sectoral areas:
- commercial aviation for the development of enabling methods and technologies for the design and construction of new regional aircrafts;
- general aviation for the development of manufacturing techniques and assembly of light aircraft for the Business & General Aviation (B&G Aviation);
- space and carriers for design and development of space platforms such as micro satellites and any dual technologies related to vectors and systems for logistics and communications.
Dattilo's mission is to promote R&D, training and scientific dissemination activities in advanced logistics, automotive and railway sectors.
The members of DATTILO District include the main industrial players in Campania for the following sectors:
- Automotive Supply Chain: represented by the ANFIA association which brings together the main road vehicle manufacturers including large groups such as FIAT and Adler;
- Railway Sector: Ansaldo STS; Hitachi Rail Italy; CEA; CTIF; Consorzio Tecnologies; INTECS Solutions SPA; SESAMO consortium;
- Logistics chain: ASTER, CID software; Eurohandling srl, Innovaway Spa, Medinok Spa, National Services Maritime Sighting S.c.a.r.l.
DATTILO has established a limited liability consortium with joint stakes in automotive and railway industry (38% each) and with 10% participation in logistics chain.
With regard to the public research bodies represented by the Regional Transport Competence Centers (TEST) and the ICT (CeRICT Regional Research Center for Information and Telecommunication Technologies), the participation is at 14%.
DATTILO intends to operate in the field of surface transport (automotive, railway, logistics) for: - Increase business competitiveness; - Attract new investments in Campania; - Increase scientific and technological industrial skills; - Support the growth of Campania's SMEs through the development of high added value
products, create "network excellence"; - Attracting human resources.
The regional context of public research in the field of Transport and Advanced Logistics is characterized by a rich offer of know-how, in some fields result of historical research schools that are of excellence in the world.
In the specific field of transport engineering systems, Campania is undoubtedly the region with the highest academic and scientific national qualification, with a scientific production that is quantitatively and qualitatively superior from 3 to 5 times compared to the national average.
The main public and private research organisations in the Region, the CNR (National Council of Research), the five Campania Universities, in particular the following departments and Interdepartmental Centres and Laboratories:
- SCIC (Center of excellence in structural components for innovative applications); - COHERENTIA (Physics and Applications of Coherent cases in the fields of Optics and
Superconductivity); - CeSMA (Advanced Measurements Service Centre); - CEMSAC (Centre of Excellence on Methods and Systems for Competitive Companies); - Accelerator Laboratory, Radioactivity Laboratory, CIRCE Laboratory, Scientific
Computing Laboratory, Programming and Calculation Laboratory L1 and L2, Physical Education Laboratory, Laser Spectroscopy Laboratory, Data Acquisition Laboratory, Laboratory of Electronics and Cybernetics, Laboratory of Environmental Physics , Laboratory of Particle and Sub-nuclear Physics, Laboratory of Theoretical and Mathematical Physics, Antenna Laboratory, Computer Architecture and Networks
108 | P a g e
Laboratory, Multimedia Data Base Laboratory, CAD Laboratory, Instrument Calibration Laboratory, Semiconductor Electric Characterization Laboratory, Electrothermal Characterization Laboratory, Laboratory Electrical and Magnetic Diagnostic Circuits, Automatic Control Laboratory, Continuous Currents Laboratory for Transportation, Short Circuit Laboratory, Electromagnetic Compatibility Laboratory, OPSLab Laboratory (Problem Solving and Optimization), Laboratory Processing Se gnali Images, Electronics Laboratory;
- the CCMMMA - Campania Campus for Marine and Atmospheric Modeling and Monitoring;
- the ReCaS supercomputing infrastructure for simulations, data analysis and data storage;
- Accelerator Laboratory of the Department of Physics “E. Pancini "; - RISSC-LAB seismology laboratory;
will be involved for their respective competences.
Institutional Stakeholders
Alongside the abovementioned stakeholders - consortia of companies and universities - there are further actors of institutional legal status to cope with these issues:
- Conference of Regions and Autonomous Provinces of Trento and Bolzano, - Employers' Associations and Trade Union Organisations, - Board of the Economic and Social Partnership for implementation and planning of the
European Regional Development Fund.
Conference of Regions and Autonomous Provinces of Trento and Bolzano
See the next paragraph 3.3
Trade Union Organisations and Employers' Organisations.
Trade Union Associations
The main ones are as follows: CGIL, CISL, UIL, UGL, CISAL, CIDA, USB.
Employers’ Associations
- CONFINDUSTRIA - Confederation of Industries - CONFAPI – Confederation of Small and Medium Enterprises - CONFCOMMERCIO - Confederation of Commerce - CONFESERCENTI - Confederation of exhibitors. - CNA - National Confederation of Crafts and Small and Medium Enterprise - CLAAI Confederation of Free Italian Crafts Associations - CASARTIGIANI - Confederation Autonomous of artisans' associations - CONFARTI - Confederation of Crafts - COLDIRETTI – Confederation of Direct Growers - CIA – Italian Farmers Confederation - CONFAGRICOLTURA – Confederation of Agriculture
Board of the Economic and Social Partnership for implementation and planning of the European Regional Development Fund.
The “Regional Economic and Social Partnership” is aimed to promote the participation of economic and social representatives in the definition of strategies and orientations to be taken
109 | P a g e
by different Directorates of the Regional Administration throughout the programming cycles. It guarantees representativeness, skills and active participation in all Programming phases of social, economic and institutional actors of the region.
The Regional Economic and Social Partnership is composed by the following economic and institutional actors:
a. Institutional parties
- National Association of Italian Municipalities (ANCI) – CAMPANIA Section - League of Local Autonomies - Union of the Italian Provinces - National Union of Municipalities, Communities and Mountain Municipalities - Naples Metropolitan Area - Regional School Directorate - Regional University Committee - National Office Against Racial Discrimination
b. Economic and social parties
• Trade union associations (quoted in the previous paragraph)
• Employers' associations (quoted in the previous paragraph)
• Associations of the World of Cooperation - COOP LEGA – Cooperative League - AGCI - General Association of Italian Cooperatives - CONFCOOPERATIVE – Confederation of Cooperatives
• Other Associations - ABI - Italian Banking Association - CONFSERVICES - Confederation of Companies operating in Services sectors - ACLI - Catholic Association of Italian Workers - UNCI - Italian National Cooperative Union - UNIMPRESA – National Union of Enterprises - UNIONCAMERE - Union of Chambers of Commerce - CONFPROFESSIONS – Confederation of Freelancers - ANCE – National Association of Building Builders
c. Bodies representing civil society
- Third Sector Forum - READ MORE – League for the Environment - WWF – World Wild Fund for Nature - FEDERPARCHI – Italian Federation of Parks and Nature Reserves - FEDERFAUNA - Confederation of Farmers' Union, Traders and Animal Keepers
110 | P a g e
South Aegean Region
Greece
Stakeholders
The Region of South Aegean consists of public authorities and organisations as well as private and public companies, research institutes and a multi-campus University.
DAFNI Network mentioned above plays an important role in the region through various activities. It participates as a partner and/or associate partner in European projects, providing resources for the implementation of actions and projects to member islands in the areas of Renewable Energy Sources (RES), smart grids (energy, water, transport) and energy storage, building and street lighting energy efficiency, electrification, integrated local energy planning, and youth employment. In addition to the European ones, DAFNI Network implements a series of projects with special added value for its members as a whole as well as for individual islands, drawing on different sources of funding. DAFNI Network offers technical support to its members for the integrated planning and efficient management of local infrastructures, the completion and deployment of local development projects, the pilot implementation of innovative technologies, as well as the ability to train executives of local authorities in the above sectors. DAFNI Network coordinates and actively participates in initiatives to strengthen local self-government and island communities by pursuing the development of policies tailored to the special challenges and development potential of the islands. The DAFNI Network, through conferences, informational workshops, participatory workshops, training seminars and awareness-raising actions at local, national and European level, contributes to the transfer of knowledge, the exchange of experiences and good practices, as well as the networking and strengthening of synergies between actors with an active role and strong interest in the sustainable development of islands.
As a region, RSA is able to conduct planning and development based on the needs, challenges and opportunities of the local communities in alignment with the national guidelines as they have been developed. The following Table 13 presents the identified stakeholders at both regional and local levels as well as the national ones that provide guidelines and directions and affect the RSA.
National Regional/Local
General Directorate for Development, Planning,
Environment and Infrastructure
Municipalities
General Directorate for Transport and
Telecommunications
University of Aegean
Directorate for Technical Services Dafni network
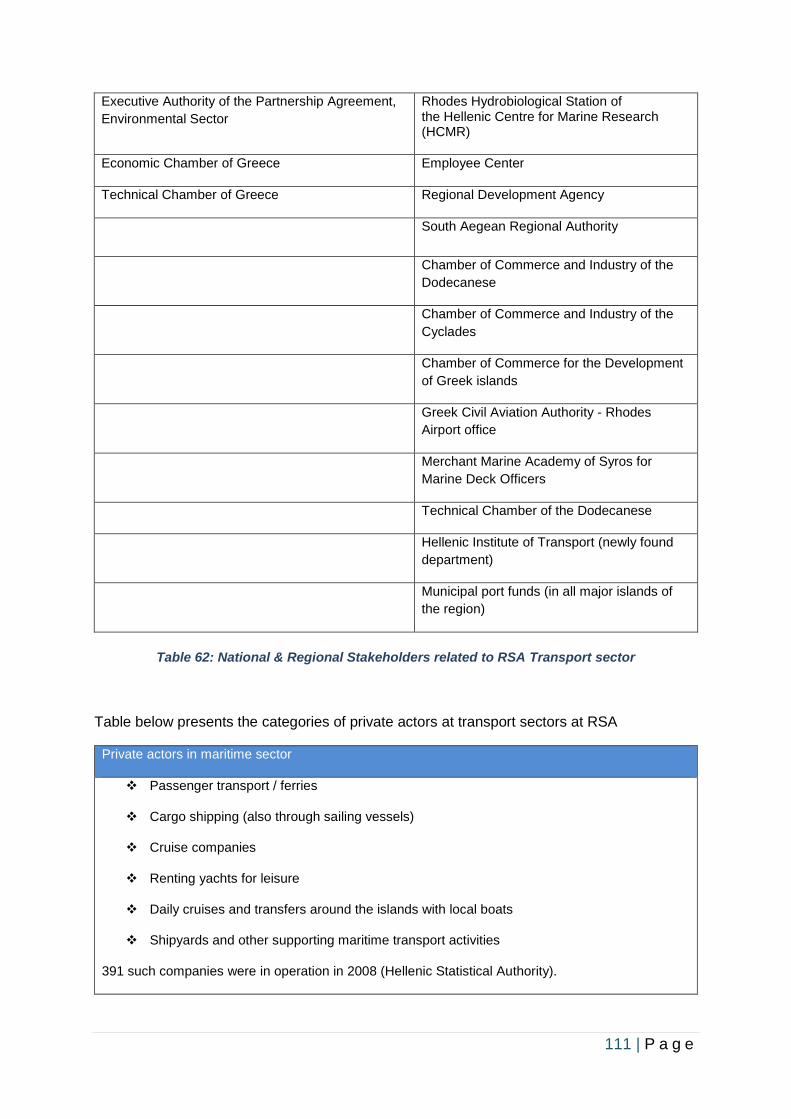
111 | P a g e
Executive Authority of the Partnership Agreement,
Environmental Sector
Rhodes Hydrobiological Station of the Hellenic Centre for Marine Research (HCMR)
Economic Chamber of Greece Employee Center
Technical Chamber of Greece Regional Development Agency
South Aegean Regional Authority
Chamber of Commerce and Industry of the
Dodecanese
Chamber of Commerce and Industry of the
Cyclades
Chamber of Commerce for the Development
of Greek islands
Greek Civil Aviation Authority - Rhodes
Airport office
Merchant Marine Academy of Syros for
Marine Deck Officers
Technical Chamber of the Dodecanese
Hellenic Institute of Transport (newly found
department)
Municipal port funds (in all major islands of
the region)
Table 62: National & Regional Stakeholders related to RSA Transport sector
Table below presents the categories of private actors at transport sectors at RSA
Private actors in maritime sector
❖ Passenger transport / ferries
❖ Cargo shipping (also through sailing vessels)
❖ Cruise companies
❖ Renting yachts for leisure
❖ Daily cruises and transfers around the islands with local boats
❖ Shipyards and other supporting maritime transport activities
391 such companies were in operation in 2008 (Hellenic Statistical Authority).
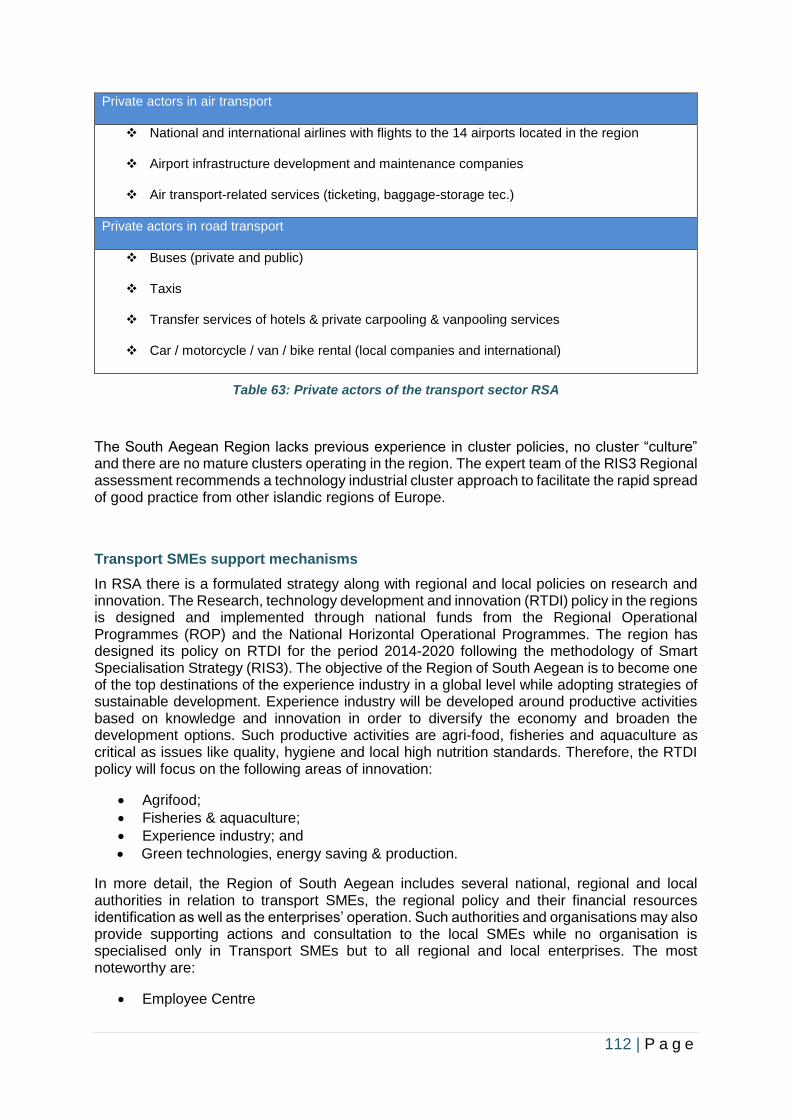
112 | P a g e
Private actors in air transport
❖ National and international airlines with flights to the 14 airports located in the region
❖ Airport infrastructure development and maintenance companies
❖ Air transport-related services (ticketing, baggage-storage tec.)
Private actors in road transport
❖ Buses (private and public)
❖ Taxis
❖ Transfer services of hotels & private carpooling & vanpooling services
❖ Car / motorcycle / van / bike rental (local companies and international)
Table 63: Private actors of the transport sector RSA
The South Aegean Region lacks previous experience in cluster policies, no cluster “culture” and there are no mature clusters operating in the region. The expert team of the RIS3 Regional assessment recommends a technology industrial cluster approach to facilitate the rapid spread of good practice from other islandic regions of Europe.
Transport SMEs support mechanisms
In RSA there is a formulated strategy along with regional and local policies on research and innovation. The Research, technology development and innovation (RTDI) policy in the regions is designed and implemented through national funds from the Regional Operational Programmes (ROP) and the National Horizontal Operational Programmes. The region has designed its policy on RTDI for the period 2014-2020 following the methodology of Smart Specialisation Strategy (RIS3). The objective of the Region of South Aegean is to become one of the top destinations of the experience industry in a global level while adopting strategies of sustainable development. Experience industry will be developed around productive activities based on knowledge and innovation in order to diversify the economy and broaden the development options. Such productive activities are agri-food, fisheries and aquaculture as critical as issues like quality, hygiene and local high nutrition standards. Therefore, the RTDI policy will focus on the following areas of innovation:
• Agrifood;
• Fisheries & aquaculture;
• Experience industry; and
• Green technologies, energy saving & production.
In more detail, the Region of South Aegean includes several national, regional and local authorities in relation to transport SMEs, the regional policy and their financial resources identification as well as the enterprises’ operation. Such authorities and organisations may also provide supporting actions and consultation to the local SMEs while no organisation is specialised only in Transport SMEs but to all regional and local enterprises. The most noteworthy are:
• Employee Centre
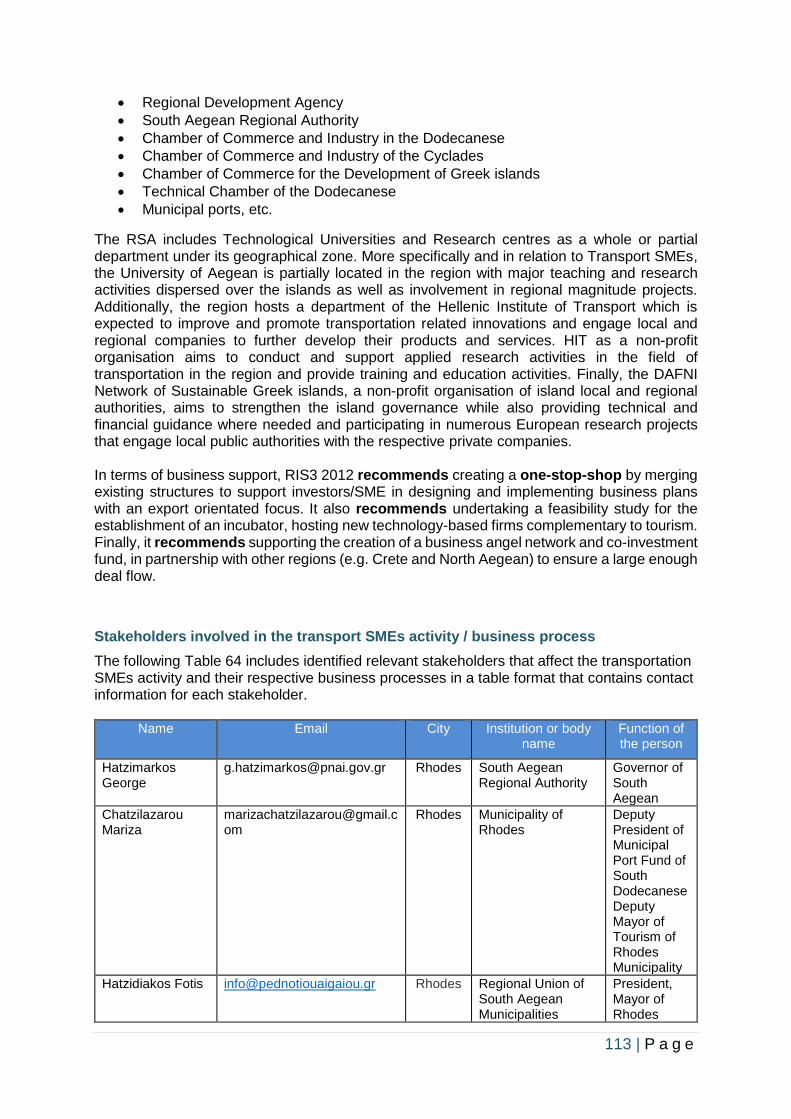
113 | P a g e
• Regional Development Agency
• South Aegean Regional Authority
• Chamber of Commerce and Industry in the Dodecanese
• Chamber of Commerce and Industry of the Cyclades
• Chamber of Commerce for the Development of Greek islands
• Technical Chamber of the Dodecanese
• Municipal ports, etc.
The RSA includes Technological Universities and Research centres as a whole or partial department under its geographical zone. More specifically and in relation to Transport SMEs, the University of Aegean is partially located in the region with major teaching and research activities dispersed over the islands as well as involvement in regional magnitude projects. Additionally, the region hosts a department of the Hellenic Institute of Transport which is expected to improve and promote transportation related innovations and engage local and regional companies to further develop their products and services. HIT as a non-profit organisation aims to conduct and support applied research activities in the field of transportation in the region and provide training and education activities. Finally, the DAFNI Network of Sustainable Greek islands, a non-profit organisation of island local and regional authorities, aims to strengthen the island governance while also providing technical and financial guidance where needed and participating in numerous European research projects that engage local public authorities with the respective private companies. In terms of business support, RIS3 2012 recommends creating a one-stop-shop by merging existing structures to support investors/SME in designing and implementing business plans with an export orientated focus. It also recommends undertaking a feasibility study for the establishment of an incubator, hosting new technology-based firms complementary to tourism. Finally, it recommends supporting the creation of a business angel network and co-investment fund, in partnership with other regions (e.g. Crete and North Aegean) to ensure a large enough deal flow.
Stakeholders involved in the transport SMEs activity / business process
The following Table 64 includes identified relevant stakeholders that affect the transportation SMEs activity and their respective business processes in a table format that contains contact information for each stakeholder.
Name Email City Institution or body name
Function of the person
Hatzimarkos George
[email protected] Rhodes South Aegean Regional Authority
Governor of South Aegean
Chatzilazarou Mariza
Rhodes Municipality of Rhodes
Deputy President of Municipal Port Fund of South Dodecanese Deputy Mayor of Tourism of Rhodes Municipality
Hatzidiakos Fotis [email protected] Rhodes Regional Union of South Aegean Municipalities
President, Mayor of Rhodes
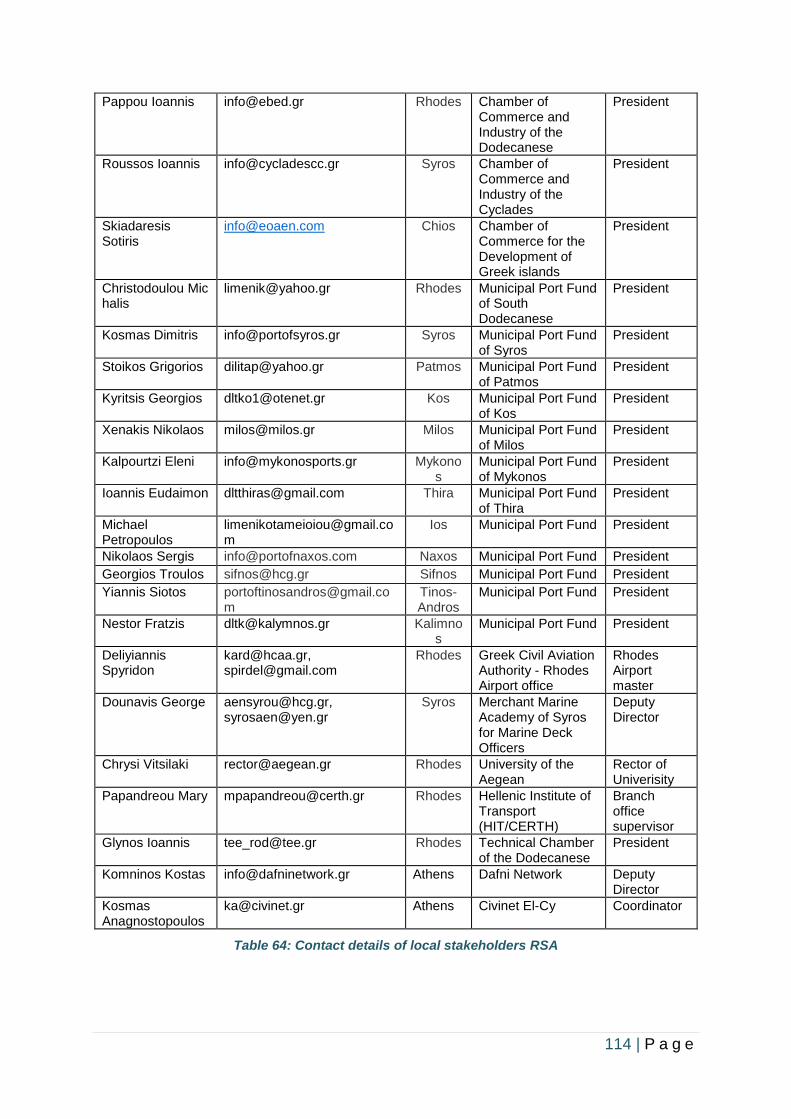
114 | P a g e
Pappou Ioannis [email protected] Rhodes Chamber of Commerce and Industry of the Dodecanese
President
Roussos Ioannis [email protected] Syros Chamber of Commerce and Industry of the Cyclades
President
Skiadaresis Sotiris
[email protected] Chios Chamber of Commerce for the Development of Greek islands
President
Christodoulou Michalis
[email protected] Rhodes Municipal Port Fund of South Dodecanese
President
Kosmas Dimitris [email protected] Syros Municipal Port Fund of Syros
President
Stoikos Grigorios [email protected] Patmos Municipal Port Fund of Patmos
President
Kyritsis Georgios [email protected] Kos Municipal Port Fund of Kos
President
Xenakis Nikolaos [email protected] Milos Municipal Port Fund of Milos
President
Kalpourtzi Eleni [email protected] Mykonos
Municipal Port Fund of Mykonos
President
Ioannis Eudaimon [email protected] Thira Municipal Port Fund of Thira
President
Michael Petropoulos
Ios Municipal Port Fund President
Nikolaos Sergis [email protected] Naxos Municipal Port Fund President
Georgios Troulos [email protected] Sifnos Municipal Port Fund President
Yiannis Siotos [email protected]
Tinos-Andros
Municipal Port Fund President
Nestor Fratzis [email protected] Kalimnos
Municipal Port Fund President
Deliyiannis Spyridon
[email protected], [email protected]
Rhodes Greek Civil Aviation Authority - Rhodes Airport office
Rhodes Airport master
Dounavis George [email protected], [email protected]
Syros Merchant Marine Academy of Syros for Marine Deck Officers
Deputy Director
Chrysi Vitsilaki [email protected] Rhodes University of the Aegean
Rector of Univerisity
Papandreou Mary [email protected] Rhodes Hellenic Institute of Transport (HIT/CERTH)
Branch office supervisor
Glynos Ioannis [email protected] Rhodes Technical Chamber of the Dodecanese
President
Komninos Kostas [email protected] Athens Dafni Network Deputy Director
Kosmas Anagnostopoulos
[email protected] Athens Civinet El-Cy Coordinator
Table 64: Contact details of local stakeholders RSA
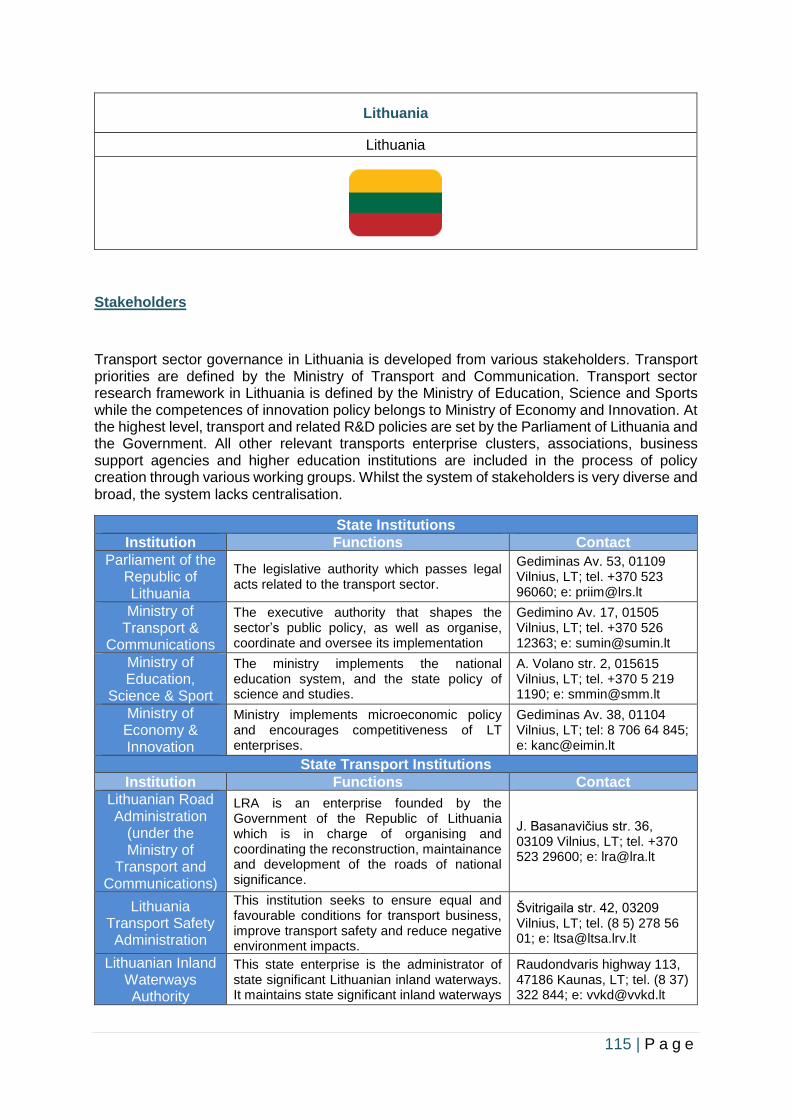
115 | P a g e
Lithuania
Lithuania
Stakeholders
Transport sector governance in Lithuania is developed from various stakeholders. Transport priorities are defined by the Ministry of Transport and Communication. Transport sector research framework in Lithuania is defined by the Ministry of Education, Science and Sports while the competences of innovation policy belongs to Ministry of Economy and Innovation. At the highest level, transport and related R&D policies are set by the Parliament of Lithuania and the Government. All other relevant transports enterprise clusters, associations, business support agencies and higher education institutions are included in the process of policy creation through various working groups. Whilst the system of stakeholders is very diverse and broad, the system lacks centralisation.
State Institutions
Institution Functions Contact
Parliament of the Republic of Lithuania
The legislative authority which passes legal acts related to the transport sector.
Gediminas Av. 53, 01109 Vilnius, LT; tel. +370 523 96060; e: [email protected]
Ministry of Transport &
Communications
The executive authority that shapes the sector’s public policy, as well as organise, coordinate and oversee its implementation
Gedimino Av. 17, 01505 Vilnius, LT; tel. +370 526 12363; e: [email protected]
Ministry of Education,
Science & Sport
The ministry implements the national education system, and the state policy of science and studies.
A. Volano str. 2, 015615 Vilnius, LT; tel. +370 5 219 1190; e: [email protected]
Ministry of Economy & Innovation
Ministry implements microeconomic policy and encourages competitiveness of LT enterprises.
Gediminas Av. 38, 01104 Vilnius, LT; tel: 8 706 64 845; e: [email protected]
State Transport Institutions
Institution Functions Contact
Lithuanian Road Administration
(under the Ministry of
Transport and Communications)
LRA is an enterprise founded by the Government of the Republic of Lithuania which is in charge of organising and coordinating the reconstruction, maintainance and development of the roads of national significance.
J. Basanavičius str. 36, 03109 Vilnius, LT; tel. +370 523 29600; e: [email protected]
Lithuania Transport Safety Administration
This institution seeks to ensure equal and favourable conditions for transport business, improve transport safety and reduce negative environment impacts.
Švitrigaila str. 42, 03209 Vilnius, LT; tel. (8 5) 278 56 01; e: [email protected]
Lithuanian Inland Waterways Authority
This state enterprise is the administrator of state significant Lithuanian inland waterways. It maintains state significant inland waterways
Raudondvaris highway 113, 47186 Kaunas, LT; tel. (8 37) 322 844; e: [email protected]
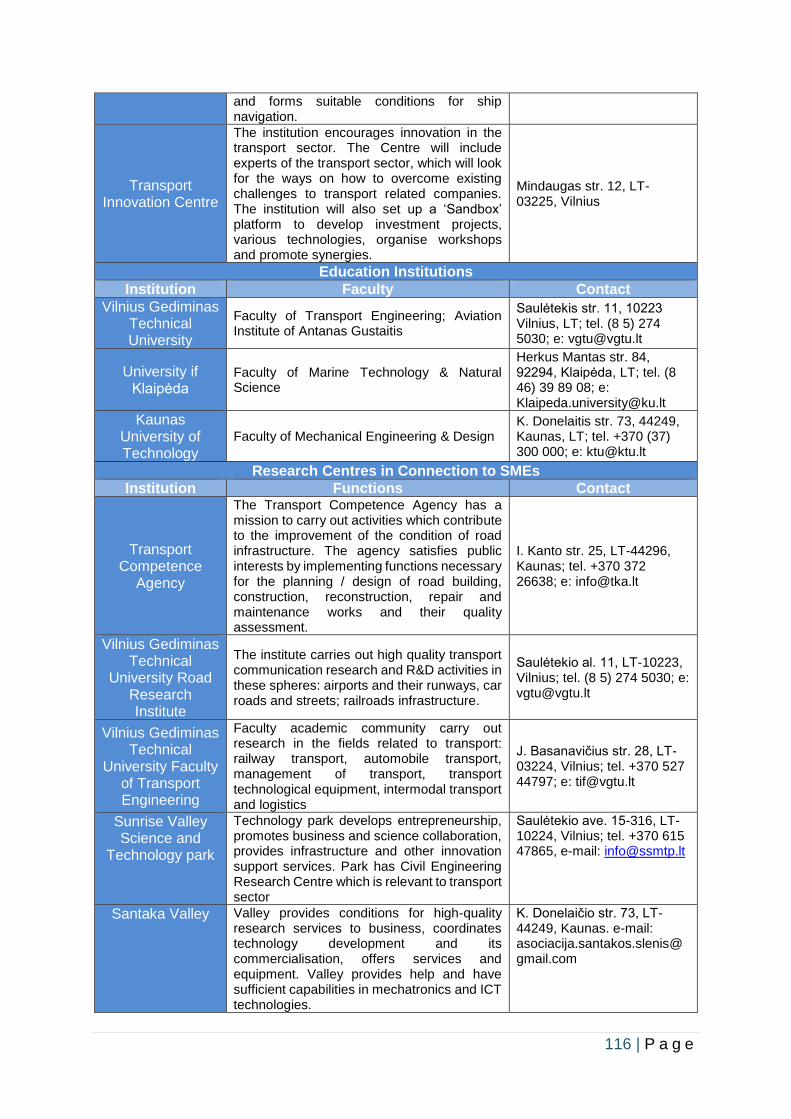
116 | P a g e
and forms suitable conditions for ship navigation.
Transport Innovation Centre
The institution encourages innovation in the transport sector. The Centre will include experts of the transport sector, which will look for the ways on how to overcome existing challenges to transport related companies. The institution will also set up a ‘Sandbox’ platform to develop investment projects, various technologies, organise workshops and promote synergies.
Mindaugas str. 12, LT-03225, Vilnius
Education Institutions
Institution Faculty Contact
Vilnius Gediminas Technical University
Faculty of Transport Engineering; Aviation Institute of Antanas Gustaitis
Saulėtekis str. 11, 10223 Vilnius, LT; tel. (8 5) 274 5030; e: [email protected]
University if Klaipėda
Faculty of Marine Technology & Natural Science
Herkus Mantas str. 84, 92294, Klaipėda, LT; tel. (8 46) 39 89 08; e: [email protected]
Kaunas University of Technology
Faculty of Mechanical Engineering & Design K. Donelaitis str. 73, 44249, Kaunas, LT; tel. +370 (37) 300 000; e: [email protected]
Research Centres in Connection to SMEs
Institution Functions Contact
Transport Competence
Agency
The Transport Competence Agency has a mission to carry out activities which contribute to the improvement of the condition of road infrastructure. The agency satisfies public interests by implementing functions necessary for the planning / design of road building, construction, reconstruction, repair and maintenance works and their quality assessment.
I. Kanto str. 25, LT-44296, Kaunas; tel. +370 372 26638; e: [email protected]
Vilnius Gediminas Technical
University Road Research Institute
The institute carries out high quality transport communication research and R&D activities in these spheres: airports and their runways, car roads and streets; railroads infrastructure.
Saulėtekio al. 11, LT-10223, Vilnius; tel. (8 5) 274 5030; e: [email protected]
Vilnius Gediminas Technical
University Faculty of Transport Engineering
Faculty academic community carry out research in the fields related to transport: railway transport, automobile transport, management of transport, transport technological equipment, intermodal transport and logistics
J. Basanavičius str. 28, LT-03224, Vilnius; tel. +370 527 44797; e: [email protected]
Sunrise Valley Science and
Technology park
Technology park develops entrepreneurship, promotes business and science collaboration, provides infrastructure and other innovation support services. Park has Civil Engineering Research Centre which is relevant to transport sector
Saulėtekio ave. 15-316, LT-10224, Vilnius; tel. +370 615 47865, e-mail: [email protected]
Santaka Valley Valley provides conditions for high-quality research services to business, coordinates technology development and its commercialisation, offers services and equipment. Valley provides help and have sufficient capabilities in mechatronics and ICT technologies.
K. Donelaičio str. 73, LT-44249, Kaunas. e-mail: [email protected]
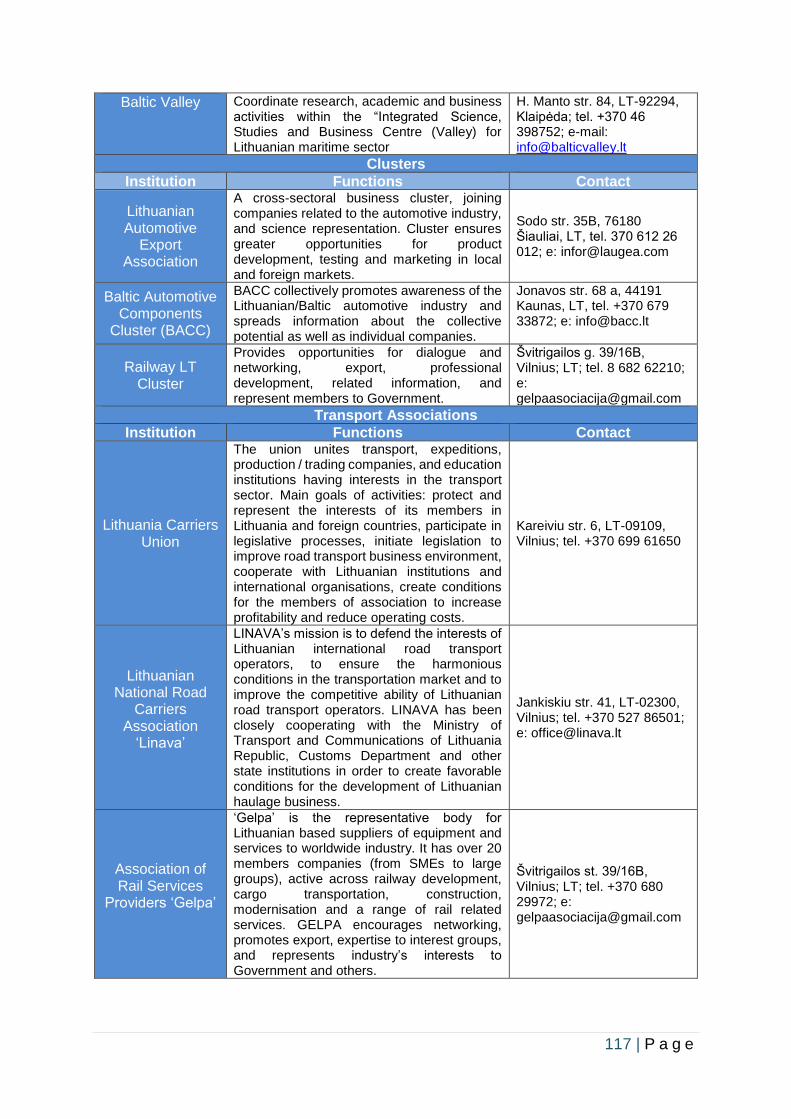
117 | P a g e
Baltic Valley Coordinate research, academic and business activities within the “Integrated Science, Studies and Business Centre (Valley) for Lithuanian maritime sector
H. Manto str. 84, LT-92294, Klaipėda; tel. +370 46 398752; e-mail: [email protected]
Clusters
Institution Functions Contact
Lithuanian Automotive
Export Association
A cross-sectoral business cluster, joining companies related to the automotive industry, and science representation. Cluster ensures greater opportunities for product development, testing and marketing in local and foreign markets.
Sodo str. 35B, 76180 Šiauliai, LT, tel. 370 612 26 012; e: [email protected]
Baltic Automotive Components
Cluster (BACC)
BACC collectively promotes awareness of the Lithuanian/Baltic automotive industry and spreads information about the collective potential as well as individual companies.
Jonavos str. 68 a, 44191 Kaunas, LT, tel. +370 679 33872; e: [email protected]
Railway LT Cluster
Provides opportunities for dialogue and networking, export, professional development, related information, and represent members to Government.
Švitrigailos g. 39/16B, Vilnius; LT; tel. 8 682 62210; e: [email protected]
Transport Associations
Institution Functions Contact
Lithuania Carriers Union
The union unites transport, expeditions, production / trading companies, and education institutions having interests in the transport sector. Main goals of activities: protect and represent the interests of its members in Lithuania and foreign countries, participate in legislative processes, initiate legislation to improve road transport business environment, cooperate with Lithuanian institutions and international organisations, create conditions for the members of association to increase profitability and reduce operating costs.
Kareiviu str. 6, LT-09109, Vilnius; tel. +370 699 61650
Lithuanian National Road
Carriers Association
‘Linava’
LINAVA’s mission is to defend the interests of Lithuanian international road transport operators, to ensure the harmonious conditions in the transportation market and to improve the competitive ability of Lithuanian road transport operators. LINAVA has been closely cooperating with the Ministry of Transport and Communications of Lithuania Republic, Customs Department and other state institutions in order to create favorable conditions for the development of Lithuanian haulage business.
Jankiskiu str. 41, LT-02300, Vilnius; tel. +370 527 86501; e: [email protected]
Association of Rail Services
Providers ‘Gelpa’
‘Gelpa’ is the representative body for Lithuanian based suppliers of equipment and services to worldwide industry. It has over 20 members companies (from SMEs to large groups), active across railway development, cargo transportation, construction, modernisation and a range of rail related services. GELPA encourages networking, promotes export, expertise to interest groups, and represents industry’s interests to Government and others.
Švitrigailos st. 39/16B, Vilnius; LT; tel. +370 680 29972; e: [email protected]
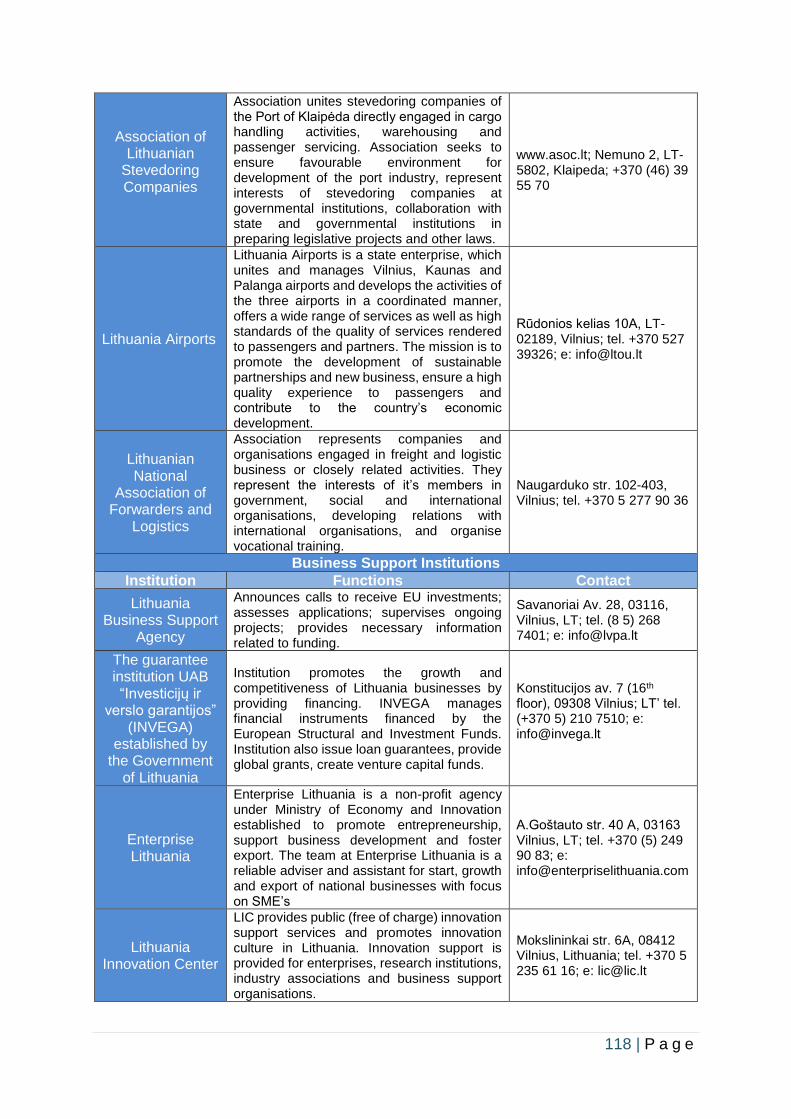
118 | P a g e
Association of Lithuanian
Stevedoring Companies
Association unites stevedoring companies of the Port of Klaipėda directly engaged in cargo handling activities, warehousing and passenger servicing. Association seeks to ensure favourable environment for development of the port industry, represent interests of stevedoring companies at governmental institutions, collaboration with state and governmental institutions in preparing legislative projects and other laws.
www.asoc.lt; Nemuno 2, LT-5802, Klaipeda; +370 (46) 39 55 70
Lithuania Airports
Lithuania Airports is a state enterprise, which unites and manages Vilnius, Kaunas and Palanga airports and develops the activities of the three airports in a coordinated manner, offers a wide range of services as well as high standards of the quality of services rendered to passengers and partners. The mission is to promote the development of sustainable partnerships and new business, ensure a high quality experience to passengers and contribute to the country’s economic development.
Rūdonios kelias 10A, LT-02189, Vilnius; tel. +370 527 39326; e: [email protected]
Lithuanian National
Association of Forwarders and
Logistics
Association represents companies and organisations engaged in freight and logistic business or closely related activities. They represent the interests of it’s members in government, social and international organisations, developing relations with international organisations, and organise vocational training.
Naugarduko str. 102-403, Vilnius; tel. +370 5 277 90 36
Business Support Institutions
Institution Functions Contact
Lithuania Business Support
Agency
Announces calls to receive EU investments; assesses applications; supervises ongoing projects; provides necessary information related to funding.
Savanoriai Av. 28, 03116, Vilnius, LT; tel. (8 5) 268 7401; e: [email protected]
The guarantee institution UAB “Investicijų ir
verslo garantijos” (INVEGA)
established by the Government
of Lithuania
Institution promotes the growth and competitiveness of Lithuania businesses by providing financing. INVEGA manages financial instruments financed by the European Structural and Investment Funds. Institution also issue loan guarantees, provide global grants, create venture capital funds.
Konstitucijos av. 7 (16th floor), 09308 Vilnius; LT’ tel. (+370 5) 210 7510; e: [email protected]
Enterprise Lithuania
Enterprise Lithuania is a non-profit agency under Ministry of Economy and Innovation established to promote entrepreneurship, support business development and foster export. The team at Enterprise Lithuania is a reliable adviser and assistant for start, growth and export of national businesses with focus on SME’s
A.Goštauto str. 40 A, 03163 Vilnius, LT; tel. +370 (5) 249 90 83; e: [email protected]
Lithuania Innovation Center
LIC provides public (free of charge) innovation support services and promotes innovation culture in Lithuania. Innovation support is provided for enterprises, research institutions, industry associations and business support organisations.
Mokslininkai str. 6A, 08412 Vilnius, Lithuania; tel. +370 5 235 61 16; e: [email protected]
119 | P a g e
The Agency for Science,
Innovation and Technologies
(MITA)
It is national agency responsible for the implementation of innovation policy in Lithuania. It provides free-of-charge services to companies interesting in finding international partners or getting financial support for research and innovation projects. MITA also coordinates national activities and international programmes and financial schemes. It also provides information and advice on the protection of intellectual property rights.
A.Goštauto str. 12-219, 01108 Vilnius, LT; tel. (+370 5) 2644 708; e: [email protected]
Table 65: National & Regional Stakeholders related to Lithuania
South-West Oltenia
Romania
Stakeholders Research Centres in Connection to Transport SMEs
1. INCESA Research Centre (Research Hub of Applied Science) 133
Driving Effective Innovation
• Electrical Engineering o Laboratory of Innovative Techniques and Processes in Complex Electromechanical
Systems o Laboratory of Innovative Techniques and Processes in Mechatronics and Robotics o Laboratory of Innovative Techniques and Processes in Smart Grids
• Mechanical Engineering and Materials Science o Laboratory of Physical-Chemical Characterisation and Materials Testing o Laboratory of Microtechnologies o Laboratory of Mechanical Engineering
• Biotechnology and Bioengineering o Laboratory of Innovative Techniques and Processes in Bioengineering o Laboratory of Modelling, Identification and Control of Biochemical and Biotechnological
Processes o Laboratory of Modelling, Identification and Control of Biochemical and Biotechnological
Processes in Biotechnology
133 http://www.incesa.ro/#/
120 | P a g e
• Laboratory of Biomechanics
• Computer Science o Laboratory of Formal Intelligence Integration in Analysis, Simulation, Development,
Testing and Certification of Computation Infrastructures o Laboratory of Computer Engineering o Laboratory of Advance Research in applied mathematics
2. ICMET Craiova – Research & Development and Testing National Institute for
Electrical Engineering 134
• ICMET has expertise in: o High Voltage, High Power and Low Voltage research, development and testing
technology o Monitoring and Diagnosis of the electrical power equipment o Measuring of electrical and non-electrical quantities o Power electronics o Electromagnetic Compatibility o Industry applications
• ICMET Craiova is the national leader in the field of: o Research, Development and testing for high voltage and high-power equipment
Research, Development for monitoring and diagnosis of the electrical power equipment o Unconventional technologies using the effect of the vibratory stress relief o Unconventional technologies using the effect of the compressed - air at supersonic
velocity o It is the only manufacturer of force and mass measuring transducers and equipment
for heavy industrial duty based on magneto-elastic strain gauging, the result of its own research within the interdisciplinary group CERTENSMAG
Transport Related SMEs Clusters/Innovation Poles
1. Automotive SWO Pole 135
• Domain: Automotive
• Website: www.automotive-svoltenia.ro
• A well-defined strategic entity that promotes the Automotive field developed in Craiova area and Oltenia counties to attract new investments.
• It has 37 members. Including car manufacturers and car parts, design firms, educational units, research and development institutes, non-governmental organisations, and public authorities.
• The general objective of the pole: Increasing competitiveness in the Southwest Oltenia region by developing an Automotive pole with a wide range of activities both in the field of training, highly qualified skills required by Ford and its suppliers, and by making new investments, technology transfer and enhanced collaboration between the University of Craiova and the companies active in automotive for the development of joint research projects applied especially in the field of electro mobility in order to use the regional RDI experience in the sector.
• Members:
134 http://www.icmet.ro/ 135 http://www.automotive-svoltenia.ro/
121 | P a g e
o Car Manufacturers:
• S.C. Ford Romania S.A. – motorcar manufacture
o Car parts and components manufacturing:
• S.C. International Automotive Components Group S.R.L. – manufacturer of interiors for motorcars;
• S.C. Kichhoff Automotive Romania – manufacturer of subassembly for motorcars;
• S.C. Altur Slatina S.A. – manufacturer of aluminium cast parts;
• S.C. Novel Industrie SRL- manufacturer of parts.
o Manufacturer companies that plan to develop in automotive industry:
• S.C. Popeci Utilaj Greu S.A.- manufacturer of industrial equipment;
• S.C. Indaeltrac S.R.L.- manufacturer of electronic and electro technical traction systems;
• S.C. Nextrom Industrie S.R.L. - manufacturer of light electric vehicles;
• S.C. SPIACT Craiova S.A. - manufacturer of industrial systems for railway control automation.
o Business companies:
• S.C. Parc Industrial Craiova SA - industrial park;
• S.C. Tour Impex Mapamond MD S.R.L - tour operator and agent;
• SC EVOBRAND SRL - PR company;
• RO Software House S.R.L. - software development;
• S.C. Avitech Co S.R.L. – electronics and communications equipment;
• S.C. Polystart Impex S.R.L. – construction;
• S.C. RM Motors Company S.R.L. - car service;
• S.C.Entrerriors Servicios Generales S.R.L.- metal structures construction;
• S.C. Blue Neon S.R.L. - web services;
• S.C. Aptus Software S.R.L. - web solutions and services;
• S.C. Sondrio Impex S.R.L. - road construction;
• S.C. Cesi Automation S.R.L. – software development;
• S.C. Romsir Impex S.R.L. - heating equipment.
o Universities: University of Craiova – HEI
• Research Institutes
• Research, development, design, innovation:
• Romanian Association of Technology Transfer and Innovation;
• S.C. Caelynx Europe S.R.L.– computer-aided design and engineering (CAE/CAD);
• National Institute of Research-Development and Test for Electrotechnics;
• S.C. IPA S.A. - Research-Development-Innovation in automation;
• Institutul National de Cercetare Dezvoltare pentru Textile si Pielarie;
• S.C. INAS SA – R & D institute for computer-aided design;
• S.C. Uranus S.R.L. – R & D provider for industrial automation.
o Public Authorities:
• Craiova Town Council - LA
• Dolj County Council – LA
o Non-Governmental Organisations:
• Regional Development Agency South-West Oltenia – management entity;
• Olt County Chamber of Commerce and Industry – non-governmental association;
• Dolj County Chamber of Commerce and Industry – non-governmental association;
122 | P a g e
• Craiova Town Council - LA
• Dolj County Council – LA
o RDA SWO – Regional Development Agency South-West Oltenia
• Its core activity is to attracting resources from outside the region and increasing the use of local resources in order to improve the quality of life and social cohesion of local communities in SWO and to increase the competitiveness of regional economy.
• RDA SWO is equally active in the field of innovation projects, initiated the creation of two competitiveness poles, namely Automotive SV Oltenia and Oltenia Tourism Pole - Innovation and Traditions in Tourism - TurOlt InTT.
2. ICT Oltenia Cluster (ICT – Regional Competitiveness Pole Oltenia Cluster) 136
• Domain: ICT
• Website: http://www.aries-oltenia.ro
• Support for business missions, brokerage events for SMEs.
• Support for business missions, brokerage events for SMEs – 30 members
• Access to technology services
• Direct advisory services
• Innovation Management / Support of innovation processes (internal, external)
• It has 30 members.
• Services for SMEs, business cooperation, promotion through participation in
national/international fairs and exhibitions, business internationalisation, development
of a competitiveness pole and expertise.
• Mission: ICT Oltenia Cluster is a flexible structure, open, based on good regional, national/international practices. Its mission can be summed-up in the following points:
o Promote innovation, competitiveness, research, technology transfer as a regional development policy, sustainable by the inter-connection of the knowledge, technologies and people.
o It is an integral part of the regional policy of Oltenia which supports research-development, innovation, technology transfer founding and development of enterprises
o Provide information, specialized consultancy, starts events, meetings and professional contacts;
o Promote and participate in the implementation of informational society and of the society of knowledge in the region of Oltenia;
o Assure promotion of competitiveness of the industry
• Activities: o Support in participating in economic missions, brokerage events for SMEs. o Business internationalisation. o Services for innovative SMEs, research for SMEs. o Creation of start-ups; incubation; o Transfer of research results and technologies to the economic environment. o Consultancy in intellectual property issues; Patents o Consultancy in accessing funding; Creation of national, international partnerships,
business development o Staff training; entrepreneurial training. o Implementation of quality assurance systems.
136 http://www.aries-oltenia.ro/
123 | P a g e
3. INOVTRANS Pole
• Domain: industry, transport
• Manufacturing of rolling stock sector with: rolling stock manufacturers, design, education institutions, Research & Development.
• INOVTRANS POLE was set up in 2012 in the manufacturing of rolling stock.
• The management entity is SC TIMPLEXIM SRL Craiova, the competitiveness pole counting over 25 members and associates: rolling stock manufacturers, design firms, educational establishments, research and development institutes, non-governmental organisations, public authorities.
• These include: o S.C. TIPLEXIM S.R.L., Craiova o RAT CRAIOVA, Dolj o S.C. TRANS INOV S.A., Craiova, o S.C. DIAVAL S.R.L., Craiova o S.C. CESI AUTOMATION S.R.L, Craiova o S.C. CADET JUSTCONSULTING S.R.L., Craiova o S.C. TOPOSYSTEM S.R.L., Craiova o S.C. INDAELTRAC S.R.L., Craiova o S.C. MALITEOS TRANS S.R.L., Craiova o S.C. SITCO SERVICE S.R.L., Craiova, Dolj o S.C. POPECI UTILAJ GREU S.A., Craiova o S.C. EUROMET S.R.L., Balş o S.C. SERES PROD COM S.R.L., Bumbeşti-Jiu o S.C. SOFTRONIC S.R.L., Craiova o University of Craiova o S.C. ICPE SAERP S.A., Bucureşti o SC IPA SA Sucursala CIFATT, Craiova o INCDIE ICMET, Craiova. o Dolj County Council o Craiova Town Council o Regional Development Agency South-West Oltenia etc.
RTDI Infrastructure in Connection To Transport SMEs Since 2014, the SWO region is home to 120 innovative enterprises, from which 85 were small enterprises, 25 medium and 10 big enterprises. From these, 72 were active in the industry sector and 48 in services (INS, 2018). In the same year, there were 26 research institutes and centres, of which 18 worked in agriculture and forestry (INS, 2018). 137 There were also 4 accredited entities for innovation and technological transfer:
• TechTEC - Technology information centre for Tourism and Environment protection;
• CTT INCESA - Technological Transfer Centre;
• ITA - ICSI Technological and Business Incubator; and
• IPA S.A - CIFATT Craiova Business and Technological Incubator). Likewise, the region was home to several industrial and technological parks such as the Bumbesti- Jiu Industrial Park, the Industrial Park in Craiova and the Craiova Technological Park, and 6 business incubators: ITA-ICSI ITA – ICSI Technological and Business Incubator and Business Centre Flandra in Valcea; the Business Centre for SME’s Development in Gorj;
137 https://ec.europa.eu/growth/tools-databases/regional-innovation-monitor/base-profile/south-west-oltenia
124 | P a g e
the Cross Border Business Incubator in Dolj; the IPA CIFATT; and Business Incubator Industrial Park in Craiova. There were also several facilities that can host major exhibits such as Expo Nord Oltenia - Seaca exhibition centre in Valcea and the Border Exhibit Centre as well as the Multifunctional Centre in Craiova. RDI employees represented only 4.1% of the national total in 2016, some 1.321 workers (INS, 2018). The R&D expenditures have been fluctuating over the years, being at €24.5m in 2015 (Eurostat, 2018). This represents 0.2% of the regional GDP, staying below the national average of 0.5% and far below the EU-28 average of 2.0% (Eurostat, 2018). Private companies accounted for 11.8% of the regional R&D expenditures in 2015, which is also below the national average (44.0%) (Eurostat, 2018). The development of the enterprise sector is insufficient, counting with the lowest number of private companies in the country in 2016 (37,405, corresponding to 7.1% of the national total) (INS, 2018). This is a consequence of several factors, including, among others, a high poverty level of the population and a high level of active workforce occupied in subsistence agriculture. Patent applications to the EPO per million inhabitants were at 0.3 in 2012, which is below the national average of 3.0 (Eurostat, 2018). The number of employees in the high-tech sector has decreased from 2014 to 2017, staying at 6,600 employees in 2017. This represented 2.6% of the national employment in the sector and 0.8% of the total employment (against the EU-28 average of 4.0% in the same year). The RDI potential reflects the structural difficulties of the region138 to meet the challenges of the market economy: massive industry lay-offs, especially in coal mining, and return to ‘subsistence agriculture’ during 1995-2000, dependence on mono-industrial cities that went through severe crises, poor capacity to attract FDI, late development of SMEs and financial services, etc. The deepening intra and interregional gaps seriously affect the SWO Region’s catching-up capacity both in relation to other Romanian regions and the EU-28. According to Eurostat (2018), the population aged 30-34 with tertiary education in the region continued to decrease since 2015 and reached 21.6% in 2017, staying below both the national average (26.3%) and the EU-28 average (39.9%). Regarding broadband diffusion, in 2017, 90% of the households in SWO had internet access at home which is below the national average of 97%. RTDI Units in SWO region
1. INCESA Research Centre
2. ICMET Craiova – Research & Development and Testing National Institute for Electrical Engineering
3. National Institutes:
• National Research and Development Institute for Cryogenic and Isotopic Technologies - ICSI Râmnicu Vâlcea;
• Research and Testing Centre for In Flight Aircraft
138 https://ec.europa.eu/growth/tools-databases/regional-innovation-monitor/
125 | P a g e
• INCD and Testing for Electrotechnical Engineering - ICMET Craiova;
• National Institute for Research and Development on Industrial Ecology ECOIND – Vâlcea Branch, Râmnicu Vâlcea;
• National Research Centre on Hydrogen and Combustion Piles Râmnicu Vâlcea
• Universities: o University of Craiova; University of Medicine and Pharmacy in Craiova; o University ‘Constantin Brâncuși’ Târgu Jiu;
• Business companies: Artego SA Tg. Jiu, Popeci Craiova, INDA Craiova, INAS Craiova, Softronic Craiova.
Over the programming period 2014-2020, by Regional Innovation Strategy for Smart Specialisation, as a result of regional analysis and field research, the areas with development potential for smart specialisation are proposed for the SWO Region:
• Industrial engineering and transport
• Sustainable energy and environment
• Fundamental innovative and applicative medicine
• Agriculture and food industry
• Tourism and cultural identity Research Infrastructure There is broad consensus that both economic growth and the future competitiveness of economy will be based on research and information. Unfortunately, Romania in general and SWO, in particular, do allocate a very small percentage of the budget for research activities. Research activity in the South-West Oltenia region is being developed in a total of 11 institutes and research centres which approach also topics in Transport-related areas, that are presented by activity type, as follows:
• Physics and chemistry - 1 unit - Vâlcea
• Information Technology and Computers - 1 unit - Dolj
• Electronics, automation engineering, high tech - 1 unit - Dolj
• Aeronautics - 1 unit - Dolj
• Chemistry, petrochemistry - 4 units - 2 in Vâlcea, 2 in Dolj
• Electrotehnical technology - 2 units - Dolj
• Metallurgical technology - 1 unit - Olt
Technology/Industrial Parks and Incubators
Craiova Industrial Park Sadu Industrial Park
Legislation Govt. decision No.727/2004 HG nr. 1596/2002
Location Ghercesti, jud. Dolj Bumbesti-Jiu, jud Gorj
Area 10.4 Ha 18.62 Ha
Infrastructure Electricity, gas, water, sewage, waste recycle,
telecommunication network
Electricity, gas, water, sewage, telephone network, internet
access, mail services
Current Status Operational Operational
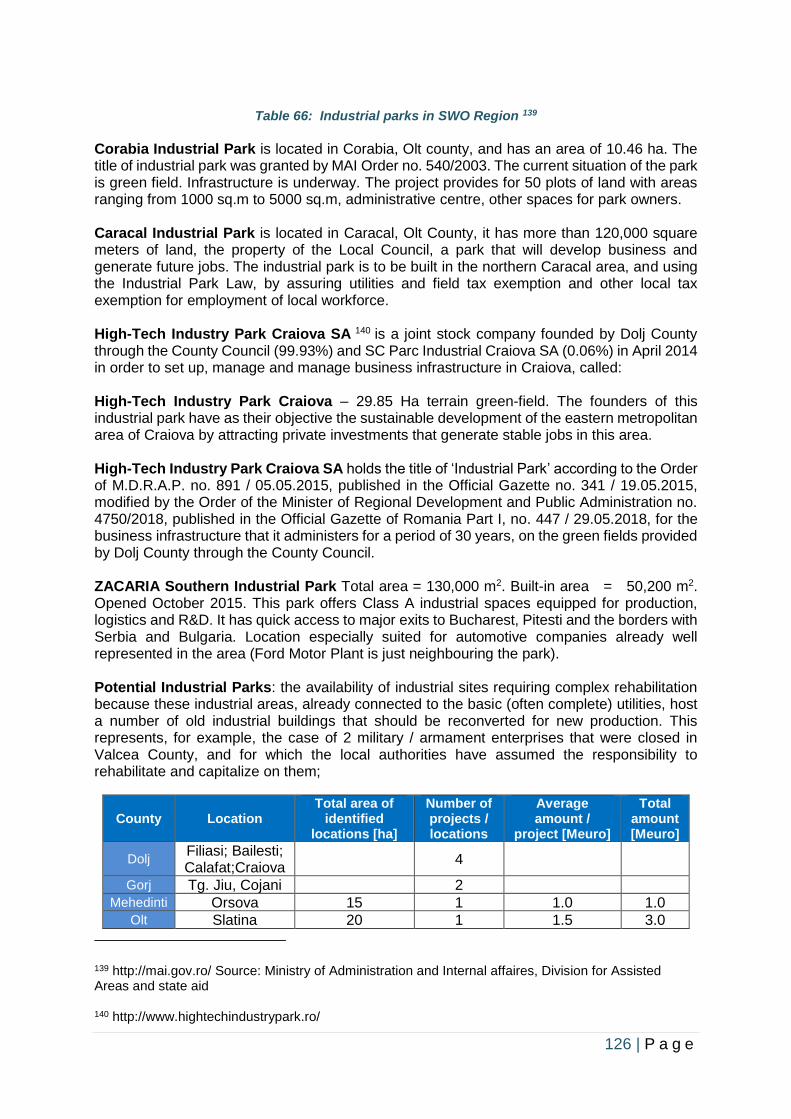
126 | P a g e
Table 66: Industrial parks in SWO Region 139
Corabia Industrial Park is located in Corabia, Olt county, and has an area of 10.46 ha. The title of industrial park was granted by MAI Order no. 540/2003. The current situation of the park is green field. Infrastructure is underway. The project provides for 50 plots of land with areas ranging from 1000 sq.m to 5000 sq.m, administrative centre, other spaces for park owners. Caracal Industrial Park is located in Caracal, Olt County, it has more than 120,000 square meters of land, the property of the Local Council, a park that will develop business and generate future jobs. The industrial park is to be built in the northern Caracal area, and using the Industrial Park Law, by assuring utilities and field tax exemption and other local tax exemption for employment of local workforce. High-Tech Industry Park Craiova SA 140 is a joint stock company founded by Dolj County through the County Council (99.93%) and SC Parc Industrial Craiova SA (0.06%) in April 2014 in order to set up, manage and manage business infrastructure in Craiova, called: High-Tech Industry Park Craiova – 29.85 Ha terrain green-field. The founders of this industrial park have as their objective the sustainable development of the eastern metropolitan area of Craiova by attracting private investments that generate stable jobs in this area. High-Tech Industry Park Craiova SA holds the title of ‘Industrial Park’ according to the Order of M.D.R.A.P. no. 891 / 05.05.2015, published in the Official Gazette no. 341 / 19.05.2015, modified by the Order of the Minister of Regional Development and Public Administration no. 4750/2018, published in the Official Gazette of Romania Part I, no. 447 / 29.05.2018, for the business infrastructure that it administers for a period of 30 years, on the green fields provided by Dolj County through the County Council. ZACARIA Southern Industrial Park Total area = 130,000 m2. Built-in area = 50,200 m2. Opened October 2015. This park offers Class A industrial spaces equipped for production, logistics and R&D. It has quick access to major exits to Bucharest, Pitesti and the borders with Serbia and Bulgaria. Location especially suited for automotive companies already well represented in the area (Ford Motor Plant is just neighbouring the park). Potential Industrial Parks: the availability of industrial sites requiring complex rehabilitation because these industrial areas, already connected to the basic (often complete) utilities, host a number of old industrial buildings that should be reconverted for new production. This represents, for example, the case of 2 military / armament enterprises that were closed in Valcea County, and for which the local authorities have assumed the responsibility to rehabilitate and capitalize on them;
County Location Total area of
identified locations [ha]
Number of projects / locations
Average amount /
project [Meuro]
Total amount [Meuro]
Dolj Filiasi; Bailesti; Calafat;Craiova
4
Gorj Tg. Jiu, Cojani 2
Mehedinti Orsova 15 1 1.0 1.0 Olt Slatina 20 1 1.5 3.0
139 http://mai.gov.ro/ Source: Ministry of Administration and Internal affaires, Division for Assisted Areas and state aid 140 http://www.hightechindustrypark.ro/
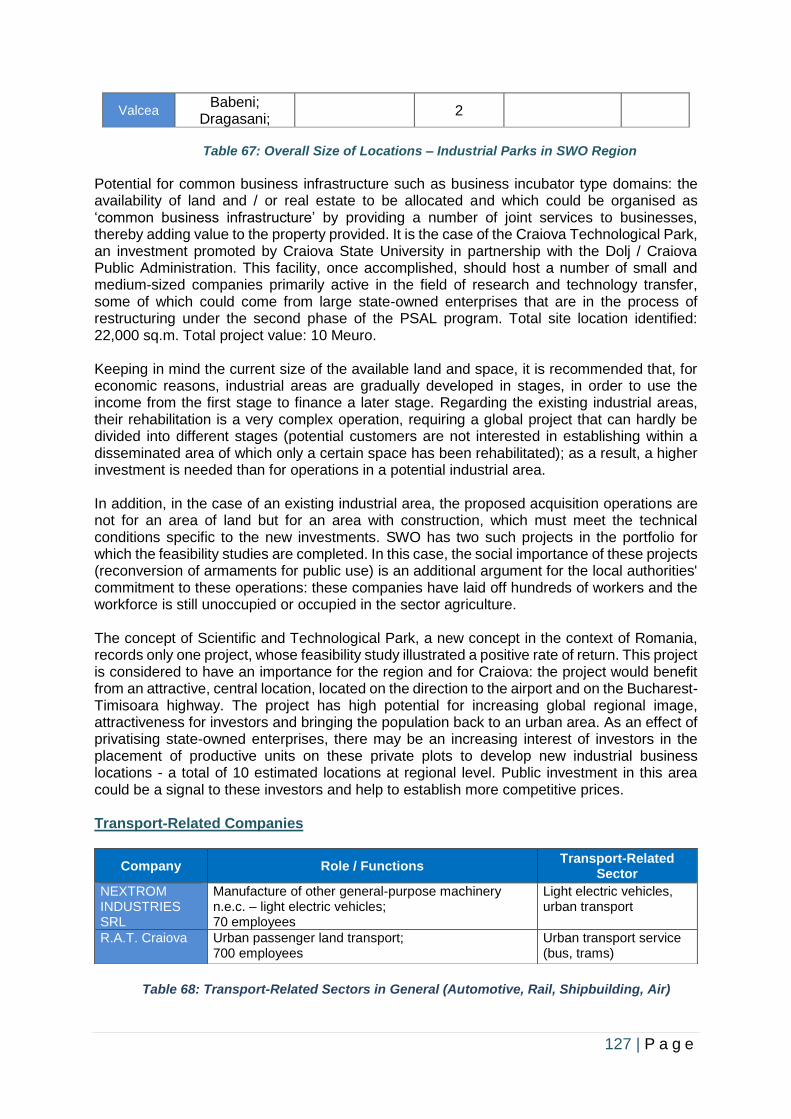
127 | P a g e
Valcea Babeni;
Dragasani; 2
Table 67: Overall Size of Locations – Industrial Parks in SWO Region
Potential for common business infrastructure such as business incubator type domains: the availability of land and / or real estate to be allocated and which could be organised as ‘common business infrastructure’ by providing a number of joint services to businesses, thereby adding value to the property provided. It is the case of the Craiova Technological Park, an investment promoted by Craiova State University in partnership with the Dolj / Craiova Public Administration. This facility, once accomplished, should host a number of small and medium-sized companies primarily active in the field of research and technology transfer, some of which could come from large state-owned enterprises that are in the process of restructuring under the second phase of the PSAL program. Total site location identified: 22,000 sq.m. Total project value: 10 Meuro. Keeping in mind the current size of the available land and space, it is recommended that, for economic reasons, industrial areas are gradually developed in stages, in order to use the income from the first stage to finance a later stage. Regarding the existing industrial areas, their rehabilitation is a very complex operation, requiring a global project that can hardly be divided into different stages (potential customers are not interested in establishing within a disseminated area of which only a certain space has been rehabilitated); as a result, a higher investment is needed than for operations in a potential industrial area. In addition, in the case of an existing industrial area, the proposed acquisition operations are not for an area of land but for an area with construction, which must meet the technical conditions specific to the new investments. SWO has two such projects in the portfolio for which the feasibility studies are completed. In this case, the social importance of these projects (reconversion of armaments for public use) is an additional argument for the local authorities' commitment to these operations: these companies have laid off hundreds of workers and the workforce is still unoccupied or occupied in the sector agriculture. The concept of Scientific and Technological Park, a new concept in the context of Romania, records only one project, whose feasibility study illustrated a positive rate of return. This project is considered to have an importance for the region and for Craiova: the project would benefit from an attractive, central location, located on the direction to the airport and on the Bucharest-Timisoara highway. The project has high potential for increasing global regional image, attractiveness for investors and bringing the population back to an urban area. As an effect of privatising state-owned enterprises, there may be an increasing interest of investors in the placement of productive units on these private plots to develop new industrial business locations - a total of 10 estimated locations at regional level. Public investment in this area could be a signal to these investors and help to establish more competitive prices. Transport-Related Companies
Table 68: Transport-Related Sectors in General (Automotive, Rail, Shipbuilding, Air)
Company Role / Functions Transport-Related
Sector
NEXTROM INDUSTRIES SRL
Manufacture of other general-purpose machinery n.e.c. – light electric vehicles; 70 employees
Light electric vehicles, urban transport
R.A.T. Craiova Urban passenger land transport; 700 employees
Urban transport service (bus, trams)
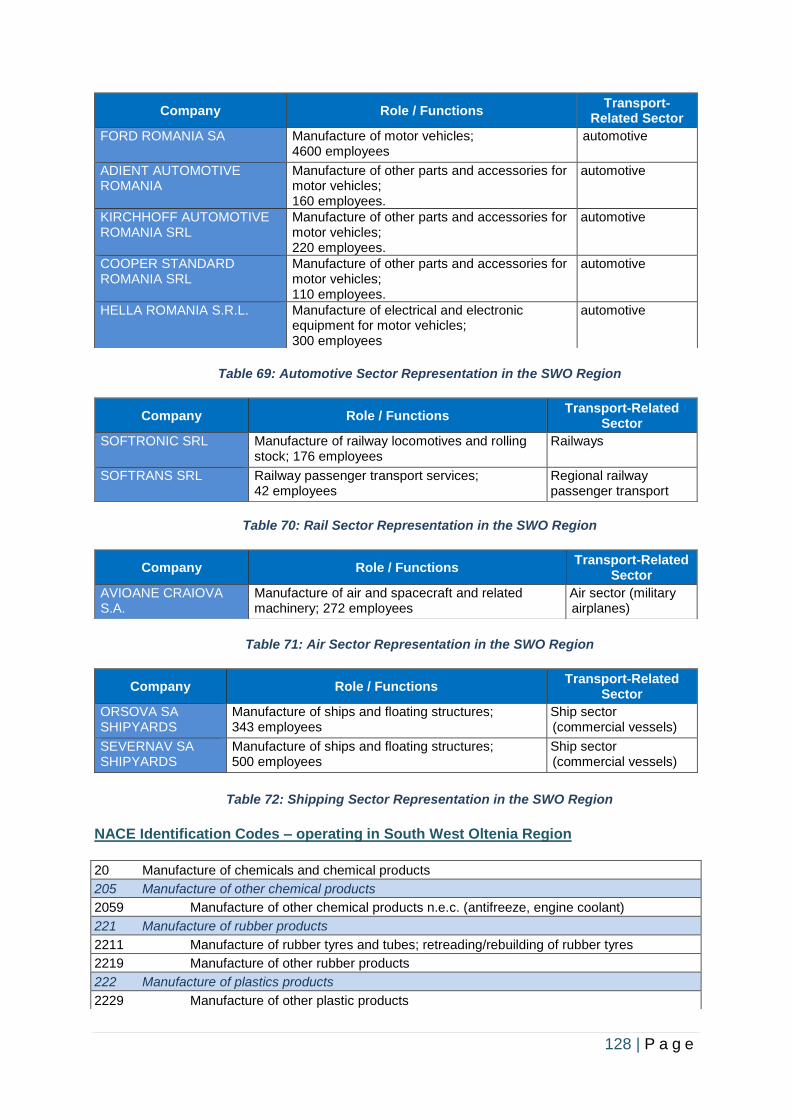
128 | P a g e
Table 69: Automotive Sector Representation in the SWO Region
Table 70: Rail Sector Representation in the SWO Region
Table 71: Air Sector Representation in the SWO Region
Table 72: Shipping Sector Representation in the SWO Region
NACE Identification Codes – operating in South West Oltenia Region
20 Manufacture of chemicals and chemical products
205 Manufacture of other chemical products
2059 Manufacture of other chemical products n.e.c. (antifreeze, engine coolant)
221 Manufacture of rubber products
2211 Manufacture of rubber tyres and tubes; retreading/rebuilding of rubber tyres
2219 Manufacture of other rubber products
222 Manufacture of plastics products
2229 Manufacture of other plastic products
Company Role / Functions Transport-
Related Sector
FORD ROMANIA SA Manufacture of motor vehicles; 4600 employees
automotive
ADIENT AUTOMOTIVE ROMANIA
Manufacture of other parts and accessories for motor vehicles; 160 employees.
automotive
KIRCHHOFF AUTOMOTIVE ROMANIA SRL
Manufacture of other parts and accessories for motor vehicles; 220 employees.
automotive
COOPER STANDARD ROMANIA SRL
Manufacture of other parts and accessories for motor vehicles; 110 employees.
automotive
HELLA ROMANIA S.R.L. Manufacture of electrical and electronic equipment for motor vehicles; 300 employees
automotive
Company Role / Functions Transport-Related
Sector
SOFTRONIC SRL Manufacture of railway locomotives and rolling stock; 176 employees
Railways
SOFTRANS SRL Railway passenger transport services; 42 employees
Regional railway passenger transport
Company Role / Functions Transport-Related
Sector
AVIOANE CRAIOVA S.A.
Manufacture of air and spacecraft and related machinery; 272 employees
Air sector (military airplanes)
Company Role / Functions Transport-Related
Sector
ORSOVA SA SHIPYARDS
Manufacture of ships and floating structures; 343 employees
Ship sector (commercial vessels)
SEVERNAV SA SHIPYARDS
Manufacture of ships and floating structures; 500 employees
Ship sector (commercial vessels)
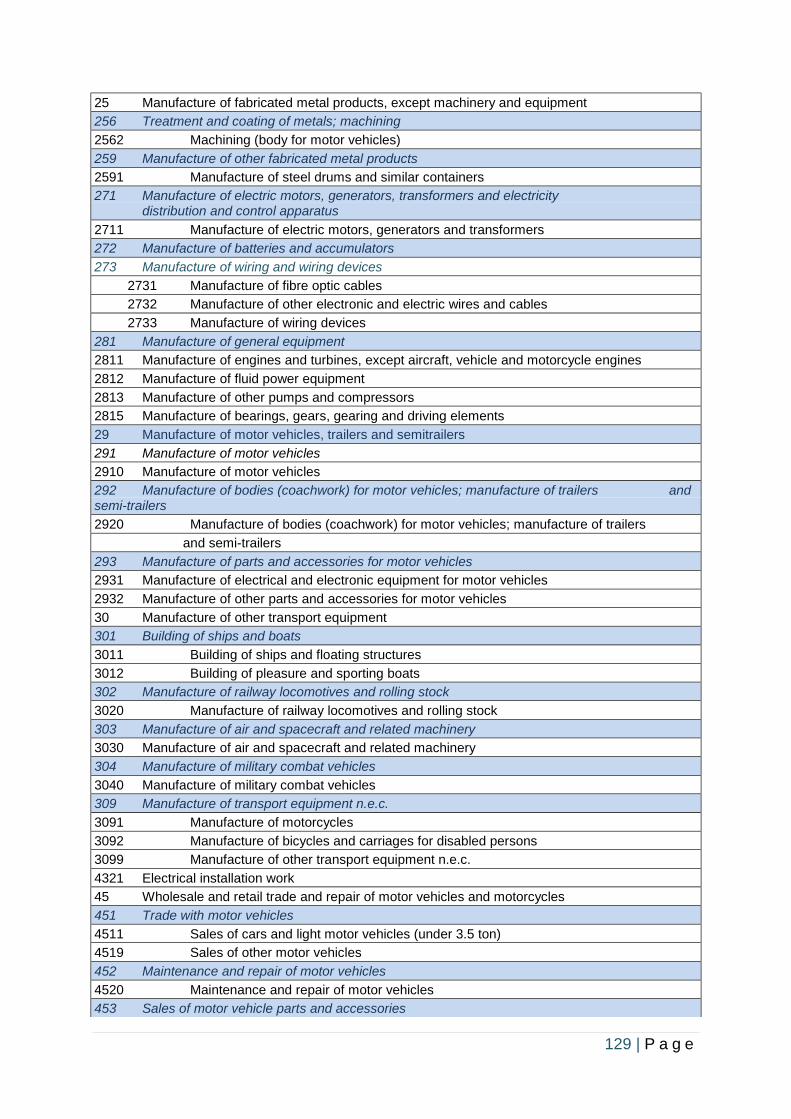
129 | P a g e
25 Manufacture of fabricated metal products, except machinery and equipment
256 Treatment and coating of metals; machining
2562 Machining (body for motor vehicles)
259 Manufacture of other fabricated metal products
2591 Manufacture of steel drums and similar containers
271 Manufacture of electric motors, generators, transformers and electricity distribution and control apparatus
2711 Manufacture of electric motors, generators and transformers
272 Manufacture of batteries and accumulators
273 Manufacture of wiring and wiring devices
2731 Manufacture of fibre optic cables
2732 Manufacture of other electronic and electric wires and cables
2733 Manufacture of wiring devices
281 Manufacture of general equipment
2811 Manufacture of engines and turbines, except aircraft, vehicle and motorcycle engines
2812 Manufacture of fluid power equipment
2813 Manufacture of other pumps and compressors
2815 Manufacture of bearings, gears, gearing and driving elements
29 Manufacture of motor vehicles, trailers and semitrailers
291 Manufacture of motor vehicles
2910 Manufacture of motor vehicles
292 Manufacture of bodies (coachwork) for motor vehicles; manufacture of trailers and semi-trailers
2920 Manufacture of bodies (coachwork) for motor vehicles; manufacture of trailers
and semi-trailers
293 Manufacture of parts and accessories for motor vehicles
2931 Manufacture of electrical and electronic equipment for motor vehicles
2932 Manufacture of other parts and accessories for motor vehicles
30 Manufacture of other transport equipment
301 Building of ships and boats
3011 Building of ships and floating structures
3012 Building of pleasure and sporting boats
302 Manufacture of railway locomotives and rolling stock
3020 Manufacture of railway locomotives and rolling stock
303 Manufacture of air and spacecraft and related machinery
3030 Manufacture of air and spacecraft and related machinery
304 Manufacture of military combat vehicles
3040 Manufacture of military combat vehicles
309 Manufacture of transport equipment n.e.c.
3091 Manufacture of motorcycles
3092 Manufacture of bicycles and carriages for disabled persons
3099 Manufacture of other transport equipment n.e.c.
4321 Electrical installation work
45 Wholesale and retail trade and repair of motor vehicles and motorcycles
451 Trade with motor vehicles
4511 Sales of cars and light motor vehicles (under 3.5 ton)
4519 Sales of other motor vehicles
452 Maintenance and repair of motor vehicles
4520 Maintenance and repair of motor vehicles
453 Sales of motor vehicle parts and accessories
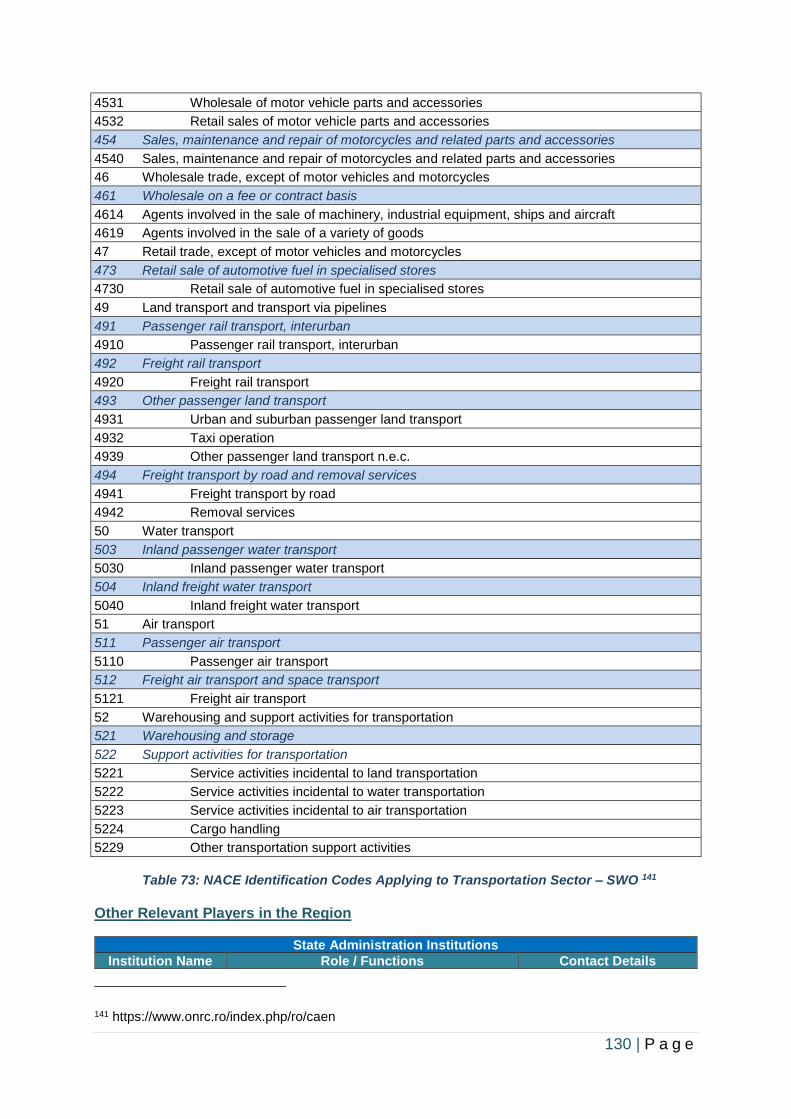
130 | P a g e
4531 Wholesale of motor vehicle parts and accessories
4532 Retail sales of motor vehicle parts and accessories
454 Sales, maintenance and repair of motorcycles and related parts and accessories
4540 Sales, maintenance and repair of motorcycles and related parts and accessories
46 Wholesale trade, except of motor vehicles and motorcycles
461 Wholesale on a fee or contract basis
4614 Agents involved in the sale of machinery, industrial equipment, ships and aircraft
4619 Agents involved in the sale of a variety of goods
47 Retail trade, except of motor vehicles and motorcycles
473 Retail sale of automotive fuel in specialised stores
4730 Retail sale of automotive fuel in specialised stores
49 Land transport and transport via pipelines
491 Passenger rail transport, interurban
4910 Passenger rail transport, interurban
492 Freight rail transport
4920 Freight rail transport
493 Other passenger land transport
4931 Urban and suburban passenger land transport
4932 Taxi operation
4939 Other passenger land transport n.e.c.
494 Freight transport by road and removal services
4941 Freight transport by road
4942 Removal services
50 Water transport
503 Inland passenger water transport
5030 Inland passenger water transport
504 Inland freight water transport
5040 Inland freight water transport
51 Air transport
511 Passenger air transport
5110 Passenger air transport
512 Freight air transport and space transport
5121 Freight air transport
52 Warehousing and support activities for transportation
521 Warehousing and storage
522 Support activities for transportation
5221 Service activities incidental to land transportation
5222 Service activities incidental to water transportation
5223 Service activities incidental to air transportation
5224 Cargo handling
5229 Other transportation support activities
Table 73: NACE Identification Codes Applying to Transportation Sector – SWO 141
Other Relevant Players in the Region
141 https://www.onrc.ro/index.php/ro/caen
State Administration Institutions
Institution Name Role / Functions Contact Details
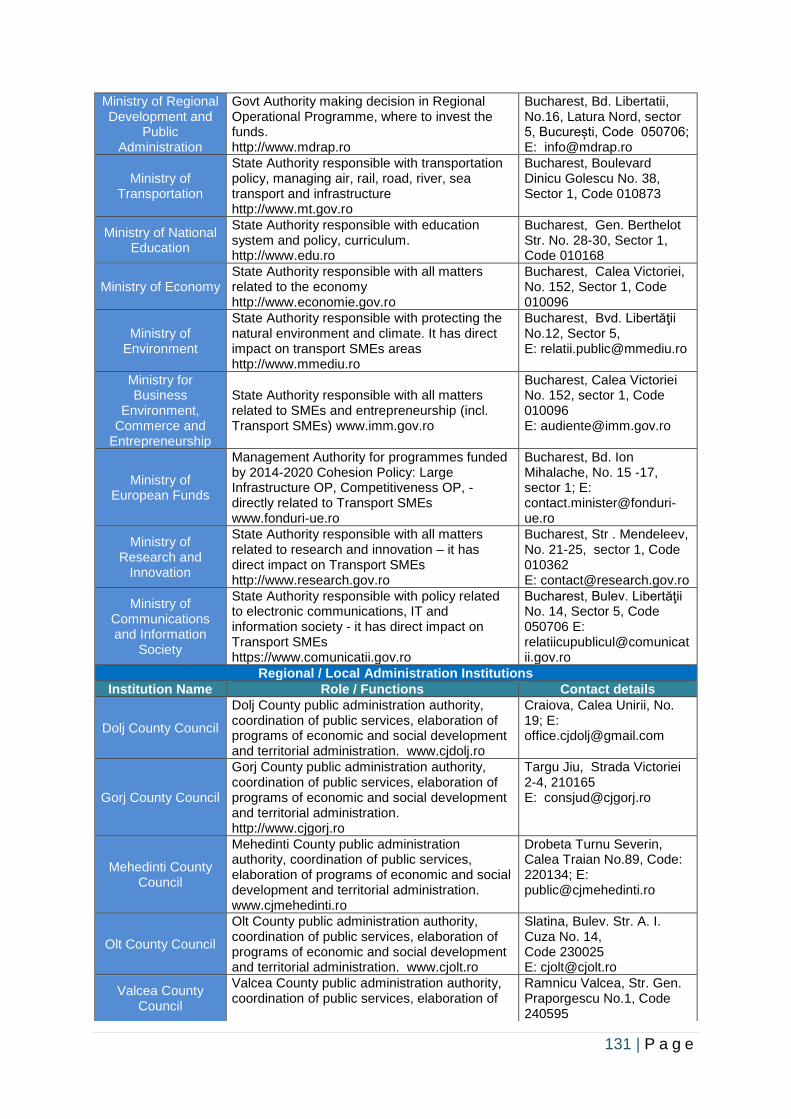
131 | P a g e
Ministry of Regional Development and
Public Administration
Govt Authority making decision in Regional Operational Programme, where to invest the funds. http://www.mdrap.ro
Bucharest, Bd. Libertatii, No.16, Latura Nord, sector 5, București, Code 050706; E: [email protected]
Ministry of Transportation
State Authority responsible with transportation policy, managing air, rail, road, river, sea transport and infrastructure http://www.mt.gov.ro
Bucharest, Boulevard Dinicu Golescu No. 38, Sector 1, Code 010873
Ministry of National Education
State Authority responsible with education system and policy, curriculum. http://www.edu.ro
Bucharest, Gen. Berthelot Str. No. 28-30, Sector 1, Code 010168
Ministry of Economy State Authority responsible with all matters related to the economy http://www.economie.gov.ro
Bucharest, Calea Victoriei, No. 152, Sector 1, Code 010096
Ministry of Environment
State Authority responsible with protecting the natural environment and climate. It has direct impact on transport SMEs areas http://www.mmediu.ro
Bucharest, Bvd. Libertăţii No.12, Sector 5, E: [email protected]
Ministry for Business
Environment, Commerce and
Entrepreneurship
State Authority responsible with all matters related to SMEs and entrepreneurship (incl. Transport SMEs) www.imm.gov.ro
Bucharest, Calea Victoriei No. 152, sector 1, Code 010096 E: [email protected]
Ministry of European Funds
Management Authority for programmes funded by 2014-2020 Cohesion Policy: Large Infrastructure OP, Competitiveness OP, - directly related to Transport SMEs www.fonduri-ue.ro
Bucharest, Bd. Ion Mihalache, No. 15 -17, sector 1; E: [email protected]
Ministry of Research and
Innovation
State Authority responsible with all matters related to research and innovation – it has direct impact on Transport SMEs http://www.research.gov.ro
Bucharest, Str . Mendeleev, No. 21-25, sector 1, Code 010362 E: [email protected]
Ministry of Communications and Information
Society
State Authority responsible with policy related to electronic communications, IT and information society - it has direct impact on Transport SMEs https://www.comunicatii.gov.ro
Bucharest, Bulev. Libertăţii No. 14, Sector 5, Code 050706 E: [email protected]
Regional / Local Administration Institutions
Institution Name Role / Functions Contact details
Dolj County Council
Dolj County public administration authority, coordination of public services, elaboration of programs of economic and social development and territorial administration. www.cjdolj.ro
Craiova, Calea Unirii, No. 19; E: [email protected]
Gorj County Council
Gorj County public administration authority, coordination of public services, elaboration of programs of economic and social development and territorial administration. http://www.cjgorj.ro
Targu Jiu, Strada Victoriei 2-4, 210165 E: [email protected]
Mehedinti County Council
Mehedinti County public administration authority, coordination of public services, elaboration of programs of economic and social development and territorial administration. www.cjmehedinti.ro
Drobeta Turnu Severin, Calea Traian No.89, Code: 220134; E: [email protected]
Olt County Council
Olt County public administration authority, coordination of public services, elaboration of programs of economic and social development and territorial administration. www.cjolt.ro
Slatina, Bulev. Str. A. I. Cuza No. 14, Code 230025 E: [email protected]
Valcea County Council
Valcea County public administration authority, coordination of public services, elaboration of
Ramnicu Valcea, Str. Gen. Praporgescu No.1, Code 240595
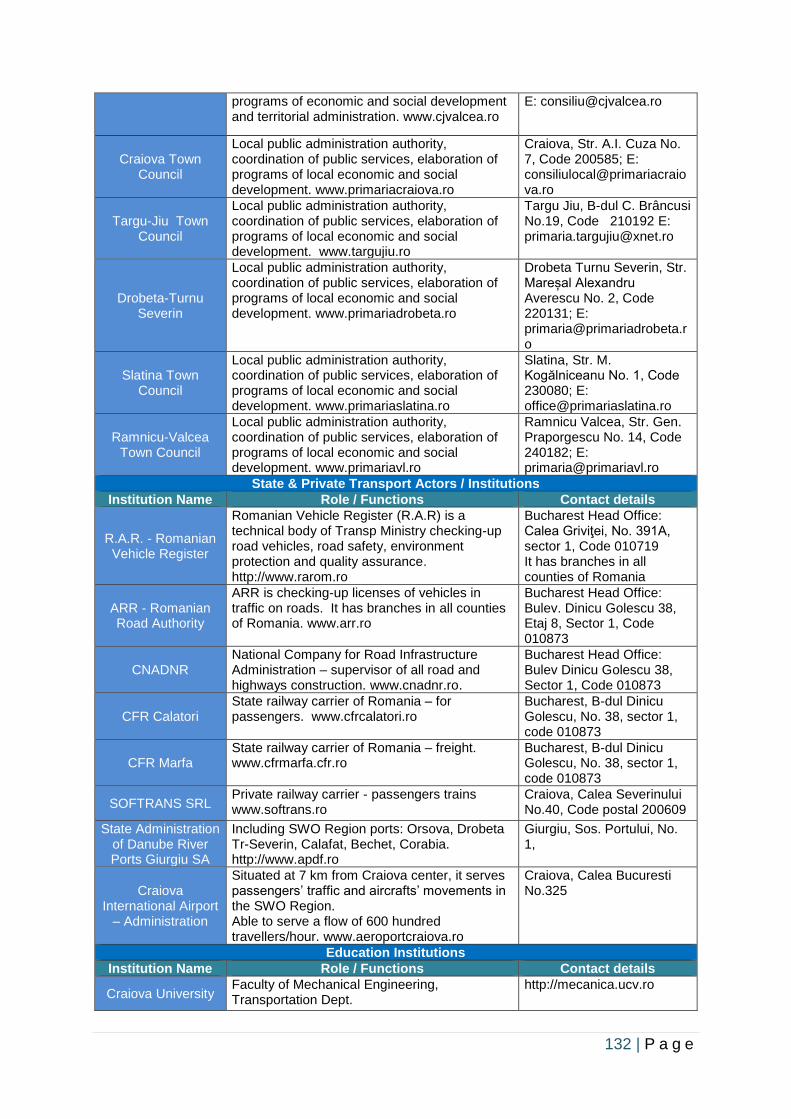
132 | P a g e
programs of economic and social development and territorial administration. www.cjvalcea.ro
Craiova Town Council
Local public administration authority, coordination of public services, elaboration of programs of local economic and social development. www.primariacraiova.ro
Craiova, Str. A.I. Cuza No. 7, Code 200585; E: [email protected]
Targu-Jiu Town Council
Local public administration authority, coordination of public services, elaboration of programs of local economic and social development. www.targujiu.ro
Targu Jiu, B-dul C. Brâncusi No.19, Code 210192 E: [email protected]
Drobeta-Turnu Severin
Local public administration authority, coordination of public services, elaboration of programs of local economic and social development. www.primariadrobeta.ro
Drobeta Turnu Severin, Str. Mareșal Alexandru Averescu No. 2, Code 220131; E: [email protected]
Slatina Town Council
Local public administration authority, coordination of public services, elaboration of programs of local economic and social development. www.primariaslatina.ro
Slatina, Str. M. Kogălniceanu No. 1, Code 230080; E: [email protected]
Ramnicu-Valcea Town Council
Local public administration authority, coordination of public services, elaboration of programs of local economic and social development. www.primariavl.ro
Ramnicu Valcea, Str. Gen. Praporgescu No. 14, Code 240182; E: [email protected]
State & Private Transport Actors / Institutions
Institution Name Role / Functions Contact details
R.A.R. - Romanian Vehicle Register
Romanian Vehicle Register (R.A.R) is a technical body of Transp Ministry checking-up road vehicles, road safety, environment protection and quality assurance. http://www.rarom.ro
Bucharest Head Office: Calea Griviţei, No. 391A, sector 1, Code 010719 It has branches in all counties of Romania
ARR - Romanian Road Authority
ARR is checking-up licenses of vehicles in traffic on roads. It has branches in all counties of Romania. www.arr.ro
Bucharest Head Office: Bulev. Dinicu Golescu 38, Etaj 8, Sector 1, Code 010873
CNADNR National Company for Road Infrastructure Administration – supervisor of all road and highways construction. www.cnadnr.ro.
Bucharest Head Office: Bulev Dinicu Golescu 38, Sector 1, Code 010873
CFR Calatori State railway carrier of Romania – for passengers. www.cfrcalatori.ro
Bucharest, B-dul Dinicu Golescu, No. 38, sector 1, code 010873
CFR Marfa State railway carrier of Romania – freight. www.cfrmarfa.cfr.ro
Bucharest, B-dul Dinicu Golescu, No. 38, sector 1, code 010873
SOFTRANS SRL Private railway carrier - passengers trains www.softrans.ro
Craiova, Calea Severinului No.40, Code postal 200609
State Administration of Danube River Ports Giurgiu SA
Including SWO Region ports: Orsova, Drobeta Tr-Severin, Calafat, Bechet, Corabia. http://www.apdf.ro
Giurgiu, Sos. Portului, No. 1,
Craiova International Airport
– Administration
Situated at 7 km from Craiova center, it serves passengers’ traffic and aircrafts’ movements in the SWO Region. Able to serve a flow of 600 hundred travellers/hour. www.aeroportcraiova.ro
Craiova, Calea Bucuresti No.325
Education Institutions
Institution Name Role / Functions Contact details
Craiova University Faculty of Mechanical Engineering, Transportation Dept.
http://mecanica.ucv.ro
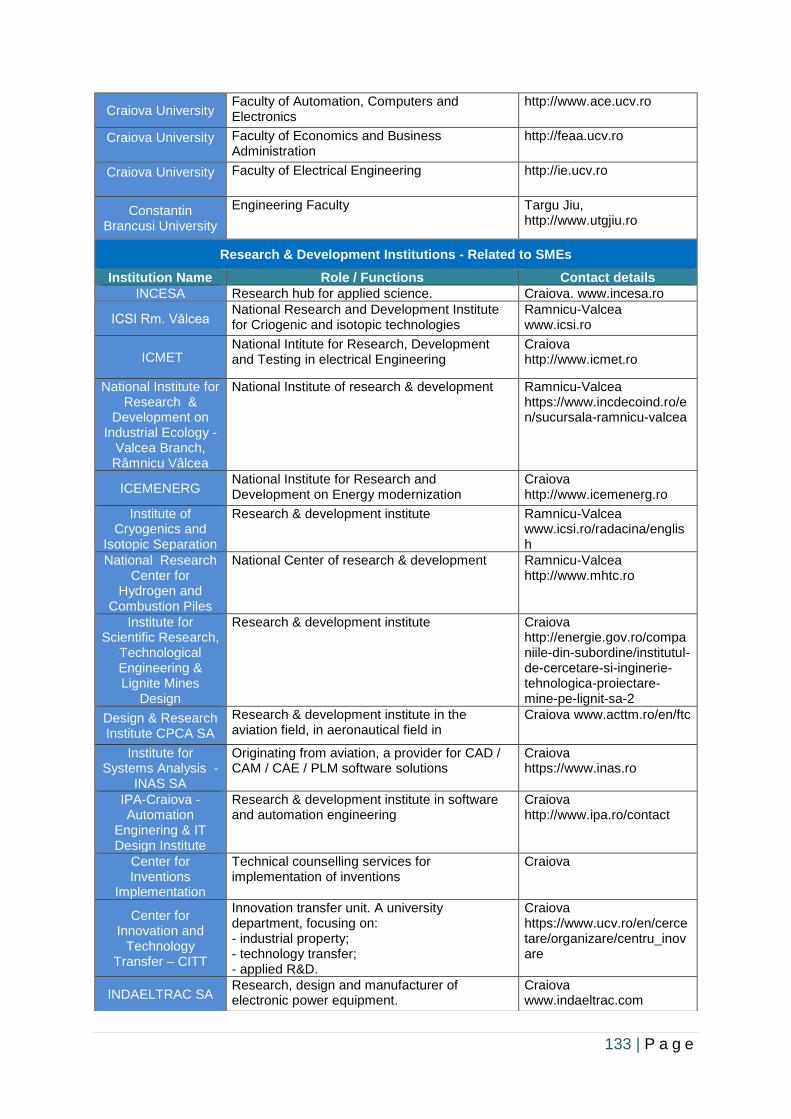
133 | P a g e
Craiova University Faculty of Automation, Computers and Electronics
http://www.ace.ucv.ro
Craiova University
Faculty of Economics and Business Administration
http://feaa.ucv.ro
Craiova University
Faculty of Electrical Engineering http://ie.ucv.ro
Constantin Brancusi University
Engineering Faculty Targu Jiu, http://www.utgjiu.ro
Research & Development Institutions - Related to SMEs
Institution Name Role / Functions Contact details
INCESA Research hub for applied science. Craiova. www.incesa.ro
ICSI Rm. Vălcea National Research and Development Institute for Criogenic and isotopic technologies
Ramnicu-Valcea www.icsi.ro
ICMET National Intitute for Research, Development and Testing in electrical Engineering
Craiova http://www.icmet.ro
National Institute for Research &
Development on Industrial Ecology -
Valcea Branch, Râmnicu Vâlcea
National Institute of research & development Ramnicu-Valcea https://www.incdecoind.ro/en/sucursala-ramnicu-valcea
ICEMENERG National Institute for Research and Development on Energy modernization
Craiova http://www.icemenerg.ro
Institute of Cryogenics and
Isotopic Separation
Research & development institute Ramnicu-Valcea www.icsi.ro/radacina/english
National Research Center for
Hydrogen and Combustion Piles
National Center of research & development Ramnicu-Valcea http://www.mhtc.ro
Institute for Scientific Research,
Technological Engineering & Lignite Mines
Design
Research & development institute Craiova http://energie.gov.ro/companiile-din-subordine/institutul-de-cercetare-si-inginerie-tehnologica-proiectare-mine-pe-lignit-sa-2
Design & Research Institute CPCA SA
Research & development institute in the aviation field, in aeronautical field in
Craiova www.acttm.ro/en/ftc
Institute for Systems Analysis -
INAS SA
Originating from aviation, a provider for CAD / CAM / CAE / PLM software solutions
Craiova https://www.inas.ro
IPA-Craiova - Automation
Enginering & IT Design Institute
Research & development institute in software and automation engineering
Craiova http://www.ipa.ro/contact
Center for Inventions
Implementation
Technical counselling services for implementation of inventions
Craiova
Center for Innovation and
Technology Transfer – CITT
Innovation transfer unit. A university department, focusing on: - industrial property; - technology transfer; - applied R&D.
Craiova https://www.ucv.ro/en/cercetare/organizare/centru_inovare
INDAELTRAC SA Research, design and manufacturer of electronic power equipment.
Craiova www.indaeltrac.com
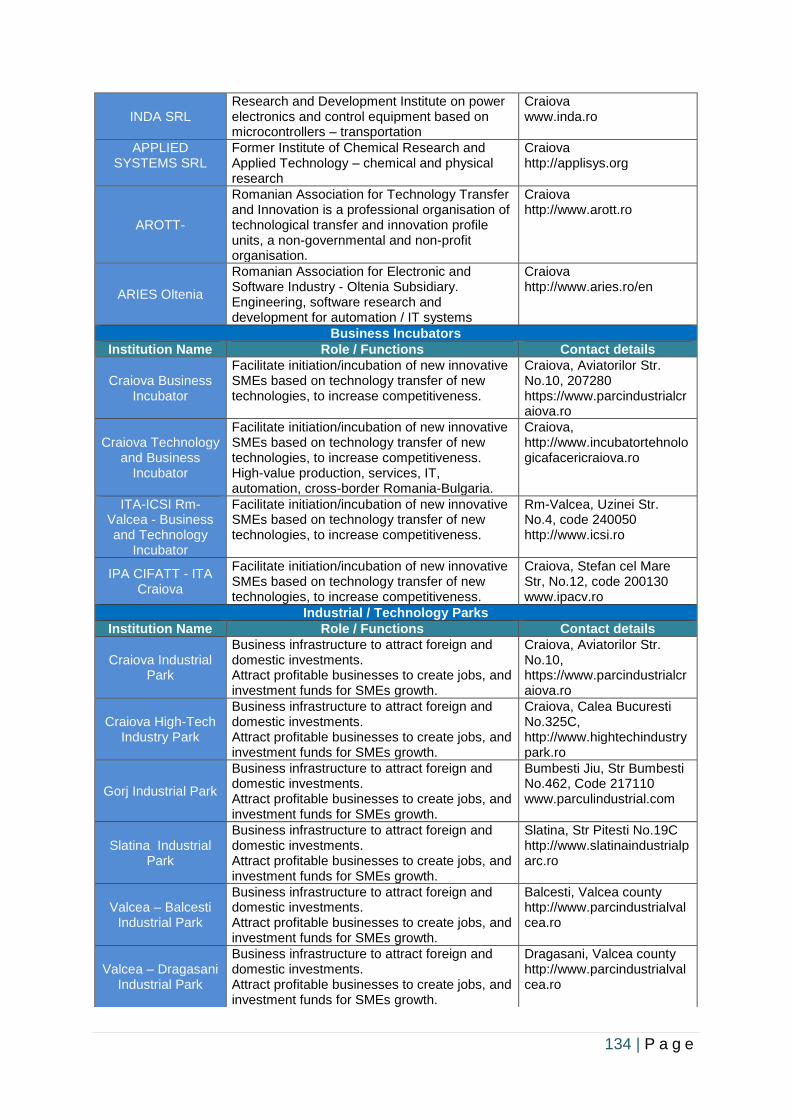
134 | P a g e
INDA SRL Research and Development Institute on power electronics and control equipment based on microcontrollers – transportation
Craiova www.inda.ro
APPLIED SYSTEMS SRL
Former Institute of Chemical Research and Applied Technology – chemical and physical research
Craiova http://applisys.org
AROTT-
Romanian Association for Technology Transfer and Innovation is a professional organisation of technological transfer and innovation profile units, a non-governmental and non-profit organisation.
Craiova http://www.arott.ro
ARIES Oltenia
Romanian Association for Electronic and Software Industry - Oltenia Subsidiary. Engineering, software research and development for automation / IT systems
Craiova http://www.aries.ro/en
Business Incubators
Institution Name Role / Functions Contact details
Craiova Business Incubator
Facilitate initiation/incubation of new innovative SMEs based on technology transfer of new technologies, to increase competitiveness.
Craiova, Aviatorilor Str. No.10, 207280 https://www.parcindustrialcraiova.ro
Craiova Technology and Business
Incubator
Facilitate initiation/incubation of new innovative SMEs based on technology transfer of new technologies, to increase competitiveness. High-value production, services, IT, automation, cross-border Romania-Bulgaria.
Craiova, http://www.incubatortehnologicafacericraiova.ro
ITA-ICSI Rm-Valcea - Business and Technology
Incubator
Facilitate initiation/incubation of new innovative SMEs based on technology transfer of new technologies, to increase competitiveness.
Rm-Valcea, Uzinei Str. No.4, code 240050 http://www.icsi.ro
IPA CIFATT - ITA Craiova
Facilitate initiation/incubation of new innovative SMEs based on technology transfer of new technologies, to increase competitiveness.
Craiova, Stefan cel Mare Str, No.12, code 200130 www.ipacv.ro
Industrial / Technology Parks
Institution Name Role / Functions Contact details
Craiova Industrial Park
Business infrastructure to attract foreign and domestic investments. Attract profitable businesses to create jobs, and investment funds for SMEs growth.
Craiova, Aviatorilor Str. No.10, https://www.parcindustrialcraiova.ro
Craiova High-Tech Industry Park
Business infrastructure to attract foreign and domestic investments. Attract profitable businesses to create jobs, and investment funds for SMEs growth.
Craiova, Calea Bucuresti No.325C, http://www.hightechindustrypark.ro
Gorj Industrial Park
Business infrastructure to attract foreign and domestic investments. Attract profitable businesses to create jobs, and investment funds for SMEs growth.
Bumbesti Jiu, Str Bumbesti No.462, Code 217110 www.parculindustrial.com
Slatina Industrial Park
Business infrastructure to attract foreign and domestic investments. Attract profitable businesses to create jobs, and investment funds for SMEs growth.
Slatina, Str Pitesti No.19C http://www.slatinaindustrialparc.ro
Valcea – Balcesti Industrial Park
Business infrastructure to attract foreign and domestic investments. Attract profitable businesses to create jobs, and investment funds for SMEs growth.
Balcesti, Valcea county http://www.parcindustrialvalcea.ro
Valcea – Dragasani Industrial Park
Business infrastructure to attract foreign and domestic investments. Attract profitable businesses to create jobs, and investment funds for SMEs growth.
Dragasani, Valcea county http://www.parcindustrialvalcea.ro
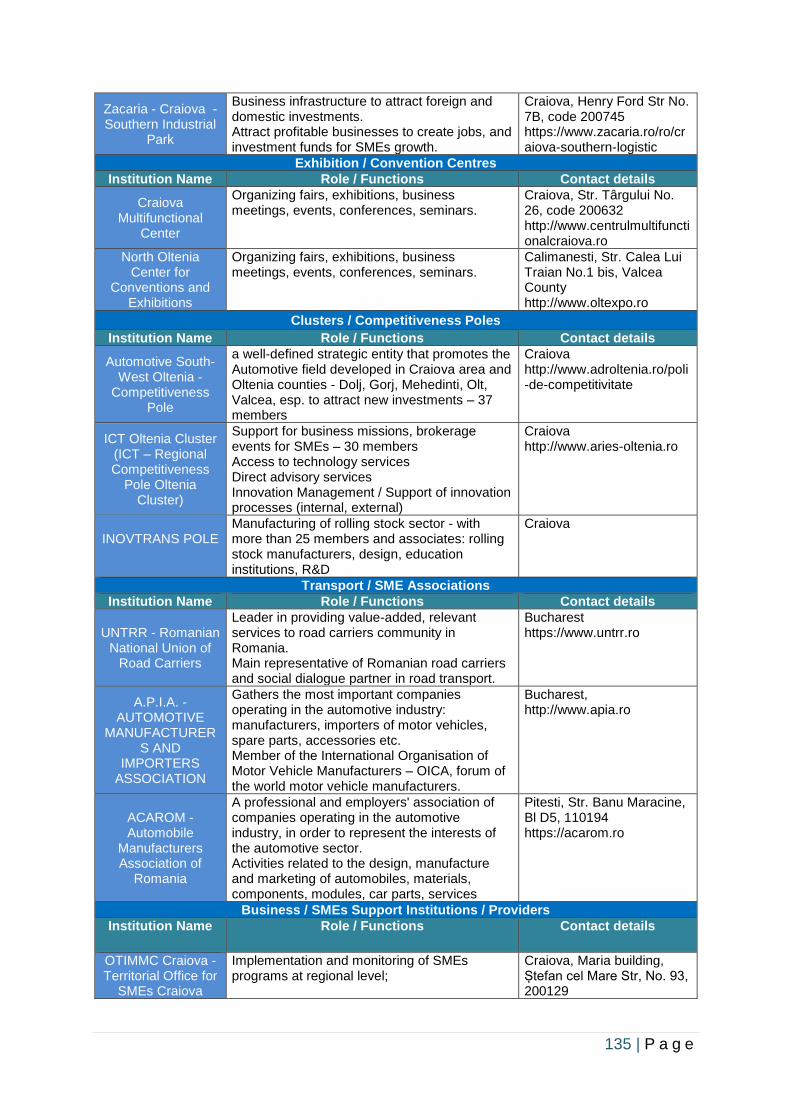
135 | P a g e
Zacaria - Craiova - Southern Industrial
Park
Business infrastructure to attract foreign and domestic investments. Attract profitable businesses to create jobs, and investment funds for SMEs growth.
Craiova, Henry Ford Str No. 7B, code 200745 https://www.zacaria.ro/ro/craiova-southern-logistic
Exhibition / Convention Centres
Institution Name Role / Functions Contact details
Craiova Multifunctional
Center
Organizing fairs, exhibitions, business meetings, events, conferences, seminars.
Craiova, Str. Târgului No. 26, code 200632 http://www.centrulmultifunctionalcraiova.ro
North Oltenia Center for
Conventions and Exhibitions
Organizing fairs, exhibitions, business meetings, events, conferences, seminars.
Calimanesti, Str. Calea Lui Traian No.1 bis, Valcea County http://www.oltexpo.ro
Clusters / Competitiveness Poles
Institution Name Role / Functions Contact details
Automotive South-West Oltenia -
Competitiveness Pole
a well-defined strategic entity that promotes the Automotive field developed in Craiova area and Oltenia counties - Dolj, Gorj, Mehedinti, Olt, Valcea, esp. to attract new investments – 37 members
Craiova http://www.adroltenia.ro/poli-de-competitivitate
ICT Oltenia Cluster (ICT – Regional Competitiveness
Pole Oltenia Cluster)
Support for business missions, brokerage events for SMEs – 30 members Access to technology services Direct advisory services Innovation Management / Support of innovation processes (internal, external)
Craiova http://www.aries-oltenia.ro
INOVTRANS POLE
Manufacturing of rolling stock sector - with more than 25 members and associates: rolling stock manufacturers, design, education institutions, R&D
Craiova
Transport / SME Associations
Institution Name Role / Functions Contact details
UNTRR - Romanian National Union of
Road Carriers
Leader in providing value-added, relevant services to road carriers community in Romania. Main representative of Romanian road carriers and social dialogue partner in road transport.
Bucharest https://www.untrr.ro
A.P.I.A. - AUTOMOTIVE
MANUFACTURERS AND
IMPORTERS ASSOCIATION
Gathers the most important companies operating in the automotive industry: manufacturers, importers of motor vehicles, spare parts, accessories etc. Member of the International Organisation of Motor Vehicle Manufacturers – OICA, forum of the world motor vehicle manufacturers.
Bucharest, http://www.apia.ro
ACAROM - Automobile
Manufacturers Association of
Romania
A professional and employers' association of companies operating in the automotive industry, in order to represent the interests of the automotive sector. Activities related to the design, manufacture and marketing of automobiles, materials, components, modules, car parts, services
Pitesti, Str. Banu Maracine, Bl D5, 110194 https://acarom.ro
Business / SMEs Support Institutions / Providers
Institution Name Role / Functions Contact details
OTIMMC Craiova - Territorial Office for
SMEs Craiova
Implementation and monitoring of SMEs programs at regional level;
Craiova, Maria building, Ștefan cel Mare Str, No. 93, 200129
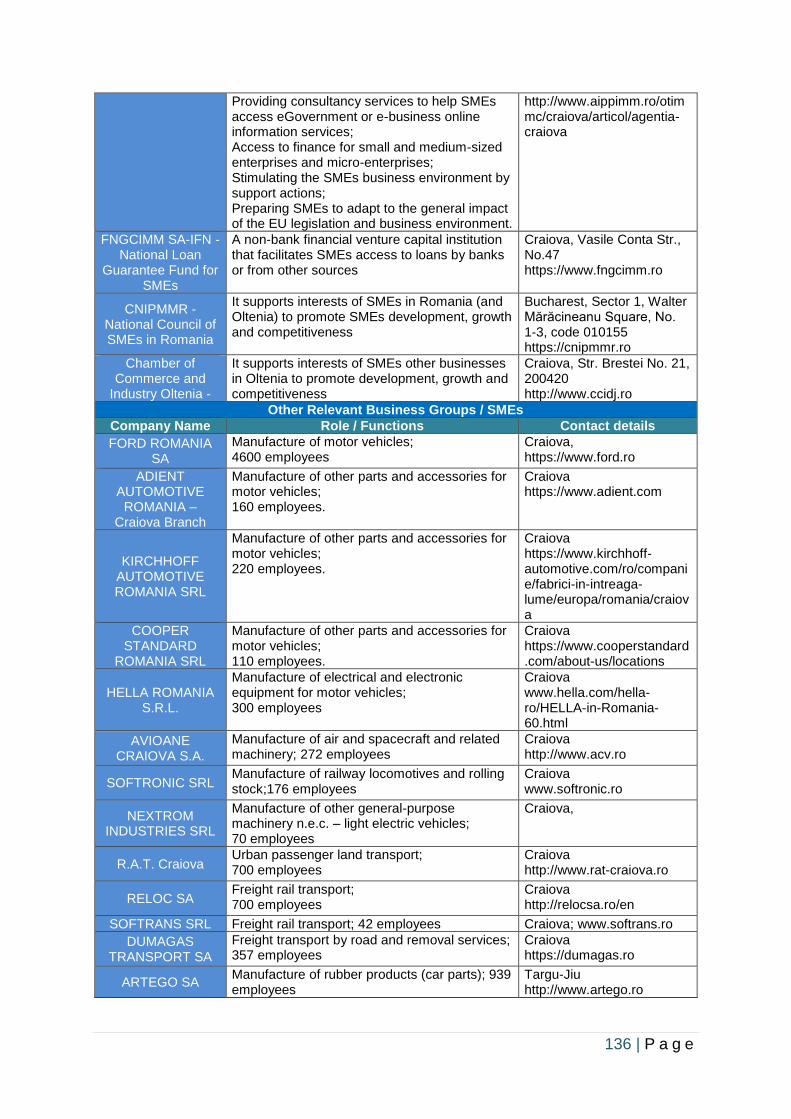
136 | P a g e
Providing consultancy services to help SMEs access eGovernment or e-business online information services; Access to finance for small and medium-sized enterprises and micro-enterprises; Stimulating the SMEs business environment by support actions; Preparing SMEs to adapt to the general impact of the EU legislation and business environment.
http://www.aippimm.ro/otimmc/craiova/articol/agentia-craiova
FNGCIMM SA-IFN - National Loan
Guarantee Fund for SMEs
A non-bank financial venture capital institution that facilitates SMEs access to loans by banks or from other sources
Craiova, Vasile Conta Str., No.47 https://www.fngcimm.ro
CNIPMMR - National Council of SMEs in Romania
It supports interests of SMEs in Romania (and Oltenia) to promote SMEs development, growth and competitiveness
Bucharest, Sector 1, Walter Mărăcineanu Square, No. 1-3, code 010155 https://cnipmmr.ro
Chamber of Commerce and
Industry Oltenia -
It supports interests of SMEs other businesses in Oltenia to promote development, growth and competitiveness
Craiova, Str. Brestei No. 21, 200420 http://www.ccidj.ro
Other Relevant Business Groups / SMEs
Company Name Role / Functions Contact details
FORD ROMANIA SA
Manufacture of motor vehicles; 4600 employees
Craiova, https://www.ford.ro
ADIENT AUTOMOTIVE
ROMANIA – Craiova Branch
Manufacture of other parts and accessories for motor vehicles; 160 employees.
Craiova https://www.adient.com
KIRCHHOFF AUTOMOTIVE ROMANIA SRL
Manufacture of other parts and accessories for motor vehicles; 220 employees.
Craiova https://www.kirchhoff-automotive.com/ro/companie/fabrici-in-intreaga-lume/europa/romania/craiova
COOPER STANDARD
ROMANIA SRL
Manufacture of other parts and accessories for motor vehicles; 110 employees.
Craiova https://www.cooperstandard.com/about-us/locations
HELLA ROMANIA S.R.L.
Manufacture of electrical and electronic equipment for motor vehicles; 300 employees
Craiova www.hella.com/hella-ro/HELLA-in-Romania-60.html
AVIOANE CRAIOVA S.A.
Manufacture of air and spacecraft and related machinery; 272 employees
Craiova http://www.acv.ro
SOFTRONIC SRL Manufacture of railway locomotives and rolling stock;176 employees
Craiova www.softronic.ro
NEXTROM INDUSTRIES SRL
Manufacture of other general-purpose machinery n.e.c. – light electric vehicles; 70 employees
Craiova,
R.A.T. Craiova Urban passenger land transport; 700 employees
Craiova http://www.rat-craiova.ro
RELOC SA Freight rail transport; 700 employees
Craiova http://relocsa.ro/en
SOFTRANS SRL Freight rail transport; 42 employees Craiova; www.softrans.ro
DUMAGAS TRANSPORT SA
Freight transport by road and removal services; 357 employees
Craiova https://dumagas.ro
ARTEGO SA Manufacture of rubber products (car parts); 939 employees
Targu-Jiu http://www.artego.ro
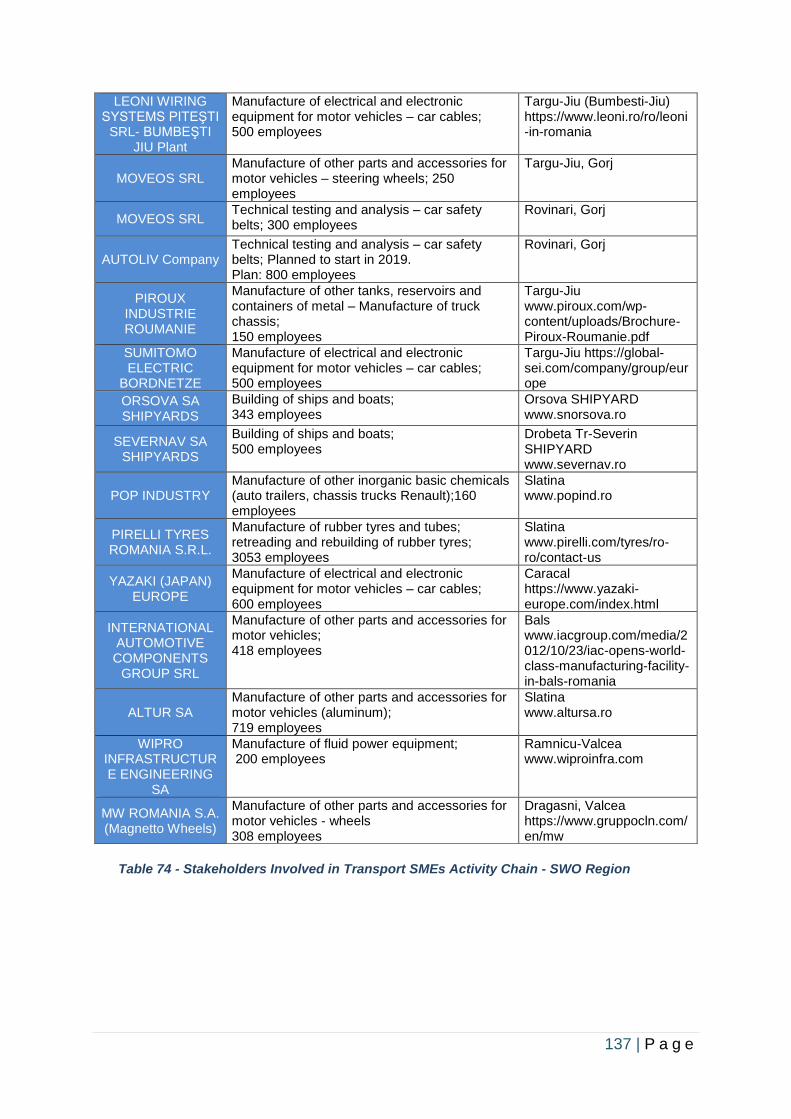
137 | P a g e
Table 74 - Stakeholders Involved in Transport SMEs Activity Chain - SWO Region
LEONI WIRING SYSTEMS PITEŞTI
SRL- BUMBEŞTI JIU Plant
Manufacture of electrical and electronic equipment for motor vehicles – car cables; 500 employees
Targu-Jiu (Bumbesti-Jiu) https://www.leoni.ro/ro/leoni-in-romania
MOVEOS SRL Manufacture of other parts and accessories for motor vehicles – steering wheels; 250 employees
Targu-Jiu, Gorj
MOVEOS SRL Technical testing and analysis – car safety belts; 300 employees
Rovinari, Gorj
AUTOLIV Company Technical testing and analysis – car safety belts; Planned to start in 2019. Plan: 800 employees
Rovinari, Gorj
PIROUX INDUSTRIE ROUMANIE
Manufacture of other tanks, reservoirs and containers of metal – Manufacture of truck chassis; 150 employees
Targu-Jiu www.piroux.com/wp-content/uploads/Brochure-Piroux-Roumanie.pdf
SUMITOMO ELECTRIC
BORDNETZE
Manufacture of electrical and electronic equipment for motor vehicles – car cables; 500 employees
Targu-Jiu https://global-sei.com/company/group/europe
ORSOVA SA SHIPYARDS
Building of ships and boats; 343 employees
Orsova SHIPYARD www.snorsova.ro
SEVERNAV SA SHIPYARDS
Building of ships and boats; 500 employees
Drobeta Tr-Severin SHIPYARD www.severnav.ro
POP INDUSTRY Manufacture of other inorganic basic chemicals (auto trailers, chassis trucks Renault);160 employees
Slatina www.popind.ro
PIRELLI TYRES ROMANIA S.R.L.
Manufacture of rubber tyres and tubes; retreading and rebuilding of rubber tyres; 3053 employees
Slatina www.pirelli.com/tyres/ro-ro/contact-us
YAZAKI (JAPAN) EUROPE
Manufacture of electrical and electronic equipment for motor vehicles – car cables; 600 employees
Caracal https://www.yazaki-europe.com/index.html
INTERNATIONAL AUTOMOTIVE COMPONENTS
GROUP SRL
Manufacture of other parts and accessories for motor vehicles; 418 employees
Bals www.iacgroup.com/media/2012/10/23/iac-opens-world-class-manufacturing-facility-in-bals-romania
ALTUR SA Manufacture of other parts and accessories for motor vehicles (aluminum); 719 employees
Slatina www.altursa.ro
WIPRO INFRASTRUCTURE ENGINEERING
SA
Manufacture of fluid power equipment; 200 employees
Ramnicu-Valcea www.wiproinfra.com
MW ROMANIA S.A. (Magnetto Wheels)
Manufacture of other parts and accessories for motor vehicles - wheels 308 employees
Dragasni, Valcea https://www.gruppocln.com/en/mw
138 | P a g e
3.3 Regional Policy
West Midlands
United Kingdom
Policy Priorities Overview
Strategic economic development policy in the region is led by the LEPs. This section provides a short summary of the main economic development issues and corresponding priorities set by the LEPs in the region. The focus here is upon the priorities proposed for business competitiveness and SME finance. The analysis seeks to draw out the important economic drivers in each of the LEP areas. 142 The main priorities and interventions that are relevant to SME competiveness are set out below. The strategies reflect the varying local economic contexts across the WM LEPs but there are a number of themes which are common in all parts of the region. In particular:
• The need to create employment and GVA: this reflects the long term trend for GVA per head in the region to be behind the England average and the continued widening of the gap.
• Supply chain development to support growth: particularly related to advanced manufacturing and engineering.
• Innovation and R&D: priorities here encompass the full spectrum of innovation related activities from more generalised process innovation and productivity improvement through to R&D intensive and tech focused activities to generate spin out companies.
• Enterprise and start-ups: There is a strong innovation and technology flavour to many of the priorities in this area, although some LEP areas also prioritise the development of an entrepreneurial culture and stimulating business start-ups more generally.
• Focus on growth sectors: The importance of priority sectors in driving growth is recognised in all of the strategy documents and each LEP area has identified the key sectors around which they expect future growth to focus.
• The advanced manufacturing sector stands out as being particularly important, with automotive, aerospace and aeronautical sectors highlighted as being key strengths and sources of growth.
The range of interventions that emerge from these strategies could, of themselves stimulate demand for finance of different types (and indeed some of the interventions will contribute to the supply side), although there is limited detail on these interventions at this time.
142 https://www.british-business-bank.co.uk/wp-content/uploads/2016/10/West-Midlands-Area-Overview-13-2.pdf European Investment Bank Using Financial Instruments for SMEs in England in the 2014-2020 Programming Period. A study in support of the ex-ante assessment for the deployment of EU resources
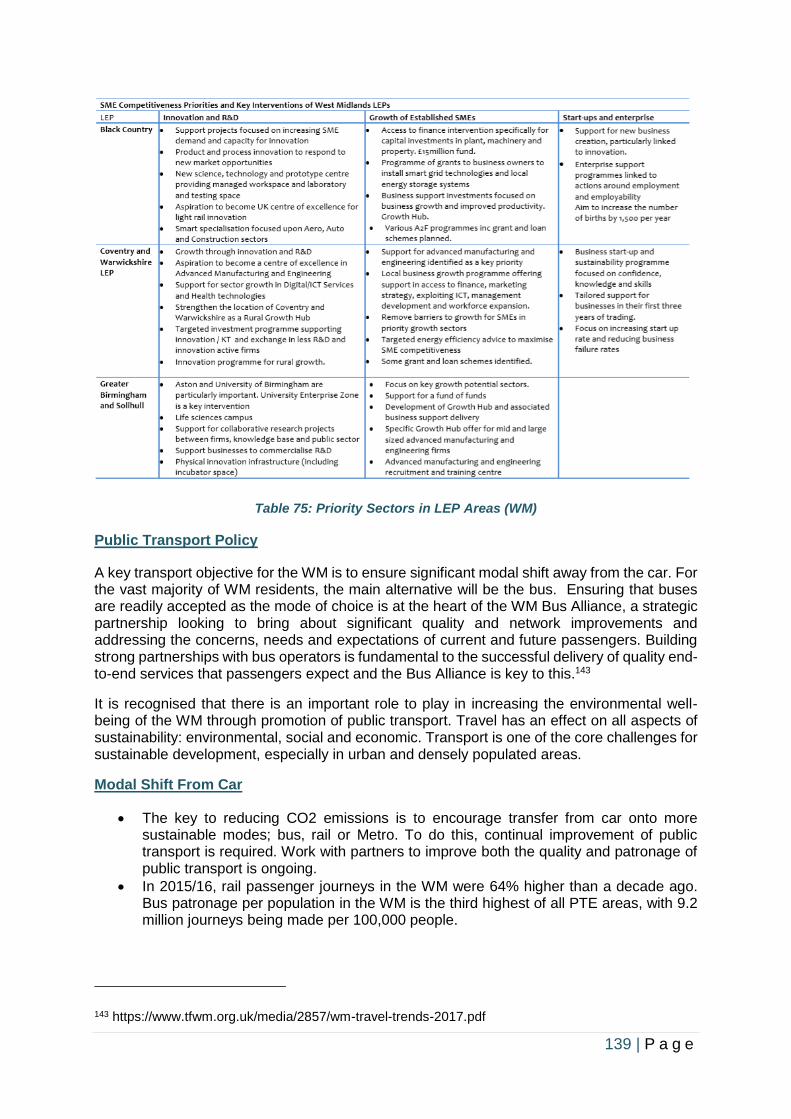
139 | P a g e
Table 75: Priority Sectors in LEP Areas (WM)
Public Transport Policy
A key transport objective for the WM is to ensure significant modal shift away from the car. For the vast majority of WM residents, the main alternative will be the bus. Ensuring that buses are readily accepted as the mode of choice is at the heart of the WM Bus Alliance, a strategic partnership looking to bring about significant quality and network improvements and addressing the concerns, needs and expectations of current and future passengers. Building strong partnerships with bus operators is fundamental to the successful delivery of quality end-to-end services that passengers expect and the Bus Alliance is key to this.143
It is recognised that there is an important role to play in increasing the environmental well-being of the WM through promotion of public transport. Travel has an effect on all aspects of sustainability: environmental, social and economic. Transport is one of the core challenges for sustainable development, especially in urban and densely populated areas.
Modal Shift From Car
• The key to reducing CO2 emissions is to encourage transfer from car onto more sustainable modes; bus, rail or Metro. To do this, continual improvement of public transport is required. Work with partners to improve both the quality and patronage of public transport is ongoing.
• In 2015/16, rail passenger journeys in the WM were 64% higher than a decade ago. Bus patronage per population in the WM is the third highest of all PTE areas, with 9.2 million journeys being made per 100,000 people.
143 https://www.tfwm.org.uk/media/2857/wm-travel-trends-2017.pdf
140 | P a g e
• Development of the Midland Metro network to include additional extensions and further integration with rail and bus will help transfer more journeys made by car onto public transport.
• It is encouraging to see a continual increase in the number of journeys by public transport into Birmingham City Centre. 63% of all journeys into the city centre during morning peak are now by public transport, compared with only 48% in 1997.
• Many more successes and initiatives to help improve and encourage transfer onto public transport are evidenced in the report (TfWM travel Trends, 2017).
The Sustainable Travel Team (STT), in partnership with the seven WM Metropolitan local authorities, work together to help local businesses, schools and communities make smarter travel choices to access jobs, education and leisure opportunities – supporting the economy while reducing carbon. Below is an overview on the services provided by the STT.
• Smarter Choices are techniques for influencing and supporting people’s travel behaviour towards more sustainable options, including:
• Providing people with better information about their travel options
• Actively marketing sustainable travel options
• Making improvements to transport services to meet people’s needs
• Providing options that reduce the need to travel at all
• As part of an integrated transport system, cycling and walking can:
• Support economic growth by reducing congestion and delays on our road network
• Improve the environment by helping to reduce carbon emissions, air pollution, noise
• Offer an affordable, convenient and low-cost travel option to access jobs, education and leisure opportunities, particularly for people without a car
• Increase physical activity levels and improve physical and mental health
• Create better places to live and visit, by making it easier for people to move around their local communities.
Cycling Charter
Encouraging more people to walk and cycle can contribute to the vision of ‘building a healthier, happier, better connected and more prosperous WM.’ The Cycling Charter is a set of aims to make the step change to increase cycling to 5% of modal share across the WM. These aims were agreed by key stakeholders including the seven constituent local authorities, TfWM, Sustrans, Cycling UK and the Canals & Rivers Trust. The Charter has the following themes around which an action plan was developed and currently being delivered:
• Leadership and Profile
• Cycling Network
• Promoting and Encouraging Cycling
• Funding
During 2016/17, there was successful engagement of the Charter member organisations through stakeholder management by the Cycling Charter Coordinator. Quarterly meetings were held with an average of 14 of the 20 participating organisations attending. Meetings included workshops and facilitated discussions to foster dialogue between the members of the group, to share ideas and best practice. New stakeholders have been identified (Chiltern Rail, WM Rail, and Cycling Projects) and will be invited to future meetings.
Environmental Policy
At the launch of the Committee on Climate Change's 2019 Progress report to Parliament, Chief Executive Chris Stark said that the world is ‘currently, optimistically - at best - on track for three
141 | P a g e
degrees Celsius warming’ and that policies must urgently be implemented to ensure the net zero targets - just enshrined in UK law - can be met.
The report says the surface transport sector is still the largest contributor to the UK's greenhouse gas emissions and, therefore, a key area in need of intensified policy focus.
If the UK - which hopes to host next year's vital international gathering on climate change (COP26) - is to be a credible host for the conference, it needs to set an example and implement policy effectively.
The new report highlighted specific areas of immediate concern, such as lack of progress on new car and van CO2 performance, EV registrations and biofuels uptake.
It also lays out some specific priorities for the road transport sector in 2019/20: A sales ban on conventional vehicles moved to 2030-35 (and clarification that this means only battery electric - or other zero carbon tailpipe - emissions vehicles will be sold after that point)
• A clearer approach to EU vehicle standards and testing • Stronger incentives to purchase cleaner vehicles including fiscal instruments • Plans for roll-out of zero emission HGVs and stretching targets for CO2 reductions • Schemes to support walking, cycling, public transport
It also includes as priorities for the long-term:
• Continued development of charging infrastructure • A decision on future for HGVs in the 2020s • A 98% reduction in emissions by 2050
Other actions recommended are for a clarification of the UK regulatory approach to the EU 2020/21 new car and van CO2 targets and for the setting of stretching CO2 targets for new cars and vans beyond 2020, requiring a high electric vehicle market share.
The report says that a 'real world' testing regime must be used alongside standardised tests.
The UK has legislated for net-zero emissions by 2050. 144
Future of Mobility: Urban Strategy – Moving Britain Ahead (March 2019)
This strategy sets out the approach Government will take to seize the opportunities from the changes happening in urban transport.
It sets out the benefits we want mobility innovation to deliver and the Principles that will help us achieve these.
144 https://www.lowcvp.org.uk/news,now-do-it-ccc-says-uk-government-must-now-implement-policies-to-deliver-net-zero-requirement_3973.htm
142 | P a g e
In facilitating innovation in urban mobility for freight,
passengers and services, the Government’s approach
will be underpinned as far as possible by the following
Principles:
1. New modes of transport and new mobility
services must be safe and secure by design.
2. The benefits of innovation in mobility must be
available to all parts of the UK and all segments
of society.
3. Walking, cycling and active travel must remain
the best options for short urban journeys.
4. Mass transit must remain fundamental to an
efficient transport system.
5. New mobility services must lead the transition
to zero emissions.
6. Mobility innovation must help to reduce
congestion through more efficient use of
limited road space, for example through
sharing rides, increasing occupancy or
consolidating freight.
7. The marketplace for mobility must be open to
stimulate innovation and give the best deal to
consumers.
8. New mobility services must be designed to
operate as part of an integrated transport
system combining public, private and multiple
modes for transport users.
9. Data from new mobility services must be
shared where appropriate to improve choice
and the operation of the transport system. 145
145 https://www.gov.uk/government/publications/future-of-mobility-urban-strategy
CASE STUDY
FUTURE MOBILITY IN WEST
MIDLANDS
Building on local strengths in the
WM.
The location of the first Future
Mobility Zone, in the WM, was
announced in 2018 to capitalise
on related investments in
transport innovation in the region.
A plan is currently being
developed by TfWM, in
collaboration with the DfT, to
invest an initial £20 million in a
range of future mobility
measures.
The WM is also responding to the
Future of Mobility Grand
Challenge through development
of a Local Industrial Strategy.
This will build on the area’s
automotive and rail clusters and
major planned investment in new
public transport systems and 5G.
143 | P a g e
Campania Region
Italy
Regional Policy
General features To understand the Campania Region policies promoting territorial development, it is appropriate to clarify the role that Italian Regions play as Public Administration.
Italian Public Administration Legal Order The Public Administration in Italy is governed by four distinct levels:
- State
- Regions
- Provinces and Metropolitan Cities
- Municipalities
Legislative Power Legislative Power is divided between State and Regions according to different issues of public interest:
- Exclusive competences of the State: Foreign Policy, Defense and Army, Currency,
Environmental Protection, Education.
- Concurrent legislation: Foreign Trade, Scientific and Technology Research, Civil
Protection, Large Transport and Navigation Networks, Economic Development.
- Exclusive regional competence: Local Public Transport, Vocational Training,
Healthcare, Housing Policies.
Legislative Powers give autonomy of expenditure according to sectoral competencies.
Relationships for territorial government To exercise legislative power and public resources expenditure, two important institutions set up the relationship State/Regions and State/Regions/Local Authorities (Provinces, Metropolitan Cities and Municipalities):
- Conference of Regions and Autonomous Provinces (which brings together the
Presidents of Italian Regions and the autonomous Provinces of Trento and Bolzano).
- State-Regions Conference (which brings together political representatives of State and
Regions)
- Unified Conference (which brings together political representatives of State, Regions
and Local Authorities).
We focalise our attention on the first one.
The Conference of Autonomous Regions and Provinces of Trento and Bolzano The Conference has the following objectives:
144 | P a g e
a) define and promote common positions on issues of interest of the Regions. Drafting documents and proposals in order to represent them to the Government and Parliament and other central bodies of State and EU institutions;
b) prepare opinions and analyses in accordance with current legislation;
c) to allow the connection with local autonomies at national level.
The Conference is organized into the following bodies: Assembly, President of Assembly, Vice-President, Bureau, Commissions.
The Commissions represent the supporting bodies through which the Conference operates. They gather the Councilors of Regions responsible for matters of interest.
In addition, each Commission uses Technical Coordination representatives, experts in the subjects of the Commission.
Each Commission and its Technical Coordination are chaired by a Regional Councilor identified by the Conference of Presidents and a Technician of the same Region.
Among the Commissions, the one dealing with issues of RECREATE's scope of interest is the 4th Commission “Infrastructure, Mobility and Government Commission of the territory”. It is responsible of the following areas:
- public works civil ports and airports,
- regional ports and airports,
- national transport and navigation networks,
- regional transport and navigation networks,
- local public transport,
- traffic,
- parking lots and bike lanes,
- construction and urban planning,
- public housing.
This Commission is coordinated for the last fifteen years by the Campania Region.
Financial resources Financial resources to the Regions come from European Union, State and Local taxation (percentage of taxes paid directly to Regions and Municipalities).
1. State Funds
The State transfers to the Regions funds to provide services of exclusive regional competence: Local Public Transport, Professional Training, Health, Housing Policies.
In addition, the State provides the Regions with resources for the implementation of specific national policies of local interest. For example:
- purchase of automotive and rail rolling stock
- purchase of ship material
- construction and maintenance of mobility infrastructure
- implementation of environmental protection interventions (e.g. sustainable mobility)
2. European Funds
- ESF – European Social Fund
- EDF – European Development and Cohesion Fund
- FC - Cohesion Fund
- FEASR - European Agricultural Fund for Rural Development
- FEAMP - European Maritime Affairs and Fisheries Fund
145 | P a g e
They are managed by the Regions according to their own schedules drawn up within a national framework and regional operational programmes.
3. Local Taxes
Local taxes are applied to citizens' incomes directly by Regions and Municipalities. These resources are mainly used for social services and local public interest services.
The Policies for the Transport The Transport is operated in Italy at two levels:
- National level
The State is responsible for: - National rail and road transport networks;
- Highways;
- Railway Networks for High Speed and High Capacity;
- National Transport Services (essentially rail transport);
- Ports and Airports of national interest;
- Aerospace.
- Local level
At the local level, the Regions are responsible for: - Regional rail and road transport networks;
- Metropolitan Networks and other constrained-driven networks (metropolitan and
urban transport);
- Port and Airport Infrastructures of regional interest;
- Infrastructures for the “Last Mile” and Logistics;
- Local Public Transport.
In some cases, the Regions delegate the local public transport management to Provinces and Municipalities.
Regional issues
Introduction Other sections of this report describe Campania infrastructures’ size and services for transport and mobility. This section investigates the policies implemented in favor of companies operating in infrastructures and transport services sectors. Of course, in Campania there are Big Enterprises and SMEs and, in some cases, Micro and family businesses (particularly in the LPT sector).
Campania Region’ Policies for the development of SMEs in the transport sector are addressed to the following:
- companies providing local public transport services
- companies that produce goods in the mobility and transport sector
- companies and other organisations that carry out research and innovation for the
development of SMEs and Labour Market; among them are: Technology Transfer
Operators and Enterprise Incubators.
In addition, the Campania Region develops its local policies also making use of the work carried out by the Conference of Regions and Autonomous Provinces, the Conferences Unified
146 | P a g e
and State-Regions, in which it works tight to identify policy and interventions of interest to orient enterprises and labour market in its own territory.
Some of the main Transport policies of the Campania Region Over the recent years, Campania Region has intervened to support and develop specific areas of Mobility and Transport in its territories, in order to ensure:
- improving services to provide to citizens;
- sustainable growth - not only environmentally – of mobility and transport;
- consolidation and growth of enterprises operating in these areas.
In the following paragraphs we describe some areas in which policy actions are more focused in recent years.
• Local Public Transport
The LPT’ services in Campania worth about 1 billion euros, including: resources provided directly by the State, Region direct resources and, for a small part, by Municipalities and, last but not least, incomes from sale of travel titles.
The Campania Region in recent years has worked to introduce rules aimed at the efficiency and rationalisation of TPL services, helping companies in their process of organisational modernization.
• Rolling stock and ship
Since 2015, the Campania Region, as part of a wider national intervention programme, has been implementing a significant modernization of the fleet of transport means operating in Campania for road, rail and water. The new rolling stock and boats are characterised by greater sustainability, technological efficiency, accessibility and safety and equipped with the latest Intelligent Transport System technologies.
• Road, rail, port, logistics infrastructure
Large interventions are carried out, in Campania. in the area of transport infrastructure (roads, railways, ports, airports, interports). These measures are aimed at both the construction of new infrastructure and the modernisation and security of existing ones.
• Sustainable Mobility
The Campania Region is updating its Transport Plan with a focus on Sustainable Mobility. In this context, the Campania region interest is to promote more effective, safe, modern, environmentally friendly mobility. The New Plan includes both the redesign and improvement of transport lines, current and programmatic interventions on different infrastructures, as well as rules for sustainable regional mobility. Regarding infrastructures for sustainable mobility, the Campania Region aims to build new infrastructures for rechargeable sustainable vehicles, such as methane, hydrogen, electricity and purchase rolling stock so powered.
• Biking Mobility
As part of the new General Transport Plan, the Campania Region is developing the Regional Plan for Biking Mobility. This Plan draws the regional-scale cycle system, as element of connection and integration between provincial and municipal bike systems, in relation to territorial morphology, urban development and natural system, with particular reference to coasts, rivers, lakes, national and regional parks and main attraction poles. The Regional Biking System is articulated in backbones of the regional biking network: i.e. medium-long-distance routes of the national and international biking networks that provide connections between both local tourist interest and urban centres included in superregional systems, up to European level, as well as in routes for municipal and inter-communal biking.
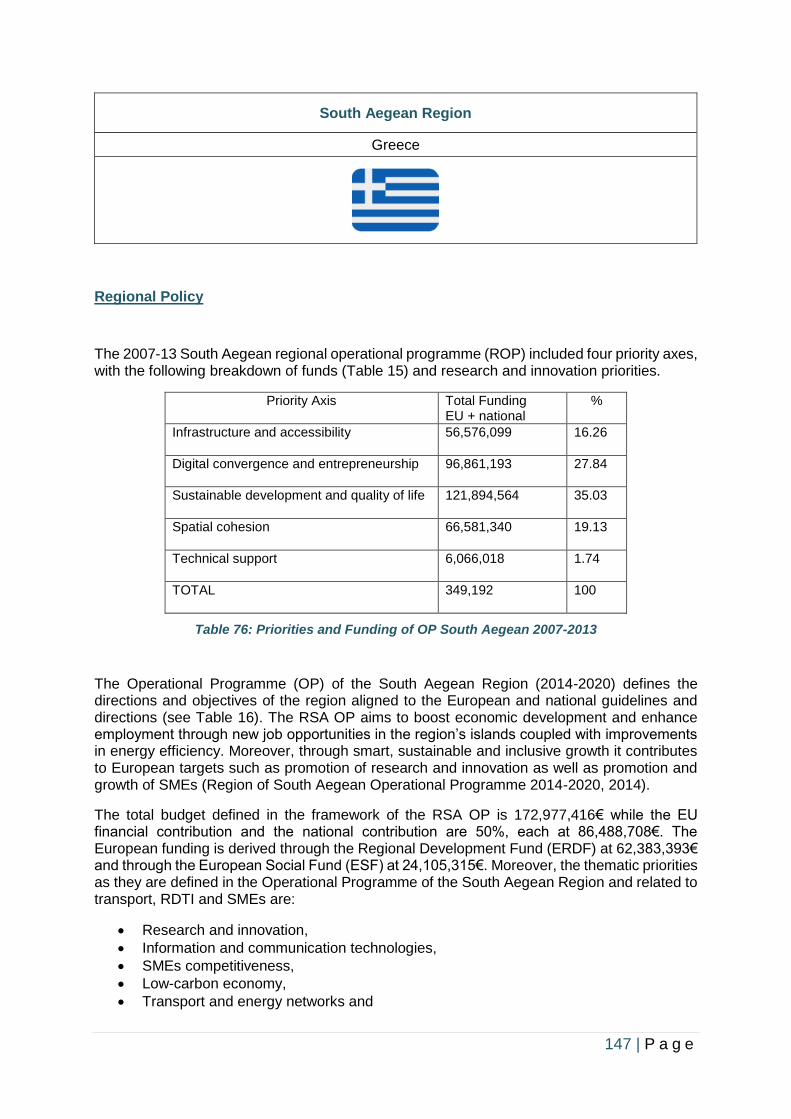
147 | P a g e
South Aegean Region
Greece
Regional Policy
The 2007-13 South Aegean regional operational programme (ROP) included four priority axes, with the following breakdown of funds (Table 15) and research and innovation priorities.
Priority Axis Total Funding EU + national
%
Infrastructure and accessibility 56,576,099 16.26
Digital convergence and entrepreneurship 96,861,193 27.84
Sustainable development and quality of life 121,894,564 35.03
Spatial cohesion 66,581,340 19.13
Technical support 6,066,018 1.74
TOTAL 349,192 100
Table 76: Priorities and Funding of OP South Aegean 2007-2013
The Operational Programme (OP) of the South Aegean Region (2014-2020) defines the directions and objectives of the region aligned to the European and national guidelines and directions (see Table 16). The RSA OP aims to boost economic development and enhance employment through new job opportunities in the region’s islands coupled with improvements in energy efficiency. Moreover, through smart, sustainable and inclusive growth it contributes to European targets such as promotion of research and innovation as well as promotion and growth of SMEs (Region of South Aegean Operational Programme 2014-2020, 2014).
The total budget defined in the framework of the RSA OP is 172,977,416€ while the EU financial contribution and the national contribution are 50%, each at 86,488,708€. The European funding is derived through the Regional Development Fund (ERDF) at 62,383,393€ and through the European Social Fund (ESF) at 24,105,315€. Moreover, the thematic priorities as they are defined in the Operational Programme of the South Aegean Region and related to transport, RDTI and SMEs are:
• Research and innovation,
• Information and communication technologies,
• SMEs competitiveness,
• Low-carbon economy,
• Transport and energy networks and
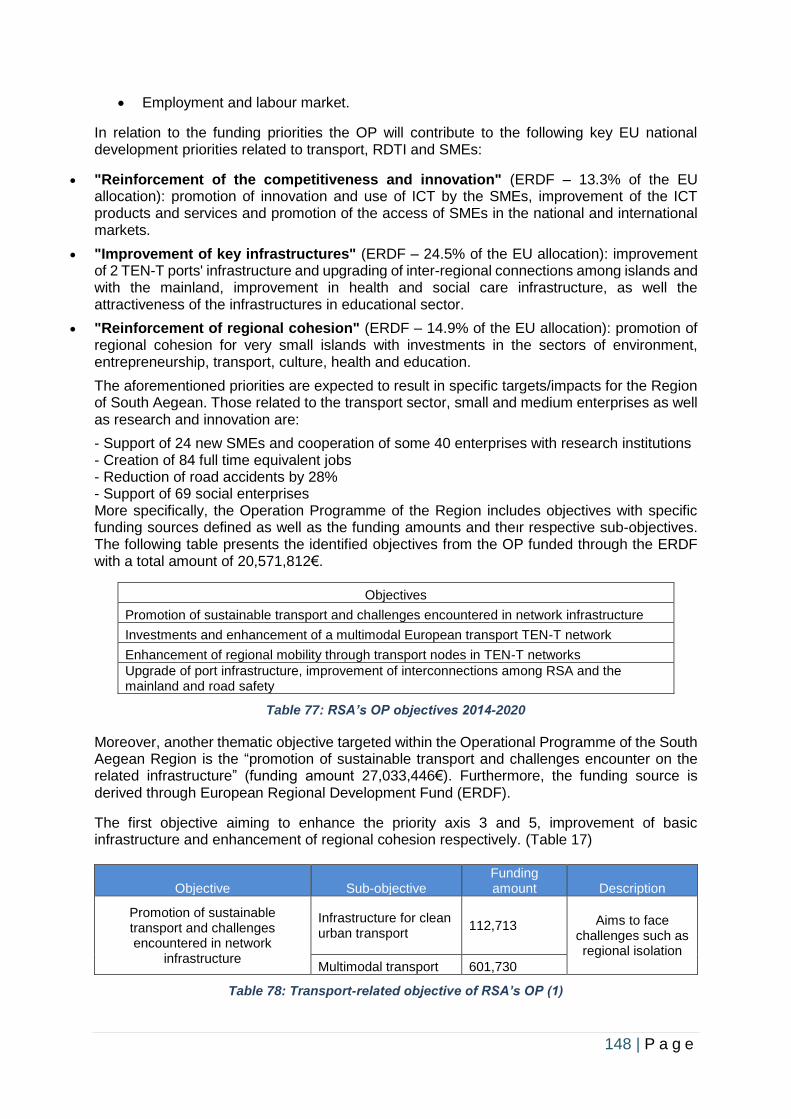
148 | P a g e
• Employment and labour market.
In relation to the funding priorities the OP will contribute to the following key EU national development priorities related to transport, RDTI and SMEs:
• "Reinforcement of the competitiveness and innovation" (ERDF – 13.3% of the EU allocation): promotion of innovation and use of ICT by the SMEs, improvement of the ICT products and services and promotion of the access of SMEs in the national and international markets.
• "Improvement of key infrastructures" (ERDF – 24.5% of the EU allocation): improvement of 2 TEN-T ports' infrastructure and upgrading of inter-regional connections among islands and with the mainland, improvement in health and social care infrastructure, as well the attractiveness of the infrastructures in educational sector.
• "Reinforcement of regional cohesion" (ERDF – 14.9% of the EU allocation): promotion of regional cohesion for very small islands with investments in the sectors of environment, entrepreneurship, transport, culture, health and education.
The aforementioned priorities are expected to result in specific targets/impacts for the Region of South Aegean. Those related to the transport sector, small and medium enterprises as well as research and innovation are:
- Support of 24 new SMEs and cooperation of some 40 enterprises with research institutions - Creation of 84 full time equivalent jobs - Reduction of road accidents by 28% - Support of 69 social enterprises More specifically, the Operation Programme of the Region includes objectives with specific funding sources defined as well as the funding amounts and theιr respective sub-objectives. The following table presents the identified objectives from the OP funded through the ERDF with a total amount of 20,571,812€.
Objectives
Promotion of sustainable transport and challenges encountered in network infrastructure
Investments and enhancement of a multimodal European transport TEN-T network
Enhancement of regional mobility through transport nodes in TEN-T networks
Upgrade of port infrastructure, improvement of interconnections among RSA and the mainland and road safety
Table 77: RSA’s OP objectives 2014-2020
Moreover, another thematic objective targeted within the Operational Programme of the South Aegean Region is the “promotion of sustainable transport and challenges encounter on the related infrastructure” (funding amount 27,033,446€). Furthermore, the funding source is derived through European Regional Development Fund (ERDF).
The first objective aiming to enhance the priority axis 3 and 5, improvement of basic infrastructure and enhancement of regional cohesion respectively. (Table 17)
Objective Sub-objective Funding amount Description
Promotion of sustainable transport and challenges encountered in network
infrastructure
Infrastructure for clean urban transport
112,713 Aims to face challenges such as regional isolation
Multimodal transport 601,730
Table 78: Transport-related objective of RSA’s OP (1)
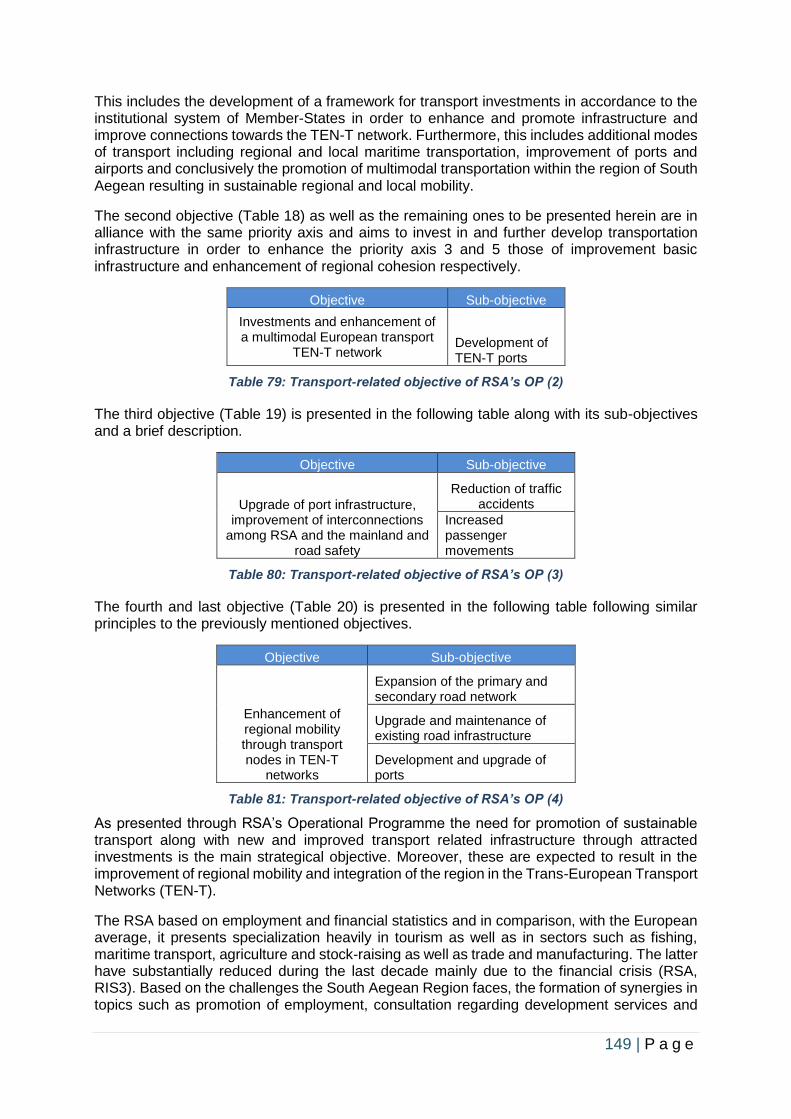
149 | P a g e
This includes the development of a framework for transport investments in accordance to the institutional system of Member-States in order to enhance and promote infrastructure and improve connections towards the TEN-T network. Furthermore, this includes additional modes of transport including regional and local maritime transportation, improvement of ports and airports and conclusively the promotion of multimodal transportation within the region of South Aegean resulting in sustainable regional and local mobility.
The second objective (Table 18) as well as the remaining ones to be presented herein are in alliance with the same priority axis and aims to invest in and further develop transportation infrastructure in order to enhance the priority axis 3 and 5 those of improvement basic infrastructure and enhancement of regional cohesion respectively.
Objective Sub-objective
Investments and enhancement of a multimodal European transport
TEN-T network Development of TEN-T ports
Table 79: Transport-related objective of RSA’s OP (2)
The third objective (Table 19) is presented in the following table along with its sub-objectives and a brief description.
Objective Sub-objective
Upgrade of port infrastructure, improvement of interconnections
among RSA and the mainland and road safety
Reduction of traffic accidents
Increased passenger movements
Table 80: Transport-related objective of RSA’s OP (3)
The fourth and last objective (Table 20) is presented in the following table following similar principles to the previously mentioned objectives.
Objective Sub-objective
Enhancement of regional mobility through transport nodes in TEN-T
networks
Expansion of the primary and secondary road network
Upgrade and maintenance of existing road infrastructure
Development and upgrade of ports
Table 81: Transport-related objective of RSA’s OP (4)
As presented through RSA’s Operational Programme the need for promotion of sustainable transport along with new and improved transport related infrastructure through attracted investments is the main strategical objective. Moreover, these are expected to result in the improvement of regional mobility and integration of the region in the Trans-European Transport Networks (TEN-T).
The RSA based on employment and financial statistics and in comparison, with the European average, it presents specialization heavily in tourism as well as in sectors such as fishing, maritime transport, agriculture and stock-raising as well as trade and manufacturing. The latter have substantially reduced during the last decade mainly due to the financial crisis (RSA, RIS3). Based on the challenges the South Aegean Region faces, the formation of synergies in topics such as promotion of employment, consultation regarding development services and
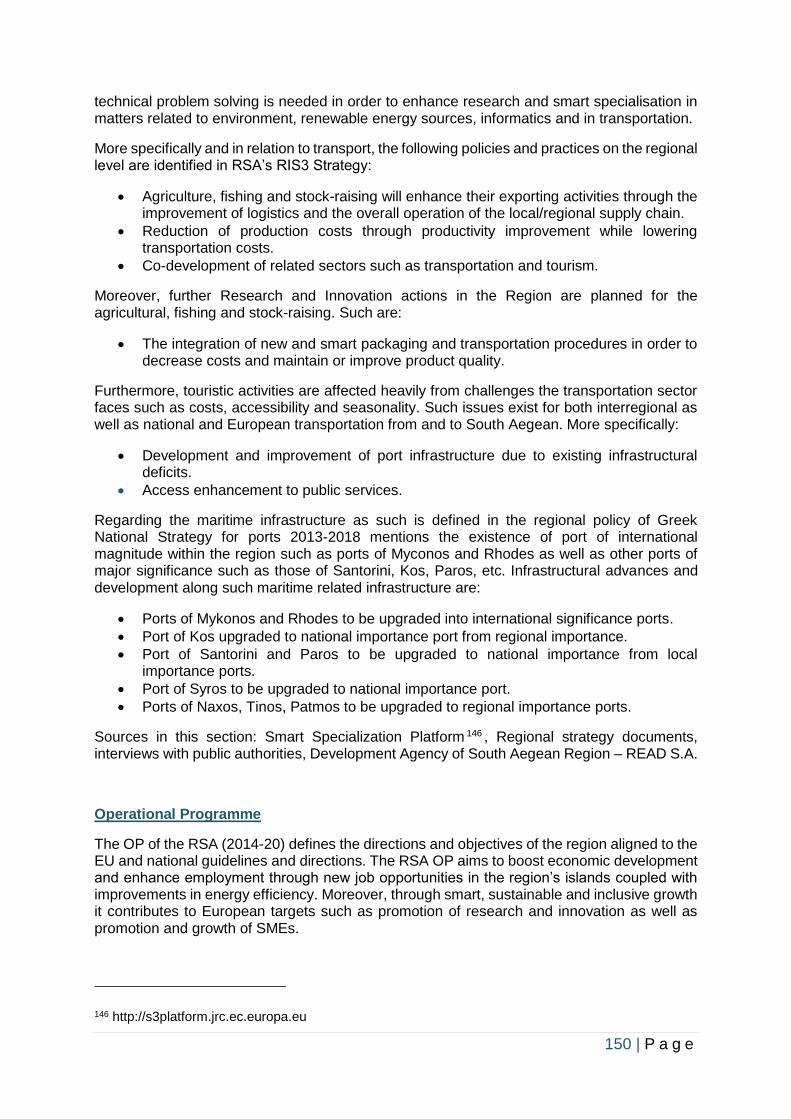
150 | P a g e
technical problem solving is needed in order to enhance research and smart specialisation in matters related to environment, renewable energy sources, informatics and in transportation.
More specifically and in relation to transport, the following policies and practices on the regional level are identified in RSA’s RIS3 Strategy:
• Agriculture, fishing and stock-raising will enhance their exporting activities through the improvement of logistics and the overall operation of the local/regional supply chain.
• Reduction of production costs through productivity improvement while lowering transportation costs.
• Co-development of related sectors such as transportation and tourism.
Moreover, further Research and Innovation actions in the Region are planned for the agricultural, fishing and stock-raising. Such are:
• The integration of new and smart packaging and transportation procedures in order to decrease costs and maintain or improve product quality.
Furthermore, touristic activities are affected heavily from challenges the transportation sector faces such as costs, accessibility and seasonality. Such issues exist for both interregional as well as national and European transportation from and to South Aegean. More specifically:
• Development and improvement of port infrastructure due to existing infrastructural deficits.
• Access enhancement to public services.
Regarding the maritime infrastructure as such is defined in the regional policy of Greek National Strategy for ports 2013-2018 mentions the existence of port of international magnitude within the region such as ports of Myconos and Rhodes as well as other ports of major significance such as those of Santorini, Kos, Paros, etc. Infrastructural advances and development along such maritime related infrastructure are:
• Ports of Mykonos and Rhodes to be upgraded into international significance ports.
• Port of Kos upgraded to national importance port from regional importance.
• Port of Santorini and Paros to be upgraded to national importance from local importance ports.
• Port of Syros to be upgraded to national importance port.
• Ports of Naxos, Tinos, Patmos to be upgraded to regional importance ports.
Sources in this section: Smart Specialization Platform 146 , Regional strategy documents, interviews with public authorities, Development Agency of South Aegean Region – READ S.A.
Operational Programme
The OP of the RSA (2014-20) defines the directions and objectives of the region aligned to the EU and national guidelines and directions. The RSA OP aims to boost economic development and enhance employment through new job opportunities in the region’s islands coupled with improvements in energy efficiency. Moreover, through smart, sustainable and inclusive growth it contributes to European targets such as promotion of research and innovation as well as promotion and growth of SMEs.
146 http://s3platform.jrc.ec.europa.eu
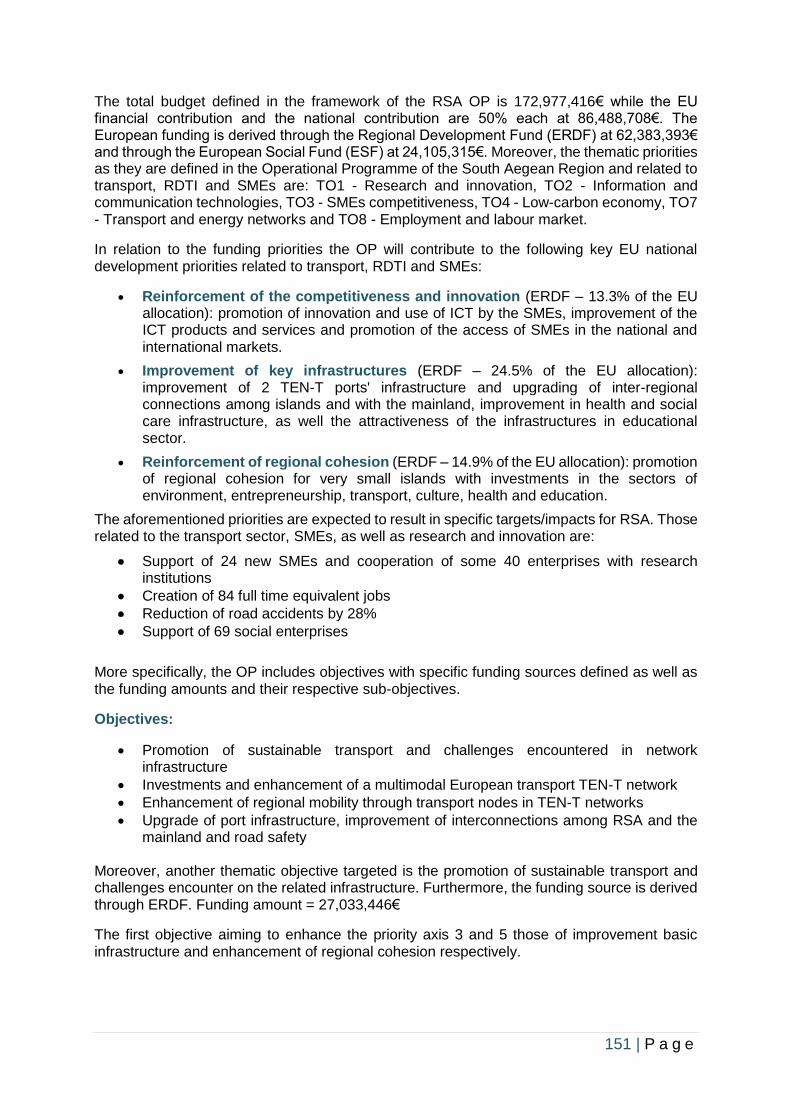
151 | P a g e
The total budget defined in the framework of the RSA OP is 172,977,416€ while the EU financial contribution and the national contribution are 50% each at 86,488,708€. The European funding is derived through the Regional Development Fund (ERDF) at 62,383,393€ and through the European Social Fund (ESF) at 24,105,315€. Moreover, the thematic priorities as they are defined in the Operational Programme of the South Aegean Region and related to transport, RDTI and SMEs are: TO1 - Research and innovation, TO2 - Information and communication technologies, TO3 - SMEs competitiveness, TO4 - Low-carbon economy, TO7 - Transport and energy networks and TO8 - Employment and labour market.
In relation to the funding priorities the OP will contribute to the following key EU national development priorities related to transport, RDTI and SMEs:
• Reinforcement of the competitiveness and innovation (ERDF – 13.3% of the EU allocation): promotion of innovation and use of ICT by the SMEs, improvement of the ICT products and services and promotion of the access of SMEs in the national and international markets.
• Improvement of key infrastructures (ERDF – 24.5% of the EU allocation): improvement of 2 TEN-T ports' infrastructure and upgrading of inter-regional connections among islands and with the mainland, improvement in health and social care infrastructure, as well the attractiveness of the infrastructures in educational sector.
• Reinforcement of regional cohesion (ERDF – 14.9% of the EU allocation): promotion of regional cohesion for very small islands with investments in the sectors of environment, entrepreneurship, transport, culture, health and education.
The aforementioned priorities are expected to result in specific targets/impacts for RSA. Those related to the transport sector, SMEs, as well as research and innovation are:
• Support of 24 new SMEs and cooperation of some 40 enterprises with research institutions
• Creation of 84 full time equivalent jobs
• Reduction of road accidents by 28%
• Support of 69 social enterprises
More specifically, the OP includes objectives with specific funding sources defined as well as the funding amounts and their respective sub-objectives.
Objectives:
• Promotion of sustainable transport and challenges encountered in network infrastructure
• Investments and enhancement of a multimodal European transport TEN-T network
• Enhancement of regional mobility through transport nodes in TEN-T networks
• Upgrade of port infrastructure, improvement of interconnections among RSA and the mainland and road safety
Moreover, another thematic objective targeted is the promotion of sustainable transport and challenges encounter on the related infrastructure. Furthermore, the funding source is derived through ERDF. Funding amount = 27,033,446€
The first objective aiming to enhance the priority axis 3 and 5 those of improvement basic infrastructure and enhancement of regional cohesion respectively.
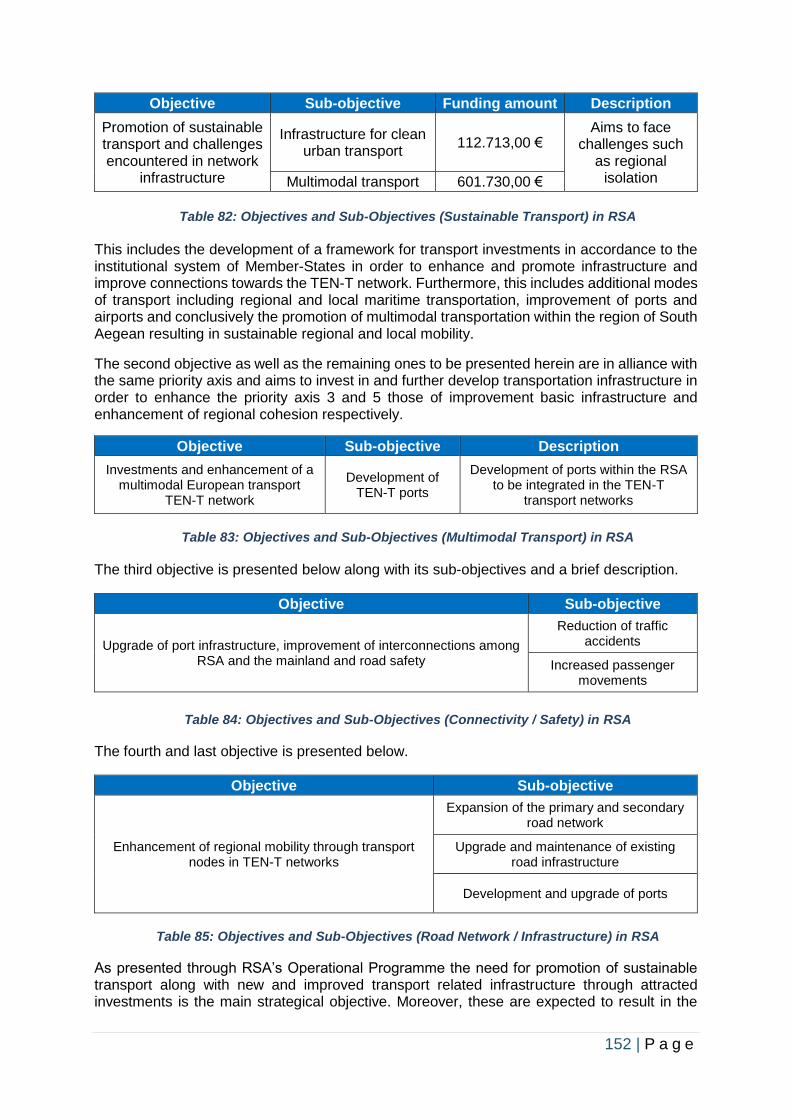
152 | P a g e
Objective Sub-objective Funding amount Description
Promotion of sustainable transport and challenges encountered in network
infrastructure
Infrastructure for clean urban transport
112.713,00 € Aims to face
challenges such as regional
isolation Multimodal transport 601.730,00 €
Table 82: Objectives and Sub-Objectives (Sustainable Transport) in RSA
This includes the development of a framework for transport investments in accordance to the institutional system of Member-States in order to enhance and promote infrastructure and improve connections towards the TEN-T network. Furthermore, this includes additional modes of transport including regional and local maritime transportation, improvement of ports and airports and conclusively the promotion of multimodal transportation within the region of South Aegean resulting in sustainable regional and local mobility.
The second objective as well as the remaining ones to be presented herein are in alliance with the same priority axis and aims to invest in and further develop transportation infrastructure in order to enhance the priority axis 3 and 5 those of improvement basic infrastructure and enhancement of regional cohesion respectively.
Objective Sub-objective Description
Investments and enhancement of a multimodal European transport
TEN-T network
Development of TEN-T ports
Development of ports within the RSA to be integrated in the TEN-T
transport networks
Table 83: Objectives and Sub-Objectives (Multimodal Transport) in RSA
The third objective is presented below along with its sub-objectives and a brief description.
Objective Sub-objective
Upgrade of port infrastructure, improvement of interconnections among RSA and the mainland and road safety
Reduction of traffic accidents
Increased passenger movements
Table 84: Objectives and Sub-Objectives (Connectivity / Safety) in RSA
The fourth and last objective is presented below.
Objective Sub-objective
Enhancement of regional mobility through transport nodes in TEN-T networks
Expansion of the primary and secondary road network
Upgrade and maintenance of existing road infrastructure
Development and upgrade of ports
Table 85: Objectives and Sub-Objectives (Road Network / Infrastructure) in RSA
As presented through RSA’s Operational Programme the need for promotion of sustainable transport along with new and improved transport related infrastructure through attracted investments is the main strategical objective. Moreover, these are expected to result in the
153 | P a g e
improvement of regional mobility and integration of the region in the Trans-European Transport Networks (TEN-T).
The RSA, based on employment and financial statistics and in comparison with the European average, it presents specialization heavily in tourism as well as in sectors such as fishing, maritime transport, agriculture and stock-raising as well as trade and manufacturing. The latter have substantially reduced during the last decade mainly due to the financial crisis (RSA, RIS3).
Based on the challenges the South Aegean Region faces, the formation of synergies in topics such as promotion of employment, consultation regarding development services and technical problem solving is needed in order to enhance research and smart specialisation in matters related to environment, renewable energy sources, informatics and in transportation.
More specifically and in relation to transport the following policies and practices on the regional level are identified in RSA’s RIS3:
• Agriculture, fishing and stock-raising will enhance their exporting activities through the improvement of logistics and the overall operation of the local/regional supply chain.
• Reduction of production costs through productivity improvement while lowering transportation costs.
• Co-development of related sectors such as transportation and tourism.
• Moreover, further Research and Innovation actions in the Region are planned for the agricultural, fishing and stock-raising. Such are:
• The integration of new and smart packaging and transportation procedures in order to decrease costs and maintain or improve product quality.
• Furthermore, touristic activities are affected heavily from challenges the transportation sector faces such as costs, accessibility and seasonality. Such issues exist for both interregional as well as national and European transportation from and to South Aegean. More specifically:
• Development and improvement of port infrastructure due to existing infrastructural deficits.
• Access enhancement to public services.
Lithuania
Lithuania
Regional Policy
Overview of Policy
Policy mix related to transport sector in Lithuania is very broad. First of all, transport sector was chosen as one of the Lithuania Smart Specialisation priorities. At the beginning, in total 6
154 | P a g e
priority areas were selected, one of which is “Transport, logistics and ICT”. Smart Specialization (S3) is a strategy of state support for R&D in which Lithuania, like other European Union countries, has set its R&D and innovation priorities, considering existing or potential competitive advantage. Priority directions for R&D and innovation were determined by analysing the potential of business in Lithuania: what is the susceptibility for knowledge of businesses in Lithuania, whether or not entrepreneurs will be able to engage in global value chains using gained knowledge, export their products and thus contribute to the strengthening of the economy. Experts from various institutions distinguished four thematic areas (T) in relation to this priority.
1. (T1) Intelligent Transport Systems and ICT: this priority includes implementation of electronic route planning technologies; electronic road billing systems; integrated transport management, route planning; vehicles interaction with infrastructure;
2. (T2) International transport corridor management and transport integration technologies/models: this priority includes innovative models and processes for managing international transport corridors and global logistics networks; models and technologies for securing transport and logistics processes; integration of different modes of transport; security of transportation and logistics;
3. (T3) Advanced electronic content, technologies for creating it, and informational interaction: this priority includes information technology semanticization technology; security technologies for electronic content; information technology interoperability technologies;
4. (T4) ICT infrastructure, cloud computing solutions and services: development of innovative (energy efficient, high performance, security) computing methods; development of business processes and activities management; development of automate information systems modernisation processes;
Recently, Lithuania Smart Specialisation Strategy has been evaluated and revised. According to various evaluation results and future forecasts, decision was made to change smart specialisation priorities. Now, seven instead of six priorities will make up Lithuania S3. Changes also occurred in priority “Transport, logistics and ICT”. It was decided to make two separate priority areas: “Smart, clean, integrated (linked) transport” and “Information and communication technologies”. New transport sector priority will include the creation of innovations and R&D activities: internet of things, smart management systems, positioning and data communication technologies, autonomous vehicles, transport safety and security technologies, Innovative models for managing international transport corridors and global logistics networks, Concepts and technologies for multimodal terminals and platforms.
The renewed priority for smart specialisation in transport will contribute to the ambitious
goal: development of an interconnected system covering all modes of transport where people, vehicles and transport infrastructure would constantly interact, the boundaries between modes of transport would be blurred and people and businesses would be provided with quality door-to-door services. At the same time, the implementation of technologies and innovations under this priority would allow further integration into global value chains.
Expected impact of this priority is: 1. By 2030 30-35% reduction in passenger car use;
2. Use of public transport increased by 10-15%;
3. Usage of bicycles increased 2-3 times;
155 | P a g e
4. Targeted reduction of fatalities on Lithuanian roads in order to achieve zero fatalities (by 2050);
5. 20% reduction in greenhouse gas emissions from transport;
6. Developed and implemented new models of innovative open supply chains that would increase the load rate of vehicles, reduce idle mileage and reduce vehicle pollution;
7. Broader integration of the Lithuanian transport system into the global transport - supply chains (with the forecast that Lithuania 's share in the global market segment will double by 2030);
Besides Smart Specialisation Strategy, transport sector was also included in other
important strategic documents which aims to encourage R&D and innovation in this sector. In 2012, Parliament of Lithuania passed Lithuania’s progress strategy “Lithuania 2030”. This strategy sets state’s vision and development priorities and implementation direction until 2030. It is a key planning document, which has to be taken into account when making strategic decisions and preparing state plans and programs.
Strategy has three broad development segments:
1. Smart society - a happy society with greater personal and economic security, fairer income distribution, clean environment, social and political inclusion, broad access to education and skills improvement, good human health;
2. Smart economy – is high added value economy based on knowledge, innovation, entrepreneurship, social responsibility, green growth and also flexible and competitive globally;
3. Smart management – it is service management, which is open, participatory, productive, responsive to the needs of society, competent and strategic decisions making government
In general, “Smart society” and “Smart economy” are relevant development sectors to transport sector. Broad targets of segment “Smart society” in relation to transport aim to reduce air pollution, improve environment for R&D activities, while “Smart economy” seeks to encourage science and business cooperation, science and business organizations integration into international value creation chains, business development. It should be noted, that program itself is a vision document, not an action plan. The program emphasizes the essential needs for change and does not specify any specific goals for individual sector of the economy. However, it also should be noted, that “Lithuania 2030” broad targets have to be involved in other strategic document, so it creates continuity of goals. In order to achieve goals, which are set up in a Lithuania’s Progress Strategy “Lithuania 2030”, National Progress Program for 2014-2020 was developed. It seeks to implement broadly described “Lithuania 2030” aims, however emphasise there has to be made on economic sphere. In addition to other objectives, it strives to foster research-business collaboration, implementation of joint projects and joint use of R&D infrastructure. It also contains a set of demand-side innovation policy measures, e.g. innovative public and pre-commercial procurement, regulation, financial and tax incentives for innovation consumers. Program pays a lot of attention to education and R&D activities in Lithuania and seek to improve these spheres. It sets recommendations to modernise education system infrastructure, to implement advanced information and other technologies, improve teachers’ education systems and so on. Besides that, program emphasise the need to strengthen the intellectual potential of the Lithuanian knowledge building system and further modernise the public R&D infrastructure.
Another important strategy for transport sector is “National Transport Development Program 2014-2022”. The program is necessary for the harmonious development of the Lithuanian transport system, efficient management of state resources and use of the European
156 | P a g e
Union (hereinafter - EU) structural funds, increased competitiveness of the transport sector. The strategic goal of the program is to create a sustainable, environmentally friendly, competitive and high added value Lithuanian transport system.
Strategy objectives are: 1. Enhance freight and passenger mobility by improving the trans-European transport network core network corridors and their links with national and local transport networks and by developing interoperability between modes of transport;
2. Increase the competitiveness of the transport sector and improve the quality of transport and logistics services through an active transport policy; 3. Promote the sustainability of the local (urban and suburban) transport system;
4. Increase energy efficiency in transport and reduce the negative environmental impact of transport
Lithuania National Security Strategy is also relevant document for transport sector in
Lithuania. Transport is included as one of the interests of Lithuania national security, which means that country will defend this sector in foreign affairs. Last but not least, as a part of EU, Lithuania and its economic sectors are also influenced by
EU law, either it be recommendations, directives or regulations and by various strategic
documents. Besides Smart Specialisation Strategy, transport sector was also included in other
important strategic documents which aims to encourage R&D and innovation in this sector. In
2012, Parliament of Lithuania passed Lithuania’s progress strategy ‘Lithuania 2030’. It has four
major directions of development which are related with transport and seeks to encourage
environment friendly transport and implementation of digital technologies together with
innovations and intellectual transport systems.147 Another important document is Transport
sector white paper. This document sets out priority development areas in the transport sector:
effectiveness of roads throughput; modernization of road infrastructure; promotion of new
sustainable fuels, optimisation of logistic chains. One more important transport related
document is National Transport System Development Program. In general, this document
does not mention anything new in comparison to other mentioned legal acts/strategies:
encourage safety, efficiency, R&D, implementation of new technologies, intellectual systems
of transport, modernization.148 It should be mentioned, that broad strategic documents in
Lithuania mostly focuses on developments in road transportation. One more important
document is Lithuania National Security strategy. Transport sector is included as one of the
interests of Lithuania national security, which means that country will defend this sector in
foreign affairs.
Besides political documents and strategies, transport sector can get support through approved
European Structural Funds. Measure ‘Inočekiai’ total budget is 5 000 000,00 EUR. Already,
there are 73 signed contracts and 1 780 000 EUR has been granted. Potential applicants are
legal entities that carry out or intends to carry out R&D activities. This measure finances these
activities: providing innovative vouchers for R&D projects, provision of innovative vouchers for
technical feasibility studies for R&D work or planned R&D activities. Another important support
147 Lietuva 2030 148 Galimi transporto sektoriaus Europos Sąjungoje struktūrinės paramos naudojimo prioritetai
157 | P a g e
measure for SMEs in Lithuania, which is also funded by European structural funds is
‘Inostartas’. Measure total budget is 9 400 000.00 EUR.
Until now, there are 15 signed contracts and 273 962.71 EUR has been granted. Potential
applicants are SME business entities operating for up to 12 months from the date of
registration; SMEs operating for at least 12 months and up to 36 months from the date of
registration of the activity; knowledge-intensive SMEs operating for at least 12 months from
the date of registration. Companies can get financing for these activities: promotion of the
creation of innovative small and medium-sized business entities in the implementation of
phases 2–6 of R&D activities; recruitment of researchers and/or scientists in knowledge-
intensive SMEs and, at the same time, the development of SME products for their commercial
realisation; promoting the development of innovative small and medium-sized business entities
by implementing R&D activities stages 7-9, which are specified in R&D Phase Classification
Specification.
Third support measure is ‘Intelektas. Bendri mosklo ir verslo projektai’. Total budget of this
measure is 174 213 512,00 EUR. 268 business entities already signed contracts and received
150,67 million EUR. Potential applicants are private legal entities (except science and
education institutions) which implements R&D activities. Activities financed by this measure
include: research and (or) development; enterprises initial investments to create new or
expand existing company R&D and innovation infrastructure which is not available in public or
clusters; certification of new products and technologies and related activities.
One more financial measure is ‘Eco-inovacijos LT+’ with a budget of 86 886 005,00 EUR. At
this moment, there are 56 signed contracts with and granted 22,39 million EUR. Potential
applicants for funding are SMEs. Activities which can be funded are the introduction and
promotion of technological eco-innovations, which in general reduce the negative impact of
economic activity on the environment, encourage more environmental-friendly processes and
equipment.
South-West Oltenia
Romania
Regional Policy
Introduction to Policy in South-West Oltenia Region Romania has no formal regional RDI policy. RDI policies are designed and coordinated at national level by the Ministry of National Education and Research, which has a very limited
158 | P a g e
role in regional RDI potential and exerts little territorial coordination of RDI, although its mandate includes the task to stimulate regional and local development. The SWO region has 5 counties, 40 municipalities (including 11 cities), 408 communes and 2,070 villages. It has non-administrative or legal status, as it only represents a NUTS 2 territorial unit for which regional development policies are formulated and implemented, for more efficient use of resources from national programmes and structural funds. Nevertheless, the Regional Development Council SWO was founded by the free association of the counties Dolj, Gorj, Mehedinti, Olt and Valcea, which formed, under the Law 151/1998, the SWO Region, an entity with no legal personality. The Regional Development Agency is a non-governmental, non-profit organisation, of public utility, regulated by Law 315/2004. Its mission is to facilitate and promote the development of SWO by jointly implement the development strategy with the Regional Development Council and the Regional Partners, as well as the national development policy, which requires decentralising policies and programmes at the level of the regional structures. Since their foundation in 1999, the RDAs have played the role of Implementing Authorities for the projects financed under PHARE Social and Economic Cohesion Programmes, with 538 projects funded and implemented, with total value of 96 MEuro. The RDA SWO currently plays the role of Intermediate Body for the Regional Operational Programme and for the Sectoral Operational Programme Economic Competitiveness Growth. Under ROP 2007-2013, 975 projects have been submitted, with a total value of 1.2 Billion Euro, from which 566 projects worth 773 MEuro were contracted. Under ROP 2014-2020, 441 projects have been contracted and funded, worth 611 MEuro. Under Sectoral Operational Programme Economic Competitiveness Growth, in the SWO region, 325 projects were funded and implemented, with a total value of 80.43 MEuro. In 2013, RDA SWO initiated the creation of two clusters of regional interest: ‘Construct Cluster Oltenia’ in the field of construction and ‘AGROPRO Oltenia Cluster’ in the field of agriculture. In 2015 it initiated the creation of health tourism cluster: San Tour Cluster. RDA SWO has also initiated the creation of two Competitiveness Poles: Automotive South-West Competitiveness Pole, thanks to FORD investment in Craiova city and the rising business opportunities in this particular field. The Pole is focused on RDI in manufacturing motor vehicles, trailers and semi-trailers. The cluster is a partnership between the RDA South-West Oltenia, the Faculty of Mechanics at the University of Craiova, the Municipality of Craiova and Ford Company. It currently consists of 36 members: cars and auto parts manufacturers, design firms, education units, R&D institutes, non-governmental organisations and public authorities; and Tourism Oltenia - Innovation and Tradition in tourism TurOlt InoTT Competitiveness Pole, due to the growing potential of the spa, wellness and health/medicine sectors in the region. In 2014, the Ministry of National Education elaborated the National Strategy for Smart Specialisation. The document supports the strategic role and the priority position of the research as a growth engine for the economic competitiveness. The ICT and eco-technologies were considered as two transversal fields of interest, their evolution being a condition for the proper functioning of the above mentioned fields. The Metropolitan Zone Craiova is also a local growth pole, which is financed through individual projects supported by all Operational Programmes (e.g. OP Regional Development, sectoral OP Increasing Economic Competitiveness, sectoral OP Human Resources, sectoral OP Transport, etc.), as well as by the National Programme for Rural Development, the European
159 | P a g e
Agricultural Fund for Rural Development, other public sources and banks, including the European Investment Bank. In 2009, the Metropolitan Zone Craiova was created as an association between the city of Craiova and other municipalities in Dolj. The main objectives of this association are:
• Becoming a national and cross border growth pole;
• Supporting the structuring process for economic change and sustainable development of the metropolitan area;
• Elaboration and implementation of strategies and integrated development programs for the metropolitan area;
• Initiation and promotion of projects aiming at reducing the discrepancies between its members;
• Improving the transport infrastructure and developing public services;
• R&D infrastructure and human resources development;
• Regenerating the functions and the activities that build the region’s image;
• Improving the quality of life and the environment;
• Attracting a large number of private investments for a sustainable development; and
• Accessing different national and international financing sources for which the public administration is eligible.
Innovation / Support Programmes for Transport SMEs Services & Products
1) ROP 2007-13 149
During 2007-13, ROP has financed areas as diverse as social infrastructure, health, education, transport, emergency equipment, focusing on the development of cities but also supporting business- environment through schemes dedicated to SMEs, business structures and the tourism sector, through the rehabilitation of historical monuments and heritage buildings. The allocated amount for SWO Region from ROP 2007-2013 was 604.97 MEuro (only ERDF). A number of 975 projects were submitted for funding in SW Oltenia Region under ROP 2007-2013, with a requested value of 1.20 Billion Euro. A total of 565 projects were contracted in all five counties of the region, amounting over 768.39 MEuro of grant. Among them, a number of 286 projects were contracted for SMEs support in the region, with total amount of 118.72 MEuro of grant (representing app. 15.5% of total amount for the whole region).
2) Sectoral OP ‘Increase of Economic Competitiveness’ 2007-13 150
SOP IEC has financed companies and SMEs, focusing on the supporting of business through schemes dedicated to SMEs. The allocated amount for SWO Region from ROP 2007-2013 was 604.97 MEuro (only ERDF). A number of 325 projects were funded in SW Oltenia Region under SOP IEC 2007-2013, in all five counties of the region, with total amount of 160.00 MEuro (of which 80.4 MEuro grant).
3) ROP 2014-2020 151
A number of 1200 of projects were submitted for funding in SW Oltenia Region under ROP 2014-2020 (updated in April 2019). A total of 441 projects were contracted in all five counties of the region, amounting over 612.00 MEuro of grant. Among them, a number of 297 projects
149 http://www.old.inforegio.ro/ro/regio-2007-2013/ 150 http://old.fonduri-ue.ro/poscce/ 151 http://www.inforegio.ro/
160 | P a g e
were contracted for SMEs support in the region, with total amount of 95.00 MEuro of grant (representing app. 16.5% of total amount for the whole region). (updated in April 2019).
4) Competitiveness OP 2014-2020 152
Priority Axis 1 - Research, Technological Development and Innovation to support Economic Competitiveness and Business Development Investment Priority 1.1 - Promoting investment in R&I, developing links and synergies between businesses, research and development centres and higher education, in particular promoting investment in product and service development, technology transfer, social innovation, eco-innovation and public service applications, boosting demand , networking and clustering and open innovation through smart specialisation, as well as support for technological and applied research activities, pilot lines, early product validation actions, advanced production capacities and first generation capabilities, particularly in the field of key enabling technologies and the diffusion of general use technologies
• Action 1.1.1 - Large R&D infrastructures
• Action 1.1.2 - Development of networks of R&D centres coordinated at national level and linked to European and international networking and providing researchers with access to scientific publications and European and international databases
• Action 1.1.3 - Creating synergies with RDI actions of the EU's HORIZON 2020 framework program and other international RDI programs
• Action 1.1.4 - Attract staff with advanced skills from abroad to strengthen CD capacity Investment Priority 1.2 - Improving research and innovation (R & I) infrastructures and capacities to develop excellence in C & I and the promotion of competence centres, especially those of European interest, by linking them to existing or emerging clustering structures that aim at innovation and economic development , in a way that meets the development needs of the communities in which they are developing
• Action 1.2.1 - Stimulate companies' innovation demand through RDI projects undertaken by businesses individually or in partnership with R & D institutes and universities for the purpose of product and process innovation in growth sectors with potential for growth
• Action 1.2.2 - Credit and risk capital measures in favour of innovative SMEs and research organizations responding to market demands
• Action 1.2.3 - Knowledge Transfer Partnerships Priority Axis 2 - Information and Communication Technology (ICT) for a competitive digital economy Investment Priority 2.1 - Broadband deployment and high-speed network deployment, as well as support for the adoption of emerging technologies and networks for the digital economy; digital inclusion, online culture and e-health
• Action 2.1.1 - Improving broadband infrastructure and Internet access
• Action 2.2. Develop ICT products and services, e-commerce and ICT demand;
• Action 2.2.1 - Supporting the growth of added value generated by the ICT sector and innovation in the field through the development of clusters
152 http://www.fonduri-ue.ro/poc-2014
161 | P a g e
• Action 2.2.2 - Supporting the use of ICT for business development, in particular the e-commerce framework
2.3. Strengthen ICT applications for eGovernment, eLearning
• Action 2.3.1 - Strengthen and ensure the interoperability of e-Government-centric e-government systems, type 2.0, centred on events in citizens and businesses, developing cloud computing and social media communication, Open Data and Big Data
• Action 2.3.2 - Ensuring cyber security of OS systems 2.4 ICT and IT networks
• Action 2.3.3 - Improving digital content and systemic ICT infrastructure in e-education, e-inclusion, e-health and e-culture
5) Large Infrastructure Operational Programme 153
6) Start-up Nation Funding Programme 154
ROP 2014-2020 Priority Axis 1 - Promoting Technological Transfer Investment Priority 1.1 Promoting investment in RDI, developing links and synergies between businesses, research and development centres and higher education, in particular promoting investment in product and service development, technology transfer, social innovation, eco-innovation and public service applications, boosting demand, networking and clustering and open innovation through smart specialisation, as well as support for technological and applied research activities, pilot lines, early product validation actions, advanced production capacities and first generation, especially in the field of generic technologies and the diffusion of general use technologies. IP 1.1 Operation A - Support for Technological Transfer and Innovation Entities (TTI) 2014-2020 Regional Operational Program PI 1.1 Operation B - Support for Science and Technology Parks (S&T P) IP 1.1 Operation C - Investments for SMEs to implement a research-innovation outcome in partnership with ITT IP 1.1 Specific Objective 1.2 - Increasing innovation in companies by supporting the multi-sector approaches resulting from the implementation of the less developed regions initiative in Romania Priority Axis 2 - Improving the competitiveness of SMEs Investment Priority 2.1A - Promoting entrepreneurship, in particular by facilitating the economic exploitation of new ideas and by encouraging the creation of new businesses, including business incubators Investment Priority 2.1.B - Business incubators. Investments funded by regional State aid:
153 http://www.fonduri-ue.ro/poim-2014 154 https://startupnation2018.aippimm.ro/
162 | P a g e
• Creating sectoral business incubators, by building the related spaces, and endowment with tangible and intangible assets.
• Investments funded by de Minimis aid: Development of services provided within business incubators
Investment Priority 2.2 - Supporting the setting-up and expansion of advanced production capacities and service development Priority Axis 3 - Supporting the transition to a low-carbon economy Competitiveness OP 2014-20 Priority Axis 1 - Research, Technological Development and Innovation to support Economic Competitiveness and Business Development Investment Priority 1.1 - Promoting investment in R & I, developing links and synergies between businesses, research and development centres and higher education, in particular promoting investment in product and service development, technology transfer, social innovation, eco-innovation and public service applications, boosting demand , networking and clustering and open innovation through smart specialisation, as well as support for technological and applied research activities, pilot lines, early product validation actions, advanced production capacities and first generation capabilities, particularly in the field of key enabling technologies and the diffusion of general use technologies
• Action 1.1.1 - Large R & D infrastructures
• Action 1.1.2 - Development of networks of CD centres coordinated at national level and linked to European and international networking and providing researchers with access to scientific publications and European and international databases
• Action 1.1.3 - Creating synergies with RDI actions of the EU's HORIZON 2020 framework program and other international RDI programs
• Action 1.1.4 - Attract staff with advanced skills from abroad to strengthen CD capacity Investment Priority 1.2. Improving research and innovation (R & I) infrastructures and capacities to develop excellence in R & I and the promotion of competence centres, especially those of European interest, by linking them to existing or emerging clustering structures that aim at innovation and economic development, in a way that meets the development needs of the communities in which they are developing
• Action 1.2.1 - Stimulate companies' innovation demand through RDI projects undertaken by businesses individually or in partnership with R & D institutes and universities for the purpose of product and process innovation in growth sectors with potential for growth
• Action 1.2.2 - Credit and risk capital measures in favour of innovative SMEs and research organisations responding to market demands
• Action 1.2.3 - Knowledge Transfer Partnerships Priority Axis 2 - Information and Communication Technology (ICT) for a competitive digital economy Investment Priority 2.1. - Broadband deployment and high-speed network deployment, as well as support for the adoption of emerging technologies and networks for the digital economy; digital inclusion, online culture and e-health
163 | P a g e
• Action 2.1.1 Improving broadband infrastructure and Internet access
• Develop ICT products and services, e-commerce and ICT demand;
• Action 2.2.1 Supporting the growth of added value generated by the ICT sector and innovation in the field through the development of clusters
• Action 2.2.2 Supporting the use of ICT for business development, in particular the e-commerce framework
2.3. Strengthen ICT applications for eGovernment, eLearning
• Action 2.3.1 Strengthen and ensure the interoperability of e-Government-centric e-government systems, type 2.0, centred on events in citizens and businesses, developing cloud computing and social media communication, Open Data and Big Data
• Action 2.3.2 Ensuring cyber security of OS systems 2.4 ICT and IT networks
• Action 2.3.3 Improving digital content and systemic ICT infrastructure in e-education, e-inclusion, e-health and e-culture
Transport Technology Support programmes to the benefit of SMEs in SWO
1) Classic Recycle Car Programme 2016-20 155
Incentives This program has an eco-voucher of 1450 Euro for used car buy back, with the possibility of additional access to two eco-bonuses for the following situations:
a. an eco-bonus of EUR 164 which can be added to the main eco voucher; b. or an eco-bonus of 330 Euros for a new hybrid vehicle option
If the new car meets both criteria, the funding is 1900 Euro, supported by Eco Funding in the cost of the new car.
In Rabla Plus, a non-polluting car benefited from two types of eco-tickets from the Eco Fund:
a. eco-ticket of 1100 Euro for the purchase of a new hybrid electric car; b. eco-ticket of 4400 Euro for new 100% electric cars.
PROGRAM TYPE AND GEOGRAPHICAL APPLICATION AREA
1. The program is multiannual and applies at national level. 2. The program runs over 2017-2019 period.
MAXIMUM AMOUNT FOR THE PROJECT: The amount of the eco voucher is 1450 Euros. The scrapping premium is granted according to the amount of CO2 / km emissions generated by the new propulsion system of the new vehicle in mixed mode as follows:
a. in 2017 it is granted for a new vehicle whose emission is less than 130 g CO2 / km; b. in 2018 it is granted for a new vehicle whose emission is less than 130 g CO2 / km; c. in 2019 it is granted for a new car whose emission is less than 120 g CO2 / km.
At the recycle car premium, an Eco bonus may be added under the following conditions:
155 https://www.afm.ro/programe_finantate.php
164 | P a g e
a. When purchasing a new motor vehicle equipped with a propulsion system that emits up to 98 g CO2 / km in mixed mode, an Eco bonus of 220 Euros;
b. When purchasing a new motor vehicle equipped with a propulsion system that emits a maximum of 98 g CO2 / km in mixed mode, an Eco bonus of 220 Euro;
c. When purchasing a new motor vehicle equipped with a propulsion system that emits up to 96 g CO2 / km in mixed mode, an Eco bonus of 220 Euro will be granted for 2019;
d. When purchasing a new vehicle equipped with a hybrid propulsion system, an Eco bonus of 370 Euro is granted.
In 2016 for the Classic Recycle Program, the recycle voucher was 1450 Euro, with the chance to add another two eco-bonuses for the following situations:
• an eco-bonus of 170 Euro to buy a car with CO2 emissions of less than 100 g / km;
• an eco-bonus of 330 Euro for the situation where the population opts for a new hybrid vehicle.
If the new car complied with both criteria, a citizen could benefit from both eco-bonuses and could receive, with the scrapping premium, a grant of 1950 Euro, supported by the Eco Fund in the cost of the new car. In Recycle Car Plus, those who buy a non-polluting car benefited from two types of eco-tickets from the Eco Fund:
• an eco-ticket of 1100 Euro for the purchase of a new electric-hybrid car;
• or an eco-ticket of 4400 Euro for new 100% electric cars. Unpolluted public transport – funded by Ministry of Environment Guidelines for improving air quality and reducing greenhouse gas emissions by using less polluting vehicles in local public transport Green power supply grids Reducing greenhouse gas emissions in transport by promoting infrastructure for energy-efficient road transport vehicles: recharging stations for electric and electric hybrid vehicles plug-in CHARGING STATIONS FOR ELECTRICAL VEHICLES.
During the session opened between September 15 and November 15, 2016, funding was requested for the installation of approximately 260 stations, 9 applicants were public and territorial units, and 39 legal private entities, the total amount requested being 3,400,000 Euro. BENEFICIARIES:
• Administrative-territorial units, with population more than 50,000 inhabitants;
• Public institutions with headquarters or functional structures within administrative-territorial units;
• Business companies working within administrative-territorial units referred to in a) as well as economic operators having their registered office or work points with direct access to motorways, European roads and national roads.
ELIGIBLE CHARGES:
• Purchase of recharging stations for electric and electric hybrid plug-in vehicles;
• Charges for the assembly of recharging stations;
• Expenditure incurred for building and installing the information panel;
• Value added tax for the project for local public authorities and public institutions
MAXIMUM AMOUNT PER PROJECT:
165 | P a g e
Funding is granted in a session up to 200,000 Euro per applicant, representing up to 80% of the eligible expenses. The maximum amount funded by the Authority will be:
• 2500 Euro for a normal power recharge station;
• 35,000 Euro for a high-power DC power recharging station;
• 3000 Euro for a high AC power recharging station.
2) Ministry of Transportation 156 2019 Fluidization of Transfrontier Communication Crossing Point Specific Transmission Capacity 2.6 (OS) ‘Reducing Time to Stay at Transnational Communication Points’, Investment Priority 7c Developing and enhancing environment-friendly transport systems including noise reduced and low carbon emissions, including inland waterways and maritime transport systems, ports, multimodal connections and airport infrastructures, in order to promote sustainable mobility at regional and local level under Priority Axis 2 AP) ‘’Developing a multimodal, quality, sustainable and efficient transport system’. Enhance Safety and Enhancement of Environmental Conditions for All Specific Transport 2.5 (OS) Transport Modes ‘Increasing Safety and Security in All Transport Modes and Reducing Environmental Impact’, Investment Priority 7c - Developing and enhancing environment-friendly transport systems, including low noise and low carbon, including inland waterways and maritime transport systems, ports, multimodal connections and airport infrastructures, in order to promote sustainable mobility at regional and local level under Priority Axis 2 (AP) ‘Developing a multimodal, quality, sustainable and efficient transport system’. Increasing Safety and Enhancing Environmental Conditions in All Transport Modes Development of Subway Infrastructure for Specific Objective 1.4 (OS) ‘Increasing the Use of Subway Transport in Bucharest-Ilfov’, Investment Priority 7ii Development and improvement of environment-friendly transport systems, including low-noise and which have low carbon emissions, including inland waterways and maritime transport systems, ports, multimodal connections and airport infrastructures, in order to promote sustainable mobility at regional and local level under Priority Axis 1 (PA) ‘Improving mobility through the development of the TEN-T network and metro transport’. Developing the Mobility on Central TEN-T Railway Network Investment Priority 7i Supporting a Single European Transport Area of Multimodal Transport by Investing in TEN-T under Priority Axis 1 ( AP) ‘Improving mobility through the development of the TEN-T network and metro transport’ and Specific Objective 2.7 (OS) Increasing the sustainability and quality of rail transport ‘Increasing the accessibility of TEN-T low-traffic area connectivity’, Investment Priority 7d Rehabilitation of Full High Quality Railway Interoperability and Promoting Noise Reduction Measures under Priority Axis 2 (AP) ‘Developing a Multimodal, Quality, Sustainable and Efficient Transport System’. Development of Railway Infrastructure The Road Infrastructure Development – ‘Increasing Mobility on the Central TEN-T Road Network’, Investment Priority 7i ‘Supporting a Single European Multimodal Transport Area by Investing in TEN-T’ Priority Axis 1 (AP) ‘Improving Mobility through the Development of the TEN-T Network and Subway Transport’ and Objective 2.1 (OS) ‘Increasing Mobility on the
156 http://www.mt.gov.ro/web14/strategia-in-transporturi/transporturi-finantari
166 | P a g e
TEN-T Road Network’, Specific Objective 2.2 Reduced connectivity to TEN-T road infrastructure, Investment Priority 7a ‘Supporting a Single European Transport Area of Multimodal Transport by Investing in TEN-T’, Investment Priority ‘7b Stimulating Regional Mobility by Connecting Secondary and Tertiary Nodes to Infrastructure TEN-T, including multimodal nodes’ in the framework of Priority Axis 2 (A.P.) ‘Development of a multimodal, quality, sustainable and efficient transport system’. 2018 Increasing the volume of goods transit through intermodal terminals and ports - Projects to support the beneficiaries in preparing the investment project portfolios on and off the TEN-T network for 2014-20 and post-2020
• SO 2.4 call - Increasing the volume of goods transiting through intermodal terminals and ports - New investment projects in maritime and river ports located on and off the TEN-T network
• SO 2.4 call - Increasing the volume of goods transited through intermodal terminals and ports - New investment projects for the modernisation / development of intermodal terminals;
• SO 2.4 call - Increasing the volume of goods transited through intermodal terminals and ports - Projects to support the beneficiaries in preparing the portfolio of investment projects for the development of intermodal and multimodal terminals in the Priority Locations under the 2014-2020 Master Plan of Transport, post 2020;
• SO 1.3 call - Increasing the use of waterways and ports on the central TEN-T network - New projects to improve navigation conditions on the Danube and on the Danube's waterways as well as within ports, including the purchase of equipment and multifunctional vessels to ensure airworthiness on the Danube and Projects to modernize and develop the capacity of ports located on the central TEN-T network;
• SO 1.3 call - Increasing the use of waterways and ports on the central TEN-T network - Phase investment projects to improve navigation on the Danube and waterways;
• SO 1.3 call. Increasing the use of waterways and ports on the central TEN-T network - Technical assistance projects in the preparation of the investment portfolio for the development of waterways and TEN-T CORE ports for the 2014-2020 period and post 2020
• SO 2.3 call - Increasing the sustainable use of airports - Support for the preparation of the portfolio of investment projects in airport infrastructure that target non-economic activities in the field of safety and security;
• SO 2.3 call - Increasing the sustainable use of airports - New investment projects in airport infrastructure targeting non-economic activities in the field of safety and security;
• SO 2.3 call - Increasing Sustainable Use of Airports - New Investment Projects in Airport Infrastructure;
• SO 2.3 - Increasing Sustainable Use of Airports under Priority Axis 2 Developing a Multimodal, Quality, Sustainable and Efficient Transport System;
Crossborder Flow Linking Fluctuation of the Specific Objective 2.6 (OS) Reduction of station time at transnational communication points
167 | P a g e
Reduction of stationary points transnational communication, investment priorities 7c development and improvement of environmentally friendly transport, including low noise and low carbon, including inland waterways and maritime transport systems, ports, multimodal connections and airport infrastructures, in order to promote sustainable mobility at regional and local level under Priority Axis 2 ) Developing a multimodal, quality, sustainable and efficient transport system Infrastructure Development of Underground transport. Developing rail infrastructure related Specific Objective 1.2 (OS) Increased mobility rail network TEN-T core and specific Objective 2.7 (O.s.) Increasing the sustainability and quality of rail. Road Infrastructure Development Specific Objective 1.1 (O.s.) Increased mobility road network TEN-T core Objective 2.1 (O.s.) Increased mobility TEN-T road network.
• S.O. 2.2 - Increasing the accessibility of low-impact areas to TEN-T road infrastructure;
• Specific conditions for accessing funds ‘Development of Airport Infrastructure’
• S.O. 2.5 - Increasing safety and security in all modes of transport and reducing the impact of transport on the environment;
• Enhancing Safety and Enhancing Environmental Conditions for All Transports In relation to European Funds support programmes, Craiova is the 4th city in the Top of Urbanize Hub in Romania157, with a good absorption of European funds. It is also the 12th city in terms of a magnetism index in Romania, according to the World Bank. According to the same source, Craiova is the 4th largest city in Romania in terms of growth in GDP per capita between 2000 and 2013.
157 https://urbanizehub.ro/
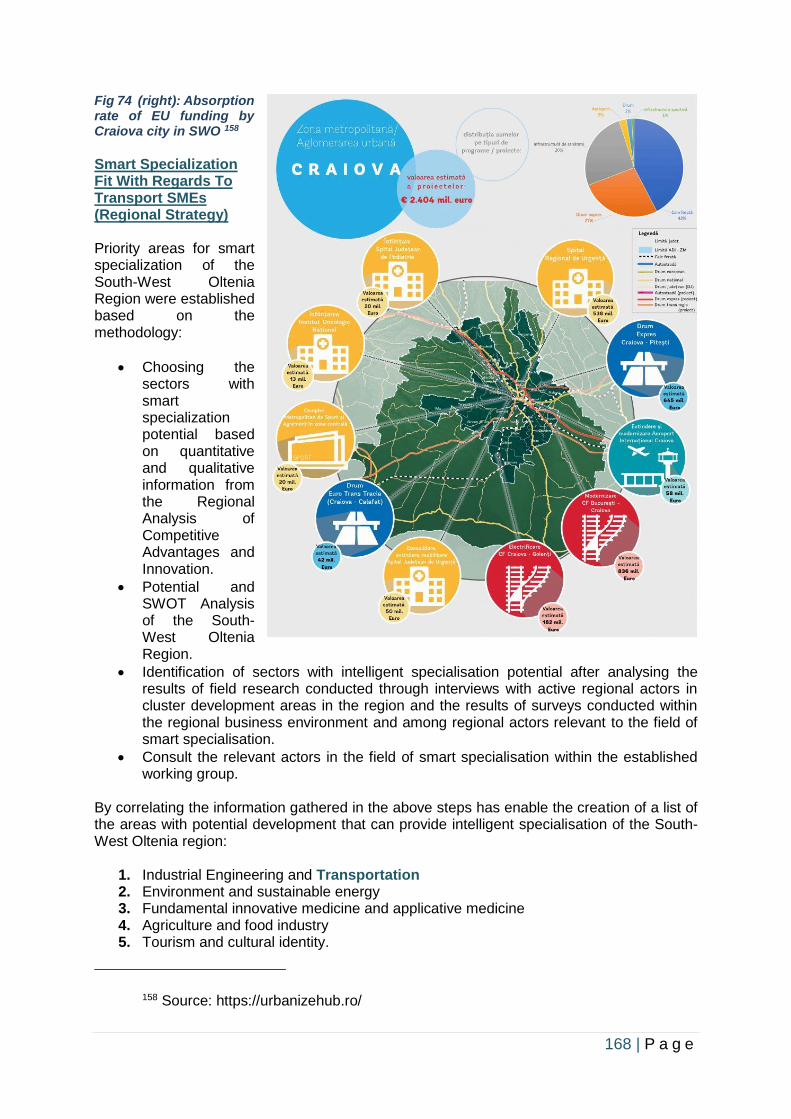
168 | P a g e
Fig 74 (right): Absorption rate of EU funding by Craiova city in SWO 158
Smart Specialization Fit With Regards To Transport SMEs (Regional Strategy) Priority areas for smart specialization of the South-West Oltenia Region were established based on the methodology:
• Choosing the sectors with smart specialization potential based on quantitative and qualitative information from the Regional Analysis of Competitive Advantages and Innovation.
• Potential and SWOT Analysis of the South-West Oltenia Region.
• Identification of sectors with intelligent specialisation potential after analysing the results of field research conducted through interviews with active regional actors in cluster development areas in the region and the results of surveys conducted within the regional business environment and among regional actors relevant to the field of smart specialisation.
• Consult the relevant actors in the field of smart specialisation within the established working group.
By correlating the information gathered in the above steps has enable the creation of a list of the areas with potential development that can provide intelligent specialisation of the South-West Oltenia region:
1. Industrial Engineering and Transportation 2. Environment and sustainable energy 3. Fundamental innovative medicine and applicative medicine 4. Agriculture and food industry 5. Tourism and cultural identity.
158 Source: https://urbanizehub.ro/
169 | P a g e
3.4 Challenges for Transport SMEs to Develop & Commercialise Their Products
West Midlands
United Kingdom
Future Mobility Challenges
The WM as the centre of transport innovation in the UK, are leading the smart, low-carbon movement of people and goods and connecting communities to new opportunities. The next decade will be a period of large-scale change to how people and goods move, with significant innovation in mobility and continued changes to consumer preferences and global markets.
This includes not only the shift to electric and connected autonomous vehicles but also rapid technological change such as 5G, with the WM already the home to the UK’s first 5G test-beds. Adapting to these challenges will create huge economic opportunities nationally and for the WM, driving benefits across the Midlands Engine.
The WM will maximise these opportunities by combining advances in data science, artificial intelligence and sensing technology while completing large-scale infrastructure projects such as High Speed 2 and improving the transport network. This involves a range of initiatives, including maximising the impact of the £322 million secured for the WM through the Industrial Strategy’s Transforming Cities Fund.
The scale of the challenge requires local and national collaboration. The government and the WM are working together to meet the ambitions of the Future of Mobility Grand Challenge. Building on significant investment, the WM, working in partnership with the government, commits to the next phase of plans to realise shared goals:
• Working with local partners to maximise the region’s contribution to achieving government’s ambition to deploy three world-leading trials of connected autonomous vehicles by 2021, with the WM aiming to deploy the first fully operational connected autonomous vehicles in the region before the 2022 Commonwealth Games;
• Building the optimum environment for additional foreign direct investment and electric vehicle manufacturing. This will include completing the development of the UK Battery Industrialisation Centre and maximising the impact of funding from the Faraday Battery Challenge;
• Building on its existing partnership that has supported the development of the WM High Speed 2 Growth Strategy, the government will work in partnership with the WM to maximise the benefits that High Speed 2 will bring to the region.159
SMMT are inviting start-ups, scale-ups and SMEs to pitch innovative ideas and solutions to address eight key mobility challenges of the future. Those with the best solutions will be
159 https://www.gov.uk/government/publications/west-midlands-local-industrial-strategy/west-midlands-local-industrial-strategy
170 | P a g e
shortlisted and invited to meet with, and pitch live, to the five major brands at a one-day event in London on 17 October 2019.
Successful start-ups, scale-ups and SMEs will be able to seriously negotiate a range of bespoke partnership opportunities, ranging from access to world-class mentoring, incubation facilities and live pilot sandboxes, to unparalleled routes to market and investment.160
Gaps in R&D Profile
• The WM has a strong and extensive research base in its universities, private institutions, commercial R&D and engineering facilities.
• The Gross Expenditure on Research and Development (GERD) as a share of GDP in 2014 was 1.96%, which was above the UK average of 1.67% (Eurostat, 2018).
• It’s Gross Expenditure on Research and Development (GERD) amounted to €3,640m and represented 8.35% of the total national GERD. However, remarkable differences exist between private and public contribution to these figures.
• Evidence suggests that the WM also has one of the lowest proportions of ‘innovation active’ firms in England, although it performs much better on measured innovation outputs such as introduction of new products and processes.
• The region also has slightly fewer people employed in science and technology jobs than the UK average.
• In 2017, there were 85,900 employed people in high-tech sectors, representing 3.2% of the total employed people, very far from the UK average (4.9%)
• The region is home to 10 universities including two research intensive institutions with strengths in science and technology fields: the Universities of Warwick and Birmingham, which were ranked 10 and 19 respectively in the UK in the 2016-2017 Times Higher Education World university rankings (82 and 130 respectively in the worldwide rankings). These universities are the focus of significant regional funds for the development of research infrastructure under the ‘Birmingham Science City’ initiative. According to the 2014 Research Excellence Framework (REF), Birmingham University and Warwick University ranked in the top 5 nationally by research power and/or relative quality of research conducted across our Higher Education Institutions in a number of Units of Assessments, such as Aeronautical, Mechanical, Chemical & Manufacturing Engineering, Agriculture, Veterinary and Food Science, Computer Science and Informatics and Mathematical Sciences. In 2017, tertiary education attainment in the WM in the population aged 30-34 is 39.8%, below the national average of 48.3%, in line with the EU28 average of 39.1%.
• The region is also home to ten science/innovation parks (e.g. Innovation Birmingham Campus focused on the digital and technology sectors, Birmingham Research Park on biomedical, and Stoneleigh Park on science-based rural industries) along with 14 incubators providing flexible property and value-added business support services to new start-up firms, often operating as part of the science parks.161
Gaps in Commercial Innovation Activity
WM commercial innovation activity and investment is moderate by UK standards and lower than international competitors.
1. Levels of new-to-the-firm innovation activity 2. Levels new-to-the-market innovation activity
160 https://www.smmt.co.uk/events/future-mobility-challenge/ 161 https://ec.europa.eu/growth/tools-databases/regional-innovation-monitor/base-profile/west-midlands
171 | P a g e
3. Levels of investment in R&D and design 4. Collaboration via B2B and U2B (university to business)
Innovation gaps are generally larger for Greater Birmingham and Solihull LEP and the Black Country LEP than for Coventry and Warwickshire.
Socio-political Challenges (Global & Domestic)
The WM has long been renowned as a centre for industry and manufacturing. Despite the challenges of globalisation, manufacturing remains the largest industry in the region, with strengths in basic metals, metal products and transport equipment. External challenges around Brexit and the global economy mean the WM must be clear about their offer and what makes this a great place to invest. It will help respond to changing conditions for trade, investment, regulation and funding.
The benefits of growth are not felt by all, in terms of access to jobs and opportunities, stubbornly poor indicators on e.g. healthy life expectancy, obesity and housing affordability. We have low levels of access to green space, local hotspots of poor air quality, 12% of our households in fuel poverty, and still high levels of carbon emissions.162
Stagnant Growth for SMEs
The majority of UK SMEs predict no change in growth over the next few months with some
forecasting modest growth, showing an overall upturn in growth predictions according to
research from Hitachi Capital Business Finance (HCBF).
In contrast, the only sector with more SME owners predicting contraction over growth was the
transport and distribution sector, falling from 38% to 27% over the last six months. The
research concludes whilst transport, building and manufacturing businesses have been faced
by tangible challenges from Brexit, small businesses that provide professional and consulting
services are prospering.163
Supply Chain Changes
More changes are going to happen in supply chain management. Some of them reflect external
factors. Some reflect changes that are needed to make supply chains more effective. Some
important ones include:
Green Logistics
Modes of transport used, order and shipment sizes, location of warehouses and more of what
are now accepted supply chain practices may be challenged as companies deal with ‘green’,
it is about more than just reducing packaging or your carbon footprint.
It involves making environmentally-wise choices in supply chain design and execution,
including managing the reverse supply chain to efficiently manage and remove waste. The key
162 https://www.blackcountrylep.co.uk 163 https://www.assetfinanceinternational.com/index.php/equipment-finance/news-emea/emea-articles/18535-sme-growth-predictions-on-the-rise-showing-resilience-in-the-face-of-brexit
172 | P a g e
objective of a business is to grow shareholder value, so it would be a brave organization that
decided to do everything it could to be green irrespective of costs.
However, as fuel costs rise, economic and environmental concerns will converge even more -
good, old-fashioned operations management thinking is directly applicable to carbon
management. As the cost base changes, projects which would have been unviable in
commercial terms in the past will become justifiable.
The most effective way of approaching carbon management is to apply business principles to
the environment, not environmental principles to business. This may be slow to gain significant
momentum. Consumers have not demonstrated a strong commitment to pay for green.
Also, making and sustaining business changes is a high bar to cross presently. Environmental
problems lie outside of their general business, especially outside of their core competencies.
Yet some large companies have begun to assess how green their supply chains are. As the
implement changes, they will also drive improvements on their suppliers and service providers.
This rippling will continue as suppliers make changes to comply with customers and push their
suppliers change.
SME Challenge
SMEs are reaching a critical path in their businesses. Leading supply chain practices and
processes commonly reside with large retailers and manufacturers. They have and driven
various economies of scale. They utilise technologies and have larger staffs of people active
in supply chain management.
SMEs are not fighting large competitors on a level playing field. They cannot leverage their
volumes into as low of prices. They do not get the same performance from suppliers; as a
result. SMEs then have customer service problems because needed products are not available
to sale, and they tie up more capital in inventory with fewer turns, all of which have an impact
on profits and the ability to grow.
These businesses must change. Supply chain management is a key way to drive that change.
SMEs have an advantage over their larger competitors. Their smaller size gives them less
bureaucracy to change and greater agility to respond.
The question of SMEs will be how to assess, design and implement new supply chain
processes. They will look to outside firms to help them. These firms will be supply chain service
providers, as compared to logistics service providers that are basically transport or warehouse
firms that are not focused on supply chain management as their driver. The logistics firms,
including third party logistics (3PL), as core commodity service providers, do not see supply
chains. This is a significant problem and issue for SMEs.
To address the issue, a new paradigm will develop to meet this market need and opportunity.
The paradigm will be independent supply chain service providers and will work with SMEs on
supply chain needs, not on freight.
173 | P a g e
The new supply chain providers will not come from existing, large 3PL or transport, forwarding
or warehousing service firms. They will develop from new venues. That is what usually
happens with market needs. Existing players focus on their needs and not on customer needs.
As a result, new players enter the void.
Supplier Performance & Demand Planning
Supplier performance is the foundation of a solid supply chain. Poor and erratic supplier
performance cascades through the supply chains of customers. In the end, it is a source of
great waste and inefficiency. Part of the dilemma though rests with their customers, the
retailers, wholesalers and manufacturers.
The long lead time with offshore sourcing, comprised much of transit times between and
among the various involved parties, creates additional forecasting uncertainties. To mitigate
some of the additional time and its resultant uncertainty, companies will streamline processes
to remove gaps and redundancies. Then they will add technology to increase visibility to
purchase orders and to product moves, including those from their suppliers to their suppliers'
suppliers.
Other
There are other changes, many external. The continued pressures on failing or insufficient
infrastructures, in the US, China, India and elsewhere will continue to cause problems,
disruptions and risks to supply chains as companies deal with either compensating for
inadequacies or with building new facilities.
Supply chain security and its impact of supply chain velocity will continue. The potential for
mergers in ocean shipping and in freight forwarding and 3PL markets continues. Mergers could
accelerate during a business slowdown as firms use acquisitions to bolster volumes and
revenues. Companies will increase the frequency of sourcing changes, to more dependable
suppliers and to lower cost sourcing countries to help improve pricing and their businesses.
Supply chains will have to be agile and dynamic to adjust with these changes. 164
Addressing Challenges through Regional Economic Strengths
The industrialised area known as the Black Country, which commonly refers to the four Metropolitan Boroughs of Dudley, Sandwell, Walsall and Wolverhampton, particularly focusses on advanced manufacturing and engineering, aerospace, automotive, and low carbon industry. The region is home to well-known manufacturers including Jaguar Land Rover, Aston Martin, and JCB, which support a wider supply chain of smaller firms.
The region also boasts excellent connectivity, being well-served by major road and rail networks, which helps to support its entrepreneurialism. The service sector also plays a large role in the region's economy, employing almost half of the working population.
Birmingham is a regional financial centre which has been tipped to become more important nationally. However, the number of financial and insurance businesses in the region has fallen by 1% since 2010 – this is a disappointing figure, compared to the 14% rise throughout the UK
164 https://www.ltdmgmt.com/green_logistics.php
174 | P a g e
as a whole. Several financial big hitters have already set up shop in the city, including Deutsche Bank, Deloitte and Ernst and Young, which may have put off smaller set-ups and start-ups. Construction businesses have also seen slower growth than the rest of the country, having only risen by 8%, compared to 16% overall.
More generally, the number of businesses in the WM grew by 19% from 2010 to 2017, though this is slightly behind the UK average of 22%. Conversely, the transportation and storage industry saw a particularly significant increase during this period, with the number of businesses up by 95%, against a UK average of 51%.
Continuing with the transportation and storage sector, two of the major cities in the region, Birmingham and Coventry, along with the borough of Sandwell, have seen rises of 137%, 168% and 129% respectively. This includes postal and courier services, land, air and water transport companies, plus warehousing solutions.
In 2017, high street retailer Argos opened a new warehouse in north Birmingham, and in 2018 international retailer Amazon will open a new fulfilment centre in Rugby, following in the footsteps of warehouses launched in Coalville, Daventry and Rugeley.
Coventry has also seen an 85% increase in the number of professional, scientific and technical businesses, such as legal, architectural and consultancy firms. Also positively, the number of agricultural companies has grown by 12% in WM, compared to 9% in the rest of the UK.
WM firms are successful exporters, posting the fastest export growth of any UK region. It's also the only region exporting the majority of its products and services to China. There are a number of planned infrastructure projects that look set to deliver a significant boost to the region’s prosperity.
The Midlands Engine, which was launched in 2016, is a multi-million-pound initiative to boost productivity in the region. This will include investment in transport designed to tackle congestion, a new university to create a pipeline of skilled graduate engineers and £250 million of growth funding for small businesses.
The HS2 rail link is also hailed as having the potential to boost Birmingham’s economy by £1.4 billion through reduced journey times between the Midlands, London and the north.165
Findings from Interviews & Questionnaires
Challenges for SMEs: Apart from money, skills shortage for people with technical knowledge,
skills shortage in low carbon technologies especially and lack of knowledge / uptake in
hydrogen fuel cell technology.
University degrees in the region are popular – students study here e.g. Environment,
Engineering or Energy course, then if there are no jobs locally they go abroad to Europe or
International. Coventry University seems to have a wider pool of international students than
the University of Warwick.
Knowledge gap in the industry and amongst students / general public – need to create a public
demonstration to showcase newer innovations, how to get to a low carbon future fast.
University of Warwick held a Green Summit where the huge knowledge gap was addressed.
Barriers to partnering for SMEs include time constraints in making applications and awaiting a
decision. A big barrier is all the form filling just to find out if they are viable or eligible for a
particular programme.
165 https://www.swinton.co.uk/business/business-trends/west-midlands/
175 | P a g e
Consortium working can be a hindrance – finding partners. Collaboration good in theory, could
be language barriers. Other transport modes that the government invests in always proves to
be too late, strategizing period and then the implementation is too late or haphazard, moreover
the uncertainty and delays around HS2 are ongoing.
However, there are support services that can help SMEs bring their innovations to market if
they know where to look. For example, CWLEP have helped services come to market, example
a company called Enable ID – ‘mi journey’ app offering real-time information for various modes
of transport. Innovation programme gives them non-financial support and a grant to help
launch to the market. Another example is a company developing a prototype for an electric
motorbike through innovation. The Green Business programme funds energy grants and is
delivered through CCC and CUE Ltd. From idea generalisation to commercialisation, the
Innovation Programme (CWLEP) supports companies at varying stages, some are very early
concept, help them to prototype through to launching. The LEP also support a number of
companies through Innovate UK and the universities through venture capital, partnerships,
signposting to other services through the Growth Hub.
Gaps in networks: MTC engage with CWLEP at a strategic level, some interaction with
Midlands Connect. DIT – more focused on new exporters rather than SMEs who are already
doing this. Missing out on opportunities, need to invest more to support, with the onset of Brexit
– companies need help financially and non-financially. Feedback from companies – uncertain
where is the information about accessing the markets. Particularly affect transport mobility
companies as much of the supply chain is international. Midlands Engine more active in the
East Midlands – e.g. aerospace aviation clusters. Emerging and unknown barriers, uncertain
times for transport industry.
In regards to accessing new markets, there are support services that can help SMEs.
International trade advisors go and see companies looking to trade internationally. If they are
exporting already then how to access new markets or operate under different rules such as
World Trade Organisation (WTO) or post Brexit scenarios. Assessing how many orders the
company secures (metrics). Another set of advisors also from the Department of International
Trade help companies regulate the logistics of moving their goods and services, from border
control and documentation.
The Chambers of Commerce offer generic business support programmes via local authority
contracts. Not targeted at transport sector but can include transport business that fall within
SME definition and are seeking generic business support. Training can relate to shipping
courses such as INCOTERMS.
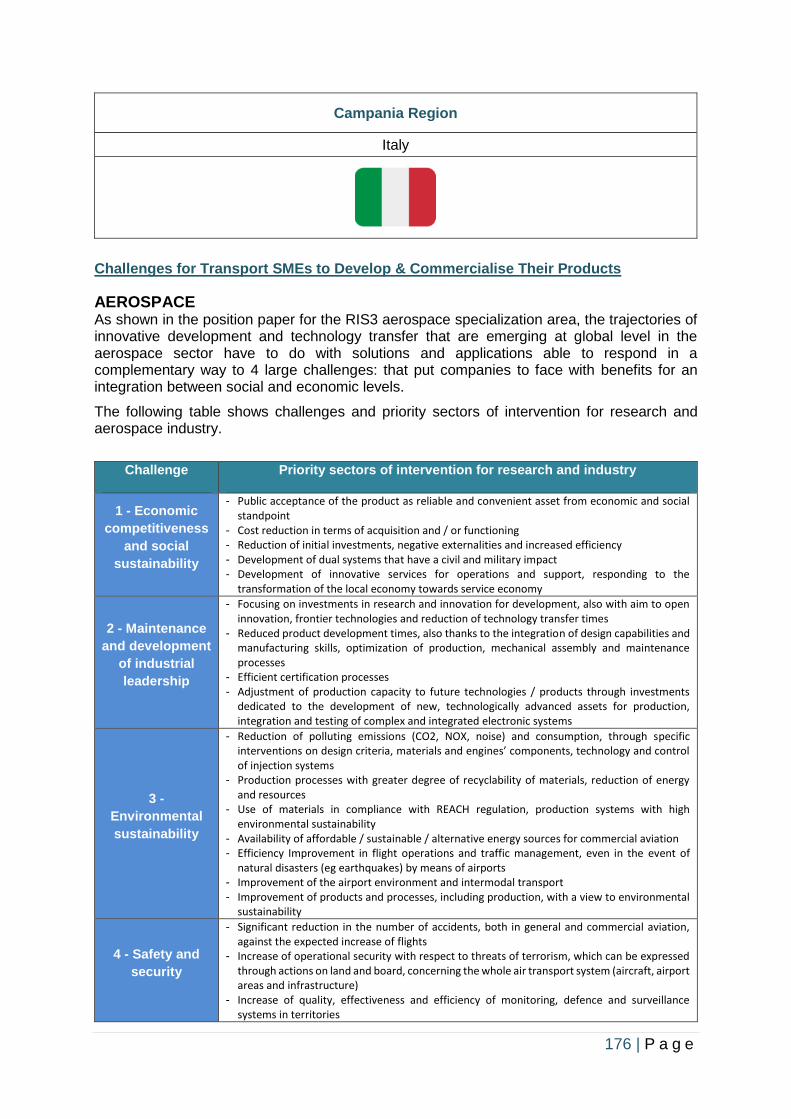
176 | P a g e
Campania Region
Italy
Challenges for Transport SMEs to Develop & Commercialise Their Products
AEROSPACE As shown in the position paper for the RIS3 aerospace specialization area, the trajectories of innovative development and technology transfer that are emerging at global level in the aerospace sector have to do with solutions and applications able to respond in a complementary way to 4 large challenges: that put companies to face with benefits for an integration between social and economic levels.
The following table shows challenges and priority sectors of intervention for research and aerospace industry.
Challenge Priority sectors of intervention for research and industry
1 - Economic
competitiveness
and social
sustainability
- Public acceptance of the product as reliable and convenient asset from economic and social standpoint
- Cost reduction in terms of acquisition and / or functioning - Reduction of initial investments, negative externalities and increased efficiency - Development of dual systems that have a civil and military impact - Development of innovative services for operations and support, responding to the
transformation of the local economy towards service economy
2 - Maintenance
and development
of industrial
leadership
- Focusing on investments in research and innovation for development, also with aim to open innovation, frontier technologies and reduction of technology transfer times
- Reduced product development times, also thanks to the integration of design capabilities and manufacturing skills, optimization of production, mechanical assembly and maintenance processes
- Efficient certification processes - Adjustment of production capacity to future technologies / products through investments
dedicated to the development of new, technologically advanced assets for production, integration and testing of complex and integrated electronic systems
3 -
Environmental
sustainability
- Reduction of polluting emissions (CO2, NOX, noise) and consumption, through specific interventions on design criteria, materials and engines’ components, technology and control of injection systems
- Production processes with greater degree of recyclability of materials, reduction of energy and resources
- Use of materials in compliance with REACH regulation, production systems with high environmental sustainability
- Availability of affordable / sustainable / alternative energy sources for commercial aviation - Efficiency Improvement in flight operations and traffic management, even in the event of
natural disasters (eg earthquakes) by means of airports - Improvement of the airport environment and intermodal transport - Improvement of products and processes, including production, with a view to environmental
sustainability
4 - Safety and
security
- Significant reduction in the number of accidents, both in general and commercial aviation, against the expected increase of flights
- Increase of operational security with respect to threats of terrorism, which can be expressed through actions on land and board, concerning the whole air transport system (aircraft, airport areas and infrastructure)
- Increase of quality, effectiveness and efficiency of monitoring, defence and surveillance systems in territories
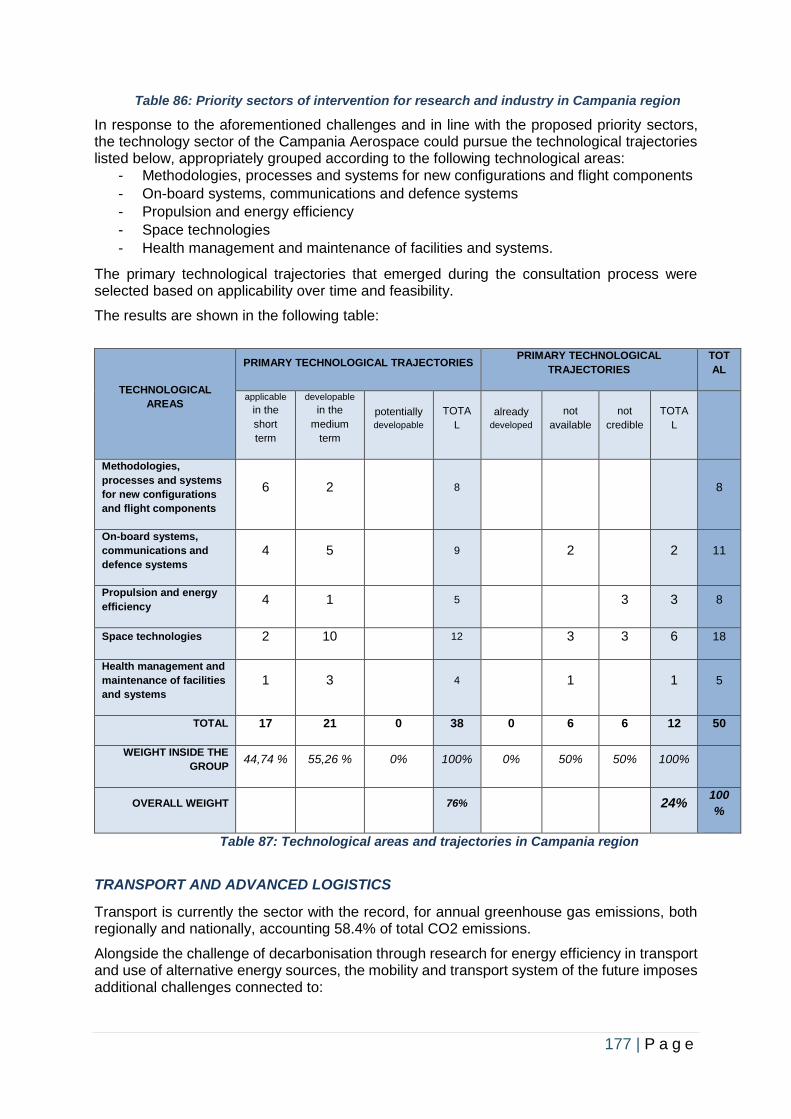
177 | P a g e
Table 86: Priority sectors of intervention for research and industry in Campania region
In response to the aforementioned challenges and in line with the proposed priority sectors, the technology sector of the Campania Aerospace could pursue the technological trajectories listed below, appropriately grouped according to the following technological areas:
- Methodologies, processes and systems for new configurations and flight components
- On-board systems, communications and defence systems
- Propulsion and energy efficiency
- Space technologies
- Health management and maintenance of facilities and systems.
The primary technological trajectories that emerged during the consultation process were selected based on applicability over time and feasibility.
The results are shown in the following table:
TECHNOLOGICAL
AREAS
PRIMARY TECHNOLOGICAL TRAJECTORIES PRIMARY TECHNOLOGICAL
TRAJECTORIES
TOT
AL
applicable
in the
short
term
developable
in the
medium
term
potentially
developable
TOTA
L
already
developed
not
available
not
credible
TOTA
L
Methodologies,
processes and systems
for new configurations
and flight components
6 2 8 8
On-board systems,
communications and
defence systems
4 5 9 2 2 11
Propulsion and energy
efficiency 4 1 5 3 3 8
Space technologies 2 10 12 3 3 6 18
Health management and
maintenance of facilities
and systems
1 3 4 1 1 5
TOTAL 17 21 0 38 0 6 6 12 50
WEIGHT INSIDE THE
GROUP 44,74 % 55,26 % 0% 100% 0% 50% 50% 100%
OVERALL WEIGHT 76% 24% 100
%
Table 87: Technological areas and trajectories in Campania region
TRANSPORT AND ADVANCED LOGISTICS
Transport is currently the sector with the record, for annual greenhouse gas emissions, both regionally and nationally, accounting 58.4% of total CO2 emissions.
Alongside the challenge of decarbonisation through research for energy efficiency in transport and use of alternative energy sources, the mobility and transport system of the future imposes additional challenges connected to:
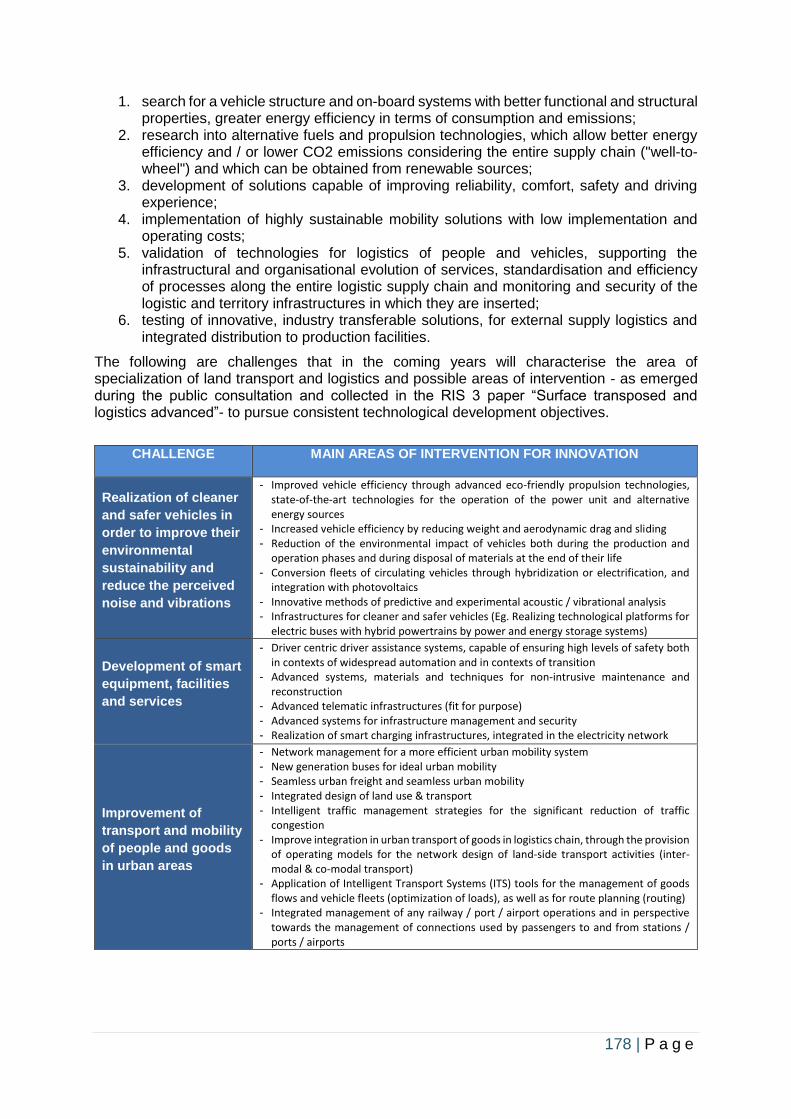
178 | P a g e
1. search for a vehicle structure and on-board systems with better functional and structural properties, greater energy efficiency in terms of consumption and emissions;
2. research into alternative fuels and propulsion technologies, which allow better energy efficiency and / or lower CO2 emissions considering the entire supply chain ("well-to-wheel") and which can be obtained from renewable sources;
3. development of solutions capable of improving reliability, comfort, safety and driving experience;
4. implementation of highly sustainable mobility solutions with low implementation and operating costs;
5. validation of technologies for logistics of people and vehicles, supporting the infrastructural and organisational evolution of services, standardisation and efficiency of processes along the entire logistic supply chain and monitoring and security of the logistic and territory infrastructures in which they are inserted;
6. testing of innovative, industry transferable solutions, for external supply logistics and integrated distribution to production facilities.
The following are challenges that in the coming years will characterise the area of specialization of land transport and logistics and possible areas of intervention - as emerged during the public consultation and collected in the RIS 3 paper “Surface transposed and logistics advanced”- to pursue consistent technological development objectives.
CHALLENGE MAIN AREAS OF INTERVENTION FOR INNOVATION
Realization of cleaner
and safer vehicles in
order to improve their
environmental
sustainability and
reduce the perceived
noise and vibrations
- Improved vehicle efficiency through advanced eco-friendly propulsion technologies, state-of-the-art technologies for the operation of the power unit and alternative energy sources
- Increased vehicle efficiency by reducing weight and aerodynamic drag and sliding - Reduction of the environmental impact of vehicles both during the production and
operation phases and during disposal of materials at the end of their life - Conversion fleets of circulating vehicles through hybridization or electrification, and
integration with photovoltaics - Innovative methods of predictive and experimental acoustic / vibrational analysis - Infrastructures for cleaner and safer vehicles (Eg. Realizing technological platforms for
electric buses with hybrid powertrains by power and energy storage systems)
Development of smart
equipment, facilities
and services
- Driver centric driver assistance systems, capable of ensuring high levels of safety both in contexts of widespread automation and in contexts of transition
- Advanced systems, materials and techniques for non-intrusive maintenance and reconstruction
- Advanced telematic infrastructures (fit for purpose) - Advanced systems for infrastructure management and security - Realization of smart charging infrastructures, integrated in the electricity network
Improvement of
transport and mobility
of people and goods
in urban areas
- Network management for a more efficient urban mobility system - New generation buses for ideal urban mobility - Seamless urban freight and seamless urban mobility - Integrated design of land use & transport - Intelligent traffic management strategies for the significant reduction of traffic
congestion - Improve integration in urban transport of goods in logistics chain, through the provision
of operating models for the network design of land-side transport activities (inter-modal & co-modal transport)
- Application of Intelligent Transport Systems (ITS) tools for the management of goods flows and vehicle fleets (optimization of loads), as well as for route planning (routing)
- Integrated management of any railway / port / airport operations and in perspective towards the management of connections used by passengers to and from stations / ports / airports
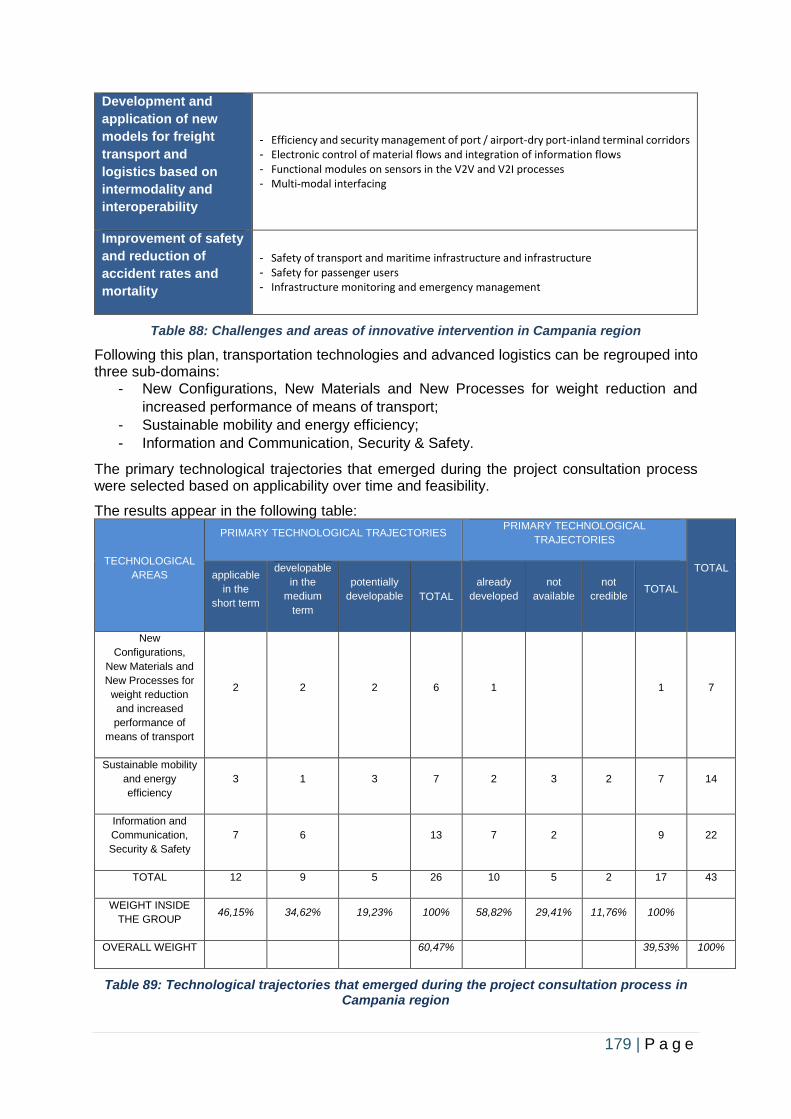
179 | P a g e
Development and
application of new
models for freight
transport and
logistics based on
intermodality and
interoperability
- Efficiency and security management of port / airport-dry port-inland terminal corridors - Electronic control of material flows and integration of information flows - Functional modules on sensors in the V2V and V2I processes - Multi-modal interfacing
Improvement of safety
and reduction of
accident rates and
mortality
- Safety of transport and maritime infrastructure and infrastructure - Safety for passenger users - Infrastructure monitoring and emergency management
Table 88: Challenges and areas of innovative intervention in Campania region
Following this plan, transportation technologies and advanced logistics can be regrouped into three sub-domains:
- New Configurations, New Materials and New Processes for weight reduction and
increased performance of means of transport;
- Sustainable mobility and energy efficiency;
- Information and Communication, Security & Safety.
The primary technological trajectories that emerged during the project consultation process were selected based on applicability over time and feasibility.
The results appear in the following table:
TECHNOLOGICAL
AREAS
PRIMARY TECHNOLOGICAL TRAJECTORIES PRIMARY TECHNOLOGICAL
TRAJECTORIES
TOTAL applicable
in the
short term
developable
in the
medium
term
potentially
developable TOTAL
already
developed
not
available
not
credible TOTAL
New
Configurations,
New Materials and
New Processes for
weight reduction
and increased
performance of
means of transport
2 2 2 6 1 1 7
Sustainable mobility
and energy
efficiency
3 1 3 7 2 3 2 7 14
Information and
Communication,
Security & Safety
7 6 13 7 2 9 22
TOTAL 12 9 5 26 10 5 2 17 43
WEIGHT INSIDE
THE GROUP 46,15% 34,62% 19,23% 100% 58,82% 29,41% 11,76% 100%
OVERALL WEIGHT 60,47% 39,53% 100%
Table 89: Technological trajectories that emerged during the project consultation process in Campania region
180 | P a g e
South Aegean Region
Greece
Challenges for Transport SMEs to Develop & Commercialise Their Products
Research & Innovation (RTDI) The Region of South Aegean is among the lowest EU regions on expenditure on research and innovation and the second lowest among the Greek regions. In 2011, the RSA spent 0.15% of its regional GDP on research and innovation activities while the national average is 0.67% and the European average is 2.05%. The region is a marginal contributor to the National Innovation System and almost all research activities in the region take place within the four departments of the Aegean University. Furthermore, the region hosts the Rhodes Hydrobiological Station of the Hellenic Centre for Marine Research (HCMR) and 92% of the total research activities conducted within the RSA in 2011 were part of the University and the HCMR with less than 6% conducted by private companies. Moreover, the percentage of employees with higher education was 16.6% in 2013, the lowest among all Greek regions. Recently, RSA attracted and currently hosts a newly found department of the Hellenic Institute of Transport which is part of CERTH.
Besides the efforts to increase the R&D expenditure over the last decade to create a critical mass of public research infrastructures that can potentially support the regional economy, there is still much to be done in order for the region to improve its R&D and Innovation performance (RIS3, 2012). The local economy’s structure combined with previous low intensity research activities do not encourage the reconciliation of further research with production.
As the analysis from the collected data derived from the literature review and the questionnaires and other discussions held with relevant stakeholders and companies, the following paragraphs provide a brief overview of the challenged the transport SMEs face to develop and commercialise their products. First and most important is the lack of external financial resources that will allow the funding and this the externalization and the successful establishment of the services and products of such SMEs. Local SMEs (especially in most remote areas) need to become resilient to a climate of constrained national budgets and public investments and an unstable banking system with restrictions in all kind of loans (due to reduced liquidity) in order to have a sustainable future. What is currently missing from the region are private and public investments that could boost transport SMEs to test their products and services and bring them in the market.
Moreover, the island identity of the RSA creates a relative isolation of local SMEs from the sources of information and funding, like public authorities, universities and research centres.
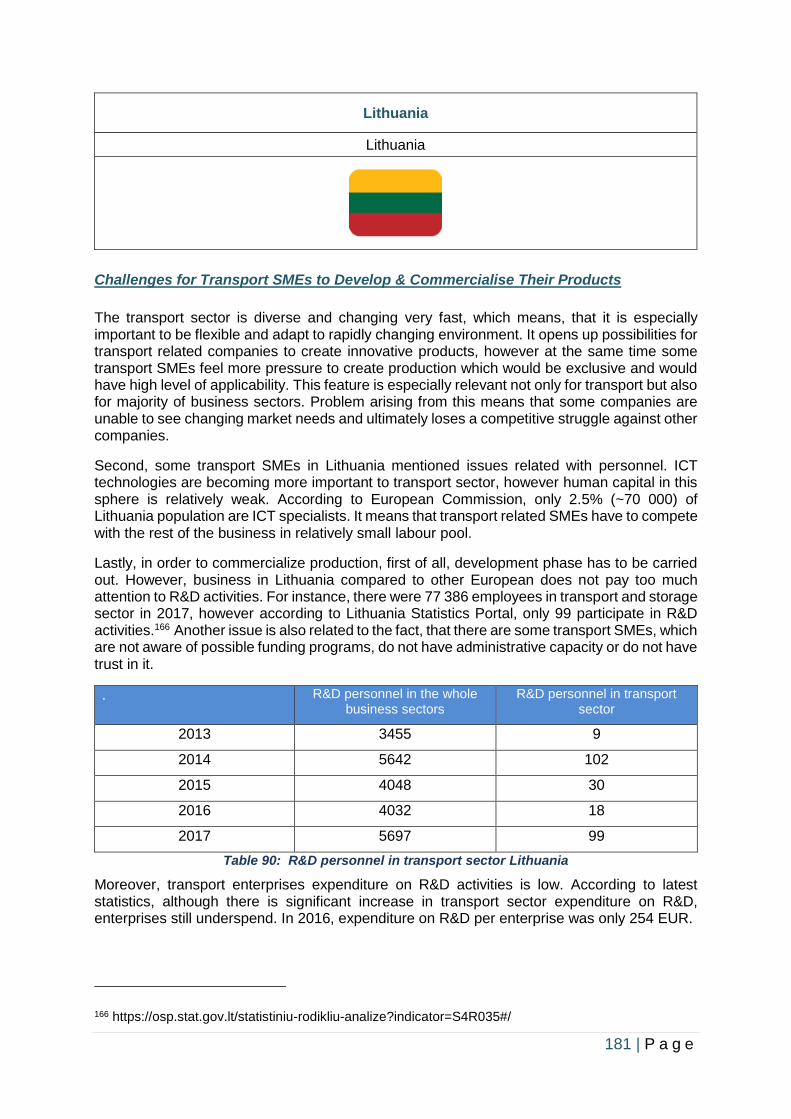
181 | P a g e
Lithuania
Lithuania
Challenges for Transport SMEs to Develop & Commercialise Their Products
The transport sector is diverse and changing very fast, which means, that it is especially important to be flexible and adapt to rapidly changing environment. It opens up possibilities for transport related companies to create innovative products, however at the same time some transport SMEs feel more pressure to create production which would be exclusive and would have high level of applicability. This feature is especially relevant not only for transport but also for majority of business sectors. Problem arising from this means that some companies are unable to see changing market needs and ultimately loses a competitive struggle against other companies.
Second, some transport SMEs in Lithuania mentioned issues related with personnel. ICT technologies are becoming more important to transport sector, however human capital in this sphere is relatively weak. According to European Commission, only 2.5% (~70 000) of Lithuania population are ICT specialists. It means that transport related SMEs have to compete with the rest of the business in relatively small labour pool.
Lastly, in order to commercialize production, first of all, development phase has to be carried out. However, business in Lithuania compared to other European does not pay too much attention to R&D activities. For instance, there were 77 386 employees in transport and storage sector in 2017, however according to Lithuania Statistics Portal, only 99 participate in R&D activities.166 Another issue is also related to the fact, that there are some transport SMEs, which are not aware of possible funding programs, do not have administrative capacity or do not have trust in it.
. R&D personnel in the whole business sectors
R&D personnel in transport sector
2013 3455 9
2014 5642 102
2015 4048 30
2016 4032 18
2017 5697 99
Table 90: R&D personnel in transport sector Lithuania
Moreover, transport enterprises expenditure on R&D activities is low. According to latest statistics, although there is significant increase in transport sector expenditure on R&D, enterprises still underspend. In 2016, expenditure on R&D per enterprise was only 254 EUR.
166 https://osp.stat.gov.lt/statistiniu-rodikliu-analize?indicator=S4R035#/
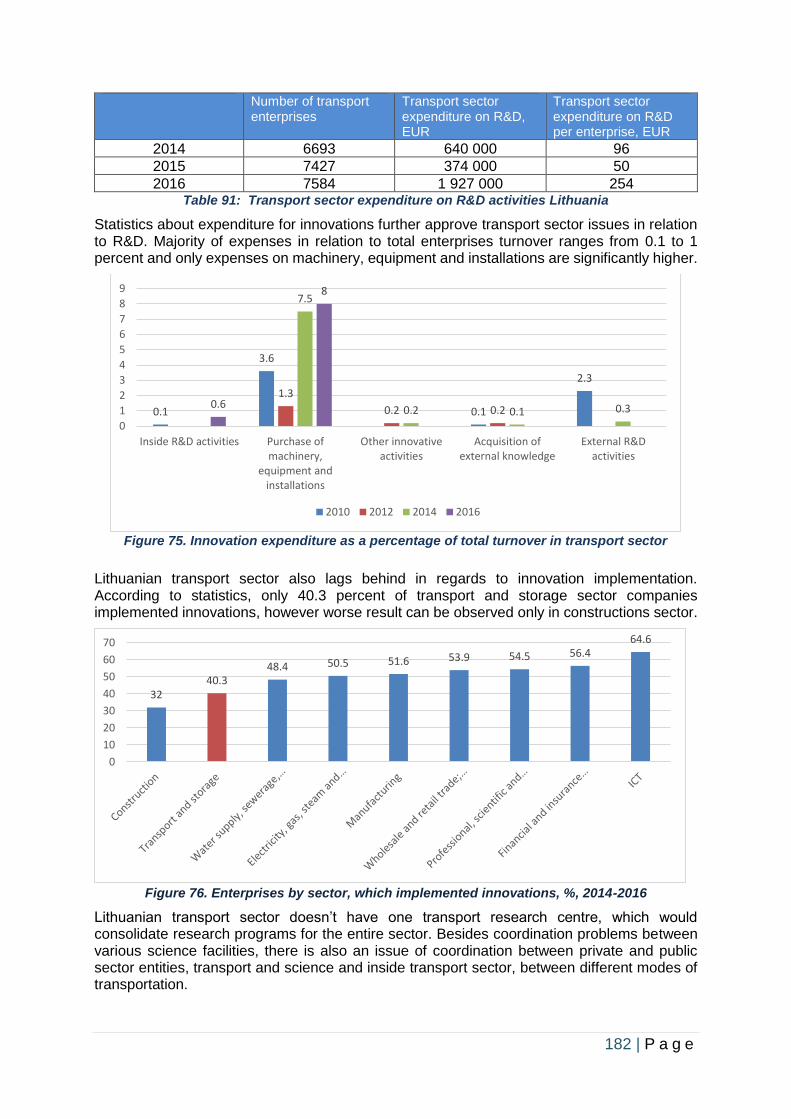
182 | P a g e
Number of transport enterprises
Transport sector expenditure on R&D, EUR
Transport sector expenditure on R&D per enterprise, EUR
2014 6693 640 000 96
2015 7427 374 000 50
2016 7584 1 927 000 254 Table 91: Transport sector expenditure on R&D activities Lithuania
Statistics about expenditure for innovations further approve transport sector issues in relation to R&D. Majority of expenses in relation to total enterprises turnover ranges from 0.1 to 1 percent and only expenses on machinery, equipment and installations are significantly higher.
Figure 75. Innovation expenditure as a percentage of total turnover in transport sector
Lithuanian transport sector also lags behind in regards to innovation implementation. According to statistics, only 40.3 percent of transport and storage sector companies implemented innovations, however worse result can be observed only in constructions sector.
Figure 76. Enterprises by sector, which implemented innovations, %, 2014-2016
Lithuanian transport sector doesn’t have one transport research centre, which would consolidate research programs for the entire sector. Besides coordination problems between various science facilities, there is also an issue of coordination between private and public sector entities, transport and science and inside transport sector, between different modes of transportation.
0.1
3.6
0.1
2.3
1.3
0.2 0.2
7.5
0.2 0.1 0.30.6
8
0
1
2
3
4
5
6
7
8
9
Inside R&D activities Purchase ofmachinery,
equipment andinstallations
Other innovativeactivities
Acquisition ofexternal knowledge
External R&Dactivities
2010 2012 2014 2016
3240.3
48.4 50.5 51.6 53.9 54.5 56.464.6
0
10
20
30
40
50
60
70
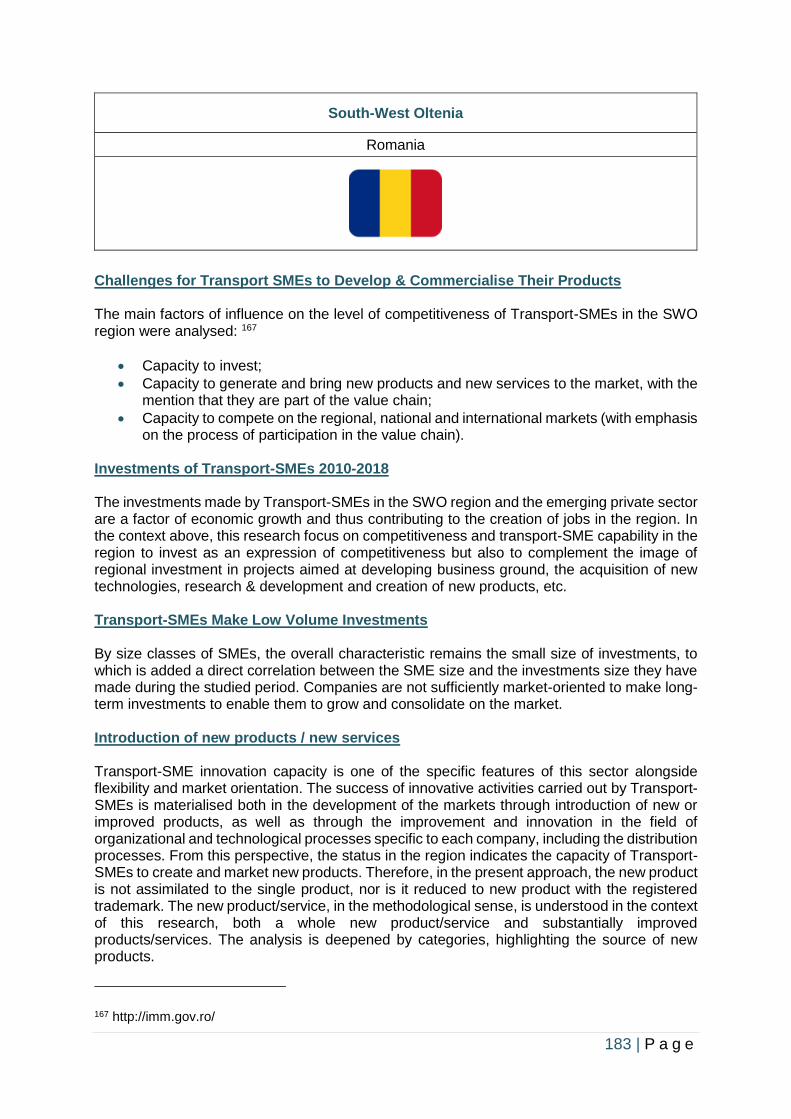
183 | P a g e
South-West Oltenia
Romania
Challenges for Transport SMEs to Develop & Commercialise Their Products The main factors of influence on the level of competitiveness of Transport-SMEs in the SWO region were analysed: 167
• Capacity to invest;
• Capacity to generate and bring new products and new services to the market, with the mention that they are part of the value chain;
• Capacity to compete on the regional, national and international markets (with emphasis on the process of participation in the value chain).
Investments of Transport-SMEs 2010-2018 The investments made by Transport-SMEs in the SWO region and the emerging private sector are a factor of economic growth and thus contributing to the creation of jobs in the region. In the context above, this research focus on competitiveness and transport-SME capability in the region to invest as an expression of competitiveness but also to complement the image of regional investment in projects aimed at developing business ground, the acquisition of new technologies, research & development and creation of new products, etc. Transport-SMEs Make Low Volume Investments By size classes of SMEs, the overall characteristic remains the small size of investments, to which is added a direct correlation between the SME size and the investments size they have made during the studied period. Companies are not sufficiently market-oriented to make long-term investments to enable them to grow and consolidate on the market. Introduction of new products / new services Transport-SME innovation capacity is one of the specific features of this sector alongside flexibility and market orientation. The success of innovative activities carried out by Transport-SMEs is materialised both in the development of the markets through introduction of new or improved products, as well as through the improvement and innovation in the field of organizational and technological processes specific to each company, including the distribution processes. From this perspective, the status in the region indicates the capacity of Transport-SMEs to create and market new products. Therefore, in the present approach, the new product is not assimilated to the single product, nor is it reduced to new product with the registered trademark. The new product/service, in the methodological sense, is understood in the context of this research, both a whole new product/service and substantially improved products/services. The analysis is deepened by categories, highlighting the source of new products.
167 http://imm.gov.ro/
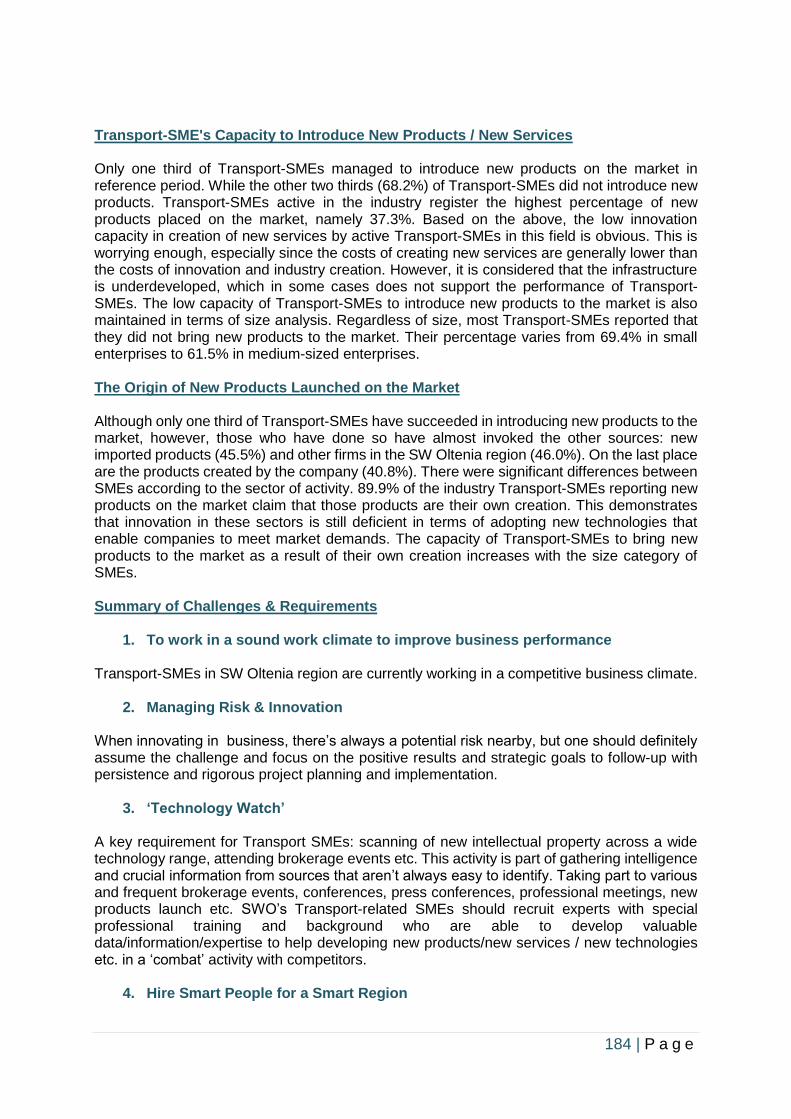
184 | P a g e
Transport-SME's Capacity to Introduce New Products / New Services Only one third of Transport-SMEs managed to introduce new products on the market in reference period. While the other two thirds (68.2%) of Transport-SMEs did not introduce new products. Transport-SMEs active in the industry register the highest percentage of new products placed on the market, namely 37.3%. Based on the above, the low innovation capacity in creation of new services by active Transport-SMEs in this field is obvious. This is worrying enough, especially since the costs of creating new services are generally lower than the costs of innovation and industry creation. However, it is considered that the infrastructure is underdeveloped, which in some cases does not support the performance of Transport-SMEs. The low capacity of Transport-SMEs to introduce new products to the market is also maintained in terms of size analysis. Regardless of size, most Transport-SMEs reported that they did not bring new products to the market. Their percentage varies from 69.4% in small enterprises to 61.5% in medium-sized enterprises. The Origin of New Products Launched on the Market Although only one third of Transport-SMEs have succeeded in introducing new products to the market, however, those who have done so have almost invoked the other sources: new imported products (45.5%) and other firms in the SW Oltenia region (46.0%). On the last place are the products created by the company (40.8%). There were significant differences between SMEs according to the sector of activity. 89.9% of the industry Transport-SMEs reporting new products on the market claim that those products are their own creation. This demonstrates that innovation in these sectors is still deficient in terms of adopting new technologies that enable companies to meet market demands. The capacity of Transport-SMEs to bring new products to the market as a result of their own creation increases with the size category of SMEs. Summary of Challenges & Requirements
1. To work in a sound work climate to improve business performance Transport-SMEs in SW Oltenia region are currently working in a competitive business climate.
2. Managing Risk & Innovation When innovating in business, there’s always a potential risk nearby, but one should definitely assume the challenge and focus on the positive results and strategic goals to follow-up with persistence and rigorous project planning and implementation.
3. ‘Technology Watch’
A key requirement for Transport SMEs: scanning of new intellectual property across a wide technology range, attending brokerage events etc. This activity is part of gathering intelligence and crucial information from sources that aren’t always easy to identify. Taking part to various and frequent brokerage events, conferences, press conferences, professional meetings, new products launch etc. SWO’s Transport-related SMEs should recruit experts with special professional training and background who are able to develop valuable data/information/expertise to help developing new products/new services / new technologies etc. in a ‘combat’ activity with competitors.
4. Hire Smart People for a Smart Region
185 | P a g e
Transport-SMEs should also recruit exceptional people with exceptional professional training and background who are able to develop smart projects for a smart region. In this case, the Transport SMEs should keep close contact and cooperation with universities, research and development centres/institutions, with the regional development agency, think tanks etc.
5. Benchmarking Against a Holistic Model of Good Practice
Regular and systematic benchmarking against peers in the industry, to adopt best practice for specific functions, training and background to develop smart projects for a smart region. Holism is the idea that systems (physical, biological, chemical, social, economic, mental, linguistic) and their properties should be viewed as wholes, not just as a collection of parts. In our case, Transport-related SMEs in SWO region should make up a holistic model of good practice to be developed and maintained in the SWO region for a long and stable period of time, if possible, for several decades. The whole is greater than the sum of its parts: Transport SMEs system that is running in the region produces a greater overall effect than the mere sum of the separate components defined at each individual business sector where Transport SMEs are operating.
The fundamental holistic characters as a unity of parts which is so close and intense as to be more than the sum of its parts; which not only gives a particular conformation or structure to the parts, but so relates and determines them in their synthesis that their functions are altered; the synthesis affects and determines the parts, so that they function towards the whole Transport SMEs system; and the whole and the parts, therefore reciprocally influence and determine each other, and appear more or less to merge their individual characters: the whole Transport SMEs s is in the parts and the specific individual Transport SMEs parts are in the whole, and this synthesis of whole and parts is reflected in the holistic character of the functions of the parts as well as of the whole.
6. Benchmarking Against Leader Firms to Make Decisions About New Products & Processes
Leader firms drive the whole Transport-SMEs system forward. To establish a competitive benchmark against leader firms, the follower Transport SMEs must:
• Determine key metrics: What data points are most central to Transport SMEs business in the SW Oltenia region? Focusing on key business-driving metrics like revenue, order volume, and cost of goods sold makes researching competitors and measuring success much clearer.
• Identify competitors: It’s important to know the competitor companies in the current period and in the future. They have also to examine how the leader firms are operating within Transport-related SMEs market and any marketplaces in which to expand.
• Research and assess competitors: How are the leader firms differentiating themselves in the Transport-SMEs market? What different sales channels and retail technologies are they utilizing? These are the types of questions the region’s Transport-SMEs need to answer and competitor actions they need to anticipate.
• Leverage benchmarking tools: Aside from costly industry analyst reports, data that can provide a competitive analysis about how region’s Transport-SMEs are performing against leader firms and main competitors is sparse.
• Develop an action plan: What insights did the business research bring to light for Transport SMEs business? Once the Transport SMEs are clear on what the leader firms and main competitors are doing and what changes they need to implement to drive business success, it’s time to determine key goals for the year and start developing tactical plans to achieve those goals. Region’s Transport SMEs have to
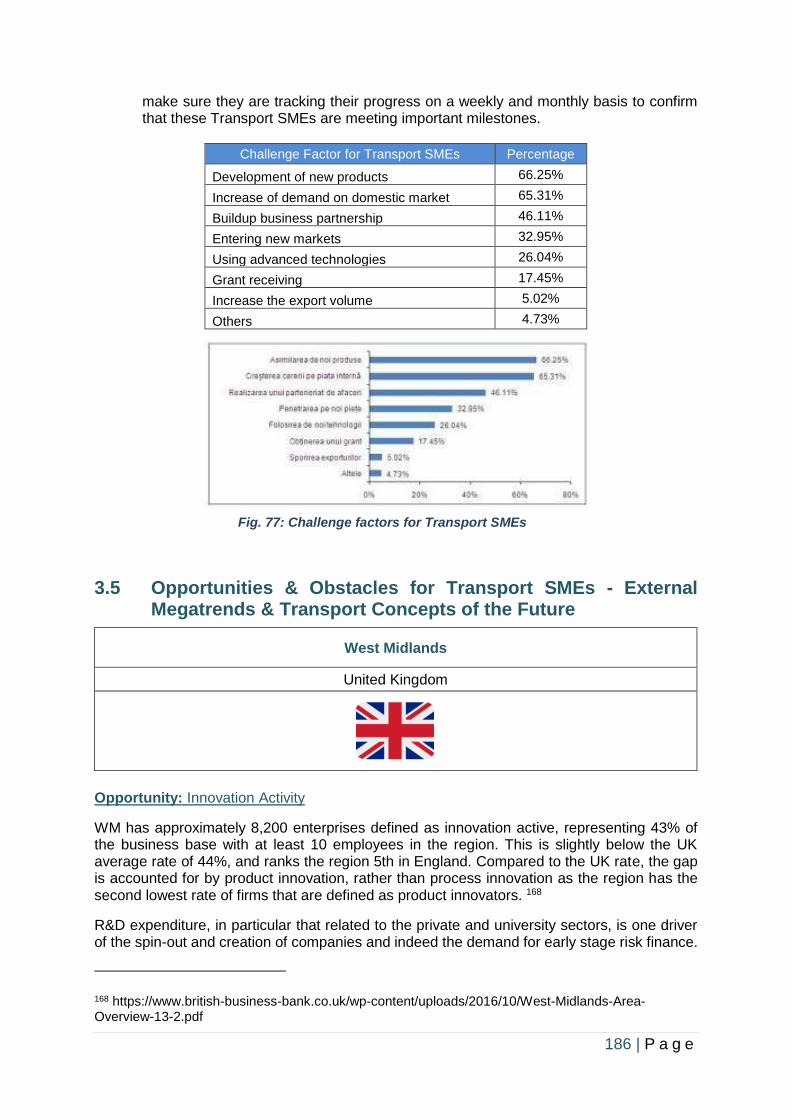
186 | P a g e
make sure they are tracking their progress on a weekly and monthly basis to confirm that these Transport SMEs are meeting important milestones.
Challenge Factor for Transport SMEs Percentage
Development of new products 66.25%
Increase of demand on domestic market 65.31%
Buildup business partnership 46.11%
Entering new markets 32.95%
Using advanced technologies 26.04%
Grant receiving 17.45%
Increase the export volume 5.02%
Others 4.73%
Fig. 77: Challenge factors for Transport SMEs
3.5 Opportunities & Obstacles for Transport SMEs - External Megatrends & Transport Concepts of the Future
West Midlands
United Kingdom
Opportunity: Innovation Activity
WM has approximately 8,200 enterprises defined as innovation active, representing 43% of the business base with at least 10 employees in the region. This is slightly below the UK average rate of 44%, and ranks the region 5th in England. Compared to the UK rate, the gap is accounted for by product innovation, rather than process innovation as the region has the second lowest rate of firms that are defined as product innovators. 168
R&D expenditure, in particular that related to the private and university sectors, is one driver of the spin-out and creation of companies and indeed the demand for early stage risk finance.
168 https://www.british-business-bank.co.uk/wp-content/uploads/2016/10/West-Midlands-Area-Overview-13-2.pdf
187 | P a g e
R&D expenditure has increased steadily between 2001-12, from £1 billion to £1.8 billion, an increase of 80%.
This increase was particularly pronounced for private expenditure in the last few years, increasing by 65% between 2010 and 2012. Data for the latest year shows that of total R&D expenditure, 80% (1.46 billion) came from the private sector, whereas around 20% (£353 million) came from the higher education sector.
There have been around 90 university spinouts recorded since the year 2000, representing 9% of all spinouts in England. Considering the working age population, the region has a higher than national average rate. The three universities of Warwick, Birmingham and Aston account for around 74% of all spinouts in the region.
Opportunity: Global Centre of Transport & Mobility
The WM cluster includes cutting edge research and development and established original equipment manufacturers (OEMs). These are supported by globally competitive, robust and interconnected supply chain firms, including in aerospace, automotive, rail and the crucial supporting industries of metals and materials.
These supply chain strengths underpin the manufacturing expertise in the region and will drive the wider innovation needed to secure a successful and balanced transition to new mobility solutions, the manufacture of batteries, connected autonomous vehicles and electric vehicle powertrain components, for example, at firms such as Westfield in Dudley, ZF Lemforder in Darlaston and Teepee Electrical in Bloxwich (Walsall).
Opportunity: Business & University Partnerships
The WM has global research and business strengths in digital and ultra-light rail, logistics, the largest connected autonomous vehicles (CAV) testbed ‘Midlands Future Mobility’ and the leading specialist CAV vehicle manufacturers in Westfield and RDM (Aurrigo).
There is also a concentration of highly innovative supply chain firms, working across the full range of manufacturing, materials, design, testing and data services that make up the future mobility industry, including components for future battery manufacture.
These strengths and assets provide the platform for creating, developing, testing and building global and national solutions to the future of mobility and associated supply chains. This includes large scale battery manufacture and successfully managing the move to electric vehicle (EV) powertrains across the full range of transport modes and supply chains.
Opportunity: Public Transport Upgrades Future Transport Concepts: High Speed Rail, Smart Buses
This cluster of skills, sectors and assets is matched with significant and locally agreed plans to upgrade public transport infrastructure through High Speed 2, suburban rail, trams and smart buses. This will maximise the opportunity for TfWM to transform customers’ experience of travelling around the WM and wider UK, improving connectivity to jobs and skills opportunities. Wider work through the Midlands Connect partnership will enhance connectivity across the Midlands.
Megatrends: Future Cities Ecosystem Opportunity: Economic Value
The future success of the WM lies in the ability to adapt to long-term trends in mobility:
188 | P a g e
• Creating new markets, such as those in electric and connected autonomous vehicles (CAV) and mobility as a service, through the Future Mobility Zone;
• Stimulating further innovation in key areas such as battery research and manufacturing, 5G, and data, with benefits to the supply chain and whole economy;
• Taking advantage of growing global markets in very light rail, digital rail and electric and autonomous flight, in firms of all sizes;
• Continuing to develop a clean, integrated transport network, maximising the opportunities presented by HS2, optimising the value of the Transforming Cities Fund and other locally led investments and working smartly with Midlands Connect.
• CAV is worth between £50 and £100 billion to the UK economy
• An integrated transport network and arrival of HS2 could add £4 billion to the WM economy, driving major centres of growth such as UK Central Solihull.
Future Transport Concepts: New Markets
Electric vehicles Business and university partnerships will embed digital and creative expertise in electric vehicle design and manufacturing and support the development of new supply chains.
The WM will continue to establish enabling infrastructure to support the development of local charging and energy transmission systems for electric vehicles across the region to enable the future market, with location and approach driven by demand.
Connected Autonomous Vehicles (CAV) could form the majority of cars on the roads in 15 years, with truly self-driving vehicle trials for the public due to begin in the UK in 2021.
The national Industrial Strategy (November 2017) has backed over 200 companies working in consortia on 90 world leading projects on self-driving and connected technologies. As part of this commitment, the WM aims to deploy the first fully operational CAV in the WM in advance of the 2022 Commonwealth Games.
Between now and then, the region will be testing progress on a network of over 50 miles of roads in Coventry, Birmingham and Solihull. This area is now a globally leading ‘real world’ UK testbed for developing the next generation CAVs following over £50 million of recent investment from government and the private sector.
• The continued growth of city regions such as Birmingham and the WM, together with the need to reduce the impact of our growing population on the environment mean that we need to think about different ways of delivering and utilising transport.
• WM are a leader in developing and delivering intelligent and sustainable mobility. • £20 million to establish the UK’s first Future Mobility Zone between Birmingham,
Solihull and Coventry. • Midlands Future Mobility, which is using more than 50 miles of 'real world' roads in
Coventry, Solihull and Birmingham for CAV developers to not only come and test their new technology but bring their manufacturing operations with them.
• This is helping to create a cluster effect that is establishing the WM as a premier location for CAV-related organisations and companies. 169
169 https://www.tfwm.org.uk/strategy/innovation-future-mobility/
189 | P a g e
• £50 million into 5G trials in Birmingham, Coventry and Wolverhampton, awarding WM preferred partner status as part of the Urban Connected Communities scheme.
• The UK has been establishing itself at the forefront of innovation when it comes to Connected Automated Mobility, which is expected to be a £907 billion market by 2035.170
• The WM will have an effective and well used intelligent mobility solution which supports integrated travel across all means of transport. People and businesses will be enabled and incentivised to make cost effective, informed and sustainable travel choices using 'live' travel information and seamless payment systems which span multiple modes.
• This technology will help manage the way vehicles, including public transport, use our roads in the future so that journeys are more efficient and reliable. But they will also help keep our region at the forefront of the next wave of automotive technology and manufacture, creating well paid, future-proof jobs for local people.
• Driven by innovation in engineering, technology and business models, the way we move people and goods around is transforming with ‘mobility as a service’ challenging our assumptions on how we travel.171
• It is not just a replacement of vehicles with connected autonomous electric vehicles - to truly revolutionise transportation, there is a need to have a change to ownership models with an emphasis on shared and inclusive mobility. 172
Opportunity: Stimulate Further Innovation Battery Research & Development Partners will complete the development of the UK Battery Industrialisation Centre, part of the Faraday Battery Challenge, and consider local options to enhance its specifications and energy supply. Collaboration between local public and private sector partners will continue to build the optimum environment for additional foreign direct investment to accelerate battery development and production. This includes local work to build on the WM plans to develop a local case for a Gigafactory.
Technology Innovation & Testing There are plans to build on government and local investment of up to £50 million for the UK’s first large-scale 5G testbed to enable a new approach to real-time data and user management across the whole transport system. This includes integration with CAV design, testing and operation. Collaboration with other 5G testbeds, including Worcester Manufacturing and the Midlands Engine 5G project, will deliver productivity improvements for the wider supply chain.
Deploying Mobility Technology into Other Sectors Innovation and manufacturing expertise will be applied to WM supply chain firms at all tiers, through new demonstrator and support programmes. For example, stimulating innovation in connected mobility will underpin a new approach to distributed, connected factories and supply chains with significant gains for the wider UK economy and local supply chains across the wider Midlands Engine area.
Opportunity: Integrated Transport System in the WM
Continue a significant programme of transport investment to develop an integrated, clean, multi modal system linked to the locally led HS2 Growth Strategy. This will improve air quality and directly address productivity challenges by connecting people to new job opportunities and
170 https://assets.publishing.service.gov.uk/government/uploads/system/uploads/ 171 https://ktn-uk.co.uk/interests/transport 172 https://taas.technology/awards/home
190 | P a g e
skills provision, improving access to healthcare and green space. It will also be integrated with the 5G network to drive a new traveller-centric system and approach.
To reduce congestion and journey times through significant ongoing investment in clean, low emission public transport ensuring that every part of the WM is close to local, national and international opportunities – via air, road, rail and digital.173
Opportunity: Advanced Manufacturing Manufacturing is the largest industry in the region, corresponding to 15% of regional GVA in 2015 (UK Office of National Statistics, 2017). On average, the WM manufacturing base contributes to 9.6% of the UK manufacturing base. In terms of GVA, the most important manufacturing industries in the WM are basic metals and metal products and transport equipment. The Black Country Enterprise Zone has a focus on advanced manufacturing and engineering, aerospace, automotive, and low carbon industry. Greater Birmingham and Solihull LEP also has a focus on advanced manufacturing, especially related to the automotive industry. The region hosts the Warwick Manufacturing Group (WMG), located in Coventry, which is part of the UK High Value Manufacturing Catapult. The Catapult centres are a network of world-leading institutions designed to promote UK’s capability for innovation in specific areas and drive economic growth. The WMG catapult focuses on providing solutions for Low Carbon Mobility, by supporting the development of innovation solutions in the following areas: Light-weighting, Advanced Propulsion Systems, Intelligent Vehicles and Energy Storage & Management. Coventry is home to the Manufacturing Technology Centre (MTC) that represents one of the largest public sector investments in UK manufacturing and is part of the High Value Manufacturing Catapult. The MTC develops and proves innovative manufacturing processes and technologies. It was founded in 2010, as an independent Research & Technology Organisation (RTO), by four institutions: The University of Birmingham, Loughborough University, The University of Nottingham and TWI. The role of this Centre has increased throughout the years to cover not only R&D but also Training, Advanced Manufacturing Management and Factory Design. The MTC develops and proves innovative manufacturing processes and technologies. Another organization located in the region the Institute for Advanced Manufacturing and Engineering (AME). The Institute aims to research and develop innovative technology for automotive, aerospace, oil and gas, power generation and rail. Obstacles: Skills Shortages A potential obstacle may come in the form of Generation Z (born after 1995) entering the work force, with some business leaders perceiving a lack of essential skills for manufacturing sectors. Compounded by a shortage in skills in manufacturing, construction and automotive there is an argument the new generation will have other skills that will be valuable, such as an orientation for digital, technology, creativity and a rejection of business norms and hierarchy, embracing innovation and change.
173 https://www.gov.uk/government/publications/west-midlands-local-industrial-strategy/west-midlands-local-industrial-strategy
191 | P a g e
The WMCA are encouraging investment and take-up of skilled construction workers and new jobs in the region to capitalise on this booming industry. The ‘Construction Gateway’ programme, a £5m initiative, helps to develop a new generation of skilled workers with an aptitude for hi-tech solutions to boost output. This is considered a way to counteract the effects of a post-Brexit landscape and an ageing workforce. In the automotive sector, the WMCA has launched the Automotive Skills Plan to provide a boost for the regions automotive supply chain businesses. These funds from a devolution deal will equip workers with digital retraining and future proof thousands of jobs.174 Only one in seven companies are found to be investing in skills and training as their number one strategic priority, a recent study by a leading law firm concluded (Pinsent Masons, 2019). They conducted a roundtable with key influencers in the Midlands manufacturing sector and outlined a skills gap, deficiencies in the way OEMs recruit, issues with pay rates, and customer demand outweighing in-house skills and resources. They advised that skills gaps can be aided by a diverse employee pool resulting in enhanced creativity and ideas. The Black Country Skills Factory has been a highly successful project aimed at addressing skills shortages in Black Country Advanced Manufacturing companies. The Skills Factory team have a detailed understanding of training provision in the manufacturing sector in the Black Country and can offer employers impartial and independent advice on up-skilling training courses, Apprenticeships and funding opportunities in the Black Country. Funding was received in 2017 to extend the Skills Factory model to our other growth sectors, and the intention is to expand this geographically into other areas of the WM. Another key activity linked to advanced manufacturing is the High Value Manufacturing City (HVM City) portal. HVM City is an award-winning digital platform bringing together the region’s total investment opportunity with its ambition to support 10,000+ businesses, whilst at the same time drawing on major capital programmes both in the UK and globally. It’s a business-to-business showcase which highlights the world-class supply chain in the WM, allowing users to find supplier companies using a wide range of search criteria. HVM City enables users to integrate the supply chain, capturing the products manufactured in the area.175
Coventry University’s National Transport Design Centre and the Advanced Manufacturing and Engineering Institute provide industry ready graduates and research in electric vehicle and powertrain technologies.
Megatrends: Car Ownership
TfWM’s travel trends survey shows a continual increase in car ownership, with more households having two or more cars and fewer households having no car.
Since 1971, the percentage of households in the WM Metropolitan Area with two or more cars has risen from 8% to 27% in 2011. The percentage of households with no car has fallen from
174 Midlands Business Insider Magazine: Vol 27, Sep 2019 175 https://ec.europa.eu/growth/tools-databases/regional-innovation-monitor/base-profile/west-midlands
192 | P a g e
51% in 1971 to 31% in 2011. This trend has been seen in each of the seven WM metropolitan districts.
A continual increase in car ownership is expected over the next few decades. In 2035 it is projected that 19% of households in the WM will have no car and 26% will have two or more cars. A similar picture is projected for GB as a whole. In 2035 it is projected that 19% of households will have no car and 32% will have two or more cars. 176
Megatrends: Household Expenditure on Transport
The Family Spending Survey identifies average weekly household expenditure within Government Office regions; this includes the wider shire counties of the WM.
• The latest statistics show that weekly household expenditure in the region in 2016 was £454.10 compared with £454.50 in 2014.
• This trend contradicts what is apparent in the UK as a whole, with an increase from £512 to £527.
• The commodity or service with the greatest increase year-on-year was housing, fuel & power (an additional £2.60 per week) with recreation & culture having the largest decrease (£2.10).
• Transport represents the second largest portion of weekly household spending at 14%. Transport costs include purchase of vehicles and operational costs and represents 11.5% of weekly household expenditure. Public transport fares represent the remaining percentage share.
Megatrends: Fuel Consumption
Latest regional road transport consumption statistics show the WM Metropolitan Area uses approximately 1.2 million tonnes of fuel a year, a slight increase from the previous year. Cars represent 65.6% of the total fuel consumption, with petrol cars representing the largest share at 37.4% and 28.2% for diesel cars.
• Buses represent only 5% and goods vehicles make up 29% of the total road transport consumption.
• Statistics for the UK show broadly the same trend as the WM with cars representing 63% of total fuel consumption and buses only 3%.
• Comparing fuel prices in April 2017 with prices in April 2016 shows that there has been an increase in prices per litre for diesel, super and premium unleaded.
• Super unleaded has increased 11.7p, premium unleaded by 10.9p, diesel by 12.9p.
Global Megatrend: Supercities + Obstacle: Meeting Demands of Increased Globalisation & Rapid Industrialisation + Opportunity: Infrastructure & Jobs Investment With more people in the world living in cities, their share of global growth is rising. According to McKinsey as of October 2018, the top 50 cities account for 8% of global population, 21% of world GDP, 37% of urban high-income households and are home to 45% of firms with more than $1 bn in annual revenues.
As cities grow, they require significant infrastructure, including communication networks (e.g. 5G, fibre), transit and transportation (e.g. metro, bridges), social infrastructure (e.g. hospitals, schools) and housing.
176 https://www.tfwm.org.uk/media/2857/wm-travel-trends-2017.pdf
193 | P a g e
This was a key driver of commodity demand and fixed investments in the last 10-15 years as China and other developing economies industrialised rapidly and millions of people migrated to cities. This story is likely to continue as other emerging markets follow China’s lead.
Large cities that offer good infrastructure, greater convenience and attractive job opportunities typically attract global talent (see skills gap section above). This leads to higher population densities and younger consumers with higher disposable incomes. 177
Young and developing cities, especially in emerging markets, require basic infrastructure and construction (i.e. hard commodities, diggers, concrete etc.). But as they grow in size, opportunities emerge in middle class consumption exposure (housing, appliances, cars). Inevitably, demand for leisure and media grow too, as do services such as waste management and logistics. We seek to understand how cities in major economies are evolving to identify which businesses are the most attractive to invest in.
As cities become even bigger, large scale transport infrastructure, airports and bridges become essential. As electric vehicles become more prevalent, cities will need to invest in charging infrastructure and grids too.
Smart cities that link up crucial infrastructure using high-speed connectivity may well become the norm in many economies. In the last few years, new business models that rely on online platforms and dense populations have sprung up in many countries.
Examples include last-mile delivery, the sharing economy, e-scooters and electric vehicles. Many of them originate in large cities before they gain scale and expand elsewhere. The UN projects that by 2030, the world will be home to 43 megacities with over 10 million inhabitants.
Obstacle: Economic Uncertainty
There’s still a lot of hesitancy among car buyers – both new and used, a drop in used car transactions, with the year-to-date market down over the same period in 2018. It’s perhaps not a surprise to see such a slowdown in action – with so much economic and political uncertainty around us, owners are holding on to their cars for longer. This has a further impact on air quality, as the best way to improve it is through the introduction of the latest, cleanest models on to our roads – and accelerate their take-up.
There’s also some turbulence in the commercial vehicle markets, with a 10th consecutive quarterly decline in bus and coach registrations but a boost in truck numbers. The former shows more uncertainty at work, with operators unsure about different local authority requirements for clean air zones, now and in the future.
For the truck market, meanwhile, it may well be something of a false effect as truck fleets expand ahead of the introduction of smart tachograph regulations, with the market expected to equalise later this year.
All areas of the industry are feeling the effects of the current economic conditions, and there is certainly a need to make efforts to boost consumer and business confidence.
Government has measures within its gift but, of course, the one that would bolster our sector would be a Brexit deal. This would go a long way to turning around the fortunes of the industry and, indeed, the wider economy from their current path.
177 https://www.ishares.com/uk/professional/en/literature/whitepaper/megatrend-en-emea-whitepaper.pdf Megatrends The forces shaping our future A research study looking at structural shifts in the global economy and how they affect our investment thinking. (Blackrock, 2019)
194 | P a g e
Obstacle: Environmental Pressures
There are many other long-term challenges facing the global automotive industry, not least of which is air quality and the broader environmental pressures. The industry has the technologies to address these challenges; what we need is a strong appetite among consumers.
This starts with the new car markets but, given the way we purchase vehicles these days, quickly flows through to the used vehicle market. Having confidence to invest – whether an individual consumer or business – would help drive this transition and bring about the improvements. 178
Similarly, rapid urbanisation and the rising scrutiny on pollution and climate change have together accelerated investments in electric vehicles in both advanced and emerging economies.
By the end of this year, global auto manufacturers are expected to have launched 132 electric vehicle models up from just 33 in 2012. The ripple effects of this theme are being felt not just by auto manufacturers, but also component suppliers, tech hardware firms, commodity suppliers as well as infrastructure providers.
Becoming ‘carbon neutral’ is a theme and political pressure on industries that are part of the wider transportation ecosystem such as highways, infrastructure and new roads. 179
Obstacle: Low Carbon Transition Politics
Transport is one sector that has struggled to decarbonise, despite the ongoing optimism surrounding the expected growth in electric vehicles (EVs). For those operating in the transport sector, as well as the renewables sector, the Prime Minister should be supercharging how EVs and renewables can interact as well as spurring the development of low-carbon heavy transport. 180
The Low Carbon Vehicle Partnership’s 16th Annual Conference, took place in Westminster on July 8. ‘More than electric dreams? Future Fuels on the Road to Zero' asked whether accelerating the drive to battery electric vehicles can deliver road transport’s contribution to ‘net zero’ or whether we’ll need to use ‘other tools in the box’ to cut emissions from liquid fuels and combustion engines while we’re undergoing the electric transition. 181
The Electric Vehicle Energy Taskforce has been formed at the request of Government to make suggestions to Government and industry to ensure that the GB energy system is ready for and able to facilitate and exploit the mass take up of electric vehicles.
To put engaging the electric vehicle user at the heart of preparing the electricity system for the mass take up of electric vehicles (EV), ensuring that costs and emissions are as low as possible, and opportunities for vehicles to provide grid services are capitalised upon for the benefit of the system, energy bill payers and electric vehicle owners. 182 A report detailing how growth in the renewable energy and electric vehicle (EV) sectors is likely to displace oil in the
178 https://www.smmt.co.uk/2019/08/economic-uncertainty-masking-fundamental-strengths/ 179 http://flickread.com/edition/Highways/?user=Highways (Highways Magazine, July 2019 edition) 180 https://www.edie.net/news/11/Six-huge-challenges-Boris-Johnson-must-tackle--according-to-the-green-economy 181 https://www.lowcvp.org.uk/news,lowcvp-2019-conference-focuses-on-future-fuels-all-resources-now-available_3975.htm 182 https://www.lowcvp.org.uk/evet.htm
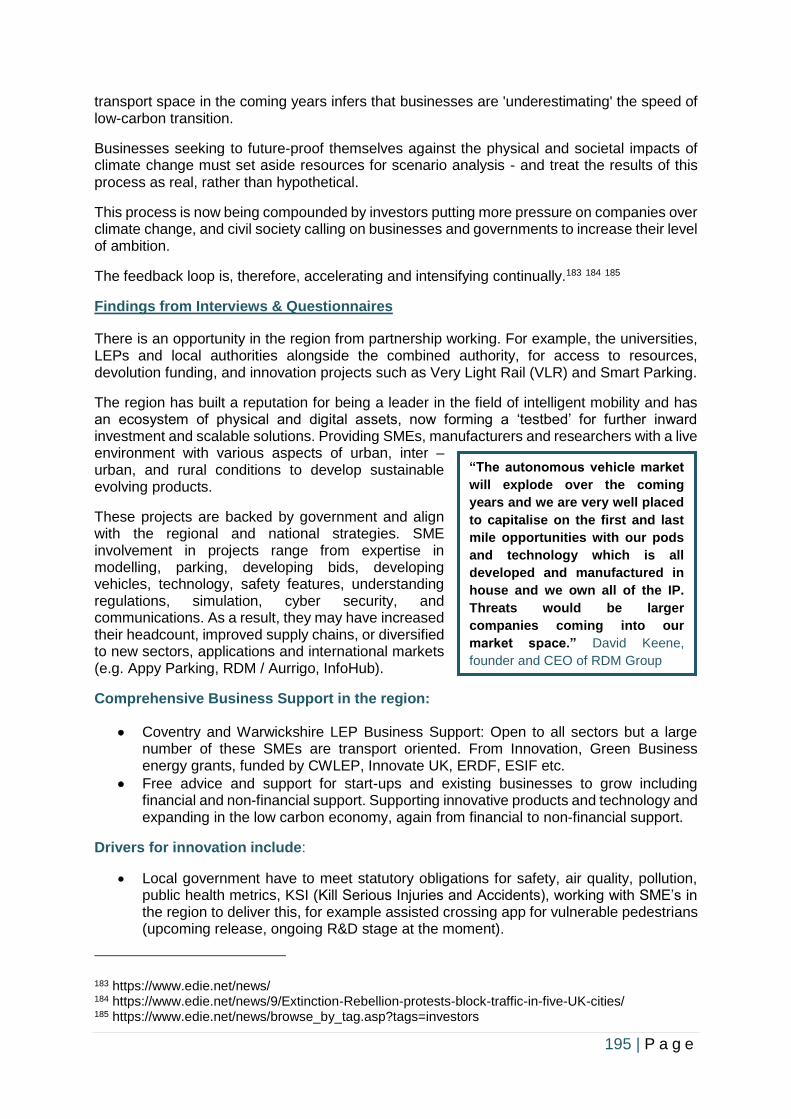
195 | P a g e
transport space in the coming years infers that businesses are 'underestimating' the speed of low-carbon transition.
Businesses seeking to future-proof themselves against the physical and societal impacts of climate change must set aside resources for scenario analysis - and treat the results of this process as real, rather than hypothetical.
This process is now being compounded by investors putting more pressure on companies over climate change, and civil society calling on businesses and governments to increase their level of ambition.
The feedback loop is, therefore, accelerating and intensifying continually.183 184 185
Findings from Interviews & Questionnaires
There is an opportunity in the region from partnership working. For example, the universities, LEPs and local authorities alongside the combined authority, for access to resources, devolution funding, and innovation projects such as Very Light Rail (VLR) and Smart Parking.
The region has built a reputation for being a leader in the field of intelligent mobility and has an ecosystem of physical and digital assets, now forming a ‘testbed’ for further inward investment and scalable solutions. Providing SMEs, manufacturers and researchers with a live environment with various aspects of urban, inter – urban, and rural conditions to develop sustainable evolving products.
These projects are backed by government and align with the regional and national strategies. SME involvement in projects range from expertise in modelling, parking, developing bids, developing vehicles, technology, safety features, understanding regulations, simulation, cyber security, and communications. As a result, they may have increased their headcount, improved supply chains, or diversified to new sectors, applications and international markets (e.g. Appy Parking, RDM / Aurrigo, InfoHub).
Comprehensive Business Support in the region:
• Coventry and Warwickshire LEP Business Support: Open to all sectors but a large number of these SMEs are transport oriented. From Innovation, Green Business energy grants, funded by CWLEP, Innovate UK, ERDF, ESIF etc.
• Free advice and support for start-ups and existing businesses to grow including financial and non-financial support. Supporting innovative products and technology and expanding in the low carbon economy, again from financial to non-financial support.
Drivers for innovation include:
• Local government have to meet statutory obligations for safety, air quality, pollution, public health metrics, KSI (Kill Serious Injuries and Accidents), working with SME’s in the region to deliver this, for example assisted crossing app for vulnerable pedestrians (upcoming release, ongoing R&D stage at the moment).
183 https://www.edie.net/news/ 184 https://www.edie.net/news/9/Extinction-Rebellion-protests-block-traffic-in-five-UK-cities/ 185 https://www.edie.net/news/browse_by_tag.asp?tags=investors
“The autonomous vehicle market
will explode over the coming
years and we are very well placed
to capitalise on the first and last
mile opportunities with our pods
and technology which is all
developed and manufactured in
house and we own all of the IP.
Threats would be larger
companies coming into our
market space.” David Keene,
founder and CEO of RDM Group
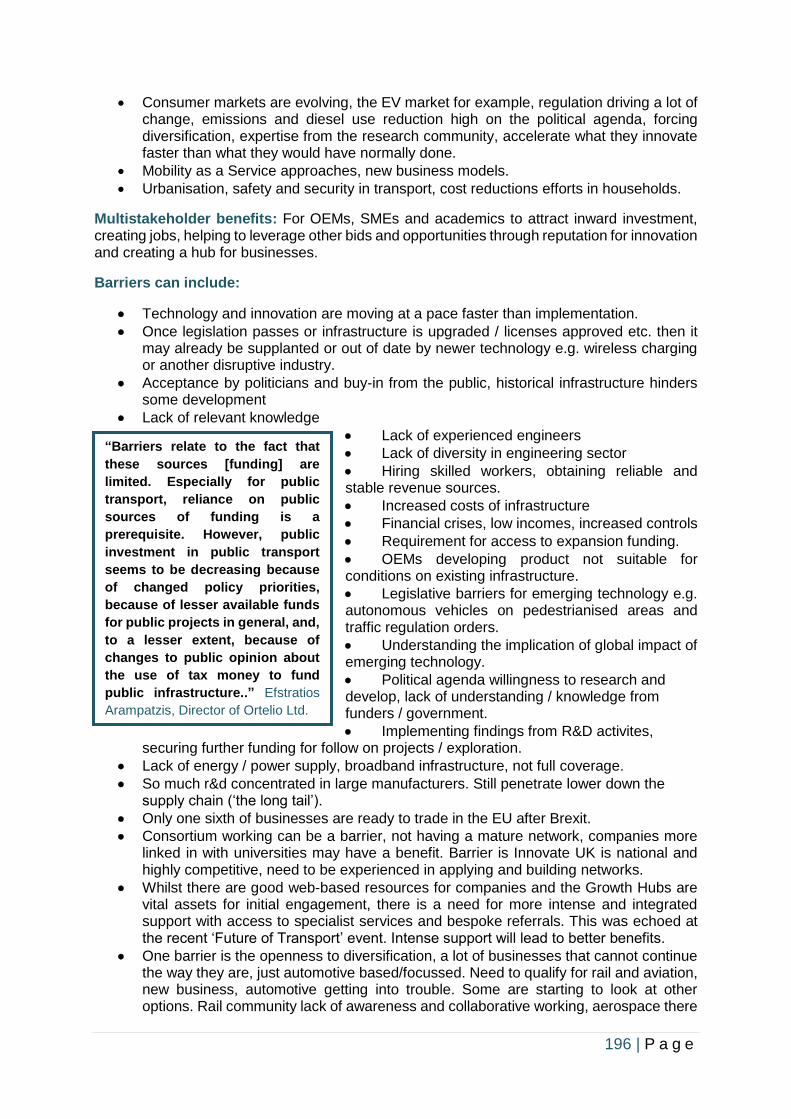
196 | P a g e
• Consumer markets are evolving, the EV market for example, regulation driving a lot of change, emissions and diesel use reduction high on the political agenda, forcing diversification, expertise from the research community, accelerate what they innovate faster than what they would have normally done.
• Mobility as a Service approaches, new business models.
• Urbanisation, safety and security in transport, cost reductions efforts in households.
Multistakeholder benefits: For OEMs, SMEs and academics to attract inward investment, creating jobs, helping to leverage other bids and opportunities through reputation for innovation and creating a hub for businesses.
Barriers can include:
• Technology and innovation are moving at a pace faster than implementation.
• Once legislation passes or infrastructure is upgraded / licenses approved etc. then it may already be supplanted or out of date by newer technology e.g. wireless charging or another disruptive industry.
• Acceptance by politicians and buy-in from the public, historical infrastructure hinders some development
• Lack of relevant knowledge
• Lack of experienced engineers
• Lack of diversity in engineering sector
• Hiring skilled workers, obtaining reliable and stable revenue sources.
• Increased costs of infrastructure
• Financial crises, low incomes, increased controls
• Requirement for access to expansion funding.
• OEMs developing product not suitable for conditions on existing infrastructure.
• Legislative barriers for emerging technology e.g. autonomous vehicles on pedestrianised areas and traffic regulation orders.
• Understanding the implication of global impact of emerging technology.
• Political agenda willingness to research and develop, lack of understanding / knowledge from funders / government.
• Implementing findings from R&D activites, securing further funding for follow on projects / exploration.
• Lack of energy / power supply, broadband infrastructure, not full coverage.
• So much r&d concentrated in large manufacturers. Still penetrate lower down the supply chain (‘the long tail’).
• Only one sixth of businesses are ready to trade in the EU after Brexit.
• Consortium working can be a barrier, not having a mature network, companies more linked in with universities may have a benefit. Barrier is Innovate UK is national and highly competitive, need to be experienced in applying and building networks.
• Whilst there are good web-based resources for companies and the Growth Hubs are vital assets for initial engagement, there is a need for more intense and integrated support with access to specialist services and bespoke referrals. This was echoed at the recent ‘Future of Transport’ event. Intense support will lead to better benefits.
• One barrier is the openness to diversification, a lot of businesses that cannot continue the way they are, just automotive based/focussed. Need to qualify for rail and aviation, new business, automotive getting into trouble. Some are starting to look at other options. Rail community lack of awareness and collaborative working, aerospace there
“Barriers relate to the fact that
these sources [funding] are
limited. Especially for public
transport, reliance on public
sources of funding is a
prerequisite. However, public
investment in public transport
seems to be decreasing because
of changed policy priorities,
because of lesser available funds
for public projects in general, and,
to a lesser extent, because of
changes to public opinion about
the use of tax money to fund
public infrastructure..” Efstratios
Arampatzis, Director of Ortelio Ltd.
197 | P a g e
are joint organisations such as Midlands Aerospace Alliance. Rail centre in Quinton could be a good opportunity going forward.
There are numerous barriers for SMEs in the Rail sector including:
• Current interpretation of EU procurement rules
• Procurement practices of large (client and Tier 1) organisations
• Accessibility (or rather lack of) to support/funding based on the current definition of a SME
• Procurement cycles within rail – leading to boom and bust - making investment decisions difficult
• Access to skilled people • Short term order books.
Campania Region
Italy
Opportunities & Obstacles for Transport SMEs - External Megatrends & Transport Concepts of the Future
The Automotive sector
The main players in this supply chain are characterised by a high international profile and high rates of product and process innovation. Over the years, the dependence on subcontracting destined solely for national manufacturers has been greatly reduced and there has been an increasing number of orders portfolio diversification processes. Such a characterization of the automotive manufacturing industry in Campania highlights the strong product differentiation compared to other Italian regions such as Emilia Romagna (where a significant presence of suppliers specialised in parts and components for the supply of the local sector can be seen today - production niche of “high-end” cars, accompanied by the presence of a strong precision mechanical industry); Tuscany (leading region in the motorhome sector with 80% of national production and a significant presence of the motorcycle industry); Abruzzo (where globalised companies operating in the automotive and mechanical sectors); Basilicata (industrial centre of FCA-Sata plant in Melfi); Piedmont continues to represent the main Region in terms of number of companies, number of employees and exports, in addition to FCA, GM operating also with its own Research Centre. Nevertheless, the Piedmont auto components supply chain is strongly tied to FCA production programmes.
Over the past few decades, the competitive environment of the automotive sector has changed a lot due to technological advances, production automation, regulation and increasing competition outside Europe. A recent publication by Ernst & Young Automotive Centre identifies and explains the mega-trends that will characterise the evolution of the automotive industry in 8 mega trends over the next few decades. It will be driven by the demand for safer and cleaner transport to impose the search for new value propositions to meet the mobility changing needs, favouring the entry of new specialized players to extend solutions developed
198 | P a g e
in other areas along with the rationalisation by the OEMs of the portfolio around product platforms, modules and systems; that will require the development of structured collaborations and risk sharing among actors of the supply chain, amplifying the tendency of TIR 1 to become, at least partially, global system integrators with their own supply chain.
The complexity, the criticality and the evolutions, which will characterize the automotive industry supply chain in the coming years, point out towards the need to adopt integrated project management methodologies, which allow to guarantee the level of Time to Market and quality of products, fundamental for the sector and at the same time difficult to obtain given the complexity of the involved supply chain.
Generally speaking, the motorisation rate (cars/inhabitants) in the USA, EU and Japan is about 1: 2. In India and China the rate of motorisation does not reach the value of 1:20, with an obviously huge growth potential. Currently, the difference is explained above all by the difference in per capita income in these countries; the expected income dynamics explains the expectations in terms of both production and consumption of new cars in these (very huge) emerging markets. In the future the car industry will be even more global, with new players (especially from China and India) able not only to scale their own internal markets but also to challenge increasingly consolidated brands in mature markets of Europe, United States and Japan. The winning strategy for European, US and Japanese players will probably be to prepare, on the one hand, to penetrate emerging markets, even with initially niche shares of such huge markets and, on the other hand, provide increasingly advanced products in mature markets, complying with technological expectations and changes in the approach to mobility.
We will witness, firstly in mature markets, a phenomenon driven by progress and innovation that will replace existing vehicles with more energy efficient and safer ones, able to offer new driving experiences. From this point of view, increasingly impressive advances in the field of alternative propulsion, active safety, assistance and driving automation are expected in the coming years. Vehicle-vehicle (V2V) and vehicle-infrastructure (V2I) communications will be exploited progressively for automation and, more generally, for cooperative ITS (Intelligent Transportation Systems) applications. Although technological innovation will not initially be spread evenly and OEMs will introduce the main innovations starting from “high-end” models, as technological frontiers will be moved beyond the lower-level segments, they will be able to enjoy progressively cheaper innovations. Similarly, technological innovation will spread from mature to emerging markets.
In such a scenario, the capacity for innovation in process (competitiveness) and product (technological adaptation) will be key of the global success. Besides, the phenomenon and the nature of technological innovation generate some non-trivial issues. Technological innovation encompasses several disciplines, even more extensive if we consider the innovation of consumer behaviour to which the technology must adapt. The result is an increasing difficulty for car-makers to handle and profoundly guide all necessary technologies, especially considering that some non-automotive players may have technical and R&D capabilities superior to OEMs in some specific disciplines. These factors, even more, are shifting the process towards distributed platforms and production processes in which OEMs are increasingly designers and integrators of first instance and the same top-level suppliers can, in some cases, be integrators of specific systems. In this context, the only way to ensure a simple, rapid, efficient and scalable introduction of the required technological innovation level is to ensure appropriate testing and procedural tools as well as distributed platforms aimed at integrating and implementing an open production process.
The segment of passenger mobility services, traditionally identified as that of collective transport services, while representing an extremely important economic volume, has always received limited attention from industrial policies and innovation. The same industrial world has turned to this sector more as a market than as an active component of the production world, able to develop innovative solutions that could compete in the global market and generate
199 | P a g e
significant industrial returns. From the technological point of view, the conviction that a lack of innovation both in terms of process and product could be faced in the sector as such (although certainly not in the material components that make it up, such as vehicles) has led to a lack of attention towards the sector by research and innovation policies, strengthening its vision as a component of industrial demand (and innovation), rather than a component of the offer. In fact, from the point of view of innovation, this sector has been almost exclusively looked at from the point of view of economic-financial and legislative restructuring, the reform of the rules and the optimisation of organisation and management. The sector has always lived in a dual contrast with the automotive sector and, in the age of mass motorisation, collective mobility services often have been seen as a residual market in which there were no alternatives to offer, no commercial policies to attract consumers, no market shares on which to compete and value-added services to be realised. The situation is rapidly changing. The future of mobility is emerging in a new way, with new economic conveniences and cultural attitudes, oriented towards use and not possession of the car. Mobility-as-a-service will see cars as one of the means managed by multimodal and integrated service providers to satisfy, in a unified and integrated way with other means, requests of services. Service provider fleets will rise, individual ownership will be residual. A driver will use several vehicles in a short time and each vehicle will be used by a multitude of drivers. Specialisation (urban, extra-urban vehicles, suitable for fog, with different fuelling systems, etc.) and the intensity of use, with reduction of long stops of owned vehicles, will justify the cost of sophisticated on-board systems. The innovation already taking place in the automotive field is coplanar with this future scenario, partly enabling it and partly stimulating it: vehicles are equipped with an increasing number of driver assistance systems, evolving towards automatic driving. The phenomenon is accelerated by inter-volar communication technologies (V2V) and with infrastructures (V2I), for an increasingly effective, complex and pervasive automation. While, on one hand, automotive OEMs themselves will be interested in becoming a provider of mobility services, on the other hand, current operators of collective services could equip themselves (and manage) not only with fleets of collective vehicles, but also vehicle fleets. The very concept of mobility-as-a-service is so intrinsically changing, that it naturally generates a tendency towards convergence between the automotive and mobility services sectors. The degree of technological and management innovation necessary to manage such a transformation and offering truly effective and integrated mobility services is so high that it generates a completely renewed industrial sector. Solutions and technologies developed in this sector will soon be subject of a global competition and will represent a sector of economic dimensions previously unimaginable.
In Campania, the vehicle construction and rail transport systems sector are based around large international OEMs, including Ansaldo Breda and Ansaldo STS, engaged in the construction of rolling stock, signalling, command / control systems and railways supply. These companies employ around two thousand workers in their Campania-based factories and produce an average annual production value of more than 500 million euros. In terms of exports, the sale of railway vehicles (locomotives and other rolling stock) produces an annual turnover of around 30 million euros. In terms of quality, the vehicle construction industry and rail transport systems are characterized by mass transit and regional systems, engineering services, materials, electronic/electromechanical components: thus differentiating themselves from the corresponding supply chains of other Italian regions, including Piedmont (high-speed / regional rolling stock, electronic components), Lombardy (rolling stock, electronic and electromechanical components, traction) , Liguria (high speed, regional carriers, electronic components), Tuscany (high-speed rolling stock, suburban carriers, electronic and electromechanical components), Basilicata (production of signaling components), Calabria (factory,m rolling stock, mass transit cars, high speed and suburban), Sicily (upgrading vehicles).
200 | P a g e
Within the national market of manufacturers of vehicles and services for mobility, the railway sector has nearly 17 thousand employees, for a turnover of over 5 billion euros. As regards Research & Development in particular, the expense is 3.8% of the total turnover and it is estimated that over 500 employees work together, in addition to the technicians dedicated to product development that would lead to a triple increase in the aforementioned value. The extensive and aggressive commercial development policy of the big foreign groups has not allowed to fully exploit the favourable market conditions, due to the liberalization process underway at European level and to the greater demand for rolling stock from the markets, such as those Asians, who have investments in growing infrastructure.
The port and airport logistics sector in Campania is an important component of the regional economic system, not only in absolute terms, but also in relation to the development of other industrial sectors, above all those characterized by high international opening rates (eg automotive, aerospace, food processing, Tac). Such a sizing is ensured by a series of favorable conditions linked both to available infrastructures and to the geographical positioning. There are three commercial ports, two of national level (Naples and Salerno) and one of regional level (Torre Annunziata) and two interports (Nola and Marcianise-Maddaloni). Within this system, it is also possible to return the airport of Capodichino and Salerno. Such equipment and a widespread plants of SMEs allowed the development of local businesses (MSC Cruises; D'Amato di Navigazione; Fratelli D'Amato; Giuseppe Bottiglieri Shipping Company; Grimaldi Group, Marnavi; Michele Bottiglieri Armatore; Perseverance; Rizzo - Bottiglieri - De Carlini Armatori; SNAV, Synergas; Tirrenia) and the attraction of foreign operators (the Conateco container terminal in Naples - joint venture between Cosco Container Lines and Mediterranean Shipping Company; Royal Caribbean; Eurogate; Gesac; GH Naples). These infrastructures and facilities are then associated with the central position that occupies the region with respect to the international maritime traffic in the Mediterranean: Campania can be considered as the main "macro-platform" of southern Italy; with a volume of over 15 million tons of goods in transit, thanks also to the interport nodes, Campania is also performing the role of dry port areas in support of terrestrial intermodality, constituting an essential element of the regional logistics system. The interports of Marcianise and Nola are two well-established realities in the sector, with a total annual movement of around 5 million tons (half a million tons on the railroad) and with the presence of railway relations both with Northern Italy and Central Europe. With the northern Mediterranean ports, the Ports of Naples and Salerno have become the main access gates of the entire central-southern basin for intra-Mediterranean and intercontinental exchanges.
It is worth pointing out that almost 2/3 of the import-export containers in the southern basin pass by the Campania port system. Finally, as element of weakness of the Campania logistics, in addition to some limiting problems due to infrastructures, not always adequately developed, there is the poor integration of its services with the regional production and industrial system. This factor represents a considerable potential for development and improvement, if the organization of production sites, terminals and logistics services were integrated and resolved in a logic of integrated development of the site supply systems. The regional logistics system manages annually over 60 million tons of imported / exported goods - with about 10 million tons of goods in transit and 30 million tons of internal flows – just 4,000 tons are generated by freight traffic in the Naples airport, equal to 10.7% of the total cargo traffic to and from South of Italy, which as a whole is affected by structural limits to cover less than 4% of the total air freight transport flows. Otherwise, as for passenger transport, in the last decade Naples International Airport has increased by around 40%, exceeding the threshold of 6 million passengers and reaching to cover more than 20% of Southern traffic of Italy (including the islands) and 5% of the national one. Even the two main ports of Naples and Salerno continue to record steady growth, around 10% per year in the last three years, in passenger maritime transport exceeding the threshold of 20 million passengers. Among the various traffic items of absolute importance for the port of Naples, it is that relating to the cruise sector. This innovative potential is also supported by the presence in the region of companies specialized in the development of advanced electronic systems and related devices, including photonic fiber
201 | P a g e
optic sensors, monitoring and diagnosing infrastructures, VtoV problems, etc. This technology, based on photonics and micro-electronics, is innovative and potentially revolutionary in terms of performance and consumption: it allows the implementation of autonomous, multi-function and sophisticated detection systems that guarantee advantages in key aspects of miniaturization, lightness, cost, consumption of energy, typical of the railway, road and marine environment. It should be emphasized that photonics is one of the five key technologies recognized by the European Commission as essential to respond to the great challenges of the twenty-first century in terms of safety & security, energy efficiency and improvement of the quality of life.
South Aegean Region
Greece
Opportunities & Obstacles for Transport SMEs - External Megatrends & Transport Concepts of the Future
Opportunities
Local transport SMEs and stakeholders could encounter new developments in the transport sector, discover new funding opportunities, set priorities, be aware of the current EU & national policies / regulations / guidelines and exchange experiences among them and also with other European islands in various conferences and networking activities, such as workshops and stakeholders’ roundtables, organized by the RSA, Dafni network, Aegean Energy & Environment Agency (AEGEA), The Hellenic Institute of Transport and other transport-related bodies or EU-funded projects.
For example, the International Conference on Ports, Maritime Transport & Insularity organised under the auspices of AEGEA is well-placed to consolidate its position as the forum and network for the exchange of knowledge and experience specifically targeted on achieving sustainability of island port activities for the survival of their local communities, viable operation of regional and national tourism, and effective protection of the environment itself.
Another example is the workshop entitled “Transport and Tourism” organized in September 2019 in Rhodes Island by the Hellenic Institute of Transportation Engineers (HITE) in collaboration with the Hellenic Institute of Transport (HIT/CERTH) under the auspices of the South Aegean Region. Through a dialogue between stakeholders of transport and tourism, the workshop explored how the transport sector can be promoted in relation to tourism (and vice-versa), so that the Greek touristic destinations can provide safe and high standard transport services and infrastructures, also taking advantage of the technological developments in the field.
Additionally, the “Ports Maritime Transport & Insularity” International Conference organized in Piraeus and many more events could be utilized to enhance the capacity building of the stakeholders.
Smart Island Initiative is a bottom-up effort of European island authorities and communities. The initiative was the culmination of a number of EU funded initiatives and projects (ISLENET, ISLEPACT, Pact of Islands, SMILEGOV). It builds on years of collaboration between European
202 | P a g e
islands and seeks to convey the significant potential of islands to function as laboratories for technological, social, environmental, economic and political innovation. DAFNI currently coordinates the Smart Islands Initiative. On 2017, 33 island representatives came together in the European Parliament to sign on behalf of over 200 islands the Smart islands Declaration, cornerstone document of the Initiative. The Initiative could be used by the transport SMEs as a vehicle for transition to a low-carbon transport, innovation and sustainability.
The commitment includes:
• Take action to mitigate and adapt to climate change and build resilience at local level
• Trigger the uptake of smart technologies to ensure the optimal management and use of our resources and infrastructures
• Move away from fossil fuels by tapping our significant renewables and energy efficiency potential
• Introduce sustainable island mobility including electric mobility
• Reduce water scarcity by applying non-conventional and smart water resources management
• Become zero-waste territories by moving to a circular economy
• Preserve our distinctive natural and cultural capital
• Diversify our economies by exploiting the intrinsic characteristics of our islands to create new and innovative jobs locally
• Strengthen social inclusion, education and citizens’ empowerment
• Encourage the shift towards alternative, yearlong, sustainable and responsible tourism, inland, coastal and maritime
The Smart Islands Forums bring together organisations that are proven to be the key drivers and delivery agents of decarbonisation on islands, namely island local and regional energy and environment agencies but also island local and regional authorities and their networks. Participants examine also how 4 key EU funding programmes (Horizon Europe, InvestEU, Digital Europe Programme and LIFE) in MFF 2021-2027 can better reflect the potential and challenges facing islands, empowering them to emerge as living labs of the energy transition, digital transformation, circular economy and innovative financing and so embark on sustainable and fair development pathways.
Since 1 January 2019, all residents and businesses based on Greek islands are beneficiaries of the “Road Equivalent Tariff” measure. It is the measure, that seeks to equalize the cost of transport by public transport means from mainland to an island or between islands with the cost that would apply in mainland for the same distance. It is an important transportation subsidy of the Ministry of Shipping and Island Policy (https://metaforikoisodynamo.gr/) for both local citizens and businesses. Airlines are also included in the measure. This measure can boost the competitiveness of local transport SMEs.
Road safety and especially the one targeted for pedestrians, since the islands are the recipient areas of large number of tourists, is a major opportunity for the local authorities. Innovative solutions such as the 3D pedestrian crossings in Tinos can be a measure to be implemented by other municipalities as well (https://www.drive.gr/news/ellada/i-tinos-apektise-trisdiastates-diabaseis-video).
Obstacles
Most small businesses, due to reduced demand and a simultaneous increase in taxation, face severe liquidity problems and limited access to finance to fund current operations never mind investments. Another major problem that transport related SMEs have to face is lack of infrastructure and more importantly the driving culture that exists in many areas throughout Greece and the RSA. Greece constantly occupies one of the worst places concerning road safety among the 28 EU member states. Road accidents form the most serious life-
203 | P a g e
threatening factor to tourists during their holidays in Greece (Petridou et al., 1997). In touristic places, like Cyclades and Dodecanese, the accidents are increased through the summer months mainly involving two-wheeled vehicles (52%). Most of the victims (injured or dead) are between ages 25 and 44 (source: Greek National Statistical Authority).
Lithuania
Lithuania
Opportunities & Obstacles for Transport SMEs - External Megatrends & Transport Concepts of the Future
Innovation Potential in Transport Sector
According to the Global Innovation Index 2018, Lithuania is ranked 40th among 126 countries. However, neighbouring countries are ranked a bit better: Estonia is 24th, Latvia is 34th, and Poland is 39th. Lithuania’s best evaluated properties are: a) Mobile app creation (3rd); b) Female employed with advanced degree (5th); c) Pupil-teacher ratio, secondary (8th). Besides that, there is also a European Innovation Scoreboard 2018. According to it, Lithuania is in 20th place among 36 countries and is considered to be a moderate innovator.
Despite this mediocre position, during the period of last 8 years, results of Lithuania have increased the most among evaluated countries in Europe. Despite these mediocre results, Lithuania transport sector innovation potential is very high. There are three universities in Lithuania which have study programs related to transport sector. Vilnius Gediminas Technical University has separate faculty of transport engineering, together with 5 departments. These departments are subdivisions of faculty of transport engineering.
Central areas of research in these departments are traffic safety, experimental research of engines, fuels, research related to automotive exploitation, safety systems, marketing and management, IT and intelligent transport systems, automation, green logistics, research on railway infrastructure and equipment. University also has separate Antanas Gustaitis’ Aviation Institute, which also has 5 departments. Entire faculty is devoted for education and research for aviation sector.
All the research in this faculty and its departments are related to aviation technologies, engineering, and piloting of aviation. To carry out research in such a broad spectrum of spheres, university has a wide range of technological infrastructure which is also constantly updated. Besides that, university also develops international academic relations as well as fosters institutional cooperation with business entities and public establishments. University community is very active by participating in international research programs, students together with lecturers carry out various research projects, of which couple are related to electro mobile and automobile sliding systems.
Klaipėda University is another higher education institution active in transport sector, particularly in water transportation. University faculty of Marine Technology and Natural Science has
204 | P a g e
Department of Marine engineering. Department offers bachelor and master degree studies in the fields of sea ports, ships, marine transport engineering, maintenance of transport means and other infrastructure. There is also a doctoral studies of transport engineering which focuses on “green” shipping. University academic community also participates in maritime industry research programs, related to optimisation of logistics, implementation of ICT, energy efficiency and environment. Faculty community is also exceptionally active in the sphere of scientific publications. Third technology orientated higher education institution is Kaunas university of Technology. Faculty of Engineering and Design has Vehicle Engineering study program. University has high level infrastructure of laboratories. Research is carried out using: aerodynamic tube, dynamic parameter detection equipment DL, power system and electronic control unit stands, non-destructive control defectoscopes and so on. All in all, higher education infrastructure in Lithuania is quite high.
There are three universities which specialize in different spheres and covers the entire transport sector. However, it should be mentioned, that most attention is paid to road transportation, which is mostly developed in Lithuania. Besides higher education institutions, innovation is also fostered by science and technology parks. 7 of them are located in the biggest Lithuania cities: Vilnius, Kaunas, Klaipėda and Panevėžys. In general, all of them seek same results: stimulates the dissemination of scientific knowledge and technology, create conditions for commercialisation of research results, promote business and science cooperation, encourages culture of innovation. However, only one park indirectly mentioned transport sector as one of their activity spheres. Klaipėda Science and Technology park provides specialized services in the areas of green and blue (marine) technologies, which we
have established as their leading priorities. At the same time, park also participate in two Interreg Baltic Sea Region Europe projects related to transport (Development of freight transportation and logistics services by strengthening inland waterways and river-sea transport; Value chain for Clean Shipping, Green Ports and Blue Growth). Despite it, transport SMEs can contact any science and technology park and attaint all services, that park can provide.
All in all, country has fairly developed infrastructure. Universities, science and technology centres together with other public research institutions include basically every sphere of transport sector. Considering rising demand from business side due to the rising internal and global competitiveness and required infrastructure, Lithuania scientists have a big potential to create high added value transport innovations. However, there are also some issues, which can have negative impact and have to be solved. Science and business cooperation in Lithuania is relatively low, while business expenditure on R&D activities is insufficient. During the period of 2014-2017, in all business sectors, there were only 11 registered science and business patents, while during 2017, there were only 28 common science and business publications. Another challenge to the potential of innovations is that there is no research centre consolidating research programs for the entire sector. Third challenge is education system in general. Secondary education in Lithuania has to overcome issues such as shortage of competent teachers, differences between education in regions and bigger Lithuania cities, issues related to students’ competencies especially in exact sciences. Higher education also suffers from some of the challenges: even though situation is getting better, majority of students in Lithuania tend to choose study programs which are not in demand on the labour market, while at the same time higher education is ineffective and some study programs are low quality.
Consolidation of universities is planned; however it heavily depends on politicians and other interest groups, which are interested to save these ineffective and low quality education institutions. This issue is relevant to transport sector, which in order to stay competitive has to find personnel with appropriate competences to create and implement innovations and new technologies.
Opportunities & Obstacles for Transport SMEs – as emerging from External Megatrends
205 | P a g e
Future transport sector and logistics development will be influence by these trends:
1. The flow of passengers and freight transportation volumes together with cargo handling volumes are increasing worldwide;
2. Share of people living in cities is increasing and it results in uneven road infrastructure congestion and growing traffic jams;
3. Environmental pollution and greenhouse effect are increasing;
4. Third countries lead to increased competition and lower prices. Therefore, innovation in transport and logistics becomes important for maintaining competitiveness
Due to these international trends, which are also visible in Lithuania, consumers and society expectations for quality of services, safety, greener and faster transportation are constantly growing. These international developments lead to some obstacles and at the same time, creates opportunities for transport companies.
Environmental trends worldwide open opportunities for transport SMEs. Transport represents almost a quarter of Europe's greenhouse gas emissions and is the main cause of air pollution in cities. The transport sector has not seen the same gradual decline in emissions as other sectors: emissions only started to decrease in 2007 and still remain higher than in 1990 (see graph below). Within this sector, road transport is by far the biggest emitter accounting for more than 70% of all GHG emissions from transport in 2014. Situation in Lithuania is relatively similar to these European trends. During 2016 in Lithuania 20,1 million tones of carbon dioxide was emitted into environment. Most of this gas, 57%, was emitted by the energy sector, whose main source of pollution was transport - as much as 48%. Compared to 2015, transport increased the most, by more than 7%. In this sector, which includes road, rail, air and inland waterway transport, road transport is the largest contributor (95%). The largest contributors to pollution in road transport are passenger cars (almost 60%) and heavy vehicles (36%). As well as being leading source of carbon dioxide, transport is also responsible for a large proportion of urban air pollution. An estimated 3.7 million premature deaths are attributed to ambient (outdoor) air pollution, based on WHO data from 2012. Both, European and Lithuanian strategic documents include environment problems as an issue which has to be solved by using alternative energy sources and other measures. “Lithuania National Development Strategy 2014-2020” together with strategy “Lithuania 2030” and Smart Specialisation Strategy includes some policy measures to encourage alternative fuels, develop electric and other alternative transportation. It opens opportunity for transport related SMEs in Lithuania to join this trend and be one of the leading actors in the region. Already some of the most innovative companies in Lithuania are producing innovative products in regards to this problem. Use of the electricity in transport sector is encouraged by creation of various electric transport components. For instance, company “CHRG Network” is creating a platform, that will facilitate the efficient use of the charging stations infrastructure by allowing electronic vehicles charging stations owners to connect, share and earn passive income from their charging stations and provide the drivers as easy way to find, book and pay for the access (it will work as AirBnB for EV). Another interesting project in relation to alternative energy is being implemented by company “Elinta”, which created charging stations for electric cars, which will allow optimal use the power, supplied to the station.
Another major trend is growing globalisation which is especially important in regards to transport sector. Due to the internationality of transport sector, it is important for enterprises to be flexible and innovate in order to stay competitive. However, transport systems of any country do not fit into the national geographical framework. In the context of globalisation, international transport and distribution chains and transport corridors are becoming more important than ever. Government of Lithuania together with neighboring countries develop and implement projects which will improve the network of transport corridors passing thorough
206 | P a g e
Lithuania. It will benefit transport related SMEs by integrating them into global trade networks. Related to the question of transport networks, traffic jams are also global trend which is becoming more important in Lithuania. Urbanisation grows vey fast and future forecasts predict, that in 2025 75 percent and in 2050 85 percent of all Europe population will live in cities. These trends are also visible in major Lithuanian cities. In addition to increasing population, major cities are also crossed by the TEN-T highway which creates relatively big traffic jams. Even though, they are not as big as in other EU countries, Ministry of Transport and Communication of Lithuania emphasize the financial losses for carriers and state. On the one hand, it can be looked as an obstacle, however at the same time it opens opportunities for transport related sector companies to develop and use new intermodal regional and national transport and logistics networks, engineering solutions and infrastructure. In case of this issue, Lithuanian companies are also active and create new innovative solutions. Various companies in Lithuania are developing transport monitoring and management systems, which will allow to optimise transport operations on the go and be more efficient. Lithuanian cities are also aware of new trends and seek to improve their public transportation management, parking systems and various management systems.
In relation to rising globalisation, urbanisation and increasing concerns about cities, smart, sustainable and integrated transport development is one of the future trends. The estimated annual turnover for this segment will be between $ 90 million and $ 130 million. US $ in the next 10-15 years. In order to develop this segment, technologies such as internet of things, positioning systems and data transmission, intellectual transport systems, route planning technologies, and instruments for forecasting and visualisation of transport flows will have to be developed. During the evaluations of companies that innovative in these technological spheres, observations were made that enterprises are well prepared ang have huge growth potential. Since 2014, there are 23 new start ups in this sphere while already existing companies successfully participate in international project. It was also noticed that the number of companies in the field of vehicle manufacturing involved in global added value chains is increasing in Lithuania. Last but not least, economic evaluations also predict high potential: the turnover of companies producing these technologies is growing (form 82 million euros in 2014 to 95 million euros in 2016); average value added per employee is 31 thousand euros, investment for R&D activities is 2,88 million euros.
Other important worldwide trend is related to transport corridors and its effectiveness. In order to be at the front of these trends, Lithuanian companies have to form and join various networks, which would seek to develop and implement: a) innovative models for managing international transport corridors and global logistics networks; b) processes that ensure a smooth transition from current closed supply chains to open supply chains that are accessible even to small businesses. Required technologies for these changes are: transport and logistics safety technologies, multimodal transport platforms and technologies, long distance transport technologies. Such changes should reduce unladed driving time and distance, reduce vehicle pollution and the need for energy resources. All this should allow Lithuanian transport and logistics companies not only to become involved in the existing global supply chains, but also to form new ones. All this is particularly relevant in this context: according to an international study, cargo flows in the Baltic region from east to west could double by 2030 compared to 2010. Lithuanian science and transport business are very active in this sphere: 22 Horizon 2020 projects are carried out in regards to these technologies, start ups in this sphere are evolving. During S3 evaluations, 11 companies that innovate in this sphere were evaluation and results are very positive: turnover in 2016 pursued 575 million euros, added value was 32 278 EUR per employee while investments for R&D activities were 297 thousand EUR.
Despite all opportunities, Lithuania transport sector in the future could also face some obstacles. Education system in Lithuania is undergoing consolidation phase and there are still high levels of uncertainty about certain higher education institutions. This process is especially relevant in regards to the amount of qualified labor force, particularly in Klaipėda Seaport were
207 | P a g e
majority of labor force were prepared in Klaipėda University, which specialises in water related spheres. There is possibility to have problems with higher qualification employees, however, same can be said about lower qualification labor force. As mentioned above, Lithuania population since the restoration of independence decreased by about 1 million and migration still remains on the major issues. According to Lithuania Labor Exchange statistics, among the most demanding professions in Lithuania was heavy trucks and trucks drivers and vans drivers which could work in transportation sector. Lack of labor force in transport sector of Lithuania is one of the major issues, and it is even more escalated by the fact that Lithuania migration policy is unfavourable to attract labor force from third countries. In order to employ employee, for instance from Ukraine, takes about 6 weeks, while in Poland this process is much faster (around 2 weeks). There should be more cooperation between politics and business representatives to solve both, education and immigration, problems.
Another emerging worldwide trend is protectionist policy. USA new political establishment emphasize that international economic order is unfair to its population and even started lite trade wars with China and EU. Taking into consideration that Lithuania is a part of European Union, large scale developments of trade wars could be harmful for Lithuania transport sector. Increased costs can lead to the situation when business won’t devote as much money to R&D and innovation as they could if trade wars had not happened. It is also worth mentioning internal EU transport policy dynamics.
There are deliberations coming from old EU member states, that transport companies from eastern part of Europe, especially road transport, raise competitiveness problems for their companies operating in transport sector. One of the possible suggestions are changes to payroll rules, which would be in favour for Western Europe transport companies. These ideas coming from old EU states can be considered protectionist and reduce competitiveness not only for Lithuania companies, but overall, EU economy as a whole.
South-West Oltenia
Romania
Opportunities & Obstacles for Transport SMEs - External Megatrends & Transport Concepts of the Future Regional Innovation Potential According to the Regional Innovation Scoreboard 2017, SWO is a ‘Modest – Innovator’, with innovation performance decreasing significantly over time.186 RIS 2017 has scored SWO’s performance in several indicators, allowing the analysis of the region’s strengths and
186 https://ec.europa.eu/growth/tools-databases/regional-innovation-monitor/base-profile/south-west-oltenia
208 | P a g e
weaknesses. The Regional Innovation Index (RII) in 2017 was 0.106 (a -10.3 RII change between 2011 and 2017), 70.2 relative to Romania and 23.3 relative to the EU. With an average score of 0.136, the region has seen its best performances in the following indicators:
• Exports of medium and high-tech manufacturing (normalised score of 0.881, 148 relative to Romania and 139 relative to the EU);
• Most-cited scientific publications (normalised score of 0.342, 95 relative to Romania and 63 relative to the EU);
• Tertiary education (normalised score of 0.289, 89 relative to Romania and 53 relative to the EU).
On the other hand, the region’s weaknesses are related to the following indicators:
• Product/process innovations (normalised score of 0.000);
• Marketing or organisational innovations (normalised score of 0.000);
• SMEs innovating in-house (normalised score of 0.000). Research & Innovation Infrastructure According to the RIS3 for the SWO region, the following research-development-innovation suppliers operate in the region: 187
• National Institute of Research and Development for Cryogenic and Isotopic Technologies - ICSI Râmnicu Vâlcea;
• INCD and TESTING FOR ELECTRICAL ENGINEERING - ICMET Craiova;
• National Institute for Research and Development on Energy modernization - INCD for Energy-ICEMENERG;
• Design & Research Institute in aeronautical field in CPCA SA - Craiova;
• Institute for Systems Analysis INAS SA - Craiova;
• Institute for Industrial Development Ecological Development ECOIND - Valcea Branch, Râmnicu-Vâlcea;
• Institute of Cryogenics and Isotopic Separation Râmnicu Vâlcea;
• National Centre for Hydrogen and Combustion Pumps Research in Râmnicu Vâlcea;
• IPA-Craiova – Automation Engineering & IT Design Institute
• SC APPLIED SYSTEMS SRL;
• Inventions Implementation Centre - Craiova;
• Centre for Innovation and Technology Transfer – CITT Craiova;
• INDAELTRAC SA – research, design and manufacturer of electronic power equipment - Craiova;
• INDA SRL - Research and Development Institute on power electronics and control equipment based on microcontrollers – transportation Craiova
Universities: University of Craiova; University of Medicine and Pharmacy of Craiova; ‘Constantin Brâncuşi’ University of Targu Jiu; Companies: Artego SA Tg. Jiu, Popeci Craiova, Softronic Craiova.
187 http://s3platform.jrc.ec.europa.eu/regions/RO41/tags/RO41
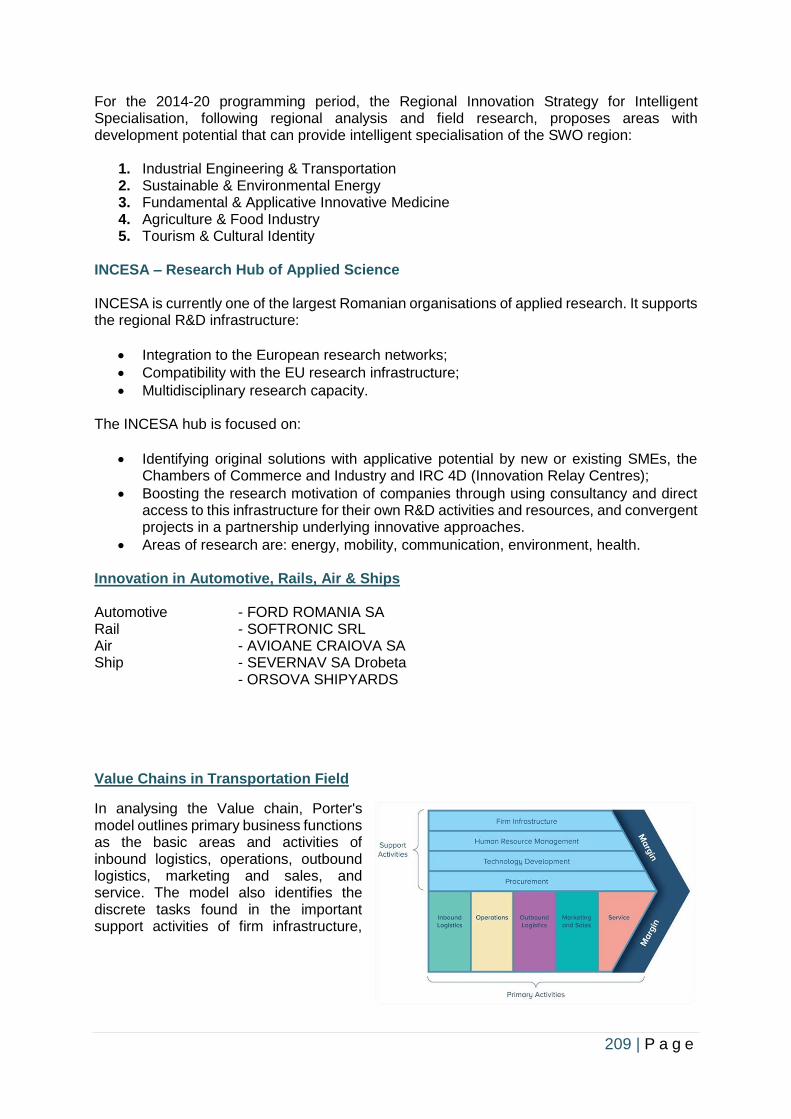
209 | P a g e
For the 2014-20 programming period, the Regional Innovation Strategy for Intelligent Specialisation, following regional analysis and field research, proposes areas with development potential that can provide intelligent specialisation of the SWO region:
1. Industrial Engineering & Transportation 2. Sustainable & Environmental Energy 3. Fundamental & Applicative Innovative Medicine 4. Agriculture & Food Industry 5. Tourism & Cultural Identity
INCESA – Research Hub of Applied Science INCESA is currently one of the largest Romanian organisations of applied research. It supports the regional R&D infrastructure:
• Integration to the European research networks;
• Compatibility with the EU research infrastructure;
• Multidisciplinary research capacity. The INCESA hub is focused on:
• Identifying original solutions with applicative potential by new or existing SMEs, the Chambers of Commerce and Industry and IRC 4D (Innovation Relay Centres);
• Boosting the research motivation of companies through using consultancy and direct access to this infrastructure for their own R&D activities and resources, and convergent projects in a partnership underlying innovative approaches.
• Areas of research are: energy, mobility, communication, environment, health. Innovation in Automotive, Rails, Air & Ships Automotive - FORD ROMANIA SA Rail - SOFTRONIC SRL Air - AVIOANE CRAIOVA SA Ship - SEVERNAV SA Drobeta - ORSOVA SHIPYARDS
Value Chains in Transportation Field
In analysing the Value chain, Porter's model outlines primary business functions as the basic areas and activities of inbound logistics, operations, outbound logistics, marketing and sales, and service. The model also identifies the discrete tasks found in the important support activities of firm infrastructure,
210 | P a g e
human resources management, technology, and procurement. 188
Fig. 78: Value Chains Diagram
Key Players in Value Chains
Manufacturers:
- FORD ROMANIA SA - motorcar - major global manufacturer
- AVIOANE CRAIOVA SA - aircraft - national manufacturer (esp. military)
- SEVERNAV SA - ships - regional sea ship and inland ships manufacturer
- PIRELLI TYRES ROMANIA SA - tyres - major global manufacturer
- SOFTRONIC SRL - trains - national manufacturer
- NEXTROM INDUSTRIES SRL - light electric vehicles - national manufacturer
The Acquisition of New Technologies The acquisition of new technologies in the Transport-SME sector is low. 68.1% of SMEs say they have not made any new technology acquisitions, only 21.2% have purchased new technologies, while 9.7% have made acquisitions. The share of Transport-SMEs that declare that they have not acquired any technology outpaces those who have bought technology or have made some partial acquisitions, regardless of the main activity sector. However, the largest share of Transport-SMEs that have acquired new technologies is found in the Industry sector. Introduction & Certification of the Quality Management System Certification of quality management system has important business benefits, namely: improved quality awareness, increased clarity of company responsibility, leading to increased employee engagement, internal efficiency, improved company image, attracting new customers and gaining their trust, facilitating participation in the value chain, tenders, simplifying export procedures and, last but not least, leading to an improvement in the company's market position. The certification of the management systems (ISO 9001 quality, the environment - ISO 14001, HACCP, OHSAS 18001, information security, etc.) and the certification of products are decisive factors for increasing the competitiveness of Transport-SMEs and the free movement of goods / services in the region, on the Romanian market, as well as on international markets, especially on the European Union space. If the introduction of the quality management system is perceived as a necessary passport for companies when selling their products and services on export markets, with the completion of the process of accession and integration in the European structures, the process of taking over the European standards and the implementation will have to be in the centre of major efforts done by Transport-SMEs in the SWO region.
188 Source: Michael Porter – ‘Competitive Advantage: Creating and Sustaining Superior Performance’
211 | P a g e
In other words, the quality becomes a key condition for Transport-SMEs to exist in the SWO region, in Romania, in Europe or in the international markets, in order to meet the demands of a global market. Considering the premises outlined above, the research aimed to highlight the extent to which Transport-SMEs are concerned about these issues of alignment with European and international standards in the perspective of integrating themselves into the value chain. The State of Introduction of the Quality Management System The introduction of quality management remains a major challenge for the absolute majority of Transport-SMEs, as 78.2% of SMEs say they have not introduced this system. The results show that the quality management system was introduced in 12.0% of SMEs. Only 7.6% of the interviewed enterprises are undergoing this process. This is even more worrying, all the more so since the integration process in the EU has already 12 years from the moment of Romania’s joining the EU (1st of January 2007). Transport SMEs have been able to meet these standards to a small extent. Their successes are below the average of the sector. The results of the survey highlight the fact that only 18.6% of the Transport-SMEs in the industry have obtained the certifications for the introduction of the quality management system, as a result regarding the competitiveness of the 73.1% of SMEs that failed to do so in the context of integration into the domestic and International Market. The data reveal that there is a direct correlation between the SME size category and the success in introducing the quality management system are respected. Given that management and quality assurance will become sine-qua non conditions for operating on the Internal and European market, and in the perspective of the international value chain, it is clearly evident that smaller SMEs remain the most vulnerable, closer to the disappearance on market. The detailed analysis of the categories of certifications obtained by SMEs highlights the following:
• Even though 12% of Transport-SMEs in SW Oltenia have managed to introduce the quality management system, they have obtained these certifications mostly in the standard category and are much left behind in the environmental management category. Thus, most certifications (75.3%) were obtained in the standard category (i.e. ISO 9001), while only 4.7% of SMEs obtained environmental management (ISO14001) certifications.
• Transport-SMEs, irrespective of the specific industry, have obtained to a very small extent environmental management certification (ISO 14001). Transport-SMEs that have succeeded in introducing the quality management system irrespective of the sector of activity fall into the general feature mentioned on the whole, obtaining certifications from the standard category in proportions ranging from 100%, in the case of SMEs in Transport, to 75.1 % for Industry and 71.9% respectively for those active in other services.
• By size classes of SMEs, there are no significant differences compared to the general features outlined above. The data also show that there is no direct correlation between the size of SMEs, the fields of activity and the degree of introduction of higher-end and environmental management. Thus, small SMEs reported 6.9% introduction of ISO14001, while only 4.3% of the middle-sized companies managed this. This proves that all SMEs, regardless of their size class, are quite slow in obtaining these certifications either because they are not sufficiently informed or are still deficient in the entrepreneurial approach to business development.
Participation in the Value Chain
212 | P a g e
The Degree of Participation in the Value Chain The absolute majority of the interviewed Transport-SMEs are not involved in the public procurement process. On the whole of the sector, the share of those who declared that they did not participate in any public procurement process amounted to 85.1%, while only 14.3% had the opportunity to participate. For the Transport sector, the lowest percentage of SMEs participating in the value chain / public procurement is recorded. There is a direct positive correlation between the SMEs size category, the field of activity and the participation in the value chain. Smaller Transport-SMEs have had a low participation in the value chain, while larger SMEs have increased chances. Thus, only 13.3% of smaller SMEs participated in public procurement processes, increasing to 20.0% for small and 30.2% for medium-sized SMEs, respectively. The analysis highlights the fact that the position of subcontractor is even more inaccessible to Transport-SMEs. In other words, if they do not compete directly in the value chain public procurement process, they also reduce their chances of going to the trailer of larger contractors. Only 7.4% of Transport-SMEs said they had a sub-contractor position in the process of supplying the public orders. Medium-sized SMEs were slightly more likely to get a sub-order than small SMEs. However, the general note remains inaccessible. Participation of Regional Transport-SMEs in the International Market Trade relations of Transport-SMEs on international markets Very low participation of regional Transport-SMEs on the international market. 10% of SMEs participated in the international market as importers, only 6% exporters and 6.9% as sub-contractors of some companies. Most of the interviewed firms said they did not participate in the international market (80.1%). On this overall background of low participation, however, Transport SMEs in specific industry are taking the lead in international markets as exporters. Another characteristic is that the number of Transport SMEs in the specific industry participating in the international market as an exporter (17.6%) outnumber the number of those who participated as importers (16.7%). As expected, sectoral analysis illustrates significant differences. Another characteristic is recorded among the SMEs in Transport (14.1%), shows higher shares than the total, taking part in international markets as subcontractors of foreign companies, a phenomenon known as outsourcing. Participation in international markets viewed from the perspective of the size class of SMEs shows a cleavage between small SMEs and those of middle size. The results of the survey highlight the fact that Transport-SMEs in the region of SW Oltenia are not trained and, ultimately, are not able to capitalize on the advantages of economic globalisation, and they remain predominantly oriented towards the Romanian market of goods and services. Obstacles encountered by Transport-SMEs as exporters A mix of obstacles to exporters. Among these, the most commonly mentioned were – insufficient information on external markets, 28.2% of the respondents, plus the lack of capital to act on external peaks and financing for export activities (20.8%). It should be added to these findings that a significant number of companies do not know the obstacles that made their international markets impossible (25.3%).
213 | P a g e
In the business activity structure, it can be noticed that the lack of information on external markets is a major obstacle for the Transport-SMEs in the commercial intermediation sector (48.1%), while the lack of capital and financing was the most important obstacle for Transport and Logistics (64.9%). The lack of qualified expertise and skills was an unbeatable barrier for Transport-SMEs because 76.2% of firms in the sector have invoked this cause. For industry firms, the causes of more difficult access to foreign markets are multiple. Regardless of the size category, there are several causes that have led to so low participation of Transport-regional SMEs in the value chain as well as in the international markets. Automotive Industry in SWO Region A brief presentation on SW Oltenia region’s Automotive Industry in the last decade is presented. SW Oltenia region’s automotive industry has grown rapidly since 2000, with sales of 180,927 units in 2004, up from 84,170 units in 2000. Overall, in 2018 Ford Romania Company 189 manufactured more than 141,000 cars in Craiova plant. Thus, Romania’s automotive industry produced more than 480,000 assembled cars in 2018 (of which the other company Dacia-Renault manufactured more than 340,000 assembled cars). Ford Romania Company recently announced that it will manufacture more than 250,000 cars in 2019. Ford Romania Company is also manufacturing state-of-the-art Eco Boost engines in Craiova (gasoline direct-injection turbocharged engine technology). Over the period 2012-2018 Ford Company manufactured 1,000,000 Eco Boost engines in Craiova Engine Factory. Currently, Ford Romania Company has 4600 employed persons. In order to manufacture a new car model, Ford plans to hire another 1700 persons over 2019, thus reaching the level of 6300 persons employed in Craiova Plant. Ford Motor Company will start production of the new Puma model at its assembly plant in Craiova, Romania, in the second half of the year 2019. "Puma will go on sale at the end of the year 2019, and will be produced with exceptional craftsmanship and quality following nearly 1.5 billion EUR ($1.7 billion) investment since 2008," Ford said in a statement. Ford Puma is an SUV-inspired compact crossover that features a 48-volt mild-hybrid powertrain technology. Ford Romania announced that is investing up to 200 million EUR ($235 million) and adding 1500 jobs to manufacture a second type of vehicle at the Craiova plant, in South-West Oltenia region of Romania. Puma is in addition to the Eco Sport small SUV currently built in Craiova, plus Ford’s 1.0‑litre Eco Boost engine. Ford Company started Eco Sport SUV production at Craiova following a 200 million EUR investment in October 2017. In October 2018, Ford inaugurated its first European Resource and Commitment Centre in Craiova following a 1 million EUR investment made over four years. Ford entered Romania in March 2008 when it wrapped up the acquisition of a 72.4% stake in Automobile Craiova, the sole owner of car maker and distributor Daewoo Automobile Romania. Ford Craiova plant has a capacity of approximately 300,000 cars a year. But to get to this production volume, the car maker has to make sure that the road infrastructure will enable the transport of motorcars and components in and out the factory, and from Craiova factory to Europe. Ford's biggest challenge is logistics in Craiova factory, i.e. access to production facility, as road infrastructure is not good as it should be. The carmaker has access to the rail, but the authorities in the region and the government must improve the road infrastructure to get to the factory. This would help also the component suppliers. When infrastructure is poor, suppliers are avoiding coming. Therefore, the objective for Craiova plant is to have a better road infrastructure. Ford Craiova factory is efficient, has very good employees, an efficient
189 https://www.ford.com/ro/
214 | P a g e
management team, massive amounts of money has been invested in Craiova plant to bring it to Ford Motor Company standards. The combination of well-trained employees, quality management and investments made by Ford make the Craiova plant one of the most efficient factories of Ford Motor Company. The automotive industry has been one of the most profitable sectors of the Romanian economy in recent years. Much of the Romanian manufacturing industry consists of branch plants of foreign firms, located in SW Oltenia region as well. SW Oltenia region has a growing automotive cluster with a network of suppliers and components manufacturers. Most of the Romanian suppliers work in joint ventures with foreign partners, the Romanian party providing production facilities, utilities and engineering services, while the international car manufacturers bring in their brand, global know-how and services. These joint ventures produce for both the domestic market (e.g. for Ford Romania) and the overseas markets. The potential for development of the automotive manufacturing industry is higher in South-West Oltenia than in the other regions of Central and Eastern Europe. To become more competitive, the regional SW Oltenia‘s automotive sector will have to continue to rely on foreign direct investment. OEMs and Key Suppliers Ford: In October 2007, Ford Motor Company purchased the Korean carmaker Daewoo Automobile Romania factory in Craiova, Romania. As of 2011, Ford Europe’s plans were to manufacture three vehicle models in Craiova: the light utility vehicle Transit Connect, a small class automobile, the B-Max, and a medium class sport utility vehicle, i.e. the next generation Ford Puma, which will target the European market. Ford representatives announced that they would continue to invest in the Craiova subsidiary despite having to adjust the business plan and production targets in light of market conditions. By 2013 the Craiova factory completed the installed production capacities which are able to produce now 350,000 cars per year. Automotive Supplier Base The current situation provides new opportunities for suppliers of all tiers to the Ford manufacturer in Craiova. Ford has attracted and continue to attract significant investments in the auto components industry, as suppliers seek to locate nearer these assembly facilities. For the auto components manufacturers, the presence of this carmaker in SW Oltenia region is extremely beneficial: Ford announced ambitious plans for the future: a production capacity of 300,000 cars and 150,000 engines in 2020. Car Part Industry The car part industry in SW Oltenia region took off in an impressive way after the 2007 Craiova Plant takeover by Ford. Since then, a number of traditional part suppliers for Ford have started investing in Romania. Over the last few years, US and EU companies have started investing in both the Craiova manufacture and its environs, companies that supply parts for the car plant. They are names such as Johnson Controls, Bamesa, Kirchoff Automotive, Autoliv of Sweden, Leoni Wiring Systems and Gestamp Automocion. Component makers already present in SW Oltenia became Ford’s suppliers too, such as Magnetto Wheels, based in Dragasani, in Valcea county, which makes rims. Major Japanese manufacturers have placed investments throughout the country, including SWO region. Recent Investments
215 | P a g e
One of the major investments was made by Japanese wiring harness company Yazaki in Caracal, in SWO’s Olt County. The Japanese company invested more than 10 million EUR in a new plant located within a former textile factory where it has leased 6,000 square meters. Olt County was also the site of a larger investment by a Ford supplier: plastics and automotive interior manufacturer IAC Romania. Located in the town of Bals, the value of the investment is estimated at 58 million EUR. Pirelli has built the 2nd production facility in Slatina, Olt county, worth app. 250 million EUR. In addition to the major vehicle manufacturer currently producing in SW Oltenia region, there are as well several other companies that could be considered potential suppliers to the vehicle market (car or truck) as manufacturers of auto parts, sub-assemblies and components. Most of these Romanian firms are small enterprises and in the area of metalworking, and plastic and rubber components. An overview of SW Oltenia region foreign trade in the automotive area shows increased exports of auto parts. Exports include tires, cabling, steering wheels, safety systems, car seats and upholstery, connectors, tire cords, and generally any part that involves a significant amount of labour, or anything that is unprofitable to manufacture in other countries. The passenger car industry is the most important segment of the market, with 80% of total sales in 2004. Vehicles manufactured in Romania accounted for 67.5% of total sales in 2004 (down from 92.9% in 2000). In 2013, the recorded exports had a value of 2.97 billion EUR, on increase by about 17% as compared with the values registered in 2008. The main sections of export products that represented 78.1% from the exports of the region were: vehicles, aircrafts, vessels and auxiliary transport equipment, machinery and devices; electric equipment and components. Relatively low labour costs, and unimpeded access to the European automotive market are some of the main reasons for the relatively high penetration of foreign firms into Romania’s automotive subsector, including auto parts. Overall market review The auto industry employs 3.5% of workers in the manufacturing sector. Romania has different customs valuation rules for new and used motor vehicles, including cars, all-terrain vehicles, trucks, motorcycles, and trailers. Romania has revitalized its automotive industry, mainly by attracting foreign direct investment, through inter alia, incentive schemes, including state aid granted to Dacia and Ford. Given these developments, the car industry in SW Oltenia region will witness a major boost over the next year, ACSEE reports. 190 SW Oltenia region’s role in the European automotive industry As production was moving towards Eastern European countries, SW Oltenia region’s role in automotive industry has steadily increased. This was possible based on the following factors: Romania had and still has one of the lowest production costs in Europe; investment in production facilities in Romania leads to a stronger market presence in Europe for non-European companies and presence in Eastern Europe and proximity of ex-Soviet countries for European and non-European companies. Opening car production and automotive parts in SW Oltenia region increased competition and lead to continuous price reduction in the small and
190 https://acsee.iafor.org/ - Asian Conference on Sustainability, Energy & the Environment
216 | P a g e
medium car segment. Ford continuous process of cutting costs (through models made in Craiova) increased the operation in Romania in order to stay competitive. Research and development A big amount of R&D is outsourced by foreign companies to local subsidiaries opened in Romania. Ford has started to outsource some of its R&D activities to suppliers and many foreign suppliers have established R&D and production activities in SW Oltenia in order to meet Ford’s demand. In the commercial vehicle industry sector there was no globalization of the vehicle production though some attempts were made to sign strategic collaborations with important foreign companies. The present Romanian production of commercial vehicles is low and strictly oriented to the local market. Increased competition from abroad has reduced significantly the sales of Romanian commercial vehicles. Large commercial vehicle producers were considering the possibility to open production facilities in SW Oltenia. Exploring the possibilities to find suppliers in SW Oltenia, these initiatives provide opportunities for Tier 1 suppliers to start operations in the region. Supplier sector The Romanian car parts industry has experienced rapid expansion over the last five years as several large foreign parts producers established production plants in the country. The automotive industry in Romania has two large foreign vehicle makers, Ford and Renault. Numerous parts production plants have opened in to support these facilities. 58% of spare parts used by Ford were domestically produced, and Ford co-operated with 226 Romanian producers who supply more than 1,000 parts. The SW Oltenia region’s automotive supplier sector has followed the evolution of car makers in Romania. The major car production facilities located in Pitesti, Craiova, Brasov and Bucuresti has concentrated most of the supplier companies. These companies had to face the changes car producer went through. Before 1990 all suppliers were producing for national car makers in Pitesti, Craiova, Brasov, Bucuresti, Campulung and Timisoara. When Romania started to open to foreign investors, a lot of Western European and international automotive suppliers have open subsidiaries in Romania based on the existence of a relatively skilful and cheap working force. The current situation provides excellent opportunities for suppliers of all tiers. Ford is partly looking for a new supplier network, and Daimler will also be looking for low-cost but good quality suppliers to support their strategy. Currently, the Romanian automotive industry consists of a limited number of players (as compared, for example, with Poland). Ford Company in Craiova has set-up an industrial cluster of Transport (automotive) SMEs within Ford Plant Area: -Johnson Controls (USA), -Lear Corporation (USA), -Kautex (Germany), -Magna (Canada), -Faurecia (France), -Handling & Lager (Spain) etc. Shipbuilding industry in SW Oltenia region SEVERNAV S.A. SHIPYARDS
217 | P a g e
S.C. SEVERNAV S.A. in Drobeta-Turnu Severin191 is a household name in ship building for over 150 years. The main business activity of SEVERNAV S.A. is building new seagoing and inland ships of various kinds. The shipbuilder also offers standard repair programs for ships, damaged ship repairs, retrofitting and ship conversions. This naval shipyard, located in Drobeta Turnu-Severin, on the left bank of the Danube, is ready to receive customer fleet for a wide range of repair and maintenance works. Product range:
• Inland /Estuary: passenger ships, chemical tankers, gas carriers, general cargo ships
• Offshore - Support vessels, Exploration vessels, Construction ships
• Seagoing - Container ships, Multipurpose Container vessels; Tanker ships; Bulk carriers
• Government / Scientific - Research, Military vessels, Fire boats
• Fishing - Trawlers, Longliners, Crabbers. ORSOVA SA SHIPYARDS This shipyard is located in Orsova 192 , 25 km upstream Danube River from SEVERNAV DROBETA, having a smaller capacity than SEVERNAV. The ships are exported to clients from: Netherlands, Germany, Belgium, Austria etc. Product range:
• Chemical tanks,
• Integrated cargo tanks from stainless steel duplex;
• Port containers
• Barges,
• Pontoons,
• Barges EUROPA 2B type,
• Self-propelled barges,
• Barges 1500 BIPT,
• Mixed barges,
• RO-RO barges
• Gas tankers. Rolling stock industry in SW Oltenia region ELECTROPUTERE S.A. Electroputere S.A. (which translates as Electro power in English) is a company193 based in Craiova, Romania. Founded in 1949, it is one of the largest industrial companies in Romania. Electroputere has produced more than 2,400 diesel locomotives during 1960-1993, and 1,050 electric locomotives between 1972-1991 for the Romanian, Bulgarian, Chinese, and Polish railways, additionally producing other urban vehicles and complex equipment. One of its more notable foreign orders was for the Class 56 locomotives for British Rail. The 30 locomotives were outsourced to Electroputere by Brush Traction from the UK. Beginning with 1993 the locomotive division has been engaged in performing overhaul repairing’s and modernisations of metro electric units, for Metrorex-Bucharest, tramways and trolleybuses. Electroputere is also producing electric Urban Vehicles having the following technical details:
191 https://www.severnav.ro/ 192 http://www.snorsova.ro/ 193 https://www.electroputere.ro/
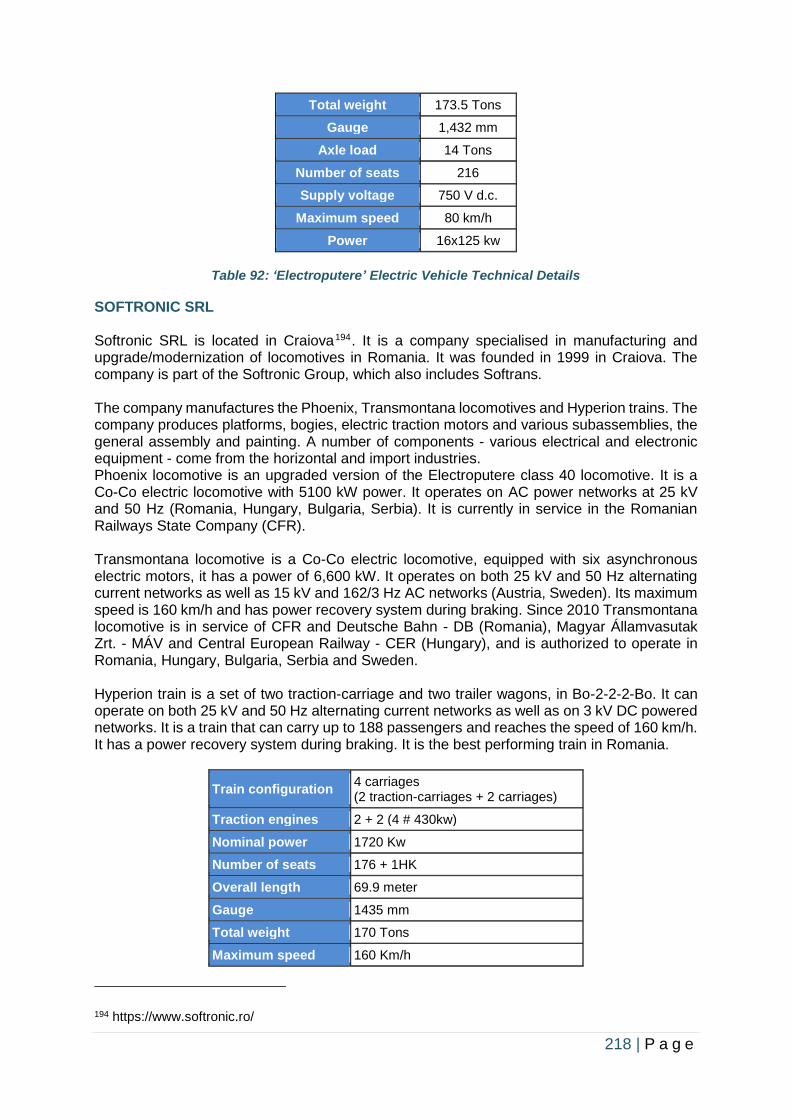
218 | P a g e
Total weight 173.5 Tons
Gauge 1,432 mm
Axle load 14 Tons
Number of seats 216
Supply voltage 750 V d.c.
Maximum speed 80 km/h
Power 16x125 kw
Table 92: ‘Electroputere’ Electric Vehicle Technical Details
SOFTRONIC SRL Softronic SRL is located in Craiova194. It is a company specialised in manufacturing and upgrade/modernization of locomotives in Romania. It was founded in 1999 in Craiova. The company is part of the Softronic Group, which also includes Softrans. The company manufactures the Phoenix, Transmontana locomotives and Hyperion trains. The company produces platforms, bogies, electric traction motors and various subassemblies, the general assembly and painting. A number of components - various electrical and electronic equipment - come from the horizontal and import industries. Phoenix locomotive is an upgraded version of the Electroputere class 40 locomotive. It is a Co-Co electric locomotive with 5100 kW power. It operates on AC power networks at 25 kV and 50 Hz (Romania, Hungary, Bulgaria, Serbia). It is currently in service in the Romanian Railways State Company (CFR). Transmontana locomotive is a Co-Co electric locomotive, equipped with six asynchronous electric motors, it has a power of 6,600 kW. It operates on both 25 kV and 50 Hz alternating current networks as well as 15 kV and 162/3 Hz AC networks (Austria, Sweden). Its maximum speed is 160 km/h and has power recovery system during braking. Since 2010 Transmontana locomotive is in service of CFR and Deutsche Bahn - DB (Romania), Magyar Államvasutak Zrt. - MÁV and Central European Railway - CER (Hungary), and is authorized to operate in Romania, Hungary, Bulgaria, Serbia and Sweden. Hyperion train is a set of two traction-carriage and two trailer wagons, in Bo-2-2-2-Bo. It can operate on both 25 kV and 50 Hz alternating current networks as well as on 3 kV DC powered networks. It is a train that can carry up to 188 passengers and reaches the speed of 160 km/h. It has a power recovery system during braking. It is the best performing train in Romania.
Train configuration 4 carriages (2 traction-carriages + 2 carriages)
Traction engines 2 + 2 (4 # 430kw)
Nominal power 1720 Kw
Number of seats 176 + 1HK
Overall length 69.9 meter
Gauge 1435 mm
Total weight 170 Tons
Maximum speed 160 Km/h
194 https://www.softronic.ro/
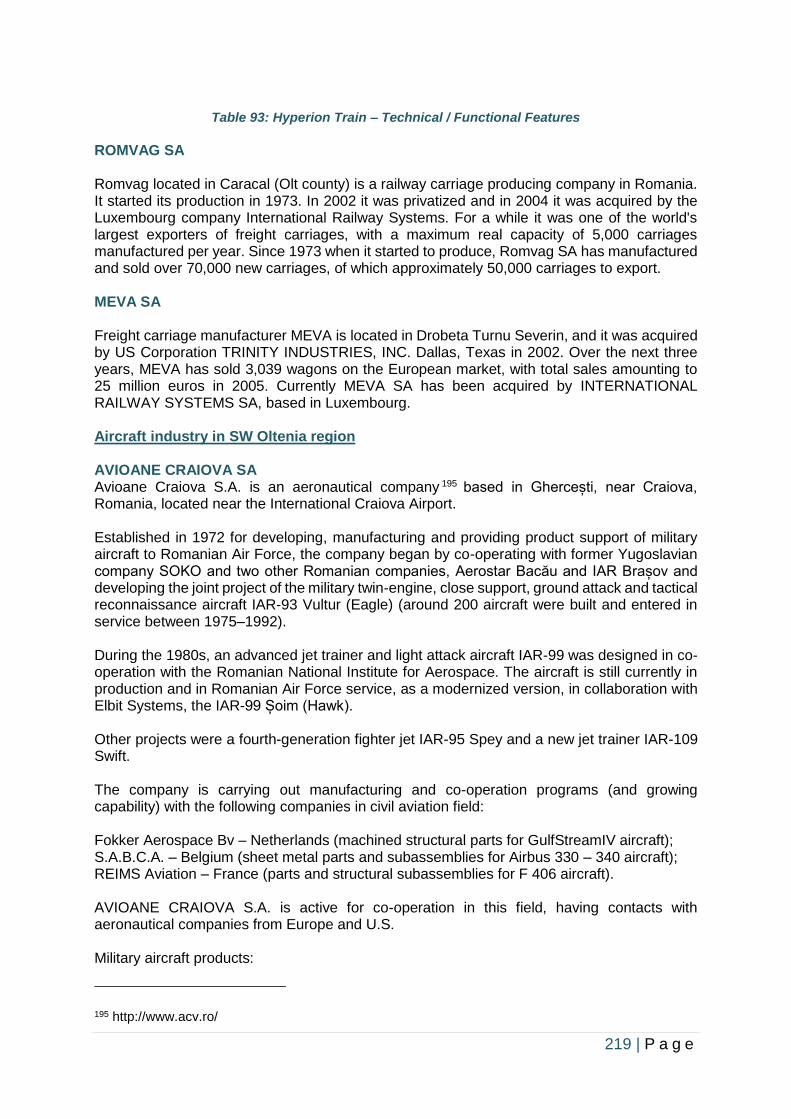
219 | P a g e
Table 93: Hyperion Train – Technical / Functional Features
ROMVAG SA Romvag located in Caracal (Olt county) is a railway carriage producing company in Romania. It started its production in 1973. In 2002 it was privatized and in 2004 it was acquired by the Luxembourg company International Railway Systems. For a while it was one of the world's largest exporters of freight carriages, with a maximum real capacity of 5,000 carriages manufactured per year. Since 1973 when it started to produce, Romvag SA has manufactured and sold over 70,000 new carriages, of which approximately 50,000 carriages to export. MEVA SA Freight carriage manufacturer MEVA is located in Drobeta Turnu Severin, and it was acquired by US Corporation TRINITY INDUSTRIES, INC. Dallas, Texas in 2002. Over the next three years, MEVA has sold 3,039 wagons on the European market, with total sales amounting to 25 million euros in 2005. Currently MEVA SA has been acquired by INTERNATIONAL RAILWAY SYSTEMS SA, based in Luxembourg. Aircraft industry in SW Oltenia region AVIOANE CRAIOVA SA Avioane Craiova S.A. is an aeronautical company 195 based in Ghercești, near Craiova, Romania, located near the International Craiova Airport. Established in 1972 for developing, manufacturing and providing product support of military aircraft to Romanian Air Force, the company began by co-operating with former Yugoslavian company SOKO and two other Romanian companies, Aerostar Bacău and IAR Brașov and developing the joint project of the military twin-engine, close support, ground attack and tactical reconnaissance aircraft IAR-93 Vultur (Eagle) (around 200 aircraft were built and entered in service between 1975–1992). During the 1980s, an advanced jet trainer and light attack aircraft IAR-99 was designed in co-operation with the Romanian National Institute for Aerospace. The aircraft is still currently in production and in Romanian Air Force service, as a modernized version, in collaboration with Elbit Systems, the IAR-99 Șoim (Hawk). Other projects were a fourth-generation fighter jet IAR-95 Spey and a new jet trainer IAR-109 Swift. The company is carrying out manufacturing and co-operation programs (and growing capability) with the following companies in civil aviation field: Fokker Aerospace Bv – Netherlands (machined structural parts for GulfStreamIV aircraft); S.A.B.C.A. – Belgium (sheet metal parts and subassemblies for Airbus 330 – 340 aircraft); REIMS Aviation – France (parts and structural subassemblies for F 406 aircraft). AVIOANE CRAIOVA S.A. is active for co-operation in this field, having contacts with aeronautical companies from Europe and U.S. Military aircraft products:
195 http://www.acv.ro/
220 | P a g e
• IAR-93 Vultur (Eagle) • IAR-99 Standard • IAR-99 Șoim (Hawk) Avioane Craiova SA is working in current production program to upgrade IAR 99 aircraft to the Super Flying Standard - to be used as training jets for future F-16 pilots. The value of the contract that Avioane Craiova SA will carry out for the Ministry of National Defence is 124 million Euros to modernize the 21 aircraft IAR 99 and IAR 99 Hawk in the Romanian army. Light electric vehicles (LEV) NEXTROM Industries SRL The company196 is located in Craiova Industrial Park.
• In 2012, designer engineers created and launched on the market the E-Twow folding electric scooter, which fully folds and easily enters the boot or backpack.
• The concept has been developed within a team of researchers across Europe within 3 years.
• All E-Twow vehicles were previously built in China, but since 2016, much of the production has moved to Romania, in Craiova, under the EU funding programme POS CCE 2007-2013.
• In 2015, E-Twow Electric Mobility sold about 2,000 units of electric trotters and in 2016 sold more than 8,000 units at European level.
• The factory also produces other power-driven vehicles - scooters, motorcycles, bicycles, wheelchairs.
• Three models of electric scooters are available: ECO, MASTER and BOOSTER, which differ by engine power and battery capacity.
• ECO model: 350 W power motor, speed up to 27 km/h, battery autonomy 30 km, price 2900 Lei.
• Charging time of about 2 hours with 4A charger, and 3.5 hours with 2A charger. Additional relevant factors about Status Quo in Transport-SMEs Business sector
When analysing Transport SMEs competitiveness in the SWO region, is it possible to maintain the positive factors of status quo for a long period of time? Is it also possible to improve the negative situation recorded in Transport SMEs competitiveness in the SWO region? In fact, Transport SMEs are moving upwards, they are not staying in the same place for a long period of time. This is because there are too many factors, including competitors, customers, vendors, etc., that impact Transport SMEs’ movement. Over the past two years, the Transport SMEs industry in SWO region has been struggling with certain issues and challenges. A frequently asked question in the Transport-related business community is how fast the technologies are going to advance. Technology advance is crucial for the Transport-SMEs sectors or the economy of cities with a high concentration of transport related issues and businesses. Although there isn’t a timeline outlining when the technologies are going to advance/change, it is predictable that something must happen to make it move. By not innovating, changing, or moving, the entire Transport-SMEs sector in SWO is facing dangers. Transport-SMEs will have to adapt themselves and find a way to face their competitors. Although dealing with a challenging market environment can limit the Transport-
196 https://e-twow.ro/
221 | P a g e
SMEs’ ability to reinforce their status, there are many other ways to counteract those external factors. There are two ways to advance in the status quo: one is pushing to make a change in Transport SMEs sector, having in view that external factors limit the amount of business movement the Transport-SMEs can have. The SW Oltenia regional economy structure cannot change those external forces. Transport-SMEs have to make big efforts to advance. They have to be prepared to make a change. Some signals that Transport SMEs in SW Oltenia are becoming complacent and risk not moving in the right direction include:
• Not investing in new technologies
• Resisting to new ideas and changes
• Being comfortable with the status quo with no energy to move forward
• Lack of momentum
• Fear of failure Note: Not taking a risk may be worse than betting on an investment or launching a new idea. Transport-SMEs must calculate the opportunity costs and risks associated with doing nothing compared to doing something. No one likes to fail, so why do Transport-SMEs allow their businesses to do so in “calm” waters? Competition moves forward and customers move their business to other competitor companies, leaving the SMEs without any innovation, progress, or capital. Getting stuck is not good as it decreases the value of the SMEs, allows for an increase in the amount of competition, and has the potential to destroy the future of the Transport-SME. Competition Forbes once said, ‘your competitor isn’t your real competition: status quo is.’ Although the unknown may be scary, it’s important to compare the costs of investing in something to keep the company moving forward versus staying complacent and letting the competition to take the lead. If Transport-SMEs in SW Oltenia stay in the status quo for long enough, not only will their current competition pass them up and take their customers but more competitors will flood their market. Not doing anything at all is worse than trying and failing. Loss of Business Everyone should want to be the latest and greatest. So why would the customer stay with a Transport-SME if it hasn’t changed/updated/reacted to new technologies that the customer expects to see? The customer would not stay with a Transport-SME that has stopped investing in their product or service. He will move to another company that has improved their services to adjust to the technology changes or the moving economy. Many Transport-SMEs are in danger to lose business being complacent! Start Moving In today’s world market, it is no longer safe just to survive. In fact, Transport-SMEs in SW Oltenia must be working on the offensive side rather than the defensive side to succeed. Instead of reacting to a declining or expanding economic climate, Transport-SMEs have to start making smart decisions before it is time to react. For example, the Transport-SMEs that are doing substantial investment are the first-to-market in this specific industry.
222 | P a g e
And in current stage of technology development, this is a right opportunity to improve the skills, train the staff, brainstorm, strategize, streamline the processes, and adjust some of the procedures of the Transport-SMEs, and investing in projects, marketing, and training. Leadership The Transport-SMEs in SW Oltenia have to improve the status quo and should take risk and invest in research & innovation, new technology etc., to strengthen their competitiveness Megatrends ENVIRONMENTAL CHALLENGES Energy and environment. Issues related to the availability of energy and raw materials, particularly fossil fuels, are likely to endure and become more acute. This will be reflected in higher energy prices and since each mode has a different elasticity, the comparative advantages of modal options will change towards the most energy efficient transport chains. A whole range of alternative fuels will be brought forward and transportation activities will increasingly be considered within a sustainability framework. Climate change is also an issue that may add to the sustainability of SWO region’s Transport SMEs systems, particularly in terms of a more stringent regulatory framework. UNECE Forum 197 (United Nations Economic Commission for Europe) proposed a possible strategy for the automotive sector with regard to the abatement of global warming and the reduction of CO2 emissions:
(a) A short term objective through improved energy efficiency of vehicles and the use of sustainable biofuels (2020);
(b) A midterm objective with the development and introduction into the market of plug-in hybrid vehicles (2020-2025), and;
(c) A long term objective with development and introduction into the market of electric vehicles (2030-2040).
This strategy would shift the automotive sector from the use of fossil energy to the use of hydrogen and electric energy, based on an integrated approach, taking also into account that measures such as eco-driving and better traffic management may be very cost-effective in obtaining a short-term substantial CO2 reduction in the existing vehicle fleet. For the effectiveness of this integrated strategy, the energy sector has to ensure the sustainable and cost-effective generation of electricity and production of hydrogen. The World Forum for Harmonization of Vehicle Regulations is promoting measures for sustainable development, including global warming mitigation such as environmentally friendly vehicles, worldwide harmonized light vehicle test procedures including CO2 measurement, hybrid and electric vehicles, hydrogen and fuel cell vehicles, and numerous other measures on fuel efficiency. URBANISATION & MEGACITIES The authors Wulf-Holger Arndt and Günter Emberger in their paper ‘The relevance of transport for megacities’ stated that: “since 2000 over 50% of the world’s population is living in cities. The trend to urbanisation and further expansion of megacities is unbroken. The urban
197 http://www.unece.org/info/ece-homepage.html
223 | P a g e
population is increasing in all countries even those with stagnating and decreasing numbers of inhabitants. Especially in emerging and developing countries cities are growing rapidly. Striving for a more ecological development of existing cities and new urban development must be an urgent priority in the global transformation towards sustainability. Efficient energy production and consumption are central questions of the 21st century, especially for urban agglomerations and megacities in developing and newly industrialising countries. Although cities cover only 2% of the earth's surface, 50% of the world’s population live in cities but they are responsible for three-quarters of global energy consumption as well as approximately 80% of global greenhouse gas emissions. Future megacities therefore offer strategic approaches for efficient energy use and climate protection in all sectors of production and especially in the field of transport. 20% to 35% of GHG emissions result of transport processes. In residential areas transport is the major GHG emission source with a share of 50%. Several societal trends lead to a growth of traffic. Besides the growth of population and urbanisation, car-oriented settlement structures, income growth and new production methods as well as distance intensive trading relations are key drivers for transport demand. As the picture below shows population growth and car use have a progressive correlation.” All megacities face the challenge of increasing demand for car traffic with annual growths rates above 10 percent. In all cities road congestion, air and noise pollution and safety problems are rocketing and have significant negative impacts on the quality of life for the inhabitants living in there. The transport concepts currently applied or in development in megacities can be characterised by an extensive expansion of the existing transport infrastructure, with a dominating focus on road infrastructure provision and to a less extent on public transport infrastructure improvement. However, policies which encourage walking and cycling as potential solutions towards a sustainable, low energy and environmental friendly transport system are de facto non-existent. But the expansion of networks capacities, as it can be learned from examples also in first world countries, such as the USA or Europe, is not a solution for the present and future traffic and transport problems. To achieve a sustainable transportation system, car use must be restricted and short ways have to be promoted. The street design has to integrate slow modes (bikes and pedestrians) and parking lots have to be reduced. Simultaneously public transport services have to be improved, too. The public transport systems have to be adequate for the cities, which means enough capacity, affordable (from the operator and from the user point of view) and has to be dense enough to generate a network with a mesh width below 500 meters between the transport stops. Such systems can only be realised through a combination of bus, bus rapid transport systems and tramway systems. Additionally, considering the informal structures in many Megacities in emerging countries so called Paratransit services as informal taxis and carpooling can play a supporting role of this flexible public transport system. Only in very limited circumstances are subway/sky train systems affordable and necessary. Soft policies (for example, information campaigns, promotion of eco-mobility, restriction for car traffic etc.) have to be an integrated part of these future transport concepts. The objectives of the existing transport strategies cannot be reached with the planned or presently implemented policy instruments. This uniform result, derived with the application of different tools applied on different cities should initiate a rethinking process for the design of future transport masterplans. It can be concluded that “traditional” solutions, based on (road-) infrastructure provision are by no means able to deliver a sustainable, viable and seminal transport system.
In SWO region, there is no case of megacity. Actually, Craiova metropolitan area can become a nucleus of a larger city, but this should be foreseen in the next 20-30 years or so. Craiova metropolitan is formed by Craiova and other 23 nearby communities, with a population of the area of app. 360,000.
224 | P a g e
AGEING SOCIETY As the number of elderlies in Europe increases, so does the need to address the considerable challenges this will present for future transportation systems. In order to keep older people actively involved in their daily activities, it is vital that they are able to travel and have access to acceptable levels of mobility. Older people are usually regarded as a group with particular limitations and needs, especially in terms of mobility. Therefore, taking into account the elderly population ‘s specific requirements is of great importance to transportation research projects, in order to develop comprehensive profiles of older people. This further needs to identify knowledge gaps and research needs. Technology offers opportunities to improve the situation for older drivers:
1. Increased use of telematics to provide insurance premium
Car insurance companies now use telematics, to calculate insurance premiums. A device is installed in the driver’s car that measures driving risk based on braking speed, cornering, and acceleration amongst other things. Whilst previously the cost of this technology meant that it may not have been profitable for companies to install these devices in the cars of older drivers, there are insurers that now offer this technology as a free smartphone app. An insurance calculation based on driving ability, rather than more arbitrary age limits, could mean that safe older drivers would be less likely to be unfairly penalised.
2. Partially-assisted driving vehicles
Advances in technology in recent years mean that it is becoming more common for new cars to be installed with features such as rear-view cameras for reversing, blind-spot warning systems and even auto-parking technology. For older drivers with limited upper-body mobility, this can aid their independence through adding longevity to their driving years whilst keeping the driver and other road users safe.
3. Driverless cars
Whilst a few years ago the idea of driverless cars would be science fiction scenario, the rapid advancement of technology means that driverless cars are now a real possibility; and they are likely to be on the roads in years, rather than decades. The governments are committed to leading development of driverless car technology, recently authorising their testing on public roads. In the context of an ageing society, this development, although at relatively early stages, has potential to benefit older people in the European Union. For example, people with limited mobility or disabilities may not have to stop driving; people in rural areas and people who have difficulty in travelling to bus stops and train stations could have the freedom to travel. Predictions are that car insurance costs could halve by 2020 with the increased presence of driverless vehicles. ENERGY DEMAND & SOURCES Alternative Fuels
• Most require substantial energy to produce, what is the net gain?
• Ethanol converts diesel fuel and natural gas into diesel fuel and a gasoline substitute, a small gain
• Hydrogen from natural gas or electricity
• Methanol, ethanol need fuel, fertilizer and heat from fossil fuels
225 | P a g e
• Electricity as a source to convert fuels, generally uses coal, natural gas or nuclear fuels
• New petroleum sources are more difficult to extract and require substantial energy input Alternative fuels in the form of non-crude oil resources are drawing considerable attention as a result of the non-renewable character of fossil fuels and the need to reduce emissions of harmful pollutants. The most prevalent alternatives being considered are: Biofuels such as ethanol, methanol and biodiesel can be produced from the fermentation of food crops (sugar cane, corn, cereals; often called first generation biofuels) or the biomass (such as wood and grasses; called second generation biofuels). Their production however requires large harvesting areas that may compete with other types of land use. This limit is related to the capacity of plants to absorb solar energy and transform it through photosynthesis. This low productivity of the biomass does not meet the energy needs of the transportation sector. Besides, the production of ethanol is an energy-intensive process. Biodiesel can also be obtained from a variety of crops. The choice of biomass fuel will largely depend on the sustainability and energy efficiency of the production process. Hydrogen is often mentioned as the energy source of the future. The steps in using hydrogen as a transportation fuel consist in producing hydrogen by electrolysis of water or by extracting it from hydrocarbons. Then, compressing or converting hydrogen into liquid form and storing it on-board a vehicle. Finally, using fuel cell to generate electricity on demand from the hydrogen to propel a motor vehicle. Hydrogen fuel cells are more efficient than gasoline and generate near-zero pollutants. But hydrogen suffers from several problems, particularly since a lot of energy can be wasted in its production, transfer and storage. Hydrogen manufacturing requires electricity production. Besides, hydrogen has a very low energy density and requires very low temperature and very high-pressure storage tank adding weight and volume to a vehicle. This suggests that liquid hydrogen fuel would be a better alternative for ship and aircraft propulsion. Electricity is being considered as an alternative to petroleum fuels as an energy source. A pure battery electric vehicle is considered a more efficient alternative to hydrogen fuel propelled vehicle as there is no need to convert energy into electricity since the electricity stored in the battery can power the electric motor. Besides an all-electric car is easier and cheaper to produce than a comparable fuel-cell vehicle. The main barriers to the development electric cars are the lack of storage systems capable of providing driving ranges and speed comparable to those of conventional vehicles. The low energy capacity of batteries makes the electric car less competitive than internal combustion engines using gasoline. The current technological level of electric cars has a range around 400 kilometres, which is steadily increasing. As technology improves, the energy and cost effectiveness of batteries is getting better. For instance, between 2010 and 2015, the cost of lithium-ion batteries fell by 65%. Electric vehicles are more suitable for urban transportation for both passenger and freight because of the lower ranges involved. Hybrid Vehicles consisting of propulsion system using an internal combustion engine supplemented by an electric motor and batteries, which provides opportunities combining the efficiency of electricity with the long driving range of an internal combustion engine. A hybrid vehicle still uses liquid fuel as the main source of energy but the engine provides the power to drive the vehicle or is used to charge the battery via a generator. Alternatively, the propulsion can be provided by the electricity generated by the battery. When the battery is discharged, the engine starts automatically without intervention from the driver. The generator can also be fed by using the braking energy to recharge the battery. Such a propulsion design greatly contributes to overall fuel efficiency, particularly in urban area where a vehicle accelerates and brakes frequently. The successful development and commercialization of hybrid vehicles appears on the medium term the most sustainable option to conventional gasoline engine powered vehicles.
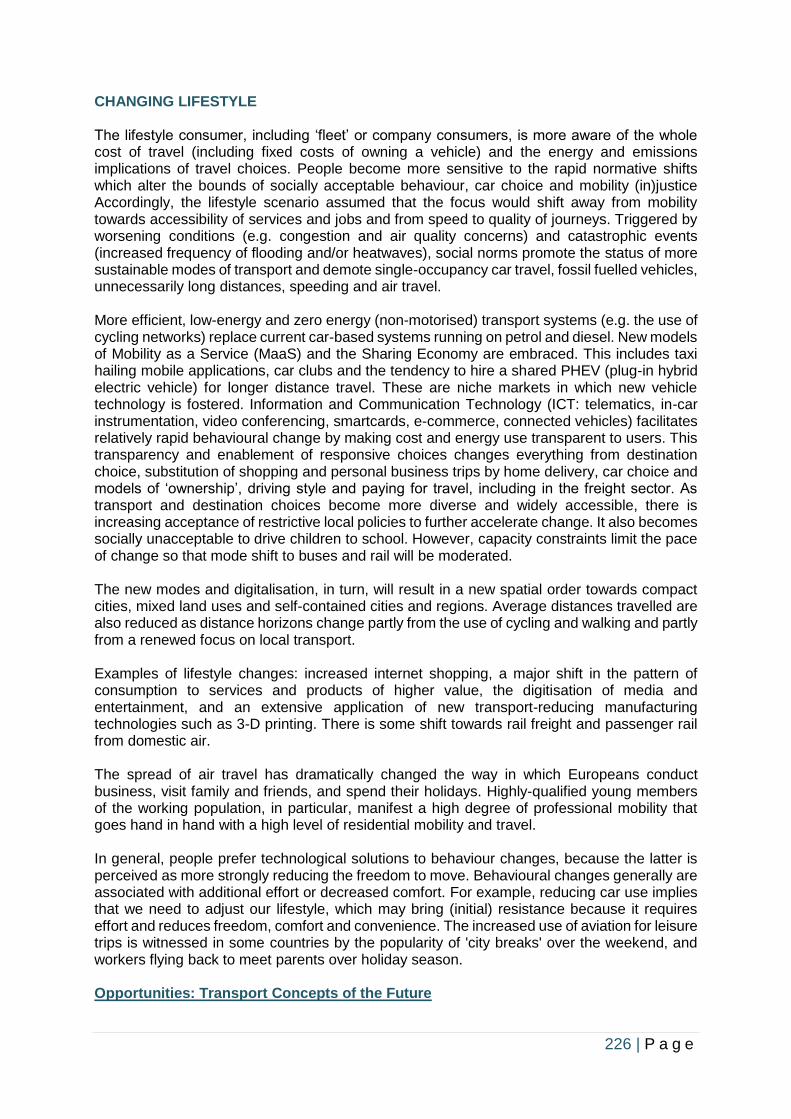
226 | P a g e
CHANGING LIFESTYLE The lifestyle consumer, including ‘fleet’ or company consumers, is more aware of the whole cost of travel (including fixed costs of owning a vehicle) and the energy and emissions implications of travel choices. People become more sensitive to the rapid normative shifts which alter the bounds of socially acceptable behaviour, car choice and mobility (in)justice Accordingly, the lifestyle scenario assumed that the focus would shift away from mobility towards accessibility of services and jobs and from speed to quality of journeys. Triggered by worsening conditions (e.g. congestion and air quality concerns) and catastrophic events (increased frequency of flooding and/or heatwaves), social norms promote the status of more sustainable modes of transport and demote single-occupancy car travel, fossil fuelled vehicles, unnecessarily long distances, speeding and air travel. More efficient, low-energy and zero energy (non-motorised) transport systems (e.g. the use of cycling networks) replace current car-based systems running on petrol and diesel. New models of Mobility as a Service (MaaS) and the Sharing Economy are embraced. This includes taxi hailing mobile applications, car clubs and the tendency to hire a shared PHEV (plug-in hybrid electric vehicle) for longer distance travel. These are niche markets in which new vehicle technology is fostered. Information and Communication Technology (ICT: telematics, in-car instrumentation, video conferencing, smartcards, e-commerce, connected vehicles) facilitates relatively rapid behavioural change by making cost and energy use transparent to users. This transparency and enablement of responsive choices changes everything from destination choice, substitution of shopping and personal business trips by home delivery, car choice and models of ‘ownership’, driving style and paying for travel, including in the freight sector. As transport and destination choices become more diverse and widely accessible, there is increasing acceptance of restrictive local policies to further accelerate change. It also becomes socially unacceptable to drive children to school. However, capacity constraints limit the pace of change so that mode shift to buses and rail will be moderated. The new modes and digitalisation, in turn, will result in a new spatial order towards compact cities, mixed land uses and self-contained cities and regions. Average distances travelled are also reduced as distance horizons change partly from the use of cycling and walking and partly from a renewed focus on local transport. Examples of lifestyle changes: increased internet shopping, a major shift in the pattern of consumption to services and products of higher value, the digitisation of media and entertainment, and an extensive application of new transport-reducing manufacturing technologies such as 3-D printing. There is some shift towards rail freight and passenger rail from domestic air. The spread of air travel has dramatically changed the way in which Europeans conduct business, visit family and friends, and spend their holidays. Highly-qualified young members of the working population, in particular, manifest a high degree of professional mobility that goes hand in hand with a high level of residential mobility and travel. In general, people prefer technological solutions to behaviour changes, because the latter is perceived as more strongly reducing the freedom to move. Behavioural changes generally are associated with additional effort or decreased comfort. For example, reducing car use implies that we need to adjust our lifestyle, which may bring (initial) resistance because it requires effort and reduces freedom, comfort and convenience. The increased use of aviation for leisure trips is witnessed in some countries by the popularity of 'city breaks' over the weekend, and workers flying back to meet parents over holiday season. Opportunities: Transport Concepts of the Future
227 | P a g e
AUTOMATION-PASSENGER TRANSPORT Travel time is becoming less costly for travellers
• New technologies promise to free car drivers from driving
• Mobile devices make public transport passengers more productive Driverless cars concentrate in middle of peak
• Capacity may improve, reducing travel cost for everybody. Users of non-driverless cars may be worse off
Automation refers to the transport system including all of its components, such as vehicles, drivers, users, infrastructure, information systems and applications. The term automation is often used to define a process in which automation takes over control from the human. In this context, the level in which the driver is still ‘in the loop’ is used in order to discriminate between the different levels of vehicle automation. An often used classification of vehicle automation is the one formulated by Gasser and Westhoff (2012), although other similar classifications have been also suggested. They distinguish four different levels of automation, namely:
• level 1: driver assistance;
• level 2: partial automation;
• level 3: high automation; and
• level 4: full automation. In driver assistance, the driver permanently maintains either longitudinal (speed choice, car- following) or lateral control (lane- keeping, merging, lane- changing, overtaking). Other tasks can be automated to a certain extent by an advanced driver assistance (ADA) system. Examples of driver assistance systems are adaptive cruise control (ACC) and cooperative adaptive cruise control (CACC). Handbook on transport and urban planning in the developed world providing support in longitudinal control through maintaining a desired speed and time headway. This system can be overruled by the driver. Cooperative adaptive cruise control is a system which provides support for longitudinal control as well. The difference compared with ACC is that in CACC the vehicles extend their field of view to several predecessors through vehicle-to-vehicle (V2V) communication. Partial automation entails the situation in which a system takes over both longitudinal and lateral control. The driver is required to permanently monitor the system and is required to take over control at any time. In the third level, high automation, the system also takes over longitudinal and lateral control, but the driver is no longer required to permanently monitor the system. Nevertheless, the driver must be prepared to respond adequately to a take-over request by the system. On the highest level, full automation, the system again takes over longitudinal and lateral control. AUTONOMOUS VEHICLES An autonomous vehicle is one that can drive itself from a starting point to a predetermined destination in ‘autopilot’ mode using various in-vehicle technologies and sensors, including adaptive cruise control, active steering (steer by wire), anti-lock braking systems (brake by wire), GPS navigation technology, lasers and radar. Autonomous vehicles are capable of sensing their environment and navigating without human input. Advanced control systems interpret sensory information to identify appropriate navigation paths, as well as obstacles. Autonomous vehicles can update their maps based on sensory input, allowing the vehicles to keep track of their position even when conditions change or when they enter uncharted environments.
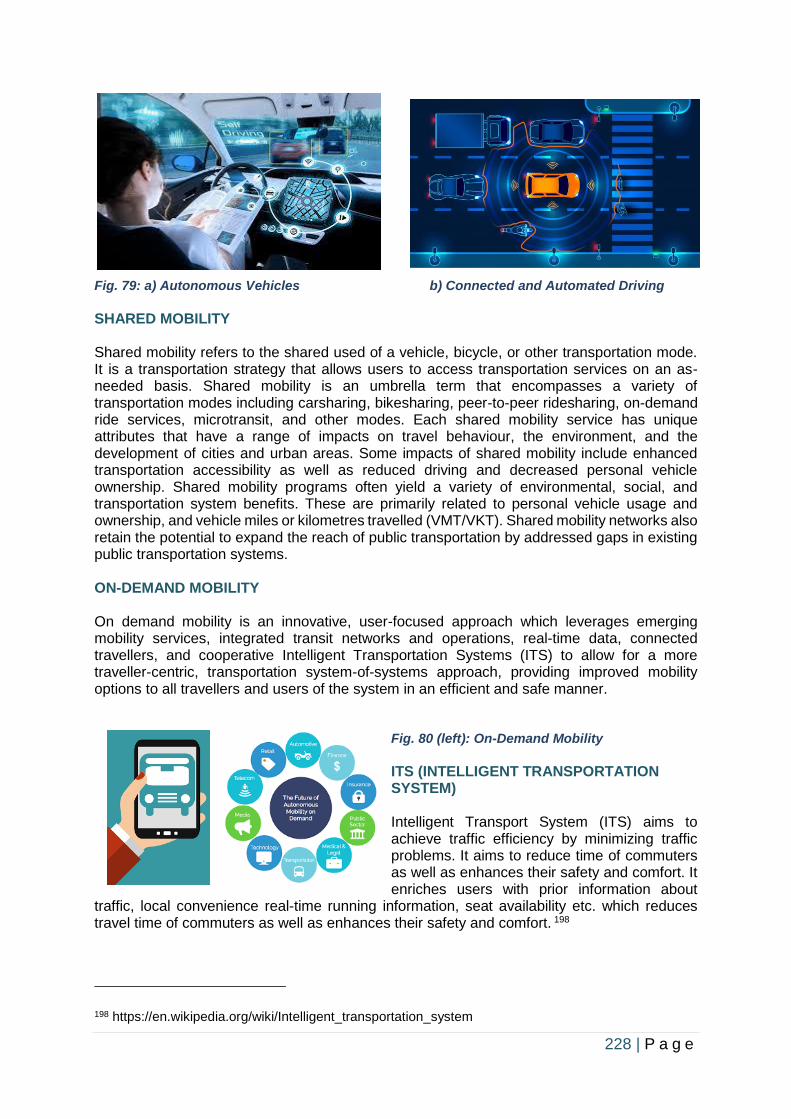
228 | P a g e
Fig. 79: a) Autonomous Vehicles b) Connected and Automated Driving
SHARED MOBILITY Shared mobility refers to the shared used of a vehicle, bicycle, or other transportation mode. It is a transportation strategy that allows users to access transportation services on an as-needed basis. Shared mobility is an umbrella term that encompasses a variety of transportation modes including carsharing, bikesharing, peer-to-peer ridesharing, on-demand ride services, microtransit, and other modes. Each shared mobility service has unique attributes that have a range of impacts on travel behaviour, the environment, and the development of cities and urban areas. Some impacts of shared mobility include enhanced transportation accessibility as well as reduced driving and decreased personal vehicle ownership. Shared mobility programs often yield a variety of environmental, social, and transportation system benefits. These are primarily related to personal vehicle usage and ownership, and vehicle miles or kilometres travelled (VMT/VKT). Shared mobility networks also retain the potential to expand the reach of public transportation by addressed gaps in existing public transportation systems. ON-DEMAND MOBILITY On demand mobility is an innovative, user-focused approach which leverages emerging mobility services, integrated transit networks and operations, real-time data, connected travellers, and cooperative Intelligent Transportation Systems (ITS) to allow for a more traveller-centric, transportation system-of-systems approach, providing improved mobility options to all travellers and users of the system in an efficient and safe manner.
Fig. 80 (left): On-Demand Mobility ITS (INTELLIGENT TRANSPORTATION SYSTEM) Intelligent Transport System (ITS) aims to achieve traffic efficiency by minimizing traffic problems. It aims to reduce time of commuters as well as enhances their safety and comfort. It enriches users with prior information about
traffic, local convenience real-time running information, seat availability etc. which reduces travel time of commuters as well as enhances their safety and comfort. 198
198 https://en.wikipedia.org/wiki/Intelligent_transportation_system
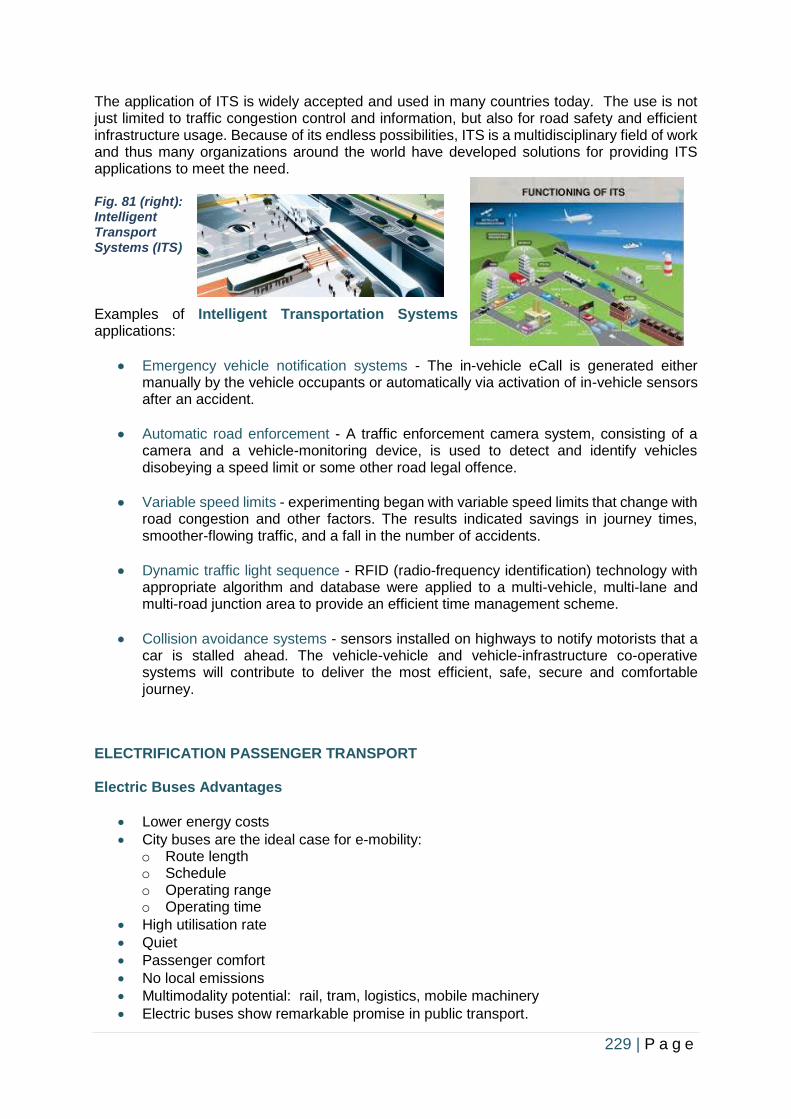
229 | P a g e
The application of ITS is widely accepted and used in many countries today. The use is not just limited to traffic congestion control and information, but also for road safety and efficient infrastructure usage. Because of its endless possibilities, ITS is a multidisciplinary field of work and thus many organizations around the world have developed solutions for providing ITS applications to meet the need.
Fig. 81 (right): Intelligent Transport Systems (ITS)
Examples of Intelligent Transportation Systems applications:
• Emergency vehicle notification systems - The in-vehicle eCall is generated either manually by the vehicle occupants or automatically via activation of in-vehicle sensors after an accident.
• Automatic road enforcement - A traffic enforcement camera system, consisting of a camera and a vehicle-monitoring device, is used to detect and identify vehicles disobeying a speed limit or some other road legal offence.
• Variable speed limits - experimenting began with variable speed limits that change with road congestion and other factors. The results indicated savings in journey times, smoother-flowing traffic, and a fall in the number of accidents.
• Dynamic traffic light sequence - RFID (radio-frequency identification) technology with appropriate algorithm and database were applied to a multi-vehicle, multi-lane and multi-road junction area to provide an efficient time management scheme.
• Collision avoidance systems - sensors installed on highways to notify motorists that a car is stalled ahead. The vehicle-vehicle and vehicle-infrastructure co-operative systems will contribute to deliver the most efficient, safe, secure and comfortable journey.
ELECTRIFICATION PASSENGER TRANSPORT Electric Buses Advantages
• Lower energy costs
• City buses are the ideal case for e-mobility: o Route length o Schedule o Operating range o Operating time
• High utilisation rate
• Quiet
• Passenger comfort
• No local emissions
• Multimodality potential: rail, tram, logistics, mobile machinery
• Electric buses show remarkable promise in public transport.
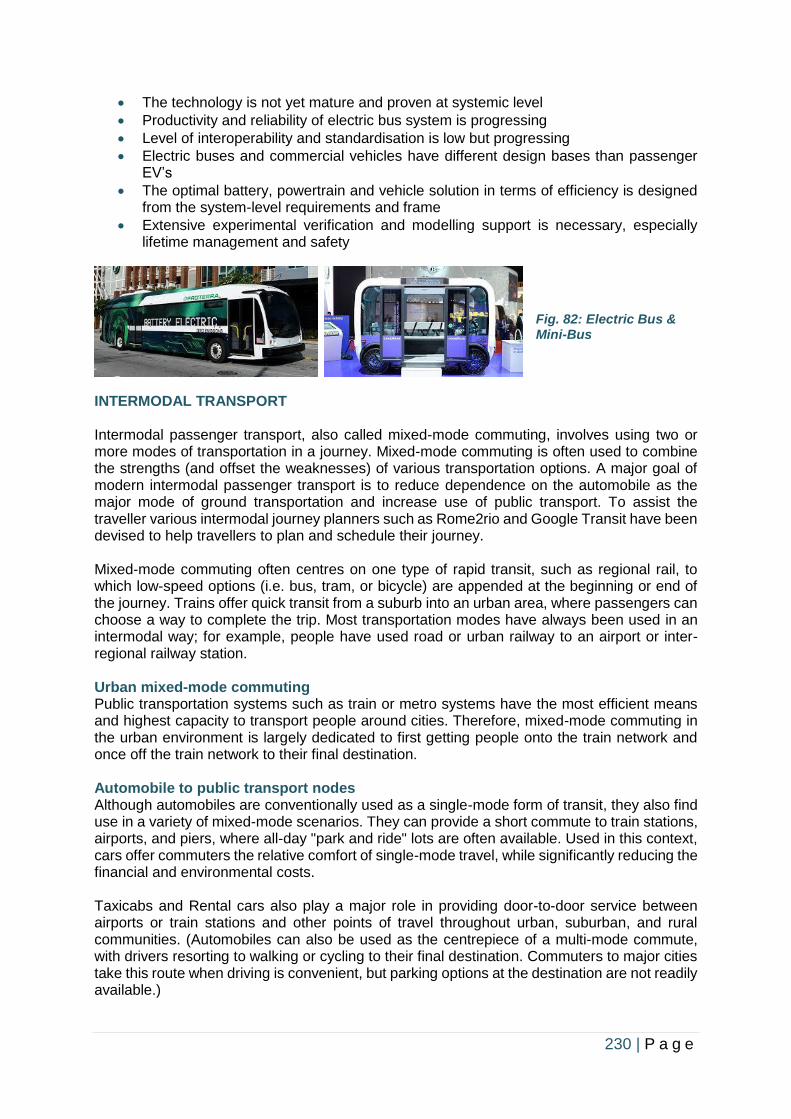
230 | P a g e
• The technology is not yet mature and proven at systemic level
• Productivity and reliability of electric bus system is progressing
• Level of interoperability and standardisation is low but progressing
• Electric buses and commercial vehicles have different design bases than passenger EV’s
• The optimal battery, powertrain and vehicle solution in terms of efficiency is designed from the system-level requirements and frame
• Extensive experimental verification and modelling support is necessary, especially lifetime management and safety
Fig. 82: Electric Bus & Mini-Bus
INTERMODAL TRANSPORT Intermodal passenger transport, also called mixed-mode commuting, involves using two or more modes of transportation in a journey. Mixed-mode commuting is often used to combine the strengths (and offset the weaknesses) of various transportation options. A major goal of modern intermodal passenger transport is to reduce dependence on the automobile as the major mode of ground transportation and increase use of public transport. To assist the traveller various intermodal journey planners such as Rome2rio and Google Transit have been devised to help travellers to plan and schedule their journey. Mixed-mode commuting often centres on one type of rapid transit, such as regional rail, to which low-speed options (i.e. bus, tram, or bicycle) are appended at the beginning or end of the journey. Trains offer quick transit from a suburb into an urban area, where passengers can choose a way to complete the trip. Most transportation modes have always been used in an intermodal way; for example, people have used road or urban railway to an airport or inter-regional railway station. Urban mixed-mode commuting Public transportation systems such as train or metro systems have the most efficient means and highest capacity to transport people around cities. Therefore, mixed-mode commuting in the urban environment is largely dedicated to first getting people onto the train network and once off the train network to their final destination. Automobile to public transport nodes Although automobiles are conventionally used as a single-mode form of transit, they also find use in a variety of mixed-mode scenarios. They can provide a short commute to train stations, airports, and piers, where all-day "park and ride" lots are often available. Used in this context, cars offer commuters the relative comfort of single-mode travel, while significantly reducing the financial and environmental costs. Taxicabs and Rental cars also play a major role in providing door-to-door service between airports or train stations and other points of travel throughout urban, suburban, and rural communities. (Automobiles can also be used as the centrepiece of a multi-mode commute, with drivers resorting to walking or cycling to their final destination. Commuters to major cities take this route when driving is convenient, but parking options at the destination are not readily available.)
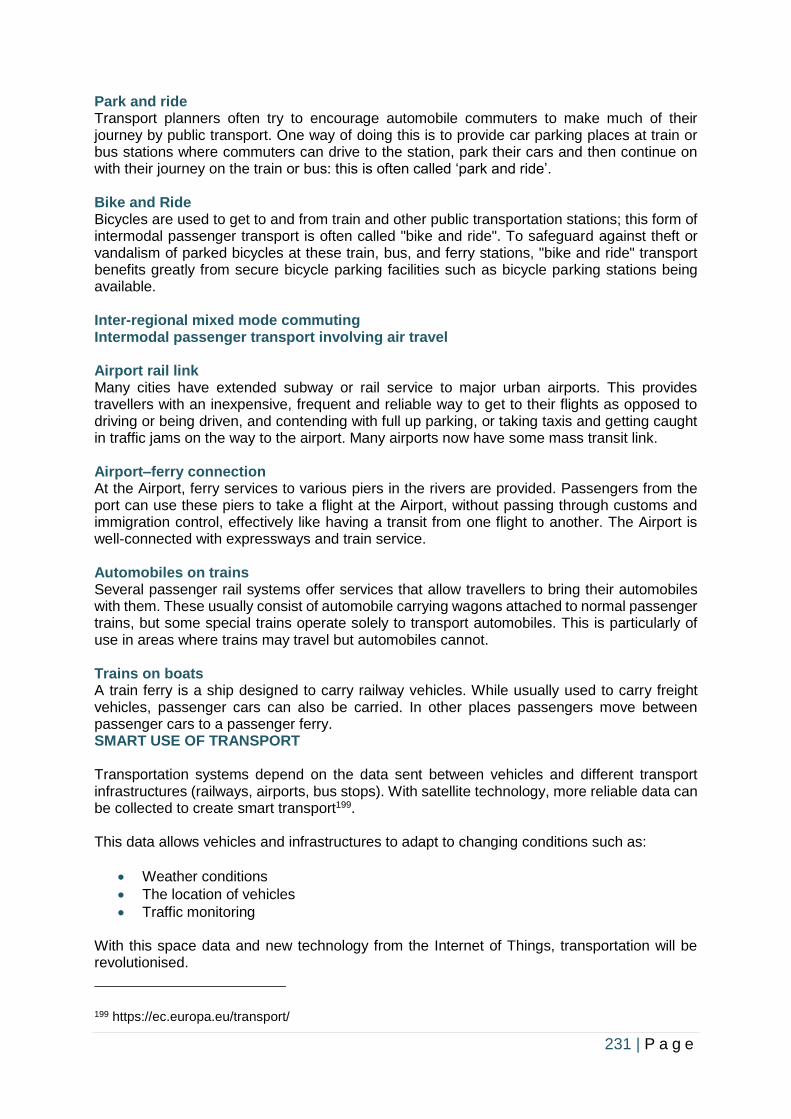
231 | P a g e
Park and ride Transport planners often try to encourage automobile commuters to make much of their journey by public transport. One way of doing this is to provide car parking places at train or bus stations where commuters can drive to the station, park their cars and then continue on with their journey on the train or bus: this is often called ‘park and ride’. Bike and Ride Bicycles are used to get to and from train and other public transportation stations; this form of intermodal passenger transport is often called "bike and ride". To safeguard against theft or vandalism of parked bicycles at these train, bus, and ferry stations, "bike and ride" transport benefits greatly from secure bicycle parking facilities such as bicycle parking stations being available. Inter-regional mixed mode commuting Intermodal passenger transport involving air travel Airport rail link Many cities have extended subway or rail service to major urban airports. This provides travellers with an inexpensive, frequent and reliable way to get to their flights as opposed to driving or being driven, and contending with full up parking, or taking taxis and getting caught in traffic jams on the way to the airport. Many airports now have some mass transit link. Airport–ferry connection At the Airport, ferry services to various piers in the rivers are provided. Passengers from the port can use these piers to take a flight at the Airport, without passing through customs and immigration control, effectively like having a transit from one flight to another. The Airport is well-connected with expressways and train service. Automobiles on trains Several passenger rail systems offer services that allow travellers to bring their automobiles with them. These usually consist of automobile carrying wagons attached to normal passenger trains, but some special trains operate solely to transport automobiles. This is particularly of use in areas where trains may travel but automobiles cannot. Trains on boats A train ferry is a ship designed to carry railway vehicles. While usually used to carry freight vehicles, passenger cars can also be carried. In other places passengers move between passenger cars to a passenger ferry. SMART USE OF TRANSPORT Transportation systems depend on the data sent between vehicles and different transport infrastructures (railways, airports, bus stops). With satellite technology, more reliable data can be collected to create smart transport199. This data allows vehicles and infrastructures to adapt to changing conditions such as:
• Weather conditions
• The location of vehicles
• Traffic monitoring With this space data and new technology from the Internet of Things, transportation will be revolutionised.
199 https://ec.europa.eu/transport/
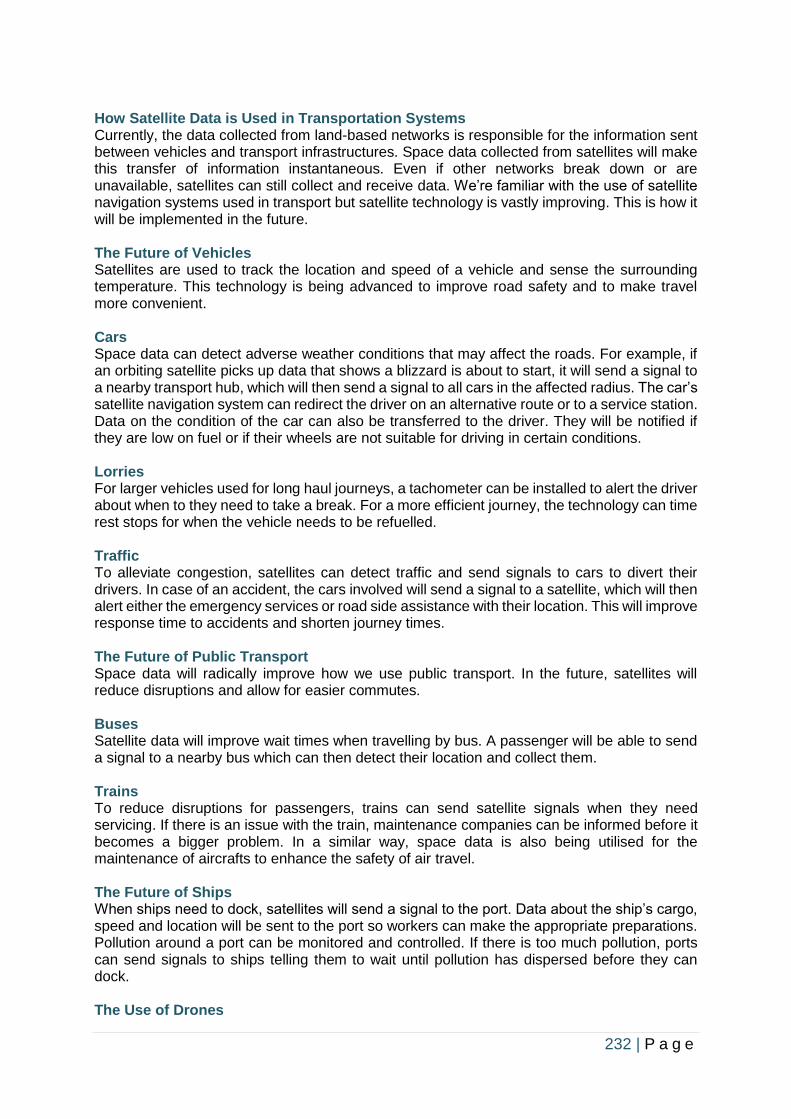
232 | P a g e
How Satellite Data is Used in Transportation Systems Currently, the data collected from land-based networks is responsible for the information sent between vehicles and transport infrastructures. Space data collected from satellites will make this transfer of information instantaneous. Even if other networks break down or are unavailable, satellites can still collect and receive data. We’re familiar with the use of satellite navigation systems used in transport but satellite technology is vastly improving. This is how it will be implemented in the future. The Future of Vehicles Satellites are used to track the location and speed of a vehicle and sense the surrounding temperature. This technology is being advanced to improve road safety and to make travel more convenient. Cars Space data can detect adverse weather conditions that may affect the roads. For example, if an orbiting satellite picks up data that shows a blizzard is about to start, it will send a signal to a nearby transport hub, which will then send a signal to all cars in the affected radius. The car’s satellite navigation system can redirect the driver on an alternative route or to a service station. Data on the condition of the car can also be transferred to the driver. They will be notified if they are low on fuel or if their wheels are not suitable for driving in certain conditions. Lorries For larger vehicles used for long haul journeys, a tachometer can be installed to alert the driver about when to they need to take a break. For a more efficient journey, the technology can time rest stops for when the vehicle needs to be refuelled. Traffic To alleviate congestion, satellites can detect traffic and send signals to cars to divert their drivers. In case of an accident, the cars involved will send a signal to a satellite, which will then alert either the emergency services or road side assistance with their location. This will improve response time to accidents and shorten journey times. The Future of Public Transport Space data will radically improve how we use public transport. In the future, satellites will reduce disruptions and allow for easier commutes. Buses Satellite data will improve wait times when travelling by bus. A passenger will be able to send a signal to a nearby bus which can then detect their location and collect them. Trains To reduce disruptions for passengers, trains can send satellite signals when they need servicing. If there is an issue with the train, maintenance companies can be informed before it becomes a bigger problem. In a similar way, space data is also being utilised for the maintenance of aircrafts to enhance the safety of air travel. The Future of Ships When ships need to dock, satellites will send a signal to the port. Data about the ship’s cargo, speed and location will be sent to the port so workers can make the appropriate preparations. Pollution around a port can be monitored and controlled. If there is too much pollution, ports can send signals to ships telling them to wait until pollution has dispersed before they can dock. The Use of Drones
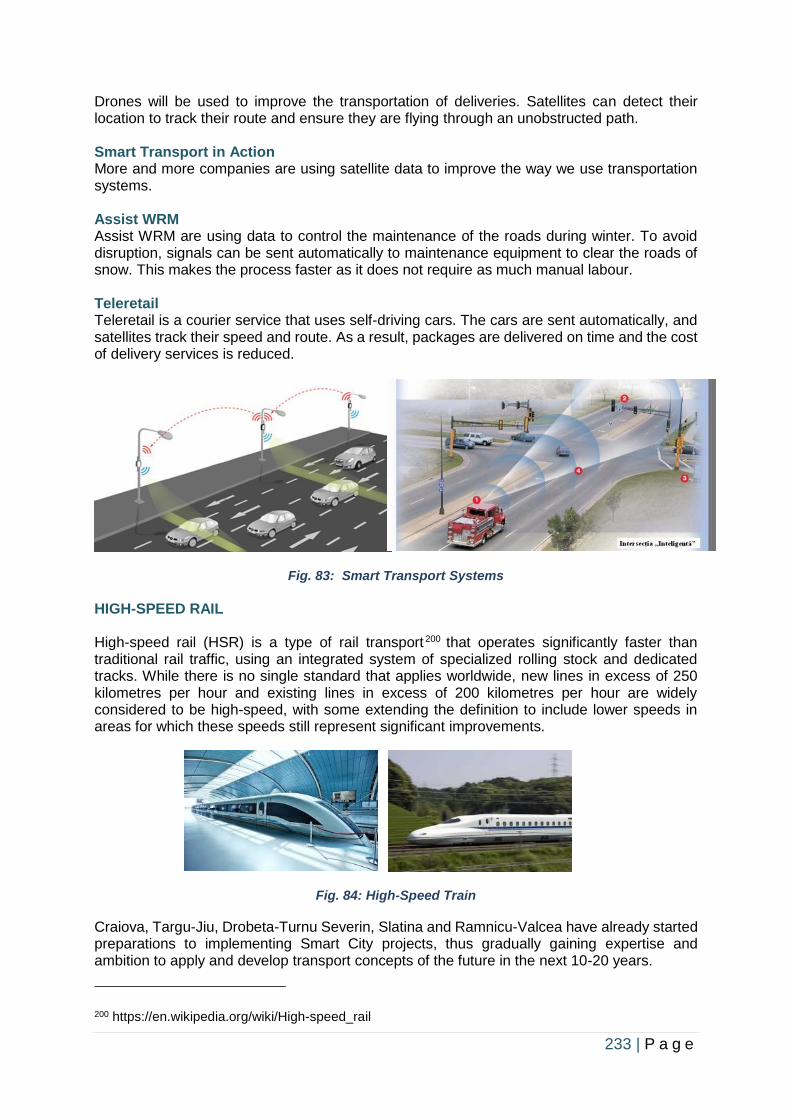
233 | P a g e
Drones will be used to improve the transportation of deliveries. Satellites can detect their location to track their route and ensure they are flying through an unobstructed path. Smart Transport in Action More and more companies are using satellite data to improve the way we use transportation systems. Assist WRM Assist WRM are using data to control the maintenance of the roads during winter. To avoid disruption, signals can be sent automatically to maintenance equipment to clear the roads of snow. This makes the process faster as it does not require as much manual labour. Teleretail Teleretail is a courier service that uses self-driving cars. The cars are sent automatically, and satellites track their speed and route. As a result, packages are delivered on time and the cost of delivery services is reduced.
Fig. 83: Smart Transport Systems
HIGH-SPEED RAIL High-speed rail (HSR) is a type of rail transport 200 that operates significantly faster than traditional rail traffic, using an integrated system of specialized rolling stock and dedicated tracks. While there is no single standard that applies worldwide, new lines in excess of 250 kilometres per hour and existing lines in excess of 200 kilometres per hour are widely considered to be high-speed, with some extending the definition to include lower speeds in areas for which these speeds still represent significant improvements.
Fig. 84: High-Speed Train
Craiova, Targu-Jiu, Drobeta-Turnu Severin, Slatina and Ramnicu-Valcea have already started preparations to implementing Smart City projects, thus gradually gaining expertise and ambition to apply and develop transport concepts of the future in the next 10-20 years.
200 https://en.wikipedia.org/wiki/High-speed_rail
234 | P a g e
Obstacles for Transport SMEs
Lack of Financial Resources
From the commercial point of view most investments in transport SMEs sector are part of a broader category known as project financing. A project’s viability is therefore closely connected with the valorisation of the future cash flow generated by the business project. There are some features specific to project financing in transport-related sectors that make the availability of resources more difficult. These are the elements of a project:
• Long Life-Cycle
• Relatively Low Operating Costs
• Need For Large Capacity Resources
• Long Construction Period (2–7 Years)
As regards the cash-flow this means: Negative cash flow throughout the construction period, which is usually longer than in the case of ordinary industrial projects. This is an important factor in the risk to the investor. Slow increase in the cash flow at the beginning of operation, caused by large interest payments on loans. High cash flow after amortization.
Finance resources for transport infrastructure projects can be divided as follows:
Public Resources
1. State budget
• State transport infrastructure fund
• Other government subsidies and grants
2. Non-budget public resources
• External subsidy funds and programmes (e.g. Regional Operational Programme etc.)
3. Other – Alternative resources
Loans:
• from domestic banks
• from foreign commercial banks
• from export credit institutions • from international financial institutions
Entry to capital markets:
• Bond issue programmes
• Stock issue programmes
• Leasing
• Guarantees, bills
• Fee and toll collecting – user pays
235 | P a g e
• Subsidiary company purchasing
Project financing via Public-Private Partnership - mixed scenarios for private capital involvement. The transport SMEs sector must have the capacity to deliver the best products and services, in a time and cost-efficient manner, in order to preserve its leadership and create new jobs, as well as to tackle the environmental and mobility defies. The role of Transport SMEs to meet these challenges in all the areas is critical as they are key players in the supply chains. Enhancing the involvement of weaker players in innovation activities as well as facilitating the start-up and emergence of new high-tech SMEs is of paramount importance. SMEs are pivotal for delivering the innovations needed for greater sustainable and smarter mobility, better accessibility and logistics serving business and citizens, and thus higher economic growth, in a context where the majority of population lives in urban and urbanised areas. Transport SMEs have to develop new services, products, processes, technologies, systems and combinations thereof to contribute to transport sector progress.
Gaps in Transport SMEs Financing The usual option for Transport SMEs entrepreneurs was to borrow money from their local banks. As the loans become too expensive, Transport SMEs tend to put their investment plans on hold until better economic times. This is detrimental to the economic growth and innovation. The financial landscape has changed dramatically and Transport SMEs would need to broaden their horizon for financing and use new tools like crowdfunding and microfinance. Transport SMEs have to explore the new range of financing mechanisms. Compared to larger companies, Transport SMEs are much more vulnerable to funding shortages due to the lack of capital buffers and resources, and the lack of internal diversification. Transport SMEs rely mainly on bank financing in the form of short- and long-term loans to provide working capital and to finance future growth. But their loan applications are often rejected by their banks, leaving them more dependent on their own means or even causing financial distress. This financing difficulty reaches its peak during financial crisis, as banks apply more restrictive credit requirements. The role of government is to make intervention on distressed banks in order to stimulate lending to the Transport SMEs. Other sources involves new entrepreneurial financing channels such as crowdfunding. Generally, entrepreneurs are not well informed about their financing tools and thereby rely heavily on their local banks. In response to this advice, training programmes for accountants and tax advisers should be initiated to provide entrepreneurs with updated information on financing alternatives. Transport SMEs entrepreneurs should have strong commitment to improving financing situation. Business support associations, trade federations etc. should create a better entrepreneurial environment through education. Entrepreneurs should be actively engaged in learning and attending lecture series that are providing up-to-date information on financing sources and ways for entrepreneurs to access them. They should access platforms for crowdfunding, or attract angel investments (especially tailored to the Transport SMEs sector). Lack of Qualified Personnel Many Transport SMEs are reporting difficulty in recruiting their staff in general, and they are having more trouble finding skilled workers. It’s not surprising that capable employees are harder to find as the pace of hiring picks up and the unemployment rate drops. But would-be employees just don’t appear to be the right fit for many of the open positions. The main reasons for having difficulty filling open jobs are:
236 | P a g e
• a low number of applicants;
• a lack of needed work experience;
• competition from other employers;
• a shortage of technical skills;
• a shortage of qualified candidates in local markets. Complicating the situation, hiring managers and organisational leaders often are not fully aware of just how difficult it is to fill vacancies. That means it is up to HR professionals to build a solid business case for larger talent acquisition budgets that can be used to invest in internal and external recruiters or, in some cases, higher pay to attract highly skilled specialists. Social media is now the most common method used to meet recruiting challenges. However, more effective approach is to training the existing employees to take on hard-to-fill roles. To that end, HR depts. also must make the case within their Transport SMEs about the importance of preparing workers to take on critical open roles. That’s especially important because many applicants are missing several critical skills. Difficult Collaboration with Public Authorities In many occasions, the collaboration between Transport SMEs and public authorities is really difficult. Public authorities should be proactive in supporting the Transport SMEs by enabling them doing business in a free and stimulating ecosystem. Excessive bureaucracy imposes a disproportionate bureaucratic burden on Transport SMEs, creating both incentives and opportunities for bribery and corruption. This can manifest itself in the form of excessive or overly rigid administrative procedures, requirements for unnecessary licences, protracted decision-making processes involving multiple people or committees and a myriad of specific rules that slow down business operations. Evidence of linkages between corruption and bureaucracy. Bureaucracy is a term for “excessive regulation or rigid conformity to formal rules that is considered redundant or bureaucratic and hinders or prevents action or decision-making”. Red tape generally involves the filling out of seemingly unnecessary paperwork, obtaining unnecessary licences, having multiple people or committees approve a decision and various low-level rules that make conducting SMEs’ business slower and more difficult. Bureaucracy and red tape offer opportunities for bribery and corruption. Institutional barriers provide an opportunity for rent-seeking as individuals and businesses may be willing to make illegal payments to circumvent these barriers. Also, in some cases, public authority officials may create additional bureaucratic procedures as an opportunity for bribe extortion, changing the public sector’s incentive system towards a rent-seeking culture. Bribery is the most common form of corruption affecting SMEs. SMEs have reported paying bribes in order to access government services that they are entitled to or requested by law, such as licenses, permits, contracts, tax incentives. SMEs have also reported paying bribes in order to speed up procedures or evade the law. SMEs are more susceptible to bureaucratic corruption than larger companies due to their structure (e.g. there is often a greater degree of informality and less accountability mechanisms); short-term vision and perspective (as opposed to larger companies, SMEs are less concerned about reputation and other long-term negative impacts of corruption); limited financial resources; and their inability to wield influence over officials and institutions, lacking bargaining power to oppose requests for illegal payments from public officials. Reduction of bureaucratic corruption of public authority officials is a major aim, and there is further potential to reduce corruption opportunities by further decreasing the interaction between public officials and businesses. Nevertheless, the government should stress the
237 | P a g e
importance of transparency and accountability, as well as strengthen its enforcement mechanisms. The roles of regions and cities for supporting Transport SME and entrepreneurship policy is most fundamentally seen in:
• Harnessing their internal potential for development, i.e. developing an attractive and business-friendly ecosystem tailor-made to the territory’s strengths;
• Designing strategic approaches to Transport SME and entrepreneurship policy thanks to their sound understanding of the needs of SMEs, e.g. in terms of access funding, one of the main obstacles to growth for SMEs;
• Strengthening and supporting the policy implementation process by involving regional partners;
• Developing more effectively mentoring and supporting measures assigned to specific target groups of potential entrepreneurs.
The difficult collaboration with public authorities has a particularly negative effect on Transport-SMEs in export-oriented sectors such as manufacturing and the automotive industry.
Government Measures to Help Transport-SMEs
As the economic crisis of recent years has been so severe, governments have introduced policies to support enterprises as much as they can. Aware that Transport-SMEs have fewer defenses against economic downturn, due to size and limited access to financial aid, governments have put in place specific policies and measures aimed at helping Transport-SMEs to survive the crisis. These cover a range of issues, including:
• Financial measures, such as reductions in tax, provision of loans, and measures to improve access to credit;
• Helping transport SMEs to access new markets and to invest in research, development and innovation;
• Providing specific advice and consultancy to transport SMEs, usually on themes such as how to set up operations or financial advice;
• Simplification of administrative procedures, on the basis that red tape is seen as a particularly difficult barrier to business development for transport- SMEs;
• Support for job creation, which usually takes the form of providing financial incentives, such as reduced employer social security contributions, for employers hiring unemployed people;
• Supporting training which is recognised as a key instrument in ensuring employability, not just during an economic crisis, but throughout an employee’s working life.
Transport SMEs often find it difficult to release employees for training and to fund training in general. Targeted sectoral measures can therefore help, in addition to measures specifically targeting entrepreneurship in Transport SMEs.
Transport SMEs Networks & Partnerships
One way in which Transport SMEs can take action themselves to help weather difficult economic times is to build partnerships and networks, with a variety of purposes: some are designed to help Transport-SMEs gain access to commercial markets, while others are aimed at improving information-sharing or developing systems to allow companies to share employees in some circumstances.
These networks can also help SMEs deal with the impact of the crisis in terms of maintaining employment, productivity and market share, and providing other ways of pooling resources.
238 | P a g e
Transport-SME networks take the form of business associations that provide shared services for SMEs, and provide help and services to SMEs in areas such as research and innovation.
Conclusion on Government Measures
The economic crisis has hit Transport SMEs harder than larger companies in most regions of the countries. This is evidenced by the large numbers of SMEs that have been forced into bankruptcy in the majority of EU Member States over the past couple of years. As a response to this, governments in many EU Member States have tried to put into place measures to help Transport SMEs.
As Transport SMEs suffer from particular difficulties that make it harder for them to cope with difficult factors in the economic cycle, the development of networks and local partnerships are extremely important to Transport SMEs in SWO region as a way of helping maintain employment and offer training to their workforce.
Non-Collaboration Between Universities / Research Centres & Transport SMEs
A key issue in SWO is that it is lagging behind in terms of innovation even though it includes many active research units, producing results that cannot find their way to the Transport SMEs market. Need to contribute in exploitation of academic research through development of a web pool of R&D results. A missing element is the definition of those R&D results elements that block the valorisation potential, through the involvement of experts. The region’s aim is to bridge the gap between R&D creators, producers, financiers and Transport SMEs marketers by creating a mechanism that facilitates the valorisation of research results. The various elements of R&D valorization (researchers, financiers, producers and marketers) come from the region and there should be an interaction between researchers and transfer of experience between research supplier and Transport SMEs. The concept of a deficit in R&D expenditures has recently served as a crucial focusing device for research and innovation policy in the EU. In relevant studies it is assumed that R&D support mechanisms must strengthen the R&D take-up critical system links oriented to market-driven R&D efforts. The support actions for strengthening this interaction are limited by:
• Low-level accessibility of R&D results by Transport-SMEs, due to internalities of research efforts;
• Weak knowledge transfer mechanisms among researchers and Transport-SMEs;
• Lack of policies for creating links between science and the Transport-SMEs sector;
• Fail to meet a critical mass of R&D results for Transport-SMEs due to isolation and lack of interregional cooperation.
There is a need to create sustainable links between the Transport-SMEs sector and the academia through market driven actions facilitating access and support to R&D results.
Actions Needed:
• To adopt a systematic approach on identification and exploitation of potentially marketable R&D results to Transport SMEs;
• To bring together researchers and Transport-SMEs across SWO, thus contributing to the creation of a regional innovation market;
• The mechanism can be easily expanded to other regions and research areas by bringing in more partnerships.
The methodology adopted should include the following steps:
• Identification of R&D results created by research centers in the region that have market potential for Transport-SMEs;
239 | P a g e
• Creation of a regional pool of experts that can offer their advice on market potential, technical feasibility, scientific relevance and funding opportunities in Transport SMEs sector;
• Assessment by the experts of Transport SMEs market potential of selected R&D results;
• Development of exploitation plans and valorisation agreements for the most promising of the assessed R&D results and support of their valorisation potential to Transport-SMEs;
• Systematically promote linkage between research and Transport-SMEs through focused brokerage events.
These steps will be complemented by:
• The co-operative research program has to connect Transport-SMEs to academics and researchers to encourage collaboration;
• Technology transfer companies have to operate, along with successful investment schemes, to help universities/researchers target investment in new technologies in Transport SMEs area;
• The scheme should set-up start-ups and incubators, accelerators and research results transfer brokerage agencies to deliver R&D results to Transport SMEs in SWO.
SWO region is not capitalising on its public investment in research & development. There is a low proportion of researchers working in business and academic-industry research publications. Business sector prefers to ‘adopt or modify existing innovations’ and SWO region should improve the modest performance on innovation, particularly in getting new products to market.
Reasons for this shortage in R&D-SMEs connection included poor management skills, inadequate networking and collaboration, poor levels of venture and private equity capital, fragmented and obstructive government regulation, an isolated economy dominated by small businesses, and risk aversion.
How can SWO region boost collaboration?
The forthcoming innovation to rethink complexities in the block funding scheme for research. There are opportunities to adopt global good practice in collaboration, such as the UK’s Catapult initiative – a network of world-leading centres designed to transform the UK’s capability for innovation in seven specific areas and help drive future economic growth.
Assessing the balance between individual and program grants could shift research toward more long-term goals. It is time to address the gap between the point when research funding ends and investment begins.
SWO region needs teams of managers with the expertise to translate promising early research into commercial development in Transport SMEs sector. These people – venture catalysts – could work with inventors to package opportunities for investors. In this system, they could work across universities and research institutes to secure a sufficient flow of viable deals to SWO region’s Transport SMEs.
Know where to start and be clear about the goal
SWO’s economy, with all its strengths and weaknesses, is our setting. It is not fulfilling its potential as measures of activities such as industry-university engagement make clear. The task is to make the SWO regional economy more innovative, more productive and more diverse. It must begin with a realistic assessment of the circumstances, and build on evidence, to fulfil the ambition for an innovative regional economy where Transport-SMEs become more innovative.
240 | P a g e
Partnerships between universities and businesses are nothing new, but these partnerships have become especially relevant in the face of increasing economic pressure and global competition, the need for interdisciplinary approaches and the growing complexity of the problems need solutions. In these years, there should be strong partnering between academic institutions and region’s Transport SMEs to address many of the modern challenges to advancing research, innovation and technological development.
Researchers have to stipulate how they are going to share the results of their research with the actual and potential users of that research: Transport SMEs in SWO region. The objective is to focus in localized and specific problematic areas in the region’s Transport SMEs sector where the potential of improvement and innovation is large, to diagnose the situation and propose new and efficient solutions supported by technical/scientific methodologies. Joint projects allow both collaborators, academia/R&D and Transport SMEs, to smoothly define their roles, achieve high levels of personal trust and design achievable expectations within their competencies, which are the basic foundations to successfully develop large and risky research projects. This model of collaboration has a set of benefits:
• Training of young engineering students for an active problem-solving attitude, within a systemic industrial perspective;
• Smoothness of the students transition to their professional life in transport SMEs;
• Promotion of a collaboration culture between region’s transport SMEs and academic institutions/R&D centres for real problems-solving and for continuous improvement and innovation processes.
3.6 How are Transport SMEs Innovation and / or Products Financed?
West Midlands
United Kingdom
LEP Access to Finance
It is important to note that, across the LEPs in the WM, there is strong evidence of cross LEP working, particularly in the area of access to finance (A2F). The LEPs have formed a cross LEP working group to explore joint approaches to A2F interventions and there is agreement across all of the SEPs that there is scope for a joint intervention on A2F. 201
Enterprise Finance Guarantee (EFG)
EFG facilitates lending to UK small businesses and is managed by the British Business Bank. Since its launch in 2009, EFG has supported the provision of over £3.2bn of finance to more than 30,000 smaller businesses in the UK (as of 2017). At Budget 2017 on 22 November, the
201 https://www.british-business-bank.co.uk/wp-content/uploads/2016/10/West-Midlands-Area-Overview-13-2.pdf
241 | P a g e
Government announced it would extend the programme for a further four years, enabling them to guarantee up to £2bn of lending over that time. They will be taking on new lenders and offering a new asset finance option, which will enable them to further diversify the lending available to smaller businesses that want to invest and grow.
EFG facilitates lending to smaller businesses that are viable but unable to obtain finance from their lender due to having insufficient security to meet the lender’s normal security requirements. In this situation, EFG provides the lender with a government-backed guarantee of up to 75%, against the outstanding facility balance, potentially enabling a ‘no’ credit decision from a lender to become a ‘yes’. EFG supports a wide range of business finance products:
• Revolving facilities, such as overdrafts
• Invoice finance facilities
• Asset finance facilities
To be eligible for support via EFG, the small business must:
• Be UK based, with turnover of no more than £41 million per annum
• Operate within an eligible industrial sector (a small number of industrial sectors are not eligible for support)
• Have a sound borrowing proposal but have inadequate security to meet a lender’s normal requirements
• Be able to confirm that they have not received other public support of de Minimis state aid beyond €200,000 equivalent over the previous three years
EFG guarantees loans to fund the future growth or expansion of a business, from £1,000 to £1.2 million. Finance terms are from three months up to 10 years for term loans and asset finance and up to three years for revolving facilities and invoice finance. It’s simple to apply and should take no longer than a standard loan application. Any small business interested in EFG should, in the first instance, approach one of the 40+ EFG accredited lenders with their borrowing proposal. If the EFG lender can offer finance on normal commercial terms without the need to make use of EFG, they will do so. Where the small business has a sound borrowing proposal but no, or inadequate security, the lender will consider the small business for support via EFG. Decision-making on whether a small business is eligible for EFG is fully delegated to the 40+ accredited EFG lenders. These lenders range from high-street banks, to challenger banks, to asset based lenders, through to smaller specialist local lenders.
• As with any other commercial transaction, the borrower is always responsible for repayment of the full value of any facility supported by EFG
• The EFG guarantee is to the lender and not the small business
• All small businesses supported via EFG are required to pay a 2% annual fee to the government, as a contribution towards the cost of the scheme
• This fee is payable on a quarterly basis and is collected by direct debit, directly from the small business’s bank account. 202
Demand for and Take-up of External Finance
202 https://www.british-business-bank.co.uk/ourpartners/supporting-business-loans-enterprise-finance-guarantee/about-efg/
242 | P a g e
The Small Business Survey (SBS) provides insights for the UK as a whole on the demand for different types of finance by region, but unfortunately it is not available regionally. The SME Finance Monitor – set up by the Business Finance Taskforce in 2010 - does provide some insight into the demand for finance from SMEs in the regions and the extent to which they are successful in obtaining the finance they are looking for. This only covers debt finance, so in looking at equity finance it is only possible to infer messages from the national SBS survey. Also, data is not available sub-regionally.
It is important to note that the regional breakdown of this dataset is subject to substantial margins of error, due to the limited regional samples collected. While it can provide some insight into the picture regionally, it is difficult to identify trends or draw strong inferences when margins of error are factored into the assessment. While the data should be treated as indicative only, it can help to highlight some interesting patterns in the demand and supply of finance.
The regional analysis of SME respondents in the WM in 2013 indicates that 39% of respondents in the region had used finance of some sort in the past five years, whilst 58% had not used finance at all over this period. Just under a third (30%) of SME respondents had used either an overdraft, loan or credit card during this period.
A substantial proportion of SMEs (43%) were classed as a ‘permanent non-borrower’ (PNB), meaning that they have not used external finance in the last five years, have not attempted to borrow over the past 12 months, and have no inclination to borrow in the next three months. This is slightly above the England average of 40%, but given the margins of error around this survey data should not be interpreted as being statistically significant. For the WM this proportion has varied since 2011, falling in 2012 but rising again in 2013.
Small debt finance (sub £150k) is viewed as a particularly high priority. The vast majority of respondents identified this area as either a priority. Subsequent questions which sought further detail on the purpose of small loans required were asked again on the basis of prioritisation. Loans for SME expansion were most frequently identified as a priority (by 90% of respondents) with loans for skills development, research and innovation and business start-up all being highlighted by substantial proportion of respondents (circa 70%).
Other survey findings relate to:
Loans / mezzanine finance: The majority of respondents saw loans/mezzanine finance for expansion as priority within the SME loans / mezzanine funding category. A substantial proportion also highlighted loans for research and innovation, MBO/MBIs (management buy-out and management buy-in) as well as loans to support inward investment and relocation.
SME Loan Guarantees: this area was frequently prioritised although it is not clear in what way this provision would need to be distinct from national guarantee schemes. The responses indicate that most respondents see this as most relevant to micro businesses. The view that further provision is needed in this area echoes that expressed by numerous consultees that EFG might not be fully meeting the needs of businesses in the region.
Finance for medium sized businesses: This encompasses debt and equity. The frequency with which this was prioritised by respondents highlights a strong view that the finance gap in the WM extends beyond smaller businesses.
Equity: Although a smaller proportion of respondents highlighted SME Equity Finance this category is still prioritised by 60% of respondents. For the respondents who highlighted this category, the majority (89%) indicated that early stage growth equity (<£500k) was a priority. A similar proportion (83%) highlighted start-up equity (<£250k as a priority).
243 | P a g e
Assuming the experience of SMEs in the region is similar to those in the UK as whole, this analysis suggests that:
• In 2012 there were around 23,600 SMEs in the region looking for external finance, of which 17,700 were microbusinesses. Some of these microbusinesses will have been seeking microfinance; others will have been looking for larger amounts.
• Of these, nearly half (47%) had difficulties of some sort in obtaining this finance
• 7,600 (32%) of SMEs obtained none of the finance they were looking for, and 1,400 received some, but not all of what they were seeking (national data indicates that the likelihood of successfully obtaining finance varies directly with business size, micros having most difficulties, easing with size increases).
• 5,100 SMEs that had a need for finance did not apply, for the reason that they thought they would be rejected (there is no further detail available from the survey on why they thought they would be rejected). Majority were micro businesses.
Small Business Grants
Small business grants remain one of the best sources of funding available to new, developing and established SMEs. The majority of business grants are funded by national, local and EU government to support deprived areas, to stimulate technological advance through research and development and to make the economy (local and national level) more competitive in a specific sector. Overall these grant schemes, whether private or public generally seek to empower SMEs to grow the economy and in the process, create jobs.
Personal Funds, Memberships and Accounting
Businesses formed in the last five years were more likely to have injected personal funds into their businesses – 77% of those aged 1-5 years, and 83% of start-ups. 63% of SMEs in the transport, retail and distribution sector had used personal funding in the last three years. It was also the case that those who sought finance in the last three years were more likely than average to have used personal funds (64%).
By sector, regular accounting was more likely than average in transport, retail and distribution (54%). Those that had sought finance in the past 3 years were more likely to have regular accounting (54% compared to 45 % of those that have never sought finance).
28% of SMEs are members of a business representative organisation. This was most likely to be sector specific (51 % of those who are members of an organisation), with 36% being members of FSB, 10% members of the British Chamber of Commerce, 2% members of local Chambers of Commerce, and 1% respectively members of the Institute of Directors and Forum of Private Businesses.
Those in business services (42%) and technology businesses (35%) were more likely than average to be members of a business representative organisation, as were the more established businesses (31% of those trading for 10 years +).
28% of SMEs had a formal business plan. This was more likely to be the case among social enterprises (47%), start-ups (52%) and businesses aged 1-5 years (47%, compared to just 19% of those aged 10 years +). By sector, business plans were more likely to found in technology businesses (37%), and were least likely in construction (15%). 38 % of those that had sought finance in the past three years had a business plan, compared to 24% of those that had never sought finance.203
203 https://www.british-business-bank.co.uk/wp-content/uploads/2013/10/SME-Journey-Towards-Raising-Finance.pdf 2013
244 | P a g e
Bank Loans
Bank overdrafts were the most frequently used form of finance for companies aged 10 years or more (37%, compared to just 12% of start-ups). They were most used in the construction (39%) and transport, retail and distribution (38%) sectors, and least used in production (25%), information/communications (24%), other services (22%) and by ‘technology’ businesses (25%).
As was the case with bank overdrafts, Bank loans and commercial mortgages were most often used by companies aged 10 years or more (16%, compared to 9% of start-ups). They were most common in the production sector (22%) and transport, retail and distribution (18%). Female-led businesses were less likely than average to use these (10%).
Loans from family, directors and partners were almost as likely to be used by micro businesses as they were to SMEs. By age of business, these were most likely to be given to businesses of 1-5 years (29%). By sector they were more often used in transport, retail and distribution (22%) and engineering/pharmaceutical manufacturing (22%), but not technical testing/science (5%).
Asset Finance
59% of start-ups and businesses aged 1-5 years were aware of asset finance. 63% of those in production, 74% of those in information/communication, 60% in transport, retail and distribution and 70% in business services were aware. Awareness was again lowest in construction and other services.
Government Schemes
84% of all SMEs agreed that greater awareness amongst banks to direct businesses to appropriate Government schemes would be an improvement. This particularly appealed to micro businesses (87%), social enterprises (95%), those in the transport, retail and distribution sector (88%) and those that had sought finance in the last 3 years (88%). Having simpler or fewer schemes was also a popular idea, with 78% of SMEs saying they would like to see this. This was most likely to appeal to employers (82%), and particularly small businesses (85%) and those in transport, retail and distribution (83%).
There are currently 34 schemes listed on the government repository of funding schemes when filtering for ‘WM’ and ‘Transport & Distribution’. 204 These include Capital and Revenue grants and loans, local growth schemes, access to advice and energy audits, proof of concept funding, access to supply chain opportunities and networks, research grants, and digitisation support.
External Finance
In this section, a summary is presented of the current picture of access to external finance (not grants) for SMEs and micro businesses, from public/private sector regional interventions, in the difficult range below £2m, at LEP and WM level. It represents opinions of the members of Regional Finance Forum (RFF), the Midlands cross LEP group, providers, and others, individually and as a group. The private sector also provides many other fund sources. 205
204 https://www.gov.uk/business-finance-support?industries%5B%5D=transport-and-distribution®ions%5B%5D=west-midlands 205 https://innovationwm.co.uk/2018/04/24/west-midlands-finance-for-small-business-spring-2018-update/
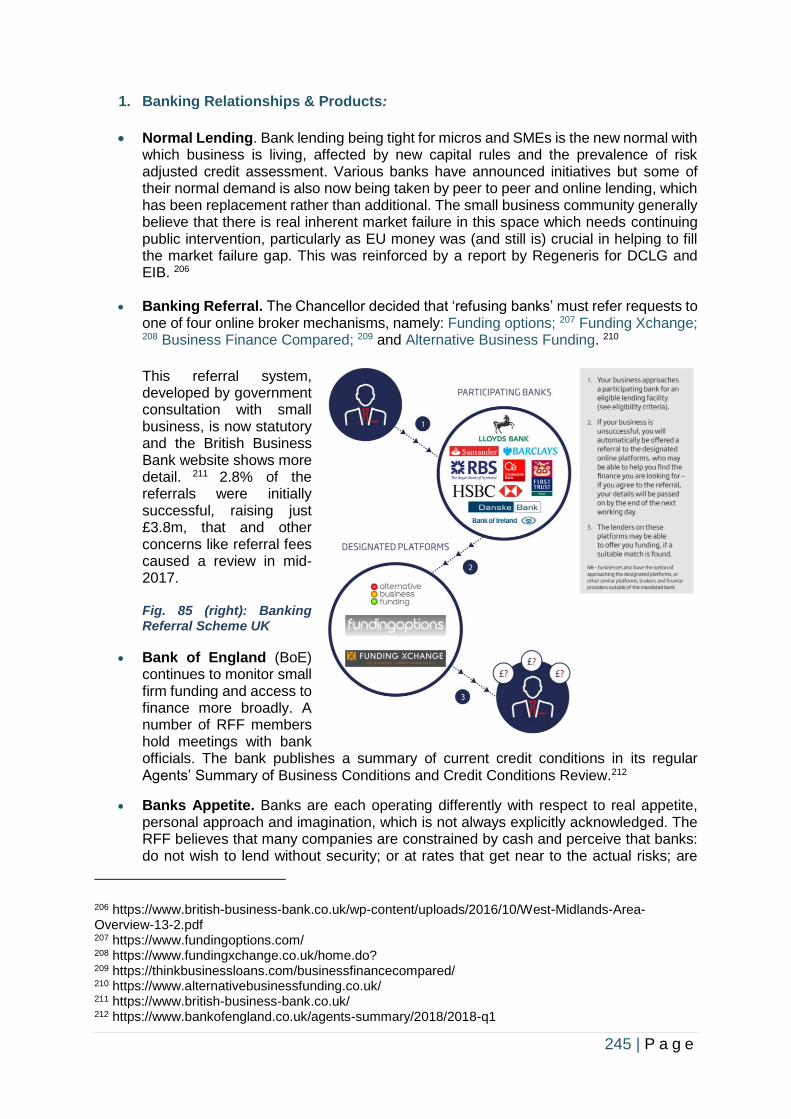
245 | P a g e
1. Banking Relationships & Products:
• Normal Lending. Bank lending being tight for micros and SMEs is the new normal with which business is living, affected by new capital rules and the prevalence of risk adjusted credit assessment. Various banks have announced initiatives but some of their normal demand is also now being taken by peer to peer and online lending, which has been replacement rather than additional. The small business community generally believe that there is real inherent market failure in this space which needs continuing public intervention, particularly as EU money was (and still is) crucial in helping to fill the market failure gap. This was reinforced by a report by Regeneris for DCLG and EIB. 206
• Banking Referral. The Chancellor decided that ‘refusing banks’ must refer requests to one of four online broker mechanisms, namely: Funding options; 207 Funding Xchange; 208 Business Finance Compared; 209 and Alternative Business Funding. 210
This referral system, developed by government consultation with small business, is now statutory and the British Business Bank website shows more detail. 211 2.8% of the referrals were initially successful, raising just £3.8m, that and other concerns like referral fees caused a review in mid-2017. Fig. 85 (right): Banking Referral Scheme UK
• Bank of England (BoE) continues to monitor small firm funding and access to finance more broadly. A number of RFF members hold meetings with bank officials. The bank publishes a summary of current credit conditions in its regular Agents’ Summary of Business Conditions and Credit Conditions Review.212
• Banks Appetite. Banks are each operating differently with respect to real appetite, personal approach and imagination, which is not always explicitly acknowledged. The RFF believes that many companies are constrained by cash and perceive that banks: do not wish to lend without security; or at rates that get near to the actual risks; are
206 https://www.british-business-bank.co.uk/wp-content/uploads/2016/10/West-Midlands-Area-Overview-13-2.pdf 207 https://www.fundingoptions.com/ 208 https://www.fundingxchange.co.uk/home.do? 209 https://thinkbusinessloans.com/businessfinancecompared/ 210 https://www.alternativebusinessfunding.co.uk/ 211 https://www.british-business-bank.co.uk/ 212 https://www.bankofengland.co.uk/agents-summary/2018/2018-q1
246 | P a g e
affected particularly by the risk constraints imposed by official regulation, and shortage/cost of local competence to make detailed assessment. That perception means that they do not even approach banks whose statistics on refusal are therefore significantly understated. Trust of banks and the financial establishment continues low, reinforced by personal experiences and public disclosures. Some of the major banks have recently announced funding initiatives for the region but these are normally directed at the easier high size loans, greater than £200k. Many micro and small companies are using consumer finance such as personal credit cards, with their high interest rates.
• Guarantee schemes. EFG Scheme continues as government support for the main banks and, now, other sources. Three local Community Development Finance Institutions (CDFIs): ART, BCRS and CWRT, are accredited. The national offers are now at the reduced rate of around £300m/ year. Whilst there are complaints particularly around the emerging constraint to only use for shortage of security, it is still an important option for companies. It has full national distribution, is a large public intervention, and is a recognition of the inherent economic market failure, as in other countries, irrespective of security, as banks strive for purely financial not community economic return.
• Asset backed investment. Invoice discounting (with modern variations), and factoring continues to grow and can be crucial in funding working capital growth. That and Fixed asset leasing schemes are endemic and supplied by most large lenders/banks. There are some schemes for government support of 10/20% run through the banks and it goes well alongside normal asset – based lending. Some peer to peer is also involved.
• Exporting. Support is a national and company concern. Positively, there is now
increased government interest in helping exports by the newly branded and developed UK Export Finance.213 Whilst large contracts have always received public support there is now more interest in SMEs too, following an announcement in October 2017. It is partnering with five major high street banks for finance up to £2m for direct exports but also SME suppliers to larger exporters.
2. Non- Bank Loans:
• New entrants. National emphasis is continuing to encourage new entrants of all kinds into the market as a fundamental competition policy. The new referral legislation and action, as above, if take-up does improve, could be a significant move as new entrants will have guided access to existing banks’ customers.
• CDFIs (Community Development Finance Institutions, now also called Responsible Finance Providers). These institutions with some public support to encourage economic development, are crucial to dealing with inherent market failures below around £150k. They lend after a bank decline, as an additional source of finance. All CDFIs nationally and locally are seeing strong demand and are seeking additional capital to lend from local, regional and national sources: public and private, including using a personal tax relief to investors - Community Investment Tax Relief (CITR). They are missing ERDF and the closure of RGF, as a first loss mechanism, which needs some replacement for CDFI successful survival.
• ART Business loans has extended from the Birmingham area, to the wider region in the last three years on loans up to £150k. ART also operates targeted loan funds to
213 https://www.gov.uk/government/organisations/uk-export-finance
247 | P a g e
Birmingham businesses of £10k to £100k in partnership with Birmingham City Council. It is accredited for the Enterprise Finance Guarantee (EFG) scheme.
• BCRS business loans, based in the Black Country, now lends across the WM, up to £150k, with a loan book of around £12.5m. Overall, in the last year it has lent around £4m with an objective of around £7.5m in the next financial year.
o It has used a variety of capital sources including individuals, local authorities, LEPs, Regional Growth Fund, other public bodies and sympathetic lenders.
o It is accredited for EFG, with its valuable practical and reputational support. o In late 2017, BCRS won Midlands Engine Investment Funds of £17m to supply
Small Business Loans £25k to £150k, over the next 5 years.
• CWRT Business loans in Coventry/Warwickshire is less active, lending up to £100k,
but may emerge with new ERDF programmes.
• Impetus in Pershore also lends mostly in Worcestershire and the Marches.
• Big Society Capital. A new £30m national fund for foundation community investment nationwide, including Scotland, has just been announced in Feb 2018 but it is not yet clear about its relevance to the WM.
• Internet Based/peer to peer activity. Established sites identified, include Zopa, Funding Circle, Lending Works, Esme, Assetz, and Funding Knight with others emerging frequently on the net. Thincats, a local player, is now trending away from smaller loans. Rates are commercial and mostly security is required but they lend when banks will not or are not trusted. Most major lenders have applied for FCA approvals, with the market becoming more regulated as viability concerns increase. This activity is now becoming more a challenge to traditional lenders, with less inherent costs, rather than a good value supplement. Peer to peer for equity, including crowd funding, is not so established and there are more doubts about its viability for investors and companies. Finance brokers can recommend fitness for purpose.
• Finance Birmingham
o Loans are still available, but less of a priority, in the £100k to £1m space covering the whole Greater Birmingham LEP area, including Solihull. They are also involved in Government Start up loans for businesses. See below.
o Supply chain funding. Advanced Manufacturing Supply Chain Initiative (AMSCI) is currently closed, but was mainly for WM LEPs run nationally by Birmingham City Council/Finance Birmingham, expanded to a national scheme. It originated to help the automotive supply chain serve growing automotive development and tooling.
• Start Up Loans are a recent product, government backed, delivered from the British Business Bank by local partners. An individual can borrow £500 to £25000, to start or grow a business. This is an unsecured personal loan; but is of course expected to be repaid. Interest rates are 6% per annum and repaid over a period of 1 to 5 years. Currently there is doubt it will continue.
• Midlands Engine Investment Fund (MEIF) has provided a larger loans product between £100k and £1.5m to support scale-up activity across the whole Midlands Engine geography with around £50m available for the WM, delivered by Maven. This is a new product, now available.
248 | P a g e
3. Specific Regional Risk capital and support
Funds established by the former-Regional Development Agency, from single pot and also ERDF, are running down and now replaced.
• Midven, Birmingham based with a team of 17 people, has a portfolio of c. 50 WM companies employing over 500 people, and is the leading WM’ general equity gap firm not concentrating on technology. It provides progressive equity investment from start-up to maturity, with experienced staff to help identify and develop businesses.
o Midven has been equity investing in the region over the last 15 years plus, including
ERDF, and other national and regional UK public funds, in around 10 mainly WM companies each year. Over 30 cash millionaires have been created by Midven portfolio companies, nearly all of them in the WM.
o It has just, in February 2018, been awarded around £35m from the MEIF WM Equity Fund: the main single package of equity from that fund, which is now to invest partially below £250k but up to £2m, into single companies.
o Midven is also raising an EIS fund using the latest government tax benefits for individuals, resulting in the deployment of circa £5m per annum, much of it in the Midlands, to support early stage businesses. It already has experience of investing alongside private money from previous funds.
• Mercia is run out of Henley in Arden, with seven further offices across the Midlands, North of England, and Scotland; over 70 employees, and is now recognised as one of the most significant national high-tech investment businesses after IP group. Mercia has 19 university partnerships (nine in the Midlands) which account for circa 25% of investment activity. It broadly provides a ladder of investment from idea to maturity with experienced staff to help seek and develop technological opportunities. Overall, Mercia invests approximately £50m per annum across the group from managed funds and own resources.
o Mercia has just been awarded the proof of concept package of up to £750k lots (and
much below £250k) for the whole Midlands from the MEIF fund, adding c £23m to its funding, to support its other packages, traditional and new.
o Mercia raises EIS/ Seed EIS Hybrid funds (every year over the last 6 years) to deploy c. £12m per annum, much of it in the Midlands, using the latest government tax benefits for individuals, supporting early stage businesses.
o It has over £330m in third party managed funds for early stage support (venture, growth, and debt)
o Mercia has an additional £50m to selectively scale businesses with high growth potential via its managed funds by investing its own capital from its balance sheet.
o Mercia (as a listed investment business) benefits from the ability to co-invest alongside some of its shareholders, including Woodford investment management and Invesco Perpetual as it has done recently with Psioxus (University of Birmingham spin- out) Abzena (University of Warwick spinout) and Oxford Genetics.
• Finance Birmingham has a comprehensive set of funds available to Greater Birmingham LEP area but also sometimes to the rest of the WM and Nationally. It has recently expanded and reorganised its activities by sectors and arranged them as:
o Growth capital: A variety of financial instruments from £50k to £2m, including loans, venture capital and mezzanine, concentrating on growing business or larger transactions but will consider all opportunities, including start-ups. It is generally
249 | P a g e
available across the WM but with major concentration in the WM Combined Authority and Birmingham.
o Sector Specific Funding. ➢ Advanced Manufacturing Supply chain. Building on WM and Liverpool
initiatives with manufacturing needs; particularly automotive and aerospace (currently closed).
➢ National Rail supply growth. This is a new emphasis based on the growing need and market in rail supply.
➢ National Tooling Loan fund. This is supporting nationwide the design development and manufacture of tooling.
o Property Investment. They are offering flexible loans, potential grants, and equity funding. Particular need has been identified within the WMCA and some adjacent authorities for property and land development support, particularly brown field sites and within niche demands including stalled housing. This matches the perceived needs of the region and includes finance to unlock the growth of property development.
• National funds. There are many national and other commercial venture capital providers in the region such as LDV, but generally in investments larger than £1m. British Business Bank (BBB) in now more active and Innovate UK are also becoming more active beyond grants, launching its Innovation Loans earlier this year.
4. Angel/ Start up activity/personal involvement.
Tax relief for private individuals, investing by the Enterprise Investment Scheme (EIS) and Seed Enterprise Investment Scheme (SEIS), at the seed level is very generous with over £1.5B raised nationwide in the last year at a cost to the exchequer of over £500m in lost tax. A recent report has calculated that SMEs in the WM use less than a third of EIS UK average per SME. The RFF was very keen that focussed encouragement of angels should be part of the MEIF development as there are issues with network costs and it may emerge. Thus, further initiatives are still required.
• Mercia has funds, as above and there are others operating on a smaller scale. • Midven is planning to introduce a new EIS fund alongside its MEIF equity fund. It
expects to deploy around £5m per annum alongside its new MEIF equity fund of c £35m. Wait for details of how angels can be involved.
• Responsible Finance has a system of tax relief for individual investors: CITR. In summary it provides an equivalent up-front tax relief to EIS, but over 5 years, providing an effective minimum 5% per annum tax free interest.
• Minerva with HQ at Warwick Science Park, but presence throughout the region and beyond, has been the major independent regional Angel network with 22 investments in the last 3 years. However, the leader has recently retired, and future is uncertain.
• Each LEP could develop its own Business Angel networks: independent, linked to larger players in funds, or to others in the Business Services community such as CAs /IODS.
• Science Parks. Many of the science parks, which are considered amongst the best in the country, have incubation centres both actual and virtual which can provide signposting to finance people and services, often with the support of public funds. These include Innovation Birmingham, Birmingham University Bizz Inn, Warwick Science Park, Keele University Science and Innovation Park, Malvern Hills Science Park, Coventry University Technology Park, University of Wolverhampton Science Park, and new ones are emerging. They all need angel investors. Many are working
250 | P a g e
with established banks, new peer to peer, and other web-based investors, particularly for technology start-ups. 214 215 216 217 218 219
o Start-ups. There were formerly ERDF funded activities in virtually every LEP area. In the new programme it is not so clear.
o Proof of concept. There are former funds in Staffordshire, Worcsestershire and Cov/Warwickshire, that could be replicated, depending on what replaces ERDF post Brexit.
5. Midlands Engine Investment Fund (MEIF)
The Regional Finance Forum identified the opportunity for a ‘fund of funds’ using recycled AWM and ERDF funds, and EIB borrowings, when AWM closed. They researched and developed the idea with all the WM LEPs and government departments, which has become MEIF. 220
It is a game changer in the amount of funds available and has being added to and organised by the BBB in cooperation with the LEPs. The distributor details were announced on Feb. 20th 2018 and are already covered earlier in this report in the relevant sections but are pulled together here for clarity.
MEIF has the following characteristics:
Approximately £250m has been allotted from ERDF, EIB, BBB, and RDA legacy funds for 5 years, across the whole Midlands i.e. including East and some South East Midlands with the Midlands Engine Investment Fund (MEIF) label. Four Lots have been procured involving the WM within the initially specified framework below. Approx. 10% unallocated.
• Small business loans: initial allocation of total c £17m: Each investment £25 k to £150k. Announced Summer of 2017.
• Debt: initial allocation of total c £90m: Each investment £100k to £1.5m. Announced Feb 2018. Covering the Whole Midlands.
• Proof of concept/ early stage funds; initial allocation of total c £23m: Each investment up to £750k. Announced Feb 18. Covering the Whole Midlands.
• Equity: initial allocation of c £35m; Each investment 20% below £250k, up to £2m. In the WM.
6. Research and Development (R & D) Tax credit
It can be very difficult for SMEs, to raise money for R and D but there is tax relief or tax credit for R and D expenditure, which constitute real cash support. In 2002 the government introduced a scheme to encourage scientific and technological innovation in the United Kingdom which currently costs them over £1bn for SMEs. It has been changed over the years and in 2015 the relief a company can get was increased to 230% of their qualifying R and D
214 https://www.innovationbham.com/ 215 https://www.warwicksciencepark.co.uk/ 216 https://www.keele.ac.uk/business/scienceandinnovationpark/ 217 http://www.mhsp.co.uk/ 218 https://www.coventry.ac.uk/business/facilities/technology-park/ 219 https://www.wolverhamptonsp.co.uk/ 220 https://www.meif.co.uk/
251 | P a g e
costs. The potential tax credit can be up to 14.4% of that qualifying cost if the company is loss-making i.e. c 1/3 of the R and D cost. The definition of qualifying costs is precise, but broadly it involves; seeking an advance in a field of science or technology (not just a company’s own knowledge), and scientific or technological uncertainty that competent professionals can’t readily resolve. It is intended that this is not just about ‘white coat’ R and D and product, but also ‘brown coat’ and processes.
In some circumstances SMES are not eligible e.g. having received a notifiable state aid; doing a project under contract; or not subject to corporation tax. In which case they may be eligible for Research and Development expenditure credit scheme (RDEC), which is less generous and similar to the large company R and D scheme. There are of course strict guidelines on the qualification and relevant costs.
Findings from Interviews & Questionnaires
The funding landscape across our area is improving with increasing amounts of business expenditure on R&D and venture capital investment being reported, but increasing this further, as well as follow-on capital funding to scale up processes, is key to improving our productivity performance. In addition to this private finance, organisations based in our area secured 8% of all Innovate UK grant funding over the 2010-15 period, approximately £247.5m. Proportionately, this is a higher share of Innovate UK funding than our population of firms and universities / HEIs would suggest and indicates the innovative nature of our businesses and the commercial engagement of our academics.
There is, however, a perception of fragmentation of availability of support and funding, with a small number of institutions – Warwick and Birmingham universities, Jaguar Land Rover, and the MTC and WMG Catapult Centres – responsible for a high proportion of the Innovate UK (and other) funding secured by the area. Access to finances – grants and equity finance is very variable, still a lot of blockages as to what is out there and who can help SMEs. There is a referral network in the region between the various business support organisations, signposting to support services, venture capital and business support. ERDF new call for applications expected with a focus on all priority axis, final round for Coventry and Warwickshire, delayed throughout Brexit. Members of the Chamber (Coventry and Warwickshire) can access funding provision of up to 30% through programmes such as ERDF.
Banks are still risk averse, challenges around security, lack of assets will be a barrier, if after smaller sized grants then more of a chance perhaps, if you can’t cash flow it and defray it is a problem, larger level grants can be a challenge, uncertainties over the future of Horizon 2020 framework funding programme after Brexit and the involvement of UK based partners.
Campania Region
Italy
How are Transport SMEs Innovation and / or Products Financed?
252 | P a g e
Introduction
In Paragraph 3.3 we have extensively described both organization and policies for the development of mobility and transport in Italy and in Campania Region. We have highlighted – see subparagraph 3.3.2 – that the policies for the development of Small and Medium- Enterprises operating in the region are part of a wider intervention for the development and sustainability of transport and mobility. This sustainability is intended in terms (ì) environmental (low emissions and innovation) and (ii) social (safety, reliability, efficiency).
We also described the areas in which regional policies are most common: - Local Public Transport;
- Rolling stock and boat;
- Road, rail, port and logistics infrastructure;
- Sustainable Mobility;
- Biking Mobility.
In this paragraph we will describe the financial policies implemented by the Campania Region that can promote the development of SMEs in the area.
Finally, we will describe an interesting example of the implementation of these policies aimed at the development of SMEs in the transport sector, which we believe could become a good practice.
Funding from the Campania Region for Transport and Mobility Development
The interventions of the Campania Region in support of the Local Public Transport are aimed at
- share public transport charges;
- minimum efficiency levels from companies that perform TPL services;
- specific pricing policies to encourage the use of public transport over private cars;
- purchase of new rolling stock and ship for the provision of services.
In order to promote the infrastructure development aimed at both the Local Public Transport and other transport sectors (freight, logistics, etc.) and mobility planning (biking, electric, pedestrian), Campania Region intervenes with the resources derived from:
- Community funds (FESR, ESF).
- National Funds (FSC / PAC / Other Funds).
- Local funds.
These resources are thus directed as follows:
1. European Regional Development Fund (ERDF) - Seven-year programming. Current Schedule: 2014-2020
- Key Thematic Goals for the Infrastructure:
- OT4. Supporting the transition to a low-carbon economy;
- OT7. Promoting sustainable transport and improving network infrastructure.
2. Development and Cohesion Fund (FSC) - Seven-year programming. Current Schedule: 2014-2020
- Main development lines for infrastructure:
- Road works;
- Interventions in the railway sector;
- Interventions for urban and metropolitan transport;
- Securing existing infrastructure assets;
- Interventions for infrastructure security, multi-modal and sustainable mobility in the
regional and urban areas, accessibility to urban nodes, strengthening the links of
secondary nodes to the TEN-T network for the major islands);
253 | P a g e
- Local rail and rubber public transport material renewal
- Interventions for rail safety.
An example of the implementation of regional policies for the development of transport
companies in Campania
The Campania Region in September 2018 defined the guidelines of an intervention called "Campania 2020 - Sustainable and Safe Mobility" to encourage public demand of innovation for sustainable and safe mobility, also with the aim of fostering the experimentation in actual environment, and supporting research and innovation projects, through open and formalized coordination mechanisms between actors of the technological supply chain, integration between research-enhancing actions, development of radical innovations, testing of new models, technological transfer and dissemination of enabling technologies to SMEs.
To this purpose, the Campania Region is investing 50 million of Euro on Axis 1 – R&D and Axis 2 – ICT and Digital Agenda of POR FESR Campania 2014/2020.
The aims of the Regional Administration are to promote:
a. greater efficiency of the infrastructure network using innovative technologies that enable vehicles to develop “smart” mobility within the framework of a technological ecosystem conducive to interoperability between infrastructure and next-generation vehicles;
b. facilitation of mobility, access and movement in urban centres, including through forms of shared mobility, with benefits for weakest groups (disabled, elderly, etc.) and so-called vulnerable people (e.g. pedestrians and bikers);
c. the spread of models that enable all citizens to benefit from the advantages of safer traffic, less polluting vehicles and more advanced technological solutions;
d. the technology improvement of companies – particularly SMEs – and development of smart services and solutions for sustainable and safe mobility, in particular in the following areas:
i) smart roads, ii) connected vehicles, iii) technologically advanced road infrastructure, iv) systems for self-driving cars, v) technological innovations for the goods and logistics sector;
e. the implementation of investment programmes with very high scientific, technological and employment implications through the involvement of Campania’ Municipalities, research institutions, universities and companies operating in the field of sustainable and safe mobility.
South Aegean Region
Greece
254 | P a g e
How are Transport SMEs Innovation and / or Products Financed?
The most common financing methods of transport companies in the RSA are self-finance from company’s own resources and bank loans. Car renting companies also use leasing services.
Public funding has been also used but not so extensively from transport SMEs. According to RIS 2012, a substantial investment has been made in support of local SMEs expansion by 1100 new investments supported and realised in tourism, manufacturing, trade and services funded through relevant programmes and the development law. Those programmes are market-focused but still include elements of research and innovation. The main drawback is the limited budget and the administrative / bureaucracy barriers.
Transport SMEs in rare cases use EU-funded research projects mainly to fund research and pilot/demonstration activities. There are many available funding schemes like the Horizon2020, Connecting Europe Facility, the European Fund for Strategic Investments (EFSI), Green Shipping Guarantee (GSG), as well as Interreg, Smart Cities and Communities, CIVITAS etc. For example, Kythnos island aims to be upgraded into a smart island using EU funds, alternative financing models and PPPs. The realization of the Master Plan will be strongly supported by the Municipality of Kythnos, the local stakeholders, entrepreneurs and local organizations with significant track record in shaping the island’s sustainable energy and mobility profile.
Lithuania
Lithuania
How are Transport SMEs Innovation and / or Products Financed?
Most common way to fund innovation for Lithuanian transport SMEs is EU Structural and Investment Funds. According to the agreement between Lithuania and EU, during the period of 2014-2020, 8,386 billion euros was devoted. In order to effectively spend this money, 11 priorities areas were identified. Some of these priorities are directly suitable for transport companies:
1. Priority 1: promotion of R&D and innovation (703,15 million euros); 2. Priority 2: promotion of the information society (235,94 million euros) 3. Priority 3: promoting the competitiveness of small and medium-sized enterprises
(541,60 million euros); 4. Priority 4: energy efficiency and promotion of renewable energy sources creation and
use (848,22 million euros); 5. Priority 5: environment and sustainable use of natural resources, adaptation to climate
change (789,35 million euros) 6. Priority 6: sustainable transport, promotion of core networks infrastructure (1,180.48
million euros)
255 | P a g e
Lithuanian transport SMEs can apply for many various financial measures. Measure “Inočekiai” total budget is 5 000 000,00 EUR. Already, there are 73 signed contracts and 1 780 000 EUR has been granted. Potential applicants are legal entities that carry out or intends to carry out R&D activities. This measure finances these activities: providing innovative vouchers for R&D projects, provision of innovative vouchers for technical feasibility studies for R&D work or planned R&D activities. Another important support measure for SMEs in Lithuania, which is also funded by European structural funds is “Inostartas”. Measure total budget is 9 400 000,00 EUR. Until now, there are 15 signed contracts and 273 962,71 EUR has been granted. Potential applicants are SME business entities operating for up to 12 months from the date of registration; SMEs operating for at least 12 months and up to 36 months from the date of registration of the activity; knowledge-intensive SMEs operating for at least 12 months from the date of registration. Companies can get financing for these activities: promotion of the creation of innovative small and medium-sized business entities in the implementation of phases 2–6 of R&D activities; recruitment of researchers and/or scientists in knowledge-intensive SMEs and, at the same time, the development of SME products for their commercial realization; promoting the development of innovative small and medium-sized business entities by implementing R&D activities stages 7-9, which are specified in R&D Phase Classification Specification. Third support measure is “Intelektas. Bendri mosklo ir verslo projektai”. Total budget of this measure is 174 213 512,00 EUR. 268 business entities already signed contracts and received 150,67 million EUR. Potential applicants are private legal entities (except science and education institutions) which implements R&D activities. Activities financed by this measure include: research and (or) development; enterprises initial investments to create new or expand existing company R&D and innovation infrastructure which is not available in public or clusters; certification of new products and technologies and related activities. One more financial measure is “Eco-inovacijos LT+” with a budget of 86 886 005,00 EUR. At this moment, there are 56 signed contracts with and granted 22,39 million EUR. Potential applicants for funding are SMEs. Activities which can be funded are the introduction and promotion of technological eco-innovations, which in general reduce the negative impact of economic activity on the environment, encourage more environmental-friendly processes and equipment. It is important to note, that there are many more financing measures which were not mentioned in this document.
Another prevalent way to finance various activities is private company financing. Transport SMEs tend to invest their own funds into modernisation of processes, infrastructure, labor force, etc. Considering Lithuania and other European countries rising economies after global economic crisis, transport companies used this chance to invest their own saved funds to grow competitive advantages over the others.
Transport related companies also has opportunity to seek help from banks and credit unions. These business finance institutions tend to provide loans when the need is for a larger amount and for a longer period of time: the loan amounts usually range from EUR 20,000, with a repayment term of several years. With the need for such funds, banks and credit unions may be able to borrow more cheaply, but most often require loan collateral and high risk assessment requirements for the company. It is worth mentioning that transport sector in general according to banks is considered to be risky, which means, that they are relatively conservative when it comes to financing. As a result, such financing is more often available to older and larger companies, and the loan process itself takes quite a long time. At the time, 7 banks in Lithuania are holding a bank or a specialised bank license, while 9 banks are carrying out their activities as foreign bank branches. The two largest banks registered in Lithuania are AB “SEB” bank and “Swedbank” AB.
An alternative to bank business financing is business loan companies, which are more flexible in their risk appraisal and therefore lend quickly, but more costly than banks or unions. Most business loan companies, like banks, focus on larger amounts of business loans. Therefore, as an alternative to these, there are peer-to-peer funding platforms (P2Ps) on the market that
256 | P a g e
allow people who have some free money to invest into upcoming products and innovations and give business more flexibility to borrow.
Another segment of business loan lending is the micro-business loan companies, which finance companies up to EUR 10 000 from the early stages of their life. This financing sector use flexible risk assessment, with a strong focus on assessing the credibility of the entrepreneur himself, which means that finance is available to a wider range of companies and borrowing is very quick. Usually a small amount of funding, ranging from a thousand to several thousand euros, is provided for a period of a year or two.
Transport SME can also ask for help from INVEGA. It is a financial entity incorporated by the State. The main objectives of the operations of the entity are as follows: provision of financial services and implementation and administration of financial and other support measures for SMEs. INVEGA is performing national promotion institution functions in the field of commencement, implementation and development of operations (including innovations) of SMEs. The operations of INVEGA are aimed to implement State-financed measures intended to support SMEs at the stages of activity commencement, implementation and development, to create and/or retain jobs and improve competitiveness.
Lithuanian private equity and venture capital entities provide finance. Private equity financing is intended for small and medium companies which receive the opportunity to expand rapidly and in a controlled way without bank loans or traditional means of financing. Venture capital is a means of financing for startup companies with high growth potential. In Lithuania, there are around 10 private equity and venture capital companies which can provide financing for transport SMEs. Some of these are: “Practica Venture Capital”, “LitCapital”, “Livonia Partners”, “Lithuanian Business Angels Network – Litban”.
South-West Oltenia
Romania
How are Transport SMEs Innovation and / or Products Financed? European Union Funding Sources
• Sectoral Operational Programmes for Transport SMEs Competitiveness
Priority Axis 2 - Improving the competitiveness of small and medium-sized enterprises; Investment Priority 2.2 - Support the creation and expansion of advanced production capacities and service development - 20,700,000 Euro Competitiveness Operational Programme 2014-2020
• Start-up Nation programme for SMEs Competitiveness of Enterprises and Small and Medium-sized Enterprises (COSME)
257 | P a g e
Helps businesses get off the ground, access to financing and provides tools and supports for business development and economic growth, research, development and innovation in targeted sectors, including the Transport-related SMEs.
• EU Framework Programme for RDI – Transport SMEs
• National programmes funding for RDI – Transport SMEs
• Private funding
Private money investing is the reverse side of hard money lending, a type of financing in which a borrower receives funds based on the value of real estate owned by the borrower. Private Money Investing (‘PMI’) concerns the SOURCE of the funds lent to hard money borrowers, as well as other considerations made from the INVESTOR’S side of the equation. Without these private, non-institutional investors, hard money would not exist. Investors range from private individuals, trusts, and LLCs to pension funds. Individual investors generally have substantial knowledge and experience in real estate or trust deed investing. Individual investors are tending to pool their money with other sophisticated investors through pooling via Private Money Bankers, also known as Real Estate Bankers, or Private Real Estate Bankers. The motivation for investing includes: the simplicity of the underlying investment and a desire for:
1. An investment secured by real estate 2. Regular income derived from monthly dividend distributions; 3. Higher yields than those available from investing in money market funds or bonds; 4. An Active involvement in real estate finance.
• Own business capital
Own business capital is any economic resource measured in terms of money used by entrepreneurs and businesses to buy what they need to make their products or to provide their services to the sector of the economy upon which their operation is based, i.e. retail, corporate, investment banking, etc.
• Banking credit institutions Banking institutions are corporations that provide services as intermediaries of financial markets. Broadly speaking, there are three major types of financial institutions:
• Depository institutions – deposit-taking institutions that accept and manage deposits and make loans, including banks, building societies, credit unions, trust companies, and mortgage loan companies;
• Contractual institutions – insurance companies and pension funds
• Investment institutions – investment banks, underwriters, brokerage firms. 1. Financial institutions can be distinguished broadly into two categories according to
ownership structure: Commercial Banks and Cooperative Banks.
Some experts see a trend toward homogenisation of financial institutions, meaning a tendency to invest in similar areas and have similar business strategies.
258 | P a g e
• Business Angels
A business angel (also known as an angel investor, informal investor, angel funder, private investor, or seed investor) is an affluent individual who provides capital for a business start-up, usually in exchange for convertible debt or ownership equity. Angel investors usually give support to start-ups at the initial moments (where risks of the start-ups failing are relatively high) and when most investors are not prepared to back them. In the last 50 years the number of angel investors has greatly increased.
Existing funding schemes type Business Angels
1. Business Angels Romania Promoting the business angels type investments. 221
2. TechAngels
Facilitating the development of tech businesses from South-Eastern Europe through investment, expertise and connections. 222
3. Angel Connect Investment opportunities, to SMEs new developments in various industry sectors (including transport sectors); members benefit through business growth and investment plans.
• Venture Capital & Financial Corporate Venturing Venture Connect: promoting investment in SMEs. 223
• Asset Finance Asset financing refers to the use of a Transport SME’s balance sheet assets, including short-term investments, inventory and accounts receivable, to borrow money or get a loan. The Transport SME borrowing the funds must provide the lender with a security interest in the assets. This differs considerably from traditional financing, as the borrowing company must simply offer some of its assets to quickly get a cash loan. Various needs are: IT equipment, new fleet of vehicles for logistics, new plant or machinery to replace the obsolete machinery for the business to grow. Asset-based finance is usually done when the normal routes of raising funds is not possible, such as the capital markets (selling bonds to investors) and normal unsecured or mortgage secured bank. This is often because the Transport SME has no other capital raising options or immediate capital for project financing needs (such as inventory purchases, mergers, acquisitions and debt purchasing). Asset-based lending, once considered a last-resort finance option, has become a popular choice for companies that don't have the credit ratings, track record or patience to pursue more traditional capital sources.
• Crowdfunding
221 http://businessangelsromania.ro/en/ 222 http://www.techangels.ro/ 223 http://www.romanianstartups.com/event/ventureconnect/
259 | P a g e
Crowdfunding is the practice of funding a project or venture by raising small amounts of money from a large number of people, typically via the Internet. Crowdfunding is a form of crowdsourcing and alternative finance. In 2015, over US$34 billion was raised worldwide by crowdfunding. 224 Although similar concepts can also be executed through mail-order subscriptions, benefit events, and other methods, the term crowdfunding refers to Internet-mediated registries. This modern crowdfunding model is generally based on three types of actors: the project initiator who proposes the idea or project to be funded, individuals or groups who support the idea, and a moderating organisation (the ‘platform’) that brings the parties together to launch the idea. Crowdfunding has been used to fund a wide range of for-profit, entrepreneurial ventures such as artistic and creative projects, medical expenses, travel, and community-oriented social entrepreneurship projects.
3.7 SWOT Analysis
West Midlands
United Kingdom
Strengths Weaknesses
One of the most accessible locations in the UK.
Upgraded transport network and infrastructure, improving connectivity, productivity and movement of goods
Historic and cultural significance of transport sector and related industries in the region, birthing ancillary services and products.
Strong and stable economy, growth potential through strategy and policies.
Political support for the industry and innovation, nationally and regionally.
Very strong research clusters, manufacturers (OEM's and Tier 1 suppliers)
Huge congestion problem on key route network (comprising 7% of entire network yet accounting for 50% of traffic volume), impact on traffic flows and public transport
Midlands Engine, Midlands Connect skewed focus across regions, East vs West.
Skills shortages to fulfil innovation potential
Gaps in business support provision
Skills gaps and knowledge
Some transport modes concentrated in one or two localities, e.g. Metro
224 https://www.startupcafe.ro/taxe/crowdfunding-fonduri-antreprenori.htm
260 | P a g e
Specialisms and trade bodies across major modes of transport - planes, trains and automobiles (aviation, rail and road).
Potential for cross modal transport initiatives and concepts, integrated transport, Mobility as a Service models
Home to world leading universities, science parks and incubators.
Combined authority for spreading of funds and resources across wards and districts.
Joined up policy approach through Transport for West Midlands.
Manufacturing remains the largest industry in the region.
WM commercial innovation activity and investment is moderate by UK standards and lower than international competitors.
Innovation gaps are generally larger for Greater Birmingham and Solihull LEP and the Black Country LEP than for Coventry and Warwickshire.
Stagnant growth for SMEs
SMEs time constrained, many not accessing the support available or unsure how.
Some gaps in broadband and energy provision.
R&D can be concentrated in larger manufacturers.
Complex and complicated funding streams for SMEs, the less experienced or less networked in companies may struggle to access the resources they need.
Opportunities Threats
There is scope for an increased role for sustainable travel.
Hub / cluster for intelligent mobility, reputation for transport innovation and inward investment.
Home of 'Future Mobility' built from successful partnership working.
Pioneer of driverless car technology and 5G testing.
Different and innovative funding and procurement models post-Brexit.
Emerging products, services and sectors as a result of and preparing for environmental concerns. (Low Carbon / Circular economies).
WM firms are successful exporters, posting the fastest export growth of any UK region. It's also the only region exporting the majority of its products and services to China. There are a number of planned infrastructure projects that look set to deliver a significant boost to the region’s prosperity.
Brexit, disruption to manufacturing, supply chains, investment and movement of goods and services
Businesses may not be ready to trade post Brexit
HS2 Delays in delivery, over budget
Competition for 'smart city', 'living lab' status with other regions in the country, namely London, Bristol.
Pace of societal change, innovation and competition.
Emergence of disruptive industries and technologies such as Robotics, AI, VR and 3D Printing.
Global supply chain disruption, risk of global recession, geopolitical instability and uncertainty.
Delivering on a low carbon future, cutting emissions through transport and innovation on time to government and international recommendations.
261 | P a g e
The Midlands Engine, which was launched in 2016, is a multi-million-pound initiative to boost productivity in the region. This will include investment in transport designed to tackle congestion, a new university to create a pipeline of skilled graduate engineers and £250 million of growth funding for small businesses.
The HS2 rail link is also hailed as having the potential to boost Birmingham’s economy by £1.4 billion through reduced journey times between the Midlands, London and the north
Table 94: SWOT Analysis, WM
Campania Region
Italy
SWOT Analysis
The results of the swot analysis are shown below, which will form the basis of the comparison with the stakeholders in order to identify the issues of this report to be analysed.
Strength weakness opportunities threats
Strenght Weakness
The Campania region is the national area where
the population is younger
High youth unemployment rate (53.6%)
Presence of Universities, Departments and
Research Centres specialized in transport
sectors
Fragmentation of the productive plants that limits
competitiveness on international scale
High concentration of graduates in technical
scientific subjects and high qualified researchers
Poor capitalization of SMEs and difficulties in
accessing the capital market
Strong and articulated transport policy Infrastructural and management bottlenecks
262 | P a g e
Innovative SMEs in transport and mobility
services sector
Limited integration of the logistics system with
the production and industrial system
Infrastructure and geographical position Presence of social institutional constraints
ZES (Special Economic Zone)
Possibility of accessing structural funds
Opportunites Threats
Digital transformation The introduction of new tariffs
Income per capita growth in emerging countries Innovation in consumer behaviour
The development of e-commerce Change in transport culture
Development of national, European and
international synergies between SMEs and the
research world
Table 95: SWOT Analysis, Campania region
South Aegean Region
Greece
SWOT Analysis
Positive
for reaching the objectives
Negative
for reaching the objectives
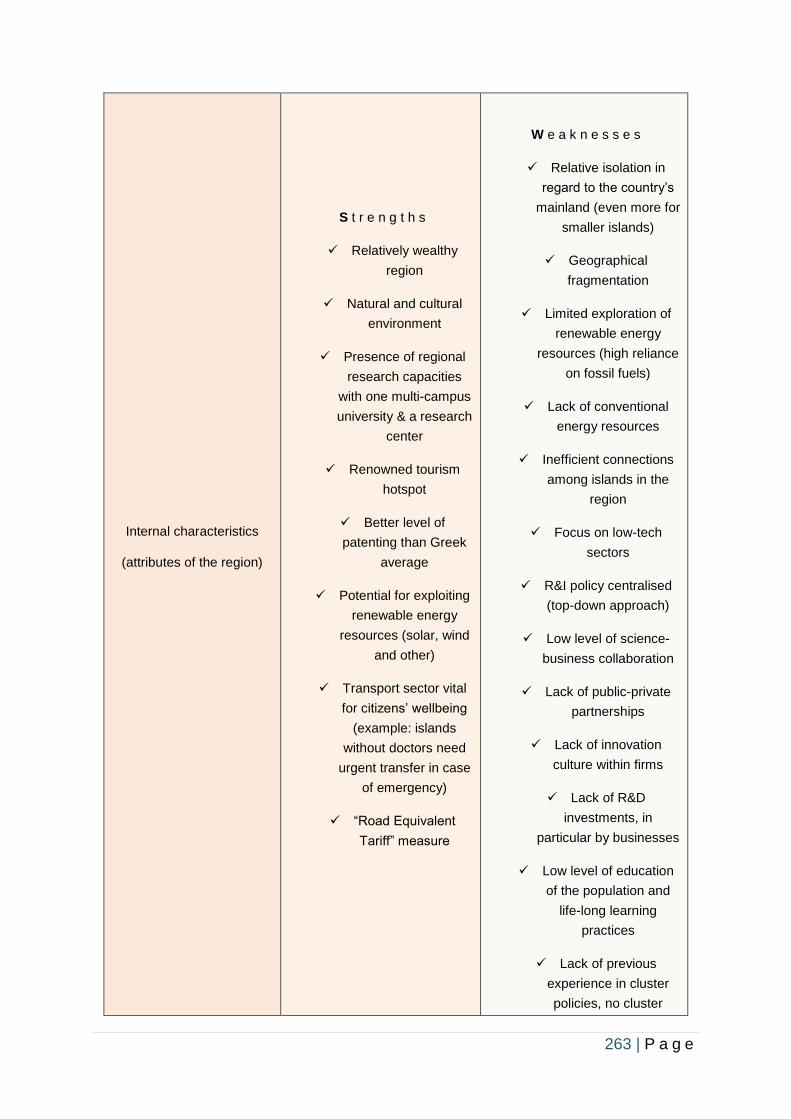
263 | P a g e
Internal characteristics
(attributes of the region)
S t r e n g t h s
✓ Relatively wealthy
region
✓ Natural and cultural
environment
✓ Presence of regional
research capacities
with one multi-campus
university & a research
center
✓ Renowned tourism
hotspot
✓ Better level of
patenting than Greek
average
✓ Potential for exploiting
renewable energy
resources (solar, wind
and other)
✓ Transport sector vital
for citizens’ wellbeing
(example: islands
without doctors need
urgent transfer in case
of emergency)
✓ “Road Equivalent
Tariff” measure
W e a k n e s s e s
✓ Relative isolation in
regard to the country’s
mainland (even more for
smaller islands)
✓ Geographical
fragmentation
✓ Limited exploration of
renewable energy
resources (high reliance
on fossil fuels)
✓ Lack of conventional
energy resources
✓ Inefficient connections
among islands in the
region
✓ Focus on low-tech
sectors
✓ R&I policy centralised
(top-down approach)
✓ Low level of science-
business collaboration
✓ Lack of public-private
partnerships
✓ Lack of innovation
culture within firms
✓ Lack of R&D
investments, in
particular by businesses
✓ Low level of education
of the population and
life-long learning
practices
✓ Lack of previous
experience in cluster
policies, no cluster
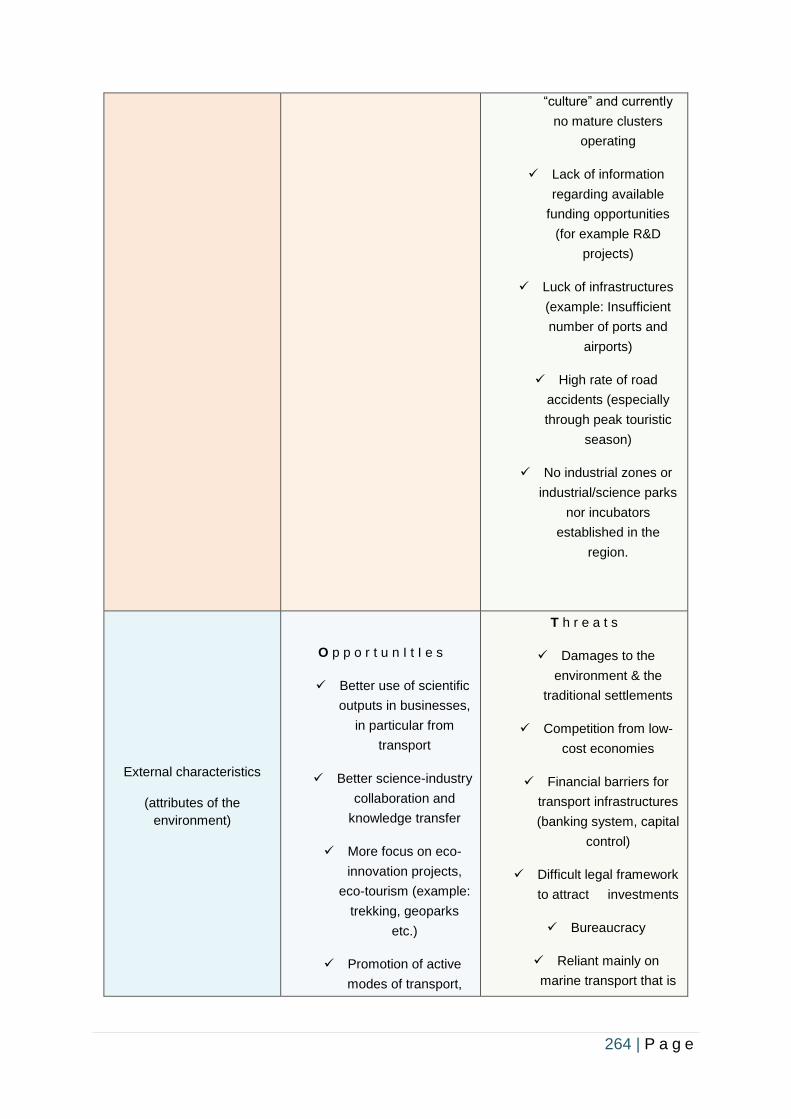
264 | P a g e
“culture” and currently
no mature clusters
operating
✓ Lack of information
regarding available
funding opportunities
(for example R&D
projects)
✓ Luck of infrastructures
(example: Insufficient
number of ports and
airports)
✓ High rate of road
accidents (especially
through peak touristic
season)
✓ No industrial zones or
industrial/science parks
nor incubators
established in the
region.
External characteristics
(attributes of the
environment)
O p p o r t u n I t I e s
✓ Better use of scientific
outputs in businesses,
in particular from
transport
✓ Better science-industry
collaboration and
knowledge transfer
✓ More focus on eco-
innovation projects,
eco-tourism (example:
trekking, geoparks
etc.)
✓ Promotion of active
modes of transport,
T h r e a t s
✓ Damages to the
environment & the
traditional settlements
✓ Competition from low-
cost economies
✓ Financial barriers for
transport infrastructures
(banking system, capital
control)
✓ Difficult legal framework
to attract investments
✓ Bureaucracy
✓ Reliant mainly on
marine transport that is
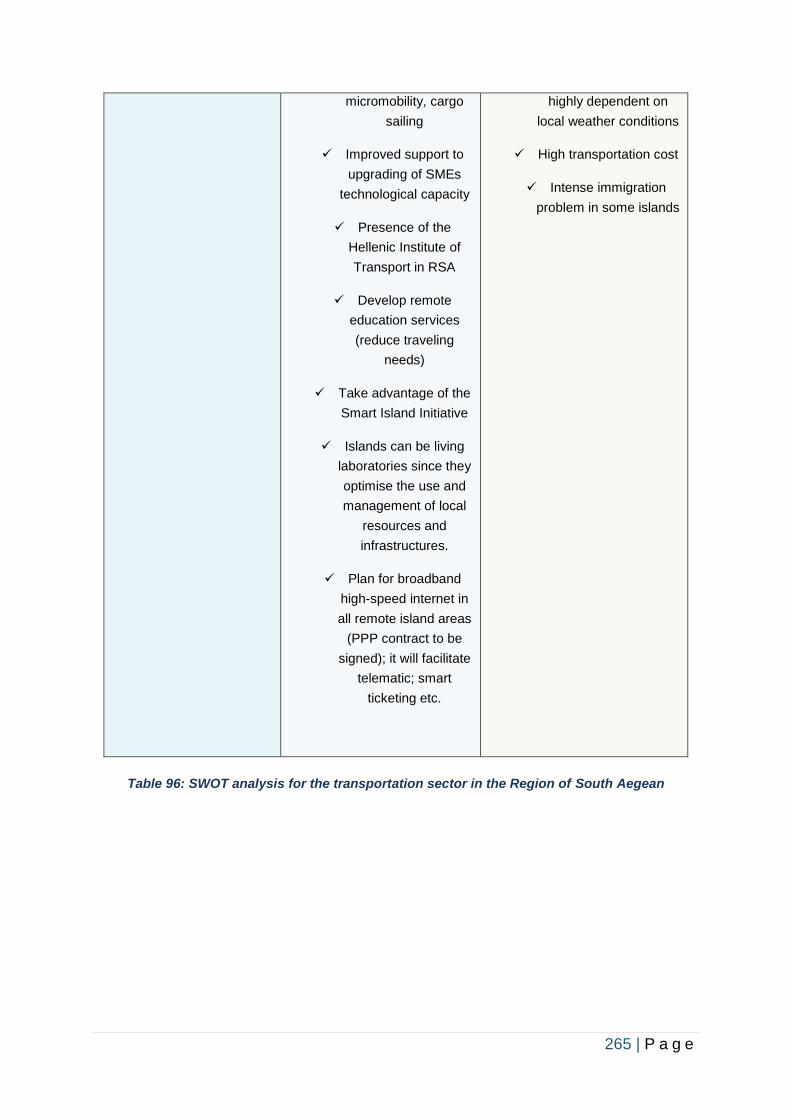
265 | P a g e
micromobility, cargo
sailing
✓ Improved support to
upgrading of SMEs
technological capacity
✓ Presence of the
Hellenic Institute of
Transport in RSA
✓ Develop remote
education services
(reduce traveling
needs)
✓ Take advantage of the
Smart Island Initiative
✓ Islands can be living
laboratories since they
optimise the use and
management of local
resources and
infrastructures.
✓ Plan for broadband
high-speed internet in
all remote island areas
(PPP contract to be
signed); it will facilitate
telematic; smart
ticketing etc.
highly dependent on
local weather conditions
✓ High transportation cost
✓ Intense immigration
problem in some islands
Table 96: SWOT analysis for the transportation sector in the Region of South Aegean
266 | P a g e
Lithuania
Lithuania
SWOT Analysis
Strengths
• Lithuanian transport scientists and researchers have great potential to develop research-
based, cost-effective and socially efficient technologies;
• Science and business successfully cooperate in international projects (Horizon 2020);
• High demand from business side for innovations and applied research which is encouraged
by growing competitiveness and globalization;
• Interaction between different organizations and systems, ability to act (work) together;
• Geographical location. Lithuania is in between EU and CIS which gives opportunity to
transport SMEs to operate in both markets;
• Lithuania Klaipėda Seaport is the northest-most ice-free port in the Baltic Sea which gives
it competitive advantage over other northern ports;
• Cheaper labor force in comparison to Western Europe;
• Better knowledge of eastern markets, knowledge of Russian language;
• Lithuania is member of EU (custom union, single market) which gives it advantage over
eastern competitors
• Transport and storage sector contribution to Lithuanian GDP is very high (~12%);
• European Union financing programs to improve transport infrastructure;
• Dense road network;
• High level of transport SMEs participating in clusters and associations;
• Widely developed network of science and education institutions, innovation support
organizations, transport related science institutions;
• Lithuania transport sector is included into Lithuania National Security Strategy
Weaknesses
• Low publishing and patenting capacity;
• Low level of ICT usage in transport SMEs;
• Due to fierce competition, there is a lack of synergy between different modes of transport
and technological processes (businesses are reluctant to share information and the
market);
• There is no transport research center consolidating research programs for the entire sector;
267 | P a g e
• In comparison to eastern competitors, labor force in Lithuania is more expensive;
• Shortage of labor force reduce the competitiveness of transport companies (shrinking
population, education issues);
• Transport SMEs do not fully exploit the benefits of science and technology parks, education
institutions, in general, there is low level of business and science cooperation in Lithuania;
• Undeveloped inland waterway transport;
• EU Structural Funds are not fully utilized;
• Transport SMEs do not have enough knowledge about public funding’s and public
administration
Opportunities
• Using EU funding, Lithuania will electrify its railway system;
• Lithuania should use the opportunity to liberalize employment rules for people from third
countries;
• Increasing requirements for the safety and energy efficiency of transport sector;
• Commercialize high value-added technologies, products and services by forming new
market segments;
• Greater involvement of ICT professionals in the transport sector;
• TEN-T networks will be modernized in Lithuania;
• Involvement of Lithuanian logistics centers in international networks;
• Opportunity to build safe and environmentally friendly transport system;
• Because of rising internal and external competition, transport SMEs will demand more R&D
activities
• Developing high value-added technologies, products and services (R&D driven);
• Fourth industrial revolution will bring new opportunities; however, it will be important to
keep up with and implement new emerging technologies;
• Election of European Parliament and formation of new European Commission can have a
positive impact on future EU policy;
Threats
• In case of slow development and deployment of innovative technologies in transport sector,
competitiveness and Lithuania transport sector position in international markets can
decreas;
• Rising prices of various energy resources can slow down the creation and implementation
of separate technologies, reduce the attractiveness for users;
• Most important funding source for transport sector R&D activities is Horizon2020 projects,
which have very high competition. Unsuccessful projects may result in the termination of
R&D activities;
• Uncertainty related to Brexit, especially opportunity of hard Brexit;
• Uncertainty related to eastern markets, especially Russia. Due to the tension between
Russia and Lithuania, transport sector of Lithuania in the past experienced blockade;
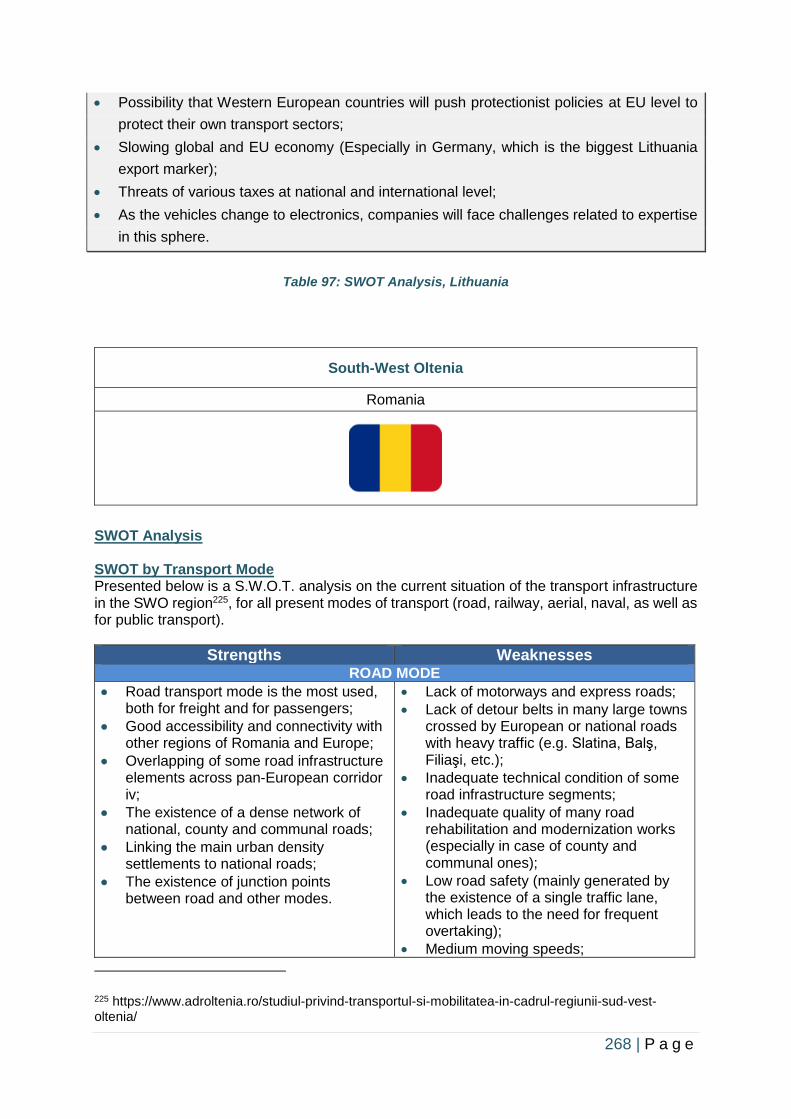
268 | P a g e
• Possibility that Western European countries will push protectionist policies at EU level to
protect their own transport sectors;
• Slowing global and EU economy (Especially in Germany, which is the biggest Lithuania
export marker);
• Threats of various taxes at national and international level;
• As the vehicles change to electronics, companies will face challenges related to expertise
in this sphere.
Table 97: SWOT Analysis, Lithuania
South-West Oltenia
Romania
SWOT Analysis SWOT by Transport Mode Presented below is a S.W.O.T. analysis on the current situation of the transport infrastructure in the SWO region225, for all present modes of transport (road, railway, aerial, naval, as well as for public transport).
Strengths Weaknesses ROAD MODE
• Road transport mode is the most used, both for freight and for passengers;
• Good accessibility and connectivity with other regions of Romania and Europe;
• Overlapping of some road infrastructure elements across pan-European corridor iv;
• The existence of a dense network of national, county and communal roads;
• Linking the main urban density settlements to national roads;
• The existence of junction points between road and other modes.
• Lack of motorways and express roads;
• Lack of detour belts in many large towns crossed by European or national roads with heavy traffic (e.g. Slatina, Balş, Filiaşi, etc.);
• Inadequate technical condition of some road infrastructure segments;
• Inadequate quality of many road rehabilitation and modernization works (especially in case of county and communal ones);
• Low road safety (mainly generated by the existence of a single traffic lane, which leads to the need for frequent overtaking);
• Medium moving speeds;
225 https://www.adroltenia.ro/studiul-privind-transportul-si-mobilitatea-in-cadrul-regiunii-sud-vest-oltenia/
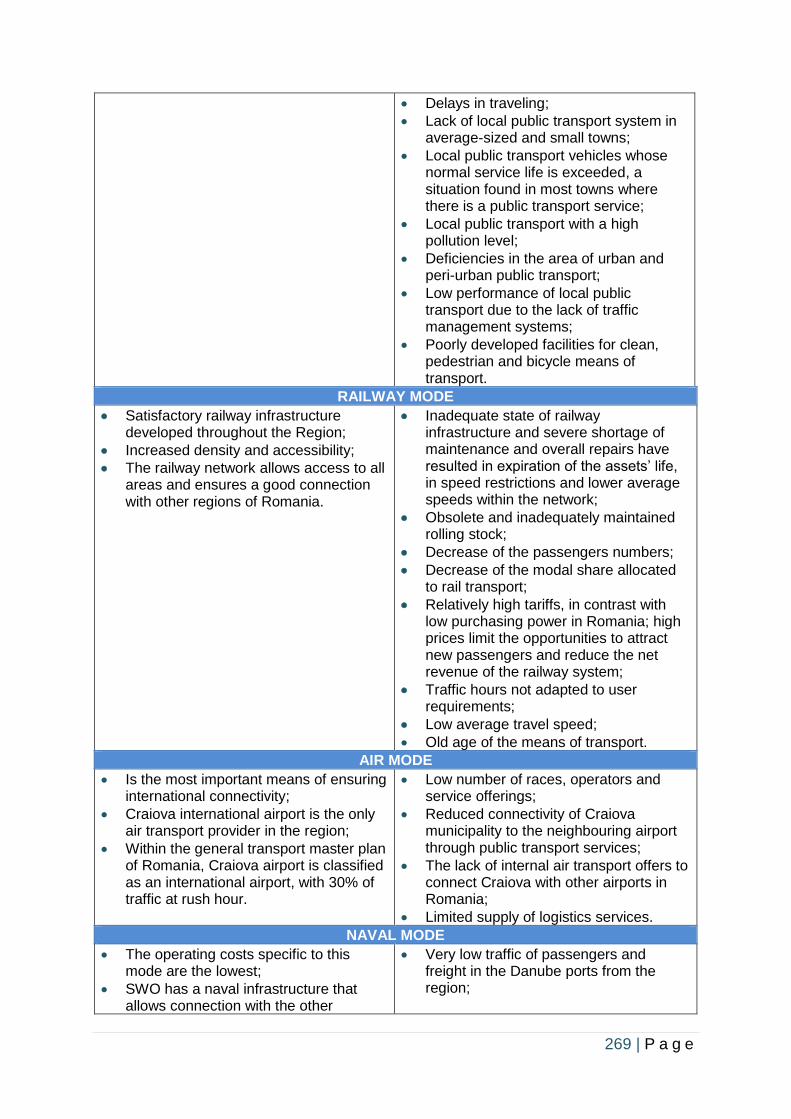
269 | P a g e
• Delays in traveling;
• Lack of local public transport system in average-sized and small towns;
• Local public transport vehicles whose normal service life is exceeded, a situation found in most towns where there is a public transport service;
• Local public transport with a high pollution level;
• Deficiencies in the area of urban and peri-urban public transport;
• Low performance of local public transport due to the lack of traffic management systems;
• Poorly developed facilities for clean, pedestrian and bicycle means of transport.
RAILWAY MODE
• Satisfactory railway infrastructure developed throughout the Region;
• Increased density and accessibility;
• The railway network allows access to all areas and ensures a good connection with other regions of Romania.
• Inadequate state of railway infrastructure and severe shortage of maintenance and overall repairs have resulted in expiration of the assets’ life, in speed restrictions and lower average speeds within the network;
• Obsolete and inadequately maintained rolling stock;
• Decrease of the passengers numbers;
• Decrease of the modal share allocated to rail transport;
• Relatively high tariffs, in contrast with low purchasing power in Romania; high prices limit the opportunities to attract new passengers and reduce the net revenue of the railway system;
• Traffic hours not adapted to user requirements;
• Low average travel speed;
• Old age of the means of transport.
AIR MODE
• Is the most important means of ensuring international connectivity;
• Craiova international airport is the only air transport provider in the region;
• Within the general transport master plan of Romania, Craiova airport is classified as an international airport, with 30% of traffic at rush hour.
• Low number of races, operators and service offerings;
• Reduced connectivity of Craiova municipality to the neighbouring airport through public transport services;
• The lack of internal air transport offers to connect Craiova with other airports in Romania;
• Limited supply of logistics services.
NAVAL MODE
• The operating costs specific to this mode are the lowest;
• SWO has a naval infrastructure that allows connection with the other
• Very low traffic of passengers and freight in the Danube ports from the region;
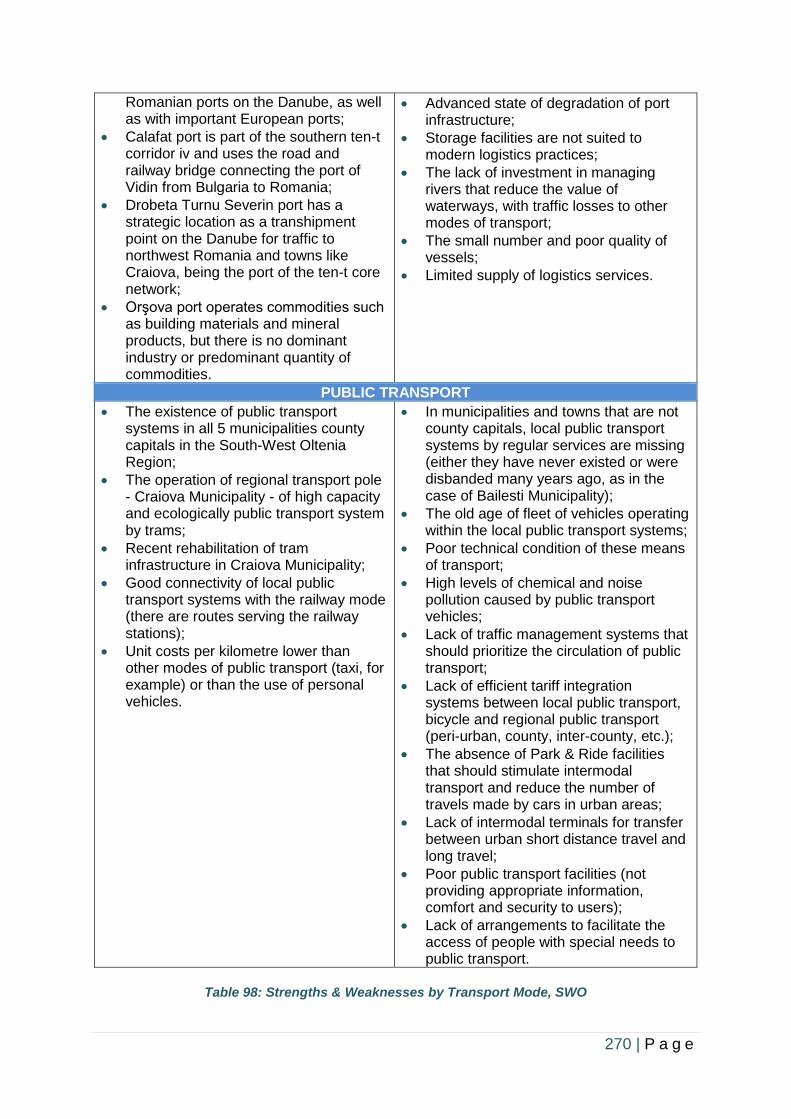
270 | P a g e
Romanian ports on the Danube, as well as with important European ports;
• Calafat port is part of the southern ten-t corridor iv and uses the road and railway bridge connecting the port of Vidin from Bulgaria to Romania;
• Drobeta Turnu Severin port has a strategic location as a transhipment point on the Danube for traffic to northwest Romania and towns like Craiova, being the port of the ten-t core network;
• Orşova port operates commodities such as building materials and mineral products, but there is no dominant industry or predominant quantity of commodities.
• Advanced state of degradation of port infrastructure;
• Storage facilities are not suited to modern logistics practices;
• The lack of investment in managing rivers that reduce the value of waterways, with traffic losses to other modes of transport;
• The small number and poor quality of vessels;
• Limited supply of logistics services.
PUBLIC TRANSPORT
• The existence of public transport systems in all 5 municipalities county capitals in the South-West Oltenia Region;
• The operation of regional transport pole - Craiova Municipality - of high capacity and ecologically public transport system by trams;
• Recent rehabilitation of tram infrastructure in Craiova Municipality;
• Good connectivity of local public transport systems with the railway mode (there are routes serving the railway stations);
• Unit costs per kilometre lower than other modes of public transport (taxi, for example) or than the use of personal vehicles.
• In municipalities and towns that are not county capitals, local public transport systems by regular services are missing (either they have never existed or were disbanded many years ago, as in the case of Bailesti Municipality);
• The old age of fleet of vehicles operating within the local public transport systems;
• Poor technical condition of these means of transport;
• High levels of chemical and noise pollution caused by public transport vehicles;
• Lack of traffic management systems that should prioritize the circulation of public transport;
• Lack of efficient tariff integration systems between local public transport, bicycle and regional public transport (peri-urban, county, inter-county, etc.);
• The absence of Park & Ride facilities that should stimulate intermodal transport and reduce the number of travels made by cars in urban areas;
• Lack of intermodal terminals for transfer between urban short distance travel and long travel;
• Poor public transport facilities (not providing appropriate information, comfort and security to users);
• Lack of arrangements to facilitate the access of people with special needs to public transport.
Table 98: Strengths & Weaknesses by Transport Mode, SWO
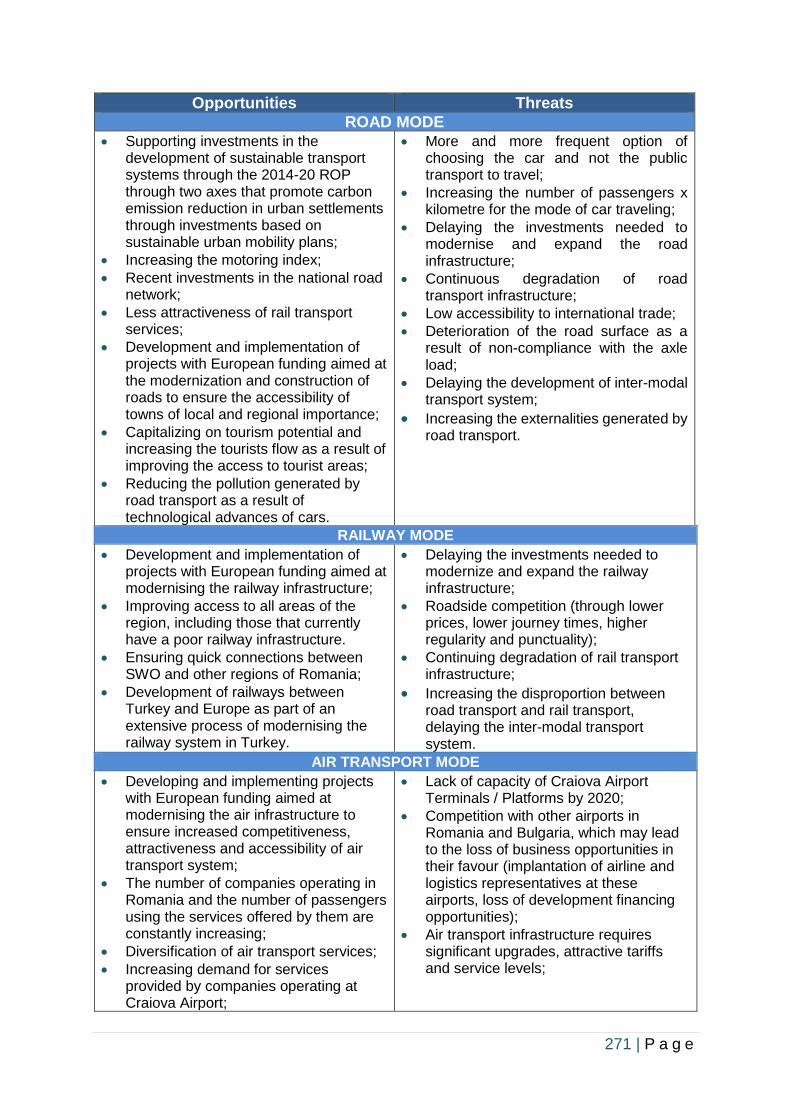
271 | P a g e
Opportunities Threats
ROAD MODE
• Supporting investments in the development of sustainable transport systems through the 2014-20 ROP through two axes that promote carbon emission reduction in urban settlements through investments based on sustainable urban mobility plans;
• Increasing the motoring index;
• Recent investments in the national road network;
• Less attractiveness of rail transport services;
• Development and implementation of projects with European funding aimed at the modernization and construction of roads to ensure the accessibility of towns of local and regional importance;
• Capitalizing on tourism potential and increasing the tourists flow as a result of improving the access to tourist areas;
• Reducing the pollution generated by road transport as a result of technological advances of cars.
• More and more frequent option of choosing the car and not the public transport to travel;
• Increasing the number of passengers x kilometre for the mode of car traveling;
• Delaying the investments needed to modernise and expand the road infrastructure;
• Continuous degradation of road transport infrastructure;
• Low accessibility to international trade;
• Deterioration of the road surface as a result of non-compliance with the axle load;
• Delaying the development of inter-modal transport system;
• Increasing the externalities generated by road transport.
RAILWAY MODE
• Development and implementation of projects with European funding aimed at modernising the railway infrastructure;
• Improving access to all areas of the region, including those that currently have a poor railway infrastructure.
• Ensuring quick connections between SWO and other regions of Romania;
• Development of railways between Turkey and Europe as part of an extensive process of modernising the railway system in Turkey.
• Delaying the investments needed to modernize and expand the railway infrastructure;
• Roadside competition (through lower prices, lower journey times, higher regularity and punctuality);
• Continuing degradation of rail transport infrastructure;
• Increasing the disproportion between road transport and rail transport, delaying the inter-modal transport system.
AIR TRANSPORT MODE
• Developing and implementing projects with European funding aimed at modernising the air infrastructure to ensure increased competitiveness, attractiveness and accessibility of air transport system;
• The number of companies operating in Romania and the number of passengers using the services offered by them are constantly increasing;
• Diversification of air transport services;
• Increasing demand for services provided by companies operating at Craiova Airport;
• Lack of capacity of Craiova Airport Terminals / Platforms by 2020;
• Competition with other airports in Romania and Bulgaria, which may lead to the loss of business opportunities in their favour (implantation of airline and logistics representatives at these airports, loss of development financing opportunities);
• Air transport infrastructure requires significant upgrades, attractive tariffs and service levels;
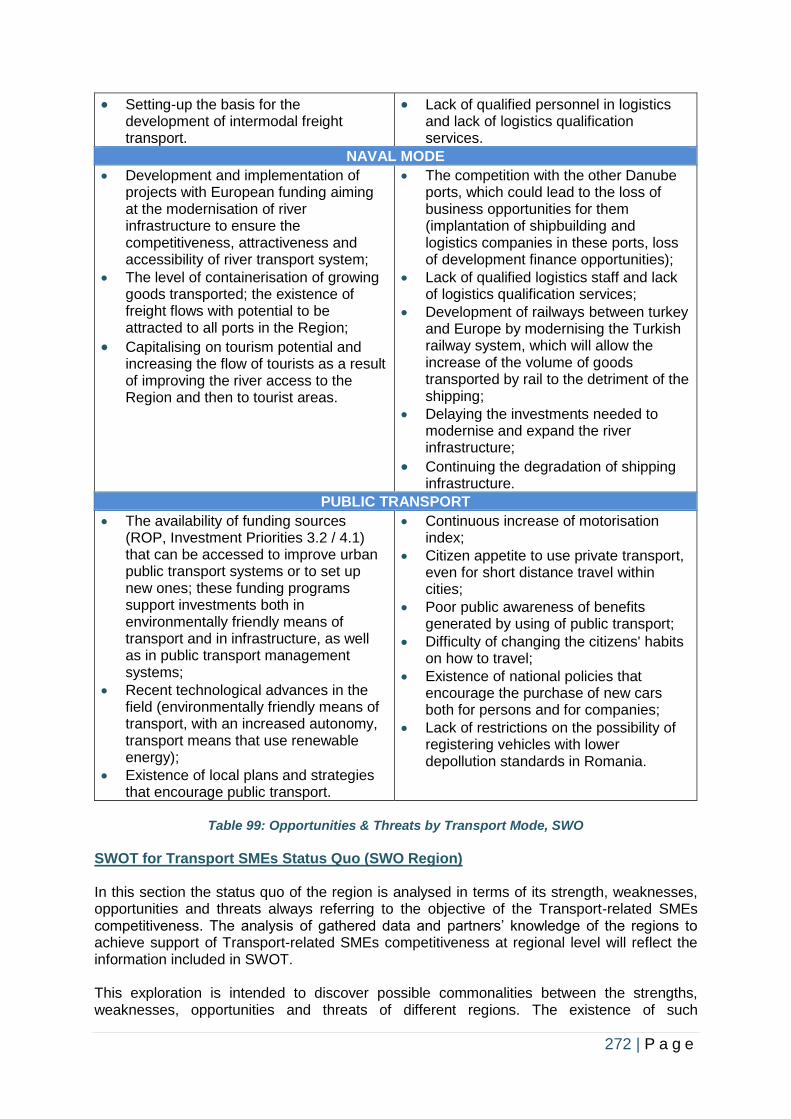
272 | P a g e
• Setting-up the basis for the development of intermodal freight transport.
• Lack of qualified personnel in logistics and lack of logistics qualification services.
NAVAL MODE
• Development and implementation of projects with European funding aiming at the modernisation of river infrastructure to ensure the competitiveness, attractiveness and accessibility of river transport system;
• The level of containerisation of growing goods transported; the existence of freight flows with potential to be attracted to all ports in the Region;
• Capitalising on tourism potential and increasing the flow of tourists as a result of improving the river access to the Region and then to tourist areas.
• The competition with the other Danube ports, which could lead to the loss of business opportunities for them (implantation of shipbuilding and logistics companies in these ports, loss of development finance opportunities);
• Lack of qualified logistics staff and lack of logistics qualification services;
• Development of railways between turkey and Europe by modernising the Turkish railway system, which will allow the increase of the volume of goods transported by rail to the detriment of the shipping;
• Delaying the investments needed to modernise and expand the river infrastructure;
• Continuing the degradation of shipping infrastructure.
PUBLIC TRANSPORT
• The availability of funding sources (ROP, Investment Priorities 3.2 / 4.1) that can be accessed to improve urban public transport systems or to set up new ones; these funding programs support investments both in environmentally friendly means of transport and in infrastructure, as well as in public transport management systems;
• Recent technological advances in the field (environmentally friendly means of transport, with an increased autonomy, transport means that use renewable energy);
• Existence of local plans and strategies that encourage public transport.
• Continuous increase of motorisation index;
• Citizen appetite to use private transport, even for short distance travel within cities;
• Poor public awareness of benefits generated by using of public transport;
• Difficulty of changing the citizens' habits on how to travel;
• Existence of national policies that encourage the purchase of new cars both for persons and for companies;
• Lack of restrictions on the possibility of registering vehicles with lower depollution standards in Romania.
Table 99: Opportunities & Threats by Transport Mode, SWO
SWOT for Transport SMEs Status Quo (SWO Region) In this section the status quo of the region is analysed in terms of its strength, weaknesses, opportunities and threats always referring to the objective of the Transport-related SMEs competitiveness. The analysis of gathered data and partners’ knowledge of the regions to achieve support of Transport-related SMEs competitiveness at regional level will reflect the information included in SWOT. This exploration is intended to discover possible commonalities between the strengths, weaknesses, opportunities and threats of different regions. The existence of such
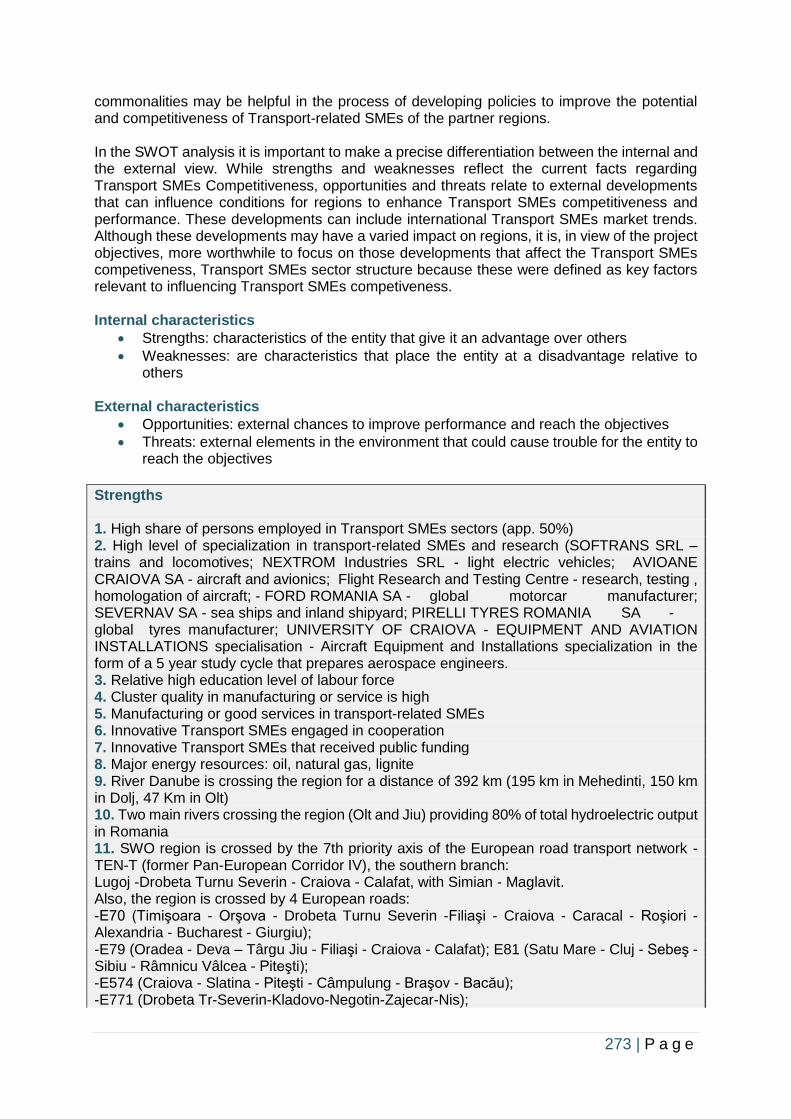
273 | P a g e
commonalities may be helpful in the process of developing policies to improve the potential and competitiveness of Transport-related SMEs of the partner regions. In the SWOT analysis it is important to make a precise differentiation between the internal and the external view. While strengths and weaknesses reflect the current facts regarding Transport SMEs Competitiveness, opportunities and threats relate to external developments that can influence conditions for regions to enhance Transport SMEs competitiveness and performance. These developments can include international Transport SMEs market trends. Although these developments may have a varied impact on regions, it is, in view of the project objectives, more worthwhile to focus on those developments that affect the Transport SMEs competiveness, Transport SMEs sector structure because these were defined as key factors relevant to influencing Transport SMEs competiveness. Internal characteristics
• Strengths: characteristics of the entity that give it an advantage over others
• Weaknesses: are characteristics that place the entity at a disadvantage relative to others
External characteristics
• Opportunities: external chances to improve performance and reach the objectives
• Threats: external elements in the environment that could cause trouble for the entity to reach the objectives
Strengths 1. High share of persons employed in Transport SMEs sectors (app. 50%) 2. High level of specialization in transport-related SMEs and research (SOFTRANS SRL – trains and locomotives; NEXTROM Industries SRL - light electric vehicles; AVIOANE CRAIOVA SA - aircraft and avionics; Flight Research and Testing Centre - research, testing , homologation of aircraft; - FORD ROMANIA SA - global motorcar manufacturer; SEVERNAV SA - sea ships and inland shipyard; PIRELLI TYRES ROMANIA SA - global tyres manufacturer; UNIVERSITY OF CRAIOVA - EQUIPMENT AND AVIATION INSTALLATIONS specialisation - Aircraft Equipment and Installations specialization in the form of a 5 year study cycle that prepares aerospace engineers. 3. Relative high education level of labour force 4. Cluster quality in manufacturing or service is high 5. Manufacturing or good services in transport-related SMEs 6. Innovative Transport SMEs engaged in cooperation 7. Innovative Transport SMEs that received public funding 8. Major energy resources: oil, natural gas, lignite 9. River Danube is crossing the region for a distance of 392 km (195 km in Mehedinti, 150 km in Dolj, 47 Km in Olt) 10. Two main rivers crossing the region (Olt and Jiu) providing 80% of total hydroelectric output in Romania 11. SWO region is crossed by the 7th priority axis of the European road transport network - TEN-T (former Pan-European Corridor IV), the southern branch: Lugoj -Drobeta Turnu Severin - Craiova - Calafat, with Simian - Maglavit. Also, the region is crossed by 4 European roads: -E70 (Timişoara - Orşova - Drobeta Turnu Severin -Filiaşi - Craiova - Caracal - Roşiori - Alexandria - Bucharest - Giurgiu); -E79 (Oradea - Deva – Târgu Jiu - Filiaşi - Craiova - Calafat); E81 (Satu Mare - Cluj - Sebeş - Sibiu - Râmnicu Vâlcea - Piteşti); -E574 (Craiova - Slatina - Piteşti - Câmpulung - Braşov - Bacău); -E771 (Drobeta Tr-Severin-Kladovo-Negotin-Zajecar-Nis);
274 | P a g e
12. Border with two neighbouring countries: Serbia and Bulgaria; 13. Many companies are operating in the electric power, chemical industry, automotive industry (represented by Ford Romania and related suppliers’ sub-assemblies), aeronautics (Craiova Aircraft Factory), mechanical engineering industry (manufactures locomotives, parts and heavy equipment, agricultural machinery); 14. Business concentration areas: Craiova for the automotive industry and engineering industry, Slatina for the metallurgical industry, Ramnicu-Valcea for the chemical industry, Targu-Jiu for the extractive industry, Drobeta-Turnu Severin for the power industry, shipbuilding; 15. Navigable route on the region’s territory: access to Danube river; 16. Craiova International Airport, which is under continuous process of expansion and upgrade/modernization; 17. Fully operational support services business and industrial parks; 18. Almost 50% of the number of enterprises in the SW Oltenia Region operate in services - trade, construction, rentals, services provided to enterprises, which is an alternative in terms of job creation; 19. Public and private universities in the region, and also the vocational training centres for adults and accredited vocational training providers; 20. Suitable and prepared human resources in the RTDI and IT sector; 21. Base infrastructure for research, development, innovation and technology transfer; 22. Many enterprises with innovation activity in the region; 23. Many companies that are specialized in producing software and providing IT services in the region; 24. Business areas with potential for development, including the innovation field, such as: transport and communications, mechanical engineering; 25. Important volume for export share assured by Ford automaker in Craiova Plant; Weaknesses 1. Insufficient developed base infrastructure in rural areas; 2. Insufficient capacity for attracting foreign investments; 3. Monoindustrial profile areas existing in Gorj, Olt and Valcea counties; 4. Accelerated massive unemployment due to the closure of some productive industrial facilities; 5. Insufficiently developed transport infrastructure related to Transport-SMEs competitiveness 6. Lack of intermodal transport; 7. Wide gap between urban and rural areas in terms of economic development; 8. Industry is still based on large industrial plants with obsolete and high energy spending technology; 9. Lack of correlation between workforce training and labour market requirements, considering the local / regional industrial profile; 10. Low funding capacity to co-finance the investment projects; 11. Insufficient business structures in Mehedinti, Olt, Gorj counties; 12. Low occupancy rate of business incubators; 13. Quite poor theoretical and technical training of graduates; 14. Business investors have difficulties in finding staff with specific technical qualifications and skills; 15. Lack of standardization / efficiency in case of support services for development of business and consulting services; 16. Inadequate logistics services for Industry; 17. Insufficient funding of RDI sector and difficult financing from public sources and private sources; 18. Insufficient collaboration between research centres / universities and the business and industrial environment in using the research results, and quite difficult process of technology transfer to the economy;
275 | P a g e
19. Very low number of certified SMEs and enterprises in management systems; 20. Ports in the region are not sufficiently developed and exploited; 21. Road network and rail network are not properly maintained and not viable for attracting investment and business development; 22. Quite low capacity of business activity in the region’s shipyards; 23. Lack of motorways and high-speed / high capacity roads; 24. Lack of detours in many larger & medium size towns that are crossed by massive European or national traffic; 25. Delay in investments in extension/upgrade of the road transport infrastructure; 26. Disproportion between road transport and other modes of transport Opportunities 1. The current existence of European funding (structural instruments and public funds) for the 2014-20 period; 2. Speed-up the investment in infrastructure and increase of the pace of recovery, along with setting-up operational infrastructure as support service for business development; 3. Modernization and upgrade/expansion of Craiova International Airport along with the connected road transport network will lead to increased passenger traffic, increasing trade exchanges and higher capacity to attract foreign investments in productive companies; 4. Exploitation and valorisation of the Calafat - Vidin Bridge on Danube (Romania-Bulgaria border) along with its integration into the European Corridor IV to facilitate the trade exchanges with the southern part of Europe; 5. Exploitation and valorisation of Danube bridges on Iron Gates I, and Iron Gates II (Romania-Serbia border); 6. Further development of FORD Romania SA business in the area a will create new jobs and stimulate the setting-up of new companies for services in the field of mechanical engineering and industry; 7. High potential to exploit the Danube river as a transport corridor with very low investment costs; 8. Rehabilitation/upgrading of industrial sites could create new jobs and stimulate re-qualification/reconversion of workforce; 9. Intensification of contacts at cross-border level (with Serbia, Bulgaria) can bring about new international specific activities; 10. Creating tax incentives to develop the regional business investments; 11. Highly-skilled workforce who went abroad, might return to the region in the near future; 12. High interest in the region to create business support services for further business development; 13. Ever increasing interest of foreign companies in setting-up local branches in the region; 14. Implementation of projects to enhance cooperation in all business areas, including research, development and innovation; 15. Setting-up the clusters in the region; 16. Development and implementation of projects with EU funding aimed at the modernization and construction of roads to ensure the accessibility of cities of local and regional importance 17. Improved access to all areas of the region, including those isolated and with a poor road infrastructure; 18. Ensuring fast links between the SW Oltenia Region and the other regions of Romania, increasing the integration of the regional road network into the European transport networks; 19. Upgrading the bases for the development of intermodal freight transport; 20. Diminish the pollution generated by road transport – by adopting green technologies 21. Increasing demand for innovative transport products/ services in the region; 22. Measures for reducing the pollution and reducing the traffic crowd in the region are in place Threats
276 | P a g e
1. Migration of active, skilled and specialized workforce to other regions and countries to get higher and motivating wages and exploit opportunities for personal career development; 2. Migration of workforce from villages to urban areas; 3. Unstable and quite confuse tax legislation; 4. Excessive taxation applied on workforce; 5. Ineffective partnership between local public authorities and business investors (e.g. in terms of human resource identification, legislative advice, and also on development of transport infrastructure); 6. Increasing educational gap between persons in rural and persons in urban areas, along with increasing migration and unemployment; 7. Legislative barriers and lack of coordination between different sectoral policies; 8. Businesses are reluctant / not willing to invest capital for spending in RDI activities; 9. the missing structure that would coordinate the innovation system and areas in a logical / holistic way in the region; 10. Massive migration of young persons and workforce to Western Europe, to get education / further specialization and higher paid jobs; 11. Migration of the active population (which is highly qualified) to other countries with higher standards; 12. The delay in investments needed to modernize and expand the road infrastructure 13. Narrow traffic, overburdening European and national roads 14. Continue the degradation of road transport infrastructure 15. Extending the relative isolation status of areas currently difficult to access on the roads 16. Relocation of some enterprises, lowering the attractiveness of the Centre for Economic Investment 17. Increasing disproportion between road transport and rail transport, delaying the inter-modal transport system and increasing the level of pollution generated by road transport 18. Obstacles (bureaucracy; lack of interest of the public authorities for open dialogue) 19. Unstable legislation: continuously changing legal framework and interoperation of law
Table 100: SWOT for Transport SME Status Quo, SWO
277 | P a g e
Results
West Midlands
United Kingdom
The WM as the centre of transport innovation in the UK, are leading the smart, low-carbon movement of people and goods and connecting communities to new opportunities. The next decade will be a period of large-scale change to how people and goods move, with significant innovation in mobility and continued changes to consumer preferences and global markets.
• The region is home to well-known manufacturers including Jaguar Land Rover, Aston Martin, and JCB, which support a wider supply chain of smaller firms.
• The region also boasts excellent connectivity, being well-served by major road and rail networks, which helps to support its entrepreneurialism. The service sector also plays a large role in the region's economy, employing almost half of the working population.
The main priorities and interventions that are relevant to SME competiveness are set out below. The strategies reflect the varying local economic contexts across the WM but there are a number of themes which are common in all parts of the region. In particular:
• The need to create employment and GVA (gross value added)
• Supply chain development to support growth: particularly related to advanced manufacturing and engineering.
• Innovation and R&D: priorities here encompass the full spectrum of innovation related activities from more generalised process innovation and productivity improvement through to R&D intensive and tech focused activities to generate spin out companies.
• Enterprise and start-ups: There is a strong innovation and technology flavour to many of the priorities in this area, although some LEP areas also prioritise the development of an entrepreneurial culture and stimulating business start-ups more generally.
• Focus on growth sectors: The importance of priority sectors in driving growth is recognised in all of the strategy documents and each LEP area has identified the key sectors around which they expect future growth to focus.
• The advanced manufacturing sector stands out as being particularly important, with automotive, aerospace and aeronautical sectors highlighted as being key strengths and sources of growth.
The future success of the WM lies in the ability to adapt to long-term trends in mobility:
• Creating new markets, such as those in electric and connected autonomous vehicles (CAV) and mobility as a service, through the Future Mobility Zone;
• Stimulating further innovation in key areas such as battery research and manufacturing, 5G, and data, with benefits to the supply chain and whole economy;
• Taking advantage of growing global markets in very light rail, digital rail and electric and autonomous flight, in firms of all sizes;
278 | P a g e
• Continuing to develop a clean, integrated transport network, maximising the opportunities presented by HS2, optimising the value of the Transforming Cities Fund and other locally led investments and working smartly with Midlands Connect.
• CAV is worth between £50 and £100 billion to the UK economy
• An integrated transport network and arrival of HS2 could add £4 billion to the WM economy, driving major centres of growth such as UK Central Solihull.
The region will be testing progress on a network of over 50 miles of roads in Coventry, Birmingham and Solihull. This area is now a globally leading ‘real world’ UK testbed for developing the next generation CAVs following over £50 million of recent investment from government and the private sector.
The funding landscape across our area is improving with increasing amounts of business expenditure on R&D and venture capital investment being reported, but increasing this further, as well as follow-on capital funding to scale up processes, is key to improving our productivity performance.
Campania Region
Italy
Results
As it can be seen from the analysis reported, the social and economic structure of the Region still presents a contradictory picture, in some ways. If on the one hand, indeed, this is characterised by factors that show a delay in development - as evidenced by high unemployment rates, fragility of the entrepreneurial fabric, growing diffusion of illicit and illegal behaviours - on the other, it presents factors tending to project it in the field of advanced economies. Though, Campania represents the main research centre in the South, with the presence of universities and companies operating in advanced and innovative sectors and a fair amount of transport infrastructure. The economic prospects connected to the SEZ can contribute to strengthening the positive trends already indicated at the regional level. This new area can contribute to mitigating some territorial gaps that, if bridged, can free up resources for economic growth.
However, it is still worth emphasizing how Southern Regions, live a contradictory reality, not only in Italy but all over the world, in which problems and critical issues represent an opportunity for development, due to the great will of emancipation, that allows to rebalance the lagging of development that some territories present.
279 | P a g e
South Aegean Region
Greece
Results
The promotion of sustainable transport and challenges such as upgrade of infrastructures on ports and airports, improvement of interconnections among RSA and the mainland, road safety and promotion of multimodal transportation are among the objectives of the RSA’s Operational Programme.
Maritime transport services dominate the sector and are considered crucial for the future development of the Region, both for tourism and as part of the supply chain of the agricultural sector. There are numerous companies operating in the maritime sector, both for cargo shipping and passenger’s transport and recreation. In order to improve and enhance maritime connections for RSA both at national and regional level, there are increased needs for appropriate infrastructure.
Additionally, air transport is also significant for the touristic development and the exploitation of local resources. While the larger islands have developed sufficient infrastructure to accommodate air transport services, many smaller islands require airport expansions in order to further accommodate international airlines. Additionally, inefficiencies in flight connections among the RSA’s islands are identified which can further result in challenges and difficulties among the interregional connections and the overall Region’s cohesion
Private vehicles are the dominant mode of transport within the islands, while tourists use buses, taxis and various rental services. All transport modes are considered significantly costly compared to the country’s average mainly due to higher diesel prices.
The stakeholders present in the Region of South Aegean are public authorities and organisations as well as private and public companies, research institutes, DAFNI network and a multi-campus University. Regional Government and stakeholders consider tourism as core sector of South Aegean and all other sectors (transport, local products, services) depending and existing through tourism (RIS3). The Region of South Aegean is among the lowest EU regions on expenditure on research and innovation and the second lowest among the Greek regions. The region is a marginal contributor to the National Innovation System. They also lack any previous experience in clusters, while there are no technology parks operating in the region. Transport SMEs daily face major challenges in the region, like limited access to finance, increase in taxation, low level of science-business collaboration and PPPs, lack of innovation culture & funds for R&D investments, high transportation costs, insufficient infrastructures, unattractive legal framework, bureaucracy etc. The most important is considered the lack of external financial resources that will allow the funding and externalization and the successful establishment of the services and products of such SMEs.
However, opportunities for sustainable development of transport SMEs are also presented such as the availability of renewable resources, the public incentives (like the “Road Equivalent Tariff”, high-speed internet in remote islands and other), the collaboration with the local
280 | P a g e
research/innovation centers and Initiatives, participation in workshops/conferences and EU-funded projects etc.
Lithuania
Lithuania
Results
All in all, transport sector is one of the biggest sectors in Lithuania and it makes up around 12% of national GDP depending on year. It is the best result in the while EU (EU average around 5 %). Sectors added value is also very high and in Lithuanian economic structure it is the third best result. It is also worth mentioning that the number of enterprises and epmloyees are also rising. Transport sector is mainly composed of small and medium size enterprises. Road transport is by far the biggest segment in Lithuania transport sector, however water and rail transportation even though are smaller, also are strategically important to Lithuania.
Lithuania transport infrastructure is highly developed with some projects still underway. Lithuania is passed by strategic road roads, connecting north with south and east with west. Same can be said about railroads system. In the water transport system, Klaipeda State Seaport plays a key role, especially in regards to freight transportation. In general, countries accessibility is fairly developed and major transport routes goes through biggest Lithuania cities.
List of stakeholders involved in this sector is very broad. Starting with ministries and other governmental institutions it is also composed of various associations, transport clusters, business support organizations, education institutions, science and technology parks, financing institutions. The list is quite broad, however there are some concerns that this system is too broad which leads to an ineffective coordination and implementation of various strategies and plans.
Lithuania transport companies have a lot of competitive advantages over businesses in other countries. These are mentioned throughout the whole analysis, however to mention some, most important ones are Lithuania geographical position, labor costs compared to western Europe, developed infrastructure. However, there are also some weaknesses. Worth mentioning are low level of science and business cooperation, lack of labor force, lack of R&D activities. These weaknesses should be seen as opportunities if transport SMEs would determine to overcome them. There are also some global trends which will be important not only for Lithuania, but also for other countries transport SMEs: slowing economic growth, environmental challenges, protectionist policies, etc.
Policy mix in relation to transport is quite broad. Major Lithuanian economic development strategies like “Lithuania 2030” and “Lithuanian Smart Specialization Strategy” involve transport as one of the priorities. It means, that government pays more attention and financial resources to the development of this field.
281 | P a g e
South-West Oltenia
Romania
Results
Capacity & Capability of Regional Transport SMEs to Further Develop & Grow.
Considering the information and facts presented on SWO region’s transport-related sectors, there is a high potential of further growing industrial output, thus ensuring the economic-social conditions for advancement in capacity and capability of regional Transport SMEs to further develop and grow.
• Transport SMEs in SW Oltenia region are essential to achieving further industry & services sectors directly connected to transport;
• Transport SMEs in the region account for more than 50% of all jobs and also create the majority of new jobs. They contribute to economic growth, along with other enterprises;
• Transport SMEs are boosting innovation and economic diversification, and provide attractive business opportunities in the region;
• Transport SMEs development help create more and productive employment and social-economic progress in the region;
• Transport SMEs development in the SW Oltenia region assure productive jobs and income, reduce poverty and inequalities, and this sector has become a good example for stable employment basis;
• In order to establish the level of capacity and capability of regional transport SMEs, more emphasis should be placed on data collection, evidence-based policy design, monitoring, rigorous evaluation and impact measurement, in particular regarding the sustainability of Transport SMEs;
• Constraints faced by regional Transport SMEs vary significantly, and should be analysed within their specific regional context and differentiated by sector characteristics. A favourable business environment is vital for regional Transport SMEs’ capacity and capability to further develop and grow;
• Definitely the SW Oltenia region should improve Transport SMEs’ access to finance through measures such as loan guarantees, EU funding, start-up grants, facilitation of crowd-funding, sector-specific financial institutions, as part of policies for the support and incentives of Transport SME;
• Clustering, networking, linking into technology platforms, value chain and local economic development help improve the situation of regional Transport SMEs. Multiple SMEs associations and holdings can be an effective way of achieving scale and a better position in supplier and markets, as well as mobilising resources more effectively;
• Public investment in the SW Oltenia region should be further made in transport infrastructure, as well as invest in education and training and technology, on which Transport SMEs rely. Improvements can most effectively be achieved by embedding specific Transport SMEs policies in regional development plans and generic policies, with special attention to technical education and training systems, lifelong learning in cooperation with Transport SMEs as per their skills needs.
282 | P a g e
The analysis of the Transport-SME situation in SWO region will be made considering both the analyses resulting from statistical data processing and the conclusions drawn from the working groups meetings.
Development of Transport SMEs in SWO
• SWO region should provide more proactive support to Transport SMEs in their planning for internationalisation, including support in identifying the most attractive, fast-growing international markets;
• SWO region should develop knowledge and information resources to guide Transport SMEs through the norms and regulation associated with international activity, and to help them access all appropriate sources of funding;
• SWO region should help Transport SMEs build relationships with banks and other key financiers of international investment and trade, to facilitate introductions between these funding sources and Transport SMEs;
• SWO region should identify where Transport SMEs are dealing in foreign markets and seek opportunities to provide value-adding advice in areas such as managing risks and forecasting good opportunities;
• Additional networking opportunities can build relationships with other professionals and help connect SWO’s Transport SMEs with other regions to create mutually supportive environments and information channels;
• The international value chains can operate to the benefit of regional Transport SMEs that can specialise in tasks within the chain in which they have expertise, and thereby help them to become internationalised;
• Competition between local Transport SMEs may increase and business knowledge can be transmitted from foreign to local firms;
• Multiplier effects created by the Transport SMEs themselves in support of their exporting activity would generate new orders for additional materials and services;
• As the dynamics within international value chains may evolve, high-growth competitive Transport SMEs in the SWO region may eventually upgrade within the chain or become lead firms in their sector;
• International value chains also pose significant challenges to SWO regional Transport SMEs;
• Multinational enterprises often set strict product quality standards, thus upgrading regional Transport SMEs’ production;
• Lack of access to credit and insufficient support to obtain adequate R&D and training of personnel can significantly constrain SWO Transport SMEs' capacity to meet the product standards set by lead firms.
Transport-Related Sectors are in Full Development Over SWO Region.
As a result of consultation during the working groups organised in the SW Oltenia Region, transportation & industrial engineering sector is one of the smart specialization areas in the region. As of the year 2013, the automotive industry concentrates some very active SMEs in the region, the highest turnover being recorded by the companies Ford Romania SA and the group of companies producing car parts and components like Kirchhoff Automotive Romania SRL, located in Dolj county. The rolling stock industry has a long tradition at regional level, being one of the sectors In the field of mechanical engineering & transport, the region has several research centres, set up by the University of Craiova: Aerospace Engineering Research Centre - CERDIAS, Electrotechnics in Transport and Energy Systems - ELTRES, Electrical Engineering, Electro energy and Ecological Technologies - IEEET, Centre for Innovation and Technology Transfer - CITT, Scientific Research Centre for Electromechanical and Quality Systems - SEMEQ etc.

283 | P a g e
A few examples of intelligent innovations from SMEs and specialisation directions in the transport sector:
• Design and development of the bio-vehicle concept, based on biofuels from renewable resources.
• Developing new generations of railway vehicles and green, energy-efficient technologies.
284 | P a g e
Conclusions
West Midlands
United Kingdom
• In addition to a strong research base, our area boasts a well-developed network of science parks, associated innovation and incubator centres, as well as accelerator programmes.
• Along with the high availability of superfast broadband, this provides our businesses, wherever they are located, with the necessary physical assets and ‘hard’ infrastructures to support their growth and development.
• Our area faces multiple skills challenges. This is a major issue for the development of innovative businesses, with too few people with high-level qualifications relative to the UK, and too many with no qualifications.
• We have an impressive set of local networks, and our institutions are actively engaged at regional, national and international levels, with significant industrial and academic collaborations and partnerships in place. Our ecosystem is underpinned by a strong local policy focus on driving-up levels of innovation and maximising the potential of our key assets, including our major research-intensive universities, RTOs and R&D active firms. 226
Campania Region
Italy
Conclusions
From the point of view of innovation, passengers’ service sectors, traditionally identified as that of collective transport, have been, almost exclusively, subject of economic-financial and legislative restructuring, reforming specific rules for rationalising systems’ organization and management. This has led to halving the use of the services.
In order to prevent citizens, especially commuters, from giving up and aiming more and more at their own means of transport, with a consequent increase in vehicular traffic, urban pollution, which also affects the quality of every day life, in the last strategic period 2019-2021 the
226 https://www.wmca.org.uk/media/1682/west-midlands-sia-final-for-publication-21617.pdf
285 | P a g e
Campania Region is pursuing, in the field of transport, a general policy aimed at redevelopment, securing, strengthening and improving the efficiency of existing infrastructures and the overall offer of public transport to users.
Transport by rail
The regional policy on rail mobility will be primarily aimed at facilitating access to the territories, with particular reference to mobility to and from urban areas, providing with the renewal of the rolling stock park on the regional rail networks.
Furthermore, transport by rail is subject of interventions aimed at re-evaluating and upgrading the service provided by the so-called “historical” trains, which can themselves become actual travelling promotional places, as well as containers capable to offer tourist-visitors the welcome and useful information to raise the quality level of their experience in Campania.
Road transport
The objectives that the Regional Authority intends to achieve converge on a precise strategy to improve the efficiency of the local public transport which takes the form of various convergent actions on the minimum level of services, in order to make operativity more responsive to the need for citizens’ mobility in the region, both in terms of fleet of vehicles and in terms of more efficient quality, safety and environmental sustainability (purchase of eco-compatible vehicles, characterized by high energy yields and higher efficiency energy, used in regional and local urban and suburban public transport services).
Further operational objective is to guarantee the maintenance of adequate conditions of traffic and security on regional and provincial roads, which the Campania Region proposes to achieve in the three-year period concerned, in agreement with the institutional stakeholders that contribute to deal with safe road traffic for citizens.
Maritime connections
The main objective is to upgrade the port infrastructures and equipment and to re-programme the minimum maritime services, entering the runs related to night services.
The ports of the South Italy are factor of natural attraction, due to their strategic positioning that allows to avoid itineraries’ deviations: but the intermodal aspect must be improved. In particular, the bridge of the ports of Naples-Salerno on the Tyrrhenian Sea with Bari-Taranto on the Adriatic Sea can become the logistic base for the whole Italian industry right up to the Po Valley.
Attention to port infrastructures has been accompanied by the creation of rear ports (in addition to the Interporti of Nola and Marcianise), where industrial and manufacturing activities take place, along with numerous logistics facilities. Upon proposal by the Campania Region, the ZES (Special Economic Zones with partial or total taxes exemption for export or re-export and import flows) is the most coherent tool to create advantageous conditions of regional development.
Airports
As for the airports, innovation will be concentrated on the connection between the two airports of Naples Capodichino and Pontecagnano in a unique Campania airport system. Thus, Capodichino, which has undergone extraordinary growth over the last few years, will be breathed out, and Salerno Costa d'Amalfi airport will finally take off, destined to better satisfy the users of the Amalfi coast and Cilento, as well as the territories of Basilicata, Puglia and Calabria: a system that, at full capacity, will be able to develop traffic, between the two airports,
286 | P a g e
of over 17 million passengers. Total public and private investments are planned for 230 million euros.
Companies
Finally, with regard to the companies in the transport sector, automotive, aerospace, vehicle construction and rail transport systems and port and airport logistics, the success of the Campania system goes through an ever-stronger integration and participation among private and public institutions in the processes, to share common tools and methodologies, for a spread of light, interoperable and sustainable collaboration platforms. A sharing of knowledge finds its natural focus in the design of specific paths to form and train a new generation of human and technical resources.
Despite the fact that Campania is the first in Italy in terms of number of development contracts set up (30% of the national amount), public tools cannot support at long-term the Campania company’s needs; SMEs can no longer think of developing only by focusing on the resources provided by the public bodies: in order to maintain an important role at the international level they must cope with the new development paradigms offered by digital transformation, engaging a new cycle of growth and development through large-scale strategic public-private investment projects.
South Aegean Region
Greece
Conclusions
Region of South Aegean is a relatively wealthy and well-known tourism hotspot with a rich natural and cultural environment comprised of 79 dispersed islands (31 inhabited). The transport sector is vital for citizen’s wellbeing and for the development of sustainable tourism, that is the most important sector for the regional economy.
However, due to the relative isolation from the mainland, the geographical fragmentation and the special characteristics of the local natural environment such as location, size, insularity, etc. the local transport systems are heavily affected and more specifically their operational effectiveness and complementarity. This has an impact both on (a) tourism, since the sector is highly affected by issues generated in the transportation sector, such as the frequency, cost and reliability and (b) SMEs competitiveness that is considered very low at the moment.
Transport SMEs daily face major challenges in the region, like limited access to finance, increase in taxation, low level of science-business collaboration and PPPs, lack of innovation culture & funds for R&D investments, high transportation costs, insufficient infrastructures, unattractive legal framework, bureaucracy etc.
Local SMEs (especially in the most remote areas) need to become resilient to a climate of constrained national budgets and public investments and an unstable banking system with restrictions in all kind of loans (due to reduced liquidity) in order to have a sustainable future.
287 | P a g e
However, this “challenging” environment could be confronted if SMEs exploit the opportunities offered by the Region, such as the availability of renewable resources, the public incentives (like the “Road Equivalent Tariff”, high-speed internet in remote islands and other), the collaboration with the local research/innovation centers and Initiatives, participation in workshops/conferences and EU-funded projects etc.
Based on the challenges the South Aegean Region faces, the formation of synergies in topics such as promotion of employment, consultation regarding development services and technical problem solving is needed in order to enhance research and smart specialisation in matters related to environment, renewable energy sources, informatics and in transportation.
Jointly with support from the Regional Operational Programme and the relative ministries, the local transport SMEs could attract private and public investments to test their products and services and bring them in the market.
Lithuania
Lithuania
Conclusions
Talking about future trends, major developments in relation to transport safety, environmental concerns, cities, autonomous transportation, intelligent transport management and monitoring systems will also be visible in Lithuania. Already at national and enterprises level there are some plans and projects which will respond to these challenges. Lithuanian government developed various mobility and environment plans and strategies in order to reduce traffic jams and air pollution. Transport SMEs are also aware of changing environment and seeks to develop world class production. Lithuanian companies are very active in the fields of transport sharing platforms, development of alternative energy solutions, especially electricity, transport monitoring and management systems.
Lithuania innovation potential in transport sector is not fully exploited. Even though, there are plenty of universities, science valleys and technology parks operating in transport innovations, researchers participate in international projects, some enterprises spend a lot for R&D, there are some major drawbacks in this system. Overall expenditure for R&D is very low, there is no unified transport research center consolidating research programs for the entire sector, business and science cooperation is relatively low. Transport SMEs in Lithuania also do not fully exploit the opportunities related to the financing of the EU Structural Funds.
All in all, Lithuania is one of the most important transport sector countries in Europe. Geographical position and already developed transport systems mean that country is very competitive in this sector. However, new emerging technological and social trends step by step are changing this sector. In order to stay competitive, Lithuanian transport SMEs will have a crucial role in solving these emerging issues. There are already some successful cases such as “Ruptela” or “Elinta” companies who are famous for their innovative solutions, however this list has to be expanded. SMEs have to increase their innovation capabilities by increasing expenditure on R&D activities, improving science and business cooperation.
288 | P a g e
South-West Oltenia
Romania
Conclusions
• Annual turnover of SMEs in SW Oltenia region is almost 50% of the region’s GDP.
• The economy of SW Oltenia region has experienced a continuous increase in the last four years (2015-2018).
• In 2018, economic growth reached the peak of the post-crisis period (app 4.9%), a situation driven by strong domestic demand amid pro-cyclical fiscal policies.
• Economic growth was 7.3% in 2017, and 2.7% in 2018.
• The labour market has further strengthened as a result of steady economic growth.
• Unemployment is approaching the low levels recorded before the crisis and it continued to decline in the period 2017-2018.
• For the first time since 2008, actual production has exceeded its potential and it continued this growing trend over the period 2017-2018.
• The unused work force in the region is limiting the economic growth.
• Regional employment and rates of work among women, the low-skilled, young people, the disabled remain below the EU average.
• Public spending on investment is high, but low infrastructure development in the region is hindering economic growth.
Regarding the analysis carried out on the South-West Oltenia regional business environment, the following aspects were noted:
• The business environment has improved but still has a number of shortcomings.
• Over period 2011-2018, SW Oltenia's competitiveness has improved significantly, but it still needs further efforts and capital investment for development.
• Progress has been made in simplifying administrative procedures, in order to ease the SMEs development and competitiveness, but far from advanced countries.
• After the 2011-2013 period which was marked by a lack of progress, there was significant progress in 2013-2015, with two strategies in place, an action plan for entrepreneurship, business and SMEs and a government program for 2013-2016. The establishment of a specialised department for SMEs, the business environment and tourism has further strengthened progress. As a result, over the last 3 years (2016-2018), Romania has achieved results above the EU average in terms of facilitating the creation of new businesses, especially SMEs.
• Omnipresent bottlenecks and reluctance hinder SMEs investment in innovation in the region, a situation which is likely to continue in the coming years.
• SMEs have a low level of innovation and the knowledge flow between R&D suppliers and business activities is weak, which is confirmed by the fact that SW Oltenia region is in the queue of the ‘Collaboration and Entrepreneurship’ dimension in the Scoreboard.
• Bureaucracy, underdeveloped infrastructure and low levels of entrepreneurial education are all too many obstacles to innovative entrepreneurship and the creation and development of businesses (and SMEs) in the technology sector.
289 | P a g e
• It is expected to improve SMEs’ access to finance through a range of new financial instruments.
• It is estimated that by setting up a national bank to promote and create a SMEs bank announced by the government it will improve access to finance for SMEs and other businesses.
• Corruption, encountered at all levels, remains an obstacle to economic activities.
• The constant high rate of early school leaving and the low level of tertiary education do not meet the growing need for a skilled workforce, due to a persistent emigration flow.
• Public spending on investment has been among the highest in the EU over the last decade, but the perceived infrastructure quality is among the lowest in the EU.
• Public administration reform has speeded-up in 2016, it continued in 2017-2018, but it is not yet complete.
There is a high potential for further development and expansion of Transport-SMEs sectors in SWO region in the next 20-30 years continuously. Transport-related industry in SWO region is supported by a major automotive manufacturing company, Ford Romania, along with numerous companies producing automotive components. Ford Company is present in SWO since 2007 when it took over Craiova factory by making massive investments. Regarding the automotive component manufacturing, SWO has attracted increasingly more foreign investors in this segment, so currently there are produced automobile components in several factories in the SW Oltenia region. Such developments have increased the turnover of the sector steadily over the period 2010-18, and the increasing trend continues. Automotive production is almost entirely exported, its share in the total exports of the country's automobiles is important. The value of the exported vehicles is increasing, together with the increasing value of the automotive components to export. The automotive sector in SWO region represents a major share of the total exports of Romania, being one of the most competitive sectors of the economy. The vision for the SWO region is to become a major hub in transport related industry: automotive (passenger cars) and railway vehicles (passenger trains and tramways), aircraft industry (a major plant of military industry), Craiova International Airport steady development with connected service providers in maintenance and logistics.
290 | P a g e
Slim Version
In addition to the Transport SMEs Competiveness Report, all partners will prepare a summary of their regional analysis following the template distributed by PP5 – RDA SWO who will lead this activity. The aim is to produce a shorter version of the regional analysis summarising the main aspects and including recommendations based on the findings for each region. This shorter version will be used as a communication tool for the project stakeholders and policy makers in order to disseminate the research results and to raise awareness on the project theme. This version will be available on the project website.
References
www.interregeurope.eu/
West Midlands - UK
1 http://www.interregeurope.eu
2 https://www.gov.uk/government/collections/englands-traditional-counties
3 https://abcounties.com/
4 https://en.wikipedia.org/wiki/Constituent_state
5 https://www.definitions.net/definition/constituent%20country
6 https://www.thefreedictionary.com/conurbation
7 https://en.wikipedia.org/wiki/Metropolitan_borough
8 https://en.wikipedia.org/wiki/Metropolitan_county
9 https://www.collinsdictionary.com/dictionary/english/sovereign
10 https://en.wikipedia.org/wiki/Trade_bloc
11 https://dictionary.cambridge.org/dictionary/english/unitary-authority
12 https://www.cia.gov/library/publications/the-world-factbook/geos/uk.html
13 https://europa.eu/european-union/about-eu/countries_en
14 https://en.wikipedia.org/wiki/United_Kingdom
15 https://en.wikipedia.org/wiki/The_Midlands
16 http://www.freeworldmaps.net/europe/united-kingdom/england/england.jpg
17 https://en.wikipedia.org/wiki/West_Midlands_(region)
18 https://en.wikipedia.org/wiki/West_Midlands_Green_Belt
19 http://www.cprewm.org.uk/
20 https://www.britannica.com/place/West-Midlands
21 https://en.wikipedia.org/wiki/West_Midlands_(county)
22 https://www.britannica.com/place/West-Midlands
23 https://en.wikipedia.org/wiki/West_Midlands_(county)
24 https://en.wikipedia.org/wiki/West_Midlands_Combined_Authority
25 https://www.wmca.org.uk/who-we-are/
26 https://www.wmca.org.uk/who-we-are/structure
291 | P a g e
27 https://en.wikipedia.org/wiki/West_Midlands_conurbation
28 https://www.bbc.co.uk/news/uk-england-coventry-warwickshire-37631092
29 https://www.coventrytelegraph.net/news/coventry-news/what-county-is-coventry-in-
12118879
30 https://en.wikipedia.org/wiki/Warwickshire
31 http://maps.warwickshire.gov.uk/boundaries/
32 http://www.lgbce.org.uk/all-reviews/west-midlands/warwickshire/warwickshire-county-
council
33 http://www.legislation.gov.uk/uksi/1993/474/made
34 https://www.cw-chamber.co.uk/about-us/policy/branches/
35 https://www.nomisweb.co.uk/reports
36 https://ec.europa.eu/eurostat/web/regions-and-cities
37 https://www.ons.gov.uk/methodology/geography/ukgeographies/eurostat
38 https://www.gov.uk/check-a-university-is-officially-recognised
39 https://www.birmingham.ac.uk/index.aspx
40 https://ts.catapult.org.uk/news-events-gallery
41 https://www2.aston.ac.uk/
42 https://www.bcu.ac.uk/
43 https://www.coventry.ac.uk/
44 https://warwick.ac.uk/
45 https://www.wlv.ac.uk
46 http://www.lepnetwork.org.uk/the-lep-network/
47 https://www.cw-chamber.co.uk/
48 https://www.cwlep.com/
49 https://www.cwgrowthhub.co.uk
50 https://gbslep.co.uk/
51 https://www.blackcountrylep.co.uk
52 https://www.gov.uk/government/organisations/department-for-international-trade
53 https://www.gov.uk/government/how-government-works
54 https://www.nao.org.uk/report/departments-oversight-of-arms-length-bodies-a-
comparative-study/
55 https://ec.europa.eu/growth/tools-databases/regional-innovation-
monitor/organisation/innovation-poles
56 https://www.gov.uk/government/organisations/highways-england
57 https://www.gov.uk/government/organisations/department-for-transport
58 https://cp.catapult.org.uk/about-us/
59 https://www.tfwm.org.uk/
292 | P a g e
60 https://www.midlandsengine.org
61 https://en.wikipedia.org/wiki/Rail_franchising_in_Great_Britain
62 http://wmre.org.uk/about-us/key-links/
63 https://www.railsupplygroup.org
64 https://www.ukri.org/
65 http://ec.europa.eu/growth/industry/policy/cluster_en
66 http://ec.europa.eu/competition/state_aid/legislation/horizontal.html
67 https://www.coventry.ac.uk/research/areas-of-research/institute-for-future-transport-and-
cities/our-facilities/
68 https://warwick.ac.uk/fac/sci/wmg
69 www.the-mtc.org
Campania Region - Italy
1 Legambiente and Environment Italy
2 Campania Regional Operational Programme ERDF 2014-2020
3 Campania 2020 - Mobilità Sostenibile e Sicura
4 Bollettino Ufficiale della Regione Campania (BURC) (Official Gazzette of Campania
Region)
5 Piano Direttore della Mobilità Regione Campania (Master plan of Campania Region
Mobility)
South Aegean Region - Greece
1 “RIS3 Regional Assessment: South Aegean”, Alasdair Reid, Nikos Komninos, Jorge-A.
Sanchez-P., Panayiotis Tsanakas, Dec 2012
2 European Innovation Scoreboard 2019
3 South Aegean Regional Operational Programme 2014-2020
4 South Aegean Regional Operational Programme 2007-2013
5 Hellenic Statistical Authority: http://www.statistics.gr
6 DAFNI network: https://dafninetwork.gr
7 University of Aegean: http://www1.aegean.gr/aegean/en/about.htm
8 Road Equivalent Tariff measure https://metaforikoisodynamo.gr/
293 | P a g e
9 3D pedestrian crossing in Tinos https://www.drive.gr/news/ellada/i-tinos-apektise-
trisdiastates-diabaseis-video
10 AEGEA - Aegean Energy & Environment Agency www.aegean-energy.gr
11 «Aegean Cargo Sailing» (https://www.sailmed.org)
Lithuania
1. Invest Lithuania, Transport and Logistics in Lithuania: Alchemistry of crossroads
2. Lithuanian Labour Exchange
3. Enterprise Lithuania
South-West Oltenia - Romania
1. www.adroltenia.ro/studiul-privind-transportul-si-mobilitatea-in-cadrul-regiunii-sud-vest-
oltenia/
2. www.apdf.ro/ - National Company of Danube River Administration
3. www.primariacraiova.ro/
4. www.primariavl.ro/
5. www.primariadrobeta.ro/
6. www.targujiu.ro/
7. www.primariaslatina.ro/
8. www.adroltenia.ro/studiul-privind-transportul-si-mobilitatea-in-cadrul-regiunii-sud-vest-
oltenia/
9. www.insse.ro/
10. www.insse.ro/
11. www.insse.ro/
12. www.zf.ro/imm/
13. www.onrc.ro/index.php/ro/caen
14. http://imm.gov.ro/
15. www.ford.com/ro/
16. https://acsee.iafor.org/ - Asian Conference on Sustainability, Energy & the
Environment
17. www.severnav.ro/
18. www.snorsova.ro/
294 | P a g e
19. www.electroputere.ro/
20. www.softronic.ro/
21. www.acv.ro/
22. https://e-twow.ro/
23. www.automotive-svoltenia.ro/
24. www.aries-oltenia.ro/
25. www.old.inforegio.ro/ro/regio-2007-2013/
26. http://old.fonduri-ue.ro/poscce/
27. www.inforegio.ro/
28. www.fonduri-ue.ro/poc-2014
29. www.fonduri-ue.ro/poim-2014
30. https://startupnation2018.aippimm.ro/
31. www.afm.ro/programe_finantate.php
32. www.mt.gov.ro/web14/strategia-in-transporturi/transporturi-finantari
33. https://urbanizehub.ro/
34. www.incesa.ro/#/
35. www.icmet.ro/
36. https://ec.europa.eu/growth/tools-databases/regional-innovation-monitor/
37. http://mai.gov.ro/
38. www.hightechindustrypark.ro/
39. www.hidroelectrica.ro/
40. www.hidroelectrica.ro/
41. www.vidincalafatbridge.bg/ro/
42. www.cfr.ro/
43. www.aeroportcraiova.ro/en/
44. https://ec.europa.eu/growth/tools-databases/regional-innovation-monitor/base-
profile/south-west-oltenia
45. http://s3platform.jrc.ec.europa.eu/regions/RO41/tags/RO41
46. https://en.wikipedia.org/wiki/Value_chain#/media/File:Porter_Value_Chain.png
47. www.unece.org/info/ece-homepage.html
48. https://en.wikipedia.org/wiki/Intelligent_transportation_system
49. https://ec.europa.eu/transport/
50. https://en.wikipedia.org/wiki/High-speed_rail
51. http://businessangelsromania.ro/en/
52. www.techangels.ro/
53. www.romanianstartups.com/event/ventureconnect/
54. www.startupcafe.ro/taxe/crowdfunding-fonduri-antreprenori.htm
295 | P a g e
55. AECOM (2015), Key performance indicators for Intelligent Transport Systems, Bristol.
56. European Commission (2008). Action Plan for the Deployment of Intelligent Transport
Systems in Europe – Communication from the Commission, COM (2008)886 final,
Brussels
57. European Commission (2010a). Directive 2010/40/EU of the European Parliament
and of the Council of 7 July 2010 on the framework for the deployment of Intelligent
Transport Systems in the field of road transport and for interfaces with other modes of
transport, Brussels.
58. European Commission (2010b). A strategy for smart, sustainable and inclusive
growth, EUROPE 2020, Communication from the Commission, COM (2010) 2020,
Brussels, 2010.
59. European Commission (2012): Intelligent transport systems, [Online], Available:
http://ec.europa.eu/transport/themes/its/index_en.htm, 15th March 2013
Related Documents


