This article was downloaded by: [National Institute of Tech - Surathkal] On: 20 May 2015, At: 01:55 Publisher: Taylor & Francis Informa Ltd Registered in England and Wales Registered Number: 1072954 Registered office: Mortimer House, 37-41 Mortimer Street, London W1T 3JH, UK Click for updates Separation Science and Technology Publication details, including instructions for authors and subscription information: http://www.tandfonline.com/loi/lsst20 Recovery and Partial Purification of Bovine α- Lactalbumin from Whey Using PEG 1000 – Trisdoium Citrate Systems Kalaivani Sivakumar a & Regupathi Iyyaswami a a Department of Chemical Engineering, National Institute of Technology Karnataka, Surathkal, Srinivasanagar (PO), Mangalore, India Accepted author version posted online: 28 Oct 2014. To cite this article: Kalaivani Sivakumar & Regupathi Iyyaswami (2015) Recovery and Partial Purification of Bovine α- Lactalbumin from Whey Using PEG 1000 – Trisdoium Citrate Systems, Separation Science and Technology, 50:6, 833-840, DOI: 10.1080/01496395.2014.964729 To link to this article: http://dx.doi.org/10.1080/01496395.2014.964729 PLEASE SCROLL DOWN FOR ARTICLE Taylor & Francis makes every effort to ensure the accuracy of all the information (the “Content”) contained in the publications on our platform. However, Taylor & Francis, our agents, and our licensors make no representations or warranties whatsoever as to the accuracy, completeness, or suitability for any purpose of the Content. Any opinions and views expressed in this publication are the opinions and views of the authors, and are not the views of or endorsed by Taylor & Francis. The accuracy of the Content should not be relied upon and should be independently verified with primary sources of information. Taylor and Francis shall not be liable for any losses, actions, claims, proceedings, demands, costs, expenses, damages, and other liabilities whatsoever or howsoever caused arising directly or indirectly in connection with, in relation to or arising out of the use of the Content. This article may be used for research, teaching, and private study purposes. Any substantial or systematic reproduction, redistribution, reselling, loan, sub-licensing, systematic supply, or distribution in any form to anyone is expressly forbidden. Terms & Conditions of access and use can be found at http:// www.tandfonline.com/page/terms-and-conditions

Welcome message from author
This document is posted to help you gain knowledge. Please leave a comment to let me know what you think about it! Share it to your friends and learn new things together.
Transcript

This article was downloaded by: [National Institute of Tech - Surathkal]On: 20 May 2015, At: 01:55Publisher: Taylor & FrancisInforma Ltd Registered in England and Wales Registered Number: 1072954 Registered office: Mortimer House,37-41 Mortimer Street, London W1T 3JH, UK
Click for updates
Separation Science and TechnologyPublication details, including instructions for authors and subscription information:http://www.tandfonline.com/loi/lsst20
Recovery and Partial Purification of Bovine α-Lactalbumin from Whey Using PEG 1000 – TrisdoiumCitrate SystemsKalaivani Sivakumara & Regupathi Iyyaswamiaa Department of Chemical Engineering, National Institute of Technology Karnataka,Surathkal, Srinivasanagar (PO), Mangalore, IndiaAccepted author version posted online: 28 Oct 2014.
To cite this article: Kalaivani Sivakumar & Regupathi Iyyaswami (2015) Recovery and Partial Purification of Bovine α-Lactalbumin from Whey Using PEG 1000 – Trisdoium Citrate Systems, Separation Science and Technology, 50:6, 833-840, DOI:10.1080/01496395.2014.964729
To link to this article: http://dx.doi.org/10.1080/01496395.2014.964729
PLEASE SCROLL DOWN FOR ARTICLE
Taylor & Francis makes every effort to ensure the accuracy of all the information (the “Content”) containedin the publications on our platform. However, Taylor & Francis, our agents, and our licensors make norepresentations or warranties whatsoever as to the accuracy, completeness, or suitability for any purpose of theContent. Any opinions and views expressed in this publication are the opinions and views of the authors, andare not the views of or endorsed by Taylor & Francis. The accuracy of the Content should not be relied upon andshould be independently verified with primary sources of information. Taylor and Francis shall not be liable forany losses, actions, claims, proceedings, demands, costs, expenses, damages, and other liabilities whatsoeveror howsoever caused arising directly or indirectly in connection with, in relation to or arising out of the use ofthe Content.
This article may be used for research, teaching, and private study purposes. Any substantial or systematicreproduction, redistribution, reselling, loan, sub-licensing, systematic supply, or distribution in anyform to anyone is expressly forbidden. Terms & Conditions of access and use can be found at http://www.tandfonline.com/page/terms-and-conditions

Separation Science and Technology, 50: 833–840, 2015Copyright © Taylor & Francis Group, LLCISSN: 0149-6395 print / 1520-5754 onlineDOI: 10.1080/01496395.2014.964729
Recovery and Partial Purification of Bovine α-Lactalbuminfrom Whey Using PEG 1000 – Trisdoium Citrate Systems
Kalaivani Sivakumar and Regupathi IyyaswamiDepartment of Chemical Engineering, National Institute of Technology Karnataka, Surathkal,Srinivasanagar (PO), Mangalore, India
The extraction of α-Lactalbumin (α-La) and β-Lactoglobulin(β-Lg) from whey have been carried out in the Aqueous TwoPhase System (ATPS) composed of PEG 1000 – tri sodium citrate.The suitable conditions for the simultaneous partitioning of α-Lainto the top phase and β-Lg in bottom phases was identifiedusing the pure α-La and β-Lg. Maximum partition coefficient (k)of 16.67 was achieved for α-La at the system condition of 28%(w/w) PEG 1000-14% (w/w) tri sodium citrate at pH 8 and 40◦C,whereas in this condition k of β-Lg is 0.27. 30% (w/w) wheyloaded to this system yielded the maximum recovery of α-La andβ-Lg.
Keywords aqueous two phase systems; α-Lactalbumin; PEG1000-tri sodium citrate; whey
INTRODUCTIONBovine α-Lactalbumin (α-La) is the second major protein in
whey which helps in boosting the immune system and regulatesthe production of lactose (1). The intake of α-La has provento have neurobehavioral benefits in adults (2) and can also beused as a contraceptive agent (3). It has the potential to induceapoptosis in tumor cells when it forms a complex with oleicacid (4). Nano tubular structures formed by partial hydrolysisunder controlled environment have been successfully testedfor site directed drug delivery (5). α-La is the primary proteinin human milk, and therefore, the addition of bovine α-La informula milk would provide adequate nutrition to the infants.α-La exists in the diluted form in whey with other proteinssuch as β-Lactoglobulin (β-Lg), Serum Albumin (BSA),Lactoferrin, Lactose peroxidase, and Glycomacropeptide(GMP) (6). The presence of lactose, fat, and complex mixture
Received 17 March 2014; accepted 9 September 2014.Address correspondence to Regupathi Iyyaswami, Department of
Chemical Engineering, National Institute of Technology Karnataka,Surathkal, Srinivasanagar (PO), Mangalore - 575026, India. E-mail:[email protected]
Color versions of one or more of the figures in the article can befound online at www.tandfonline.com/lsst.
of proteins makes the recovery of individual proteins fromwhey a challenging task.
As of now, the commercially available purified α-La hasbeen recovered from whey by ion exchange chromatographyand membrane separation processes (7). High pressure drop,low flow rate, lesser diameter to length ratio, cost of packingmaterial, and clogging of the column resin pores limits scale upof chromatographic separation. Membranes used in ultrafiltra-tion separation process are not economical and also fouling ofthe membrane reduces the yield of the product with respect totime. Scale-up difficulties of these downstream processes limitlarge scale production of α-La and as a consequence the puri-fied individual protein cost is too high, which emphasizes theneed for a simple, high throughput technology to process whey.
Aqueous Two Phase Extraction (ATPE) is one such tech-nique with ease of scale-up, continuous operation, and largehandling capacity. Partitioning of biomolecules in AqueousTwo Phase Systems (ATPS) is governed by various sys-tem parameters such as type and concentration of the phasecomponents, temperature, pH, the presence of additives, andalso by the biomolecule properties such as charge, size, andhydrophobicity (8). Several polymer-salt ATPS have beenemployed to study the partitioning behavior of pure whey pro-teins. Recently, Alcantara et al. (9) reported 81.1% yield ofα-La and 97.8% of GMP into the top PEG rich phase and 97.3%yield of β-Lg in to the bottom salt rich phase in PEG 2000–potassium phosphate system. However, the salts used in thosesystems are not biodegradable and hence the salt rich phasehas to be subjected to waste treatment before releasing intothe environment, which again increases the cost of the purifiedproduct. With this perspective we have chosen citrate salts as aphase component for ATPS. Previously, we have reported thepartitioning of α-La in to the top PEG rich phase with high par-tition coefficient in PEG 1000-tripotassium citrate system (10).Further studies carried out in our laboratory on the partitioningof pure β-Lg in PEG 1000–tripotassium citrate system revealsthe affinity of β-Lg towards the top PEG rich phase whichis undesirable for the purification of α-La into the top phase(data not published). Moreover, Yan-Min et al. (8) reported the
833
Dow
nloa
ded
by [
Nat
iona
l Ins
titut
e of
Tec
h -
Sura
thka
l] a
t 01:
55 2
0 M
ay 2
015

834 K. SIVAKUMAR AND R. IYYASWAMI
partitioning of BSA into the top phase of PEG–tripotassiumsystem with a yield of 99%. These pure protein studies in PEG1000–tripotassium citrate system suggest the purity of α-Lapartitioned in this system would be less because of the parti-tioning of major contaminants such as β-Lg and BSA into thetop PEG rich phase.
Hence, we have chosen sodium citrate, which is also beingwidely used for the partitioning studies of pure whey proteinssuch as BSA (11) and Glycomacropeptide (12). Bogalio et al.(13) and Capezio et al. (14) reported the partitioning of thesynthetic mixture of BSA, α-La, β-Lg and the recombinantalpha-1 antitrypsin (ATA) expressed in bovine milk in PEG–tri sodium system with an objective of purifying ATA. Hence,in the present work a structured approach has been carried outto study the influence of factors such as PEG molecular weightand concentration, salt (tri sodium citrate) and additive (NaCl)concentrations, system pH, and temperature on the partition-ing of α-La and β-Lg in PEG–tri sodium citrate system. Sincethe partitioning of biomolecule in ATPs is truly driven by theequilibrium concentration of the phases, the equilibrium con-centration of the phase components along with their respectiveTie Line Lengths (TLL) were analyzed and reported. Processparameters and equilibrium conditions suitable for the recov-ery of α-La from whey were identified from the pure proteinstudies. Efficiency of the system in the purification process wasdiscussed in terms of yield, purification fold, and recovery ofα-La from whey.
MATERIALS AND METHODSChemicals
Polyethylene glycol (PEG) [HO-(CH2CH2O)n-CH2OH] ofaverage molecular masses 1000, α-Lactalbumin (L 5285) typeI, β-lactoglobulin (L 2506) of purity greater than 85%and Bradford Reagent were procured from Sigma-Aldrich.Molecular biology grade BSA (MB083-5G) from Himedia,India was used for the studies. HPLC grade Acetonitrile,TriFluroAcetic Acid, and analytical grade tri-sodium citratefrom Merck was used. De-ionized water obtained fromMillipore system was used in all the experiments.
MethodsPreparation of Aqueous Two-Phase Systems (ATPS)
ATPS were prepared by mixing required concentration ofthe PEG 1000 and tri sodium citrate stock solutions. For stud-ies with pure protein, 0.5 mg of pure protein was added to the10 g system and the desired system pH was adjusted using cit-ric acid/NaOH. For studies with whey, 3 g of freshly preparedwhey in the laboratory was added to the 10 g system. The sys-tems were then subjected to the centrifugal force of 2000 g formin to increase the rate of phase separation and allowed to reachequilibrium at the desired temperature. After 24 hrs of incu-bation, the top and bottom phases were completely clear with
a distinct demarcation of interphase. The phase volumes werenoted down and the phases were separated using pipettes.
Preparation of Acid WheyAcid whey was prepared by adjusting pH of the pasteurized
milk to 4.6. In this acidic pH, the major milk protein casein wascoagulated and removed as a pellet by centrifuging the acidifiedmilk at 15,000 RCF for 30 min at 4◦C. This eventually resultsin the precipitation of casein and lipids and the clear straw col-ored whey as supernatant. Protein concentration in whey wasquantified and stored at 4◦C until use.
Quantification of ProteinsTotal protein content in whey and in the phase samples
of pure proteins were analyzed by Bradford assay. The inter-ference of phase components in the protein estimation wasneglected by using the corresponding phase sample with-out protein as blank (10). Individual protein concentrationin whey was analyzed in Dionex High Performance LiquidChromatography (HPLC) system using Reverse phase C18 col-umn (RP 18-415, Shodex). Two different mobile phases (A–0.1% Tri Fluro Acetic Acid (TFA), B–0.09% TFA in 90%Acetonitrile) were used at a flow rate of 1 mL/min and thecolumn was maintained at 25◦C throughout the analysis. Multi-step linear gradient program (15) was used to separate theproteins based on their hydrophobicity and the absorbance wasrecorded at 214 nm using UV-Vis detector. Freshly preparedmixed proteins mixture (α-La, β-Lg, and BSA) was used forthe preparation of standard curve. The concentration of eachprotein was in the range of 0.5–0.1 mg/mL. All the analysiswas done in triplicates and the average values are reported.
Analysis of Phase Components ConcentrationSalt concentration in the equilibrated phases was measured
in flame photometer (Elico Co. Ltd) between 1 ppm and100 ppm and an external standard addition method was usedto calculate the concentration of salts. Polymer concentrationwas calculated from refractive index measurements (AutomaticDigital Refractometer, Atago Co. Ltd, RX-5000α) with anaccuracy of ± 0.00004. For diluted samples, a linear relation-ship between polymer concentrations, salt concentration, andrefractive index measurements is represented by Eq. (1) (16).
nD = a0 + a1wp + a2ws (1)
where nD is the measured refractive index of the sample, wp
and ws are the weight fractions of polymer and salt respec-tively. Constants a0–1.3325 (refractive index of water at 25◦C),a1 – 0.1417and a2 – 0.1582 values are valid within the range ofpolymer (4%–50% w/w) and salt (0.2%–26% w/w) concentra-tion with a regression of 0.997. Tie lines (TL) were constructedby connecting equilibrium concentration of the phases and feedpoint. Length of the tie lines (TLL) was calculated by Eq. (2).
Dow
nloa
ded
by [
Nat
iona
l Ins
titut
e of
Tec
h -
Sura
thka
l] a
t 01:
55 2
0 M
ay 2
015

RECOVERY AND PARTIAL PURIFICATION OF BOVINE α-LACTALBUMIN FROM WHEY 835
TLL =√(
wtp − wb
p
)2 + (wt
s − wbs
)2(2)
where the wp and ws are the weight fractions of polymer andsalt and the superscript t, b indicates the top and bottom phase,respectively.
CalculationsPartition coefficient (k) is defined as the ratio of desired pro-
tein concentration in top phase (Ct) to the bottom phase (Cb)(Eq. 3) and yield% of α-La in top and β-Lg in the bottom phasewas calculated using Eqs. (4) and (5), respectively,
Partition coefficient (k) = Ct
Cb(3)
Top phase yield (yα−La)t% = 100(1 + 1/
kVr
) (4)
Bottom phase yield(yβ−Lg
)b% = 100
(1 + kVr)(5)
where V r is the phase volume ratio (top phase volume/bottomphase volume). For studies with whey, selectivity (17), purifi-cation fold, and recovery (18) of α − La partitioned to the topphase was calculated using Eqs. (6), (7), and (8), respectively,
Selectivity for α − La in top phase = k (α − La)
k (β − Lg)(6)
Purification fold of α − La in top phase
= (Cα−La)top phase(Ctotal protein
)top phase
∗(Ctotal protein
)whey
(Cα−La)whey
(7)
Recovery ofα − La in top phase
= 100 ∗ (Cα−La)top phase
initial concentration of α − La added in the system
(8)
RESULTS AND DISCUSSIONEffect of PEG Molecular Weight on the Partitioning ofα-La and β-Lg
Partitioning of the desired biomolecule into the top PEGrich phase is desirable due to the stabilizing nature of PEG.Here, the desired biomolecule, α-La is hydrophobic in natureand hence the hydrophobic interaction between PEG and α-Lacould be the driving force for the partitioning of α-La to thetop PEG rich phase. Hydrophobicity of the PEG rich phase isdetermined by the PEG molecular weight and its concentration.
–4.0
–3.0
–2.0
–1.0
0.0
1.0
2.0
3.0
0 1000 2000 3000 4000 5000 6000 7000
ln k
PEG molecular weight
α-La
β-Lg
FIG. 1. Influence of PEG molecular weight on the partitioning of ◦ α-La and� β-Lg at an equilibration temperature of 25◦C in 34 (%, w/w) PEG X – 12(%, w/w) tri sodium citrate systems. The error bars represent standard deviationof the triplicate analysis.
Hence, to identify the suitable PEG molecular weight for thepartitioning, partitioning studies were carried out in the 34(%,w/w) PEG X – 12(%, w/w) tri sodium citrate systems. Thepartition coefficient of both α-La and β-Lg was observed todecrease with the increase in PEG molecular weight (Fig.1).It is noted that irrespective of the difference in hydrophobicityand molecular weight, both α-La and β-Lg demonstrate asimilar pattern of decrease in the k with increase of PEG molec-ular weight. As a consequence of increase in PEG molecularweight, hydrophobicity and Effective Excluded Volume of PEGrich top phase increases in the systems with the simultaneousreduction of free volume available for biomolecule solvation.Similar observations were reported for BSA in PEG-tri sodiumcitrate/ tri potassium citrate system (19, 20), α-La in PEG-tri potassium citrate system (10), and for α-La and β-Lg inPEG–potassium phosphate/ammonium sulphate systems (21,22). Chen (21) stated that the major driving force for the par-titioning of α-La into the top PEG rich phase is hydrophobicinteraction between PEG and the hydrophobic region of α-La.However, the increase of PEG molecular weight associated withincrease in the hydrophobicity of PEG does not favor the par-titioning of the whey proteins (GMP, α-La, β-Lg, and BSA)into the top PEG rich phase, which means that the EffectiveExcluded Volume of PEG predominates the hydrophobic effect.The present experimental results suggest the usage of lowermolecular weight of PEG for the partitioning of α-La into thePEG rich top phase. Hence, further experiments were restrictedto PEG 1000–tri sodium citrate systems.
Effect of PEG 1000 Concentration and Tri Sodium CitrateConcentration
Effect of PEG 1000 concentration on the partitioning of α-La and β-Lg was studied by varying the PEG concentrationfrom 20 to 38%, w/w at a constant tri sodium citrate
Dow
nloa
ded
by [
Nat
iona
l Ins
titut
e of
Tec
h -
Sura
thka
l] a
t 01:
55 2
0 M
ay 2
015
836 K. SIVAKUMAR AND R. IYYASWAMI
–3
–2
–1
0
1
2
3
15 20 25 30 35 40
ln k
PEG 1000 concentration (%, w/w)
α-La
β-Lg
FIG. 2. Influence of PEG 1000 concentration on the partitioning; of ◦ α- La& � β-Lg in X (%, w/w) PEG 1000 – 14 (%, w/w) tri sodium citrate systems.Horizontal error bars represent fixed error of 0.2 in the PEG 1000 concentrationand the vertical error bars represent standard deviation of the triplicate analysisof partition coefficient values.
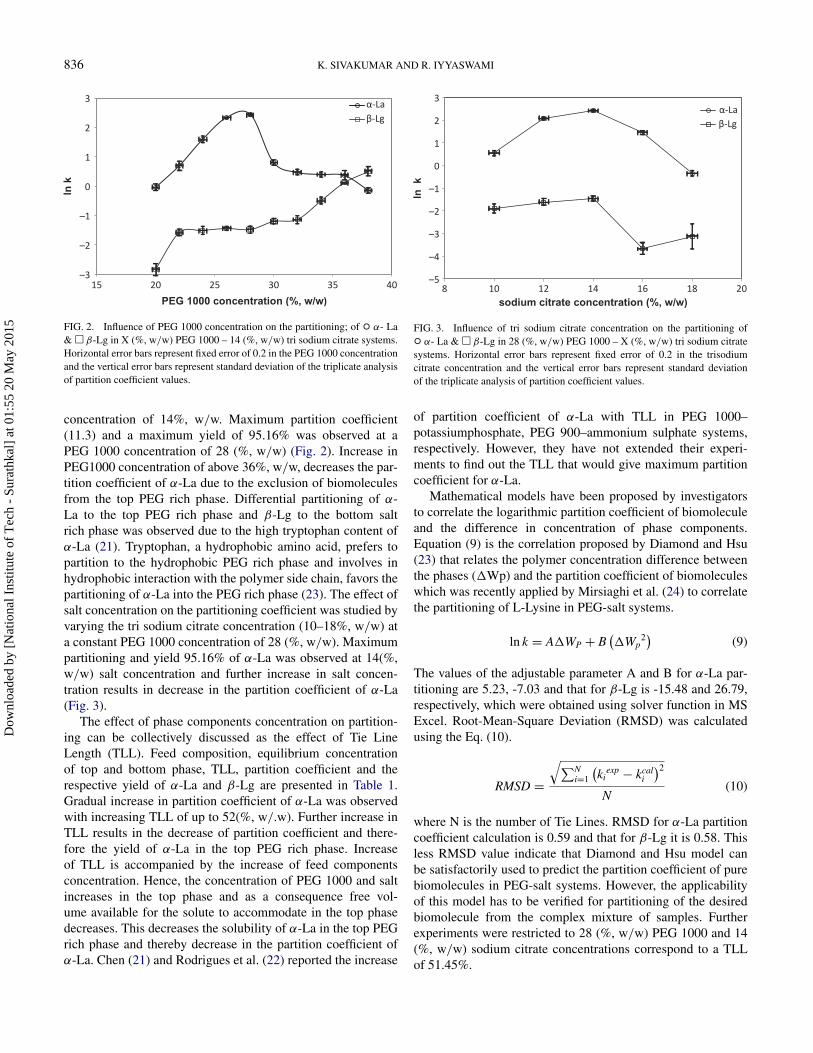
concentration of 14%, w/w. Maximum partition coefficient(11.3) and a maximum yield of 95.16% was observed at aPEG 1000 concentration of 28 (%, w/w) (Fig. 2). Increase inPEG1000 concentration of above 36%, w/w, decreases the par-tition coefficient of α-La due to the exclusion of biomoleculesfrom the top PEG rich phase. Differential partitioning of α-La to the top PEG rich phase and β-Lg to the bottom saltrich phase was observed due to the high tryptophan content ofα-La (21). Tryptophan, a hydrophobic amino acid, prefers topartition to the hydrophobic PEG rich phase and involves inhydrophobic interaction with the polymer side chain, favors thepartitioning of α-La into the PEG rich phase (23). The effect ofsalt concentration on the partitioning coefficient was studied byvarying the tri sodium citrate concentration (10–18%, w/w) ata constant PEG 1000 concentration of 28 (%, w/w). Maximumpartitioning and yield 95.16% of α-La was observed at 14(%,w/w) salt concentration and further increase in salt concen-tration results in decrease in the partition coefficient of α-La(Fig. 3).
The effect of phase components concentration on partition-ing can be collectively discussed as the effect of Tie LineLength (TLL). Feed composition, equilibrium concentrationof top and bottom phase, TLL, partition coefficient and therespective yield of α-La and β-Lg are presented in Table 1.Gradual increase in partition coefficient of α-La was observedwith increasing TLL of up to 52(%, w/.w). Further increase inTLL results in the decrease of partition coefficient and there-fore the yield of α-La in the top PEG rich phase. Increaseof TLL is accompanied by the increase of feed componentsconcentration. Hence, the concentration of PEG 1000 and saltincreases in the top phase and as a consequence free vol-ume available for the solute to accommodate in the top phasedecreases. This decreases the solubility of α-La in the top PEGrich phase and thereby decrease in the partition coefficient ofα-La. Chen (21) and Rodrigues et al. (22) reported the increase
–5
–4
–3
–2
–1
0
1
2
3
8 10 12 14 16 18 20
ln
k
sodium citrate concentration (%, w/w)
α-La
β-Lg
FIG. 3. Influence of tri sodium citrate concentration on the partitioning of◦ α- La & � β-Lg in 28 (%, w/w) PEG 1000 – X (%, w/w) tri sodium citratesystems. Horizontal error bars represent fixed error of 0.2 in the trisodiumcitrate concentration and the vertical error bars represent standard deviationof the triplicate analysis of partition coefficient values.
of partition coefficient of α-La with TLL in PEG 1000–potassiumphosphate, PEG 900–ammonium sulphate systems,respectively. However, they have not extended their experi-ments to find out the TLL that would give maximum partitioncoefficient for α-La.
Mathematical models have been proposed by investigatorsto correlate the logarithmic partition coefficient of biomoleculeand the difference in concentration of phase components.Equation (9) is the correlation proposed by Diamond and Hsu(23) that relates the polymer concentration difference betweenthe phases (�Wp) and the partition coefficient of biomoleculeswhich was recently applied by Mirsiaghi et al. (24) to correlatethe partitioning of L-Lysine in PEG-salt systems.
ln k = A�WP + B(�Wp
2)
(9)
The values of the adjustable parameter A and B for α-La par-titioning are 5.23, -7.03 and that for β-Lg is -15.48 and 26.79,respectively, which were obtained using solver function in MSExcel. Root-Mean-Square Deviation (RMSD) was calculatedusing the Eq. (10).
RMSD =√∑N
i=1
(ki
exp − kcali
)2
N(10)
where N is the number of Tie Lines. RMSD for α-La partitioncoefficient calculation is 0.59 and that for β-Lg it is 0.58. Thisless RMSD value indicate that Diamond and Hsu model canbe satisfactorily used to predict the partition coefficient of purebiomolecules in PEG-salt systems. However, the applicabilityof this model has to be verified for partitioning of the desiredbiomolecule from the complex mixture of samples. Furtherexperiments were restricted to 28 (%, w/w) PEG 1000 and 14(%, w/w) sodium citrate concentrations correspond to a TLLof 51.45%.
Dow
nloa
ded
by [
Nat
iona
l Ins
titut
e of
Tec
h -
Sura
thka
l] a
t 01:
55 2
0 M
ay 2
015

RECOVERY AND PARTIAL PURIFICATION OF BOVINE α-LACTALBUMIN FROM WHEY 837
TABLE 1Equilibrium concentration of the phases with their TLL, partition coefficient, top phase yield of α-La and bottom phase yield of
β-Lg
Feed (%, w/w) Top phase (%, w/w)Bottom phase
(%, w/w)Partition
coefficient (k) Yield (%)
PEG1000
Tri sodiumcitrate
PEG1000
Tri sodiumcitrate
PEG1000
Tri sodiumcitrate
Tie linelength
(TLL) (%,w/w) α-La β-Lg α-La β-Lg
20 14 32.22 5.81 3.60 24.72 34.31 0.97 0.06 58.62 92.0622 14 34.83 4.94 3.02 26.58 38.46 2.00 0.21 75.62 75.7024 14 37.55 4.26 2.01 28.92 43.26 4.9 0.22 88.69 73.9626 14 42.08 3.09 1.41 30.90 49.27 10.20 0.24 94.38 71.6828 14 43.93 2.77 1.56 31.96 51.45 11.30 0.23 95.16 71.4130 14 48.93 2.11 1.96 34.68 57.16 2.25 0.30 81.04 63.6932 14 51.06 1.99 3.71 34.98 57.72 1.61 0.32 76.29 60.8734 14 53.30 1.27 2.80 37.21 61.99 1.49 0.61 76.40 42.7636 14 55.86 0.97 2.15 39.75 66.25 1.46 1.12 77.21 27.8538 14 58.28 0.90 2.75 41.50 68.78 0.86 1.67 67.94 19.6228 10 34.83 5.01 2.41 26.54 38.92 1.75 0.15 85.79 65.9028 12 39.47 3.62 1.90 28.95 45.31 8.10 0.20 94.72 69.3128 14 43.93 2.77 1.56 31.96 51.45 11.30 0.23 95.16 71.4128 16 46.07 2.41 2.52 33.47 53.5 4.29 0.03 87.19 96.1228 18 50.87 1.93 2.24 36.19 59.48 0.7 0.04 48.08 94.48
–3
–2
–1
0
1
2
3
4.5 5 5.5 6 6.5 7 7.5 8 8.5
ln k
pH
α-La
β-Lg
α-La
β-Lg
FIG. 4. Influence of pH on partitioning of α-La and β-Lg at an equilibrationtemperature of 25◦C. ◦ α- La & � β-Lg in 28 (%, w/w) PEG 1000 – 14 (%,w/w) tri sodium citrate system. • α- La & β-Lg in 34 (%, w/w) PEG 1000– 12 (%, w/w) tri sodium citrate system. Horizontal error bars represent fixederror of 0.05 in pH measurements and the vertical error bars represent standarddeviation of the triplicate analysis of partition coefficient values.
Influence of pH on the Partitioning of α-La and β-LgPartitioning of biomolecule is determined by the system
properties as well as the conformation and charge of thebiomolecule present in the system. The ratio of charged speciespresent in the system and also the net charge of the biomoleculeare known to vary with system pH. Desirable pH for the
selective partitioning of α-La in to the top PEG rich phasewas found out by varying the pH of the systems (34(%, w/w)PEG 1000-12% w/w tri-sodium citrate and in 28(%, w/w) PEG1000–14(%, w/w) tri sodium citrate) from 5 to 8. Figure 4shows the gradual increase in the partition coefficient of bothproteins with increase in system pH.
At pH 5, α-La is in a premolten globule state wherein thetryptophan residues are buried inside the hydrophobic core (25).This highly compact structure prevents hydrophobic interactionbetween polymer and protein. Hence, lower partition coeffi-cient was observed for α-La partitioned at lower pH. With theincrease in pH from acidic to basic range, α-La folds back intoits native conformation (tertiary structure). In the native confor-mation, the hydrophobic regions are folded inside and the fourhydrophobic side chains of tryptophan residues expose in thesurface of the protein which readily forms hydrophobic inter-action with PEG. Other than conformation of the biomolecule,the ratio of the charged species in the system also favors thepartitioning of α-La to the top PEG rich phase. The contribu-tion of both electrostatic and non-electrostatic forces for thebiomolecule partitioning can be represented by Altbertsson’sequation (26) (Eq. 11) which relates the net charge of theprotein and the electrostatic potential difference between thephases
ln k = ln k0 + FZ�ψ
RT(11)
Dow
nloa
ded
by [
Nat
iona
l Ins
titut
e of
Tec
h -
Sura
thka
l] a
t 01:
55 2
0 M
ay 2
015

838 K. SIVAKUMAR AND R. IYYASWAMI
where Z is the net charge of the biomolecule; ��, the elec-trostatic potential difference between top and bottom phase ko
is the partition coefficient in the absence of electrostatic poten-tial difference �� = 0 or Z = 0; F, Faraday’s constant; R isthe gas constant and T is the equilibration temperature. Thesystem pH used in these experiments was above the isoelec-tric point of the proteins (α-La–4.7 to 5.1, β-Lg -5.2 to 5.4)(14) and increase in net negative charge of the protein with pHwas verified with the software (H++, www.biophysics.cs.vt.edu) (10). The electrostatic contribution (long range molecu-lar interaction) for biomolecule partitioning is (Z ��) greaterthan zero and increases with increase in pH. Hence, the exper-imental result (Fig. 2) of increase in partition coefficient withpH could be due to the increased long range molecular inter-action between PEG and the more negatively charged α-La.Moreover, α-La is more negatively charged than β-Lg and isreadily attracted by the ether oxygen atoms of PEG (21). Thisnon-covalent attraction between the protein and PEG togetherfavors the partitioning of α-La into the top PEG rich phase athigher pH. A similar trend was reported for α-La and β-Lg par-titioning in PEG 1000–potassium phosphate system (21) andin PVP–potassium phosphate system (27). However, in PEG2000, 4000, and 6000–tri sodium citrate systems (11, 19) andalso in PEG 2000–tri potassium citrate system (20), decreasein the partition coefficient of pure BSA was reported when thesystem pH is above 7.0. With the increase in system pH, topphase concentration of PEG increases and as a consequencehydrophobicity of the PEG rich phase also increases. Hence,the hydrophilic BSA prefers to partition to the bottom salt richphase in systems of pH above 7.0.
Partition coefficient of other whey proteinGlycomacropeptide (GMP) was also reported to increasewith the system pH in PEG 1500 – tri sodium citrate system(6). GMP forms aggregates in the systems of pH above 4.5.This increases the hydrophobicity of GMP and the partitioncoefficient of GMP increases due to the increased hydrophobicinteraction with PEG.
Influence of NaCl as AdditiveAdditives such as salts have different affinity towards the
phases. This differential partitioning of salts alters the parti-tioning of biomolecules added in these systems. Hence, in thepresent study we have added 0.5 to 2(%, w/w) NaCl in 28(%,w/w) PEG 1000–10 /14(%, w/w) tri sodium citrate systems,and the partition coefficient of α-La and β-Lg in those systemswere analyzed. In the presence of additives, biomolecules tendto partition in such a way to restore as to electroneutrality ofthe interface which is disturbed by the differential partitioningof additives. Figure 5 shows the decrease of partition coeffi-cient of both proteins with the increase in NaCl concentration.A similar trend was observed in PEG–salt systems for α-La,β-Lg (10, 21), glycomarcopeptide (6), BSA (20). Sodium ionsare hydrophilic in nature and prefer to partition to the bottomsalt rich phase along with its counter ion (negatively charged
–5
–4
–3
–2
–1
0
1
2
3
0 0.5 1 1.5 2 2.5
ln k
NaCl concentration (%, w/w)
α-La
β-Lg
α-La
β-Lg
FIG. 5. Effect of neutral salt (NaCl) on partitioning of α-La and β-Lg at anequilibration temperature of 25◦C. ◦ α- La & � β-Lg in 28 (%, w/w) PEG1000 – 14 (%, w/w) tri sodium citrate system. • α- La & β-Lg in 28 (%,w/w) PEG 1000 – 10 (%, w/w) tri sodium citrate system. Horizontal error barsrepresent fixed error of 0.05 in the NaCl concentration and the vertical error barsrepresent standard deviation of the triplicate analysis of partition coefficientvalues.
α-La and β-Lg). Binding of ions to the proteins increase theelectrostatic free energy of the protein. Moreover, the electro-static repulsive force prevents aggregation or association of theproteins and weakens the hydrophobic interaction with PEG.This decreased solubility of proteins results in the decrease ofbiomolecule partition coefficient (28). Alcantara et al. (9) opti-mized the concentration of Nacl in PEG–potassium system andachieved the complete removal of β-Lg from the top phase and87.1% yield of α-La in the top phase. These results suggest thatNaCl can be used in the ATPS when there is a need for thecomplete removal of β-Lg and high purity of α-La.
Influence of TemperatureEquilibration temperature alters both composition of the
phases and conformation of the protein which in turn leads tochanging the partitioning of biomolecule between the phases.In the investigated temperature range (15–50◦C), partition coef-ficient of α-La increases linearly with temperature till 40◦Cwhereas β-Lg increases slightly with temperature (Fig. 6).
Above 25◦C, α-La is in the form of native-like molten glob-ule intermediate and above 45◦C it exists as molten globulestate (29). In this molten globule state, α-La is in the formof swollen globular structure due to the binding of 270 watermolecules (30) and also the hydrophobic regions of aminoacids are not regularly packed inside the globular structure. Dueto the lack of proper folding of α-La, (native tertiary struc-ture) hydrophobic side chain of the tryptophan residues arenot exposed in the surface and also the strong hydration ofα-La do not favor hydrophobic interaction between PEG andα-La. Hence, the partition coefficient was observed to decreaseabove 45◦C. Maximum partitioning of α-La to the top phasewas obtained at 40◦C.
Dow
nloa
ded
by [
Nat
iona
l Ins
titut
e of
Tec
h -
Sura
thka
l] a
t 01:
55 2
0 M
ay 2
015

RECOVERY AND PARTIAL PURIFICATION OF BOVINE α-LACTALBUMIN FROM WHEY 839
–4
–3
–2
–1
0
1
2
3
4
10 15 20 25 30 35 40 45 50 55
ln k
Temperature°C
α-La
α-La
β-Lg
β-Lg
FIG. 6. Influence of temperature on partitioning of α-La and β-Lg.• α- La &β-Lg in 28 (%, w/w) PEG 1000 – 14 (%, w/w) tri sodium citrate system.◦ α- La & � β-Lg in 28 (%, w/w) PEG 1000 – 12 (%, w/w) tri sodium citrate
system◦. Horizontal error bars represent fixed error of 0.1 in the equilibrationtemperature and the vertical error bars represent standard deviation of thetriplicate analysis of partition coefficient values.
Studies with WheyTotal protein content of acid whey estimated using Bradford
assay was 5.49 mg/mL. Individual protein quantification wasdone in HPLC and the concentration of α-La, β-Lg, and BSAwas found as 0.78, 2.86, and 0.17 mg/mL, respectively, whichare similar to the results obtained by Almecija et al. (31).Chromatographic separation of whey protein is shown in Fig. 7.
Based on the analysis of individual pure protein studies, 30%(w/w) of whey was loaded into 28(%, w/w) PEG 1000-14(%,w/w) tri sodium citrate ATPS at pH of 8.0 and equilibrated at40◦C. Protein concentration in the phases was analyzed in RP-HPLC (Fig. 8) and the partition coefficient of α-La, β-Lg andBSA was found as 10.09, 0.005, and 0.003, respectively. Yield
FIG. 7. Chromatographic separation of proteins in whey, peak 1-Glycomacropeptide, peak 2 - α-Lactalbumin, peak 3 – BSA, peak 4 &5- β-Lactoglobulin.
FIG. 8. Chromatographic separation of top phase whey sample shows 4 Peaks(1 - GMP, 2 – α-Lactalbumin, 3 & 4 - β-Lactoglobulin B & A respectively)whereas the bottom phase shows only β-Lactoglobulin.
of α-La in the top phase was 94.64%. Bottom phase yield of99.14% β-Lg and 99.46% BSA were obtained. The yield of thedesired proteins obtained in the present study is more than thatreported in the literature (9), where yield of α-La is reportedas 81.1% and the bottom phase yield of β-Lg is 97.3% in PEG2000–potassium phosphate system.
Selectivity (kα-La/kβ-Lg) of the present ATPS (PEG1000–tri sodium citrate) is 2018, which is much higher than thatreported for PEG 15000–potassium phosphate system 318 (17).α-La was partitioned to the top phase with a purification foldof 4.99 and a recovery of 81.54%. Along with α-La, GMPwas also partitioned to the top PEG rich phase which wasunderstood form the HPLC analysis of top phase sample the(peak 1 of Fig. 8). Silva et al. (6) also reported the parti-tioning of pure GMP in to the top phase of PEG 1500–trisodium citrate system. The purity of α-La partitioned to the topphase is affected by the partitioning of other impurities such asGlycomacropeptide (GMP) and traces of other whey proteins tothe top phase. Pure α-La could be recovered from the top PEGrich phase by the use of downstream processes such as sizeexclusion chromatography/membrane separation technologythat exploits the size of the biomolecule for purification.
CONCLUSIONSFavorable conditions for the selective partitioning of α-La
into the top PEG rich phase were identified as 28(%, w/w)PEG 1000–14(%, w/w) tri sodium citrate system at pH 8 andequilibration temperature of 40◦C. Polymer concentration andconformation of α-La has a significant effect on the partitioningof α-La, since partitioning is determined by the hydrophobicinteraction between the surface exposed hydrophobic side chainof the aminoacid, tryptophan, and PEG. α-La was extractedinto the top phase with 81.54% recovery and 94.64% yield.99.14% of β-Lg and 99.46% yield of BSA in the salt richbottom phase show the partition of most of the contami-nants to the bottom salt rich phase. The results on the whole
Dow
nloa
ded
by [
Nat
iona
l Ins
titut
e of
Tec
h -
Sura
thka
l] a
t 01:
55 2
0 M
ay 2
015
840 K. SIVAKUMAR AND R. IYYASWAMI
demonstrate the potentiality of the chosen well defined singlePEG 1000–trisodium citrate ATP system for the extraction ofα-Lactalbumin from whey.
FUNDINGThe authors acknowledge the grant (Scheme number:
BT/PR11935/PID/06/456/2009 & October 31, 2011) fromthe Department of Biotechnology (DBT), Government of India,for this research work.
REFERENCES1. Heine, W. E.; Klein, P. D.; Reeds, P. J. (1991) The importance ofα-Lactalbumin in infant nutrition. J. Nutr., 121: 277–283.
2. Markus, C. R.; Olivier, B.; Haan, E. H. F. (2002) Whey protein rich inα-lactalbumin increases the ratio of plasma tryptophan to the sum of theother large neutral amino acids and improves cognitive performance instress-vulnerable subjects. Am. J. Clin. Nutr., 75: 1051–1056.
3. Bhattacharjee, S.; Bhattacharjee, C.; Datta, S. (2006) Studies on thefractionation of β-lactoglobulin from casein whey using ultrafiltrationand ion-exchange membrane chromatography. J. Membrane Sci., 275:141–150.
4. Velusamy, V.; Palaniappan, L. (2011) Compositional analysis α-Lactalbumin. Am. J. Biochem. Mol. Biol., 1: 106–120.
5. Mehravar, R.; Jahanshahi, M.; Saghatoleslami, N. (2009) Production ofbiological nano particles from α-lactalbumin for drug delivery and foodscience application. Afr. J. Biotechnol. 8: 6822–6827.
6. Silva, C. A. S.; Coimbra, J. S. R.; Rojas, E. E. G.; Teixeira, J. A. C. (2009)Partitioning of glycomacropeptide in aqueous two-phase systems. ProcessBiochem., 44: 1213–1216.
7. Alomirah, H. F.; Alli, I. (2004) Separation and characterization of β-lactoglobulin and α-lactalbumin from whey and whey protein prepara-tions. Int. Dairy J., 14: 411–419.
8. Yan-Min, L.; Yan-Zhao, Y.; Yan-Min, L.; Xi-Dan, Z.; Chuan-Bo,X. (2010) Bovine serum albumin partitioning in polyethylene glycol(PEG)/potassium citrate aqueous two-phase systems. Food Bioprod.Process, 88: 40–46.
9. Alcantara, L. A. P.; Minim, L. A.; Minim, V. P. R.; Bonomo, R. C. F.;Silva, L. H. M.; Silva, M. C. H. (2011) Application of the responsesurface methodology for optimization of whey protein partitioning inPEG/phosphate aqueous two-phase system. J. Chromatogr. B, 879:1881–1885.
10. Kalaivani, S.; Regupathi, I. (2013) Partitioning studies of α-lactalbuminin environmental friendly poly (ethylene glycol) – citrate salt aqueous twophase systems. Bioproc. Biosyst. Eng., 36: 1475–1483.
11. Murugesan, T.; Perumalsamy, M. (2007) Partition behavior of bovineserum albumin in PEG2000-sodium citrate-water based aqueous two-phase system. Separ. Sci. Techol., 42: 2049–2065.
12. Silva, C. A. S.; Coimbra, J. S. R.; Rojas, E. E. G.; Minim, L. A.; Silva, L.H. M. (2007) Partitioning of caseniomacropeptide in aqueous-two phasesytems. J. Chromatogr. B, 858: 205–210.
13. Bogalio, A.; Bassani, G.; Pico, G.; Nerli, B. (2006) Features of the milkwhey protein partitioning in polyethylene glycol-sodium citrate aqueoustwo-phase systems with the goal of isolating human alpha-1 antitrypsinexpressed in bovine milk. J. Chromatogr. B, 837: 18–23.
14. Capezio, L.; Romanini, D.; Pico, G. A.; Nerli, B. (2005) Partition ofwhey milk proteins in aqueous two-phase systems of polyethylene glycol-phosphate as a starting point to isolate proteins expressed in transgenicmilk. J. Chromatogr. B, 819: 25–31.
15. Elgar, D. F.; Norris, C. S.; Ayers, J. S.; Pritchard, M.; Otter, D.E.; Palmano, K. P. (2000) Simultaneous separation and quantita-tion of the major bovine whey proteins including proteose peptoneand caseinomacropeptide by reversed-phase high-performance liquidchromatography on polystyrene–divinylbenzene. J. Chromatogr. A, 878:183–196.
16. Cheluget, E. L.; Gelines, S.; Vera, J. H.; Weber, M. E. (1994) Liquid-liquidequilibrium of aqueous mixtures of poly(propylene glycol) with NaCl. J.Chem. Eng. Data, 39: 127–130.
17. Alves, J. G. L. F.; Chumpitaz, L. D. A.; Silva, L. H. M.; Franco,T. T.; Meirelles, A. J. J. (2000) Partitioning of whey proteins, bovineserum albumin and porcine insulin in aqueous two-phase systems. J.Chromatogr. B, 743: 235–239.
18. Priyanka, B. S.; Rastogi, N. K.; Raghavarao, K. S. M. S.; Thakur, M. S.(2013) Optimization of extraction of luciferase from fireflies (Photinuspyralis) using aqueous two-phase extraction. Sep. purify. Technol., 118:40–48.
19. Perumalsamy, M.; Batcha, M. I. (2011) Synergistic extraction of bovineserum albumin using poly ethylene glycol based aqueous biphasic system.Process Biochem., 46; 494–497.
20. Sindhu, N.; Kalaivani, S.; Regupathi, I. (2013) Optimization of condi-tions for bovine serum albumin partitioning in aqueous two-phase systemsusing Response Surface Methodology (RSM). Bioprocess J., 12: 29–41.
21. Chen, J. (1992) Partitioning and separation of α-lactalbumin and β-lactoglobulin in PEG/potassium phosphate aqueous two-phase systems.J. Ferment. Bioeng., 73: 140–147.
22. Rodrigues, A. L. R.; Venancio, A.; Teixeira, J. A. (2001) Partitioningand separation of α-Lactalbumin and β-Lactoglobulin in Polyethyleneglycol/ammonium sulphate aqueous two-phase systems. Biotechnol. Lett.23: 1893– 1897.
23. Diamond, A. D.; Hsu, J. T. (1992) Aqueous two phase systems forbiomolecule separation. Adv. Biochem. Eng. Biotechnol., 47: 89–135.
24. Mirsiaghi, M.; Pazuki, G.; Vossoughi, M.; Alemzadeh, I. (2010)Partitioning of L-lysine monohydrochloride in aqueous two-phase sys-tems of Poly(ethylene glycol) and dipotassium hydrogen phosphate ortrisodium citrate 5-hydrate. J. Chem. Eng. Data, 55: 3005–3009.
25. Lala, A. K.; Kaul, P. (1992) Increased exposure of hydrophobic surface inmolten globule state of alpha-lactalbumin Fluorescence and hydrophobicphotolabeling studies. J. Biol. Chem., 267: 19914–19918.
26. Albertsson, P. A. (1986) Partition of Cell Particles and Macromolecules;Wiley: New York.
27. Mokhtarani, B.; Mortaheb, H. R.; Ma, M.; Amini, M. H. (2011)Partitioning of α-lactalbumin and β-lactoglobulinin aqueous two-phasesystems of polyvinylpyrrolidone and potassium phosphate. J. Chromatogr.B, 879: 721–726.
28. Zaslavsky, B. Y. (1995) Aqueous-Two Phase Partitioning; Marcel Dekker:New York.
29. Permyakov, E. A.; Berliner, L. J. (2000) α-Lactalbumin: Structure andfunction. FEBS Letters, 473: 269–274.
30. Permyakov, E. A. (2005) α-lactalbumin; Nova Science Publishers: NewYork.
31. Almecija, C. M.; Ibanez, R.; Guadix, A.; Guadix, E. M. (2007) Effectof pH on the fractionation of whey proteins with a ceramic ultrafiltrationmembrane. J. Membrane Sci., 288: 28–35.
Dow
nloa
ded
by [
Nat
iona
l Ins
titut
e of
Tec
h -
Sura
thka
l] a
t 01:
55 2
0 M
ay 2
015
Related Documents