Reconviction patterns of released prisoners: A 60-months follow-up analysis March 2009 Arul Nadesu Principal Strategic Adviser Policy, Strategy and Research Department of Corrections

Welcome message from author
This document is posted to help you gain knowledge. Please leave a comment to let me know what you think about it! Share it to your friends and learn new things together.
Transcript
Reconviction patterns of released prisoners: A 60-months follow-up analysis March 2009 Arul Nadesu Principal Strategic Adviser Policy, Strategy and Research Department of Corrections

2

3
Foreword I am pleased to introduce this report as it provides a wealth of information on re-offending patterns amongst released prisoners. The statistical information in this report is based on a cohort of offenders released from prison sentences in New Zealand over a 12 months period in 2002-2003. While there is no reason to believe that overall rates of re-imprisonment in New Zealand are worse than those of other countries, from my perspective these rates are too high, and need to come down. The report highlights important differences in the re-offending risk of different sub-types of offenders. The relatively high rates of re-imprisonment for Māori and for young offenders are particularly concerning. The report points to potentially fruitful areas of research to better understand why the identified trends occur, and what might be done to address risk factors which affect certain sub-groups. I am confident that this report, and others in the same series, will be a valuable reference tool for those with an interest in correctional trends and issues, and will promote informed discussion about our correctional system. I welcome any feedback or comments you might have regarding this report. Barry Matthews Chief Executive
4
Introduction Reducing re-offending is an important objective for most correctional services. As such, measures of recidivism, particularly reconviction and re-imprisonment rates, are key indicators of organisational performance. The current study is intended to assist the Department of Corrections in meeting its strategic objectives. In addition to providing straightforward data on recidivism, it is hoped also that the study will be a valuable reference tool for those interested in correctional trends and issues, and will inform discussions on improving New Zealand’s correctional system. The data presented here are based on the “recidivism index” (RI) methodology used in the Department of Corrections’ annual reporting of reconviction. This method quantifies the rate of reconviction and re-imprisonment for specified sub-groups of offenders, over follow-up periods of defined length, after release from a custodial sentence, or following commencement of a community sentence or order. Conviction and sentencing data is obtained from the Ministry of Justice’s Case Management System (CMS) database. This report summarises patterns of reconviction and re-imprisonment amongst almost 5000 offenders who were released from prison during the 12 months period 1 April 2002 to 31 March 2003. The same cohort of offenders was the subject of previous reports in this series, which provided reconviction and re-imprisonment rates within 36-months and 48-months follow-up periods1. The current report provides similar data, but now with a 60-months follow-up period: that is, figures represent reconvictions for offences that occurred within 60 months of each individual offender’s release date (up to 31 March 2008)2. Recidivism figures are produced for two potential outcomes: reconvictions leading to any sentence administered by the Department of Corrections (community-based or prison), and reconviction leading solely to a term of imprisonment. Imprisonment figures are generally considered the more critical of the two measures, as this outcome is associated with more serious offences and higher costs of sentence administration. Recidivism figures exclude reconvictions which do not result in sentences administered by the Department (fines, convicted and discharged, etc). These figures also exclude re-sentences for breaches of community sentences or recalls to prison for breaches of parole conditions. In summary all reconvictions data presented here should be interpreted as restricted to convictions for a new offence resulting in imprisonment or a community-based sentence. It is also important to note that most of the figures here represent any reconviction or re-imprisonment during the 60-months follow-up period: some of the individuals re-imprisoned may have had multiple, successive terms of imprisonment during that period. However, in places the report also provides information on multiple re-imprisonments of categories of offenders during the 60-months follow-up period.
1 “Reconviction Patterns of Released Prisoners” (A 36-months and A 48-months Follow-up Analysis), available at http://www.corrections.govt.nz/public/research/reimprisonment-report/. 2 The data set also included reconvictions on dates up to November 2008 when the offence date was prior to 31 March 2008.
5
Many offenders are sentenced to a prison term for more than one offence. Therefore, when offenders are grouped by offence type, the convention is to identify the most serious offence type3 (MSO) for which they were imprisoned for their original sentence. However, another way of identifying the offence type is according to an individual offender’s ‘lead offence’. This refers to the offence which incurred the greatest number of days of imprisonment as ordered by the judge for that particular offender. It should be noted that in most cases the lead offence and MSO are one and the same; however, those scenarios where the two do not coincide are of interest, and a comparison of the two measures’ utility is explored in this report. Grouping by the lead offence rather than the MSO is used in only one section of the study. The average number of days it takes for an offender to commit their first proved re-offence is examined by offence type. This calculation is based on about 2600 prisoners, who were convicted of a new offence and were returned to prison during the 60-months follow-up period. Although many offenders had multiple offences during the 60-month follow-up period, the first proved re-offence is considered for this study. A subsequent report in the series is planned (expected early in 2010) to give comparative figures for a five-year follow-up from a different cohort of offenders, those released from prison during the 12 months period 1 April 2003 to 31 March 2004. The study of two cohorts of offenders released from prisons in successive years will indicate possible trends in base rates of offending. The study will also examine some other factors such as offenders’ education, family relationship and association with gangs and whether these factors are significantly related to reconviction and re-imprisonment rates. Countries differ markedly in how criminal justice data are handled: reconviction and re-imprisonment rates are influenced by legislation, sentencing practices, resource levels of criminal justice sector agencies, as well as volumes of crimes committed and rates of detection and resolution. Consequently, comparisons of reconviction or re-imprisonment rates between countries are usually a fraught exercise. Nevertheless, the study provides a benchmark for five-year recidivism rates for offenders released from New Zealand prisons.
3 MSO rankings are determined from the Ministry of Justice Seriousness of Offence Scale, which orders offences in accordance with the average number of days imprisonment ordered by judges, for that specific offence type, over the past five years.
6
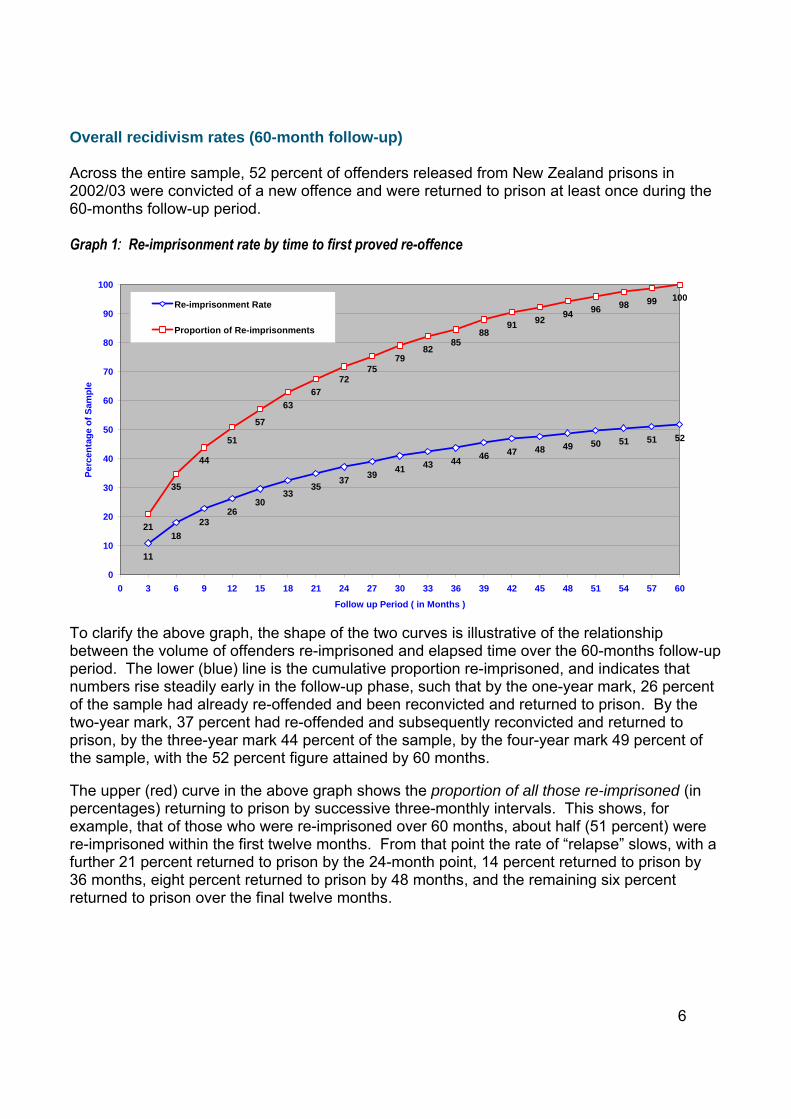
Overall recidivism rates (60-month follow-up) Across the entire sample, 52 percent of offenders released from New Zealand prisons in 2002/03 were convicted of a new offence and were returned to prison at least once during the 60-months follow-up period. Graph 1: Re-imprisonment rate by time to first proved re-offence
11
18
2326
3033
3537
3941 43 44
46 47 48 49 50 51 51 52
21
35
44
51
57
63
6772
7579
8285
8891 92
94 96 98 99 100
0
10
20
30
40
50
60
70
80
90
100
0 3 6 9 12 15 18 21 24 27 30 33 36 39 42 45 48 51 54 57 60
Follow up Period ( in Months )
Per
cen
tag
e o
f S
amp
le
Re-imprisonment Rate
Proportion of Re-imprisonments
To clarify the above graph, the shape of the two curves is illustrative of the relationship between the volume of offenders re-imprisoned and elapsed time over the 60-months follow-up period. The lower (blue) line is the cumulative proportion re-imprisoned, and indicates that numbers rise steadily early in the follow-up phase, such that by the one-year mark, 26 percent of the sample had already re-offended and been reconvicted and returned to prison. By the two-year mark, 37 percent had re-offended and subsequently reconvicted and returned to prison, by the three-year mark 44 percent of the sample, by the four-year mark 49 percent of the sample, with the 52 percent figure attained by 60 months. The upper (red) curve in the above graph shows the proportion of all those re-imprisoned (in percentages) returning to prison by successive three-monthly intervals. This shows, for example, that of those who were re-imprisoned over 60 months, about half (51 percent) were re-imprisoned within the first twelve months. From that point the rate of “relapse” slows, with a further 21 percent returned to prison by the 24-month point, 14 percent returned to prison by 36 months, eight percent returned to prison by 48 months, and the remaining six percent returned to prison over the final twelve months.
7
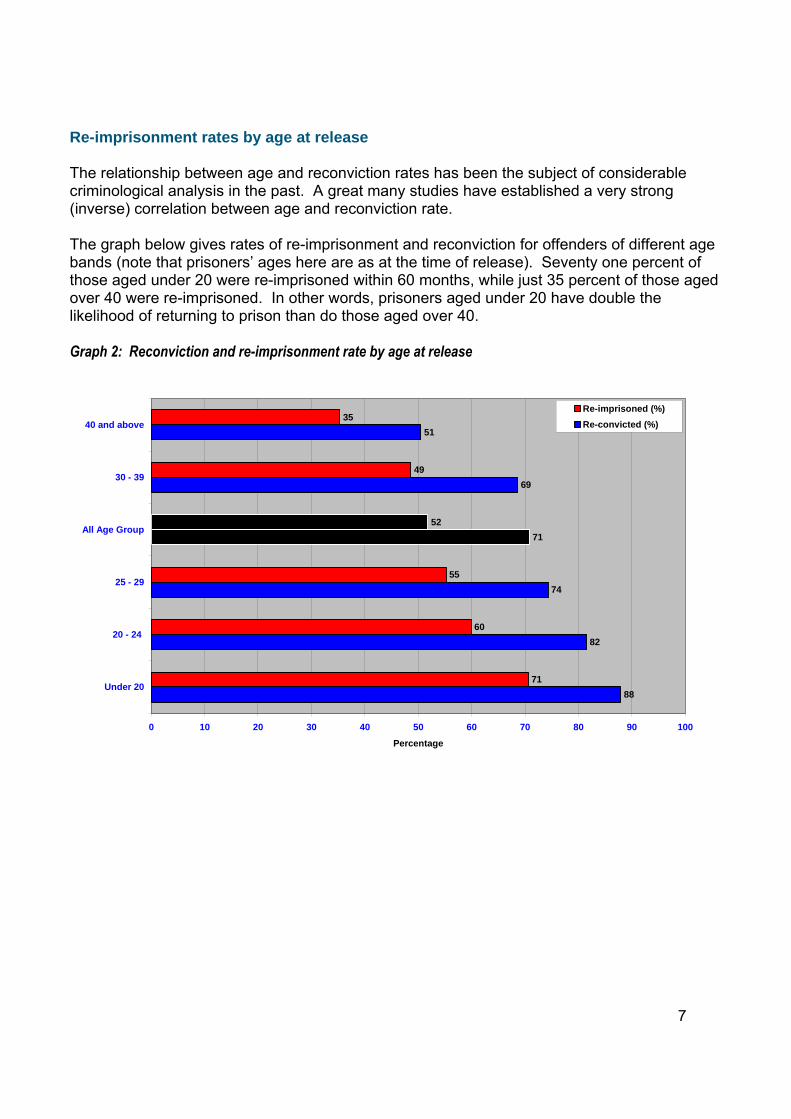
Re-imprisonment rates by age at release The relationship between age and reconviction rates has been the subject of considerable criminological analysis in the past. A great many studies have established a very strong (inverse) correlation between age and reconviction rate. The graph below gives rates of re-imprisonment and reconviction for offenders of different age bands (note that prisoners’ ages here are as at the time of release). Seventy one percent of those aged under 20 were re-imprisoned within 60 months, while just 35 percent of those aged over 40 were re-imprisoned. In other words, prisoners aged under 20 have double the likelihood of returning to prison than do those aged over 40. Graph 2: Reconviction and re-imprisonment rate by age at release
88
82
74
71
69
51
71
60
55
52
49
35
0 10 20 30 40 50 60 70 80 90 100
Under 20
20 - 24
25 - 29
All Age Group
30 - 39
40 and above
Percentage
Re-imprisoned (%)
Re-convicted (%)
8
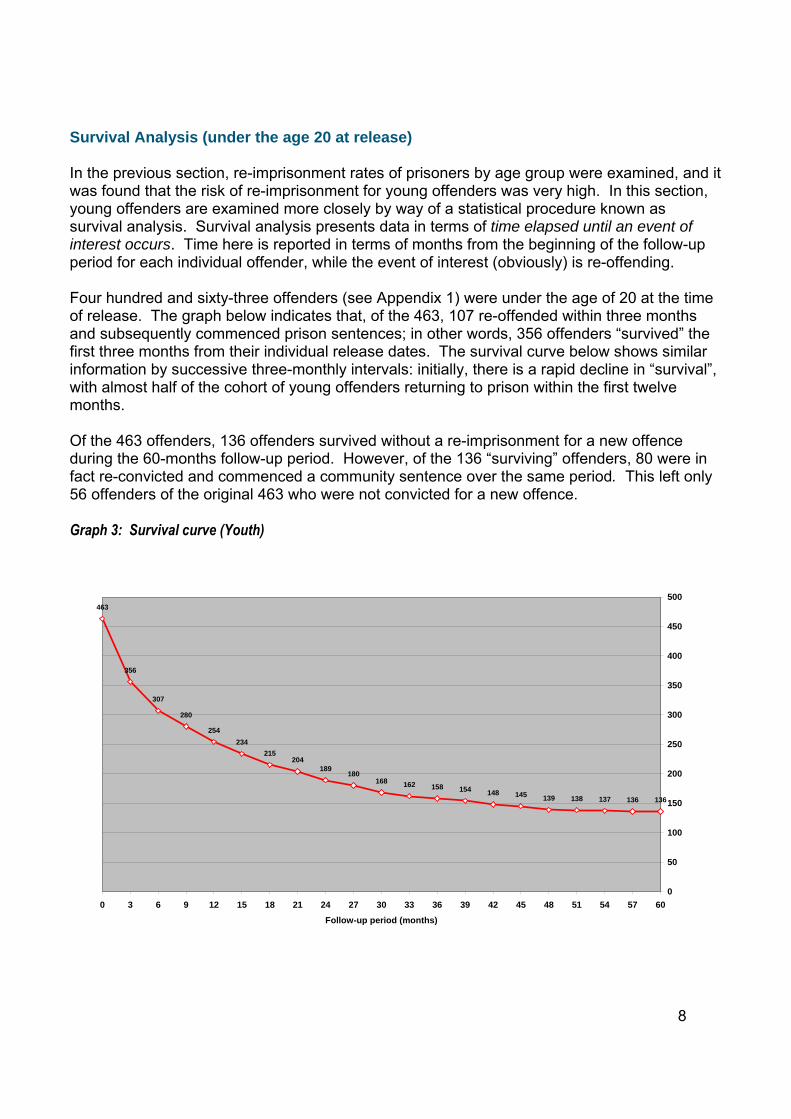
Survival Analysis (under the age 20 at release) In the previous section, re-imprisonment rates of prisoners by age group were examined, and it was found that the risk of re-imprisonment for young offenders was very high. In this section, young offenders are examined more closely by way of a statistical procedure known as survival analysis. Survival analysis presents data in terms of time elapsed until an event of interest occurs. Time here is reported in terms of months from the beginning of the follow-up period for each individual offender, while the event of interest (obviously) is re-offending. Four hundred and sixty-three offenders (see Appendix 1) were under the age of 20 at the time of release. The graph below indicates that, of the 463, 107 re-offended within three months and subsequently commenced prison sentences; in other words, 356 offenders “survived” the first three months from their individual release dates. The survival curve below shows similar information by successive three-monthly intervals: initially, there is a rapid decline in “survival”, with almost half of the cohort of young offenders returning to prison within the first twelve months. Of the 463 offenders, 136 offenders survived without a re-imprisonment for a new offence during the 60-months follow-up period. However, of the 136 “surviving” offenders, 80 were in fact re-convicted and commenced a community sentence over the same period. This left only 56 offenders of the original 463 who were not convicted for a new offence. Graph 3: Survival curve (Youth)
463
356
307
280
254
234
215204
189180
168 162 158 154 148 145 139 138 137 136 136
0
50
100
150
200
250
300
350
400
450
500
0 3 6 9 12 15 18 21 24 27 30 33 36 39 42 45 48 51 54 57 60
Follow-up period (months)
9
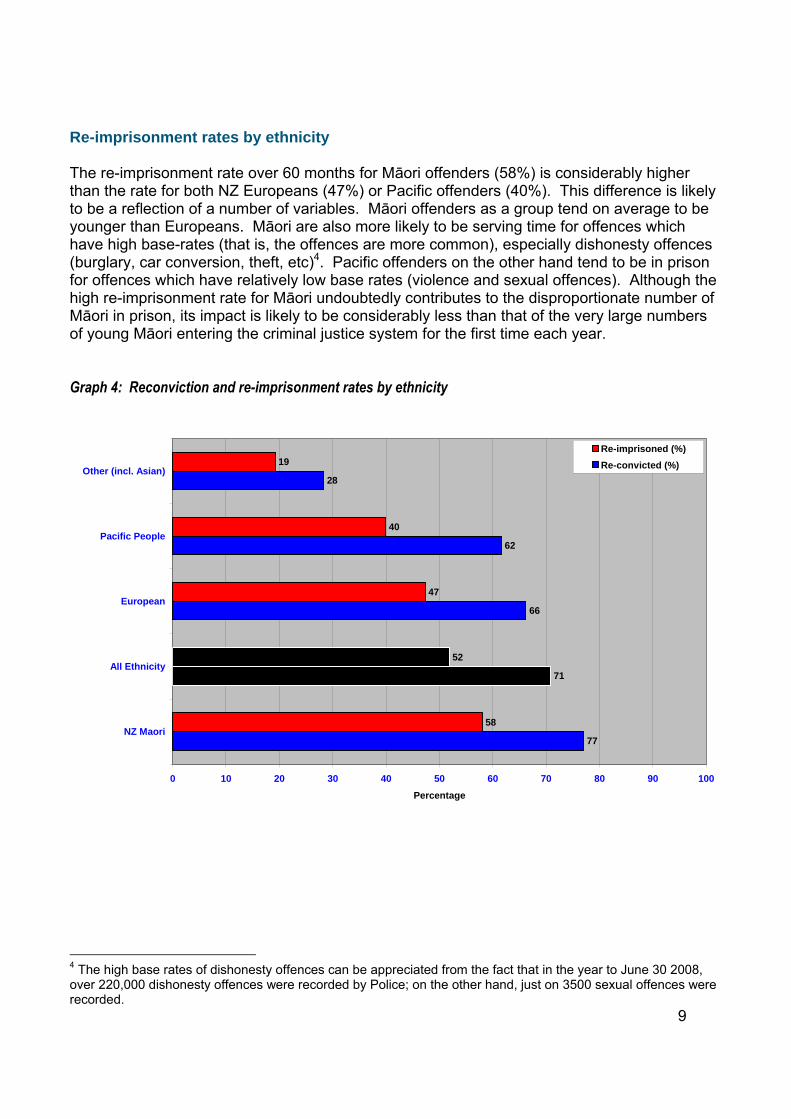
Re-imprisonment rates by ethnicity The re-imprisonment rate over 60 months for Māori offenders (58%) is considerably higher than the rate for both NZ Europeans (47%) or Pacific offenders (40%). This difference is likely to be a reflection of a number of variables. Māori offenders as a group tend on average to be younger than Europeans. Māori are also more likely to be serving time for offences which have high base-rates (that is, the offences are more common), especially dishonesty offences (burglary, car conversion, theft, etc)4. Pacific offenders on the other hand tend to be in prison for offences which have relatively low base rates (violence and sexual offences). Although the high re-imprisonment rate for Māori undoubtedly contributes to the disproportionate number of Māori in prison, its impact is likely to be considerably less than that of the very large numbers of young Māori entering the criminal justice system for the first time each year. Graph 4: Reconviction and re-imprisonment rates by ethnicity
77
71
66
62
28
58
52
47
40
19
0 10 20 30 40 50 60 70 80 90 100
NZ Maori
All Ethnicity
European
Pacific People
Other (incl. Asian)
Percentage
Re-imprisoned (%)
Re-convicted (%)
4 The high base rates of dishonesty offences can be appreciated from the fact that in the year to June 30 2008, over 220,000 dishonesty offences were recorded by Police; on the other hand, just on 3500 sexual offences were recorded.
10
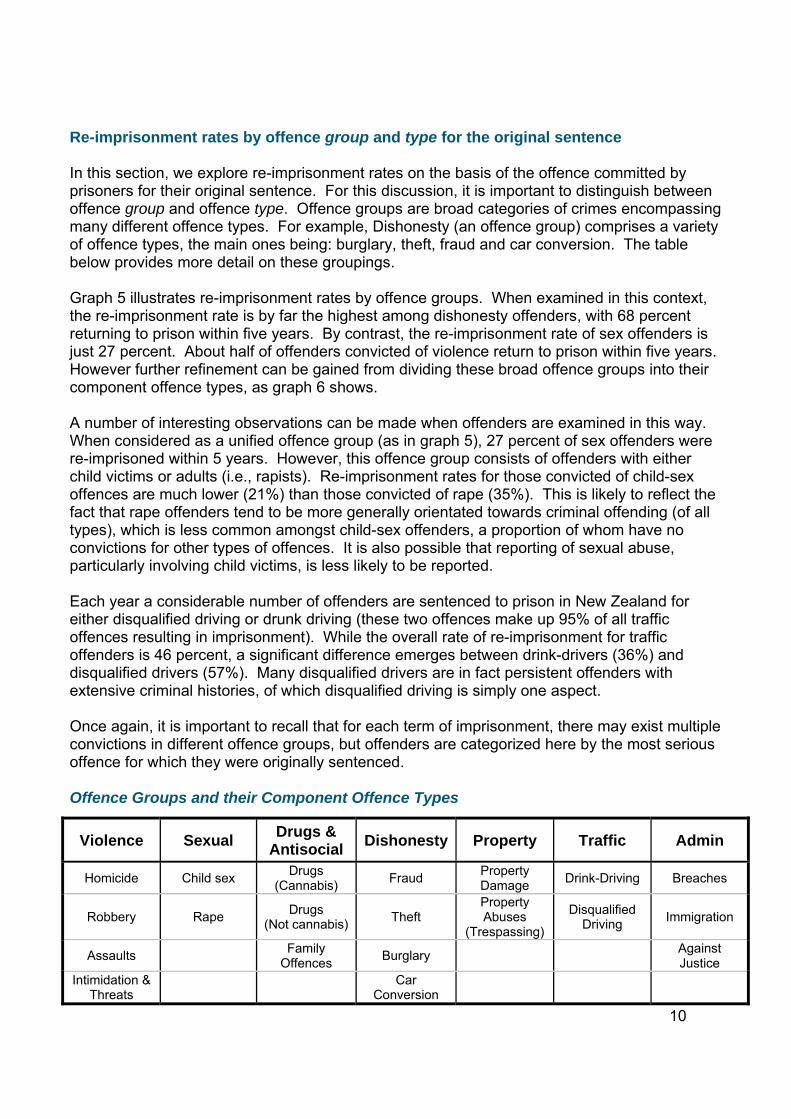
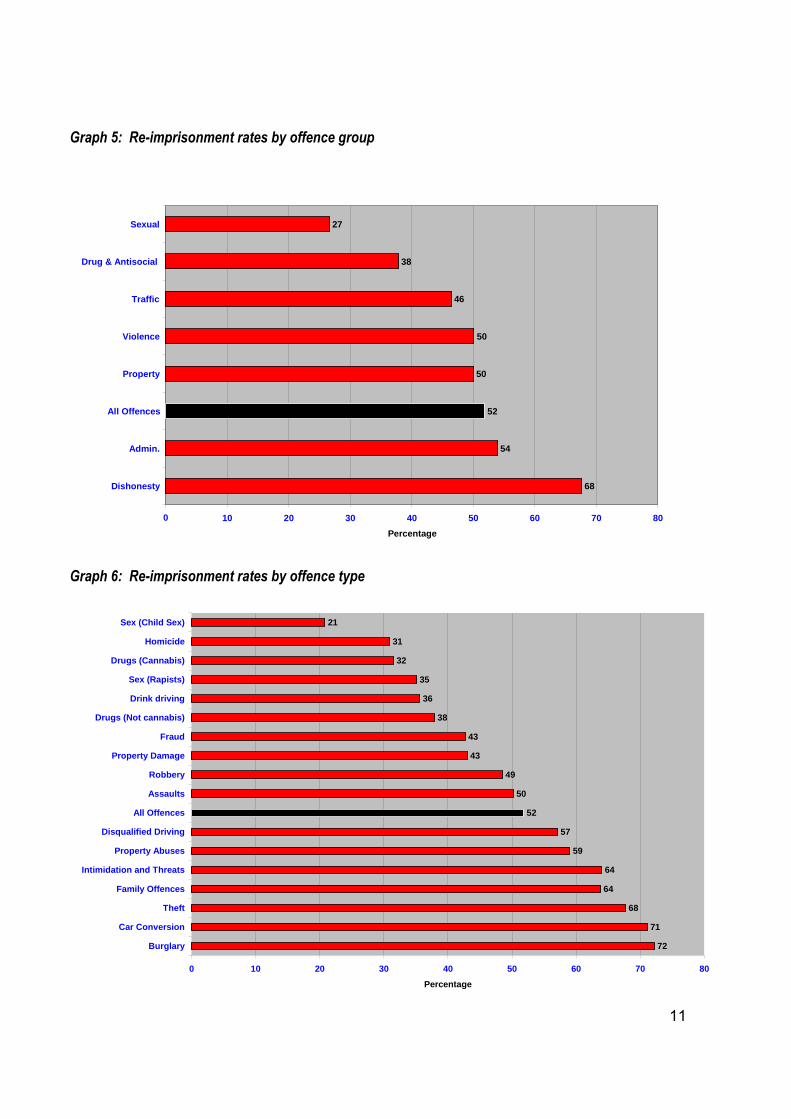
Re-imprisonment rates by offence group and type for the original sentence In this section, we explore re-imprisonment rates on the basis of the offence committed by prisoners for their original sentence. For this discussion, it is important to distinguish between offence group and offence type. Offence groups are broad categories of crimes encompassing many different offence types. For example, Dishonesty (an offence group) comprises a variety of offence types, the main ones being: burglary, theft, fraud and car conversion. The table below provides more detail on these groupings. Graph 5 illustrates re-imprisonment rates by offence groups. When examined in this context, the re-imprisonment rate is by far the highest among dishonesty offenders, with 68 percent returning to prison within five years. By contrast, the re-imprisonment rate of sex offenders is just 27 percent. About half of offenders convicted of violence return to prison within five years. However further refinement can be gained from dividing these broad offence groups into their component offence types, as graph 6 shows. A number of interesting observations can be made when offenders are examined in this way. When considered as a unified offence group (as in graph 5), 27 percent of sex offenders were re-imprisoned within 5 years. However, this offence group consists of offenders with either child victims or adults (i.e., rapists). Re-imprisonment rates for those convicted of child-sex offences are much lower (21%) than those convicted of rape (35%). This is likely to reflect the fact that rape offenders tend to be more generally orientated towards criminal offending (of all types), which is less common amongst child-sex offenders, a proportion of whom have no convictions for other types of offences. It is also possible that reporting of sexual abuse, particularly involving child victims, is less likely to be reported. Each year a considerable number of offenders are sentenced to prison in New Zealand for either disqualified driving or drunk driving (these two offences make up 95% of all traffic offences resulting in imprisonment). While the overall rate of re-imprisonment for traffic offenders is 46 percent, a significant difference emerges between drink-drivers (36%) and disqualified drivers (57%). Many disqualified drivers are in fact persistent offenders with extensive criminal histories, of which disqualified driving is simply one aspect. Once again, it is important to recall that for each term of imprisonment, there may exist multiple convictions in different offence groups, but offenders are categorized here by the most serious offence for which they were originally sentenced. Offence Groups and their Component Offence Types
Violence Sexual Drugs &
Antisocial Dishonesty Property Traffic Admin
Homicide Child sex Drugs
(Cannabis) Fraud
Property Damage
Drink-Driving Breaches
Robbery Rape Drugs
(Not cannabis)Theft
Property Abuses
(Trespassing)
Disqualified Driving
Immigration
Assaults Family
Offences Burglary
Against Justice
Intimidation & Threats
Car
Conversion
11
Graph 5: Re-imprisonment rates by offence group
Graph 6: Re-imprisonment rates by offence type
72
71
68
64
64
59
57
52
50
49
43
43
38
36
35
32
31
21
0 10 20 30 40 50 60 70 80
Burglary
Car Conversion
Theft
Family Offences
Intimidation and Threats
Property Abuses
Disqualified Driving
All Offences
Assaults
Robbery
Property Damage
Fraud
Drugs (Not cannabis)
Drink driving
Sex (Rapists)
Drugs (Cannabis)
Homicide
Sex (Child Sex)
Percentage
68
54
52
50
50
46
38
27
0 10 20 30 40 50 60 70 80
Dishonesty
Admin.
All Offences
Property
Violence
Traffic
Drug & Antisocial
Sexual
Percentage
12
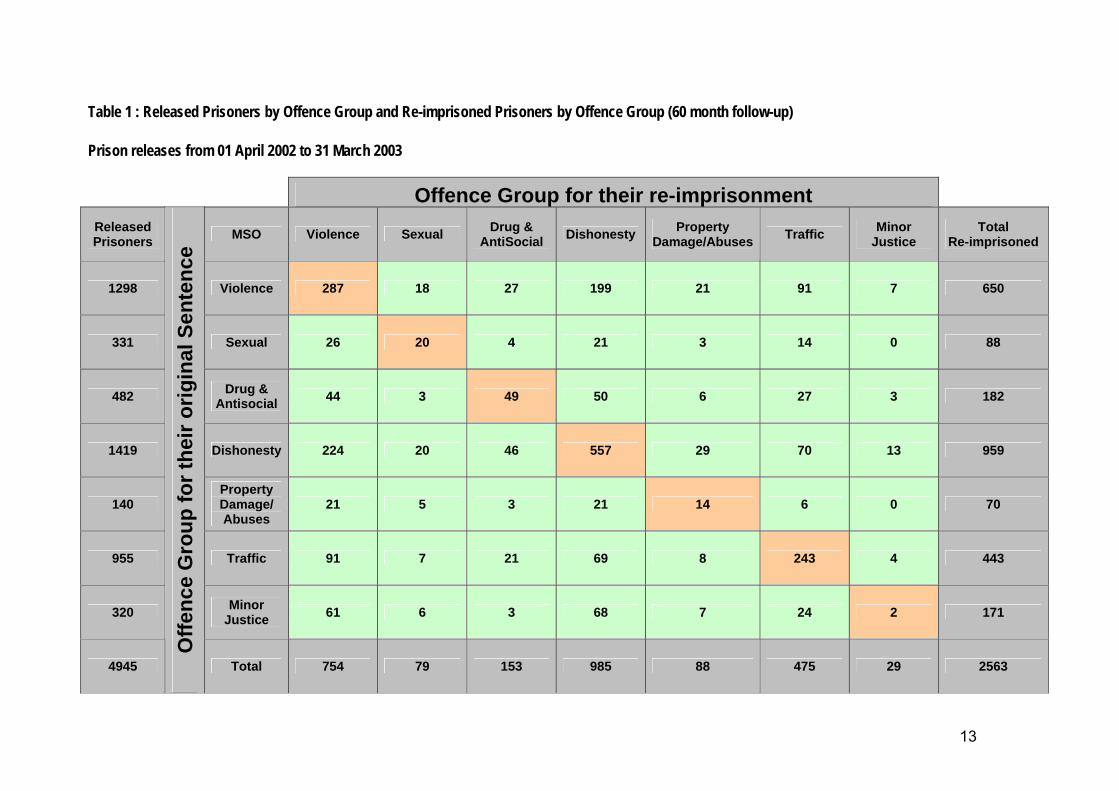
Correlations between original offence group and re-offence group As discussed above, some offenders are repeatedly imprisoned for the same offences, while many others are re-imprisoned for dissimilar offences. The table on the next page represents the degree of correlation between original offence group and re-offence group. Persistence of the same offence group is highest among those imprisoned for violence, dishonesty, and traffic convictions. Once again, remember that offenders are categorised by their most serious offence, and may have been imprisoned on several convictions. Of the 1,298 offenders originally imprisoned for violence, 650 were re-imprisoned for any
other conviction within 60 months; 287 (44%) of those 650 were re-imprisoned for another violent offence, which is the most serious offence of all convictions. In general, many offenders are sentenced to a prison term for more than one offence: by considering all the offences resulting in re-imprisonment, in fact 64 percent of violent offenders were re-imprisoned with at least one new violent conviction.
Of the 1,419 offenders originally imprisoned for dishonesty offences, 959 were
re-imprisoned for any other conviction within 60 months; 557 (58%) of those 959 were re-imprisoned for another dishonesty offence, which is the most serious offence of all convictions. By considering all the offences resulting in re-imprisonment, in fact 81 percent of dishonesty offenders were re-imprisoned with at least one new dishonesty conviction.
Of the 955 offenders originally imprisoned for traffic offences, 443 were re-imprisoned for
any other conviction within 60 months; 243 (55%) of those 443 were re-imprisoned for another traffic offence, which is the most serious offence of all convictions. By considering all the offences resulting in re-imprisonment, in fact 76 percent of traffic offenders were re-imprisoned with at least one new traffic conviction.
What will be apparent from inspection of the following table is the high level of “versatility” which characterises the general offender population. In the main, individuals who repeatedly offend tend to express their criminality across the range of offence types. For example, the subsequent offence of a person previously convicted of a sex offence is more likely to be a violent offence than it is sexual; the next conviction of someone previously convicted for drug offending is just as likely to be for dishonesty. For further analysis of recidivism within the same offence type, please consult last year’s publication from this series, entitled “Reconviction patterns of released prisoners: a 48-months follow-up analysis,” which is available at http://www.corrections.govt.nz/public/research/reimprisonment-report/.
13
Table 1 : Released Prisoners by Offence Group and Re-imprisoned Prisoners by Offence Group (60 month follow-up)
Prison releases from 01 April 2002 to 31 March 2003
Offence Group for their re-imprisonment
Released Prisoners
MSO Violence Sexual Drug &
AntiSocial Dishonesty
Property Damage/Abuses
Traffic Minor
Justice Total
Re-imprisoned
1298 Violence 287 18 27 199 21 91 7 650
331 Sexual 26 20 4 21 3 14 0 88
482 Drug &
Antisocial 44 3 49 50 6 27 3 182
1419 Dishonesty 224 20 46 557 29 70 13 959
140 Property Damage/ Abuses
21 5 3 21 14 6 0 70
955 Traffic 91 7 21 69 8 243 4 443
320 Minor
Justice 61 6 3 68 7 24 2 171
4945
Off
ence
Gro
up
fo
r th
eir
ori
gin
al S
ente
nce
Total 754 79 153 985 88 475 29 2563
14
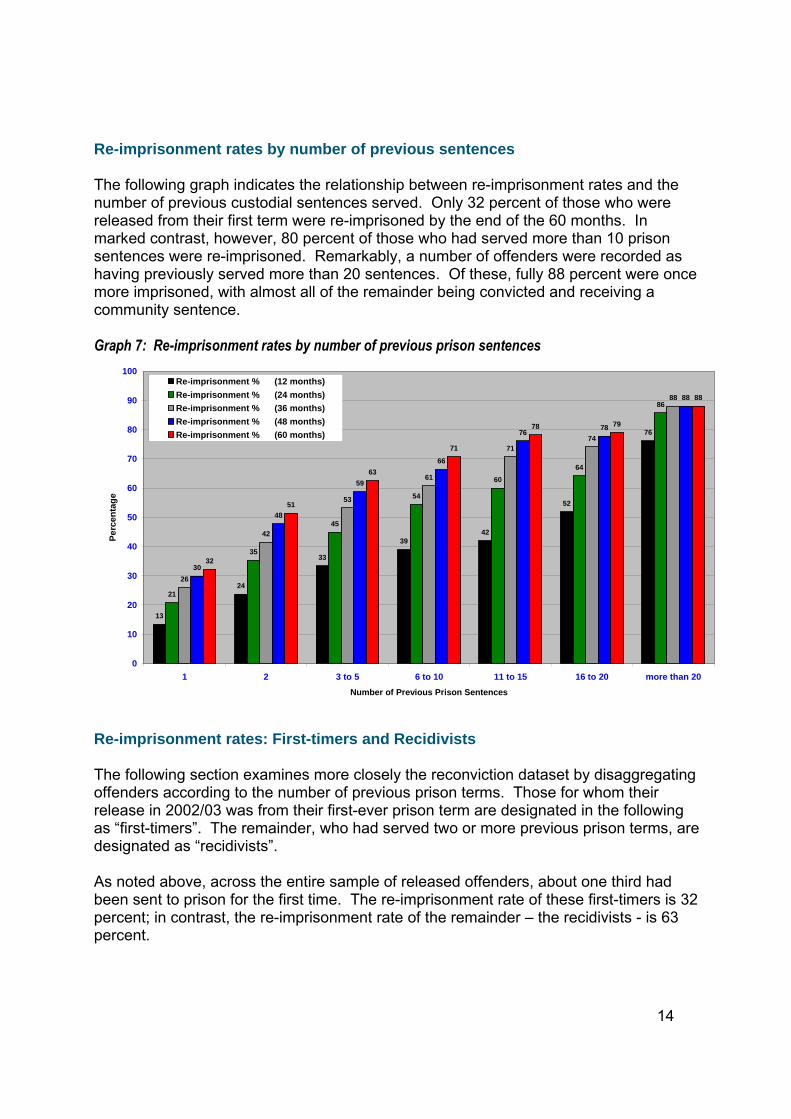
Re-imprisonment rates by number of previous sentences The following graph indicates the relationship between re-imprisonment rates and the number of previous custodial sentences served. Only 32 percent of those who were released from their first term were re-imprisoned by the end of the 60 months. In marked contrast, however, 80 percent of those who had served more than 10 prison sentences were re-imprisoned. Remarkably, a number of offenders were recorded as having previously served more than 20 sentences. Of these, fully 88 percent were once more imprisoned, with almost all of the remainder being convicted and receiving a community sentence. Graph 7: Re-imprisonment rates by number of previous prison sentences
13
24
33
3942
52
76
21
35
45
54
60
64
86
26
42
53
61
7174
88
30
48
59
66
7678
88
32
51
63
71
78 79
88
0
10
20
30
40
50
60
70
80
90
100
1 2 3 to 5 6 to 10 11 to 15 16 to 20 more than 20
Number of Previous Prison Sentences
Per
cen
tag
e
Re-imprisonment % (12 months)
Re-imprisonment % (24 months)
Re-imprisonment % (36 months)
Re-imprisonment % (48 months)
Re-imprisonment % (60 months)
Re-imprisonment rates: First-timers and Recidivists The following section examines more closely the reconviction dataset by disaggregating offenders according to the number of previous prison terms. Those for whom their release in 2002/03 was from their first-ever prison term are designated in the following as “first-timers”. The remainder, who had served two or more previous prison terms, are designated as “recidivists”. As noted above, across the entire sample of released offenders, about one third had been sent to prison for the first time. The re-imprisonment rate of these first-timers is 32 percent; in contrast, the re-imprisonment rate of the remainder – the recidivists - is 63 percent.
15
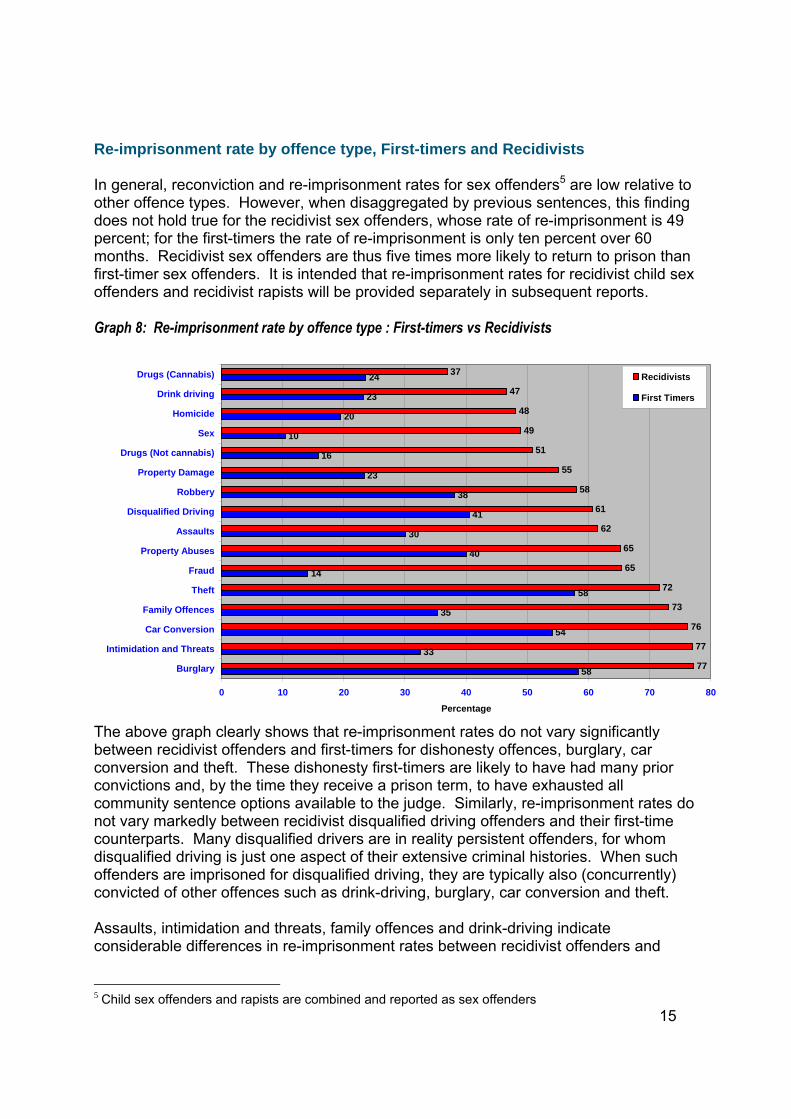
Re-imprisonment rate by offence type, First-timers and Recidivists In general, reconviction and re-imprisonment rates for sex offenders5 are low relative to other offence types. However, when disaggregated by previous sentences, this finding does not hold true for the recidivist sex offenders, whose rate of re-imprisonment is 49 percent; for the first-timers the rate of re-imprisonment is only ten percent over 60 months. Recidivist sex offenders are thus five times more likely to return to prison than first-timer sex offenders. It is intended that re-imprisonment rates for recidivist child sex offenders and recidivist rapists will be provided separately in subsequent reports. Graph 8: Re-imprisonment rate by offence type : First-timers vs Recidivists
58
33
54
35
58
14
40
30
41
38
23
16
10
20
23
24
77
77
76
73
72
65
65
62
61
58
55
51
49
48
47
37
0 10 20 30 40 50 60 70 80
Burglary
Intimidation and Threats
Car Conversion
Family Offences
Theft
Fraud
Property Abuses
Assaults
Disqualified Driving
Robbery
Property Damage
Drugs (Not cannabis)
Sex
Homicide
Drink driving
Drugs (Cannabis)
Percentage
Recidivists
First Timers
The above graph clearly shows that re-imprisonment rates do not vary significantly between recidivist offenders and first-timers for dishonesty offences, burglary, car conversion and theft. These dishonesty first-timers are likely to have had many prior convictions and, by the time they receive a prison term, to have exhausted all community sentence options available to the judge. Similarly, re-imprisonment rates do not vary markedly between recidivist disqualified driving offenders and their first-time counterparts. Many disqualified drivers are in reality persistent offenders, for whom disqualified driving is just one aspect of their extensive criminal histories. When such offenders are imprisoned for disqualified driving, they are typically also (concurrently) convicted of other offences such as drink-driving, burglary, car conversion and theft. Assaults, intimidation and threats, family offences and drink-driving indicate considerable differences in re-imprisonment rates between recidivist offenders and
5 Child sex offenders and rapists are combined and reported as sex offenders
16
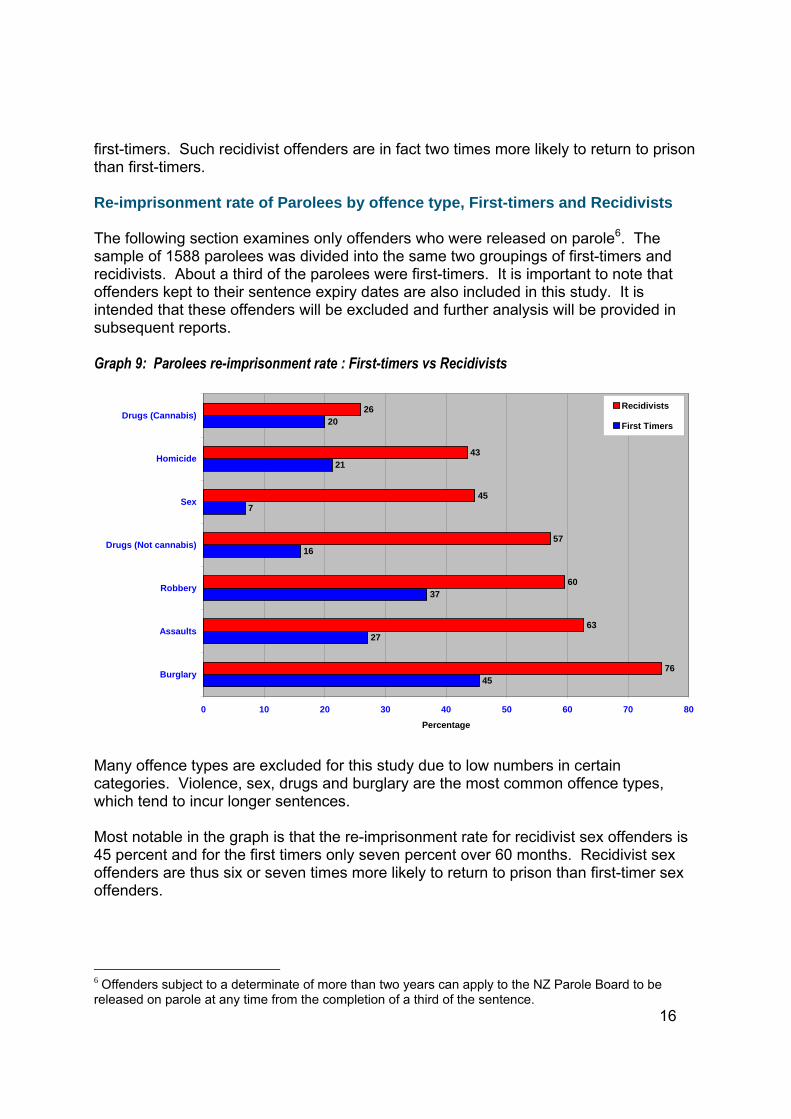
first-timers. Such recidivist offenders are in fact two times more likely to return to prison than first-timers. Re-imprisonment rate of Parolees by offence type, First-timers and Recidivists The following section examines only offenders who were released on parole6. The sample of 1588 parolees was divided into the same two groupings of first-timers and recidivists. About a third of the parolees were first-timers. It is important to note that offenders kept to their sentence expiry dates are also included in this study. It is intended that these offenders will be excluded and further analysis will be provided in subsequent reports. Graph 9: Parolees re-imprisonment rate : First-timers vs Recidivists
45
27
37
16
7
21
20
76
63
60
57
45
43
26
0 10 20 30 40 50 60 70 80
Burglary
Assaults
Robbery
Drugs (Not cannabis)
Sex
Homicide
Drugs (Cannabis)
Percentage
Recidivists
First Timers
Many offence types are excluded for this study due to low numbers in certain categories. Violence, sex, drugs and burglary are the most common offence types, which tend to incur longer sentences. Most notable in the graph is that the re-imprisonment rate for recidivist sex offenders is 45 percent and for the first timers only seven percent over 60 months. Recidivist sex offenders are thus six or seven times more likely to return to prison than first-timer sex offenders.
6 Offenders subject to a determinate of more than two years can apply to the NZ Parole Board to be released on parole at any time from the completion of a third of the sentence.
17
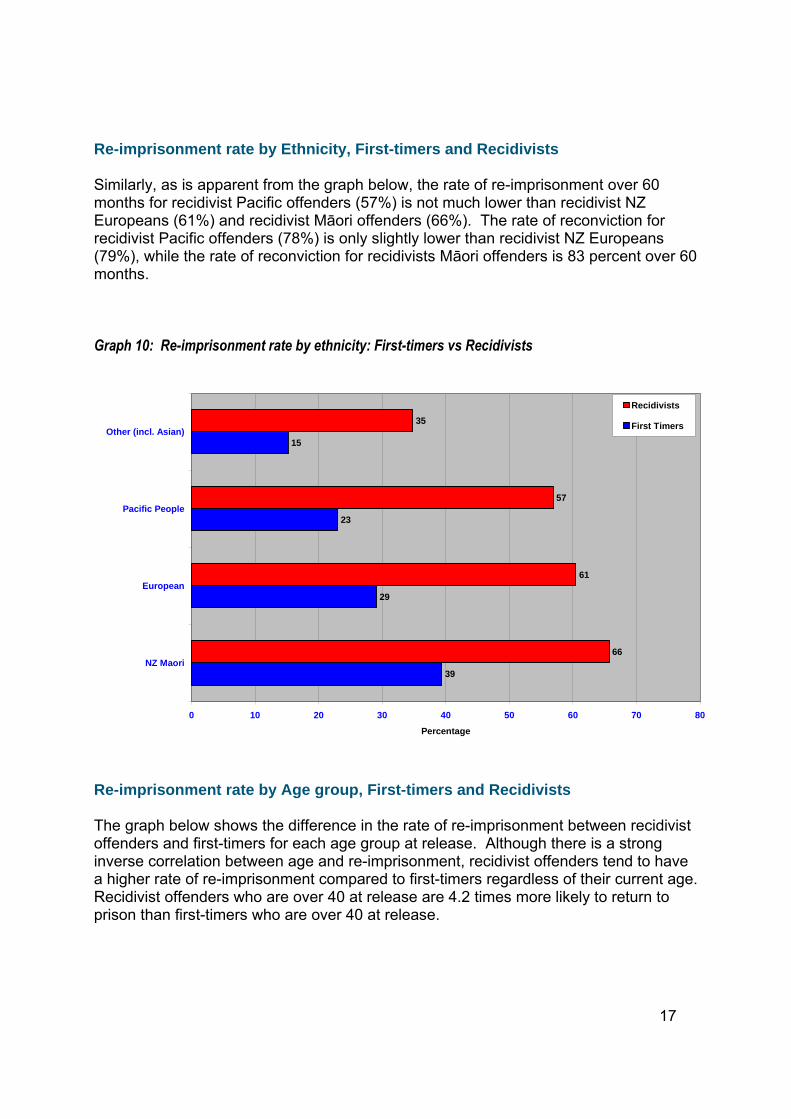
Re-imprisonment rate by Ethnicity, First-timers and Recidivists Similarly, as is apparent from the graph below, the rate of re-imprisonment over 60 months for recidivist Pacific offenders (57%) is not much lower than recidivist NZ Europeans (61%) and recidivist Māori offenders (66%). The rate of reconviction for recidivist Pacific offenders (78%) is only slightly lower than recidivist NZ Europeans (79%), while the rate of reconviction for recidivists Māori offenders is 83 percent over 60 months. Graph 10: Re-imprisonment rate by ethnicity: First-timers vs Recidivists
39
29
23
15
66
61
57
35
0 10 20 30 40 50 60 70 80
NZ Maori
European
Pacific People
Other (incl. Asian)
Percentage
Recidivists
First Timers
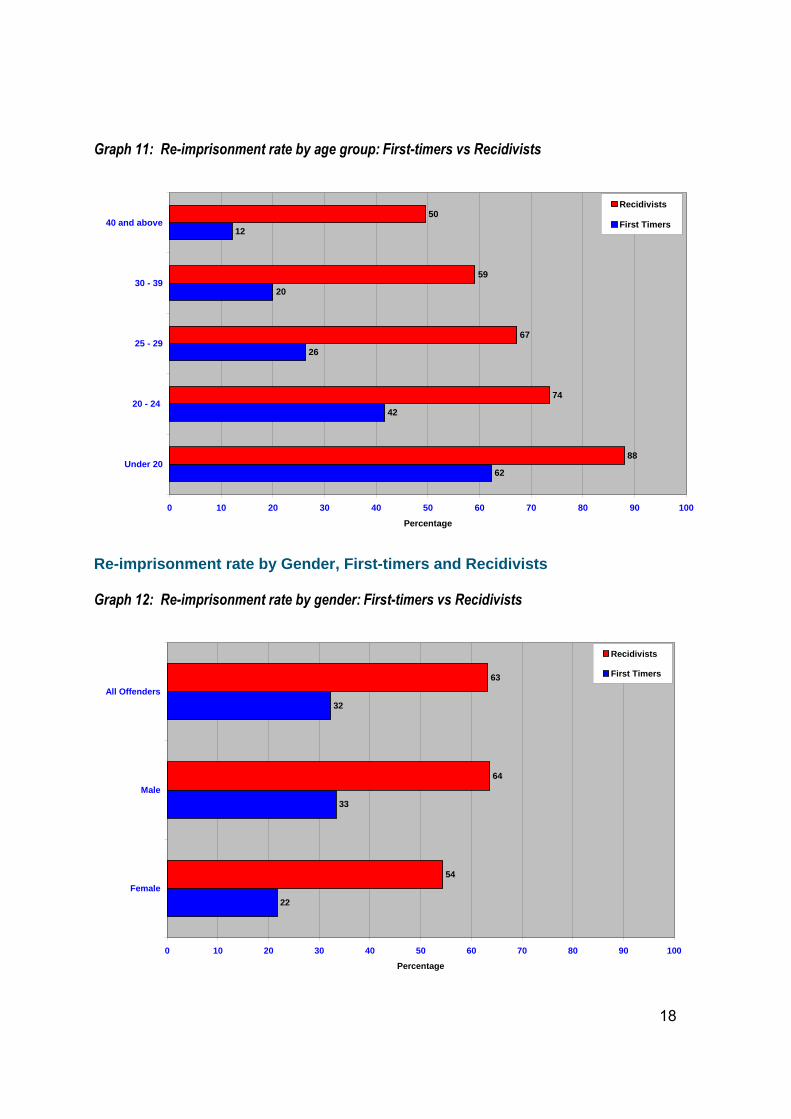
Re-imprisonment rate by Age group, First-timers and Recidivists The graph below shows the difference in the rate of re-imprisonment between recidivist offenders and first-timers for each age group at release. Although there is a strong inverse correlation between age and re-imprisonment, recidivist offenders tend to have a higher rate of re-imprisonment compared to first-timers regardless of their current age. Recidivist offenders who are over 40 at release are 4.2 times more likely to return to prison than first-timers who are over 40 at release.
18
Graph 11: Re-imprisonment rate by age group: First-timers vs Recidivists
62
42
26
20
12
88
74
67
59
50
0 10 20 30 40 50 60 70 80 90 100
Under 20
20 - 24
25 - 29
30 - 39
40 and above
Percentage
Recidivists
First Timers
Re-imprisonment rate by Gender, First-timers and Recidivists Graph 12: Re-imprisonment rate by gender: First-timers vs Recidivists
22
33
32
54
64
63
0 10 20 30 40 50 60 70 80 90 100
Female
Male
All Offenders
Percentage
Recidivists
First Timers

19
In general, the overall re-imprisonment rate of female offenders (36%) is lower than that of male offenders (53%). The graph above contains some interesting findings in relation to female offenders: the rate of re-imprisonment for recidivist female offenders (54%) is not greatly dissimilar to that of recidivist male offenders (64%). Recidivist female offenders turn out to be 2.5 times more likely to return to prison than first-timer females, while recidivist male offenders are just 1.9 times more likely to return to prison than first-timer males. However, the rate of reconviction for recidivist female offenders (80%) is almost same as recidivist male offenders (81%); clearly there is a “hard core” of female offenders who are as criminally inclined as their male counterparts. In summary the analysis confirms simply that, the more time in the past someone has been in prison, the more likely they are to return to prison following any given release.
20
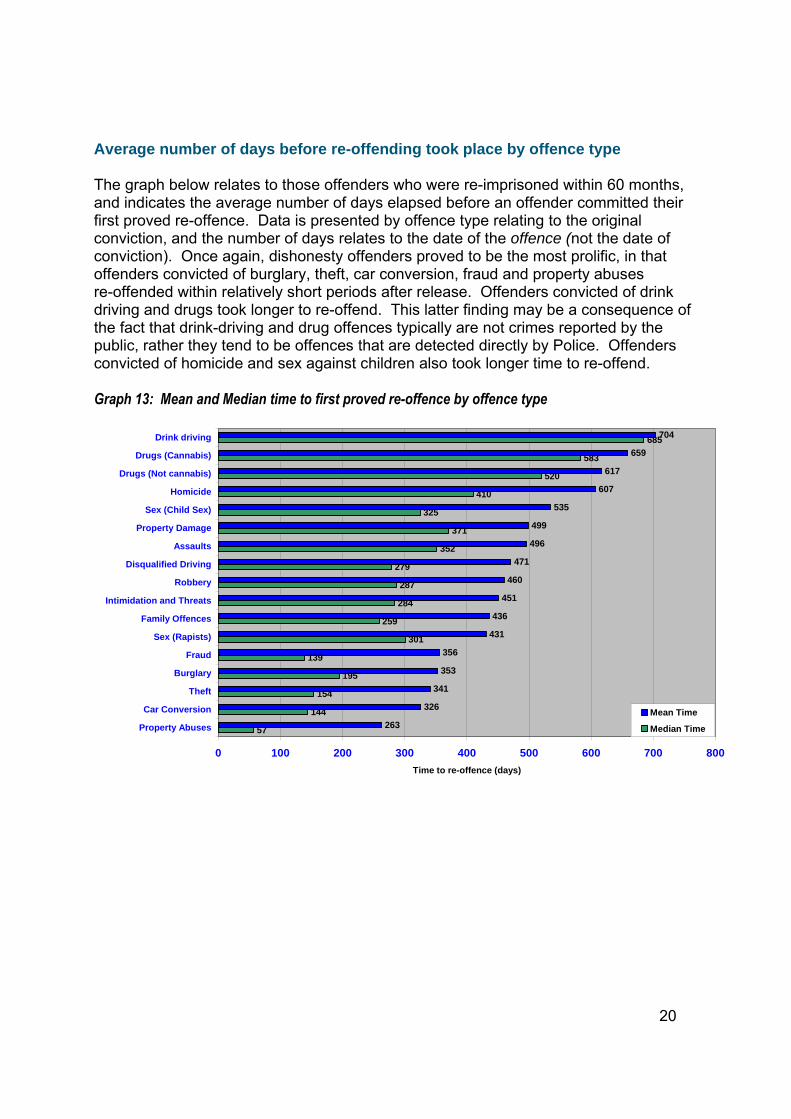
Average number of days before re-offending took place by offence type The graph below relates to those offenders who were re-imprisoned within 60 months, and indicates the average number of days elapsed before an offender committed their first proved re-offence. Data is presented by offence type relating to the original conviction, and the number of days relates to the date of the offence (not the date of conviction). Once again, dishonesty offenders proved to be the most prolific, in that offenders convicted of burglary, theft, car conversion, fraud and property abuses re-offended within relatively short periods after release. Offenders convicted of drink driving and drugs took longer to re-offend. This latter finding may be a consequence of the fact that drink-driving and drug offences typically are not crimes reported by the public, rather they tend to be offences that are detected directly by Police. Offenders convicted of homicide and sex against children also took longer time to re-offend. Graph 13: Mean and Median time to first proved re-offence by offence type
57
144
154
195
139
301
259
284
287
279
352
371
325
410
520
583
685
263
326
341
353
356
431
436
451
460
471
496
499
535
607
617
659
704
0 100 200 300 400 500 600 700 800
Property Abuses
Car Conversion
Theft
Burglary
Fraud
Sex (Rapists)
Family Offences
Intimidation and Threats
Robbery
Disqualified Driving
Assaults
Property Damage
Sex (Child Sex)
Homicide
Drugs (Not cannabis)
Drugs (Cannabis)
Drink driving
Time to re-offence (days)
Mean Time
Median Time
21
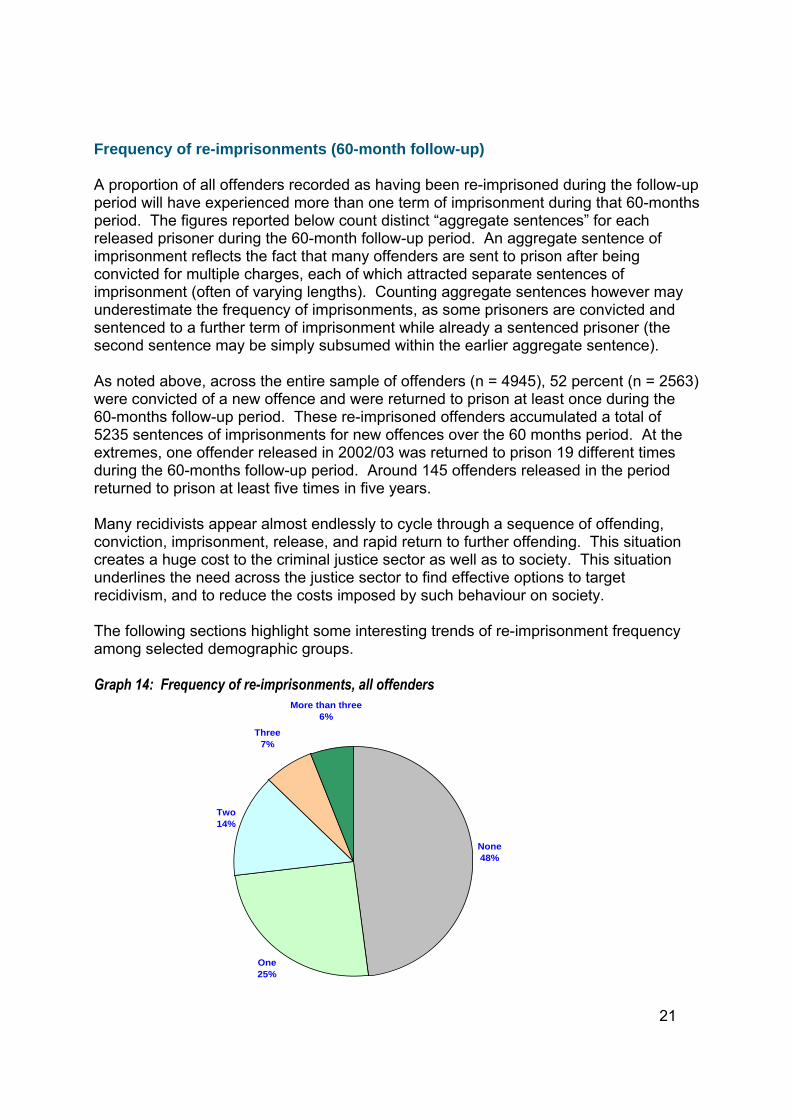
Frequency of re-imprisonments (60-month follow-up) A proportion of all offenders recorded as having been re-imprisoned during the follow-up period will have experienced more than one term of imprisonment during that 60-months period. The figures reported below count distinct “aggregate sentences” for each released prisoner during the 60-month follow-up period. An aggregate sentence of imprisonment reflects the fact that many offenders are sent to prison after being convicted for multiple charges, each of which attracted separate sentences of imprisonment (often of varying lengths). Counting aggregate sentences however may underestimate the frequency of imprisonments, as some prisoners are convicted and sentenced to a further term of imprisonment while already a sentenced prisoner (the second sentence may be simply subsumed within the earlier aggregate sentence). As noted above, across the entire sample of offenders (n = 4945), 52 percent (n = 2563) were convicted of a new offence and were returned to prison at least once during the 60-months follow-up period. These re-imprisoned offenders accumulated a total of 5235 sentences of imprisonments for new offences over the 60 months period. At the extremes, one offender released in 2002/03 was returned to prison 19 different times during the 60-months follow-up period. Around 145 offenders released in the period returned to prison at least five times in five years. Many recidivists appear almost endlessly to cycle through a sequence of offending, conviction, imprisonment, release, and rapid return to further offending. This situation creates a huge cost to the criminal justice sector as well as to society. This situation underlines the need across the justice sector to find effective options to target recidivism, and to reduce the costs imposed by such behaviour on society. The following sections highlight some interesting trends of re-imprisonment frequency among selected demographic groups. Graph 14: Frequency of re-imprisonments, all offenders
None48%
One25%
Two14%
Three7%
More than three6%
22
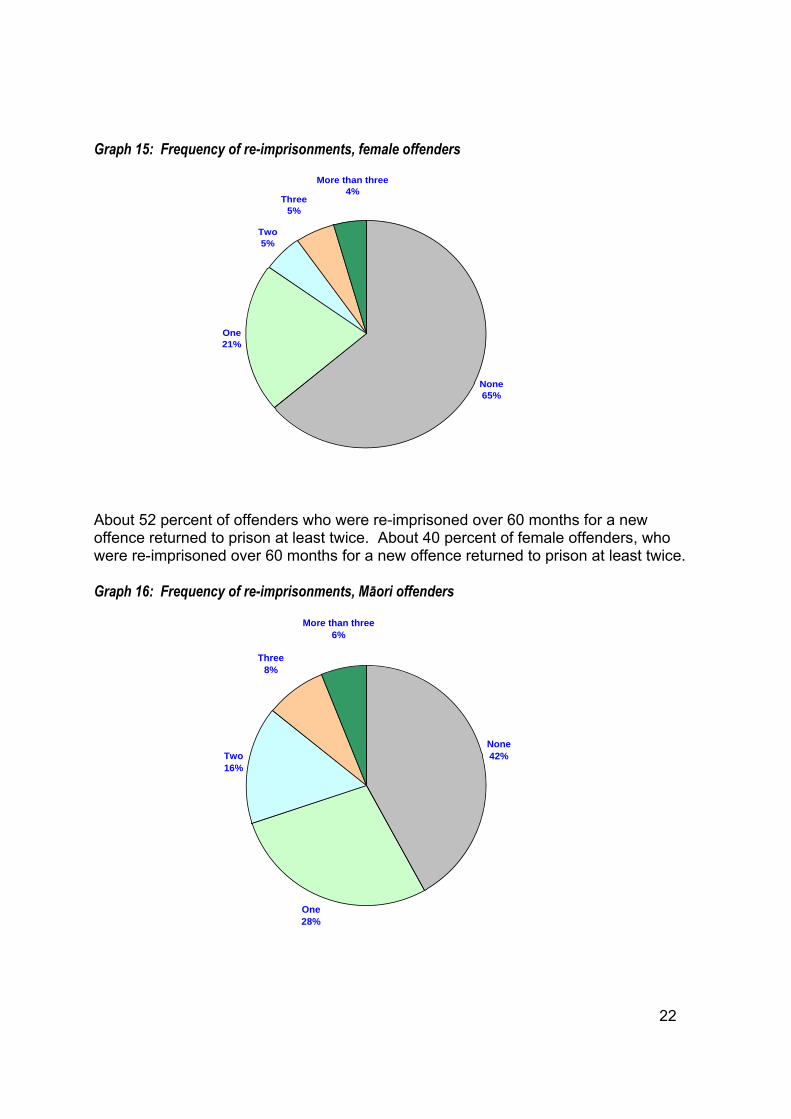
Graph 15: Frequency of re-imprisonments, female offenders
None65%
One21%
Two5%
Three5%
More than three4%
About 52 percent of offenders who were re-imprisoned over 60 months for a new offence returned to prison at least twice. About 40 percent of female offenders, who were re-imprisoned over 60 months for a new offence returned to prison at least twice. Graph 16: Frequency of re-imprisonments, Māori offenders
None42%
One28%
Two16%
Three8%
More than three6%
23
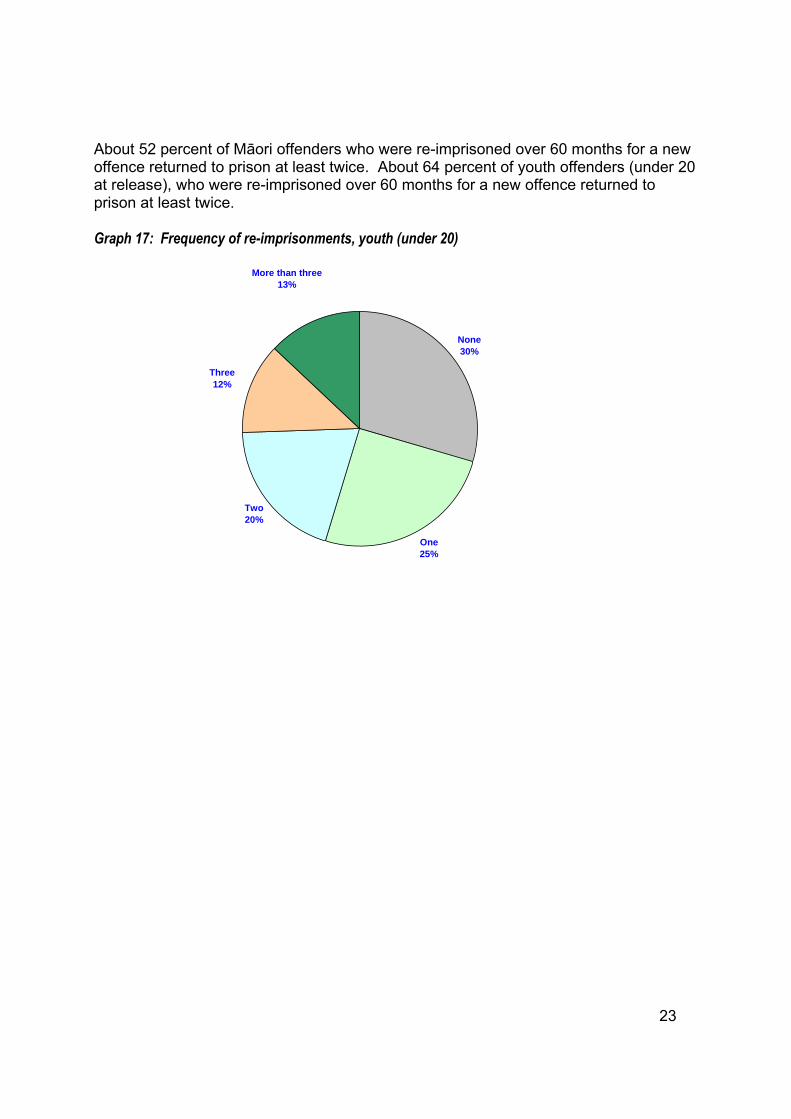
About 52 percent of Māori offenders who were re-imprisoned over 60 months for a new offence returned to prison at least twice. About 64 percent of youth offenders (under 20 at release), who were re-imprisoned over 60 months for a new offence returned to prison at least twice. Graph 17: Frequency of re-imprisonments, youth (under 20)
None30%
One25%
Two20%
Three12%
More than three13%
24
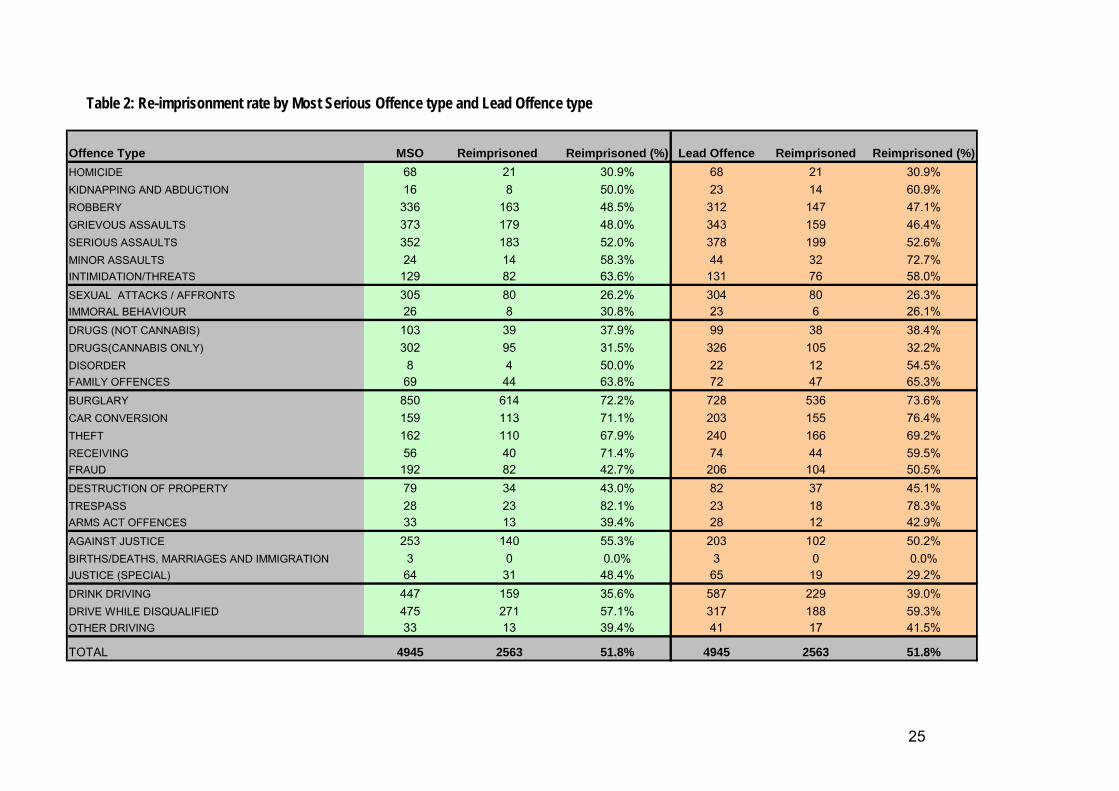
“Most serious offence” and “Lead offence” An important offender characteristic featured in this report is the “offence type”. As a great number of offenders are sent to prison for multiple offences, offenders are typically grouped according to their most serious offence (MSO) for which they were imprisoned on the original sentence. MSO rankings are determined from the Ministry of Justice “Seriousness of Offence Scale”, which determines offence seriousness in accordance with the average number of days imprisonment ordered by judges, for that specific offence type, over the past five years. Another way of identifying “offence type” when an offender is convicted of multiple and diverse offences is by identifying the offender’s “lead offence”. A lead offence is the offence which, on the date of that particular offender’s imprisonment, incurred the greatest number of days of imprisonment as ordered by the sentencing judge. Table 2 presents a comparison of the total number of offenders and the re-imprisonment rate by the MSO and lead offence. Overall, the two classifications produce key differences for some offence types, but minimal differences for others. Unsurprisingly, very serious offences such as homicide and sexual offences recorded either no differences or little differences when MSO and lead offence methods were used. On the other hand, some offence types recorded considerable differences when derived as the MSO and the lead offence. In particular, the number of offenders whose lead offence was drink driving was significantly higher than the number of offenders whose MSO was drink driving (587 compared with 447 respectively). Similarly, the number of offenders whose lead offence was disqualified driving was significantly lower than the number of offenders whose MSO was disqualified driving (317 compared with 475 respectively). This discrepancy appears to be due to a number of offenders being convicted for both driving while disqualified and drink driving. Under the MSO classification, driving while disqualified is considered to be a more serious offence; however, in practice, the sentence which judges apply to the separate offences indicates that they typically regard the drink-driving offence(s) as more serious. Similarly, the number of offenders whose lead offence was burglary was significantly lower than the number of offenders whose MSO was burglary (728 compared with 850 respectively). These results indicate that under the MSO classification some offenders were grouped into the burglary offence type despite receiving longer sentences for other dishonesty offences committed such as car conversion and theft. In most cases, the differences between the two classifications had little impact on the re-imprisonment rate over five years. For instance, under Lead Offence classification the re-imprisonment rate for burglary is 73.6 percent. Under MSO classification the re-imprisonment rate for burglary is 72.2 percent. However, re-imprisonments for offences such as minor assaults, intimidation and threats, receiving and fraud have significant differences under both classifications (see table 2 on the next page).
25
Table 2: Re-imprisonment rate by Most Serious Offence type and Lead Offence type
Offence Type MSO Reimprisoned Reimprisoned (%) Lead Offence Reimprisoned Reimprisoned (%)
HOMICIDE 68 21 30.9% 68 21 30.9%
KIDNAPPING AND ABDUCTION 16 8 50.0% 23 14 60.9%
ROBBERY 336 163 48.5% 312 147 47.1%
GRIEVOUS ASSAULTS 373 179 48.0% 343 159 46.4%
SERIOUS ASSAULTS 352 183 52.0% 378 199 52.6%
MINOR ASSAULTS 24 14 58.3% 44 32 72.7%INTIMIDATION/THREATS 129 82 63.6% 131 76 58.0%
SEXUAL ATTACKS / AFFRONTS 305 80 26.2% 304 80 26.3%IMMORAL BEHAVIOUR 26 8 30.8% 23 6 26.1%
DRUGS (NOT CANNABIS) 103 39 37.9% 99 38 38.4%
DRUGS(CANNABIS ONLY) 302 95 31.5% 326 105 32.2%
DISORDER 8 4 50.0% 22 12 54.5%FAMILY OFFENCES 69 44 63.8% 72 47 65.3%
BURGLARY 850 614 72.2% 728 536 73.6%
CAR CONVERSION 159 113 71.1% 203 155 76.4%
THEFT 162 110 67.9% 240 166 69.2%
RECEIVING 56 40 71.4% 74 44 59.5%FRAUD 192 82 42.7% 206 104 50.5%
DESTRUCTION OF PROPERTY 79 34 43.0% 82 37 45.1%
TRESPASS 28 23 82.1% 23 18 78.3%ARMS ACT OFFENCES 33 13 39.4% 28 12 42.9%
AGAINST JUSTICE 253 140 55.3% 203 102 50.2%
BIRTHS/DEATHS, MARRIAGES AND IMMIGRATION 3 0 0.0% 3 0 0.0%JUSTICE (SPECIAL) 64 31 48.4% 65 19 29.2%
DRINK DRIVING 447 159 35.6% 587 229 39.0%
DRIVE WHILE DISQUALIFIED 475 271 57.1% 317 188 59.3%OTHER DRIVING 33 13 39.4% 41 17 41.5%
TOTAL 4945 2563 51.8% 4945 2563 51.8%
26
Summary The central finding of this study is that, amongst offenders released from New Zealand prisons in 2002-2003, 52 percent were convicted of a new offence and received a further prison sentence within 60 months of the first release. Of those who were re-imprisoned over 60 months, about half were re-imprisoned within the first twelve months. Clearly, the first year after release is the highest-risk period for relapsing into old patterns of behaviour. The re-imprisonment rate of young offenders was particularly high. Offenders who commence their offending careers during their teenage years are considerably more likely to become persistent offenders, particularly if their initial crimes are ones that result in a prison sentence. Previous study in this series showed that many prisoners were first convicted and imprisoned when they were young. Interventions with youth offenders in prisons are thus an important priority for the Department, and if effective would have significant “down-stream” benefits. The re-imprisonment rate of dishonesty offenders - those convicted of theft, car conversion and burglary - was very high. These are of course crimes with very high base-rates (that is, the offences are more common), which means that those who tend to engage in such crimes probably do so, relatively speaking, with high frequency. An interesting finding emerged with sex offenders: these individuals are typically known to have relatively low rates of reconviction. However, when separated into first-timers and recidivists, it became apparent that there is a sub-set of sex offenders who are very active criminals, for whom the sexual offending is but one expression of their general antisociality. This finding was also apparent in general figures showing relationships between original offence type and subsequent re-offence type. This indicated that, amongst the recidivistic offenders, there is only a modest tendency towards offence specialisation. The latter was apparent only amongst violence and driving offenders; in the main there was a distinct pattern of versatile offending, spanning all categories of offence types. Overall, the most striking finding of the study is that, the more often in the past someone has been in prison, the more likely they are to return to prison following any given release. Conversely, the great majority of those individuals, who come to prison on their first-ever sentence of imprisonment, do not in fact return to prison. This is perhaps the most heartening finding in what is otherwise a somewhat bleak picture of recidivistic offending.

27
References Reconviction Patterns of Released Prisoners (March 2008), Policy Strategy and Research, Department of Corrections. Reconviction Patterns of Released Prisoners (March 2007), Policy Strategy and Research, Department of Corrections. Annual Report 2005/06 (2006), Department of Corrections.
28
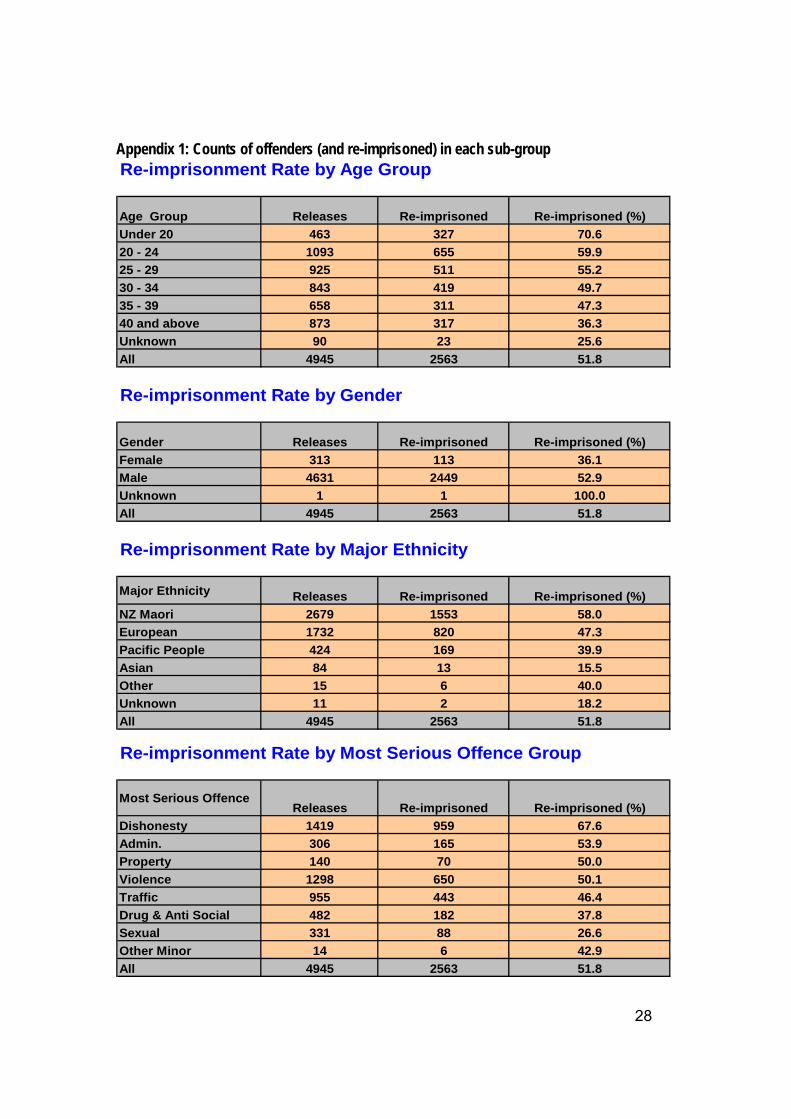
Appendix 1: Counts of offenders (and re-imprisoned) in each sub-group Re-imprisonment Rate by Age Group
Age Group Releases Re-imprisoned Re-imprisoned (%)
Under 20 463 327 70.6
20 - 24 1093 655 59.9
25 - 29 925 511 55.2
30 - 34 843 419 49.7
35 - 39 658 311 47.3
40 and above 873 317 36.3
Unknown 90 23 25.6
All 4945 2563 51.8
Re-imprisonment Rate by Gender
Gender Releases Re-imprisoned Re-imprisoned (%)
Female 313 113 36.1
Male 4631 2449 52.9
Unknown 1 1 100.0
All 4945 2563 51.8
Re-imprisonment Rate by Major Ethnicity
Major Ethnicity Releases Re-imprisoned Re-imprisoned (%)
NZ Maori 2679 1553 58.0
European 1732 820 47.3
Pacific People 424 169 39.9
Asian 84 13 15.5
Other 15 6 40.0
Unknown 11 2 18.2
All 4945 2563 51.8
Re-imprisonment Rate by Most Serious Offence Group
Most Serious OffenceReleases Re-imprisoned Re-imprisoned (%)
Dishonesty 1419 959 67.6
Admin. 306 165 53.9
Property 140 70 50.0
Violence 1298 650 50.1
Traffic 955 443 46.4
Drug & Anti Social 482 182 37.8
Sexual 331 88 26.6
Other Minor 14 6 42.9
All 4945 2563 51.8
29
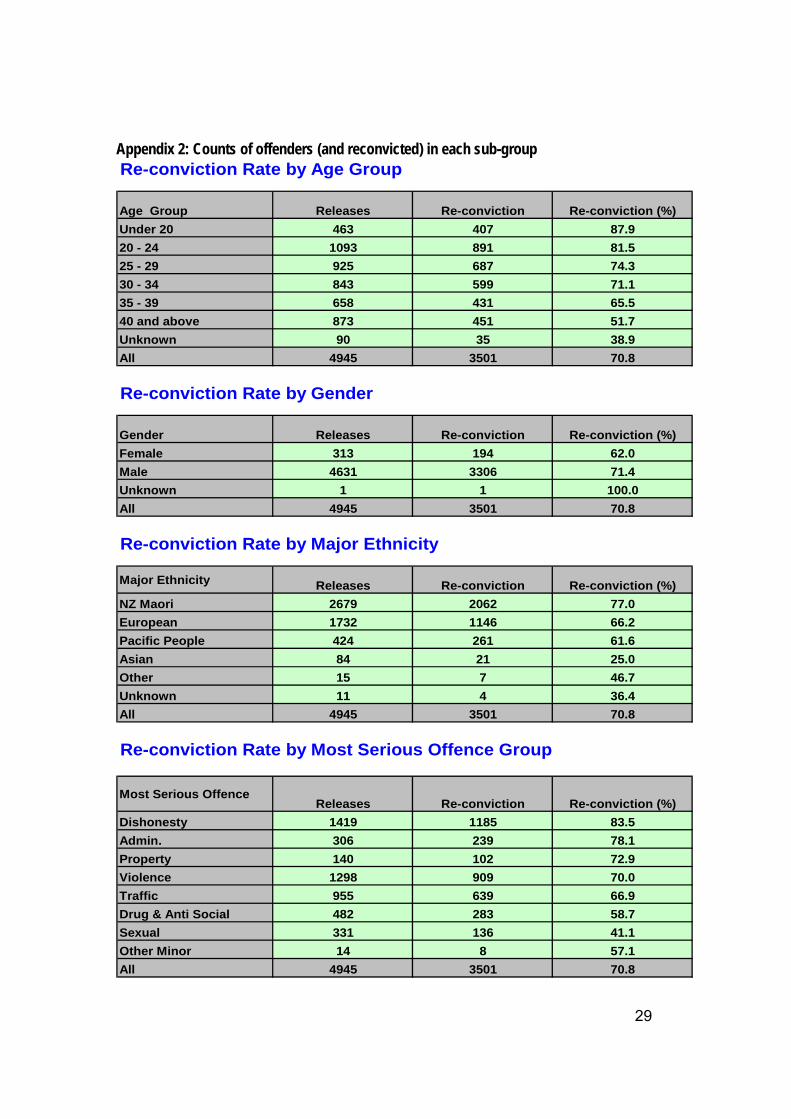
Appendix 2: Counts of offenders (and reconvicted) in each sub-group Re-conviction Rate by Age Group
Age Group Releases Re-conviction Re-conviction (%)
Under 20 463 407 87.9
20 - 24 1093 891 81.5
25 - 29 925 687 74.3
30 - 34 843 599 71.1
35 - 39 658 431 65.5
40 and above 873 451 51.7
Unknown 90 35 38.9
All 4945 3501 70.8
Re-conviction Rate by Gender
Gender Releases Re-conviction Re-conviction (%)
Female 313 194 62.0
Male 4631 3306 71.4
Unknown 1 1 100.0
All 4945 3501 70.8
Re-conviction Rate by Major Ethnicity
Major Ethnicity Releases Re-conviction Re-conviction (%)
NZ Maori 2679 2062 77.0
European 1732 1146 66.2
Pacific People 424 261 61.6
Asian 84 21 25.0
Other 15 7 46.7
Unknown 11 4 36.4
All 4945 3501 70.8
Re-conviction Rate by Most Serious Offence Group
Most Serious OffenceReleases Re-conviction Re-conviction (%)
Dishonesty 1419 1185 83.5
Admin. 306 239 78.1
Property 140 102 72.9
Violence 1298 909 70.0
Traffic 955 639 66.9
Drug & Anti Social 482 283 58.7
Sexual 331 136 41.1
Other Minor 14 8 57.1
All 4945 3501 70.8
Related Documents