Reconstruction of Tsunami Inland Propagation on December 26, 2004 in Banda Aceh, Indonesia, through Field Investigations FRANCK LAVIGNE, 1 RAPHAE ¨ L PARIS, 2 DELPHINE GRANCHER, 1 PATRICK WASSMER, 1 DANIEL BRUNSTEIN, 1 FRANCK VAUTIER, 2 FRE ´ DE ´ RIC LEONE, 3 FRANC ¸ OIS FLOHIC, 4 BENJAMIN DE COSTER, 4 TAUFIK GUNAWAN, 5 CHRISTOPHER GOMEZ, 1 ANGGRI SETIAWAN, 6 RINO CAHYADI, 6 and FACHRIZAL 5 Abstract—This paper presents the results from an extensive field data collection effort following the December 26, 2004 earthquake and tsunami in Banda Aceh, Sumatra. The data were collected under the auspices of TSUNARISQUE, a joint French-Indonesian program dedicated to tsunami research and hazard mitigation, which has been active since before the 2004 event. In total, data from three months of field investigations are presented, which detail important aspects of the tsunami inundation dynamics in Banda Aceh. These include measurements of runup, tsunami wave heights, flow depths, flow directions, event chronology and building damage patterns. The result is a series of detailed inundation maps of the northern and western coasts of Sumatra including Banda Aceh and Lhok Nga. Among the more important findings, we obtained consistent accounts that approximately ten separate waves affected the region after the earthquake; this indicates a high-frequency component of the tsunami wave energy in the extreme near-field. The largest tsunami wave heights were on the order of 35 m with a maximum runup height of 51 m. This value is the highest runup value measured in human history for a seismically generated tsunami. In addition, our field investigations show a significant discontinuity in the tsunami wave heights and flow depths along a line approximately 3 km inland, which the authors interpret to be the location of the collapse of the main tsunami bore caused by sudden energy dissipation. The propagating bore looked like a breaking wave from the landward side although it has distinct characteristics. Patterns of building damage are related to the location of the propagating bore with overall less damage to buildings beyond the line where the bore collapsed. This data set was built to be of use to the tsunami community for the purposes of calibrating and improving existing tsunami inundation models, especially in the analysis of extreme near-field events. Key words: Tsunami, runup, tsunami bore, inundation, intensity scale, building damage. 1 Laboratoire de Ge ´ographie Physique, UMR 8591 CNRS, 1 Place A. Briand, 92190 Meudon, France. E-mail: [email protected] 2 Ge ´olab UMR 6042 CNRS, Maison de la Recherche, 4 rue Ledru, 63057 Clermont-Ferrand, France. 3 Department de Ge ´ographie, universite ´ Paul Vale ´ry, Montpelliar, France. 4 Planet Risk, 6 rue Marie-The ´re `se, 91230 Montgeron, France. 5 Badan Meteorologi dan Geofisika, Jl. Angkasa 1 No.2, Kemayoran, Jakarta Pusat, Indonesia. 6 University Gadjah Mada (UGM), Jl Kaliurang, Yogyakarta, Indonesia. Pure appl. geophys. 166 (2009) 259–281 Ó Birkha ¨user Verlag, Basel, 2009 0033–4553/09/010259–23 DOI 10.1007/s00024-008-0431-8 Pure and Applied Geophysics

Welcome message from author
This document is posted to help you gain knowledge. Please leave a comment to let me know what you think about it! Share it to your friends and learn new things together.
Transcript
Reconstruction of Tsunami Inland Propagation on December 26, 2004
in Banda Aceh, Indonesia, through Field Investigations
FRANCK LAVIGNE,1 RAPHAEL PARIS,2 DELPHINE GRANCHER,1 PATRICK WASSMER,1 DANIEL
BRUNSTEIN,1 FRANCK VAUTIER,2 FREDERIC LEONE,3 FRANCOIS FLOHIC,4 BENJAMIN DE COSTER,4
TAUFIK GUNAWAN,5 CHRISTOPHER GOMEZ,1 ANGGRI SETIAWAN,6 RINO CAHYADI,6 and
FACHRIZAL5
Abstract—This paper presents the results from an extensive field data collection effort following the
December 26, 2004 earthquake and tsunami in Banda Aceh, Sumatra. The data were collected under the
auspices of TSUNARISQUE, a joint French-Indonesian program dedicated to tsunami research and hazard
mitigation, which has been active since before the 2004 event. In total, data from three months of field
investigations are presented, which detail important aspects of the tsunami inundation dynamics in Banda Aceh.
These include measurements of runup, tsunami wave heights, flow depths, flow directions, event chronology and
building damage patterns. The result is a series of detailed inundation maps of the northern and western coasts of
Sumatra including Banda Aceh and Lhok Nga.
Among the more important findings, we obtained consistent accounts that approximately ten separate waves
affected the region after the earthquake; this indicates a high-frequency component of the tsunami wave energy
in the extreme near-field. The largest tsunami wave heights were on the order of 35 m with a maximum runup
height of 51 m. This value is the highest runup value measured in human history for a seismically generated
tsunami. In addition, our field investigations show a significant discontinuity in the tsunami wave heights and
flow depths along a line approximately 3 km inland, which the authors interpret to be the location of the collapse
of the main tsunami bore caused by sudden energy dissipation. The propagating bore looked like a breaking
wave from the landward side although it has distinct characteristics. Patterns of building damage are related to
the location of the propagating bore with overall less damage to buildings beyond the line where the bore
collapsed. This data set was built to be of use to the tsunami community for the purposes of calibrating and
improving existing tsunami inundation models, especially in the analysis of extreme near-field events.
Key words: Tsunami, runup, tsunami bore, inundation, intensity scale, building damage.
1 Laboratoire de Geographie Physique, UMR 8591 CNRS, 1 Place A. Briand, 92190 Meudon, France.
E-mail: [email protected] Geolab UMR 6042 CNRS, Maison de la Recherche, 4 rue Ledru, 63057 Clermont-Ferrand, France.3 Department de Geographie, universite Paul Valery, Montpelliar, France.4 Planet Risk, 6 rue Marie-Therese, 91230 Montgeron, France.5 Badan Meteorologi dan Geofisika, Jl. Angkasa 1 No.2, Kemayoran, Jakarta Pusat, Indonesia.6 University Gadjah Mada (UGM), Jl Kaliurang, Yogyakarta, Indonesia.
Pure appl. geophys. 166 (2009) 259–281 � Birkhauser Verlag, Basel, 2009
0033–4553/09/010259–23
DOI 10.1007/s00024-008-0431-8Pure and Applied Geophysics
1. Introduction
The 2004 Indian Ocean tsunami was triggered by a 9.15 magnitude earthquake
(MELTZNER et al., 2006; CHLIEH et al., 2007) that occurred at 0:58:53 GMT, 7:58:53 LT
(USGS) (tEQ). The epicenter was located at 3.3 N, 95.8 E (Fig. 1) with a focal depth of
approximately 30 km. The earthquake was responsible for a sudden fault slip estimated
on average from 12–15 m (SYNOLAKIS et al., 2005; LAY et al., 2005) to 20 m (FU and SUN,
2006). The seismic moment estimate (Mo = 1.3 5 9 1030 dyne-cm), based on the
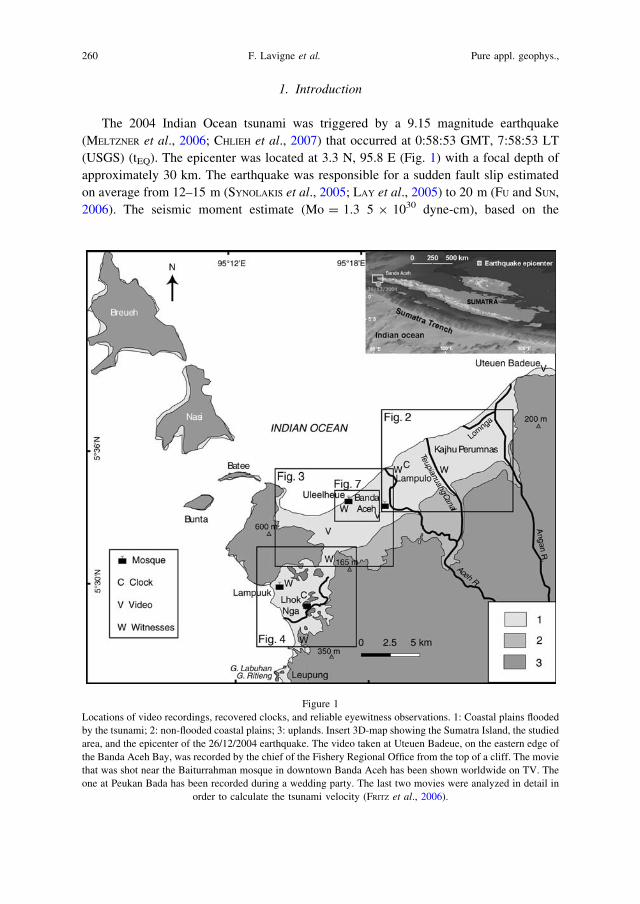
Figure 1
Locations of video recordings, recovered clocks, and reliable eyewitness observations. 1: Coastal plains flooded
by the tsunami; 2: non-flooded coastal plains; 3: uplands. Insert 3D-map showing the Sumatra Island, the studied
area, and the epicenter of the 26/12/2004 earthquake. The video taken at Uteuen Badeue, on the eastern edge of
the Banda Aceh Bay, was recorded by the chief of the Fishery Regional Office from the top of a cliff. The movie
that was shot near the Baiturrahman mosque in downtown Banda Aceh has been shown worldwide on TV. The
one at Peukan Bada has been recorded during a wedding party. The last two movies were analyzed in detail in
order to calculate the tsunami velocity (FRITZ et al., 2006).
260 F. Lavigne et al. Pure appl. geophys.,
measurement of split modes of free oscillations of the Earth, is about three times larger
than the 4 5 9 1029 dyne-cm measured from traditional long-period surface waves (STEIN
and OKAL, 2005). In the model suggested by CHLIEH et al. (2007), the latitudinal
distribution of released moment has three distinct peaks at about 4� N, 7� N, and 9� N,
which compares well to the latitudinal variations seen in the seismic inversion and of the
analysis of radiated T waves. The earthquake-induced damage to buildings was rather
limited in Banda Aceh City. Along the coastline, the damage to structures was difficult to
assess because the tsunami had totally destroyed the buildings.
Since the 1980s and the 1990s, the development of numerical modeling has increased
the knowledge of offshore tsunami propagation (e.g., SYNOLAKIS, 1987; IMAMURA and
SHUTO, 1990; CARRIER et al., 2003). Models currently in use include the French simulation
code developed by the Commissariat a l’Energie Atomique (CEA) (HEINRICH et al., 1998;
HEBERT et al., 2001), the Method of Splitting Tsunami (MOST) model used by the Pacific
Marine Environmental Laboratory of the National Oceanic and Atmospheric Adminis-
tration (NOAA PMEL) (TITOV and SYNOLAKIS, 1998), the FUNWAVE model (developed
by the Centre of Applied Coastal Research: KIRBY, 2003), and the code produced by
workers from Japan called TUNAMI N2 (GOTO et al., 1997). Most of these models use
linear or nonlinear shallow water assumptions, with or without dispersive effects, to study
tsunamis generated by earthquakes and submarine landslides. Such models provide
accurate simulations of far-field propagation of the tsunami waves. Some models like
MOST have also been extensively validated against runup signatures, even for extreme
events like the Okushiri tsunami (> 30 m runup). However, other models have not yet
been used extensively in simulating near-field propagation and detailed inland wave
behavior (e.g., transient bore propagation). This fact can be partially explained by a lack
of a highly accurate DEM and source model, however mainly by a lack of accurate field
data necessary to calibrate the models. Therefore, few inundation maps have been drawn
following a major tsunami, and tsunami hazard mapping based on numerical modeling is
still limited, except along the Japanese coast and the West coast of the USA (TITOV et al.,
2004; WONG et al., 2005).
The December 26th, 2004 Indian Ocean earthquake and tsunami offers an opportunity
to enhance our knowledge on tsunami processes and modeling, both near-shore and on
land. Several research teams involved in the study of this unusual event thus far have
focused their efforts on the tsunami origin — i.e. the earthquake mechanism — and/or
trans-oceanic propagation (AMMON et al., 2005; GEIST et al., 2007; HEBERT et al., 2007;
ENGDAHL et al., 2007; VALLEE, 2007). A few weeks after the disaster, other research
groups conducted reconnaissance surveys along the Indonesian coasts in the framework
of the International Tsunami Survey Teams (ITST) headed by BORRERO (2005a,b),
BORRERO et al. (2006), YALCINER et al. (2005), and TSUJI et al. (2006). Such rapid field
surveys were very useful in the aftermath of this exceptional tsunami that inundated
hundreds of square kilometers of coasts and destroyed thousands of houses. For example,
BORRERO (2005b) provided a table of overland flow depths and direction from throughout
Banda Aceh, as well as a detailed map of the inundation extents and the first descriptions
Vol. 166, 2009 Reconstruction of Tsunami Inland Propagation Aceh 261
of the wave crossing from Lhok Nga to the southwestern parts of Banda Aceh. Such data
were enough to do preliminary modelling. However, additional data are needed to
conduct in-depth analysis at a local scale.
An extensive database of tsunami propagation evidence has been collected for the
Banda Aceh and Lhok Nga districts (Fig. 1). The data were collected under the auspices
of TSUNARISQUE, a joint French-Indonesian program dedicated to tsunami research
and hazard mitigation, which has been active since before the 2004 event. At the time of
the Indian Ocean tsunami disaster, authors 1 and 2 accompanied the second ITST from 19
to 29 January 2005, and supplemented this preliminary survey by six subsequent trips
conducted between August 2005 and August 2006. Finally, this program was completed
after three months of field investigations, and with the help of more than 30 researchers,
technicians, and students.
In this paper we synthesized the main data collected during these field trips in order to
provide the most complete and accurate reconstruction of the dynamics of the tsunami
inundation as possible. This analysis includes various aspects of the phenomenon, such as
the time and space evolution of the different waves, tsunami height and runup variations,
flow-depth distribution, as well as the contribution of backwash to coastal erosion. In
addition, these parameters were discussed with several additional parameters, such as
topography, location of tsunami bores, and building damages. Complementary analyses
of the 2004 tsunami deposits and observations on the geomorphological effects of the
tsunami were previously published (PARIS et al., 2007a, b). Beyond the direct contribution
of this work to the understanding of the effects of giant tsunami waves on coastal areas,
our database offers an opportunity to test, calibrate, and improve the existing numerical
simulation codes, which are fundamental in assessing the hazards of future events. In this
respect, a high-resolution DEM has been built from various datasets collected during
the campaigns. The complete database, including this DEM, is available as open-source
in a web page dedicated to the international community of tsunami modellers
(www.tsunarisque.cnrs.fr).
2. Methods
The database contains 300 measurements of tsunami height, flow depth, runup, and
inundation distance. For these measurements, a variety of standard tsunami field survey
techniques were combined (e.g., TSUJI et al., 1995; OKAL et al., 2002), which has been
previously published (LAVIGNE et al., 2006). Field data acquired using laser range finders
(LaserAce 300) were calibrated from astronomical tide tables at Pulau Rusa and
Uleelheue. The high density of field data allowed us to map the spatial distribution of
tsunami height, flow depth, and runup, as well as the lines where the last transient
tsunami bore collapsed several kilometers inland. At several sites, the highest marks on
impacted trees or the upper limit of destruction traces on buildings decreased by several
262 F. Lavigne et al. Pure appl. geophys.,
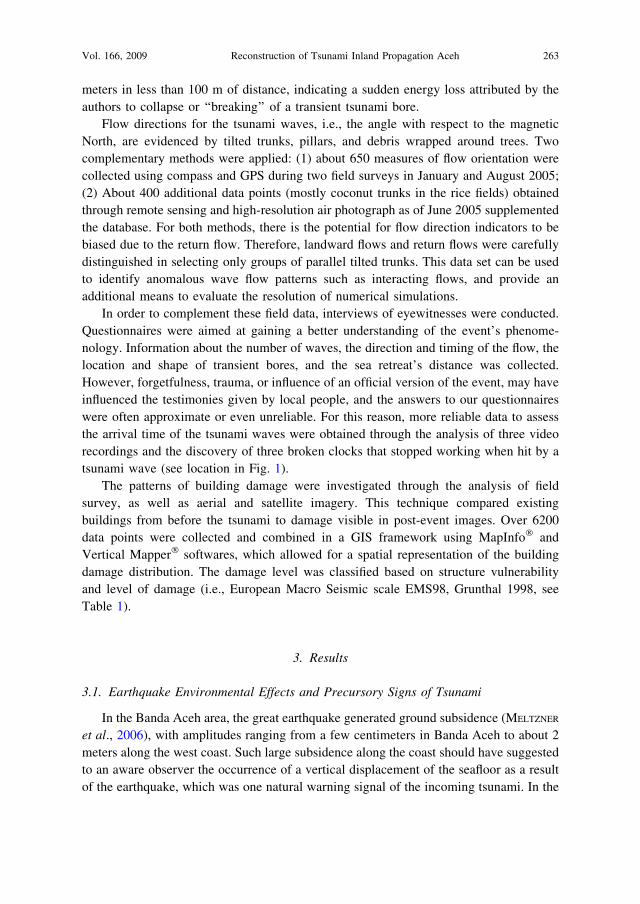
meters in less than 100 m of distance, indicating a sudden energy loss attributed by the
authors to collapse or ‘‘breaking’’ of a transient tsunami bore.
Flow directions for the tsunami waves, i.e., the angle with respect to the magnetic
North, are evidenced by tilted trunks, pillars, and debris wrapped around trees. Two
complementary methods were applied: (1) about 650 measures of flow orientation were
collected using compass and GPS during two field surveys in January and August 2005;
(2) About 400 additional data points (mostly coconut trunks in the rice fields) obtained
through remote sensing and high-resolution air photograph as of June 2005 supplemented
the database. For both methods, there is the potential for flow direction indicators to be
biased due to the return flow. Therefore, landward flows and return flows were carefully
distinguished in selecting only groups of parallel tilted trunks. This data set can be used
to identify anomalous wave flow patterns such as interacting flows, and provide an
additional means to evaluate the resolution of numerical simulations.
In order to complement these field data, interviews of eyewitnesses were conducted.
Questionnaires were aimed at gaining a better understanding of the event’s phenome-
nology. Information about the number of waves, the direction and timing of the flow, the
location and shape of transient bores, and the sea retreat’s distance was collected.
However, forgetfulness, trauma, or influence of an official version of the event, may have
influenced the testimonies given by local people, and the answers to our questionnaires
were often approximate or even unreliable. For this reason, more reliable data to assess
the arrival time of the tsunami waves were obtained through the analysis of three video
recordings and the discovery of three broken clocks that stopped working when hit by a
tsunami wave (see location in Fig. 1).
The patterns of building damage were investigated through the analysis of field
survey, as well as aerial and satellite imagery. This technique compared existing
buildings from before the tsunami to damage visible in post-event images. Over 6200
data points were collected and combined in a GIS framework using MapInfo� and
Vertical Mapper� softwares, which allowed for a spatial representation of the building
damage distribution. The damage level was classified based on structure vulnerability
and level of damage (i.e., European Macro Seismic scale EMS98, Grunthal 1998, see
Table 1).
3. Results
3.1. Earthquake Environmental Effects and Precursory Signs of Tsunami
In the Banda Aceh area, the great earthquake generated ground subsidence (MELTZNER
et al., 2006), with amplitudes ranging from a few centimeters in Banda Aceh to about 2
meters along the west coast. Such large subsidence along the coast should have suggested
to an aware observer the occurrence of a vertical displacement of the seafloor as a result
of the earthquake, which was one natural warning signal of the incoming tsunami. In the
Vol. 166, 2009 Reconstruction of Tsunami Inland Propagation Aceh 263
former swamp areas, transformed into shrimp basins or tambak along the north coast of
Banda Aceh, liquefaction effects of clayed soils were observed. Eyewitnesses in Cotpaya
or Miruk Taman (Fig. 2) described sulphurous, black water coming out of the ditches and
sudden variations of well water levels, which were also mentioned by KITAGAWA et al.
(2006). At Lampineung (Fig. 2), testimonies described malodorous black bubbles in
water wells. Similar smells and colors were reported by fishermen roughly 1.5 km
offshore. Along the karstic area of Lhok Nga, on the west coast, many wells were drained
immediately following the earthquake.
Local people also reported hearing three detonations similar to bomb explosions that
sounded between the main tectonic shock and the tsunami arrival. Similar noises were
reported at the time of the 1933 Great Sanriku Earthquake in Japan (INOUYE, 1934) and of
the 1977 Sumba earthquake and tsunami (KATO and TSUJI, 1995). These bangs are
probably peculiar to earthquakes caused by the breaking of a sinking plate (KATO and
TSUJI, 1995). However, SHUTO (1997) suggested that ‘‘thunder-like’’ sounds are generated
and heard at distant places when tsunamis higher than 5 m hit coastal cliffs.
Another preliminary sign of the impending tsunami was a withdrawal of the ocean
waters near the shore. The withdrawal related to the leading depression wave (SYNOLAKIS
and TADEPALLI, 1996) was observed on the west coast about 10 minutes after the first shock
of the earthquake. Testimonies reported similar observations at Meulaboh on the south
coast (YALCINER et al., 2005). The extent of the withdrawal exceeded 1 km off Banda Aceh
and Lhok Nga, with the most reliable data being given by the Tuan Island, northwest off
Uleelheue (Fig. 3). Located 1.2 km off the former coastline, the seawater surrounding this
small island was drained during the leading depression wave related drawdown. The
leading depression was estimated to 10 minutes. The corresponding lowering of the sea
level has been estimated at 5 m ± 1 m by local fishermen. At Lampuuk (Fig. 4), the
duration of the sea withdrawal lasted several minutes based on testimonies.
The last warning sign of the tsunami arrival was the massive migration of bird
colonies flying landward from the open sea. Numerous eyewitnesses reported, after the
disaster, to have heard bird calls which were interpreted by some villagers as a warning
Table 1
Macro-tsunamic intensity scale based on buildings damages (from I to VI degrees). The term ‘‘Macro-tsunamic’’
is proposed by reference to the European Macro-Seismic intensity scale. This scale, developed by F. Leone,
encompasses all building classes and damage levels
Damage levels on buildings
D0 to D1 D1 to D2 D2 to D3 D4 to D5 D5 to D6
Buildings vulnerability classes A I II III IV V
B I II III IV VI
C II III IV V VI
D II III IV V VI
E II IV V VI VI
264 F. Lavigne et al. Pure appl. geophys.,
for people threatened by the tsunami. This underlines the great efforts that still need to be
focused on tsunami education and raising tsunami awareness.
3.2. Tsunami Waves and Velocities
Eyewitnesses reported between 10 and 12 waves along the coastlines all around the
Banda Aceh area. The chief of the Fishery Regional Office at Uteuen Badeue (Fig. 1)
recorded a dozen waves on videotape. Further west, eyewitnesses reported about ten
waves from the bridge over the Teupianuang Canal, which was not inundated by the
tsunami. Near downtown Banda Aceh, people who found shelter in the famous boat that
overtopped a house at Lampulo also reported ten waves, like other eyewitnesses at
Lampuuk and Labuhan (a military camp above the cement factory and the harbor:
Fig. 4). However, several individual waves identified by the eyewitnesses may have
resulted from the decomposition of single transient bores that have broken up into
multiple waves.
Rather detailed descriptions were obtained for the first three waves. The leading wave
moved rapidly landward as a turbulent flow with depths ranging from 0.5 to 2.5 m from
9
8
Indian OceanNon flooded areaAngan R.
Aceh R.
0 1 kmMaximum wave height (m)
Measured wave height (m)
Direction of the main wave
Tsunami bore collapse
River
Urban area
<
Neuheun
Lam Nga
Lam UjongLabuy
Lampineung
Lambada Lhok
Cotpaya
MirukTaman
MirukLamreudep
Lampoihdaya
Cadet
KAJHU
Ba'et
Blang KruengSalaue
Tg. Selamat
Tibang
Lambaro
Lampulo
Banda Aceh
Jeulinke
Pasi
Kutaraja Beudee
Lamnyong
DaehRaya
Lamprada
7.8
10.2
7.8
2.121.8
14
6
7.8
7
47.48.6
9.5
8.80.1
13
98.4
5.87.510.4
9.37.5
6.54.3
1.7
1.1
2.7
2.6
10.2
2.9
8.8
6.1
1.5
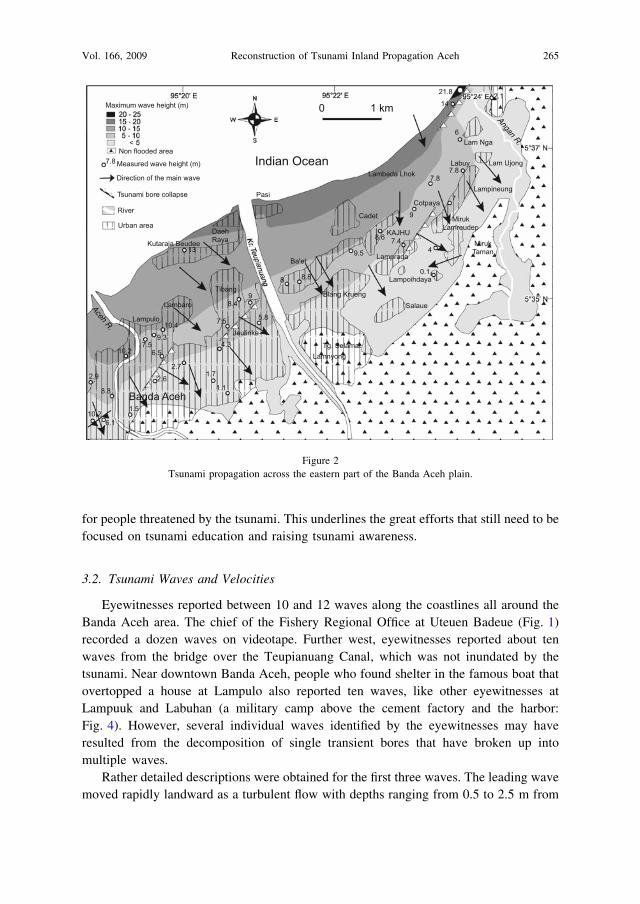
Figure 2
Tsunami propagation across the eastern part of the Banda Aceh plain.
Vol. 166, 2009 Reconstruction of Tsunami Inland Propagation Aceh 265
ground, depending on the local topography. The velocity of this flow was estimated to be
approximately 8–10 m.s-1, based on testimonies of some survivors at Lampuuk, who fled
from this wave by motorcycle at a similar speed. The leading wave carried a large amount
of debris. Several survivors reported that this wave was responsible for the destruction of
most of the so-called sederhana and semi-permanent houses, as they are built using wood
and bamboo. In spite of its limited depth and its solid waste, this flow moved as far as
2 km inland up to Ba’et village (Fig. 2), and as far as 3.5 km inland in downtown Banda
Aceh. This first wave may have corresponded to the leading edge of the tsunami, i.e., the
water that was being pushed by the second bore. Contrary to this leading wave, the
second bore moved landward as a rapidly rising tide of dark color. Little is known about
the following waves, which were lower than the subsequent waves, and thus came over
areas already inundated and devastated. However, witnesses at Lampuuk, Uleelheue,
Lamtengoh, northwest of Banda Aceh city, Figure 3, reported that the third wave was
higher than the second one.
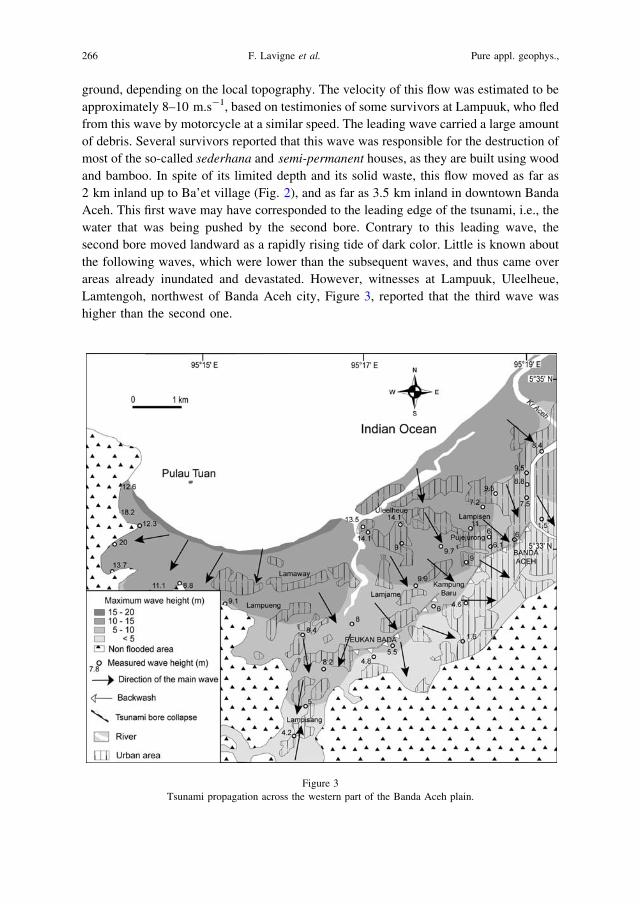
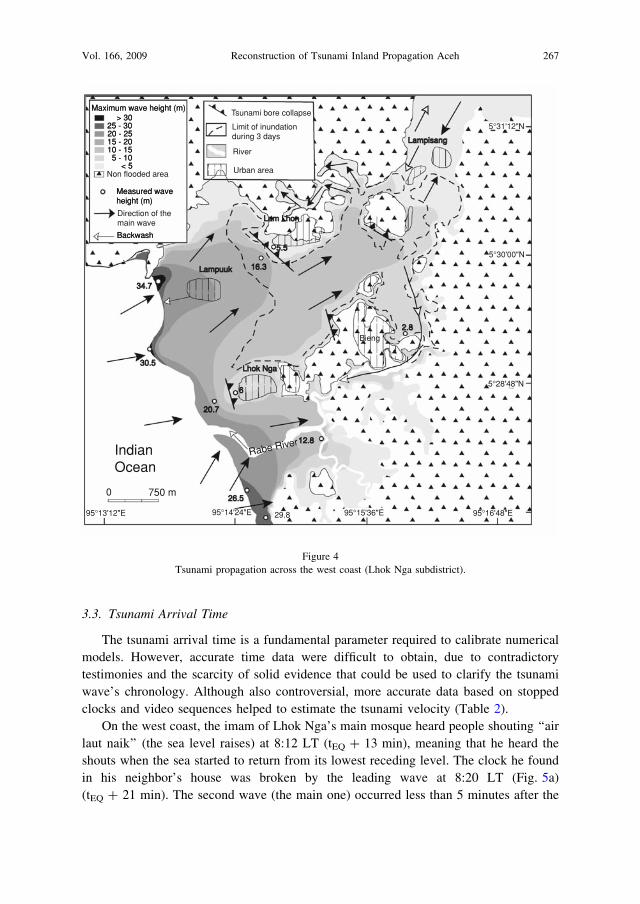
Figure 3
Tsunami propagation across the western part of the Banda Aceh plain.
266 F. Lavigne et al. Pure appl. geophys.,
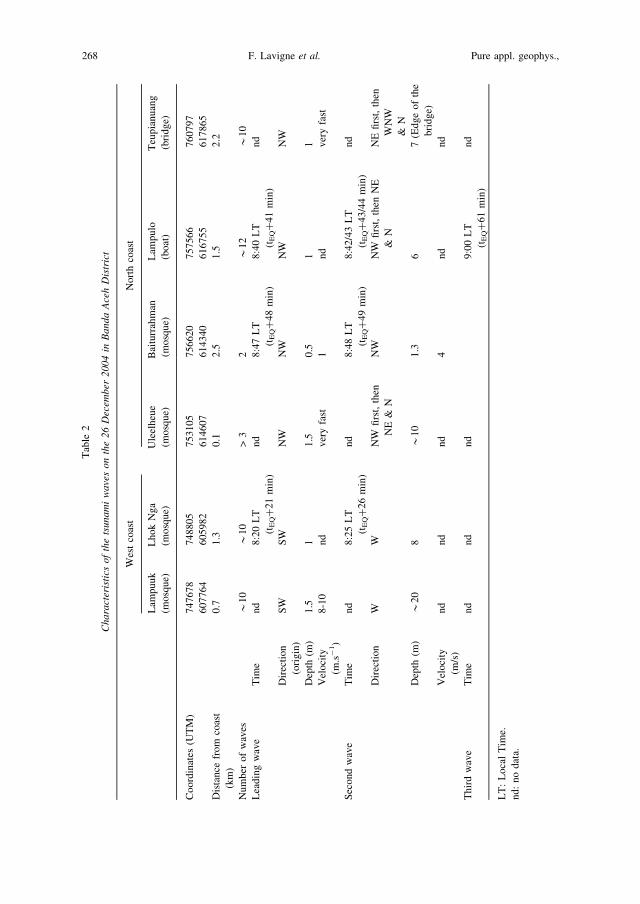
3.3. Tsunami Arrival Time
The tsunami arrival time is a fundamental parameter required to calibrate numerical
models. However, accurate time data were difficult to obtain, due to contradictory
testimonies and the scarcity of solid evidence that could be used to clarify the tsunami
wave’s chronology. Although also controversial, more accurate data based on stopped
clocks and video sequences helped to estimate the tsunami velocity (Table 2).
On the west coast, the imam of Lhok Nga’s main mosque heard people shouting ‘‘air
laut naik’’ (the sea level raises) at 8:12 LT (tEQ ? 13 min), meaning that he heard the
shouts when the sea started to return from its lowest receding level. The clock he found
in his neighbor’s house was broken by the leading wave at 8:20 LT (Fig. 5a)
(tEQ ? 21 min). The second wave (the main one) occurred less than 5 minutes after the
IndianOcean
Rabe River
5°31'12"N
5°30'00"N
5°28'48"N
95°13'12"E 95°14'24"E 95°15'36"E 95°16'48"E
34.7
30.5
29.8
26.5
12.8
2.8
20.7
5.5
16.3
Lam Lhon
Lampuuk
Lhok Nga
Lampisang
> 3025 - 30 20 - 25 15 - 20
< 5 5 - 10 10 - 15
Backwash
Limit of inundation during 3 days
0 750 m
6
Bieng
Maximum wave height (m)
Measured waveheight (m)
> 3025 - 30 20 - 25 15 - 20
< 5 5 - 10 10 - 15
Backwash
Maximum wave height (m)
Measured waveheight (m)
Non flooded area
Direction of themain wave
Urban area
River
Tsunami bore collapse
Figure 4
Tsunami propagation across the west coast (Lhok Nga subdistrict).
Vol. 166, 2009 Reconstruction of Tsunami Inland Propagation Aceh 267
Tab
le2
Cha
ract
eris
tics
of
the
tsun
am
iw
aves
on
the
26
Dec
ember
2004
inB
anda
Ace
hD
istr
ict
Wes
tco
ast
No
rth
coas
t
Lam
pu
uk
(mo
squ
e)
Lh
ok
Ng
a
(mo
squ
e)
Ule
elh
eue
(mo
squ
e)
Bai
turr
ahm
an
(mo
squ
e)
Lam
pu
lo
(bo
at)
Teu
pia
nu
ang
(bri
dg
e)
Co
ord
inat
es(U
TM
)7
47
67
8
60
776
4
74
880
5
60
598
2
75
310
5
61
460
7
75
662
0
61
434
0
75
756
6
61
675
5
76
079
7
61
786
5
Dis
tan
cefr
om
coas
t
(km
)
0.7
1.3
0.1
2.5
1.5
2.2
Nu
mb
ero
fw
aves
*1
0*
10
>3
2*
12
*1
0
Lea
din
gw
ave
Tim
en
d8
:20
LT
(tE
Q?
21
min
)
nd
8:4
7L
T
(tE
Q?
48
min
)
8:4
0L
T
(tE
Q?
41
min
)
nd
Dir
ecti
on
(ori
gin
)
SW
SW
NW
NW
NW
NW
Dep
th(m
)1
.51
1.5
0.5
11
Vel
oci
ty
(m.s
-1)
8-1
0n
dv
ery
fast
1n
dv
ery
fast
Sec
ond
wav
eT
ime
nd
8:2
5L
T
(tE
Q?
26
min
)
nd
8:4
8L
T
(tE
Q?
49
min
)
8:4
2/4
3L
T
(tE
Q?
43
/44
min
)
nd
Dir
ecti
on
WW
NW
firs
t,th
en
NE
&N
NW
NW
firs
t,th
enN
E
&N
NE
firs
t,th
en
WN
W
&N
Dep
th(m
)*
20
8*
10
1.3
67
(Ed
ge
of
the
bri
dg
e)
Vel
oci
ty
(m/s
)
nd
nd
nd
4n
dn
d
Th
ird
wav
eT
ime
nd
nd
nd
9:0
0L
T
(tE
Q?
61
min
)
nd
LT
:L
oca
lT
ime.
nd
:n
od
ata.
268 F. Lavigne et al. Pure appl. geophys.,
first wave (tEQ ? 26 min) at Lampuuk and Lhok Nga, and no backwash was reported
between these two waves at these locations. Although several testimonies reported the
occurrence of a third wave higher than the second one, the exact chronology remains
unclear.
At Lampulo, northeast of Banda Aceh (Fig. 1), a boat can still be found perched on
the roof of a house 1.5 km from the ocean. The leading edge of the tsunami arrived along
the north coast at approximately 8:40 LT. The second wave arrived 2 to 3 minutes after
the leading wave (tEQ ? 42/43 min), and broke two clocks in a house (Fig. 5b). The first
clock originally hung on a wall 2 m above the floor, stopped at 8:44 LT (tEQ ? 45 min),
whereas the second one, hung at 3 m, stopped at 8:49 LT (tEQ ? 50 min). Considering a
minimum flow velocity of 4 m.s-1 calculated by FRITZ et al. (2006) near the great mosque
and at Peukan Bada, the front of the second wave reached the north coast less than 6
minutes before its arrival at the mosque (4 m/s 9 1500 m), i.e. at tEQ ? 39 min or
slightly less. The boat on the roof was carried by the third wave at about 9:00 LT
(tEQ ? 61 min), i.e., about 10 minutes after the second wave. Eyewitnesses at Lampulo
reported that the sea level withdrew by 1 m preceding the arrival of the third wave. This
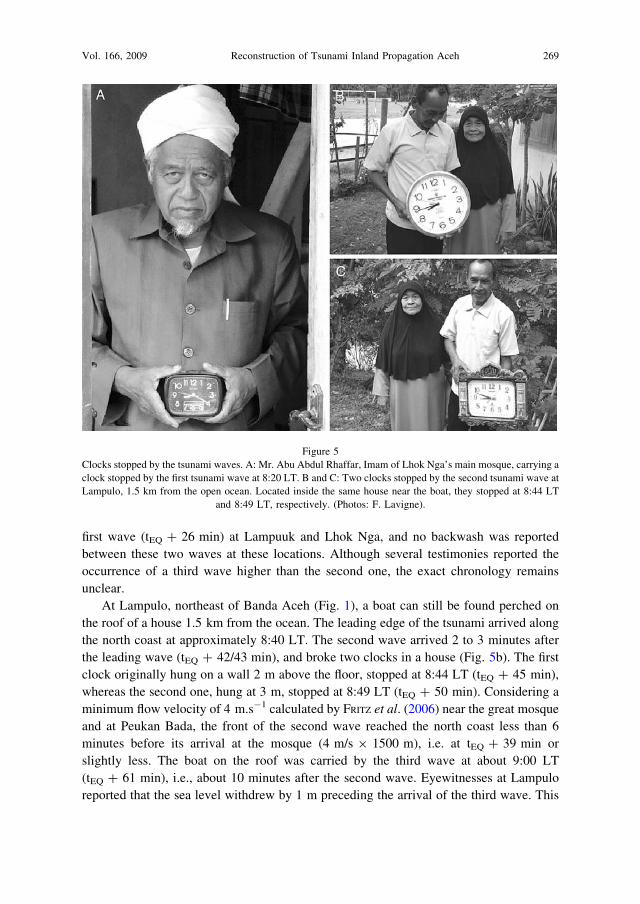
Figure 5
Clocks stopped by the tsunami waves. A: Mr. Abu Abdul Rhaffar, Imam of Lhok Nga’s main mosque, carrying a
clock stopped by the first tsunami wave at 8:20 LT. B and C: Two clocks stopped by the second tsunami wave at
Lampulo, 1.5 km from the open ocean. Located inside the same house near the boat, they stopped at 8:44 LT
and 8:49 LT, respectively. (Photos: F. Lavigne).
Vol. 166, 2009 Reconstruction of Tsunami Inland Propagation Aceh 269
small backwash between the second and the third wave was also observed in other
locations, e.g., north of Cadet (Fig. 2).
At the Baiturrahman mosque in downtown Banda Aceh, the flow velocity of the
leading wave did not exceed 1 m.s-1 (BORRERO, 2005b; FRITZ et al., 2006) due to the
large amount of debris it was transporting. Based on a video frame analysis, the second
tsunami wave arrived at the site only 40 seconds after its leading edge, with a flow
velocity of 4 m.s-1 (FRITZ et al., 2006). Assuming this velocity as constant from the
shore to the mosque on a 2.5-km distance (whereas it was higher than this value), the
second wave should have reached the city center in 10 minutes (4 m.s-1 9 2500 m),
i.e., at tEQ ? 49 min. This arrival time is twice the initial estimation of Borrero (2005b)
who simply reported witness accounts during the immediate aftermath of the disaster.
Such discrepancy underlines that the data obtained through broken clock and videos,
although somewhat controversial, are still more reliable than information obtained by
witnesses.
3.4. Flow Directions
Flow direction data obtained through eyewitness accounts and/or tilted trunks,
pillars, and debris are of primary importance in reconstructing the wave’s origin.
Thus, a detailed analysis of the flow directions may help calibrate the numerical
models.
The leading wave was almost perpendicular to the shore along the west coast,
whereas it reached the northern shore from the northwest with an angle of 45� near the
Aceh River mouth (Fig. 2) and Uleelheue (Fig. 3). The second wave reached Lhok Nga
on the west coast from the southwest at an angle of about 45�. Therefore, its source
may be attributed to the moment peak at about 4� N, rather than to the ones at 7� N and
9� N. This flow was moving as a single and massive tsunami front. On the northern
coast, this front was divided into three segments of different directions, namely WNW,
N and NE. On the eastern part of the Banda Aceh Bay, the northeast wavefront came
first, whereas the northwest one came first at Uleelheue. These three segments of
similar height (see below) probably resulted from the division of the second wave into
separate waves after multiple refraction and diffraction effects near shore around the
islands to the northwest of Banda Aceh (Fig. 1). In addition, some reflection effects
may have enhanced the local effects of the tsunami, as also reported on Babi Island
(Flores) in 1992 (YEH et al., 1994; MINOURA et al., 1997) and at Pangandaran (South
Java) in July 2006 (LAVIGNE et al., 2007). These waves collided with each other a few
kilometers inland in several locations (e.g., at Jambutape, Lampulo, Lamprada,
Lamjame: Fig. 2), as reported by testimonies or evidenced by trunks or pillars that were
tilted in many different directions. The flow moving landward from Lhok Nga on the
west coast interacted with the one moving from Uleelheue at Lampisang (Figs. 3 and
4). Such collision between waves may partly explain the differences in flow depth and
orientations in neighboring areas.
270 F. Lavigne et al. Pure appl. geophys.,
3.5. Runup Heights
The apparent uniformity of the runup as indicated by the trim line (i.e., the upper limit
of vegetation clearing by the tsunami on coastal hill slopes and cliffs) hundreds of
kilometers along the west coast, typically 25 to 35 m, suggests that significant co-seismic
submarine landslides were limited during the great Indian Ocean earthquake. Were this
not the case, extreme runup values should have been locally identified (OKAL and
SYNOLAKIS, 2003, 2004), as recently reported at Nusa Kambangan Island during the 17
July, 2006 tsunami that hit Java (FRITZ et al., 2007). A large mass failure capable of
producing such a large wave has not been found yet for the 2004 tsunami event, even
though marine surveys have taken place in search of such features along Sumatra’s coast.
Local geomorphological configurations of the coastline and/or the seafloor, however,
were responsible for exceptional runup heights along the west coast of the Banda Aceh
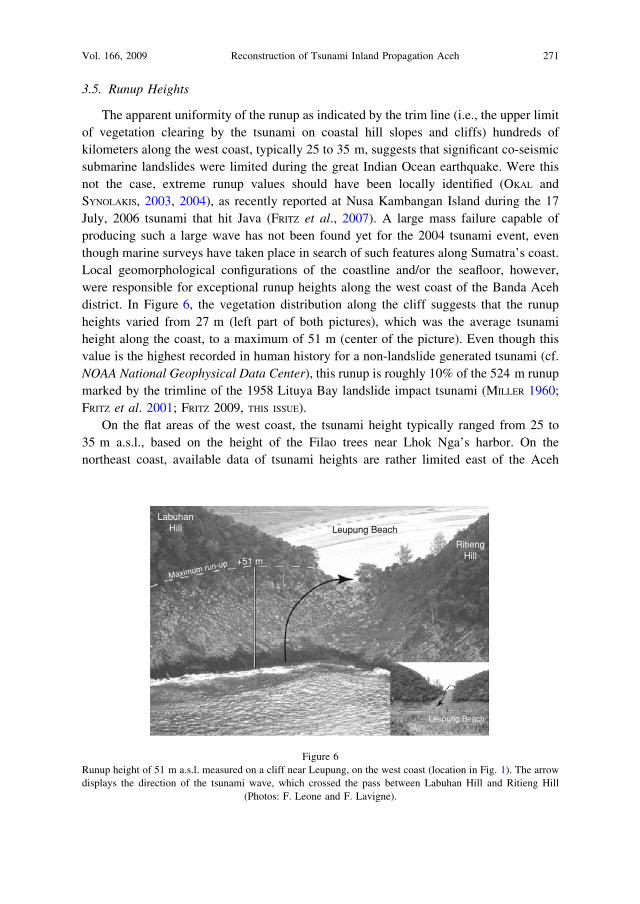
district. In Figure 6, the vegetation distribution along the cliff suggests that the runup
heights varied from 27 m (left part of both pictures), which was the average tsunami
height along the coast, to a maximum of 51 m (center of the picture). Even though this
value is the highest recorded in human history for a non-landslide generated tsunami (cf.
NOAA National Geophysical Data Center), this runup is roughly 10% of the 524 m runup
marked by the trimline of the 1958 Lituya Bay landslide impact tsunami (MILLER 1960;
FRITZ et al. 2001; FRITZ 2009, THIS ISSUE).
On the flat areas of the west coast, the tsunami height typically ranged from 25 to
35 m a.s.l., based on the height of the Filao trees near Lhok Nga’s harbor. On the
northeast coast, available data of tsunami heights are rather limited east of the Aceh
+51 m
Leupung Beach
Leupung Beach
Maximum run-up
RitiengHill
LabuhanHill
Figure 6
Runup height of 51 m a.s.l. measured on a cliff near Leupung, on the west coast (location in Fig. 1). The arrow
displays the direction of the tsunami wave, which crossed the pass between Labuhan Hill and Ritieng Hill
(Photos: F. Leone and F. Lavigne).
Vol. 166, 2009 Reconstruction of Tsunami Inland Propagation Aceh 271
River, due to the lack of remaining trees and buildings. However, several reliable
testimonies reported that the front of the second wave was as high as the coconut trees
close to the shoreline, i.e., about 20 m a.s.l. On the eastern part of the bay, broken
branches of Filao trees on sand dunes indicated runup values up to 22 m a.s.l. At
Uleelheue, the maximum tsunami height did not exceed 13.5 m a.s.l. at the mosque.
3.6. Overland Tsunami Propagation
Landward motion of tsunamis is one of the lesser-known parameters for tsunami
modeling. The rate that wave height and flow depth decrease with distance from the
shoreline is poorly known, as are the factors that may explain the spatial variations of this
rate. A recurrent question for the modellers is: Do the models require any additional basal
friction to account for local topography, vegetation and buildings? Some results of our
field investigations are presented below, which may help to answer this challenging
question.
Before the collapse of the main tsunami bore two or three kilometers inland, the flow
depth progressively decreased at a rate that ranged from 20 cm per 100 m to 60 cm per
100 m. At Lhok Nga on the west coast, this rate reached 50 cm per 100 m along the two
first kilometers inland. Then was half this value across the 2-km long swamp further
inland. On the coast north of Banda Aceh City, the flow depth decreased at various rates,
i.e., 50 to 60 cm per 100 m on the eastern part of the bay (see Fig. 2), 25–30 cm per
100 m in the northeast suburbs of Banda Aceh City (e.g., at Lamparo or Jeulinke, Fig. 2),
and 20 cm per 100 m on the northwest suburbs between Uleelheue and downtown Banda
Aceh.
The above data may help define the role various factors play in controlling the rate at
which flow depth decreases before the tsunami bore collapses.
The maximum rates were calculated at Lhok Nga and on the eastern part of the Banda
Aceh Bay, where the maximum tsunami heights at the coastline were observed. Therefore
the height of the main bore seems to play a key role in this rate, the higher the bore at the
coastline, the higher the rate of decreasing flow depth. Indeed, the increase of flow depth
due to a sudden increase of the nearshore slope (from 0.13% to 1.3% on the last 1.5 km)
causes a drastic reduction of the tsunami velocity. This rapid dissipation of energy as the
wave moves inland has also been inferred from the thickness, mean size, and sorting of
the tsunami deposits in these areas (PARIS et al., 2007a; JAFFE et al., 2006).
The local topography of the shore also played an important role in the landward
reduction of flow depth. Indeed, huge sand dunes help to dissipate the wave’s energy; at
Lhok Nga and on the coast northeast of Banda Aceh, the dunes reaching elevations as
high as 8 m a.s.l have been partly eroded by the tsunami. For an initial depth in excess of
20 m, the decreasing rate of the tsunami is about 50 cm per 100 m when the tsunami
moves across a sand dune field. When the tsunami waves moved across swamps, shrimp
basins or rice fields, the limited roughness of the ground explains lower decreasing rates,
ranging around 20 cm per 100 m.
272 F. Lavigne et al. Pure appl. geophys.,
The role played by human settlements seems to be very limited before the collapse of
the tsunami bore. Along the road between the Uleelheue mosque and downtown Banda
Aceh, where the former traditional villages had previously been transformed into a
residential area including concrete, two-story houses, the tsunami bore moved landward
with a rather constant flow depth. The decreasing rate of flow depth was in the same order
as the one calculated across non-built areas. Artificial dams and fringing reefs were also
inefficient in locally reducing the tsunami velocity and depth (PARIS et al., 2007b).
3.7. Transient Tsunami Bores Formation and Collapse
For the first time since the major tsunamis crossed the Pacific in 1960 and 1964,
the 26 December, 2004 event made it possible to accurately determine the location
where the main tsunami bores collapsed due to the sudden energy dissipation of the
second wave. Data based on field measurements (sudden decrease in flow depth) were
always confirmed by relevant eyewitnesses, who used the Indonesian words ‘‘ombak
pecah’’ (meaning ‘‘wave broke’’) to describe the collapse of the bores. Such data are of
major importance when calibrating the numerical models that utilize this parameter.
Thus far, the bore’s collapse or ‘‘breaking’’ of tsunami waves has been analyzed
mainly through physical modeling in artificial basins or through a mathematical
approach (GRILLI et al., 1997). Our result will allow comparisons between these models
and the 2004 field data.
Everywhere within the studied area, eyewitnesses described the shape of the
propagating bore as similar to ‘‘standing cobra snake,’’ meaning a high standing wave
with vortex. Transient tsunami bores formed between 1.5 to 3 km inland (Figs. 3, 4, and
5). To the east of Banda Aceh Bay (Fig. 2), the bore related to the second wave collapsed
in the rice fields south of the main road 1.7 km to 2 km from the coast line. In the
northeast suburbs of Banda Aceh city, the propagating bore collapsed from 1.5 km, e.g.,
at Lamparo, to 3 km at Jeulinke, where the 7.5 m-high wave ‘‘broke’’ on the commercial
buildings along the road. In the northwest suburbs of Banda Aceh City, the bore related to
the second wave coming from Uleelheue collapsed near the Perusaahan Listrik Negara
(PLN) boat, i.e., about 2.5 km inland from the open ocean. In this place, the flow depth
suddenly diminished from 9–10 m to 1.5–2 m in a few hundred meters (Fig. 3).
The factors that contribute to the formation and disappearance of transient tsunami
bores are difficult to assess. Some bores collapsed on contact with hill slopes. For
example, Figure 5 shows a ‘‘breaking’’ line along the slope of a small hill covered with a
coconut plantation, behind the golf course of Lhok Nga, located 1 km away from the
shore. Due to the bore’s collapse, the village was partially spared. Some survivors had
taken refuge on the roofs of non-flooded houses. Another bore collapsed 2 km away from
Lampuuk beach, at Lam Lhom village (Fig. 4). The flow depth suddenly decreased from
about 16.5 m to 5.5 m over a distance of less than 100 m. Eyewitnesses described a
‘‘breaking wave’’ along a 5-m high palaeoshore covered by a coconut plantation that lies
in front of the village. For the flat areas of the north coast, Figures 2 and 3 show that most
Vol. 166, 2009 Reconstruction of Tsunami Inland Propagation Aceh 273
of the bores collapsed where the flow depth ranges from five to ten meters. This may
indicate a depth/velocity threshold for the destruction of the transient bores.
In addition with the local topographical settings, the collapse of the bores could have
also been caused by the incoming flow interacting with the receding flow. However, the
location of the interacting flows (‘‘air beradu’’ in Indonesian language) reported by
witnesses or enhanced through the flow direction map do not match with those of the
bores’ collapse. Furthermore, based on our field data, the density of human settlements
did not play any role in the bore collapse process.
3.8. Flow Depth after Bores Collapses, Inundation Distance and Duration, and
Backwash
Following the collapse of bores related to the second wave, the flow depth of the
tsunami rapidly decreased. The runout flow spread over Banda Aceh City and its suburbs
through foiled surges, sparing some districts and damaging others. The flow from
Uleelheue encountered the one from Lampulo in the center of the city, where the flow
depth did not exceed 2 m, based on the video recording analysis from FRITZ et al. (2006).
The high density of buildings explains why the flow was reduced within the city. To the
east of the Aceh River, the presence of old beach ridges (or palaeoshores) running
parallel to the current shore drastically reduced both flow depth and velocity of the
second wave. The propagation of the following waves was stopped by the backwash of
the second wave. Therefore, the inundation line did not exceed 2 km inland (Fig. 2). As
for the tsunami wave coming from the west coast, it continued moving inland as far as
6 km, at which point it met the wave coming from the north coast.
On the north coast, the flow started to recede towards the ocean at about noon. At
Kajhu (Fig. 2), the backwash lasted several hours during the first night following the
disaster. The sea withdrawal was not regular, but occurred by steps. The mud lines at
different levels, usually three, in the houses are evidence of periods of stagnant water that
lasted for hours. At Lampulo, the flow depth was still 1 m at 14:30 LT, two and a half
hours after the peak flow of 9 m. Therefore, the average velocity of the drawdown was
about 5.3 cm per minute during this time interval. Closer to the shore, the current
generated by the backwash was reported to be very fast. However, several indications
suggest a laminar receding flow rather than a series of concentrated flows parallel to each
other, including the absence of new gullies or other erosional features created by the
backwash (UMITSU et al., 2007), the lack of sedimentary features of backwash within
the tsunami deposits, as well as several testimonies. Contrarily, at Lampuuk (west coast),
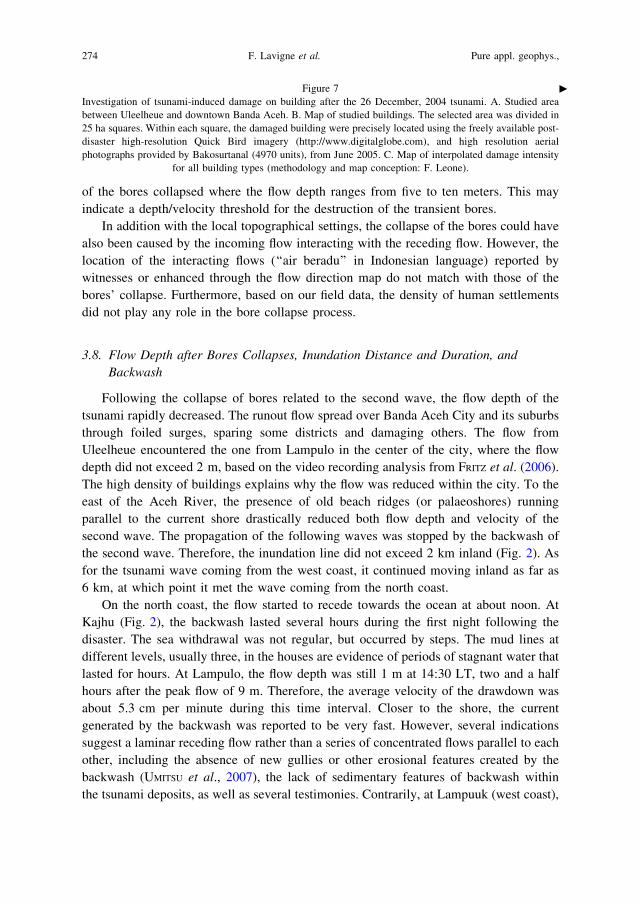
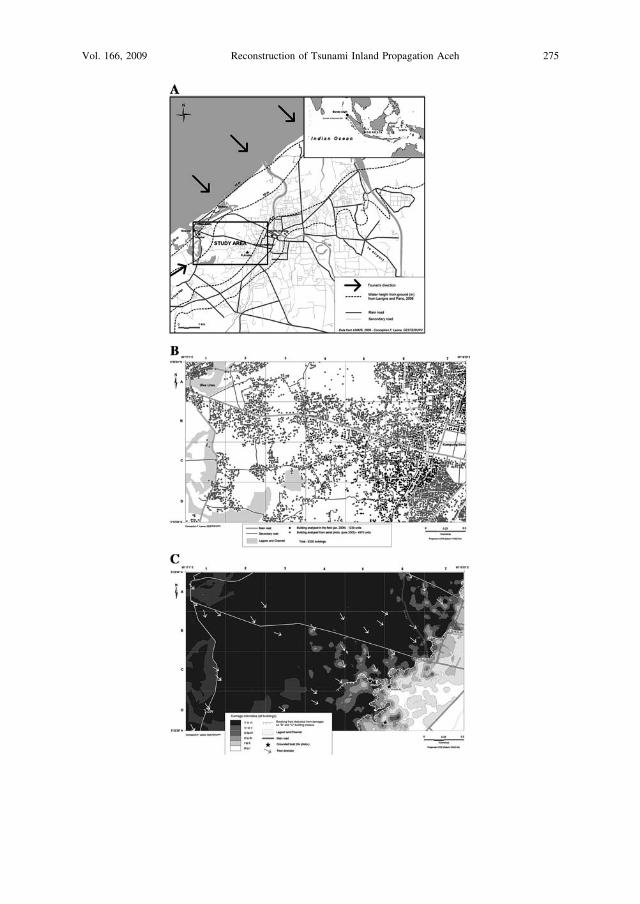
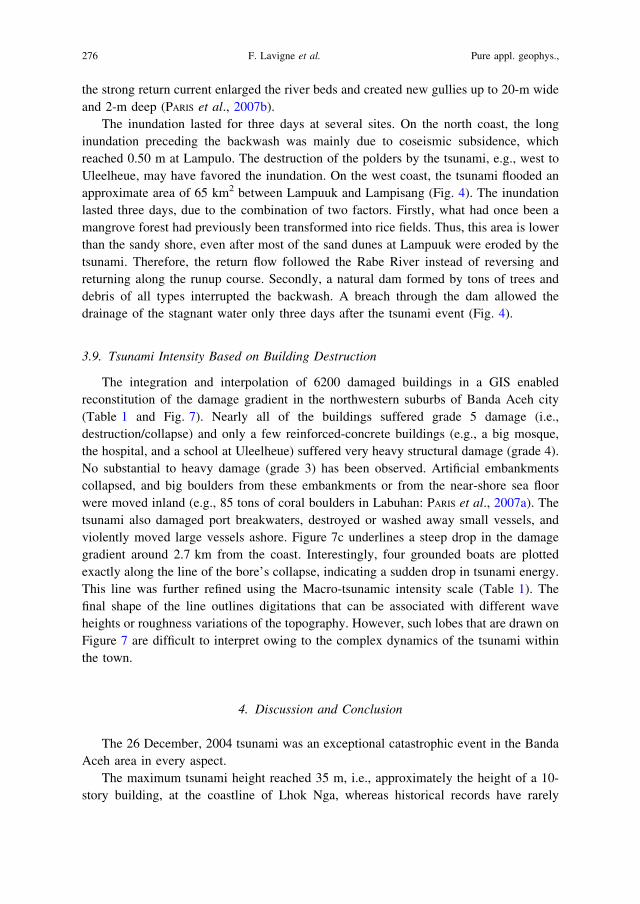
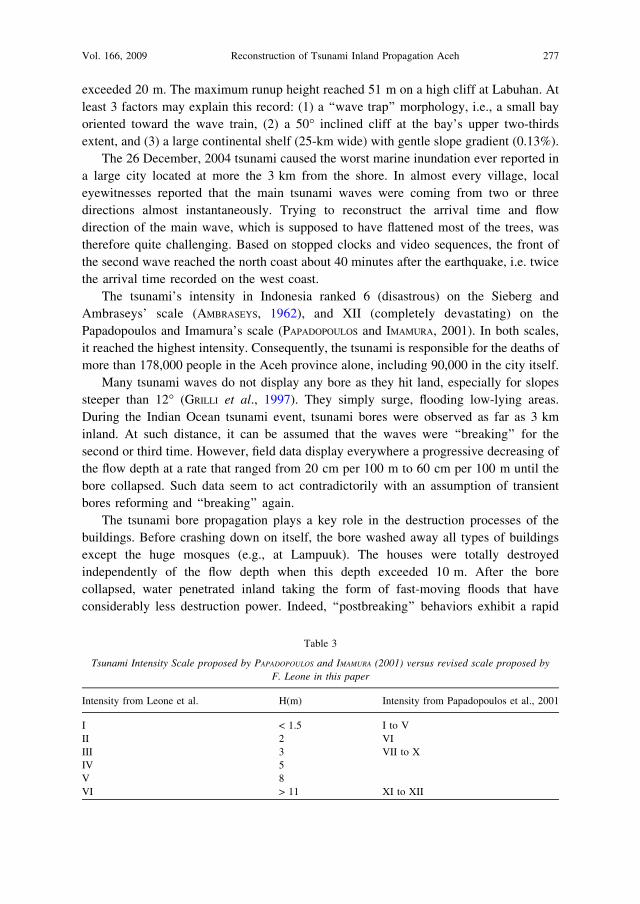
Figure 7
Investigation of tsunami-induced damage on building after the 26 December, 2004 tsunami. A. Studied area
between Uleelheue and downtown Banda Aceh. B. Map of studied buildings. The selected area was divided in
25 ha squares. Within each square, the damaged building were precisely located using the freely available post-
disaster high-resolution Quick Bird imagery (http://www.digitalglobe.com), and high resolution aerial
photographs provided by Bakosurtanal (4970 units), from June 2005. C. Map of interpolated damage intensity
for all building types (methodology and map conception: F. Leone).
c
274 F. Lavigne et al. Pure appl. geophys.,
Vol. 166, 2009 Reconstruction of Tsunami Inland Propagation Aceh 275
the strong return current enlarged the river beds and created new gullies up to 20-m wide
and 2-m deep (PARIS et al., 2007b).
The inundation lasted for three days at several sites. On the north coast, the long
inundation preceding the backwash was mainly due to coseismic subsidence, which
reached 0.50 m at Lampulo. The destruction of the polders by the tsunami, e.g., west to
Uleelheue, may have favored the inundation. On the west coast, the tsunami flooded an
approximate area of 65 km2 between Lampuuk and Lampisang (Fig. 4). The inundation
lasted three days, due to the combination of two factors. Firstly, what had once been a
mangrove forest had previously been transformed into rice fields. Thus, this area is lower
than the sandy shore, even after most of the sand dunes at Lampuuk were eroded by the
tsunami. Therefore, the return flow followed the Rabe River instead of reversing and
returning along the runup course. Secondly, a natural dam formed by tons of trees and
debris of all types interrupted the backwash. A breach through the dam allowed the
drainage of the stagnant water only three days after the tsunami event (Fig. 4).
3.9. Tsunami Intensity Based on Building Destruction
The integration and interpolation of 6200 damaged buildings in a GIS enabled
reconstitution of the damage gradient in the northwestern suburbs of Banda Aceh city
(Table 1 and Fig. 7). Nearly all of the buildings suffered grade 5 damage (i.e.,
destruction/collapse) and only a few reinforced-concrete buildings (e.g., a big mosque,
the hospital, and a school at Uleelheue) suffered very heavy structural damage (grade 4).
No substantial to heavy damage (grade 3) has been observed. Artificial embankments
collapsed, and big boulders from these embankments or from the near-shore sea floor
were moved inland (e.g., 85 tons of coral boulders in Labuhan: PARIS et al., 2007a). The
tsunami also damaged port breakwaters, destroyed or washed away small vessels, and
violently moved large vessels ashore. Figure 7c underlines a steep drop in the damage
gradient around 2.7 km from the coast. Interestingly, four grounded boats are plotted
exactly along the line of the bore’s collapse, indicating a sudden drop in tsunami energy.
This line was further refined using the Macro-tsunamic intensity scale (Table 1). The
final shape of the line outlines digitations that can be associated with different wave
heights or roughness variations of the topography. However, such lobes that are drawn on
Figure 7 are difficult to interpret owing to the complex dynamics of the tsunami within
the town.
4. Discussion and Conclusion
The 26 December, 2004 tsunami was an exceptional catastrophic event in the Banda
Aceh area in every aspect.
The maximum tsunami height reached 35 m, i.e., approximately the height of a 10-
story building, at the coastline of Lhok Nga, whereas historical records have rarely
276 F. Lavigne et al. Pure appl. geophys.,
exceeded 20 m. The maximum runup height reached 51 m on a high cliff at Labuhan. At
least 3 factors may explain this record: (1) a ‘‘wave trap’’ morphology, i.e., a small bay
oriented toward the wave train, (2) a 50� inclined cliff at the bay’s upper two-thirds
extent, and (3) a large continental shelf (25-km wide) with gentle slope gradient (0.13%).
The 26 December, 2004 tsunami caused the worst marine inundation ever reported in
a large city located at more the 3 km from the shore. In almost every village, local
eyewitnesses reported that the main tsunami waves were coming from two or three
directions almost instantaneously. Trying to reconstruct the arrival time and flow
direction of the main wave, which is supposed to have flattened most of the trees, was
therefore quite challenging. Based on stopped clocks and video sequences, the front of
the second wave reached the north coast about 40 minutes after the earthquake, i.e. twice
the arrival time recorded on the west coast.
The tsunami’s intensity in Indonesia ranked 6 (disastrous) on the Sieberg and
Ambraseys’ scale (AMBRASEYS, 1962), and XII (completely devastating) on the
Papadopoulos and Imamura’s scale (PAPADOPOULOS and IMAMURA, 2001). In both scales,
it reached the highest intensity. Consequently, the tsunami is responsible for the deaths of
more than 178,000 people in the Aceh province alone, including 90,000 in the city itself.
Many tsunami waves do not display any bore as they hit land, especially for slopes
steeper than 12� (GRILLI et al., 1997). They simply surge, flooding low-lying areas.
During the Indian Ocean tsunami event, tsunami bores were observed as far as 3 km
inland. At such distance, it can be assumed that the waves were ‘‘breaking’’ for the
second or third time. However, field data display everywhere a progressive decreasing of
the flow depth at a rate that ranged from 20 cm per 100 m to 60 cm per 100 m until the
bore collapsed. Such data seem to act contradictorily with an assumption of transient
bores reforming and ‘‘breaking’’ again.
The tsunami bore propagation plays a key role in the destruction processes of the
buildings. Before crashing down on itself, the bore washed away all types of buildings
except the huge mosques (e.g., at Lampuuk). The houses were totally destroyed
independently of the flow depth when this depth exceeded 10 m. After the bore
collapsed, water penetrated inland taking the form of fast-moving floods that have
considerably less destruction power. Indeed, ‘‘postbreaking’’ behaviors exhibit a rapid
Table 3
Tsunami Intensity Scale proposed by PAPADOPOULOS and IMAMURA (2001) versus revised scale proposed by
F. Leone in this paper
Intensity from Leone et al. H(m) Intensity from Papadopoulos et al., 2001
I < 1.5 I to V
II 2 VI
III 3 VII to X
IV 5
V 8
VI > 11 XI to XII
Vol. 166, 2009 Reconstruction of Tsunami Inland Propagation Aceh 277
(nondissipative) decay associated with a transfer of potential energy into kinetic energy.
Wave velocity decreases in this zone of rapid decay, as previously demonstrated by
GRILLI et al. (1997) through numerical modeling. Thus, the houses were damaged but
not completely swept away after the bores’ collapse. Our field observation on the
aftermath of the July 2006 tsunami event in Java confirmed this affirmation. As the
tsunami wave hit the Batukaras and the Permisan beaches of Java, the flow depth
increased to over 10 meters (LAVIGNE et al., 2007). The houses close to the shore were
completely destroyed, whereas houses were only slightly damaged beyond the line
where the bore collapsed.
Our extensive field work made it possible to construct a tsunami damage intensity
scale based upon quantitative data that includes all building classes and levels of
damage. This scale is named here the ‘‘Macrotsunamic Intensity Scale’’ after the
Macroseismic Intensity Scale of GRUNTHAL (1998). Our results should also enhance the
Tsunami Intensity Scale proposed by PAPADOPOULOS and IMAMURA (2001; Table 3),
which to date has not been calibrated for megatsunami events. In particular, the results
of our comparison between damage gradients and flow depth suggest a need to revise
the definition of the XI level of the PAPADOPOULOS and IMAMURA (2001) scale, which is
the ‘‘devastating’’ level associated with a tsunami height of > 16 m. Indeed, this scale
indicates a damage of grade 5 in many masonry buildings, grade 4 in a few reinforced-
concrete buildings, and grade 3 for most of the other reinforced-concrete buildings. On
the north coast of Banda Aceh City (wave height around 16 m), most all of the
buildings suffered grade 5 damage and only a few reinforced-concrete buildings
suffered grade 4 damage. No grade 3 damage has been observed. Actually, 10 m seems
to be the depth of water where the correlation between water depth and damage levels
breaks down.
The open-source database obtained in the frame of the TSUNARISQUE programme
offers an opportunity for worldwide researchers to better calibrate numerical models.
Data includes high-resolution DEM of near-shore and coastal areas at Banda Aceh and
Lhok Nga, tsunami and runup heights, flow depth, flow directions measured in the field,
chronology of the waves, location of the hydraulic jumps, damage maps using a new
quantitative-based tsunami intensity scale, and additional studies on sediment deposits
previously published (PARIS et al., 2006, 2007). Our field data will provide interesting
challenges for mathematicians and earth scientists, including modeling of transient bore
propagation and collapse, determining the friction and erosion processes of tsunami,
modeling the turbulence, determining the effect of buildings and vegetation on the wave
propagation, etc.
Acknowledgements
This paper is dedicated to the memory of our student and co-author Rino Cahyadi, who
tragically died during a field trip in Thailand in 2007. The first measurements in January
278 F. Lavigne et al. Pure appl. geophys.,
2005 were achieved during the first ITST led by Prof. Tsuji. The following field surveys
were carried out in the frame of the Tsunarisque Programme funded by the French
Delegation Interministerielle pour l’Aide Post-Tsunami (DIPT), the French Embassy in
Indonesia, and the French National Centre for Scientific Research (CNRS – ATIP Pro-
gramme). The authors thank Waluyo, Syahnan, Laurent Mahieu and Nicolas Lespinasse,
who contributed to field data acquisition, Marc Le Moullec and P.T. Enrique in Jakarta
who provided high-resolution aerial photographs of the studied area. We also acknowl-
edge the survivors of the disaster who have provided useful information about the event.
We are also grateful to Chris Thissen for the correction of the English. J.-C. Borrero,
K. Sieh, G. Greene, S. Bondevik, and an anonymous reviewer who provided thoughtful
reviews of the early versions of the manuscript.
REFERENCES
AMBRASEYS, N. N. (1962), Data for the investigation of the seismic sea-waves in the Eastern Mediterranean,
Bull. Seismol. Soc. Am 52, 895–913.
AMMON, C. J., JI, C., THIO, H.-K., ROBINSONS, D., NI, S., HRORLEIFSDOTTIR, V., KANAMORI, H., LAY, T., DAS, S.,
HELMBERGER, D., ICHINOSE, G., POLET, J., and WALD, D. (2005), Rupture Process of the 2004 Sumatra-Andaman
Earthquake, Science 308, 1133–1139.
BORRERO, J.C. (2005a), Field data and satellite imagery of the tsunami effects in Banda Aceh, Science 308, 1596.
BORRERO, J.C. (2005b), Field Survey of Northern Sumatra and Banda Aceh, Indonesia after the Tsunami and
Earthquake of 26 December 2004, Seismol. Res. Lett. 76, 3, 312–320.
BORRERO, J.C., SYNOLAKIS, C.E., and FRITZ, H.M. (2006), Field surveys of northern Sumatra after the tsunami
and earthquake of 26 December 2004, Earthq. Spectra 22, S3, 93–104.
CARRIER, G.F., WU, T.T., and YEH, H. (2003), Tsunami runup and drawdown on a plane beach, J. Fluid Mech.
475, 79–99.
CHLIEH, M., AVOUAC, J.-P., HJORLEIFSDOTTIR, V., SONG, T.-R. A., SIEH, K., SLADEN, A., HEBERT, H. PRAWIRODIRDJO,
L., BOCK, Y., and GALETZKA, J. (2007), Coseismic slip and afterslip of the great (Mw 9.15) Sumatra–Andaman
Earthquake of 2004, Bull. Seismol. Soc. Am 97, 152–173.
ENGDAHL, E.R., VILLASENOR, A., DESHON, H.R., and THURBER, C.H. (2007), Teleseismic relocation and
assessment of seismicity (1918–2005) in the region of the 2004 Mw 9.0 Sumatra–Andaman and 2005 Mw 8.6
Nias Island great earthquakes, Bull. Seismol. Soc. Am. 97, 1A, S43–S61.
FRITZ, H., M., KONGKO, W., MOORE, A., MCADOO, B., GOFF, J., HARBITZ, C., USLU, B., KALLIGERIS, N., SUTEJA,
D., KALSUM, K., TITOV, V., GUSMAN, A., LATIEF, H., SANTOSO, E., SUJOKO, S., DJULKARNAEN, D., SUNENDAR, H.,
and SYNOLAKIS, C. (2007), Extreme runup from the 17 July 2006 Java tsunami, Geophys. Res. Lett. 34,
L12602.
FRITZ, H.M., BORRERO, J.C., SYNOLAKIS, C.E., and YOO, J. (2006), 2004 Indian Ocean tsunami flow velocity
measurements from survivor videos, Geophys. Res. Lett. 33, L24605.
FRITZ, H.M., HAGER, W.H., and MINOR, H.E. (2001), Lituya Bay case: Rockslide impact and wave run-up,
Science of Tsunami Hazards 19, 3–22.
FRITZ, H.M., MOHAMMED Fi, and YOO, Y. (2009), Lituya Bay Landside Impact Generated Mega-Tsunami: 50th
Anniversary, Pure. Appl. Geophys. 166, 1/2 (2009), this issue
FU, G. and SUN, W. (2006), Global co-seismic displacements caused by the 2004 Sumatra-Andaman earthquake
(Mw 9.1), Earth Planets Space 58, 149–152.
GEIST, E.L., TITOV, V.V., ARCAS, D, POLLITZ, F.F., and BILEK S. L. (2007), Implications of the 26 December 2004
Sumatra–Andaman earthquake on tsunami forecast and assessment models for great subduction-zone
earthquakes, Bull. Seismol. Soc. Am. 97, 1A, S249–S270.
GRILLI, S.T., SVENDSEN, I.A., and SUBRAMANYA, R. (1997), Breaking criterion and characteristics for solitary
waves on slopes, J. Waterway Port Coastal and Ocean Engineering 123, 3, 102–112.
Vol. 166, 2009 Reconstruction of Tsunami Inland Propagation Aceh 279
GOTO, C., OGAWA, Y., SHUTO, N., and IMAMURA, N., Numerical method of tsunami simulation with the leap-frog
scheme (IUGG/IOC Time Project) (IOC Manual, UNESCO, New York 1997)
HEBERT, H., HEINRICH, P, SCHINDELE, F., and PIATANESI, A. (2001), Far-field simulation of tsunami propagation in
the Pacific Ocean: Impact on the Marquesas Islands (French Polynesia), J. Geophys. Res. 106, C5, 9161–
9177.
HEBERT. H., SLADEN A., and SCHINDELE, F. (2007), Numerical Modeling of the Great 2004 Indian Ocean
Tsunami: Focus on the Mascarene Islands, Bull. Seismol. Soc. Am. 97, 1A, S208–S222.
HEINRICH, P., SCHINDELE, F., GUIBOURG, S., and IHMLE, P.F. (1998), Modeling of the February 1996 Peruvian
tsunami, Geophys. Res. Lett. 25, 2687–2690.
IMAMURA, F., and SHUTO, N., Tsunami propagation by use of numerical dispersion. In Proceedings, International
Symposium Comp. Fluid Dynamics (Nagoya, 1990) pp. 390–395.
INOUYE, W. (1934), On sound phenomena of the Sanriku earthquake of March 3rd, 1933, Bull. Earthq. Res.
Instit. Extra 1, 77–86 (in Japanese).
JAFFE, B.E., BORRERO, J.-C., PRASETYA, G.S., PETERS, R., MCADOO, B., GELFENBAUM, G., MORTON, R., RUGGIERO,
P., HIGMAN, B., DENGLER, L., HIDAYAT, R., KINGSLEY, E., KONGKO W., LUKIJANTO, and MOORE A. (2006),
Northwest Sumatra and Offshore Islands field survey after the December 2004 Indian Ocean Tsunami.
Earthquake Spectra 22, S3, S105-S135.
KATO, K. and TSUJI, Y. (1995), Tsunami of the Sumba earthquake of August 19, 1977, J. Natural Disaster Sci. 17,
2, 87–100.
KIRBY, J.T. (2003), Boussinesq models and applications to nearshore wave propagation, surf-zone processes and
wave-induced currents. In Lakhan V.C., ed., Advances in Coastal Engineering, (Elsevier, 2003) pp. 1–41.
KITAGAWA, M., KOIZUMI, Y., TAKAHASHI, M., MATSUMOTO, N., and SATO, T. (2006), Changes in groundwater
levels or pressures associated with the 2004 Earthquake off the west coast of northern Sumatra (M9.0), Earth
Planets Space 58, 173–179.
LAVIGNE, F., PARIS, R., WASSMER, P., GOMEZ, C., BRUNSTEIN, D., GRANCHER, D., VAUTIER, F., SARTOHADI, J.,
SETIAWAN, A., SYAHNAN, GUNAWAN, T., FACHRIZAL, WALUYO, B., MARDIATNO, D., WIDAGDO, A., CAHYADI, R.,
LESPINASSE, N., and MAHIEU, L. (2006), Learning from a major disaster (Banda Aceh, December 26th,
2004): A methodology to calibrate simulation codes for tsunami inundation models, Zeitschrift fur
Geomorphologie N.F., Suppl. 146, 253–265.
LAVIGNE, F., GOMEZ, C., GIFFO, M., WASSMER, P., HOEBRECK, C., MARDIATNO, D., PRIOYONO, J., and PARIS, R.
(2007), Field observations of the 17th July 2006 Tsunami in Java, Nat. Hazard and Earth Sci. Syst. 7, 177–
183.
LAY, T., KANAMORI, H., AMMON, C.J., NETTLES, M., WARD, S.N., ASTER, R.C., BECK, S.L., BILEK, S.L., BRUDZINSKI,
M.R., BUTLER, R., DESHON, H.R., EKSTROM, G., SAKATE, K., and SIPKIN, S. (2005), The great Sumatra-Andaman
earthquake of 26 December 2004, Science 308, 1127–1133.
MELTZNER, A.J., SIEH, K., ABRAMS, M., AGNEW, D.-C., HUDNUT, K.-W., AVOUAC, J.-P., and NATAWIDJAJA, D. H.
(2006), Uplift and subsidence associated with the great Aceh-Andaman earthquake of 2004, J. Geophys. Res.
111, B02407, doi:10, 1029/2005JB003891.
MILLER, D.J. (1960), Giant waves in Lituya Bay, Alaska. U.S. Geological Survey Professional Paper 354C, 51–
83.
MINOURA, K., IMAMURA, F., TAKAHASHI, T., and SHUTO, N. (1997), Sequence of sedimentation processes caused by
the 1992 Flores tsunami: Evidence from Babi Island, Geology 25, 6, 523–526.
OKAL, E.A., and SYNOLAKIS, C.E. (2003), Theoretical comparison of tsunamis from dislocations and landslides,
Pure Appl. Geophys. 160, 2177–2188.
OKAL, E.A., and SYNOLAKIS, C.E. (2004), Source discriminants for near-field tsunamis, Geophysical Journal
International 158, 899–912.
OKAL, E A., DENGLER, L., ARAYA, S., BORRERO, J.C., GOMER, B., KOSHIMURA, S., LAOS, G., OLCESE, D., ORTIZ, M.,
SWENSSON, M., TITOV, V.V., and VEGAS, F. (2002), A field survey of the Camana, Peru tsunami of June 23,
2001, Seismol. Res. Lett. 73, 904–917.
PAPADOPOULOS, G.A. and IMAMURA, F., A proposal for a new tsunami intensity scale. In Proc. Internat. Tsunami
Conf. 7–9 August 2001 (Seattle 2001) pp. 569 - 577.
PARIS, R., LAVIGNE, F., WASSMER, P., and SARTOHADI, J. (2007a), Coastal sedimentation associated with the
December 26, 2004 tsunami in Lhok Nga, West Banda Aceh (Sumatra, Indonesia), Marine Geology 238, 93–
106.
280 F. Lavigne et al. Pure appl. geophys.,
PARIS, R., WASSMER, P., SARTOHADI, J., LAVIGNE, F., BARTHOMEUF, B., DESGAGES, E., GRANCHER, D., BAUMER, P.,
VAUTIER, F., BRUNSTEIN, D., and GOMEZ, C. (2007b), Tsunamis as geomorphic crisis: Lessons from the
December 26, 2004 tsunami in Lhok Nga, West Banda Aceh (Sumatra, Indonesia), Geomorphology (in
press).
SHUTO, N., A natural warning of tsunami arrival. In Perspectives on Tsunami Hazard Reduction, Observation
Theory and Planning, Advances in Natural and Technological Hazards Research (ed. Hebenstreit G. T.)
(Springer, 1997) pp. 157–173.
STEIN, S. and OKAL, E. (2005), Speed and size of the Sumatra earthquake, Nature 434, 581–582.
SYNOLAKIS, C.E. (1987), The runup of solitary waves, J. Fluid Mech. 185, 523–545.
SYNOLAKIS, C.E., OKAL, E.A., and BERNARD, E.N. (2005), The Megatsunami of December 26 2004, The Bridge
35, 2, 26–35.
TADEPALLI, S. and SYNOLAKIS, C.E. (1996), Model for the leading waves of tsunamis, Phys. Rev. Lett. 77, 2141–
2145.
TITOV, V.V., and SYNOLAKIS, C.E. (1998), Numerical modeling of tidal wave runup, J. Waterways, Port, Coastal
and Ocean Engin., ASCE 124, 4, 157–171.
TITOV, V.V., ARCAS, D., KANOGLU, U., NEWMAN, J., and GONZALEZ, F.I. (2004), Inundation modeling for
probabilistic tsunami hazard assessment, EOS Trans. AGU 85, 47, Fall Meeting Suppl., Abstract OS23D–
1340.
TSUJI, Y., IMAMURA, H., MATSUTOMI, H., SYNOLAKIS, C.E., NANANG, P.T., JUMADI, HARADA, S., HAN, S.S, ARAI, K.,
and COOK, B. (1995), Field survey of the east Java earthquake and tsunami of June 3, 1994, Pure Appl.
Geophys. 144, 3–4, 839–854.
TSUJI, Y., TANIOKA, Y., MATSUTOMI, H., NISHIMURA, Y., KAMATAKI, T., MURAKAMI, Y., SAKAKIYAMA, T., MOORE, A.,
GELFENBAUM, G., NUGROHO, S., WALUYO, B., SUKANTA, I., TRIYONO, R., and NAMEGAYA, Y. (2006), Damage and
height distribution of Sumatra earthquake-tsunami of December 26, 2004, in Banda Aceh City and its
environs, J. Disaster Res. 1, 1, 103–115.
UMITSU, M., TANAVUD, C., and PATANAKANOG, T. (2007), Effects of Landforms on Tsunami Flow in the Plains of
Banda Aceh, Indonesia, and Nam Khem, Thailand, Marine Geology (in press).
VALLEE, M. (2007), Rupture properties of the giant Sumatra earthquake imaged by empirical Green’s function
analysis, Bull. Seismol. Soc. Am. 97, S103–S114.
WONG, F.L., GEIST, E.L., and VENTURATO, A., J., Probabilistic Tsunami Hazard Maps and GIS. In Proc. 2005
ESRI Internat. User Conf., (San Diego California, July 2005), 11 pp.
YALCINER, A.C., PERINCEK, D., ERSOY, S., PRESATEYA, G.S., HIDAYAT, R., and MCADOO, B. (2005), December 26,
2004 Indian Ocean Tsunami field survey (Jan. 21–31, 2005) at north of Sumatra Island, http://
yalciner.ce.metu.edu.tr/sumatra/survey/
YEH, H., LIU, P.L.F., BRIGGS, M., and SYNOLAKIS, C.E., (1994), Tsunami catastrophe in Babi Island, Nature, 372,
6503–6508.
(Received January 20, 2001, accepted September 17, 2008)
Published Online First: February 13, 2009
To access this journal online:
www.birkhauser.ch/pageoph
Vol. 166, 2009 Reconstruction of Tsunami Inland Propagation Aceh 281
Related Documents