Planetary and Space Science 53 (2005) 237–243 Reconstruction of the magnetotail current sheet structure using multi-point Cluster measurements A. Runov a, , V.A. Sergeev b , R. Nakamura a , W. Baumjohann a , T.L. Zhang a , Y. Asano a , M. Volwerk a,c , Z. Vo¨ro¨s a , A. Balogh d , H. Re`me e a Institut fu¨r Weltraumforschung, A-8042 Graz, Austria b Institute of Physics, St. Petersburg University, 188504 St. Petersburg, Russia c MPE, 85741 Garching, Germany d Imperial College, London, SW7 2AZ, UK e CESR, Toulouse Cedex 4, France Accepted 12 September 2004 Abstract In this paper we analyze the vertical structure of the magnetotail current sheet for a few intervals during which Cluster repeatedly crosses the neutral sheet due to fast flapping motion. They include fast flows with episodes of flow reversals. The curl, gradient and divergence of the magnetic field are estimated using linear gradient/curl estimator techniques. The reconstruction of the electric current and magnetic field profiles are performed by integration of the estimated gradient scales. We found examples of thin current sheets, (half-thickness of 1000 km) with the current density maximum at the magnetic equator ðB x ¼ 0Þ; as well as examples of off- center or bifurcated current sheets. r 2004 Elsevier Ltd. All rights reserved. Keywords: Magnetospheric tail; Neutral sheet; Current sheet; Bursty bulk flow 1. Introduction The magnetotail current sheet structure was exten- sively studied since the beginning of the satellite era (Behannon, 1970; Fairfield, 1979). The current sheet, generally, contains a dawn–dusk electric current with maximum intensity at the magnetic equator ðB x ¼ 0Þ and a spatial distribution well approximated by the Harris (1962) solution. At the same time, case studies of rapid multiple neutral sheet crossing by a single space- craft (Fairfield et al., 1981; Sergeev et al., 1998) and the studies using the ISEE-1/2 dual spacecraft system (McComas et al., 1986; Sergeev et al., 1993; Sanny et al., 1994) showed that the particular structure of the current sheet varies from case to case and depends on the activity of interplanetary medium and the magneto- sphere. Investigations by the Geotail spacecraft also showed that the current structure is highly variable and may essentially differ from a Harris-type equilibrium picture (Hoshino et al., 1996; Asano et al., 2003, 2004). Similar results were obtained recently from the analysis of multi-spacecraft data from Cluster (Nakamura et al., 2002; Volwerk et al., 2003; Runov et al., 2003a; Sergeev et al., 2003). The tetrahedron configuration of the Cluster space- craft constellation allows to calculate spatial gradients of the magnetic field and their scales in a local normal coordinate system and reconstruct the electric current profile. During the 2001 tail season Cluster’s apogee (of 19 R E ) traversed the magnetotail from the post-mid- night to pre-midnight sector. The average distance between the Cluster tetrahedron barycenter and the ARTICLE IN PRESS www.elsevier.com/locate/pss 0032-0633/$ - see front matter r 2004 Elsevier Ltd. All rights reserved. doi:10.1016/j.pss.2004.09.049 Corresponding author. Tel.: +43 316 4120 572; fax: +43 316 4120 590. E-mail address: [email protected] (A. Runov).

Welcome message from author
This document is posted to help you gain knowledge. Please leave a comment to let me know what you think about it! Share it to your friends and learn new things together.
Transcript

ARTICLE IN PRESS
0032-0633/$ - se
doi:10.1016/j.ps
�Correspondfax: +43316 41
E-mail addr
Planetary and Space Science 53 (2005) 237–243
www.elsevier.com/locate/pss
Reconstruction of the magnetotail current sheet structure usingmulti-point Cluster measurements
A. Runova,�, V.A. Sergeevb, R. Nakamuraa, W. Baumjohanna, T.L. Zhanga,Y. Asanoa, M. Volwerka,c, Z. Vorosa, A. Baloghd, H. Remee
aInstitut fur Weltraumforschung, A-8042 Graz, AustriabInstitute of Physics, St. Petersburg University, 188504 St. Petersburg, Russia
cMPE, 85741 Garching, GermanydImperial College, London, SW7 2AZ, UK
eCESR, Toulouse Cedex 4, France
Accepted 12 September 2004
Abstract
In this paper we analyze the vertical structure of the magnetotail current sheet for a few intervals during which Cluster repeatedly
crosses the neutral sheet due to fast flapping motion. They include fast flows with episodes of flow reversals. The curl, gradient and
divergence of the magnetic field are estimated using linear gradient/curl estimator techniques. The reconstruction of the electric
current and magnetic field profiles are performed by integration of the estimated gradient scales. We found examples of thin current
sheets, (half-thickness of 1000 km) with the current density maximum at the magnetic equator ðBx ¼ 0Þ; as well as examples of off-center or bifurcated current sheets.
r 2004 Elsevier Ltd. All rights reserved.
Keywords: Magnetospheric tail; Neutral sheet; Current sheet; Bursty bulk flow
1. Introduction
The magnetotail current sheet structure was exten-sively studied since the beginning of the satellite era(Behannon, 1970; Fairfield, 1979). The current sheet,generally, contains a dawn–dusk electric current withmaximum intensity at the magnetic equator ðBx ¼ 0Þand a spatial distribution well approximated by theHarris (1962) solution. At the same time, case studies ofrapid multiple neutral sheet crossing by a single space-craft (Fairfield et al., 1981; Sergeev et al., 1998) and thestudies using the ISEE-1/2 dual spacecraft system(McComas et al., 1986; Sergeev et al., 1993; Sanny etal., 1994) showed that the particular structure of the
e front matter r 2004 Elsevier Ltd. All rights reserved.
s.2004.09.049
ing author. Tel.: +43316 4120 572;
20 590.
ess: [email protected] (A. Runov).
current sheet varies from case to case and depends onthe activity of interplanetary medium and the magneto-sphere. Investigations by the Geotail spacecraft alsoshowed that the current structure is highly variable andmay essentially differ from a Harris-type equilibriumpicture (Hoshino et al., 1996; Asano et al., 2003, 2004).Similar results were obtained recently from the analysisof multi-spacecraft data from Cluster (Nakamura et al.,2002; Volwerk et al., 2003; Runov et al., 2003a; Sergeevet al., 2003).The tetrahedron configuration of the Cluster space-
craft constellation allows to calculate spatial gradientsof the magnetic field and their scales in a local normalcoordinate system and reconstruct the electric currentprofile. During the 2001 tail season Cluster’s apogee (of19 RE) traversed the magnetotail from the post-mid-night to pre-midnight sector. The average distancebetween the Cluster tetrahedron barycenter and the

ARTICLE IN PRESSA. Runov et al. / Planetary and Space Science 53 (2005) 237–243238
nodes was X500 km; and the maximum interspacecraftseparation was of 1800 km. These values give the rangeof spatial structure scales which may be resolved usingfour-point measurements.We analyze the structure of the current sheet during
several intervals of intensive flapping. All of them areactive-time intervals with high-speed plasma flowreversals. The aim of these studies is to probe thecurrent sheet structure on different stages of flowreversals to estimate characteristic scales of the currentlayers, their stability, and characteristic times of change.
2. The method
The technique of current sheet spatial profile recon-struction is based on a concept of reciprocal vectorscalculation and linear gradient estimation (Chanteur,1998). Spatial structures with a characteristic scale lessthan � 500 km (typical distance between the Clustertetrahedron barycenter and nodes) cannot be resolvedusing this technique. An application of the method for4-point magnetic field measurements results in a timeseries of the magnetic field gradient and curl compo-nents and the magnetic field divergence at the Clusterbarycenter. 1-s averaged data are used for this calcula-tion.Reconstruction of the spatial profile of the magnetic
field and the electric current in the time varying plasmasheet can be done if spacecraft repeatedly cross thecurrent sheet. Such crossings should be fast enough tobe sure that the parameters of the sheet and itsorientation remain the same within the crossing. Thisoccurs during large amplitude vertical oscillation of thecurrent sheet (flapping). For the presented studies weselect several repeating crossings with a characteristicduration 30ptp120 s and a jump of Bx exceeding15 nT. It is assumed that in such cases the minimumvariance analysis (MVA) and multi-point timing (Har-vey, 1998) are applicable to determine the local normalcoordinate system. The lag time between the Clustertetrahedron nodes is determined from the maximum inthe cross-correlation of the Ba
x; a ¼ 1; . . . ; 4 (Volwerk etal., 2004). The 22Hz resolution data from Cluster/FGM(Balogh et al., 2001) are used for the MVA/timinganalysis.Usually, for rapid magnetotail current sheet crossings
the direction of the maximum variance component Bl israther close to Bx and well defined. But minimum andintermediate variance component Bn and Bm are notwell defined (Zhang et al., 2004). We use in our analysisthe normal vector components in GSM coordinatesystem N ¼ ½Nx;Ny;Nz�; resulting from the timinganalysis, to calculate a normal gradient @Bl=@n ’
@Bx=@n; where n is a coordinate along the normal. It isassumed that the current sheet is a plane boundary on
the scale of the tetrahedron. It is incorrect if the shape ofthe variation is different for different spacecraft. TheMVA is applied for the normal determination for suchcases. Using this estimate we integrate the normalgradient length as a function of time over eachparticular crossing to obtain an effective vertical scaleZ� ¼
R t1t0
@Bl=@t½@Bl=@n�1 dt; where t0 and t1 are timesof start and end of the crossing, respectively, @n ismeasured in 103 km: Z� ¼ 0 where Bl ¼ 0: The integra-tion is done with 1 s steps.In the normal fl;m; ng coordinate system the cross-tail
component of the current density is jm ¼ @Bl=@n
@Bn=@l: According to our selection criteria dBx415 nT;dBy and dBz are, usually,pdBx; and because of Bl ’ Bx
it may be simply written as jm ’ @Bx=@n: Thus, plottingjm and Bx versus Z� we obtain the reconstructed profilesof the cross-tail current density and the maximal varyingmagnetic field component in the current sheet.
3. Case studies
3.1. October 1, 2001
The first selected example was observed by Cluster onOctober 1, 2001, during a storm-time substorm of0935–0955UT. A negative bay of about 900 nT (notshown) was detected by Alaska magnetometer chain.Cluster was located at ½16:5; 8:0; 0:5� RE (GSM).Fig. 1 shows GSM components of the magnetic field
from Cluster/FGM, measured by s/c 1 (most northernone) and s/c 3 (most southern one), GSM components ofthe current density j ¼ m10 r B; calculated using linearcurl estimator technique (Chanteur, 1998), and the X-component of the proton bulk velocity from Cluster/CIS-CODIF (Reme et al., 2001), measured by the samepair of spacecraft.An intensive vertical motion of the current sheet,
resulting in large-amplitude variations of Bx (Fig. 1,upper panel), starts at 0937UT together with fastð4500 km=sÞ ion flow which reverses from tailward toEarthward. The Hþ density and energy (not shown)vary from 0.3 to 0:02 cm3 and from � 104 to 500 eVduring the flow reversal. Due to the flapping motion theCluster tetrahedron scans the current sheet from 30 to30 nT; which allows to reconstruct the perfect profileof the magnetic field and current density. Five intervals,labelled as A, B, C, D and E, with 11 crossings areselected for the analysis.The results of the normal vector determination and
calculated relative magnetic field divergence for theintervals A, B, C and D are presented in Table 1. Herewe introduce the notation X u for the crossings,corresponding to upward motion of the current sheetor, the same, a jump of Bx from positive values tonegative ones. Vice versa, Xd denotes downward motion

ARTICLE IN PRESS
Table 1
GSM components of normal, the mean value of D ¼ jr � Bj=jr Bj
ratio and the standard deviation of this value of s½D� for intervals A, B,
C, and D October 1, 2001
Nx Ny Nz D (%) s½D�
Au 0.234 0.821 0.521 12.6 10.1
Ad 0.078 0.895 0.439 31.6 25.6
Bu 0.179 0.765 0.619 21.3 24.8
Bd 0.190 0.952 0.241 10.4 10.3
Cu 0.328 0.427 0.842 20.0 10.1
Cd 0.337 0.070 0.939 13.1 10.2
Dd 0.097 0.712 0.695 23.2 17.5
0936UT
20
0
-20Bx,
nT
20
0
-20
20
0
-20
20
0
-20
500
0
-500Vp x
, km
/sB
z, n
TB
y, n
Tj,
nA
/m2
A B C D E
09540951094809450942 0939
Fig. 1. From top to bottom: GSM components of the magnetic field
from Cluster/FGM (s/c 1—solid line, s/c 3—dotted line), GSM
components of the current density ( jx—thin line, jy—thick gray line
and jz—dotted line), and the X-component of proton bulk velocity
from Cluster/CIS-CODIF (s/c 1—solid line, s/c 3—dotted line).
0
5
10
15
20
25
30
35
-4 -3 -2 -1 0 1 2 3 4
-30
-20
-10
0
10
20
30
Z*, 1000 km
J m,
nA
/m2
BI,
nT
AuAdBuBd
CdDu
Cu
Fig. 2. Reconstructed profiles of the cross-tail current density jm
(upper panel) and maximal variance magnetic field component Bl
(bottom panel) for intervals A, B, C and D.
A. Runov et al. / Planetary and Space Science 53 (2005) 237–243 239
of the sheet. All GSM normal components, except theDd; result from the multi-point timing analysis. Thenormal for Dd is obtained from the MVA. 22Hzresolution FGM data are used for both analysis. Theresults show a high (up to 751) inclination of the normalvector in the Y–ZGSM plane for the intervals A, B and D.Moreover, the timing shows that the magnetic fieldvariations during intervals A and B are caused by kink-like wave (or waves) travelling in þY direction
(duskward). The characteristic period of the wave isabout 70–90 s and the velocity of 150–200 km/s. Similarresults were obtained by Runov et al. (2003a) andSergeev et al. (2003). More detailed investigations of thefast flapping waves have been done by Sergeev et al.(2004) From the analysis it is difficult to concludewhether the variations A and B are generated by thesame wave object or by a set of different kink-typetransients.Spatial profiles reconstructed from the magnetic field
data for intervals A–D are shown in Fig. 2. During theseintervals the current sheet has a coherent structure witha half-thickness of 1000 km and maximal current densityof 25–30 nA=m2: Particular profiles of jm; especially forthe Bd and Cu crossings, look as multi-peak or finestructured within 500pZ�p500 km; but the accuracyof linear approach (see the relative magnetic fielddivergence in Table 1) does not allow to interpret theseparticularities as a bifurcation or as other features of thecurrent density distribution. The cross-current densityduring intervals A–D has, more likely, a single-peakprofile. The Bl-component changes from –20 to 20 nT
ARTICLE IN PRESSA. Runov et al. / Planetary and Space Science 53 (2005) 237–243240
within � 2000 km; which is about of the Clustermaximal separation. This result may be verified by avisual inspection of the Bx time history plot (Fig. 1) atthe beginning of interval A.The interval E was investigated by Runov et al.
(2003b). They showed that during this interval thecurrent sheet normal direction was close to ZGSM: Fig. 3shows the reconstructed profiles of jm and Bl for fourcrossings during this interval. The reconstruction showsthat the normal gradient of Bl is larger for crossing E2,corresponding to the interval in between tailward andEarthward ion flows, than for other crossings, corre-sponding to high speed flows, which is in agreement withthe cartoon of the X-line structure (Runov et al., 2003b).
3.2. October 11, 2001
The next example was observed on 0325–0345UT,October 11, 2001. Cluster was located at ½15:7;10:5; 2:5� RE : The ground-based and geostationarymagnetometers measurements show geomagnetic dis-turbances around footprint of the Cluster spacecraft(Cully et al., unpublished). A clear negative deflection
-4 -3 -2 -1 0 1 2 3 4Z*, 1000 km
2
6
10
14
18
-10
0
10
20
30
J m,
nA
/m2
BI,
nT
E1
E2 E3 E4
E1
E2
E3
E4
Fig. 3. The same as in Fig. 2 for interval E.
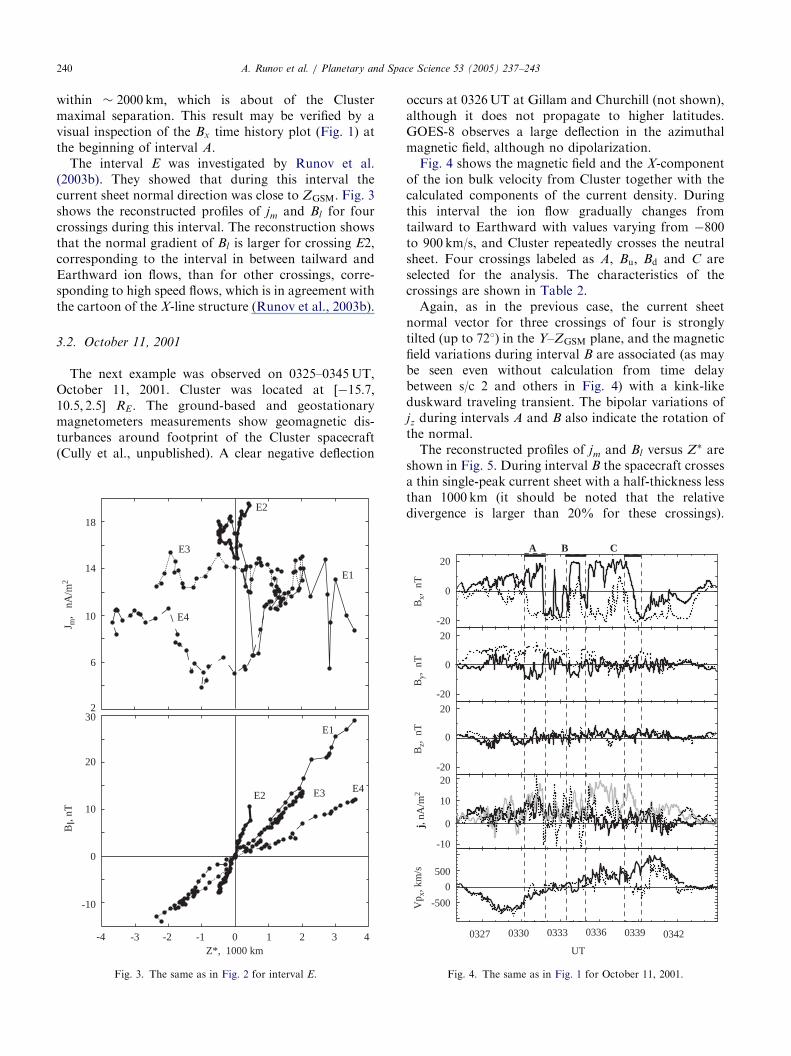
occurs at 0326UT at Gillam and Churchill (not shown),although it does not propagate to higher latitudes.GOES-8 observes a large deflection in the azimuthalmagnetic field, although no dipolarization.Fig. 4 shows the magnetic field and the X-component
of the ion bulk velocity from Cluster together with thecalculated components of the current density. Duringthis interval the ion flow gradually changes fromtailward to Earthward with values varying from 800to 900 km/s, and Cluster repeatedly crosses the neutralsheet. Four crossings labeled as A, Bu; Bd and C areselected for the analysis. The characteristics of thecrossings are shown in Table 2.Again, as in the previous case, the current sheet
normal vector for three crossings of four is stronglytilted (up to 721) in the Y–ZGSM plane, and the magneticfield variations during interval B are associated (as maybe seen even without calculation from time delaybetween s/c 2 and others in Fig. 4) with a kink-likeduskward traveling transient. The bipolar variations ofjz during intervals A and B also indicate the rotation ofthe normal.The reconstructed profiles of jm and Bl versus Z� are
shown in Fig. 5. During interval B the spacecraft crossesa thin single-peak current sheet with a half-thickness lessthan 1000 km (it should be noted that the relativedivergence is larger than 20% for these crossings).
UT
20
0
-20
Bx,
nT
20
0
-20
20
0
-20
10
0
-10
500
0
-500Vp x
, km
/sB
z, n
TB
y, n
T
20
A B C
034203390336033303300327
j, n
A/m
2
Fig. 4. The same as in Fig. 1 for October 11, 2001.

ARTICLE IN PRESS
Table 2
The same as in Table 1 for intervals A, B and C, October 11, 2001
Nx Ny Nz D (%) s½D�
A 0.214 0.500 0.839 15.0 15.3
Bu 0.259 0.928 0.267 23.4 15.5
Bd 0.338 0.772 0.538 25.6 20.3
C 0.140 0.06 0.989 16.9 17.4
-20
-15
-10
-5
0
5
10
15
200
2
4
6
8
10
12
14
16
18
-2 -1 0 1 2Z*, 1000 km
J m,
nA/m
2B
I, n
T
ABuBdC
Fig. 5. The same as in Fig. 2 for intervals A, B, and C, October 11,
2001.
UT
20
0
-20
Bx,
nT
20
0
-20
20
0
-20
10
0
-10
500
0
-500Vp x
, km
/sB
z, n
TB
y, n
Tj,
nA
/m2
A B C
1258125612541252125012481246
Fig. 6. The same as in Fig. 1 for October 8, 2001.
Table 3
The same as in Table 1 for intervals A, B and C, October 8, 2001
Nx Ny Nz D (%) s½D�
A 0.052 0.836 0.546 20.0 18.8
B 0.040 0.426 0.940 10.0 9.1
C 0.158 0.277 0.948 7.9 5.4
A. Runov et al. / Planetary and Space Science 53 (2005) 237–243 241
During crossing C the current sheet is thicker (half-thickness of 1000km) and also more likely a single-peak.For the short crossing A the situation is different—thenormal gradient of Bl is smaller in the vicinity of Z� ¼ 0;than at 1000pZ�p 700 km: Unfortunately, we cansee only the southern hemisphere and cannot say whetherthe current is bifurcated or offset. The current density hasa plateau-like profile around the local maximum.
3.3. October 8, 2001
During 1245–1300UT October 8, 2001 Cluster waslocated at ½15:1; 9:4; 0:1� RE : The Alaska magnet-
ometers chain, detects a set of deflections with a peakof 500 nT during 1000–1600UT. The Cluster measure-ments of the magnetic field and ion bulk velocitytogether with the calculated current density are shownin Fig. 6. During this interval the tailward ion flow,which started at 1248:30UT together with the verticalmotion of the current sheet, reverses to Earthward flow.Three crossings of the neutral sheet, marked as A, B andC are selected for the analysis. The characteristics of thecrossings are summarized in Table 3. As in the twoprevious cases, the current sheet normal vector is tiltedin the Y–Z plane. The timing analysis for crossing A
shows, that the boundary moves mostly duskward withvelocity of 130–150 km/s.Fig. 7 shows the reconstructed profiles of jm and Bl
for crossings A, B and C. The analysis shows that duringthe 5-min long interval the current sheet structure

ARTICLE IN PRESS
2
4
6
8
10
12
14
-30
-20
-10
0
10
20
-3 -2 -1 0 1 2 3
Jm,
nA
/m2
BI,
nT
Z*, 1000 km
A
B
C
C
A
B
Fig. 7. The same as in Fig. 2 for intervals A, B, and C, October 8,
2001.
A. Runov et al. / Planetary and Space Science 53 (2005) 237–243242
changes drastically from crossing to crossing. Duringthe first crossing interval ðAÞ the current is definitelybifurcated—there are two similar peaks of jm; quasi-symmetrical with respect to Z� ¼ 0; and a pronouncedbroad valley in between. A similar, but not so distinctdouble-peak profile was obtained by Sergeev et al., 2003using the difference of the magnetic field, measured by apair of spacecraft. The next crossing ðBÞ shows anincoherent structure of the current sheet with largercurrent density at the periphery than in the center, andjm within the third interval C is more intensive and has apronounced peak at Z� ¼ 0.
4. Discussion and conclusions
We reconstructed the vertical profiles of the cross-tailcurrent density and reversing magnetic field componentsfor 18 fast crossings of the neutral sheet, during whichthe magnetic field jump exceeds 15 nT. The effectivevertical coordinate Z� was calculated by integration ofthe linearly estimated magnetic field gradient scale. Itwas found that during 11 crossings from 18 the currentsheet had a half-thickness p1000 and a single-peak
profile. Four crossings show a bifurcated structure withtwo peaks of electric current. The crossing A on October8, 2001, displays the best example of the bifurcatedcurrent sheet. For 3 crossings we could not clearly definethe current sheet structure.Observations of during A, B, C, and D intervals on
October 1, 2001 show that the single peak intensiveðj jj430 nA=m2Þ current sheet with half-thickness of1000 km or p2rTi; where rTi is ion thermal gyroradius,calculated for B0 ¼ 20 nT and ion temperature Ti ¼
80MK; was stable within 7min long interval duringstorm-time substorm.During interval 1248:30–1250UT ðAÞ on October 8
the spacecraft crossed a pronounced bifurcated currentsheet with two peaks of the current density at Z� �
�1500 km and broad minimum around Z� ¼ 0: Butcrossings B and C for same case show different profilesof the current density, unlike the cases studied by Runovet al. (2003a) and Sergeev et al. (2003), when abifurcated current sheet was stable during 7–15min.An origin and stability of bifurcated current sheets arediscussed in several theoretical studies. Sitnov et al.(2003) have shown that the generalization of the Harrismodel assuming ion temperature anisotropy withT?4Tk outside the current sheet gives rise to anequilibrium configuration with a bifurcated currentprofile. Greco et al. (2002) have shown that currentsheet bifurcation may be caused by magnetic turbulencelocalized in a central part of a current sheet. Thethreshold value of the magnetic field variability, leads tothe bifurcation, depends on an intensity of the normalmagnetic field component in the sheet. Zelenyi et al.(2003) have proposed the mechanism of the currentsheet splitting in the result of scattering of the currentcarrying ions and formation of quasi-trapped particlespopulation near the current sheet center if Bna0:Because these particles are carrying a current directedoppositely to original current, the total current densityprofile evolve to a bifurcated shape. An estimated timeof this evolution is about 30–90min. Observations show,however, that the current sheet bifurcation may be atransient short-living phenomenon. The fact that thestructure of the electric current may dramatically changewithin a time scale of several minutes must be taken intoaccount in the modelling.It should be noted, that because of our selection
criteria, active-time crossings were analyzed. Also, allstudied cases include intervals of fast flow reversal. Formore general investigation of the current sheet spatialstructure, quiet time crossings, which, generally, areslow (long-time) should be investigated, too. Themethod of normal coordinate system determinationshould be improved for this purpose.The relative divergence of the magnetic field, which is
a measure of the accuracy of the linear gradient/curlestimator was of 20–30% for selected crossings. The

ARTICLE IN PRESSA. Runov et al. / Planetary and Space Science 53 (2005) 237–243 243
main input into this value came from the linearinterpolation of the magnetic field within the Clustertetrahedron. We expect that smaller separation ofspacecraft will increase the robustness of the method.
Acknowledgements
We thank H.-U. Eichelberger and B. Klecker for helpwith FGM and CIS data. Magnetometer data availableon magnet.gi.alaska.edu are used. This work wassupported by RFBR N 03-02-17533, N 03-05-20012-BNTS, I.1/04 Scientific-technological cooperation Aus-tria-Russia, and INTAS 03-51-3738 Grants.
References
Asano, Y., Mukai, T., Hoshino, M., Saito, Y., Hayakawa, H., Nagai,
T., 2003. Evolution of the thin current sheet in a substorm observed
by Geotail. J. Geophys. Res. 108 doi: 10.1029/2002JA009785.
Asano, Y., Mukai, T., Hoshino, M., Saito, Y., Hayakawa, H., Nagai,
T., 2004. Current sheet structure around the near-Earth neutral line
observed by Geotail. J. Geophys. Res. 109, A02212 doi: 10.1029/
2003JA010114.
Balogh, A., et al., 2001. The Cluster magnetic field investigation:
overview of in-flight performance and initial results. Ann.
Geophys. 19, 1207–1217.
Behannon, K.W., 1970. Geometry of the geomagnetic tail. J. Geophys.
Res. 75, 743–753.
Chanteur, G., 1998. Spatial interpolation for four spacecraft: theory.
In: Paschmann, G., Daly, P. (Eds.), Analysis Methods for Multi-
Spacecraft Data, pp. 349–369.
Fairfield, D.H., 1979. On the average configuration of the geomagnetic
tail. J. Geophys. Res. 84, 1950–1958.
Fairfield, D.H., Hones, E.W., Meng, C.-I., 1981. Multiple crossings of
a very thin plasma sheet in the Earth’s magnetotail. J. Geophys.
Res. 86, 11189–11200.
Greco, A., Taktakishvili, A.L., Zimbardo, G., Vetri, P., Zelenyi, L.M.,
2002. Ion dynamics in the near-Earth magnetotail: magnetic
turbulence versus normal component of the average magnetic
field. J. Geophys. Res. 107, 1267 doi: 10.1029/2002JA009270.
Harris, E.G., 1962. On a plasma sheet separating regions of oppositely
directed magnetic field. Nuovo Cimento 23, 115–121.
Harvey, C.C., 1998. Spatial gradients and volumetric tensor. In:
Paschmann, G., Daly, P. (Eds.), Analysis Methods for Multi-
Spacecraft Data, pp. 307–322.
Hoshino, M., Nishida, A., Mukai, T., Saito, Y., Yamamoto, T.,
Kokubun, S., 1996. Structure of plasma sheet in magnetotail:
double-peaked electric current sheet. J. Geophys. Res. 101,
24775–24786.
McComas, D.J., Russel, C.T., Elphic, R.C., Bame, S.J., 1986. The
near-Earth cross-tail current sheet: detailed ISEE 1 and 2 case
studies. J. Geophys. Res. 91, 4287–4301.
Nakamura, R., et al., 2002. Fast flows during current sheet thinning.
Geophys. Res. Lett. 29 (29), 2140 doi: 10.1029/2002GL016200.
Reme, H., et al., 2001. First multi-spacecraft ion measurements in
and near the Earth’s magnetosphere with the identical
Cluster ion spectrometry (CIS) experiment. Ann. Geophys. 19,
1303–1354.
Runov, A., Nakamura, R., Baumjohann, W., Zhang, T.L., Volwerk,
M., Eichelberger, H.-U., Balogh, A., 2003a. Geophys. Res. Lett. 30
(2), 1036 doi: 10.1029/2002GL016136.
Runov, A., et al., 2003b. Current sheet structure near magnetic X-line
observed by Cluster. Geophys. Res. Lett. 30 (11), 1579 doi:
10.1029/2002GL016730.
Sanny, J., McPherron, R.L., Russel, C.T., Baker, D.N., Pulkkinen,
T.I., Nishida, A., 1994. Growth-phase thinning of the near-Earth
current sheet during CDAW 6 substorm. J. Geophys. Res. 99,
5805–5816.
Sergeev, V.A., Mitchell, D.G., Russell, C.T., Williams, D.J., 1993.
Structure of the tail plasma/current sheet at � 11 RE and its
changes in the course of a substorm. J. Geophys. Res. 98,
17345–17365.
Sergeev, V., Angelopulos, V., Carlson, C., Sutcliffe, P., 1998. Current
sheet measurements within a flapping plasma sheet. J. Geophys.
Res. 103, 9177–9187.
Sergeev, V., et al., 2003. Current sheet flapping motion and structure
observed by Cluster. Geophys. Res. Lett. 30 (6), 1327 doi: 10.1029/
2002GL016500.
Sergeev, V., et al., 2004. Orientation and propagation of current sheet
oscillations. Geophys. Res. Lett. 31, L05807 doi: 10.1029/
2003GL019346.
Sitnov, M.I., Guzdar, P.N., Swisdak, M., 2003. A model of the
bifurcated current sheet. Geophys. Res. Lett. 30 (13), 1712 doi:
10.1029/2003GL017218.
Volwerk, M., et al., 2003. Kink mode oscillation of the current sheet.
Geophys. Res. Lett. 30 (6), 1320 doi: 10.1029/2002GL016467.
Volwerk, M., et al., 2004. Compressional waves in the Earth’s neutral
sheet. Ann. Geophys. 22, 303–315.
Zelenyi, L.M., Malova, H.V., Popov, V.Yu., 2003. Splitting of thin
current sheets in the Earth’s magnetosphere. JETP Lett. 78 (5) doi:
10.11134/1.1625729.
Zhang, T.L., Baumjohann, W., Nakamura, R., Volwerk, M.,
Runov, A., Voros, Z., Glassmeier, K.-H., Balogh, A., 2004.
Neutral sheet normal direction determination. Adv. Space Res.,
in press.
Related Documents