International Journal of Economics and Financial Issues ISSN: 2146-4138 available at http: www.econjournals.com International Journal of Economics and Financial Issues, 2017, 7(4), 537-549. International Journal of Economics and Financial Issues | Vol 7 • Issue 4 • 2017 537 Reconstruction of Financial Performance to Manage Gap between Value Added Intellectual Coefficient (VAICTM) and Value of Company in Banking Company Listed in Indonesia Stock Exchange Yana Ermawati 1 , Muhamad Yamin Noch 2 , Zakaria 3 , Arfan Ikhsan 4 , Muammar Khaddafi 5 * 1 Alumnus of Yapis Papua University, Indonesia, 2 Yapis Papua University, Indonesia, 3 Yapis Papua University, Indonesia, 4 Medan State University, Indonesia, 5 Universitas Malikussaleh, Indonesia. *Email: ammar.dhafi[email protected] ABSTRACT This study aims to analyze the effect of value added intellectual coefficient (VAIC™) on value of company (market to book value [MtBV]) and financial performance (return on asset [ROA]) as mediating variable. This study used VAIC™ to measure the efficiency of three components i.e. value added capital employed, value added human capital, and structural capital value added (STVA). This study is a quantitative research using 20 banking companies listed in Indonesia Stock Exchange (BEI) as samples. Data were analyzed using path analysis with Analysis Moment of Structure program version 22. The results of this study indicate that the VAIC™ has positive and significant effect on financial performance (ROA), but it has immediate positive and non-significant effect on company value (MtBV). Furthermore, it can be proven that VAIC™ has indirect positive and significant effect on MtBV with ROA as a mediating variable. Keywords: Value Added Intellectual Coefficient, Financial Performance (Return on Asset), Company Value (Market to Book Value), Analysis Moment of Structure JEL Classifications: G1, G3, M42 1. INTRODUCTION Indicators of good corporate governance can be reflected from a positive company performance that not only provides income for shareholders but also ensures the company survival and fosters public trust. Manager as fiduciary of capital owners must take a decision or the best policy for the capital owners, in the sense that the decision or the policy must be in accordance with the wishes of the capital owners i.e. welfare of the shareholders or maximizing the value of the company. In the achievement of its objectives, the company increasingly emphasizes on the importance of knowledge assets, which is one form of intangible assets. One approach used in the assessment and measurement of knowledge assets is intellectual capital (IC). IC has become an issue not only for scholars, but also governments, regulators, companies, investors, and other stakeholders. This poses a challenge for the accountant to identify, measure, and express it in financial statements. Pulic (2000) identifies that the company market value (MV) created not only by capital used (physical and financial), but also IC by identifying that there is a significant correlation between average value of VAIC and company MV. According to Pulic (1998), the main goal of knowledge-based economy is to create value added (VA), while in order to create VA, it takes an exact size of physical capital and intellectual potential. He further states that intellectual ability or VAIC™ indicates the extent to which both resources (physical capital and intellectual potential) have been utilized efficiently by the company. The management of IC is increasingly important to be conducted in the era of knowledge economy. Riahi-Belkaoiu (2003) states that company assets both tangible and intangible are potential

Welcome message from author
This document is posted to help you gain knowledge. Please leave a comment to let me know what you think about it! Share it to your friends and learn new things together.
Transcript
International Journal of Economics and Financial Issues
ISSN: 2146-4138
available at http: www.econjournals.com
International Journal of Economics and Financial Issues, 2017, 7(4), 537-549.
International Journal of Economics and Financial Issues | Vol 7 • Issue 4 • 2017 537
Reconstruction of Financial Performance to Manage Gap between Value Added Intellectual Coefficient (VAICTM) and Value of Company in Banking Company Listed in Indonesia Stock Exchange
Yana Ermawati1, Muhamad Yamin Noch2, Zakaria3, Arfan Ikhsan4, Muammar Khaddafi5*
1Alumnus of Yapis Papua University, Indonesia, 2Yapis Papua University, Indonesia, 3Yapis Papua University, Indonesia, 4Medan State University, Indonesia, 5Universitas Malikussaleh, Indonesia. *Email: [email protected]
ABSTRACT
This study aims to analyze the effect of value added intellectual coefficient (VAIC™) on value of company (market to book value [MtBV]) and financial performance (return on asset [ROA]) as mediating variable. This study used VAIC™ to measure the efficiency of three components i.e. value added capital employed, value added human capital, and structural capital value added (STVA). This study is a quantitative research using 20 banking companies listed in Indonesia Stock Exchange (BEI) as samples. Data were analyzed using path analysis with Analysis Moment of Structure program version 22. The results of this study indicate that the VAIC™ has positive and significant effect on financial performance (ROA), but it has immediate positive and non-significant effect on company value (MtBV). Furthermore, it can be proven that VAIC™ has indirect positive and significant effect on MtBV with ROA as a mediating variable.
Keywords: Value Added Intellectual Coefficient, Financial Performance (Return on Asset), Company Value (Market to Book Value), Analysis Moment of Structure JEL Classifications: G1, G3, M42
1. INTRODUCTION
Indicators of good corporate governance can be reflected from a positive company performance that not only provides income for shareholders but also ensures the company survival and fosters public trust. Manager as fiduciary of capital owners must take a decision or the best policy for the capital owners, in the sense that the decision or the policy must be in accordance with the wishes of the capital owners i.e. welfare of the shareholders or maximizing the value of the company.
In the achievement of its objectives, the company increasingly emphasizes on the importance of knowledge assets, which is one form of intangible assets. One approach used in the assessment and measurement of knowledge assets is intellectual capital (IC). IC has become an issue not only for scholars, but also governments, regulators, companies, investors, and other stakeholders. This
poses a challenge for the accountant to identify, measure, and express it in financial statements.
Pulic (2000) identifies that the company market value (MV) created not only by capital used (physical and financial), but also IC by identifying that there is a significant correlation between average value of VAIC and company MV. According to Pulic (1998), the main goal of knowledge-based economy is to create value added (VA), while in order to create VA, it takes an exact size of physical capital and intellectual potential. He further states that intellectual ability or VAIC™ indicates the extent to which both resources (physical capital and intellectual potential) have been utilized efficiently by the company.
The management of IC is increasingly important to be conducted in the era of knowledge economy. Riahi-Belkaoiu (2003) states that company assets both tangible and intangible are potential
Ermawati, et al.: Reconstruction of Financial Performance to Manage Gap between Value Added Intellectual Coefficient (Vaictm) and Value of Company in Banking Company Listed in Indonesia Stock Exchange
International Journal of Economics and Financial Issues | Vol 7 • Issue 4 • 2017538
strategic assets for the company. Intellectual assets are categorized as strategic assets because of the close relationship between IC and company financial performance. According to Pulic (1998), the main goal of knowledge-based economy is to create VA, while in order to create VA, it takes an exact size of physical capital and intellectual potential. Intellectual ability then called VAIC™ indicates the extent to which both resources (physical capital and intellectual potential) have been utilized efficiently by company.
Recognition of IC in encouraging company value and competitive advantage is increasing, however, precise measurements of company IC have not been set. For example, Pulic (1998; 1999; 2000), his study did not directly measure company IC, but proposed a measurement to assess efficiency of VA as a result of company intellectual ability (VAIC™). The main components of VAIC™ can be seen from company resources i.e. physical capital (value added capital employed [VACA]), value added human capital [VAHU], and structural capital value added [STVA]). So, it can be explained that the VA is influenced by the efficiency of the three inputs owned by the company, namely: Physical capital or capital employed (CE), human capital (HC), and structural capital (SC).
STVA shows the contribution of SC in value creation. STVA measures the amount of SC needed to produce 1 (one) rupiah from VA and an indication of how the success of SC in value creation. SC is not an independent measure as HC, SC is dependent on value creation (Pulic, 1999). That is, the greater the contribution of HC in value creation, the less contribution of SC in this regard. Furthermore, Pulic states that SC is VA minus HC, and this has been verified by an empirical research on traditional industrial sector (Pulic, 2000).
In Indonesia, the phenomenon of IC starts growing, especially after the emergence of PSAK No. 19 (revised in 2000) on intangible assets. Although not stated explicitly as IC, but more or less IC has been getting attention. According to PSAK No. 19, intangible assets are non-monetary assets that are identifiable and have no physical form and held for use in producing or providing goods or services, leased to other parties, or for administrative purpose (IAI, 2002). Chen et al., (2005); Edvinsson and Malone (1997); Lev and Radhakrishnan, (2003) reveals that:
“The increasing gap observed between MV and book value (BV) of many companies has drawn attention towards investigating the value missing from financial statements. According to various scholars, IC is considered to be the hidden value that escapes financial statements and the one that leads organizations to obtain a competitive advantage.”
The phrase explains that the increase of difference observed between MV and BV in many companies have drawn attention of many studies on value difference or values considered to be missing from financial statements. According to various academics, IC is regarded as hidden value missing from financial statements and the value becomes one of the strengths for organizations or companies to achieve competitive advantage.
Studies conducted by Riahi-Belkaoiu (2003), Mavridis (2004); Kamath (2007), Chen et al. (2005), Tan et al. (2007), Astuti (2004), Ulum (2007), Soedaryono et al. (2012), Heikal et al. (2014), Noviawijaya (2012), Pasaribu et al. (2012) and Ferdiansah et al. (2013) prove that IC has positive impact on the performance and company MV. Contrary to these studies, research by Sianipar (2009) failed to prove the significant impact of VA of resources based companies on return on asset (ROA), return on equity (ROE) and capital gains in banking sector. Similarly, research by Artinah and Mushlih (2011) is not successful to prove significant impact between IC and capital gain.
The inconsistency of research results conducted by Riahi-Belkaoiu (2003), Mavridis (2004) and Kamath (2007), Chen et al. (2005), Tan et al. (2007), Astuti (2004), Ulum (2007), Harryani et al. (2012), Werastuti (2014), Soedaryono et al. (2012), Noviawijaya (2012), Pasaribu et al. (2012) and Ferdiansah et al. (2013) with Sianipar (2009), Radianto (2011) and Artinah and Mushlih (2011) on the effect of IC on performance and MV of company motivates researchers to conduct another research on the impact of IC on company financial performance. The companies that are able to manage their intellectual resources effectively and efficiently, the financial performance will increase. The increasing financial performance will have a positive response from the market so that the company value will increase.
This study seeks to prove the reconstruction of financial performance in addressing the gap between VAIC™ and company value in banking sector in Indonesia. The selection of banking sector as sample refers to research by Ulum (2007), Sianipar (2009), Artinah (2011), Radianto (2011), Kamath (2006); Mavridis (2005), and Firer and William (2003). The banking sector was chosen because according to Firer and William (2003) in Ulum (2007), banking industry is one of sectors that have the most intensive IC. Moreover, from intellectual aspect, the employees in banking sector are in overall more homogeneous compared to other economic sectors. The selection of VAIC™ model as a proxy for IC refers to the study by Firer and William (2003), Chen et al. (2005), and Tan et al. (2007), Ulum (2007), Sianipar (2009), Soedaryono et al. (2012), and Pasaribu et al. (2012). The financial performance used is the profitability (ROA). The selection of performance indicator refers to research by Chen et al. (2005), Firer and William (2003), Ulum (2007), Radianto (2011), Sianipar (2009), Soedaryono et al. (2012), and Ferdiansah et al. (2013). While the value of the company is as a proxy for market to book value (MtBV). The selection of company value indicators refers to the study by Chen et al., (2005), Firer and William (2003), Harryani et al. (2012), Werastuti (2014), and Ferdiansah et al. (2013).
2. LITERATURE REVIEW
2.1. Resource-based TheoryBased on resource-based theory, company achieves competitive ability and optimal performance by leveraging strategic assets effectively. This was disclosed by Wernerfelt, 1984 in Komnenic and Pokraj, 2012, which states that:
“Firms gain competitive advantage and attain superior performance by holding, acquiring, and effectively using
Ermawati, et al.: Reconstruction of Financial Performance to Manage Gap between Value Added Intellectual Coefficient (Vaictm) and Value of Company in Banking Company Listed in Indonesia Stock Exchange
International Journal of Economics and Financial Issues | Vol 7 • Issue 4 • 2017 539
strategic assets. These assets include tangible, physical, assets as well as intangible assets that have been internalized, developed and used by firms in pursuing competitive and profitable strategies.”
The phrase explains that company will achieve competitive advantage and achieve optimal performance by holding, acquiring and using strategic assets effectively. These assets include tangible assets, physical assets and intangible assets that have been internalized, developed and used by companies in the pursuit of profitable competition and strategies.
According to Firer and Williams (2003), Ulum (2007), the resource-based theory explains that a company is perceived as a collection of tangible and intangible assets or capabilities. This theory suggests that the performance of a company should be defined as an effective and efficient use of tangible and intangible assets or intellectual ability owned by the company.
2.2. Stakeholder TheoryIn line with the resource-based theory, stakeholder theory states that the VA is a more accurate measure in measuring performance of a company than accounting profit, which is simply a measure of return for shareholders. The theory explains that all company activities lead to value creation, ownership and use of intellectual resources so that it enables company to achieve competitive advantage and to increase VA. This theory states that all stakeholders have the right to be provided information on how the organization activities affect them, even when they choose not to use that information, and even when they cannot directly play a constructive role in organization survival (Deegan, 2004).
2.3. ICThe term IC often treated as a synonym of intangible assets. Nevertheless, the definition proposed by OECD shows that there are enough differences to put IC as a separate part of the basis for determining overall intangible assets of a company. Thus, there are items of intangible assets that logically do not form part of IC of a company. One is the company reputation. Company reputation may be a byproduct (or an effect) of a wise use of IC in company, but it not part of IC.
2.4. Measurement of ICMeasuring IC is not easy because it is intangible and non-physical. Therefore, traditional accounting model used in company operation in an industrial economy remain focus on financial assets and physical capital and ignore IC assets (Zeghal and Maaloul, 2010).
2.5. VAIC™VAIC™ method developed by Pulic (1998) designed to provide information about value creation efficiency of tangible assets and intangible assets owned by company. This model begins with the company ability to create VA. VA is the most objective indicator to assess the business success and to demonstrate the company ability in the value creation (Pulic, 1998).
According to Pulic (1998); Ulum (2007), the main purpose of a knowledge-based economy is to create VA, while in order to create
VA it takes an exact size of physical capital and intellectual potential. Furthermore, Pulic (1998) states that intellectual ability or VAIC™ indicate the extent to which both resources (physical capital and intellectual potential) has been utilized efficiently by the company.
VAICTM model measures IC through the measurement of CE efficiency (VACA), HC efficiency (VAHU), and SC efficiency (STVA). The higher the value of VAIC™, the better the potential utilization of company value creation. Physical capital (VACA) describes how much VA resulting from the use of physical capital. Pulic (1998) in Tan et al. (2007) assumes that if 1 (one) unit of CE generates greater return than other companies, it means the company is better at taking advantage of its CE. Thus, a better utilization of CE is part of the IC of a company (Tan et al., 2007. p. 79).
Yeats in Stewart (1998. p. 90) reveals that HC is the place where all the stairs begins: A source of innovation, the origin of insight. Money can talk, but it cannot think; sometimes machines carry better than humans, but it does not create. Before purchasing new equipment, any large enough companies have a certain form that must be filled by managers: The demand for capital expenditures requires the calculation of capital return on investment. While sometimes, creative writing in the form cannot be compared with the creativity required to complete the same calculation on investment return towards new workers, especially those who are expected to think.
STVA shows the contribution of SC in value creation. STVA measures the number of SC required to produce 1 (one) rupiah from VA and is an indication of how the success of SC in value creation (Tan et al., 2007. p. 80). SC is not an independent measure as HC; SC is dependent on value creation (Pulic, 2000). That is, according to Pulic (2000), the greater the contribution of HC in value creation, the less contribution of SC in this regard. Furthermore, Pulic (2000) states that SC is VA minus HC and it has been verified by empirical research on traditional industrial sectors (Pulic, 2000; Tan et al. (2007).
2.6. Financial PerformanceThe financial performance is an assessment or evaluation of financial condition of company based on financial ratio analysis in a given period in order to obtain results such as ROE, ROA, EPS, residual income, or other performance indicators. In this study, ROA was selected to measure financial performance of company. Selection of ROA as a proxy for the company financial performance because the value of ROA can measure the company ability to use the whole funds that are embedded in the assets used in operations with the aim of making a profit. This ratio connects the benefits of company operations with the amount of investment or asset used to produce these benefits (Hanafi and Abdul, 2014).
2.7. The Value of CompanyThe value of company formed by indicator of stock MV is influenced by investment opportunities. The existence of investment opportunities can sends a positive signal about the company growth in the future, so it can enhance shareholder value. The company value in this study was measured by MtBV. MtBV
Ermawati, et al.: Reconstruction of Financial Performance to Manage Gap between Value Added Intellectual Coefficient (Vaictm) and Value of Company in Banking Company Listed in Indonesia Stock Exchange
International Journal of Economics and Financial Issues | Vol 7 • Issue 4 • 2017540
shows the value of company obtained by comparing the company MV with BV. MV is a market perception from investors, creditors, and other stakeholders to company condition and usually reflected in the company stock MV. MV is the overall value of shares owned by company. In other words, MV is the amount that must be paid to buy the overall company. Rise and fall of company value is affected by company BV, profit rate, economic picture, as well as speculation and confidence in the company ability to create value. While BV is the value of wealth, debt, and equity based on the historical record and usually stated in the balance sheet (Werastuti, 2014).
2.8. The Relationship between VAIC™ and Financial Performance and Company ValueMiditinos et al. (2011) suggest that the greater the value of capital intellectual (VAIC™) the more efficient the use of company capital, thus creating VA for company. Physical capital as part of IC becomes a resource to determine the company performance. In addition, if IC is a measurable resource to increase competitive advantages, the IC will contribute to company performance (Harrison and Sullivan, 2000; Chen et al., 2005; Abdolmohammadi, 2005).
IC is believed to play an important role in increasing value of company or financial performance. Companies that are able to efficiently utilize their IC, the MV will increase. The relationship between IC (VAIC™) and financial performance has been demonstrated empirically by some research that has been done in recent years. Research by Riahi-Belkaoiu (2003) supports the resource-based theory and shareholders theory that shows IC is significantly related to multinational company performance in the USA. Research by Soedaryono et al. (2012) found that there is influence between VAIC™, namely physical capital on the MV of the company as a proxy for market to book ratio and there is influence between the three components of VAIC™ toward financial performance of company as a proxy for ROA. Furthermore, Pasaribu et al. (2012), using sample of manufacturing companies listed in Indonesia Stock Exchange during the period of 2006-2008, the research results show that there is effect of VAIC™, namely physical capital (VACA) towards financial performance as a proxy for ROE, EPS, ASR, ATO, PER, GR, where the most dominant influence is toward EPS, ROE, and ATO. While HC (VAHU) has the most dominant influence towards financial performance in the future.
2.9. Effect of IC (VAICTM) on Financial PerformanceThe influence of the independent variables VAIC™ on the dependent variable financial performance companies (Y1) refers to the resource-based theory and stakeholder theory. Based on the resource-based theory, company achieves competitive ability and optimal performance by leveraging strategic assets effectively. This is disclosed by Wernerfelt, 1984 in Komnenic and Pokraj, 2012, who state that:
“Firms gain competitive advantage and attain superior performance by holding, acquiring, and effectively using strategic assets. These assets include tangible, physical, assets as well as intangible assets that have been internalized, developed and used by firms in pursuing competitive and profitable strategies.”
The phrase explains that company will achieve competitive advantage and achieve optimal performance by holding, acquiring and using strategic assets effectively. These assets include tangible assets, physical assets, and intangible asset that have been internalized, developed and used by companies in the pursuit of profitable competition and strategy.
According to Firer and Williams (2003), the resource-based theory explains that a company is perceived as a collection of both tangible and intangible assets or capabilities. This theory suggests that the performance of a company should be defined as an effective and efficient use of both tangible and intangible assets or intellectual abilities owned by a company.
In line with this theory, the stakeholder theory states that VA is a more accurate measure in measuring the performance of a company compared to the accounting profit which is simply a measure of return for shareholders. The theory explains that all company activities lead to value creation, ownership and use of intellectual resources so that it enables company to achieve competitive advantage and to increase VA. Pulic (1998; 1999; 2000), his study did not directly measure company IC, but proposed a measure to assess the efficiency of the VA as a result of company intellectual abilities (VAIC™). The main components of VAICTM can be seen from the company resources i.e. physical capital (VACA), HC (VAHU), and SC (STVA).
Empirical studies on the effect of VAIC™ on financial performance among others conducted by Riahi-Belkaoiu (2003), the results of his research support the resource-based theory and the shareholders theory that show IC is significantly related to multinational companies performance in USA. Tan et al. (2007) found that IC (VAIC™) is positively associated with company performance; IC (VAIC™) is also positively associated with the company performance in the future. Furthermore, Firer and Williams (2003); Ulum (2007), their research showed that physical capital is the most significant and influential factor on the performance of companies in South Africa.
In Indonesia, the study of IC (VAIC™) and its influence on the financial performance has been done by Ulum (2007), the research concludes that there is a positive effect of IC (VAIC™) on company financial performance. Overall, his research states that HC (VAHU) and ROA is the most significant indicator for VAICTM and company financial performance for 3 years of observation.
Meanwhile, Noviawijaya (2012), his research concludes that there is influence between CE efficiency towards profitability, productivity and company MV, while HC efficiency and SC efficiency both affect company MV, but does not affect profitability and productivity. Research by Pasaribu et al. (2012) shows that there is influence of VAIC™, namely physical capital (VACA) on financial performance as a proxy for ROE, EPS, ASR, ATO, PER, GR, where the most dominant influence is toward EPS, ROE, and ATO. While HC (VAHU) has the most dominant influence on financial performance in the future. From the above, the proposed hypothesis 1 as follows:
Ermawati, et al.: Reconstruction of Financial Performance to Manage Gap between Value Added Intellectual Coefficient (Vaictm) and Value of Company in Banking Company Listed in Indonesia Stock Exchange
International Journal of Economics and Financial Issues | Vol 7 • Issue 4 • 2017 541
Hypothesis 1: VAIC™ has a positive and significant effect on financial performance of banking companies listed on the Indonesia Stock Exchange.
2.10. Effect of IC (VAIC™) on Company ValueThe influence of independent variable IC (VAIC™) on the variable dependent company value (Y2) refers to stakeholder theory. This study adds intervening variable (company financial performance) to determine the direct and indirect effect of variable IC (VAIC™) on company value.
Stakeholder theory states that company is not an entity that operates only for its own interest, but it must provide benefits to stakeholders (Ulum et al., 2008). Therefore, company must be able to manage resources owned optimally in order to create VA for company in the interests of stakeholders. The resources include physical and intellectual assets. If company is capable of managing intellectual assets properly, then the perception of the market towards company value will increase. IC is believed to play an important role in increasing the company MV.
Empirical studies on the effect of IC (VAIC™) on company value, among others, conducted by Chen et al. (2005), the study shows that IC (VAIC™) has positive effect on company MV and financial performance.
Research by Harryani et al. (2012) reveals that there is influence between IC (VAIC™) on ROE, where VACA and STVA is VAIC™ component that has a significant effect, whereas VAHU has insignificant effect, then, ROE as mediating variable between VAIC™ and company value has a significant effect on company value as a proxy for PBV, but not significantly affect PER.
Furthermore, research by Werastuti (2014) shows that there is positive influence between IC disclosure (VAICTM) and financial performance as a proxy for ROA. The research is not able to prove direct influence of IC disclosure (VAIC™) on company value as a proxy for MtBV, but it is able to prove that financial performance as a proxy for ROA being able to mediate the relationship between IC disclosure (VAIC™) and company value as a proxy for MtBV.
In line with Dewi and Isynuwardhana (2014), their research reveals that IC (VAIC™) significantly affect financial performance as a proxy for ROA and IC (VAIC™) has no direct effect on company value but it has indirect influence to company as a proxy for PBV, where ROA as intervening variable. Furthermore, research by Soedaryono et al. (2012) shows that there is influence between VAIC™, namely physical capital on company MV as a proxy for market to book ratio and there is influence between the three components of VAIC™ to company financial performance as a proxy for ROA. From the above, the proposed hypothesis 2 and 3 as follows:
Hypothesis 2: VAIC™ has direct effect on company value in banking companies listed on the Indonesia Stock Exchange.
Hypothesis 3: VAIC™ has indirect effect on company value through financial performance as intervening variable in banking companies listed on the Indonesia Stock Exchange.
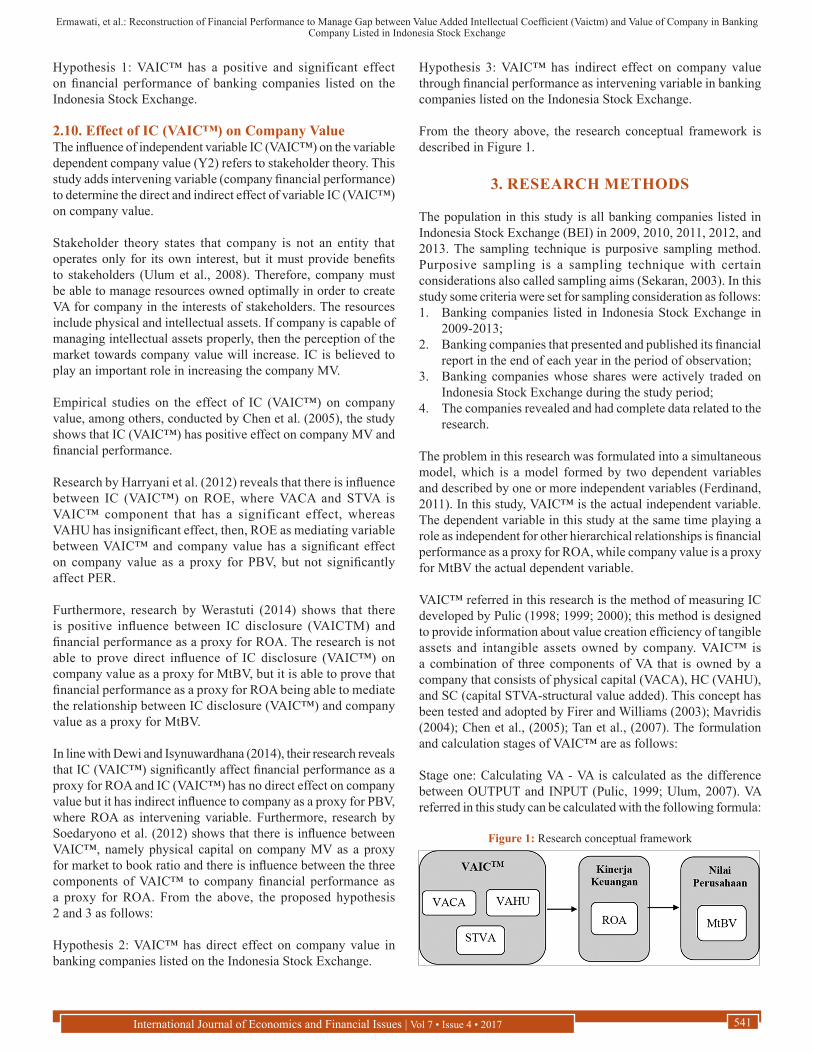
From the theory above, the research conceptual framework is described in Figure 1.
3. RESEARCH METHODS
The population in this study is all banking companies listed in Indonesia Stock Exchange (BEI) in 2009, 2010, 2011, 2012, and 2013. The sampling technique is purposive sampling method. Purposive sampling is a sampling technique with certain considerations also called sampling aims (Sekaran, 2003). In this study some criteria were set for sampling consideration as follows:1. Banking companies listed in Indonesia Stock Exchange in
2009-2013;2. Banking companies that presented and published its financial
report in the end of each year in the period of observation;3. Banking companies whose shares were actively traded on
Indonesia Stock Exchange during the study period;4. The companies revealed and had complete data related to the
research.
The problem in this research was formulated into a simultaneous model, which is a model formed by two dependent variables and described by one or more independent variables (Ferdinand, 2011). In this study, VAIC™ is the actual independent variable. The dependent variable in this study at the same time playing a role as independent for other hierarchical relationships is financial performance as a proxy for ROA, while company value is a proxy for MtBV the actual dependent variable.
VAIC™ referred in this research is the method of measuring IC developed by Pulic (1998; 1999; 2000); this method is designed to provide information about value creation efficiency of tangible assets and intangible assets owned by company. VAIC™ is a combination of three components of VA that is owned by a company that consists of physical capital (VACA), HC (VAHU), and SC (capital STVA-structural value added). This concept has been tested and adopted by Firer and Williams (2003); Mavridis (2004); Chen et al., (2005); Tan et al., (2007). The formulation and calculation stages of VAIC™ are as follows:
Stage one: Calculating VA - VA is calculated as the difference between OUTPUT and INPUT (Pulic, 1999; Ulum, 2007). VA referred in this study can be calculated with the following formula:
Figure 1: Research conceptual framework
Ermawati, et al.: Reconstruction of Financial Performance to Manage Gap between Value Added Intellectual Coefficient (Vaictm) and Value of Company in Banking Company Listed in Indonesia Stock Exchange
International Journal of Economics and Financial Issues | Vol 7 • Issue 4 • 2017542
VA=OP+EC+D+A
Where,VA = Value addedOP = Operating profitEC = Employee costsD = DepreciationA = Amortization.
Stage two: Calculating VACA - VACA referred in this study is measured based on VA created by physical capital. This ratio shows contribution made by each unit of CE to VA organization (Pulic, 1999; Ulum, 2007). It can be calculated with the following formula:
VACAVA
CE=
Where,VACA = Value added capital employed: The ratio of VA to CEVA = Value addedCE = Capital employed: Available funds (equity, net income).
Third step: Calculating VAHU - VAHU referred in this study is measured based on VA created by HC (VAHU). VAHU shows how much VA can be generated by funds spent on labor. This ratio shows the contribution made by each rupiah invested in HC towards VA organization (Pulic, 1999; Ulum, 2007). It can be calculated with the following formula:
VAHUVA
HC=
Where,VAHU = Value added human capital: The ratio of VA to HCVA = Value addedHC = Human capital: Personnel expenses.
Stage four: Calculating STVA. SC referred in this study is measured based on VA created by SC (STVA). This ratio measures the amount of SC needed to produce 1 rupiah of VA and is an indication of the success of SC in value creation (Pulic, 1999; Ulum, 2007). It can be calculated with the following formula:
STVASC
VA=
Where,STVA = Structural capital value added: The ratio of SC to VASC = Structural capital: VA−HCVA = Value added.
Stage five: Calculating VAIC™ - VAIC™ indicates organization intellectual capabilities that can also be considered as business performance indicator. VAIC™ is the sum of the three previous components: VACA, VAHU, and STVA (Pulic, 1999; Ulum, 2007). It can be calculated with the following formula:
VAIC™=VACA+VAHU+STVA
Where,VAIC™ = Value added intellectual coefficientVACA = Value added capital employedVAHU = Value added human capitalSTVA = Structural capital value added.
While ROA is chosen to measure financial performance of company. Financial performance was set as first dependent variable and also defined as variable that mediates independent variable (VAIC™) with value of company variable. The selection of ROA as a proxy for the company financial performance because ROA can measure the ability of company to use overall funds that are embedded in assets used in operations with the aim of making a profit. This ratio measures bank ability to generate profits. It is calculated by using the following formula:
ROANet income before tax
Totalassets=
In this study, the actual dependent variable is value of company as a proxy for MtBV. MtBV shows the value of company that is obtained by comparing the company MV with BV. MV is the market perception from investors, creditors, and other stakeholders on the condition of company and it usually reflects company stock MV. MV is the total value of shares held by company. MtBV is measured by MV divided by BV by using the following formula:
MtBVMarket value
Book value=
Where,Market value (MV) = Share price at year-endBook value (BV) = Total equity ÷ Outstanding shares.
Data processing method used in this study is path analysis that is the basic model used for analyze the path in estimating the strength of causal relationships depicted in path model. The use of path analysis because it allegedly contained a correlational relationship between independent variables, so there was a direct or indirect effect on the dependent variable.
To analyze the survey data and to interpret the results as well as to test the hypothesis, we used descriptive analysis. Then, we conducted measurement model testing, overall model testing, structural model testing and relationship variables observed testing. To facilitate the analysis process, several statistical applications programs were used, among others Statistical Program for Social Sciences Versions 22 and Analysis Moment of Structure (AMOS) version 22.
In this study, path analysis was applied to manifest variable or measurable variable by using panel data from the BEI (Indonesia Stock Exchange) as the analysis unit by period of observation for 5 years. Steps in the data analysis, as follows:1. Designing a model based on theoretical and empirical studies.
Through the models, it indicated the estimate of direct and indirect effect of independent variables on dependent variable that can be formulated in equation that shows the relationship
Ermawati, et al.: Reconstruction of Financial Performance to Manage Gap between Value Added Intellectual Coefficient (Vaictm) and Value of Company in Banking Company Listed in Indonesia Stock Exchange
International Journal of Economics and Financial Issues | Vol 7 • Issue 4 • 2017 543
and the direct or indirect effect, VAIC™ on ROA and MtBV. The model is expressed in the equation:
ROAt=βVAIC™t (4.1)
MtBVt=β1ROAt+β1VAICTMt (4.2)
Where,ROAt = Return on assets at period tMtBVt = Market to book value at period tVAICTMt = Value added intellectual coefficient in period tβ, β1, β2 = Regression coefficients.
2. Describing the model in diagram.3. Testing the model assumption. To make the data can be further
analyzed then a few prerequisites must be met in the analysis i.e. assumptions of data normality and outliers.
4. Analyzing goodness-of-fit model. The testing guideline of goodness-of-fit model was done by comparing the testing parameters with a determined cut-off value as shown in Table 1 (Ferdinand, 2014. p. 233). Data analysis used AMOS software Version 22, and Excel.
5. Interpreting the results of the statistical tests that have been carried out.
6. Confirming the model with data.
4. RESULTS AND DISCUSSION
4.1. An Overview of Research ObjectThis study used banking industry listed in Indonesia Stock Exchange as the research objects. Data from Bank Indonesia that officially published in 2014 shows that the system of Indonesian
banking consists of six types of commercial banks with a total of 120 banks (Bank Indonesia, 2007), namely: Limited bank (4 banks), BUSN foreign exchange (35 banks), BUSN non-foreign exchange (30 banks), BPD (26 banks), mixed bank (15 banks), and foreign banks (10 banks).
4.2. Description of Research Variables4.2.1. Variable description of VAIC™
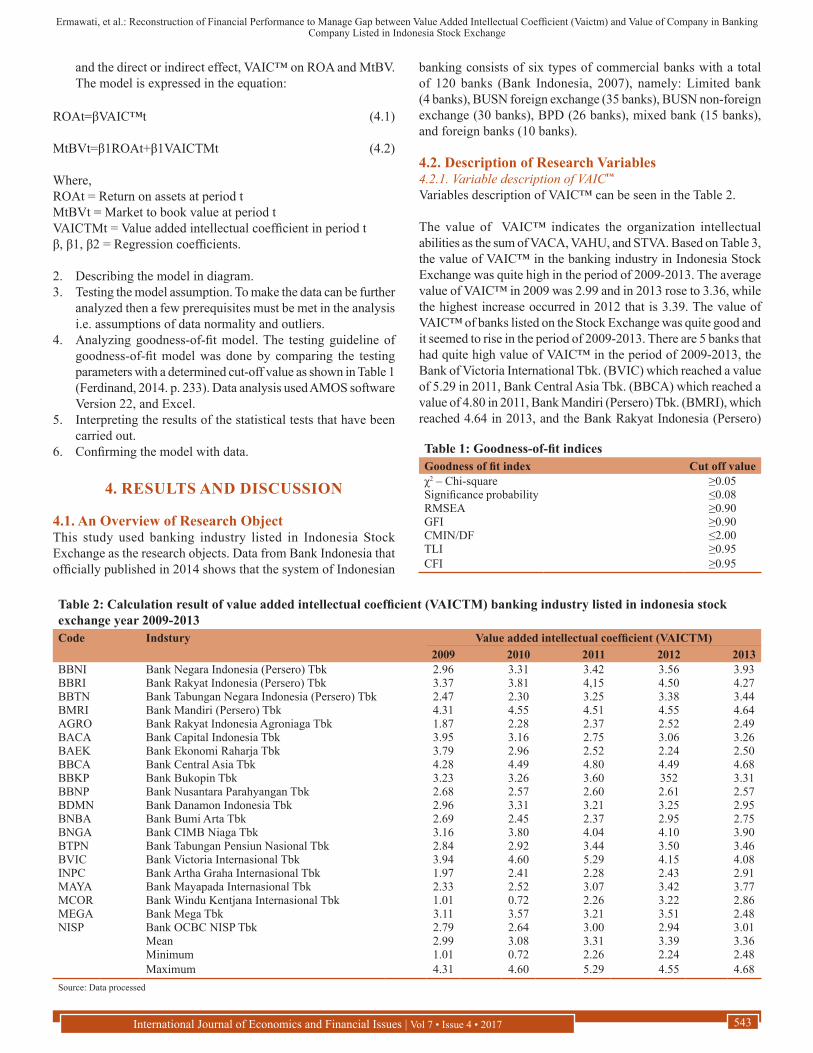
Variables description of VAIC™ can be seen in the Table 2.
The value of VAIC™ indicates the organization intellectual abilities as the sum of VACA, VAHU, and STVA. Based on Table 3, the value of VAIC™ in the banking industry in Indonesia Stock Exchange was quite high in the period of 2009-2013. The average value of VAIC™ in 2009 was 2.99 and in 2013 rose to 3.36, while the highest increase occurred in 2012 that is 3.39. The value of VAIC™ of banks listed on the Stock Exchange was quite good and it seemed to rise in the period of 2009-2013. There are 5 banks that had quite high value of VAIC™ in the period of 2009-2013, the Bank of Victoria International Tbk. (BVIC) which reached a value of 5.29 in 2011, Bank Central Asia Tbk. (BBCA) which reached a value of 4.80 in 2011, Bank Mandiri (Persero) Tbk. (BMRI), which reached 4.64 in 2013, and the Bank Rakyat Indonesia (Persero)
Table 1: Goodness‑of‑fit indicesGoodness of fit index Cut off valueχ2 – Chi-square ≥0.05Significance probability ≤0.08RMSEA ≥0.90GFI ≥0.90CMIN/DF ≤2.00TLI ≥0.95CFI ≥0.95
Table 2: Calculation result of value added intellectual coefficient (VAICTM) banking industry listed in indonesia stock exchange year 2009-2013Code Indstury Value added intellectual coefficient (VAICTM)
2009 2010 2011 2012 2013BBNI Bank Negara Indonesia (Persero) Tbk 2.96 3.31 3.42 3.56 3.93BBRI Bank Rakyat Indonesia (Persero) Tbk 3.37 3.81 4,15 4.50 4.27BBTN Bank Tabungan Negara Indonesia (Persero) Tbk 2.47 2.30 3.25 3.38 3.44BMRI Bank Mandiri (Persero) Tbk 4.31 4.55 4.51 4.55 4.64AGRO Bank Rakyat Indonesia Agroniaga Tbk 1.87 2.28 2.37 2.52 2.49BACA Bank Capital Indonesia Tbk 3.95 3.16 2.75 3.06 3.26BAEK Bank Ekonomi Raharja Tbk 3.79 2.96 2.52 2.24 2.50BBCA Bank Central Asia Tbk 4.28 4.49 4.80 4.49 4.68BBKP Bank Bukopin Tbk 3.23 3.26 3.60 352 3.31BBNP Bank Nusantara Parahyangan Tbk 2.68 2.57 2.60 2.61 2.57BDMN Bank Danamon Indonesia Tbk 2.96 3.31 3.21 3.25 2.95BNBA Bank Bumi Arta Tbk 2.69 2.45 2.37 2.95 2.75BNGA Bank CIMB Niaga Tbk 3.16 3.80 4.04 4.10 3.90BTPN Bank Tabungan Pensiun Nasional Tbk 2.84 2.92 3.44 3.50 3.46BVIC Bank Victoria Internasional Tbk 3.94 4.60 5.29 4.15 4.08INPC Bank Artha Graha Internasional Tbk 1.97 2.41 2.28 2.43 2.91MAYA Bank Mayapada Internasional Tbk 2.33 2.52 3.07 3.42 3.77MCOR Bank Windu Kentjana Internasional Tbk 1.01 0.72 2.26 3.22 2.86MEGA Bank Mega Tbk 3.11 3.57 3.21 3.51 2.48NISP Bank OCBC NISP Tbk 2.79 2.64 3.00 2.94 3.01
Mean 2.99 3.08 3.31 3.39 3.36Minimum 1.01 0.72 2.26 2.24 2.48Maximum 4.31 4.60 5.29 4.55 4.68
Source: Data processed
Ermawati, et al.: Reconstruction of Financial Performance to Manage Gap between Value Added Intellectual Coefficient (Vaictm) and Value of Company in Banking Company Listed in Indonesia Stock Exchange
International Journal of Economics and Financial Issues | Vol 7 • Issue 4 • 2017544
Tbk., which reached 4.50 in 2012. While the lowest value reached by Bank Windu Kentjana International Tbk. 1.01 in 2009.
4.2.2. Variable description of ROAVariable description of ROA can be seen in the Table 3.
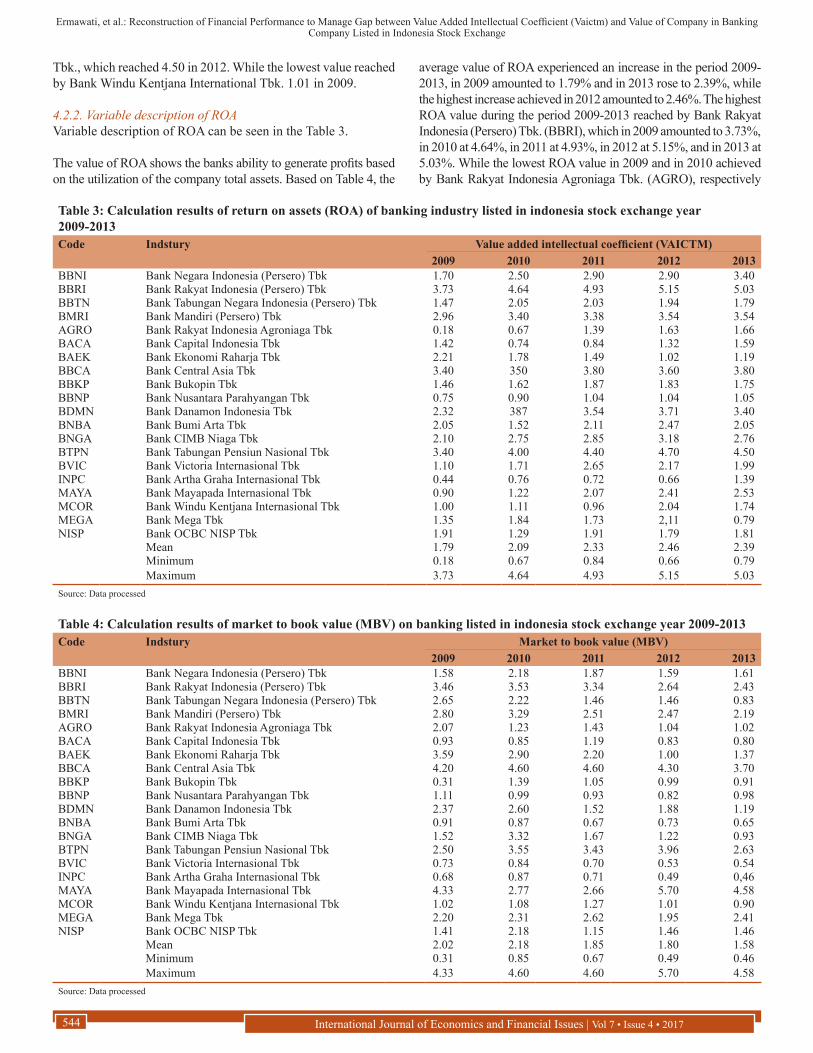
The value of ROA shows the banks ability to generate profits based on the utilization of the company total assets. Based on Table 4, the
average value of ROA experienced an increase in the period 2009-2013, in 2009 amounted to 1.79% and in 2013 rose to 2.39%, while the highest increase achieved in 2012 amounted to 2.46%. The highest ROA value during the period 2009-2013 reached by Bank Rakyat Indonesia (Persero) Tbk. (BBRI), which in 2009 amounted to 3.73%, in 2010 at 4.64%, in 2011 at 4.93%, in 2012 at 5.15%, and in 2013 at 5.03%. While the lowest ROA value in 2009 and in 2010 achieved by Bank Rakyat Indonesia Agroniaga Tbk. (AGRO), respectively
Table 3: Calculation results of return on assets (ROA) of banking industry listed in indonesia stock exchange year 2009-2013Code Indstury Value added intellectual coefficient (VAICTM)
2009 2010 2011 2012 2013BBNI Bank Negara Indonesia (Persero) Tbk 1.70 2.50 2.90 2.90 3.40BBRI Bank Rakyat Indonesia (Persero) Tbk 3.73 4.64 4.93 5.15 5.03BBTN Bank Tabungan Negara Indonesia (Persero) Tbk 1.47 2.05 2.03 1.94 1.79BMRI Bank Mandiri (Persero) Tbk 2.96 3.40 3.38 3.54 3.54AGRO Bank Rakyat Indonesia Agroniaga Tbk 0.18 0.67 1.39 1.63 1.66BACA Bank Capital Indonesia Tbk 1.42 0.74 0.84 1.32 1.59BAEK Bank Ekonomi Raharja Tbk 2.21 1.78 1.49 1.02 1.19BBCA Bank Central Asia Tbk 3.40 350 3.80 3.60 3.80BBKP Bank Bukopin Tbk 1.46 1.62 1.87 1.83 1.75BBNP Bank Nusantara Parahyangan Tbk 0.75 0.90 1.04 1.04 1.05BDMN Bank Danamon Indonesia Tbk 2.32 387 3.54 3.71 3.40BNBA Bank Bumi Arta Tbk 2.05 1.52 2.11 2.47 2.05BNGA Bank CIMB Niaga Tbk 2.10 2.75 2.85 3.18 2.76BTPN Bank Tabungan Pensiun Nasional Tbk 3.40 4.00 4.40 4.70 4.50BVIC Bank Victoria Internasional Tbk 1.10 1.71 2.65 2.17 1.99INPC Bank Artha Graha Internasional Tbk 0.44 0.76 0.72 0.66 1.39MAYA Bank Mayapada Internasional Tbk 0.90 1.22 2.07 2.41 2.53MCOR Bank Windu Kentjana Internasional Tbk 1.00 1.11 0.96 2.04 1.74MEGA Bank Mega Tbk 1.35 1.84 1.73 2,11 0.79NISP Bank OCBC NISP Tbk 1.91 1.29 1.91 1.79 1.81
Mean 1.79 2.09 2.33 2.46 2.39Minimum 0.18 0.67 0.84 0.66 0.79Maximum 3.73 4.64 4.93 5.15 5.03
Source: Data processed
Table 4: Calculation results of market to book value (MBV) on banking listed in indonesia stock exchange year 2009-2013Code Indstury Market to book value (MBV)
2009 2010 2011 2012 2013BBNI Bank Negara Indonesia (Persero) Tbk 1.58 2.18 1.87 1.59 1.61BBRI Bank Rakyat Indonesia (Persero) Tbk 3.46 3.53 3.34 2.64 2.43BBTN Bank Tabungan Negara Indonesia (Persero) Tbk 2.65 2.22 1.46 1.46 0.83BMRI Bank Mandiri (Persero) Tbk 2.80 3.29 2.51 2.47 2.19AGRO Bank Rakyat Indonesia Agroniaga Tbk 2.07 1.23 1.43 1.04 1.02BACA Bank Capital Indonesia Tbk 0.93 0.85 1.19 0.83 0.80BAEK Bank Ekonomi Raharja Tbk 3.59 2.90 2.20 1.00 1.37BBCA Bank Central Asia Tbk 4.20 4.60 4.60 4.30 3.70BBKP Bank Bukopin Tbk 0.31 1.39 1.05 0.99 0.91BBNP Bank Nusantara Parahyangan Tbk 1.11 0.99 0.93 0.82 0.98BDMN Bank Danamon Indonesia Tbk 2.37 2.60 1.52 1.88 1.19BNBA Bank Bumi Arta Tbk 0.91 0.87 0.67 0.73 0.65BNGA Bank CIMB Niaga Tbk 1.52 3.32 1.67 1.22 0.93BTPN Bank Tabungan Pensiun Nasional Tbk 2.50 3.55 3.43 3.96 2.63BVIC Bank Victoria Internasional Tbk 0.73 0.84 0.70 0.53 0.54INPC Bank Artha Graha Internasional Tbk 0.68 0.87 0.71 0.49 0,46MAYA Bank Mayapada Internasional Tbk 4.33 2.77 2.66 5.70 4.58MCOR Bank Windu Kentjana Internasional Tbk 1.02 1.08 1.27 1.01 0.90MEGA Bank Mega Tbk 2.20 2.31 2.62 1.95 2.41NISP Bank OCBC NISP Tbk 1.41 2.18 1.15 1.46 1.46
Mean 2.02 2.18 1.85 1.80 1.58Minimum 0.31 0.85 0.67 0.49 0.46Maximum 4.33 4.60 4.60 5.70 4.58
Source: Data processed
Ermawati, et al.: Reconstruction of Financial Performance to Manage Gap between Value Added Intellectual Coefficient (Vaictm) and Value of Company in Banking Company Listed in Indonesia Stock Exchange
International Journal of Economics and Financial Issues | Vol 7 • Issue 4 • 2017 545
0.18% in 2009 and 0.67% in 2010. Later in 2011, the lowest ROA value of 0.84% achieved by the Bank Capital Indonesia Tbk. (BACA). Whereas in 2012 the lowest ROA value of 0.66% achieved by Bank Artha Graha Internasional Tbk. (INPC). Meanwhile, in 2013 the lowest ROA value at 0.79% achieved by Bank Mega Tbk. (MEGA).
4.2.3. Variable description of MtBVVariables description of MtBV can be seen in Table 5.
MtBV shows the company value obtained by comparing the company MV and the BV. MtBV aims to measure how far the difference between the MV of the company and its BV. Based on Table 5, it appears the average value of MtBV in 2009 by 2.02 and in 2010 rose to 2.34, then declined in 2013. In 2011, the average value of MtBV is 1.85, in 2012 at 1.80 and in 2013 at 1.58.
4.3. Research Results4.3.1. Description of research variables indicatorsThe research variables consist of VAIC™ (X), ROA (Y1), and the market to BV at period t (MtBVt) (Y2). The detailed description of the variables indicators of the study are presented as follows (Table 5).
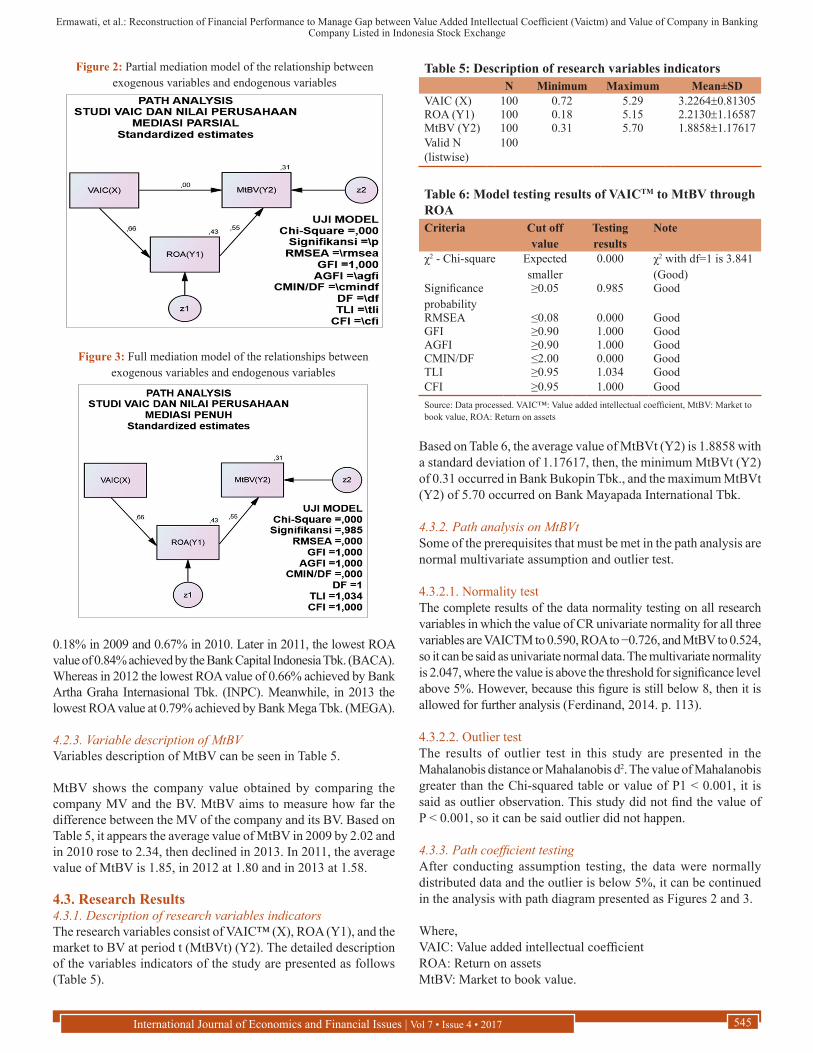
Based on Table 6, the average value of MtBVt (Y2) is 1.8858 with a standard deviation of 1.17617, then, the minimum MtBVt (Y2) of 0.31 occurred in Bank Bukopin Tbk., and the maximum MtBVt (Y2) of 5.70 occurred on Bank Mayapada International Tbk.
4.3.2. Path analysis on MtBVtSome of the prerequisites that must be met in the path analysis are normal multivariate assumption and outlier test.
4.3.2.1. Normality testThe complete results of the data normality testing on all research variables in which the value of CR univariate normality for all three variables are VAICTM to 0.590, ROA to −0.726, and MtBV to 0.524, so it can be said as univariate normal data. The multivariate normality is 2.047, where the value is above the threshold for significance level above 5%. However, because this figure is still below 8, then it is allowed for further analysis (Ferdinand, 2014. p. 113).
4.3.2.2. Outlier testThe results of outlier test in this study are presented in the Mahalanobis distance or Mahalanobis d2. The value of Mahalanobis greater than the Chi-squared table or value of P1 < 0.001, it is said as outlier observation. This study did not find the value of P < 0.001, so it can be said outlier did not happen.
4.3.3. Path coefficient testingAfter conducting assumption testing, the data were normally distributed data and the outlier is below 5%, it can be continued in the analysis with path diagram presented as Figures 2 and 3.
Where,VAIC: Value added intellectual coefficientROA: Return on assetsMtBV: Market to book value.
Figure 2: Partial mediation model of the relationship between exogenous variables and endogenous variables
Figure 3: Full mediation model of the relationships between exogenous variables and endogenous variables
Table 5: Description of research variables indicatorsN Minimum Maximum Mean±SD
VAIC (X) 100 0.72 5.29 3.2264±0.81305ROA (Y1) 100 0.18 5.15 2.2130±1.16587MtBV (Y2) 100 0.31 5.70 1.8858±1.17617Valid N (listwise)
100
Table 6: Model testing results of VAICTM to MtBV through ROACriteria Cut off
valueTesting results
Note
χ2 - Chi-square Expected smaller
0.000 χ2 with df=1 is 3.841(Good)
Significance probability
≥0.05 0.985 Good
RMSEA ≤0.08 0.000 GoodGFI ≥0.90 1.000 GoodAGFI ≥0.90 1.000 GoodCMIN/DF ≤2.00 0.000 GoodTLI ≥0.95 1.034 GoodCFI ≥0.95 1.000 GoodSource: Data processed. VAIC™: Value added intellectual coefficient, MtBV: Market to book value, ROA: Return on assets
Ermawati, et al.: Reconstruction of Financial Performance to Manage Gap between Value Added Intellectual Coefficient (Vaictm) and Value of Company in Banking Company Listed in Indonesia Stock Exchange
International Journal of Economics and Financial Issues | Vol 7 • Issue 4 • 2017546
The testing results of goodness-of-fit model for full mediation model by AMOS program can be seen in the Table 6.
In Table 7, the description indicates that 8 criteria used to assess the feasibility of a model were fulfilled. Thus, a modification was not needed. It can be said that the model is acceptable, which means there is a fit between the model and the data.
From the suitable model, each path coefficient as the hypothesis in this research can be interpreted and it is presented in a structural equation as follows:ROA = 0.656 VAIC™
MtBV = 0.554 ROA
The testing of path coefficients is presented in details in Table 8.
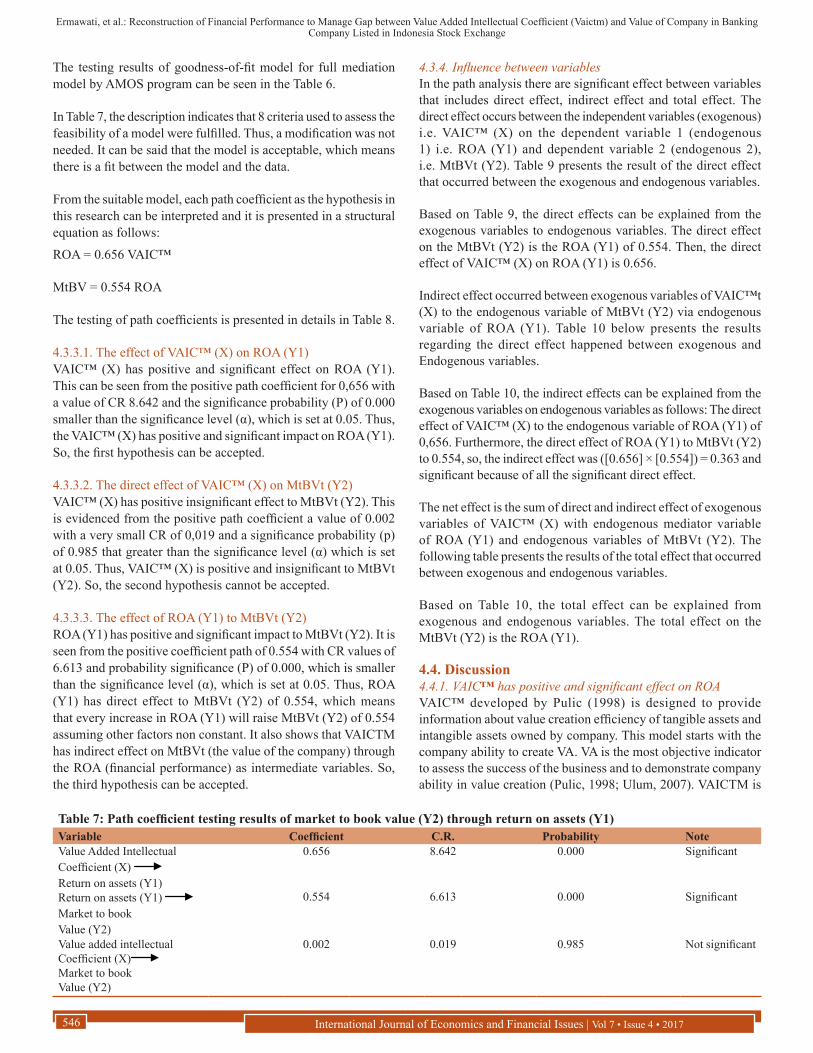
4.3.3.1. The effect of VAIC™ (X) on ROA (Y1)VAIC™ (X) has positive and significant effect on ROA (Y1). This can be seen from the positive path coefficient for 0,656 with a value of CR 8.642 and the significance probability (P) of 0.000 smaller than the significance level (α), which is set at 0.05. Thus, the VAIC™ (X) has positive and significant impact on ROA (Y1). So, the first hypothesis can be accepted.
4.3.3.2. The direct effect of VAIC™ (X) on MtBVt (Y2)VAIC™ (X) has positive insignificant effect to MtBVt (Y2). This is evidenced from the positive path coefficient a value of 0.002 with a very small CR of 0,019 and a significance probability (p) of 0.985 that greater than the significance level (α) which is set at 0.05. Thus, VAIC™ (X) is positive and insignificant to MtBVt (Y2). So, the second hypothesis cannot be accepted.
4.3.3.3. The effect of ROA (Y1) to MtBVt (Y2)ROA (Y1) has positive and significant impact to MtBVt (Y2). It is seen from the positive coefficient path of 0.554 with CR values of 6.613 and probability significance (P) of 0.000, which is smaller than the significance level (α), which is set at 0.05. Thus, ROA (Y1) has direct effect to MtBVt (Y2) of 0.554, which means that every increase in ROA (Y1) will raise MtBVt (Y2) of 0.554 assuming other factors non constant. It also shows that VAICTM has indirect effect on MtBVt (the value of the company) through the ROA (financial performance) as intermediate variables. So, the third hypothesis can be accepted.
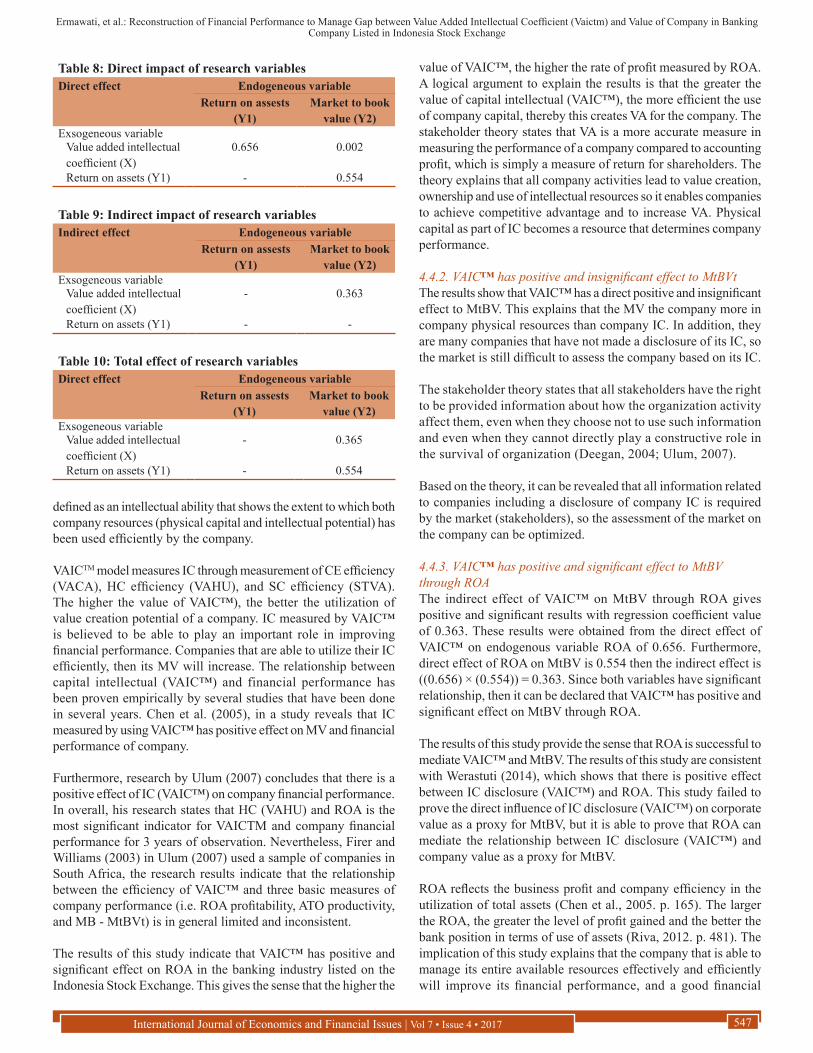
4.3.4. Influence between variablesIn the path analysis there are significant effect between variables that includes direct effect, indirect effect and total effect. The direct effect occurs between the independent variables (exogenous) i.e. VAIC™ (X) on the dependent variable 1 (endogenous 1) i.e. ROA (Y1) and dependent variable 2 (endogenous 2), i.e. MtBVt (Y2). Table 9 presents the result of the direct effect that occurred between the exogenous and endogenous variables.
Based on Table 9, the direct effects can be explained from the exogenous variables to endogenous variables. The direct effect on the MtBVt (Y2) is the ROA (Y1) of 0.554. Then, the direct effect of VAIC™ (X) on ROA (Y1) is 0.656.
Indirect effect occurred between exogenous variables of VAIC™t (X) to the endogenous variable of MtBVt (Y2) via endogenous variable of ROA (Y1). Table 10 below presents the results regarding the direct effect happened between exogenous and Endogenous variables.
Based on Table 10, the indirect effects can be explained from the exogenous variables on endogenous variables as follows: The direct effect of VAIC™ (X) to the endogenous variable of ROA (Y1) of 0,656. Furthermore, the direct effect of ROA (Y1) to MtBVt (Y2) to 0.554, so, the indirect effect was ([0.656] × [0.554]) = 0.363 and significant because of all the significant direct effect.
The net effect is the sum of direct and indirect effect of exogenous variables of VAIC™ (X) with endogenous mediator variable of ROA (Y1) and endogenous variables of MtBVt (Y2). The following table presents the results of the total effect that occurred between exogenous and endogenous variables.
Based on Table 10, the total effect can be explained from exogenous and endogenous variables. The total effect on the MtBVt (Y2) is the ROA (Y1).
4.4. Discussion4.4.1. VAIC™ has positive and significant effect on ROAVAIC™ developed by Pulic (1998) is designed to provide information about value creation efficiency of tangible assets and intangible assets owned by company. This model starts with the company ability to create VA. VA is the most objective indicator to assess the success of the business and to demonstrate company ability in value creation (Pulic, 1998; Ulum, 2007). VAICTM is
Table 7: Path coefficient testing results of market to book value (Y2) through return on assets (Y1)Variable Coefficient C.R. Probability NoteValue Added IntellectualCoefficient (X) Return on assets (Y1)
0.656 8.642 0.000 Significant
Return on assets (Y1) Market to bookValue (Y2)
0.554 6.613 0.000 Significant
Value added intellectualCoefficient (X) Market to bookValue (Y2)
0.002 0.019 0.985 Not significant
Ermawati, et al.: Reconstruction of Financial Performance to Manage Gap between Value Added Intellectual Coefficient (Vaictm) and Value of Company in Banking Company Listed in Indonesia Stock Exchange
International Journal of Economics and Financial Issues | Vol 7 • Issue 4 • 2017 547
defined as an intellectual ability that shows the extent to which both company resources (physical capital and intellectual potential) has been used efficiently by the company.
VAICTM model measures IC through measurement of CE efficiency (VACA), HC efficiency (VAHU), and SC efficiency (STVA). The higher the value of VAIC™), the better the utilization of value creation potential of a company. IC measured by VAIC™ is believed to be able to play an important role in improving financial performance. Companies that are able to utilize their IC efficiently, then its MV will increase. The relationship between capital intellectual (VAIC™) and financial performance has been proven empirically by several studies that have been done in several years. Chen et al. (2005), in a study reveals that IC measured by using VAIC™ has positive effect on MV and financial performance of company.
Furthermore, research by Ulum (2007) concludes that there is a positive effect of IC (VAIC™) on company financial performance. In overall, his research states that HC (VAHU) and ROA is the most significant indicator for VAICTM and company financial performance for 3 years of observation. Nevertheless, Firer and Williams (2003) in Ulum (2007) used a sample of companies in South Africa, the research results indicate that the relationship between the efficiency of VAIC™ and three basic measures of company performance (i.e. ROA profitability, ATO productivity, and MB - MtBVt) is in general limited and inconsistent.
The results of this study indicate that VAIC™ has positive and significant effect on ROA in the banking industry listed on the Indonesia Stock Exchange. This gives the sense that the higher the
value of VAIC™, the higher the rate of profit measured by ROA. A logical argument to explain the results is that the greater the value of capital intellectual (VAIC™), the more efficient the use of company capital, thereby this creates VA for the company. The stakeholder theory states that VA is a more accurate measure in measuring the performance of a company compared to accounting profit, which is simply a measure of return for shareholders. The theory explains that all company activities lead to value creation, ownership and use of intellectual resources so it enables companies to achieve competitive advantage and to increase VA. Physical capital as part of IC becomes a resource that determines company performance.
4.4.2. VAIC™ has positive and insignificant effect to MtBVtThe results show that VAIC™ has a direct positive and insignificant effect to MtBV. This explains that the MV the company more in company physical resources than company IC. In addition, they are many companies that have not made a disclosure of its IC, so the market is still difficult to assess the company based on its IC.
The stakeholder theory states that all stakeholders have the right to be provided information about how the organization activity affect them, even when they choose not to use such information and even when they cannot directly play a constructive role in the survival of organization (Deegan, 2004; Ulum, 2007).
Based on the theory, it can be revealed that all information related to companies including a disclosure of company IC is required by the market (stakeholders), so the assessment of the market on the company can be optimized.
4.4.3. VAIC™ has positive and significant effect to MtBV through ROAThe indirect effect of VAIC™ on MtBV through ROA gives positive and significant results with regression coefficient value of 0.363. These results were obtained from the direct effect of VAIC™ on endogenous variable ROA of 0.656. Furthermore, direct effect of ROA on MtBV is 0.554 then the indirect effect is ((0.656) × (0.554)) = 0.363. Since both variables have significant relationship, then it can be declared that VAIC™ has positive and significant effect on MtBV through ROA.
The results of this study provide the sense that ROA is successful to mediate VAIC™ and MtBV. The results of this study are consistent with Werastuti (2014), which shows that there is positive effect between IC disclosure (VAIC™) and ROA. This study failed to prove the direct influence of IC disclosure (VAIC™) on corporate value as a proxy for MtBV, but it is able to prove that ROA can mediate the relationship between IC disclosure (VAIC™) and company value as a proxy for MtBV.
ROA reflects the business profit and company efficiency in the utilization of total assets (Chen et al., 2005. p. 165). The larger the ROA, the greater the level of profit gained and the better the bank position in terms of use of assets (Riva, 2012. p. 481). The implication of this study explains that the company that is able to manage its entire available resources effectively and efficiently will improve its financial performance, and a good financial
Table 8: Direct impact of research variablesDirect effect Endogeneous variable
Return on assests (Y1)
Market to book value (Y2)
Exsogeneous variableValue added intellectual coefficient (X)
0.656 0.002
Return on assets (Y1) - 0.554
Table 9: Indirect impact of research variablesIndirect effect Endogeneous variable
Return on assests (Y1)
Market to book value (Y2)
Exsogeneous variableValue added intellectual coefficient (X)
- 0.363
Return on assets (Y1) - -
Table 10: Total effect of research variablesDirect effect Endogeneous variable
Return on assests (Y1)
Market to book value (Y2)
Exsogeneous variableValue added intellectual coefficient (X)
- 0.365
Return on assets (Y1) - 0.554
Ermawati, et al.: Reconstruction of Financial Performance to Manage Gap between Value Added Intellectual Coefficient (Vaictm) and Value of Company in Banking Company Listed in Indonesia Stock Exchange
International Journal of Economics and Financial Issues | Vol 7 • Issue 4 • 2017548
performance will also get a good response from investors, thereby increase the company value.
5. CONCLUSIONS AND RECOMMENDATIONS
Based on the results of data analysis and discussion, the conclusions of this study can be described as follows:1. VAIC™ has positive and significant effect on ROA2. VAIC™ has positive and insignificant effect to MtBV3. VAIC™ has positive and significant effect to MtBV through
ROA.
The results of this study explain that in accordance with the resource based theory, company that is able to utilize its resources, both tangible and intangible resource, can create company competitive advantage and improve company performance. However, market (investors) only values company based on the company ability to manage its financial performance and have not been able to assess company based on VA created. So, the company that is able to manage all of its available resources effectively and efficiently will be able to improve its financial performance, and furthermore, a good financial will also get a good response from investors, thus, increase the company value.
In this research, there are some limitations that this study:1. Used the period of 5 years of research: From 2009 to 2013,
so there are limitations to the data used in this study.2. Not all banks listed in the Indonesia Stock Exchange in the
period from 2009 until 2013 can be used in the study samples due to some banks did not provide data associated with this research, thus, it narrowed the number of research samples.
Based on the results of the study, it can be put forward suggestions as follows:1. It is expected from the investors in evaluating company
performance to consider the VA created by the company.2. It is expected that future studies can extend the period of
research and expand the research object to include companies from other sectors, so that the results of the research are able to describe public companies in Indonesia as a whole.
REFERENCES
Abdolmohammadi, M.J. (2005), Intellectual capital disclosure and market capitalization. Journal of Intellectual Capital, 6(3), 397-416.
Artinah, B., Muslih, A. (2011), Pengaruh intellectual capital terhadap capital gain (studi empiris terhadap perusahaan perbankan yang terdaftar di bursa efek Indonesia). Jurnal Spread, 1(1), 9-22.
Bank Indonesia. (2013), Kajian Stabilitas Keuangan No. 21. September; 2013. Available from: http://www.bi.go.id.
Chen, C.M., Cheng, J.S., Hwang, Y. (2005), An empirical investigation of the relationship between intellectual capital and firms market value and financial performance. Journal of Intellectual Capital, 6(2), 159-176.
Deegan, C. (2004), Financial Accounting Theory. Sydney: McGraw-Hill Book Company.
Dewi, C.A.N., Isynuwardhana, D. (2014), Intellectual capital terhadap nilai perusahaan dengan kinerja keuangan sebagai variabel intervening. Jurnal Keuangan dan Perbankan, 18(2), 233-248.
Edvinsson, L., Malone, M. (1997), Intellectual Capital: Realizing Your Company’s True Value by Finding Its Hidden Brainpower. New York, NY: HarperCollins.
Ferdinand, A. (2011), Metode Penelitian Manajemen Pedoman Penelitian untuk Penulisan Skripsi, Tesis, dan Disertasi Ilmu Manajemen, Edisi 3, AGF Books, Fakulty of Economy dan business Universitas of Diponegoro, Semarang.
Ferdiansah, A., Dezie, W.L. (2013), Analisis Pengaruh Intellectual Capital Terhadap Kinerja Keuangan dan Nilai Perusahaan Pada Perusahaan Kompas 100 yang Terdaftar di Bursa Efek Indonesia (BEI) Tahun 2011. Thesis, University of Bina Nusantara.
Ferdinand, A. (2014), Structual Equation Modeling Dalam Penelitian Manajemen. Seri Pustaka Kunci 13/ 2014. Semarang: BP Undip-Undip Press.
Firer, S., Williams, S.M. (2003), Intellectual capital and traditional measures of corporate performance. Journal of Intellectual Capital, 4(3), 348-360.
Hanafi, M.M., Abdul, H. (2014), Analisis Laporan Keuangan. Yogyakarta: UPP STIM YKPN. p112.
Harryani, S., Nurcahyo, B., Nur’aini, R. (2012), Impact of Intellectual Capital on the Firm’s Market Value: The Mediation Role of Financial Performance (Empirical Study From The Indonesian Banking Companies since 2007-2011). 10th Ubaya International Annual Symposium on Management.
Harrison, S., Sullivan, P.H. (2000), Profitting form intellectual capital; Learning from leading companies. Journal of Intellectual Capital, 1(1), 33-46.
Heikal, M., Khaddafi, M., Ummah, A. (2014), Influence analysis of return on assets (ROA), ROE, net profit margin (NPM), debt to equity ratio (DER), and current ratio (CR), against corporate profit growth in automotive in indonesia stock exchange. International Journal of Academic Research in Business and Social Sciences, 4(12), 101-113.
Ikatan Akuntan Indonesia. (2002), Pernyataan Standar Akuntansi Keuangan No. 19. Jakarta: Salemba Empat.
Lev, B., Radhakrishnan, S. (2003), The measurement of Firm-Specific Organization Capital. NBER Working Paper No. 9581. Available from: http://www.nber.org/papers/w9581.htm.
Kamath, G.B. (2007), The intellectual capital performance of Indian banking sector. Journal of Intellectual Capital, 8(1), 96-123.
Komnenic, B., Pokraj, D. (2012), Intellectual capital and corporate performance of MNCs in Serbia. Journal of Intellectual Capital, 13(1), 106-119.
Miditinos, D., Tsairidis, C., Theriou, G. (2011), The impact of intellectual capitalon firms market value and financial performance. Journal of Intellectual Capital, 12(1), 132-151.
Mavridis, D.G. (2004), The intellectual capital performance of the Japanese banking sector. Journal of Intellectual Capital, 5(1), 92-115.
Mavridis, D.G. (2005), Intellectual capital performance determinants and globalization status of Greek listed firms. Journal of Intellectual Capital, 6(1), 127-140.
Novia, W. (2012), Pengaruh intelectual capital terhadap kinerja keuangan dan nilai pasar perusahaan perbankan dengan metode value added intelectual coefficient. Jurnal Bisnis dan Akuntansi, 14(3), 157-180.
Pasaribu, H., Purnamasari, D.I., Hapsari, T.I. (2012), The role of corporate intellectual capital. American International Journal of Contemporary Research, 2(9), 162-170.
Pulic, A. (1998), Measuring the Performance of Intellectual Potential in Knowledge Economy (Presented in 1998 at the 2nd McMaster World Congress on Measuring and Managing Intellectual Capital by the Austrian Team for Intellectual Potential).
Ermawati, et al.: Reconstruction of Financial Performance to Manage Gap between Value Added Intellectual Coefficient (Vaictm) and Value of Company in Banking Company Listed in Indonesia Stock Exchange
International Journal of Economics and Financial Issues | Vol 7 • Issue 4 • 2017 549
Pulic, A. (1999), Basic Information on VAIC™. Available from: http://www.vaicon.net. [Last accessed on 2013 Jul 05].
Pulic, A. (2000), VAICTM - An Accounting Tool for IC Management. Available from: http://www.measuring-ip.at/Papers/ham99txt.htm. [Last accessed on 2013 Jul 05].
Radianto, W.E.D. (2011), The influence of intellectual capital on banking industry performance: A case in Indonesia stock exchange before and after the 2008 global financial crisis. Asia Pacific Journal of Accounting and Finance, 2(1), 39-50.
Riahi-Belkaoiu, A. (2003), Intellectual Capital and Firm Performance of US Multinational Firms: A Study of the Resource-Based and Stakeholder Views. 2003), Intellectual Capital and Firm Performance of US Multinational Firms: A Study of the Resource-Based and Stakeholder Views. Chicago: University of Illinois at Chicago.
Rivai, V.D.K. (2012), Commercial Bank Management: Manajemen Perbankan Dari Teori ke Praktik. Jakarta: PT. Raja Grafindo Perkasa.
Sekaran, U. (2003), Research Methods for Business: A Skill Building Approach. 4th ed. NY: John Wiley & Sons, Inc.
Sianipar, M. (2009), The Impact of Intellectual Capital Towards Financial Profitability and Investors Capital Gain on Shares: An Empirical Investigation of Indonesian Banking and Insurance Sector For Year 2005-2007. SNA-12-AKPM 120, Universitas Sriwijaya Palembang,
3-9 November; 2009.Soedaryono, B.D.K. (2012), Effect Intellectual Capital (Value Added
Intellectual Capital) to Market Value and Financial Performance of Banking Sector Companies Listed in Indonesia Stock Exchange The 2012 International Conference on Business and Management, 6-7 September 2012, Phuket - Thailand.
Stewart, T.A. (1998), Intellectual Capital. Translated by Reza Gunawan. Jakarta: Publisher PT. Elex Media Komputindo, Kelompok Gramedia.
Tan, P.H., Plowman, D., Hancock, P. (2007), Intellectual capital and financial returns of companies. Journal of Intellectual Capital, 8(1), 76-95.
Ulum, I. (2007), Pengaruh Intellectual Capital Terhadap Kinerja Keuangan Perusahaan Perbankan Di Indonesia. Thesis, University of Diponegoro Semarang.
Ulum, I. (2008), Intellectual capital performance sektor perbankan di Indonesia. Jurnal Akuntansi dan Keuangan, 10(2), 77-84.
Werastuti, S.N.D. (2014), Model mediasi dalam hubungan antara intelectual capital disclosure, nilai perusahaan, dan financial performance. Journal of Financial and Banking, 18(1), 14-28.
Zeghal, D., Maaloul, A. (2010), Analysing value added as an indicator of intellectual capital and its consequences on company performance. Jurnal of Intellectual Capital, 11(1), 39-60.
Related Documents